Embed Size (px)
Citation preview
ANNUAL AND SUSTAINABILITY REPORT
2018
CONTENTS
NOBIA 2018
00 Nobia in brief02 Nobia 201803 Highlights04 CEO’s comments06 How Nobia creates value
BUSINESS ENVIRONMENT AND STRATEGY
10 Trends affecting our kitchens12 The European kitchen market 14 Strategyforprofitablegrowth 15 Efficiency
16 Growth
17 Enablers
19 Targetsandfulfilment
OPERATIONS
22 Nordic region24 UK region26 Central Europe region
OUR SUSTAINABILITY INITIATIVES
30 Value chain31 Sustainable advances in 201832 Strategic focus areas 34 Sustainable innovations
35 Timber from sustainable sources
36 Reduce CO2 emissions
37 Responsible sourcing
38 Resource efficiency
39 Employee well-being
BOARD OF DIRECTORS’ REPORT
41 Financial overview46 Risks and risk management
FINANCIAL STATEMENTS
50 Consolidated income statement, consolidated statement of comprehensive income and comments
54 Consolidated balance sheet and comments56 Change in consolidated shareholders’ equity57 Consolidatedcash-flowstatement
and comments58 Parent Company income statement,
balancesheet,cash-flowstatementand change in shareholders’ equity
60 Notes88 Reconciliation of alternative performance measures89 Board of Directors’ assurance90 Audit report
CORPORATE GOVERNANCE AND THE NOBIA SHARE
92 Corporate Governance Report96 Board of Directors98 Group management100 The Nobia share and shareholders102 Five-year overview103 Definitions–Keyfigures104 Sustainability108 Annual General Meeting 2019
TheauditedAnnualReportandconsolidatedfinancialstatementscanbefoundonpages41–89.TheCorporateGovernanceReportcanbefoundonpages92–99andthestatutorySustainabilityReportcanbefoundonpages30–40and104–107.
ThekitchenshownonthefrontcoveristheMarbodalArkitektPlus.ThisannualreporthasbeenpreparedinSwedishandtranslatedintoEnglish.Intheeventofany discrepanciesbetweentheSwedishandthetranslation,theformershallhaveprecedence.
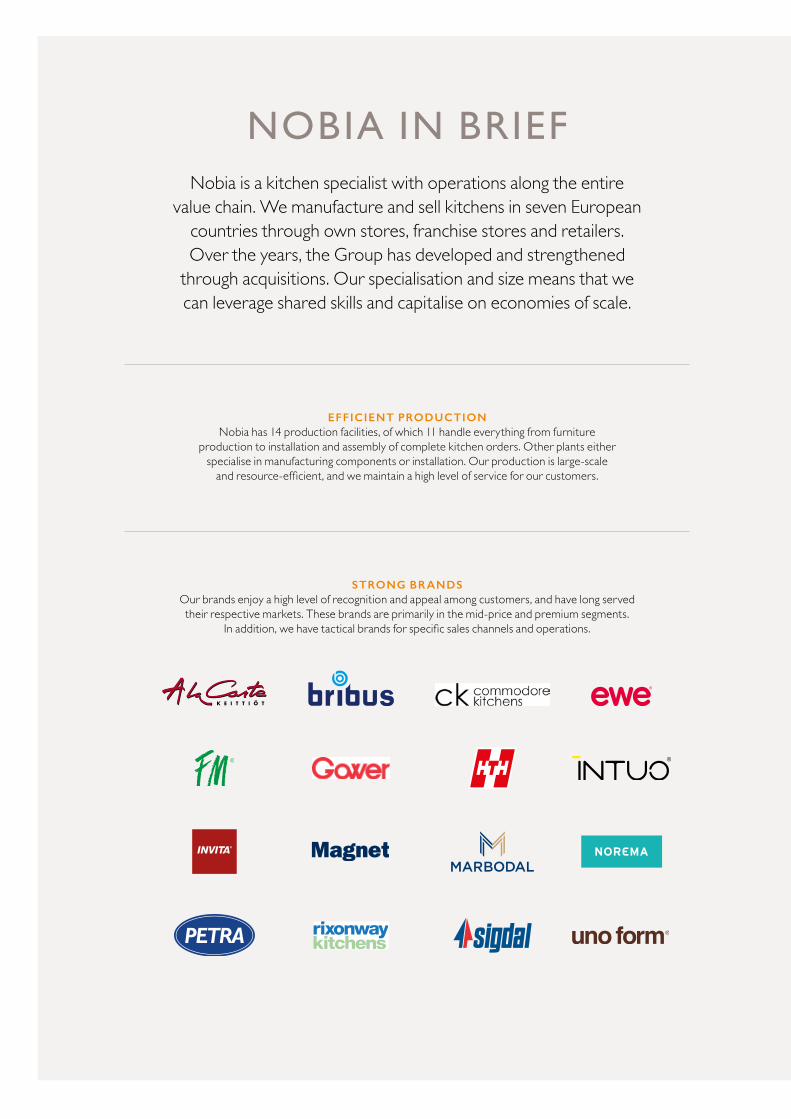
NOBIA IN BRIEFNobia is a kitchen specialist with operations along the entire
valuechain.WemanufactureandsellkitchensinsevenEuropean countriesthroughownstores,franchisestoresandretailers. Over the years, the Group has developed and strengthened throughacquisitions.Ourspecialisationandsizemeansthatwe canleveragesharedskillsandcapitaliseoneconomiesofscale.
EFFICIENT PRODUCTION Nobia has 14 production facilities, of which 11 handle everything from furniture
productiontoinstallationandassemblyofcompletekitchenorders.Otherplantseither specialiseinmanufacturingcomponentsorinstallation.Ourproductionislarge-scale andresource-efficient,andwemaintainahighlevelofserviceforourcustomers.
STRONG BRANDS Our brands enjoy a high level of recognition and appeal among customers, and have long served theirrespectivemarkets.Thesebrandsareprimarilyinthemid-priceandpremiumsegments.
Inaddition,wehavetacticalbrandsforspecificsaleschannelsandoperations.
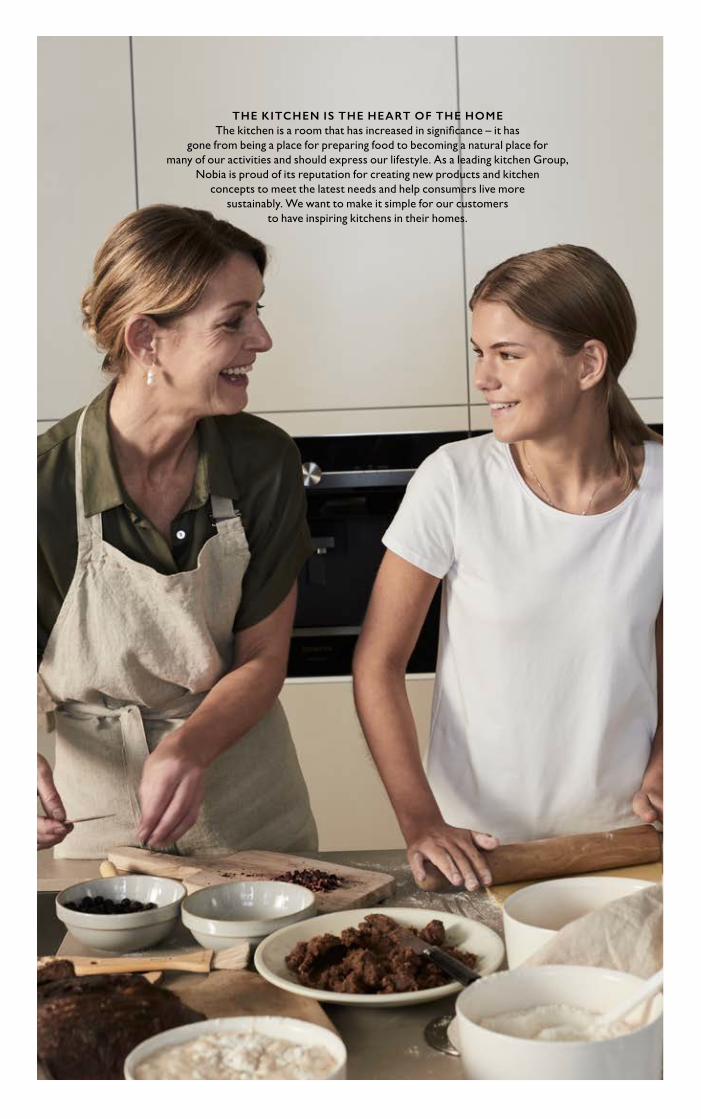
THE KITCHEN IS THE HEART OF THE HOMEThe kitchen is a room that has increased in significance – it has
gone from being a place for preparing food to becoming a natural place for many of our activities and should express our lifestyle. As a leading kitchen Group,
Nobia is proud of its reputation for creating new products and kitchen concepts to meet the latest needs and help consumers live more
sustainably. We want to make it simple for our customers to have inspiring kitchens in their homes.
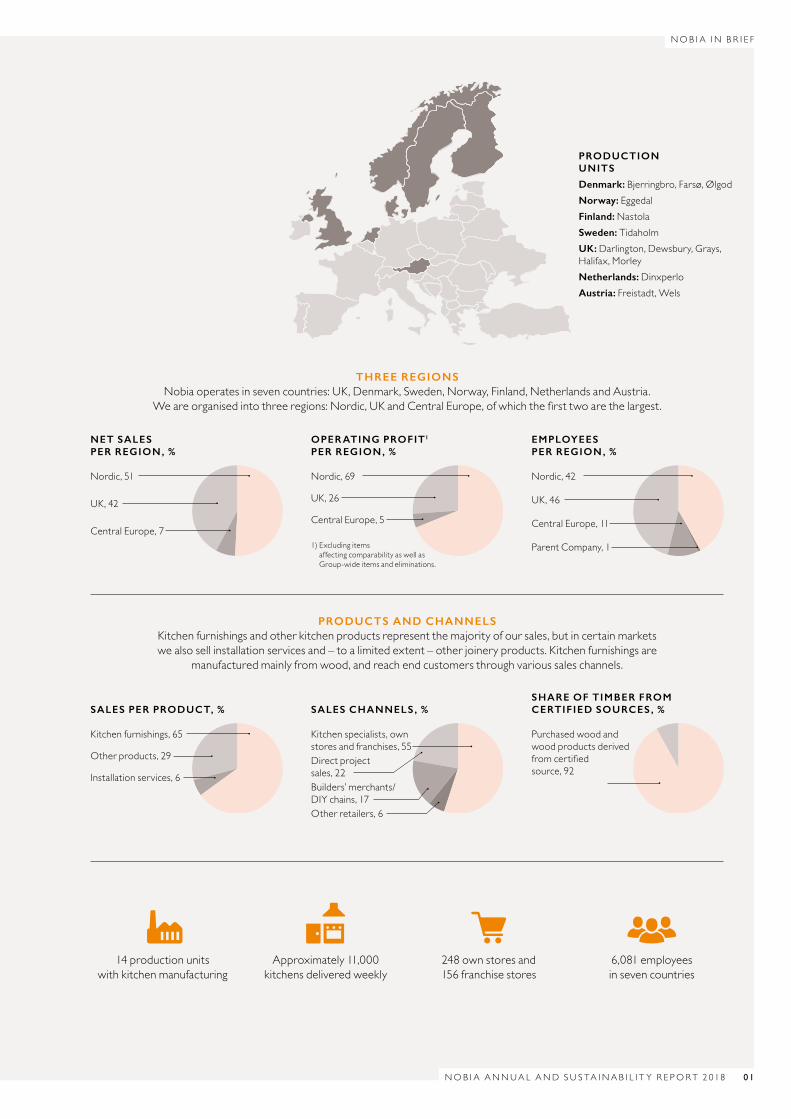
14 production units with kitchen manufacturing
Approximately 11,000 kitchens delivered weekly
248 own stores and 156 franchise stores
6,081 employees in seven countries
PRODUCTS AND CHANNELSKitchen furnishings and other kitchen products represent the majority of our sales, but in certain markets wealsosellinstallationservicesand–toalimitedextent–otherjoineryproducts.Kitchenfurnishingsare
manufacturedmainlyfromwood,andreachendcustomersthroughvarioussaleschannels.
THREE REGIONSNobiaoperatesinsevencountries:UK,Denmark,Sweden,Norway,Finland,NetherlandsandAustria.
Weareorganisedintothreeregions:Nordic,UKandCentralEurope,ofwhichthefirsttwoarethelargest.
NET SALES PER REGION, %
Nordic, 51
UK, 42
Central Europe, 7
SALES PER PRODUCT, %
Kitchen furnishings, 65
Other products, 29
Installationservices,6
OPERATING PROFIT1 PER REGION, %
Nordic, 69
UK, 26
Central Europe, 5
1) Excluding items affecting comparability as well as Group-wideitemsandeliminations.
EMPLOYEES PER REGION, %
Nordic, 42
UK, 46
Central Europe, 11
Parent Company, 1
SHARE OF TIMBER FROM CERTIFIED SOURCES, %
Purchased wood and wood products derived fromcertified source, 92
SALES CHANNELS, %
Kitchen specialists, own stores and franchises, 55Direct project sales, 22Builders’ merchants/ DIYchains,17Other retailers, 6
PRODUCTION UNITS
Denmark: Bjerringbro, Farsø, Ølgod Norway: Eggedal Finland: Nastola Sweden: TidaholmUK: Darlington, Dewsbury, Grays, Halifax, Morley Netherlands: Dinxperlo Austria:Freistadt,Wels
NOB I A ANNUA L AND S U S TA I NA B I L I T Y R E PORT 2 018 01
NOB I A I N B R I E F
NET SALES, SEK M
RETURN ON OPERATING CAPITAL , SEK M
OPERATING CASH FLOW, SEK M
OPERATING PROFIT1, SEK M AND OPERATING MARGIN1, %
KEY RATIOS – FIVE-YEAR OVERVIEW 20143 20154 2016 2017 2018
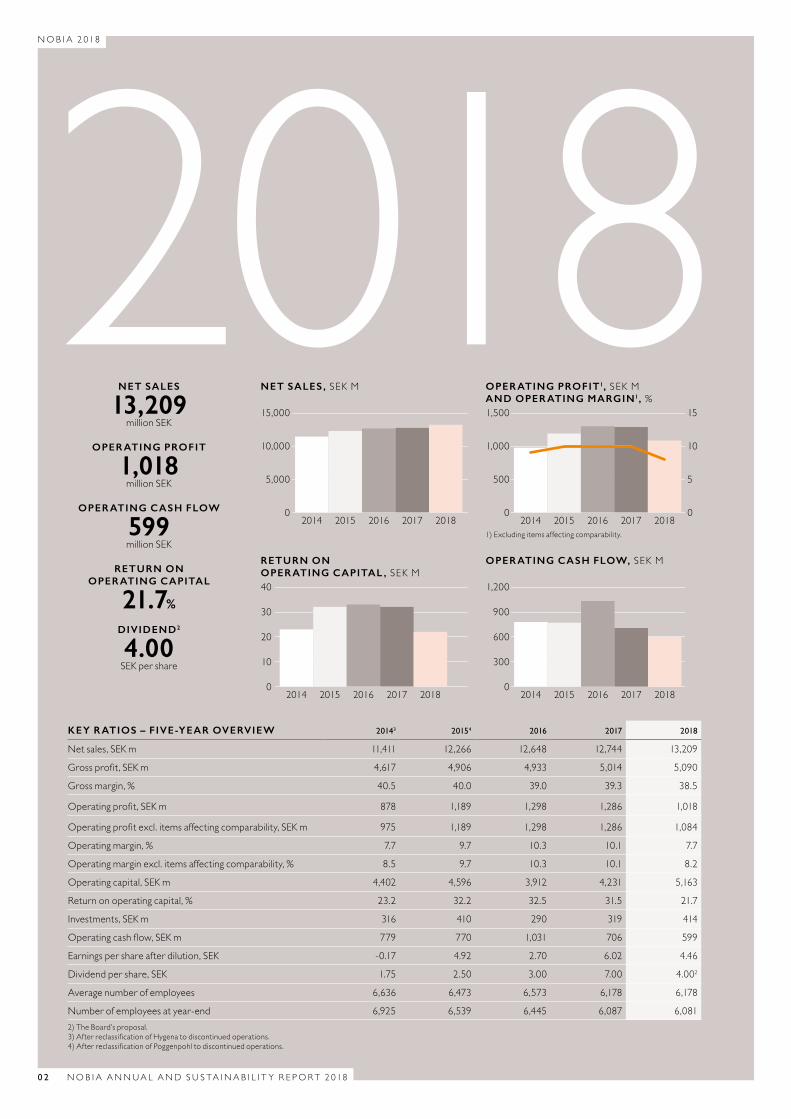
Net sales, SEK m 11,411 12,266 12,648 12,744 13,209
Grossprofit,SEKm 4,617 4,906 4,933 5,014 5,090
Gross margin, % 40.5 40.0 39.0 39.3 38.5
Operatingprofit,SEKm 878 1,189 1,298 1,286 1,018
Operatingprofitexcl.itemsaffectingcomparability,SEKm 975 1,189 1,298 1,286 1,084
Operating margin, % 7.7 9.7 10.3 10.1 7.7
Operatingmarginexcl.itemsaffectingcomparability,% 8.5 9.7 10.3 10.1 8.2
Operating capital, SEK m 4,402 4,596 3,912 4,231 5,163
Return on operating capital, % 23.2 32.2 32.5 31.5 21.7
Investments,SEKm 316 410 290 319 414
Operatingcashflow,SEKm 779 770 1,031 706 599
Earnings per share after dilution, SEK -0.17 4.92 2.70 6.02 4.46
Dividend per share, SEK 1.75 2.50 3.00 7.00 4.002
Average number of employees 6,636 6,473 6,573 6,178 6,178
Number of employees at year-end 6,925 6,539 6,445 6,087 6,0812)TheBoard’sproposal.3)AfterreclassificationofHygenatodiscontinuedoperations.4)AfterreclassificationofPoggenpohltodiscontinuedoperations.
NET SALES
13,209million SEK
OPERATING PROFIT
1,018 million SEK
OPERATING CASH FLOW
599 million SEK
RETURN ON OPERATING CAPITAL
21.7% DIVIDEND2
4.00SEK per share
20182017201620152014
20182017201620152014 20182017201620152014
20182017201620152014
15,000
10,000
5,000
0
40
30
20
10
0
1,200
900
600
300
0
1,500
1,000
500
0
15
10
5
0
1)Excludingitemsaffectingcomparability.
0 2 NOB I A ANNUA L AND S U S TA I NA B I L I T Y R E PORT 2 018
NOB I A 2 018
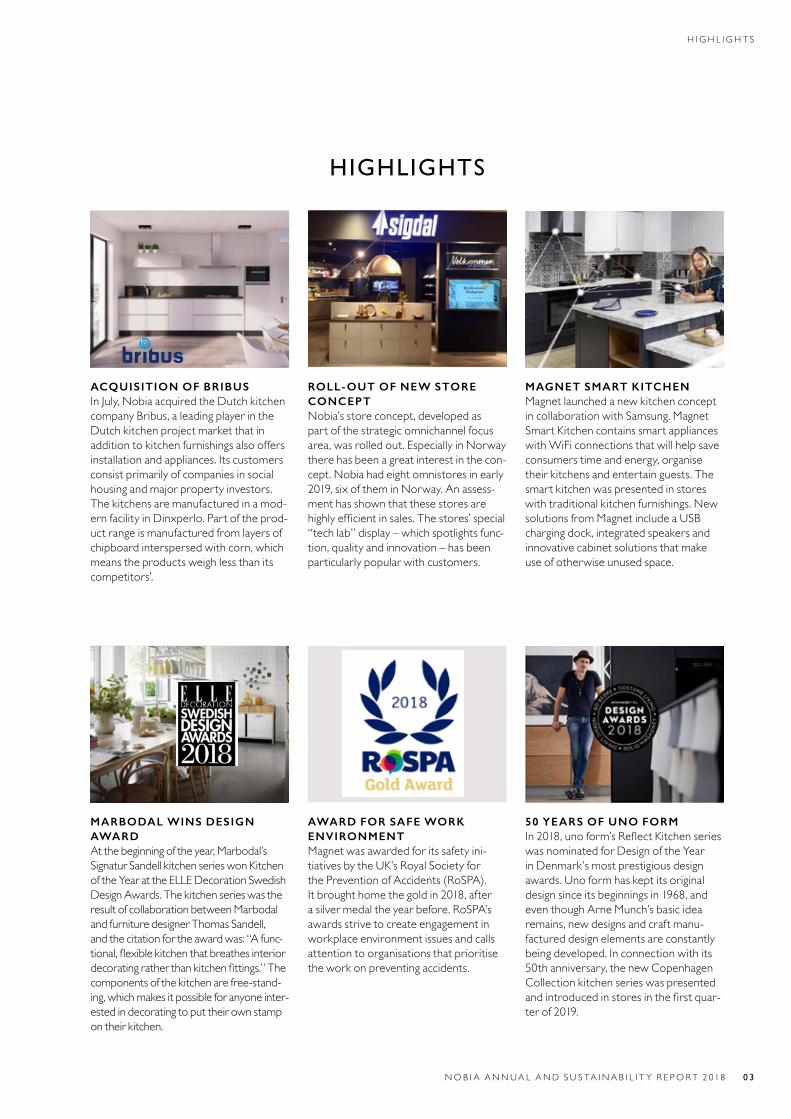
ACQUISITION OF BRIBUSInJuly,NobiaacquiredtheDutchkitchencompany Bribus, a leading player in the Dutch kitchen project market that in addition to kitchen furnishings also offers installationandappliances.Itscustomersconsist primarily of companies in social housingandmajorpropertyinvestors.The kitchens are manufactured in a mod-ernfacilityinDinxperlo.Partoftheprod-uct range is manufactured from layers of chipboard interspersed with corn, which means the products weigh less than its competitors’.
ROLL-OUT OF NEW STORE CONCEPTNobia’s store concept, developed as part of the strategic omnichannel focus area,wasrolledout.EspeciallyinNorwaythere has been a great interest in the con-cept.Nobiahadeightomnistoresinearly2019,sixoftheminNorway.Anassess-ment has shown that these stores are highlyefficientinsales.Thestores’special“techlab”display–whichspotlightsfunc-tion,qualityandinnovation–hasbeenparticularlypopularwithcustomers.
MAGNET SMART KITCHENMagnet launched a new kitchen concept incollaborationwithSamsung.MagnetSmart Kitchen contains smart appliances withWiFiconnectionsthatwillhelpsaveconsumers time and energy, organise theirkitchensandentertainguests.Thesmart kitchen was presented in stores withtraditionalkitchenfurnishings.Newsolutions from Magnet include a USB charging dock, integrated speakers and innovative cabinet solutions that make useofotherwiseunusedspace.
MARBODAL WINS DESIGN AWARDAt the beginning of the year, Marbodal’s Signatur Sandell kitchen series won Kitchen oftheYearattheELLEDecorationSwedishDesignAwards.Thekitchenserieswastheresult of collaboration between Marbodal and furniture designer Thomas Sandell, and the citation for the award was: “A func-tional,flexiblekitchenthatbreathesinteriordecoratingratherthankitchenfittings.”Thecomponents of the kitchen are free-stand-ing, which makes it possible for anyone inter-ested in decorating to put their own stamp ontheirkitchen.
AWARD FOR SAFE WORK ENVIRONMENTMagnet was awarded for its safety ini-tiatives by the UK’s Royal Society for thePreventionofAccidents(RoSPA).Itbroughthomethegoldin2018,afterasilvermedaltheyearbefore.RoSPA’sawards strive to create engagement in workplace environment issues and calls attention to organisations that prioritise theworkonpreventingaccidents.
50 YEARS OF UNO FORMIn2018,unoform’sReflectKitchenserieswasnominatedforDesignoftheYearin Denmark’s most prestigious design awards.Unoformhaskeptitsoriginaldesign since its beginnings in 1968, and even though Arne Munch’s basic idea remains, new designs and craft manu-factured design elements are constantly beingdeveloped.Inconnectionwithits50th anniversary, the new Copenhagen Collection kitchen series was presented andintroducedinstoresinthefirstquar-terof2019.
HIGHLIGHTS
NOB I A ANNUA L AND S U S TA I NA B I L I T Y R E PORT 2 018 0 3
H I GH L I GH T S
An eventful year with great uncertainty in the business environmentLookingbackat2018,itwasayearimpactedbyaweakermacroeconomicoutlook.Brexit uncertainty coupled with the softening of the Nordic housing market and materialpriceinflationnegativelyaffectedourgrowthandmargins.However,muchhas been done to mitigate these impacts, and with Nobia’s strong organisation andfinances,wearewellpreparedtodriveprofitablegrowthgoingforward.
2018wasayearinwhichagreatdealhappened.Wemadeanotheracquisition–thistimeintheNetherlands,whichisanewmarketforNobia.OurprojectoperationsintheUKreapedmajorsalessuc-cesses, which resulted in a sharp increase in the value of the Brit-ish project portfolio, and we continued to roll out our new store conceptwithmoredigitalcontent.Butperhapsmostimportantforthe years ahead was that we prepared plans to tap into the major potentialforimprovedefficiencyinherentintheGroup’sproduc-tionandlogisticsstructures.
NO GROWTH IN THE MAIN MARKETSOur UK operations reported negative growth during the year, even though Magnet grew and captured shares in a consumer segmentsubjecttofiercecompetition.ThebackgroundtoMag-net’s sales growth was the successful repositioning of the con-sumerofferingatthebeginningoftheyear.Uncertaintysur-roundingBrexitledhowevertolowerconsumerconfidenceanda certain level of turbulence in the UK kitchen market, in which severalplayersreformulatedtheirofferingsandbusinessmodels.Oursalestosmall,localconstructioncompaniesandDIYchainsdecreased, and growth was also negatively impacted by the con-cluded collaboration with B2B customer Homebase, a weak socialhousingmarketandpostponedhousingprojects.
IntheNordicregion,theprojectmarketwasinitiallyverystrong, but unfortunately during the summer we were compelled to state that our Swedish factory could not manage to deliver high volumeswithoutdisruptionstoproduction.Procedureswerereviewed by our new central and local supply chain teams, and the disruptionswererectifiedfollowingmaintenanceworkinthesum-mer.Attheendoftheyear,therateofgrowthinprojectdeliverieshadslackened.Consumersalesalsodecreased,largelyasaconse-quence of the decision to convert own stores in Norway to franchisestores.Thebackgroundtothestoreconversionwas primarily that the franchise model proved to work well in the Norwegianmarket,butalsothatitlowersourfixedcosts.
WE ARE SAFEGUARDING PROFITABILITYInlightoftheincreaseduncertaintyinourmarkets,andtosafeguardourprofitability,acostsavingsprogrammewasinitiatedinthefourthquarter.Thesemeasuresincludestaffreductionsinallregionsand
theclosureof16stores,primarilyintheUK.Themeasureswillgen-erateannualsavingsofSEK80million.Dependingonthedemandtrends, we may initiate further measures, and we will continue to focusmainlyoncontinuallybringingdowncostlevels.
Cashflowfromoperatingactivitiesincreasedduringtheyear,andthecompany’sfinancialpositionremainsstrong.TheBoardofDirectorsproposesadividendofSEK4pershare.
NEW FAMILY MEMBERInJuly,wewelcomedBribustotheNobiafamily.Bribusisaleaderin the Dutch kitchen project market, and we see strong oppor-tunities for continued growth in the Netherlands as well as for expansionintootherchannelsandcountries.Theintegrationof Bribus into the Nobia Group went well, and as a result of the acquisitionourCentralEuropeanregionhasexpanded.Bribus’sincomeinthesecondhalfoftheyeartotalledSEK350million.
MAJOR PROJECTS IN LONDONThroughCIEKitchens,whichdesignsandinstallspremiumkitch-ens for private developer projects, we successfully bid on several prestigiousprojectsinLondon,includingSouthbankPlace,Bat-terseaPowerStation,LillieSquare,SouthQuayPlazaandMar-bleArchTower.ManyattractiveapartmentbuildingsinLondonwillbebuiltandfurnishedwithkitchensoverthecomingyears.All together, our UK project operations via Commodore and CIEKitchenshaveaverystrongorderbook,withahighpropor-tionofplanneddeliveriesin2019.
PROGRAMME FOR ENHANCED EFFICIENCYRestructuring in production and logistics will be a large part of future valuecreationatNobia.Wehaveoverhauledtheproductionstruc-tureandbuiltahighlycompetentorganisation.Beginningin2019,wewillimplementmeasurestoenhancetheefficiencyofthestructurein the Nordic region, where we currently have six production facil-ities, and in the UK, where no structural changes have been imple-mentedsincetheplantswereacquired.Overthenextfewyears,thiswill mean fewer full-scale production facilities and more specialised divisionsinbothregions.Inadditiontoimprovingtheproductionstructure,wewillimplementefficiencyenhancementsinourprod-uctrangeandsourcingaswellasmakegeneralcostsavings.
0 4 NOB I A ANNUA L AND S U S TA I NA B I L I T Y R E PORT 2 018
C E O ’ S C O M M E N T S
VALUE CREATION STRATEGYFocusonprofitablegrowthandefficiencyenhancementsisacentralpartofourstrategy.Otherimportantpartsofthestrat-egy are investments in omnichannel, growth in the economy segmentandnewsolutionsforthemodern,sustainablekitchen.As a leading kitchen specialist, we need to continually invest in ourbrands,channelsandproductrange.In2019therewillbea comprehensive review of both the production and logistics structures, as well as choice of channels, and strategic initiatives tofurtherstrengthenourmarketpositionandcreatevalue.Wehavealsoidentifiedgoodopportunitiesforprofitableorganicand acquired growth going forward, which include strengthen-ing the UK contract business and revamping the Nordic B2C business.
The most important facilitator for achieving what we want isouremployees.Toattractandretaintalent,weareinvestingin our corporate culture, in which the safety of our employees isthehighestpriority.Othercentralpartsareahealthywork-ingenvironmentandgoodmanagement.Wearekeentoensurethat Nobia is hallmarked by diversity, and are making efforts to recruitmorewomentoexecutivepositions.
Sustainability is a strategically important issue that helps us remain relevant and strengthens our relationships with import-antstakeholders.Today’sconsumerswantattractivekitchens,andatthesametimewanttotakeresponsibilityfortheplanet.Wehaveagreatdealofexperienceinmanufacturingandsellingkitchens with high environmental standards, and regard sustain-ability from two perspectives: how we inspire people to more sustainable lives through our kitchens; and how we can be more sustainableinourownoperationsandbusinessrelationships.
Nobia has signed the UN Global Compact and supports the ten principles on human rights, labour, the environment, and anti-corruption; we work actively to integrate these principles intoouroperationsandourbusinessrelationships.Oursustain-ability strategy is intended to create value through linking our operations to our ambitions to promote the UN Sustainable DevelopmentGoals.Wehavedefinedourownsustainabilitygoals, and have already achieved the goal of 100 per cent renew-ableelectricityinproduction.
LOOKING FORWARDWithastrongmarketpositionandmanyinitiativesforgrowthfollowingthevaluecreationplan,Iamconvincedwecangainsharesinourcoremarkets.However,macroeconomicuncer-taintywillmostlikelyentailsoftermarketconditions.IntheUK, political uncertainty concerning Brexit continues to ham-per demand, and the risk of a “no deal” UK exit from the EU increasedearlyintheyear.Nobiaiswellpreparedforsuchasitu-ation; measures we have taken include building up a safety stock of components and fronts in order to keep our customers sup-pliedwithcompletekitchensevenifimportsaredisrupted.Atthe same time, an increasing number of indications are emerging from the Nordic and Central Europe regions that markets are becomingsofter.
Wearetakingthesewarningsignsextremelyseriously,andIwould like to be clear that there is much left to be done to real-isetheGroup’sfullpotential.Butitshouldalsoberememberedthat, in many respects, Nobia today is a different company than itwastenyearsagoafterthefinancialcrisis.Nobiawasnotprof-itable then, and the company was deeply indebted; today, the Group’searningsarehealthy,withlowerfixedcostsandstrongfinances.Wealsohaverelativelystronginsightintoprojectbusi-nesses, since lead times from construction start to delivery are long.Theseinsights,aswellasourplans,givemeconfidenceinthe assurance that we have excellent conditions for managing well even in a tougher market situation, and that we will realise majorefficiencyenhancementsinthecomingyears.
Iwouldliketoextendmywarmestthankstoallmycol-leaguesandpartnersforexcellentcollaboration.Wearehead-ingtowardseventfultimes,andIamlookingforwardtothem.
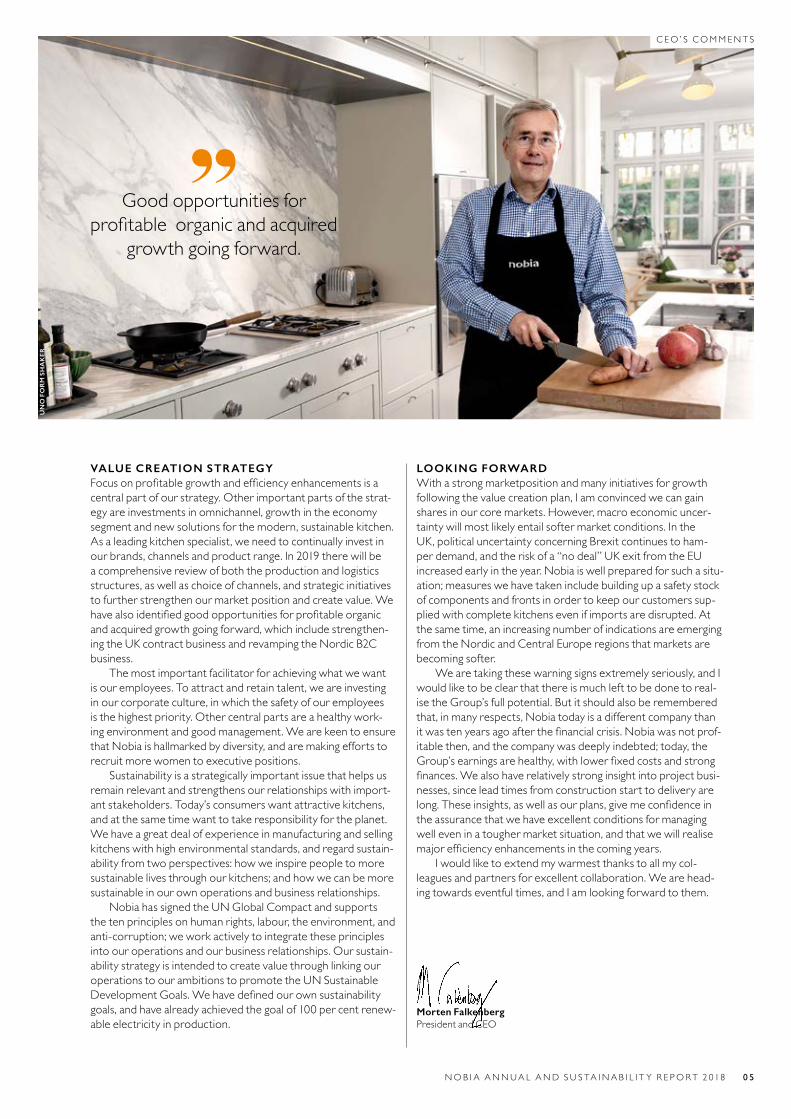
Morten Falkenberg President and CEO
Good opportunities for profitableorganicandacquired
growthgoingforward.
UN
O F
OR
M S
HA
KE
R
NOB I A ANNUA L AND S U S TA I NA B I L I T Y R E PORT 2 018 0 5
C E O ’ S C O M M E N T S
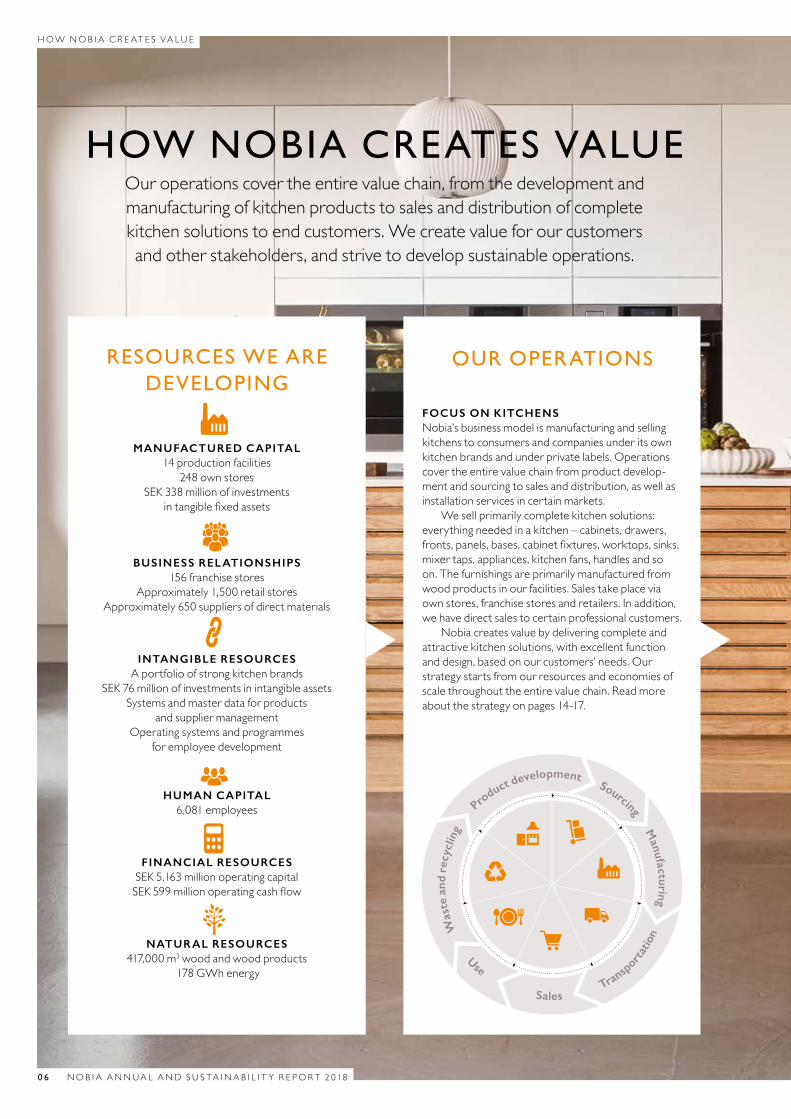
HOW NOBIA CREATES VALUEOur operations cover the entire value chain, from the development and manufacturing of kitchen products to sales and distribution of complete kitchensolutionstoendcustomers.Wecreatevalueforourcustomersandotherstakeholders,andstrivetodevelopsustainableoperations.
RESOURCES WE ARE DEVELOPING
MANUFACTURED CAPITAL14 production facilities
248 own stores SEK 338 million of investments
intangiblefixedassets
BUSINESS RELATIONSHIPS156 franchise stores
Approximately 1,500 retail storesApproximately 650 suppliers of direct materials
INTANGIBLE RESOURCESA portfolio of strong kitchen brands
SEK 76 million of investments in intangible assets Systems and master data for products
and supplier management Operating systems and programmes
for employee development
HUMAN CAPITAL6,081 employees
FINANCIAL RESOURCESSEK 5,163 million operating capitalSEK599millionoperatingcashflow
NATURAL RESOURCES417,000 m3 wood and wood products
178GWhenergy
OUR OPERATIONS
FOCUS ON KITCHENS Nobia’s business model is manufacturing and selling kitchens to consumers and companies under its own kitchenbrandsandunderprivatelabels.Operationscover the entire value chain from product develop-ment and sourcing to sales and distribution, as well as installationservicesincertainmarkets.
Wesellprimarilycompletekitchensolutions:everythingneededinakitchen–cabinets,drawers,fronts,panels,bases,cabinetfixtures,worktops,sinks,mixer taps, appliances, kitchen fans, handles and so on.Thefurnishingsareprimarilymanufacturedfromwoodproductsinourfacilities.Salestakeplaceviaownstores,franchisestoresandretailers.Inaddition,wehavedirectsalestocertainprofessionalcustomers.
Nobia creates value by delivering complete and attractive kitchen solutions, with excellent function anddesign,basedonourcustomers’needs.Our strategy starts from our resources and economies of scalethroughouttheentirevaluechain.Readmoreaboutthestrategyonpages14-17.
Product development
SourcingM
anufacturing
Was
te a
nd r
ecyc
ling
Transp
orta
tion
Sales
Use
0 6 NOB I A ANNUA L AND S U S TA I NA B I L I T Y R E PORT 2 018
HOWNOB I A C R E AT E S VA LU E
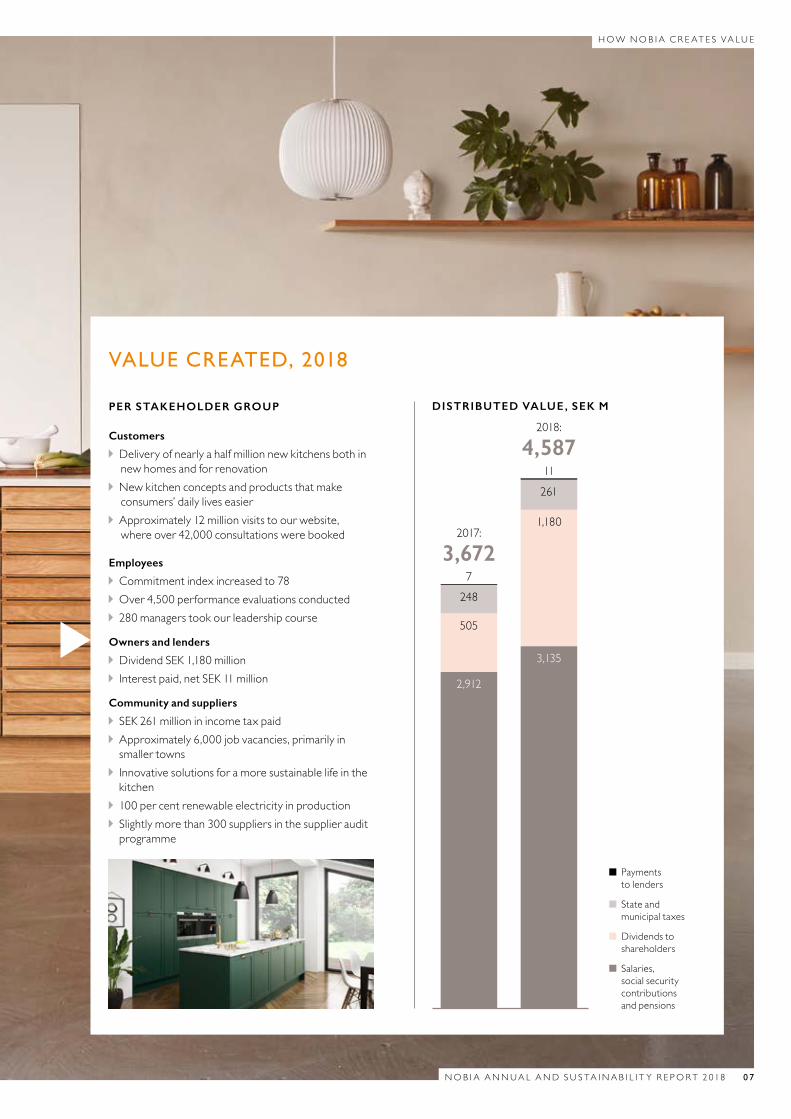
VALUE CREATED, 2018
PER STAKEHOLDER GROUP
Customers
Delivery of nearly a half million new kitchens both in new homes and for renovation
New kitchen concepts and products that make consumers’ daily lives easier
Approximately 12 million visits to our website, where over 42,000 consultations were booked
Employees
Commitment index increased to 78 Over 4,500 performance evaluations conducted 280 managers took our leadership course
Owners and lenders
Dividend SEK 1,180 million Interestpaid,netSEK11million
Community and suppliers
SEK 261 million in income tax paid Approximately 6,000 job vacancies, primarily in smaller towns Innovativesolutionsforamoresustainablelifeinthekitchen
100 per cent renewable electricity in production Slightly more than 300 suppliers in the supplier audit programme
DISTRIBUTED VALUE, SEK M
2017:
3,672
2018:
4,587
Payments to lenders
State and municipal taxes
Dividends to shareholders
Salaries, social security contributions and pensions
7
11
248
505
2,912
261
1,180
3,135
NOB I A ANNUA L AND S U S TA I NA B I L I T Y R E PORT 2 018 0 7
HOWNOB I A C R E AT E S VA LU E
MA
GN
ET
TA
TT
ON
0 8 NOB I A ANNUA L AND S U S TA I NA B I L I T Y R E PORT 2 018
B U S I N E S S EN V I RONMENT AND S T R AT EGY
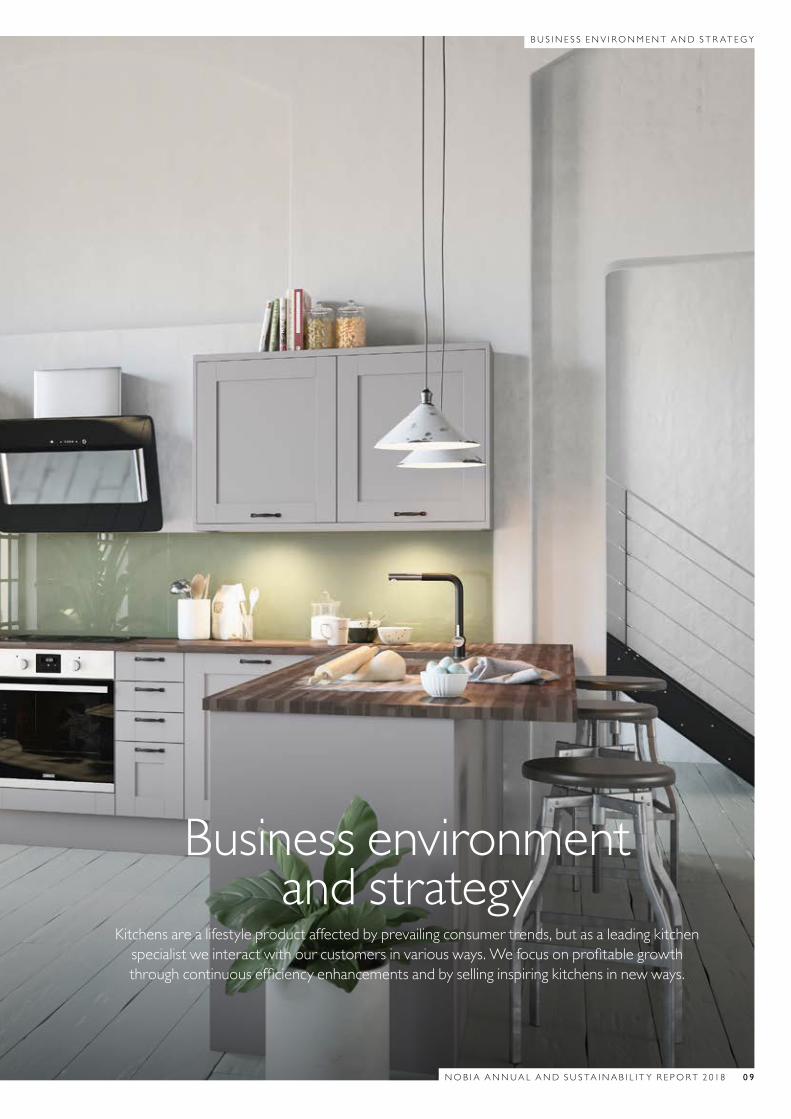
Business environment and strategy
Kitchens are a lifestyle product affected by prevailing consumer trends, but as a leading kitchen specialistweinteractwithourcustomersinvariousways.Wefocusonprofitablegrowththroughcontinuousefficiencyenhancementsandbysellinginspiringkitchensinnewways.
NOB I A ANNUA L AND S U S TA I NA B I L I T Y R E PORT 2 018 0 9
B U S I N E S S EN V I RONMENT AND S T R AT EGY
TRENDS THAT IMPACT OUR KITCHENSUrbanisation, digitisation and an increased interest in sustainability
and experiences are examples of megatrends that impact how our kitchens look andhowwebuythem.Here,wepresentfivespecifictrendswithanimpactonourproductdevelopmentandonhowweinteractwithourcustomers.
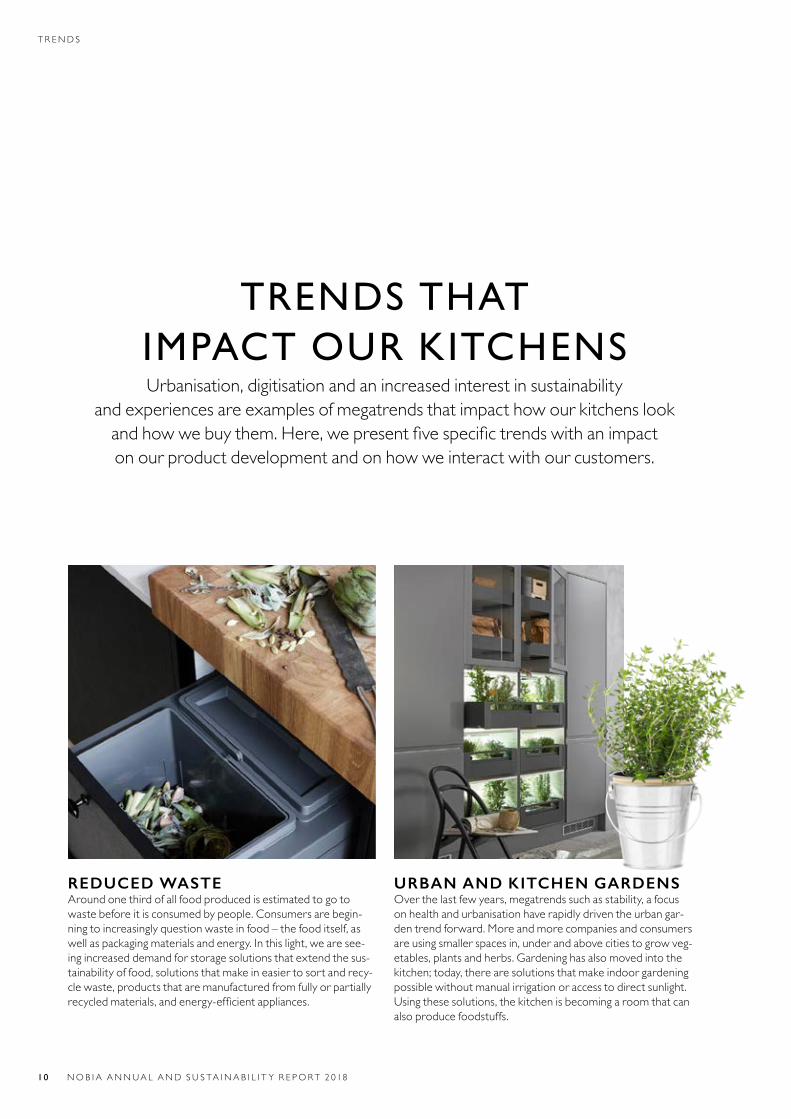
REDUCED WASTEAround one third of all food produced is estimated to go to wastebeforeitisconsumedbypeople.Consumersarebegin-ningtoincreasinglyquestionwasteinfood–thefooditself,aswellaspackagingmaterialsandenergy.Inthislight,wearesee-ing increased demand for storage solutions that extend the sus-tainability of food, solutions that make in easier to sort and recy-cle waste, products that are manufactured from fully or partially recycledmaterials,andenergy-efficientappliances.
URBAN AND KITCHEN GARDENSOver the last few years, megatrends such as stability, a focus on health and urbanisation have rapidly driven the urban gar-dentrendforward.Moreandmorecompaniesandconsumersare using smaller spaces in, under and above cities to grow veg-etables,plantsandherbs.Gardeninghasalsomovedintothekitchen; today, there are solutions that make indoor gardening possiblewithoutmanualirrigationoraccesstodirectsunlight.Using these solutions, the kitchen is becoming a room that can alsoproducefoodstuffs.
10 NOB I A ANNUA L AND S U S TA I NA B I L I T Y R E PORT 2 018
T R E N D S
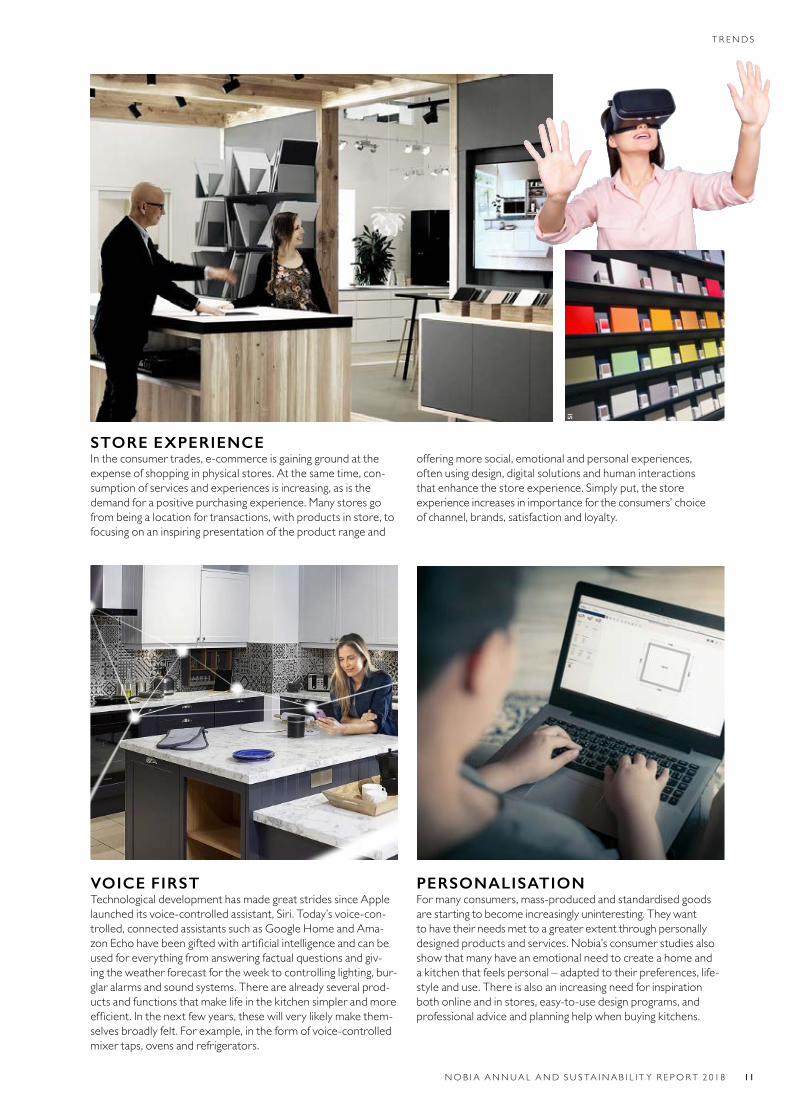
STORE EXPERIENCEIntheconsumertrades,e-commerceisgaininggroundattheexpenseofshoppinginphysicalstores.Atthesametime,con-sumption of services and experiences is increasing, as is the demandforapositivepurchasingexperience.Manystoresgofrom being a location for transactions, with products in store, to focusing on an inspiring presentation of the product range and
offering more social, emotional and personal experiences, often using design, digital solutions and human interactions thatenhancethestoreexperience.Simplyput,thestore experience increases in importance for the consumers’ choice ofchannel,brands,satisfactionandloyalty.
VOICE FIRSTTechnological development has made great strides since Apple launcheditsvoice-controlledassistant,Siri.Today’svoice-con-trolled, connected assistants such as Google Home and Ama-zonEchohavebeengiftedwithartificialintelligenceandcanbeused for everything from answering factual questions and giv-ing the weather forecast for the week to controlling lighting, bur-glaralarmsandsoundsystems.Therearealreadyseveralprod-ucts and functions that make life in the kitchen simpler and more efficient.Inthenextfewyears,thesewillverylikelymakethem-selvesbroadlyfelt.Forexample,intheformofvoice-controlledmixertaps,ovensandrefrigerators.
PERSONALISATIONFor many consumers, mass-produced and standardised goods arestartingtobecomeincreasinglyuninteresting.Theywantto have their needs met to a greater extent through personally designedproductsandservices.Nobia’sconsumerstudiesalsoshow that many have an emotional need to create a home and akitchenthatfeelspersonal–adaptedtotheirpreferences,life-styleanduse.Thereisalsoanincreasingneedforinspirationboth online and in stores, easy-to-use design programs, and professionaladviceandplanninghelpwhenbuyingkitchens.
SI
NOB I A ANNUA L AND S U S TA I NA B I L I T Y R E PORT 2 018 11
T R E N D S
THE EUROPEAN KITCHEN MARKET
The kitchen market can be divided according to whether the kitchens are sold to consumersortoprofessionalcustomers.Thesecustomersegmentsaresizeddifferently
in different European countries, and can in turn be divided into renovation and new construction.Itisestimatedthat80percentoftheEuropeankitchenmarketismadeupofpurchasesforrenovation,andtheremainderofpurchasesfornewproduction.
THE CONSUMER MARKET As a room, the kitchen is becoming increasingly important in ourhomes.Itisnolongerjustaroomwherepeoplecookandeat food, but also the natural room both for socialising with fam-ilyandfriendsandforwork,studyandcreativeactivities.Inaddi-tion,interestinfoodandcookingisincreasing.Manyalsohaveaneed to create a home and a kitchen that expresses their per-sonalityandreflectstheirlifestyle.Furnishings,appliancesandkitchenequipmentcanconsequentlycostmore.Newdesignandfunctionalityreflectthegrowingimportanceofthekitchenandinspireconsumerstorenovateandinvestintheirkitchens.
For households, a new kitchen is a relatively major and com-plex investment that includes the important factors of function, layout,styleandmaterials.Kitchensareinfrequentlypurchasedproductsassociatedwithahighlevelofcustomerinvolvement.Onaverage,consumerspurchasenewkitchensevery15–20yearsand often when they move into a new home or have major reno-vationsdone.Thegeneraleconomicclimateandconsumers’faithinthefutureonquestionsofprivateeconomyaffectdemand.
Consumers usually invest a great deal of time and energy ongatheringinspirationandinformation.Inadditiontoresearchin such places as websites, social media and home décor mag-azines,theyvisitanaverageoftwotothreestorestocompare different alternatives and to get design and cost proposals before theychooseasupplierandplaceanorder.Thisiswhyastrong,well-known brand is important, as is professional and inspiring serviceinthestores.
European consumers can purchase their kitchens through various channels, for example, specialised kitchen stores, furni-ture stores and builders’ merchants, as well as directly on the Internettoacertainextent.Nobiareachescustomersthroughboth own stores and franchise stores, and a large number of retailers who often specialise in kitchens or who are active as builders’merchants.
Customers often seek inspiration and help in their planning, which is why trained kitchen designers and sellers are important in order to offer the right service and support our consumers throughthepurchasingprocess.Thegoalistoplananddesign
a kitchen adapted according to every customer’s needs, pref-erencesandlifestyle.Oneimportantaspectforfunctionalityisplanningbasedonthekitchen’s‘triangle’–thesink,ovenandrefrigerator are located relatively close to each other so as to createanefficientworkflow.
Kitchen renovations often result in labour costs for installa-tion, plumbing and electricity, which is why some countries offer tax deductions on labour that could have a positive effect on kitchensales.
Ready-to-assemble kitchen products are a large and growing segmentofmanykitchenmarketsinEurope.Nobiaprovidesaproduct range under several brands that are a good value for someonewhowantstodoallthework–measuring,assemblingandinstallingthekitchen–bythemselves.
THE PROFESSIONAL MARKETTheprofessionalmarketcontainscorporatecustomers–majorconstruction companies and property companies, house fac-toriesandpropertydevelopers,forexample–andalsoprivateand municipal landlords as well as small construction companies andbuilders.InlargecountriessuchastheUK,kitchensuppliersfocustoalargeextentonaspecificsegmentoftheprofessionalmarket, for example, customers in property development, social housing,orsmalllocalconstructioncompanies.Nobiahasoper-ations in all these segments through various channels, and has a particularly strong position in the professional market in the Nordiccountries.
Professional customers are important partners for Nobia, and while they have product requirements that are simi-lartoconsumers’,theirserviceneedsaresomewhatdifferent.The most important competitive advantages for major proj-ects are successfully delivering large orders on time, and prod-uctsthatareeasytoinstall.Theservicesbeingdemandedcouldbe knowledge of trends, maximising surface area and the work flowinthekitchenanddedicatedprojectmanagement.Physicalstores that allow the end customer to see and feel the kitchens arealsoanadvantage.Sustainabilityissuesarealsoimportantfor professional customers, and demand for sustainability cer-
12 NOB I A ANNUA L AND S U S TA I NA B I L I T Y R E PORT 2 018
M A R K E T
tificationsandproductlabelsandsolutionsthatenabletheendconsumertolivemoresustainablyhaveincreased.Thereis,forexample, a growing demand for smart waste sorting and com-postingsolutions.
Contracts for kitchen deliveries are signed on a project- by-project basis, but it is common for business relationships between kitchen suppliers and professional customers to be long-term, especially among the major construction companies intheNordicregion.
House builders and construction companiesHouse builders and construction companies need to offer their customers kitchens with good design and numerous options, and an attractive kitchen is seen as part of marketing new objects.Newhousingconstructionisanindustrythatisrel-atively sensitive to the business cycle; construction moves in cycles but does not necessarily follow the same trend in all Euro-peancountries.Macroeconomiceventsandmegatrendssuchas urbanisation impact the demand for new housing, as do con-sumers’ future expectations for salary trends, housing prices and interestratesaswellasopportunitiesforborrowingmoney.
IntheUKandtheNordicregion,kitchensareconsideredbuilding accessories and included in the sale of an apartment orahouse.Thisislesscommon,however,incountriessuchasAustriaorGermany,whichmeanssignificantlysmallerprojectmarketsinthesecountries.
Nobia has a strong position in new housing construction amongconstructioncompanies–especiallyintheNordicregion–butisalsoactiveintheUK,primarilythroughCommodoreandCIE.
Social housingOne part of the professional kitchen market is sales to tenancy apartments or the public housing sector, who in the form of municipal housing authorities and tenant associations provide housing.Investmentsinsocialhousingareoftendependentonstatesubsidiesandpoliticaldecisions.Mostofthekitchensinthissegment are sold for renovation, normally as part of a planned maintenance programme, even thought there is some new con-structioninthissector.
Competitive prices and product durability are important aspectsforcustomersinthissegment.Otherimportantcom-petitive advantages are simplicity in ordering and installation, reliabilityofdeliveriesandshortdeliverytimes.
Kitchens for the rental market and social housing are a sig-nificantpartofNobia’soperations,primarilyintheUKandtheNetherlands, which have a relatively large stock of rental apart-ments.
Builders and small local construction companiesBuilders and small local construction companies are another importantcustomergroupintheprofessionalmarket.Smallcompanies with a small number of employees normally purchase andinstallonekitchenatatimefortheendconsumer.Anum-ber of these focus only on kitchen installation, but the majority alsoperformextensiverenovationworkforprivatehouseholds.
These smaller construction companies are important cus-tomersforNobia,aboveallthroughMagnetintheUK.Butevenour brands in the Nordic market and Bribus sell to smaller con-struction companies and builders, through both franchise stores andretailersinthebuildingtrade.
HT
H N
EW
YO
RK
NOB I A ANNUA L AND S U S TA I NA B I L I T Y R E PORT 2 018 13
M A R K E T
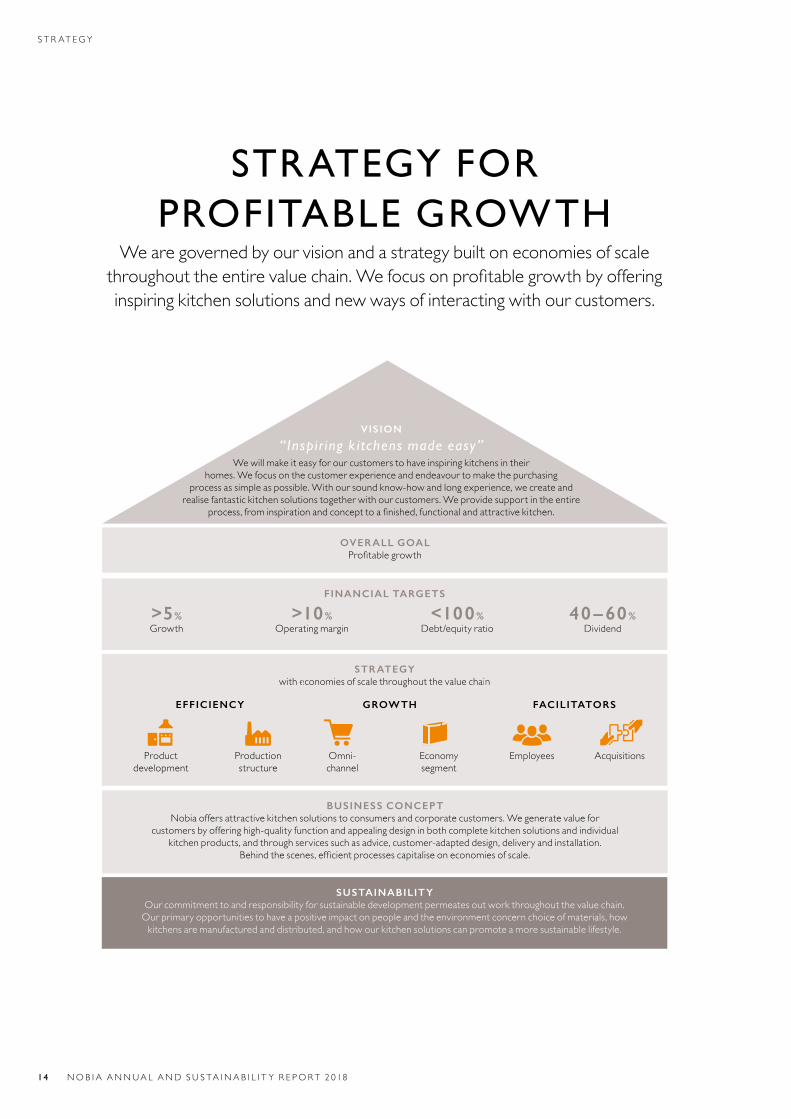
STRATEGY FOR PROFITABLE GROWTH
Wearegovernedbyourvisionandastrategybuiltoneconomiesofscalethroughouttheentirevaluechain.Wefocusonprofitablegrowthbyofferinginspiringkitchensolutionsandnewwaysofinteractingwithourcustomers.
VISION
“ Inspir ing k i tchens made easy”Wewillmakeiteasyforourcustomerstohaveinspiringkitchensintheir
homes.Wefocusonthecustomerexperienceandendeavourtomakethepurchasing processassimpleaspossible.Withoursoundknow-howandlongexperience,wecreateand
realisefantastickitchensolutionstogetherwithourcustomers.Weprovidesupportintheentire process,frominspirationandconcepttoafinished,functionalandattractivekitchen.
SUSTAINABILITYOurcommitmenttoandresponsibilityforsustainabledevelopmentpermeatesoutworkthroughoutthevaluechain.
Our primary opportunities to have a positive impact on people and the environment concern choice of materials, how kitchensaremanufacturedanddistributed,andhowourkitchensolutionscanpromoteamoresustainablelifestyle.
OVERALL GOALProfitablegrowth
FINANCIAL TARGETS
>5%Growth
>10%Operating margin
<100%Debt/equity ratio
40 – 60%Dividend
BUSINESS CONCEPTNobiaoffersattractivekitchensolutionstoconsumersandcorporatecustomers.Wegeneratevaluefor
customers by offering high-quality function and appealing design in both complete kitchen solutions and individual kitchenproducts,andthroughservicessuchasadvice,customer-adapteddesign,deliveryandinstallation.
Behindthescenes,efficientprocessescapitaliseoneconomiesofscale.
STRATEGYwith economies of scale throughout the value chain
Product development
Production structure
EFFICIENCY FACILITATORS
Employees AcquisitionsEconomy segment
Omni- channel
GROWTH
S T R AT EGY
14 NOB I A ANNUA L AND S U S TA I NA B I L I T Y R E PORT 2 018
Product developmentFor most of Nobia’s brands and markets, there is a Group-wide core range.Thegoalistobeontheleadingedgeasregardsnewproductswhile reducing the complexity of the Group’s total product range by increasing the overlaps of best-selling products and reducing the numberofcomponentswithsmallvolumes.Thisallowsustorealiseadditionaleconomiesofscaleinbothsourcingandproduction.
Our central product development brings out new kitchen concepts and innovative solutions that meet the latest customer needs,distinguishingourbrandsfromourcompetitors.Asaleadingkitchenspecialist,Nobia’sambitionistobethefirsttomarket with new products and to improve environmental per-formance in our kitchens in order to help our customers pro-motesustainabledevelopment.
COMPLETED IN 2018
Two new kitchen concepts with smart solutions were intro-ducedinthemarket.OurWaste-FreeKitchenhelpscustomerslivemorerespon-siblyandsustainably.Thiskitchenconceptcontainscabinetfronts made of recycled material, solutions that make recyc ling moreconvenient,andbetterstorageoffood. Magnet Smart Kitchen is a kitchen with a large amount of technologicalcontent.ThissmartkitchenfromMagnetcon-tains solutions such as a USB charging dock, integrated speakers and innovative cabinet solutions, as well as Sam-sung’srangeofconnectedsmartappliances.
The total number of fronts was reduced, primarily as a result of harmonisingtheproductrangeintheUK.
2016 2017 2018
Fronts, UK 530 320 197Fronts, Nordic 256 246 214
FORWARD FOCUSThe direction of our product development is determined based on an analysisofprevailingtrendsandconsumerinsights.Newsolutionswillbeworkedoutfortrendssuchassmallkitchensandindoorgardening.Wearealsodevelopingconceptsthatwillincreasecomfortandsim-plify life in the kitchen, and we will also focus on introducing products thathelpconsumerslivemoresustainably.Cost-efficientsolutionsforsustainable kitchens in rental apartments are being developed in part-nershipwithourcustomersfromconstructioncompanies.
Savings in purchasing will be achieved through in-depth col-laboration and cross-functional improvement initiatives with ourmostimportantsuppliers.Wewillalsoreducethenumberofsuppliers.Wewillplacegreatimportantonoptimisingtrans-ports and on total cost, where we are working with value engi-neeringtooptimisetheproductrange.
Production structureTheefficiencyofNobia’sstructure,with14productionfacilities(of which 11 manage the entire process from manufacturing of components to painting, installation and packaging of complete kitchen orders) can be enhanced through increased specialisa-tion and a clearer division into high-volume and low-volume production.
The long-term strategy is to centralise component manufac-ture.Productiononalargerscalemeanslowerfixedcosts,mak-ingconcentratedinvestmentsinfirst-classequipmentpossible.The main components in our kitchens will be produced under own management, even though contract manufacture may be advantageous for smaller product categories or for managing volumefluctuations.
Assembly and customisation should take place in local mar-kets so that we can maintain a high level of service for our cus-tomers.Transportefficiencyshouldalsobetakenintoaccount,sincerigidkitchensarerelativelybulkyproducts.Assemblyfacil-ities and logistics centres need to be conveniently located for optimaltransportation.
COMPLETED IN 2018
A comprehensive review was conducted of the production structuresfortheNordicandUKregions. A logistics centre for the Nordic economy price product range wasdevelopedatTidaholm.KitchenorderssoldviaPower’sstores–and,beginninginthespringof2019,alsoHTH’srangeofflatpacks–areputtogetherandpackagedfromhere. A transport system that allows better control over deliveries and costs in the entire transport process began to be imple-mented.
FORWARD FOCUS The priorities moving forward are implementing structural changes, investing in new equipment, minimising the risk of disrup tions to production and maintaining a high delivery capacity.Thechangeswillmeanfewerfull-scaleplantsand morespecialisedfacilitieswithagreaterdegreeofautomation.In2019,theserestructuringplanswillbemademorespecific.
EFFICIENCYNobia is one of the largest kitchen producers in Europe, and an important part of our strategy is to realise advantages of
large-scale production and opportunities for efficiency enhancement. We are continually developing new products while we optimise our total product range. Another important part of our strategy is our work on rationalising our production structure.
S T R AT EGY
NOB I A ANNUA L AND S U S TA I NA B I L I T Y R E PORT 2 018 15
OmnichannelNobia is well in the lead in omnichannel for the kitchen industry, and we will continue to develop new digital tools and new store concepts.Ourcustomerswillhavethesameinspiringexperi-ence regardless of whether they visit our website or come in to astore.
Withinspiringandrelevantcontentinsocialmediaandonour websites, we will utilise customers’ involvement and help themthroughthepurchasingprocess.Whenourcustomershave the opportunity to do more work by themselves, they will come more prepared to the meetings with our kitchen design-ersandthepurchasingprocesswillbemoreefficient.
Withthecustomerexperienceinfocus,astoreconceptwas introduced in 2017 with a great deal of digital elements and smallersurfaceareasthannormalkitchenstores.Theseomni-stores invite customers to become involved in and experience theproductsinnewandinspiringways.Thephysicalkitchendis-plays are fewer, and the broad offering is presented using digital toolsinstead.Thestoreshaveaspecialdisplayaboutfunction,quality and innovation where the customers can test smart stor-agesolutionsandaccessories.
COMPLETED IN 2018
Focus for our online development was on increasing users’ activitylevels.Oneimportantpartofthiswastheroll-outofthe Get Started module, which helps visitors start on their kitchenjourney. Four new omnistores, and three stores with parts of this con-cept,wereopenedduringtheyear.Intotalwehaveeightomni-storesandsixstoreswithpartsoftheconcept. An evaluation of the omnistores showed that they have higher sales per store seller, and a higher rate of conversion, than tra-ditionalstores.
2016 2017 2018
Activations online 6.0% 6.2% 6.5%
FORWARD FOCUSNobia plans to continue the roll-out of the omnistore concept in bothownstoresandinfranchisees.Thelong-termtrendismov-ing toward smaller stores in more central locations, and with moredigitalcontent.Wewillcontinuetoinvestinbeingontheleading edge, digitally, focusing on creating a positive customer experience through tools that make it simpler for our customers toplanandmaketheirkitchendreamsareality.
The economy segmentMore and more consumers want to do a part of the work of installing kitchens themselves, which is why the market for lower pricedkitchenswillcontinuetogrow.Withourstrongbrands,broad distribution and healthy production economy, Nobia has excellent conditions to create growth for kitchens for consum-ersintheeconomysegment.
Nobia has a few sales channels primarily aimed at the econ-omy segment, for example, Gower in the UK and the electronics chainPowerintheNordicregion.Inaddition,ourlargestbrandshaveseparaterangesthataresoldready-to-assemble.Approxi-mately 30 per cent of the Group’s sales in the UK come from ready-to-assemble kitchens, while the same share in the Nordic regionisapproximately10percent.InCentralEurope,weonlysellrigidkitchens.
Over the last few years, we have focused on growth in the Nordiceconomysegment.Buyingandassemblingourkitchensshould be easy and offer good value, and the products should be delivereddirectlytothecustomer’sdoor.
COMPLETED IN 2018
After having marketed HTH’s ready-to-assemble kitchens for a period under its own brand, HTH returned to the strategy of a brand under which the ready-to-assemble range was sold as a DIYalternativetotheregularrange.Nobiaintroducedasimplifiedinstallationforitskitchenrange,deliveredinflatpacksandsoldviathePowerelectronicschainintheNordicregion.Withpre-installedcomponentsinthecabinet sides, customers avoid dealing with packets of screws andmatchingtherightscrewtotherighthole–bothofwhichoftentrypeople’spatience.AmanualwithQRcodestouser-friendlyinstructionsaccompaniesthedelivery.Comparedto earlier, it takes half as long to install the cabinets with the simplifiedsystem,whichwillalsobeintroducedintoHTH’sready-to-assemblerangeinthespringof2019.
FORWARD FOCUSOur brands develop offerings with good value for consumers, and we will continue to improve our production economy and ourrangeofready-to-assemblekitchens.Inparallelwiththis, we are looking for more sales partnerships regarding ready-to- assemble kitchens that we can deliver with short lead times directtotheendcustomer’shome.
GROWTH Our focus is on developing digital services and new store concepts to meet new customer behaviours and technological
possibilities. We will offer inspiring kitchens in a simple fashion, both in physical stores and digitally. We also endeavour to develop new offers for the economy segment, which is a growing part of the consumer market.
S T R AT EGY
16 NOB I A ANNUA L AND S U S TA I NA B I L I T Y R E PORT 2 018
EmployeesNobia has 6,081 employees in seven countries, with many dif-ferent positions, backgrounds and skills, all of whom enable the successoftheorganisation.Theabilitytorecruitskilledemploy-ees and to retain and develop existing staff is crucial for a suc-cessful,sustainablecompany.Thatiswhywecontinuallyworkto increase the company’s attractiveness as an employer, create commitment and pride among our employees, and to develop leadershipabilitiesandtherightskills.
COMPLETED IN 2018
ToemphasizeNobia’spositiononthelabourmarketasaninternational kitchen group with many well-known and attrac-tive brands, we have pooled job vacancy announcements from allouroperationsintoaGroup-widecareerwebsite.Theweb-site was launched in May, and together with increased visibility in social media enables recruitment and increases pride among ourcurrentemployees. A Group-wide leadership programme, customised for the company’s business and management challenges, is being implementedinallthecountrieswhereweoperate.In2018,280 managers began the programme, which consists of six modules.Thefirstmoduletakesplaceinaclassroomenviron-ment, while the other modules make use of technological solu-tionsthatmakevirtualclassroomspossible.
Two measurements of all employees’ commitment has been carriedout.Theresultisusedasthebasisforworkingfurtheronactivitiesbothlocallyandcentrally.
2016 2017 2018
Employee commitment index 75 77 78
FORWARD FOCUSNobia will continue to invest in employee’s commitment and participation.Theambitionistostrengthencollaborationandunity among employees, divisions and functions and to develop asharedcorporateculture.Oneimportantpartoftheworkwillbe implementing a new intranet that will promote communica-tionandcollaboration.
Acquisitions Acquisitions represent an important part of Nobia’s strategy, and the Group still has the ambition of growing on Europe’s kitchenmarketandenablingitsconsolidation.Theacquisi-tionstrategytargetsprofitablekitchencompaniesoperatingin attractive markets and that supplement the Group’s exist-ingstructure.Bothadd-onacquisitionsincountrieswherewealready operate and expansion into new markets in Europe may beofinterest.
Theacquisitionsofthepastfewyears–RixonwayKitchensin2014,CommodoreKitchensandCIEin2015,andBribusin2018–havenotonlymeantincreasedsalesandlargerproduc-tionvolumesbutalsosynergyeffectsandincreaseddiversifica-tionthroughexpansionintonewsegmentsandmarkets.
COMPLETED IN 2018
InJuly,NobiaacquiredthekitchensupplierBribus,aleaderintheDutchkitchenprojectmarket.Bribusmanufacturesandinstalls approximately 45,000 kitchens a year; its customers are primarily companies operating in social housing and major prop-ertyinvestorsintheNetherlands.Thekitchensaredeliveredcomplete, including appliances, from the modern production facilityinDinxperlo.SomeofBribus’skitchencabinetsaremanu-factured from chipboard interspersed with corn, which means theproductsweighlessandarebetterfortheenvironment.
FORWARD FOCUSAcquisitionsremainhighonouragenda.Wehaveexcellentfinancialconditionsforacquiringprofitablekitchenoperations,whentheopportunitypresentsitself.Ouracquisitionmarketisrelatively limited, however, and most of the attractive European kitchencompaniesareprivatelyowned.Itmaythereforetakeawhiletoreachagreementsoncompanytransactions.
ENABLERSThe commitment among our employees is what makes development possible. By offering a safe,
attractive workplace, we can recruit and retain employees who help deliver kitchen dreams to our customers. Our acquisitions make it possible for us to grow and consolidate the kitchen market.
S T R AT EGY
NOB I A ANNUA L AND S U S TA I NA B I L I T Y R E PORT 2 018 17
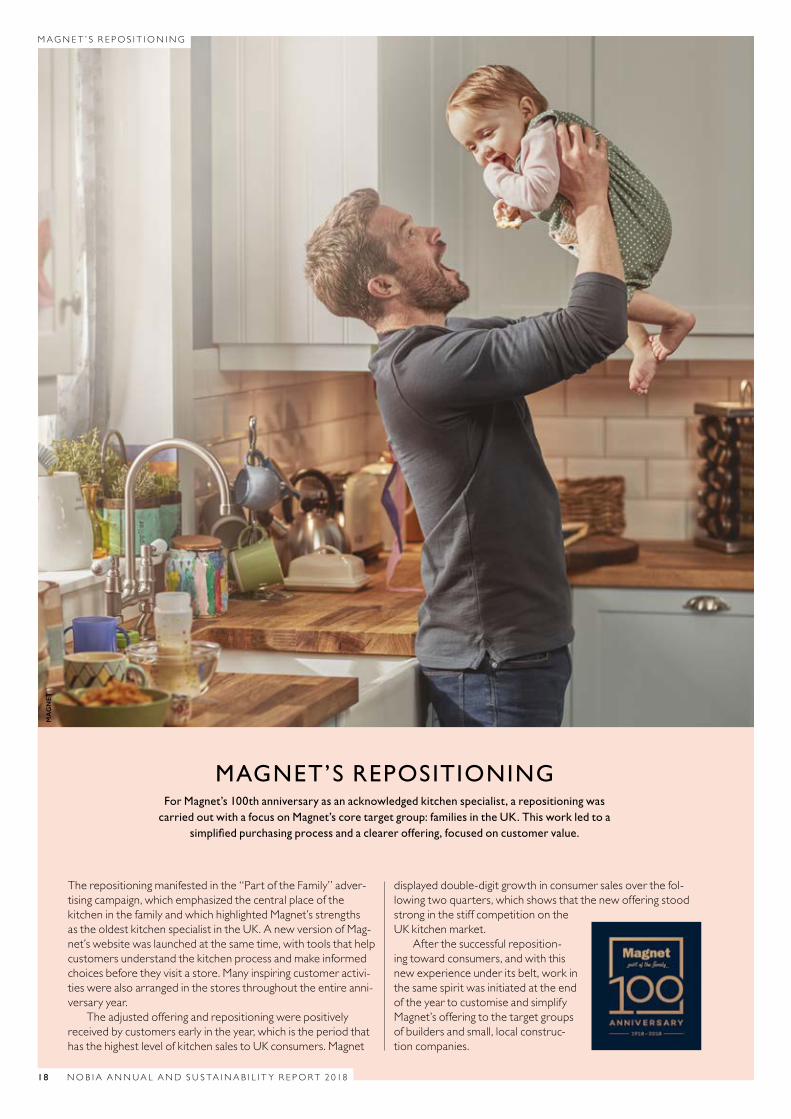
MAGNET’S REPOSITIONING For Magnet’s 100th anniversary as an acknowledged kitchen specialist, a repositioning was
carried out with a focus on Magnet’s core target group: families in the UK. This work led to a simplified purchasing process and a clearer offering, focused on customer value.
The repositioning manifested in the “Part of the Family” adver-tisingcampaign,whichemphasizedthecentralplaceofthekitchen in the family and which highlighted Magnet’s strengths astheoldestkitchenspecialistintheUK.AnewversionofMag-net’s website was launched at the same time, with tools that help customers understand the kitchen process and make informed choicesbeforetheyvisitastore.Manyinspiringcustomeractivi-ties were also arranged in the stores throughout the entire anni-versaryyear.
The adjusted offering and repositioning were positively received by customers early in the year, which is the period that hasthehighestlevelofkitchensalestoUKconsumers.Magnet
displayed double-digit growth in consumer sales over the fol-lowing two quarters, which shows that the new offering stood strong in the stiff competition on the UKkitchenmarket.
After the successful reposition-ing toward consumers, and with this new experience under its belt, work in the same spirit was initiated at the end of the year to customise and simplify Magnet’s offering to the target groups of builders and small, local construc-tioncompanies.
MA
GN
ET
18 NOB I A ANNUA L AND S U S TA I NA B I L I T Y R E PORT 2 018
MAGN E T ’ S R E PO S I T I ON I NG
TARGETS AND TARGET FULFILMENT
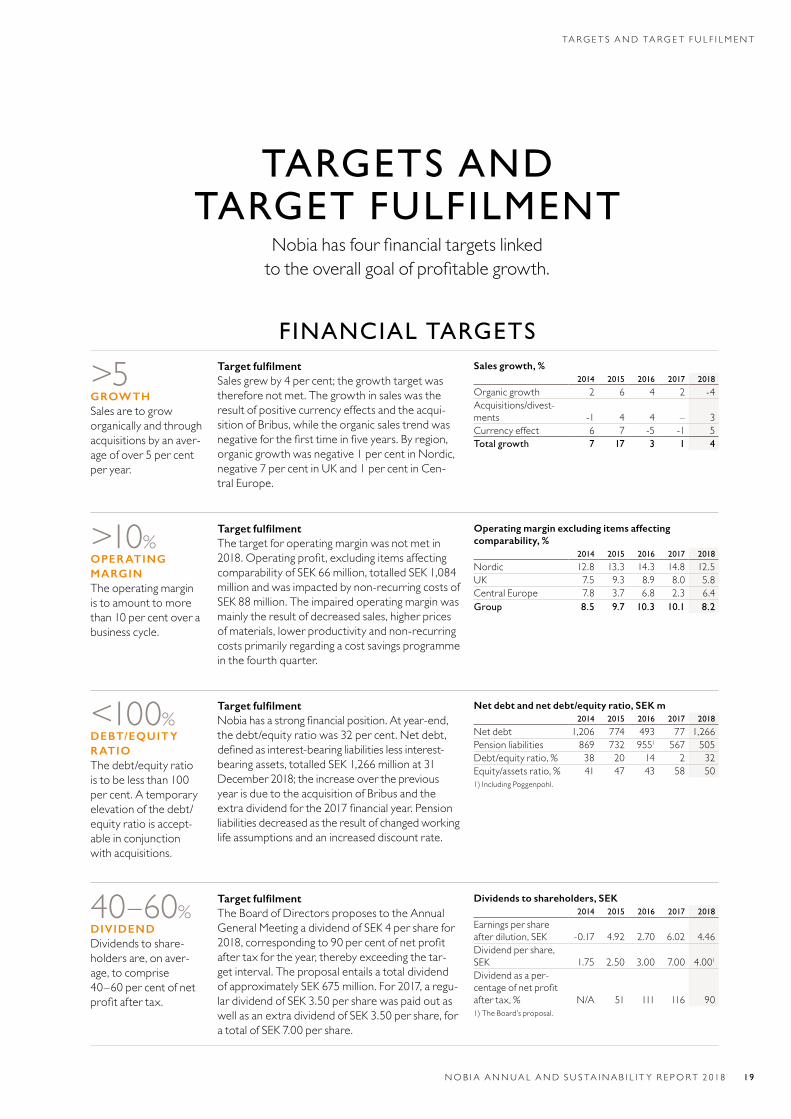
Nobiahasfourfinancialtargetslinked totheoverallgoalofprofitablegrowth.
FINANCIAL TARGETS
>5 GROWTHSales are to grow organically and through acquisitions by an aver-age of over 5 per cent peryear.
Target fulfilmentSales grew by 4 per cent; the growth target was thereforenotmet.Thegrowthinsaleswastheresult of positive currency effects and the acqui-sition of Bribus, while the organic sales trend was negativeforthefirsttimeinfiveyears.Byregion,organic growth was negative 1 per cent in Nordic, negative 7 per cent in UK and 1 per cent in Cen-tralEurope.
Sales growth, %2014 2015 2016 2017 2018
Organic growth 2 6 4 2 -4Acquisitions/divest-ments -1 4 4 – 3Currency effect 6 7 -5 -1 5Total growth 7 17 3 1 4
>10%OPERATINGMARGINThe operating margin is to amount to more than 10 per cent over a businesscycle.
Target fulfilmentThe target for operating margin was not met in 2018.Operatingprofit,excludingitemsaffectingcomparability of SEK 66 million, totalled SEK 1,084 million and was impacted by non-recurring costs of SEK88million.Theimpairedoperatingmarginwasmainly the result of decreased sales, higher prices of materials, lower productivity and non-recurring costs primarily regarding a cost savings programme inthefourthquarter.
Operating margin excluding items affecting comparability, %
2014 2015 2016 2017 2018
Nordic 12.8 13.3 14.3 14.8 12.5UK 7.5 9.3 8.9 8.0 5.8Central Europe 7.8 3.7 6.8 2.3 6.4Group 8.5 9.7 10.3 10.1 8.2
<100%DEBT/EQUITYRATIOThe debt/equity ratio is to be less than 100 percent.Atemporaryelevation of the debt/equity ratio is accept-able in conjunction withacquisitions.
Target fulfilment Nobiahasastrongfinancialposition.Atyear-end,thedebt/equityratiowas32percent.Netdebt,definedasinterest-bearingliabilitieslessinterest-bearing assets, totalled SEK 1,266 million at 31 December 2018; the increase over the previous year is due to the acquisition of Bribus and the extradividendforthe2017financialyear.Pensionliabilities decreased as the result of changed working lifeassumptionsandanincreaseddiscountrate.
Net debt and net debt/equity ratio, SEK m2014 2015 2016 2017 2018
Net debt 1,206 774 493 77 1,266Pension liabilities 869 732 9551 567 505Debt/equity ratio, % 38 20 14 2 32Equity/assets ratio, % 41 47 43 58 501)IncludingPoggenpohl.
40–60%DIVIDENDDividends to share-holders are, on aver-age, to comprise 40–60percentofnetprofitaftertax.
Target fulfilment The Board of Directors proposes to the Annual General Meeting a dividend of SEK 4 per share for 2018,correspondingto90percentofnetprofitafter tax for the year, thereby exceeding the tar-getinterval.TheproposalentailsatotaldividendofapproximatelySEK675million.For2017,aregu-lardividendofSEK3.50persharewaspaidoutaswellasanextradividendofSEK3.50pershare,foratotalofSEK7.00pershare.
Dividends to shareholders, SEK2014 2015 2016 2017 2018
Earnings per share after dilution, SEK -0.17 4.92 2.70 6.02 4.46Dividend per share, SEK 1.75 2.50 3.00 7.00 4.001
Dividend as a per-centageofnetprofitafter tax, % N/A 51 111 116 901)TheBoard’sproposal.
NO B I A ANNUA L AND S U S TA I NA B I L I T Y R E PORT 2 018 19
TA RG E T S AND TA RG E T F U L F I L M ENT
INT
UO
FIN
ISO
2 0 NOB I A ANNUA L AND S U S TA I NA B I L I T Y R E PORT 2 018
O P E R AT ION S
OperationsWehaveorganisedouroperationsbasedonthreegeographicregions:
Nordic,theUKandCentralEurope.Howweinteractwiththemarketdiffersamongthevariousregionsandalsoamongourdifferentbrands.
NOB I A ANNUA L AND S U S TA I NA B I L I T Y R E PORT 2 018 21
OPE R AT ION S
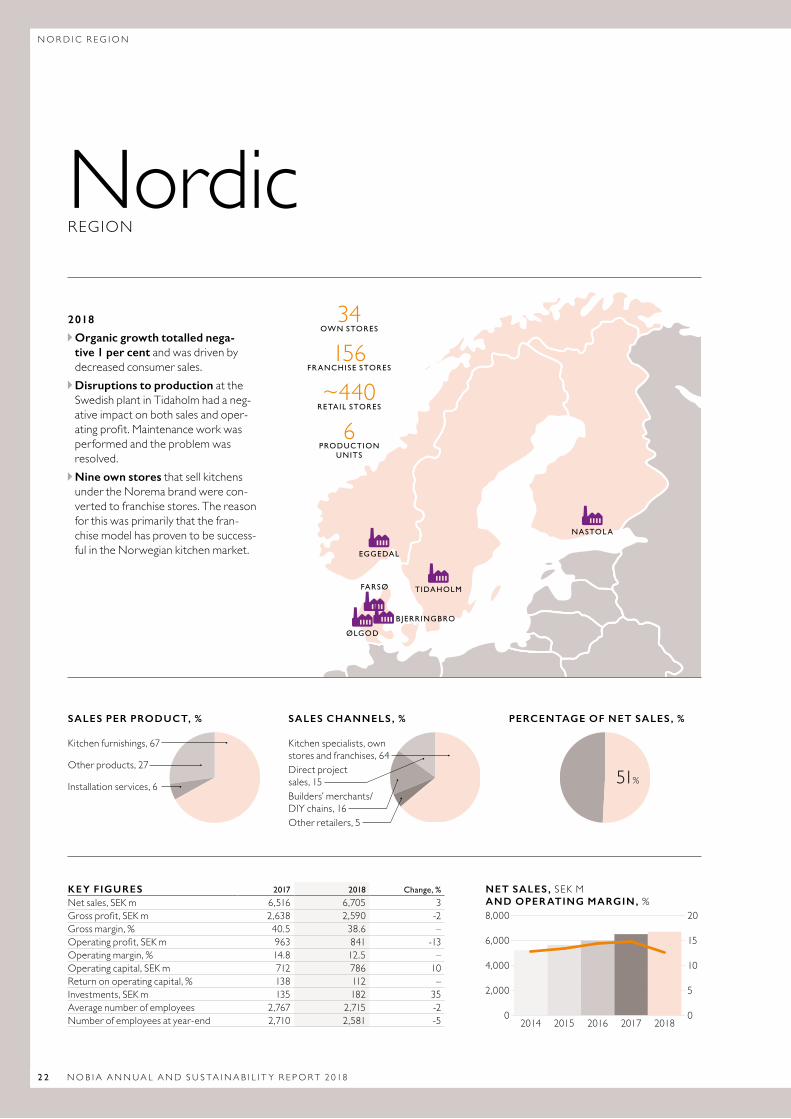
NordicREGION
2018
Organic growth totalled nega-tive 1 per cent and was driven by decreasedconsumersales. Disruptions to production at the Swedish plant in Tidaholm had a neg-ative impact on both sales and oper-atingprofit.Maintenanceworkwasperformed and the problem was resolved. Nine own stores that sell kitchens under the Norema brand were con-vertedtofranchisestores.Thereasonfor this was primarily that the fran-chise model has proven to be success-fulintheNorwegiankitchenmarket.
KEY FIGURES 2017 2018 Change, %
Net sales, SEK m 6,516 6,705 3Grossprofit,SEKm 2,638 2,590 -2Gross margin, % 40.5 38.6 –Operatingprofit,SEKm 963 841 -13Operating margin, % 14.8 12.5 –Operating capital, SEK m 712 786 10Return on operating capital, % 138 112 –Investments,SEKm 135 182 35Average number of employees 2,767 2,715 -2Number of employees at year-end 2,710 2,581 -5
34 OWN STORES
156 FR ANCHISE STORES
~440RETAIL STORES
6PRODUCTION
UNITS
TIDAHOLM
ØLGOD
B JERRINGBRO
FARSØ
EGGEDAL
NASTOL A
SALES PER PRODUCT, %
Kitchen furnishings, 67
Other products, 27
Installationservices,6
PERCENTAGE OF NET SALES, %
SALES CHANNELS, %
Kitchen specialists, own stores and franchises, 64Direct project sales, 15Builders’ merchants/ DIYchains,16Other retailers, 5
51%
NET SALES, SEK M AND OPERATING MARGIN, %
20182017201620152014
8,000
6,000
4,000
2,000
0
20
15
10
5
0
2 2 NOB I A ANNUA L AND S U S TA I NA B I L I T Y R E PORT 2 018
NORD I C R EG ION
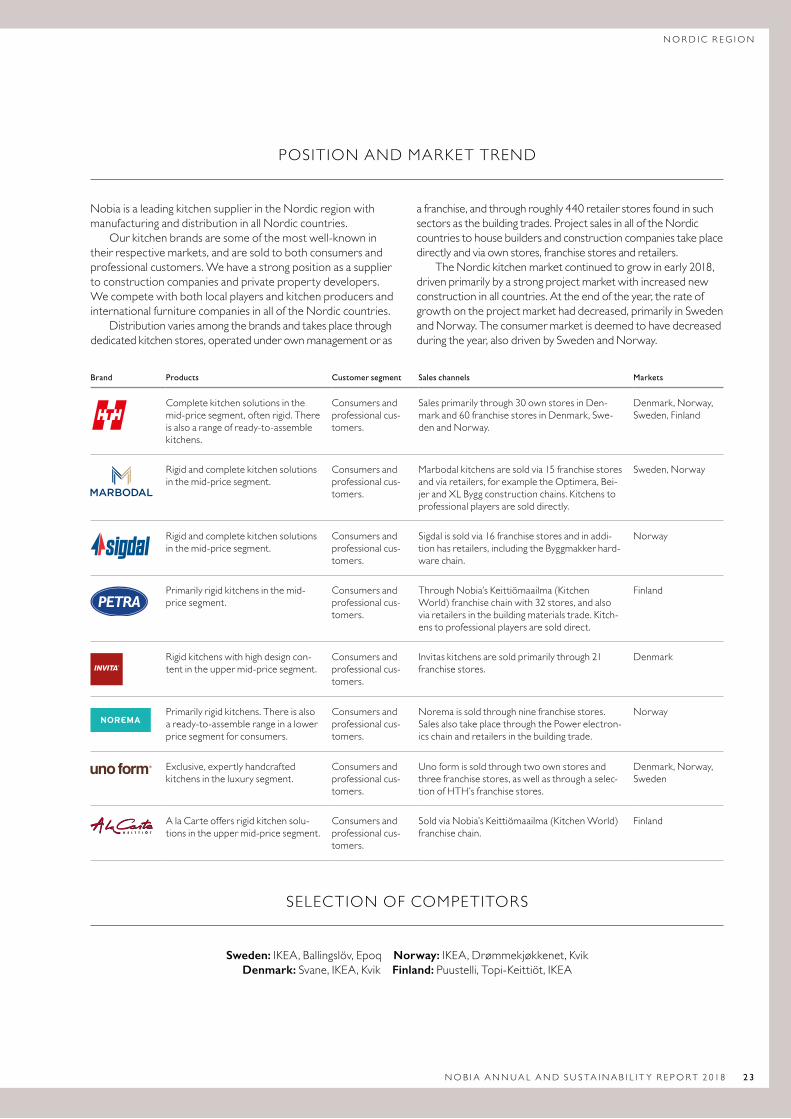
POSITIONANDMARKETTREND
Nobia is a leading kitchen supplier in the Nordic region with manufacturinganddistributioninallNordiccountries.
Our kitchen brands are some of the most well-known in their respective markets, and are sold to both consumers and professionalcustomers.Wehaveastrongpositionasasuppliertoconstructioncompaniesandprivatepropertydevelopers.WecompetewithbothlocalplayersandkitchenproducersandinternationalfurniturecompaniesinalloftheNordiccountries.
Distribution varies among the brands and takes place through dedicated kitchen stores, operated under own management or as
a franchise, and through roughly 440 retailer stores found in such sectorsasthebuildingtrades.ProjectsalesinalloftheNordiccountries to house builders and construction companies take place directlyandviaownstores,franchisestoresandretailers.
The Nordic kitchen market continued to grow in early 2018, driven primarily by a strong project market with increased new constructioninallcountries.Attheendoftheyear,therateofgrowth on the project market had decreased, primarily in Sweden andNorway.Theconsumermarketisdeemedtohavedecreasedduringtheyear,alsodrivenbySwedenandNorway.
Brand Products Customer segment Sales channels Markets
Complete kitchen solutions in the mid-pricesegment,oftenrigid.Thereis also a range of ready-to-assemble kitchens.
Consumers and professional cus-tomers.
Sales primarily through 30 own stores in Den-mark and 60 franchise stores in Denmark, Swe-denandNorway.
Denmark, Norway, Sweden, Finland
Rigid and complete kitchen solutions inthemid-pricesegment.
Consumers and professional cus-tomers.
Marbodal kitchens are sold via 15 franchise stores and via retailers, for example the Optimera, Bei-jerandXLByggconstructionchains.Kitchenstoprofessionalplayersaresolddirectly.
Sweden, Norway
Rigid and complete kitchen solutions inthemid-pricesegment.
Consumers and professional cus-tomers.
Sigdal is sold via 16 franchise stores and in addi-tion has retailers, including the Byggmakker hard-warechain.
Norway
Primarily rigid kitchens in the mid-pricesegment.
Consumers and professional cus-tomers.
Through Nobia’s Keittiömaailma (Kitchen World)franchisechainwith32stores,andalsoviaretailersinthebuildingmaterialstrade.Kitch-enstoprofessionalplayersaresolddirect.
Finland
Rigid kitchens with high design con-tentintheuppermid-pricesegment.
Consumers and professional cus-tomers.
Invitaskitchensaresoldprimarilythrough21franchisestores.
Denmark
Primarilyrigidkitchens.Thereisalsoa ready-to-assemble range in a lower pricesegmentforconsumers.
Consumers and professional cus-tomers.
Noremaissoldthroughninefranchisestores.Sales also take place through the Power electron-icschainandretailersinthebuildingtrade.
Norway
Exclusive, expertly handcrafted kitchensintheluxurysegment.
Consumers and professional cus-tomers.
Uno form is sold through two own stores and three franchise stores, as well as through a selec-tionofHTH’sfranchisestores.
Denmark, Norway, Sweden
A la Carte offers rigid kitchen solu-tionsintheuppermid-pricesegment.
Consumers and professional cus-tomers.
SoldviaNobia’sKeittiömaailma(KitchenWorld)franchisechain.
Finland
SELECTIONOFCOMPETITORS
Sweden: IKEA,Ballingslöv,Epoq Norway:IKEA,Drømmekjøkkenet,KvikDenmark:Svane,IKEA,Kvik Finland: Puustelli,Topi-Keittiöt,IKEA
NOB I A ANNUA L AND S U S TA I NA B I L I T Y R E PORT 2 018 2 3
NORD I C R EG ION
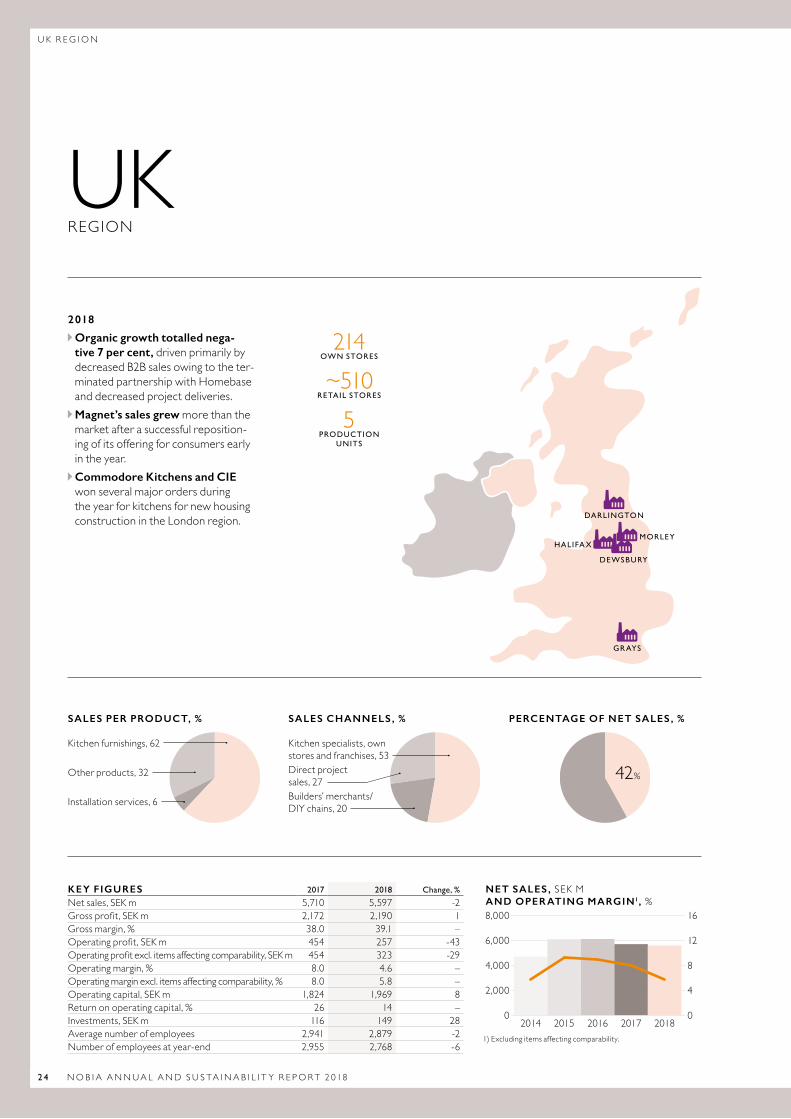
UKREGION
2018
Organic growth totalled nega-tive 7 per cent, driven primarily by decreased B2B sales owing to the ter-minated partnership with Homebase anddecreasedprojectdeliveries. Magnet’s sales grew more than the market after a successful reposition-ing of its offering for consumers early intheyear. Commodore Kitchens and CIE won several major orders during the year for kitchens for new housing constructionintheLondonregion.
214OWN STORES
~510RETAIL STORES
5PRODUCTION
UNITS
GR AYS
DARLINGTON
DEWSBURY
MORLEY HALIFA X
KEY FIGURES 2017 2018 Change, %
Net sales, SEK m 5,710 5,597 -2Grossprofit,SEKm 2,172 2,190 1Gross margin, % 38.0 39.1 –Operatingprofit,SEKm 454 257 -43Operatingprofitexcl.itemsaffectingcomparability,SEKm 454 323 -29Operating margin, % 8.0 4.6 –Operatingmarginexcl.itemsaffectingcomparability,% 8.0 5.8 –Operating capital, SEK m 1,824 1,969 8Return on operating capital, % 26 14 –Investments,SEKm 116 149 28Average number of employees 2,941 2,879 -2Number of employees at year-end 2,955 2,768 -6
SALES PER PRODUCT, %
Kitchen furnishings, 62
Other products, 32
Installationservices,6
PERCENTAGE OF NET SALES, %
SALES CHANNELS, %
Kitchen specialists, own stores and franchises, 53Direct project sales, 27Builders’ merchants/ DIYchains,20
42%
NET SALES, SEK M AND OPERATING MARGIN1, %
20182017201620152014
8,000
6,000
4,000
2,000
0
16
12
8
4
0
1)Excludingitemsaffectingcomparability.
2 4 NOB I A ANNUA L AND S U S TA I NA B I L I T Y R E PORT 2 018
U K R EG ION
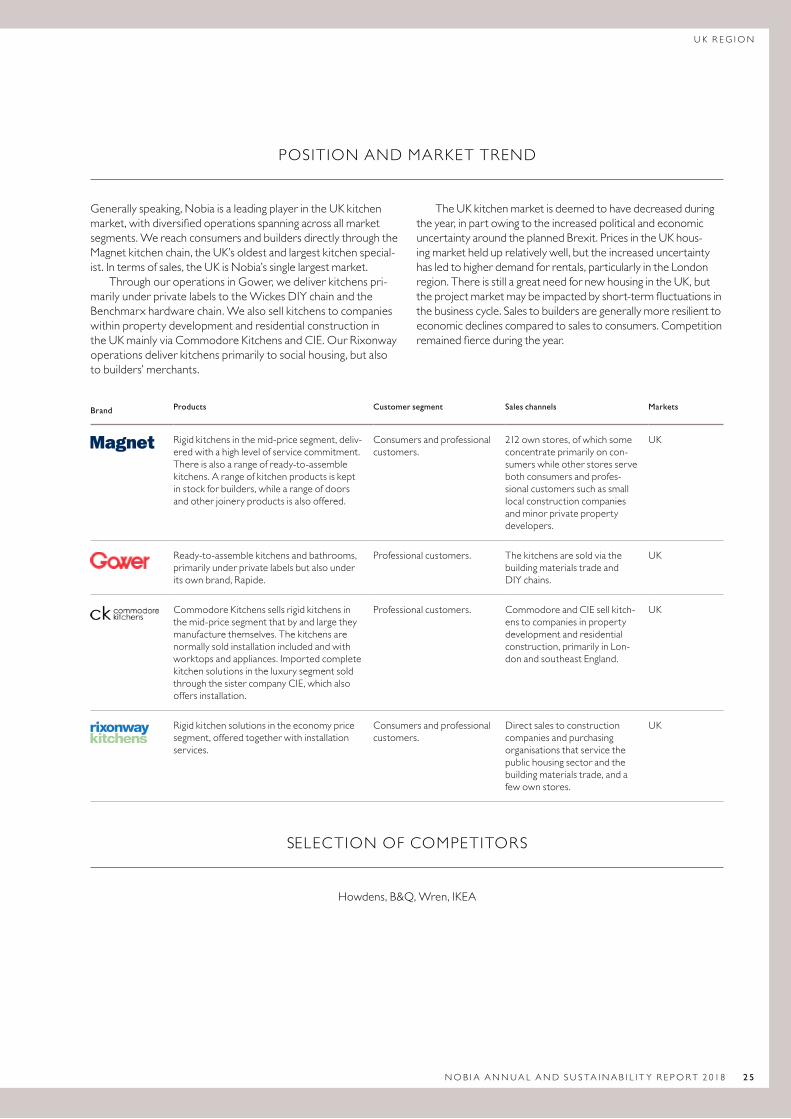
POSITIONANDMARKETTREND
Generally speaking, Nobia is a leading player in the UK kitchen market,withdiversifiedoperationsspanningacrossallmarketsegments.WereachconsumersandbuildersdirectlythroughtheMagnet kitchen chain, the UK’s oldest and largest kitchen special-ist.Intermsofsales,theUKisNobia’ssinglelargestmarket.
Through our operations in Gower, we deliver kitchens pri-marilyunderprivatelabelstotheWickesDIYchainandtheBenchmarxhardwarechain.Wealsosellkitchenstocompanieswithin property development and residential construction in theUKmainlyviaCommodoreKitchensandCIE.OurRixonwayoperations deliver kitchens primarily to social housing, but also tobuilders’merchants.
The UK kitchen market is deemed to have decreased during the year, in part owing to the increased political and economic uncertaintyaroundtheplannedBrexit.PricesintheUKhous-ing market held up relatively well, but the increased uncertainty hasledtohigherdemandforrentals,particularlyintheLondonregion.ThereisstillagreatneedfornewhousingintheUK,buttheprojectmarketmaybeimpactedbyshort-termfluctuationsinthebusinesscycle.Salestobuildersaregenerallymoreresilienttoeconomicdeclinescomparedtosalestoconsumers.Competitionremainedfierceduringtheyear.
Brand Products Customer segment Sales channels Markets
Rigid kitchens in the mid-price segment, deliv-eredwithahighlevelofservicecommitment.There is also a range of ready-to-assemble kitchens.Arangeofkitchenproductsiskeptin stock for builders, while a range of doors andotherjoineryproductsisalsooffered.
Consumers and professional customers.
212 own stores, of which some concentrate primarily on con-sumers while other stores serve both consumers and profes-sional customers such as small local construction companies and minor private property developers.
UK
Ready-to-assemble kitchens and bathrooms, primarily under private labels but also under itsownbrand,Rapide.
Professionalcustomers. The kitchens are sold via the building materials trade and DIYchains.
UK
Commodore Kitchens sells rigid kitchens in the mid-price segment that by and large they manufacturethemselves.Thekitchensarenormally sold installation included and with worktopsandappliances.Importedcompletekitchen solutions in the luxury segment sold throughthesistercompanyCIE,whichalsooffersinstallation.
Professionalcustomers. CommodoreandCIEsellkitch-ens to companies in property development and residential construction,primarilyinLon-donandsoutheastEngland.
UK
Rigid kitchen solutions in the economy price segment, offered together with installation services.
Consumers and professional customers.
Direct sales to construction companies and purchasing organisations that service the public housing sector and the building materials trade, and a fewownstores.
UK
SELECTIONOFCOMPETITORS
Howdens,B&Q,Wren,IKEA
NOB I A ANNUA L AND S U S TA I NA B I L I T Y R E PORT 2 018 2 5
U K R EG ION
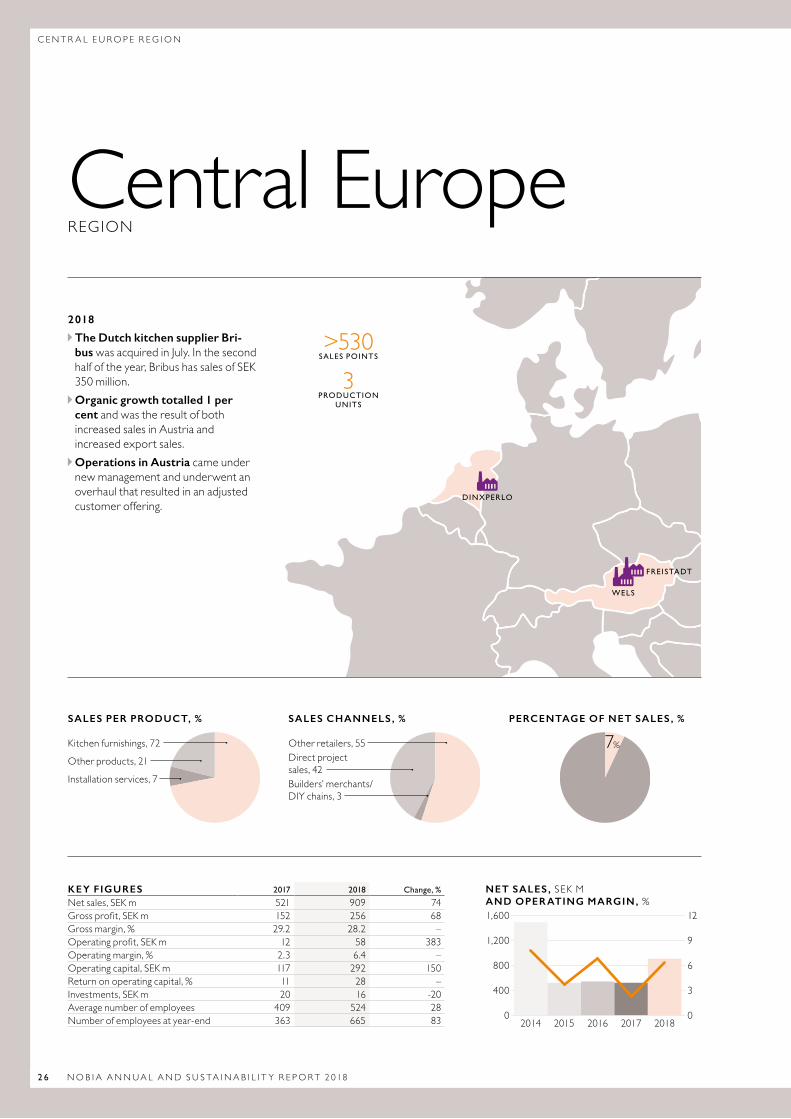
Central Europe REGION
KEY FIGURES 2017 2018 Change, %
Net sales, SEK m 521 909 74Grossprofit,SEKm 152 256 68Gross margin, % 29.2 28.2 –Operatingprofit,SEKm 12 58 383Operating margin, % 2.3 6.4 –Operating capital, SEK m 117 292 150Return on operating capital, % 11 28 –Investments,SEKm 20 16 -20Average number of employees 409 524 28Number of employees at year-end 363 665 83
SALES PER PRODUCT, %
Kitchen furnishings, 72
Other products, 21
Installationservices,7
PERCENTAGE OF NET SALES, %
SALES CHANNELS, %
Other retailers, 55Direct project sales, 42Builders’ merchants/ DIYchains,3
7%
NET SALES, SEK M AND OPERATING MARGIN, %
20182017201620152014
1,600
1,200
800
400
0
12
9
6
3
0
2018
The Dutch kitchen supplier Bri-bus wasacquiredinJuly.Inthesecondhalf of the year, Bribus has sales of SEK 350million. Organic growth totalled 1 per cent and was the result of both increased sales in Austria and increasedexportsales. Operations in Austria came under new management and underwent an overhaul that resulted in an adjusted customeroffering.
FRE ISTADT
DINXPERLO
WELS
>530SALES POINTS
3PRODUCTION
UNITS
2 6 NOB I A ANNUA L AND S U S TA I NA B I L I T Y R E PORT 2 018
C ENT R A L E U ROP E R EG ION
POSITIONANDMARKETTREND
Nobia has a small share of the kitchen market in Central Europe, buthasastrongpositioninAustria–andaftertheacquisitionofBribus,intheNetherlandsaswell.
Our Austrian operations sell kitchens under the ewe, FM andIntuobrands.Thecustomersareprimarilyalargenumberofindependent retailers, of which a few are organised via purchas-ing organisations, but also major Austrian furniture chains such asLeinerandXXXLutz.Ourkitchensarefoundinsome430sales points in Austria, and our operations also have a certain amountofexportstoneighbouringcountries.
Bribus concentrates primarily on customers in the rental market in the form of the public housing sector and large-scale commercialpropertyowners.Thekitchensareinstalledin
newly constructed apartments or during renovation projects, andBribusalsoprovidesprojectmanagementandinstallation.Bribus also has a number of retailers, including the Bouwmaat builders’ merchants chain with 46 sales points that sell kitchens tosmallerconstructioncompaniesandbuilders.
The Austrian kitchen market is deemed to have grown in 2018 as a result of increased housing construction but also as a consequence of healthy macroeconomic conditions as well as growthintherenovationmarket.Intensecompetitioncontin-ued to prevail from companies such as DAN Küchen in Austria andseveralGermankitchencompanies.TheDutchkitchenmarket is also deemed to have grown, especially in the profes-sionalsegmentwherethereisagreatneedfornewhousing.
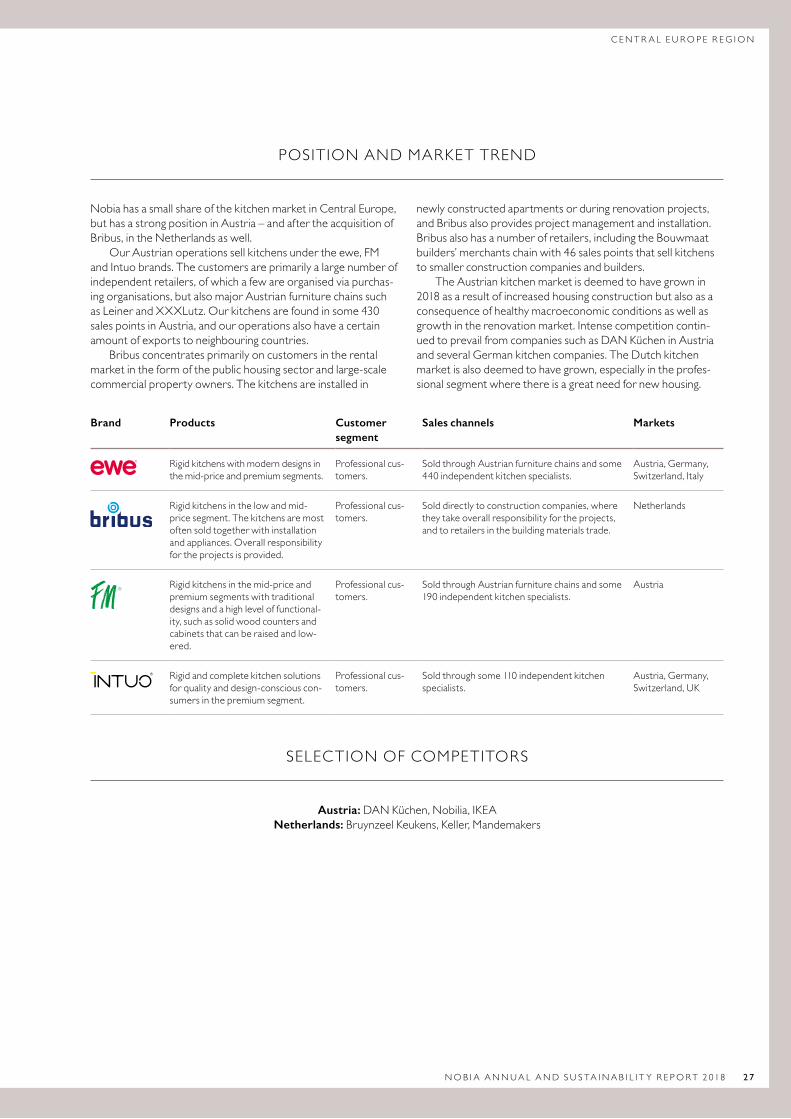
Brand Products Customer segment
Sales channels Markets
Rigid kitchens with modern designs in themid-priceandpremiumsegments.
Professional cus-tomers.
Sold through Austrian furniture chains and some 440independentkitchenspecialists.
Austria, Germany, Switzerland,Italy
Rigid kitchens in the low and mid-pricesegment.Thekitchensaremostoften sold together with installation andappliances.Overallresponsibilityfortheprojectsisprovided.
Professional cus-tomers.
Sold directly to construction companies, where they take overall responsibility for the projects, andtoretailersinthebuildingmaterialstrade.
Netherlands
Rigid kitchens in the mid-price and premium segments with traditional designs and a high level of functional-ity, such as solid wood counters and cabinets that can be raised and low-ered.
Professional cus-tomers.
Sold through Austrian furniture chains and some 190independentkitchenspecialists.
Austria
Rigid and complete kitchen solutions for quality and design-conscious con-sumersinthepremiumsegment.
Professional cus-tomers.
Sold through some 110 independent kitchen specialists.
Austria, Germany, Switzerland,UK
SELECTIONOFCOMPETITORS
Austria: DANKüchen,Nobilia,IKEANetherlands: BruynzeelKeukens,Keller,Mandemakers
NOB I A ANNUA L AND S U S TA I NA B I L I T Y R E PORT 2 018 2 7
C ENT R A L E U ROP E R EG ION
MA
RB
OD
AL
AR
KIT
EK
T P
LUS
2 8 NOB I A ANNUA L AND S U S TA I NA B I L I T Y R E PORT 2 018
OU R S U S TA I NA B I L I T Y I N I T I AT I V E S
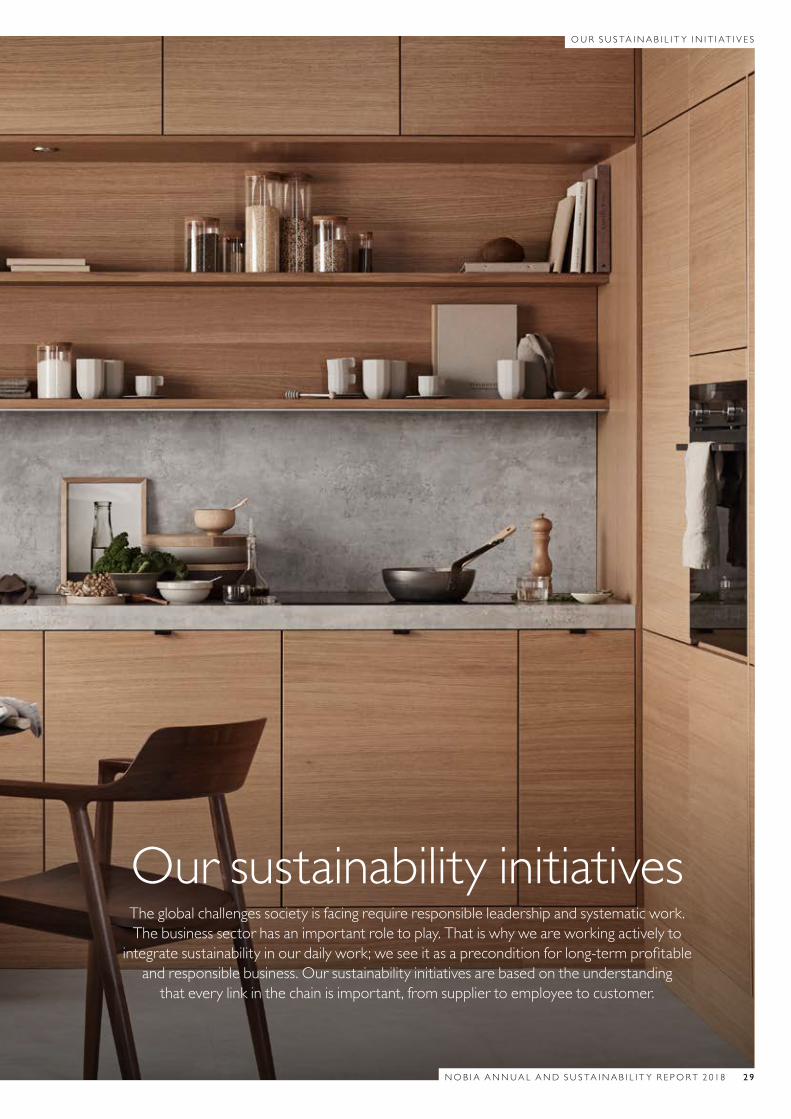
Our sustainability initiativesTheglobalchallengessocietyisfacingrequireresponsibleleadershipandsystematicwork.Thebusinesssectorhasanimportantroletoplay.Thatiswhyweareworkingactivelytointegratesustainabilityinourdailywork;weseeitasapreconditionforlong-termprofitableandresponsiblebusiness.Oursustainabilityinitiativesarebasedontheunderstandingthateverylinkinthechainisimportant,fromsuppliertoemployeetocustomer.
NOB I A ANNUA L AND S U S TA I NA B I L I T Y R E PORT 2 018 2 9
OUR S U S TA I NA B I L I T Y I N I T I AT I V E S
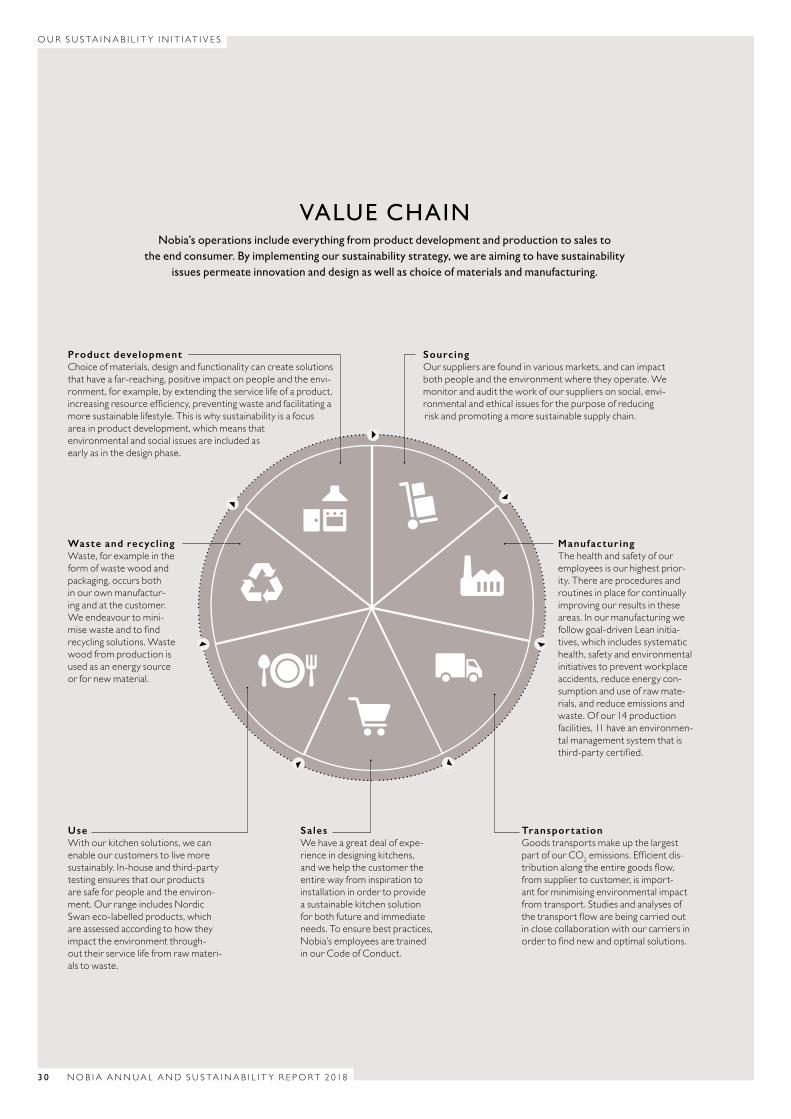
Product developmentChoice of materials, design and functionality can create solutions that have a far-reaching, positive impact on people and the envi-ronment, for example, by extending the service life of a product, increasingresourceefficiency,preventingwasteandfacilitatingamoresustainablelifestyle.Thisiswhysustainabilityisafocusarea in product development, which means that environmental and social issues are included as earlyasinthedesignphase.
Waste and recycl ingWaste,forexampleintheform of waste wood and packaging, occurs both in our own manufactur-ingandatthecustomer.Weendeavourtomini-misewasteandtofindrecyclingsolutions.Wastewood from production is used as an energy source orfornewmaterial.
UseWithourkitchensolutions,wecanenable our customers to live more sustainably.In-houseandthird-partytesting ensures that our products are safe for people and the environ-ment.OurrangeincludesNordicSwan eco-labelled products, which are assessed according to how they impact the environment through-out their service life from raw materi-alstowaste.
SalesWehaveagreatdealofexpe-rience in designing kitchens, and we help the customer the entire way from inspiration to installation in order to provide a sustainable kitchen solution for both future and immediate needs.Toensurebestpractices,Nobia’s employees are trained inourCodeofConduct.
Transpor tat ionGoods transports make up the largest part of our CO2emissions.Efficientdis-tributionalongtheentiregoodsflow,from supplier to customer, is import-ant for minimising environmental impact fromtransport.Studiesandanalysesofthetransportflowarebeingcarriedoutin close collaboration with our carriers in ordertofindnewandoptimalsolutions.
SourcingOur suppliers are found in various markets, and can impact bothpeopleandtheenvironmentwheretheyoperate.Wemonitor and audit the work of our suppliers on social, envi-ronmental and ethical issues for the purpose of reducing riskandpromotingamoresustainablesupplychain.
VALUE CHAINNobia’s operations include everything from product development and production to sales to
the end consumer. By implementing our sustainability strategy, we are aiming to have sustainability issues permeate innovation and design as well as choice of materials and manufacturing.
ManufacturingThe health and safety of our employees is our highest prior-ity.Thereareproceduresandroutines in place for continually improving our results in these areas.Inourmanufacturingwefollowgoal-drivenLeaninitia-tives, which includes systematic health, safety and environmental initiatives to prevent workplace accidents, reduce energy con-sumption and use of raw mate-rials, and reduce emissions and waste.Ofour14productionfacilities, 11 have an environmen-tal management system that is third-partycertified.
3 0 NOB I A ANNUA L AND S U S TA I NA B I L I T Y R E PORT 2 018
OU R S U S TA I NA B I L I T Y I N I T I AT I V E S
SUSTAINABLE ADVANCES IN 2018 During the year, we continued to integrate important sustainability issues into our value chain and made important advances in concept and product development
as well as in production and the supply chain. We have also focused on skills development to increase and broaden knowledge about sustainability. Some of the most important activities, results and awards from the year are listed below.
ACTIVITIES
Switching from energy recovery to material recycling of waste wood in several facilities Group-wide projects to reduce waste wood in production Two concept kitchens with a focus on minimising waste, and circular flows Switching one of our largest supplier’s transport flow from vehicles to trains Internal sustainability training initiatives
RESULTS
92 per cent of Nobia’s total wood and wood materials originated from a certified source 70 per cent of the UK’s wood and wood materials originated from FSC® (Forest Stewardship Council® FSC®-C100100) or PEFCTM (Programme for the Endorsement of Forest CertificationTM) certified wood, with full chain of cus-tody through to the end consumer 45 per cent of sales in Sweden and Norway consisted of Nordic Swan eco-labelled products 50 per cent of all our wood waste went to manufacturing new products Slightly more than 300 suppliers in the supplier review programme
AWARDS
Nobia ranked among the top five in the Consumer Goods category of the 2018 Hållbar bolag (Sustainable Businesses) survey Nobia was graded C+, Prime in sustain-ability in the ISS-oekom corporate rating Nobia’s score in CDP Forest increased from D to -B Our production facilities in the UK received the British Safety Council’s Sword of Honour award Our production units in Darlington, Halifax, Morley and Dewsbury were granted entry into the Furniture Industry Sustainability Programme (FISP)
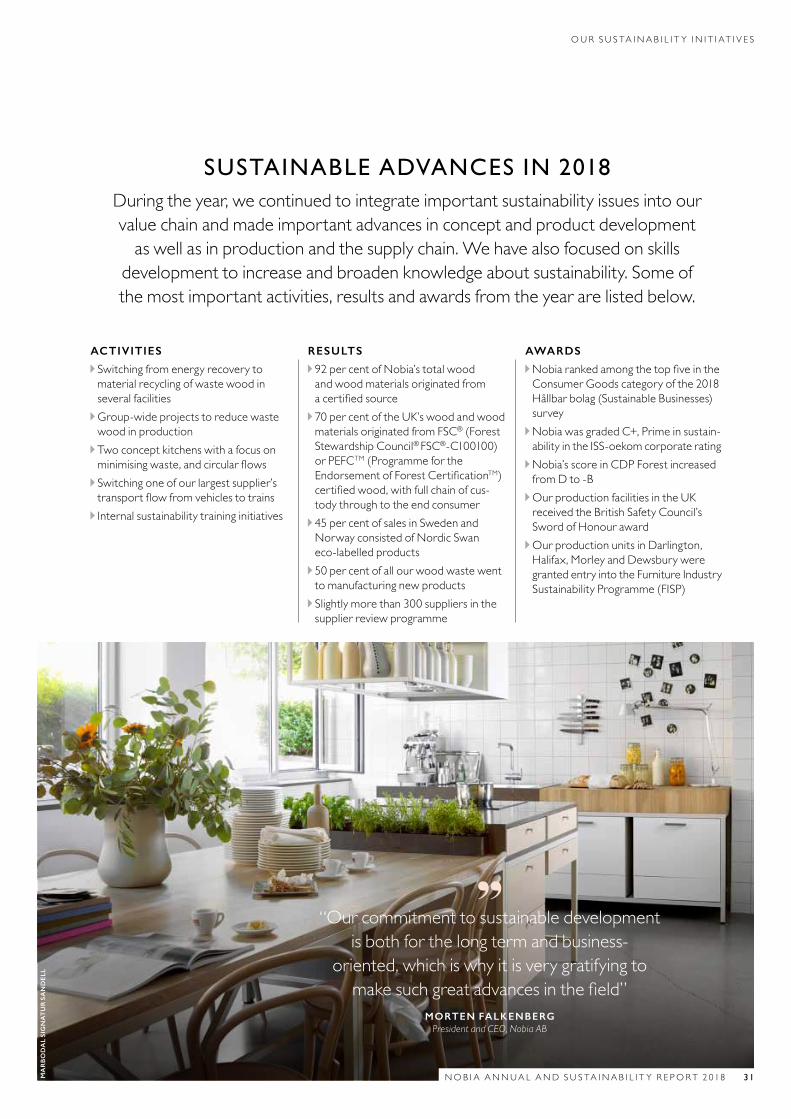
“Our commitment to sustainable development is both for the long term and business-
oriented, which is why it is very gratifying to make such great advances in the field”
MORTEN FALKENBERG President and CEO, Nobia AB
MA
RB
OD
AL
SIG
NA
TU
R S
AN
DE
LL
N O B I A A N N U A L A N D S U S TA I N A B I L I T Y R E P O R T 2 018 31
O U R S U S TA I N A B I L I T Y I N I T I AT I V E S
STRATEGIC FOCUS AREAS Our sustainability strategy is our medium- to long-term itinerary, constituting a support for our business plan and vision.Itlinksourcoreoperationswithour ambitions to promote the UN SustainableDevelopmentGoals.
The strategy is built on four long-term focusareasthatreflecttheimpactofouroperations and constitute the areas with opportunitiesforimprovement.Thefocusareas also work together with our other strategic initiatives concerning resource efficiencyandemployeewell-being.
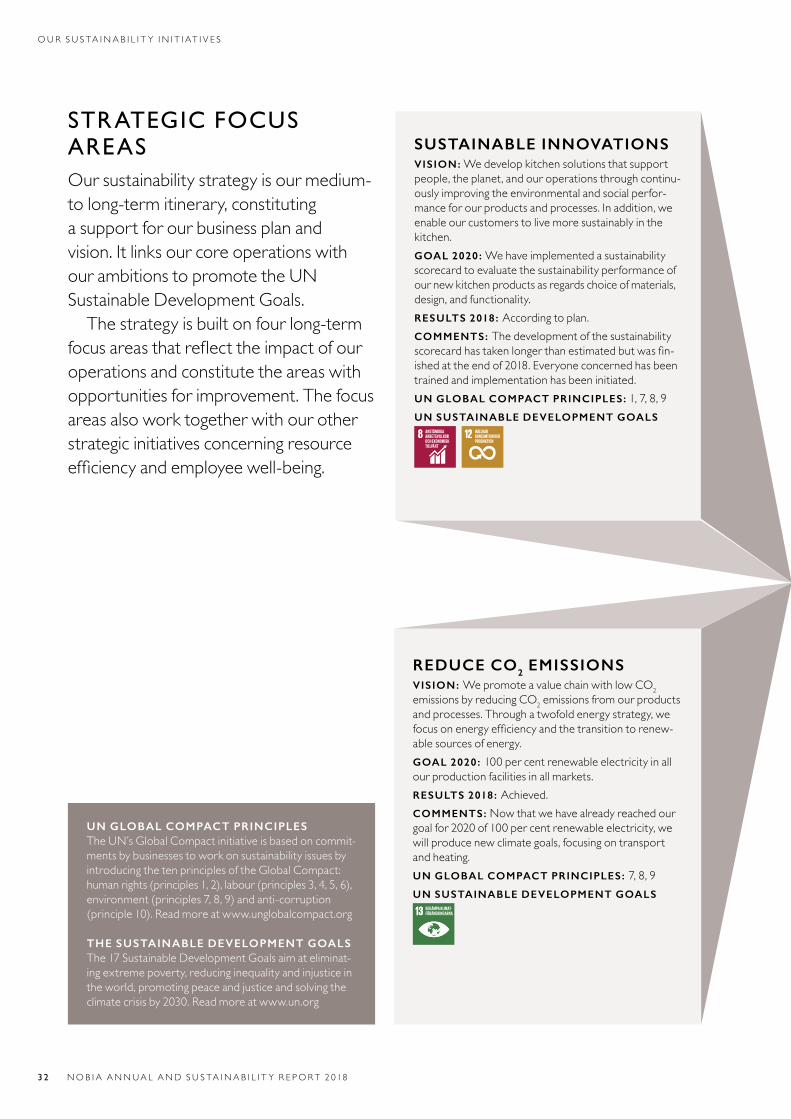
REDUCE CO2 EMISSIONSVISION: WepromoteavaluechainwithlowCO2 emissions by reducing CO2 emissions from our products andprocesses.Throughatwofoldenergystrategy,wefocusonenergyefficiencyandthetransitiontorenew-ablesourcesofenergy.GOAL 2020 : 100 per cent renewable electricity in all ourproductionfacilitiesinallmarkets.RESULTS 2018: Achieved.COMMENTS: Now that we have already reached our goal for 2020 of 100 per cent renewable electricity, we will produce new climate goals, focusing on transport andheating.UN GLOBAL COMPACT PRINCIPLES: 7, 8, 9UN SUSTAINABLE DEVELOPMENT GOALS
BEKÄMPA KLIMAT-FÖRÄNDRINGARNA
SUSTAINABLE INNOVATIONS VISION: Wedevelopkitchensolutionsthatsupportpeople, the planet, and our operations through continu-ously improving the environmental and social perfor-manceforourproductsandprocesses.Inaddition,weenable our customers to live more sustainably in the kitchen.GOAL 2020 :Wehaveimplementedasustainabilityscorecard to evaluate the sustainability performance of our new kitchen products as regards choice of materials, design,andfunctionality.RESULTS 2018: Accordingtoplan.COMMENTS: The development of the sustainability scorecardhastakenlongerthanestimatedbutwasfin-ishedattheendof2018.Everyoneconcernedhasbeentrainedandimplementationhasbeeninitiated.UN GLOBAL COMPACT PRINCIPLES: 1, 7, 8, 9UN SUSTAINABLE DEVELOPMENT GOALS
ANSTÄNDIGA ARBETSVILLKOR OCH EKONOMISK TILLVÄXT
HÅLLBAR KONSUMTION OCHPRODUKTION
UN GLOBAL COMPACT PRINCIPLESThe UN’s Global Compact initiative is based on commit-ments by businesses to work on sustainability issues by introducing the ten principles of the Global Compact: human rights (principles 1, 2), labour (principles 3, 4, 5, 6), environment (principles 7, 8, 9) and anti-corruption (principle10).Readmoreatwww.unglobalcompact.org
THE SUSTAINABLE DEVELOPMENT GOALSThe 17 Sustainable Development Goals aim at eliminat-ing extreme poverty, reducing inequality and injustice in the world, promoting peace and justice and solving the climatecrisisby2030.Readmoreatwww.un.org
3 2 NOB I A ANNUA L AND S U S TA I NA B I L I T Y R E PORT 2 018
OU R S U S TA I NA B I L I T Y I N I T I AT I V E S
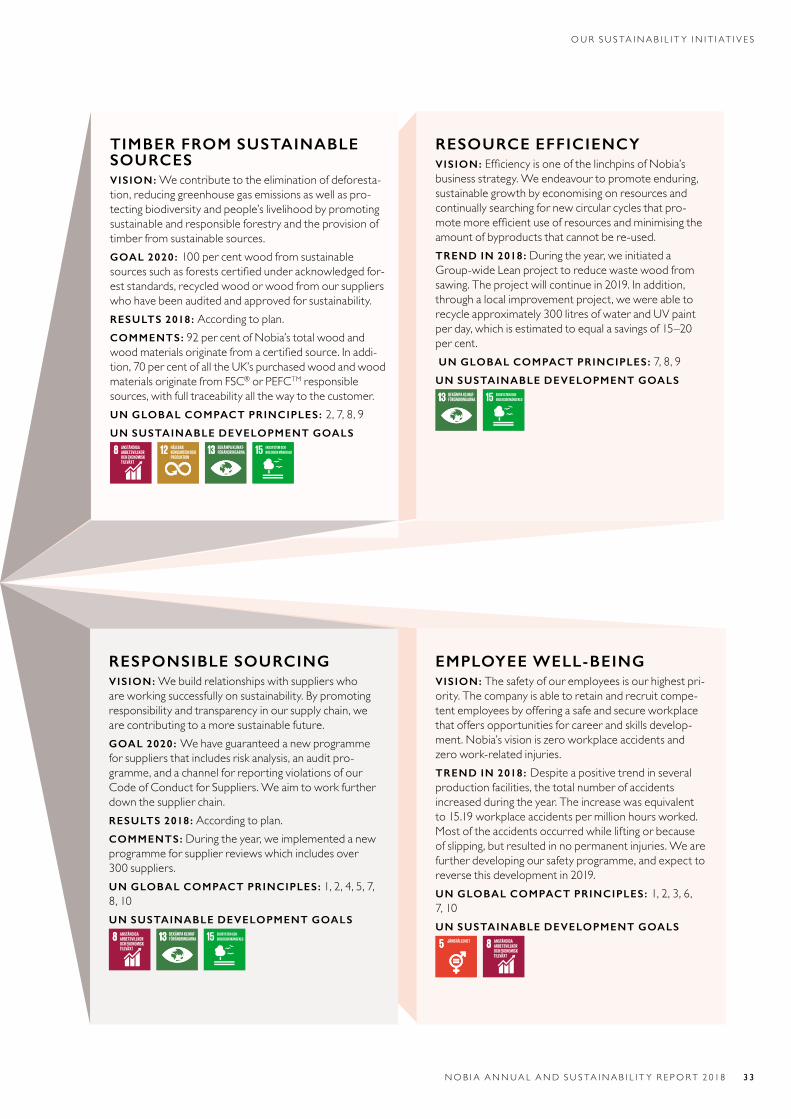
RESPONSIBLE SOURCINGVISION: We build relationships with suppliers who are working successfully on sustainability. By promoting responsibility and transparency in our supply chain, we are contributing to a more sustainable future.GOAL 2020 : We have guaranteed a new programme for suppliers that includes risk analysis, an audit pro-gramme, and a channel for reporting violations of our Code of Conduct for Suppliers. We aim to work further down the supplier chain.RESULTS 2018: According to plan. COMMENTS: During the year, we implemented a new programme for supplier reviews which includes over 300 suppliers.UN GLOBAL COMPACT PRINCIPLES: 1, 2, 4, 5, 7, 8, 10UN SUSTAINABLE DEVELOPMENT GOALS
ANSTÄNDIGA ARBETSVILLKOR OCH EKONOMISK TILLVÄXT
BEKÄMPA KLIMAT-FÖRÄNDRINGARNA
EMPLOYEE WELL-BEINGVISION: The safety of our employees is our highest pri-ority. The company is able to retain and recruit compe-tent employees by offering a safe and secure workplace that offers opportunities for career and skills develop-ment. Nobia’s vision is zero workplace accidents and zero work-related injuries. TREND IN 2018: Despite a positive trend in several production facilities, the total number of accidents increased during the year. The increase was equivalent to 15.19 workplace accidents per million hours worked. Most of the accidents occurred while lifting or because of slipping, but resulted in no permanent injuries. We are further developing our safety programme, and expect to reverse this development in 2019. UN GLOBAL COMPACT PRINCIPLES: 1, 2, 3, 6, 7, 10UN SUSTAINABLE DEVELOPMENT GOALS
JÄMSTÄLLDHET
ANSTÄNDIGA ARBETSVILLKOR OCH EKONOMISK TILLVÄXT
TIMBER FROM SUSTAINABLE SOURCES VISION: We contribute to the elimination of deforesta-tion, reducing greenhouse gas emissions as well as pro-tecting biodiversity and people’s livelihood by promoting sustainable and responsible forestry and the provision of timber from sustainable sources.GOAL 2020 : 100 per cent wood from sustainable sources such as forests certified under acknowledged for-est standards, recycled wood or wood from our suppliers who have been audited and approved for sustainability.RESULTS 2018: According to plan. COMMENTS: 92 per cent of Nobia’s total wood and wood materials originate from a certified source. In addi-tion, 70 per cent of all the UK’s purchased wood and wood materials originate from FSC® or PEFCTM responsible sources, with full traceability all the way to the customer.UN GLOBAL COMPACT PRINCIPLES: 2, 7, 8, 9UN SUSTAINABLE DEVELOPMENT GOALS
ANSTÄNDIGA ARBETSVILLKOR OCH EKONOMISK TILLVÄXT
HÅLLBAR KONSUMTION OCHPRODUKTION
BEKÄMPA KLIMAT-FÖRÄNDRINGARNA
RESOURCE EFFICIENCYVISION: Efficiency is one of the linchpins of Nobia’s business strategy. We endeavour to promote enduring, sustainable growth by economising on resources and continually searching for new circular cycles that pro-mote more efficient use of resources and minimising the amount of byproducts that cannot be re-used.TREND IN 2018: During the year, we initiated a Group-wide Lean project to reduce waste wood from sawing. The project will continue in 2019. In addition, through a local improvement project, we were able to recycle approximately 300 litres of water and UV paint per day, which is estimated to equal a savings of 15–20 per cent. UN GLOBAL COMPACT PRINCIPLES: 7, 8, 9UN SUSTAINABLE DEVELOPMENT GOALS
BEKÄMPA KLIMAT-FÖRÄNDRINGARNA
N O B I A A N N U A L A N D S U S TA I N A B I L I T Y R E P O R T 2 018 3 3
O U R S U S TA I N A B I L I T Y I N I T I AT I V E S
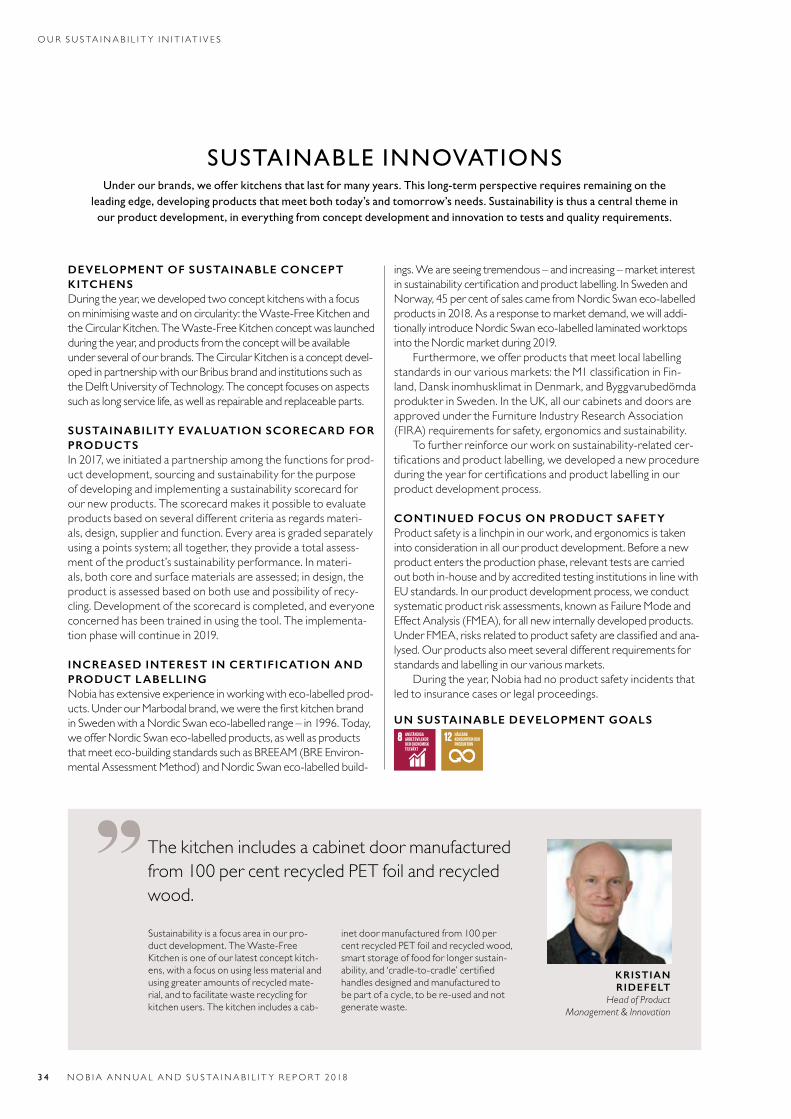
SUSTAINABLE INNOVATIONS Under our brands, we offer kitchens that last for many years. This long-term perspective requires remaining on the
leading edge, developing products that meet both today’s and tomorrow’s needs. Sustainability is thus a central theme in our product development, in everything from concept development and innovation to tests and quality requirements.
DEVELOPMENT OF SUSTAINABLE CONCEPT KITCHENS During the year, we developed two concept kitchens with a focus onminimisingwasteandoncircularity:theWaste-FreeKitchenandtheCircularKitchen.TheWaste-FreeKitchenconceptwaslaunchedduring the year, and products from the concept will be available underseveralofourbrands.TheCircularKitchenisaconceptdevel-oped in partnership with our Bribus brand and institutions such as theDelftUniversityofTechnology.Theconceptfocusesonaspectssuchaslongservicelife,aswellasrepairableandreplaceableparts.
SUSTAINABILITY EVALUATION SCORECARD FOR PRODUCTSIn2017,weinitiatedapartnershipamongthefunctionsforprod-uct development, sourcing and sustainability for the purpose of developing and implementing a sustainability scorecard for ournewproducts.Thescorecardmakesitpossibletoevaluateproducts based on several different criteria as regards materi-als,design,supplierandfunction.Everyareaisgradedseparatelyusing a points system; all together, they provide a total assess-mentoftheproduct’ssustainabilityperformance.Inmateri-als, both core and surface materials are assessed; in design, the product is assessed based on both use and possibility of recy-cling.Developmentofthescorecardiscompleted,andeveryoneconcernedhasbeentrainedinusingthetool.Theimplementa-tionphasewillcontinuein2019.
INCREASED INTEREST IN CERTIFICATION AND PRODUCT LABELLING Nobia has extensive experience in working with eco-labelled prod-ucts.UnderourMarbodalbrand,wewerethefirstkitchenbrandinSwedenwithaNordicSwaneco-labelledrange–in1996.Today,we offer Nordic Swan eco-labelled products, as well as products that meet eco-building standards such as BREEAM (BRE Environ-mental Assessment Method) and Nordic Swan eco-labelled build-
ings.Weareseeingtremendous–andincreasing–marketinterestinsustainabilitycertificationandproductlabelling.InSwedenandNorway, 45 per cent of sales came from Nordic Swan eco-labelled productsin2018.Asaresponsetomarketdemand,wewilladdi-tionally introduce Nordic Swan eco-labelled laminated worktops intotheNordicmarketduring2019.
Furthermore, we offer products that meet local labelling standardsinourvariousmarkets:theM1classificationinFin-land, Dansk inomhusklimat in Denmark, and Byggvarubedömda produkterinSweden.IntheUK,allourcabinetsanddoorsareapprovedundertheFurnitureIndustryResearchAssociation(FIRA)requirementsforsafety,ergonomicsandsustainability.
To further reinforce our work on sustainability-related cer-tificationsandproductlabelling,wedevelopedanewprocedureduringtheyearforcertificationsandproductlabellinginourproductdevelopmentprocess.
CONTINUED FOCUS ON PRODUCT SAFETY Product safety is a linchpin in our work, and ergonomics is taken intoconsiderationinallourproductdevelopment.Beforeanewproduct enters the production phase, relevant tests are carried out both in-house and by accredited testing institutions in line with EUstandards.Inourproductdevelopmentprocess,weconductsystematic product risk assessments, known as Failure Mode and EffectAnalysis(FMEA),forallnewinternallydevelopedproducts.UnderFMEA,risksrelatedtoproductsafetyareclassifiedandana-lysed.Ourproductsalsomeetseveraldifferentrequirementsforstandardsandlabellinginourvariousmarkets.
During the year, Nobia had no product safety incidents that ledtoinsurancecasesorlegalproceedings.
UN SUSTAINABLE DEVELOPMENT GOALSANSTÄNDIGA ARBETSVILLKOR OCH EKONOMISK TILLVÄXT
HÅLLBAR KONSUMTION OCHPRODUKTION
KRISTIAN RIDEFELT
Head of Product Management & Innovation
The kitchen includes a cabinet door manufactured from 100 per cent recycled PET foil and recycled wood.
Sustainability is a focus area in our pro-ductdevelopment.TheWaste-FreeKitchen is one of our latest concept kitch-ens, with a focus on using less material and using greater amounts of recycled mate-rial, and to facilitate waste recycling for kitchenusers.Thekitchenincludesacab-
inet door manu factured from 100 per cent recycled PET foil and recycled wood, smart storage of food for longer sustain-ability,and‘cradle-to-cradle’certifiedhandles designed and manufactured to be part of a cycle, to be re-used and not generatewaste.
3 4 NOB I A ANNUA L AND S U S TA I NA B I L I T Y R E PORT 2 018
OU R S U S TA I NA B I L I T Y I N I T I AT I V E S
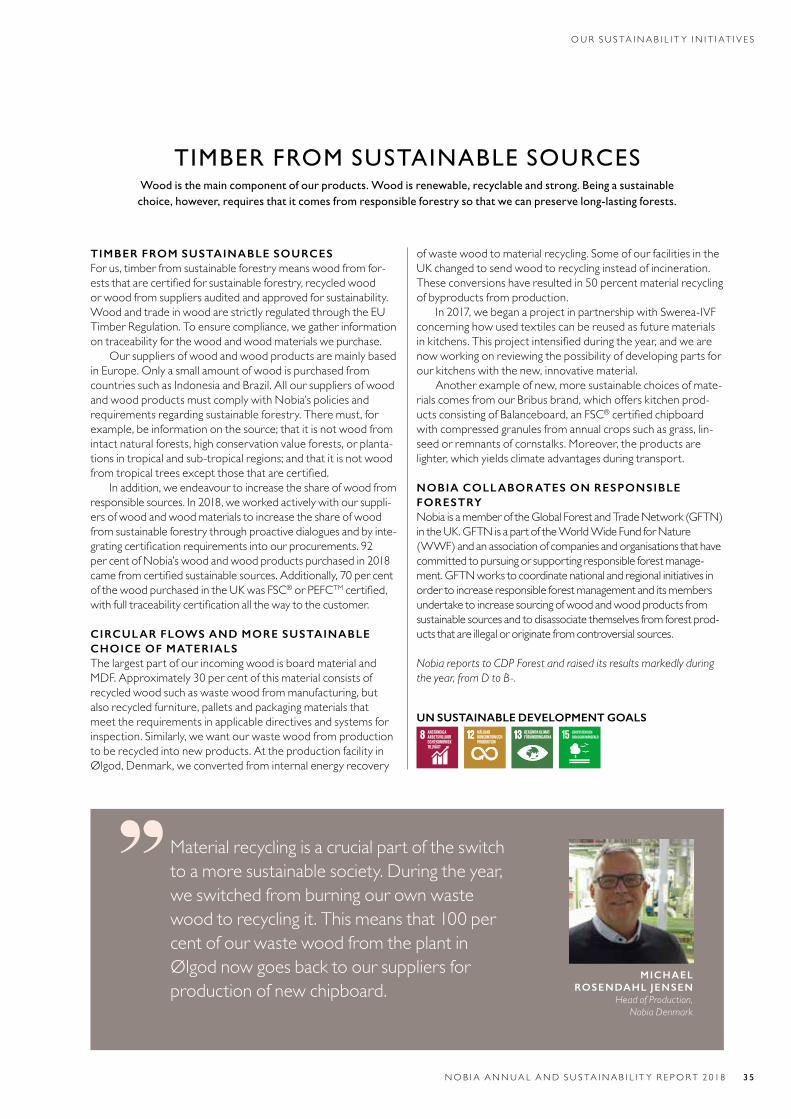
TIMBER FROM SUSTAINABLE SOURCES Wood is the main component of our products. Wood is renewable, recyclable and strong. Being a sustainable choice, however, requires that it comes from responsible forestry so that we can preserve long-lasting forests.
TIMBER FROM SUSTAINABLE SOURCES For us, timber from sustainable forestry means wood from for-ests that are certified for sustainable forestry, recycled wood or wood from suppliers audited and approved for sustainability. Wood and trade in wood are strictly regulated through the EU Timber Regulation. To ensure compliance, we gather information on traceability for the wood and wood materials we purchase.
Our suppliers of wood and wood products are mainly based in Europe. Only a small amount of wood is purchased from countries such as Indonesia and Brazil. All our suppliers of wood and wood products must comply with Nobia’s policies and requirements regarding sustainable forestry. There must, for example, be information on the source; that it is not wood from intact natural forests, high conservation value forests, or planta-tions in tropical and sub-tropical regions; and that it is not wood from tropical trees except those that are certified.
In addition, we endeavour to increase the share of wood from responsible sources. In 2018, we worked actively with our suppli-ers of wood and wood materials to increase the share of wood from sustainable forestry through proactive dialogues and by inte-grating certification requirements into our procurements. 92 per cent of Nobia’s wood and wood products purchased in 2018 came from certified sustainable sources. Additionally, 70 per cent of the wood purchased in the UK was FSC® or PEFCTM certified, with full traceability certification all the way to the customer.
CIRCULAR FLOWS AND MORE SUSTAINABLE CHOICE OF MATERIALS The largest part of our incoming wood is board material and MDF. Approximately 30 per cent of this material consists of recycled wood such as waste wood from manufacturing, but also recycled furniture, pallets and packaging materials that meet the requirements in applicable directives and systems for inspection. Similarly, we want our waste wood from production to be recycled into new products. At the production facility in Ølgod, Denmark, we converted from internal energy recovery
of waste wood to material recycling. Some of our facilities in the UK changed to send wood to recycling instead of incineration. These conversions have resulted in 50 percent material recycling of byproducts from production.
In 2017, we began a project in partnership with Swerea-IVF concerning how used textiles can be reused as future materials in kitchens. This project intensified during the year, and we are now working on reviewing the possibility of developing parts for our kitchens with the new, innovative material.
Another example of new, more sustainable choices of mate-rials comes from our Bribus brand, which offers kitchen prod-ucts consisting of Balanceboard, an FSC® certified chipboard with compressed granules from annual crops such as grass, lin-seed or remnants of cornstalks. Moreover, the products are lighter, which yields climate advantages during transport.
NOBIA COLLABORATES ON RESPONSIBLE FORESTRY Nobia is a member of the Global Forest and Trade Network (GFTN) in the UK. GFTN is a part of the World Wide Fund for Nature (WWF) and an association of companies and organisations that have committed to pursuing or supporting responsible forest manage-ment. GFTN works to coordinate national and regional initiatives in order to increase responsible forest management and its members undertake to increase sourcing of wood and wood products from sustainable sources and to disassociate themselves from forest prod-ucts that are illegal or originate from controversial sources.
Nobia reports to CDP Forest and raised its results markedly during the year, from D to B-.
UN SUSTAINABLE DEVELOPMENT GOALSANSTÄNDIGA ARBETSVILLKOR OCH EKONOMISK TILLVÄXT
HÅLLBAR KONSUMTION OCHPRODUKTION
BEKÄMPA KLIMAT-FÖRÄNDRINGARNA
Material recycling is a crucial part of the switch to a more sustainable society. During the year, we switched from burning our own waste wood to recycling it. This means that 100 per cent of our waste wood from the plant in Ølgod now goes back to our suppliers for production of new chipboard.
MICHAEL ROSENDAHL JENSEN
Head of Production, Nobia Denmark
N O B I A A N N U A L A N D S U S TA I N A B I L I T Y R E P O R T 2 018 3 5
O U R S U S TA I N A B I L I T Y I N I T I AT I V E S
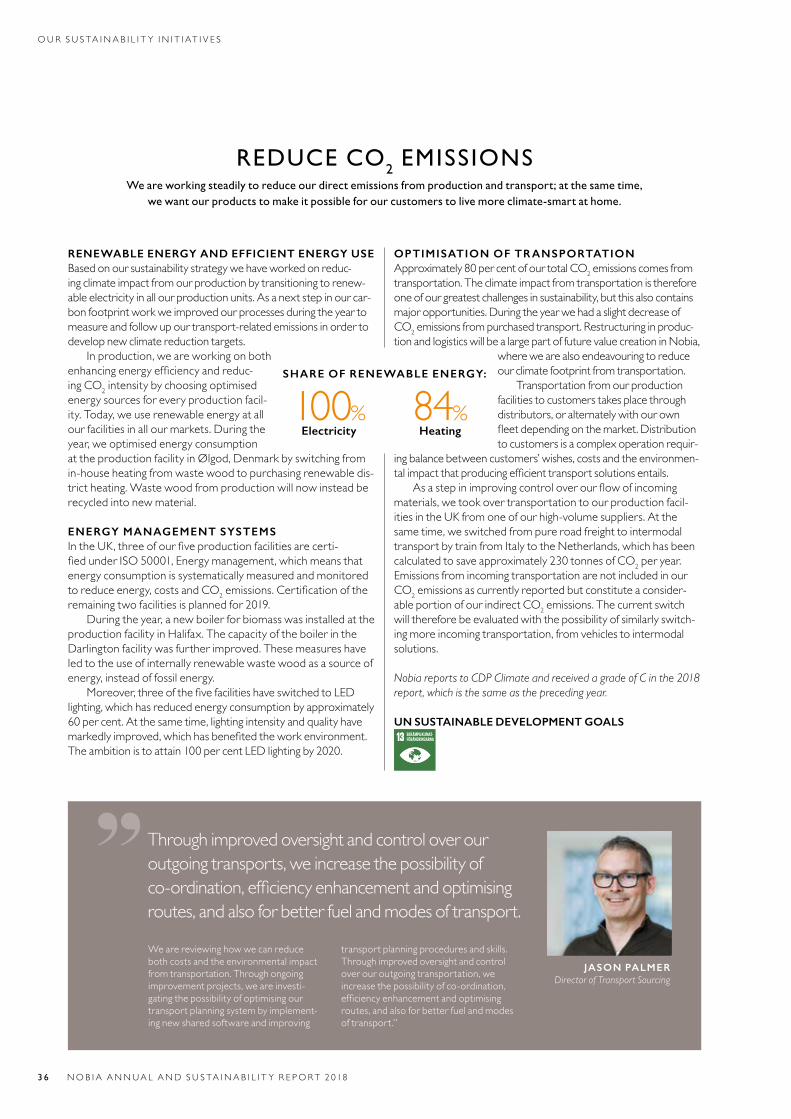
REDUCE CO2 EMISSIONS We are working steadily to reduce our direct emissions from production and transport; at the same time,
we want our products to make it possible for our customers to live more climate-smart at home.
RENEWABLE ENERGY AND EFFICIENT ENERGY USEBased on our sustainability strategy we have worked on reduc-ing climate impact from our production by transitioning to renew-ableelectricityinallourproductionunits.Asanextstepinourcar-bon footprint work we improved our processes during the year to measure and follow up our transport-related emissions in order to developnewclimatereductiontargets.
Inproduction,weareworkingonbothenhancingenergyefficiencyandreduc-ing CO2 intensity by choosing optimised energy sources for every production facil-ity.Today,weuserenewableenergyatallourfacilitiesinallourmarkets.Duringtheyear, we optimised energy consumption at the production facility in Ølgod, Denmark by switching from in-house heating from waste wood to purchasing renewable dis-trictheating.Wastewoodfromproductionwillnowinsteadberecycledintonewmaterial.
ENERGY MANAGEMENT SYSTEMSIntheUK,threeofourfiveproductionfacilitiesarecerti-fiedunderISO50001,Energymanagement,whichmeansthatenergy consumption is systematically measured and monitored to reduce energy, costs and CO2emissions.Certificationoftheremainingtwofacilitiesisplannedfor2019.
During the year, a new boiler for biomass was installed at the productionfacilityinHalifax.ThecapacityoftheboilerintheDarlingtonfacilitywasfurtherimproved.Thesemeasureshaveled to the use of internally renewable waste wood as a source of energy,insteadoffossilenergy.
Moreover,threeofthefivefacilitieshaveswitchedtoLEDlighting, which has reduced energy consumption by approximately 60percent.Atthesametime,lightingintensityandqualityhavemarkedlyimproved,whichhasbenefitedtheworkenvironment.Theambitionistoattain100percentLEDlightingby2020.
OPTIMISATION OF TRANSPORTATIONApproximately 80 per cent of our total CO2 emissions comes from transportation.Theclimateimpactfromtransportationisthereforeone of our greatest challenges in sustainability, but this also contains majoropportunities.DuringtheyearwehadaslightdecreaseofCO2emissionsfrompurchasedtransport.Restructuringinproduc-tion and logistics will be a large part of future value creation in Nobia,
where we are also endeavouring to reduce ourclimatefootprintfromtransportation.
Transportation from our production facilities to customers takes place through distributors, or alternately with our own fleetdependingonthemarket.Distributionto customers is a complex operation requir-
ing balance between customers’ wishes, costs and the environmen-talimpactthatproducingefficienttransportsolutionsentails.
Asastepinimprovingcontroloverourflowofincomingmaterials, we took over transportation to our production facil-itiesintheUKfromoneofourhigh-volumesuppliers.Atthesame time, we switched from pure road freight to intermodal transportbytrainfromItalytotheNetherlands,whichhasbeencalculated to save approximately 230 tonnes of CO2peryear.Emissions from incoming transportation are not included in our CO2 emissions as currently reported but constitute a consider-able portion of our indirect CO2emissions.Thecurrentswitchwill therefore be evaluated with the possibility of similarly switch-ing more incoming transportation, from vehicles to intermodal solutions.
Nobia reports to CDP Climate and received a grade of C in the 2018 report, which is the same as the preceding year.
UN SUSTAINABLE DEVELOPMENT GOALSBEKÄMPA KLIMAT-FÖRÄNDRINGARNA
SHARE OF RENEWABLE ENERGY:
100%Electricity
84% Heating
Through improved oversight and control over our outgoing transports, we increase the possibility of co-ordination,efficiencyenhancementandoptimisingroutes,andalsoforbetterfuelandmodesoftransport.
Wearereviewinghowwecanreduceboth costs and the environmental impact fromtransportation.Throughongoing improvement projects, we are investi-gating the possibility of optimising our transport planning system by implement-ing new shared software and improving
transportplanningproceduresandskills.Through improved oversight and control over our outgoing transportation, we increase the possibility of co-ordination, efficiencyenhancementandoptimisingroutes, and also for better fuel and modes oftransport.”
JASON PALMERDirector of Transport Sourcing
3 6 NOB I A ANNUA L AND S U S TA I NA B I L I T Y R E PORT 2 018
OU R S U S TA I NA B I L I T Y I N I T I AT I V E S
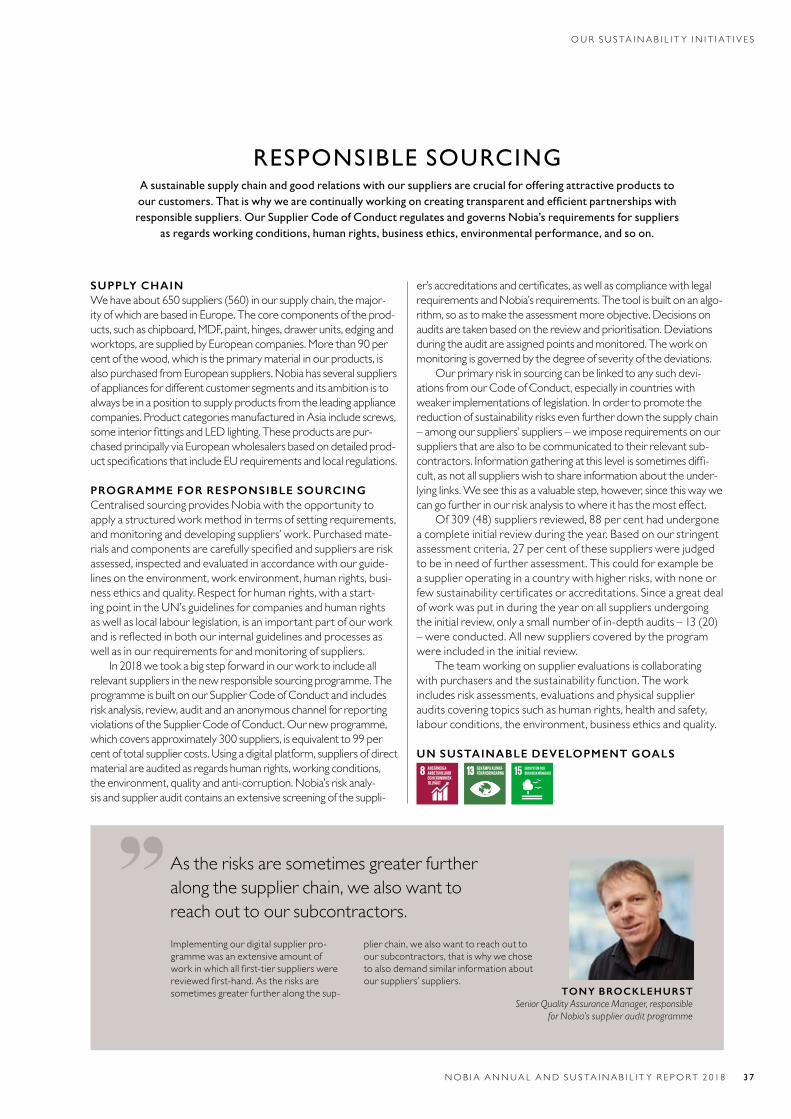
RESPONSIBLE SOURCINGA sustainable supply chain and good relations with our suppliers are crucial for offering attractive products to our customers. That is why we are continually working on creating transparent and efficient partnerships with responsible suppliers. Our Supplier Code of Conduct regulates and governs Nobia’s requirements for suppliers
as regards working conditions, human rights, business ethics, environmental performance, and so on.
SUPPLY CHAINWehaveabout650suppliers(560)inoursupplychain,themajor-ityofwhicharebasedinEurope.Thecorecomponentsoftheprod-ucts, such as chipboard, MDF, paint, hinges, drawer units, edging and worktops,aresuppliedbyEuropeancompanies.Morethan90percent of the wood, which is the primary material in our products, is alsopurchasedfromEuropeansuppliers.Nobiahasseveralsuppliersof appliances for different customer segments and its ambition is to always be in a position to supply products from the leading appliance companies.ProductcategoriesmanufacturedinAsiaincludescrews,someinteriorfittingsandLEDlighting.Theseproductsarepur-chased principally via European wholesalers based on detailed prod-uctspecificationsthatincludeEUrequirementsandlocalregulations.
PROGRAMME FOR RESPONSIBLE SOURCING Centralised sourcing provides Nobia with the opportunity to apply a structured work method in terms of setting requirements, andmonitoringanddevelopingsuppliers’work.Purchasedmate-rialsandcomponentsarecarefullyspecifiedandsuppliersareriskassessed, inspected and evaluated in accordance with our guide-lines on the environment, work environment, human rights, busi-nessethicsandquality.Respectforhumanrights,withastart-ing point in the UN’s guidelines for companies and human rights as well as local labour legislation, is an important part of our work andisreflectedinbothourinternalguidelinesandprocessesaswellasinourrequirementsforandmonitoringofsuppliers.
In2018wetookabigstepforwardinourworktoincludeallrelevantsuppliersinthenewresponsiblesourcingprogramme.Theprogramme is built on our Supplier Code of Conduct and includes risk analysis, review, audit and an anonymous channel for reporting violationsoftheSupplierCodeofConduct.Ournewprogramme,which covers approximately 300 suppliers, is equivalent to 99 per centoftotalsuppliercosts.Usingadigitalplatform,suppliersofdirectmaterial are audited as regards human rights, working conditions, theenvironment,qualityandanti-corruption.Nobia’sriskanaly-sis and supplier audit contains an extensive screening of the suppli-
er’saccreditationsandcertificates,aswellascompliancewithlegalrequirementsandNobia’srequirements.Thetoolisbuiltonanalgo-rithm,soastomaketheassessmentmoreobjective.Decisionsonauditsaretakenbasedonthereviewandprioritisation.Deviationsduringtheauditareassignedpointsandmonitored.Theworkonmonitoringisgovernedbythedegreeofseverityofthedeviations.
Our primary risk in sourcing can be linked to any such devi-ations from our Code of Conduct, especially in countries with weakerimplementationsoflegislation.Inordertopromotethereduction of sustainability risks even further down the supply chain –amongoursuppliers’suppliers–weimposerequirementsonoursuppliers that are also to be communicated to their relevant sub-contractors.Informationgatheringatthislevelissometimesdiffi-cult, as not all suppliers wish to share information about the under-lyinglinks.Weseethisasavaluablestep,however,sincethiswaywecangofurtherinourriskanalysistowhereithasthemosteffect.
Of 309 (48) suppliers reviewed, 88 per cent had undergone acompleteinitialreviewduringtheyear.Basedonourstringentassessment criteria, 27 per cent of these suppliers were judged tobeinneedoffurtherassessment.Thiscouldforexamplebea supplier operating in a country with higher risks, with none or fewsustainabilitycertificatesoraccreditations.Sinceagreatdealof work was put in during the year on all suppliers under going theinitialreview,onlyasmallnumberofin-depthaudits–13(20)–wereconducted.Allnewsupplierscoveredbytheprogramwereincludedintheinitialreview.
The team working on supplier evaluations is collaborating withpurchasersandthesustainabilityfunction.Theworkincludes risk assessments, evaluations and physical supplier audits covering topics such as human rights, health and safety, labourconditions,theenvironment,businessethicsandquality.
UN SUSTAINABLE DEVELOPMENT GOALSANSTÄNDIGA ARBETSVILLKOR OCH EKONOMISK TILLVÄXT
BEKÄMPA KLIMAT-FÖRÄNDRINGARNA
As the risks are sometimes greater further along the supplier chain, we also want to reachouttooursubcontractors.Implementingourdigitalsupplierpro-gramme was an extensive amount of workinwhichallfirst-tiersupplierswerereviewedfirst-hand.Astherisksaresometimes greater further along the sup-
plier chain, we also want to reach out to our subcontractors, that is why we chose to also demand similar information about oursuppliers’suppliers.
TONY BROCKLEHURSTSenior Quality Assurance Manager, responsible
for Nobia’s supplier audit programme
NOB I A ANNUA L AND S U S TA I NA B I L I T Y R E PORT 2 018 3 7
OUR S U S TA I NA B I L I T Y I N I T I AT I V E S
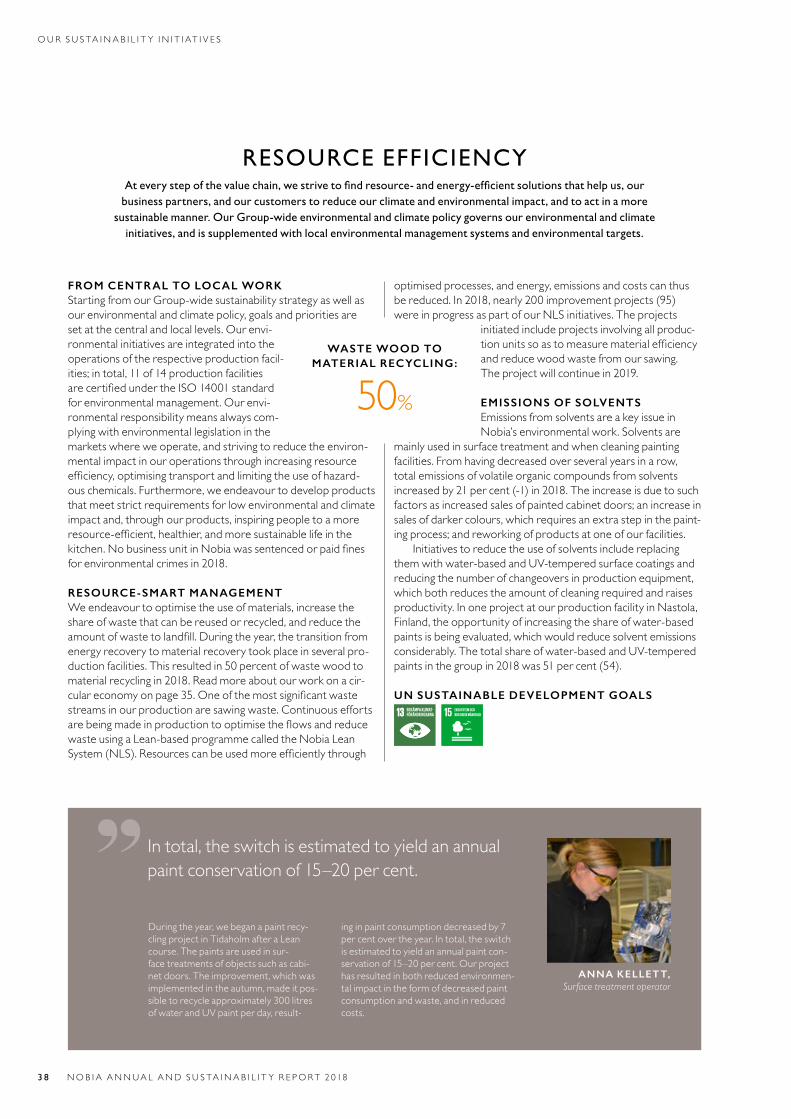
RESOURCE EFFICIENCY At every step of the value chain, we strive to find resource- and energy-efficient solutions that help us, our business partners, and our customers to reduce our climate and environmental impact, and to act in a more
sustainable manner. Our Group-wide environmental and climate policy governs our environmental and climate initiatives, and is supplemented with local environmental management systems and environmental targets.
FROM CENTRAL TO LOCAL WORKStarting from our Group-wide sustainability strategy as well as our environmental and climate policy, goals and priorities are setatthecentralandlocallevels.Ourenvi-ronmental initiatives are integrated into the operations of the respective production facil-ities; in total, 11 of 14 production facilities arecertifiedundertheISO14001standardforenvironmentalmanagement.Ourenvi-ronmental responsibility means always com-plying with environmental legislation in the markets where we operate, and striving to reduce the environ-mental impact in our operations through increasing resource efficiency,optimisingtransportandlimitingtheuseofhazard-ouschemicals.Furthermore,weendeavourtodevelopproductsthat meet strict requirements for low environmental and climate impact and, through our products, inspiring people to a more resource-efficient,healthier,andmoresustainablelifeinthekitchen.NobusinessunitinNobiawassentencedorpaidfinesforenvironmentalcrimesin2018.
RESOURCE-SMART MANAGEMENTWeendeavourtooptimisetheuseofmaterials,increasetheshare of waste that can be reused or recycled, and reduce the amountofwastetolandfill.Duringtheyear,thetransitionfromenergy recovery to material recovery took place in several pro-ductionfacilities.Thisresultedin50percentofwastewoodtomaterialrecyclingin2018.Readmoreaboutourworkonacir-culareconomyonpage35.Oneofthemostsignificantwastestreamsinourproductionaresawingwaste.ContinuouseffortsarebeingmadeinproductiontooptimisetheflowsandreducewasteusingaLean-basedprogrammecalledtheNobiaLeanSystem(NLS).Resourcescanbeusedmoreefficientlythrough
optimised processes, and energy, emissions and costs can thus bereduced.In2018,nearly200improvementprojects(95)wereinprogressaspartofourNLSinitiatives.Theprojects
initiated include projects involving all produc-tionunitssoastomeasurematerialefficiencyandreducewoodwastefromoursawing. Theprojectwillcontinuein2019.
EMISSIONS OF SOLVENTSEmissions from solvents are a key issue in Nobia’senvironmentalwork.Solventsare
mainly used in surface treatment and when cleaning painting facilities.Fromhavingdecreasedoverseveralyearsinarow,total emissions of volatile organic compounds from solvents increasedby21percent(-1)in2018.Theincreaseisduetosuchfactors as increased sales of painted cabinet doors; an increase in sales of darker colours, which requires an extra step in the paint-ingprocess;andreworkingofproductsatoneofourfacilities.
Initiativestoreducetheuseofsolventsincludereplacingthem with water-based and UV-tempered surface coatings and reducing the number of changeovers in production equipment, which both reduces the amount of cleaning required and raises productivity.InoneprojectatourproductionfacilityinNastola,Finland, the opportunity of increasing the share of water-based paints is being evaluated, which would reduce solvent emissions considerably.Thetotalshareofwater-basedandUV-temperedpaintsinthegroupin2018was51percent(54).
UN SUSTAINABLE DEVELOPMENT GOALSBEKÄMPA KLIMAT-FÖRÄNDRINGARNA
Intotal,theswitchisestimatedtoyieldanannual paintconservationof15–20percent.
During the year, we began a paint recy-clingprojectinTidaholmafteraLeancourse.Thepaintsareusedinsur-face treatments of objects such as cabi-netdoors.Theimprovement,whichwasimplemented in the autumn, made it pos-sible to recycle approximately 300 litres of water and UV paint per day, result-
ing in paint consumption decreased by 7 percentovertheyear.Intotal,theswitchis estimated to yield an annual paint con-servationof15–20percent.Ourprojecthas resulted in both reduced environmen-tal impact in the form of decreased paint consumption and waste, and in reduced costs.
ANNA KELLETT, Surface treatment operator
WASTE WOOD TO MATERIAL RECYCLING:
50%
3 8 NOB I A ANNUA L AND S U S TA I NA B I L I T Y R E PORT 2 018
OU R S U S TA I NA B I L I T Y I N I T I AT I V E S
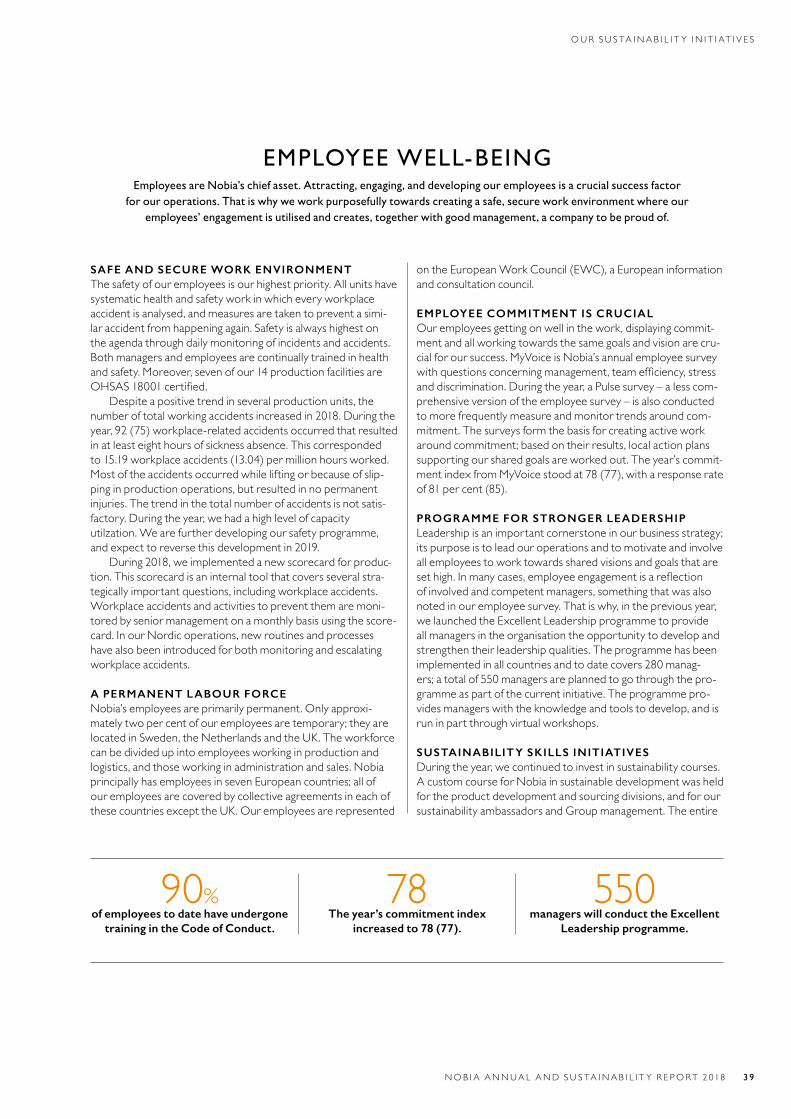
EMPLOYEE WELL-BEING Employees are Nobia’s chief asset. Attracting, engaging, and developing our employees is a crucial success factor
for our operations. That is why we work purposefully towards creating a safe, secure work environment where our employees’ engagement is utilised and creates, together with good management, a company to be proud of.
SAFE AND SECURE WORK ENVIRONMENTThesafetyofouremployeesisourhighestpriority.Allunitshavesystematic health and safety work in which every workplace accident is analysed, and measures are taken to prevent a simi-laraccidentfromhappeningagain.Safetyisalwayshighestontheagendathroughdailymonitoringofincidentsandaccidents.Both managers and employees are continually trained in health andsafety.Moreover,sevenofour14productionfacilitiesareOHSAS18001certified.
Despite a positive trend in several production units, the numberoftotalworkingaccidentsincreasedin2018.Duringtheyear, 92 (75) workplace-related accidents occurred that resulted inatleasteighthoursofsicknessabsence.Thiscorrespondedto15.19workplaceaccidents(13.04)permillionhoursworked.Most of the accidents occurred while lifting or because of slip-ping in production operations, but resulted in no permanent injuries.Thetrendinthetotalnumberofaccidentsisnotsatis-factory.Duringtheyear,wehadahighlevelofcapacity utilzation.Wearefurtherdevelopingoursafetyprogramme,andexpecttoreversethisdevelopmentin2019.
During 2018, we implemented a new scorecard for produc-tion.Thisscorecardisaninternaltoolthatcoversseveralstra-tegicallyimportantquestions,includingworkplaceaccidents.Workplaceaccidentsandactivitiestopreventthemaremoni-tored by senior management on a monthly basis using the score-card.InourNordicoperations,newroutinesandprocesseshave also been introduced for both monitoring and escalating workplaceaccidents.
A PERMANENT LABOUR FORCENobia’semployeesareprimarilypermanent.Onlyapproxi-mately two per cent of our employees are temporary; they are locatedinSweden,theNetherlandsandtheUK.Theworkforcecan be divided up into employees working in production and logistics,andthoseworkinginadministrationandsales.Nobiaprincipally has employees in seven European countries; all of our employees are covered by collective agreements in each of thesecountriesexcepttheUK.Ouremployeesarerepresented
ontheEuropeanWorkCouncil(EWC),aEuropeaninformationandconsultationcouncil.
EMPLOYEE COMMITMENT IS CRUCIALOur employees getting on well in the work, displaying commit-ment and all working towards the same goals and vision are cru-cialforoursuccess.MyVoiceisNobia’sannualemployeesurveywithquestionsconcerningmanagement,teamefficiency,stressanddiscrimination.Duringtheyear,aPulsesurvey–alesscom-prehensiveversionoftheemployeesurvey–isalsoconductedto more frequently measure and monitor trends around com-mitment.Thesurveysformthebasisforcreatingactiveworkaround commitment; based on their results, local action plans supportingoursharedgoalsareworkedout.Theyear’scommit-ment index from MyVoice stood at 78 (77), with a response rate of81percent(85).
PROGRAMME FOR STRONGER LEADERSHIPLeadershipisanimportantcornerstoneinourbusinessstrategy;its purpose is to lead our operations and to motivate and involve all employees to work towards shared visions and goals that are sethigh.Inmanycases,employeeengagementisareflectionof involved and competent managers, something that was also notedinouremployeesurvey.Thatiswhy,inthepreviousyear,welaunchedtheExcellentLeadershipprogrammetoprovideall managers in the organisation the opportunity to develop and strengthentheirleadershipqualities.Theprogrammehasbeenimplemented in all countries and to date covers 280 manag-ers; a total of 550 managers are planned to go through the pro-grammeaspartofthecurrentinitiative.Theprogrammepro-vides managers with the knowledge and tools to develop, and is runinpartthroughvirtualworkshops.
SUSTAINABILITY SKILLS INITIATIVESDuringtheyear,wecontinuedtoinvestinsustainabilitycourses.A custom course for Nobia in sustainable development was held for the product development and sourcing divisions, and for our sustainabilityambassadorsandGroupmanagement.Theentire
90%of employees to date have undergone
training in the Code of Conduct.
78 The year’s commitment index
increased to 78 (77).
550 managers will conduct the Excellent
Leadership programme.
NOB I A ANNUA L AND S U S TA I NA B I L I T Y R E PORT 2 018 3 9
OUR S U S TA I NA B I L I T Y I N I T I AT I V E S
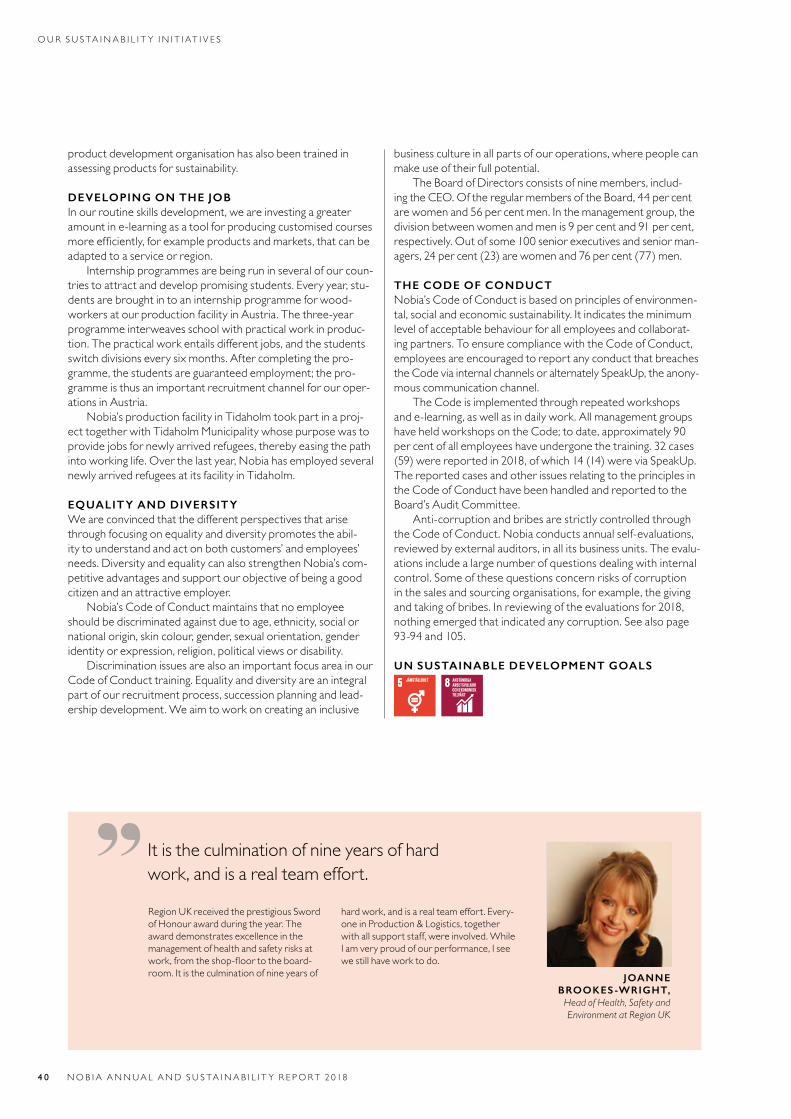
product development organisation has also been trained in assessingproductsforsustainability.
DEVELOPING ON THE JOBInourroutineskillsdevelopment,weareinvestingagreateramount in e-learning as a tool for producing customised courses moreefficiently,forexampleproductsandmarkets,thatcanbeadaptedtoaserviceorregion.
Internshipprogrammesarebeingruninseveralofourcoun-triestoattractanddeveloppromisingstudents.Everyyear,stu-dents are brought in to an internship programme for wood-workersatourproductionfacilityinAustria.Thethree-yearprogramme interweaves school with practical work in produc-tion.Thepracticalworkentailsdifferentjobs,andthestudentsswitchdivisionseverysixmonths.Aftercompletingthepro-gramme, the students are guaranteed employment; the pro-gramme is thus an important recruitment channel for our oper-ationsinAustria.
Nobia’s production facility in Tidaholm took part in a proj-ect together with Tidaholm Municipality whose purpose was to provide jobs for newly arrived refugees, thereby easing the path intoworkinglife.Overthelastyear,NobiahasemployedseveralnewlyarrivedrefugeesatitsfacilityinTidaholm.
EQUALITY AND DIVERSITYWeareconvincedthatthedifferentperspectivesthatarisethrough focusing on equality and diversity promotes the abil-ity to understand and act on both customers’ and employees’ needs.DiversityandequalitycanalsostrengthenNobia’scom-petitive advantages and support our objective of being a good citizenandanattractiveemployer.
Nobia’s Code of Conduct maintains that no employee should be discriminated against due to age, ethnicity, social or national origin, skin colour, gender, sexual orientation, gender identityorexpression,religion,politicalviewsordisability.
Discrimination issues are also an important focus area in our CodeofConducttraining.Equalityanddiversityareanintegralpart of our recruitment process, succession planning and lead-ershipdevelopment.Weaimtoworkoncreatinganinclusive
business culture in all parts of our operations, where people can makeuseoftheirfullpotential.
The Board of Directors consists of nine members, includ-ingtheCEO.OftheregularmembersoftheBoard,44percentarewomenand56percentmen.Inthemanagementgroup,thedivision between women and men is 9 per cent and 91 per cent, respectively.Outofsome100seniorexecutivesandseniorman-agers,24percent(23)arewomenand76percent(77)men.
THE CODE OF CONDUCTNobia’s Code of Conduct is based on principles of environmen-tal,socialandeconomicsustainability.Itindicatestheminimumlevel of acceptable behaviour for all employees and collaborat-ingpartners.ToensurecompliancewiththeCodeofConduct,employees are encouraged to report any conduct that breaches the Code via internal channels or alternately SpeakUp, the anony-mouscommunicationchannel.
The Code is implemented through repeated workshops ande-learning,aswellasindailywork.Allmanagementgroupshave held workshops on the Code; to date, approximately 90 percentofallemployeeshaveundergonethetraining.32cases(59)werereportedin2018,ofwhich14(14)wereviaSpeakUp.The reported cases and other issues relating to the principles in the Code of Conduct have been handled and reported to the Board’sAuditCommittee.
Anti-corruption and bribes are strictly controlled through theCodeofConduct.Nobiaconductsannualself-evaluations,reviewedbyexternalauditors,inallitsbusinessunits.Theevalu-ations include a large number of questions dealing with internal control.Someofthesequestionsconcernrisksofcorruption in the sales and sourcing organisations, for example, the giving andtakingofbribes.Inreviewingoftheevaluationsfor2018,nothingemergedthatindicatedanycorruption.Seealsopage93-94and105.
UN SUSTAINABLE DEVELOPMENT GOALSJÄMSTÄLLDHET
ANSTÄNDIGA ARBETSVILLKOR OCH EKONOMISK TILLVÄXT
Itistheculminationofnineyearsofhardwork,andisarealteameffort.
Region UK received the prestigious Sword ofHonourawardduringtheyear.Theaward demonstrates excellence in the management of health and safety risks at work,fromtheshop-floortotheboard-room.Itistheculminationofnineyearsof
hardwork,andisarealteameffort.Every-oneinProduction&Logistics,togetherwithallsupportstaff,wereinvolved.WhileIamveryproudofourperformance,Iseewestillhaveworktodo.
JOANNE BROOKES -WRIGHT,
Head of Health, Safety and Environment at Region UK
OUR S U S TA I NA B I L I T Y I N I T I AT I V E S
4 0 NOB I A ANNUA L AND S U S TA I NA B I L I T Y R E PORT 2 018
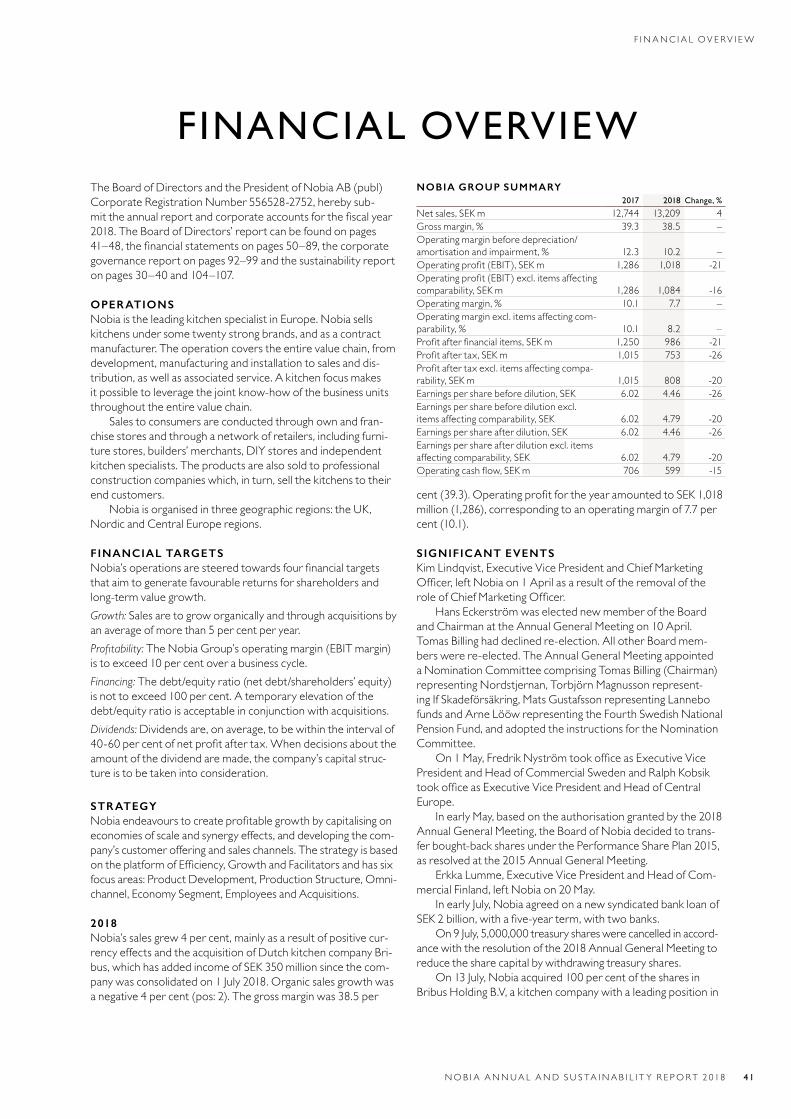
F I NANC I A L OV E RV I EW
NOB I A ANNUA L AND S U S TA I NA B I L I T Y R E PORT 2 018 41
F INANCIAL OVERVIEWThe Board of Directors and the President of Nobia AB (publ) Corporate Registration Number 556528-2752, hereby sub-mittheannualreportandcorporateaccountsforthefiscalyear2018.TheBoardofDirectors’reportcanbefoundonpages41–48,thefinancialstatementsonpages50–89,thecorporategovernancereportonpages92–99andthesustainabilityreportonpages30–40and104–107.
OPERATIONS NobiaistheleadingkitchenspecialistinEurope.Nobiasellskitchens under some twenty strong brands, and as a contract manufacturer.Theoperationcoverstheentirevaluechain,fromdevelopment, manufacturing and installation to sales and dis-tribution,aswellasassociatedservice.Akitchenfocusmakesit possible to leverage the joint know-how of the business units throughouttheentirevaluechain.
Sales to consumers are conducted through own and fran-chise stores and through a network of retailers, including furni-turestores,builders’merchants,DIYstoresandindependentkitchenspecialists.Theproductsarealsosoldtoprofessionalconstruction companies which, in turn, sell the kitchens to their endcustomers.
Nobia is organised in three geographic regions: the UK, NordicandCentralEuroperegions.
FINANCIAL TARGETSNobia’soperationsaresteeredtowardsfourfinancialtargetsthat aim to generate favourable returns for shareholders and long-termvaluegrowth.Growth: Sales are to grow organically and through acquisitions by anaverageofmorethan5percentperyear.Profitability: TheNobiaGroup’soperatingmargin(EBITmargin)istoexceed10percentoverabusinesscycle.Financing: The debt/equity ratio (net debt/shareholders’ equity) isnottoexceed100percent.Atemporaryelevationofthedebt/equityratioisacceptableinconjunctionwithacquisitions.Dividends: Dividends are, on average, to be within the interval of 40-60percentofnetprofitaftertax.Whendecisionsabouttheamount of the dividend are made, the company’s capital struc-tureistobetakenintoconsideration.
STRATEGY Nobiaendeavourstocreateprofitablegrowthbycapitalisingoneconomies of scale and synergy effects, and developing the com-pany’scustomerofferingandsaleschannels.ThestrategyisbasedontheplatformofEfficiency,GrowthandFacilitatorsandhassixfocus areas: Product Development, Production Structure, Omni-channel,EconomySegment,EmployeesandAcquisitions.
2018 Nobia’s sales grew 4 per cent, mainly as a result of positive cur-rency effects and the acquisition of Dutch kitchen company Bri-bus, which has added income of SEK 350 million since the com-panywasconsolidatedon1July2018.Organicsalesgrowthwasanegative4percent(pos:2).Thegrossmarginwas38.5per
cent(39.3).OperatingprofitfortheyearamountedtoSEK1,018million(1,286),correspondingtoanoperatingmarginof7.7percent(10.1).
SIGNIFICANT EVENTSKimLindqvist,ExecutiveVicePresidentandChiefMarketingOfficer,leftNobiaon1AprilasaresultoftheremovaloftheroleofChiefMarketingOfficer.
Hans Eckerström was elected new member of the Board andChairmanattheAnnualGeneralMeetingon10April.TomasBillinghaddeclinedre-election.AllotherBoardmem-berswerere-elected.TheAnnualGeneralMeetingappointeda Nomination Committee comprising Tomas Billing (Chairman) representing Nordstjernan, Torbjörn Magnusson represent-ingIfSkadeförsäkring,MatsGustafssonrepresentingLannebofundsandArneLööwrepresentingtheFourthSwedishNationalPension Fund, and adopted the instructions for the Nomination Committee.
On1May,FredrikNyströmtookofficeasExecutiveVicePresident and Head of Commercial Sweden and Ralph Kobsik tookofficeasExecutiveVicePresidentandHeadofCentralEurope.
InearlyMay,basedontheauthorisationgrantedbythe2018Annual General Meeting, the Board of Nobia decided to trans-fer bought-back shares under the Performance Share Plan 2015, asresolvedatthe2015AnnualGeneralMeeting.
ErkkaLumme,ExecutiveVicePresidentandHeadofCom-mercialFinland,leftNobiaon20May.
InearlyJuly,NobiaagreedonanewsyndicatedbankloanofSEK2billion,withafive-yearterm,withtwobanks.
On9July,5,000,000treasuryshareswerecancelledinaccord-ance with the resolution of the 2018 Annual General Meeting to reducethesharecapitalbywithdrawingtreasuryshares.
On13July,Nobiaacquired100percentofthesharesinBribusHoldingB.V,akitchencompanywithaleadingpositionin
NOBIA GROUP SUMMARY 2017 2018 Change, %
Net sales, SEK m 12,744 13,209 4Gross margin, % 39.3 38.5 –Operating margin before depreciation/amortisation and impairment, % 12.3 10.2 –Operatingprofit(EBIT),SEKm 1,286 1,018 -21Operatingprofit(EBIT)excl.itemsaffectingcomparability, SEK m 1,286 1,084 -16Operating margin, % 10.1 7.7 –Operatingmarginexcl.itemsaffectingcom-parability, % 10.1 8.2 –Profitafterfinancialitems,SEKm 1,250 986 -21Profitaftertax,SEKm 1,015 753 -26Profitaftertaxexcl.itemsaffectingcompa-rability, SEK m 1,015 808 -20Earnings per share before dilution, SEK 6.02 4.46 -26Earningspersharebeforedilutionexcl.items affecting comparability, SEK 6.02 4.79 -20Earnings per share after dilution, SEK 6.02 4.46 -26Earningspershareafterdilutionexcl.itemsaffecting comparability, SEK 6.02 4.79 -20Operatingcashflow,SEKm 706 599 -15
F I NANC I A L OV E RV I EW
4 2 NOB I A ANNUA L AND S U S TA I NA B I L I T Y R E PORT 2 018
theDutchprojectmarketforkitchens.Thepurchaseconsider-ation consisted of a remuneration of EUR 60 million on a cash and debt-free basis, and a variable remuneration of a maximum of EUR 5 million, conditional upon the development of the oper-ationsuntiltheendof2020.
The Swedish and Norwegian operations were negatively impacted by production disruptions at the plant in Tidaholm in thesecondandthirdquarters.Maintenancewasperformedandtheproblemswereresolved.
A cost saving programme was initiated in the fourth quarter in light of the increased uncertainty in our markets and to safe-guardourprofitability.Thesemeasuresincludestaffreductionsandtheclosureof16stores,primarilyintheUK.Thecostsav-ing programme is expected to generate annual savings of about SEK80million.
AnnikaVainiotookofficeasExecutiveVicePresidentandHeadofCommercialFinlandon1December.
Nine own stores that sell kitchens under the Norema brand wereconvertedtofranchisestoresduringtheyear.Theback-ground is Nobia’s assessment that Norema’s kitchen chain is not large enough to generate synergies and that the franchise model hasprovensuccessfulintheNorwegiankitchenmarket.
CONSOLIDATED NET SALES Net sales amounted to SEK 13,209 million (12,744) and were distributed as follows: Nordic region, SEK 6,705 million (6,516); UK region, SEK 5,597 million (5,710); and Central Europe region, SEK909million(521).Salestootherregionsarealsoincludedinnetsalesfortheregion.
The Group’s organic growth, meaning the change in net sales for comparable units and adjusted for currency effects, totalled a negative4percent(pos:2).OrganicgrowthintheNordicregionwasanegative1percent(pos:8).OrganicgrowthintheUKregion was a negative 7 per cent (neg: 2) and the Central Europe region’sorganicgrowthwas1percent(neg:5).
THE GROUP’S EARNINGS TheGroup’soperatingprofitincludingitemsaffectingcompara-bility regarding an additional pension expense of SEK 66 million amountedtoSEK1,018million(1,286).Theoperatingmarginincludingitemsaffectingcomparabilitywas7.7percent(10.1).
Operatingprofitexcludingitemsaffectingcomparabilityamounted to SEK 1,084 million (1,286) and the corresponding operatingmarginexcludingitemsaffectingcomparabilitywas8.2percent(10.1).Thedeclineinoperatingprofitwastheresultofdecreased sales, higher prices of materials, lower productivity and non-recurring costs primarily attributable to the cost sav-ingprogrammeinitiatedinthefourthquarter.Currencyeffectshad a negative impact of SEK 10 million (neg: 105) on operating profitexcludingitemsaffectingcomparability.
IntheNordicregion,operatingprofitexcludingitemsaffect-ingcomparabilityamountedtoSEK841million(963).Thedeclinein earnings was primarily due to lower sales volumes, higher prices of materials, production disruptions and non-recurring costs.CurrencyeffectshadanegativeimpactofSEK20million(0)onoperatingprofitexcludingitemsaffectingcomparability.
IntheUKregion,operatingprofitexcludingitemsaffect-ingcomparabilityamountedtoSEK323million(454).Thelowerearnings were mainly due to lower volumes, higher prices of materialsandnon-recurringcosts.Currencyeffectshadapos-itiveimpactofSEK10million(neg:105)onoperatingprofitexcludingitemsaffectingcomparability.
IntheCentralEuroperegion,operatingprofitexcludingitemsaffectingcomparabilityamountedtoSEK58million(12).The earnings improvement was mainly attributable to the acqui-sitionofBribus,butalsotheresultofproductivity.CurrencyeffectshadanimpactofSEK0million(0)onoperatingprofitexcludingitemsaffectingcomparability.
Group-wide items and eliminations amounted to an oper-ating loss excluding items affecting comparability of SEK 138 mil-lion(loss:143).FinancialitemsamountedtoanexpenseofSEK32million(expense:36).Netfinancialitemsincludedthenetofreturn on pension assets and interest expense for pension lia-bilities corresponding to an expense of SEK 28 million (expense: 34).NetinterestexpensetotalledSEK4million(expense:2).ProfitafterfinancialitemsamountedtoSEK986million(1,250).
TaxexpenseamountedtoSEK233million(256).Profitaftertax including items affecting comparability amounted to SEK 753 million(1,015)andprofitaftertaxexcludingitemsaffectingcom-parabilityamountedtoSEK808million(1,015).
Earnings per share for the year before and after dilution includingitemsaffectingcomparabilityamountedtoSEK4.46(6.02)andearningspersharefortheyearbeforeandafterdilu-tion excluding items affecting comparability amounted to SEK 4.79(6.02).
EARNINGS FROM DISCONTINUED OPERATIONSNoprofitfromdiscontinuedoperationswasrecognisedin2018.In2017,profitaftertaxfromdiscontinuedoperationsamountedto SEK 21 million and pertained to Poggenpohl, which was divestedon31January2017.
ITEMS AFFECTING COMPARABILITYNobia recognises items affecting comparability separately to dis-tinguishtheperformanceoftheunderlyingoperations.Itemsaffecting comparability refer to items that affect comparisons in so far as they do not recur with the same regularity as other items.Operatingprofitfor2018wasnegativelyimpactedbyanon-cash item affecting comparability of SEK 66 million attrib-utable to an additional pension cost in the fourth quarter as a resultofacourtrulingintheUKregardingdefined-benefitpen-sionplansinthe1990s.Noitemsaffectingcomparabilitywererecognisedfor2017.
INVESTMENTS, CASH FLOW AND FINANCIAL POSITIONInvestmentsinfixedassetsamountedtoSEK414million(319),ofwhichSEK338million(262)pertainedtotangiblefixedassetsandSEK76million(57)tointangibleassets.
OperatingcashflowamountedtoSEK599million(706),adverselyaffectedbylowerprofitgenerationandhigherinvest-ments compared with the preceding year, which were not offset byapositivechangeinworkingcapital.
The Group’s capital employed amounted to SEK 5,326 mil-lion(4,727)attheendoftheperiod.
On 31 December 2018, net debt amounted to SEK 1,266 million (77) and the increase for the year was mainly due to the acquisitionofBribus.Provisionsforpensions,whichareincludedinnetdebt,amountedtoSEK505million(567).Thedebt/equityratioatyear-endamountedto32percent(2).Shareholders’equity on the same date amounted to SEK 3,897 million (4,154) andtheequity/assetsratiowas50percent(58).
InearlyJuly2018,NobiaagreedonanewsyndicatedbankloanofSEK2,000million,validuntil2023,withtwobanks.
F I NANC I A L OV E RV I EW
NOB I A ANNUA L AND S U S TA I NA B I L I T Y R E PORT 2 018 4 3
About SEK 840 million of this bank loan had been utilised at year-end.
ACQUISITIONS AND DIVESTMENTS On13July2018,Nobiaacquired100percentofthesharesinBri-busHoldingB.V,aDutchkitchensupplierwithaleadingpositionintheDutchprojectmarketforkitchens.Bribussupplieskitchensto professional customers in the Netherlands, primarily to social housingprovidersandlarge-scalepropertyinvestors.Thekitch-ens are manufactured at a production facility in Dinxperlo, the Netherlands, and the offering also includes installation and appli-ances.In2017,BrisusgeneratedincomeofaboutEUR65millionandhadanoperatingmargininlinewithNobia’sfinancialtargets.
The purchase consideration consisted of a remuneration of EUR 60 million on a cash and debt-free basis, and a variable remuneration of a maximum of EUR 5 million, conditional upon thedevelopmentoftheoperationsuntiltheendof2020.BribushasbeenincludedinNobia’saccountssince1July2018.
Nodivestmentstookplacein2018.
SIGNIFICANT EVENTS AFTER THE END OF THE YEARNobia’s Nomination Committee announced on 12 February 2019 thatLilianFossumBiner,ChristinaStåhlandRicardWennerklinthad declined re-election and that the Nomination Committee proposes that the Board of Directors comprise seven members, entailingareductionoftwomembers.GeorgeAdams,HansEckerström,MortenFalkenberg,NoraFørisdalLarssen,JillLittle andStefanJacobsonareproposedforre-election.MarleneForsellisproposedasanewBoardmember.TheNominationCommittee also proposes that Hans Eckerström be re-elected ChairmanoftheBoard.
DanJosefsbergtookofficeasExecutiveVicePresidentandChiefStrategy,MarketingandCustomerExperienceOfficeron1March2019.
FUTURE OUTLOOKDemand for kitchens normally follows the same business cycle asotherconsumerdiscretionaryproducts.
The combination of macroeconomic uncertainty caused by Brexit and the slowdown in the Nordic new-build sector means that market conditions and demand in 2019 are considered chal-lenging.However,themarketoutlookforourmainmarketsintheCentralEuroperegionisdeemedslightlymorestable.
Nobiawillcontinuetofocusonincreasingefficiencyovertime,andtakinggreateradvantageoftheGroup’ssize,whilealsomakingsignificantinvestmentsinordertogenerateprofitablegrowth.
PERSONNEL In2018,theaveragenumberofemployeeswas6,178(6,178).Thenumberofemployeesatyear-endwas6,081(6,087).Bribus,whichwasacquiredin2018,had303employeesatyear-end.
ENVIRONMENT AND SUSTAINABILITYNobia conducts activities that require a permit under the Swed-ish Environmental Code through Nobia Production Sweden AB, which includes Nobia’s Swedish operations in production, logis-ticsandsourcing.In2018,theproductionfacilityinTidaholmaffected the external environment through mainly noise and emissions to air in conjunction with the surface treatment ofwoodenitems.TheCountyAdministrativeBoardofVästra
Götaland is the regulatory authority and decision-making bodyregardingpermitapplications.NobiaProductionSwedenABiscertifiedtotheISO14001environmentalmanagementstandard.
All of Nobia’s 14 production units, located in seven Euro-pean countries, satisfy the environmental requirements deter-mined by each country and 11 of these have been awarded ISO14001certification.
Nobia works conscientiously with sustainability through the implementationofaGroup-widesustainabilitystrategy.Nobia’skey sustainability-related performance indicators are presented onpages104–107.Nobia’sstatutorysustainabilityreportcanbefoundonpages30–40and104–107.
PRODUCT DEVELOPMENTAll product development for the Group-wide range is man-agedcentrally.Workonproducingnewproductsisfocusedonanumberofareasthatmeetspecificcustomerrequirements.During the course of the process, prototypes are developed thataretestedonconsumers.
PARENT COMPANY The Parent Company Nobia AB’s operations comprise Group-widefunctionsandtheownershipofsubsidiaries.ThelimitedliabilitycompanyisdomiciledinSwedenandtheheadofficeislocatedinStockholm.
TheParentCompany’sprofitafterfinancialitemsamountedto SEK 829 million (742) and mainly consisted of dividends from subsidiaries.
THE SHARE AND OWNERSHIP STRUCTURE The Nobia share has been listed on Nasdaq Stockholm since 2002.Nobia’ssharecapitalamountedtoSEK56,763,597(58,430,237) on 31 December 2018, divided between 170,293,458 (175,293,458) shares with a quotient value of SEK 0.33.Nobiahasonlyoneclassofshare.Eachshare,withtheexception of bought-back treasury shares, entitles the holder to one vote, and carries the same entitlement to the company’s capitalandprofits.
In2007and2008,Nobiaboughtbackatotalof8,162,300own shares at a value of SEK 468,056,934 under the authori-sation mandate granted by the 2007 and 2008 Annual Gen-eralMeetings.Theaimwastoenablewholeorpartialacquisi-tionfinancingthroughpaymentusingtreasuryshares,butalsotoadjust the company’s capital structure and thereby contribute to highershareholdervalue.
The 2018 Annual General Meeting authorised the Board to decide on the buy-back of up to 10 per cent of the total trea-sury shareholding and, for the period until the 2019 Annual General Meeting, to decide on the transfer of treasury shares for the purpose of delivering shares under the Performance SharePlanresolvedin2015.The2018AnnualGeneralMeet-ing also resolved to reduce Nobia’s share capital by withdrawing 5,000,000treasuryshares.
At the start of May, the Board decided to transfer 103,003 bought-backshares,comprising0.06percentoftheParentCompany’ share capital, based on the authorisation from the AnnualGeneralMeeting.Thisdecisiontoreducesharecapi-talwasthenexecutedon9July2018when5,000,000treasuryshareswerewithdrawn.Accordingly,thenumberofsharesinNobia declined from 175,293,458 to 170,293,458 and the share capitalwasreducedfromSEK58,430,237toSEK56,763,597.
F I NANC I A L OV E RV I EW
4 4 NOB I A ANNUA L AND S U S TA I NA B I L I T Y R E PORT 2 018
Noshareswereboughtbackduringtheyear.Attheendof2018, the number of treasury shares amounted to 1,606,568, correspondingto0.9percentofthetotalnumberofshares.These shares were acquired in 2007 and 2008 for a total amountofSEK92,112,918.
Atyear-end,thetenlargestownersheldabout65.9percentoftheshares.Thesinglelargestshareholder,Nordstjernan,represented22.7percentoftheshares.IfSkadeförsäkringheld10.7percentoftheshares,theFourthSwedishNationalPen-sionFund7.4percentandSwedbankRoburfunds6.2percent.
Nobia’s lenders have the option of terminating all loans if the controlofthecompanyweretobesignificantlyaltered.Ifanyoneparty, or jointly with other parties (under formal or informal forms) gains control of the company, the lenders are entitled to termi-natealloutstandingloansforpayment.Theterm“controlofthecompany” pertains to control of more than half of the total num-berofvotesorcapital,ortheacquisitionofdirectanddecisiveinflu-ence over the appointment of the Board of Directors or members ofGroupmanagement.Controlofthecompanyisalsodeemedtoarise if a party, alone or jointly with other parties, can exercise direct anddecisiveinfluenceoverthecompany’sfinancialandstrategicposition.Ifsuchasituationweretoarisewherebythecontrolofthecompanyweretobesignificantlyaltered,thelenderandNobiashallbeginnegotiationsthatshalllastforamaximumof30days.
The aim of these negotiations is to reach an agreement betweenthelendersandNobia.Ifanagreementisnotreached,the lender is entitled to terminate all outstanding loans for immediatepayment.
More information on the share and shareholders is pre-sentedonpages100–101.
REMUNERATION GUIDELINES AND OTHER EMPLOYMENT CONDITIONS FOR GROUP MANAGEMENT 2018The guidelines for 2018 essentially correspond with the pro-posedguidelinesfor2019,aspresentedbelow.
REMUNERATION COMMITTEEThe Board of Directors appoints a Remuneration Committee from withinitsranks.TheCommittee’stasksincludepreparingproposalswith respect to remuneration for the President, and to reach deci-sions on remuneration proposals for managers who report directly tothePresident.TheRemunerationCommitteeperformsannualfollow-ups and evaluations of the ongoing variable-remuneration programmes,andtheprogrammescompletedduringtheyear.TheRemuneration Committee also monitors and evaluates the appli-cation of the principles resolved by the Annual General Meeting for remuneration and other employment conditions for Group man-agement concerning remuneration structures and remuneration levels,andotherwiseconsidersneedsforchanges.
Following on from its evaluations, the Remuneration Com-mittee stated that remuneration to senior executives in 2018 conformed to the remuneration guidelines resolved at the 2018 AnnualGeneralMeeting.IntheopinionoftheRemunerationCommittee, the guidelines were appropriate and the application ofthemwascorrect.
Nobia has implemented long-term performance-based remuneration plans, following a resolution at each Annual Gen-eral Meeting since 2005 in order to link employee remunera-tion to the company’s future earnings and value trend and thus rewardbothshareholdersandtherelevantemployees.Along-
term remuneration plan is also expected to assist the company inrecruitingandretainingseniorexecutives.
The Remuneration Committee’s evaluation shows that the conditions established for the Performance Share Plans are deemed appropriate and relevant and, in the Remuneration Committee’s opinion, there is reason to continue with a long-termshare-basedremunerationscheme.
PROPOSAL ON REMUNERATION GUIDELINES AND OTHER EMPLOYMENT CONDITIONS FOR GROUP MANAGEMENT 2019The Board of Directors of Nobia AB proposes that the 2019 Annual General Meeting decide on the following guidelines for determining remuneration and employment conditions for the PresidentandothermembersofGroupmanagement.Groupmanagement, including the President, currently comprises 12 individuals.
Basing its opinion on, for example, the follow-up and evalu-ation performed by the Remuneration Committee, the Board believes that the proposed proposal on remuneration guide-lines and other employment conditions for Group management –whichessentiallyconformstothoseguidelinesadoptedbythe2018AnnualGeneralMeeting–representsanappropriatebal-ancebetweenfixedcashsalary,variablecashsalary,long-termshare-based remuneration, pension conditions and other bene-fits.Nobia’ssalarypolicystipulatesthattotalremunerationistocorrespondtomarketlevels.Acontinuouspositionevaluationiscarriedouttoensuremarketlevelsineachcountry.
MembersofGroupmanagementreceivebothafixedandavariablesalaryportion.Thefundamentalprincipleisthatthevariable salary portion may amount to a maximum of 40 per centoffixedannualsalary.Theexceptiontothisprincipleis the President, whose variable salary portion may amount to a maximumof65percentoffixedannualsalary.Exceptionsmayalso be made for senior executives following decisions by the Board.Thevariablesalaryportionisnormallydividedbetweenseveral targets, such as the Group’s earnings, earnings in the business unit for which the manager is responsible and individual/quantitativetargets.Thevariableportionisbasedonanearningperiodofoneyear.ThetargetsforthePresidentaredeterminedbytheBoard.Thetargetsfortheotherseniorexecutivesareestablished by the President following recommendations by the Board’sRemunerationCommittee.
Intheeventofamaximumoutcome,whichpresupposesthatallbonus-relatedtargetsarefulfilled,thevariablesalarycosts for Group management are estimated to be approxi-matelySEK16,600,000(excludingsocialsecuritycontributions).The calculation is based on the current composition of Group management and does not take into account any decreases in the maximum variable salary portion associated with participa-tioninthelong-termperformanceshareplan.
Members of Group management employed in Sweden are entitledtoapensionundertheITPsystemorequivalent.Theageofretirementis65.InadditiontotheITPplan,followingaresolution by the Board, members of Group management are entitled to an increased occupational pension premium on salary portionsamountingtomorethan30basicamounts.
Employment contracts for Group management include pro-visions regulating remuneration and termination of employ-ment.Accordingtothesecontracts,employmentmayordinarilybe terminated upon the employee’s request with a six-month
F I NANC I A L OV E RV I EW
NOB I A ANNUA L AND S U S TA I NA B I L I T Y R E PORT 2 018 4 5
period of notice and at the company’s request with a 12-month periodofnotice.
A resolution was made at the 2012, 2013, 2014 and 2015 Annual General Meetings to establish a long-term remunera-tionschemebasedonmatchingandperformanceshares.Theschemes, which encompassed some 100 individuals comprising senior executives and senior managers, were based on the par-ticipants investing in Nobia shares that were “locked into” the plan.EachNobiashareinvestedinundertheframeworkoftheplan entitled the participant, following a vesting period of about threeyearsandprovidedthatcertainconditionswerefulfilled,to allotment (for no consideration) of matching and perfor-mancesharesinNobia.Theconditionsarelinkedtothepartici-pant’s continued employment and ownership of invested shares, andtofulfilmentofafinancialperformancetarget.
The 2016 Annual General Meeting resolved to introduce a new long-term remuneration scheme directed to the same tar-get group and with largely the same structure as the preced-ing year’s programme, though without a requirement for invest-ment of own shares and without the possibility of receiving “matchingshares.”TheminimumleveladoptedbytheBoardfor allotment of shares under the Performance Share Plan 2016 was accumulated earnings per share, excluding items affecting comparabilityforthe2016and2017financialyears,ofSEK11.75.ThemaximumlevelwassetatSEK13.75.Sincetheaccumulatedearnings per share excluding items affecting comparability for theperiodamountedtoSEK11.69,theBoard’sminimumtargetfigureforallotmentwasnotachievedandnoallotmentofsharesunderthePerformanceSharePlan2016willtakeplace.
At the 2017 and 2018 Annual General Meetings, decisions were made on long-term remuneration schemes with the same structure as the remuneration scheme adopted at the 2016 AnnualGeneralMeeting.Oneoftherequirementsforallot-mentofsharesundertheprogramsismeetingafinancialperfor-mance target linked to accumulated earnings per share for Nobia duringthe2017–2018and2018-2019financialyears.Forthe2017Plan, the Board adopted a minimum level for allotment of shares related to accumulated earnings per share, excluding items affect-ingcomparabilityforthe2017and2018financialyears,ofSEK12.00.ThemaximumlevelwassetatSEK13.75.Sincetheaccu-mulated earnings per share excluding items affecting comparabil-ityfortheperiodamountedtoSEK11.11,theBoard’sminimumtargetfigureforallotmentwasnotachievedandnoallotmentofsharesunderthePerformanceSharePlan2017willtakeplace.
The Board has again proposed a long-term performance shareplantothe2019AnnualGeneralMeeting.ThePerfor-mance Share Plan 2019 mostly has the same structure as the remuneration scheme adopted at the 2018 Annual General Meeting.PerformanceSharePlan2019comprisesapproximately100 employees consisting of senior executives and senior man-agerswithintheNobiaGroup.Participationintheplanrequiresanemployee’sprivateinvestmentinNobiashares.Attheendof the vesting period, the participants will be allotted shares in Nobia free of charge, provided that certain conditions are ful-filled.Theallotmentofsharesrequiresthattheperformancetargetsrelatedtoaverageoperatingprofit(EBIT)andtotalshareholder return (TSR) on the company’s shares have been achieved.However,iftheEBITperformancetargethasbeenachieved but the TSR target on the Nobia share is negative, no allotmentwilltakeplace.
The share rights are allocated free of charge and to be enti-tled to receive shares under the share rights, it is required, with certain exemptions, that the participant remains employed withintheNobiaGroup.Theparticipantsarenotentitledtotransfer, pledge or dispose of the share rights or exercise any shareholders’ rights regarding the share rights during the Vest-ingPeriod.IfNobiaissuesadividendtoshareholders,thepartic-ipants of the Performance Share Plan 2019 will be compensated by increasing the number of shares that each share right carries entitlementto.ThesesharerightsaredividedintoSeriesAandSeries B according to the various performance targets under the PerformanceSharePlan2019.Halfofeachparticipant’sallot-mentofsharerightsreferstoSeriesA,andhalftoSeriesB.The number of share rights carrying entitlement to allotment dependsonfulfilmentoftheperformancetargetsthatapply foreachseriesofshare.TheBoardsetsaminimumlevelandamaximumlevelforeachperformancetarget.Theallotmentofshare rights for Series A requires that target levels are achieved foraverageoperatingprofitinthe2019-2021financialyears.Theallotment of share rights for Series B requires that target levels during the period are achieved for annual average total share-holderreturn(TSR)ontheNobiashare.
For the President of the company, each Saving Share car-riesentitlementtoamaximumofsevensharerights.Forothermembers of Group management, each Saving Share entitles the holdertoamaximumofsixsharerights.Forotherseniorexec-utives and managers, each Saving Share entitles the holder to maximumoffoursharerights.AllotmentofNobiasharesshallnormally take place within two weeks of the announcement of Nobia’sinterimreportforthefirstquarterof2022.
CostsarerecognisedasemployeebenefitsinprofitorlossoverthevestingperiodinaccordancewithIFRS2Share-basedPayment.SocialsecuritycontributionswillbeexpensedinprofitorlossinaccordancewithUFR7overthevestingperiod.Theamount of these costs will be calculated based on Nobia’s share-pricetrendoverthevestingperiodandallotmentofsharerights.For more information about the proposed performance share plan, including estimated total costs for the programme, refer to theBoard’sseparateproposaltothiseffect.
PROPOSED APPROPRIATION OF PROFITSThefollowingprofitsintheParentCompanyareatthedisposi-tion of the Annual General Meeting:Share premium reserve 52,225,486Unappropriatedprofitbroughtforward 586,241,165Netprofitfortheyear 817,302,342Total SEK 1,455,768,993
TheBoardofDirectorsproposesthatallprofitsatthedisposi-tion of the Annual General Meeting be appropriated as follows:
StandarddividendofSEK4.00per share to be paid to shareholders 674,747,560To be carried forward 781,021,433Total SEK 1,455,768,993
TheBoardproposesadividendofSEK4.00pershare(7.00)forthe2018financialyear.TherecorddatetobeentitledtoreceiveadividendisproposedasMonday,6May2019.IftheAnnualGeneral Meeting resolves in accordance with the proposal, the dividendisexpectedtobepaidonThursday,9May2019.
4 6 NOB I A ANNUA L AND S U S TA I NA B I L I T Y R E PORT 2 018
R I S K S AND R I S K MANAG EM ENT
RISKS AND RISK MANAGEMENT
Nobiaisexposedtobothcommercialandfinancialrisks.Commercialriskscanbedivided into strategic, business development-related, operating, sustainability-related, politicalandlegalrisksaswellasinformationandITrisks.Financialrisksareattributable
tocurrencies,interestrates,liquidity,borrowingandcreditgranting,financialinstrumentsandpensions.
Allbusinessoperationsareassociatedwithrisks.Risksthatarewell-managed can create opportunities, whereas risks that are notmanagedcorrectlymayleadtodamageandlosses.Theaimof Nobia’s risk management is to create awareness of risks and consequently limit, control and manage them, while safeguarding businessopportunitiesandstrengtheningprofitability.
IdentifiedmaterialsrisksaremanagedonanongoingbasisatalllevelsinNobiaandinstrategicplanning.TheBoardofDirec-tors is responsible to the shareholders for the company’s risk management.CompanymanagementregularlyreportsonriskissuestotheBoard.
STRATEGIC RISKS
Corporate-governance and policy risksCorporate-governance and policy risks are managed by Nobia continuouslydevelopingtheGroup’sinternalcontrol.
The internal dissemination of appropriate information is ensured throughthecompany’smanagementsystemsandprocesses.Amore detailed description is provided in the Group management sectionoftheCorporateGovernanceReportonpage98.
BUSINESS -DEVELOPMENT RISKSRisks associated with business development, such as acquisitions and major structural changes, are managed by the Group’s M&A departmentandcentralprogrammeoffice,andbyspecificproj-ectgroupsorganisedforthevariousprojects.Continuousfol-low-ups are carried out compared with plans and expected out-comes.Morelong-termrisksareinitiallyaddressedbytheBoardinitsGroupstrategyplanning.Inconjunctionwiththis,Nobia’sbusiness development is evaluated and discussed based on externalandinternalconsiderations.
OPERATING RISKS
Market and competitionNobia operates in markets exposed to competition and mature markets, which means that underlying demand in normal mar-ketcircumstancesisrelativelystable.Thecompany’scyclicalnature does not deviate from that of other companies in the industry.Nobiahasastructuredandproactivemethodforfol-lowingdemandfluctuations.Robustmeasuresandcost-sav-ing programmes for adjusting capacity have proven that Nobia can adjust its cost level when demand for the Group’s products
declines.Nobiaworkscontinuouslytotransferpriceincreasesonmaterialstoconsumerswherepossible.
Demand is deemed to have gradually slowed in the Nordic andCentralEuroperegionsin2018.Themarketoutlookforthenew-build segment in the Nordic market has weakened com-paredwiththeprecedingyear.IntheUK,whichaccountsforabout 42 per cent (45) of the Group’s total sales, the macro-economic uncertainty resulting from Brexit had a negative impactonthekitchenmarket.Nobiahasmadepreparationsinthe event of a no-deal Brexit, including building up a safety stock ofcomponentsandfronts.Nobiaiscontinuingtocapitaliseonsynergies and economies of scale through harmonisation of the range,co-ordinationofproductionandmoreefficientsourcing.
DemandforNobia’sproductsisinfluencedbytrendsinthehousing market, whereby prices, the number of transactions and accesstofinancingarekeyfactors.Four-fifthsoftheEuropeankitchen market is estimated to comprise purchases for renova-tion,andone-fifthfornewbuilds.Nobia’sstrategyisbasedonlarge-scale product supply, product development and the utilisa-tion of the positioning of the Group’s strong brands in the vari-ousmarketsandsaleschannels.Nobia’svariousofferingsarealsobased on the strategy of providing added value to customers in theformofcompletesolutionswithaccessoriesandinstallation.
CustomersKitchens to end customers are sold through 248 own stores and anetworkoffranchisestores,aswellasDIYstores,furniturechainsandotherretailers.Conductingsalesthroughownandfranchisestoresisadeliberatestrategytoachievegreaterinflu-ence over the kitchen offering to end customers, which contrib-utestobetterco-ordinationoftheGroup’ssupplychain.Ariskwithfranchisesisthatretailersareunabletofulfiltheircontrac-tualcommitments,whichmayhaveanegativeeffectonsales.However,thefranchisesolutioninvolveslowerfixedcosts.
In2018,nineNoremastoreswereconvertedtofranchisestoresandoneNoremastorewasclosed.AllNoremastoreswerefranchisestoresat31December2018.Thebackgroundto the decision to convert own stores under the Norema brand to franchise stores is that this kitchen chain is not deemed large enough to generate synergies, and that the franchise model has provensuccessfulintheNorwegiankitchenmarket.
Sales to professional customers are conducted with regional and local construction companies via a specialised sales organi-
NOB I A ANNUA L AND S U S TA I NA B I L I T Y R E PORT 2 018 4 7
R I S K S AND R I S K MANAG EM ENT
sationordirectlythroughthestorenetwork.Concentratingonthese large separate customers entails an elevated risk of losing salesifalargecustomerislostaswellasincreasedcreditrisk.
Supply chainNobia’s cost structure in 2018 comprised about 61 per cent vari-able costs (raw materials, components, accessories), about 29 per cent semi-variable costs (personnel costs, marketing and maintenance)andabout10percentfixedcosts(rents,deprecia-tion,insurance).Thedivisionofcostsisrelativelyequalbetweenthe main markets, except that the UK region has a slightly higher percentageoffixedcostsduetoitsextensivestorenetworks.
Nobia’s proprietary manufacturing mainly comprises the production and installation of cabinets and doors, together with purchasedcomponents.
In2018,NobiapurchasedmaterialsandcomponentsvaluedataboutSEK5.4billion,ofwhichsome21percentpertainedtoraw materials (such as chipboard and packaging materials), about 53 per cent to components (such as handles, worktops and hinges) and about 26 per cent to goods for resale (such as appli-ances).TheunderlyingrawmaterialstowhichtheGroupispri-marilyexposedarewood,steel,aluminiumandplastics.Costvariations can be caused by changes in the prices of raw materi-alsintheglobalmarketorsuppliers’abilitytodeliver.
Nobia’s sourcing organisation works closely with its suppli-erstoensureefficientflowsofmaterials.In2018,marketpricesincreased for board material and components, as well as other raw materials, such as metals, oil, wood products and packaging materials.Demandforboardmaterialisexpectedtoincreasefor reasons including higher demand from the housing construc-tion industry, and weak competition and limited manufacturing capacityamongsuppliers.TheGroup’ssourcingandproductionfunctionsarecontinuouslyevaluatedtoreduceproductcosts.
Property risks in the form of loss of production, for exam-ple,intheeventofafireatmanufacturingunits,areminimisedby Nobia conducting annual technical risk inspections jointly withtheGroup’sinsurersandtheriskconsultingfirmAONthatreportsondeviationsfromNobia’s“StandardforLoss-Preven-tionMeasures.”Preventivemeasuresarecontinuouslyimple-mentedtoreducetheriskofdisruptionsintheoperations.
Strategy and restructuringNobia’sabilitytoincreaseprofitabilityandreturnsforshare-holders is heavily dependent on the Group’s success in develop-inginnovativeproducts,maintainingcost-efficientmanufacturingandcapitalisingonsynergies.Managingrestructuringmeasuresis a key factor in maintaining and enhancing Nobia’s competi-tiveness.In2018,theGroup’sbrandportfolio,innovation,product-range development, production and sourcing continued to be co-ordinated.In2018,Nobiacontinuedtoinvestedindigitalaids, such as drawing tools and e-commerce services that allow customerstobothdrawandpurchasetheirkitchenonline.In2017, Nobia launched a new store concept aimed at increasing customer participation, improving the customer experience and enhancingsalesefficiency.Thisventurecontinuedin2018.Thestrategicdirectionisdescribedinmoredetailonpages14–17.
The implementation of these plans entails operating risks, whichareaddressedeverydayintheongoingchangeprocess.Restructuring is a complex process that requires the manage-mentofaseriesofdifferentactivitiesandrisks.
Human capital risksNobia needs to attract and retain skilled and motivated employ-ees to conduct its business operations with high long-term prof-itabilityandendeavourstobeanattractiveemployer.Toensureavailability of and skills development for motivated employees, manager sourcing and managerial development is administered byacentralunitatNobia.Foramoredetaileddescription,refertooursustainabilityreportonpages39-40.
SUSTAINABILITY-RELATED CHALLENGES AND OPPORTUNITIESSustainability risks are related to all four areas of the UN Global Compact: environment, human rights, labour and anti-corrup-tion.Risksrelatedtoclimatechangeandglobalwarming,therisk of shortcoming in the controls of subcontractors and suppli-ers, work-related accidents or serious environmental incidents at Nobia’s workplaces, and unforeseen increased customer demand for sustainable products and production processes are relevantrisksforNobia.Managingsustainabilityrisksisaninte-grated part of existing central processes and a parameter in the centralriskanalysis.Foramoredetaileddescription,refertooursustainabilityreportonpages30-40and104-105.
POLITICAL AND LEGAL RISKSNobia operates in seven countries and is thus affected by country- specificrulesandregulationsbetweencountries.Theseincludegeneralregulationsontradebarriers,taxesandfinancialreporting, butalsomorespecificrules,suchassubsidiesfornewbuildsand/or renovation or changes to the taxation of residential properties,mayinfluencedemand.Taxdeductionsonlabour for home renovations, for example, have had a positive effect ondemandinseveralNordiccountries.AllNobiaunitsareresponsible within their individual area to monitor and evaluate changesinthebusinessworldandchangestolegislation.
INFORMATION AND IT RISKSNobiaisdependentonITsystemsinitsdailyoperations.Disrup-tions or errors in critical systems may have a direct impact on production.Incorrecthandlingoffinancialsystemscouldimpactthereportingofthecompany’sresults.Riskslinkedtocybersecurity have generally increased in importance and could have a significantimpactonouroperations.TheGeneralDataProtec-tion Regulation (GDPR) sets strict requirements on how com-paniesprocesspersonaldata.Non-compliancewiththeRegula-tioncouldresultinhighfines.
NobiahasestablishedanITmodelthatincludesgovernance,standardisedITprocessesandaninformationsecurityorganisa-tion.StandardisedprocessesareinplaceforimplementingandchangingsystemsandITservices,aswellasthedailyoperations.Nobia’sITsystemlandscapeisbasedonwell-knownproducts,suchasSAP.
FINANCIAL RISKSInadditiontostrategicandoperatingrisks,Nobiaisexposedtovariousfinancialrisks.Thesearemainlyattributabletocurren-cies,interestrates,liquidity,borrowingandcreditgranting,finan-cialinstrumentsandpensions.Alloftheserisksaremanagedinaccordancewiththefinancepolicy,whichhasbeenadoptedbytheBoard.Foramoredetaileddescription,refertoNote2Financialrisksonpages67-69.
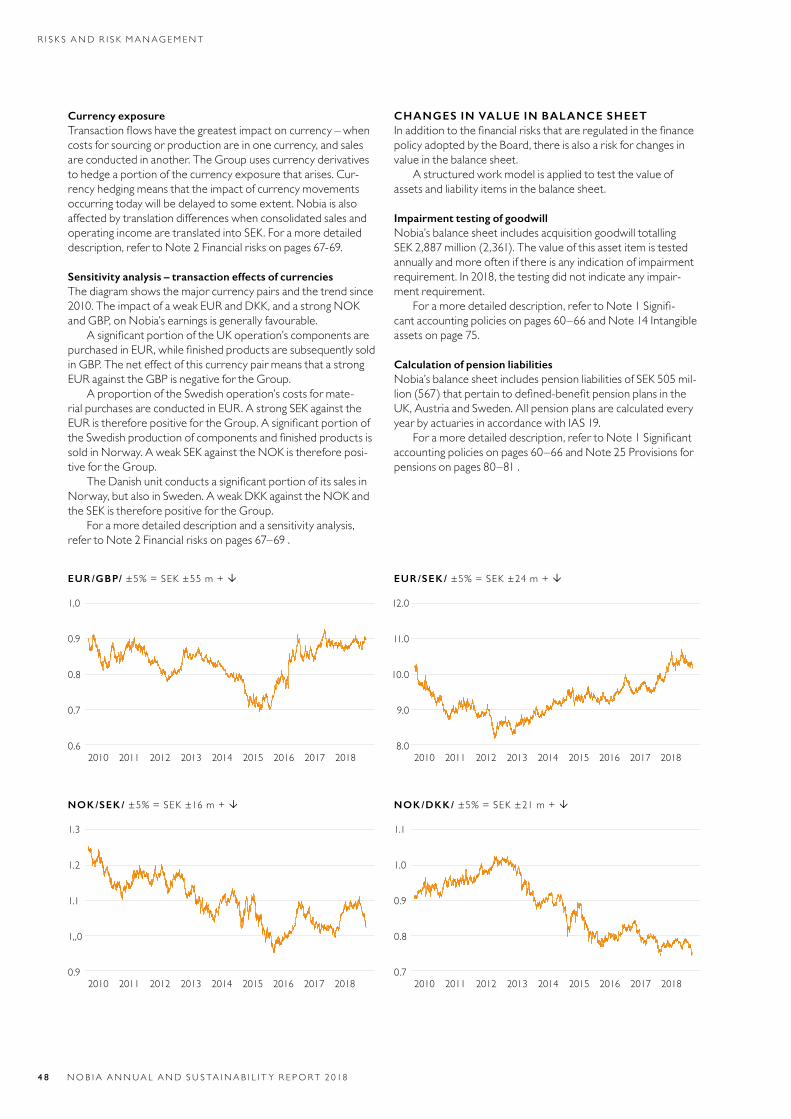
4 8 NOB I A ANNUA L AND S U S TA I NA B I L I T Y R E PORT 2 018
R I S K S AND R I S K MANAG EM ENT
Currency exposureTransactionflowshavethegreatestimpactoncurrency–whencosts for sourcing or production are in one currency, and sales areconductedinanother.TheGroupusescurrencyderivativestohedgeaportionofthecurrencyexposurethatarises.Cur-rency hedging means that the impact of currency movements occurringtodaywillbedelayedtosomeextent.Nobiaisalsoaffected by translation differences when consolidated sales and operatingincomearetranslatedintoSEK.Foramoredetaileddescription,refertoNote2Financialrisksonpages67-69.
Sensitivity analysis – transaction effects of currenciesThe diagram shows the major currency pairs and the trend since 2010.TheimpactofaweakEURandDKK,andastrongNOKandGBP,onNobia’searningsisgenerallyfavourable.
AsignificantportionoftheUKoperation’scomponentsarepurchasedinEUR,whilefinishedproductsaresubsequentlysoldinGBP.TheneteffectofthiscurrencypairmeansthatastrongEURagainsttheGBPisnegativefortheGroup.
A proportion of the Swedish operation’s costs for mate-rialpurchasesareconductedinEUR.AstrongSEKagainsttheEURisthereforepositivefortheGroup.AsignificantportionoftheSwedishproductionofcomponentsandfinishedproductsissoldinNorway.AweakSEKagainsttheNOKisthereforeposi-tivefortheGroup.
TheDanishunitconductsasignificantportionofitssalesinNorway,butalsoinSweden.AweakDKKagainsttheNOKandtheSEKisthereforepositivefortheGroup.
For a more detailed description and a sensitivity analysis, refertoNote2Financialrisksonpages67–69.
CHANGES IN VALUE IN BALANCE SHEET Inadditiontothefinancialrisksthatareregulatedinthefinancepolicy adopted by the Board, there is also a risk for changes in valueinthebalancesheet.
A structured work model is applied to test the value of assetsandliabilityitemsinthebalancesheet.
Impairment testing of goodwillNobia’s balance sheet includes acquisition goodwill totalling SEK2,887million(2,361).Thevalueofthisassetitemistestedannually and more often if there is any indication of impairment requirement.In2018,thetestingdidnotindicateanyimpair-mentrequirement.
Foramoredetaileddescription,refertoNote1Signifi-cantaccountingpoliciesonpages60–66andNote14Intangibleassetsonpage75.
Calculation of pension liabilitiesNobia’s balance sheet includes pension liabilities of SEK 505 mil-lion(567)thatpertaintodefined-benefitpensionplansintheUK,AustriaandSweden.AllpensionplansarecalculatedeveryyearbyactuariesinaccordancewithIAS19.
Foramoredetaileddescription,refertoNote1Significantaccountingpoliciesonpages60–66andNote25Provisionsforpensionsonpages80–81.
EUR/GBP/ ±5% = SEK ±55 m +
201820172016201520142013201220112010
1.0
0.9
0.8
0.7
0.6
NOK /SEK / ±5% = SEK ±16 m +
201820172016201520142013201220112010
1.3
1.2
1.1
1,,0
0.9
EUR/SEK / ±5% = SEK ±24 m +
201820172016201520142013201220112010
12.0
11.0
10.0
9.0
8.0
NOK /DKK / ±5% = SEK ±21 m +
201820172016201520142013201220112010
1.1
1.0
0.9
0.8
0.7
[UPPDATER AS]
FINANCIAL STATEMENTSConsolidated income statement 50Consolidated statement of comprehensive income 51Comments and analysis of income statement 52Consolidated balance sheet 54Comments and analysis of balance sheet 55Change in consolidated shareholders’ equity 56Consolidatedcash-flowstatementandcomments 57Parent Company 58Notes 60Note1 Significantaccountingpolicies 60Note 2 Financial risks 67Note 3 Operating segments and Net sales 69Note4 Costsforemployeebenefitsandremuneration
to senior executives 70Note 5 Average number of employees 73Note 6 Remuneration to auditors 73Note 7 Depreciation/amortisation and impairment by activity 73Note 8 Other operating income 73Note 9 Other operating expenses 73Note10 Specificationbytypeofcost 73Note 11 Operating leases 74Note 12 Financial income and expenses 74Note13 Taxonnetprofitfortheyear 74
Note14 Intangibleassets 75Note15 Tangiblefixedassets 76Note16 Financialfixedassets 76Note 17 Shares and participations in subsidiaries 77Note 18 Derivative instruments 78Note 19 Prepaid expenses and accrued income 78Note 20 Cash and cash equivalents 78Note 21 Share capital 78Note 22 Reserves in shareholders’ equity 78Note 23 Earnings per share 79Note24 Appropriationofcompany’sprofitorloss 79Note 25 Provisions for pensions 80Note 26 Deferred tax 82Note 27 Other provisions 83Note28 Liabilitiestocreditinstitutions 83Note 29 Accrued expenses and deferred income 83Note 30 Financial assets and liabilities 83Note 31 Pledged assets, contingent liabilities and commitments 85Note 32 Discontinued operations 85Note 33 Company acquisitions 85Note 34 Related-party transactions 86Note35 Specificationsforstatementofcashflows 86Note 36 Events after the closing date 87
NOB I A ANNUA L AND S U S TA I NA B I L I T Y R E PORT 2 018 4 9
F I NANC I A L S TAT EM ENT S
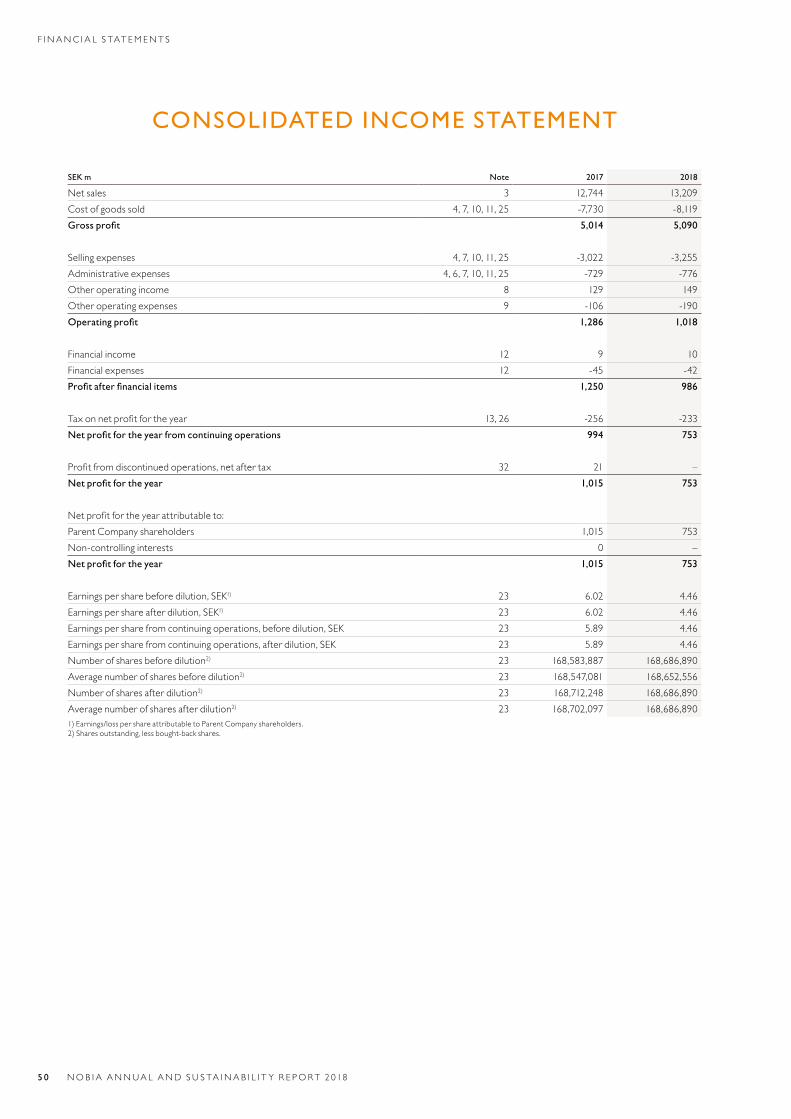
CONSOLIDATED INCOME STATEMENT
SEK m Note 2017 2018
Net sales 3 12,744 13,209Cost of goods sold 4, 7, 10, 11, 25 -7,730 -8,119Gross profit 5,014 5,090
Selling expenses 4, 7, 10, 11, 25 -3,022 -3,255Administrative expenses 4, 6, 7, 10, 11, 25 -729 -776Other operating income 8 129 149Other operating expenses 9 -106 -190Operating profit 1,286 1,018
Financial income 12 9 10Financial expenses 12 -45 -42Profit after financial items 1,250 986
Taxonnetprofitfortheyear 13, 26 -256 -233Net profit for the year from continuing operations 994 753
Profitfromdiscontinuedoperations,netaftertax 32 21 –Net profit for the year 1,015 753
Netprofitfortheyearattributableto:Parent Company shareholders 1,015 753Non-controlling interests 0 –Net profit for the year 1,015 753
Earnings per share before dilution, SEK1) 23 6.02 4.46Earnings per share after dilution, SEK1) 23 6.02 4.46Earnings per share from continuing operations, before dilution, SEK 23 5.89 4.46Earnings per share from continuing operations, after dilution, SEK 23 5.89 4.46Number of shares before dilution2) 23 168,583,887 168,686,890Average number of shares before dilution2) 23 168,547,081 168,652,556Number of shares after dilution2) 23 168,712,248 168,686,890Average number of shares after dilution2) 23 168,702,097 168,686,8901)Earnings/losspershareattributabletoParentCompanyshareholders.2)Sharesoutstanding,lessbought-backshares.
5 0 NOB I A ANNUA L AND S U S TA I NA B I L I T Y R E PORT 2 018
F I NANC I A L S TAT EM ENT S
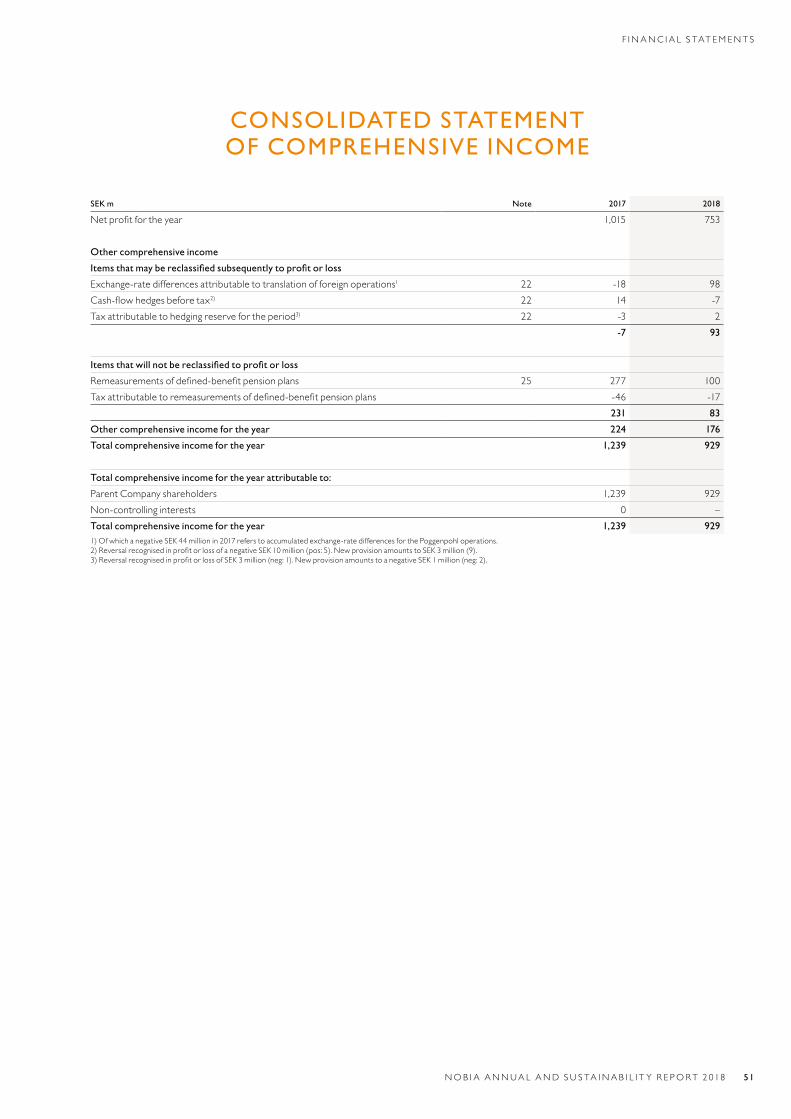
CONSOLIDATED STATEMENT OF COMPREHENSIVE INCOME
SEK m Note 2017 2018
Netprofitfortheyear 1,015 753
Other comprehensive income
Items that may be reclassified subsequently to profit or loss
Exchange-rate differences attributable to translation of foreign operations1 22 -18 98Cash-flowhedgesbeforetax2) 22 14 -7Tax attributable to hedging reserve for the period3) 22 -3 2
-7 93
Items that will not be reclassified to profit or loss
Remeasurementsofdefined-benefitpensionplans 25 277 100Taxattributabletoremeasurementsofdefined-benefitpensionplans -46 -17
231 83
Other comprehensive income for the year 224 176
Total comprehensive income for the year 1,239 929
Total comprehensive income for the year attributable to:
Parent Company shareholders 1,239 929Non-controlling interests 0 –Total comprehensive income for the year 1,239 9291)OfwhichanegativeSEK44millionin2017referstoaccumulatedexchange-ratedifferencesforthePoggenpohloperations.2)ReversalrecognisedinprofitorlossofanegativeSEK10million(pos:5).NewprovisionamountstoSEK3million(9).3)ReversalrecognisedinprofitorlossofSEK3million(neg:1).NewprovisionamountstoanegativeSEK1million(neg:2).
NO B I A ANNUA L AND S U S TA I NA B I L I T Y R E PORT 2 018 51
F I NANC I A L S TAT EM ENT S
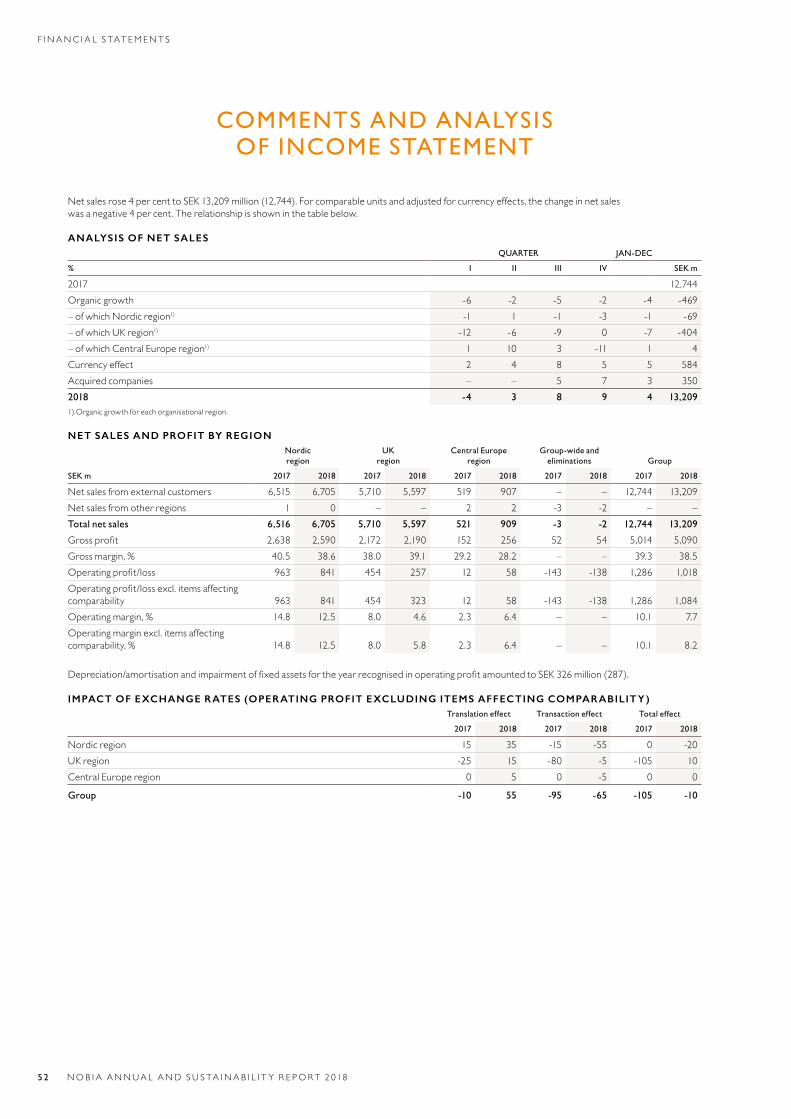
COMMENTS AND ANALYSIS OF INCOME STATEMENT
Netsalesrose4percenttoSEK13,209million(12,744).Forcomparableunitsandadjustedforcurrencyeffects,thechangeinnetsaleswasanegative4percent.Therelationshipisshowninthetablebelow.
ANALYSIS OF NET SALES QUARTER JAN-DEC
% I II III IV SEK m
2017 12,744Organic growth -6 -2 -5 -2 -4 -469–ofwhichNordicregion1) -1 1 -1 -3 -1 -69–ofwhichUKregion1) -12 -6 -9 0 -7 -404–ofwhichCentralEuroperegion1) 1 10 3 -11 1 4Currency effect 2 4 8 5 5 584Acquired companies – – 5 7 3 3502018 -4 3 8 9 4 13,2091)Organicgrowthforeachorganisationalregion.
NET SALES AND PROFIT BY REGIONNordic region
UK region
Central Europe region
Group-wide and eliminations Group
SEK m 2017 2018 2017 2018 2017 2018 2017 2018 2017 2018
Net sales from external customers 6,515 6,705 5,710 5,597 519 907 – – 12,744 13,209Net sales from other regions 1 0 – – 2 2 -3 -2 – –Total net sales 6,516 6,705 5,710 5,597 521 909 -3 -2 12,744 13,209
Grossprofit 2,638 2,590 2,172 2,190 152 256 52 54 5,014 5,090Gross margin, % 40.5 38.6 38.0 39.1 29.2 28.2 – – 39.3 38.5Operatingprofit/loss 963 841 454 257 12 58 -143 -138 1,286 1,018Operatingprofit/lossexcl.itemsaffectingcomparability 963 841 454 323 12 58 -143 -138 1,286 1,084Operating margin, % 14.8 12.5 8.0 4.6 2.3 6.4 – – 10.1 7.7Operatingmarginexcl.itemsaffectingcomparability, % 14.8 12.5 8.0 5.8 2.3 6.4 – – 10.1 8.2
Depreciation/amortisationandimpairmentoffixedassetsfortheyearrecognisedinoperatingprofitamountedtoSEK326million(287).
IMPACT OF EXCHANGE RATES (OPERATING PROFIT EXCLUDING ITEMS AFFECTING COMPARABILITY) Translation effect Transaction effect Total effect
2017 2018 2017 2018 2017 2018
Nordic region 15 35 -15 -55 0 -20UK region -25 15 -80 -5 -105 10Central Europe region 0 5 0 -5 0 0
Group -10 55 -95 -65 -105 -10
5 2 NOB I A ANNUA L AND S U S TA I NA B I L I T Y R E PORT 2 018
F I NANC I A L S TAT EM ENT S
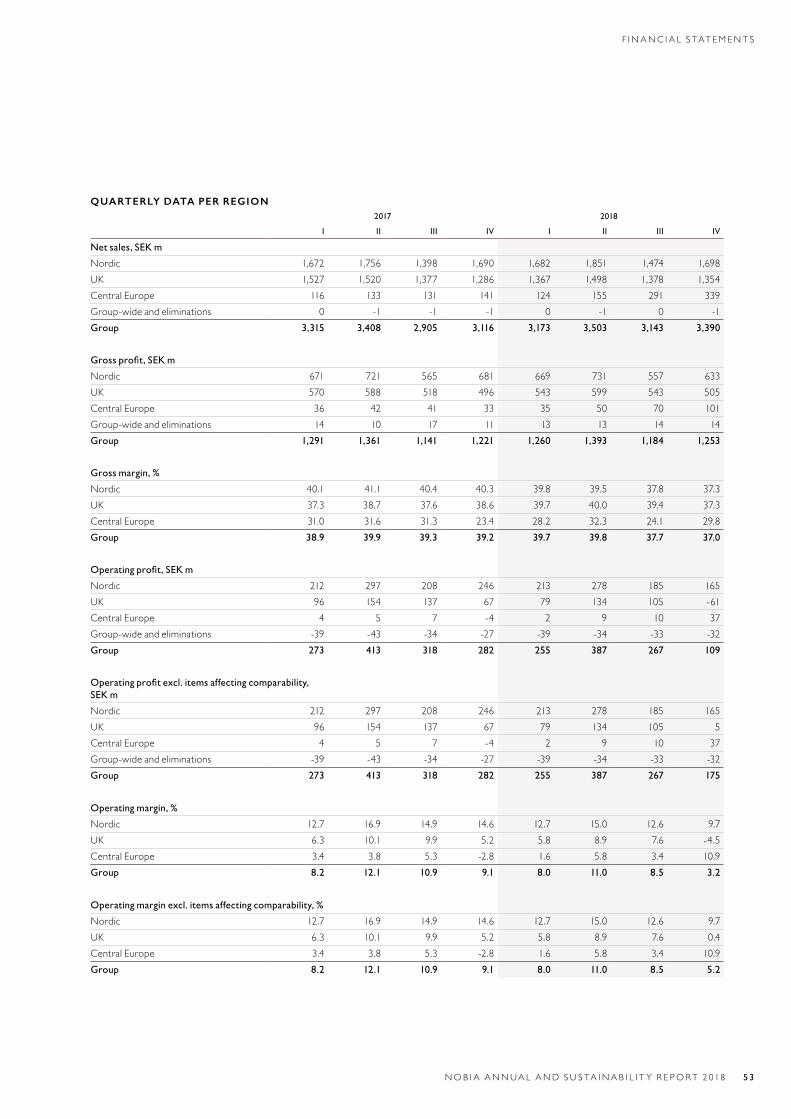
QUARTERLY DATA PER REGION2017 2018
I II III IV I II III IV
Net sales, SEK m
Nordic 1,672 1,756 1,398 1,690 1,682 1,851 1,474 1,698UK 1,527 1,520 1,377 1,286 1,367 1,498 1,378 1,354Central Europe 116 133 131 141 124 155 291 339Group-wide and eliminations 0 -1 -1 -1 0 -1 0 -1Group 3,315 3,408 2,905 3,116 3,173 3,503 3,143 3,390
Gross profit, SEK m
Nordic 671 721 565 681 669 731 557 633UK 570 588 518 496 543 599 543 505Central Europe 36 42 41 33 35 50 70 101Group-wide and eliminations 14 10 17 11 13 13 14 14Group 1,291 1,361 1,141 1,221 1,260 1,393 1,184 1,253
Gross margin, %
Nordic 40.1 41.1 40.4 40.3 39.8 39.5 37.8 37.3UK 37.3 38.7 37.6 38.6 39.7 40.0 39.4 37.3Central Europe 31.0 31.6 31.3 23.4 28.2 32.3 24.1 29.8Group 38.9 39.9 39.3 39.2 39.7 39.8 37.7 37.0
Operating profit, SEK m
Nordic 212 297 208 246 213 278 185 165UK 96 154 137 67 79 134 105 -61Central Europe 4 5 7 -4 2 9 10 37Group-wide and eliminations -39 -43 -34 -27 -39 -34 -33 -32Group 273 413 318 282 255 387 267 109
Operating profit excl. items affecting comparability, SEK m
Nordic 212 297 208 246 213 278 185 165UK 96 154 137 67 79 134 105 5Central Europe 4 5 7 -4 2 9 10 37Group-wide and eliminations -39 -43 -34 -27 -39 -34 -33 -32Group 273 413 318 282 255 387 267 175
Operating margin, %
Nordic 12.7 16.9 14.9 14.6 12.7 15.0 12.6 9.7UK 6.3 10.1 9.9 5.2 5.8 8.9 7.6 -4.5Central Europe 3.4 3.8 5.3 -2.8 1.6 5.8 3.4 10.9Group 8.2 12.1 10.9 9.1 8.0 11.0 8.5 3.2
Operating margin excl. items affecting comparability, %
Nordic 12.7 16.9 14.9 14.6 12.7 15.0 12.6 9.7UK 6.3 10.1 9.9 5.2 5.8 8.9 7.6 0.4Central Europe 3.4 3.8 5.3 -2.8 1.6 5.8 3.4 10.9Group 8.2 12.1 10.9 9.1 8.0 11.0 8.5 5.2
NOB I A ANNUA L AND S U S TA I NA B I L I T Y R E PORT 2 018 5 3
F I NANC I A L S TAT EM ENT S
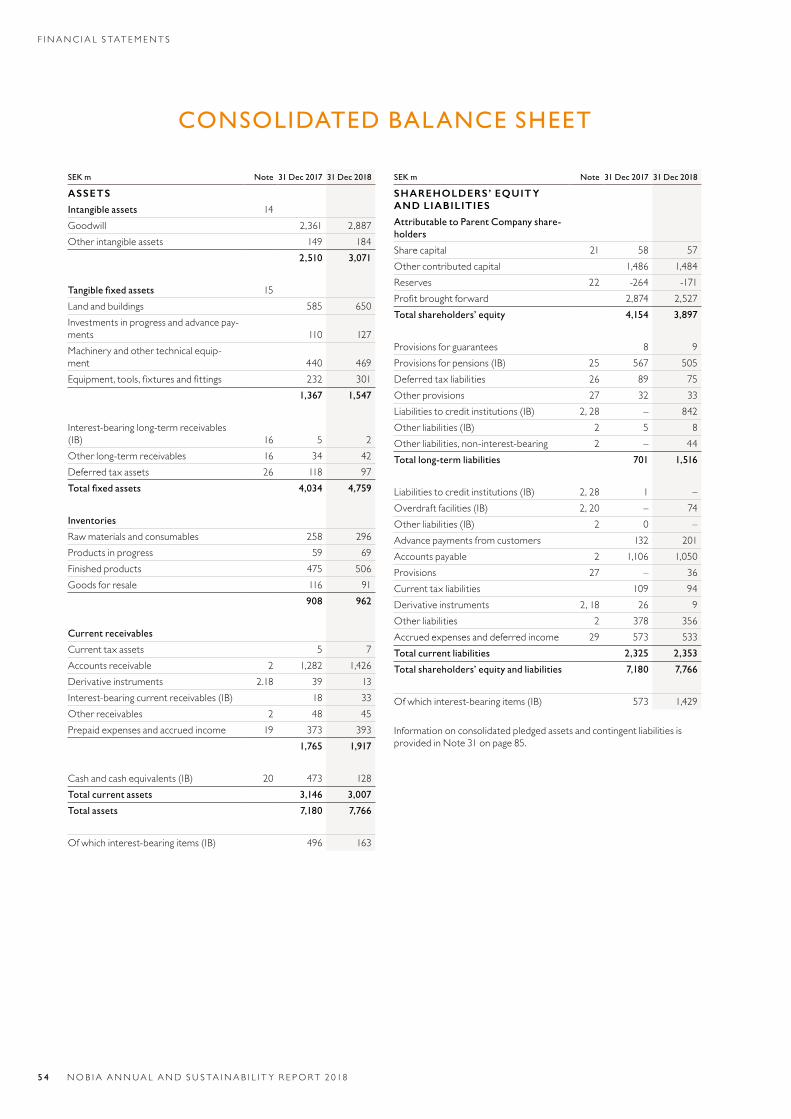
CONSOLIDATED BALANCE SHEET
SEK m Note 31 Dec 2017 31 Dec 2018
ASSETS
Intangible assets 14Goodwill 2,361 2,887Other intangible assets 149 184
2,510 3,071
Tangible fixed assets 15Landandbuildings 585 650Investmentsinprogressandadvancepay-ments 110 127Machinery and other technical equip-ment 440 469Equipment,tools,fixturesandfittings 232 301
1,367 1,547
Interest-bearinglong-termreceivables(IB) 16 5 2Other long-term receivables 16 34 42Deferred tax assets 26 118 97Total fixed assets 4,034 4,759
Inventories
Raw materials and consumables 258 296Products in progress 59 69Finished products 475 506Goods for resale 116 91
908 962
Current receivables
Current tax assets 5 7Accounts receivable 2 1,282 1,426Derivative instruments 2.18 39 13Interest-bearingcurrentreceivables(IB) 18 33Other receivables 2 48 45Prepaid expenses and accrued income 19 373 393
1,765 1,917
Cashandcashequivalents(IB) 20 473 128Total current assets 3,146 3,007
Total assets 7,180 7,766
Ofwhichinterest-bearingitems(IB) 496 163
SEK m Note 31 Dec 2017 31 Dec 2018
SHAREHOLDERS’ EQUITY AND LIABILITIES
Attributable to Parent Company share-holders
Share capital 21 58 57Other contributed capital 1,486 1,484Reserves 22 -264 -171Profitbroughtforward 2,874 2,527Total shareholders’ equity 4,154 3,897
Provisions for guarantees 8 9Provisionsforpensions(IB) 25 567 505Deferred tax liabilities 26 89 75Other provisions 27 32 33Liabilitiestocreditinstitutions(IB) 2, 28 – 842Otherliabilities(IB) 2 5 8Other liabilities, non-interest-bearing 2 – 44Total long-term liabilities 701 1,516
Liabilitiestocreditinstitutions(IB) 2, 28 1 –Overdraftfacilities(IB) 2, 20 – 74Otherliabilities(IB) 2 0 –Advance payments from customers 132 201Accounts payable 2 1,106 1,050Provisions 27 – 36Current tax liabilities 109 94Derivative instruments 2, 18 26 9Other liabilities 2 378 356Accrued expenses and deferred income 29 573 533Total current liabilities 2,325 2,353
Total shareholders’ equity and liabilities 7,180 7,766
Ofwhichinterest-bearingitems(IB) 573 1,429
InformationonconsolidatedpledgedassetsandcontingentliabilitiesisprovidedinNote31onpage85.
5 4 NOB I A ANNUA L AND S U S TA I NA B I L I T Y R E PORT 2 018
F I NANC I A L S TAT EM ENT S
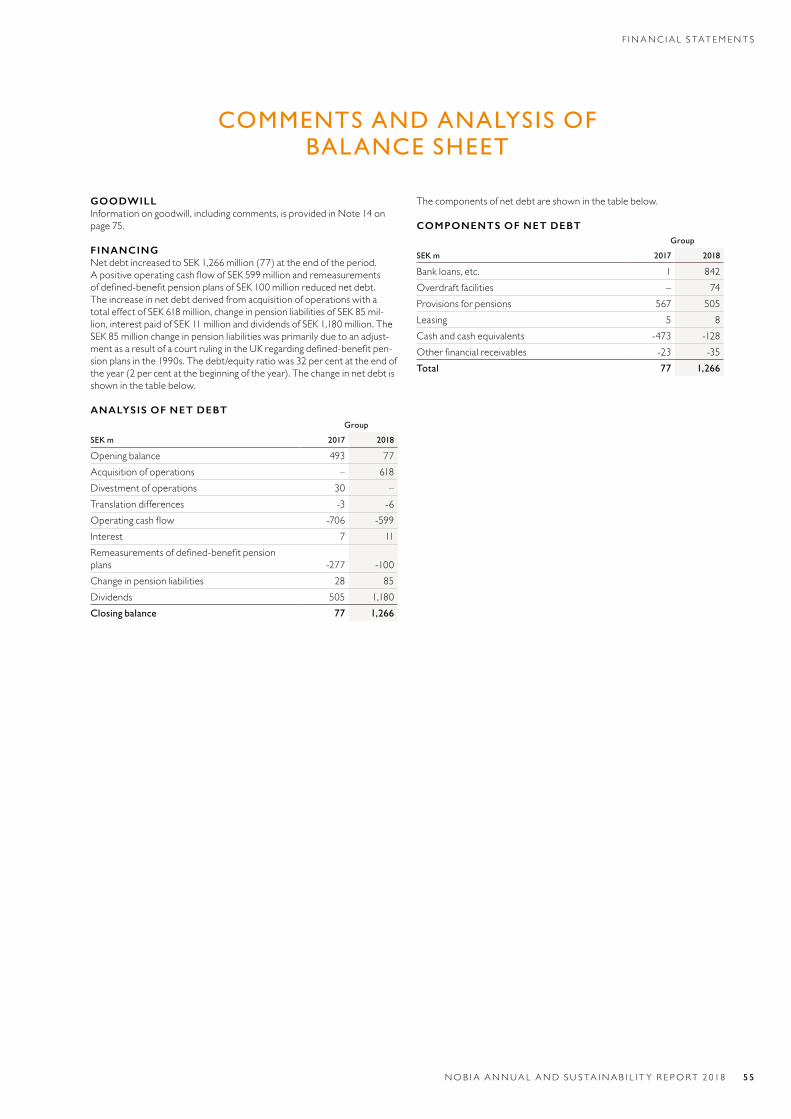
COMMENTS AND ANALYSIS OF BALANCE SHEET
GOODWILL Informationongoodwill,includingcomments,isprovidedinNote14onpage75.
FINANCING NetdebtincreasedtoSEK1,266million(77)attheendoftheperiod.ApositiveoperatingcashflowofSEK599millionandremeasurementsofdefined-benefitpensionplansofSEK100millionreducednetdebt.The increase in net debt derived from acquisition of operations with a total effect of SEK 618 million, change in pension liabilities of SEK 85 mil-lion,interestpaidofSEK11millionanddividendsofSEK1,180million.TheSEK 85 million change in pension liabilities was primarily due to an adjust-mentasaresultofacourtrulingintheUKregardingdefined-benefitpen-sionplansinthe1990s.Thedebt/equityratiowas32percentattheendoftheyear(2percentatthebeginningoftheyear).Thechangeinnetdebtisshowninthetablebelow.
ANALYSIS OF NET DEBTGroup
SEK m 2017 2018
Opening balance 493 77Acquisition of operations – 618Divestment of operations 30 –Translation differences -3 -6Operatingcashflow -706 -599Interest 7 11Remeasurementsofdefined-benefitpensionplans -277 -100Change in pension liabilities 28 85Dividends 505 1,180Closing balance 77 1,266
Thecomponentsofnetdebtareshowninthetablebelow.
COMPONENTS OF NET DEBTGroup
SEK m 2017 2018
Bankloans,etc. 1 842Overdraft facilities – 74Provisions for pensions 567 505Leasing 5 8Cash and cash equivalents -473 -128Otherfinancialreceivables -23 -35Total 77 1,266
NOB I A ANNUA L AND S U S TA I NA B I L I T Y R E PORT 2 018 5 5
F I NANC I A L S TAT EM ENT S
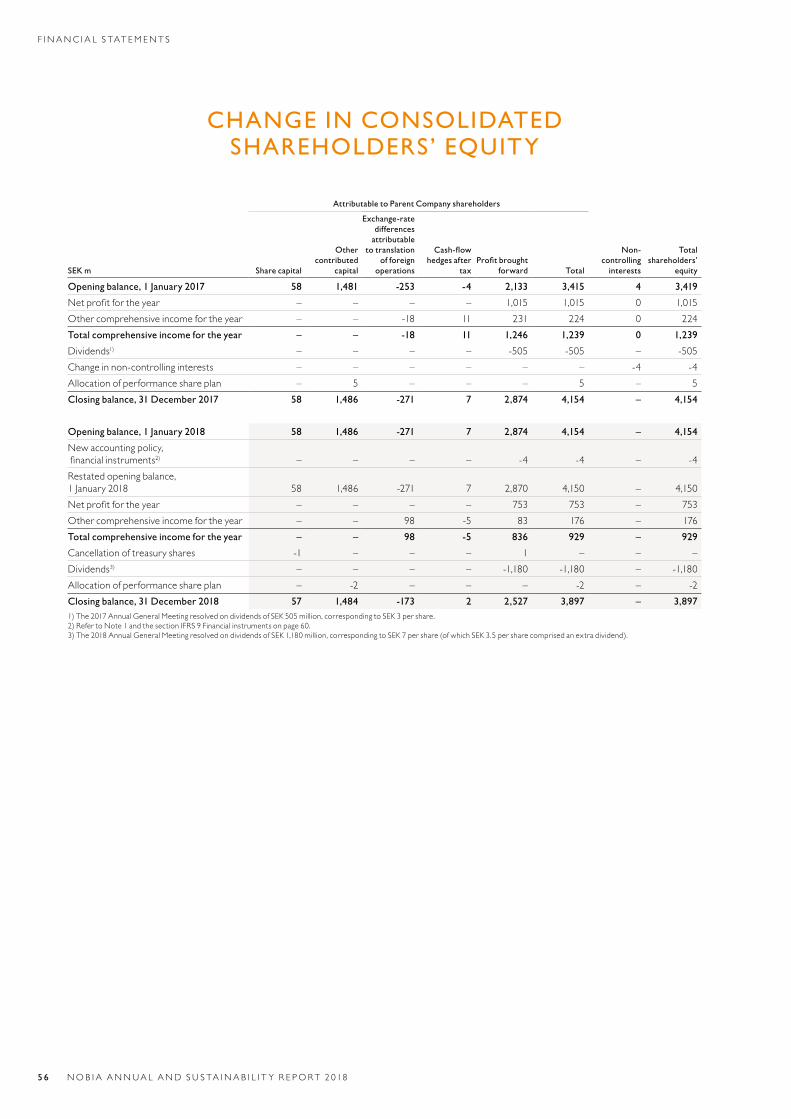
CHANGE IN CONSOLIDATED SHAREHOLDERS’ EQUITY
Attributable to Parent Company shareholders
SEK m Share capital
Other contributed
capital
Exchange-rate differences
attributable to translation
of foreign operations
Cash-flow hedges after
taxProfit brought
forward Total
Non-controlling
interests
Total shareholders’
equity
Opening balance, 1 January 2017 58 1,481 -253 -4 2,133 3,415 4 3,419
Netprofitfortheyear – – – – 1,015 1,015 0 1,015Other comprehensive income for the year – – -18 11 231 224 0 224Total comprehensive income for the year – – -18 11 1,246 1,239 0 1,239
Dividends1) – – – – -505 -505 – -505Change in non-controlling interests – – – – – – -4 -4Allocation of performance share plan – 5 – – – 5 – 5Closing balance, 31 December 2017 58 1,486 -271 7 2,874 4,154 – 4,154
Opening balance, 1 January 2018 58 1,486 -271 7 2,874 4,154 – 4,154
New accounting policy, financialinstruments2) – – – – -4 -4 – -4Restated opening balance, 1January2018 58 1,486 -271 7 2,870 4,150 – 4,150Netprofitfortheyear – – – – 753 753 – 753Other comprehensive income for the year – – 98 -5 83 176 – 176Total comprehensive income for the year – – 98 -5 836 929 – 929
Cancellation of treasury shares -1 – – – 1 – – –Dividends3) – – – – -1,180 -1,180 – -1,180Allocation of performance share plan – -2 – – – -2 – -2Closing balance, 31 December 2018 57 1,484 -173 2 2,527 3,897 – 3,8971)The2017AnnualGeneralMeetingresolvedondividendsofSEK505million,correspondingtoSEK3pershare.2)RefertoNote1andthesectionIFRS9Financialinstrumentsonpage60.3)The2018AnnualGeneralMeetingresolvedondividendsofSEK1,180million,correspondingtoSEK7pershare(ofwhichSEK3.5persharecomprisedanextradividend).
5 6 NOB I A ANNUA L AND S U S TA I NA B I L I T Y R E PORT 2 018
F I NANC I A L S TAT EM ENT S
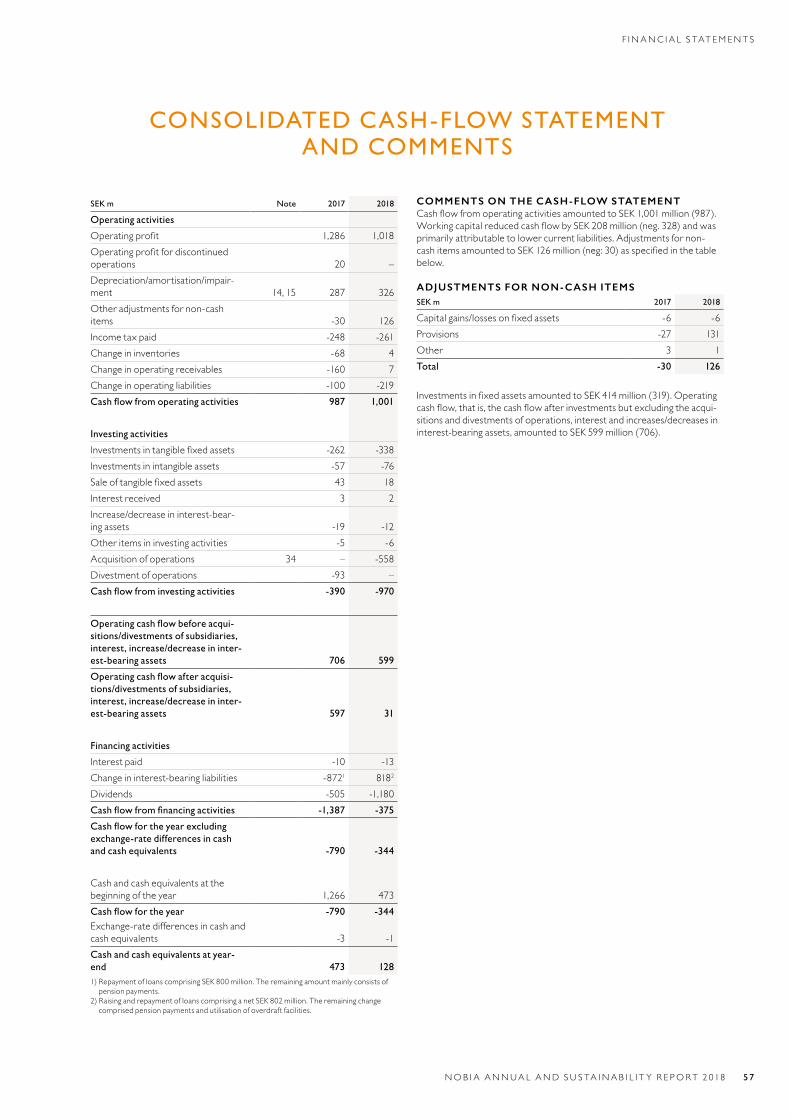
CONSOLIDATED CASH-FLOW STATEMENT AND COMMENTS
SEK m Note 2017 2018
Operating activities
Operatingprofit 1,286 1,018Operatingprofitfordiscontinuedoperations 20 –Depreciation/amortisation/impair-ment 14, 15 287 326Other adjustments for non-cash items -30 126Incometaxpaid -248 -261Change in inventories -68 4Change in operating receivables -160 7Change in operating liabilities -100 -219Cash flow from operating activities 987 1,001
Investing activities
Investmentsintangiblefixedassets -262 -338Investmentsinintangibleassets -57 -76Saleoftangiblefixedassets 43 18Interestreceived 3 2Increase/decreaseininterest-bear-ing assets -19 -12Other items in investing activities -5 -6Acquisition of operations 34 – -558Divestment of operations -93 –Cash flow from investing activities -390 -970
Operating cash flow before acqui-sitions/divestments of subsidiaries, interest, increase/decrease in inter-est-bearing assets 706 599
Operating cash flow after acquisi-tions/divestments of subsidiaries, interest, increase/decrease in inter-est-bearing assets 597 31
Financing activities
Interestpaid -10 -13Change in interest-bearing liabilities -8721 8182
Dividends -505 -1,180Cash flow from financing activities -1,387 -375
Cash flow for the year excluding exchange-rate differences in cash and cash equivalents -790 -344
Cash and cash equivalents at the beginning of the year 1,266 473Cash flow for the year -790 -344Exchange-rate differences in cash and cash equivalents -3 -1Cash and cash equivalents at year-end 473 1281)RepaymentofloanscomprisingSEK800million.Theremainingamountmainlyconsistsofpensionpayments.
2)RaisingandrepaymentofloanscomprisinganetSEK802million.Theremainingchangecomprisedpensionpaymentsandutilisationofoverdraftfacilities.
COMMENTS ON THE CASH-FLOW STATEMENTCashflowfromoperatingactivitiesamountedtoSEK1,001million(987).WorkingcapitalreducedcashflowbySEK208million(neg.328)andwasprimarilyattributabletolowercurrentliabilities.Adjustmentsfornon-cashitemsamountedtoSEK126million(neg:30)asspecifiedinthetablebelow.
ADJUSTMENTS FOR NON-CASH ITEMSSEK m 2017 2018
Capitalgains/lossesonfixedassets -6 -6Provisions -27 131Other 3 1Total -30 126
InvestmentsinfixedassetsamountedtoSEK414million(319).Operatingcashflow,thatis,thecashflowafterinvestmentsbutexcludingtheacqui-sitions and divestments of operations, interest and increases/decreases in interest-bearingassets,amountedtoSEK599million(706).
NOB I A ANNUA L AND S U S TA I NA B I L I T Y R E PORT 2 018 5 7
F I NANC I A L S TAT EM ENT S
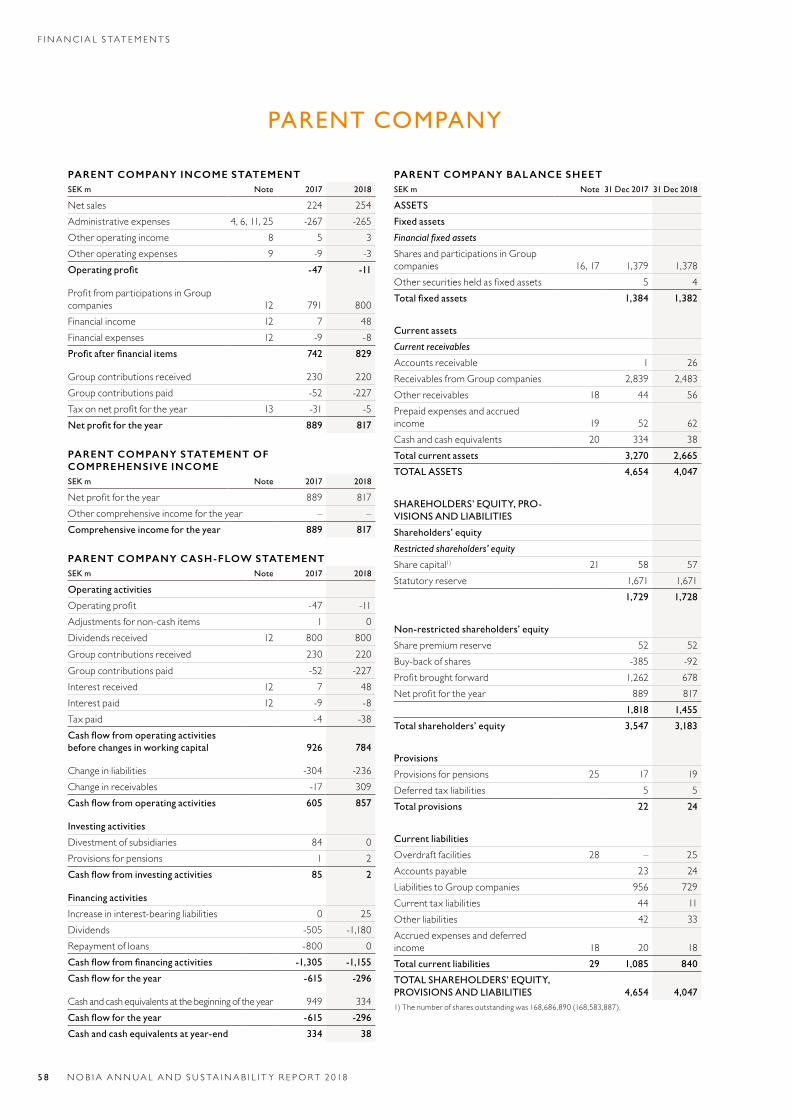
PARENT COMPANY
PARENT COMPANY INCOME STATEMENTSEK m Note 2017 2018
Net sales 224 254Administrative expenses 4, 6, 11, 25 -267 -265Other operating income 8 5 3Other operating expenses 9 -9 -3Operating profit -47 -11
ProfitfromparticipationsinGroupcompanies 12 791 800Financial income 12 7 48Financial expenses 12 -9 -8Profit after financial items 742 829
Group contributions received 230 220Group contributions paid -52 -227Taxonnetprofitfortheyear 13 -31 -5Net profit for the year 889 817
PARENT COMPANY STATEMENT OF COMPREHENSIVE INCOMESEK m Note 2017 2018
Netprofitfortheyear 889 817Other comprehensive income for the year – –Comprehensive income for the year 889 817
PARENT COMPANY CASH-FLOW STATEMENTSEK m Note 2017 2018
Operating activities
Operatingprofit -47 -11Adjustments for non-cash items 1 0Dividends received 12 800 800Group contributions received 230 220Group contributions paid -52 -227Interestreceived 12 7 48Interestpaid 12 -9 -8Tax paid -4 -38Cash flow from operating activities before changes in working capital 926 784
Change in liabilities -304 -236Change in receivables -17 309Cash flow from operating activities 605 857
Investing activities
Divestment of subsidiaries 84 0Provisions for pensions 1 2Cash flow from investing activities 85 2
Financing activities
Increaseininterest-bearingliabilities 0 25Dividends -505 -1,180Repayment of loans -800 0Cash flow from financing activities -1,305 -1,155
Cash flow for the year -615 -296
Cash and cash equivalents at the beginning of the year 949 334Cash flow for the year -615 -296
Cash and cash equivalents at year-end 334 38
PARENT COMPANY BALANCE SHEETSEK m Note 31 Dec 2017 31 Dec 2018
ASSETS
Fixed assets
Financial fixed assets
Shares and participations in Group companies 16, 17 1,379 1,378Othersecuritiesheldasfixedassets 5 4Total fixed assets 1,384 1,382
Current assets
Current receivables
Accounts receivable 1 26Receivables from Group companies 2,839 2,483Other receivables 18 44 56Prepaid expenses and accrued income 19 52 62Cash and cash equivalents 20 334 38Total current assets 3,270 2,665
TOTAL ASSETS 4,654 4,047
SHAREHOLDERS’ EQUITY, PRO-VISIONS AND LIABILITIES
Shareholders’ equity
Restricted shareholders’ equity
Share capital1) 21 58 57Statutory reserve 1,671 1,671
1,729 1,728
Non-restricted shareholders’ equity
Share premium reserve 52 52Buy-back of shares -385 -92Profitbroughtforward 1,262 678Netprofitfortheyear 889 817 1,818 1,455
Total shareholders’ equity 3,547 3,183
Provisions
Provisions for pensions 25 17 19Deferred tax liabilities 5 5Total provisions 22 24
Current liabilities
Overdraft facilities 28 – 25Accounts payable 23 24LiabilitiestoGroupcompanies 956 729Current tax liabilities 44 11Other liabilities 42 33Accrued expenses and deferred income 18 20 18Total current liabilities 29 1,085 840
TOTAL SHAREHOLDERS’ EQUITY, PROVISIONS AND LIABILITIES 4,654 4,0471)Thenumberofsharesoutstandingwas168,686,890(168,583,887).
5 8 NOB I A ANNUA L AND S U S TA I NA B I L I T Y R E PORT 2 018
F I NANC I A L S TAT EM ENT S
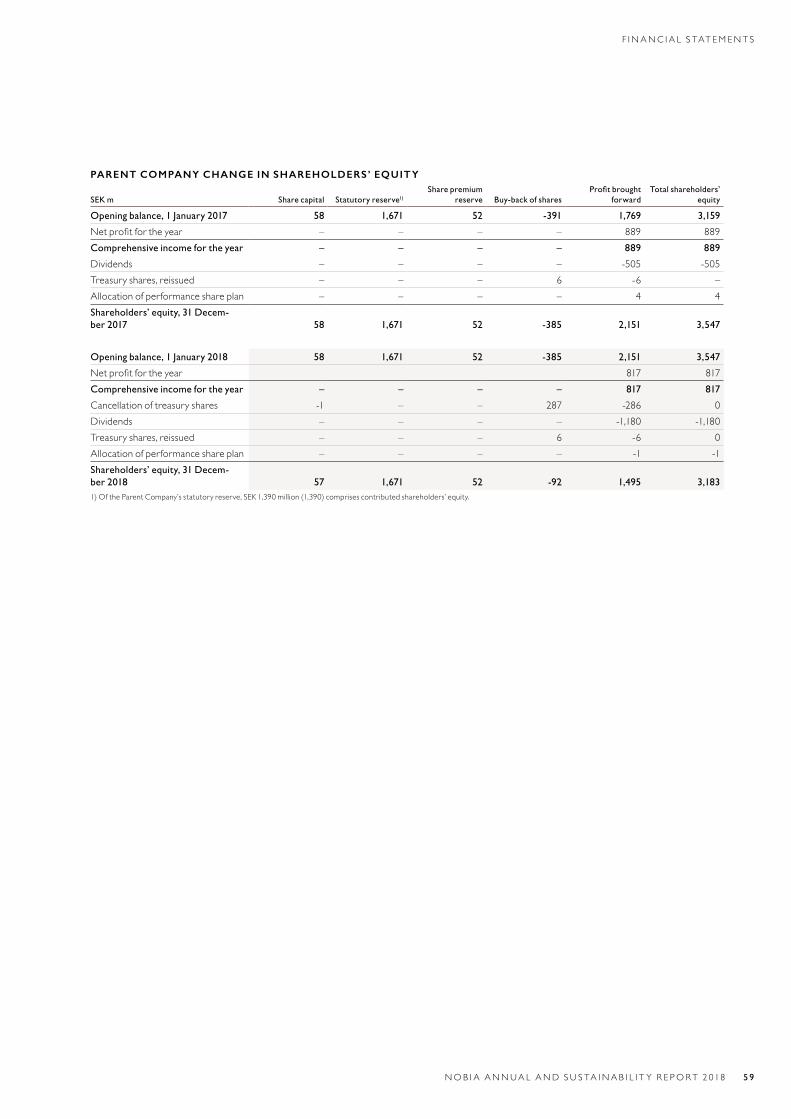
PARENT COMPANY CHANGE IN SHAREHOLDERS’ EQUITY
SEK m Share capital Statutory reserve1)
Share premium reserve Buy-back of shares
Profit brought forward
Total shareholders’ equity
Opening balance, 1 January 2017 58 1,671 52 -391 1,769 3,159
Netprofitfortheyear – – – – 889 889Comprehensive income for the year – – – – 889 889
Dividends – – – – -505 -505Treasury shares, reissued – – – 6 -6 –Allocation of performance share plan – – – – 4 4Shareholders’ equity, 31 Decem-ber 2017 58 1,671 52 -385 2,151 3,547
Opening balance, 1 January 2018 58 1,671 52 -385 2,151 3,547
Netprofitfortheyear 817 817Comprehensive income for the year – – – – 817 817
Cancellation of treasury shares -1 – – 287 -286 0Dividends – – – – -1,180 -1,180Treasury shares, reissued – – – 6 -6 0Allocation of performance share plan – – – – -1 -1Shareholders’ equity, 31 Decem-ber 2018 57 1,671 52 -92 1,495 3,1831)OftheParentCompany’sstatutoryreserve,SEK1,390million(1,390)comprisescontributedshareholders’equity.
NO B I A ANNUA L AND S U S TA I NA B I L I T Y R E PORT 2 018 5 9
F I NANC I A L S TAT EM ENT S
NOTES
NOTE 1 S IGNIF ICANTACCOUNTINGPOLICIESCOMPLIANCE WITH STANDARDS AND LEGISLATIONNobia’sconsolidatedfinancialstatementsarepreparedinaccordancewithInternationalFinancialreportingStandards,IFRS,aspublishedbytheInter-nationalAccountingStandardsBoard(IASB)asadoptedbytheEuropeanUnion(EU).TheSwedishFinancialReportingBoard’srecommendationRFR1SupplementaryAccountingRulesforGroupswasalsoapplied.
The Parent Company applies the same accounting policies as the Group except in the cases described below under the section entitled “Parent Companyaccountingpolicies.”TheAnnualReportandtheconsolidatedfinancialstatementswereapprovedforissuebytheBoardofDirectorsandPresidenton5April2019.
PRINCIPLES APPLIED IN THE PREPARATION OF THE FINANCIAL STATEMENTSAssets and liabilities are recognised at historic acquisition value (cost), exceptforcertainfinancialassetsandliabilitiesandfixedassetsheldforsale.Financialassetsandliabilitiesmeasuredatfairvaluecomprisederiva-tiveinstruments.Fixedassetsheldforsalearerecognisedatthelowerofthecarryingamountandfairvalue,lesssellingexpenses.
Receivables and liabilities and income and expenses are offset only if requiredorexpresslypermittedinanaccountingrecommendation.
The Parent Company’s functional currency is Swedish kronor (SEK), which is also the presentation currency for the Parent Company and Group.Accordingly,thefinancialstatementsarepresentedinSEK.AllamountsarestatedinSEKmillion(SEKm),unlessotherwisestated.Themostsignificantaccountingpoliciesstatedbelowareappliedcon-
sistentlytoalloftheperiodspresentedintheconsolidatedfinancialstate-ments.PreparingthefinancialstatementsinaccordancewithIFRSrequiresthat
company management make assessments, estimates and assumptions that affect the application of accounting policies and the recognised amounts ofassets,liabilities,incomeandexpenses.Theactualoutcomemaydif-ferfromtheseestimatesandassessments.Estimatesandassumptionsareregularlyreviewed.Changestoestimatesarerecognisedintheperiodinwhich the change is made if the change affects only that period, or in the period in which the change is made and future periods if the change affects bothcurrentperiodsandfutureperiods.AssessmentsmadebycompanymanagementintheapplicationofIFRSthathaveamaterialimpactonthefinancialstatementsandestimatesmadethatmayleadtosignificantadjust-mentsinthefinancialstatementsoffuturefinancialyearsareprimarilythefollowing:
Impairment testing of goodwillGoodwillisrecognisedatcostlessanyaccumulatedimpairment.TheGroup regularly (at least once a year) performs impairment tests of good-will, and when indicators of impairment exist, in accordance with the accountingpoliciesdescribedunderNote14Intangibleassetsonpage75.Theassumptionsandassessmentsmadepertainingtoexpectedcashflowsand the discount rate in the form of weighted average cost of capital are describedunderNote14Intangibleassets.RecognisedgoodwillamountedtoSEK2,887million(2,361)on31December2018.
Deferred tax assetsThe Group’s loss carryforwards for which deferred tax assets have been capitalisedhaveacarryingamountofSEK0million(0).Deferredtaxassetspertaining to loss carryforwards are capitalised to the extent it is prob - ablethatcarryforwardscanbeoffsetagainstsurplusesinfuturetaxation.Particularly high demands are placed on the assessment if the company, to which the loss carryforwards are attributable, has recognised losses in recentyears.Theamountsofcapitalisedandnon-capitalisedlosscarry-forwardsintheGrouparepresentedinNote26Deferredtax.Iftheprobability that non-capitalised loss carryforwards could be utilised in future taxation in future annual accounts is deemed to be high, additional amounts may be capitalised, with a corresponding positive amount rec-ognisedinprofitorloss.Thereverseappliesifmarketsweretosignifi-cantlydeteriorateinforthcomingyears.Thecurrentassessmentisthattheprobability of such increases or declines in the value in the balance sheet during the forthcoming year is not high, although this cannot be ruled out ifconditionsinthekitchenmarketsweretochangemorethanexpected.
The Group’s deferred tax assets amounted to SEK 97 million (118) on 31 December2018.
Defined-benefit pensionsTheGroup’sdefined-benefitpensionplansarerecognisedaccordingtocommon principles and calculation methods and are calculated by assess-ingfuturesalaryincreasesandinflation.TheGroup’spensionliabilitiesamountedtoSEK505million(567)on31December2018.
CHANGED ACCOUNTING POLICIESThechangedaccountingpoliciesappliedbytheGroupfrom1January2018aredescribedbelow.OtherIFRSchangesappliedfrom1January2018didnothaveanymaterialeffectontheconsolidatedfinancialstatements.TheGroupappliesIFRS9andIFRS15forthefirsttimefrom1January2018.The transition methods that the Group has chosen to apply in the transi-tiontoIFRS9and15entailthatcomparativeinformationinthefinancialstatementshasnotbeenrestatedtoreflecttherequirementsofthenewstandards.
The transition effects from initial application of these standard are pri-marily related to:• earlier recognition of income relating to goods for project sales, the time betweendeliveryandinstallationisveryshortwhichentailsinsignificanteffects,aboutnegativeSEK5million.Therevenueforthe2017financialyear has not been restated for comparison with 2018, since the true and fair view, and thus our stakeholders’ assessment, of Nobia’s historical or futurefinancialperformanceisnotdeemedtobeimpacted.
• anincreaseinimpairmentoffinancialassetsrelatingtocreditlossesonaccountsreceivableamountingtoapproximatelySEK5million.
IFRS 9 FINANCIAL INSTRUMENTSIFRS9establishesprinciplesfortherecognitionandmeasurementoffinan-cialassets,financialliabilitiesandcertaincontractsforthepurchaseandsaleofnon-financialinstruments.ThisstandardreplacesIAS39FinancialInstruments:RecognitionandMeasurement.IFRS9containsthreeprincipleclassificationcategoriesforfinancial
assets:Measuredatfairvaluethroughprofitorloss,amortisedcostorfairvaluethroughothercomprehensiveincome.AssessmentsoftheIFRS9classificationofdebtinstrumentsarebased
ontwocriteria:(a)thecompany’sbusinessmodelforholdingthefinancialassetand(b)theinstrument’scontractualcashflowcharacteristics.Equityinstrumentsareclassifiedatfairvaluethroughprofitorloss,
except for when the company has decided to present the instruments at fairvaluethroughothercomprehensiveincome.Therulesontherecognitionandmeasurementoffinancialliabilitiesare
largelyunchangedcomparedwithIAS39.IFRS9replacesthe“occurredlossmodel”fromIAS39withan
“expectedcreditlossmodel.”Expectedcreditlossesremovetherequire-ment of identifying an occurred loss event and introduces an expected loss impairmentmodel.Thismodelestablishesthreestepbasedonwhetherasignificantincreaseincreditriskhasoccurred.Forfinancialassetsforwhichthereisnosignificantincreaseincreditrisk,acreditlossistobereservedfor the loss that is expected to occur within 12 months (“loss allow-ance”).Forfinancialassetsforwhichasignificantincreaseincreditriskhasoccurred and for those that are doubtful, a credit loss is to be recognised forthelossthatisexpectedtooccurforfulllifetimeoftheasset.
From 2018, Nobia bases any impairment on expected credit losses and impairmentisnolongerbasedsolelyonpastevents.However,impairmentofaccountsreceivablemaycontinueifunforeseeneventshaveoccurred.Such impairment is initially recognised for each individual receivable, but may also be made collectively for a group of receivables of similar credit characteristics.Whencalculatingtheexpectedcreditlosses,Nobiatakesintoconsid-
eration historical bad debt losses, performs an analysis of respective cus-tomer segments, and observes macroeconomic effects on customers’ con-ditionssuchastheimpactofBrexitonthelocalmarket.Hedgeaccounting:Therulepermitcompaniestobetterreflectthecom-
pany’srisk-managementactivitiesinthefinancialstatementsandintroducelessdetailedrulesforassessingtheeffectivenessofhedges.
N OT E S
6 0 NOB I A ANNUA L AND S U S TA I NA B I L I T Y R E PORT 2 018
IFRS9largelyretainsthesamerequirementsfortherecognitionandmeasurementoffinancialliabilitiesasIAS39.TheintroductionofIFRS9did not have any material effect on the Group’s accounting policies related tofinancialliabilitiesandderivativeinstruments.
TransitionThe following table summarises the effect, net after tax, of the transi-tiontoIFRS9onopeningbalances,profitbroughtforward.Asthetransi-tion method, Nobia chose to utilise the exception to not restate compara-ble information for previous years regarding recognition and measurement (includingimpairment).Differencesincarryingamountattributabletofinancialassetsandliabilitiesarerecognisedinprofitbroughtforwardat1January2018accordingtothetablebelow.
31 Dec 2017 (SEK m)Before
adjustment AdjustmentAfter
adjustment
Accounts receivable 1,282 -5 1,277Deferred tax assets 118 1 119Profitbroughtforward 2,874 -4 2,870
Forotherdisclosuresregardingfinancialinstruments,refertoNote30.
IFRS 15 REVENUE FROM CONTRACTS WITH CUSTOMERSIFRS15isacomprehensivestandardfordeterminingtheamountofreve-nuetoberecognisedandwhenthisrevenueistoberecognised.ItreplacesIAS18Revenue,IAS11ConstructionContractsandassociatedinterpreta-tions.UnderIFRS15,revenueisrecognisedwhencontrolofthegoodsorservicesispassedtothecustomer.Determiningwhencontrolhaspassedto the customer, meaning a point in time or over time, requires assess-mentstobemade.NobiaappliesIFRS15retrospectivelywiththetotaleffectrecognised
inshareholders’equityon1January2018,knownasthecumulativeapproach.Accordingly,theinformationrecognisedin2017isnotrestated,meaningthatitisrecognisedaspreviouslyinaccordancewithIAS18,IAS11andassociatedinterpretations.Inaddition,thedisclosurerequirementsinIFRS15werenotappliedtocomparativeinformation.
Sale of goodsForsalesofkitchen,revenueisrecognisedunderIFRS15whencontrolofthegoodspassestothecustomer.Revenueforkitchenproductsandotherproducts is recognised at a point in time, while installations are recognised overtimeastheinstallationisperformed.Installationservicescompriseabout5-6percentofNobia’stotalsales.Nobiadoesnothaveanycontractassets.Contractliabilitiesexistin
the form of advance payments from customers for the delivery of kitchen productsorinstallation.Thetermofadvancepaymentsislessthanoneyear and the closing balance on 31 December 2018 amounted to SEK 201 million(132).AdvancepaymentsarerecognisedasrevenuewhenNobiahassatisfieditobligationtothecustomerintheformofdeliveredkitchenproductsorcompletedinstallation.Thecontractliabilitiesthatexistedinthe balance sheet on 31 December 2017 were recognised as revenue in the2018financialyear.TheaggregateeffectofthetransitiontoIFRS15onrevenueinthe
Group for 2017 has been estimated at approximately negative SEK 5 mil-lion, and on closing equity at approximately negative SEK 2 million, which is not deemed to be material in relation to the Group’s total revenue of SEK12,744millionfor2017.Thereasonforthereducedsalesin2017isduetotherevenuerecognisedinthefirstquarterof2017,whichshouldhavebeenreportedin2016accordingtoIFRS15,beinggreaterthantherev-enuethatwillberecognisedinthefirstquarterof2018butshouldhavebeenrecognisedin2017.Therevenueforthe2017financialyearhasnotbeen restated, since the true and fair view of Nobia’s historical or future financialperformanceisnotdeemedtobeimpacted.
NEW IFRSS THAT HAVE NOT YET BEEN APPLIEDAnumberofneworamendedIFRSswillcomeintoeffectduringthecur-rentfinancialyear,andhavenotbeenappliedinadvancewhenprepar-ingthesefinancialstatements.Therearenoplanstoapplyanyneworamendedaccountingpolicieswithfutureapplicationinadvance.
IFRS 16 LEASESTheGroupwillapplyIFRS16Leasesfrom1January2019.IFRS16Leasesintroducesastandardisedleaserecognitionmodelforlessees.Alesseerecognises a right-of-use asset that represents a right to use the under-lying asset and a lease liability that represents an obligation to pay lease pay-
ments.Thereareexemptionsforshort-termleasesandlow-valueassets.Recogni tion for the lessor is similar to the current standard, meaning that thelessorcontinuestoclarifyleasesasfinanceoroperatingleases.IFRS16LeaseswillreplaceexistingIFRSsrelatedtorecognisingleases
suchasIAS17LeasesandIFRIC4Determining Whether an Arrangement Contains a Lease,SIC15Operating Leases – IncentivesandSIC27Evaluating the Substance of Transactions Involving the Legal Form of a Lease.
Leases in which the Group is lesseeDuringthecurrentyear,theGroupidentifiedmaterialleasesthataredeemedtobeaffectedbyIFRS16Leases.Thesecontractshavebeendividedintotheassetclassesofpremises,vehiclesandother.InordertoprovidethenecessaryinformationonhowIFRS16LeasesimpactstheGroup’s accounts, it implemented system support that collates informa-tionaboutallmaterialleases.Thesystemwillbecontinuouslyupdated.Based on the review of the leases, the Group has concluded that prem-ises is the class of asset that will have the greatest impact on the carrying amountofassetsandliabilitiesduetotheintroductionofIFRS16Leases.The Group also intends to direct its subsidiaries to make as similar assess-ments as possible by applying a number of Group-wide guidelines on, for example,extensionoptions,interestandleasepayments.TheGroupwillrecognise new assets and liabilities for operating leases for premises, vehi-clesandother.CostsfortheseleaseswillbechangedsincetheGroupwillrecognise impairment for right-of-use assets and interest expense for lease liabilities.
The Group previously recognised operating lease costs straight-line over the lease period and recognised assets (prepaid lease payments) and lia-bilities (accrued lease payments) only to the extent that there was a differ-encebetweentheactualleasepaymentsandrecognisedcost.ThereisnotexpectedtobeanymaterialeffectontheGroup’sfinanceleases.
At the start of 2019, the Group will recognise additional lease liabili-ties of approximately SEK 2,700 million (after adjustment for prepaid lease payments recognised on 31 December 2018) and right-of-use assets of approximatelySEK2,800million.
Transition and exemption rulesTheGroupwillapplythemodifiedretrospectiveapproach.ThismeansthattheaccumulatedeffectofIFRS16Leaseswillberecognisedinprofitbroughtforwardintheopeningbalancefor1January2019withoutrestat-ingcomparativefigures.TheGroupplanstomeasuretheright-of-use(theasset) at the amount corresponding to the lease liability (before adjust-ment for advance payments), which entails that the accumulated effect in profitbroughtforwardintheopeningbalancewillnotarise.
The Group will apply the exemption rule of “grandfathering” the former definitionofleasesexistingattransition.ThismeansthattheGroupwillapplyIFRS16Leasesforallleasessignedbefore1January2019andthathavebeenidentifiedasleasesaccordingtoIAS17andIFRIC4.TheGroupwill also apply the exemption rule of using the same discount rate for a portfolio of leases with similar characteristics, entailing that the same dis-countratewillbeusedforalloftheGroup’sleasesinthesamecurrency.Leasesoflowvalue(assetsvaluedatlessthanaboutSEK50,000innew
condition)–mainlycomprisingcomputers,printers/photocopiersandcof-feemachines–willnotbeincludedintheleaseliabilitybutwillcontinuetobeexpensedstraight-lineovertheleaseterm.TheGroupisnotdeemedto have any short-term leases (leases with a term of a maximum of 12 months).TheGroupalsoappliestheexemptionruleofnotincludinglong-term leases with a remaining lease term of 12 months or less from the date ofinitialapplicationintheleaseliability.
The nominal value of the contracted future lease payments according to Note 11 in this Annual Report deviates from the calculated liability under IFRS16Leasesatthestartof2019.Thedeviationissummarisedinthetable below
LeaseliabilityrecognisedontransitiontoIFRS16on1Jan-uary 2019 2,800Adjustment for prepaid lease payments recognised on 31 December 2018 -100DiscountingleaseliabilityrecognisedontransitiontoIFRS16on1January2019 350Adjustments of leases expiring 1-5 years due to different handling of extension options -600Adjustment of leases expiring after 5 years due to different handling of extension options -550Commitments for operating leases on 31 December 2018 1,900
Not 1 continued
N OT E S
NOB I A ANNUA L AND S U S TA I NA B I L I T Y R E PORT 2 018 61
TheGroupdoesnotexpecttheintroductionofIFRS16Leasestoimpactits ability to satisfy the revised maximum debt/equity ratio stated in the Group’sloancovenants.Theweightedaverageincrementalborrowingrateusedonthedateofinitialapplication(1January2019)is1.96percent.
OTHER NEW OR AMENDED IFRSS AND INTERPRETATIONSOther amendments to accounting policies with future application are not deemedtohaveanymaterialeffectontheconsolidatedfinancialstatements.
CLASSIFICATIONFixed assets essentially comprise amounts that are expected to be recov-eredmorethan12monthsaftertheclosingdate.Currentassetsessen-tially comprise amounts that are expected to be recovered within the 12 monthsaftertheclosingdate.Long-termliabilitiescompriseliabilitiesthatNobia intends, and has an unconditional right, to pay later than 12 after the closingdate.Otherliabilitiescomprisecurrentliabilities.
CONSOLIDATION PRINCIPLES AND BUSINESS COMBINATIONSSubsidiariesSubsidiariesarecompaniessubjecttothecontrollinginterestofNobiaAB.AcontrollinginterestexistsifNobiaABhasinfluenceovertheinvestmentobject, is exposed to or has the right to variable returns for its involve-mentandcanuseitsinfluenceovertheinvestmenttoinfluencethisreturn.Whenassessingwhetheracontrollinginterestexists,potentialvotingsharesaretakenintoaccountandwhetherdefactocontrolexists.
Business combinations are recognised in accordance with the acquisition method.Accordingtothismethod,anacquisitionofasubsidiaryisconsid-ered a transaction through which the Group indirectly acquires the subsid-iary’sassetsandassumesitsliabilitiesandcontingentliabilities.TheGroup-wise cost is determined by an acquisition analysis in conjunction with the acquisition.Theanalysisdeterminesthecostoftheparticipationsorbusi-nessactivities,andthefairvalueoftheacquiredidentifiableassetsandassumedliabilitiesandcontingentliabilitiesontheacquisitiondate.
Goodwill in business combinations is calculated as the total of the con-sideration transferred, any non-controlling interests (previously termed minority interests) and fair value of previously owned participations (for stepacquisitions)lessthefairvalueofthesubsidiary’sidentifiableassetsandassumedliabilities.Whenthedifferenceisnegative,itisrecogniseddirectlyinnetprofitfortheyear.Transactioncostsattributabletobusinesscombinationsareexpensed.
Contingent consideration in acquisitions is measured at fair value on both the acquisition date and continuously thereafter, with changes in valuerecognisedinprofitorloss.
For acquisitions of subsidiaries involving non-controlling interests, the Group recognises net assets attributable to non-controlling interests either at fair value of all of the net assets except goodwill, or at fair value of all net assets includinggoodwill.Theprincipleisdecidedindividuallyforeachacquisition.
Ownership in companies that grow through acquisitions on several occasionsarerecognisedasstepacquisitions.Forstepacquisitionsthatlead to a controlling interest, the previously acquired participations are remeasured according to the most recent acquisition and the arising gains orlossesarerecognisedinprofitorloss.Whencontrollinginterestsareachieved,changesinownershiparerec-
ognised as a reallocation of shareholders’ equity between the Parent Company’s owners and the non-controlling interest, without any remea-surementofthesubsidiary’snetassets.Ifownershipisreducedtosuchanextentthatcontrollinginterestsare
lost, any remaining holdings are recognised at fair value and the change in valueisrecognisedinprofitorloss.Whenacquisitionsofsubsidiariesinvolveacquisitionsofnetassetsthat
are not part of the operations, the acquisition cost is distributed between theindividualidentifiableassetsandliabilitiesbasedontheirfairvalueontheacquisitiondate.Thefinancialstatementsofsubsidiariesareincludedintheconsolidated
financialstatementsfromthedatethatthecontrollinginterestarisesandareincludedintheconsolidatedfinancialstatementsuntilthedateonwhichthecontrollinginterestceases.
TRANSACTIONS THAT ARE ELIMINATED THROUGH CONSOLIDATIONIntra-Groupreceivablesandliabilities,incomeorexpensesandunrealisedgains or losses that arise from intra-Group transactions between Group companies, are eliminated in their entirety in the preparation of the con-solidatedfinancialstatements.
TRANSLATION OF FOREIGN SUBSIDIARIESThefinancialstatementsofsubsidiariesarepreparedinthelocalcurrency,orthe functional currency used in the country in which the company conducts operations.Swedishkronor,SEK,isutilisedintheconsolidatedfinancialstatements, which is the Parent Company’s functional currency and also the Group’spresentationcurrency.Thismeansthattheearningsandfinancialposition of all Group companies that have a functional currency that is differ-ent to the presentation currency are translated to the Group’s presentation currencyofSEK.Foreignsubsidiaries’assetsandliabilitiesaretranslatedattheclosing-daterateandallitemsrecognisedinprofitorlossandothercom-prehensiveincomearetranslatedattheaverageexchangeratefortheyear.Translation differences are recognised in other comprehensive income and areaccumulatedinaseparatereserveinconsolidatedshareholders’equity.
SIGNIFICANT EXCHANGE RATESClosing-date rate Average
31 Dec 2017 31 Dec 2018 2017 2018
DKK 1.32 1.38 1.29 1.38EUR 9.85 10.28 9.63 10.26GBP 11.10 11.35 10.99 11.59NOK 1.00 1.02 1.03 1.07USD 8.23 8.97 8.54 8.69
SEGMENT REPORTINGAn operating segment is a part of the Group that conducts business activities from which it can generate income and incur expenses and for which indepen-dentfinancialinformationisavailable.Furthermore,theresultsofanoperat-ing segment are monitored by the company’s chief operating decision-maker toevaluatethemandtoallocateresourcestotheoperatingsegment.Nobia’soperating segments are the Group’s three regions: the UK, Nordic and Cen-tralEuroperegions.Thedivisionoftheunitsperregionisbasedonthegeo-graphicdomicileoftheunits.RefertoNote3onpage69foramoredetaileddescriptionofthedivisionandpresentationoftheoperatingsegments.
REVENUE RECOGNITIONThe Group’s revenue derives from the following activities:• Salesofkitchenproductsandotherproducts.• Revenue for installation services for kitchen products and other prod-uctssold.
Revenueismeasuredbasedontheremunerationspecifiedincontractswithcustomers,meaningnetafterVAT,discountsandreturns.Revenueforsalesofgoodsandservicesisrecognisedinprofitorlosswhencontrolofthegoodsandservicesispassedtothecustomer.
Sales of kitchen products and other productsThe Group sells kitchen products and other products through a number of different sales channels, such as own stores, franchise stores, builders’ merchants,DIYchainsandotherretailers.Accordingly,salestakeplacebothdirectlytoendcustomersbutalsoviaretailers.Allguaranteespro-vided, aimed at ensuring that sold products comply with the agreed spec-ifications,areincludedinthestandardsalesprice.Itisnotpossibletopur-chase offered guaranteed or additional guarantees, which is why these are recognisedinaccordancewithIAS37.Revenueforkitchenproductsandother products is recognised at a point in time when control is passed to thecustomerandtheGrouphassatisfieditperformanceobligation,whichisusuallywhenthegoodsaredeliveredtotheagreedplace.InasmallnumberoftheGroup’scontracts,thecustomersisoffered
theoptionofreturningorderedgoods.Aprovisionisrecognisedonthesales date corresponding to the expected level of returns with the corre-spondingreductioninrevenue.Noadjustmentismadetothecostssinceitisuncertainwhetherthereturnedgoodswillbeinsaleablecondition.The Group bases the above adjustments on past experience and manages theseatportfoliolevelmeasuredattheexpectedamount.Furthermore,the Group believes that there is no risk of material reversals since the level of these items has been has been low in the past and there are currently no indicationsthatthissituationwillchange.
Revenue for installation services for kitchen products and other products sold.Revenue for installation services is deemed to be a distinct service and is thushandledasaseparateperformanceobligation.Regardlessofwhetherinstallation is included in the sales price of kitchen products and other products sold or if it is priced as a separate service, the portion of the transaction price that refers to installation will be recognised separately
Not 1 continued
N OT E S
6 2 NOB I A ANNUA L AND S U S TA I NA B I L I T Y R E PORT 2 018
fromrevenuelinkedtothesaleofkitchenandotherproducts.Iftheinstal-lation service is included in the sales prices, a share of the total sales price willbeallocatedtotheinstallationperformanceobligation.Suchallocationwillbebasedonthemarketpriceofsuchservices.
Revenue for installation services is recognised separately, and recognised overtimeastheinstallationisperformed.Giventhatthisnormallyinvolvesa relative short period of time, such revenue is recognised stright-line duringtheperiodinwhichinstallationisperformed.
GOVERNMENT ASSISTANCEGovernment subsidies are recognised in the balance sheet as deferred income when there is reasonable assurance that the subsidy will be receivedandtheGroupwillfulfiltheconditionsassociatedwiththesub-sidy.Subsidiesareallocatedsystematicallyintheincomestatementinthesame manner and over the same periods as the costs for which the subsi-diesareintendedtocover.
FINANCIAL INCOME AND EXPENSESFinancial income and expenses comprise interest income on bank bal-ances and receivables, dividend income, interest expense on loans and pensionliabilities,aswellasexchange-ratedifferencesonfinancialitems.Interestincomeorinterestexpensearerecognisedaccordingtotheeffec-tiveinterestratemethod.DividendsarerecognisedinprofitorlossonthedatewhentheGroup’srighttopaymentisestablished.Theeffectiveinter-est rate is the rate that exactly discounts the estimated future inward and outwardpaymentsduringtheexpectedlifeofthefinancialinstrumentto:• grosscarryingamountofthefinancialasset,or• theamortisedcostofthefinancialliability.
Forfinancialassetsthatarecredit-impairedafterinitialrecognition,inter-estincomeiscalculatedbyapplyingtheeffectiveinterestratetothefinan-cialasset’samortisedcost.Iftheassetisnolongercredit-impaired,interestincome is re-calculated by applying the effective interest rate to the gross carryingamount.
TAX Incometaxfortheyearcomprisescurrenttaxanddeferredtax.Incometaxisrecognisedinprofitorlossexceptwhentheunderlyingtransactionis recognised in other comprehensive income or in shareholders’ equity, whereby the associated tax effects are recognised in other comprehensive incomeorinshareholders’equity.
Current tax is tax that is to be paid or received regarding the current year, by applying the tax rates determined or that have been determined inprincipleontheclosingdate.Thisitemalsoincludesadjustmentstocur-renttaxattributabletopreviousperiods.
Deferred tax is calculated according to the balance-sheet method on alltemporarydifferencesarisingbetweenrecognisedandfiscalvaluesofassetsandliabilities.
The tax effect attributable to tax loss carryforwards that could be uti-lisedagainstfutureprofitsiscapitalisedasadeferredtaxasset.Thisappliesto both accumulated loss carryforwards at the acquisition date and losses arisingthereafter.Valuationstakeplaceatthetaxrateapplyingontheclosingdate.
Deferredtaxisrecognisedinthebalancesheetasafixedassetorlong-termliability.Theincometaxliabilityisrecognisedasacurrentreceivableorliability.Iftheactualoutcomediffersfromtheamountsfirstrecognised,thedif-
ferences will affect current tax and deferred tax in the period in which thesecalculationsaremade.
TANGIBLE FIXED ASSETSTangiblefixedassetsarerecognisedatcostwithdeductionsfordepre-ciationandanyimpairment.Costincludesexpensesthatcanbedirectlyattributedtotheacquisition.Theborrowingcostsofthecostofanyassetsestablishedthatcomprisequalifyingassetsareexpensed.Costsforrepairs,maintenanceandanyinterestexpensesarerecognisedascostsinprofitorlossintheperiodinwhichtheyarise.Intheeventthatanasset’scarryingamountexceedsitsestimatedrecov-
erable amount, the asset is written down to its recoverable amount, which ischargedtooperatingprofit.Intheincomestatement,operatingprofitischargedwithstraight-line
depreciation, which is calculated on the original cost and is based on the estimated useful lives of the assets as follows:• Kitchen displays 2-4 years• Officeequipmentandvehicles3-5years
• Buildings 15-40 years• Machinery and other technical equipment 6-12 years• Equipment,tools,fixturesandfittings6-12years
Landisnotdepreciated.
FIXED ASSETS/DISPOSAL GROUPS HELD FOR SALE AND DISCONTINUED OPERATIONSDiscontinued operations comprise important operations that have been divested or comprise a disposal group held for sale as well as subsidiaries thatareacquiredforthepurposeofsubsequentlybeingsold.Profitaftertax from discontinued operations including changes in value is recognised onaseparatelineinprofitorloss.Thesignificanceofagroupofassetsandliabilitiesbeingclassifiedasheld
for sale is that the carrying amounts are recovered primarily by being sold andnotbybeingused.Allassetsincludedinthegrouparepresentedona separate line among assets and all of the group’s liabilities are presented onaseparatelineamongliabilities.Thegroupisvaluedatthelowerofthecarryingamountandfairvalue,lesssellingexpenses.Inthethirdquarterof2017,Nobiareclassifiedthetwostoresthatwere
previously recognised as Discontinued operations and disposal groups heldforsaleinaccordancewithIFRS5.Atthattime,Nobiamadetheassessmentthatthestoreswouldnotbesoldwithinthenext12months.EarningsfortheJanuary–December2017periodareincludedincon-tinuing operations and the balance-sheet items were recognised on the respectivelinesofthebalancesheetfrom30September2017.
INTANGIBLE ASSETSGoodwill comprises the amount by which the cost of the acquired oper-ationexceedstheestablishedfairvalueofidentifiablenetassets,asrec-ognisedintheacquisitionanalysis.Inconnectionwiththeacquisitionofoperations,goodwillisallocatedtocash-generatingunits.Sincegood-willhasanindeterminableusefullife,itisnotamortised.Instead,goodwillis tested for impairment at least annually and when an indicator of impair-mentexists.Thecarryingamountcomprisesthecostlessanyaccumulatedimpairmentlosses.AdescriptionofthemethodandassumptionsusedinimpairmenttestingcanbefoundinNote14IntangibleAssetsonpage75.
Other intangible assets are recognised at cost less accumulated amorti-sationandanyimpairment.Italsoincludescapitalisedcostsforpurchasesand internal and external costs for the development of software for the Group’sIToperations,patentsandlicences.Amortisationtakesplaceaccording to the straight-line method based on the estimated useful life of theasset(threetosixyears).
RESEARCH AND PRODUCT DEVELOPMENTCosts for product development are expensed immediately as and when theyarise.
Product development within the Group is mainly in the form of design development and is conducted continuously to adapt to current style trends.
This development is relatively fast, which is the reason that no portion ofthecostsforproductdevelopmentisrecognisedasanintangibleasset.The Group does not carry out research and development in the true senseofsuchwork,ortoanysignificantextent.
LEASESLeasesconcerningfixedassetsinwhichtheGroupessentiallycarriesthesamerisksandenjoysthesamebenefitsthatdirectownershipwouldentailareclassifiedasfinancialleases.Financialleasesarerecognisedatthe start of the leasing period at the lower of the leasing object’s fair value andthepresentvalueofminimumleasingfees.Financialleasesarerec-ognisedinthebalancesheetasfixedassetsandfinancialliabilities,respec-tively.Futureleasingpaymentsaredividedbetweenrepaymentofthelia-bilitiesandfinancialexpenseswherebyeachaccountingperiodischargedwithanamountofinterestcorrespondingtoafixed-interestrateontheliabilityrecognisedduringtherespectiveperiod.Leasingassetsareamor-tised according to the same principles that apply to other assets of the sametype.Costsforleasesaredividedbetweenamortisationandinterestintheincomestatement.Leasingofassets,wherethelessorisessentiallyexposedtotherisksand
rewardsoftheasset,isclassifiedasoperatingleases.Leasingfeesarerec-ognisedonastraight-linebasisduringtheleasingperiod.Operatingleasesarerecognisedinprofitorlossasanoperatingexpense.Leasingofcarsandcomputersisnormallytreatedasoperatingleases.Thevalueoftheseleasesisnotconsideredtobesignificant.
Not 1 continued
N OT E S
NOB I A ANNUA L AND S U S TA I NA B I L I T Y R E PORT 2 018 6 3
INVENTORIESInventoriescomprisefinishedandsemi-manufacturedproductsandrawmaterials.Inventoriesarevaluedaccordingtothefirst-in,first-out(FIFO)principle,atthelowerofthecostandnetsalesvalueontheclosingdate. The net sales value comprises the estimated sales value in the ongoing opera-tionslesssellingexpenses.Finishedandsemi-manufacturedproductsare valued at manu facturing cost including raw materials, direct labour, other direct expensesandproduction-relatedoverheadsbasedonnormalproduction.Deductionsaremadeforinter-Groupprofitsarisinginconjunctionwith
deliveriesbetweencompaniesintheGroup.
FINANCIAL INSTRUMENTSFinancial instruments recognised in the balance sheet include cash and cash equivalents, loans receivable, accounts receivable, interim items that will be settled using cash and cash equivalents as well as derivative instru-mentsontheassetside.Theliabilitiessideincludesaccountspayable,loanliabilities, interim items that will be settled using cash and cash equivalents aswellasderivativeinstruments.
Recognition and measurementAfinancialassetorafinancialliabilityisenteredinthebalancesheetwhenthe company becomes a party in accordance with the contractual terms oftheinstrument.Afinancialassetisderecognisedfromthebalancesheetwhen all rewards and risks associated with ownership have been trans-ferred.Afinancialliabilityisderecognisedfromthebalancesheetwhenthe obligation resulting from the agreement has been realised or is extin-guishedinsomeothermanner.
Financial instruments are initially measured at fair value and subsequently continuouslyatfairvalueoramortisedcostdependingonclassification.Financial instruments recognised at cost are initially recognised at an amount correspondingtotheinstrument’sfairvalueplustransactioncosts.Financialinstruments measured at fair value are initially recognised at an amount cor-respondingtotheinstrument’sfairvalue.Oninitialrecognition,afinancialinstrumentisclassifiedonthebasisofthepurposeunderlyingtheacquisitionoftheinstrument.Thisclassificationdetermineshowthefinancialinstru-mentismeasuredafterinitialrecognition,inthemannerdescribedbelow.Allfinancialderivativeinstrumentsarecontinuouslyrecognisedatfair
value.Purchasesandsalesoffinancialassetsarerecognisedonthetransac-tion date, which is the day on which the Group undertakes to purchase or selltheasset.From1January2018,theGroupappliesthepolicyofrecog-nisingareserveforexpectedcreditlosses(“lossallowance”)forfinancialassetsandreceivablesclassifiedatamortisedcost.
Classification of financial instrumentsFinancial assetsDebtinstruments:classificationoffinancialassetsthataredebtinstru-ments is based on the Group’s business model for managing the asset and thecharacteristicsoftheasset’scontractualcashflows.
Instrumentsareclassifiedat:• amortised cost• fair value through other comprehensive income, or• fairvaluethroughprofitorloss
Financialassetsclassifiedatamortisedcostareinitiallymeasuredatfairvalueplustransactioncosts.Accountsreceivableareinitiallymeasuredattheinvoicedamount.Followinginitialrecognition,theassetsaremeasuredaccord-ingtotheeffectiveinterestratemethod.Assetsclassifiedatamortisedcostareheldunderthebusinessmodelofcollectingcontractualcashflowsthataresolelypaymentsofprincipalandinterestontheprincipalamountoutstanding.Theseassetsaresubjecttoalossallowanceforexpectedcreditlosses.
Fair value through profit or loss is all other debt instruments that are not mea-suredatamortisedcostorfairvaluethroughothercomprehensiveincome.Financialinstrumentsinthiscategoryareinitiallymeasuredatfairvalue.Changesinfairvaluearerecognisedinprofitorloss.TheGroup’sdebtinstru-mentsareclassifiedatamortisedcostapartfromdebtinstrumentsheldfortrading.Nodebtinstrumentsweremeasuredatfarvalueduringtheyear.
Derivatives: Derivative instruments are recognised in the balance sheet on the contract date and measured at fair value, both initially and when subsequentlyremeasured.Derivativesthatarenotidentifiedashedginginstrumentsareclassifiedinthebalancesheetasfinancialassetsandliabil-itiesmeasuredatfairvaluethroughprofitorloss.Gainsandlossesduetochangesinfairvaluearerecognisedinprofitorlossunderfinancialitemsintheperiodinwhichtheyarise.
Financial liabilitiesLiabilities(exceptforderivativeinstrumentswithnegativevalues)aremea-suredatamortisedcostorfairvaluethroughprofitorloss.Afinanciallia-bilityismeasuredatfairvaluethroughprofitorlossifitisclassifiedasheld for trading, a derivative instrument to which hedge accounting is not applied, an additional purchase consideration in a business combination classifiedasafinancialliabilityorifitisinitiallyclassifiedasafinancialliabilitythatismeasuredatfairvaluethroughprofitorloss.Financialliabilitiesmea-suredatfairvaluethroughprofitorlossarecontinuouslymeasuredatfairvaluewithchangesinvaluerecognisedinprofitorloss.Otherfinanciallia-bilities are continuously measured at amortised cost by applying the effec-tiveinterestratemethod.
Receivables and liabilities in foreign currenciesReceivables and liabilities in foreign currencies are valued at the closing-date rate.Exchange-ratefluctuationspertainingtooperatingreceivablesandliabilitiesarerecognisedinoperatingprofit,whileexchange-ratefluctua-tionspertainingtofinancialreceivablesandliabilitiesarerecognisedinnetfinancialitems.
Cash and cash equivalentsCashandcashequivalentsaredefinedascashandbankbalancesandshort-term investments with maturities not exceeding three months from theacquisitiondate.
Cash-flow hedges of uncertainty in forecasted sales and material purchases in foreign currencyTo reduce the Group’s exchange-rate exposure, Nobia uses derivative instruments in the form of currency forward contracts that are linked to forecastpurchasesandsalesofgoods.Derivativeinstrumentsareheldonlyforhedgingpurposesandnotforspeculativetransactions.Ifderivativeinstruments do not meet the criteria for hedge accounting, they are mea-suredatfairvaluethroughprofitorloss.Derivativeinstrumentsthatmeetthecriteriaforhedgeaccountingaredesignatedascash-flowhedgesandmeasured at fair value with the change in value in other comprehensive incomewiththeaccumulatedeffectinshareholders’equity.Thisreserveisreversedtoprofitorlosswhenthehedgedunderlyingtransactionstakeplace.Forotherdisclosuresregardingcash-flowhedges,refertoNote2.
IMPAIRMENTThe carrying amounts of the Group’s assets are tested annually for indi-cationsofanyimpairmentrequirement.IAS36isappliedfortheimpair-menttestingofassetsotherthanfinancialassets,whicharetestedaccord-ingtoIFRS9,assetsheldforresaleanddisposalgroupsthatarerecognisedaccordingtoIFRS5,inventories,planassetsusedforthefinancingofemployeebenefitsanddeferredtaxassets.Fortheexemptedassetsmen-tioned above, the carrying amount is tested in accordance with the rele-vantstandard.
Impairment testing of tangible and intangible assets, and participations in subsidiariesIfthereisanindicationofanimpairmentrequirement,therecoverableamountoftheassetistestedinaccordancewithIAS36(seebelow).Forgoodwill,therecoverableamountiscalculatedannually.Whentestingforimpairment requirements, if it is not possible to establish essentially inde-pendentcashflowsforanindividualasset,theassetsmustbegroupedatthe lowest level at which it is possible to identify essentially independent cashflows,knownascash-generatingunits.Impairmentlossesarerec-ognised when the carrying amount of an asset or a cash-generating unit (groupofunits)exceedstherecoverableamount.Impairmentlossesarechargedagainstprofitorloss.Impairmentlossesrelatedtoassetsattrib-utabletoacash-generatingunitareprimarilyallocatedtogoodwill.Sub-sequently, a proportional impairment of other assets included in the unit (groupofunits)iseffected.Therecoverableamountisthehigheroffairvaluelesssellingexpensesandvalueinuse.Whencalculatingthevalueinuse,futurecashflowsarediscountedusingadiscountingfactorthattakesinto account the risk-free interest rate and the risk associated with the spe-cificassetorcash-generatingunit(groupofunits).
Impairment testing of financial assetsAt every reporting occasion, the company evaluates whether there is any objectiveevidencetosuggestthatafinancialassetorgroupofassetsissubjecttoanimpairmentrequirement.NobiahasappliedIFRS9since1January2018.ImpairmentofcreditlossesunderIFRS9isprospectiveandaloss allowance is established when there is exposure to credit risk, usually inconnectionwithinitialrecognition.Expectedcreditlossesreflectthe
Not 1 continued
N OT E S
6 4 NOB I A ANNUA L AND S U S TA I NA B I L I T Y R E PORT 2 018
presentvalueofalldeficitsincashflowsattributabletopaymentcancella-tions.Whencalculatingtheexpectedcreditlosses,Nobiatakesintocon-sideration historical bad debt losses, an analysis of the respective customer segments, and observed macroeconomic effects on customers’ conditions suchastheimpactofBrexitonthelocalmarket.Thesimplifiedmodelisappliedtoaccountsreceivable.Underthesimpli-
fiedmodel,alossallowanceisrecognisedfortheexpectedfulllifetimeofthereceivableorasset.ReferalsotoNote2.Whendeterminingwhetherafinancialasset’screditriskhasincreasedsignificantlysinceinitialrecogni-tion and when calculating expected credit losses, the Group uses reason-ableandverifiableinformationthatisrelevantandavailable.
However, impairment of accounts receivable may continue if unforeseen eventshaveoccurred.Suchimpairmentisinitiallyrecognisedforeachindivid-ual receivable, but may also be made collectively for a group of receivables of similarcreditcharacteristics.Thefinancialassetsarerecognisedinthebalancesheet at amortised cost, meaning the net of gross amount and the loss allow-ance.Changesinthelossallowancearerecognisedinprofitorlossunderoperatingprofitforaccountsreceivableandasafinancialexpenseorincomeforotherreserves.TheGroup’screditexposureisstatedinNotes2and30.
Comparative yearFinancial instruments for the comparative year 2017 are recognised by applyingIAS39.Detailedinformationaboutpreviousrecognitionispro-videdinthe2017AnnualReport.
Impairment reversalAnimpairmentlossonassetsthatcomeunderthescopeofIAS36isreversed if there is an indication that the impairment requirement is no longer pertinent and that there has been a change in the assumptions upon whichthecalculationoftherecoverableamountwasbased.However,animpairmentlossongoodwillisneverreversed.Areversalisonlyper-formed to the extent that the carrying amount of the asset after the rever-sal does not exceed the carrying amount that would have been recognised, lessdepreciationwhereverapplicable,ifnoimpairmenthadbeenposted.
An impairment loss on loans and accounts receivable recognised at amortised cost is reversed if the previous reasons for the impairment loss no longer exist and full payment can be expected to be received from the customer.
PROVISIONS Provisions are recognised in the balance sheet among current and long-term liabilities, when the Group has a legal or informal obligation deriving fromanoccurredeventandthatitisprobablethatanoutflowofresourceswill be required to settle the obligation and the amount concerned can be reliablyestimated.Aprovisiondiffersfromotherliabilitiessincethedateofpaymentortheamountrequiredtosettletheprovisionisuncertain.
RestructuringA provision for restructuring is recognised once a detailed and formal restructuring plan has been adopted and the restructuring process has eithercommencedorbeenpubliclyannounced.Noprovisionsareestab-lishedforfutureoperatingexpenses.
GuaranteesA provision for guarantees is recognised when the underlying products orservicesaresold.Theprovisionisbasedonhistoricaldataandatotalappraisal of the potential outcomes in relation to the probabilities associ-atedwiththeoutcomes.
CONTINGENT LIABILITIESA contingent liability is disclosed when the company has a possible obligation derivingfromanoccurredeventwhoseexistencewillbeconfirmedonlybyone or more uncertain future events, or when there is an obligation that has not been recognised as a liability or provision because it is not probable that anoutflowofresourceswillberequired,oralternativelybecauseitisnotpossibletosufficientlyreliablyestimatetheamountconcerned.
SHAREHOLDERS’ EQUITYWhensharesareboughtback,shareholders’equityisreducedbytheentireamountpaid.DividendsarerecognisedasaliabilityaftertheAnnualGeneralMeetinghasapprovedthedividend.
EARNINGS PER SHAREThecalculationofearningspershareisbasedonconsolidatednetprofitattrib-utable to the Parent Company shareholders and on the weighted average numberofsharesoutstandingduringtheyear.Whencalculatingearningsper
share after dilution, the average number of shares outstanding is adjusted to takeintoaccountthedilutiveeffectsofpotentialordinaryshares.Duringtherecognised periods, potential ordinary shares comprise share rights (match-ingandperformancesharerights).Matchingsharerightsheldbyemployeesonthereportingdateareconsidereddilutive.Performancesharerightsaredilu-tivetotheextentthatprofittargetshavebeenfulfilledonthereportingdate.To calculate the dilutive effect, an exercise price for the share rights is applied that corresponds to the value of future services per outstanding share right calculatedasremainingcosttorecogniseinaccordancewithIFRS2.
EMPLOYEE BENEFITSPensionsTheGrouphasbothdefined-contributionanddefined-benefitpension plans.InSweden,theUKandAustria,employeesarecoveredbydefined-benefitpensionplans.Inothercountriesandcompanies,employeesarecoveredbydefined-contributionplans.Effective2010,allnewvestingintheUKcomesunderdefined-contributionplans.
Plans for which the company’s obligations are limited to the fees the company hasundertakentopayareclassifiedasdefined-contributionpensionplans.Thecompany’sobligationsfordefined-contributionplansarerecognisedasacost in earnings at the rate at which they are vested by the employees performing servicesonbehalfofthecompanyforaperiodoftime.TheGroup’sdefined-benefitpensionplansstatetheamountofpension
benefitthatanemployee,oraformeremployee,willreceiveafterretire-mentbasedupontheirsalaryandthenumberofyearsofservice.Pensionliabilitiesfordefined-benefitplansarerecognisedaccordingtocommonprinciples and calculation methods and are calculated by considering future salaryincreasesandinflation,amongotherfactors.TheGroupcarriestheriskthatthepromisedbenefitwillbepaid.Therearebothfundedandunfundeddefined-benefitpensionplans
withintheGroup.Fundedpensionplansaremainlyfinancedonthebasisofcontributionspaidtopensionfunds.Regardingdefined-benefitplans,thepensioncommitmentiscalculated
inaccordancewiththeProjectedUnitCreditmethod.Thismethodallo-cates the cost of pension at the rate at which the employees perform serv-ices for the company that increase their entitlement to future remunera-tion.Thiscalculationisperformedannuallybyindependentactuaries.Thecompany’s obligations are valued at the present value of expected future cashflowsusingadiscountrate.Thisdiscountratecorrespondstotheinterestonhigh-qualitycorporatebonds,whereamarketwithsufficientdepthexists,orgovernmentbondsifnosuchmarketexists.
The rate in Sweden is determined based on mortgage bonds, while in theUKandAustria,therateisbasedoncorporatebonds.
Actuarial gains and losses may arise when the present value of commit-ments is established and a difference arises when the actual return on plan assets is established compared with the return calculated at the beginning oftheperiod,basedonthediscountrateofthecommitments.Theseactu-arial gains and losses and this different in the return on plan assets are enti-tledremeasurements.Theseremeasurementeffectsariseeitherbecausethe fair value differs from the previously made assumption or because the assumptionshavechanged.Theremeasurementeffectsarerecognisedinothercomprehensiveincome.
For funded plans, the Group recognises pension commitments in the consolidated balance sheet as a liability comprising the net of the estimated presentvalueofthecommitmentsandthefairvalueofplanassets.Fundedplans with net assets, that is, plans with assets exceeding the pension com-mitment,arerecognisedasfixedassets.
The net amount of interest on pension liabilities and the expected return onaccompanyingplanassetsisrecognisedaspartofnetfinancialitems.
The special employer’s contribution comprises a portion of the actuar-ial assumptions and thus is recognised as a portion of the net commitment/asset.Theportionofthespecialemployer’scontributionthatiscalculatedbased on the Swedish Pension Obligations Vesting Act in legal entities is recognised, for simplicity, as accrued expenses instead of as a portion of netcommitment/asset.Taxonreturnsisrecognisedcontinuouslyinprofitorlossfortheperiod
towhichthetaxpertainsandthusisnotincludedintheliabilitycalculation.For funded plans, the tax is charged to the return on plan assets and rec-ognisedinothercomprehensiveincome.Forunfundedorpartlyunfundedplans,taxischargedtoprofitorloss.
Other long-term remunerationTheGroupoperatesschemesforremunerationofemployeesforlongservice.
Actuarial gains and losses may arise when the present value of com-mitments and the fair value of plan assets are established, which are rec-ognisedinoperatingprofit.
Not 1 continued
N OT E S
NOB I A ANNUA L AND S U S TA I NA B I L I T Y R E PORT 2 018 6 5
The discount rate is established on the basis of high-quality corporate bonds issued in the same currency as the remuneration that is to be paid andwithmaturitiesequivalenttothecommitmentsinquestion.
Share-based remuneration schemesShare-basedremunerationpertainstoemployeebenefits,includingseniorexecutives in accordance with the Performance Share Plans that Nobia initiatedbetween2014and2018.Costsforemployeebenefitsarerec-ognised as the value of services received, allocated over the vesting peri-ods for the plans, calculated as the fair value of the allotted equity instru-ments(IFRS2).Thefairvalueisdeterminedontheallotmentdate,orthedate on which Nobia and the employees have agreed on the terms and conditionsoftheplans.Sincetheplansareregulatedwithequityinstru-ments,theyareclassifiedas“equitysettled”andanamountcorrespond-ingtotherecognisedcostforemployeebenefitsisrecogniseddirectlyinshareholders’equity(othercontributedcapital).ThePerformanceSharePlans2014-2015containtwotypesofrights.
Matching share rights give entitlement to Nobia shares if the participant remains in employment and retains the saving share that must initially be purchased.Performancesharerightsgiveentitlementtosharesunderthesameconditionsandiftheaccumulatedearningspersharearesufficientlyhighduringthevestingperiod.Therecognisedcostisinitiallybasedon,and regularly adjusted in relation to, the number of share rights that are expected to be vested by considering how many participants are expected to remain in service during the vesting period and the expected and actualfulfilmentofthetermsandconditionsforearningspershare.Suchan adjustment is not carried out when participants lose share rights due to selling the saving shares that they were required to purchase and must retain.Inthiscase,theentireremainingcostisimmediatelyrecognisedinstead.NomatchingsharerightswereallottedinthePerformanceSharePlan 2016, 2017 and 2018 and saving shares do not need to be purchased andretained.Thevestingconditionsarethesameasthe2014-2015Plansand,consequently,recognitiontakesplaceasdescribedabove.Whensharerightsarevestedandsharesallotted,socialsecuritycon-
tributions are paid in certain countries for the value of the employee’s benefits.Anexpenseandaprovisionarerecognised,allocatedoverthevestingperiod,forthesesocialsecuritycontributions.Theprovisionforsocial security contributions is based on the number of share rights that are expected to be vested and the fair value of the share rights on each reportingdateandfinally,fortheallotmentofshares.
Short-term remunerationShort-term remuneration of employees is calculated without discount-ingandisrecognisedasacostwhentherelatedservicesareobtained.Aprovisionispostedfortheanticipatedcostofprofitsharesandbonuspay-ments when the Group has a current legal or informal obligation to make such payments, due to the services being obtained from the employees anditbeingpossibletoreliablyestimatetheobligation.
Payments in connection with employment terminationA cost for payments arising in connection with the laying-off of employees is recognised only if the company is legally obliged to terminate employ-mentinadvanceofthenormaldate.Whensuchpaymentismadeasanoffering to encourage voluntary retirement, it is recognised as a cost if it is probable that the offer will be accepted and the number of employees whowillaccepttheofferingcanbereliablyestimated.
PARENT COMPANY ACCOUNTING POLICIESThe Parent Company has prepared its Annual Report in accordance with the Swedish Annual Accounts Act (1995:1554) and the Swedish Financial ReportingBoard’srecommendationRFR2AccountingforLegalEntities.The Financial Reporting Board’s statements for listed companies were also applied.RFR2entailsthattheParentCompanyappliesallIFRSsadoptedby the EU and statements to the Annual Report of the legal entity as far as possible under the framework of the Annual Accounts Act and the Swed-ish Pension Obligations Vesting Act and with respect to the connection betweenaccountingandtaxation.Therecommendationstatestheexcep-tionsandadditionstoIFRSthataretobemade.Overall,therecommen-dation entails differences between the Group’s and the Parent Company’s accountingpoliciesintheareasstatedbelow.Theaccountingpoliciesforthe
Parent Company described below were applied consistently to all periods presentedintheParentCompany’sfinancialstatements.
Changed accounting policiesChanges to accounting policies applied from 2018 did not have any effect ontheParentCompany’sfinancialstatements.
Classification and presentation formAn income statement and statement of comprehensive income are pre-sentedfortheParentCompanyandtheGroup.TheParentCompany’sincome statement and balance sheet are presented following the format stipulated in the Annual Accounts Act, while the statement of comprehen-sive income, the statement of changes in shareholders’ equity and cash-flowstatementarebasedonIAS1presentationofFinancialStatementsandIAS7StatementofCashFlows.ThedifferencesintheParentCompany’sincome statement and the balance sheet compared with the presentation oftheconsolidatedfinancialstatementsprimarilypertaintotherecognitionoffinancialincomeandexpenses,fixedassets,shareholders’equityandtheexistenceofprovisionsasaseparateheadinginthebalancesheet.
SubsidiariesParticipations in subsidiaries are recognised in the Parent Company in accordancewiththecostmethod.Intheconsolidatedfinancialstatements,transactioncostsarerecogniseddirectlyinprofitorlosswhentheyarise.
Contingent consideration is valued based on the probability of the con-siderationbeingpaid.Anychangestotheprovisions/receivableareaddedto/deductedfromthecost.Intheconsolidatedfinancialstatements,con-tingent considerations are measured at fair value with changes in value rec-ognisedinprofitorloss.
Bargain purchases corresponding to future losses and costs are reversed duringtheexpectedperiodsinwhichthelossesandcostsarise.Bargainpur-chases arising for other reasons are recognised as a provision to the extent thatthepurchasedoesnotexceedthefairvalueoftheacquired,identifiablenon-monetaryassets.Theportionthatexceedsthisfairvalueisrecognisedinprofitorlossimmediately.Theportionthatdoesnotexceedthefairvalueofacquired,identifiablenon-monetaryassetsisrecognisedinprofitorlosssys-tematically over a period calculated as the remaining weighted average useful lifeoftheacquiredidentifiableassetsthataredepreciable.Intheconsolidatedfinancialstatements,bargainpurchasesarerecogniseddirectlyinprofitorloss.
Leased assetsAll leases in the Parent Company are recognised in accordance with oper-atingleasesregulations.
Employee benefitsThe Parent Company applies other principles for the calculation of defined-benefitplansthanthosestipulatedinIAS19.TheParentCom-pany follows the provisions of the Pension Obligations Vesting Act and the Swedish Financial Supervisory authority’s regulations since this is a conditionforeligibilityforrightstotaxdeductions.Thesignificantdiffer-encescomparedwiththeIAS19regulationspertaintohowthediscountrateisdetermined,thatthecalculationofdefined-benefitcommitmentsbased on current salary levels with no assumptions regarding future salary increasesandthatallactuarialgainsandlossesarerecognisedinprofitorlosswhentheyarise.
The Parent Company recognises the fair value of Performance Share Plans issued to employees of subsidiaries as shareholders’ contributions by recognition in shareholders’ equity and the value of the shares in the sub-sidiary.
Group contributions The Parent Company applies the alternative rule to Group contributions paid andreceivedandrecognisestheseasappropriationsinprofitorloss.Priorto2011,Groupcontributionswererecogniseddirectlyinshareholders’equity.
Anticipated dividendsAnticipated dividends from subsidiaries are recognised if the Parent Com-pany has the sole right to decide the amount of the dividend and the Par-ent Company has made a decision on the amount of the dividend prior to thepublicationoftheParentCompany’sfinancialstatements.
Not 1 continued
N OT E S
6 6 NOB I A ANNUA L AND S U S TA I NA B I L I T Y R E PORT 2 018
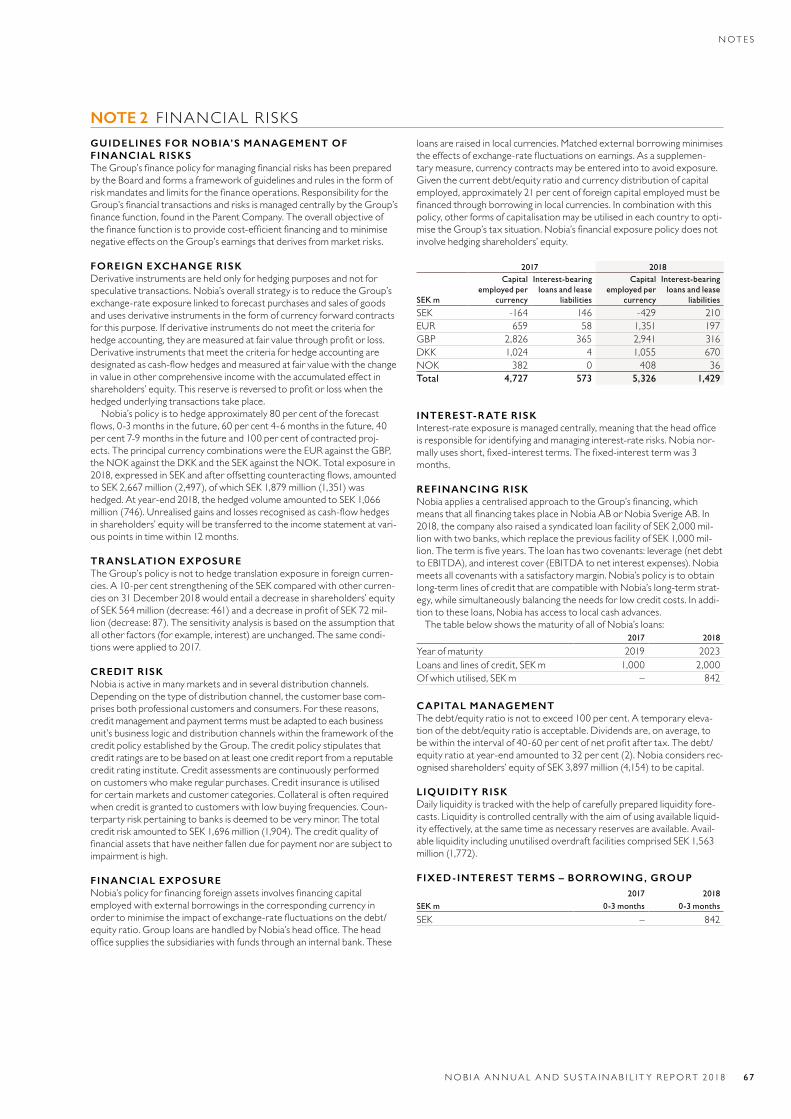
NOTE 2 F INANCIALR ISKSGUIDELINES FOR NOBIA’S MANAGEMENT OF FINANCIAL RISKSTheGroup’sfinancepolicyformanagingfinancialriskshasbeenpreparedby the Board and forms a framework of guidelines and rules in the form of riskmandatesandlimitsforthefinanceoperations.ResponsibilityfortheGroup’sfinancialtransactionsandrisksismanagedcentrallybytheGroup’sfinancefunction,foundintheParentCompany.Theoverallobjectiveofthefinancefunctionistoprovidecost-efficientfinancingandtominimisenegativeeffectsontheGroup’searningsthatderivesfrommarketrisks.
FOREIGN EXCHANGE RISKDerivative instruments are held only for hedging purposes and not for speculativetransactions.Nobia’soverallstrategyistoreducetheGroup’sexchange-rate exposure linked to forecast purchases and sales of goods and uses derivative instruments in the form of currency forward contracts forthispurpose.Ifderivativeinstrumentsdonotmeetthecriteriaforhedgeaccounting,theyaremeasuredatfairvaluethroughprofitorloss.Derivative instruments that meet the criteria for hedge accounting are designatedascash-flowhedgesandmeasuredatfairvaluewiththechangein value in other comprehensive income with the accumulated effect in shareholders’equity.Thisreserveisreversedtoprofitorlosswhenthehedgedunderlyingtransactionstakeplace.
Nobia’s policy is to hedge approximately 80 per cent of the forecast flows,0-3monthsinthefuture,60percent4-6monthsinthefuture,40per cent 7-9 months in the future and 100 per cent of contracted proj-ects.TheprincipalcurrencycombinationsweretheEURagainsttheGBP,theNOKagainsttheDKKandtheSEKagainsttheNOK.Totalexposurein2018,expressedinSEKandafteroffsettingcounteractingflows,amountedto SEK 2,667 million (2,497), of which SEK 1,879 million (1,351) was hedged.Atyear-end2018,thehedgedvolumeamountedtoSEK1,066million(746).Unrealisedgainsandlossesrecognisedascash-flowhedgesin shareholders’ equity will be transferred to the income statement at vari-ouspointsintimewithin12months.
TRANSLATION EXPOSUREThe Group’s policy is not to hedge translation exposure in foreign curren-cies.A10-percentstrengtheningoftheSEKcomparedwithothercurren-cies on 31 December 2018 would entail a decrease in shareholders’ equity ofSEK564million(decrease:461)andadecreaseinprofitofSEK72mil-lion(decrease:87).Thesensitivityanalysisisbasedontheassumptionthatallotherfactors(forexample,interest)areunchanged.Thesamecondi-tionswereappliedto2017.
CREDIT RISK Nobiaisactiveinmanymarketsandinseveraldistributionchannels.Depending on the type of distribution channel, the customer base com-prisesbothprofessionalcustomersandconsumers.Forthesereasons,credit management and payment terms must be adapted to each business unit’s business logic and distribution channels within the framework of the creditpolicyestablishedbytheGroup.Thecreditpolicystipulatesthatcredit ratings are to be based on at least one credit report from a repu table creditratinginstitute.Creditassessmentsarecontinuouslyperformedoncustomerswhomakeregularpurchases.Creditinsuranceisutilisedforcertainmarketsandcustomercategories.Collateralisoftenrequiredwhencreditisgrantedtocustomerswithlowbuyingfrequencies.Coun-terpartyriskpertainingtobanksisdeemedtobeveryminor.ThetotalcreditriskamountedtoSEK1,696million(1,904).Thecreditqualityoffinancialassetsthathaveneitherfallendueforpaymentnoraresubjecttoimpairmentishigh.
FINANCIAL EXPOSURE Nobia’spolicyforfinancingforeignassetsinvolvesfinancingcapitalemployed with external borrowings in the corresponding currency in ordertominimisetheimpactofexchange-ratefluctuationsonthedebt/equityratio.GrouploansarehandledbyNobia’sheadoffice.Theheadofficesuppliesthesubsidiarieswithfundsthroughaninternalbank.These
loansareraisedinlocalcurrencies.Matchedexternalborrowingminimisestheeffectsofexchange-ratefluctuationsonearnings.Asasupplemen-tarymeasure,currencycontractsmaybeenteredintotoavoidexposure.Given the current debt/equity ratio and currency distribution of capital employed, approximately 21 per cent of foreign capital employed must be financedthroughborrowinginlocalcurrencies.Incombinationwiththispolicy, other forms of capitalisation may be utilised in each country to opti-misetheGroup’staxsituation.Nobia’sfinancialexposurepolicydoesnotinvolvehedgingshareholders’equity.
2017 2018
SEK m
Capital employed per
currency
Interest-bearing loans and lease
liabilities
Capital employed per
currency
Interest-bearing loans and lease
liabilities
SEK -164 146 -429 210EUR 659 58 1,351 197GBP 2,826 365 2,941 316DKK 1,024 4 1,055 670NOK 382 0 408 36Total 4,727 573 5,326 1,429
INTEREST-RATE RISKInterest-rateexposureismanagedcentrally,meaningthattheheadofficeisresponsibleforidentifyingandmanaginginterest-raterisks.Nobianor-mallyusesshort,fixed-interestterms.Thefixed-interesttermwas3months.
REFINANCING RISK NobiaappliesacentralisedapproachtotheGroup’sfinancing,whichmeansthatallfinancingtakesplaceinNobiaABorNobiaSverigeAB.In2018, the company also raised a syndicated loan facility of SEK 2,000 mil-lion with two banks, which replace the previous facility of SEK 1,000 mil-lion.Thetermisfiveyears.Theloanhastwocovenants:leverage(netdebttoEBITDA),andinterestcover(EBITDAtonetinterestexpenses).Nobiameetsallcovenantswithasatisfactorymargin.Nobia’spolicyistoobtainlong-term lines of credit that are compatible with Nobia’s long-term strat-egy,whilesimultaneouslybalancingtheneedsforlowcreditcosts.Inaddi-tiontotheseloans,Nobiahasaccesstolocalcashadvances.
The table below shows the maturity of all of Nobia’s loans:2017 2018
Yearofmaturity 2019 2023Loansandlinesofcredit,SEKm 1,000 2,000Of which utilised, SEK m – 842
CAPITAL MANAGEMENT Thedebt/equityratioisnottoexceed100percent.Atemporaryeleva-tionofthedebt/equityratioisacceptable.Dividendsare,onaverage,tobewithintheintervalof40-60percentofnetprofitaftertax.Thedebt/equityratioatyear-endamountedto32percent(2).Nobiaconsidersrec-ognisedshareholders’equityofSEK3,897million(4,154)tobecapital.
LIQUIDITY RISK Daily liquidity is tracked with the help of carefully prepared liquidity fore-casts.Liquidityiscontrolledcentrallywiththeaimofusingavailableliquid-ityeffectively,atthesametimeasnecessaryreservesareavailable.Avail-able liquidity including unutilised overdraft facilities comprised SEK 1,563 million(1,772).
FIXED- INTEREST TERMS – BORROWING, GROUP2017 2018
SEK m 0-3 months 0-3 months
SEK – 842
N OT E S
NOB I A ANNUA L AND S U S TA I NA B I L I T Y R E PORT 2 018 67
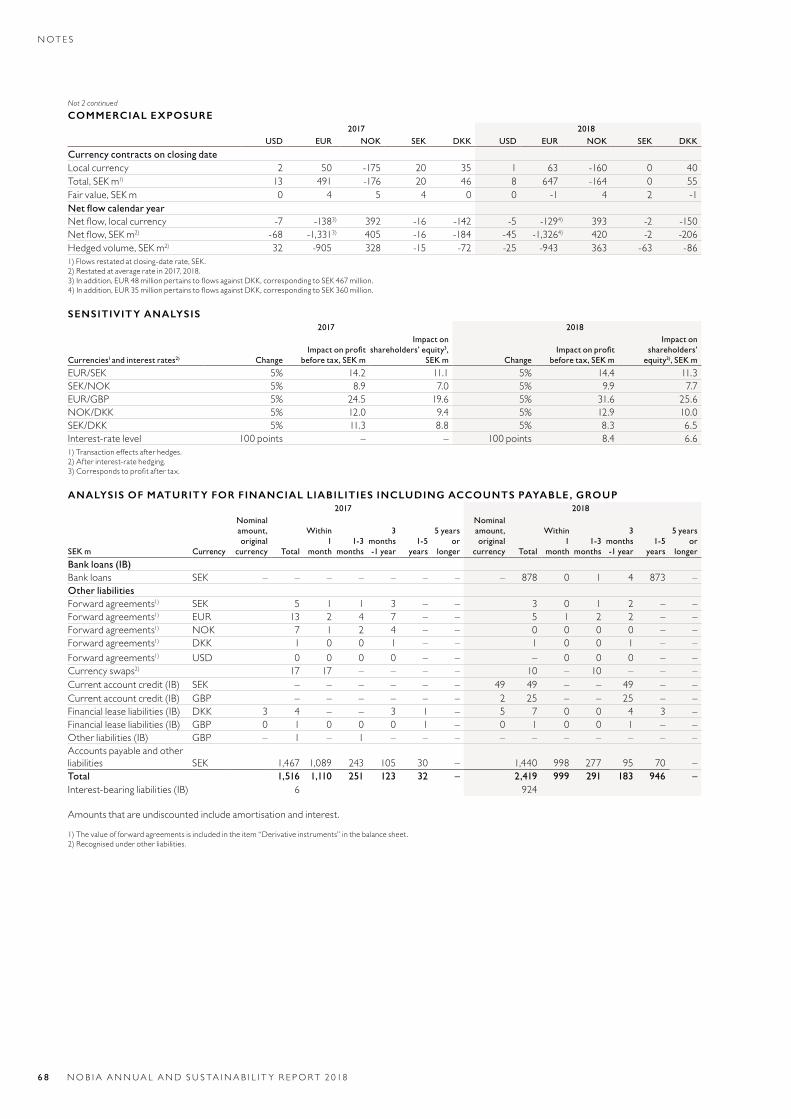
COMMERCIAL EXPOSURE2017 2018
USD EUR NOK SEK DKK USD EUR NOK SEK DKK
Currency contracts on closing dateLocalcurrency 2 50 -175 20 35 1 63 -160 0 40Total, SEK m1) 13 491 -176 20 46 8 647 -164 0 55Fair value, SEK m 0 4 5 4 0 0 -1 4 2 -1Net flow calendar yearNetflow,localcurrency -7 -1383) 392 -16 -142 -5 -1294) 393 -2 -150Netflow,SEKm2) -68 -1,3313) 405 -16 -184 -45 -1,3264) 420 -2 -206Hedged volume, SEK m2) 32 -905 328 -15 -72 -25 -943 363 -63 -861)Flowsrestatedatclosing-daterate,SEK.2)Restatedataverageratein2017,2018.3)Inaddition,EUR48millionpertainstoflowsagainstDKK,correspondingtoSEK467million.4)Inaddition,EUR35millionpertainstoflowsagainstDKK,correspondingtoSEK360million.
SENSITIVITY ANALYSIS2017 2018
Currencies1 and interest rates2) ChangeImpact on profit
before tax, SEK m
Impact on shareholders’ equity3,
SEK m ChangeImpact on profit
before tax, SEK m
Impact on shareholders’
equity3), SEK m
EUR/SEK 5% 14.2 11.1 5% 14.4 11.3SEK/NOK 5% 8.9 7.0 5% 9.9 7.7EUR/GBP 5% 24.5 19.6 5% 31.6 25.6NOK/DKK 5% 12.0 9.4 5% 12.9 10.0SEK/DKK 5% 11.3 8.8 5% 8.3 6.5Interest-ratelevel 100 points – – 100 points 8.4 6.61)Transactioneffectsafterhedges.2)Afterinterest-ratehedging.3)Correspondstoprofitaftertax.
ANALYSIS OF MATURITY FOR FINANCIAL LIABILITIES INCLUDING ACCOUNTS PAYABLE , GROUP2017 2018
SEK m Currency
Nominal amount, original
currency Total
Within 1
month1-3
months
3 months -1 year
1-5 years
5 years or
longer
Nominal amount, original
currency Total
Within 1
month1-3
months
3 months -1 year
1-5 years
5 years or
longer
Bank loans (IB)Bank loans SEK – – – – – – – – 878 0 1 4 873 –Other liabilitiesForward agreements1) SEK 5 1 1 3 – – 3 0 1 2 – –Forward agreements1) EUR 13 2 4 7 – – 5 1 2 2 – –Forward agreements1) NOK 7 1 2 4 – – 0 0 0 0 – –Forward agreements1) DKK 1 0 0 1 – – 1 0 0 1 – –Forward agreements1) USD 0 0 0 0 – – – 0 0 0 – –Currency swaps2) 17 17 – – – – 10 – 10 – – –Currentaccountcredit(IB) SEK – – – – – – 49 49 – – 49 – –Currentaccountcredit(IB) GBP – – – – – – 2 25 – – 25 – –Financialleaseliabilities(IB) DKK 3 4 – – 3 1 – 5 7 0 0 4 3 –Financialleaseliabilities(IB) GBP 0 1 0 0 0 1 – 0 1 0 0 1 – –Otherliabilities(IB) GBP – 1 – 1 – – – – – – – – – –Accounts payable and other liabilities SEK 1,467 1,089 243 105 30 – 1,440 998 277 95 70 –Total 1,516 1,110 251 123 32 – 2,419 999 291 183 946 –Interest-bearingliabilities(IB) 6 924
Amountsthatareundiscountedincludeamortisationandinterest.
1)Thevalueofforwardagreementsisincludedintheitem“Derivativeinstruments”inthebalancesheet.2)Recognisedunderotherliabilities.
Not 2 continued
N OT E S
6 8 NOB I A ANNUA L AND S U S TA I NA B I L I T Y R E PORT 2 018
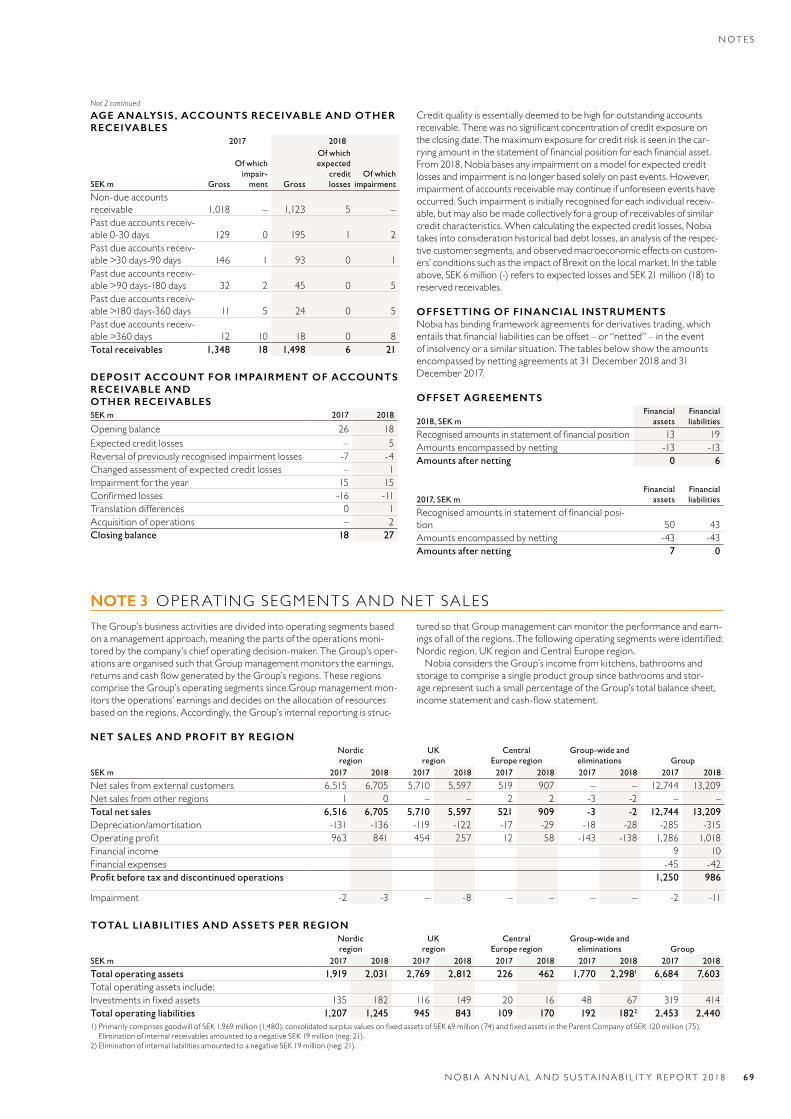
AGE ANALYSIS , ACCOUNTS RECEIVABLE AND OTHER RECEIVABLES
2017 2018
SEK m Gross
Of which impair-
ment Gross
Of which expected
credit losses
Of which impairment
Non-due accounts receivable 1,018 – 1,123 5 –Past due accounts receiv-able 0-30 days 129 0 195 1 2Past due accounts receiv-able >30 days-90 days 146 1 93 0 1Past due accounts receiv-able >90 days-180 days 32 2 45 0 5Past due accounts receiv-able >180 days-360 days 11 5 24 0 5Past due accounts receiv-able >360 days 12 10 18 0 8Total receivables 1,348 18 1,498 6 21
DEPOSIT ACCOUNT FOR IMPAIRMENT OF ACCOUNTS RECEIVABLE AND OTHER RECEIVABLESSEK m 2017 2018
Opening balance 26 18Expected credit losses – 5Reversal of previously recognised impairment losses -7 -4Changed assessment of expected credit losses – 1Impairmentfortheyear 15 15Confirmedlosses -16 -11Translation differences 0 1Acquisition of operations – 2Closing balance 18 27
Credit quality is essentially deemed to be high for outstanding accounts receivable.Therewasnosignificantconcentrationofcreditexposureontheclosingdate.Themaximumexposureforcreditriskisseeninthecar-ryingamountinthestatementoffinancialpositionforeachfinancialasset.From 2018, Nobia bases any impairment on a model for expected credit lossesandimpairmentisnolongerbasedsolelyonpastevents.However,impairment of accounts receivable may continue if unforeseen events have occurred.Suchimpairmentisinitiallyrecognisedforeachindividualreceiv-able, but may also be made collectively for a group of receivables of similar creditcharacteristics.Whencalculatingtheexpectedcreditlosses,Nobiatakes into consideration historical bad debt losses, an analysis of the respec-tive customer segments, and observed macroeconomic effects on custom-ers’conditionssuchastheimpactofBrexitonthelocalmarket.Inthetableabove, SEK 6 million (-) refers to expected losses and SEK 21 million (18) to reservedreceivables.
OFFSETTING OF FINANCIAL INSTRUMENTSNobia has binding framework agreements for derivatives trading, which entailsthatfinancialliabilitiescanbeoffset–or“netted”–intheeventofinsolvencyorasimilarsituation.Thetablesbelowshowtheamountsencompassed by netting agreements at 31 December 2018 and 31 December2017.
OFFSET AGREEMENTS
2018, SEK mFinancial
assetsFinancial liabilities
Recognisedamountsinstatementoffinancialposition 13 19Amounts encompassed by netting -13 -13Amounts after netting 0 6
2017, SEK mFinancial
assetsFinancial liabilities
Recognisedamountsinstatementoffinancialposi-tion 50 43Amounts encompassed by netting -43 -43Amounts after netting 7 0
NOTE 3 OPERATINGSEGMENTSANDNETSALESThe Group’s business activities are divided into operating segments based on a management approach, meaning the parts of the operations moni-toredbythecompany’schiefoperatingdecision-maker.TheGroup’soper-ations are organised such that Group management monitors the earnings, returnsandcashflowgeneratedbytheGroup’sregions.Theseregionscomprise the Group’s operating segments since Group management mon-itors the operations’ earnings and decides on the allocation of resources basedontheregions.Accordingly,theGroup’sinternalreportingisstruc-
tured so that Group management can monitor the performance and earn-ingsofalloftheregions.Thefollowingoperatingsegmentswereidentified:Nordicregion,UKregionandCentralEuroperegion.
Nobia considers the Group’s income from kitchens, bathrooms and storage to comprise a single product group since bathrooms and stor-age represent such a small percentage of the Group’s total balance sheet, incomestatementandcash-flowstatement.
NET SALES AND PROFIT BY REGIONNordic region
UK region
Central Europe region
Group-wide and eliminations Group
SEK m 2017 2018 2017 2018 2017 2018 2017 2018 2017 2018
Net sales from external customers 6,515 6,705 5,710 5,597 519 907 – – 12,744 13,209Net sales from other regions 1 0 – – 2 2 -3 -2 – –Total net sales 6,516 6,705 5,710 5,597 521 909 -3 -2 12,744 13,209Depreciation/amortisation -131 -136 -119 -122 -17 -29 -18 -28 -285 -315Operatingprofit 963 841 454 257 12 58 -143 -138 1,286 1,018Financial income 9 10Financial expenses -45 -42Profit before tax and discontinued operations 1,250 986
Impairment -2 -3 – -8 – – – – -2 -11
TOTAL LIABILITIES AND ASSETS PER REGIONNordic region
UK region
Central Europe region
Group-wide and eliminations Group
SEK m 2017 2018 2017 2018 2017 2018 2017 2018 2017 2018
Total operating assets 1,919 2,031 2,769 2,812 226 462 1,770 2,2981 6,684 7,603Total operating assets include:Investmentsinfixedassets 135 182 116 149 20 16 48 67 319 414Total operating liabilities 1,207 1,245 945 843 109 170 192 1822 2,453 2,4401)PrimarilycomprisesgoodwillofSEK1,969million(1,480),consolidatedsurplusvaluesonfixedassetsofSEK69million(74)andfixedassetsintheParentCompanyofSEK120million(75). EliminationofinternalreceivablesamountedtoanegativeSEK19million(neg:21).
2)EliminationofinternalliabilitiesamountedtoanegativeSEK19million(neg:21).
Not 2 continued
N OT E S
NOB I A ANNUA L AND S U S TA I NA B I L I T Y R E PORT 2 018 6 9
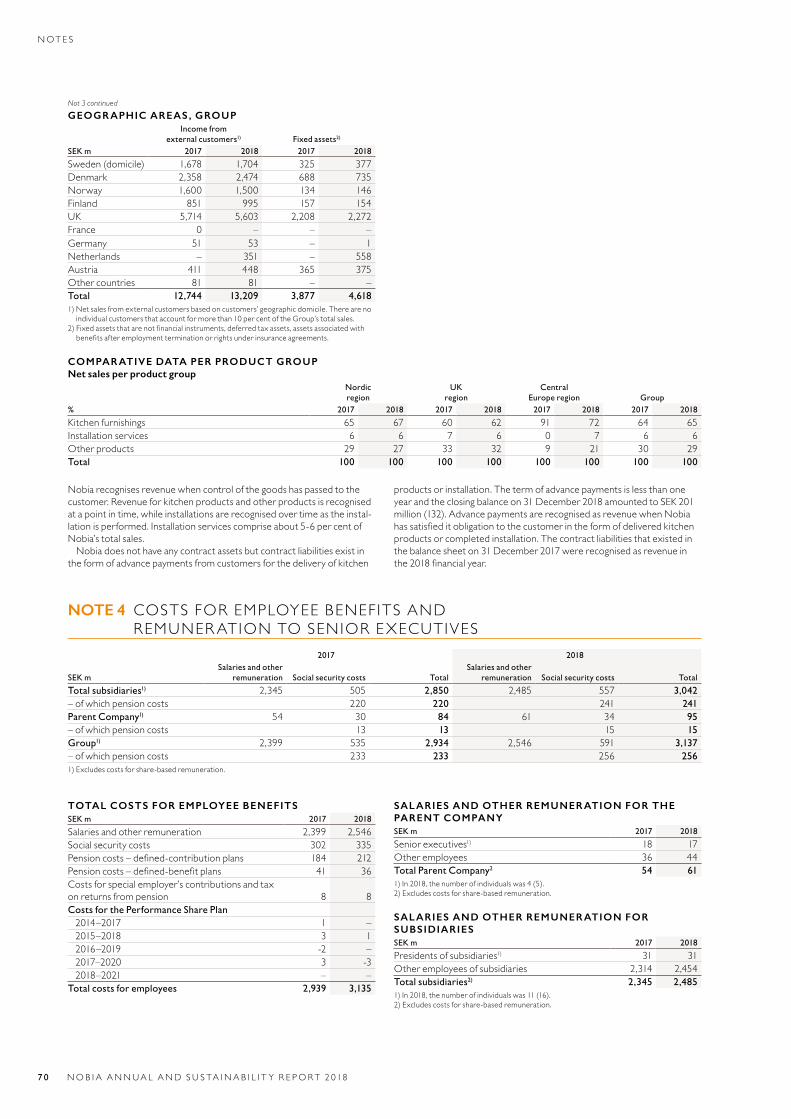
GEOGRAPHIC AREAS, GROUPIncome from
external customers1) Fixed assets2)
SEK m 2017 2018 2017 2018
Sweden (domicile) 1,678 1,704 325 377Denmark 2,358 2,474 688 735Norway 1,600 1,500 134 146Finland 851 995 157 154UK 5,714 5,603 2,208 2,272France 0 – – –Germany 51 53 – 1Netherlands – 351 – 558Austria 411 448 365 375Other countries 81 81 – –Total 12,744 13,209 3,877 4,6181)Netsalesfromexternalcustomersbasedoncustomers’geographicdomicile.Therearenoindividualcustomersthataccountformorethan10percentoftheGroup’stotalsales.
2)Fixedassetsthatarenotfinancialinstruments,deferredtaxassets,assetsassociatedwithbenefitsafteremploymentterminationorrightsunderinsuranceagreements.
COMPARATIVE DATA PER PRODUCT GROUPNet sales per product group
Nordic region
UK region
Central Europe region Group
% 2017 2018 2017 2018 2017 2018 2017 2018
Kitchen furnishings 65 67 60 62 91 72 64 65Installationservices 6 6 7 6 0 7 6 6Other products 29 27 33 32 9 21 30 29Total 100 100 100 100 100 100 100 100
Nobia recognises revenue when control of the goods has passed to the customer.Revenueforkitchenproductsandotherproductsisrecognisedat a point in time, while installations are recognised over time as the instal-lationisperformed.Installationservicescompriseabout5-6percentofNobia’stotalsales.
Nobia does not have any contract assets but contract liabilities exist in the form of advance payments from customers for the delivery of kitchen
productsorinstallation.Thetermofadvancepaymentsislessthanoneyear and the closing balance on 31 December 2018 amounted to SEK 201 million(132).AdvancepaymentsarerecognisedasrevenuewhenNobiahassatisfieditobligationtothecustomerintheformofdeliveredkitchenproductsorcompletedinstallation.Thecontractliabilitiesthatexistedinthe balance sheet on 31 December 2017 were recognised as revenue in the2018financialyear.
NOTE 4 COSTSFOREMPLOYEEBENEF ITSAND REMUNERATIONTOSENIOREXECUTIVES
2017 2018
SEK mSalaries and other
remuneration Social security costs TotalSalaries and other
remuneration Social security costs Total
Total subsidiaries1) 2,345 505 2,850 2,485 557 3,042–ofwhichpensioncosts 220 220 241 241Parent Company1) 54 30 84 61 34 95–ofwhichpensioncosts 13 13 15 15Group1) 2,399 535 2,934 2,546 591 3,137–ofwhichpensioncosts 233 233 256 2561)Excludescostsforshare-basedremuneration.
TOTAL COSTS FOR EMPLOYEE BENEFITSSEK m 2017 2018
Salaries and other remuneration 2,399 2,546Social security costs 302 335Pensioncosts–defined-contributionplans 184 212Pensioncosts–defined-benefitplans 41 36Costs for special employer’s contributions and tax on returns from pension 8 8Costs for the Performance Share Plan2014–2017 1 –2015–2018 3 12016–2019 -2 –2017–2020 3 -32018–2021 – –
Total costs for employees 2,939 3,135
SALARIES AND OTHER REMUNERATION FOR THE PARENT COMPANYSEK m 2017 2018
Senior executives1) 18 17Other employees 36 44Total Parent Company2 54 611)In2018,thenumberofindividualswas4(5).2)Excludescostsforshare-basedremuneration.
SALARIES AND OTHER REMUNERATION FOR SUBSIDIARIESSEK m 2017 2018
Presidents of subsidiaries1) 31 31Other employees of subsidiaries 2,314 2,454Total subsidiaries2) 2,345 2,4851)In2018,thenumberofindividualswas11(16).2)Excludescostsforshare-basedremuneration.
Not 3 continued
N OT E S
7 0 NOB I A ANNUA L AND S U S TA I NA B I L I T Y R E PORT 2 018
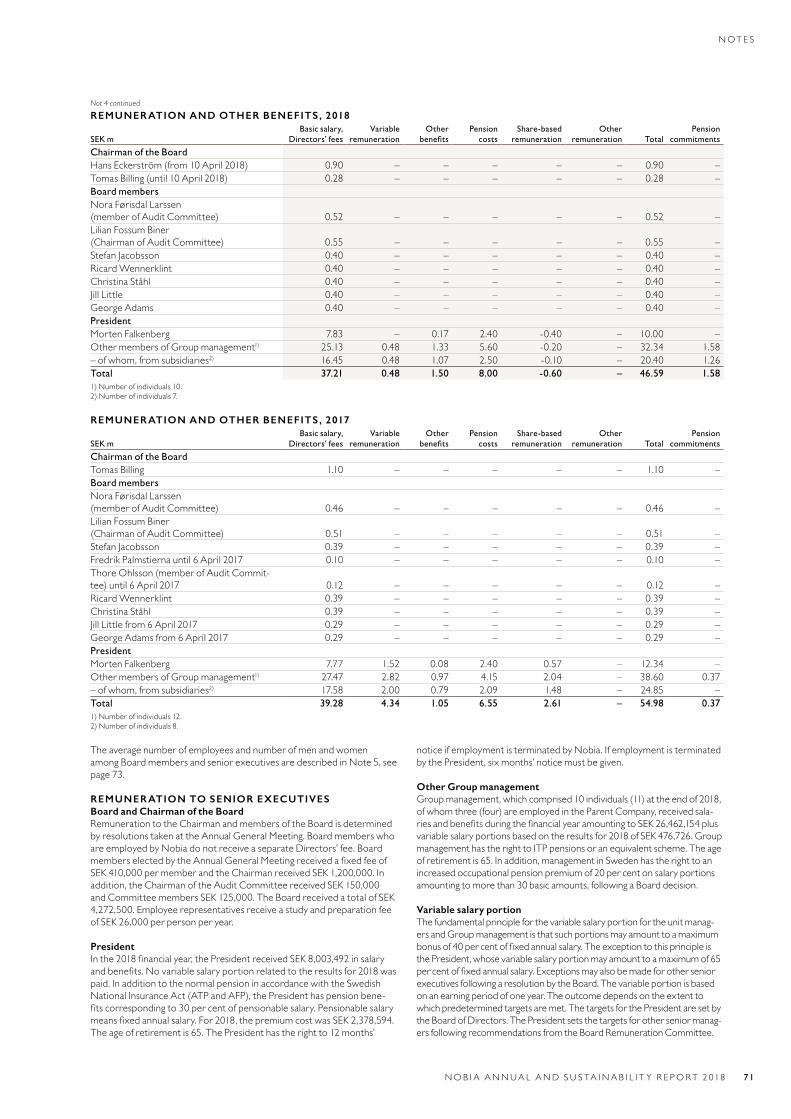
REMUNERATION AND OTHER BENEFITS, 2018
SEK mBasic salary,
Directors’ feesVariable
remunerationOther
benefitsPension
costsShare-based
remunerationOther
remuneration TotalPension
commitments
Chairman of the BoardHans Eckerström (from 10 April 2018) 0.90 – – – – – 0.90 –Tomas Billing (until 10 April 2018) 0.28 – – – – – 0.28 –Board membersNoraFørisdalLarssen(member of Audit Committee) 0.52 – – – – – 0.52 –LilianFossumBiner (Chairman of Audit Committee) 0.55 – – – – – 0.55 –StefanJacobsson 0.40 – – – – – 0.40 –RicardWennerklint 0.40 – – – – – 0.40 –Christina Ståhl 0.40 – – – – – 0.40 –JillLittle 0.40 – – – – – 0.40 –George Adams 0.40 – – – – – 0.40 –PresidentMorten Falkenberg 7.83 – 0.17 2.40 -0.40 – 10.00 –Other members of Group management1) 25.13 0.48 1.33 5.60 -0.20 – 32.34 1.58–ofwhom,fromsubsidiaries2) 16.45 0.48 1.07 2.50 -0.10 – 20.40 1.26Total 37.21 0.48 1.50 8.00 -0.60 – 46.59 1.581)Numberofindividuals10.2)Numberofindividuals7.
REMUNERATION AND OTHER BENEFITS, 2017
SEK mBasic salary,
Directors’ feesVariable
remunerationOther
benefitsPension
costsShare-based
remunerationOther
remuneration TotalPension
commitments
Chairman of the BoardTomas Billing 1.10 – – – – – 1.10 –Board membersNoraFørisdalLarssen(member of Audit Committee) 0.46 – – – – – 0.46 –LilianFossumBiner (Chairman of Audit Committee) 0.51 – – – – – 0.51 –StefanJacobsson 0.39 – – – – – 0.39 –Fredrik Palmstierna until 6 April 2017 0.10 – – – – – 0.10 –Thore Ohlsson (member of Audit Commit-tee) until 6 April 2017 0.12 – – – – – 0.12 –RicardWennerklint 0.39 – – – – – 0.39 –Christina Ståhl 0.39 – – – – – 0.39 –JillLittlefrom6April2017 0.29 – – – – – 0.29 –George Adams from 6 April 2017 0.29 – – – – – 0.29 –PresidentMorten Falkenberg 7.77 1.52 0.08 2.40 0.57 – 12.34 –Other members of Group management1) 27.47 2.82 0.97 4.15 2.04 – 38.60 0.37–ofwhom,fromsubsidiaries2) 17.58 2.00 0.79 2.09 1.48 – 24.85 –Total 39.28 4.34 1.05 6.55 2.61 – 54.98 0.371)Numberofindividuals12.2)Numberofindividuals8.
The average number of employees and number of men and women among Board members and senior executives are described in Note 5, see page73.
REMUNERATION TO SENIOR EXECUTIVES Board and Chairman of the Board Remuneration to the Chairman and members of the Board is determined byresolutionstakenattheAnnualGeneralMeeting.BoardmemberswhoareemployedbyNobiadonotreceiveaseparateDirectors’fee.BoardmemberselectedbytheAnnualGeneralMeetingreceivedafixedfeeofSEK410,000permemberandtheChairmanreceivedSEK1,200,000.Inaddition, the Chairman of the Audit Committee received SEK 150,000 andCommitteemembersSEK125,000.TheBoardreceivedatotalofSEK4,272,500.EmployeerepresentativesreceiveastudyandpreparationfeeofSEK26,000perpersonperyear.
President Inthe2018financialyear,thePresidentreceivedSEK8,003,492insalaryandbenefits.Novariablesalaryportionrelatedtotheresultsfor2018waspaid.InadditiontothenormalpensioninaccordancewiththeSwedishNationalInsuranceAct(ATPandAFP),thePresidenthaspensionbene-fitscorrespondingto30percentofpensionablesalary.Pensionablesalarymeansfixedannualsalary.For2018,thepremiumcostwasSEK2,378,594.Theageofretirementis65.ThePresidenthastherightto12months’
noticeifemploymentisterminatedbyNobia.IfemploymentisterminatedbythePresident,sixmonths’noticemustbegiven.
Other Group management Group management, which comprised 10 individuals (11) at the end of 2018, of whom three (four) are employed in the Parent Company, received sala-riesandbenefitsduringthefinancialyearamountingtoSEK26,462,154plusvariablesalaryportionsbasedontheresultsfor2018ofSEK476,726.GroupmanagementhastherighttoITPpensionsoranequivalentscheme.Theageofretirementis65.Inaddition,managementinSwedenhastherighttoanincreased occupational pension premium of 20 per cent on salary portions amountingtomorethan30basicamounts,followingaBoarddecision.
Variable salary portion The fundamental principle for the variable salary portion for the unit manag-ers and Group management is that such portions may amount to a maximum bonusof40percentoffixedannualsalary.Theexceptiontothisprincipleisthe President, whose variable salary portion may amount to a maximum of 65 percentoffixedannualsalary.ExceptionsmayalsobemadeforotherseniorexecutivesfollowingaresolutionbytheBoard.Thevariableportionisbasedonanearningperiodofoneyear.Theoutcomedependsontheextenttowhichpredeterminedtargetsaremet.ThetargetsforthePresidentaresetbytheBoardofDirectors.ThePresidentsetsthetargetsforotherseniormanag-ersfollowingrecommendationsfromtheBoardRemunerationCommittee.
Not 4 continued
N OT E S
NOB I A ANNUA L AND S U S TA I NA B I L I T Y R E PORT 2 018 71
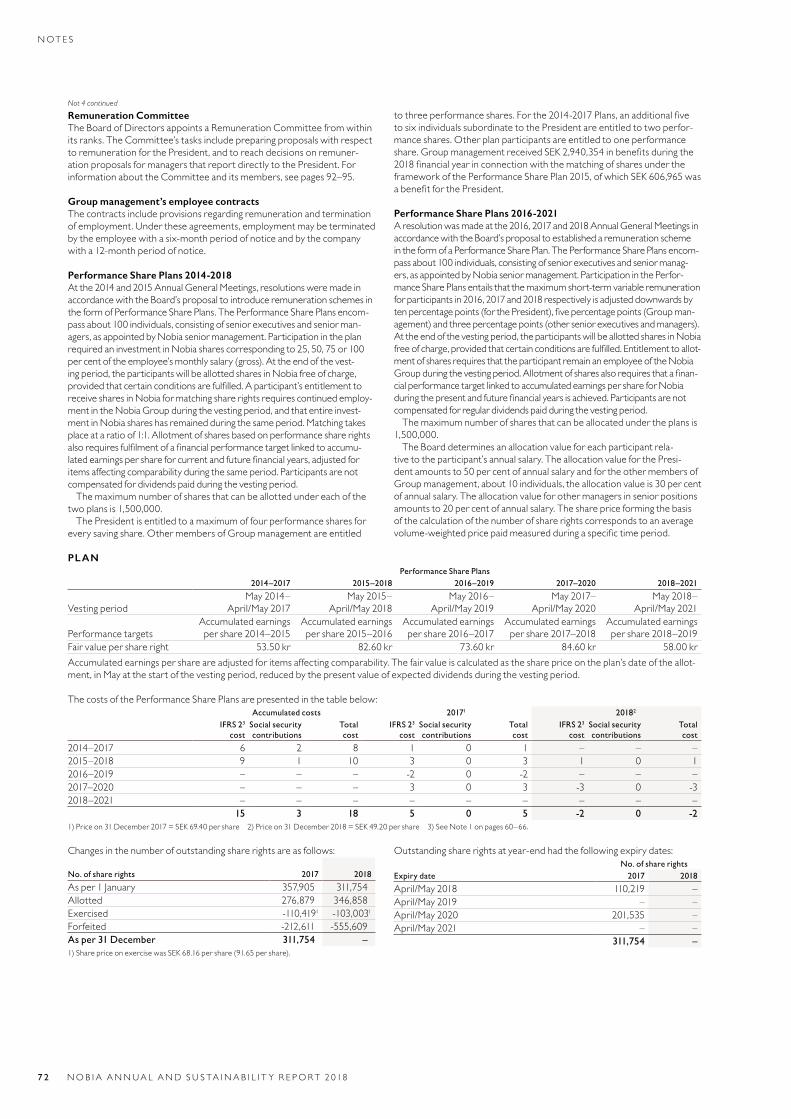
Remuneration Committee The Board of Directors appoints a Remuneration Committee from within itsranks.TheCommittee’stasksincludepreparingproposalswithrespectto remuneration for the President, and to reach decisions on remuner-ationproposalsformanagersthatreportdirectlytothePresident.ForinformationabouttheCommitteeanditsmembers,seepages92–95.
Group management’s employee contracts The contracts include provisions regarding remuneration and termination ofemployment.Undertheseagreements,employmentmaybeterminatedby the employee with a six-month period of notice and by the company witha12-monthperiodofnotice.
Performance Share Plans 2014-2018 At the 2014 and 2015 Annual General Meetings, resolutions were made in accordance with the Board’s proposal to introduce remuneration schemes in theformofPerformanceSharePlans.ThePerformanceSharePlansencom-pass about 100 individuals, consisting of senior executives and senior man-agers,asappointedbyNobiaseniormanagement.Participationintheplanrequired an investment in Nobia shares corresponding to 25, 50, 75 or 100 percentoftheemployee’smonthlysalary(gross).Attheendofthevest-ing period, the participants will be allotted shares in Nobia free of charge, providedthatcertainconditionsarefulfilled.Aparticipant’sentitlementtoreceive shares in Nobia for matching share rights requires continued employ-ment in the Nobia Group during the vesting period, and that entire invest-mentinNobiashareshasremainedduringthesameperiod.Matchingtakesplaceataratioof1:1.Allotmentofsharesbasedonperformancesharerightsalsorequiresfulfilmentofafinancialperformancetargetlinkedtoaccumu-latedearningspershareforcurrentandfuturefinancialyears,adjustedforitemsaffectingcomparabilityduringthesameperiod.Participantsarenotcompensatedfordividendspaidduringthevestingperiod.
The maximum number of shares that can be allotted under each of the twoplansis1,500,000.
The President is entitled to a maximum of four performance shares for everysavingshare.OthermembersofGroupmanagementareentitled
tothreeperformanceshares.Forthe2014-2017Plans,anadditionalfiveto six individuals subordinate to the President are entitled to two perfor-manceshares.Otherplanparticipantsareentitledtooneperformanceshare.GroupmanagementreceivedSEK2,940,354inbenefitsduringthe2018financialyearinconnectionwiththematchingofsharesundertheframework of the Performance Share Plan 2015, of which SEK 606,965 was abenefitforthePresident.
Performance Share Plans 2016-2021A resolution was made at the 2016, 2017 and 2018 Annual General Meetings in accordance with the Board’s proposal to established a remuneration scheme intheformofaPerformanceSharePlan.ThePerformanceSharePlansencom-pass about 100 individuals, consisting of senior executives and senior manag-ers,asappointedbyNobiaseniormanagement.ParticipationinthePerfor-mance Share Plans entails that the maximum short-term variable remuneration for participants in 2016, 2017 and 2018 respectively is adjusted downwards by tenpercentagepoints(forthePresident),fivepercentagepoints(Groupman-agement)andthreepercentagepoints(otherseniorexecutivesandmanagers).At the end of the vesting period, the participants will be allotted shares in Nobia freeofcharge,providedthatcertainconditionsarefulfilled.Entitlementtoallot-ment of shares requires that the participant remain an employee of the Nobia Groupduringthevestingperiod.Allotmentofsharesalsorequiresthatafinan-cial performance target linked to accumulated earnings per share for Nobia duringthepresentandfuturefinancialyearsisachieved.Participantsarenotcompensatedforregulardividendspaidduringthevestingperiod.
The maximum number of shares that can be allocated under the plans is 1,500,000.
The Board determines an allocation value for each participant rela-tivetotheparticipant’sannualsalary.TheallocationvalueforthePresi-dent amounts to 50 per cent of annual salary and for the other members of Group management, about 10 individuals, the allocation value is 30 per cent ofannualsalary.Theallocationvalueforothermanagersinseniorpositionsamountsto20percentofannualsalary.Thesharepriceformingthebasisof the calculation of the number of share rights corresponds to an average volume-weightedpricepaidmeasuredduringaspecifictimeperiod.
PLANPerformance Share Plans
2014–2017 2015–2018 2016–2019 2017–2020 2018–2021
Vesting periodMay2014–
April/May 2017May2015–
April/May 2018May2016–
April/May 2019May2017–
April/May 2020May2018–
April/May 2021
Performance targetsAccumulated earnings pershare2014–2015
Accumulated earnings pershare2015–2016
Accumulated earnings pershare2016–2017
Accumulated earnings pershare2017–2018
Accumulated earnings pershare2018–2019
Fair value per share right 53.50kr 82.60kr 73.60kr 84.60kr 58.00krAccumulatedearningspershareareadjustedforitemsaffectingcomparability.Thefairvalueiscalculatedasthesharepriceontheplan’sdateoftheallot-ment,inMayatthestartofthevestingperiod,reducedbythepresentvalueofexpecteddividendsduringthevestingperiod.
The costs of the Performance Share Plans are presented in the table below:Accumulated costs 20171 20182
IFRS 23 cost
Social security contributions
Total cost
IFRS 23 cost
Social security contributions
Total cost
IFRS 23 cost
Social security contributions
Total cost
2014–2017 6 2 8 1 0 1 – – –2015–2018 9 1 10 3 0 3 1 0 12016–2019 – – – -2 0 -2 – – –2017–2020 – – – 3 0 3 -3 0 -32018–2021 – – – – – – – – –
15 3 18 5 0 5 -2 0 -21)Priceon31December2017=SEK69.40pershare 2)Priceon31December2018=SEK49.20pershare 3)SeeNote1onpages60–66.
Changes in the number of outstanding share rights are as follows: No. of share rights 2017 2018
Asper1January 357,905 311,754Allotted 276,879 346,858Exercised -110,4191 -103,0031
Forfeited -212,611 -555,609As per 31 December 311,754 –1)SharepriceonexercisewasSEK68.16pershare(91.65pershare).
Outstanding share rights at year-end had the following expiry dates:No. of share rights
Expiry date 2017 2018
April/May 2018 110,219 –April/May 2019 – –April/May 2020 201,535 –April/May 2021 – –
311,754 –
Not 4 continued
N OT E S
7 2 NOB I A ANNUA L AND S U S TA I NA B I L I T Y R E PORT 2 018
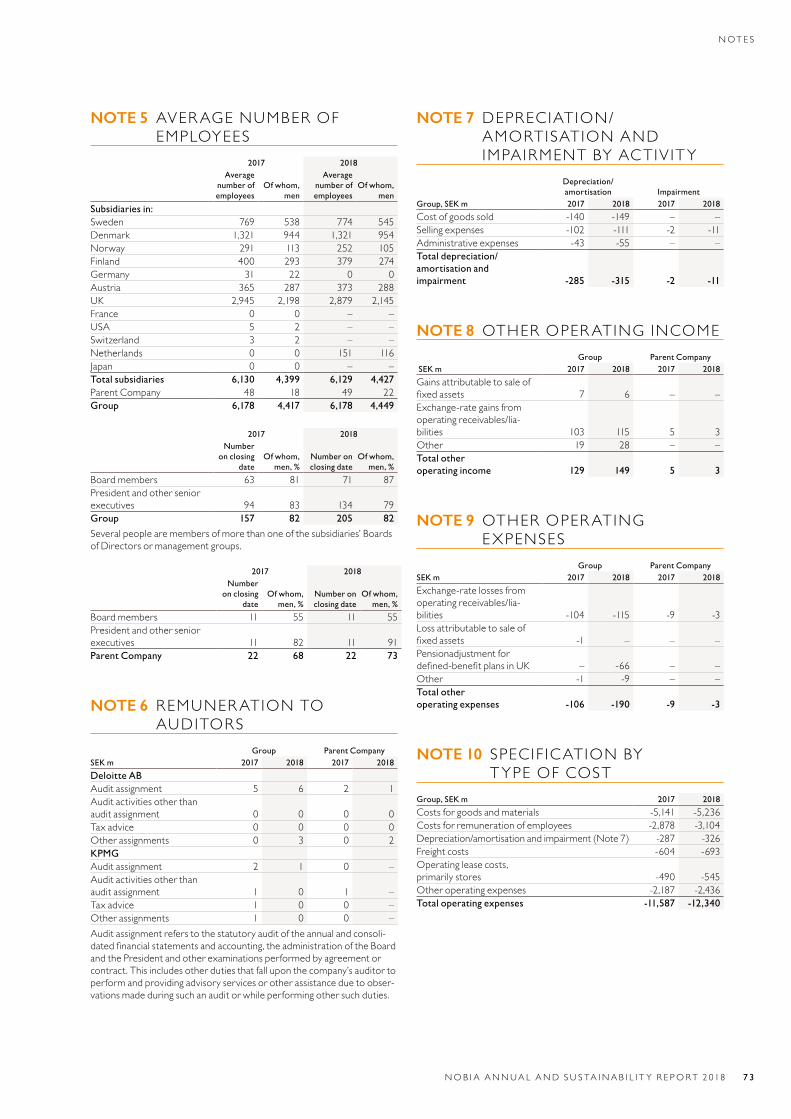
NOTE 5 AVER AGE NUMBER OF EMPLOYEES
2017 2018Average
number of employees
Of whom, men
Average number of employees
Of whom, men
Subsidiaries in:Sweden 769 538 774 545Denmark 1,321 944 1,321 954Norway 291 113 252 105Finland 400 293 379 274Germany 31 22 0 0Austria 365 287 373 288UK 2,945 2,198 2,879 2,145France 0 0 – –USA 5 2 – –Switzerland 3 2 – –Netherlands 0 0 151 116Japan 0 0 – –Total subsidiaries 6,130 4,399 6,129 4,427Parent Company 48 18 49 22Group 6,178 4,417 6,178 4,449
2017 2018Number
on closing date
Of whom, men, %
Number on closing date
Of whom, men, %
Board members 63 81 71 87President and other senior executives 94 83 134 79Group 157 82 205 82
Several people are members of more than one of the subsidiaries’ Boards ofDirectorsormanagementgroups.
2017 2018Number
on closing date
Of whom, men, %
Number on closing date
Of whom, men, %
Board members 11 55 11 55President and other senior executives 11 82 11 91Parent Company 22 68 22 73
NOTE 6 REMUNERATIONTO AUDITORS
Group Parent CompanySEK m 2017 2018 2017 2018
Deloitte ABAudit assignment 5 6 2 1Audit activities other than audit assignment 0 0 0 0Tax advice 0 0 0 0Other assignments 0 3 0 2KPMG Audit assignment 2 1 0 –Audit activities other than audit assignment 1 0 1 –Tax advice 1 0 0 –Other assignments 1 0 0 –Audit assignment refers to the statutory audit of the annual and consoli-datedfinancialstatementsandaccounting,theadministrationoftheBoardand the President and other examinations performed by agreement or contract.Thisincludesotherdutiesthatfalluponthecompany’sauditortoperform and providing advisory services or other assistance due to obser-vationsmadeduringsuchanauditorwhileperformingothersuchduties.
NOTE 7 DEPRECIATION/AMORTISATIONANDIMPAIRMENTBYACTIV ITY
Depreciation/amortisation Impairment
Group, SEK m 2017 2018 2017 2018
Cost of goods sold -140 -149 – –Selling expenses -102 -111 -2 -11Administrative expenses -43 -55 – –Total depreciation/ amortisation and impairment -285 -315 -2 -11
NOTE 8 OTHEROPERATINGINCOMEGroup Parent Company
SEK m 2017 2018 2017 2018
Gains attributable to sale of fixedassets 7 6 – –Exchange-rate gains from operating receivables/lia-bilities 103 115 5 3Other 19 28 – –Total other operating income 129 149 5 3
NOTE 9 OTHEROPERATINGEXPENSES
Group Parent CompanySEK m 2017 2018 2017 2018
Exchange-rate losses from operating receivables/lia-bilities -104 -115 -9 -3Lossattributabletosaleoffixedassets -1 – – –Pensionadjustment for defined-benefitplansinUK – -66 – –Other -1 -9 – –Total other operating expenses -106 -190 -9 -3
NOTE 10 SPECIF ICATIONBY TYPEOFCOST
Group, SEK m 2017 2018
Costs for goods and materials -5,141 -5,236Costs for remuneration of employees -2,878 -3,104Depreciation/amortisation and impairment (Note 7) -287 -326Freight costs -604 -693Operating lease costs, primarily stores -490 -545Other operating expenses -2,187 -2,436Total operating expenses -11,587 -12,340
N OT E S
NOB I A ANNUA L AND S U S TA I NA B I L I T Y R E PORT 2 018 7 3
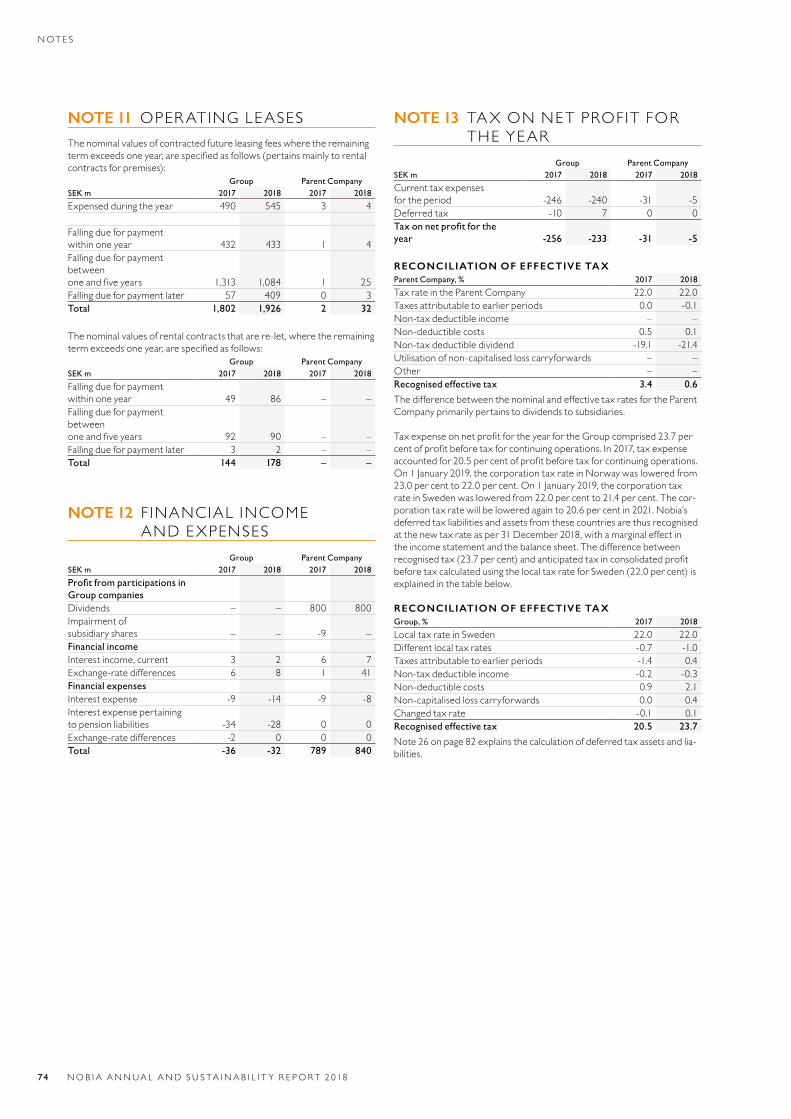
NOTE 11 OPERATINGLEASESThe nominal values of contracted future leasing fees where the remaining termexceedsoneyear,arespecifiedasfollows(pertainsmainlytorentalcontracts for premises):
Group Parent CompanySEK m 2017 2018 2017 2018
Expensed during the year 490 545 3 4
Falling due for payment within one year 432 433 1 4Falling due for payment between oneandfiveyears 1,313 1,084 1 25Falling due for payment later 57 409 0 3Total 1,802 1,926 2 32
The nominal values of rental contracts that are re-let, where the remaining termexceedsoneyear,arespecifiedasfollows:
Group Parent CompanySEK m 2017 2018 2017 2018
Falling due for payment within one year 49 86 – –Falling due for payment between oneandfiveyears 92 90 – –Falling due for payment later 3 2 – –Total 144 178 – –
NOTE 12 F INANCIALINCOME AND EXPENSES
Group Parent CompanySEK m 2017 2018 2017 2018
Profit from participations in Group companiesDividends – – 800 800Impairmentof subsidiary shares – – -9 –Financial incomeInterestincome,current 3 2 6 7Exchange-rate differences 6 8 1 41Financial expensesInterestexpense -9 -14 -9 -8Interestexpensepertainingto pension liabilities -34 -28 0 0Exchange-rate differences -2 0 0 0Total -36 -32 789 840
NOTE 13 TAXONNETPROFITFORTHEYEAR
Group Parent CompanySEK m 2017 2018 2017 2018
Current tax expenses for the period -246 -240 -31 -5Deferred tax -10 7 0 0Tax on net profit for the year -256 -233 -31 -5
RECONCILIATION OF EFFECTIVE TAX Parent Company, % 2017 2018
Tax rate in the Parent Company 22.0 22.0Taxes attributable to earlier periods 0.0 -0.1Non-tax deductible income – –Non-deductible costs 0.5 0.1Non-tax deductible dividend -19.1 -21.4Utilisation of non-capitalised loss carryforwards – –Other – –Recognised effective tax 3.4 0.6
The difference between the nominal and effective tax rates for the Parent Companyprimarilypertainstodividendstosubsidiaries.
TaxexpenseonnetprofitfortheyearfortheGroupcomprised23.7percentofprofitbeforetaxforcontinuingoperations.In2017,taxexpenseaccountedfor20.5percentofprofitbeforetaxforcontinuingoperations.On1January2019,thecorporationtaxrateinNorwaywasloweredfrom23.0percentto22.0percent.On1January2019,thecorporationtaxrateinSwedenwasloweredfrom22.0percentto21.4percent.Thecor-porationtaxratewillbeloweredagainto20.6percentin2021.Nobia’sdeferred tax liabilities and assets from these countries are thus recognised at the new tax rate as per 31 December 2018, with a marginal effect in theincomestatementandthebalancesheet.Thedifferencebetweenrecognisedtax(23.7percent)andanticipatedtaxinconsolidatedprofitbeforetaxcalculatedusingthelocaltaxrateforSweden(22.0percent)isexplainedinthetablebelow.
RECONCILIATION OF EFFECTIVE TAXGroup, % 2017 2018
LocaltaxrateinSweden 22.0 22.0Different local tax rates -0.7 -1.0Taxes attributable to earlier periods -1.4 0.4Non-tax deductible income -0.2 -0.3Non-deductible costs 0.9 2.1Non-capitalised loss carryforwards 0.0 0.4Changed tax rate -0.1 0.1Recognised effective tax 20.5 23.7
Note 26 on page 82 explains the calculation of deferred tax assets and lia-bilities.
N OT E S
74 NOB I A ANNUA L AND S U S TA I NA B I L I T Y R E PORT 2 018
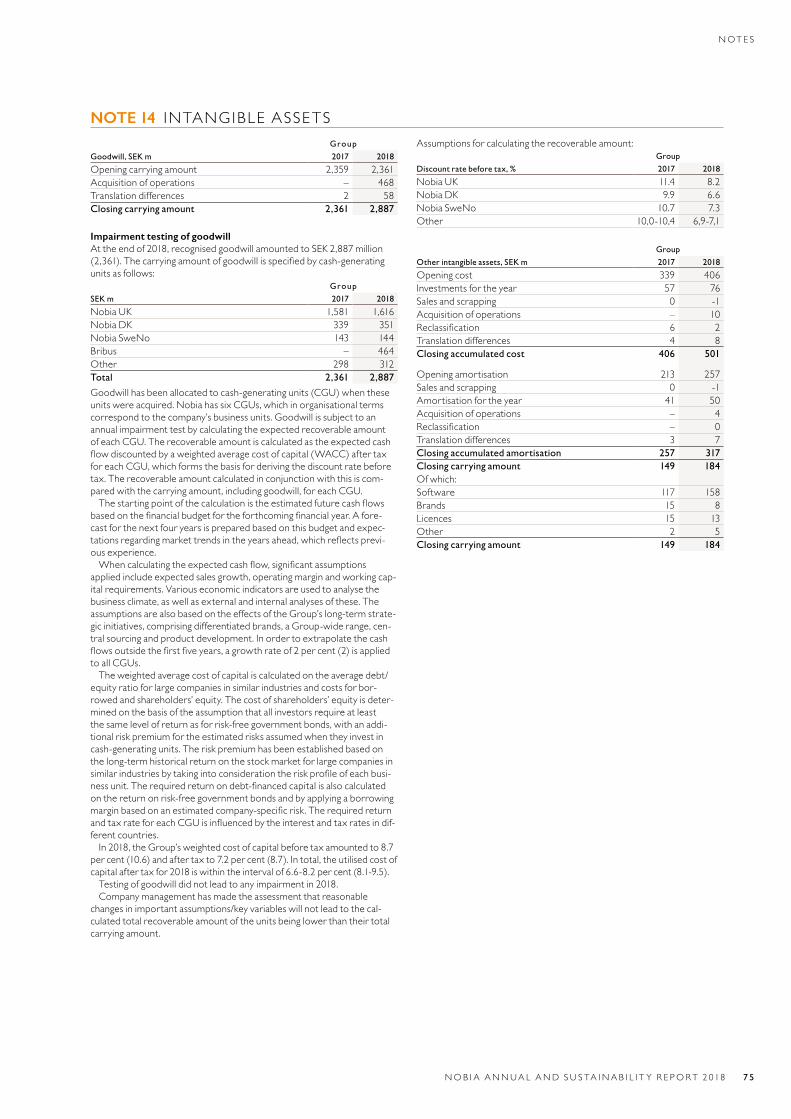
NOTE 14 INTANGIBLEASSETS Group Goodwill, SEK m 2017 2018
Opening carrying amount 2,359 2,361Acquisition of operations – 468Translation differences 2 58Closing carrying amount 2,361 2,887
Impairment testing of goodwillAt the end of 2018, recognised goodwill amounted to SEK 2,887 million (2,361).Thecarryingamountofgoodwillisspecifiedbycash-generatingunits as follows: Group
SEK m 2017 2018
Nobia UK 1,581 1,616Nobia DK 339 351Nobia SweNo 143 144Bribus – 464Other 298 312Total 2,361 2,887
Goodwill has been allocated to cash-generating units (CGU) when these unitswereacquired.NobiahassixCGUs,whichinorganisationaltermscorrespondtothecompany’sbusinessunits.Goodwillissubjecttoanannual impairment test by calculating the expected recoverable amount ofeachCGU.Therecoverableamountiscalculatedastheexpectedcashflowdiscountedbyaweightedaveragecostofcapital(WACC)aftertaxfor each CGU, which forms the basis for deriving the discount rate before tax.Therecoverableamountcalculatedinconjunctionwiththisiscom-paredwiththecarryingamount,includinggoodwill,foreachCGU.Thestartingpointofthecalculationistheestimatedfuturecashflows
basedonthefinancialbudgetfortheforthcomingfinancialyear.Afore-cast for the next four years is prepared based on this budget and expec-tationsregardingmarkettrendsintheyearsahead,whichreflectsprevi-ousexperience.Whencalculatingtheexpectedcashflow,significantassumptions
applied include expected sales growth, operating margin and working cap-italrequirements.Variouseconomicindicatorsareusedtoanalysethebusinessclimate,aswellasexternalandinternalanalysesofthese.Theassumptions are also based on the effects of the Group’s long-term strate-gic initiatives, comprising differentiated brands, a Group-wide range, cen-tralsourcingandproductdevelopment.Inordertoextrapolatethecashflowsoutsidethefirstfiveyears,agrowthrateof2percent(2)isappliedtoallCGUs.
The weighted average cost of capital is calculated on the average debt/equity ratio for large companies in similar industries and costs for bor-rowedandshareholders’equity.Thecostofshareholders’equityisdeter-mined on the basis of the assumption that all investors require at least the same level of return as for risk-free government bonds, with an addi-tional risk premium for the estimated risks assumed when they invest in cash-generatingunits.Theriskpremiumhasbeenestablishedbasedonthe long-term historical return on the stock market for large companies in similarindustriesbytakingintoconsiderationtheriskprofileofeachbusi-nessunit.Therequiredreturnondebt-financedcapitalisalsocalculatedon the return on risk-free government bonds and by applying a borrowing marginbasedonanestimatedcompany-specificrisk.TherequiredreturnandtaxrateforeachCGUisinfluencedbytheinterestandtaxratesindif-ferentcountries.In2018,theGroup’sweightedcostofcapitalbeforetaxamountedto8.7
percent(10.6)andaftertaxto7.2percent(8.7).Intotal,theutilisedcostofcapitalaftertaxfor2018iswithintheintervalof6.6-8.2percent(8.1-9.5).Testingofgoodwilldidnotleadtoanyimpairmentin2018.Company management has made the assessment that reasonable
changes in important assumptions/key variables will not lead to the cal-culated total recoverable amount of the units being lower than their total carryingamount.
Assumptions for calculating the recoverable amount: Group
Discount rate before tax, % 2017 2018
Nobia UK 11.4 8.2Nobia DK 9.9 6.6Nobia SweNo 10.7 7.3Other 10,0-10,4 6,9-7,1
Group
Other intangible assets, SEK m 2017 2018
Opening cost 339 406Investmentsfortheyear 57 76Sales and scrapping 0 -1Acquisition of operations – 10Reclassification 6 2Translation differences 4 8Closing accumulated cost 406 501
Opening amortisation 213 257Sales and scrapping 0 -1Amortisation for the year 41 50Acquisition of operations – 4Reclassification – 0Translation differences 3 7Closing accumulated amortisation 257 317Closing carrying amount 149 184Of which:Software 117 158Brands 15 8Licences 15 13Other 2 5Closing carrying amount 149 184
N OT E S
NOB I A ANNUA L AND S U S TA I NA B I L I T Y R E PORT 2 018 7 5
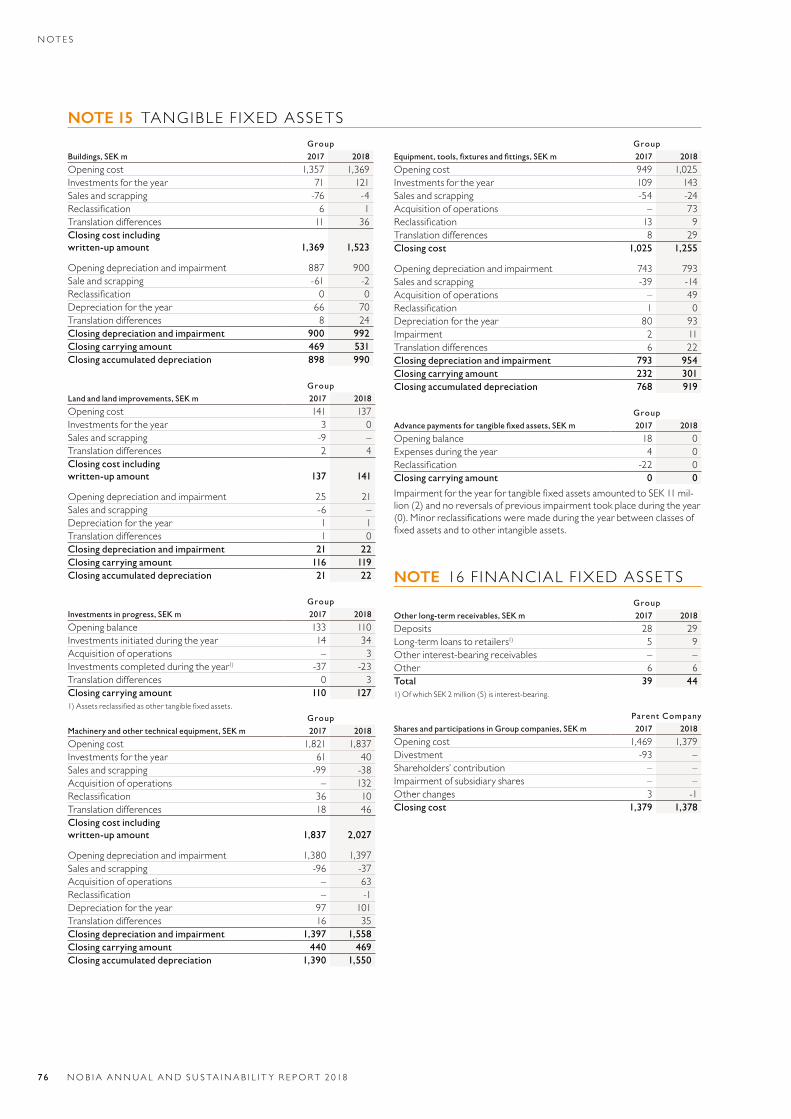
NOTE 15 TANGIBLEF IXEDASSETS Group
Buildings, SEK m 2017 2018
Opening cost 1,357 1,369Investmentsfortheyear 71 121Sales and scrapping -76 -4Reclassification 6 1Translation differences 11 36Closing cost including written-up amount 1,369 1,523
Opening depreciation and impairment 887 900Sale and scrapping -61 -2Reclassification 0 0Depreciation for the year 66 70Translation differences 8 24Closing depreciation and impairment 900 992Closing carrying amount 469 531Closing accumulated depreciation 898 990 Group
Land and land improvements, SEK m 2017 2018
Opening cost 141 137Investmentsfortheyear 3 0Sales and scrapping -9 –Translation differences 2 4Closing cost including written-up amount 137 141
Opening depreciation and impairment 25 21Sales and scrapping -6 –Depreciation for the year 1 1Translation differences 1 0Closing depreciation and impairment 21 22Closing carrying amount 116 119Closing accumulated depreciation 21 22 Group
Investments in progress, SEK m 2017 2018
Opening balance 133 110Investmentsinitiatedduringtheyear 14 34Acquisition of operations – 3Investmentscompletedduringtheyear1) -37 -23Translation differences 0 3Closing carrying amount 110 1271)Assetsreclassifiedasothertangiblefixedassets. Group
Machinery and other technical equipment, SEK m 2017 2018
Opening cost 1,821 1,837Investmentsfortheyear 61 40Sales and scrapping -99 -38Acquisition of operations – 132Reclassification 36 10Translation differences 18 46Closing cost including written-up amount 1,837 2,027
Opening depreciation and impairment 1,380 1,397Sales and scrapping -96 -37Acquisition of operations – 63Reclassification – -1Depreciation for the year 97 101Translation differences 16 35Closing depreciation and impairment 1,397 1,558Closing carrying amount 440 469Closing accumulated depreciation 1,390 1,550
Group
Equipment, tools, fixtures and fittings, SEK m 2017 2018
Opening cost 949 1,025Investmentsfortheyear 109 143Sales and scrapping -54 -24Acquisition of operations – 73Reclassification 13 9Translation differences 8 29Closing cost 1,025 1,255
Opening depreciation and impairment 743 793Sales and scrapping -39 -14Acquisition of operations – 49Reclassification 1 0Depreciation for the year 80 93Impairment 2 11Translation differences 6 22Closing depreciation and impairment 793 954Closing carrying amount 232 301Closing accumulated depreciation 768 919
Group
Advance payments for tangible fixed assets, SEK m 2017 2018
Opening balance 18 0Expenses during the year 4 0Reclassification -22 0Closing carrying amount 0 0
ImpairmentfortheyearfortangiblefixedassetsamountedtoSEK11mil-lion (2) and no reversals of previous impairment took place during the year (0).Minorreclassificationsweremadeduringtheyearbetweenclassesoffixedassetsandtootherintangibleassets.
NOTE 16F INANCIALF IXEDASSETS Group
Other long-term receivables, SEK m 2017 2018
Deposits 28 29Long-termloanstoretailers1) 5 9Other interest-bearing receivables – –Other 6 6Total 39 441)OfwhichSEK2million(5)isinterest-bearing.
Parent Company
Shares and participations in Group companies, SEK m 2017 2018
Opening cost 1,469 1,379Divestment -93 –Shareholders’ contribution – –Impairmentofsubsidiaryshares – –Other changes 3 -1Closing cost 1,379 1,378
N OT E S
76 NOB I A ANNUA L AND S U S TA I NA B I L I T Y R E PORT 2 018
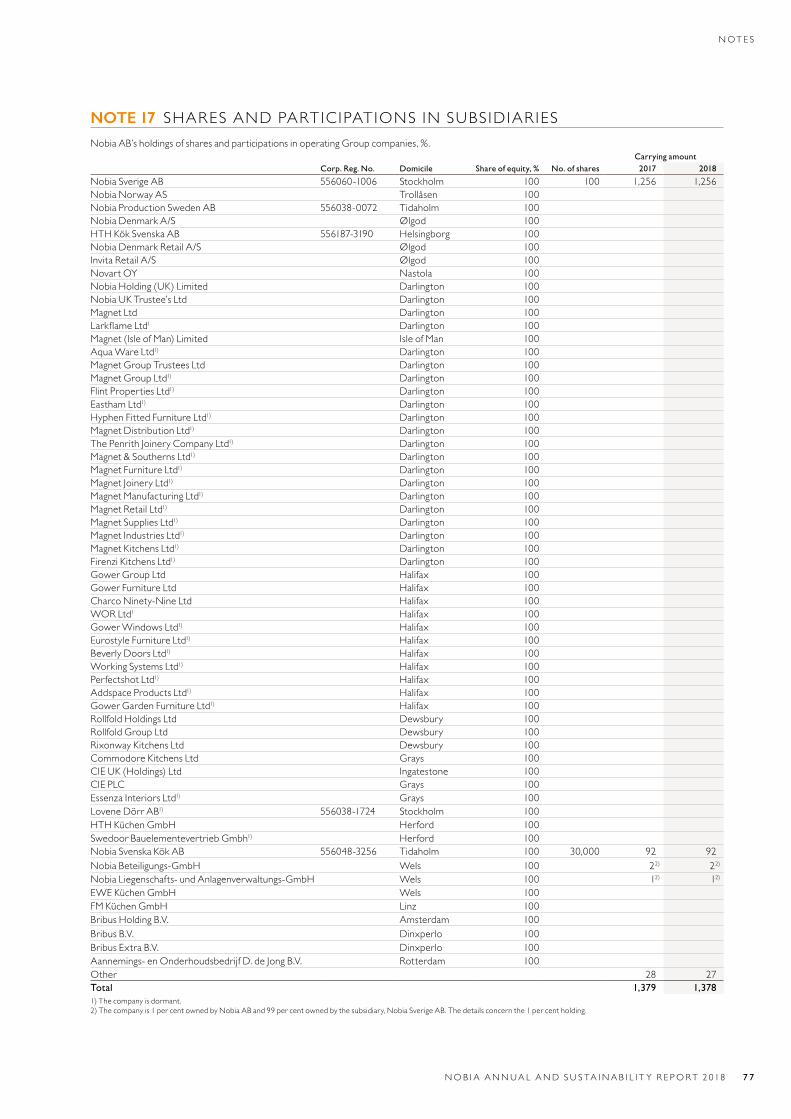
NOTE 17 SHARESANDPARTICIPATIONSINSUBS IDIAR IESNobiaAB’sholdingsofsharesandparticipationsinoperatingGroupcompanies,%.
Carrying amountCorp. Reg. No. Domicile Share of equity, % No. of shares 2017 2018
Nobia Sverige AB 556060-1006 Stockholm 100 100 1,256 1,256Nobia Norway AS Trollåsen 100Nobia Production Sweden AB 556038-0072 Tidaholm 100Nobia Denmark A/S Ølgod 100HTH Kök Svenska AB 556187-3190 Helsingborg 100Nobia Denmark Retail A/S Ølgod 100InvitaRetailA/S Ølgod 100NovartOY Nastola 100NobiaHolding(UK)Limited Darlington 100NobiaUKTrustee’sLtd Darlington 100MagnetLtd Darlington 100LarkflameLtd1 Darlington 100Magnet(IsleofMan)Limited IsleofMan 100AquaWareLtd1) Darlington 100MagnetGroupTrusteesLtd Darlington 100MagnetGroupLtd1) Darlington 100FlintPropertiesLtd1) Darlington 100EasthamLtd1) Darlington 100HyphenFittedFurnitureLtd1) Darlington 100MagnetDistributionLtd1) Darlington 100ThePenrithJoineryCompanyLtd1) Darlington 100Magnet&SouthernsLtd1) Darlington 100MagnetFurnitureLtd1) Darlington 100MagnetJoineryLtd1) Darlington 100MagnetManufacturingLtd1) Darlington 100MagnetRetailLtd1) Darlington 100MagnetSuppliesLtd1) Darlington 100MagnetIndustriesLtd1) Darlington 100MagnetKitchensLtd1) Darlington 100FirenziKitchensLtd1) Darlington 100GowerGroupLtd Halifax 100GowerFurnitureLtd Halifax 100CharcoNinety-NineLtd Halifax 100WORLtd1 Halifax 100GowerWindowsLtd1) Halifax 100EurostyleFurnitureLtd1) Halifax 100BeverlyDoorsLtd1) Halifax 100WorkingSystemsLtd1) Halifax 100PerfectshotLtd1) Halifax 100AddspaceProductsLtd1) Halifax 100GowerGardenFurnitureLtd1) Halifax 100RollfoldHoldingsLtd Dewsbury 100RollfoldGroupLtd Dewsbury 100RixonwayKitchensLtd Dewsbury 100CommodoreKitchensLtd Grays 100CIEUK(Holdings)Ltd Ingatestone 100CIEPLC Grays 100EssenzaInteriorsLtd1) Grays 100LoveneDörrAB1) 556038-1724 Stockholm 100HTH Küchen GmbH Herford 100Swedoor Bauelementevertrieb Gmbh1) Herford 100Nobia Svenska Kök AB 556048-3256 Tidaholm 100 30,000 92 92Nobia Beteiligungs-GmbH Wels 100 22) 22)
NobiaLiegenschafts-undAnlagenverwaltungs-GmbH Wels 100 12) 12)
EWEKüchenGmbH Wels 100FM Küchen GmbH Linz 100BribusHoldingB.V. Amsterdam 100BribusB.V. Dinxperlo 100BribusExtraB.V. Dinxperlo 100Aannemings-enOnderhoudsbedrijfD.deJongB.V. Rotterdam 100Other 28 27Total 1,379 1,3781)Thecompanyisdormant.2)Thecompanyis1percentownedbyNobiaABand99percentownedbythesubsidiary,NobiaSverigeAB.Thedetailsconcernthe1percentholding.
N OT E S
NOB I A ANNUA L AND S U S TA I NA B I L I T Y R E PORT 2 018 7 7
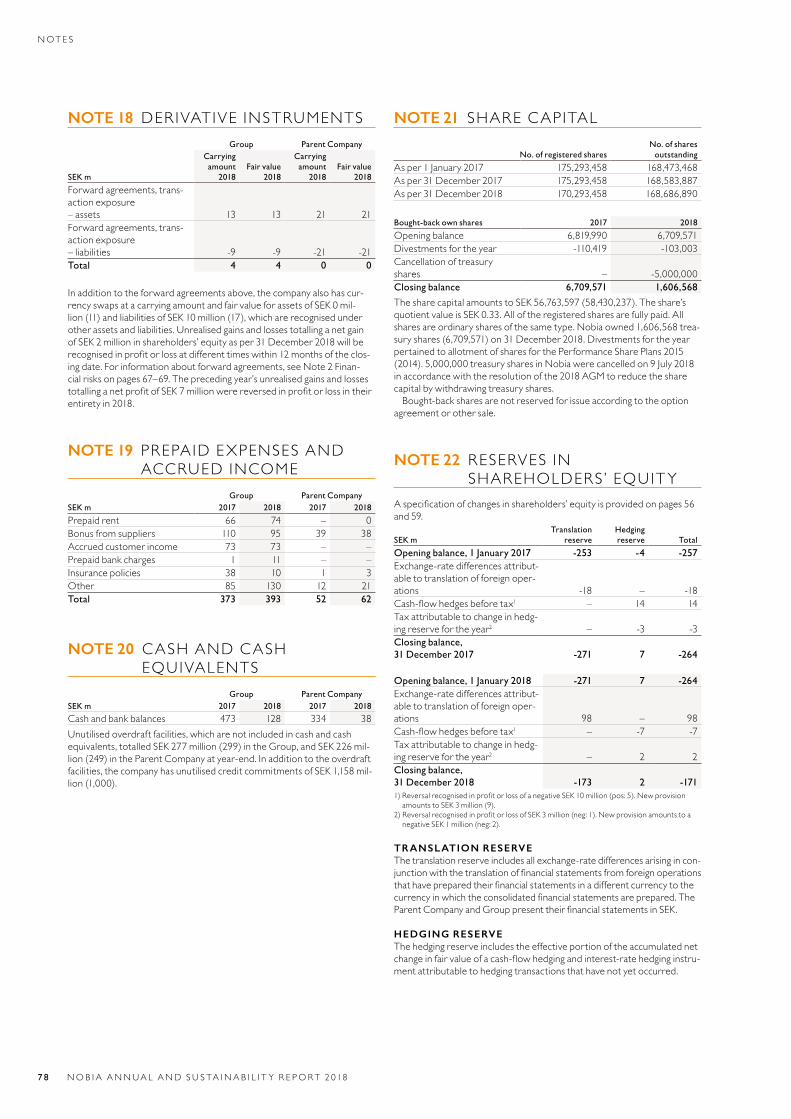
NOTE 18 DER IVATIVEINSTRUMENTSGroup Parent Company
SEK m
Carrying amount
2018Fair value
2018
Carrying amount
2018Fair value
2018
Forward agreements, trans-action exposure –assets 13 13 21 21Forward agreements, trans-action exposure –liabilities -9 -9 -21 -21Total 4 4 0 0
Inadditiontotheforwardagreementsabove,thecompanyalsohascur-rency swaps at a carrying amount and fair value for assets of SEK 0 mil-lion (11) and liabilities of SEK 10 million (17), which are recognised under otherassetsandliabilities.Unrealisedgainsandlossestotallinganetgainof SEK 2 million in shareholders’ equity as per 31 December 2018 will be recognisedinprofitorlossatdifferenttimeswithin12monthsoftheclos-ingdate.Forinformationaboutforwardagreements,seeNote2Finan-cialrisksonpages67–69.Theprecedingyear’sunrealisedgainsandlossestotallinganetprofitofSEK7millionwerereversedinprofitorlossintheirentiretyin2018.
NOTE 19 PREPAIDEXPENSESANDACCRUEDINCOME
Group Parent CompanySEK m 2017 2018 2017 2018
Prepaid rent 66 74 – 0Bonus from suppliers 110 95 39 38Accrued customer income 73 73 – –Prepaid bank charges 1 11 – –Insurancepolicies 38 10 1 3Other 85 130 12 21Total 373 393 52 62
NOTE 20 CASH AND CASH EQUIVALENTS
Group Parent CompanySEK m 2017 2018 2017 2018
Cash and bank balances 473 128 334 38Unutilised overdraft facilities, which are not included in cash and cash equivalents, totalled SEK 277 million (299) in the Group, and SEK 226 mil-lion(249)intheParentCompanyatyear-end.Inadditiontotheoverdraftfacilities, the company has unutilised credit commitments of SEK 1,158 mil-lion(1,000).
NOTE 21 SHARECAPITAL
No. of registered sharesNo. of shares
outstanding
Asper1January2017 175,293,458 168,473,468As per 31 December 2017 175,293,458 168,583,887As per 31 December 2018 170,293,458 168,686,890
Bought-back own shares 2017 2018
Opening balance 6,819,990 6,709,571Divestments for the year -110,419 -103,003Cancellation of treasury shares – -5,000,000Closing balance 6,709,571 1,606,568
ThesharecapitalamountstoSEK56,763,597(58,430,237).Theshare’squotientvalueisSEK0.33.Alloftheregisteredsharesarefullypaid.Allsharesareordinarysharesofthesametype.Nobiaowned1,606,568trea-suryshares(6,709,571)on31December2018.Divestmentsfortheyearpertained to allotment of shares for the Performance Share Plans 2015 (2014).5,000,000treasurysharesinNobiawerecancelledon9July2018in accordance with the resolution of the 2018 AGM to reduce the share capitalbywithdrawingtreasuryshares.
Bought-back shares are not reserved for issue according to the option agreementorothersale.
NOTE 22 RESERVESINSHAREHOLDERS’ EQUITY
Aspecificationofchangesinshareholders’equityisprovidedonpages56and59.
SEK mTranslation
reserveHedging reserve Total
Opening balance, 1 January 2017 -253 -4 -257Exchange-rate differences attribut-able to translation of foreign oper-ations -18 – -18Cash-flowhedgesbeforetax1 – 14 14Tax attributable to change in hedg-ing reserve for the year2 – -3 -3Closing balance, 31 December 2017 -271 7 -264
Opening balance, 1 January 2018 -271 7 -264Exchange-rate differences attribut-able to translation of foreign oper-ations 98 – 98Cash-flowhedgesbeforetax1 – -7 -7Tax attributable to change in hedg-ing reserve for the year2 – 2 2Closing balance, 31 December 2018 -173 2 -1711)ReversalrecognisedinprofitorlossofanegativeSEK10million(pos:5).NewprovisionamountstoSEK3million(9).
2)ReversalrecognisedinprofitorlossofSEK3million(neg:1).NewprovisionamountstoanegativeSEK1million(neg:2).
TRANSLATION RESERVE The translation reserve includes all exchange-rate differences arising in con-junctionwiththetranslationoffinancialstatementsfromforeignoperationsthathavepreparedtheirfinancialstatementsinadifferentcurrencytothecurrencyinwhichtheconsolidatedfinancialstatementsareprepared.TheParentCompanyandGrouppresenttheirfinancialstatementsinSEK.
HEDGING RESERVE The hedging reserve includes the effective portion of the accumulated net changeinfairvalueofacash-flowhedgingandinterest-ratehedginginstru-mentattributabletohedgingtransactionsthathavenotyetoccurred.
N OT E S
7 8 NOB I A ANNUA L AND S U S TA I NA B I L I T Y R E PORT 2 018
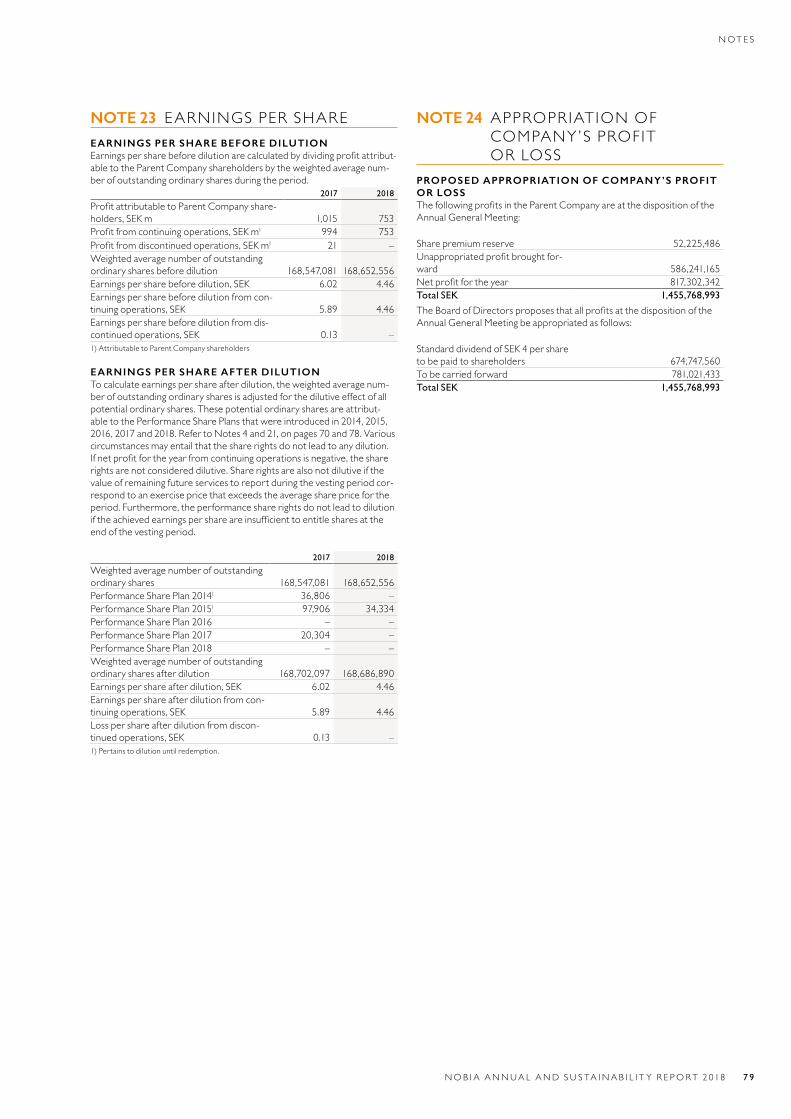
NOTE 23 EARNINGSPERSHAREEARNINGS PER SHARE BEFORE DILUTION Earningspersharebeforedilutionarecalculatedbydividingprofitattribut-able to the Parent Company shareholders by the weighted average num-berofoutstandingordinarysharesduringtheperiod.
2017 2018
ProfitattributabletoParentCompanyshare-holders, SEK m 1,015 753Profitfromcontinuingoperations,SEKm1 994 753Profitfromdiscontinuedoperations,SEKm1 21 –Weightedaveragenumberofoutstanding ordinary shares before dilution 168,547,081 168,652,556Earnings per share before dilution, SEK 6.02 4.46Earnings per share before dilution from con-tinuing operations, SEK 5.89 4.46Earnings per share before dilution from dis-continued operations, SEK 0.13 –1) Attributable to Parent Company shareholders
EARNINGS PER SHARE AFTER DILUTION To calculate earnings per share after dilution, the weighted average num-ber of outstanding ordinary shares is adjusted for the dilutive effect of all potentialordinaryshares.Thesepotentialordinarysharesareattribut-able to the Performance Share Plans that were introduced in 2014, 2015, 2016,2017and2018.RefertoNotes4and21,onpages70and78.Variouscircumstancesmayentailthatthesharerightsdonotleadtoanydilution.Ifnetprofitfortheyearfromcontinuingoperationsisnegative,thesharerightsarenotconsidereddilutive.Sharerightsarealsonotdilutiveifthevalue of remaining future services to report during the vesting period cor-respond to an exercise price that exceeds the average share price for the period.Furthermore,theperformancesharerightsdonotleadtodilutioniftheachievedearningspershareareinsufficienttoentitlesharesattheendofthevestingperiod.
2017 2018
Weightedaveragenumberofoutstandingordinary shares 168,547,081 168,652,556Performance Share Plan 20141 36,806 –Performance Share Plan 20151 97,906 34,334Performance Share Plan 2016 – –Performance Share Plan 2017 20,304 –Performance Share Plan 2018 – –Weightedaveragenumberofoutstandingordinary shares after dilution 168,702,097 168,686,890Earnings per share after dilution, SEK 6.02 4.46Earnings per share after dilution from con-tinuing operations, SEK 5.89 4.46Losspershareafterdilutionfromdiscon-tinued operations, SEK 0.13 –1)Pertainstodilutionuntilredemption.
NOTE 24 APPROPR IATIONOFCOMPANY’SPROFIT ORLOSS
PROPOSED APPROPRIATION OF COMPANY’S PROFIT OR LOSS ThefollowingprofitsintheParentCompanyareatthedispositionoftheAnnual General Meeting:
Share premium reserve 52,225,486 Unappropriatedprofitbroughtfor-ward 586,241,165 Netprofitfortheyear 817,302,342 Total SEK 1,455,768,993
TheBoardofDirectorsproposesthatallprofitsatthedispositionoftheAnnual General Meeting be appropriated as follows:
Standard dividend of SEK 4 per share to be paid to shareholders 674,747,560 To be carried forward 781,021,433 Total SEK 1,455,768,993
N OT E S
NOB I A ANNUA L AND S U S TA I NA B I L I T Y R E PORT 2 018 7 9
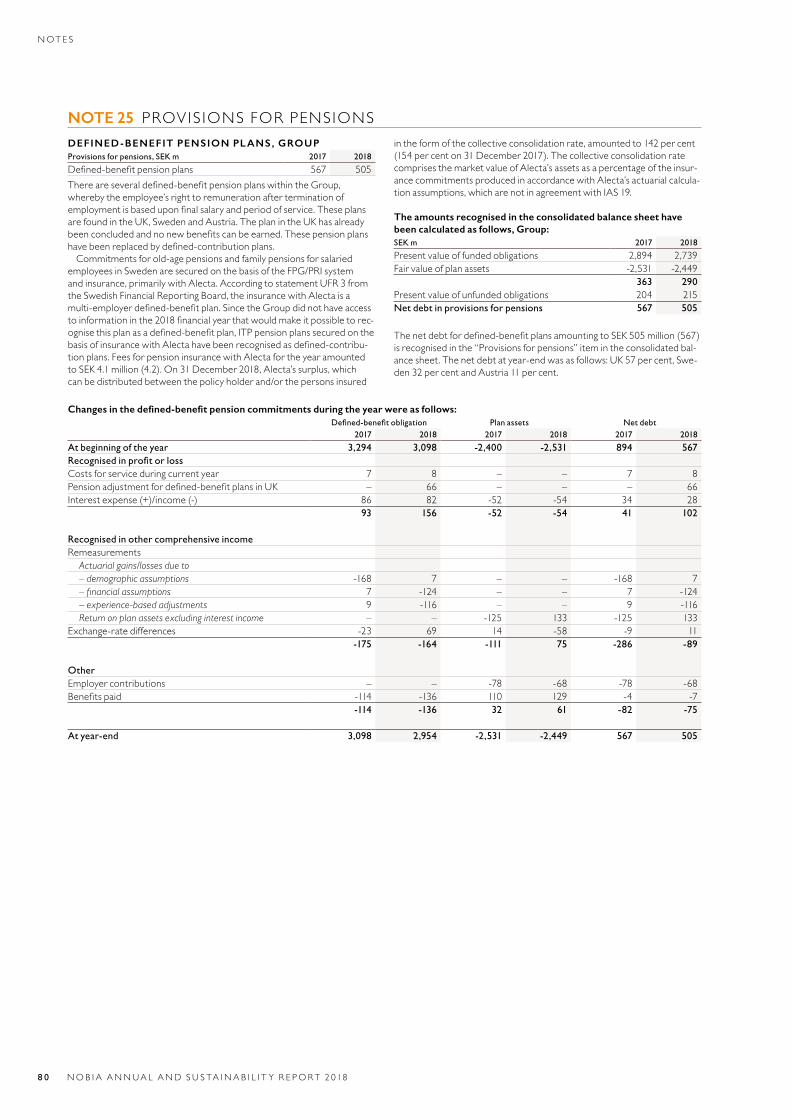
NOTE 25 PROVIS IONSFORPENSIONSDEFINED-BENEFIT PENSION PLANS, GROUP Provisions for pensions, SEK m 2017 2018
Defined-benefitpensionplans 567 505Thereareseveraldefined-benefitpensionplanswithintheGroup,whereby the employee’s right to remuneration after termination of employmentisbaseduponfinalsalaryandperiodofservice.TheseplansarefoundintheUK,SwedenandAustria.TheplanintheUKhasalreadybeenconcludedandnonewbenefitscanbeearned.Thesepensionplanshavebeenreplacedbydefined-contributionplans.
Commitments for old-age pensions and family pensions for salaried employeesinSwedenaresecuredonthebasisoftheFPG/PRIsystemandinsurance,primarilywithAlecta.AccordingtostatementUFR3fromthe Swedish Financial Reporting Board, the insurance with Alecta is a multi-employerdefined-benefitplan.SincetheGroupdidnothaveaccesstoinformationinthe2018financialyearthatwouldmakeitpossibletorec-ognisethisplanasadefined-benefitplan,ITPpensionplanssecuredonthebasisofinsurancewithAlectahavebeenrecognisedasdefined-contribu-tionplans.FeesforpensioninsurancewithAlectafortheyearamountedtoSEK4.1million(4.2).On31December2018,Alecta’ssurplus,whichcan be distributed between the policy holder and/or the persons insured
in the form of the collective consolidation rate, amounted to 142 per cent (154percenton31December2017).Thecollectiveconsolidationratecomprises the market value of Alecta’s assets as a percentage of the insur-ance commitments produced in accordance with Alecta’s actuarial calcula-tionassumptions,whicharenotinagreementwithIAS19.
The amounts recognised in the consolidated balance sheet have been calculated as follows, Group:SEK m 2017 2018
Present value of funded obligations 2,894 2,739Fair value of plan assets -2,531 -2,449
363 290Present value of unfunded obligations 204 215Net debt in provisions for pensions 567 505
Thenetdebtfordefined-benefitplansamountingtoSEK505million(567)is recognised in the “Provisions for pensions” item in the consolidated bal-ancesheet.Thenetdebtatyear-endwasasfollows:UK57percent,Swe-den32percentandAustria11percent.
Changes in the defined-benefit pension commitments during the year were as follows:Defined-benefit obligation Plan assets Net debt
2017 2018 2017 2018 2017 2018
At beginning of the year 3,294 3,098 -2,400 -2,531 894 567Recognised in profit or lossCosts for service during current year 7 8 – – 7 8Pensionadjustmentfordefined-benefitplansinUK – 66 – – – 66Interestexpense(+)/income(-) 86 82 -52 -54 34 28
93 156 -52 -54 41 102
Recognised in other comprehensive incomeRemeasurements
Actuarial gains/losses due to– demographic assumptions -168 7 – – -168 7– financial assumptions 7 -124 – – 7 -124– experience-based adjustments 9 -116 – – 9 -116Return on plan assets excluding interest income – – -125 133 -125 133
Exchange-rate differences -23 69 14 -58 -9 11-175 -164 -111 75 -286 -89
OtherEmployer contributions – – -78 -68 -78 -68Benefitspaid -114 -136 110 129 -4 -7
-114 -136 32 61 -82 -75
At year-end 3,098 2,954 -2,531 -2,449 567 505
N OT E S
8 0 NOB I A ANNUA L AND S U S TA I NA B I L I T Y R E PORT 2 018
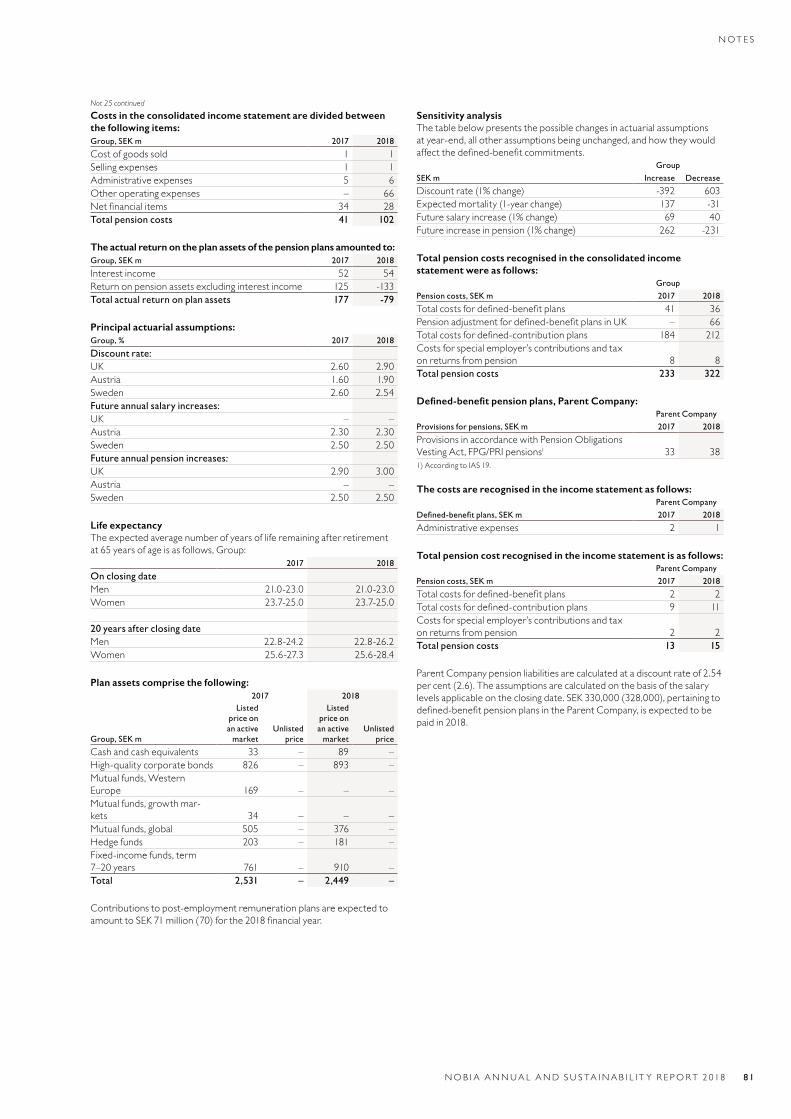
Costs in the consolidated income statement are divided between the following items: Group, SEK m 2017 2018
Cost of goods sold 1 1Selling expenses 1 1Administrative expenses 5 6Other operating expenses – 66Netfinancialitems 34 28Total pension costs 41 102
The actual return on the plan assets of the pension plans amounted to:Group, SEK m 2017 2018
Interestincome 52 54Return on pension assets excluding interest income 125 -133Total actual return on plan assets 177 -79
Principal actuarial assumptions: Group, % 2017 2018
Discount rate:UK 2.60 2.90Austria 1.60 1.90Sweden 2.60 2.54Future annual salary increases:UK – –Austria 2.30 2.30Sweden 2.50 2.50Future annual pension increases:UK 2.90 3.00Austria – –Sweden 2.50 2.50
Life expectancyThe expected average number of years of life remaining after retirement at 65 years of age is as follows, Group:
2017 2018
On closing dateMen 21.0-23.0 21.0-23.0Women 23.7-25.0 23.7-25.0
20 years after closing dateMen 22.8-24.2 22.8-26.2Women 25.6-27.3 25.6-28.4
Plan assets comprise the following: 2017 2018
Group, SEK m
Listed price on an active
marketUnlisted
price
Listed price on an active
marketUnlisted
price
Cash and cash equivalents 33 – 89 –High-quality corporate bonds 826 – 893 –Mutualfunds,WesternEurope 169 – – –Mutual funds, growth mar-kets 34 – – –Mutual funds, global 505 – 376 –Hedge funds 203 – 181 –Fixed-income funds, term 7–20years 761 – 910 –Total 2,531 – 2,449 –
Contributions to post-employment remuneration plans are expected to amounttoSEK71million(70)forthe2018financialyear.
Sensitivity analysisThe table below presents the possible changes in actuarial assumptions at year-end, all other assumptions being unchanged, and how they would affectthedefined-benefitcommitments. Group
SEK m Increase Decrease
Discount rate (1% change) -392 603Expected mortality (1-year change) 137 -31Future salary increase (1% change) 69 40Future increase in pension (1% change) 262 -231
Total pension costs recognised in the consolidated income statement were as follows: Group Pension costs, SEK m 2017 2018
Totalcostsfordefined-benefitplans 41 36Pensionadjustmentfordefined-benefitplansinUK – 66Totalcostsfordefined-contributionplans 184 212Costs for special employer’s contributions and tax on returns from pension 8 8Total pension costs 233 322
Defined-benefit pension plans, Parent Company: Parent Company Provisions for pensions, SEK m 2017 2018
Provisions in accordance with Pension Obligations VestingAct,FPG/PRIpensions1 33 381)AccordingtoIAS19.
The costs are recognised in the income statement as follows: Parent Company Defined-benefit plans, SEK m 2017 2018
Administrative expenses 2 1
Total pension cost recognised in the income statement is as follows: Parent Company Pension costs, SEK m 2017 2018
Totalcostsfordefined-benefitplans 2 2Totalcostsfordefined-contributionplans 9 11Costs for special employer’s contributions and tax on returns from pension 2 2Total pension costs 13 15
ParentCompanypensionliabilitiesarecalculatedatadiscountrateof2.54percent(2.6).Theassumptionsarecalculatedonthebasisofthesalarylevelsapplicableontheclosingdate.SEK330,000(328,000),pertainingtodefined-benefitpensionplansintheParentCompany,isexpectedtobepaidin2018.
Not 25 continued
N OT E S
NOB I A ANNUA L AND S U S TA I NA B I L I T Y R E PORT 2 018 81
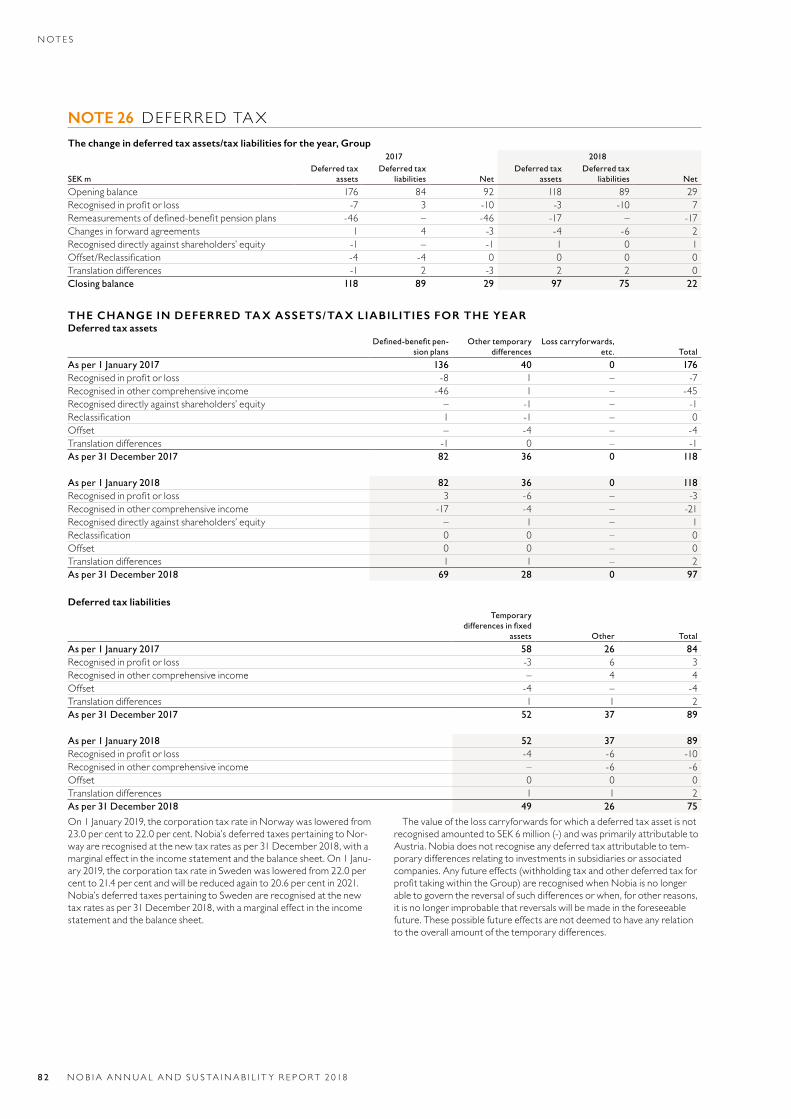
NOTE 26 DEFERRED TA XThe change in deferred tax assets/tax liabilities for the year, Group
2017 2018
SEK mDeferred tax
assetsDeferred tax
liabilities NetDeferred tax
assetsDeferred tax
liabilities Net
Opening balance 176 84 92 118 89 29Recognisedinprofitorloss -7 3 -10 -3 -10 7Remeasurementsofdefined-benefitpensionplans -46 – -46 -17 – -17Changes in forward agreements 1 4 -3 -4 -6 2Recognised directly against shareholders’ equity -1 – -1 1 0 1Offset/Reclassification -4 -4 0 0 0 0Translation differences -1 2 -3 2 2 0Closing balance 118 89 29 97 75 22
THE CHANGE IN DEFERRED TAX ASSETS/TAX LIABILITIES FOR THE YEAR Deferred tax assets
Defined-benefit pen-sion plans
Other temporary differences
Loss carryforwards, etc. Total
As per 1 January 2017 136 40 0 176Recognisedinprofitorloss -8 1 – -7Recognised in other comprehensive income -46 1 – -45Recognised directly against shareholders’ equity – -1 – -1Reclassification 1 -1 – 0Offset – -4 – -4Translation differences -1 0 – -1As per 31 December 2017 82 36 0 118
As per 1 January 2018 82 36 0 118Recognisedinprofitorloss 3 -6 – -3Recognised in other comprehensive income -17 -4 – -21Recognised directly against shareholders’ equity – 1 – 1Reclassification 0 0 – 0Offset 0 0 – 0Translation differences 1 1 – 2As per 31 December 2018 69 28 0 97
Deferred tax liabilitiesTemporary
differences in fixed assets Other Total
As per 1 January 2017 58 26 84Recognisedinprofitorloss -3 6 3Recognised in other comprehensive income – 4 4Offset -4 – -4Translation differences 1 1 2As per 31 December 2017 52 37 89
As per 1 January 2018 52 37 89Recognisedinprofitorloss -4 -6 -10Recognised in other comprehensive income – -6 -6Offset 0 0 0Translation differences 1 1 2As per 31 December 2018 49 26 75
On1January2019,thecorporationtaxrateinNorwaywasloweredfrom23.0percentto22.0percent.Nobia’sdeferredtaxespertainingtoNor-way are recognised at the new tax rates as per 31 December 2018, with a marginaleffectintheincomestatementandthebalancesheet.On1Janu-ary2019,thecorporationtaxrateinSwedenwasloweredfrom22.0percentto21.4percentandwillbereducedagainto20.6percentin2021.Nobia’s deferred taxes pertaining to Sweden are recognised at the new tax rates as per 31 December 2018, with a marginal effect in the income statementandthebalancesheet.
The value of the loss carryforwards for which a deferred tax asset is not recognised amounted to SEK 6 million (-) and was primarily attributable to Austria.Nobiadoesnotrecogniseanydeferredtaxattributabletotem-porary differences relating to investments in subsidiaries or associated companies.Anyfutureeffects(withholdingtaxandotherdeferredtaxforprofittakingwithintheGroup)arerecognisedwhenNobiaisnolongerable to govern the reversal of such differences or when, for other reasons, it is no longer improbable that reversals will be made in the foreseeable future.Thesepossiblefutureeffectsarenotdeemedtohaveanyrelationtotheoverallamountofthetemporarydifferences.
N OT E S
8 2 NOB I A ANNUA L AND S U S TA I NA B I L I T Y R E PORT 2 018
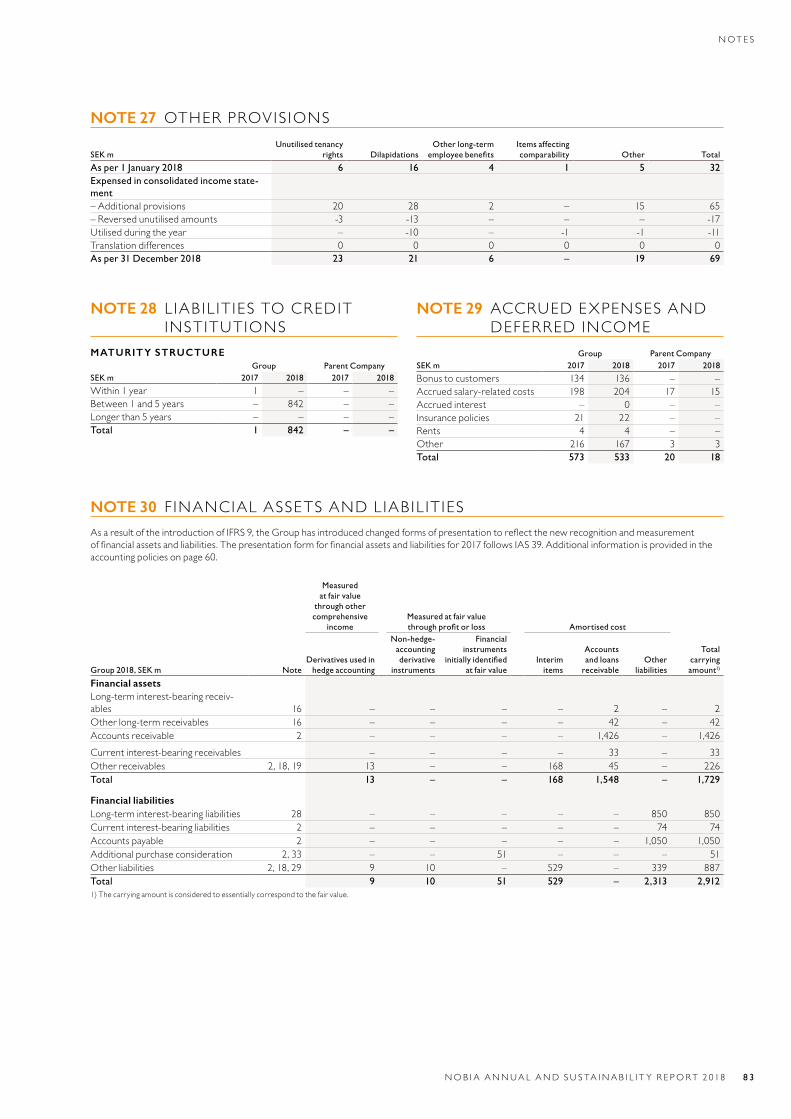
NOTE 27 OTHERPROVIS IONS
SEK mUnutilised tenancy
rights DilapidationsOther long-term
employee benefitsItems affecting comparability Other Total
As per 1 January 2018 6 16 4 1 5 32Expensed in consolidated income state-ment–Additionalprovisions 20 28 2 – 15 65–Reversedunutilisedamounts -3 -13 – – – -17Utilised during the year – -10 – -1 -1 -11Translation differences 0 0 0 0 0 0As per 31 December 2018 23 21 6 – 19 69
NOTE 28 L IAB IL IT IESTOCREDITINSTITUTIONS
MATURITY STRUCTUREGroup Parent Company
SEK m 2017 2018 2017 2018
Within1year 1 – – –Between 1 and 5 years – 842 – –Longerthan5years – – – –Total 1 842 – –
NOTE 29 ACCRUED EXPENSES AND DEFERREDINCOME
Group Parent CompanySEK m 2017 2018 2017 2018
Bonus to customers 134 136 – –Accrued salary-related costs 198 204 17 15Accrued interest – 0 – –Insurancepolicies 21 22 – –Rents 4 4 – –Other 216 167 3 3Total 573 533 20 18
NOTE 30 F INANCIALASSETSANDL IAB IL IT IESAsaresultoftheintroductionofIFRS9,theGrouphasintroducedchangedformsofpresentationtoreflectthenewrecognitionandmeasurement offinancialassetsandliabilities.Thepresentationformforfinancialassetsandliabilitiesfor2017followsIAS39.Additionalinformationisprovidedintheaccountingpoliciesonpage60.
Measured at fair value
through other comprehensive
incomeMeasured at fair value through profit or loss Amortised cost
Group 2018, SEK m NoteDerivatives used in
hedge accounting
Non-hedge- accounting derivative
instruments
Financial instruments
initially identified at fair value
Interimitems
Accounts and loans
receivableOther
liabilities
Total carrying amount1)
Financial assetsLong-terminterest-bearingreceiv-ables 16 – – – – 2 – 2Other long-term receivables 16 – – – – 42 – 42Accounts receivable 2 – – – – 1,426 – 1,426Current interest-bearing receivables – – – – 33 – 33Other receivables 2, 18, 19 13 – – 168 45 – 226Total 13 – – 168 1,548 – 1,729
Financial liabilitiesLong-terminterest-bearingliabilities 28 – – – – – 850 850Current interest-bearing liabilities 2 – – – – – 74 74Accounts payable 2 – – – – – 1,050 1,050Additional purchase consideration 2, 33 – – 51 – – – 51Other liabilities 2, 18, 29 9 10 – 529 – 339 887Total 9 10 51 529 – 2,313 2,9121)Thecarryingamountisconsideredtoessentiallycorrespondtothefairvalue.
N OT E S
NOB I A ANNUA L AND S U S TA I NA B I L I T Y R E PORT 2 018 8 3
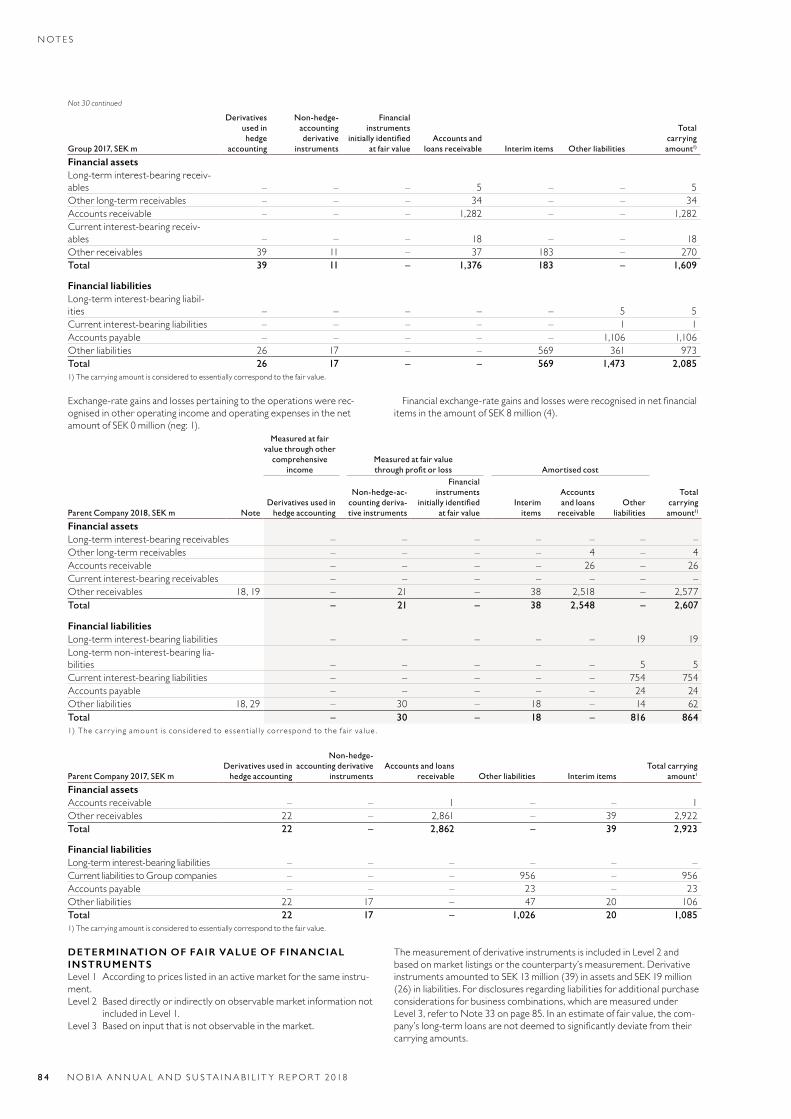
Group 2017, SEK m
Derivatives used in hedge
accounting
Non-hedge- accounting derivative
instruments
Financial instruments
initially identified at fair value
Accounts and loans receivable Interim items Other liabilities
Total carrying amount1)
Financial assetsLong-terminterest-bearingreceiv-ables – – – 5 – – 5Other long-term receivables – – – 34 – – 34Accounts receivable – – – 1,282 – – 1,282Current interest-bearing receiv-ables – – – 18 – – 18Other receivables 39 11 – 37 183 – 270Total 39 11 – 1,376 183 – 1,609
Financial liabilitiesLong-terminterest-bearingliabil-ities – – – – – 5 5Current interest-bearing liabilities – – – – – 1 1Accounts payable – – – – – 1,106 1,106Other liabilities 26 17 – – 569 361 973Total 26 17 – – 569 1,473 2,0851)Thecarryingamountisconsideredtoessentiallycorrespondtothefairvalue.
Exchange-rate gains and losses pertaining to the operations were rec-ognised in other operating income and operating expenses in the net amountofSEK0million(neg:1).
Financialexchange-rategainsandlosseswererecognisedinnetfinancialitemsintheamountofSEK8million(4).
Measured at fair value through other
comprehensive income
Measured at fair value through profit or loss Amortised cost
Parent Company 2018, SEK m NoteDerivatives used in
hedge accounting
Non-hedge-ac-counting deriva-tive instruments
Financial instruments
initially identified at fair value
Interimitems
Accounts and loans
receivableOther
liabilities
Total carrying amount1)
Financial assetsLong-terminterest-bearingreceivables – – – – – – –Other long-term receivables – – – – 4 – 4Accounts receivable – – – – 26 – 26Current interest-bearing receivables – – – – – – –Other receivables 18, 19 – 21 – 38 2,518 – 2,577Total – 21 – 38 2,548 – 2,607
Financial liabilitiesLong-terminterest-bearingliabilities – – – – – 19 19Long-termnon-interest-bearinglia-bilities – – – – – 5 5Current interest-bearing liabilities – – – – – 754 754Accounts payable – – – – – 24 24Other liabilities 18, 29 – 30 – 18 – 14 62Total – 30 – 18 – 816 8641)Theca r r y ingamounti scons ideredtoessent ia l l ycor respondtothef a i rva lue .
Parent Company 2017, SEK mDerivatives used in
hedge accounting
Non-hedge-accounting derivative
instrumentsAccounts and loans
receivable Other liabilities Interim itemsTotal carrying
amount1
Financial assetsAccounts receivable – – 1 – – 1Other receivables 22 – 2,861 – 39 2,922Total 22 – 2,862 – 39 2,923
Financial liabilitiesLong-terminterest-bearingliabilities – – – – – –Current liabilities to Group companies – – – 956 – 956Accounts payable – – – 23 – 23Other liabilities 22 17 – 47 20 106Total 22 17 – 1,026 20 1,0851)Thecarryingamountisconsideredtoessentiallycorrespondtothefairvalue.
DETERMINATION OF FAIR VALUE OF FINANCIAL INSTRUMENTSLevel1Accordingtopriceslistedinanactivemarketforthesameinstru-ment.Level2Baseddirectlyorindirectlyonobservablemarketinformationnot
includedinLevel1.Level3Basedoninputthatisnotobservableinthemarket.
ThemeasurementofderivativeinstrumentsisincludedinLevel2andbasedonmarketlistingsorthecounterparty’smeasurement.Derivativeinstruments amounted to SEK 13 million (39) in assets and SEK 19 million (26)inliabilities.Fordisclosuresregardingliabilitiesforadditionalpurchaseconsiderations for business combinations, which are measured under Level3,refertoNote33onpage85.Inanestimateoffairvalue,thecom-pany’slong-termloansarenotdeemedtosignificantlydeviatefromtheircarryingamounts.
Not 30 continued
N OT E S
8 4 NOB I A ANNUA L AND S U S TA I NA B I L I T Y R E PORT 2 018
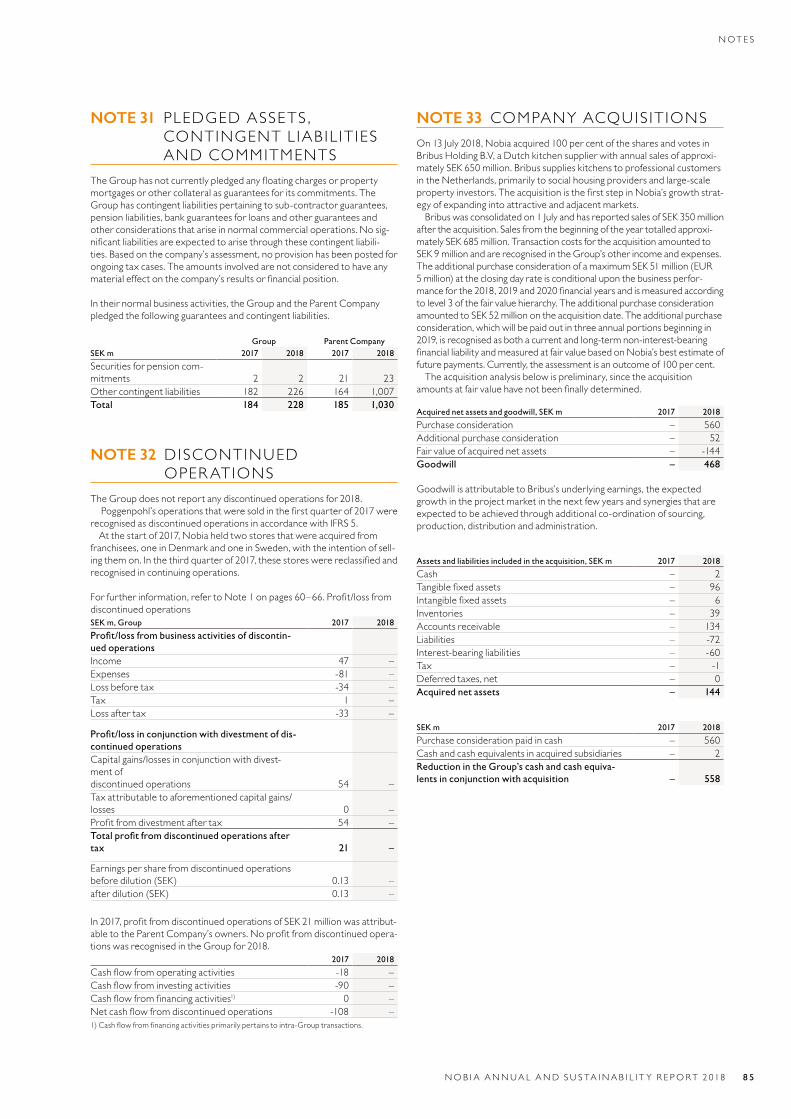
NOTE 31 PLEDGEDASSETS ,CONTINGENTL IAB IL IT IESANDCOMMITMENTS
TheGrouphasnotcurrentlypledgedanyfloatingchargesorpropertymortgagesorothercollateralasguaranteesforitscommitments.TheGroup has contingent liabilities pertaining to sub-contractor guarantees, pension liabilities, bank guarantees for loans and other guarantees and otherconsiderationsthatariseinnormalcommercialoperations.Nosig-nificantliabilitiesareexpectedtoarisethroughthesecontingentliabili-ties.Basedonthecompany’sassessment,noprovisionhasbeenpostedforongoingtaxcases.Theamountsinvolvedarenotconsideredtohaveanymaterialeffectonthecompany’sresultsorfinancialposition.
Intheirnormalbusinessactivities,theGroupandtheParentCompanypledgedthefollowingguaranteesandcontingentliabilities.
Group Parent CompanySEK m 2017 2018 2017 2018
Securities for pension com-mitments 2 2 21 23Other contingent liabilities 182 226 164 1,007Total 184 228 185 1,030
NOTE 32 D ISCONTINUEDOPERATIONS
TheGroupdoesnotreportanydiscontinuedoperationsfor2018.Poggenpohl’soperationsthatweresoldinthefirstquarterof2017were
recognisedasdiscontinuedoperationsinaccordancewithIFRS5.At the start of 2017, Nobia held two stores that were acquired from
franchisees, one in Denmark and one in Sweden, with the intention of sell-ingthemon.Inthethirdquarterof2017,thesestoreswerereclassifiedandrecognisedincontinuingoperations.
Forfurtherinformation,refertoNote1onpages60–66.Profit/lossfromdiscontinued operations SEK m, Group 2017 2018
Profit/loss from business activities of discontin-ued operationsIncome 47 –Expenses -81 –Lossbeforetax -34 –Tax 1 –Lossaftertax -33 –
Profit/loss in conjunction with divestment of dis-continued operationsCapital gains/losses in conjunction with divest-ment of discontinued operations 54 –Tax attributable to aforementioned capital gains/losses 0 –Profitfromdivestmentaftertax 54 –Total profit from discontinued operations after tax 21 –
Earnings per share from discontinued operations before dilution (SEK) 0.13 –after dilution (SEK) 0.13 –
In2017,profitfromdiscontinuedoperationsofSEK21millionwasattribut-abletotheParentCompany’sowners.Noprofitfromdiscontinuedopera-tionswasrecognisedintheGroupfor2018.
2017 2018
Cashflowfromoperatingactivities -18 –Cashflowfrominvestingactivities -90 –Cashflowfromfinancingactivities1) 0 –Netcashflowfromdiscontinuedoperations -108 –1)Cashflowfromfinancingactivitiesprimarilypertainstointra-Grouptransactions.
NOTE 33 COMPANYACQUIS IT IONSOn13July2018,Nobiaacquired100percentofthesharesandvotesinBribusHoldingB.V,aDutchkitchensupplierwithannualsalesofapproxi-matelySEK650million.Bribussupplieskitchenstoprofessionalcustomersin the Netherlands, primarily to social housing providers and large-scale propertyinvestors.TheacquisitionisthefirststepinNobia’sgrowthstrat-egyofexpandingintoattractiveandadjacentmarkets.Bribuswasconsolidatedon1JulyandhasreportedsalesofSEK350million
aftertheacquisition.Salesfromthebeginningoftheyeartotalledapproxi-matelySEK685million.TransactioncostsfortheacquisitionamountedtoSEK9millionandarerecognisedintheGroup’sotherincomeandexpenses.The additional purchase consideration of a maximum SEK 51 million (EUR 5 million) at the closing day rate is conditional upon the business perfor-manceforthe2018,2019and2020financialyearsandismeasuredaccordingtolevel3ofthefairvaluehierarchy.TheadditionalpurchaseconsiderationamountedtoSEK52millionontheacquisitiondate.Theadditionalpurchaseconsideration, which will be paid out in three annual portions beginning in 2019, is recognised as both a current and long-term non-interest-bearing financialliabilityandmeasuredatfairvaluebasedonNobia’sbestestimateoffuturepayments.Currently,theassessmentisanoutcomeof100percent.
The acquisition analysis below is preliminary, since the acquisition amountsatfairvaluehavenotbeenfinallydetermined.
Acquired net assets and goodwill, SEK m 2017 2018
Purchase consideration – 560Additional purchase consideration – 52Fair value of acquired net assets – -144Goodwill – 468
Goodwill is attributable to Bribus’s underlying earnings, the expected growth in the project market in the next few years and synergies that are expected to be achieved through additional co-ordination of sourcing, production,distributionandadministration.
Assets and liabilities included in the acquisition, SEK m 2017 2018
Cash – 2Tangiblefixedassets – 96Intangiblefixedassets – 6Inventories – 39Accounts receivable – 134Liabilities – -72Interest-bearingliabilities – -60Tax – -1Deferred taxes, net – 0Acquired net assets – 144
SEK m 2017 2018
Purchase consideration paid in cash – 560Cash and cash equivalents in acquired subsidiaries – 2Reduction in the Group’s cash and cash equiva-lents in conjunction with acquisition – 558
N OT E S
NOB I A ANNUA L AND S U S TA I NA B I L I T Y R E PORT 2 018 8 5
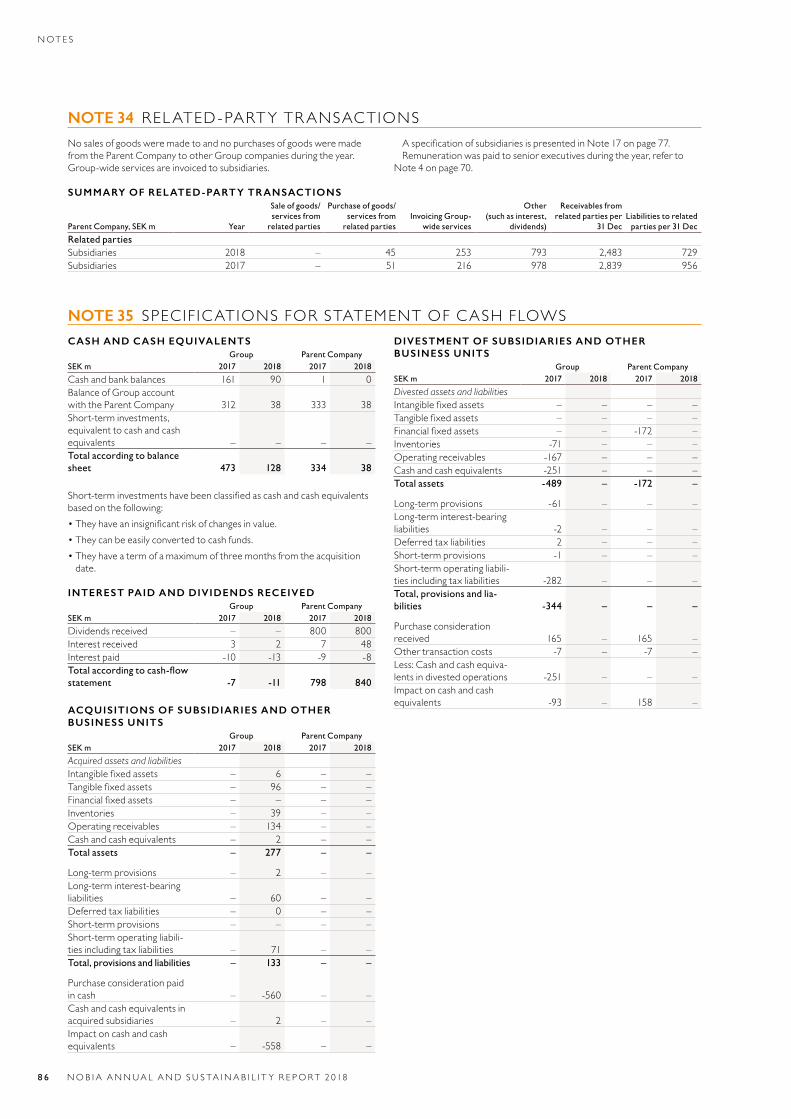
NOTE 34 RELATED-PARTYTRANSACTIONSNo sales of goods were made to and no purchases of goods were made fromtheParentCompanytootherGroupcompaniesduringtheyear.Group-wideservicesareinvoicedtosubsidiaries.
AspecificationofsubsidiariesispresentedinNote17onpage77.Remuneration was paid to senior executives during the year, refer to
Note4onpage70.
SUMMARY OF RELATED-PARTY TRANSACTIONS
Parent Company, SEK m Year
Sale of goods/services from
related parties
Purchase of goods/services from
related partiesInvoicing Group-
wide services
Other (such as interest,
dividends)
Receivables from related parties per
31 DecLiabilities to related
parties per 31 Dec
Related partiesSubsidiaries 2018 – 45 253 793 2,483 729Subsidiaries 2017 – 51 216 978 2,839 956
NOTE 35 SPECIF ICATIONSFORSTATEMENTOFCASHFLOWSCASH AND CASH EQUIVALENTS
Group Parent CompanySEK m 2017 2018 2017 2018
Cash and bank balances 161 90 1 0Balance of Group account with the Parent Company 312 38 333 38Short-term investments, equivalent to cash and cash equivalents – – – –Total according to balance sheet 473 128 334 38
Short-terminvestmentshavebeenclassifiedascashandcashequivalentsbased on the following:• Theyhaveaninsignificantriskofchangesinvalue.• Theycanbeeasilyconvertedtocashfunds.• They have a term of a maximum of three months from the acquisition date.
INTEREST PAID AND DIVIDENDS RECEIVEDGroup Parent Company
SEK m 2017 2018 2017 2018
Dividends received – – 800 800Interestreceived 3 2 7 48Interestpaid -10 -13 -9 -8Total according to cash-flow statement -7 -11 798 840
ACQUISITIONS OF SUBSIDIARIES AND OTHER BUSINESS UNITS
Group Parent CompanySEK m 2017 2018 2017 2018
Acquired assets and liabilitiesIntangiblefixedassets – 6 – –Tangiblefixedassets – 96 – –Financialfixedassets – – – –Inventories – 39 – –Operating receivables – 134 – –Cash and cash equivalents – 2 – –Total assets – 277 – –
Long-termprovisions – 2 – –Long-terminterest-bearingliabilities – 60 – –Deferred tax liabilities – 0 – –Short-term provisions – – – –Short-term operating liabili-ties including tax liabilities – 71 – –Total, provisions and liabilities – 133 – –
Purchase consideration paid in cash – -560 – –Cash and cash equivalents in acquired subsidiaries – 2 – –Impactoncashandcashequivalents – -558 – –
DIVESTMENT OF SUBSIDIARIES AND OTHER BUSINESS UNITS
Group Parent CompanySEK m 2017 2018 2017 2018
Divested assets and liabilitiesIntangiblefixedassets – – – –Tangiblefixedassets – – – –Financialfixedassets – – -172 –Inventories -71 – – –Operating receivables -167 – – –Cash and cash equivalents -251 – – –Total assets -489 – -172 –
Long-termprovisions -61 – – –Long-terminterest-bearingliabilities -2 – – –Deferred tax liabilities 2 – – –Short-term provisions -1 – – –Short-term operating liabili-ties including tax liabilities -282 – – –Total, provisions and lia-bilities -344 – – –
Purchase consideration received 165 – 165 –Other transaction costs -7 – -7 –Less:Cashandcashequiva-lents in divested operations -251 – – –Impactoncashandcashequivalents -93 – 158 –
N OT E S
8 6 NOB I A ANNUA L AND S U S TA I NA B I L I T Y R E PORT 2 018
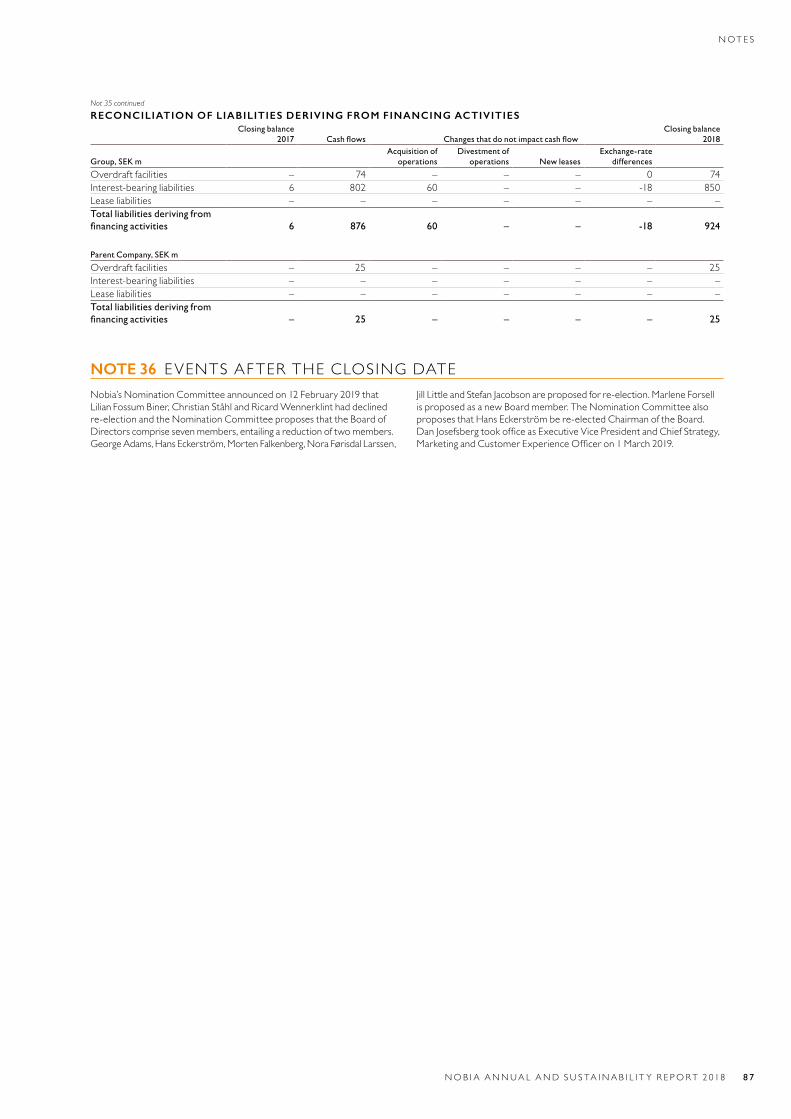
RECONCILIATION OF LIABILITIES DERIVING FROM FINANCING ACTIVITIESClosing balance
2017 Cash flows Changes that do not impact cash flowClosing balance
2018
Group, SEK mAcquisition of
operationsDivestment of
operations New leasesExchange-rate
differences
Overdraft facilities – 74 – – – 0 74Interest-bearingliabilities 6 802 60 – – -18 850Leaseliabilities – – – – – – –Total liabilities deriving from financing activities 6 876 60 – – -18 924
Parent Company, SEK m
Overdraft facilities – 25 – – – – 25Interest-bearingliabilities – – – – – – –Leaseliabilities – – – – – – –Total liabilities deriving from financing activities – 25 – – – – 25
NOTE 36 EVENTSAFTERTHECLOSINGDATENobia’s Nomination Committee announced on 12 February 2019 that LilianFossumBiner,ChristianStåhlandRicardWennerklinthaddeclinedre-election and the Nomination Committee proposes that the Board of Directorscomprisesevenmembers,entailingareductionoftwomembers.GeorgeAdams,HansEckerström,MortenFalkenberg,NoraFørisdalLarssen,
JillLittleandStefanJacobsonareproposedforre-election.MarleneForsell isproposedasanewBoardmember.TheNominationCommitteealsoproposesthatHansEckerströmbere-electedChairmanoftheBoard. DanJosefsbergtookofficeasExecutiveVicePresidentandChiefStrategy,MarketingandCustomerExperienceOfficeron1March2019.
Not 35 continued
N OT E S
NOB I A ANNUA L AND S U S TA I NA B I L I T Y R E PORT 2 018 8 7
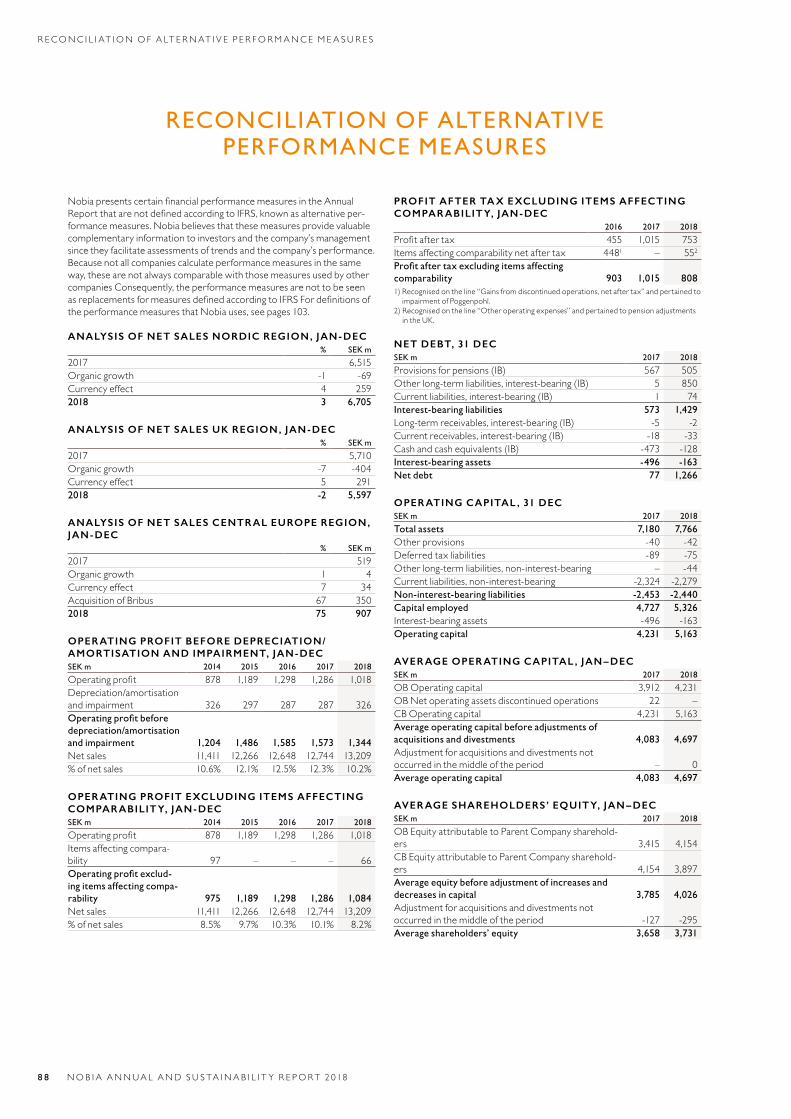
RECONCILIATION OF ALTERNATIVE PERFORMANCE MEASURES
NobiapresentscertainfinancialperformancemeasuresintheAnnualReportthatarenotdefinedaccordingtoIFRS,knownasalternativeper-formancemeasures.Nobiabelievesthatthesemeasuresprovidevaluablecomplementary information to investors and the company’s management sincetheyfacilitateassessmentsoftrendsandthecompany’sperformance.Because not all companies calculate performance measures in the same way, these are not always comparable with those measures used by other companies Consequently, the performance measures are not to be seen asreplacementsformeasuresdefinedaccordingtoIFRSFordefinitionsoftheperformancemeasuresthatNobiauses,seepages103.
ANALYSIS OF NET SALES NORDIC REGION, JAN-DEC% SEK m
2017 6,515Organic growth -1 -69Currency effect 4 2592018 3 6,705
ANALYSIS OF NET SALES UK REGION, JAN-DEC% SEK m
2017 5,710Organic growth -7 -404Currency effect 5 2912018 -2 5,597
ANALYSIS OF NET SALES CENTRAL EUROPE REGION, JAN-DEC
% SEK m
2017 519Organic growth 1 4Currency effect 7 34Acquisition of Bribus 67 3502018 75 907
OPERATING PROFIT BEFORE DEPRECIATION/AMORTISATION AND IMPAIRMENT, JAN-DECSEK m 2014 2015 2016 2017 2018
Operatingprofit 878 1,189 1,298 1,286 1,018Depreciation/amortisation and impairment 326 297 287 287 326Operating profit before depreciation/amortisation and impairment 1,204 1,486 1,585 1,573 1,344Net sales 11,411 12,266 12,648 12,744 13,209% of net sales 10.6% 12.1% 12.5% 12.3% 10.2%
OPERATING PROFIT EXCLUDING ITEMS AFFECTING COMPARABILITY, JAN-DECSEK m 2014 2015 2016 2017 2018
Operatingprofit 878 1,189 1,298 1,286 1,018Itemsaffectingcompara-bility 97 – – – 66Operating profit exclud-ing items affecting compa-rability 975 1,189 1,298 1,286 1,084Net sales 11,411 12,266 12,648 12,744 13,209% of net sales 8.5% 9.7% 10.3% 10.1% 8.2%
PROFIT AFTER TAX EXCLUDING ITEMS AFFECTING COMPARABILITY, JAN-DEC
2016 2017 2018
Profitaftertax 455 1,015 753Itemsaffectingcomparabilitynetaftertax 4481 – 552
Profit after tax excluding items affecting comparability 903 1,015 8081) Recognised on the line “Gains from discontinued operations, net after tax” and pertained to impairmentofPoggenpohl.
2) Recognised on the line “Other operating expenses” and pertained to pension adjustments intheUK.
NET DEBT, 31 DECSEK m 2017 2018
Provisionsforpensions(IB) 567 505Otherlong-termliabilities,interest-bearing(IB) 5 850Currentliabilities,interest-bearing(IB) 1 74Interest-bearing liabilities 573 1,429Long-termreceivables,interest-bearing(IB) -5 -2Currentreceivables,interest-bearing(IB) -18 -33Cashandcashequivalents(IB) -473 -128Interest-bearing assets -496 -163Net debt 77 1,266
OPERATING CAPITAL , 31 DECSEK m 2017 2018
Total assets 7,180 7,766Other provisions -40 -42Deferred tax liabilities -89 -75Other long-term liabilities, non-interest-bearing – -44Current liabilities, non-interest-bearing -2,324 -2,279Non-interest-bearing liabilities -2,453 -2,440Capital employed 4,727 5,326Interest-bearingassets -496 -163Operating capital 4,231 5,163
AVERAGE OPERATING CAPITAL , JAN – DECSEK m 2017 2018
OB Operating capital 3,912 4,231OB Net operating assets discontinued operations 22 –CB Operating capital 4,231 5,163Average operating capital before adjustments of acquisitions and divestments 4,083 4,697Adjustment for acquisitions and divestments not occurred in the middle of the period – 0Average operating capital 4,083 4,697
AVERAGE SHAREHOLDERS’ EQUITY, JAN – DECSEK m 2017 2018
OB Equity attributable to Parent Company sharehold-ers 3,415 4,154CB Equity attributable to Parent Company sharehold-ers 4,154 3,897Average equity before adjustment of increases and decreases in capital 3,785 4,026Adjustment for acquisitions and divestments not occurred in the middle of the period -127 -295Average shareholders’ equity 3,658 3,731
8 8 NOB I A ANNUA L AND S U S TA I NA B I L I T Y R E PORT 2 018
R ECONC I L I AT I ON O F A LT E RNAT I V E P E R FORMANC E M E A SU R E S
BOARD OF DIRECTORS’ ASSURANCE
The Board of Directors and the President declare that the Annual Report was prepared in accordance with generally accepted accounting principles in Swedenandthattheconsolidatedfinancialstatementshavebeenpreparedinaccordance with the international accounting standards referred to in Regu-lation (EC) No 1606/2002 of the European Parliament and of the Council of19July2002ontheapplicationofinternationalaccountingstandards.TheAnnualReportandtheconsolidatedfinancialstatementsgiveatrueandfair
viewofthepositionandearningsoftheParentCompanyandtheGroup.TheBoard of Directors’ Report for the Parent Company and the Group gives a true and fair view of the developments of operations, position and earnings anddescribessignificantrisksanduncertaintiesfacingtheParentCompanyandcompaniesincludedintheGroup.Theconsolidatedaccountsandbal-ance sheet and the Parent Company income statement and balance sheet will bepresentedtotheAnnualGeneralMeetingforadoptionon2May2019.
Stockholm, 5 April 2019
Hans Eckerström Chairman
NoraFørisdalLarssen LilianFossumBiner JillLittle ChristinaStåhl
StefanJacobsson RicardWennerklint GeorgeAdams
Morten Falkenberg Per Bergström Marie Ströberg President Employee representative Employee representative
Our audit report was submitted on 5 April 2019
Deloitte AB
Daniel de Paula Authorised Public Accountant
NOB I A ANNUA L AND S U S TA I NA B I L I T Y R E PORT 2 018 8 9
BOARD O F D I R E C TOR S ’ A S S U R ANC E
AUDITOR’S REPORT
To the general meeting of the shareholders of Nobia AB (publ) corporate identity number 556528-2752
REPORT ON THE ANNUAL ACCOUNTS AND CONSOLIDATED ACCOUNTS OpinionsWehaveauditedtheannualaccountsandconsolidatedaccountsofNobiaAB(publ)forthefinancialyear2018-01-01–2018-12-31.Theannualaccounts and consolidated accounts of the company are included on pages 41-89inthisdocument.Inouropinion,theannualaccountshavebeenpreparedinaccordance
with the Annual Accounts Act and present fairly, in all material respects, thefinancialpositionoftheparentcompanyasof31December2018anditsfinancialperformanceandcashflowfortheyearthenendedinaccord-ancewiththeAnnualAccountsAct.Theconsolidatedaccountshave been prepared in accordance with the Annual Accounts Act and present fairly,inallmaterialrespects,thefinancialpositionofthegroupasof31December2018andtheirfinancialperformanceandcashflowfortheyearthenendedinaccordancewithInternationalFinancialReportingStandards(IFRS),asadoptedbytheEU,andtheAnnualAccountsAct.Thestatu-tory administration report is consistent with the other parts of the annual accountsandconsolidatedaccounts.Wethereforerecommendthatthegeneralmeetingofshareholders
adopts the income statement and balance sheet for the parent company andthegroup.
Our opinions in this report on the annual accounts and consolidated accounts are consistent with the content of the additional report that has been submitted to the parent company’s audit committee in accordance withtheAuditRegulation(537/2014)Article11.
Basis for Opinions WeconductedourauditinaccordancewithInternationalStandardsonAuditing(ISA)andgenerallyacceptedauditingstandardsinSweden.Ourresponsibilities under those standards are further described in the Auditor’s Responsibilitiessection.Weareindependentoftheparentcompany and the group in accordance with professional ethics for accountants in Swedenandhaveotherwisefulfilledourethicalresponsibilitiesinaccord-ancewiththeserequirements.Thisincludesthat,basedonthebestof our knowledge and belief, no prohibited services referred to in the Audit Regulation(537/2014)Article5.1havebeenprovidedtotheauditedcom-pany or, where applicable, its parent company or its controlled companies withintheEU.Webelievethattheauditevidencewehaveobtainedissufficientand
appropriatetoprovideabasisforouropinions.
Key Audit Matters Key audit matters of the audit are those matters that, in our professional judgment,wereofmostsignificanceinourauditoftheannualaccountsandconsolidatedaccountsofthecurrentperiod.Thesematterswereaddressed in the context of our audit of, and in forming our opinion thereon, the annual accounts and consolidated accounts as a whole, but wedonotprovideaseparateopiniononthesematters.
Revenue Recognition The group reported revenue of SEK 13 209 millions as of 31 December 2018 which mainly consists of sales related to kitchens and kitchen equip-ment,andforsomesalesalsoinstallationservices.Withinthegroupreve-nuerelatedtokitchensandpertainingproductsisrecognizedatapointintime upon delivery of the goods to the customer, which is the point in time when the customer accepts the delivery, and receives control over the productsandthegrouphavefulfilledtheirperformanceobligations.Rev-enuerelatedtoinstallationsisrecognizedovertimewhentheinstallationisperformed.Wehaveidentifiedthisasakeyauditmattersincerevenuehasasignif-
icantimpactonthefinancialreportingandconsistsofalargeamountoftransactionsaswellasaredependentoncustomerspecificagreements,delivery terms and installation which affect the completeness and timing
ofrecognizedrevenue.Forthegroupsprinciplesonrevenuerecognition,refertonote1andnote3regar-dingaccountingofoperatingsegments.
Our Audit Procedures Our audit procedures included but where not limited to: • evaluation of the company’s accounting principles regarding revenue includingtransitiontothenewaccountingstandardsforrevenue,IFRS15Revenue from contracts with customers
• gained an understanding of the company’s routines and evaluating inter-nalcontrolsregardingrevenuerecognitionincludingIT-systemsused
• review of a selection of transactions to ensure accurate revenue recogni-tion in accordance with agreements and in the correct period
• review of marginanalysis’ as well as analysis of revenue against previous years and budget
• review of the adoption of appropriate accounting principles and that the required disclosures are included in the annual report and consolidated accounts
Impairment Tests of Goodwill As of 31 December 2018, the group reported goodwill of SEK 2 887 mil-lions.Onayearlybasis,andwhenthereisanindicationofimpairment,Nobia tests that the carrying value of assets does not exceed the calcu-latedrecoverableamountsfortheseassets.Therecoverableamountsaredeterminedusingpresentvaluecomputationoffuturecashflowspercashgenerating unit based on the expected outcome of a number of assump-tionsbasedonmanagement’sbusinessplanandforecasts.Wehaveidentifiedthisasakeyauditmatterasthecompany’sgoodwill
is a material item in the balance sheet and the impairment test have con-siderable elements of management judgements which among others com-priseofestimatingfuturecashflowsandcalculateweightedaveragecapi-talcost(“WACC”).
For the group’s principles on impairment tests of intangible and tangible fixedassetsrefertonote1andformaterialassumptionsusedinthisyear’simpairmenttestsrefertonote14.
Our Audit Procedures Our audit procedures included but where not limited to: • evaluation of the group’s principles for the preparation of impairment testsinaccordancewithIFRS
• evaluation of material assumptions as well as the sensitivity to change in these assumptions
• involving internal valuation expert, mostly related to assumptions on required return in relation to external markets
• reviewofthediscountedfuturecashflowmodelforarithmeticaccuracy• examination of the completeness of the disclosures for impairment tests intheannualreportandgroupconsolidation.
Acquisition of Bribus B.VOnJuly13,2018NobiaABannouncedtheiracquisitionofBribusHoldingB.VforapurchasepriceofSEK560millionsandanconditionaladditionalpurchasepriceofSEK51millions.Theaccountingforacquisitionsrequiresignificantestimatesandassump-
tionsfrommanagement.Themostimportantassumptionistheallocationof the purchase price to acquired assets and assumed liabilities and neces-sary adjustments to the group’s accounting principles Wehaveassessedtheaccountingfortheacquisitiontobeakeyaudit
matter due to the inherent degree of judgment regarding the valuation of acquiredassetsandliabilities,aswellasassessmentonfuturecashflowsand earnings as the additional purchase price is dependent on future earn-ingsinBribusB.V.
For the Group’s accounting principles of acquried companies, please refer to the accounting principles in note 1 and for the purchase price allo-cationfortheacquisition,pleaserefertonote33.
9 0 NOB I A ANNUA L AND S U S TA I NA B I L I T Y R E PORT 2 018
AUD I T R E PORT
Our Audit ProceduresOur audit procedures included but where not limited to:• Review of the share purchase agreement and the groups valuation of
aquired assets and assumed liabilities • Wehavereviewedthepurchasepricemechanismintheagreementandevaluatedmanagement’sestimatesoffutureearnings.
• Evaluated the appropriateness of the disclosures made in the annual report.
Other information than the annual accounts and consolidated accountsThis document also contains other information than the annual accounts andconsolidatedaccountsandisfoundonpages1–40and96–108.TheBoard of Directors and the Managing Director are responsible for this otherinformation.
Our opinion on the annual accounts and consolidated accounts does not cover this other information and we do not express any form of assurance conclusionregar-dingthisotherinformation.Inconnectionwithourauditoftheannualaccountsandconsolidated
accounts,ourresponsibilityistoreadtheinformationidentifiedaboveand consider whether the information is materially inconsistent with the annualaccountsandconsolidatedaccounts.Inthisprocedurewealsotakeinto account our knowledge otherwise obtained in the audit and assess whethertheinformationotherwiseappearstobemateriallymisstated.Ifwe,basedontheworkperformedconcerningthisinformation,con-
clude that there is a material misstatement of this other information, we arerequiredtoreportthatfact.Wehavenothingtoreportinthisregard.
Responsibilities of the Board of Directors and the Managing Director The Board of Directors and the Managing Director are responsible for the preparation of the annual accounts and consolidated accounts and that they give a fair presentation in accordance with the Annual Accounts Act and,concerningtheconsolidatedaccounts,inaccordancewithIFRSasadoptedbytheEU.TheBoardofDirectorsandtheManagingDirectorarealso responsible for such internal control as they determine is necessary to enable the preparation of annual accounts and consolidated accounts that arefreefrommaterialmisstatement,whetherduetofraudorerror.Inpreparingtheannualaccountsandconsolidatedaccounts,TheBoard
of Directors and the Managing Director are responsible for the assess-ment of the company’s and the group’s ability to continue as a going con-cern.Theydisclose,asapplicable,mattersrelatedtogoingconcernandusingthegoingconcernbasisofaccounting.Thegoingconcernbasisofaccounting is however not applied if the Board of Directors and the Man-aging Director intends to liquidate the company, to cease operations, or hasnorealisticalternativebuttodoso.
Auditor’s responsibility Our objectives are to obtain reasonable assurance about whether the annual accounts and consolidated accounts as a whole are free from mate-rial misstatement, whether due to fraud or error, and to issue an auditor’s reportthatincludesouropinions.Reasonableassuranceisahighlevelofassurance, but is not a guarantee that an audit conducted in accordance withISAsandgenerallyacceptedauditingstandardsinSwedenwillalwaysdetectamaterialmisstatementwhenitexists.Misstatementscanarisefrom fraud or error and are considered material if, individually or in the aggregate,theycouldreasonablybeexpectedtoinfluencetheeconomicdecisions of users taken on the basis of these annual accounts and consoli- datedaccounts.
An additional description of our responsibility for the audit of the annual accountsandtheconsolidatedaccountsisontheSwedishInspectorateofAuditorswebpage:www.revisorsinspektionen.se/revisornsansvar.Thisdescriptionisapartoftheauditor’sreport.
REPORT ON OTHER REQUIREMENTS ACCORDING TO LAWS AND REGULATIONSOpinions Inadditiontoourauditoftheannualaccountsandconsolidatedaccounts,we have also audited the administration of the Board of Directors and the ManagingDirectorofNobiaAB(publ)forthefinancialyear2018-01-01
-2018-12-31andtheproposedappropriationsofthecompany’sprofitorloss.Werecommendtothegeneralmeetingofshareholdersthattheprofit
to be appropriated in accordance with the proposal in the statutory administration report and that the members of the Board of Directors and theManagingDirectorbedischargedfromliabilityforthefinancialyear.
Basis for Opinions WeconductedtheauditinaccordancewithgenerallyacceptedauditingstandardsinSweden.Ourresponsibilitiesunderthosestandardsarefur-therdescribedintheAuditor’sResponsibilitiessection.Weareindepen-dent of the parent company and the group in accordance with professional ethicsforaccountantsinSwedenandhaveotherwisefulfilledourethicalresponsi-bilitiesinaccordancewiththeserequirements.Webelievethattheauditevidencewehaveobtainedissufficientand
appropriatetoprovideabasisforouropinions.
Responsibilities of the Board of Directors and the Managing Director The Board of Directors is responsible for the proposal for appropriations ofthecompany’sprofitorloss.Attheproposalofadividend,thisincludesanassessmentofwhetherthedividendisjustifiableconsideringtherequirementswhichthecompany’sandthegroup’stypeofoperations,sizeandrisksplaceonthesizeoftheparentcompany’sandthegroup’sequity,consolidationrequirements,liquidityandpositioningeneral.TheBoardofDirectorsisresponsibleforthecompany’sorganization
andtheadministrationofthecompany’saffairs.Thisincludesamongotherthingscontinuousassessmentofthecompany’sandthegroup’sfinancialsituationandensuringthatthecompany’sorganizationisdesignedsothattheaccounting,managementofassetsandthecompany’sfinancialaffairsotherwisearecontrolledinareassuringmanner.TheManagingDirectorshall manage the ongoing administration according to the Board of Direc-tors’ guidelines and instructions and among other matters take measures thatarenecessarytofulfillthecompany’saccountinginaccordancewithlawandhandlethemanagementofassetsinareassuringmanner.
Auditor’s responsibility Our objective concerning the audit of the administration, and thereby our opinion about discharge from liability is to obtain audit evidence to assess with a reasonable degree of assurance whether any member of the Board of Directors or the Managing Director in any material respect: • has undertaken any action or been guilty of any omission which can give
rise to liability to the company, or • in any other way has acted in contravention of the Companies Act, the AnnualAccountsActortheArticlesofAssociation.
Our objective concerning the audit of the proposed appropriations of the company’sprofitorloss,andtherebyouropinionaboutthis,istoassesswith reasonable degree of assurance whether the proposal is in accor-dancewiththeCompaniesAct.
Reasonable assurance is a high level of assurance, but is not a guaran-tee that an audit conducted in accordance with generally accepted auditing standards in Sweden will always detect actions or omissions that can give rise to liability to the company, or that the proposed appropriations of the company’sprofitorlossarenotinaccordancewiththeCompaniesAct.
An additional description of our responsibility for the audit of the annual accountsandtheconsolidatedaccountsisontheSwedishInspectorateofAuditorswebpage:www.revisorsinspektionen.se/revisornsansvar.Thisdescriptionisapartoftheauditor’sreport.
Deloitte AB, was appointed auditors of Nobia AB by the general meet-ing of the shareholders on the 2018-04-10 and has been the company’s auditorsince2017-04-06.
Stockholm 5 April 2019Deloitte AB
Daniel de Paula Authorized Public Accountant
NOB I A ANNUA L AND S U S TA I NA B I L I T Y R E PORT 2 018 91
AUD I T R E PORT
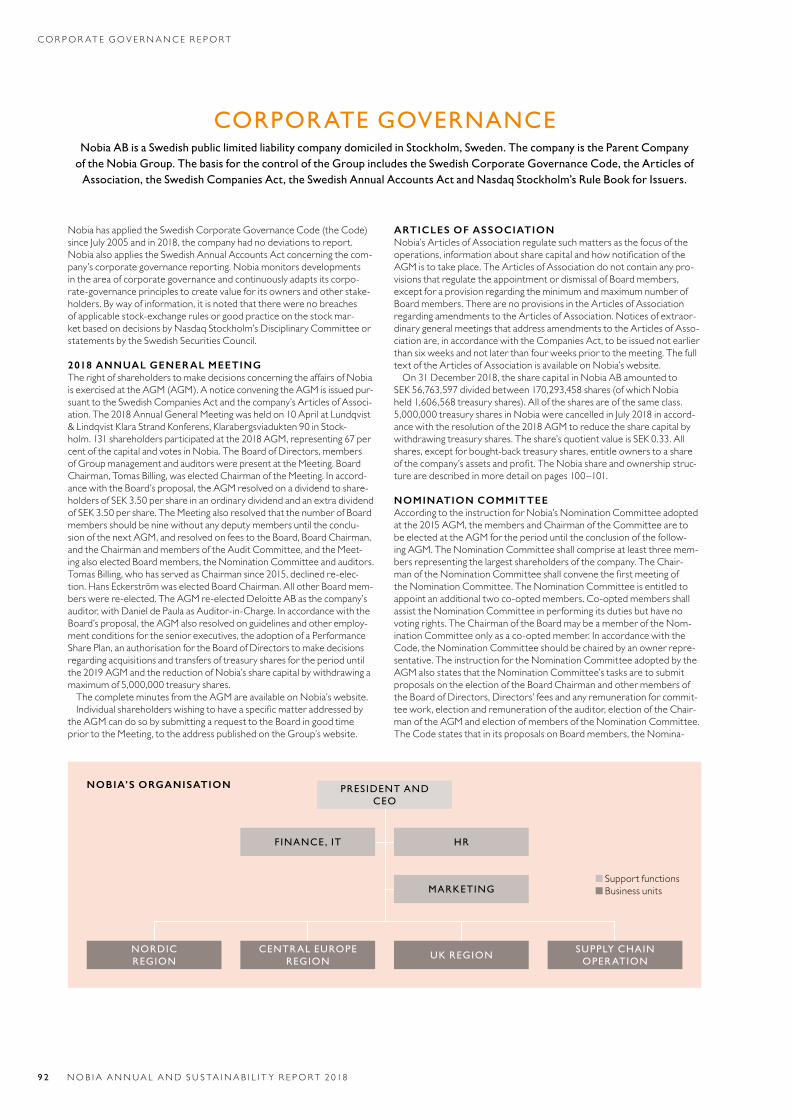
CORPORATE GOVERNANCENobia AB is a Swedish public limited liability company domiciled in Stockholm, Sweden. The company is the Parent Company
of the Nobia Group. The basis for the control of the Group includes the Swedish Corporate Governance Code, the Articles of Association, the Swedish Companies Act, the Swedish Annual Accounts Act and Nasdaq Stockholm’s Rule Book for Issuers.
Nobia has applied the Swedish Corporate Governance Code (the Code) sinceJuly2005andin2018,thecompanyhadnodeviationstoreport.Nobia also applies the Swedish Annual Accounts Act concerning the com-pany’scorporategovernancereporting.Nobiamonitorsdevelopmentsin the area of corporate governance and continuously adapts its corpo-rate-governance principles to create value for its owners and other stake-holders.Bywayofinformation,itisnotedthattherewerenobreachesof applicable stock-exchange rules or good practice on the stock mar-ket based on decisions by Nasdaq Stockholm’s Disciplinary Committee or statementsbytheSwedishSecuritiesCouncil.
2018 ANNUAL GENERAL MEETINGThe right of shareholders to make decisions concerning the affairs of Nobia isexercisedattheAGM(AGM).AnoticeconveningtheAGMisissuedpur-suant to the Swedish Companies Act and the company’s Articles of Associ-ation.The2018AnnualGeneralMeetingwasheldon10AprilatLundqvist&LindqvistKlaraStrandKonferens,Klarabergsviadukten90inStock-holm.131shareholdersparticipatedatthe2018AGM,representing67percentofthecapitalandvotesinNobia.TheBoardofDirectors,membersofGroupmanagementandauditorswerepresentattheMeeting.BoardChairman,TomasBilling,waselectedChairmanoftheMeeting.Inaccord-ance with the Board’s proposal, the AGM resolved on a dividend to share-holdersofSEK3.50pershareinanordinarydividendandanextradividendofSEK3.50pershare.TheMeetingalsoresolvedthatthenumberofBoardmembers should be nine without any deputy members until the conclu-sion of the next AGM, and resolved on fees to the Board, Board Chairman, and the Chairman and members of the Audit Committee, and the Meet-ingalsoelectedBoardmembers,theNominationCommitteeandauditors.Tomas Billing, who has served as Chairman since 2015, declined re-elec-tion.HansEckerströmwaselectedBoardChairman.AllotherBoardmem-berswerere-elected.TheAGMre-electedDeloitteABasthecompany’sauditor,withDanieldePaulaasAuditor-in-Charge.InaccordancewiththeBoard’s proposal, the AGM also resolved on guidelines and other employ-ment conditions for the senior executives, the adoption of a Performance Share Plan, an authorisation for the Board of Directors to make decisions regarding acquisitions and transfers of treasury shares for the period until the 2019 AGM and the reduction of Nobia’s share capital by withdrawing a maximumof5,000,000treasuryshares.ThecompleteminutesfromtheAGMareavailableonNobia’swebsite.Individualshareholderswishingtohaveaspecificmatteraddressedby
the AGM can do so by submitting a request to the Board in good time priortotheMeeting,totheaddresspublishedontheGroup’swebsite.
ARTICLES OF ASSOCIATIONNobia’s Articles of Association regulate such matters as the focus of the operations,informationaboutsharecapitalandhownotificationoftheAGMistotakeplace.TheArticlesofAssociationdonotcontainanypro-visions that regulate the appointment or dismissal of Board members, except for a provision regarding the minimum and maximum number of Boardmembers.TherearenoprovisionsintheArticlesofAssociationregardingamendmentstotheArticlesofAssociation.Noticesofextraor-dinary general meetings that address amendments to the Articles of Asso-ciation are, in accordance with the Companies Act, to be issued not earlier thansixweeksandnotlaterthanfourweekspriortothemeeting.ThefulltextoftheArticlesofAssociationisavailableonNobia’swebsite.
On 31 December 2018, the share capital in Nobia AB amounted to SEK 56,763,597 divided between 170,293,458 shares (of which Nobia held1,606,568treasuryshares).Allofthesharesareofthesameclass.5,000,000treasurysharesinNobiawerecancelledinJuly2018inaccord-ance with the resolution of the 2018 AGM to reduce the share capital by withdrawingtreasuryshares.Theshare’squotientvalueisSEK0.33.Allshares, except for bought-back treasury shares, entitle owners to a share ofthecompany’sassetsandprofit.TheNobiashareandownershipstruc-turearedescribedinmoredetailonpages100–101.
NOMINATION COMMITTEEAccording to the instruction for Nobia’s Nomination Committee adopted at the 2015 AGM, the members and Chairman of the Committee are to be elected at the AGM for the period until the conclusion of the follow-ingAGM.TheNominationCommitteeshallcompriseatleastthreemem-bersrepresentingthelargestshareholdersofthecompany.TheChair-manoftheNominationCommitteeshallconvenethefirstmeetingoftheNominationCommittee.TheNominationCommitteeisentitledtoappointanadditionaltwoco-optedmembers.Co-optedmembersshallassist the Nomination Committee in performing its duties but have no votingrights.TheChairmanoftheBoardmaybeamemberoftheNom-inationCommitteeonlyasaco-optedmember.InaccordancewiththeCode, the Nomination Committee should be chaired by an owner repre-sentative.TheinstructionfortheNominationCommitteeadoptedbytheAGM also states that the Nomination Committee’s tasks are to submit proposals on the election of the Board Chairman and other members of the Board of Directors, Directors’ fees and any remuneration for commit-tee work, election and remuneration of the auditor, election of the Chair-manoftheAGMandelectionofmembersoftheNominationCommittee.The Code states that in its proposals on Board members, the Nomina-
NOBIA’S ORGANISATION
NORDIC REGION
CENTR AL EUROPE REGION
UK REGIONSUPPLY CHAIN
OPER ATION
PRESIDENT AND CEO
FINANCE , IT
MARKETING
HR
Support functions Business units
C O R P O R AT E G O V E R N A N C E R E P O R T
9 2 NOB I A ANNUA L AND S U S TA I NA B I L I T Y R E PORT 2 018
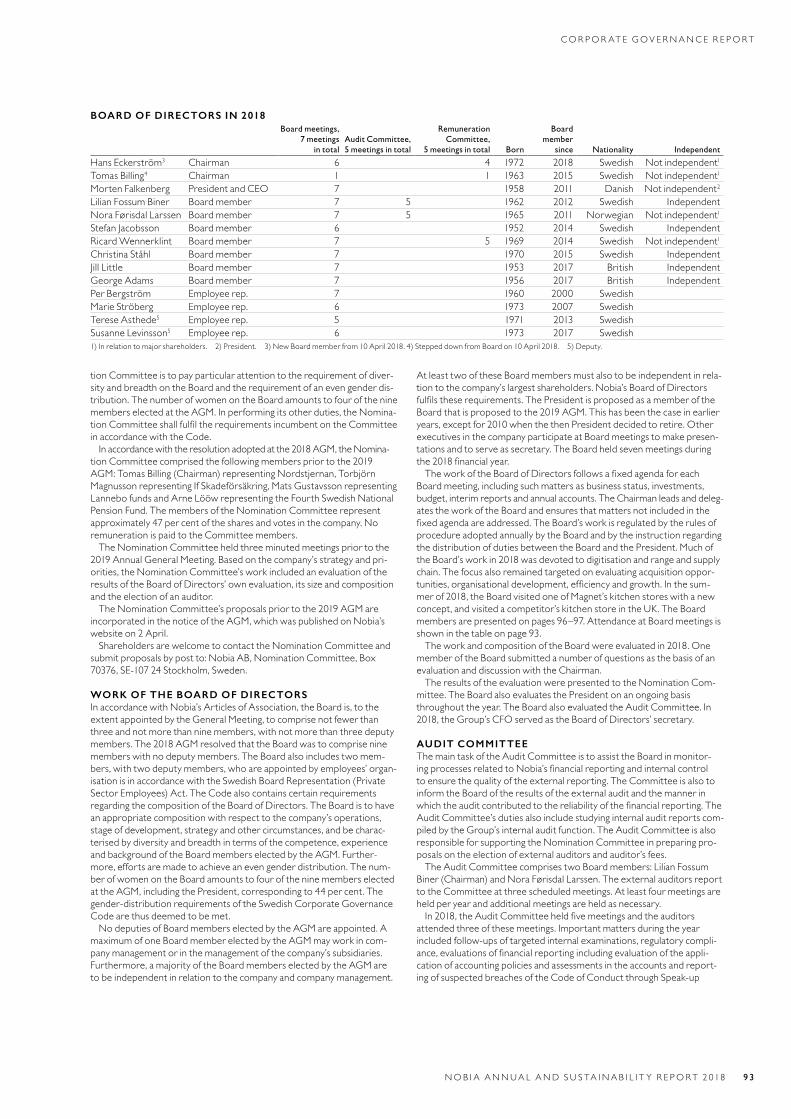
tion Committee is to pay particular attention to the requirement of diver-sity and breadth on the Board and the requirement of an even gender dis-tribution.ThenumberofwomenontheBoardamountstofouroftheninememberselectedattheAGM.Inperformingitsotherduties,theNomina-tionCommitteeshallfulfiltherequirementsincumbentontheCommitteeinaccordancewiththeCode.Inaccordancewiththeresolutionadoptedatthe2018AGM,theNomina-
tion Committee comprised the following members prior to the 2019 AGM: Tomas Billing (Chairman) representing Nordstjernan, Torbjörn MagnussonrepresentingIfSkadeförsäkring,MatsGustavssonrepresentingLannebofundsandArneLööwrepresentingtheFourthSwedishNationalPensionFund.ThemembersoftheNominationCommitteerepresentapproximately47percentofthesharesandvotesinthecompany.NoremunerationispaidtotheCommitteemembers.
The Nomination Committee held three minuted meetings prior to the 2019AnnualGeneralMeeting.Basedonthecompany’sstrategyandpri-orities, the Nomination Committee’s work included an evaluation of the resultsoftheBoardofDirectors’ownevaluation,itssizeandcompositionandtheelectionofanauditor.
The Nomination Committee’s proposals prior to the 2019 AGM are incorporated in the notice of the AGM, which was published on Nobia’s websiteon2April.
Shareholders are welcome to contact the Nomination Committee and submit proposals by post to: Nobia AB, Nomination Committee, Box 70376,SE-10724Stockholm,Sweden.
WORK OF THE BOARD OF DIRECTORSInaccordancewithNobia’sArticlesofAssociation,theBoardis,totheextent appointed by the General Meeting, to comprise not fewer than three and not more than nine members, with not more than three deputy members.The2018AGMresolvedthattheBoardwastocompriseninememberswithnodeputymembers.TheBoardalsoincludestwomem-bers, with two deputy members, who are appointed by employees’ organ-isation is in accordance with the Swedish Board Representation (Private SectorEmployees)Act.TheCodealsocontainscertainrequirementsregardingthecompositionoftheBoardofDirectors.TheBoardistohavean appropriate composition with respect to the company’s operations, stage of development, strategy and other circumstances, and be charac-terised by diversity and breadth in terms of the competence, experience andbackgroundoftheBoardmemberselectedbytheAGM.Further-more,effortsaremadetoachieveanevengenderdistribution.Thenum-ber of women on the Board amounts to four of the nine members elected attheAGM,includingthePresident,correspondingto44percent.Thegender-distribution requirements of the Swedish Corporate Governance Codearethusdeemedtobemet.NodeputiesofBoardmemberselectedbytheAGMareappointed.A
maximum of one Board member elected by the AGM may work in com-panymanagementorinthemanagementofthecompany’ssubsidiaries.Furthermore, a majority of the Board members elected by the AGM are tobeindependentinrelationtothecompanyandcompanymanagement.
At least two of these Board members must also to be independent in rela-tiontothecompany’slargestshareholders.Nobia’sBoardofDirectorsfulfilstheserequirements.ThePresidentisproposedasamemberoftheBoardthatisproposedtothe2019AGM.Thishasbeenthecaseinearlieryears,exceptfor2010whenthethenPresidentdecidedtoretire.Otherexecutives in the company participate at Board meetings to make presen-tationsandtoserveassecretary.TheBoardheldsevenmeetingsduringthe2018financialyear.TheworkoftheBoardofDirectorsfollowsafixedagendaforeach
Board meeting, including such matters as business status, investments, budget,interimreportsandannualaccounts.TheChairmanleadsanddeleg-ates the work of the Board and ensures that matters not included in the fixedagendaareaddressed.TheBoard’sworkisregulatedbytherulesofprocedure adopted annually by the Board and by the instruction regarding thedistributionofdutiesbetweentheBoardandthePresident.Muchofthe Board’s work in 2018 was devoted to digitisation and range and supply chain.Thefocusalsoremainedtargetedonevaluatingacquisitionoppor-tunities,organisationaldevelopment,efficiencyandgrowth.Inthesum-mer of 2018, the Board visited one of Magnet’s kitchen stores with a new concept,andvisitedacompetitor’skitchenstoreintheUK.TheBoardmembersarepresentedonpages96–97.AttendanceatBoardmeetingsisshowninthetableonpage93.TheworkandcompositionoftheBoardwereevaluatedin2018.One
member of the Board submitted a number of questions as the basis of an evaluationanddiscussionwiththeChairman.
The results of the evaluation were presented to the Nomination Com-mittee.TheBoardalsoevaluatesthePresidentonanongoingbasisthroughouttheyear.TheBoardalsoevaluatedtheAuditCommittee.In2018,theGroup’sCFOservedastheBoardofDirectors’secretary.
AUDIT COMMITTEEThe main task of the Audit Committee is to assist the Board in monitor-ingprocessesrelatedtoNobia’sfinancialreportingandinternalcontroltoensurethequalityoftheexternalreporting.TheCommitteeisalsotoinform the Board of the results of the external audit and the manner in whichtheauditcontributedtothereliabilityofthefinancialreporting.TheAudit Committee’s duties also include studying internal audit reports com-piledbytheGroup’sinternalauditfunction.TheAuditCommitteeisalsoresponsible for supporting the Nomination Committee in preparing pro-posalsontheelectionofexternalauditorsandauditor’sfees.TheAuditCommitteecomprisestwoBoardmembers:LilianFossum
Biner(Chairman)andNoraFørisdalLarssen.TheexternalauditorsreporttotheCommitteeatthreescheduledmeetings.Atleastfourmeetingsareheldperyearandadditionalmeetingsareheldasnecessary.In2018,theAuditCommitteeheldfivemeetingsandtheauditors
attendedthreeofthesemeetings.Importantmattersduringtheyearincluded follow-ups of targeted internal examinations, regulatory compli-ance,evaluationsoffinancialreportingincludingevaluationoftheappli-cation of accounting policies and assessments in the accounts and report-ing of suspected breaches of the Code of Conduct through Speak-up
BOARD OF DIRECTORS IN 2018Board meetings,
7 meetings in total
Audit Committee, 5 meetings in total
Remuneration Committee,
5 meetings in total Born
Board member
since Nationality Independent
Hans Eckerström3 Chairman 6 4 1972 2018 Swedish Not independent1Tomas Billing4 Chairman 1 1 1963 2015 Swedish Not independent1Morten Falkenberg President and CEO 7 1958 2011 Danish Not independent2
LilianFossumBiner Board member 7 5 1962 2012 Swedish IndependentNoraFørisdalLarssen Board member 7 5 1965 2011 Norwegian Not independent1StefanJacobsson Board member 6 1952 2014 Swedish IndependentRicardWennerklint Board member 7 5 1969 2014 Swedish Not independent1Christina Ståhl Board member 7 1970 2015 Swedish IndependentJillLittle Board member 7 1953 2017 British IndependentGeorge Adams Board member 7 1956 2017 British IndependentPer Bergström Employeerep. 7 1960 2000 SwedishMarie Ströberg Employeerep. 6 1973 2007 SwedishTerese Asthede5 Employeerep. 5 1971 2013 SwedishSusanneLevinsson5 Employeerep. 6 1973 2017 Swedish1)Inrelationtomajorshareholders. 2)President. 3)NewBoardmemberfrom10April2018.4)SteppeddownfromBoardon10April2018. 5)Deputy.
C O R P O R AT E G O V E R N A N C E R E P O R T
NOB I A ANNUA L AND S U S TA I NA B I L I T Y R E PORT 2 018 9 3
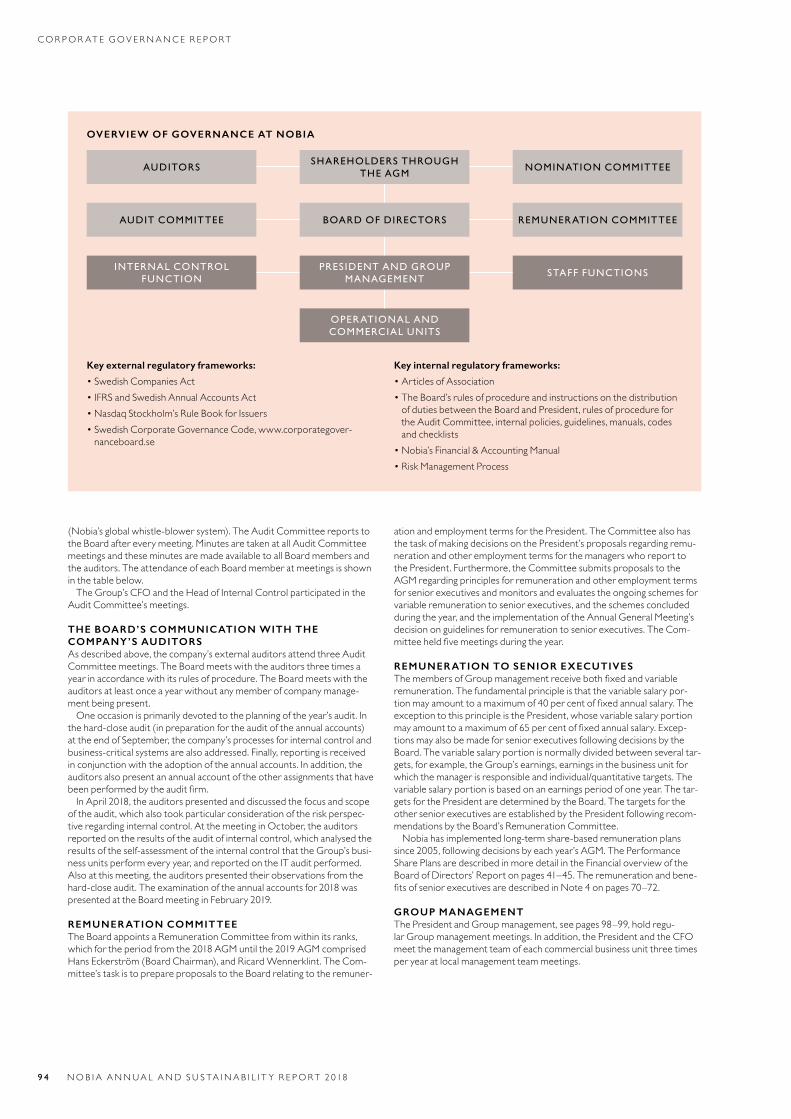
(Nobia’sglobalwhistle-blowersystem).TheAuditCommitteereportstotheBoardaftereverymeeting.MinutesaretakenatallAuditCommitteemeetings and these minutes are made available to all Board members and theauditors.TheattendanceofeachBoardmemberatmeetingsisshowninthetablebelow.TheGroup’sCFOandtheHeadofInternalControlparticipatedinthe
AuditCommittee’smeetings.
THE BOARD’S COMMUNICATION WITH THE COMPANY’S AUDITORSAs described above, the company’s external auditors attend three Audit Committeemeetings.TheBoardmeetswiththeauditorsthreetimesayearinaccordancewithitsrulesofprocedure.TheBoardmeetswiththeauditors at least once a year without any member of company manage-mentbeingpresent.Oneoccasionisprimarilydevotedtotheplanningoftheyear’saudit.In
the hard-close audit (in preparation for the audit of the annual accounts) at the end of September, the company’s processes for internal control and business-criticalsystemsarealsoaddressed.Finally,reportingisreceivedinconjunctionwiththeadoptionoftheannualaccounts.Inaddition,theauditors also present an annual account of the other assignments that have beenperformedbytheauditfirm.InApril2018,theauditorspresentedanddiscussedthefocusandscope
of the audit, which also took particular consideration of the risk perspec-tiveregardinginternalcontrol.AtthemeetinginOctober,theauditorsreported on the results of the audit of internal control, which analysed the results of the self-assessment of the internal control that the Group’s busi-nessunitsperformeveryyear,andreportedontheITauditperformed.Also at this meeting, the auditors presented their observations from the hard-closeaudit.Theexaminationoftheannualaccountsfor2018waspresentedattheBoardmeetinginFebruary2019.
REMUNERATION COMMITTEEThe Board appoints a Remuneration Committee from within its ranks, which for the period from the 2018 AGM until the 2019 AGM comprised HansEckerström(BoardChairman),andRicardWennerklint.TheCom-mittee’s task is to prepare proposals to the Board relating to the remuner-
ationandemploymenttermsforthePresident.TheCommitteealsohasthe task of making decisions on the President’s proposals regarding remu-neration and other employment terms for the managers who report to thePresident.Furthermore,theCommitteesubmitsproposalstotheAGM regarding principles for remuneration and other employment terms for senior executives and monitors and evaluates the ongoing schemes for variable remuneration to senior executives, and the schemes concluded during the year, and the implementation of the Annual General Meeting’s decisiononguidelinesforremunerationtoseniorexecutives.TheCom-mitteeheldfivemeetingsduringtheyear.
REMUNERATION TO SENIOR EXECUTIVESThemembersofGroupmanagementreceivebothfixedandvariableremuneration.Thefundamentalprincipleisthatthevariablesalarypor-tionmayamounttoamaximumof40percentoffixedannualsalary.Theexception to this principle is the President, whose variable salary portion mayamounttoamaximumof65percentoffixedannualsalary.Excep-tions may also be made for senior executives following decisions by the Board.Thevariablesalaryportionisnormallydividedbetweenseveraltar-gets, for example, the Group’s earnings, earnings in the business unit for whichthemanagerisresponsibleandindividual/quantitativetargets.Thevariablesalaryportionisbasedonanearningsperiodofoneyear.Thetar-getsforthePresidentaredeterminedbytheBoard.Thetargetsfortheother senior executives are established by the President following recom-mendationsbytheBoard’sRemunerationCommittee.
Nobia has implemented long-term share-based remuneration plans since2005,followingdecisionsbyeachyear’sAGM.ThePerformanceShare Plans are described in more detail in the Financial overview of the BoardofDirectors’Reportonpages41–45.Theremunerationandbene-fitsofseniorexecutivesaredescribedinNote4onpages70–72.
GROUP MANAGEMENTThePresidentandGroupmanagement,seepages98–99,holdregu-larGroupmanagementmeetings.Inaddition,thePresidentandtheCFOmeet the management team of each commercial business unit three times peryearatlocalmanagementteammeetings.
OVERVIEW OF GOVERNANCE AT NOBIA
Key external regulatory frameworks:
• Swedish Companies Act• IFRSandSwedishAnnualAccountsAct• NasdaqStockholm’sRuleBookforIssuers• SwedishCorporateGovernanceCode,www.corporategover-nanceboard.se
Key internal regulatory frameworks:
• Articles of Association• The Board’s rules of procedure and instructions on the distribution
of duties between the Board and President, rules of procedure for the Audit Committee, internal policies, guidelines, manuals, codes and checklists
• Nobia’s Financial & Accounting Manual• Risk Management Process
AUDITORS
AUDIT COMMITTEE
INTERNAL CONTROL FUNCTION
OPER ATIONAL AND COMMERCIAL UNITS
NOMINATION COMMITTEE
REMUNER ATION COMMITTEE
STAFF FUNCTIONS
SHAREHOLDERS THROUGH THE AGM
BOARD OF DIRECTORS
PRES IDENT AND GROUP MANAGEMENT
C O R P O R AT E G O V E R N A N C E R E P O R T
9 4 NOB I A ANNUA L AND S U S TA I NA B I L I T Y R E PORT 2 018
AUDITORSDeloitte AB was re-elected as the company’s auditor at the 2018 AGM foramandateperiodofoneyearuntiltheconclusionofthe2019AGM.TheAuditor-in-ChargeisAuthorisedPublicAccountantDanieldePaula.TheNominationCommittee’sproposalsforauditingfirmandAuditor-in-Charge prior to the 2019 AGM were presented in the notice of the AGM, whichwaspublishedonNobia’swebsiteon2April.TheinteractionoftheauditorswiththeBoardisdescribedabove.Nobia’spurchasesofservicesfrom Deloitte, in addition to audit assignments, are described in Note 6 onpage73.
THE BOARD’S DESCRIPTION OF INTERNAL CONTROL AND RISK MANAGEMENT SYSTEMS REGARDING THE FINANCIAL REPORTING FOR THE 2018 FINANCIAL YEAR The Board of Directors is responsible for maintaining a high level of inter-nal control at the company in accordance with the Swedish Companies ActandtheCode.Thisdescriptionhasbeenpreparedinaccordancewith Chapter 6, Section 6, second paragraph, second point of the Swed-ish Annual Accounts Act, and is thereby limited to the internal control and riskmanagementofthefinancialreporting.ThedescriptionoftheGroup’sinternal control and risk management systems also includes the description ofthecompany’ssystems.
CONTROL ENVIRONMENTS AND GOVERNING DOCUMENTSThestructureofNobiaisorganisedsothatthefirststageofthevaluechain, purchasing, production and logistics have a Group-wide manage-mentfunction.Themaintaskoftheseoperatingunitsistocapitaliseonopportunitiesforeconomiesofscalewithineacharea.Thecommercialunits are responsible for developing Nobia’s sales channels and brands in linewithNobia’sstrategy.Thebasisfortheinternalcontroloffinancialreportingisthecontrol
environment that comprises the company’s organisation, decision-making procedures, authorities and responsibilities, as documented and commu-nicated in governing documents such as internal policies, guidelines, man-ualsandcodes.Examplesincludethedivisionofresponsibilitybetweenthe Board on one hand and the President and other bodies established by the Board on the other, instructions for authorisation, and instructions for accountingandreporting.
Documentation concerning the principles and forms for reporting, inter-nal governance, control and monitoring is compiled in Nobia’s Financial & Accounting Manual, which is available to all relevant employees on Nobia’s intranet.ThisManualisavailabletoallrelevantemployeesonNobia’sintranet.
Thefinancedirectorofeachunitisresponsibleforensuringeffectiveinter-nalcontrol,andthefinancialmanagerofeachunitisresponsibleformon-itoring and ensuring compliance with Nobia’s accounting procedures and principles.Thesearedocumentedintheaforementionedmanual.Allfinancialmanagersfromthevariousunitsmeetatleastonceeverytwoyearstodiscussvarioustopicsrelevanttofinancialreporting.
RISK MANAGEMENTThe Group has methods for risk assessment and risk management to ensure that the risks to which the Group is exposed are managed within theestablishedframeworks.Therisksidentifiedconcerningfinancialreporting are managed in the Group’s control structure and are continu-ouslymonitoredandassessed.Oneofthetoolsforthispurposeisself-as-sessments, which are conducted annually by local management teams andevaluatedaccordingtoestablishedprocedures.Riskassessmentsaredescribedinmoredetailonpages46–48.
FINANCIAL INFORMATIONThe Group has established information and communication channels in ordertosupportthecompletenessandaccuracyofthefinancialreporting,for example, through governing documents in the form of internal policies, guidelines,manualsandcodesregardingthefinancialreportingappliedbyrelevantpersonnel.
The Group monitors compliance with these governing documents and measurestheefficiencyofcontrolstructures.Inaddition,theGroup’sinformationandcommunicationchannelsare
monitoredtoensurethatthesechannelsareappropriateforthefinan-cialreporting.Furthermore,theGrouphasdevelopedcheckliststoensurecompliancewiththedisclosurerequirementsinthefinancialstatements.
FRAMEWORK FOR FINANCIAL REPORTING The Group’s internal control function, which is an integrated part of the centralfinancefunction,monitoredviewpointsthatemergedduringtheyearfromtheinternalcontrolself-assessmentatsomeofthelargerunits.Inaddition,targetedauditsofthreetofiveunitsarecarriedouteveryyearonbehalfoftheAuditCommittee.In2018,targetedauditswerecon-ducted on Novart, Nobia Svenska Kök, Nobia Production Sweden and Bribus.
MONITORING BY THE BOARDThe outcomes of the Group’s risk assessment and risk management proc-esses are addressed each year by the Board, which ensures that these processes include all material areas and provide balanced guidelines for the variousexecutives.TheBoardreceivesperiodicfinancialreportsandeachBoardmeeting
addressesthecompany’sandGroup’sfinancialposition.TheBoardalsostudies the internal audit reports of the Board’s Audit Committee com-piledbytheGroup’sinternalauditfunction.Theinternalauditreportsinclude examining internal control and are available to the Board and audi-torsviatheonlineBoardportal.MinutesaretakenatallAuditCommitteemeetings and these minutes are made available to all Board members and theauditors.Nobiadoesnotcurrentlyhaveadedicatedinternalauditfunction.The
Board has discussed this matter and found the existing monitoring and assessmentstructureoftheGrouptobesatisfactory.Externalservicesmayalsobeengagedinthecontextofcertainspecialexaminations.Thisdecisionisreviewedannually.
AUDITOR’S REPORT ON THE CORPORATE GOV-ERNANCE STATEMENT TO THE ANNUAL MEETING OF SHAREHOLDERS OF NOBIA AB, CORP. REG. NO. 556528 -2752 Assignment and responsibilitiesThe Board of Directors is responsible for ensuring that the Corporate GovernanceReportfor2018onpages92–95hasbeenpreparedinaccordancewiththeAnnualAccountsAct.
Focus and scope of examinationOur examination of the corporate governance statement is conducted in accordance with FAR’s auditing standard RevU 16 The auditor’s examina-tionofthecorporategovernancestatement.Thismeansthatourexamina-tion of the corporate governance statement is different and substantially lessinscopethananauditconductedinaccordancewithInternationalStandards on Auditing and generally accepted auditing standards in Swe-den.Webelievethattheexaminationhasprovideduswithsufficientbasisforouropinions.
OpinionsAcorporategovernancestatementhasbeenprepared.DisclosuresinaccordancewithChapter6,Section6,secondparagraph,points2–6of the Annual Accounts Act and Chapter 7, Section 31, second para-graph of the same law are consistent with the other parts of the annual accounts and consolidated accounts and are in accordance with the Annual AccountsAct.
Stockholm, 5 April 2019Deloitte AB
Daniel de PaulaAuthorised Public Accountant
C O R P O R AT E G O V E R N A N C E R E P O R T
NOB I A ANNUA L AND S U S TA I NA B I L I T Y R E PORT 2 018 9 5
BOARD OF DIRECTORS
HANS ECKERSTRÖM Chairman of the BoardBorn1972.MScinMechanicalEngineeringandMScinBusinessAdministration.ChairmanoftheBoardsince2018.Dependentinrelationtomajorshareholders.Board assignments:ChairmanofProfotoInvestandHenriLloydGroup.BoardmemberofThuleGroupandNordstjernan.Previous positions: Partner at NC Advisory and advisortoNordicCapital’sfunds.Holding in Nobia: 50,000 shares (endowment insurance).
MORTEN FALKENBERG President and CEOBorn1958.B.Sc.BusinessAdministration.PresidentandCEOofNobia.Boardmembersince2011.Board assignments: Board member of Velux GroupandFagerhult.Previous positions: Executive Vice President and Head of Floor Care and Small Appliances at Electrolux, senior positions at TDC Mobile and theCoca-ColaCompany.Holding in Nobia: 712,291 shares (private and occupationalpension).
LILIAN FOSSUM BINER Born1962.B.Sc.BusinessAdministration.Boardmembersince2012.Independent.Board assignments:ChairmanofCloetta.BoardmemberofGivaudan,LE-Lundbergföretagenanda-connect.Previous positions: Vice President and CFO of AxelJohnsson,SeniorVicePresidentandHRDirectorofatElectrolux.Holding in Nobia:6,000shares.
NORA FØRISDAL LARSSEN Born1965.B.Sc.Economics,MBA.SeniorInvestmentManageratNordstjernan.Boardmembersince2011.Dependentinrelationtomajorshareholders.Board assignments: Chairman of Etac and Emma S.BoardmemberofEkornes.Previous positions: ProductLinemanageratElectroluxandpartneratMcKinsey&Co.Holding in Nobia:5,000shares.
STEFAN JACOBSSON Born1952.Boardmembersince2014.Independent.Board assignments: Chairman of Greenfood Group,HBGandDistruptiveMaterials.Previous positions: CEOofPuma,NFICorp.,ABU/GarciaandTretorn.Holding in Nobia: 10,000 (endowment insurance).
RICARD WENNERKLINT Born1969.DeputyCEOofIfSkadeförsäkringandGroupExecutiveVicePresidentSampo.Boardmembersince2014.Dependentinrelationtomajorshareholders.Board assignments: Board member of TopdanmarkPrevious positions: CFOofIfSkadeförsäkring.Holding in Nobia:15,000shares.
CHRISTINA STÅHL Born1970.B.Sc.BusinessAdministrationandM.Sc.BusinessandEconomics.Boardmembersince2015.Independent.Previous positions: PresidentandCEOofMQandCEOofMio.Holding in Nobia:–
J ILL LITTLE Born1953.GMPCranfieldBusinessSchoolandAMPInsead.Boardmembersince2017.Independent.Board assignments: Board member of Shaftesbury,Joules,NationalTrustEnterprisesandNationalTrustRenewableEnergy.Previous positions: SeniorpositionsatJohnLewisandadvisortoElCorteInglés.Holding in Nobia:–
GEORGE ADAMS Born1956.BA(Hons):Politics,Philosophy&Economics,OxfordUniversity.Boardmembersince2017.Independent.Board assignments: Chairman of FFX Tools and BradfordsGroup.BoardmemberofScSandStigaPrevious positions: SeniorpositionsatKingfisher.PresidentoftheEuropeanDIYRetailersAssociation.Holding in Nobia:–
PER BERGSTRÖM Born1960.Employeerepresentativesince2000.EmployedatNobiaProductionSwedensince1976.Board assignments: Board member of Tidaholms Energi,Elnät,BredbandÖstraSkaraborgandNobiaProductionSweden.Holding in Nobia:–
MARIE STRÖBERG Born1973.Employeerepresentativesince2007.EmployedatNobiaSvenskaKöksince2007.Holding in Nobia:–
SUSANNE LEVINSSON Born1973.Deputyemployeerepresentativesince2017.EmployedatNobiaProductionSwedensince2004.Holding in Nobia:–
TERESE ASTHEDEBorn1971.DeputyBoardmember.Employeerepresentativesince2013.EmployedatNobiaSvenskaKöksince2006.Board assignments: Board member of Nobia SvenskaKök.Holding in Nobia:–
AuditorsDeloitte AB
Auditor-in-ChargeDANIEL DE PAULAAuthorised Public AccountantOther audit assignments:Permobil and Poolia
9 6 NOB I A ANNUA L AND S U S TA I NA B I L I T Y R E PORT 2 018
BOARD O F D I R E C TOR S
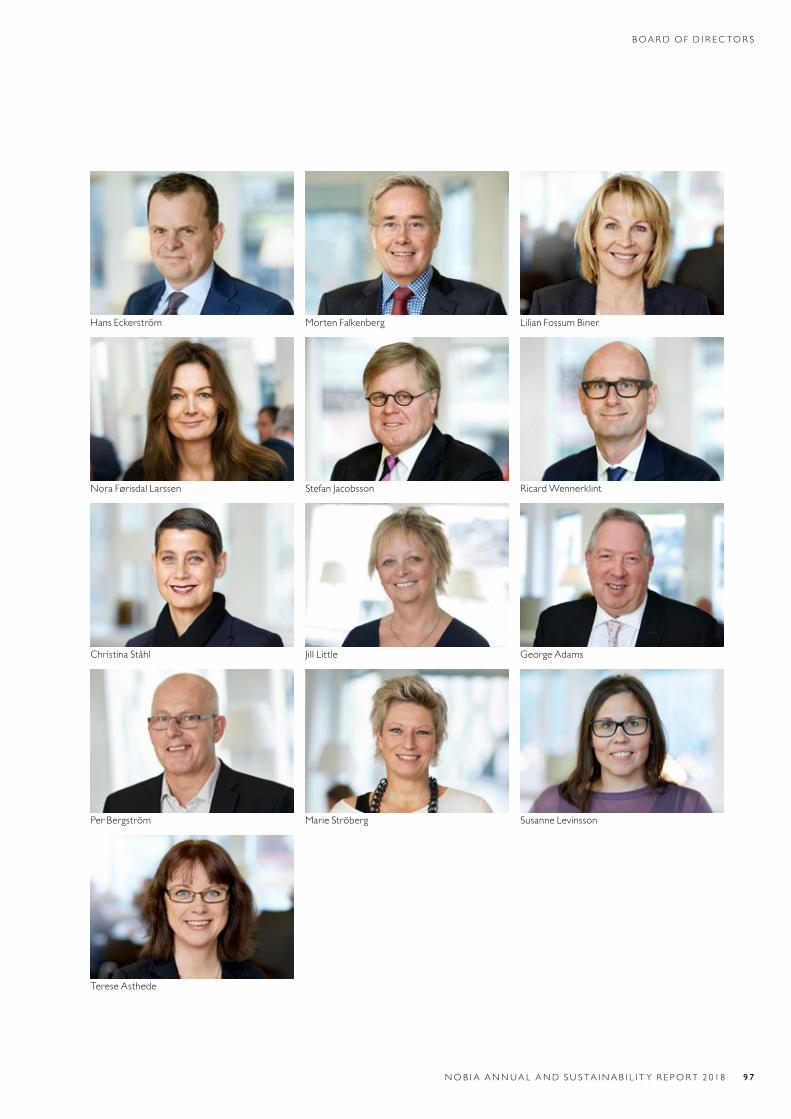
Hans Eckerström Morten Falkenberg LilianFossumBiner
NoraFørisdalLarssen StefanJacobsson RicardWennerklint
Christina Ståhl JillLittle George Adams
Per Bergström Marie Ströberg SusanneLevinsson
Terese Asthede
NOB I A ANNUA L AND S U S TA I NA B I L I T Y R E PORT 2 018 9 7
BOARD O F D I R E C TOR S
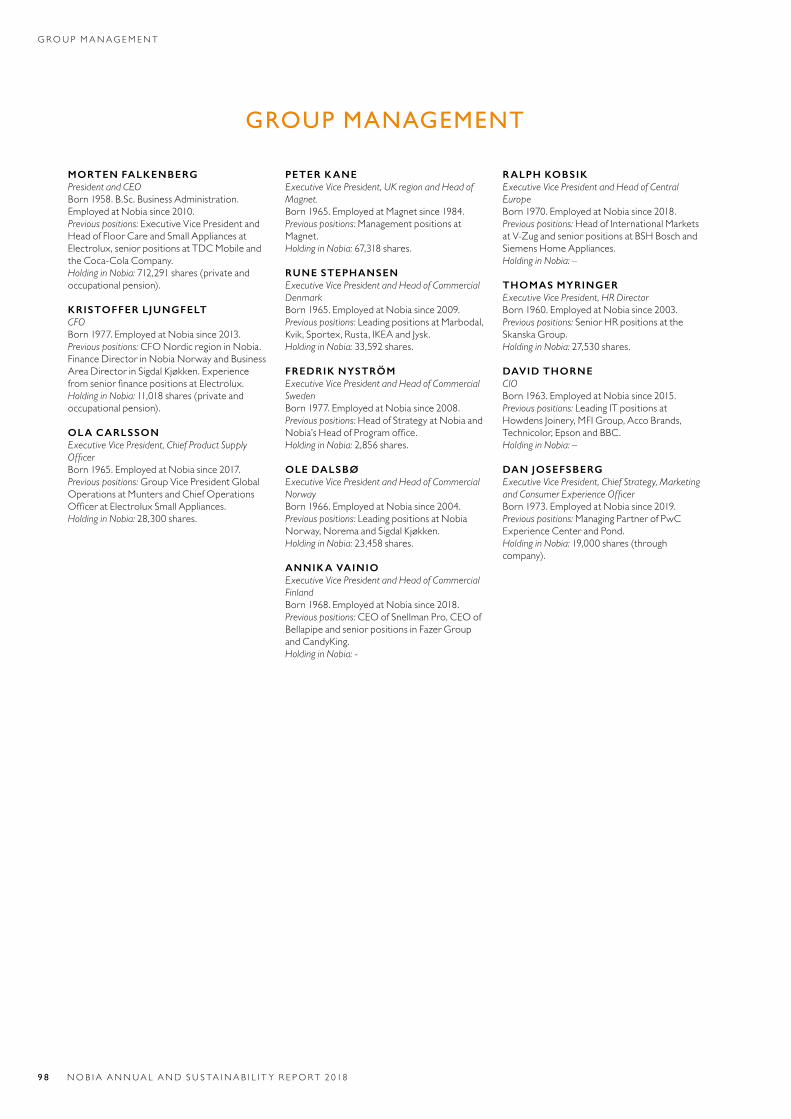
GROUP MANAGEMENT
MORTEN FALKENBERGPresident and CEOBorn1958.B.Sc.BusinessAdministration.EmployedatNobiasince2010.Previous positions: Executive Vice President and Head of Floor Care and Small Appliances at Electrolux, senior positions at TDC Mobile and theCoca-ColaCompany.Holding in Nobia: 712,291 shares (private and occupationalpension).
KRISTOFFER LJUNGFELTCFOBorn1977.EmployedatNobiasince2013.Previous positions:CFONordicregioninNobia.Finance Director in Nobia Norway and Business AreaDirectorinSigdalKjøkken.ExperiencefromseniorfinancepositionsatElectrolux.Holding in Nobia: 11,018 shares (private and occupationalpension).
OLA CARLSSONExecutive Vice President, Chief Product Supply OfficerBorn1965.EmployedatNobiasince2017.Previous positions: Group Vice President Global Operations at Munters and Chief Operations OfficeratElectroluxSmallAppliances.Holding in Nobia:28,300shares.
PETER K ANEExecutive Vice President, UK region and Head of Magnet.Born1965.EmployedatMagnetsince1984.Previous positions: Management positions at Magnet.Holding in Nobia:67,318shares.
RUNE STEPHANSENExecutive Vice President and Head of Commercial DenmarkBorn1965.EmployedatNobiasince2009.Previous positions:LeadingpositionsatMarbodal,Kvik,Sportex,Rusta,IKEAandJysk.Holding in Nobia:33,592shares.
FREDRIK NYSTRÖMExecutive Vice President and Head of Commercial SwedenBorn1977.EmployedatNobiasince2008.Previous positions: Head of Strategy at Nobia and Nobia’sHeadofProgramoffice.Holding in Nobia:2,856shares.
OLE DALSBØExecutive Vice President and Head of Commercial NorwayBorn1966.EmployedatNobiasince2004.Previous positions:LeadingpositionsatNobiaNorway,NoremaandSigdalKjøkken.Holding in Nobia:23,458shares.
ANNIK A VAINIOExecutive Vice President and Head of Commercial Finland Born1968.EmployedatNobiasince2018.Previous positions: CEO of Snellman Pro, CEO of BellapipeandseniorpositionsinFazerGroupandCandyKing.Holding in Nobia: -
RALPH KOBSIKExecutive Vice President and Head of Central EuropeBorn1970.EmployedatNobiasince2018.Previous positions:HeadofInternationalMarketsat V-Zug and senior positions at BSH Bosch and SiemensHomeAppliances.Holding in Nobia:–
THOMAS MYRINGERExecutive Vice President, HR DirectorBorn1960.EmployedatNobiasince2003.Previous positions: Senior HR positions at the SkanskaGroup.Holding in Nobia:27,530shares.
DAVID THORNECIOBorn1963.EmployedatNobiasince2015.Previous positions:LeadingITpositionsatHowdensJoinery,MFIGroup,AccoBrands,Technicolor,EpsonandBBC.Holding in Nobia:–
DAN JOSEFSBERGExecutive Vice President, Chief Strategy, Marketing and Consumer Experience OfficerBorn1973.EmployedatNobiasince2019.Previous positions: Managing Partner of PwC ExperienceCenterandPond.Holding in Nobia: 19,000 shares (through company).
9 8 NOB I A ANNUA L AND S U S TA I NA B I L I T Y R E PORT 2 018
G R O U P M A N A G E M E N T
Morten Falkenberg KristofferLjungfelt Ola Carlsson
Peter Kane Rune Stephansen Fredrik Nyström
Ole Dalsbø Annika Vainio Ralph Kobsik
Thomas Myringer David Thorne DanJosefsberg
NOB I A ANNUA L AND S U S TA I NA B I L I T Y R E PORT 2 018 9 9
G R O U P M A N A G E M E N T

THE NOBIA SHARE AND SHAREHOLDERSThe Nobia share is listed on Nasdaq Stockholm and is included in the Personal & Household Goods sector. In 2018, the share noted a decline of 29 per cent. Market capitalisation at the end of the year was slightly more than SEK 8 billion.
LISTING AND TURNOVER The Nobia share has been listed on Nasdaq Stockholm since 2002, where theshareisincludedinthePersonal&HouseholdGoodssector.Themajority of the shares are traded on Nasdaq Stockholm, but some shares arealsotradedonothermarketplaces.In2018,atotalof113.6millionNobiashares(85.9)weretradedonNas-
daqStockholmatavalueofSEK7.6billion(7.0).Theaverageturnoverper day was approximately 450,000 shares (340,000), corresponding to a valueofSEK30.2million(28.0).TheNobiashare’sliquidity,measuredasrateofturnover,totalled66percent(48).TheaveragerateofturnoverontheStockholmexchangewas48percent(48).
SHARE PERFORMANCEThe share had a weaker performance than the stock exchange as a whole in2018.Thesharepricedeclined29percent,comparedwiththeStock-holmexchangeintotal,whichdeclined8percentinthesameperiod.Duringtheyear,theOMXSStockholmConsumerGoodsPIindexfell14percent.TheclosingpricefortheNobiasharein2018wasSEK49.24,corre-
spondingtomarketcapitalisationofSEK8.4billion.Thehighestpricepaidin2018wasSEK77.45on14June.ThelowestpricepaidduringtheyearwasSEK46.56on27December.
SHARE CAPITALOn 31 December 2018, Nobia’s share capital amounted to SEK 56,763,597, dividedbetween170,293,458shareswithaquotientvalueofSEK0.33.Each share, with the exception of bought-back treasury shares, entitles the holder to one vote, and carries the same entitlement to the company’s capitalandprofits.
DIVIDEND POLICY Nobia’s dividend policy is that the dividend should comprise 40-60 per centofnetprofitaftertax.Investmentrequirements,acquisitionoppor-tunities,liquidityandthefinancialpositionofthecompanyingeneralaretakenintoconsiderationwhenpreparingdividendproposals.
PROPOSED DIVIDENDFor2018,theBoardofDirectorsproposesadividendofSEK4.00pershare,correspondingto90percentofearningspersharefortheyear.TheproposalentailsatotaldividendofapproximatelySEK675million.Forthe2017financialyear,aregulardividendofSEK3.50persharewaspaidoutaswellasanextradividendofSEK3.50pershare,totallingSEK7.00pershare.
TREASURY SHARESAt the start of the year, Nobia had 6,709,571 treasury shares, correspond-ingto3.8percentofthetotalnumberofsharesissued.InMay2018,Nobiasold103,003sharestofulfilthePerformanceShare
Planresolvedbythe2015AnnualGeneralMeeting.Duetothetransfer,thenumberofNobia’streasurysharesdeclinedto6,606,568.
InJuly2018,5,000,000treasurysharesweresubsequentlycancelledinaccordance with the resolution of the 2018 AGM to reduce Nobia’s share capitalbywithdrawingtreasuryshares.Afterthecancellation,thenum-ber of treasury shares was 1,606,568 bringing the total number of shares to170,293,458.
At the end of 2018, Nobia held an unchanged number of treasury shares (1,606,568),correspondingto0.9percentofthetotalnumberofshares.The treasury shares will be used to safeguard Nobia’s commitments under theGroup’sshare-basedremunerationplan.
OWNERSHIP STRUCTUREAtyear-end,Nobiahad14,704shareholders(8,182).Swedishlegalentitiesowned72percent(71)ofthesharecapital.Swedishownershipwas77percent(75),whileforeignownershipamountedto23percent(25).ThelargestforeignshareholdingswereintheUSandtheUK.Thefivelargestshareholders–Nordstjernan,IfSkadeförsäkring,the
FourthSwedishNationalPensionFund,SwedbankRoburfundsandLan-nebofunds–owned53.0percent(49.5)ofallsharesatyear-end.Thetenlargestshareholdersowned65.9percent(61.6)oftheshares.
SHAREHOLDINGS AMONG PERSONS IN SENIOR POSITIONSAt the time of publication of this Annual Report, Group management owned,directlyandindirectly,925,363shares(775,170)inNobia.Onthesame date, Nobia’s Board members excluding the President, had total directandindirectholdingsof86,000shares(221,779).
SHARE DATAListing: NasdaqStockholm,LargeCapTicker: NOBISector: Personal & Household Goods ISIN code: SE0000949331
ANALYSTS THAT FOLLOW NOBIACompany Analyst
Carnegie KennethTollJohanssonDNB Markets Mattias HolmbergHandelsbanken Marcela KlangNordea Predrag SavinovicSEB JohanDahl
10 0 NOB I A ANNUA L AND S U S TA I NA B I L I T Y R E PORT 2 018
TH E NOB I A S HA R E AND SHA R EHO LD E R S
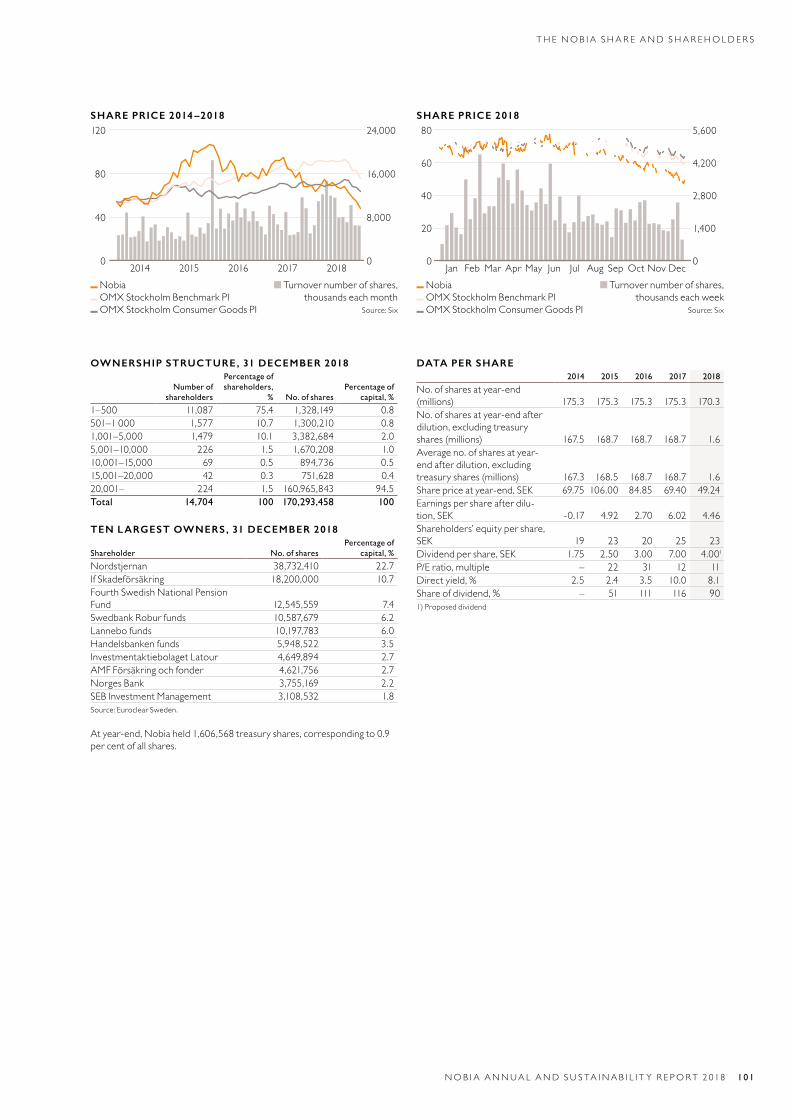
OWNERSHIP STRUCTURE , 31 DECEMBER 2018
Number of shareholders
Percentage of shareholders,
% No. of sharesPercentage of
capital, %
1–500 11,087 75.4 1,328,149 0.8501–1000 1,577 10.7 1,300,210 0.81,001–5,000 1,479 10.1 3,382,684 2.05,001–10,000 226 1.5 1,670,208 1.010,001–15,000 69 0.5 894,736 0.515,001–20,000 42 0.3 751,628 0.420,001– 224 1.5 160,965,843 94.5Total 14,704 100 170,293,458 100
TEN LARGEST OWNERS, 31 DECEMBER 2018
Shareholder No. of sharesPercentage of
capital, %
Nordstjernan 38,732,410 22.7IfSkadeförsäkring 18,200,000 10.7Fourth Swedish National Pension Fund 12,545,559 7.4Swedbank Robur funds 10,587,679 6.2Lannebofunds 10,197,783 6.0Handelsbanken funds 5,948,522 3.5InvestmentaktiebolagetLatour 4,649,894 2.7AMFFörsäkringochfonder 4,621,756 2.7Norges Bank 3,755,169 2.2SEBInvestmentManagement 3,108,532 1.8Source:EuroclearSweden.
Atyear-end,Nobiaheld1,606,568treasuryshares,correspondingto0.9percentofallshares.
DATA PER SHARE2014 2015 2016 2017 2018
No.ofsharesatyear-end (millions) 175.3 175.3 175.3 175.3 170.3No.ofsharesatyear-endafterdilution, excluding treasury shares (millions) 167.5 168.7 168.7 168.7 1.6Averageno.ofsharesatyear-end after dilution, excluding treasury shares (millions) 167.3 168.5 168.7 168.7 1.6Share price at year-end, SEK 69.75 106.00 84.85 69.40 49.24Earnings per share after dilu-tion, SEK -0.17 4.92 2.70 6.02 4.46Shareholders’ equity per share, SEK 19 23 20 25 23Dividend per share, SEK 1.75 2.50 3.00 7.00 4.001 P/E ratio, multiple – 22 31 12 11Direct yield, % 2.5 2.4 3.5 10.0 8.1Share of dividend, % – 51 111 116 901) Proposed dividend
SHARE PRICE 2014 –2018 SHARE PRICE 2018120
80
40
0
80
60
40
20
0
24,000
16,000
8,000
0
5,600
4,200
2,800
1,400
0
Nobia Turnover number of shares,OMXStockholmBenchmarkPI thousandseachmonthOMXStockholmConsumerGoodsPI Source: Six
Nobia Turnover number of shares,OMXStockholmBenchmarkPI thousandseachweekOMXStockholmConsumerGoodsPI Source: Six
2014 2015 2016 2017 2018 Jan Feb Mar Apr May Jun Jul Aug Sep Oct Nov Dec
NOB I A ANNUA L AND S U S TA I NA B I L I T Y R E PORT 2 018 101
TH E NOB I A S HA R E AND SHA R EHO LD E R S
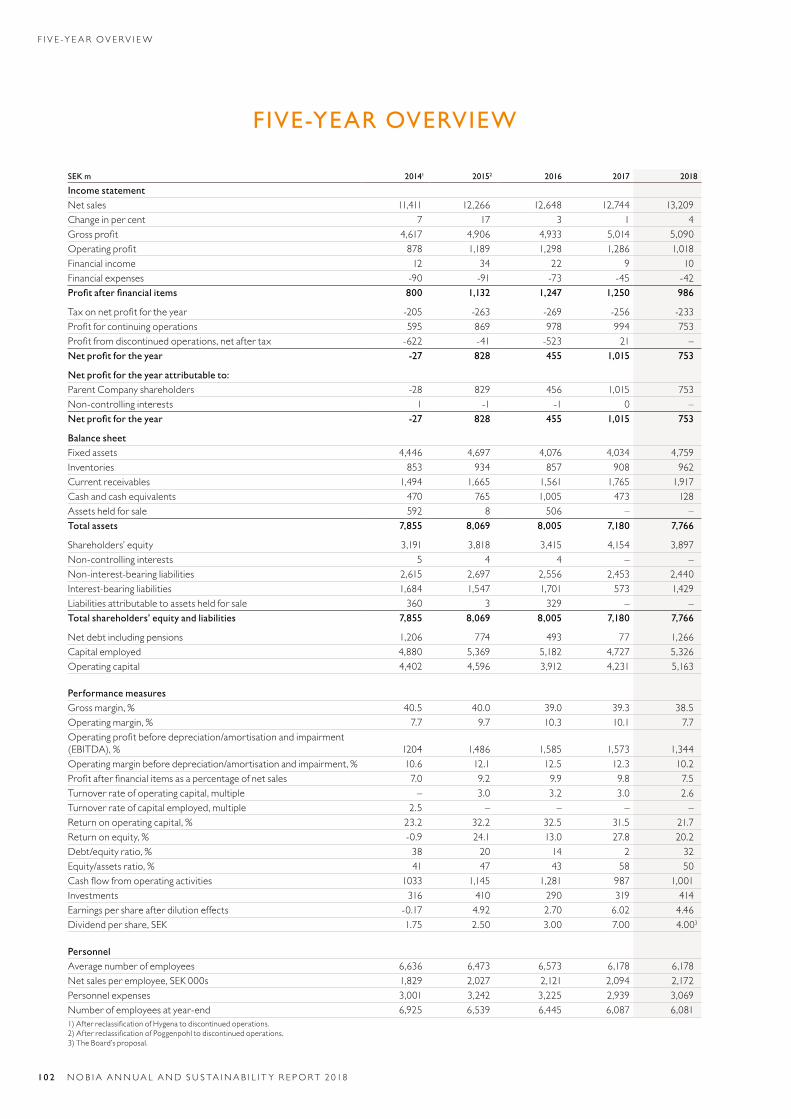
FIVE-YEAR OVERVIEW
SEK m 20141 20152 2016 2017 2018
Income statementNet sales 11,411 12,266 12,648 12,744 13,209Change in per cent 7 17 3 1 4Grossprofit 4,617 4,906 4,933 5,014 5,090Operatingprofit 878 1,189 1,298 1,286 1,018Financial income 12 34 22 9 10Financial expenses -90 -91 -73 -45 -42Profit after financial items 800 1,132 1,247 1,250 986
Taxonnetprofitfortheyear -205 -263 -269 -256 -233Profitforcontinuingoperations 595 869 978 994 753Profitfromdiscontinuedoperations,netaftertax -622 -41 -523 21 –Net profit for the year -27 828 455 1,015 753
Net profit for the year attributable to:Parent Company shareholders -28 829 456 1,015 753Non-controlling interests 1 -1 -1 0 –Net profit for the year -27 828 455 1,015 753
Balance sheetFixed assets 4,446 4,697 4,076 4,034 4,759Inventories 853 934 857 908 962Current receivables 1,494 1,665 1,561 1,765 1,917Cash and cash equivalents 470 765 1,005 473 128Assets held for sale 592 8 506 – –Total assets 7,855 8,069 8,005 7,180 7,766
Shareholders’ equity 3,191 3,818 3,415 4,154 3,897Non-controlling interests 5 4 4 – –Non-interest-bearing liabilities 2,615 2,697 2,556 2,453 2,440Interest-bearingliabilities 1,684 1,547 1,701 573 1,429Liabilitiesattributabletoassetsheldforsale 360 3 329 – –Total shareholders’ equity and liabilities 7,855 8,069 8,005 7,180 7,766
Net debt including pensions 1,206 774 493 77 1,266Capital employed 4,880 5,369 5,182 4,727 5,326Operating capital 4,402 4,596 3,912 4,231 5,163
Performance measures Gross margin, % 40.5 40.0 39.0 39.3 38.5Operating margin, % 7.7 9.7 10.3 10.1 7.7Operatingprofitbeforedepreciation/amortisationandimpairment(EBITDA),% 1204 1,486 1,585 1,573 1,344Operating margin before depreciation/amortisation and impairment, % 10.6 12.1 12.5 12.3 10.2Profitafterfinancialitemsasapercentageofnetsales 7.0 9.2 9.9 9.8 7.5Turnover rate of operating capital, multiple – 3.0 3.2 3.0 2.6Turnover rate of capital employed, multiple 2.5 – – – –Return on operating capital, % 23.2 32.2 32.5 31.5 21.7Return on equity, % -0.9 24.1 13.0 27.8 20.2Debt/equity ratio, % 38 20 14 2 32Equity/assets ratio, % 41 47 43 58 50Cashflowfromoperatingactivities 1033 1,145 1,281 987 1,001Investments 316 410 290 319 414Earnings per share after dilution effects -0.17 4.92 2.70 6.02 4.46Dividend per share, SEK 1.75 2.50 3.00 7.00 4.003
Personnel Average number of employees 6,636 6,473 6,573 6,178 6,178Net sales per employee, SEK 000s 1,829 2,027 2,121 2,094 2,172Personnel expenses 3,001 3,242 3,225 2,939 3,069Number of employees at year-end 6,925 6,539 6,445 6,087 6,0811)AfterreclassificationofHygenatodiscontinuedoperations.2)AfterreclassificationofPoggenpohltodiscontinuedoperations.3)TheBoard’sproposal.
10 2 NOB I A ANNUA L AND S U S TA I NA B I L I T Y R E PORT 2 018
F I V E -Y E A R OV E RV I EW
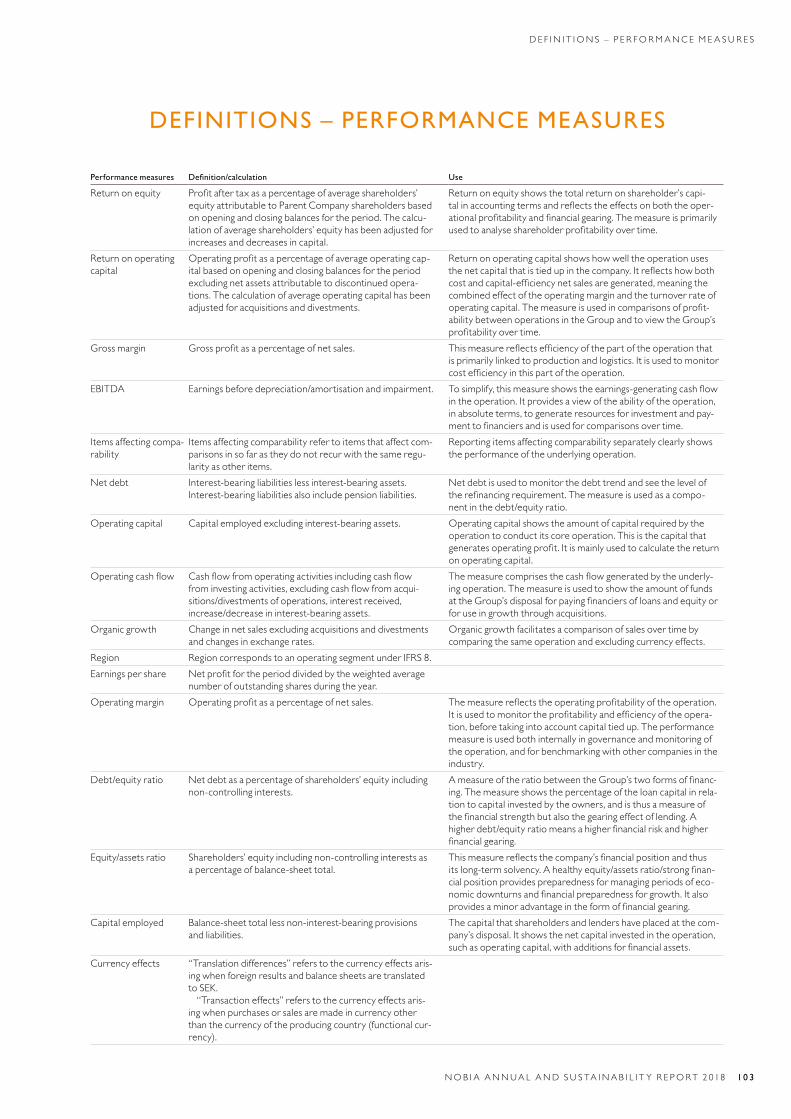
DEFINITIONS – PERFORMANCE MEASURES
Performance measures Definition/calculation Use
Return on equity Profitaftertaxasapercentageofaverageshareholders’equity attributable to Parent Company shareholders based onopeningandclosingbalancesfortheperiod.Thecalcu-lation of average shareholders’ equity has been adjusted for increasesanddecreasesincapital.
Return on equity shows the total return on shareholder’s capi-talinaccountingtermsandreflectstheeffectsonboththeoper-ationalprofitabilityandfinancialgearing.Themeasureisprimarilyusedtoanalyseshareholderprofitabilityovertime.
Return on operating capital
Operatingprofitasapercentageofaverageoperatingcap-ital based on opening and closing balances for the period excluding net assets attributable to discontinued opera-tions.Thecalculationofaverageoperatingcapitalhasbeenadjustedforacquisitionsanddivestments.
Return on operating capital shows how well the operation uses thenetcapitalthatistiedupinthecompany.Itreflectshowbothcostandcapital-efficiencynetsalesaregenerated,meaningthecombined effect of the operating margin and the turnover rate of operatingcapital.Themeasureisusedincomparisonsofprofit-ability between operations in the Group and to view the Group’s profitabilityovertime.
Gross margin Grossprofitasapercentageofnetsales. Thismeasurereflectsefficiencyofthepartoftheoperationthatisprimarilylinkedtoproductionandlogistics.Itisusedtomonitorcostefficiencyinthispartoftheoperation.
EBITDA Earningsbeforedepreciation/amortisationandimpairment. Tosimplify,thismeasureshowstheearnings-generatingcashflowintheoperation.Itprovidesaviewoftheabilityoftheoperation,in absolute terms, to generate resources for investment and pay-menttofinanciersandisusedforcomparisonsovertime.
Itemsaffectingcompa-rability
Itemsaffectingcomparabilityrefertoitemsthataffectcom-parisons in so far as they do not recur with the same regu-larityasotheritems.
Reporting items affecting comparability separately clearly shows theperformanceoftheunderlyingoperation.
Net debt Interest-bearingliabilitieslessinterest-bearingassets.Interest-bearingliabilitiesalsoincludepensionliabilities.
Net debt is used to monitor the debt trend and see the level of therefinancingrequirement.Themeasureisusedasacompo-nentinthedebt/equityratio.
Operating capital Capitalemployedexcludinginterest-bearingassets. Operating capital shows the amount of capital required by the operationtoconductitscoreoperation.Thisisthecapitalthatgeneratesoperatingprofit.Itismainlyusedtocalculatethereturnonoperatingcapital.
Operatingcashflow Cashflowfromoperatingactivitiesincludingcashflowfrominvestingactivities,excludingcashflowfromacqui-sitions/divestments of operations, interest received, increase/decreaseininterest-bearingassets.
Themeasurecomprisesthecashflowgeneratedbytheunderly-ingoperation.ThemeasureisusedtoshowtheamountoffundsattheGroup’sdisposalforpayingfinanciersofloansandequityorforuseingrowththroughacquisitions.
Organic growth Change in net sales excluding acquisitions and divestments andchangesinexchangerates.
Organic growth facilitates a comparison of sales over time by comparingthesameoperationandexcludingcurrencyeffects.
Region RegioncorrespondstoanoperatingsegmentunderIFRS8.Earnings per share Netprofitfortheperioddividedbytheweightedaverage
numberofoutstandingsharesduringtheyear.Operating margin Operatingprofitasapercentageofnetsales. Themeasurereflectstheoperatingprofitabilityoftheoperation.
Itisusedtomonitortheprofitabilityandefficiencyoftheopera-tion,beforetakingintoaccountcapitaltiedup.Theperformancemeasure is used both internally in governance and monitoring of the operation, and for benchmarking with other companies in the industry.
Debt/equity ratio Net debt as a percentage of shareholders’ equity including non-controllinginterests.
AmeasureoftheratiobetweentheGroup’stwoformsoffinanc-ing.Themeasureshowsthepercentageoftheloancapitalinrela-tion to capital invested by the owners, and is thus a measure of thefinancialstrengthbutalsothegearingeffectoflending.Ahigherdebt/equityratiomeansahigherfinancialriskandhigherfinancialgearing.
Equity/assets ratio Shareholders’ equity including non-controlling interests as apercentageofbalance-sheettotal.
Thismeasurereflectsthecompany’sfinancialpositionandthusitslong-termsolvency.Ahealthyequity/assetsratio/strongfinan-cial position provides preparedness for managing periods of eco-nomicdownturnsandfinancialpreparednessforgrowth.Italsoprovidesaminoradvantageintheformoffinancialgearing.
Capital employed Balance-sheet total less non-interest-bearing provisions andliabilities.
The capital that shareholders and lenders have placed at the com-pany’sdisposal.Itshowsthenetcapitalinvestedintheoperation,suchasoperatingcapital,withadditionsforfinancialassets.
Currency effects “Translation differences” refers to the currency effects aris-ing when foreign results and balance sheets are translated toSEK.
“Transaction effects” refers to the currency effects aris-ing when purchases or sales are made in currency other than the currency of the producing country (functional cur-rency).
NOB I A ANNUA L AND S U S TA I NA B I L I T Y R E PORT 2 018 10 3
DE F I N I T I ON S – P E R FORMANC E M E A SU R E S
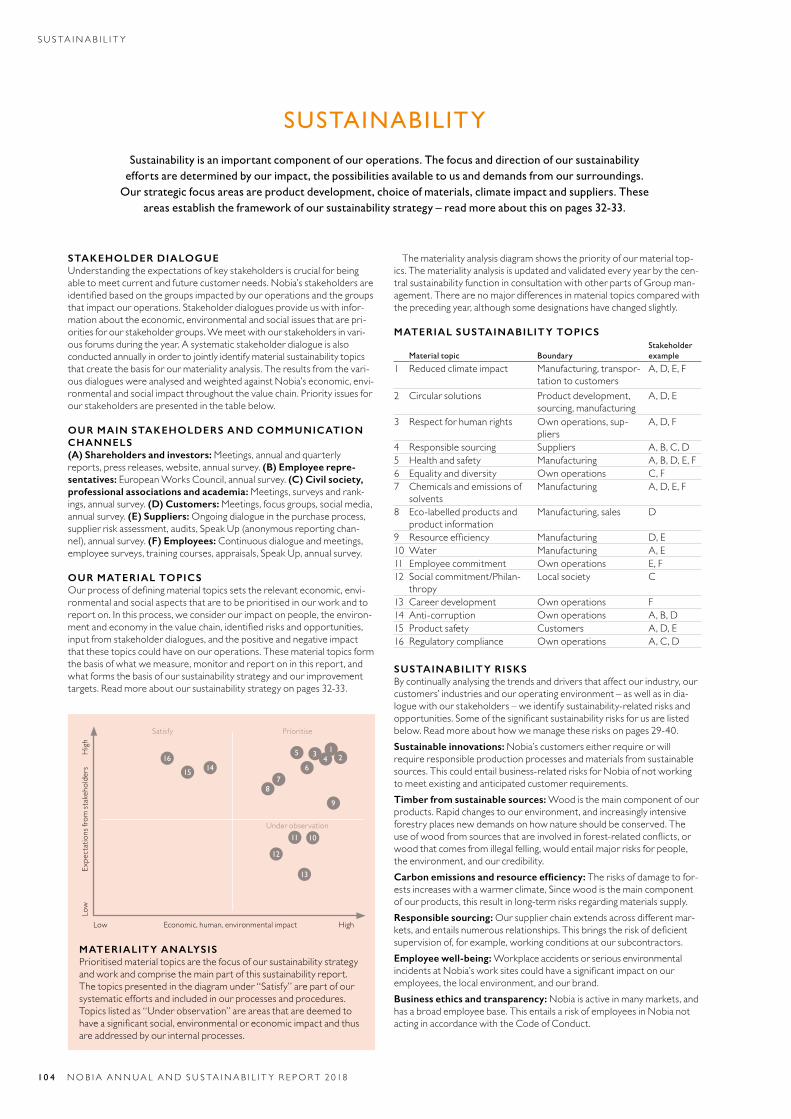
SUSTAINABILITY
Sustainability is an important component of our operations. The focus and direction of our sustainability efforts are determined by our impact, the possibilities available to us and demands from our surroundings.
Our strategic focus areas are product development, choice of materials, climate impact and suppliers. These areas establish the framework of our sustainability strategy – read more about this on pages 32-33.
STAKEHOLDER DIALOGUEUnderstanding the expectations of key stakeholders is crucial for being abletomeetcurrentandfuturecustomerneeds.Nobia’sstakeholdersareidentifiedbasedonthegroupsimpactedbyouroperationsandthegroupsthatimpactouroperations.Stakeholderdialoguesprovideuswithinfor-mation about the economic, environmental and social issues that are pri-oritiesforourstakeholdergroups.Wemeetwithourstakeholdersinvari-ousforumsduringtheyear.Asystematicstakeholderdialogueisalsoconducted annually in order to jointly identify material sustainability topics thatcreatethebasisforourmaterialityanalysis.Theresultsfromthevari-ous dialogues were analysed and weighted against Nobia’s economic, envi-ronmentalandsocialimpactthroughoutthevaluechain.Priorityissuesforourstakeholdersarepresentedinthetablebelow.
OUR MAIN STAKEHOLDERS AND COMMUNICATION CHANNELS(A) Shareholders and investors: Meetings, annual and quarterly reports,pressreleases,website,annualsurvey.(B) Employee repre-sentatives: EuropeanWorksCouncil,annualsurvey.(C) Civil society, professional associations and academia: Meetings, surveys and rank-ings,annualsurvey.(D) Customers: Meetings, focus groups, social media, annualsurvey.(E) Suppliers: Ongoing dialogue in the purchase process, supplier risk assessment, audits, Speak Up (anonymous reporting chan-nel),annualsurvey.(F) Employees: Continuous dialogue and meetings, employeesurveys,trainingcourses,appraisals,SpeakUp,annualsurvey.
OUR MATERIAL TOPICSOurprocessofdefiningmaterialtopicssetstherelevanteconomic,envi-ronmental and social aspects that are to be prioritised in our work and to reporton.Inthisprocess,weconsiderourimpactonpeople,theenviron-mentandeconomyinthevaluechain,identifiedrisksandopportunities,input from stakeholder dialogues, and the positive and negative impact thatthesetopicscouldhaveonouroperations.Thesematerialtopicsformthe basis of what we measure, monitor and report on in this report, and what forms the basis of our sustainability strategy and our improvement targets.Readmoreaboutoursustainabilitystrategyonpages32-33.
The materiality analysis diagram shows the priority of our material top-ics.Thematerialityanalysisisupdatedandvalidatedeveryyearbythecen-tral sustainability function in consultation with other parts of Group man-agement.Therearenomajordifferencesinmaterialtopicscomparedwiththeprecedingyear,althoughsomedesignationshavechangedslightly.
MATERIAL SUSTAINABILITY TOPICS
Material topic BoundaryStakeholder example
1 Reduced climate impact Manufacturing, transpor-tation to customers
A, D, E, F
2 Circular solutions Product development, sourcing, manufacturing
A, D, E
3 Respect for human rights Own operations, sup-pliers
A, D, F
4 Responsible sourcing Suppliers A, B, C, D5 Health and safety Manufacturing A, B, D, E, F6 Equality and diversity Own operations C, F7 Chemicals and emissions of
solventsManufacturing A, D, E, F
8 Eco-labelled products and product information
Manufacturing, sales D
9 Resourceefficiency Manufacturing D, E10 Water Manufacturing A, E11 Employee commitment Own operations E, F12 Social commitment/Philan-
thropyLocalsociety C
13 Career development Own operations F14 Anti-corruption Own operations A, B, D15 Product safety Customers A, D, E16 Regulatory compliance Own operations A, C, D
SUSTAINABILITY RISKSBy continually analysing the trends and drivers that affect our industry, our customers’industriesandouroperatingenvironment–aswellasindia-loguewithourstakeholders–weidentifysustainability-relatedrisksandopportunities.Someofthesignificantsustainabilityrisksforusarelistedbelow.Readmoreabouthowwemanagetheserisksonpages29-40.Sustainable innovations: Nobia’s customers either require or will require responsible production processes and materials from sustainable sources.Thiscouldentailbusiness-relatedrisksforNobiaofnotworkingtomeetexistingandanticipatedcustomerrequirements.Timber from sustainable sources: Woodisthemaincomponentofourproducts.Rapidchangestoourenvironment,andincreasinglyintensiveforestryplacesnewdemandsonhownatureshouldbeconserved.Theuseofwoodfromsourcesthatareinvolvedinforest-relatedconflicts,orwood that comes from illegal felling, would entail major risks for people, theenvironment,andourcredibility.Carbon emissions and resource efficiency: The risks of damage to for-ests increases with a warmer climate, Since wood is the main component ofourproducts,thisresultinlong-termrisksregardingmaterialssupply.Responsible sourcing: Our supplier chain extends across different mar-kets,andentailsnumerousrelationships.Thisbringstheriskofdeficientsupervisionof,forexample,workingconditionsatoursubcontractors.Employee well-being: Workplaceaccidentsorseriousenvironmental incidentsatNobia’sworksitescouldhaveasignificantimpactonouremployees,thelocalenvironment,andourbrand.Business ethics and transparency: Nobia is active in many markets, and hasabroademployeebase.ThisentailsariskofemployeesinNobianotactinginaccordancewiththeCodeofConduct.
MATERIALITY ANALYSISPrioritised material topics are the focus of our sustainability strategy andworkandcomprisethemainpartofthissustainabilityreport.The topics presented in the diagram under “Satisfy” are part of our systematiceffortsandincludedinourprocessesandprocedures.Topics listed as “Under observation” are areas that are deemed to haveasignificantsocial,environmentaloreconomicimpactandthusareaddressedbyourinternalprocesses.
Low Economic,human,environmentalimpact High
Satisfy Prioritise
Low
Expectationsfrom
stakeholders
High
Under observation
123
45
6
78
9
1011
12
13
1415
16
10 4 NOB I A ANNUA L AND S U S TA I NA B I L I T Y R E PORT 2 018
SU S TA I NA B I L I T Y
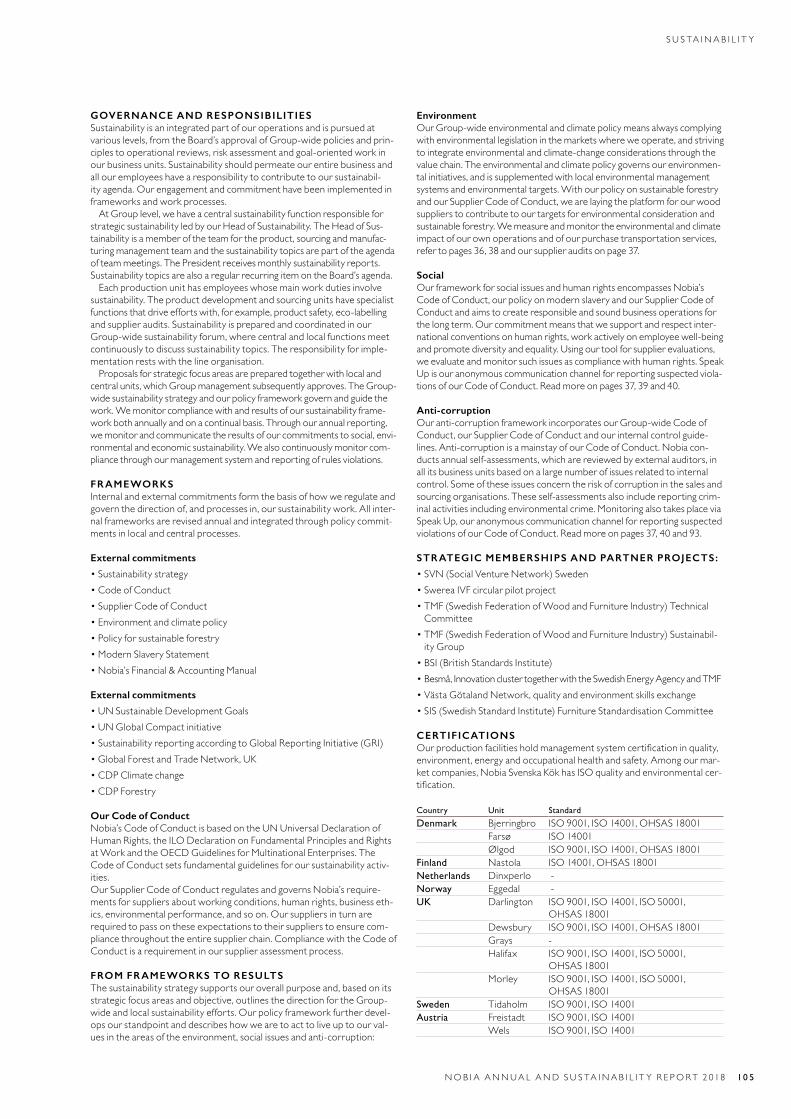
GOVERNANCE AND RESPONSIBILITIESSustainability is an integrated part of our operations and is pursued at various levels, from the Board’s approval of Group-wide policies and prin-ciples to operational reviews, risk assessment and goal-oriented work in ourbusinessunits.Sustainabilityshouldpermeateourentirebusinessandall our employees have a responsibility to contribute to our sustainabil-ityagenda.Ourengagementandcommitmenthavebeenimplementedinframeworksandworkprocesses.
At Group level, we have a central sustainability function responsible for strategicsustainabilityledbyourHeadofSustainability.TheHeadofSus-tainability is a member of the team for the product, sourcing and manufac-turing management team and the sustainability topics are part of the agenda ofteammeetings.ThePresidentreceivesmonthlysustainabilityreports.SustainabilitytopicsarealsoaregularrecurringitemontheBoard’sagenda.
Each production unit has employees whose main work duties involve sustainability.Theproductdevelopmentandsourcingunitshavespecialist functions that drive efforts with, for example, product safety, eco-labelling andsupplieraudits.SustainabilityispreparedandcoordinatedinourGroup-wide sustainability forum, where central and local functions meet continuouslytodiscusssustainabilitytopics.Theresponsibilityforimple-mentationrestswiththelineorganisation.
Proposals for strategic focus areas are prepared together with local and centralunits,whichGroupmanagementsubsequentlyapproves.TheGroup-wide sustainability strategy and our policy framework govern and guide the work.Wemonitorcompliancewithandresultsofoursustainabilityframe-workbothannuallyandonacontinualbasis.Throughourannualreporting,we monitor and communicate the results of our commitments to social, envi-ronmentalandeconomicsustainability.Wealsocontinuouslymonitorcom-pliancethroughourmanagementsystemandreportingofrulesviolations.
FRAMEWORKSInternalandexternalcommitmentsformthebasisofhowweregulateandgovernthedirectionof,andprocessesin,oursustainabilitywork.Allinter-nal frameworks are revised annual and integrated through policy commit-mentsinlocalandcentralprocesses.
External commitments
• Sustainability strategy• Code of Conduct• Supplier Code of Conduct• Environment and climate policy• Policy for sustainable forestry• Modern Slavery Statement• Nobia’s Financial & Accounting Manual
External commitments
• UN Sustainable Development Goals• UN Global Compact initiative• SustainabilityreportingaccordingtoGlobalReportingInitiative(GRI)• Global Forest and Trade Network, UK• CDP Climate change• CDP Forestry
Our Code of ConductNobia’s Code of Conduct is based on the UN Universal Declaration of HumanRights,theILODeclarationonFundamentalPrinciplesandRightsatWorkandtheOECDGuidelinesforMultinationalEnterprises.TheCode of Conduct sets fundamental guidelines for our sustainability activ-ities.Our Supplier Code of Conduct regulates and governs Nobia’s require-ments for suppliers about working conditions, human rights, business eth-ics,environmentalperformance,andsoon.Oursuppliersinturnarerequired to pass on these expectations to their suppliers to ensure com-pliancethroughouttheentiresupplierchain.CompliancewiththeCodeofConductisarequirementinoursupplierassessmentprocess.
FROM FRAMEWORKS TO RESULTS The sustainability strategy supports our overall purpose and, based on its strategic focus areas and objective, outlines the direction for the Group-wideandlocalsustainabilityefforts.Ourpolicyframeworkfurtherdevel-ops our standpoint and describes how we are to act to live up to our val-ues in the areas of the environment, social issues and anti-corruption:
EnvironmentOur Group-wide environmental and climate policy means always complying with environmental legislation in the markets where we operate, and striving to integrate environmental and climate-change considerations through the valuechain.Theenvironmentalandclimatepolicygovernsourenvironmen-tal initiatives, and is supplemented with local environmental management systemsandenvironmentaltargets.Withourpolicyonsustainableforestryand our Supplier Code of Conduct, we are laying the platform for our wood suppliers to contribute to our targets for environmental consideration and sustainableforestry.Wemeasureandmonitortheenvironmentalandclimateimpact of our own operations and of our purchase transportation services, refertopages36,38andoursupplierauditsonpage37.
SocialOur framework for social issues and human rights encompasses Nobia’s Code of Conduct, our policy on modern slavery and our Supplier Code of Conduct and aims to create responsible and sound business operations for thelongterm.Ourcommitmentmeansthatwesupportandrespectinter-national conventions on human rights, work actively on employee well-being andpromotediversityandequality.Usingourtoolforsupplierevaluations,weevaluateandmonitorsuchissuesascompliancewithhumanrights.SpeakUp is our anonymous communication channel for reporting suspected viola-tionsofourCodeofConduct.Readmoreonpages37,39and40.
Anti-corruptionOur anti-corruption framework incorporates our Group-wide Code of Conduct, our Supplier Code of Conduct and our internal control guide-lines.Anti-corruptionisamainstayofourCodeofConduct.Nobiacon-ducts annual self-assessments, which are reviewed by external auditors, in all its business units based on a large number of issues related to internal control.Someoftheseissuesconcerntheriskofcorruptioninthesalesandsourcingorganisations.Theseself-assessmentsalsoincludereportingcrim-inalactivitiesincludingenvironmentalcrime.MonitoringalsotakesplaceviaSpeak Up, our anonymous communication channel for reporting suspected violationsofourCodeofConduct.Readmoreonpages37,40and93.
STRATEGIC MEMBERSHIPS AND PARTNER PROJECTS:
• SVN (Social Venture Network) Sweden • SwereaIVFcircularpilotproject• TMF(SwedishFederationofWoodandFurnitureIndustry)Technical
Committee• TMF(SwedishFederationofWoodandFurnitureIndustry)Sustainabil-
ity Group • BSI(BritishStandardsInstitute)• Besmå,InnovationclustertogetherwiththeSwedishEnergyAgencyandTMF• VästaGötalandNetwork,qualityandenvironmentskillsexchange• SIS(SwedishStandardInstitute)FurnitureStandardisationCommittee
CERTIFICATIONS Ourproductionfacilitiesholdmanagementsystemcertificationinquality,environment,energyandoccupationalhealthandsafety.Amongourmar-ketcompanies,NobiaSvenskaKökhasISOqualityandenvironmentalcer-tification.
Country Unit Standard
Denmark Bjerringbro ISO9001,ISO14001,OHSAS18001Farsø ISO14001Ølgod ISO9001,ISO14001,OHSAS18001
Finland Nastola ISO14001,OHSAS18001Netherlands Dinxperlo - Norway Eggedal -UK Darlington ISO9001,ISO14001,ISO50001,
OHSAS 18001Dewsbury ISO9001,ISO14001,OHSAS18001Grays - Halifax ISO9001,ISO14001,ISO50001,
OHSAS 18001Morley ISO9001,ISO14001,ISO50001,
OHSAS 18001Sweden Tidaholm ISO9001,ISO14001Austria Freistadt ISO9001,ISO14001
Wels ISO9001,ISO14001
NOB I A ANNUA L AND S U S TA I NA B I L I T Y R E PORT 2 018 10 5
S U S TA I NA B I L I T Y
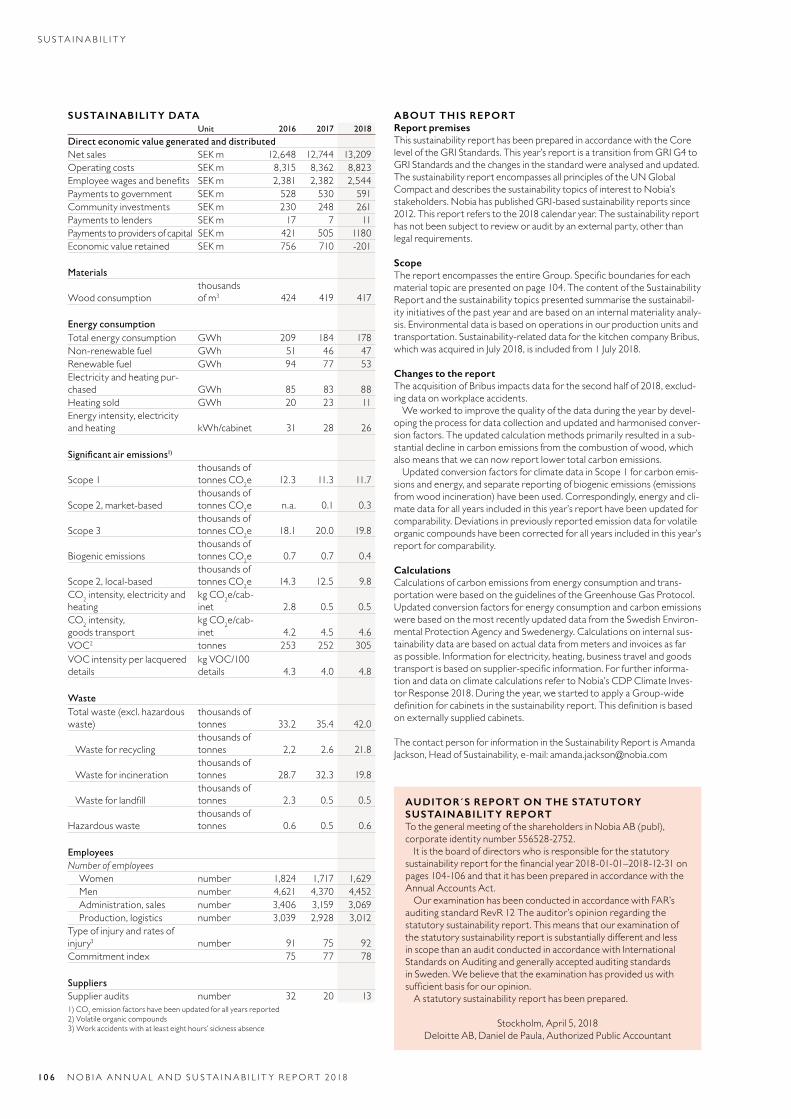
SUSTAINABILITY DATAUnit 2016 2017 2018
Direct economic value generated and distributedNet sales SEK m 12,648 12,744 13,209Operating costs SEK m 8,315 8,362 8,823Employeewagesandbenefits SEK m 2,381 2,382 2,544Payments to government SEK m 528 530 591Community investments SEK m 230 248 261Payments to lenders SEK m 17 7 11Payments to providers of capital SEK m 421 505 1180Economic value retained SEK m 756 710 -201
Materials
Woodconsumptionthousands of m3 424 419 417
Energy consumptionTotal energy consumption GWh 209 184 178Non-renewable fuel GWh 51 46 47Renewable fuel GWh 94 77 53Electricity and heating pur-chased GWh 85 83 88Heating sold GWh 20 23 11Energy intensity, electricity and heating kWh/cabinet 31 28 26
Significant air emissions1)
Scope 1 thousands of tonnes CO2e 12.3 11.3 11.7
Scope 2, market-basedthousands of tonnes CO2e n.a. 0.1 0.3
Scope 3thousands of tonnes CO2e 18.1 20.0 19.8
Biogenic emissionsthousands of tonnes CO2e 0.7 0.7 0.4
Scope 2, local-basedthousands of tonnes CO2e 14.3 12.5 9.8
CO2 intensity, electricity and heating
kg CO2e/cab-inet 2.8 0.5 0.5
CO2 intensity, goods transport
kg CO2e/cab-inet 4.2 4.5 4.6
VOC2 tonnes 253 252 305VOC intensity per lacquered details
kg VOC/100 details 4.3 4.0 4.8
WasteTotalwaste(excl.hazardouswaste)
thousands of tonnes 33.2 35.4 42.0
Wasteforrecyclingthousands of tonnes 2,2 2.6 21.8
Wasteforincinerationthousands of tonnes 28.7 32.3 19.8
Wasteforlandfillthousands of tonnes 2.3 0.5 0.5
Hazardouswastethousands of tonnes 0.6 0.5 0.6
EmployeesNumber of employeesWomen number 1,824 1,717 1,629Men number 4,621 4,370 4,452Administration, sales number 3,406 3,159 3,069Production, logistics number 3,039 2,928 3,012
Type of injury and rates of injury3 number 91 75 92Commitment index 75 77 78
SuppliersSupplier audits number 32 20 131) CO2 emission factors have been updated for all years reported2) Volatile organic compounds3)Workaccidentswithatleasteighthours’sicknessabsence
ABOUT THIS REPORT Report premisesThis sustainability report has been prepared in accordance with the Core leveloftheGRIStandards.Thisyear’sreportisatransitionfromGRIG4toGRIStandardsandthechangesinthestandardwereanalysedandupdated.The sustainability report encompasses all principles of the UN Global Compact and describes the sustainability topics of interest to Nobia’s stakeholders.NobiahaspublishedGRI-basedsustainabilityreportssince2012.Thisreportreferstothe2018calendaryear.Thesustainabilityreporthas not been subject to review or audit by an external party, other than legalrequirements.
Scope ThereportencompassestheentireGroup.Specificboundariesforeachmaterialtopicarepresentedonpage104.ThecontentoftheSustainabilityReport and the sustainability topics presented summarise the sustainabil-ity initiatives of the past year and are based on an internal materiality analy-sis.Environmentaldataisbasedonoperationsinourproductionunitsandtransportation.Sustainability-relateddataforthekitchencompanyBribus,whichwasacquiredinJuly2018,isincludedfrom1July2018.
Changes to the reportThe acquisition of Bribus impacts data for the second half of 2018, exclud-ingdataonworkplaceaccidents.Weworkedtoimprovethequalityofthedataduringtheyearbydevel-
oping the process for data collection and updated and harmonised conver-sionfactors.Theupdatedcalculationmethodsprimarilyresultedinasub-stantial decline in carbon emissions from the combustion of wood, which alsomeansthatwecannowreportlowertotalcarbonemissions.
Updated conversion factors for climate data in Scope 1 for carbon emis-sions and energy, and separate reporting of biogenic emissions (emissions fromwoodincineration)havebeenused.Correspondingly,energyandcli-mate data for all years included in this year’s report have been updated for comparability.Deviationsinpreviouslyreportedemissiondataforvolatileorganic compounds have been corrected for all years included in this year’s reportforcomparability.
CalculationsCalculations of carbon emissions from energy consumption and trans-portationwerebasedontheguidelinesoftheGreenhouseGasProtocol.Updated conversion factors for energy consumption and carbon emissions were based on the most recently updated data from the Swedish Environ-mentalProtectionAgencyandSwedenergy.Calculationsoninternalsus-tainability data are based on actual data from meters and invoices as far aspossible.Informationforelectricity,heating,businesstravelandgoodstransportisbasedonsupplier-specificinformation.Forfurtherinforma-tionanddataonclimatecalculationsrefertoNobia’sCDPClimateInves-torResponse2018.Duringtheyear,westartedtoapplyaGroup-widedefinitionforcabinetsinthesustainabilityreport.Thisdefinitionisbasedonexternallysuppliedcabinets.
The contact person for information in the Sustainability Report is Amanda Jackson,HeadofSustainability,e-mail:[email protected]
AUDITOR´S REPORT ON THE STATUTORY SUSTAINABILITY REPORT To the general meeting of the shareholders in Nobia AB (publ), corporateidentitynumber556528-2752.Itistheboardofdirectorswhoisresponsibleforthestatutory
sustainabilityreportforthefinancialyear2018-01-01–2018-12-31onpages 104-106 and that it has been prepared in accordance with the AnnualAccountsAct.
Our examination has been conducted in accordance with FAR’s auditing standard RevR 12 The auditor’s opinion regarding the statutorysustainabilityreport.Thismeansthatourexaminationofthe statutory sustainability report is substantially different and less inscopethananauditconductedinaccordancewithInternationalStandards on Auditing and generally accepted auditing standards inSweden.Webelievethattheexaminationhasprovideduswithsufficientbasisforouropinion.Astatutorysustainabilityreporthasbeenprepared.
Stockholm, April 5, 2018 DeloitteAB,DanieldePaula,AuthorizedPublicAccountant
10 6 NOB I A ANNUA L AND S U S TA I NA B I L I T Y R E PORT 2 018
SU S TA I NA B I L I T Y
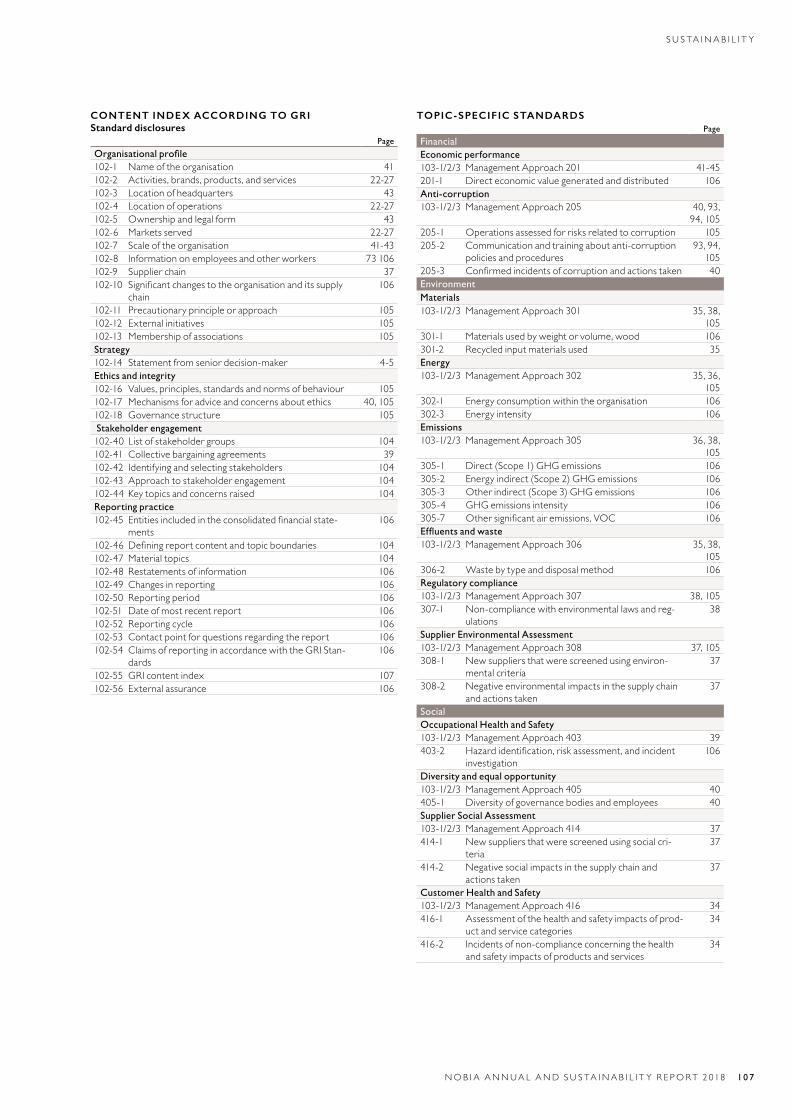
CONTENT INDEX ACCORDING TO GRIStandard disclosures
Page
Organisational profile102-1 Name of the organisation 41102-2 Activities, brands, products, and services 22-27102-3 Locationofheadquarters 43102-4 Locationofoperations 22-27102-5 Ownership and legal form 43102-6 Markets served 22-27102-7 Scale of the organisation 41-43102-8 Informationonemployeesandotherworkers 73 106102-9 Supplier chain 37102-10 Significantchangestotheorganisationanditssupply
chain 106
102-11 Precautionary principle or approach 105102-12 External initiatives 105102-13 Membership of associations 105Strategy102-14 Statement from senior decision-maker 4-5Ethics and integrity102-16 Values, principles, standards and norms of behaviour 105102-17 Mechanisms for advice and concerns about ethics 40, 105102-18 Governance structure 105 Stakeholder engagement102-40 Listofstakeholdergroups 104102-41 Collective bargaining agreements 39102-42 Identifyingandselectingstakeholders 104102-43 Approach to stakeholder engagement 104102-44 Key topics and concerns raised 104Reporting practice102-45 Entitiesincludedintheconsolidatedfinancialstate-
ments106
102-46 Definingreportcontentandtopicboundaries 104102-47 Material topics 104102-48 Restatements of information 106102-49 Changes in reporting 106102-50 Reporting period 106102-51 Date of most recent report 106102-52 Reporting cycle 106102-53 Contact point for questions regarding the report 106102-54 ClaimsofreportinginaccordancewiththeGRIStan-
dards106
102-55 GRIcontentindex 107102-56 External assurance 106
TOPIC-SPECIFIC STANDARDSPage
FinancialEconomic performance103-1/2/3 Management Approach 201 41-45201-1 Direct economic value generated and distributed 106Anti-corruption103-1/2/3 Management Approach 205 40, 93,
94, 105205-1 Operations assessed for risks related to corruption 105205-2 Communication and training about anti-corruption
policies and procedures 93, 94,
105205-3 Confirmedincidentsofcorruptionandactionstaken 40EnvironmentMaterials 103-1/2/3 Management Approach 301 35, 38,
105301-1 Materials used by weight or volume, wood 106301-2 Recycled input materials used 35Energy103-1/2/3 Management Approach 302 35, 36,
105302-1 Energy consumption within the organisation 106302-3 Energy intensity 106Emissions103-1/2/3 Management Approach 305 36, 38,
105305-1 Direct (Scope 1) GHG emissions 106305-2 Energy indirect (Scope 2) GHG emissions 106305-3 Other indirect (Scope 3) GHG emissions 106305-4 GHG emissions intensity 106305-7 Othersignificantairemissions,VOC 106Effluents and waste103-1/2/3 Management Approach 306 35, 38,
105306-2 Wastebytypeanddisposalmethod 106Regulatory compliance103-1/2/3 Management Approach 307 38, 105307-1 Non-compliance with environmental laws and reg-
ulations38
Supplier Environmental Assessment103-1/2/3 Management Approach 308 37, 105308-1 New suppliers that were screened using environ-
mental criteria37
308-2 Negative environmental impacts in the supply chain and actions taken
37
SocialOccupational Health and Safety103-1/2/3 Management Approach 403 39403-2 Hazardidentification,riskassessment,andincident
investigation 106
Diversity and equal opportunity103-1/2/3 Management Approach 405 40405-1 Diversity of governance bodies and employees 40Supplier Social Assessment103-1/2/3 Management Approach 414 37414-1 New suppliers that were screened using social cri-
teria 37
414-2 Negative social impacts in the supply chain and actions taken
37
Customer Health and Safety103-1/2/3 Management Approach 416 34416-1 Assessment of the health and safety impacts of prod-
uct and service categories 34
416-2 Incidentsofnon-complianceconcerningthehealthand safety impacts of products and services
34
NOB I A ANNUA L AND S U S TA I NA B I L I T Y R E PORT 2 018 10 7
S U S TA I NA B I L I T Y
2019 ANNUAL GENERAL MEETING
The shareholders of Nobia AB (publ) are invited to the Annual General MeetingonThursday,2May2019at5:00p.m.atKlaraStrandKonferens,Klarabergsviadukten90,Stockholm,Sweden.
RIGHT TO PARTICIPATE AT THE ANNUAL GENERAL MEETINGShareholders who wish to participate in the Annual General Meeting must: • firstlybeincludedintheshareholders’registermaintainedbyEuroclear
Sweden AB as of Thursday, 25 April, and • secondly notify Nobia of their participation in the Annual General Meet-ingnotlaterthanThursday,25April.
NOTIFICATION OF ATTENDANCENotificationofattendanceattheAnnualGeneralMeetingmaybemade:• bye-mail:[email protected]• by telephone: +46 8 440 16 00• by fax: +46 8 503 826 49• by post: Nobia AB, Box 70376, SE-107 24 Stockholm, Sweden
Thisnotificationshallstate:• the shareholder’s name• personal identity number/Corporate Registration Number• address and daytime telephone number• shareholding• Informationaboutanyassistants(notmorethantwoassistants)and
proxies who may accompany the shareholder to the Meeting
Whenapplicable,completeauthorisationdocuments,suchasregistrationcertificatesortheequivalent,shallbeappended.
PROXYShareholders represented by proxy shall issue a dated power of attorney fortheproxy.Ifthepowerofattorneyisissuedonbehalfofalegalentity,acertifiedcopyofaregistrationcertificateorcorrespondingdocument(“certificate”)forthelegalentityshallbeappendedtothenotificationofattendance.Thepowerofattorneyandcertificatemaynotbemorethan
oneyearold.However,thevalidityofthepowerofattorneymaybeamaximumoffiveyearsfromthedateofissue,ifspecificallystated.Thepowerofattorneyinoriginaland,whereapplicable,thecertificate,
should be sent by post to the company at the address stated above in good timepriortotheAnnualGeneralMeeting.ProxyformsareavailablefromNobia’s website and will also be sent to shareholders who so request and informthecompanyoftheirpostaladdress.
NOMINEE SHARESShareholders whose shares have been registered through the bank or securities broker administering the shares, must temporarily re-register their shares in their own names in order to be entitled to participate in the AnnualGeneralMeeting.Suchre-registrationmustbecompletedwithEuroclearSwedenABnotlaterthanThursday,25April2019.Arequestforre-registrationmustbemadewellinadvanceofthisdate.
DIVIDENDTheBoardofDirectorsproposesthatadividendofSEK4.00persharebepaidforthe2018financialyear.TherecorddatefortherighttoreceiveadividendisMonday6May2019.ThefinaldayfortradinginNobiasharesincludingtherighttoadividendisThursday2May2019.
ANNUAL REPORTThe Nobia Annual Report is published in Swedish and English, and both versionsareavailablefordownloadfromthecompany’swebsite.TheSwedish version of the Annual Report is printed and sent by mail to share-holdersandotherindividualswhohaverequestedsuchaversion.
FINANCIAL INFORMATIONNobia’s objective is to facilitate the valuation of the company by the stock marketthroughclearinformation.Theprovisionofinformationisbasedmainlyonquarterlyfinancialreporting,pressreleases,informationonthewebsite, company presentations and meetings with shareholders, analysts andinvestors.
FINANCIAL CALENDAR 20192May InterimreportJan-Mar2019 2 May Annual General Meeting19July InterimreportJan-Jun201923October InterimreportJan-Sep2019
10 8 NOB I A ANNUA L AND S U S TA I NA B I L I T Y R E PORT 2 018
2 019 ANNUA L G EN E R A L M E E T I NG

Nobia’s Annual Report and Sustainability Report 2018isproducedincooperationwithSpringtime-Intellecta.
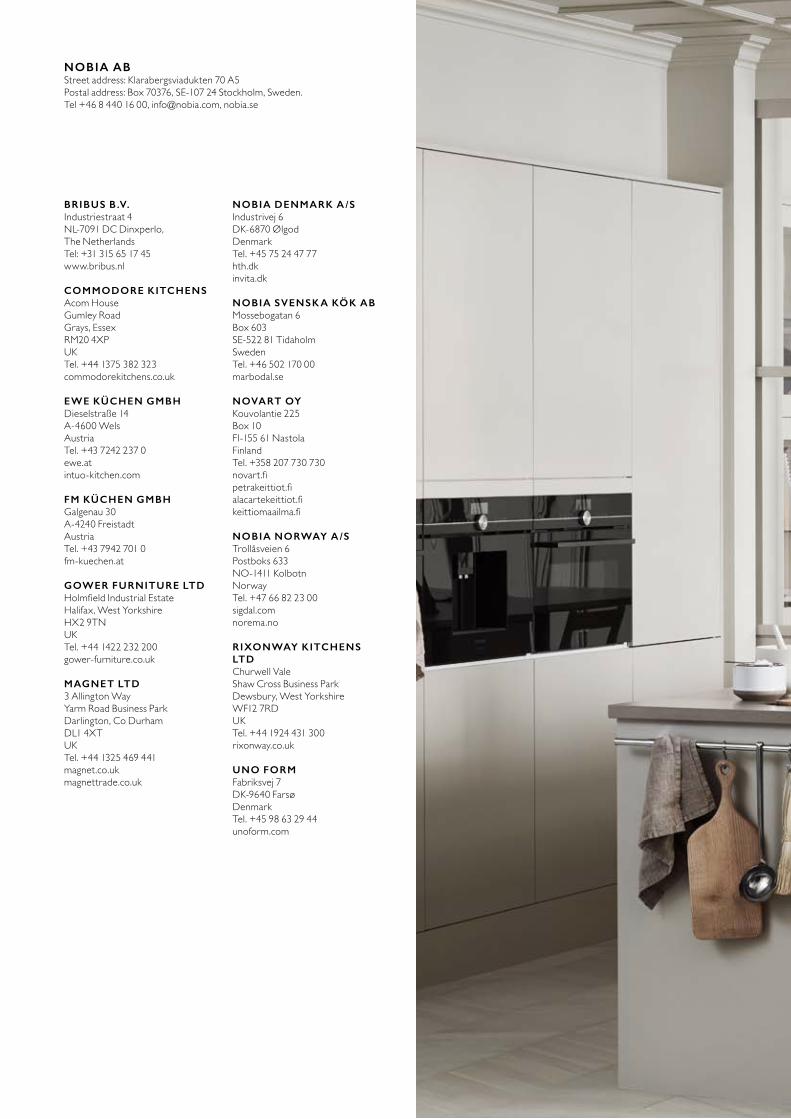
NOBIA AB Street address: Klarabergsviadukten 70 A5Postaladdress:Box70376,SE-10724Stockholm,Sweden.Tel+4684401600,[email protected],nobia.se
BRIBUS B .V.Industriestraat4NL-7091DCDinxperlo, The NetherlandsTel: +31 315 65 17 45www.bribus.nl
COMMODORE KITCHENSAcom HouseGumley RoadGrays, EssexRM20 4XP UKTel.+441375382323commodorekitchens.co.uk
EWE KÜCHEN GMBHDieselstraße 14A-4600WelsAustriaTel.+4372422370ewe.atintuo-kitchen.com
FM KÜCHEN GMBHGalgenau 30A-4240 FreistadtAustriaTel.+4379427010fm-kuechen.at
GOWER FURNITURE LTDHolmfieldIndustrialEstateHalifax,WestYorkshireHX2 9TNUKTel.+441422232200gower-furniture.co.uk
MAGNET LTD 3AllingtonWayYarmRoadBusinessParkDarlington, Co DurhamDL14XTUKTel.+441325469441magnet.co.ukmagnettrade.co.uk
NOBIA DENMARK A /SIndustrivej6DK-6870 ØlgodDenmarkTel.+4575244777hth.dkinvita.dk
NOBIA SVENSK A KÖK AB Mossebogatan 6Box 603SE-522 81 TidaholmSwedenTel.+4650217000marbodal.se
NOVART OYKouvolantie 225Box 10FI-15561NastolaFinlandTel.+358207730730novart.fipetrakeittiot.fialacartekeittiot.fikeittiomaailma.fi
NOBIA NORWAY A /STrollåsveien 6Postboks 633NO-1411 KolbotnNorwayTel.+4766822300sigdal.comnorema.no
RIXONWAY KITCHENS LTDChurwell Vale Shaw Cross Business ParkDewsbury,WestYorkshireWF127RDUKTel.+441924431300rixonway.co.uk
UNO FORMFabriksvej 7DK-9640 FarsøDenmarkTel.+4598632944unoform.com