Embed Size (px)
Citation preview

Miami-Dade Transit
September 2010
FY 2011 TO FY 2020
Transit Development Plan
ANNUAL AdmiNiSTrATive UpdATe


TRANSIT DEVELOPMENT PLAN
ANNUAL UPDATE
September 2010


Annual UpdateTable of Contents
T R A N S I T D E V E L O P M E N T P L A N F Y 2 0 1 1 - 2 0 2 0i
Table of Contents
1.0 INTRODUCTION .................................................................................................................... 1-11.1 Purpose ........................................................................................................... 1-1
1.2 TDP Adoption Process ..................................................................................... 1-1
2.0 MIAMI-DADE TRANSIT SYSTEM OVERVIEW .................................................................... 2-12.1 Metrobus .......................................................................................................... 2-4
2.2 Metrorail ........................................................................................................... 2-4
2.3 Metromover ...................................................................................................... 2-4
2.4 Special Transportation Services ....................................................................... 2-4
2.5 Miami-Dade Transit Passenger Fare Structure ................................................ 2-7
3.0 PUBLIC INVOLVEMENT ....................................................................................................... 3-13.1 Public Involvement Objectives ......................................................................... 3-1
3.2 Stakeholder Coordination ................................................................................. 3-1
3.3 Community Involvement................................................................................... 3-23.3.1 South Florida Workforce Coordination ...................................................3-23.3.2 3-1-1 Information System ......................................................................3-33.3.3 Miami-Dade Transit Website .................................................................3-33.3.4 Second Annual Transit Summit .............................................................3-3
4.0 PAST YEAR’S ACCOMPLISHMENTS (FY 2009) ................................................................ 4-14.1 Service Operations .......................................................................................... 4-1
4.1.1 New Bus Service Routes .......................................................................4-14.1.2 Metrobus On-Time Performance ...........................................................4-14.1.3 Bus Service Restructuring .....................................................................4-14.1.4 Miami-Dade Transit Service Standards .................................................4-2
4.2 Capital Improvements ...................................................................................... 4-24.2.1 Miami Intermodal Center-Earlington Heights Connector ........................4-24.2.2 Procurement of New Metrobus Vehicles ................................................4-24.2.3 Metrorail New Vehicle Replacement ......................................................4-24.2.4 Metromover Replacement Cars .............................................................4-34.2.5 Lehman Yard Rehabilitation – Expansion Phase 1 ................................4-34.2.6 Lehman Center Test Track ....................................................................4-34.2.7 Dadeland South Metrorail Station Comfort Station ................................4-34.2.8 Northeast Passenger Activity Center .....................................................4-34.2.10 Park and Ride Lots ................................................................................4-44.2.11 Infrastructure Renewal Projects (IRP) ...................................................4-5

T R A N S I T D E V E L O P M E N T P L A N F Y 2 0 1 1 - 2 0 2 0ii
Annual UpdateTable of Contents
4.3 Customer Information/Convenience ................................................................. 4-74.3.1 EASY Card Implementation ...................................................................4-74.3.2 Wireless Service on Rail and Bus Vehicles ...........................................4-74.3.3 New Electronic Transit Rider Alert System ............................................4-84.3.4 CAD/AVL System Replacement ............................................................4-8
4.4 Monitoring Program to Track Annual Performance of MDT Services ................ 4-84.4.1 Goal 1: Improve the Quality of Transit Services .....................................4-94.4.2 Goal 2: Improve Customer Convenience, Comfort and Safety on
Transit Service and within Facilities .....................................................4-134.4.3 Goal 3: Increase the Security of Transit Vehicles and Facilities ..........4-144.4.4 Goal 4: Support Economic Vitality ......................................................4-144.4.5 Goal 5: Preserve the Environment and Promote Energy
Conservation .......................................................................................4-184.4.6 Goal 6: Enhance the Integration and Connectivity of the
Transportation System, Across and Between Modes and TransitProviders, for People and Freight ........................................................4-19
4.4.7 Goal 7: Optimize Sound Investment Strategies for SystemImprovement and Management/Operation ..........................................4-19
4.4.8 Goal 8: Maximize and Preserve the Existing Transportation System ..4-20
5.0 OPERATING SERVICE IMPROVEMENTS AND ADJUSTMENTS .................................... 5-1
6.0 FY 2010 COMMITTED TRANSIT IMPROVEMENTS ........................................................... 6-16.1 Capital Improvement Plan – Committed Transit Improvement Initiatives .......... 6-1
6.1.1 Orange Line Phase 1 MIC-Earlington Heights Connector ......................6-16.1.2 Orange Line Phase 2 and Phase 3 (North Corridor and East-West
Corridor) ................................................................................................6-1
6.2 Bus Service Improvements and Adjustments – Committed (2010) ................... 6-4
6.3 Infrastructure Renewal Program – Committed Projects .................................... 6-8
7.0 TEN YEAR IMPLEMENTATION PROGRAM ....................................................................... 7-17.1 Capital Improvement Plan ................................................................................ 7-1
7.2 2020 Recommended Service Plan ................................................................... 7-17.2.1 Recommended Service Plan – Existing Metrobus Routes .....................7-17.2.2 Recommended Service Plan – New Metrobus Routes ........................7-157.2.3 Recommended Service Plan – Metrorail..............................................7-197.2.4 Recommended Service Plan – Special Transportation Services..........7-20
7.3 Capital Needs ................................................................................................ 7-207.3.1 Transit Terminals .................................................................................7-207.3.2 Bus Fleet Expansion............................................................................7-227.3.3 Priority Transit Corridor Needs ............................................................7-22

Annual UpdateTable of Contents
T R A N S I T D E V E L O P M E N T P L A N F Y 2 0 1 1 - 2 0 2 0iii
7.4 Infrastructure Renewal Program Needs ......................................................... 7-23
8.0 FINANCIAL PLAN ................................................................................................................. 8-18.1 Introduction ...................................................................................................... 8-1
8.2 Operating Expenses ........................................................................................ 8-1
8.3 Projected Operating Expenses......................................................................... 8-2
8.4 Operating Revenues ........................................................................................ 8-3
8.5 Projected Operating Revenues ........................................................................ 8-3
8.6 Summary of Operating Budget ......................................................................... 8-4
8.7 Capital Expenditures and Funding Sources ..................................................... 8-68.7.1 Planned Capital Expenditures ...............................................................8-6
8.8 Capital Funding Sources .................................................................................. 8-7
8.9 Summary of Capital Plan ................................................................................. 8-7
8.10 Unfunded Needs for New Service Initiatives .................................................. 8-10
8.11 Bus Route Improvements ............................................................................... 8-10
8.12 Priority Corridors ............................................................................................ 8-10
8.13 Capital Improvement Program Projects .......................................................... 8-11
8.14 Total Unfunded Needs ................................................................................... 8-12
APPENDIX
A.1 METROBUS SERVICE CHARACTERISTICS (DECEMBER 2009)
A.2 PUBLIC INVOLVEMENT ACTIVITIES

T R A N S I T D E V E L O P M E N T P L A N F Y 2 0 1 1 - 2 0 2 0iv
Annual UpdateTable of Contents
List of TablesTable 2-1: MDT Service Characteristics by Transit Mode, 2009 ............................................. 2-1Table 2-2: MDT Fare Structure Summary, December 2009 ................................................... 2-8Table 3-1: TDP Review Committee Meeting Schedule (2010) ................................................ 3-2Table 4-1: MDT Annual On-Time Performance ...................................................................... 4-9Table 4-2: Number of Transit Route Miles by Transit Mode .................................................. 4-10Table 4-3: MDT Systemwide Boardings ............................................................................... 4-12Table 4-4: Transit Revenue Miles in Corridors of Regional Significance............................... 4-12Table 4-5: Number of Station Stops Per Route Mile ............................................................. 4-13Table 4-6: Transit Route Miles within ¼ mile of Urban Centers ............................................ 4-14Table 4-7: Transit Route Miles within ¼ Mile of Tourist Attractions ....................................... 4-15Table 4-8: MDT Major Trip Generators, December 2009 ..................................................... 4-16Table 4-9: Transit Service Route Miles within ¼ mile of MIA and Port of Miami ................... 4-18Table 4-10: Transit Service Route Miles within ¼ mile of Redevelopment Areas ................. 4-18Table 4-11: Transit Route Miles Within ¼ mile of the Route Alignment ................................ 4-19Table 4-12: Percent of Adherence to Preventative Maintenance Program by Mode ............. 4-21Table 4-13: Mean Distance between Failures by Mode ........................................................ 4-21Table 5-1: 2009 TDP Consistency Analysis Summary ........................................................... 5-1Table 6-1: MDT FY 2009 – 2010 Proposed Capital Budget ($000’s) ...................................... 6-2Table 6-2: 2010 Committed Bus Service Improvement Adjustments ...................................... 6-4Table 6-3: FY 2010 – 2011 Prioritized New IRP Projects for Budget Approval ....................... 6-9Table 7-1: MDT FY 2010 – 2011 Proposed Capital Budget and Multi-Year Capital Plan ($000’s)
........................................................................................................................ 7-2Table 7-2: Recommended Service Plan Summary for Existing Transit Bus Routes (2020) .... 7-5Table 7-3: Transit Hub Locations and Feeder Routes for Existing Bus Routes ..................... 7-11Table 7-4: Recommended Service Plan Summary New Routes Description ........................ 7-16Table 7-5: Transit Hub Locations and Feeder Routes for New Routes ................................. 7-18Table 7-6: 2020 Recommended Service Plan Transit Hub Needs ........................................ 7-21Table 7-7: Proposed Park and Ride Locations ...................................................................... 7-22Table 7-8: Priority Transit Corridors ..................................................................................... 7-23Table 7-9: Proposed Infrastructure Renewal Program Need (2020) ..................................... 7-24Table 8-1: MDT Projected FY 2011 Direct Operating Expenses .............................................. 8-1Table 8-2: MDT Projected FY 2011 Other Operating Expenses ............................................. 8-2Table 8-3: MDT Operating Expense Inflation Assumptions .................................................... 8-2Table 8-4: MDT Projected FY 2011 Operating Revenues ....................................................... 8-3Table 8-5: MDT Operating Revenue Growth Assumptions ...................................................... 8-4Table 8-6: MDT Operating Budget (FY 2011 - FY 2020) ........................................................ 8-5Table 8-7: Planned MDT Capital Expenditures FY 2011-2020 ................................................ 8-6Table 8-8: Projected “Cash” Revenue Sources for Capital Projects, FY 2011-2020 ............... 8-7Table 8-9: MDT Capital Budget (FY 2011 - FY 2020) ............................................................. 8-8Table 8-10: Proposed Bus Route Improvements (Unfunded) ................................................ 8-10

Annual UpdateTable of Contents
T R A N S I T D E V E L O P M E N T P L A N F Y 2 0 1 1 - 2 0 2 0v
Table 8-11: Priority Transit Corridors (Unfunded) .................................................................. 8-11Table 8-12: Additional Capital Improvement Program (CIP) Projects (Unfunded) .................. 8-12Table 8-13: Total Unfunded Needs, FY2011-2020 (YOE millions)......................................... 8-12

T R A N S I T D E V E L O P M E N T P L A N F Y 2 0 1 1 - 2 0 2 0vi
Annual UpdateTable of Contents
List of FiguresFigure 2-1: MDT Table of Organization .................................................................................. 2-2Figure 2-2: MDT Service Area Coverage Map........................................................................ 2-3Figure 2-3: MDT Metrobus Route Map ................................................................................... 2-5Figure 2-4: MDT Metrorail System 2010 ................................................................................. 2-6Figure 2-5: MDT Metromover System 2010 ........................................................................... 2-7Figure 4-1: Service Coverage in Transit Supportive Areas ................................................... 4-11Figure 7-1: Transit Hub Locations ........................................................................................ 7-14Figure 7-2: Recommended Service Plan New Transit Routes .............................................. 7-17Figure 7-3: Earlington Heights – MIC Connector .................................................................. 7-19

Annual Update1.0 - Introduction
T R A N S I T D E V E L O P M E N T P L A N F Y 2 0 1 1 - 2 0 2 01-1
1.0 Introduction
The State of Florida Public Transit Block Grant Program was enacted by the Florida Legislatureto provide a stable source of state funding for public transportation. The Block Grant Programrequires public transit service providers to develop and adopt a Transit Development Plan(TDP). A TDP major update is required every five years and annual TDP updates are requiredin interim years. TDP updates must be submitted to the Florida Department of Transportation(FDOT) by September 1st of each year.
This fiscal year (FY) 2011 – 2020 TDP Annual Update is being prepared to report the level ofprogress on the FY 2010 – 2019 TDP Major Update. The TDP Major Update was completed byMiami-Dade Transit (MDT) in December 2009. Furthermore, any revisions that have beenmade to the ten year implementation plan of the FY 2010 – 2019 TDP Major Update areprovided to include a new tenth year or FY 2020.
The TDP Annual Update presents the operational and capital improvement needs of MDT andalso serves as a planning tool to project future MDT needs for the implementation and operationof transit service. This TDP Annual Update meets the requirements and is in accordance withRule Chapter 14-73, Florida Administrative Code (FAC).
1.1 PurposeFDOT has established guidelines stating that a TDP annual update contain the followinginformation and content:
Past year’s accomplishments compared to the original implementation program;
Analysis of any discrepancies between the plan and its implementation for the past year andsteps that will be taken to attain original goals and objectives;
Any revisions to the implementation program for the coming year (FY 2010);
Revised implementation program for the 2009 TDP;
Added recommendations for the new tenth year (FY 2020) of the updated plan;
A revised financial plan; and,
A revised list of projects or services needed to meet the goals and objectives, includingprojects for which funding may not have been identified.
1.2 TDP Adoption ProcessFollowing the completion of the TDP Annual Update, per rule requirement, the TDP mustofficially be adopted by the agency’s governing body. Customarily, County and localcommissioners adopt the TDPs of the transit agencies operating as a part of those generalpurpose governments.
The TDP Annual Update will be presented to the Board of County Commissioners for formaladoption in 2010.


Annual Update2.0 - Miami-Dade Transit System Overview
T R A N S I T D E V E L O P M E N T P L A N F Y 2 0 1 1 - 2 0 2 02-1
2.0 Miami-Dade Transit System Overview
Miami-Dade Transit operates the 14th largest transit system in the United States and is thelargest transit system in the State of Florida. MDT is one of the largest departments in Miami-Dade County government. MDT operates four (4) transit modes of service: bus (Metrobus),heavy rail (Metrorail), automated guideway (Metromover), and demand-response service(Special Transportation Services or STS).
Together these modes comprise an integrated multi-modal transit system for Miami-DadeCounty and record more than 326,000 daily (weekday) boardings on the MDT system while STSdaily average is approximately 5,300. Table 2-1 presents MDT service characteristics by transitmode. The MDT Table of Organization is found in Figure 2-1 and Figure 2-2 presents thecurrent MDT service area coverage map.
Table 2-1: MDT Service Characteristics by Transit Mode, 2009System
Characteristics Metrobus Metrorail Metromover STS
Operating Hours 24 hours1 5:00am - 12:00am 5:00am - 12:20am 24 hoursNumber of Routes 932 1 3 Demand ResponseNo. of Stations/Stops 8,943 22 20 N/APeak Headways 7½ - 60 minutes 7½ minutes 1½ - 3 minutes (Pick up +/-30
minutes ofscheduled time)
Midday Headways 12 - 60 minutes 15 minutes 1½ - 3 minutesWeekend Headways 12 - 60 minutes 30 minutes 1½ - 3 minutes
Routes Miles 2,615 round tripmiles 22.4 miles 4.4 miles N/A
Peak VehicleRequirements 680 84 21 276
Total Fleet Size(Section 15 Report)
816(741 full-size/ 75
minibus)136 29
355 (176 sedans,70 vans, 109 liftequipped vans)
Annual Revenue Miles 29,189,472 6,743,641 1,126,255 13,084,419Annual Boardings 75,608,000 18,244,476 8,100,144 1,491,924Park-Ride Spaces 2,671 9,658 0 N/AAnnual OperatingExpenses $334,727,320 $78,399,299 $23,265,217 $44,522,040
Annual OperatingRevenues $78,370,758 $15,646,396 $0 $6,958,585
Annual Revenues(Other)3 $8,052,752 $0 $0 N/A
Base Fare $2.00 $2.00 Free $3.00Source: National Transit Database, Miami-Dade Transit, April 2010
1 Seven Metrobus routes (L, S, 3, 11, 27, 38/Busway MAX, 77) operate 24 hours per day. Two other routes,246/Night Owl and 500/Midnight Owl, provide hourly bus service approximately between 12:00 am - 5:30 am.2 91 Metrobus operated routes plus two contracted routes.3 All transit revenues derived from advertising and concessions are reported here (including Metrorail/Metromover).

T R A N S I T D E V E L O P M E N T P L A N F Y 2 0 1 1 - 2 0 2 02-2
Annual Update2.0 - Miami-Dade Transit System Overview
Figure 2-1: MDT Table of Organization

Annual Update2.0 - Miami-Dade Transit System Overview
T R A N S I T D E V E L O P M E N T P L A N F Y 2 0 1 1 - 2 0 2 02-3
Figure 2-2: MDT Service Area Coverage Map

T R A N S I T D E V E L O P M E N T P L A N F Y 2 0 1 1 - 2 0 2 02-4
Annual Update2.0 - Miami-Dade Transit System Overview
2.1 MetrobusMetrobus is a fixed route bus service that MDT operates seven (7) days a week, twenty-fourhours per day. A total of ninety-one (91) routes comprise MDT’s regular bus service structureas served by a total fleet of 816 buses and two (2) contracted routes with seven (7) buses.Figure 2-3 illustrates the MDT Metrobus system route map as of December 2009.
2.2 MetrorailMetrorail provides service to 22 stations on a 22.4-mile heavy rail electrified line. The Metrorailsystem operates primarily on elevated structure and interfaces with two other passenger railsystems at the Tri-Rail (Commuter Rail), Brickell and Government Center Stations(Metromover). MDT maintains a total fleet of 136 Metrorail vehicles. Metrorail currentlyoperates weekday service between 5:00 a.m. and 12:00 a.m. (total trip time is 48 minutes fromterminus to terminus) with 7½-minute AM/PM peak headways, and 15 minutes during themidday and 30 minutes during evening hours. Weekend and holiday service operates withheadways of 30 minutes. Figure 2-4 illustrates the MDT Metrorail system route map as ofDecember 2009.
2.3 MetromoverThe MDT Automated People-Mover system (APM) or Metromover includes an elevated systemthat services 21 stations to include the downtown Miami core area (Downtown Loop), theAdrienne Arsht Center in the north (Omni Loop); and the Brickell area to the south (BrickellLoop). MDT maintains a fleet of 29 Metromover vehicles. Metromover operates free of chargeand stops at 21 wheelchair-accessible stations from the School Board area to Brickell, servingmajor destination throughout Downtown Miami. Metromover’s inner and outer loops operatefrom 5:00 a.m. to 12:20 a.m., seven days a week. During the AM/PM peak period, servicefrequency is every 90 seconds, and every 3 minutes during the off-peak hours, as well asweekends and holidays. Figure 2-5 illustrates the MDT Metromover system route map as ofDecember 2009.
2.4 Special Transportation ServicesMDT also operates a demand-response service known as Special Transportation Service(STS). STS is a shared-ride, door-to-door transportation service for qualified individuals withdisabilities who are unable to utilize the accessible fixed-route transit system. Service isprovided by sedans, vans and lift-equipped vehicles, seven days a week, 24 hours per day.
Presently, there are 355 vehicles (sedans, standard vans, minivans, and wheelchair lift-equipped vans) available for ambulatory transportation. Currently, these vehicles are privatelycontracted. There are more than 25,456 eligible clients enrolled in the STS program includingboth ambulatory and non-ambulatory clients.

Annual Update2.0 - Miami-Dade Transit System Overview
T R A N S I T D E V E L O P M E N T P L A N F Y 2 0 1 1 - 2 0 2 02-5
Figure 2-3: MDT Metrobus Route Map

T R A N S I T D E V E L O P M E N T P L A N F Y 2 0 1 1 - 2 0 2 02-6
Annual Update2.0 - Miami-Dade Transit System Overview
Figure 2-4: MDT Metrorail System 2010
Source: Miami-Dade Transit, 2010

Annual Update2.0 - Miami-Dade Transit System Overview
T R A N S I T D E V E L O P M E N T P L A N F Y 2 0 1 1 - 2 0 2 02-7
Figure 2-5: MDT Metromover System 2010
Source: Miami-Dade Transit, 2010
2.5 Miami-Dade Transit Passenger Fare StructureIn June 2009, MDT transitioned to a new passenger fare collection system which no longeraccepts tokens or currency as fare payment for Metrorail known as the EASY Card. The EASYCard is an automated fare collection system and the first of its kind in the State of Florida.Additionally, cash fare payments may also be made on Metrobus. MDT passengers are now

T R A N S I T D E V E L O P M E N T P L A N F Y 2 0 1 1 - 2 0 2 02-8
Annual Update2.0 - Miami-Dade Transit System Overview
required to load the contactless MDT EASY Card. These cards are purchased at a fee of $2and loaded with appropriate fare amounts for passage. Table 2-2 presents the current farestructure as of December 2009.
Table 2-2: MDT Fare Structure Summary, December 2009Regular Fare Reduced Fare1
Metrobus $2 $1Express Bus $2.35 $1.15Shuttle Bus2 25¢ 10¢Metrorail $2 $1Metrorail daily parking fee $4 No Discount AvailableMetrorail monthly parking permit $103 No Discount AvailableMetromover Free FreeSpecial Transportation Service (STS) $3 No Discount AvailableBus-to-Bus Transfer Free4 Free 4
Bus-to-Express Bus Transfer 35¢ upgrade 4 15¢ upgrade 4
Bus-to-Rail Transfer 50¢ 4 25¢ 4
Rail-to-Bus Transfer 50¢ 4 25¢ 4
Shuttle Bus-to-Bus Transfer $1.75 upgrade 4 90¢ upgrade 4
Shuttle Bus-to-Express Bus Transfer $2.10 upgrade 4 $1.05 upgrade 4
1-Month Pass $100 Not applicableDiscount 1-Month Pass $50 Not applicable1-Month Pass - Group Discount 4-99 passes $90 Not applicable1-Month Pass - Group Discount 100 or more passes $85 Not applicable7-Day Pass $26 $131-Day Pass $5 $2.50College/Adult Education Center Monthly Pass $50 Not applicableGolden Passport or Patriot Passport Free Free
Source: Miami-Dade Transit, 2010
1 Discount fare is available for Medicare recipients, most people with disabilities, and local students in grades 1-12 when using theEASY Card for discount-fare riders.2 7 Shuttles: 123/South Beach Local, 211/Overtown Circulator, 212/Sweetwater Circulator, 248/Brickell Key Shuttle, 249/CoconutGrove Circulator, 254/Brownsville Circulator/ 286 North Point Circulator3 Only available with the purchase of a monthly pass.4 Transfer fee is free within 3 hours of first boarding up to two busses travelling in the same direction.

Annual Update3.0 - Public Involvement
T R A N S I T D E V E L O P M E N T P L A N F Y 2 0 1 1 - 2 0 2 03-1
3.0 Public Involvement
Miami-Dade Transit fully encourages public involvement and participation in the development ofthe People’s Transportation Plan (PTP) and other transportation-related issues, conductinginteractive presentations with communities across the county. MDT’s mission includesdeveloping a proactive public involvement process that provides complete information, timelypublic notice, and full public access to key decisions.
The TDP Public Involvement Plan (PIP) outlines the various coordination efforts that MDTemploys to obtain both public and stakeholder input. This input facilitates public consensus anddirection for the TDP development. Throughout the development of the TDP Annual Update,efforts were made to include and actively engage Miami-Dade County citizens to identify themobility needs of residents and visitors. The TDP PIP includes several different elements,including formal meetings with technical advisory committees, and coordination with theworkforce board within Miami-Dade County. This chapter identifies and summarizes specificpublic involvement activities conducted for the TDP Major Update.
3.1 Public Involvement ObjectivesMiami-Dade Transit has developed a public involvement plan for the preparation of the TDP andis provided in the Appendix A-2 of this report. The TDP PIP objectives include the following:
Ensure early, frequent and continuous communication with the public and other stakeholders.
Provide meaningful opportunities for public input and systematic follow-through to addressissues and ideas identified by the public.
Promote MDT project benefits to the community.
Promote an on-going public partnership to ensure transportation benefits are consideredwithin the context of the communities directly impacted by MDT’s projects.
3.2 Stakeholder CoordinationMDT actively engages transportation related advisory committees throughout the developmentof the TDP. The intent of these committees is to provide comprehensive county and regionalperspectives on issues directly related to the nature of the review committee. These reviewcommittees share input, recommendations, and technical guidance on transportation relatedissues within the TDP. The review committees are comprised of government appointees,elected officials, as well as, citizens throughout the County.
MDT will attend the following regularly scheduled committee meetings as informational agendaor action items to present the TDP Annual Update, seek stakeholder input and addressquestions and comments related to its development:
Citizens Transportation Advisory Committee (CTAC)
Transportation Planning Technical Advisory Committee (TPTAC)
Transportation, Infrastructure, and Roads Committee (TIRC)
Miami-Dade County Board of County Commissioners (BCC)

T R A N S I T D E V E L O P M E N T P L A N F Y 2 0 1 1 - 2 0 2 03-2
Annual Update3.0 - Public Involvement
Table 3-1 provides a summary of the TDP Review Committee Meetings.
Table 3-1: TDP Review Committee Meeting Schedule (2010)Review Committee Meeting Date
CTAC June 23, 2010TPTAC June 2, 2010TIRC June 9, 2010BCC July 8, 2010
3.3 Community InvolvementThrough coordinated county-wide efforts MDT continues to provide early and ongoing publicinvolvement opportunities to the residents of Miami-Dade County. Opportunities for communityoutreach take the form of many different forums and outlets already set in place by the County.The TDP PIP ensures that the perspectives, opinions, and concerns of the public will be heardand addressed. The following list provides the various community outreach opportunities MDTconducted that has assisted in the development of the TDP Annual Update:
Presentations and outreach at Senior Centers, local High Schools, Colleges, Universities,County Facilities, Municipalities, Commissioners’ District Offices, Public Libraries, MiamiInternational Airport, Neighborhood Associations and Community Based Organizations.
Presentations to Metropolitan Planning Organization (MPO) Committees
MDT 2nd Annual Transit Summit
Outreach at select MDT Metrobus Transfer Points and Metrorail stations
Miami Intermodal Center/Earlington Heights Connector Workshop
EASY Card Implementation Outreach
95 Express Presentation
Census Presentations
Local Festivals
3.3.1 South Florida Workforce Coordination
The South Florida Workforce (SFW) was enacted in 2000 by the Florida Legislature under theWorkforce Innovation Act to provide youth, employment, and business enterprise developmentservices. The SFWB coordinates workforce planning and quality training services for jobseekers and businesses located in Miami-Dade County. MDT will actively seek agency inputfrom the SFW through direct coordination with the Executive Director and organizationalmembers. The SFW has been provided hard copies of the Draft TDP Annual Update for reviewand comment.
Additional coordination efforts with the South Florida Workforce Board continue to occurregularly through the Welfare-to-Work Program, which includes the provision of transit service toareas not usually served by MDT. Through this program, MDT receives input on specific transit

Annual Update3.0 - Public Involvement
T R A N S I T D E V E L O P M E N T P L A N F Y 2 0 1 1 - 2 0 2 03-3
needs for consideration of adjustment and/or implementation of existing transit services inresponse to these needs.
3.3.2 3-1-1 Information System
The Government Information 3-1-1 Answer Center operates to provide county residents withinformation regarding government services and programs available. Callers receive personalservice in English, Spanish, or Creole, to answer questions and provide information on non-emergency issues such as trash collection days, property taxes, after school programs, transitroutes, and other countywide services. The 3-1-1 Answer Center is free of charge and availablesix (6) days a week at varying operation times. Calls are received Monday through Friday from7 am to 8 pm and on Saturdays 8 am to 5 pm.
This system serves as a main point of telephone contact for residents to inquire about MDTtransit services and provide feedback. This feedback has allowed MDT to continue to makecustomer service a priority and to better understand the transportation needs of its ridershipwhile planning for the future. This input is then utilized for the development of the TDP.
3.3.3 Miami-Dade Transit Website
MDT maintains a comprehensive website to provide the community with easily accessible up-to-date system information (www.miamidade.gov/transit/). Furthermore, the website provides thepublic the ability to contact MDT, learn about services, and provide input. MDT utilizes thewebsite to post the TDP document for public review and reference.
3.3.4 Second Annual Transit Summit
Miami Dade County conducted the Second Annual Transit Summit in November 2009 at theMiami-Dade County Commission Chambers. The event was attended by hundreds whoparticipated in person or watched the summit live on Miami-Dade TV or via webcast.Participants learned about the status of various MDT service initiatives and transit capitalimprovement projects. Meeting participants were also given the opportunity to provide input onfuture transit plans by calling in or submitting comments through an online feedback form.Comments received were responded to via transit portal.


Annual Update4.0 - Past Year’s Accomplishments (FY 2009)
T R A N S I T D E V E L O P M E N T P L A N F Y 2 0 1 1 - 2 0 2 04-1
4.0 Past Year’s Accomplishments (FY 2009)
Throughout FY 2009 MDT has achieved a number of notable accomplishments that seek toimprove customer convenience while also assuring the operation of an efficient, responsive, andfinancially sustainable transit system. The following achievements are categorized as part ofthis TDP Annual Update according to the type of improvement related to service operations,capital investment, and passenger information/convenience.
4.1 Service Operations
4.1.1 New Bus Service Routes
Airport Flyer: In December 2009, MDT unveiled an express bus service route from MiamiInternational Airport (MIA) to the area’s most popular tourist destination -- Miami Beach. Thenew express bus route known as the Airport Flyer provides bi-directional service between MIAand Miami Beach, with an additional stop at the Earlington Heights Metrorail station. Fundedwith grant monies from the Federal Transit Administration (FTA), the Airport Flyer provides thenearly 4.8 million South Florida visitors traveling to Miami Beach with access to a rapid,affordable, and reliable transportation option. The Airport Flyer operates daily on 30 minuteheadways between the hours of 6 AM and 11:30 PM, and costs the rider $2.35 per boarding.
I-95 Dade-Broward Express: In January 2010, Miami-Dade Transit partnered with BrowardCounty Transit (BCT) to provide commuter express transit service to increase connectivitybetween the two counties. MDT operates express routes in Broward County from the BrowardBoulevard Park and Ride Lot and the Sheridan Street Park and Ride Lot with direct service toDowntown Miami. The I-95 Dade-Broward Express Bus routes are especially geared towardsworking commuters and departures are scheduled every 15 minutes during morning andevening peak travel period. The cost to the rider is $2.35 per boarding.
Kendall Cruiser: The project will extend 9.5 miles from Dadeland North Metrorail station to SW162nd Avenue along Kendall Drive (SW 88th Street). The alignment will have a total of 22 stops.The service will feature nine stylized distinctly branded environmentally friendly sixty foot hybriddiesel-electric New Flyer buses. The vehicles will also have Wi-Fi service available for patrons.Solar powered real-time passenger information will be provided at certain stops along thecorridor. The cost to the rider is $2.35 per boarding. Implementation is set to begin in June2010.
4.1.2 Metrobus On-Time Performance
Metrobus on-time performance has increased with an almost 10 percent (10%) improvementfrom 2008.
Mean distance between failures has increased for Metrobus due to an enhanced preventivemaintenance program that identifies mechanical issues before failures result. For FY 2008-2009 the mean distance between failures has increased by 6.4 percent. For FY 2009-2010, todate, the mean distance between failures has increased to 25.6 percent.
4.1.3 Bus Service Restructuring
A major initiative being undertaken by MDT is to improve Metrobus service efficiency through arestructuring of the Metrobus route system while minimizing the impact to customers. In

T R A N S I T D E V E L O P M E N T P L A N F Y 2 0 1 1 - 2 0 2 04-2
Annual Update4.0 - Past Year’s Accomplishments (FY 2009)
December 2009, MDT implemented service route adjustments to improve overall serviceperformance while maintaining existing service area coverage. The estimated transit operatingcost savings as a result of this effort is approximately $12.3 million annually. The new modifiedgrid system was based upon ridership data obtained from the Automated Passenger Counter(APC), Easy Card as well as coordination with local municipal transit services and theMetropolitan Planning Organization (MPO) to maximize interconnectivity and efficiency.
4.1.4 Miami-Dade Transit Service Standards
Miami-Dade Transit established specific transit service standards for bus service to assessannual operational performance. These newly revised service standards were adopted by theMiami-Dade Board of County Commissioners in November 2009.
4.2 Capital Improvements
4.2.1 Miami Intermodal Center-Earlington Heights Connector
Construction of the 2.4-mile Miami Intermodal Center (MIC)-Earlington Heights Metrorailextension continues to proceed on schedule and will be open for service in 2012. This projectwill provide a Metrorail connection between the MIC at the Miami International Airport and theexisting Earlington Heights Metrorail Station. Included in the project is a new Metrorail Stationlocated at the MIC to serve as a multimodal transfer hub for Metrobus, Metrorail, Tri-Rail, futureexpansion of Amtrak, and other chartered services such as an intercity bus line. The building ofthe track is progressing vertically with columns and elevator walls. Plumbing and electricalroughing is under way at columns, bent beams and intermediate slabs. As of December 2009,work accomplished so far includes the following: assembly and installation of steel forms,installation of new concrete poles, field and laboratory testing of drilled shaft and augercast pilegrout and concrete materials, and density compaction testing on the backfill around the pilecaps. The Preliminary Design Train Control (excluding EHT) is 60% complete. PreliminaryDesign Power Distribution System is also at 60% completion. Project completion date isscheduled for May 2012.
4.2.2 Procurement of New Metrobus Vehicles
A purchase order for Phase 1 of the procurement of thirteen 40 foot hybrid buses was releasedby MDT in June 2009. Production of hybrid buses has begun and a delivery schedule rate offour hybrid buses per week is anticipated. Phase 2 includes the procurement of twenty-five 60foot hybrid buses. Of this amount, sixteen will be used for the I-95 Express Bus project andnine for the Kendall Enhanced bus service. Hybrid vehicles will be purchased to replace allfuture bus fleet as they reach retirement age.
4.2.3 Metrorail New Vehicle Replacement
Miami-Dade County made the decision to pursue the procurement of new Metrorail cars asopposed to rehabilitation of the existing 136 rail car fleet. The Board of County Commissionershas approved procurement of 136 new Metrorail vehicles at a cost of $401.4 million. The newMetrorail vehicles will include more passenger inspired comfort interior features and a self-diagnostic system for early identification of mechanical issues. By December 2009, the RFP 654proposals were received (9/25/09) and the selection Committee Team members met to evaluateCommercial, Systems Descriptions, Management Support, Inspection and testing,Communications, Software Systems, Systems Support and Systems Assurances Sections.

Annual Update4.0 - Past Year’s Accomplishments (FY 2009)
T R A N S I T D E V E L O P M E N T P L A N F Y 2 0 1 1 - 2 0 2 04-3
Work is about 22% complete. The replacement of the entire fleet will occur over the next nineyears, with vehicles scheduled to begin arriving in the second quarter of 2013. The project isexpected to be completed by March 2019.
4.2.4 Metromover Replacement Cars
Miami-Dade Transit has completed the replacement of its original 12 Metromover cars. Thishas contributed to improved Metromover reliability and passenger comfort. Sinceimplementation, Metromover cars now travel on average about 40 percent further beforeexperiencing any mechanical failures. There has also been a decrease in the percentage ofMetromover vehicles that were inoperable at any given time. In addition, another seventeenvehicles are expected for Phase 2 of procurement for a total of twenty-nine new vehicles. Thevehicles will begin arriving in July 2010 through the beginning of 2012. The additionalseventeen cars are scheduled to be put into service by mid FY 2012.
4.2.5 Lehman Yard Rehabilitation – Expansion Phase 1
MDT will construct five storage tracks and two Maintenance of Way (MOW) tracks at the existingMetrorail Lehman Center Facility. This expansion is necessary to provide the required storage andtransition facility in support of the new 136 Metrorail fleet. During 2009 the 30% Design Criteriawas completed by the PMC consultant. The project is part of Contract # CIP028, Design Build.The project is currently at the Assistant County Manager’s office pending approval to advertizefor construction. It is schedule to be advertized by June 4, 2010. The Notice to proceed isanticipated to be issued by April 2011.
4.2.6 Lehman Center Test Track
Miami-Dade Transit is planning to construct a new test track (2,500 feet) at the existing MetrorailLehman Center Facility using a Design/Build Procurement method. The test track will provide thenecessary support for the existing and new Metrorail fleet. This project is also part of Contract forDesign Build # CIP028. During 2009 the 30% Design Criteria was also completed by the PMCconsultant. As part of the same contract, the project is currently at the Assistant CountyManager’s office pending approval to advertize for construction. It is schedule to be advertizedby June 4, 2010. The Notice to proceed is anticipated to be issued by April 2011.
4.2.7 Dadeland South Metrorail Station Comfort Station
This new rail operator comfort station will replace the existing one at the platform level of theDadeland South Metrorail Station. The scope of work includes the evaluation of the existingstructural capacity of the platform to accept the new loads, the actual design of the comfort station,the preparation of construction drawings and specifications, dry run process, preparation ofconstruction costs estimates and construction of the proposed comfort station. Estimated completiondate is May 2010.
4.2.8 Northeast Passenger Activity Center
Miami-Dade Transit is presently working with the City of North Miami Beach to develop a transit hubnear NW 163rd Street Shopping Center. The hub will accommodate 12 existing bus routes and be acatalyst for joint development.
4.2.9 Brownsville Metrorail Station Transit Oriented Development: The BrownsvilleMetrorail Station Transit Oriented Development is a phased workforce housing project which willinclude approximately 466 housing units, incidental retail space and covered vehicle parking for

T R A N S I T D E V E L O P M E N T P L A N F Y 2 0 1 1 - 2 0 2 04-4
Annual Update4.0 - Past Year’s Accomplishments (FY 2009)
transit patrons. Building permit has been issued to the Developer for Phase I. The CountyPlanning and Zoning Board approved the Phase II of the project on March 4, 2010. Applicationfor Phases III, IV, and V is anticipated in mid-2010.
4.2.10 Park and Ride Lots
New Busway Park and Ride Lot at SW 112th Avenue: Miami-Dade Transit opened a new450-space park and ride lot at SW 112th Avenue (approximately SW 204th Street) in Cutler Bayin July 2009. The new lot replaces the 95-space lot at SW 200th Street to provide additionalparking capacity to meet passenger demand along the South Miami-Dade Busway.
Dadeland South Metrorail Station Park and Ride Lot Expansion: The expansion of theexisting surface lot to include an additional 93 parking spaces was completed and opened forservice in March 2010.
Kendall Drive and SW 127th Avenue: Miami-Dade County is currently in negotiations with FloridaPower and Light to lease approximately three acres of land for purposes of developing a 180 parkingspace facility.
Kendall Drive and SW 124th Avenue: Negotiations for a park and ride facility in conjunction with theKendall Cruiser project are currently underway and set for implementation in the summer of 2010.
Kendall Drive and SW 150th Avenue: Negotiations for a park and ride facility in conjunction with theKendall Cruiser project are currently underway and set for implementation in the summer of 2010.
Kendall Town Center (Kendall Drive and SW 162nd Avenue): Miami Dade Transit is incoordination with a private developer as part of a development agreement for the construction andconveyance of a transit hub that includes a 40 space park and ride lot and 6 bus bays. Hub isscheduled to be completed and open for service in December 2010.
NW 186th Street/73rd Avenue Park and Ride Lot: The permits to allow construction of a new 125parking space lot have been finalized. Construction of the park and ride lot is began in March 2010and is anticipated to be completed by March 2011.
Busway and SW 344th Street (Florida City): Proposed Park and Ride facility with 261 spacesanticipated for opening in late 2012. FTA granted MDT approval on November 23, 2009. to proceedwith the advertisement of the Environmental Assessment Report for public review and comment.Newspaper notice, letters to appointed and elected officials and flyers to the owners have beenprepared. Public meeting held on January 20, 2010 at the Florida City Public Library.
Dolphin Station (NW 107th Avenue and NW 12th Street): To include a proposed 189 surfaceparking spaces. Held several negotiation meetings with Developer and their lawyers, and included thePlanning and Zoning Department. Strides were made to convince the Developer of MDT’s need tohave the surface lot completed to coincide with the 836 Express Bus project. Construction of the parkand ride facility is anticipated for opening in 2012.
NW 7th Avenue Transit Village (NW 7th Avenue and NW 62nd Street): Miami-Dade Transit hasproposed 25 transit patron parking spaces at the planned mixed use development project. Projectstatus to-date (Dec. 2009) includes: the right-of-way acquisition services are on-going, relocation hasbegun, RFP is being finalized and the title transfer on Transit Village Parcels occurred on 12/21/09.

Annual Update4.0 - Past Year’s Accomplishments (FY 2009)
T R A N S I T D E V E L O P M E N T P L A N F Y 2 0 1 1 - 2 0 2 04-5
4.2.11 Infrastructure Renewal Projects (IRP)
Hialeah Metrorail Station Concrete and Asphalt Repairs: The parking lot at the HialeahMetrorail Station has extensive asphalt damage due to overgrown tree roots and daily heavytraffic thru the years. The storm drainage system also needs to be evaluated to ensure that it isfunctioning properly. MDT has reviewed and approved the scope of work, schedule and costproposal provided by the Public Works Department (PWD). Schedule completion date isDecember 2010.
Omni Bus Terminal Concrete Repairs: The repair and renovation of pavement and drainage in anarea of heavy bus traffic at the Omni Bus Terminal is being planned. Public Works is in the processof preparing a scope of work, fee estimate and project schedule to perform the work.
Douglas Road Metrorail Station Park and Ride Lot Under Guideway Repair andRestoration: The project goal is to place back in service the Douglas Road Metrorail Stationparking lot located under the guideway. The project scope includes the preparation of a completeset of biddable documents, design, construction, and design services during construction. Thework includes paving, re-striping the parking spaces, fencing repairs, tree trimming andmiscellaneous safety upgrades. A proposed additional 50 parking spaces are anticipated for this lot.Construction completion date is scheduled for September 2010.
Coral Way Maintenance Facility- Employee Access to Parking: MDT recently completed thisproject which includes a new entrance and exit of vehicles to the Coral Way parking facility, anair conditioned guard house with security cameras, Closed Caption Television monitors and atoilet room.
Secondary Guiderails for Bus Washes- Installation of secondary guide rails in the buswashes at Central, Northeast and Coral Way Bus Facilities. Bid specification was completed in10/27/09. Preliminary designs were drawn for review of roller style guides. Design is to becompatible with all MDT buses. Project is to be completed by 1/31/2012.
Coral Way Garage Hurricane Panels- Coral Way Bus Transportation and MaintenanceFacilities and other buildings in the property. Furnish and install (58) perforated stainless steelhurricane barriers and five (5) high performance Accordion Shutters. Bid specifications weredeveloped on 10/27/09 and the project is to be completed by September 31, 2011.
Metrorail HAVC Replacement- Completed the overhaul of the heating, ventilation and aircondition (HVAC) system of the rail vehicles. The overhaul will maintain system reliability andcustomer comfort for the remainder of the rail vehicle life.
As of January 2010 the overhaul was completed on 68 vehicles. The remaining rail cars will beoverhauled during 2010.
4.2.11.1 ARRA Funded
Palmetto Station Traction Power Sub-Station: This will be a Design/Build procurement toimplement a new Traction Power Substation at the existing Palmetto Station. Thisimplementation is necessary to provide the required minimum higher 600 Volts Direct Current(VDC) for the 136 new Metrorail vehicles starting in 2013. The present system provides lesservoltage at the Palmetto Station and will not be able to operate new vehicles. The Planning, Pre-Design and Engineering has been completed. MDT is working with OCI to re-advertise theproject. Schedule completion date is March of 2012.

T R A N S I T D E V E L O P M E N T P L A N F Y 2 0 1 1 - 2 0 2 04-6
Annual Update4.0 - Past Year’s Accomplishments (FY 2009)
Metromover Bicentennial Park Station Rehabilitation: The construction of a new Museumfacility adjacent to this Station will foster the reopening of the Station for service. The scope ofwork to reopen this Station includes: the rehabilitation of the elevator and escalators,replacement of lamps throughout the Station, replacement of aluminum ceiling slats with newsupport system at ground level, repair the communication system, replace stair metal plates,testing of electrical circuits to assure proper function, new fire cabinets and ancillary devices,replacement of floor tiles, repair cracks at exterior walls, painting and landscaping. The ARRAfunding available for this project is $1,300,000. This is $786,800 short of the estimated projectbudget. A Project Prioritization and Budget Approval Form was submitted for the shortfall of$767,800. As of December 2009 the detail project scope of work was completed for selection ofthe consultant. Construction is set to begin in mid 2011 and completed by April 30, 2012.
Metrorail Track and Guideway Refurbishment and Mainline turnout Replacement: Thereplacement of twenty-five (25) mainline turnouts. This will include the #10 Rail BoundManganese frog, set of insulated plates, ties, concrete, and train control cables. The Metrorailsystem is over twenty-five years old; the frogs are the critical point of the mainline turnouts.These frogs have been welded and rebuilt countless times. They are a primary reason for noiseissues in residential areas that are adjacent to the crossovers. The new frogs with newcomposite ties and insulated plates will reduce noise as well as increase the safety of thesystem. Begin installation of frogs in July 2010 and complete project by end of March 2012.
Metromover Inner Loop Stations Escalator Replacement and New Canopies: Scope ofwork consists of the preparation of a complete set of biddable documents and construction workrequired for the installation of canopy covers over the existing escalators/stairs at the followingseven Metromover stations: Government Center Station, Miami Avenue Station, Bayfront ParkStation, First Street Station, College Bayside Station, College North Station and Arena/StatePlaza Station. The scope of work also includes replacement of the existing escalators at theaforementioned locations. Although the primary function of these canopies is to provideprotection from the elements for the mechanical components of the escalators, they will alsoprovide protection to persons using the escalators and stairs. NTP to the Design Consultantwas issued on March 18, 2010. Kick-off meeting was held on March 30, 2010.
Transit Operations System (TOS) Replacement Project: MDT is looking to acquire a systemthat shall support a seamless integration of transit operations related information andsimultaneously achieve the management of this information in a timely manner. This systemshall consist of a comprehensive system package with advanced automated bidding functionsdaily dispatch functions, advanced vehicle assignment functions, vehicle availability, workforcemanagement, performance and discipline, absence tracking functions, operators incentives,service incidents, timekeeping and property specific reports, and interfaces with other systems.As of December 2009 the Capital Project Cash Flow spreadsheet for FY2009-FY10 and FY 11-FY12 was updated. The Scope of Services document was finalized. Project implementation isscheduled for April 30, 2012.

Annual Update4.0 - Past Year’s Accomplishments (FY 2009)
T R A N S I T D E V E L O P M E N T P L A N F Y 2 0 1 1 - 2 0 2 04-7
Metromover Fiber Replacement: The replacement of Fiber Optic Cable equipment throughoutthe Metromover system at all stations and at Central Control has been scoped forimplementation in April 2012. The installation of Giga-Bit Ethernet and wireless networkingcapability at all stations is also included in the scope of work. The Scope of Work was modifiedbased on a revised estimate for the Programmable Logic Controller (PLC) replacement portionof the project. The objective is to attempt to include the cost of the PLC within the availableARRA Grant allocation. A project schedule is being prepared with preliminary completion dateof 10/01/2010
Metromover Closed Caption Television Replacement and Installation: MDT has set forththe installation of new digital cameras at all Metromover Stations with Network Video recorders(NVR). The new recorders will be networked into the MDT Video System. Site surveys, designand scope of work have been completed.
Existing Metrorail Stations (Phase 1) Graphics and Signage Retrofit: The project requiresthe selected Design-Builder to design, furnish, install and test a complete way finding signageand graphics system for the existing twenty-two (22) Metrorail Stations in accordance withContract Documents and industry standards. The work of the project includes providing acomplete way finding signage and graphics system for all twenty-two (22) existing MetrorailStations. As of December 2009, the advertisement process was on-going. Constructioncompletion date is March 30, 2012.
4.3 Customer Information/Convenience
4.3.1 EASY Card Implementation
In October of 2009, MDT successfully implemented a new Automated Fare Collection Systemcalled EASY Card as a fare card for passenger use on Metrobus and Metrorail. This fullyautomated system provides improved passenger convenience through the provision of areusable, and readable stored value fare card. The implementation of EASY Card is alsoanticipated to reduce the level of fare evasion on MDT services further improving the collectionof passenger fare revenue. Furthermore, the EASY Card will enable MDT to generate moreaccurate ridership data improving MDT’s ability to adjust service based on passenger demand.
In January 2010, MDT and the South Florida Regional Transportation Authority (SFRTA)entered into an agreement for MDT to provide clearinghouse activities for back office functionsfor MDT’s Automated Fare Collection System (i.e., EASY Card). This arrangement allows forseamless patron transfer between the two systems. In addition, this agreement allows theCounty to process transactions in the payment system on behalf of the SFRTA and provides theSFRTA the capability of using the EASY Card as a method of cashless fare collection onSFRTA’s fixed-route service.
4.3.2 Wireless Service on Rail and Bus Vehicles
Miami-Dade Transit launched an innovative free wireless service pilot program on selectMetrorail cars and I-95 Dade-Broward Express buses. The Wi-Fi access provides transit riderswith the convenience of being able to work on laptops and other mobile internet devices whileusing transit to commute to and from work.

T R A N S I T D E V E L O P M E N T P L A N F Y 2 0 1 1 - 2 0 2 04-8
Annual Update4.0 - Past Year’s Accomplishments (FY 2009)
MDT is looking to implement wireless services in all rail vehicles, stations, express routes andthe South Beach Local route. This project builds upon the pilot project as previously mentionedwhich is currently having an overwhelmingly positive impact for our riders. The deployment ofthis service will be done in phases to minimize the financial impact. However, dedicated sparevehicles are not Wi-Fi equipped. Wi-Fi will also be provided on the Kendall Cruiser bus service,and on the Airport Flyer vehicles (Route 150).
4.3.3 New Electronic Transit Rider Alert System
In July 2009, MDT implemented a new Rider Alert system to notify passengers about transitservice delays as well as the operational status of Metrorail or Metromover station elevators andescalators. MDT customers can also receive updates for Special Transportation Service.Customers must sign-up to receive the electronic alerts to their cellular phones, emailaddresses, text pagers, and Blackberry devices or smart phones.
4.3.4 CAD/AVL System Replacement
The current MDT CAD/AVL System has been in production for 13 years and has reached itsend-of-life cycle. The CAD/AVL software is also an antiquated system that needs to bereplaced. Initial implementation of the replacement will include maintaining existing system. Thisproject will facilitate integration with the ETSD OpenSky 800Mhz Radio Rebanding initiative.
MDT intends to prepare an infrastructure to support a "state of the art" real-time Bus TrackingSystem. The system will be accessible via the Internet, Cell Phone, PDA and Electronic Signs atselect Bus Stops. This project also provides easier integration to the new critical systems, suchas Transit Operations System (TOS) and Fare Collection currently being implemented. Aconditional pilot will be included in the RFP.
This project will also implement onboard vehicle Traffic Signal Priority (TSP) which allowscommunication with each of the thirty-three traffic signal controllers along the corridors. Thetraffic signal equipment in the corridor will be equipped to enable TSP operation and integratedinto the Miami-Dade County (MDC) Automatic Traffic Management System (ATMS).Implementation is scheduled for mid 2012.
4.4 Monitoring Program to Track Annual Performance of MDTServices
The preparation of the FY 2010 – 2019 TDP Major Update resulted in the development of eightmajor goals, each with various objectives and corresponding measures. Monitoring the previousperiod results against current measures, will validate MDT’s attainment of these goal’s for thatperiod. This TDP Annual Update provides MDT an opportunity to report monitoring results for eachmajor goal according to those objectives and corresponding evaluation measures for which data isavailable to support. These measures are the Key Performance Indicators (KPI) that will beevaluated annually, using the most recent twelve-month period for which data is available. Theevaluation compares the current values of productivity standards versus those from the previousyear. A few examples include:
Performance measures such as On-Time Performance (OTP) and Mean Distance BetweenFailures (MDBF) reflecting transit reliability are monitored monthly on the Active StrategyEnterprise (ASE) Scorecard.

Annual Update4.0 - Past Year’s Accomplishments (FY 2009)
T R A N S I T D E V E L O P M E N T P L A N F Y 2 0 1 1 - 2 0 2 04-9
Review transit routes to ensure service is being provided within a ¼ mile to major tripgenerators.
Automated Fare Collection data to monitor ridership by route.
Alignment of capital projects to goals.
Public Involvement events to disseminate transit information and promote transit usage.
4.4.1 Goal 1: Improve the Quality of Transit Services
Objective: Improve the accessibility to major health care, recreation, education,employment cultural and social services facilities: Transit service miles providingconnections to major medical and educational facilities were evaluated. In the future thismeasure will also evaluate recreation, employment, cultural and social service facilities.Approximately 60 transit service route miles operate within a ¼ mile of major medical facilitieswhile more than 130 transit service miles operate within ¼ mile of all colleges and universitieswithin Miami-Dade County. This has remained virtually unchanged from the previous year.
Objective: Improve transit level of service on major roadway corridors and betweenmajor origins and destinations: This measure will be assessed in future TDP Updatesaccording to the recently adopted MDT Service Standards and the process to evaluate serviceperformance.
Objective: Maximize service reliability and efficiency: The on-time performance for thevarious MDT transit modes are provided in Table 4-1. Metrorail has excellent on-timeperformance and continues to exceed the Agency goal of 95 percent. Metrobus operates atabout 79 percent on-time performance, which is a good result given the congested trafficconditions under which most of the routes operate, in many corridors throughout the day, aswell as the high load factors on many of the routes. On-time performance for Metrobus alsoexceeds the agency goal of 75 percent.
Table 4-1: MDT Annual On-Time PerformanceOn-Time Performance
Metrorail MetrobusFYTD 2009-2010 97.7% 79.4%
FY2008-2009 95.6% 79.2%Goal 95% 75%
Source: Miami-Dade Transit, March 2010

T R A N S I T D E V E L O P M E N T P L A N F Y 2 0 1 1 - 2 0 2 04-10
Annual Update4.0 - Past Year’s Accomplishments (FY 2009)
Objective: Maximize multimodal travel options and provide travel choices: MDT, with itsMetrorail and Metromover services, is among the few US transit agencies to offer heavy rail andDowntown People Mover Systems. The convenience of Metrorail will be further extended bythe completion of the MIC-Earlington Heights Metrorail service, which will connect downtownMiami and the other locations along the Metrorail system with MIA and the vibrant employmentcenter that surrounds the airport. Miami-Dade Transit continues to implement an initiative tooperate more efficient bus service through a grid operational network of service routes. Theresulting bus adjustments that occurred in June and December 2009 attribute to a decrease inroute miles as presented in Table 4-2.
Table 4-2: Number of Transit Route Miles by Transit Mode
Transit Mode Route Miles2008 2009
Metrorail 22.4 22.4Metrobus 2,866 2,615Metromover 4.4 4.4
Source: National Transit Database, Miami-Dade Transit, February 2010
Objective: Fill transit service coverage gaps: The number of miles of MDT bus routes withinthe transit-supportive service areas (Figure 4-1) is approximately more than 700 miles. This isvirtually unchanged from last year’s measure of just over 710 miles.

Annual Update4.0 - Past Year’s Accomplishments (FY 2009)
T R A N S I T D E V E L O P M E N T P L A N F Y 2 0 1 1 - 2 0 2 04-11
Figure 4-1: Service Coverage in Transit Supportive Areas
Source: Miami-Dade Transit, 2010

T R A N S I T D E V E L O P M E N T P L A N F Y 2 0 1 1 - 2 0 2 04-12
Annual Update4.0 - Past Year’s Accomplishments (FY 2009)
Objective: Promote transit reliability: One method to measure transit reliability is throughannual systemwide ridership. MDT will be able to further improve upon existing ridershipthrough the provision of efficient transit service that improves transit travel time and on-timeperformance. Due to the economic downturn, large transit agencies nationwide are reporting anaverage 8-10% decline versus a year ago in bus ridership. Notwithstanding the 6% reduction ofbus service miles (30.5 to 28.5 million miles), MDT is in line with the ridership decline that othernationwide agencies are experiencing with a 10% overall reduction in ridership.
Table 4-3: MDT Systemwide Boardings
Transit ModeAnnual Boardings (000’s)
FY2008-2009 FY2009-2010Metrorail 18,539 18,244Metrobus 85,790 75,608Metromover 8,839 8,100Source: National Transit Database, Miami-Dade Transit, February 2010
Objective: Improve transportation facilities' and services' regional connectivity: Table4-4 shows the number of transit service miles (including miles of overlapping bus service) ineach of more than a dozen key regional corridors. As the table indicates, MDT providesmultiple bus routes operating segments of all of these corridors, with high concentrations ofservice on South Dixie Highway (the Busway), A1A, Biscayne Boulevard and Flagler Street.
Table 4-4: Transit Revenue Miles in Corridors of Regional Significance
Corridors of RegionalSignificance
TransitRevenue Miles
in CorridorI-95 156.38S Dixie Highway 154.93NW 27th Avenue 76.7A1A 149.23Flagler Street 95.04Coral Way 46.53Biscayne Boulevard 114.648th Street 51.69Kendall Drive (88thStreet) 62.52
Source: Miami-Dade County GIS files, 2010
MDT’s system offers stations along the Metrorail and Metromover system, and bus stops,shelters and benches along Metrobus routes. Table 4-5 shows, bus stops and station spacing.MDT’s standard calls for on average five stops per mile for local bus. This would indicate aslightly more frequent spacing of stops, on average, than five stops per mile (about one stopevery 1,050 feet). More detailed analysis is being conducted to adjust stop spacing dependingon the type of service being provided, thus increasing the efficiency of the bus route.

Annual Update4.0 - Past Year’s Accomplishments (FY 2009)
T R A N S I T D E V E L O P M E N T P L A N F Y 2 0 1 1 - 2 0 2 04-13
Table 4-5: Number of Station Stops Per Route MileMode Number of
Stations/StopsTotal Route
MilesStations/Stopsper Route Mile
Metrorail 22 22.4 .98Metromover 20 4.4 4.55
Metrobus 8,943 1,837 3.42
Source: National Transit Database, Miami-Dade Transit, February 2010
Objective: Include provisions for non-motorized modes in new projects and inreconstructions: Provisions that support non-motorized modes of transportation are includedland use and transportation elements of the Miami-Dade County CDMP. Future capitalimprovements shall also seek to integrate non-motorized infrastructure upon the implementationof new transit services.
Objective: Improve transit services that provide access to educational facilities: Thenumber of transit service route miles within a ¼ mile of colleges and universities throughoutMiami-Dade County is approximately 130 miles. All of the major colleges and universities of thecounty are served by transit service within ¼ mile of their campuses. This has remainedunchanged since reported in last year’s TDP Major Update
4.4.2 Goal 2: Improve Customer Convenience, Comfort and Safety on TransitService and within Facilities
Objective: Improve safety on vehicle service operations: MDT regularly assessesoperational safety for workers and passengers according to level of investment and complianceof regularly updated safety plan. As part of MDT’s Infrastructure Renewal Program, safetyprojects are evaluated and prioritized for implementation on an annual basis.
Objective: Reduce roadway and multi-modal crashes: The goal that MDT has set forth forthe reduction of the number of accidents/incidents is 3.60 per 100,000 miles. Similarly toFY 2008, MDT reported for FY 2009 the same figures of 3.15 accidents per 100,000 miles oftransit service. This is a 14% improvement over the set goal.
MDT suffered an employee fatality on June 19, 2009. As a result of this tragic and unfortunateincident, MDT senior management conducted an extensive review of its procedures for actionswhich surround the fatality’s governance. Numerous revisions were incorporated into theaforementioned procedures and extensive training was conducted throughout the agency toraise the awareness level of the divisions involved.
Objective: Enhance outreach opportunities to educate the community on transportationissues and highlight transit service benefits such as service reliability, passenger costsavings, and environmental benefits: MDT continually seeks to educate the public as well asprovide opportunities for public input through various public outreach strategies. In November2009, Miami-Dade County held the 2nd Annual Transit Summit to further educate the publicabout various transportation projects as well as provide an opportunity for all publicstakeholders to provide input on existing and future plans. MDT also is active in attending civicand community events and meetings to continually inform the public about MDT services. Inaddition, MDT uses various forms of media (e.g., internet, radio and televised advertisements,news paper ads, etc.,) for public outreach.

T R A N S I T D E V E L O P M E N T P L A N F Y 2 0 1 1 - 2 0 2 04-14
Annual Update4.0 - Past Year’s Accomplishments (FY 2009)
Objective: Maintain convenient, clean, safe transit passenger facilities and vehicles:MDT is committed to maintaining shelters, stations, and vehicles clean, showing a 3 percentreduction of passenger complaints from the previous year.
Miami-Dade Transit reported 114 safety related incidents in 2009 as compared to 1,191 safetyrelated accidents and incidents for 2008.
4.4.3 Goal 3: Increase the Security of Transit Vehicles and Facilities
Objective: Ensure transit vehicles and facilities provide a secure environment forcustomers: The total number of active video cameras systemwide is 590. Upon thecompletion of future projects the MDT video surveillance system will consist of 684 activecameras.
Objective: Increase security at transit stops and intermodal stations and connections:For 2009, the number of criminal incidents on-board transit has been reduced from the previousyear by thirty-nine percent (39%).
4.4.4 Goal 4: Support Economic Vitality
Objective: Provide transit access to urban centers at a minimum of 30-minutes duringthe peak: Table 4-6 lists urban centers as identified in the CDMP Land Use Element that wereevaluated to determine the amount of transit service within 1/4 mile. Downtown Miami has thehighest concentration of transit service as evident from the operation of Metrorail, Metromoverand Metrobus providing service coverage throughout the downtown area. Dadeland has a morefocused center of activity with direct connections from Metrorail and the South Miami-DadeBusway. This is consistent as to what was reported in the TDP Major Update.
Table 4-6: Transit Route Miles within ¼ mile of Urban CentersRegional Activity Centers Route Miles within ¼ mile
Downtown Miami CBD 52.5Dadeland 28.9NW 107 Avenue and NW 12 Street 8.9
Source: Miami-Dade GIS, 2010
Objective: Enhance major tourist travel and access opportunities within the UrbanGrowth Boundary: Table 4-7 shows the number of miles of transit service that operates withinclose proximity to various tourist attractions in Miami-Dade County. As the table indicates, mostof the attractions have transit service, with only relatively isolated locations such as BiscayneNational Park and Everglades National Park lying beyond walking distance of MDT bus or railservice. However, a number of locations have relatively little service, including such diverseattractions as the Deering Estate, the Venetian Pool, Barnacle Historic State Park and MonkeyJungle. In many cases, the locations of these attractions in outlying areas of the county do notlend themselves to extensive transit connections, and most are located along one or two routesthat operate on an adjacent arterial street, rather than being in the center of a hub of transitservice (such as in downtown Miami or Miami Beach).

Annual Update4.0 - Past Year’s Accomplishments (FY 2009)
T R A N S I T D E V E L O P M E N T P L A N F Y 2 0 1 1 - 2 0 2 04-15
Table 4-7: Transit Route Miles within ¼ Mile of Tourist Attractions
Tourist AttractionRoutes Miles
2009 2010Miami Art Museum 15.6 16.2Miami Children’s Museum 4.4 4.4Vizcaya Museum and Gardens 1.7 1.7Ancient Spanish Monastery 2.5 2.5Barnacle Historic State Park 0.8 0.8Bass Museum of Art 4.3 3.8Bayside Marketplace 8.1 6.4Biscayne National Park NA NACoral Castle 2.5 2.0Coral Gables Merrick House 1.0 0.5Deering Estate at Cutler 0.0 0.0Everglades Safari Park NA NAFairchild Tropical Botanic Garden 0.5 0.5Jungle Island 3.7 3.7Metro Zoo 1.7 1.5Miami Beach 168 134Miami Science Museum 2.4 2.4Miami Seaquarium/Key Biscayne 0.9 0.9Monkey Jungle 0.0 0.0The Wolfsonian Museum 4.0 3.0Venetian Pool 0.6 0.3
Source: Miami-Dade GIS, 2010
Analysis measuring the adequacy of transit services was conducted to identify major tripgenerators and major attractors in Miami-Dade County. Table 4-8 presents the various transitservices provided for each identified special generators in terms of number of routes andaccessibility of these facilities.

T R A N S I T D E V E L O P M E N T P L A N F Y 2 0 1 1 - 2 0 2 04-16
Annual Update4.0 - Past Year’s Accomplishments (FY 2009)
Table 4-8: MDT Major Trip Generators, December 2009MAJOR GENERATORS COMMENTS
Coconut Grove 6 22 27 48 249 Service on local roadwaysC S 2 3 67 8 9 11 2124 51 77 93 95120 207/208 211 243 246277 500 Mover Rail
Joseph Caleb Community Ctr 22 46 54 246 254 Service on adjacent roadwaysJ 37 42 57 132
133 150 238Metrozoo 252 On-site service to entranceMiami Seaquarium B Service on adjacent roadwayPort of Miami 243 On-site service via local roadways
A C L M S115 120 123 150
Barry University 2 9 10 19 Service on adjacent roadwaysFIU - University Park 8 11 24 71 On-site terminal with sheltersFIU - Biscayne Bay 75 135 On-site serviceFlorida Memorial 32 Service on adjacent roadwayMDC - Homestead 34 35 344 Service on adjacent roadwaysMDC - Interamerican 8 27 207 208 Service on adjacent roadwaysMDC - Kendall 35 56 71 104 204 On-site service with sheltersMDC - Medical Center M 12 21 22 32 Service on adjacent roadwaysMDC - North 19 27 32 97 On-site terminal with sheltersMDC - West 36 Service on adjacent roadwaySt. Thomas University 32 Service on adjacent roadway
48 56 500 Rail
E S 3 9 5993 99 120 183
Bal Harbour Shops G H S 120 Service on adjacent roadways1 52 73 87 88
104 204 240 272 288Rail
Diplomat Mall E Service on adjacent roadwayDolphin Mall 7 36 71 137 238 On-site terminal with shelters
31 34 38 52 136252 287
Mall of the Americas 7 11 51 87 On-site service with sheltersMiami International Mall 7 36 71 137 238 Service on adjacent roadwaysPrime Outlets 35 70 344 On-site and adjacent roadway service
Skylake Mall H 9 10 59 183 Service on adjacent roadways
1 31 35 38 5270 13737 40 42 48 136
249 500
Westland Mall 29 33 54 Service on adjacent roadwaysE H 2 3 910 16 19 22 75246
163 Street Mall Service on adjacent roadways and off-site terminal
Dadeland MallService on adjacent roadways.Pedestrian walkway to DadelandNorth station
Service on adjacent roadwaysSouthland Mall
(The) Falls Service on adjacent roadway and atBusway Station at SW 136 Street
ROUTESSpecial Attractors
Village at Merrick ParkService on adjacent roadways andwithin walking distance of DouglasRoad station
Miami International Airport Bus terminal on site; shuttle to Tri-RailStation
Regional Retail Centers
Aventura Mall On-site service
University of Miami Service on adjacent roadways andwithin walking distance of Universitystation
Downtown Miami
Service on local roadways and withinwalking distance of GovernmentCenter and Historic Overtown/LyricTheatre stations and the variousMetromover stations
Service on local roadways
Educational Centers
South Beach

Annual Update4.0 - Past Year’s Accomplishments (FY 2009)
T R A N S I T D E V E L O P M E N T P L A N F Y 2 0 1 1 - 2 0 2 04-17
Table 4-8: MDT Major Trip Generators, December 2009 (Continued)
Source: MDT, 2009, Note: Rail stands for Metrorail
Objective: Increase and improve transit access to Miami International Airport and thePort of Miami: The transit service route miles within a 1/4 mile of MIA and the Port of Miamiare presented in Table 4-9. Metrobus Routes J, 37, 42, 57, 133 and 150 (Airport Flyer)connects directly to the airport terminal, in addition to the Tri-Rail commuter rail services whichstops nearby and the Airport Flyer traveling to Miami Beach. Metrobus Route 243, the SeaportConnection, connects the Port of Miami to downtown Miami and to MDT’s Metrobus andMetrorail systems.
The construction of the MIC and the MIC-Earlington Heights extension of Metrorail will greatlyenhance transit service to the airport terminal over-and-above the already excellent Metrobusservice to the terminal.
MAJOR GENERATORS COMMENTS
Aventura E Service on adjacent roadwayBaptist 88 104 Service on adjacent roadwaysDoctors' 56 Service on adjacent roadwayHialeah L 28 42 79 135 Service on adjacent roadwaysHomestead 35 Service on adjacent roadway
M 12 17 21 22
32 95 246 Rail
Jackson North E 2 22 246 Service on adjacent roadwaysJackson South 52 57 252 Service on adjacent roadwayKendall AMI 40 Service on adjacent roadwayMercy 12 48 On-site service with sheltersMiami Children's 56 On-site service with sheltersMiami Heart Institute 115 Service on adjacent roadwayMount Sinai C M 115 On-site serviceNorth Shore 33 77 277 Service on adjacent roadwaysPalmetto General 29 On-site service with sheltersPalm Springs General 33 54 On-site service with shelters
37 57 72 73 500
RailSouth Miami
Service on adjacent roadways andwithin walking distance from SouthMiami station
Regional Hospitals
Jackson Memorial / U.M. /Cedars of Lebanon / V.A.
Service on adjacent roadways andwithin walking distance from CivicCenter station
ROUTES

T R A N S I T D E V E L O P M E N T P L A N F Y 2 0 1 1 - 2 0 2 04-18
Annual Update4.0 - Past Year’s Accomplishments (FY 2009)
Table 4-9: Transit Service Route Miles within ¼ mile of MIA and Port of Miami
FacilityTransit Service Route Miles within 1/4 mile
2009 2010Miami International Airport 70.0 68.4Port of Miami 17.5 17.5
Source: Miami-Dade GIS, 2010
Objective: Implement projects that support economic development and redevelopmentareas: A number of corridors in the county were identified by Miami-Dade County as potentialredevelopment areas based on their older development and infrastructure. As Table 4-10shows, MDT provides service on multiple routes to most of these corridors.
Table 4-10: Transit Route Miles within ¼ mile of Redevelopment AreasRedevelopment Areas* Transit Route Miles within ¼ mile
Homestead 13.93Florida City 22.16North Miami 63.19Naranja Lakes 16.13North Miami Beach 44.727 Avenue Corridor 22.91Midtown Miami 12.25Miami Beach 23.21East Overtown 73.19West Perrine 21.66City of Miami - OMNI 46.82South Miami 9.24
Source: *Information taken from the Miami-Dade County's GIS webpage.Layer was last updated on 04/05/2010
Objective: Apply transportation and land use planning techniques, such as transit-oriented development (TOD), that support intermodal connections and coordination:Policy initiatives do exist within the CDMP Land Use element and Transportation Elementrelated to development and population density.
4.4.5 Goal 5: Preserve the Environment and Promote Energy Conservation
Objective: Reduce fossil fuels consumption through the consideration of alternative fuelvehicle technology:
Miami-Dade Transit is currently procuring sixteen diesel-electric hybrid vehicles to be placedinto service by 2010 for operation within the I-95 Express Lanes and nine vehicles for theKendall Enhanced Bus service on Kendall Drive. Additionally 13 new 40-foot hybrid buses willbe in service in 2010.
MDT currently uses a B5 blend (5 percent) of Biodiesel with Ultra Low Sulfur Diesel Fuel in itsbus fleet. Biodiesel is non-toxic, biodegradable, and suitable for sensitive environments. In

Annual Update4.0 - Past Year’s Accomplishments (FY 2009)
T R A N S I T D E V E L O P M E N T P L A N F Y 2 0 1 1 - 2 0 2 04-19
addition, the Metromover Bayside College station, light poles were changed to economy savingslight poles.
Objective: Promote transit service projects that support urban infill and densification:MDT operates transit service primarily within the urban infill area with the exception of variousareas throughout the county that are not fully developed.
Table 4-11: Transit Route Miles Within ¼ mile of the Route Alignment
Other Transit Route Miles within ¼ mile2009 2010
Urban Infill Area (UIA) Boundary 1,419 1,332Source: Miami-Dade GIS, 2010
4.4.6 Goal 6: Enhance the Integration and Connectivity of the TransportationSystem, Across and Between Modes and Transit Providers, for People andFreight
The number of transit service route miles within 1/4 mile of Transit Analysis Zones (TAZ’s) witha high proportion (20% or higher) of elderly is 648 miles. This indicates that areas with a highconcentration of elderly are well served by transit service and have full access to the Metrobussystem, with some areas also well served by Metrorail.
4.4.7 Goal 7: Optimize Sound Investment Strategies for System Improvementand Management/Operation
Objective: Optimize operations and maintenance expenses:
The 2009 cost per mile of MDT’s Metrobus service is $9.02 as compared with the 2008 cost permile of $10.77.
The 2009 cost per mile of MDT’s Metrorail service is $11.35 as compared with the 2008 cost permile of $14.92.
The 2009 cost per hour of MDT’s Metrobus service is $116.44 as compared with the 2008 costhour mile of $130.28.
The 2009 cost per hour of MDT’s Metrorail service is $245.45 as compared with the 2008 costper hour of $237.46.
Objective: Identify Public, Private Partnership opportunities: Two projects are identified toinclude a public private partnership. The first project is divided into two phases. The first phaseincludes a 189 space surface parking at the intersection of NW 107th Avenue and NW 12thStreet that will serve as a park and ride lot. The second phase will develop a 260 parkingspaces car garage and would eliminate the 189 surface lot. The proposed project will be a turn-key operation including MDT owning the land, once the garage is completed. Phase I projectcompletion estimated in 2012.
The second project is a bus station and surface park and ride lot with 40 parking spaces at theKendall Town Center (Kendall Drive and SW 162nd Avenue). There is an existing commitment

T R A N S I T D E V E L O P M E N T P L A N F Y 2 0 1 1 - 2 0 2 04-20
Annual Update4.0 - Past Year’s Accomplishments (FY 2009)
in place as a result of the DRI/DIC process to meet transit concurrency. The project is estimatedto be completed in December 2010.
Objective: Align MDT priorities and deliverables with available funding and resources:Miami-Dade Transit continually evaluates operational and capital priorities and assesses theviability of securing various funding sources.
4.4.8 Goal 8: Maximize and Preserve the Existing Transportation System
Objective: Continue to examine the provision and utilization of special-use lanes on theexisting system for transit use: The existing special use lanes used by MDT is the SouthMiami-Dade Busway which is approximately 20 miles in length. For 2010, the newlyimplemented managed lanes on I-95 will increase transit’s usage of special lanes from theoperation of I-95 express service between Broward County and downtown Miami.
Objective: Identify and implement the best available technologies and innovations toimprove the reliability and efficiency of the transportation system: Miami-Dade Transitcontinuously works to assess ITS needs through an organization of prioritized ITS projects fordeployment that conform to regional ITS architecture while reflecting the local needs andpreferences for the operation of transit. Newly implemented ITS projects include Transit SignalPriority (TSP), wireless bus and trains, additional signage on bus stops, and PDAs with real timenext bus quotes.
Objective: Upgrade and maintain existing transit infrastructure and facilities in a state ofgood repair: Miami-Dade Transit has developed a procedure for identifying, evaluating,prioritizing, and programming capital improvement projects that will upgrade and maintain theexisting transit infrastructure and facilities. This Infrastructure and Renewal Program (IRP) isupdated annually to assure the existing transit system and facilities remain in a state of goodrepair. As of December 2009, for FY 2010, MDT has committed to spend $10.1 million oninfrastructure and facility improvement projects.
Objective: Maintain the operational functionality of transit vehicles to maximizereliability: Generally, MDT’s service reliability statistics are good, although there is alwaysroom for improvement. MDT experienced 171 missed pullout in 2009 compared to 204 missedpullouts in 2008, or fewer than one missed pullout per operating day. While even a singlemissed pullout can mean inconvenience and discomfort for hundreds of passengers, anaverage of less than one missed pullout per day is very good performance for a transit systemthe size of MDT.
Metromover plans to improve the adherence to its preventive maintenance program byimplementing a mileage based maintenance program. Currently in use is a time based programrequiring vehicle inspections to be performed regardless of the mileage. Implementation of amileage based program will more effectively utilize the agency's man power by ensuring that allpreventive maintenance inspections are completed within the allotted time frames. The currentgoal is set at a 90% adherence and according to the last fiscal year Metromover archived acompliance rate of 86.4%.

Annual Update4.0 - Past Year’s Accomplishments (FY 2009)
T R A N S I T D E V E L O P M E N T P L A N F Y 2 0 1 1 - 2 0 2 04-21
Table 4-12: Percent of Adherence to Preventative Maintenance Program by ModeMetrobus Metrorail Metromover
FY 08/09 99.3% 99.9% 91.8%FYTD 09/10 99.8% 99.9% 86.2%
Goal 90% 90% 90%Source: Miami-Dade Transit, as of March 2010
Another measure of service reliability is the measure of the average distance between servicedisruptions (rail) or breakdowns (busses). Disruptions are described as five minutes or moreimpact to the customer. The following table presents the average number of miles for abreakdown according to MDT transit mode.
Table 4-13: Mean Distance between Failures by ModeMetrobus Metrorail Metromover
FY 08/09 3,951 45,475 6,359FYTD 09/10 4,857 41,660 8,557
Goal 4,000 39,000 6,000Source: Miami-Dade Transit, as of March 2010


Annual Update5.0 - Operating Service Improvements and Adjustments
T R A N S I T D E V E L O P M E N T P L A N F Y 2 0 1 1 - 2 0 2 05-1
5.0 Operating Service Improvements and Adjustments
For the FY 2010 – 2019 TDP Major Update a listing of committed bus service improvementsand adjustments planned for 2009 were included. A consistency analysis of these committedimprovements is being performed for this TDP Annual update to assess and measure MDT’sadherence for implementation.
The results of the consistency analysis for improvements implemented between January andDecember 2009 is presented in Table 5-1. Each of the service changes are identified accordingto whether it was a programmed commitment of the FY 2010 – 2019 TDP Major Update asindicated with a check mark or an additional change not included in the TDP Major Update asmarked by an asterisk.
Between January and December of 2009, a total of 198 bus service improvements andadjustments were implemented by MDT. This includes the implementation of 50 additionalimprovements not planned in last year’s TDP Major Update. The FY 2010 – 2019 TDP MajorUpdate planned 167 committed bus service improvements and adjustments with 149 beingimplemented in 2009 resulting in an 89 percent level of consistency.
Table 5-1: 2009 TDP Consistency Analysis SummaryJANUARY to DECEMBER 2009
Route Description Improvement / Adjustment Start Date 2009 TDPConsistency
Implemented service change committed to in previous TDP* Implemented service change not included in previous TDP
A Miami Beach to Omni Terminalvia Venetian Causeway
Adjust headway after 7pmfrom 20 to 40 minutes
June 14,2009
A Miami Beach to Omni Terminalvia Venetian Causeway
Discontinue select lowridership trips
December13, 2009 *
B Key Biscayne to Brickell stationvia Rickenbacker Causeway
Discontinue segment fromBrickell station to CBD
June 14,2009
EDiplomat Mall to GoldenGlades via 163 Street Mall andAventura Mall
Adjust weekend headway from45 to 60 minutes
June 14,2009
EDiplomat Mall to GoldenGlades via 163 Street Mall andAventura Mall
Extend from Aventura Mall toTurnberry & Hallandale Beach
December13, 2009
EDiplomat Mall to GoldenGlades via 163 Street Mall andAventura Mall
Restructure to serveHallandale Beach Boulevardfrom the combined segmentsof discontinued Route 28
December13, 2009
EDiplomat Mall to GoldenGlades via 163 Street Mall andAventura Mall
Improve midday headway from60 to 40 minutes
December13, 2009 *

T R A N S I T D E V E L O P M E N T P L A N F Y 2 0 1 1 - 2 0 2 05-2
Annual Update5.0 - Operating Service Improvements and Adjustments
Table 5-1: 2009 TDP Consistency Analysis Summary (continued)JANUARY to DECEMBER 2009
Route Description Improvement / Adjustment Start Date 2009 TDPConsistency
Implemented service change committed to in previous TDP* Implemented service change not included in previous TDPG Opa-locka to Miami Beach via
NW 22 Avenue, NW 125 Streetand Broad Causeway andCollins Avenue
Adjust weekend headway from30 to 40 minutes
June 14,2009
G Opa-locka to Surfside via NW22 Avenue, NW 125 Street andBroad Causeway
Discontinue segment onCollins Avenue and extendsegment in Bunche Park toserve the North Dade HealthCenter
December13, 2009
H North Miami Beach to MiamiBeach via NE 163 Street andCollins Avenue
Realign southbound trips at163 Street Mall
June 14,2009
H North Miami Beach to MiamiBeach via NE 163 Street andCollins Avenue
Adjust Saturday headway from20 to 30 minutes
June 14,2009
H North Miami Beach to MiamiBeach via NE 163 Street andCollins Avenue
Discontinue segment from 72Street to South Beach andAlton Road
December13, 2009
H North Miami Beach to MiamiBeach via NE 163 Street andCollins Avenue
Adjust peak headway from 20to 24 minutes
December13, 2009
H North Miami Beach to MiamiBeach via NE 163 Street andCollins Avenue
Adjust midday headway from20 to 24 minutes
December13, 2009
J Miami International Airport toMiami Beach via 36 Street
Adjust Saturday headway from20 to 30 minutes
December13, 2009
J Miami International Airport toMiami Beach via 36 Street
Discontinue segment fromMiami International Airport intoCoral Gables
December13, 2009
J Miami International Airport toMiami Beach via 36 Street
Adjust peak headway from 15to 20 minutes
December13, 2009
K Diplomat Mall to CBD viaCollins Avenue and MacArthurCauseway
Adjust daily headway from 20to 30 minutes
June 14,2009
K Diplomat Mall to CBD viaCollins Avenue and MacArthurCauseway
Discontinue route and mergewith the Route R into newRoute 115 (Mid-North BeachConnection) and Route E intoHallandale Beach
December13, 2009
L Miami Beach to Hialeah viaCollins Avenue, 79 StreetCauseway and 79 Street
Adjust weekday running timesto improve schedule reliability
June 14,2009

Annual Update5.0 - Operating Service Improvements and Adjustments
T R A N S I T D E V E L O P M E N T P L A N F Y 2 0 1 1 - 2 0 2 05-3
Table 5-1: 2009 TDP Consistency Analysis Summary (continued)JANUARY to DECEMBER 2009
Route Description Improvement / Adjustment Start Date 2009 TDPConsistency
Implemented service change committed to in previous TDP* Implemented service change not included in previous TDPL Miami Beach to Hialeah via
Collins Avenue, 79 StreetCauseway and 79 Street
Adjust peak headway from 10to 12 minutes
June 14,2009
M Civic Center to Miami Beachvia Omni Terminal, MacArthurCauseway and Mt. SinaiHospital
Discontinue loop south of 5thStreet on Miami Beach
June 14,2009
M Civic Center to Miami Beachvia Omni Terminal, MacArthurCauseway and Mt. SinaiHospital
Adjust peak headway from 30to 45 minutes
June 14,2009
M Civic Center to Miami Beachvia Omni Terminal, MacArthurCauseway and Mt. SinaiHospital
Adjust midday headway from45 to 60 minutes
June 14,2009
M Civic Center to Miami Beachvia Omni Terminal, MacArthurCauseway and Mt. SinaiHospital
Restore segment between 5Street and South Pointe Drive.Discontinue segment betweenNW 19 Avenue and NW 22Court
December13, 2009
R Surfside to south Miami Beach Discontinue route and mergewith Route K into new Route115 Mid-North BeachConnection
December13, 2009
S Aventura Mall to CBD viaMiami Beach
Improve Sunday headwayfrom 20 to 15 minutes
December13, 2009
1 South Miami Heights, Perrine,West Goulds and Cutler Bay
Adjust peak headway from 30to 40 minutes
June 14,2009
1 South Miami Heights, Perrine,West Goulds and Cutler Bay
Adjust weekend headway from40 to 60 minutes
June 14,2009
1 South Miami Heights, Perrine,West Goulds and Cutler Bay
Discontinue segment from SW168 Street to Dadeland Southstation
December13, 2009
1 South Miami Heights, Perrine,West Goulds and Cutler Bay
Improve peak headway from40 to 30 minutes
December13, 2009
1 South Miami Heights, Perrine,West Goulds and Cutler Bay
Improve weekend headwayfrom 60 to 40 minutes
December13, 2009
3 Aventura Mall to CBD via 163Street Mall and BiscayneBoulevard
Discontinue Hallandale BeachBoulevard segment on somelate evening trips
June 14,2009
3 Aventura Mall to CBD via 163Street Mall and BiscayneBoulevard
Improve Saturday headwayfrom 20 to 15 minutes
December13, 2009

T R A N S I T D E V E L O P M E N T P L A N F Y 2 0 1 1 - 2 0 2 05-4
Annual Update5.0 - Operating Service Improvements and Adjustments
Table 5-1: 2009 TDP Consistency Analysis Summary (continued)JANUARY to DECEMBER 2009
Route Description Improvement / Adjustment Start Date 2009 TDPConsistency
Implemented service change committed to in previous TDP* Implemented service change not included in previous TDP3 Aventura Mall to CBD via 163
Street Mall and BiscayneBoulevard
Discontinue Hallandale BeachBoulevard segment
December13, 2009
3 Aventura Mall to CBD via 163Street Mall and BiscayneBoulevard
Improve Sunday headwayfrom 24 to 20 minutes
December13, 2009
7 Dolphin Mall to downtownMiami via Miami InternationalMall, Fontainebleau, NW 7Street and Little Havana
Discontinue LeJeune segmentservice to Miami InternationalAirport and Miami Springs
June 14,2009
8 FIU University Park Campus toCBD via Westchester, SW 8Street and Little Havana
Reduce service west of SW 57Avenue to Westchester
December13, 2009
*
9 Aventura Mall to CBD via 163Street Mall and NE 2 Avenue
Realign route exiting AventuraMall
June 14,2009
*
10 Skylake Mall to CBD via NE 2Avenue
Realign route in the Omni area June 14,2009
*
10 Skylake Mall to CBD via NE 2Avenue
Extend from 163 Street Mall toSkylake Mall
December13, 2009
12 Northside station to MercyHospital via Liberty City,Allapattah, Civic Center, LittleHavana and Coconut Grove
Adjust weekend headway from30 to 40 minutes
June 14,2009
16 163 Street Mall to Omni via NE16 Avenue, NE 125 Street andBiscayne Boulevard
Discontinue segment fromOmni to CBD
December13, 2009
16 163 Street Mall to Omni via NE16 Avenue, NE 125 Street andBiscayne Boulevard
Improve peak headway from20 to 18 minutes
December13, 2009
16 163 Street Mall to Omni via NE16 Avenue, NE 125 Street andBiscayne Boulevard
Adjust midday headway from20 to 30 minutes
December13, 2009
*
16 163 Street Mall to Omni via NE16 Avenue, NE 125 Street andBiscayne Boulevard
Improve Saturday headwayfrom 30 to 24 minutes
December13, 2009
19 163 Street Mall to MDC NorthCampus via 119 Street andWest Dixie Highway
New route from discontinuedsegment of Route 75
December13, 2009
*
21
Northside station to CBD viaNorthside, Liberty City,Allapattah, Civic Center andOvertown
Discontinue segment north of79th Street
June 14,2009

Annual Update5.0 - Operating Service Improvements and Adjustments
T R A N S I T D E V E L O P M E N T P L A N F Y 2 0 1 1 - 2 0 2 05-5
Table 5-1: 2009 TDP Consistency Analysis Summary (continued)JANUARY to DECEMBER 2009
Route Description Improvement / Adjustment Start Date 2009 TDPConsistency
Implemented service change committed to in previous TDP* Implemented service change not included in previous TDP
21
Northside station to CBD viaNorthside, Liberty City,Allapattah, Civic Center andOvertown
Adjust weekend headway from30 to 40 minutes
June 14,2009
22
163 Street Mall to CoconutGrove station via GoldenGlades, NW 22 Avenue andCoconut Grove
Weekend scheduleadjustments to improvereliability
June 14,2009
22
163 Street Mall to CoconutGrove station via GoldenGlades, NW 22 Avenue andCoconut Grove
Discontinue HealthDistrict/Civic Center segmentvia NW 20 Street
December13, 2009
22
163 Street Mall to CoconutGrove station via GoldenGlades, NW 22 Avenue andCoconut Grove
Adjust midday headway from30 to 60 minutes south ofFlagler Street
December13, 2009 *
24 West Miami-Dade to CBD viaCoral Way and Brickell Avenue
Adjust weekend alignmentwest of Westchester to providehourly service to FIU and SW137th Avenue
June 14,2009
24 West Miami-Dade to CBD viaCoral Way and Brickell Avenue
Merge with Route 224 (CoralWay MAX) and extendwestward to SW 152 Avenuebut discontinue service toDouglas Road station
December13, 2009
28FIU Biscayne Bay Campus toHialeah Station via 135th Streetand East 4th Avenue
Adjust midday headway from40 to 60 minutes
June 14,2009
28FIU Biscayne Bay Campus toHialeah Station via 135th Streetand East 4th Avenue
Discontinue route and mergewith Route E into new Route135
December13, 2009
29 Miami Lakes Technical Schoolto Hialeah
Adjust peak headway from 30to 45 minutes
June 14,2009
31 (BuswayLocal)
Cutler Bay to Dadeland Southstation via the Busway
Adjust peak headway from 15to 20 minutes
June 14,2009
31 (BuswayLocal)
Cutler Bay to Dadeland Southstation via the Busway
Realign northbound serviceonto SW 211th Street
June 14,2009 *
31 (BuswayLocal)
Cutler Bay to Dadeland Southstation via the Busway
Improve peak headway from20 to 15 minutes
December13, 2009

T R A N S I T D E V E L O P M E N T P L A N F Y 2 0 1 1 - 2 0 2 05-6
Annual Update5.0 - Operating Service Improvements and Adjustments
Table 5-1: 2009 TDP Consistency Analysis Summary (continued)JANUARY to DECEMBER 2009
Route Description Improvement / Adjustment Start Date 2009 TDPConsistency
Implemented service change committed to in previous TDP* Implemented service change not included in previous TDP
32Carol City to Omni via Opa-locka, Northside, Liberty Cityand Civic Center
Adjust weekday eveningservice to 60 minutes after7pm and discontinueweekday/weekend lowridership evening trips
December13, 2009
33Hialeah Gardens to MiamiShores via 103rd Street (49 St)and 95th Street
Discontinue select eastboundmorning and afternoon tripsand westbound afternoon trips
June 14,2009 *
33Hialeah Gardens to MiamiShores via 103rd Street (49 St)and 95th Street
Adjust midday headway from30 to 35 minutes
June 14,2009
35 MDC Kendall Campus toFlorida City via US-1
Adjust weekend headway to30 to 60 minutes
June 14,2009
35 MDC Kendall Campus toFlorida City via US-1
Realign service in the Naranjaarea
December13, 2009 *
36
Dolphin Mall to BiscayneBoulevard via Koger OfficePark, Miami Springs and 36Street
Merge with Route 41 into aneast/west crosstown route
June 14,2009
36
Dolphin Mall to BiscayneBoulevard via Koger OfficePark, Miami Springs and 36Street
Discontinue select lowridership trips
December13, 2009 *
37Hialeah to South Miami stationvia Palm Avenue and DouglasRoad
Discontinue later eveningsouthbound trips
June 14,2009
38 (BuswayMAX)
Dadeland South station toFlorida City via Busway
Improve peak northboundheadway to 12 minutes
December13, 2009
40 West Miami-Dade to DouglasRoad station via Bird Road
Adjust peak headway from 20to 24 minutes
June 14,2009
40 West Miami-Dade to DouglasRoad station via Bird Road Discontinue later evening trips June 14,
2009
40 West Miami-Dade to DouglasRoad station via Bird Road
Adjust weekend headway from30 to 60 minutes. DiscontinueUniversity Lakes Trailer Parksegment on the weekends
June 14,2009
40 West Miami-Dade to DouglasRoad station via Bird Road
Merge with Route 240 (BirdRoad MAX) and extendwestward to SW 152 Avenue
December13, 2009
40 West Miami-Dade to DouglasRoad station via Bird Road
Improve peak headway from24 to 15 minutes
December13, 2009

Annual Update5.0 - Operating Service Improvements and Adjustments
T R A N S I T D E V E L O P M E N T P L A N F Y 2 0 1 1 - 2 0 2 05-7
Table 5-1: 2009 TDP Consistency Analysis Summary (continued)JANUARY to DECEMBER 2009
Route Description Improvement / Adjustment Start Date 2009 TDPConsistency
Implemented service change committed to in previous TDP* Implemented service change not included in previous TDP
41
Allapattah station to MiamiInternational and Dolphin Mallsvia NW 36/41 Street and NW107 Avenue
Discontinue route and mergeinto Route 36
June 14,2009 *
42 Opa-locka to Douglas Roadstation via LeJeune Road
Adjust Saturday headway from40 to 60 minutes
June 14,2009
42Opa-locka to Douglas Roadstation via LeJeune Road andMiami Springs
Restructure to serve Opa-locka Tri-Rail station andMiami Springs Circle
December13, 2009
42Opa-locka to Douglas Roadstation via LeJeune Road andMiami Springs
Improve peak headway from30 to 15 minutes south of NW36 Street
December13, 2009
42Opa-locka to Douglas Roadstation via LeJeune Road andMiami Springs
Improve midday headway from60 to 30 minutes south of NW36 Street
December13, 2009
42Opa-locka to Douglas Roadstation via LeJeune Road andMiami Springs
Improve Saturday headwayfrom 60 to 30 minutes
December13, 2009
42Opa-locka to Douglas Roadstation via LeJeune Road andMiami Springs
Improve Sunday headwayfrom 60 to 30 minutes
December13, 2009
46
Caleb Center to NW 7Avenue/NW 62 Street via NW46 Street, NW 54 Street andNW 10 Avenue
Adjust peak headway from 30to 40 minutes
June 14,2009
46
Caleb Center to NW 7Avenue/NW 62 Street via NW46 Street, NW 54 Street andNW 10 Avenue
Discontinue select lowridership trips
December13, 2009 *
48Brickell station to Universitystation via South BayshoreDrive and Coral Gables
Adjust peak headway from 40to 60 minutes
June 14,2009
48Brickell station to Universitystation via South BayshoreDrive and Coral Gables
Discontinue select lowridership trips
December13, 2009 *
49Golden Glades to Carol Cityand Miami Gardens via NW175 Street and NW 183 Street
New route replacing Carol Cityfeeder segment of Route 95
December13, 2009 *
51 (FlaglerMAX)
CBD to West Miami-Dade viaWest Flagler Street
Discontinue segment fromCBD to Omni
December13, 2009

T R A N S I T D E V E L O P M E N T P L A N F Y 2 0 1 1 - 2 0 2 05-8
Annual Update5.0 - Operating Service Improvements and Adjustments
Table 5-1: 2009 TDP Consistency Analysis Summary (continued)JANUARY to DECEMBER 2009
Route Description Improvement / Adjustment Start Date 2009 TDPConsistency
Implemented service change committed to in previous TDP* Implemented service change not included in previous TDP
52
Dadeland North station toCutler Bay via South Miami,Busway, Perrine and RichmondHeights
Discontinue segment fromDadeland North station toSouth Miami station
December13, 2009
52
Dadeland North station toCutler Bay via South Miami,Busway, Perrine and RichmondHeights
Discontinue SW 112 Avenueand Quail Roost segments
December13, 2009 *
54 Hialeah to Liberty City via 54thStreet
Adjust peak headway from 20to 24 minutes
June 14,2009
54 Hialeah to Liberty City via 54thStreet
Adjust Sunday early morningand early evening headwayfrom 30 to 60 minutes
June 14,2009
54 Miami Lakes to Liberty City via54th Street
Merge with Route 282 (HialeahGardens Connection)operating to Miami Lakesduring the weekdays only
December13, 2009
56
Miami Children's Hospital toKendall via Coral Gables, MillerRoad and MDC KendallCampus
Adjust midday headway from30 to 60 minutes
June 14,2009
56
Miami Children's Hospital toKendall via Coral Gables, MillerRoad and MDC KendallCampus
Discontinue MDC KendallCampus segment during themiddays
June 14,2009
56
Miami Children's Hospital toKendall via Coral Gables, MillerRoad and MDC KendallCampus
Discontinue select lowridership trips
December13, 2009
57 Miami International Airport toPinecrest via 57th Avenue
Discontinue eveningnorthbound trip
December13, 2009
59 Golden Glades to Aventura New route replacing Aventurafeeder segment of Route 95
December13, 2009 *
62 Hialeah to Omni via NW/NE 62Street and Biscayne Boulevard
Adjust Sunday headway from20 to 30 minutes
June 14,2009
62 Hialeah to Biscayne Boulevardvia NW/NE 62 Street
Discontinue segment onBiscayne Boulevard
December13, 2009
62 Hialeah to Biscayne Boulevardvia NW/NE 62 Street
Reduce Miami Beach trips tofour per peak
December13, 2009
65 Coconut Grove to Pinecrest viaBusway and Old Cutler Road
Adjust peak headway from 30to 45 minutes
June 14,2009

Annual Update5.0 - Operating Service Improvements and Adjustments
T R A N S I T D E V E L O P M E N T P L A N F Y 2 0 1 1 - 2 0 2 05-9
Table 5-1: 2009 TDP Consistency Analysis Summary (continued)JANUARY to DECEMBER 2009
Route Description Improvement / Adjustment Start Date 2009 TDPConsistency
Implemented service change committed to in previous TDP* Implemented service change not included in previous TDP
65 Coconut Grove to Pinecrest viaBusway and Old Cutler Road
Discontinue route and mergewith Route 136
December13, 2009
70Cutler Bay to Florida City viaNaranja, Goulds, Princeton andHomestead
Adjust midday headway from30 to 60 minutes
June 14,2009
71 Dolphin Mall to MDC KendallCampus via 107 Avenue
Adjust midday headway from40 to 60 minutes
June 14,2009
71 Dolphin Mall to MDC KendallCampus via 107 Avenue
Adjust Saturday headway from40 to 60 minutes
June 14,2009
71Dolphin Mall to MDC KendallCampus via 107 Avenue andSweetwater
Merge with Route 212(Sweetwater Circulator)
December13, 2009
71Dolphin Mall to MDC KendallCampus via 107 Avenue andSweetwater
Discontinue select lowridership trips
December13, 2009 *
72 South Miami station to Kendallvia Sunset Drive
Adjust weekend headway from30 to 60 minutes
June 14,2009
72 South Miami station to Kendallvia Sunset Drive
Discontinue Miller Squarebranch on the weekends butrealigned to serve SW 137Avenue and a portion of MillerRoad
June 14,2009 *
73Miami Lakes to DadelandSouth station via Milam DairyRoad and Ludlam Road
Adjust midday headway from30 to 40 minutes
June 14,2009
73Miami Lakes to DadelandSouth station via Milam DairyRoad and Ludlam Road
Adjust Saturday headway from40 to 60 minutes
June 14,2009
73Miami Lakes to DadelandSouth station via Milam DairyRoad and Ludlam Road
Merge with Route 267 MAX December13, 2009
75
Miami Lakes Tech to FIUBiscayne Bay Campus via 175Street, Norwood and NE163/167 Street
Discontinue Sunday eveningservice after 7pm
June 14,2009
75
Miami Lakes Tech to FIUBiscayne Bay Campus via 175Street, Norwood and NE163/167 Street
Discontinue segment to MDCNorth Campus
December13, 2009
77 Norwood to CBD via NW 7thAvenue
Truncate alternate trips atGolden Glades. Service toNorwood would be every othertrip.
June 14,2010

T R A N S I T D E V E L O P M E N T P L A N F Y 2 0 1 1 - 2 0 2 05-10
Annual Update5.0 - Operating Service Improvements and Adjustments
Table 5-1: 2009 TDP Consistency Analysis Summary (continued)JANUARY to DECEMBER 2009
Route Description Improvement / Adjustment Start Date 2009 TDPConsistency
Implemented service change committed to in previous TDP* Implemented service change not included in previous TDP
79 (79Street MAX)
Miami Beach to Northsidestation via NE/NW 79 Streetand 71st Street Causeway
New route providing weekdaypeak period only limited-stopservice
June 14,2009
83 Miami Lakes to 163 Street Mallvia Miami Gardens Drive
Discontinue route and mergewith Route 183 MAX into anew Route 183 Local
December13, 2009
87 Palmetto station to DadelandNorth station via 87 Avenue
Adjust Sunday headway from40 to 60 minutes
June 14,2009
87 Palmetto station to DadelandNorth station via 87 Avenue
Adjust midday headway from40 to 45 minutes
December13, 2009 *
87 Palmetto station to DadelandNorth station via 87 Avenue
Adjust Saturday headway from40 to 45 minutes
December13, 2009 *
88 Dadeland North station toKendall via Kendall Drive Discontinue overnight service June 14,
2009
88 Dadeland North station toKendall via Kendall Drive
Implement several weekdayschedule modifications
December13, 2009 *
88 Dadeland North station toKendall via Kendall Drive
Adjust Saturday headway from20 to 24 min
December13, 2009
91Miami Lakes to 163 Street Mallvia Carol City, California Cluband North Miami Beach
Adjust peak headway from 30to 45 minutes
June 14,2009
91Miami Lakes to 163 Street Mallvia Carol City, California Cluband North Miami Beach
Discontinue entire route andmerge with Route 99
December13, 2009
93(Biscayne
MAX)
Aventura Mall to CBD viaBiscayne Boulevard
Adjust peak headway from 15to 18 minutes
December13, 2009
95 ExpressDowntown Miami, GoldenGlades, Civic Center, CarolCity, Aventura, West Dade
Discontinue segment fromMiami Avenue to GoldenGlades via NW 199 Street, NW7 Avenue and NW 2 Avenue
June 14,2009
95 ExpressDowntown Miami, GoldenGlades, Civic Center, CarolCity, Aventura, West Dade
Discontinue select lowridership trips
June 14,2009
95 Express Downtown Miami, GoldenGlades, Civic Center
Discontinue feeder segmentsto Carol City and Aventura andreplace those segments withnew Routes 49 and 59
December13, 2009
Route 97(27 Avenue
MAX)
Carol City to Dr. Martin LutherKing, Jr. station via NW 27Avenue
Adjust midday headway from30 to 40 minutes
June 14,2009

Annual Update5.0 - Operating Service Improvements and Adjustments
T R A N S I T D E V E L O P M E N T P L A N F Y 2 0 1 1 - 2 0 2 05-11
Table 5-1: 2009 TDP Consistency Analysis Summary (continued)JANUARY to DECEMBER 2009
Route Description Improvement / Adjustment Start Date 2009 TDPConsistency
Implemented service change committed to in previous TDP* Implemented service change not included in previous TDP
99Miami Gardens to AventuraMall via Carol City, CaliforniaClub and North Miami Beach
Adjust peak headway from 40to 45 minutes
June 14,2009 *
99Miami Gardens to AventuraMall via Carol City, CaliforniaClub and North Miami Beach
Adjust midday headway from30 to 60 minutes
June 14,2009
99Miami Lakes to Aventura Mallvia Carol City, California Cluband North Miami Beach
Merge with Route 91 andimprove weekday headway to30 minutes and weekendheadway to 40 minutes
December13, 2009
99Miami Lakes to Aventura Mallvia Carol City, California Cluband North Miami Beach
Improve daily headway to 30minutes east of NW 47 Avenue
December13, 2009 *
99Miami Lakes to Aventura Mallvia Carol City, California Cluband North Miami Beach
Improve weekend headway to40 minutes
December13, 2009 *
104 Dadeland North station toKendall via SW 104 Street
Adjust midday headway from30 to 60 minutes
June 14,2009
104 Dadeland North station toKendall via SW 104 Street
Adjust weekend headway from30 to 60 minutes
June 14,2009
104 Dadeland North station toKendall via SW 104 Street
Discontinue select lowridership trips
December13, 2009 *
115 (Mid-NorthBeach
Connection)
Miami BeachNew route serving middleMiami Beach fromdiscontinued Routes K and R
December13, 2009 *
120(BeachMAX)
Aventura to CBD via MiamiBeach and Omni Terminal
Extend to Aventura Mall andrealign to serve downtownMiami via MacArthurCauseway
December13, 2009
120 (BeachMAX)
Aventura to CBD via MiamiBeach and Omni Terminal
Improve daily headway to 12minutes south of Haulover andto 24 minutes north toAventura
December13, 2009
120 (BeachMAX)
Aventura to CBD via MiamiBeach and Omni Terminal
Improve Saturday headway to15 minutes south of Hauloverand to 30 minutes north toAventura
December13, 2009
123 (SouthBeachLocal)
Miami Beach Extend to serve Belle Isle andCollins Park
June 14,2009

T R A N S I T D E V E L O P M E N T P L A N F Y 2 0 1 1 - 2 0 2 05-12
Annual Update5.0 - Operating Service Improvements and Adjustments
Table 5-1: 2009 TDP Consistency Analysis Summary (continued)JANUARY to DECEMBER 2009
Route Description Improvement / Adjustment Start Date 2009 TDPConsistency
Implemented service change committed to in previous TDP* Implemented service change not included in previous TDP
123 (SouthBeachLocal)
Miami Beach Adjust daily headway from 10to 12 minutes
June 14,2009 *
123 (SouthBeachLocal)
Miami BeachAdjust early am weekday,Saturday and Sunday eveningheadways to 20 minutes
June 14,2009 *
123 (SouthBeachLocal)
Miami Beach Discontinue select stops inSouth Beach
June 14,2009 *
135Miami Lakes to FIU BiscayneBay Campus via 135 Street,Opa-locka
New route providing hourlyservice 7 days a weekreplacing the Routes 28 and aportion of Route E
December13, 2009
136 SW 147 Avenue to DadelandSouth station via Busway
Extend to serve INS Buildingat SW 120 Street and SW 147Avenue
June 14,2009
136 SW 147 Avenue to DadelandSouth station via Busway
Minor weekday scheduleadjustments to improveschedule reliability
June 14,2009 *
136SW 147 Avenue to DouglasRoad station via SW 120/136Streets and Old Cutler Road
Merge with Route 65 December13, 2009
137 Dolphin Mall to Cutler Bay viaSW 137 Avenue
Adjust midday headway from30 to 45 minutes
June 14,2009
137 Dolphin Mall to Cutler Bay viaSW 137 Avenue
Extended to University LakesTrailer Park on weekends
June 14,2009 *
150 (AirportFlyer)
Miami International Airport toMiami Beach via EarlingtonHeights station, SR-112/I-195and Collins Avenue
New express bus service fromMiami International Airport toMiami Beach
December13, 2009 *
183 (183Street MAX)
Golden Glades Park/Ride Lotto Central Miami via NW 7Avenue
Discontinue Aventura Mall toFIU Biscayne Bay Campussegment
June 14,2009
183 Miami Lakes to Aventura Mallvia Miami Gardens Drive
New route from combinedRoutes 83 and 183 MAX
December13, 2009
202 (LittleHaiti
Connection)
Edison/Little River to MiamiDesign District via NE 2Avenue
Adjust peak headway from 30to 40 minutes
June 14,2009
202 (LittleHaiti
Connection)
Edison/Little River to MiamiDesign District via NE 2Avenue
Discontinue evening serviceafter 7pm
June 14,2009

Annual Update5.0 - Operating Service Improvements and Adjustments
T R A N S I T D E V E L O P M E N T P L A N F Y 2 0 1 1 - 2 0 2 05-13
Table 5-1: 2009 TDP Consistency Analysis Summary (continued)JANUARY to DECEMBER 2009
Route Description Improvement / Adjustment Start Date 2009 TDPConsistency
Implemented service change committed to in previous TDP* Implemented service change not included in previous TDP
202 (LittleHaiti
Connection)
Edison/Little River to MiamiDesign District via NE 2Avenue
Discontinue segment east ofMiami Avenue to the INSbuilding
December13, 2009
202 (LittleHaiti
Connection)
Edison/Little River to MiamiDesign District via NE 2Avenue
Adjust daily headway from 40to 60 minutes
December13, 2009 *
211(OvertownCirculator)
Overtown to downtown Miami Discontinue Saturday service December13, 2009 *
212(SweetwaterCirculator)
Sweetwater Discontinue weekday peakand weekend service
December13, 2009 *
224 (CoralWay MAX)
Douglas Road station to WestMiami-Dade via Coral Way
Discontinue route and mergewith Route 24
December13, 2009
238 (East-West
Connection)
Earlington Heights station toDolphin Mall via MiamiInternational Airport, BlueLagoon, Airport West andMiami International Mall
Extend alignment into AirportCorporate Center
June 14,2009
238 (East-West
Connection)
Earlington Heights station toDolphin Mall via MiamiInternational Airport, BlueLagoon, Airport West andMiami International Mall
Adjust peak headway from 30to 45 minutes
June 14,2009
238 (East-West
Connection)
Earlington Heights station toDolphin Mall via MiamiInternational Airport, BlueLagoon, Airport West andMiami International Mall
Discontinue select lowridership trips
December13, 2009
240 (BirdRoad MAX)
Dadeland North station to WestMiami-Dade via Bird Road
Discontinue route and mergewith Route 40
December13, 2009 *
243(Seaport
Connection)
Downtown Miami to Port ofMiami
Adjust peak headway from 20to 30 minutes
June 14,2009
243(Seaport
Connection)
Downtown Miami to Port ofMiami
Discontinue Flagler Street andBiscayne Boulevard alignmentand realign to serve Metrorailvia Historic Overtown/LyricTheatre station
June 14,2009
243(Seaport
Connection)
Downtown Miami to Port ofMiami
Discontinue select lowridership trips
December13, 2009 *

T R A N S I T D E V E L O P M E N T P L A N F Y 2 0 1 1 - 2 0 2 05-14
Annual Update5.0 - Operating Service Improvements and Adjustments
Table 5-1: 2009 TDP Consistency Analysis Summary (continued)JANUARY to DECEMBER 2009
Route Description Improvement / Adjustment Start Date 2009 TDPConsistency
Implemented service change committed to in previous TDP* Implemented service change not included in previous TDP
246 (NightOwl)
Downtown Miami, Civic Center,Opa-locka and North MiamiBeach
Discontinue Miami Beachsegment from downtownMiami to 163 Street Mall
June 14,2009
248 (BrickellKey Shuttle)
Brickell Avenue to Brickell KeyIsland
Adjust peak headway from 15to 20 minutes
June 14,2009
249(Coconut
GroveCirculator)
Coconut Grove station toDouglas Road station via SW27 Avenue, Grand Avenue andSW 37 Avenue
Discontinue Jefferson Streetsegment
June 14,2009
249(Coconut
GroveCirculator)
Coconut Grove station toDouglas Road station via SW27 Avenue, Grand Avenue andSW 37 Avenue
Adjust daily headway from 15to 18 minutes
June 14,2009
249(Coconut
GroveCirculator)
Coconut Grove station toDouglas Road station via SW27 Avenue, Grand Avenue andSW 37 Avenue
Discontinue weekday lastround trip, and Saturday firstround trip
June 14,2009
252 (CoralReef MAX)
Dadeland South station toCountry Walk via Coral ReefDrive
Adjust midday headway from30 to 60 minutes
June 14,2009
254(BrownsvilleCirculator)
Brownsville to Caleb Center viaBrownsville station
Discontinue last trip fromCaleb Center
June 14,2009
267 (267MAX)
Golf Club of Miami toOkeechobee station via LudlamRoad/West 12 Avenue
Adjust peak headway from 20to 30 minutes
June 14,2009
267 (267MAX)
Golf Club of Miami toOkeechobee station via LudlamRoad/West 12 Avenue
Discontinue route and mergeinto Route 73
December13, 2009
272 (SunsetKAT)
Kendall to Dadeland Northstation via Sunset Drive
Adjust peak headway from 9 to10 minutes
June 14,2009
272 (SunsetKAT)
Kendall to Dadeland Northstation via Sunset Drive
Adjust peak headway to 12minutes after 7:30am and to15 minutes after 8:15am
December13, 2009 *
277 (7AvenueMAX)
Golden Glades to CBD via NW7 Avenue
Discontinue select lowridership trips
December13, 2009
282(HialeahGardens
Connection)
Miami Lakes to HialeahGardens to Palmetto Metrorailstation via NW 82 and NW 87Avenues
Minor schedule adjustments toimprove schedule reliability
June 14,2009

Annual Update5.0 - Operating Service Improvements and Adjustments
T R A N S I T D E V E L O P M E N T P L A N F Y 2 0 1 1 - 2 0 2 05-15
Table 5-1: 2009 TDP Consistency Analysis Summary (continued)JANUARY to DECEMBER 2009
Route Description Improvement / Adjustment Start Date 2009 TDPConsistency
Implemented service change committed to in previous TDP* Implemented service change not included in previous TDP
282(HialeahGardens
Connection)
Miami Lakes to HialeahGardens to Palmetto Metrorailstation via NW 82 and NW 87Avenues
Discontinue route and mergewith Route 54
December13, 2009
286 (NorthPointe
Circulator)
Miami Lakes and Palm SpringsNorth
New route operating during theweekdays only every 24minutes during the peak and48 minutes during the middays
December13, 2009 *
287 (SagaBay MAX)
CHI Health Center to DadelandSouth station via Saga Bay,SW 87 Avenue and Busway
Discontinue select lowridership trips
December13, 2009
288(Kendall
KAT)
Kendall to Dadeland Northstation via Kendall Drive
Discontinue select lowridership trips
December13, 2009
344 Homestead and Florida City Adjust peak headway from 30to 60 minutes
June 14,2009
344 Homestead and Florida City Discontinue select lowridership trips
December13, 2009 *
Source: Miami-Dade Transit, 2010


Annual Update6.0 - FY 2010 Committed Transit Improvements
T R A N S I T D E V E L O P M E N T P L A N F Y 2 0 1 1 - 2 0 2 06-1
6.0 FY 2010 Committed Transit Improvements
This section presents transit improvement projects that are committed for the MDT transitsystem for the next year or FY 2010. The committed transit improvement initiatives areprovided for capital, service, and infrastructure.
6.1 Capital Improvement Plan – Committed Transit ImprovementInitiatives
On an annual basis MDT prepares a proposed capital budget (FY 2009 – 2010) and multi-yearCapital Plan that outlays specific projects related to the expansion and improvement of MDTexisting services. Table 6-1 presents the proposed capital budget for the next fiscal year.
Please note that the following capital improvement table will be updated once MDT finalizes theproposed capital budget for FY 2010 – 2011.
6.1.1 Orange Line Phase 1 MIC-Earlington Heights Connector
The 2.4-mile Miami Intermodal Center (MIC)/Earlington Heights proposed extension is set toextend from the MIC to the existing Earlington Heights Metrorail station. Included in the projectis a new Metrorail station located at the MIC to serve as a multimodal transfer hub for Metrobus,Metrorail, Tri-Rail, future expansion of Amtrak, rental car facilities, and other chartered servicessuch as intercity bus line. Connection to Miami International Airport (MIA) will be made possiblefrom the MIC with the MIC-MIA Connector-People Mover Project.
This project is under construction and anticipated to open for service in May 2012. The totalestimated project cost is $526.5 million.
6.1.2 Orange Line Phase 2 and Phase 3 (North Corridor and East-West Corridor)
Miami-Dade Transit continues to pursue incremental and affordable transit improvements alongthe North and East/West Corridors until heavy rail funding options are identified. Until then, theCounty is moving forward with incremental transit improvements along these corridors; with theNW 27th Avenue Rapid Bus, and the SR 836 Express Bus. These projects will serve thepurpose while continuing to build the ridership for a future Bus Rapid Transit and possibly heavyrail project for the corridors in the far future.
As part of the MPO’s Near Term Improvements Study, MDT is participating with various othercounty and state representatives in studying the proposed “Enhanced Bus Service” projects asincremental improvements to both corridors. For the North Corridor, a 27th Avenue EnhancedBus Service project is being planned also identifying park/ride locations on NW 27th Avenue atthe county line and Miami-Dade College’s North Campus. On the East-West Corridor,Enhanced Bus Service is proposed along West Flagler Street in addition to Express BusService along SR-836 (Dolphin Expressway) linking west Miami-Dade to the MIC andDowntown Miami. Park/Ride facilities are also being considered for the East-West Corridor.

T R A N S I T D E V E L O P M E N T P L A N F Y 2 0 1 1 - 2 0 2 06-2
Annual Update6.0 - FY 2010 Committed Transit Improvements
Table 6-1: MDT FY 2009 – 2010 Proposed Capital Budget ($000’s)
Source: Miami-Dade Transit, F-5 Report, 2010
FY 09-10 FY 10-11 YOE Total
PROPOSED CORRIDOR PROJECTS & RELATED PROJECTS:
194,087$ 149,824$ 343,911$
11,184$ 8,710$ 19,894$
734$ 14,734$ 15,468$
3,815$ 2,970$ 6,785$
Subtotal 209,820$ 176,238$ 386,058$
VEHICLE PROCUREMENT & RELATED PROJECTS:
100$ 3,545$ 3,645$
19,599$ 25,969$ 45,568$
188$ 6,594$ 6,782$
Palmetto Station Traction Power Sub-Station 847$ 13,299$ 14,146$
Mover 17 Phase 2 Vehicle Replacement 10,613$ 12,159$ 22,772$
15,734$ 15,734$
435$ 435$
2,600$ 4,740$ 7,340$
7,080$ 7,080$
Subtotal 33,947$ 89,555$ 123,502$
FARE COLLECTION 11,287$ 1,805$ 13,092$Subtotal 11,287$ 1,805$ 13,092$
MDT Bus Tracker System & Computer AidedDispatch/Automatic Vehicle Locator Replacement
Bus Acquisition
Orange Line Phase 1: MIC-EHT Connector (FDOTMIC Components - West Concourse, Vestibule, & BusPlaza Rway)
Lehman Yard Rehabilitation & Expansion Phase 1 (5storage and 2 MOW tracks)
Rail New Vehicle Procurement (136 cars)
Existing Metrorail Station (Phase 1) - Graphics &Signage Upgrade
Metrorail Central Control Upgrade
Mainline Turnout Replacement (T&G ARRA)
Infrastructure Renewal Plan (IRP)
Lehman Center Test Track
Orange Line Phase 1, MIC-EHT Connector Project
Project Name

Annual Update6.0 - FY 2010 Committed Transit Improvements
T R A N S I T D E V E L O P M E N T P L A N F Y 2 0 1 1 - 2 0 2 06-3
Table 6-1: MDT FY 2009 – 2010 Proposed Capital Budget ($000’s)(continued)
Source: Miami-Dade Transit, F-5 Report, 2010
FY 09-10 FY 10-11 YOE Total
OTHER PROJECTS:
6,414$ 7,413$ 13,827$
49,077$ -$ 49,077$
109,196$ -$ 109,196$
-$ 1,400$ 1,400$
3,490$ 5,939$ 9,429$
201$ 1,779$ 1,980$
5,322$ 2,891$ 8,213$
11,025$ 11,521$ 22,546$
-$ 441$ 441$
1,714$ 1,714$
2,797$ 2,797$
240$ 240$
240$ 240$
519$ 519$
82,705$ 82,705$
2,320$ 2,320$
908$ 908$
4,655$ 4,655$
1,230$ 1,230$
10,577$ 10,577$
4,379$ 4,379$
1,775$ 1,775$
1,028$ 4,759$ 5,787$
-$ -$ -$
Transit Operating System Replacement Project 1,028$ 4,754$ 5,782$
Sub Total 723,689$ 154,956$ 878,645$
Total 978,743$ 422,554$ 1,401,297$
Metrorail WIFI Implementation
Project Name
Northeast Passenger Activity Center
Park and Ride Facility at Kendall Drive and SW 127Avenue
Track & Guideway Rehabilitation Subset
Existing Metrorail Stations Repair to Stair Railings(Part 1)
Dadeland South Parking Lot Expansion
Park and Ride Facility at NW 168 St. and Busway
Park and Ride Facility at SW 344 Street and Busway
Capitalization of Preventative Maintenance
Kendall Enhanced Bus Service
Metrorail Bike Path (M-Path)Metromover Station Canopies and EscalatorReplacement
Metromover Bicentennial Park Station Refurbishment
ARRA Municipalities
Park and Ride Facility at Quail Roost Drive
Security and Safety Equipment
Metromover Tools & Equipment
Bus and Bus Facilities
Facility and Equipment Rehabilitation
Bus Tools and Equipment
Passenger Amenities and Transit Enhancements
AMAG \ Proximity Access Control
NW 7th Avenue Transit Village
Busway ADA Improvements

T R A N S I T D E V E L O P M E N T P L A N F Y 2 0 1 1 - 2 0 2 06-4
Annual Update6.0 - FY 2010 Committed Transit Improvements
6.2 Bus Service Improvements and Adjustments – Committed (2010)In an effort to continually match service capacity with ridership demand MDT routinely revisesthe existing bus route network to better meet the transportation needs of Miami-Dade County.These revisions seek to improve the operational efficiency of the overall transit system. A listingof the committed bus service improvements and adjustments planned to occur between Januaryand December 2010 is presented in Table 6-2. Route improvements are assigned letters in thelast column to describe the type of improvement made: Adjustments (A), Improvements, andReductions (R).
Table 6-2: 2010 Committed Bus Service Improvement AdjustmentsROUTE DESCRIPTION IMPROVEMENT / ADJUSTMENT TYPE
A Miami Beach to Omni Terminal viaVenetian Causeway
Realign in the Omni area and realignfrom Dade Boulevard to Alton Road
via 17th StreetA
E Diplomat Mall to Golden Glades via 163Street Mall and Aventura Mall
Adjust weekend headway from 60 to50 minutes.
I
E Diplomat Mall to Golden Glades via 163Street Mall and Aventura Mall
Add a short trip at midnight sevendays a week from Yacht Club Way to
Aventura MallI
GOpa-locka to Surfside via NW 22
Avenue, NW 125 Street and BroadCauseway
Adjust running times to improveschedule reliability and modify evening
headways after 8pmI
H North Miami Beach to Miami Beach viaNE 163 Street and Collins Avenue
Adjust southbound running times toimprove schedule reliability and modify
evening headways after 8pmA
J Miami International Airport to MiamiBeach via 36 Street
Extend the eastbound loop to 44thStreet via Collins Avenue and IndianCreek Drive before reaching recovery
zone at Indian Creek and 40th
I
MCivic Center to Miami Beach via Omni
Terminal, MacArthur Causeway and Mt.Sinai Hospital
Revise the west end turnaround andrecovery zone to NW 21 Street
A
S Aventura Mall to CBD via Miami BeachAdjust first weekday southbound trip toarrive at CBD earlier to provide better
connections with first westboundRoute 24 trip
A
1 South Miami Heights, Perrine, WestGoulds and Cutler Bay
Discontinue first roundtrip onweekdays
R
7Dolphin Mall to downtown Miami via
Miami International Mall, Fontainebleau,NW 7 Street and Little Havana
Discontinue last westbound trip onweekdays
R
8FIU University Park Campus to CBD via
Westchester, SW 8 Street and LittleHavana
Move short turn layover from 57thAvenue to 67th Avenue
I
12Northside station to Mercy Hospital viaLiberty City, Allapattah, Civic Center,
Little Havana and Coconut GroveDiscontinue the 5am southbound trip
on weekdaysR

Annual Update6.0 - FY 2010 Committed Transit Improvements
T R A N S I T D E V E L O P M E N T P L A N F Y 2 0 1 1 - 2 0 2 06-5
Table 6-2: 2010 Committed Bus Service Improvement Adjustments (Continued)
ROUTE DESCRIPTION IMPROVEMENT / ADJUSTMENT TYPE
17 Norwood to Vizcaya Metrorail station via17th Avenue
Discontinue the 12:30am northboundtrip on weekdays
R
19 163 Street Mall to MDC North Campusvia 119 Street and West Dixie Highway
Improve peak headway from 30 to 24minutes, adjust running times andimprove recovery at MDC North
Campus
I
31 (BuswayLocal)
Cutler Bay to Dadeland South station viathe Busway Add two AM northbound trips
I
32 Carol City to Omni via Opa-locka,Northside, Liberty City and Civic Center
Adjust weekday running times toimprove schedule reliability
I
33 Hialeah Gardens to Miami Shores via103rd Street (49 St) and 95th Street
Discontinue the last round trip onweekdays
R
34 (BuswayFlyer)
Dadeland South station to Florida Cityvia Busway
Adjust weekday AM northboundrunning times to improve schedule
reliabilityA
36Dolphin Mall to Biscayne Boulevard via
Koger Office Park, Miami Springs and 36Street
Adjust schedule to provide a moreeven split with the Route J on NW 36
Street where schedules overlapA
37 Hialeah to South Miami station via PalmAvenue and Douglas Road
Discontinue the last northbound trip onweekdays
R
38 (BuswayMAX)
Dadeland South station to Florida Cityvia Busway
Adjust weekday AM northboundrunning times to improve schedule
reliabilityA
40 West Miami-Dade to Douglas Roadstation via Bird Road
Adjust the early morning peakheadway from 15 to 20 minutes
R
42 Opa-locka to Douglas Road station viaLeJeune Road and Miami Springs
Discontinue the first weekday roundtrip from Miami Springs
R
46 (LibertyCity
Connection)
Caleb Center to NW 7 Avenue/NW 62Street via NW 46 Street, NW 54 Street
and NW 10 AvenueDiscontinue the first round trip on
weekdaysR
51 (FlaglerMAX)
CBD to West Miami Dade via WestFlagler Street
Move EOL recovery area to SW 8th
Street/SW 132nd AvenueA
54 Miami Lakes to Liberty City via 54thStreet
Adjust the Sunday headway from 30 to40 minutes
R
59Golden Glades to Aventura
Adjust weekday running times toimprove schedule reliability
A
71 Dolphin Mall to MDC Kendall Campusvia 107 Avenue and Sweetwater
Restore weekday midday service toSW 107 Street
I
71 Dolphin Mall to MDC Kendall Campusvia 107 Avenue and Sweetwater
Adjust midday headway from 60 to 65minutes
R
75Miami Lakes Tech to FIU Biscayne BayCampus via 175 Street, Norwood and
NE 163/167 StreetAdjust weekday running times to
improve schedule reliabilityA
88 Dadeland North station to Kendall viaKendall Drive
Adjust peak headway from 15 to 20minutes
R

T R A N S I T D E V E L O P M E N T P L A N F Y 2 0 1 1 - 2 0 2 06-6
Annual Update6.0 - FY 2010 Committed Transit Improvements
Table 6-2: 2010 Committed Bus Service Improvement Adjustments (Continued)
ROUTE DESCRIPTION IMPROVEMENT / ADJUSTMENT TYPE93
(BiscayneMAX)
Aventura Mall to CBD via BiscayneBoulevard Adjust weekday running times to
improve schedule reliabilityA
95 Express Downtown Miami, Golden Glades, CivicCenter
Add a 4 PM trip from Civic Center toGolden Glades
I
99Miami Lakes to Aventura Mall via CarolCity, California Club and North Miami
BeachExtend weekday peak short turn trips
to NW 68 AvenueI
104 Dadeland North station to Kendall viaSW 104 Street
Adjust weekday midday running timesto improve schedule reliability
A
115 (Mid-NorthBeach
Connection)
Miami Beach Extend to Lincoln Road for bothdirections I
115 (Mid-NorthBeach
Connection)
Miami Beach Adjust weekday headway from 40 to45 minutes R
115 (Mid-NorthBeach
Connection)
Miami Beach Discontinue the last eastbound trip onweekdays R
120 (BeachMAX)
Aventura to CBD via Miami Beach andOmni Terminal
Extend cut-in and cutout trips to andfrom Aventura Mall to provide more
capacity during rush hours in theHaulover to Aventura segment of
Collins Avenue
I
120 (BeachMAX)
Aventura to CBD via Miami Beach andOmni Terminal
Adjust schedule so that there are nolayovers at Haulover Park after 7pm A
120 (BeachMAX)
Aventura to CBD via Miami Beach andOmni Terminal
Discontinue the 5:30am northboundtrip on weekdays, the 6:15am
northbound trip on Saturday andextend the previous northbound trip to
Aventura Mall
R
123 (SouthBeachLocal)
Miami Beach
Revise the alignment to and from BelleIsle, extend in Collins Park to Collins
Avenue and realign to Alton Roadbetween 6th Street to 9th Street
I
123 (SouthBeachLocal) Miami Beach
Adjust peak headway from 12 to 13minutes
R
135 Miami Lakes to FIU Biscayne BayCampus via 135 Street, Opa-locka
Discontinue the 5:23am eastbound tripon weekdays
R

Annual Update6.0 - FY 2010 Committed Transit Improvements
T R A N S I T D E V E L O P M E N T P L A N F Y 2 0 1 1 - 2 0 2 06-7
Table 6-2: 2010 Committed Bus Service Improvement Adjustments (Continued)
ROUTE DESCRIPTION IMPROVEMENT / ADJUSTMENT TYPE
136SW 147 Avenue to Douglas Road station
via SW 120th/136th Street and OldCutler Road
Adjust weekday running times toimprove schedule reliability
A
137 (WestDade
Connection)
Dolphin Mall to Cutler Bay via SW 137Avenue
Improve Sunday running time toimprove schedule reliability and adjustSunday afternoon headway from 40 to
45 minutes
R
150 (AirportFlyer)
Miami International Airport to MiamiBeach via Earlington Heights station,
SR-112/I-195 and Collins Avenue
Add an afternoon trip to improveweekday afternoon running times and
improved recoveryI
150 (AirportFlyer)
Miami International Airport to MiamiBeach via Earlington Heights station,
SR-112/I-195 and Collins AvenueMove recovery zone to Washington
Avenue and Lincoln RoadA
183 Miami Lakes to Aventura Mall via MiamiGardens Drive
Extend to later evening cut-out tripsfrom NW 57 Avenue to NW 87 Avenueand two later evening eastbound trips
to NE 183 Street instead ofdeadheading
A
195 (I-95Dade/Broward
Express)
Express Route from Downtown Miami toBroward Boulevard and Sheridan Street
via I-95
Fifteen minute peak headway service.One hundred percent funded by
FDOT.202 (Little
HaitiCirculator)
Edison/Little River to Miami DesignDistrict via NE 2 Avenue
Adjust running time to increase therecovery on the south end of the route
A
204 (KillianKAT)
Hammocks to Dadeland North station viaKillian Drive
Discontinue two AM and two PM lowridership trips in both directions
R
249 (CoconutGrove
Circulator)
Coconut Grove station to Douglas Roadstation via SW 27 Avenue, Grand
Avenue and SW 37 Avenue
Discontinue two early AM weekdaytrips and one early AM weekend round
tripR
252 (CoralReef MAX)
Dadeland South station to Country Walkvia Coral Reef Drive
Begin first weekday eastbound tripfrom SW 162 Avenue instead of SW
152 AvenueI
272 (SunsetKAT)
Kendall to Dadeland North station viaSunset Drive
Discontinue two PM low ridershipweekday round trips
R
277 (7Avenue MAX) Golden Glades to CBD via NW 7 Avenue
Add two later morning southboundtrips and one evening southbound tripto alleviate overcrowding on the Route
77
I
286 (NorthPointe
Circulator)Miami Lakes and Palm Springs North
Discontinue the 8:24am trip.R
288 (KendallKAT)
Kendall to Dadeland North station viaKendall Drive
See the new Kendall Enhanced BusRoute.
R

T R A N S I T D E V E L O P M E N T P L A N F Y 2 0 1 1 - 2 0 2 06-8
Annual Update6.0 - FY 2010 Committed Transit Improvements
Table 6-2: 2010 Committed Bus Service Improvement Adjustments (Continued)
ROUTE DESCRIPTION IMPROVEMENT / ADJUSTMENT TYPE
KendallEnhanced
Bus
Kendall to Dadeland North station viaKendall Drive
Replace the Kendall KAT with this newservice which will double the amountof service currently provided. Servicewill be operated from two branches
during extended peak periods, by 60ft. articulated hybrid buses and will
provide enhanced technology servicesfor passengers
I
Source: Miami-Dade Transit, 2010
Notes: Abbreviations for Type column: A=Adjustment, I=Improvement, R=Reduction
6.3 Infrastructure Renewal Program – Committed ProjectsThe following section lists those committed projects that are proposed to be implemented duringthe FY 2009 – 2010 timeframe. These project commitments are based on an InfrastructureRenewal Program (IRP) evaluation and prioritization process as performed by MDT. The IRPprocess results in the identification, evaluation, prioritization, and programming of capitalimprovement projects. Project commitments are based on the Infrastructure Renewal Program(IRP) evaluation and prioritization process. Table 6-3 presents a listing of the committedprojects that are proposed for implementation during the FY 2010-2012 time period as providedby MDT.
Please note that at the time the TDP Annual Update was being prepared MDT had not finalizedthe IRP evaluation and prioritization process results for FY 2010 – 2012. Once these results arefinal the following table will be updated.

Annual Update6.0 - FY 2010 Committed Transit Improvements
T R A N S I T D E V E L O P M E N T P L A N F Y 2 0 1 1 - 2 0 2 06-9
Classification Project NameEstimate TotalProject Cost
FY 09-10
Total ProjectAmount
Total fundingAllocated
Type ofGrant 2010 2011
Safety &Security
Parking Garages- Fire
Suppression $ 975,000 $ 975,000
$1,249.820earmarked
FY'10
5309formula $ 975,000 $ -
MaintenanceFacilities
40 Year BuildingRe-Certification3311 NW 31 St.
$ 159,923 $ 228,558$210,000
earmarkedFY'10
5309Formula $ 159,923 $ -
MaintenanceFacilities
Coral WayGarage
Hurricane Panels100,000$ 100,000$
$100,000earmarked
FY'10
5309Formula -$ -$
SystemsBus Garages
Plumbing
$300,000earmarked
FY'10
5309Formula $ 300,000 $ -
PassengerFacilities
ConcreteRepairs at Omni
Bus Terminal $ 198,786 $ 809,047
$810,000earmarked
FY '10
5309Formula $ 198,786 $ 610,261
MaintenanceFacilities
Metrobus: A/CReplacement,
and A/C &Chiller Unit
$ 293,100 $ 1,590,410$300,000
earmarkedFY'10
5309Formula $ 245,700 $ 178,450
MaintenanceFacilities
Bus Garages:Roofs $ 297,320 $ 2,879,193
$300,000earmarked
FY'10
5309Formula $ 297,320 $ -
PassengerFacilities
ConcreteRepairs and
Asphalt repavingat Hialeah
$ 286,125 $ 286,125$330,000
earmarkedFY'10
5309Formula $ 286,125 $ -
MaintenanceFacilities
SecondaryGuide Rails forBus Washes
$ 90,000 $ 90,000$90,000
earmarkedFY' 10
5309Formula $ 90,000 $ -
MaintenanceFacilities
Replace aircompressors atall bus locations
$ 380,546 $ 1,170,180$400,000
earmarkedFY' 10
5309Formula
$ 380,456 $ 417,459
Systems Tools andEquipment
$ 298,000 $298,000FY '10
5309Fixed
Guideway $ 298,000 $ -
3,231,310$ 1,206,170$TOTALS:
Table 6-3: FY 2010 – 2011 Prioritized New IRP Projects for Budget Approval


Annual Update7.0 - Ten Year Implementation Program
T R A N S I T D E V E L O P M E N T P L A N F Y 2 0 1 1 - 2 0 2 07-1
7.0 Ten Year Implementation Program
A ten year implementation plan for FY 2011 – 2020 has been prepared for the TDP AnnualUpdate to include a new tenth year or FY 2020 as presented.
7.1 Capital Improvement PlanAnnually MDT prepares a proposed capital budget and a multi-year Capital Plan as previouslymentioned. Funded Metrorail and Metrobus projects identified within the Capital Plan areexpected to be implemented within the ten year planning period. The Capital Improvement Planfor FY 2011-2020 is presented in Table 7-1.
Please note that the YOE totals in this table are based upon the total project cost which includeannual dollar amounts previously expended prior to FY 2010 - 2011. Furthermore, theescalation applied is specific to each project as related to project conditions and contractualagreements. Each selected project corresponds to a committed funding source and isconsistent with the Miami-Dade MPO’s FY 2010 – 2014 Transportation Improvement Program(TIP).
Funded projects are expected to be implemented within the next ten years for the Metrorail andMetrobus system. There are no planned service extensions or expansion of the existingMetromover system under consideration at this time or within the planning horizon of this TDPAnnual Update.
At the time the TDP Annual Update was being prepared the proposed FY 2010 – 2011 capitalbudget and multi-year capital plan were being finalized by MDT. Once MDT determines thebudget and capital plan to be final this section will be updated to reflect the most currentinformation.
7.2 2020 Recommended Service PlanThe MDT Recommended Service Plan (RSP) serves as the needs plan for the MDT system.The 2020 RSP has been developed for the FY 2011-2020 TDP Annual Update and has beenupdated from the previous RSP as presented in last year’s FY 2010 – 2019 TDP Major Update.Any future project recommended in this section for implementation is contingent upon Miami-Dade County receiving the appropriate federal, state and local funding for its implementation.
Some of the improvements and adjustments reflected in the 2020 RSP are identified under thePTP one-half percent sales surtax approved by voters on November 5, 2002. Most of theimprovements listed in the RSP beyond 2011 were not included in the original PTPimprovements list, but may be funded with future PTP surtax funds. These improvements weredeemed to be the most pressing or requested by the community after the original PTP list wascompleted. This section addresses the four modes of transit as operated by MDT to includeMetrobus, Metrorail, Metromover and Special Transportation Services.
7.2.1 Recommended Service Plan – Existing Metrobus Routes
MDT is committed to provide the level of transit service that will provide efficient services topassengers throughout the Miami-Dade County service area. This provision of service iscontinuously considered while MDT seeks to properly address critical issues of generatingrevenue, managing operational budgets, and prioritizing capital expansion programs.

T R A N S I T D E V E L O P M E N T P L A N F Y 2 0 1 1 - 2 0 2 07-2
Annual Update7.0 - Ten Year Implementation Program
Table 7-1: MDT FY 2010 – 2011 Proposed Capital Budget and Multi-Year Capital Plan ($000’s)
Source: Miami-Dade Transit, F-5 Report, 2010
FY 10-11 FY 11-12 FY 12-13 FY 13-14 FY 14-15 FY 15-16 FY 16-17 FY 17-18 FY18-19 FY 19-20 FY 20-21 YOE Total
PROPOSED CORRIDOR PROJECTS & RELATED PROJECTS:
$149,824 $29,815 $29,815 209,454$
$8,710 $8,213 $0 16,923$
$14,734 $12,171 $1,185 28,090$
$2,970 $715 3,685$
Subtotal 176,238$ 50,914$ 31,000$ -$ -$ -$ -$ -$ -$ -$ -$ 258,152$
VEHICLE PROCUREMENT & RELATED PROJECTS:
3,545$ 5,068$ 8,613$
25,969$ 28,878$ 48,420$ 108,685$ 121,731$ 31,260$ 364,943$
6,594$ 9,241$ 15,835$
Palmetto Station Traction Power Sub-Station 13,299$ 2,453$ 15,752$
Mover 17 Phase 2 Vehicle Replacement 12,159$ 620$ 12,779$
15,734$ 12,462$ 27,534$ 21,589$ 16,589$ 93,908$
435$ 435$
4,740$ 9,770$ 14,510$
7,080$ 7,500$ 7,500$ 12,500$ 12,500$ 12,500$ 59,580$
Subtotal 89,555$ 75,992$ 83,454$ 142,774$ 150,820$ 43,760$ -$ -$ -$ -$ -$ 586,355$
FARE COLLECTION 1,805$ 1,805$Subtotal 1,805$ -$ -$ -$ -$ -$ -$ -$ -$ -$ -$ 1,805$
MDT Bus Tracker System & Computer AidedDispatch/Automatic Vehicle Locator Replacement
Project Name
Orange Line Phase 1, MIC-EHT Connector Project
Orange Line Phase 1: MIC-EHT Connector (FDOT MICComponents - West Concourse, Vestibule, & Bus PlazaRway)
Metrorail Central Control Upgrade
Existing Metrorail Station (Phase 1) - Graphics & SignageUpgrade
Lehman Yard Rehabilitation & Expansion Phase 1 (5storage and 2 MOW tracks)
Rail New Vehicle Procurement (136 cars)
Lehman Center Test Track
Bus Acquisition
Infrastructure Renewal Plan (IRP)
Mainline Turnout Replacement (T&G ARRA)

Annual Update7.0 - Ten Year Implementation Program
T R A N S I T D E V E L O P M E N T P L A N F Y 2 0 1 1 - 2 0 2 07-3
Table 7-1: MDT FY 2010 – 2011 Proposed Capital Budget and Multi-Year Capital Plan ($000’s)(continued)
Source: Miami-Dade Transit, F-5 Report, 2010
FY 10-11 FY 11-12 FY 12-13 FY 13-14 FY 14-15 FY 15-16 FY 16-17 FY 17-18 FY18-19 FY 19-20 FY 20-21 YOE Total
OTHER PROJECTS:
7,413$ 7,243$ 6,377$ 5,503$ 3,589$ 30,125$
1,400$ 1,400$
5,939$ 452$ 6,391$
1,779$ 608$ 2,387$
2,891$ 1,097$ 235$ 4,223$
11,521$ 11,982$ 16,827$ 40,330$
441$ 463$ 486$ 510$ 536$ 563$ 2,999$
252$ 265$ 278$ 292$ 307$ 1,394$
1,714$ 2,079$ 3,793$
2,797$ 2,797$
240$ 252$ 265$ 278$ 292$ 307$ 1,634$
240$ 252$ 265$ 278$ 292$ 307$ 1,634$
519$ 545$ 572$ 601$ 631$ 662$ 3,530$
82,705$ 84,061$ 89,625$ 93,163$ 98,733$ 103,021$ 551,308$
2,320$ 2,320$
908$ 292$ 1,200$
4,655$ 2,007$ 6,662$
1,230$ 971$ 2,201$
10,577$ 2,288$ 12,865$
4,379$ 4,379$
1,775$ 544$ 571$ 600$ 630$ 661$ 4,781$
2,373$ 1,574$ 1,050$ 920$ 5,917$
Transit Operating System Replacement Project 4,754$ 413$ 5,167$
Sub Total 150,197$ 115,801$ 117,861$ 102,785$ 106,045$ 106,748$ -$ -$ -$ -$ -$ 699,437$
Total 417,795$ 242,707$ 232,315$ 245,559$ 256,865$ 150,508$ -$ -$ -$ -$ -$ 1,545,749$
Metrorail WIFI Implementation
Project Name
Track & Guideway Rehabilitation Subset
Park and Ride Facility at NW 168 St. and Busway
Park and Ride Facility at SW 344 Street and Busway
Park and Ride Facility at Kendall Drive and SW 127 Ave
NW 7th Avenue Transit Village
AMAG \ Proximity Access Control
Metrorail & Metromover Tools & Equipment
Northeast Passenger Activity Center
Bus Tools and Equipment
ARRA Municipalities
Park and Ride Facility at Quail Roost Drive
Security and Safety Equipment
Passenger Amenities and Transit Enhancements
Metrorail Bike Path (M-Path)
Metromover Bicentennial Park Station Refurbishment
Capitalization of Preventative Maintenance
Kendall Enhanced Bus Service
Metromover Station Canopies and Escalator Replacement
Busway ADA Improvements
ADA Improvements and Equipment
Bus and Bus Facilities
Facility and Equipment Rehabilitation

T R A N S I T D E V E L O P M E N T P L A N F Y 2 0 1 1 - 2 0 2 07-4
Annual Update7.0 - Ten Year Implementation Program
Since the TDP Annual Update comprises part of MDT’s operational foundation for the future, itis imperative that the importance of “rightsizing” the RSP cannot be over emphasized.Therefore, the following details the both improvements and adjustments to achieve MDT’s longterm objectives.
Service route improvements and adjustments needs outlined in the RSP are proposed forimplementation throughout the ten year planning horizon of FY 2011-FY 2020. The followingTable 7-2 provides a summary description of all bus service improvements, impact of additionalbuses on the peak vehicle requirements (PVR), annual operating need per improvement, andprogramming of transit improvements by fiscal years; and corresponding funding needs by fiscalyear. The estimated total need for improvements to existing transit routes over this ten planninghorizon is $81.5 million (Table 7-2).
7.2.1.1 Transit Hubs and Feeder Routes for Existing Routes
The 2020 RSP improvements to the existing transit routes also include the development of aregional transit hub system. The current bus system generally operates on a modified gridpattern to provide feeder services to Metrorail and Metromover stations. Under the modifiedgrid, bus routes will continue to serve their respective corridors and Metrorail stations, but willalso provide connections to various routes within the general service area at a single location ortransit hub.
Nine transit hubs are proposed throughout Miami-Dade County. Passenger amenities will beprovided at these locations such as the ability for transit riders to purchases transit passes,obtain transit schedule information, benches, shelters with weather protection etc. Some ofthese proposed transit hubs already serve these functions (i.e., Dadeland stations) while otherhubs continue to remain in the conceptual planning phase. In addition, the 7th Avenue TransitVillage (at 62nd Street) and the Homestead terminals were added as proposed transit hublocations following the submittal of the 2009 MDT TDP Major Update. The NortheastPassenger Activities Center (NEPAC) and the Homestead (Busway/SW 344th Street) transithubs have the highest number of proposed routes, with twelve and five routes plannedrespectively.
Table 7-3 provides a list of the transit hubs with corresponding route connections planned toserve them. These hubs are also illustrated in Figure 7-1. In addition to those listed in this tablethere are many other areas that serve as transit hubs, for example, Golden Glades, AventuraMall, Douglas Road Metrorail station and other Metrorail stations, and the Omni. In addition, theCity of Miami Beach has funding for a transit hub at 72nd Street and Collins/Harding Avenue.

Annual Update7.0 - Ten Year Implementation Program
T R A N S I T D E V E L O P M E N T P L A N F Y 2 0 1 1 - 2 0 2 07-5
Table 7-2: Recommended Service Plan Summary for Existing Transit Bus Routes (2020)
Cost PVR Cost PVR Cost PVR Cost PVR Cost PVR Cost PVR Cost PVR Cost PVR Cost PVR Cost PVR
A No planned improvements.
B No planned improvements.
C No planned improvements.
E No planned improvements.
G No planned improvements.
H No planned improvements.
J Extend to 72 Street.
L No planned improvements.
M No planned improvements.
S
Improve headways. Monday-Saturday from 12 to 10minutes and Sundays from 15to 10 minutes.
$1,750,000 4 $1,750,000 4 $1,750,000 4 $1,750,000 4 $1,750,000 4 $1,750,000 4 $1,750,000 4 $1,750,000 4
1 Extend Route to DadelandSouth Metrorail Station
$500,000 3 $500,000 3 $500,000 3 $500,000 3 $500,000 3 $500,000 3
2Realign northern terminus tofuture Golden GladesIntermodal Terminal.
$0 0 $0 0 $0 0 $0 0 $0 0 $0 0 $0 0
3 No planned improvements.
6 Extend route to serve theMiami Intermodal Center.
$221,623 0 $221,623 0 $221,623 0 $221,623 0 $221,623 0 $221,623 0 $221,623 0 $221,623 0
7New branch (7M) from MIC toCulmer Metrorail station,serving the Marlins Ballpark.
$850,000 6 $850,000 6 $850,000 6 $850,000 6 $850,000 6 $850,000 6 $850,000 6 $850,000 6 $850,000 6
8 No planned improvements.
9 No planned improvements.
10 No planned improvements.
11 No planned improvements.
20162014 2015Route
2011Change Description
2018 20202013 20192012 2017

T R A N S I T D E V E L O P M E N T P L A N F Y 2 0 1 1 - 2 0 2 07-6
Annual Update7.0 - Ten Year Implementation Program
Table 7-2: Recommended Service Plan Summary for Existing Transit Bus Routes (2020) (continued)
Cost PVR Cost PVR Cost PVR Cost PVR Cost PVR Cost PVR Cost PVR Cost PVR Cost PVR Cost PVR
12
Remove Civic Center loop;alignment will stay on NW 12Ave. City of Miami toimplement Health DistrictCirculator.
-$173,190 -$173,190 -$173,190 -$173,190 -$173,190 -$173,190 -$173,190 -$173,190 -$173,190 -$173,190
16 No planned improvements.
17 No planned improvements.
19 No planned improvements.
21 No planned improvements.
22 No planned improvements.
24
Convert limited-stop serviceeast of Ponce de LeonBoulevard due to City of MiamiCoral Way Trolley.
-$600,000 -2 -$600,000 -2 -$600,000 -2 -$600,000 -2 -$600,000 -2 -$600,000 -2 -$600,000 -2 -$600,000 -2 -$600,000 -2 -$600,000 -2
27 No planned improvements.
29 No planned improvements.
31 (BuswayLocal)
Extend service to FloridaCity/Homestead along SouthMiami-Dade BuswayExtension.
$2,411,848 5 $2,411,848 5 $2,411,848 5 $2,411,848 5 $2,411,848 5 $2,411,848 5 $2,411,848 5 $2,411,848 5
32 No planned improvements.
33 Improve peak headway from30 to 20 minutes.
$395,453 3 $395,453 3 $395,453 3 $395,453 3
34 (BuswayFlyer) No planned improvements.
35 Improve peak headway from30 to 20 minutes.
$642,620 4 $642,620 4 $642,620 4 $642,620 4 $642,620 4 $642,620 4 $642,620 4 $642,620 4
36 No planned improvements.
37 Realign route to serve theMiami Intermodal Center.
$0 0 $0 0 $0 0 $0 0 $0 0 $0 0 $0 0 $0 0 $0 0
38 (BuswayMAX)
Improve peak headway from12 to 10 minutes.
$255,396 1 $255,396 1 $255,396 1 $255,396 1 $255,396 1 $255,396 1 $255,396 1 $255,396 1 $255,396 1 $255,396 1
40 No planned improvements.
42 Realign route to serve theMiami Intermodal Center.
$0 0 $0 0 $0 0 $0 0 $0 0 $0 0 $0 0 $0 0 $0 0
46 (LibertyCity
Connection)No planned improvements.
48 No planned improvements.
49 No planned improvements.
51 (FlaglerMAX)
Route to be transformed toFlagler Rapid Bus (see NewRoutes table).
$0 0 $0 0 $0 0 $0 0 $0 0 $0 0 $0 0 $0 0 $0 0 $0 0
20162014 2015Route
2011Change Description
2018 20202013 20192012 2017

Annual Update7.0 - Ten Year Implementation Program
T R A N S I T D E V E L O P M E N T P L A N F Y 2 0 1 1 - 2 0 2 07-7
Table 7-2: Recommended Service Plan Summary for Existing Transit Bus Routes (2020) (continued)
Cost PVR Cost PVR Cost PVR Cost PVR Cost PVR Cost PVR Cost PVR Cost PVR Cost PVR Cost PVR
52 No planned improvements.
54 No planned improvements.
56Discontinue peak periodbranch to MDC, increaseservice to 162 Avenue branch.
$0 0 $0 0 $0 0 $0 0 $0 0 $0 0 $0 0 $0 0 $0 0 $0 0
57 Realign route to serve theMiami Intermodal Center.
$0 0 $0 0 $0 0 $0 0 $0 0 $0 0 $0 0 $0 0 $0 0
59 Realign to 163rd Street Mallwith 2-way service
$100,000 1 $100,000 1 $100,000 1 $100,000 1 $100,000 1 $100,000 1 $100,000 1 $100,000 1 $100,000 1 $100,000 1
62 No planned improvements.
70Truncate Route at SouthlandMall when Cutler BayCirculator begins service.
($82,000) 0 ($82,000) 0 ($82,000) 0 ($82,000) 0 ($82,000) 0 ($82,000) 0 ($82,000) 0 ($82,000) 0 ($82,000) 0 ($82,000) 0
71 Extend Route to Palmettostation via 74 Street.
$500,000 2 $500,000 2 2 $500,000 2 $500,000 2 $500,000 2 $500,000 2 $500,000 2 $500,000 2
72 Extend route westward tofuture West Kendall Terminal.
$207,000 1 $207,000 1 $207,000 1 $207,000 1 $207,000 1 $207,000 1 $207,000 1 $207,000 1 $207,000 1 $207,000 1
73 No planned improvements.
75 No planned improvements.
77 No planned improvements.79 (79 Street
MAX)Extend Route to Tri-RailMetrorail
$153,000 1 $153,000 1 $153,000 1 $153,000 1 $153,000 1 $153,000 1 $153,000 1 $153,000 1 $153,000 1 $153,000 1
87 Extend to Flager station inMedley
$400,000 1 $400,000 1 $400,000 1 $400,000 1 $400,000 1 $400,000 1 $400,000 1 $400,000 1 $400,000 1
88
Straighten route and extendwestward to the West KendallTerminal, eliminate the 142Avenue branch.
$233,477 1 $233,477 1 $233,477 1 $233,477 1 $233,477 1 $233,477 1 $233,477 1 $233,477 1 $233,477 1 $233,477 1
93(Biscayne
Max)
Route to be transformed toBiscayne Rapid Bus (see NewRoutes table).
$0 0 $0 0 $0 0 $0 0 $0 0 $0 0 $0 0 $0 0 $0 0 $0 0
95XIncrease the number of trips todowntown and Civic Center by10%.
$192,780 0 $192,780 0 $192,780 0 $192,780 0 $192,780 0 $192,780 0 $192,780 0 $192,780 0 $192,780 0 $192,780 0
97(27 Avenue
MAX)
Route to be transformed to 27Avenue Rapid Bus, connectingto MIC (see New Routestable).
$0 0 $0 0 $0 0 $0 0 $0 0 $0 0 $0 0 $0 0 $0 0
99 No planned improvements.
104 Realign route westward tofuture West Kendall Terminal.
$83,629 0 $83,629 0 $83,629 0 $83,629 0 $83,629 0 $83,629 0 $83,629 0 $83,629 0 $83,629 0 $83,629 0
115 (Mid-North BeachConnection)
Restructure into two (2)separate routes
$0 0 $0 0 $0 0 $0 0 $0 0 $0 0 $0 0 $0 0 $0 0
120 (BeachMAX)
Improve weekday headwaysfrom 12 to 10 minutes.
$765,000 3 $765,000 3 $765,000 3 $765,000 3 $765,000 3 $765,000 3 $765,000 3 $765,000 3 $765,000 3
20162014 2015Route
2011Change Description
2018 20202013 20192012 2017

T R A N S I T D E V E L O P M E N T P L A N F Y 2 0 1 1 - 2 0 2 07-8
Annual Update7.0 - Ten Year Implementation Program
Table 7-2: Recommended Service Plan Summary for Existing Transit Bus Routes (2020) (continued)
Cost PVR Cost PVR Cost PVR Cost PVR Cost PVR Cost PVR Cost PVR Cost PVR Cost PVR Cost PVR
123 (SouthBeach Local) No planned improvements.
132 (Tri-RailDoral
Shuttle)No planned improvements.
133 (Tri-RailAirportShuttle)
To be discontinued with theopening of the MIC-MIAMover.
($142,000) -1 ($142,000) -1 ($142,000) -1 ($142,000) -1 ($142,000) -1 ($142,000) -1 ($142,000) -1 ($142,000) -1 ($142,000) -1
135Discontinue Hialeah branch toMDC, and increase service toMiami Lakes.
$0 0 $0 0 $0 0 $0 0 $0 0 $0 0 $0 0 $0 0 $0 0 $0 0
136 No planned improvements.137 (West
DadeConnection)
No planned improvements.
150 (AirportFlyer)
Extend north to 44th St /Collins Ave. and south toSouth Pointe Dr.
$600,000 1 $600,000 1 $600,000 1 $600,000 1 $600,000 1 $600,000 1 $600,000 1 $600,000 1 $600,000 1 $600,000 1
183 Local No planned improvements.
195 (I-95Dade-
BrowardExpress)
Add midday service $217,000 0 $217,000 0 $217,000 0 $217,000 0 $217,000 0 $217,000 0 $217,000 0 $217,000 0 $217,000 0
202(Little Haiti
Connection)No planned improvements.
204 (KillianKAT)
Realign route to the futureWest Kendall Bus Terminal. $0 0 $0 0 $0 0 $0 0 $0 0 $0 0 $0 0 $0 0 $0 0 $0 0
207/208(Little
HavanaCirculator)
Extend Route to BrickellMetrorail station. $438,000 1 $438,000 1 $438,000 1 $438,000 1 $438,000 1 $438,000 1 $438,000 1 $438,000 1 $438,000 1
211(OvertownCirculator)
No planned improvements.
212(SweetwaterCirculator)
No planned improvements.
20162014 2015Route
2011Change Description
2018 20202013 20192012 2017

Annual Update7.0 - Ten Year Implementation Program
T R A N S I T D E V E L O P M E N T P L A N F Y 2 0 1 1 - 2 0 2 07-9
Table 7-2: Recommended Service Plan Summary for Existing Transit Bus Routes (2020) (continued)
Cost PVR Cost PVR Cost PVR Cost PVR Cost PVR Cost PVR Cost PVR Cost PVR Cost PVR Cost PVR
238 (East-West
Connection)
Extend westward to BeaconLakes.
$250,000 1 $250,000 1 $250,000 1 $250,000 1 $250,000 1 $250,000 1 $250,000 1 $250,000 1
243 (SeaportConnection) No planned improvements.
246 (NightOwl) No planned improvements.
248 (BrickellKey Shuttle)
Discontinue service once Cityof Miami Shuttle beginsservice.
($130,000) -1 ($130,000) -1 ($130,000) -1 ($130,000) -1 ($130,000) -1 ($130,000) -1 ($130,000) -1 ($130,000) -1 ($130,000) -1
249 (CoconutGrove
Circulator)No planned improvements.
252 (CoralReef MAX)
Operate later evening serviceinto the MetrozooEntertainment complex.
$81,004 1 $81,004 1 $81,004 1
254(BrownsvilleCirculator)
No planned improvements.
272 (SunsetKAT)
Realign route to the futureWest Kendall Bus Terminal.
$0 0 $0 0 $0 0 $0 0 $0 0 $0 0 $0 0 $0 0 $0 0 $0 0
20162014 2015Route
2011Change Description
2018 20202013 20192012 2017

T R A N S I T D E V E L O P M E N T P L A N F Y 2 0 1 1 - 2 0 2 07-10
Annual Update7.0 - Ten Year Implementation Program
Table 7-2: Recommended Service Plan Summary for Existing Transit Bus Routes (2020) (continued)
Source: Miami-Dade Transit, 2010
Cost PVR Cost PVR Cost PVR Cost PVR Cost PVR Cost PVR Cost PVR Cost PVR Cost PVR Cost PVR
277(7 Avenue
MAX)No planned improvements.
286 ( NorthPointe
Circulato)rNo planned improvements.
287 (SagaBay MAX)
Improve peak headway from30 to 20 minutes. $153,213 1 $153,213 1 $153,213 1 $153,213 1 $153,213 1 $153,213 1 $153,213 1 $153,213 1 $153,213 1
288 (KendallKAT)
Realign route to the futureWest Kendall Bus Terminaland transform to KendallEnhanced Bus.
$0 0 $0 0 $0 0 $0 0 $0 0 $0 0 $0 0 $0 0 $0 0 $0 0
344 No planned improvements.
500 (MidnightOwl) No planned improvements.
INCREMENTAL TOTALS $970,092 4 $4,021,305 12 $9,297,396 14 $9,297,396 0 $9,797,396 3 $9,797,396 0 $10,192,849 3 $10,273,853 1 $10,273,853 0 $10,273,853 0
(MINI-BUSES) 0 0 0 0 0 0 0 0 0 0
(FULL SIZE BUSES) 4 12 14 0 3 0 3 1 0 0
CUMULATIVE TOTALS $970,092 4 $4,991,397 16 $14,288,793 30 $23,586,189 30 $33,383,585 33 $43,180,981 33 $53,373,830 36 $63,647,683 37 $73,921,536 37 $84,195,389 37
(MINI-BUSES) 0 0 0 0 0 0 0 0 0 0
(FULL SIZE BUSES) 4 16 30 30 33 33 36 37 37 37
20162014 2015Route
2011Change Description
2018 20202013 20192012 2017

Annual Update7.0 - Ten Year Implementation Program
T R A N S I T D E V E L O P M E N T P L A N F Y 2 0 1 1 - 2 0 2 07-11
Table 7-3: Transit Hub Locations and Feeder Routes for Existing Bus Routes
A B C E G H J L M S 1 2 3 6 7 8 9 10 11 12 16Dadeland Metrorail Stations
Flagler Marketplace (CBD)
Homestead (Busway/SW 344th Street)
Miami Beach - Lincoln Rd/Washington
Miami Intermodal Center (Airport)
Northeast Passenger Activities Center
West Dade (Dolphin Station)
West Kendall (Kendall Town Center)
7th Avenue Transit Village (at 62nd St)
17 19 21 22 24 27 29 31* 32 33 34* 35 36 37 38* 40 42 46* 48 49 51*Dadeland Metrorail Stations
Flagler Marketplace (CBD)
Homestead (Busway/SW 344th Street)
Miami Beach - Lincoln Rd/Washington
Miami Intermodal Center (Airport)
Northeast Passenger Activities Center
West Dade (Dolphin Station)
West Kendall (Kendall Town Center)
7th Avenue Transit Village (at 62nd St)
ROUTES
ROUTES
TERMINALS
TERMINALS

T R A N S I T D E V E L O P M E N T P L A N F Y 2 0 1 1 - 2 0 2 07-12
Annual Update7.0 - Ten Year Implementation Program
Table 7-3: Transit Hub Locations and Feeder Routes for Existing Bus Routes (continued)
52 54 56 57 59 62 70 71 72 73 75 77 79* 87 88 93* 95X 97* 99 104 115*Dadeland Metrorail Stations
Flagler Marketplace (CBD)
Homestead (Busway/SW 344th Street)
Miami Beach - Lincoln Rd/Washington
Miami Intermodal Center (Airport)
Northeast Passenger Activities Center
West Dade (Dolphin Station)
West Kendall (Kendall Town Center)
7th Avenue Transit Village (at 62nd St)
120* 123* 132* 133* 135 136 137* 150* 183* 202* 204* 207* 211* 212* 238* 243* 246* 248* 249* 252* 254*Dadeland Metrorail Stations
Flagler Marketplace (CBD)
Homestead (Busway/SW 344th Street)
Miami Beach - Lincoln Rd/Washington
Miami Intermodal Center (Airport)
Northeast Passenger Activities Center
West Dade (Dolphin Station)
West Kendall (Kendall Town Center)
7th Avenue Transit Village (at 62nd St)
TERMINALSROUTES
ROUTESTERMINALS

Annual Update7.0 - Ten Year Implementation Program
T R A N S I T D E V E L O P M E N T P L A N F Y 2 0 1 1 - 2 0 2 07-13
Table 7-3: Transit Hub Locations and Feeder Routes for Existing Bus Routes (continued)
Source: Miami-Dade Transit, 2010
* Route Descriptions
Route 31: Busway Local Route 133: Tri-Rail Airport Shuttle Route 248: Brickell Key ShuttleRoute 34: Busway Flyer Route 137: West Dade Connection Route 249: Coconut Grove CirculatorRoute 38: Busway MAX Route 150: Airport Flyer Route 252: Coral Reef MAXRoute 46: Liberty City Connection Route 183: 183 Local Route 254: Brownsville CirculatorRoute 51: Flagler MAX Route 202: Little Haiti Connection Route 272: Sunset KATRoute 79: 79 Street MAX Route 204: Killian KAT Route 277: 7 Avenue MAXRoute 93: Biscayne MAX Route 207/208: Little Havana Connection Route 286: North Pointe CirculatorRoute 97: 27th Avenue MAX Route 211: Overtown Circulator Route 287: Saga Bay MAXRoute 115: Mid-North Beach Connection Route 212: Sweetwater Circulator Route 288: Kendall KATRoute 120: Beach MAX Route 238: East West Connection Route 301: Dade-Monroe ExpressRoute 123: South Beach Local Route 243: Seaport Connection Route 302: Card Sound ExpressRoute 132: Tri-Rail Doral Shuttle Route 246: Night Owl Route 500: Midnight Owl
272* 277* 286* 287* 288* 301* 302* 344 500*Dadeland Metrorail Stations
Flagler Marketplace (CBD)
Homestead (Busway/SW 344th Street)
Miami Beach - Lincoln Rd/Washington
Miami Intermodal Center (Airport)
Northeast Passenger Activities Center
West Dade (Dolphin Station)
West Kendall (Kendall Town Center)
7th Avenue Transit Village (at 62nd St)
TERMINALSROUTES

T R A N S I T D E V E L O P M E N T P L A N F Y 2 0 1 1 - 2 0 2 07-14
Annual Update7.0 - Ten Year Implementation Program
Figure 7-1: Transit Hub Locations
Source: Miami-Dade Transit, 2010

Annual Update7.0 - Ten Year Implementation Program
T R A N S I T D E V E L O P M E N T P L A N F Y 2 0 1 1 - 2 0 2 07-15
7.2.2 Recommended Service Plan – New Metrobus Routes
Five (5) new transit routes have been proposed under the 2020 RSP to replace old existingroutes or add new service (Table 7-4). The table presents the proposed new transit routes withassociated service levels, peak vehicle requirements for buses, annual operating funding needs,and proposed implementation schedule. The preliminary programming of these routes wasconducted in a systematic and regional approach based on coordination with major transitcapital projects.
A description of each of the new routes identifying whether they are funded or partially funded isincluded below. These new routes represent MDT’s response to citizens’ request for additionalenhanced bus service throughout the County. These new transit routes are also illustrated inFigure 7-2.
Route 27 Avenue Rapid Bus Route (North Corridor): Funded: $1.0 million from Route97. $1.0M (Applied for) JARC FY 2008 and FY 2009.
SW 8 Street Rapid Bus (East-West Corridor): Funded: $750K (Applied for) JARC FY2008 and FY 2009. $750k to be funded by efficiencies and restructuring.
SR 836 Express: Funded: $500K (Applied for) JARC FY 08 and FY 09. $500k to befunded by efficiencies and restructuring..
Biscayne Rapid Bus: $2.3M from Route 93 and $1.2M to be funded by efficiencies andrestructuring. .
Flagler Rapid Bus: $2.8M from Route 51 and $1.2M to be funded by efficiencies andrestructuring.

T R A N S I T D E V E L O P M E N T P L A N F Y 2 0 1 1 - 2 0 2 07-16
Annual Update7.0 - Ten Year Implementation Program
Table 7-4: Recommended Service Plan Summary New Routes Description
Source: Miami-Dade Transit, 2010
Peak MidDay
WeekEnd Cost PVR Cost PVR Cost PVR Cost PVR Cost PVR Cost PVR Cost PVR Cost PVR Cost PVR Cost PVR
NW 27Avenue RapidBus (old route
97)
This route would provide limited-stop servicealong NW 27 Avenue between theBroward/Miami-Dade county line and theMLK Metrorail station.
10 20 N/S $0 10 $0 10 $0 10 $0 10 $0 10 $0 10 $0 10 $0 10 $0 10
SW 8 StreetRapid Bus
This route would provide limited-stop servicealong SW 8 Street between West Miami-Dade (approximately SW 147 Avenue) andDowntown Miami.
15 30 N/S $750,000 8 $750,000 8 $750,000 8 $750,000 8 $750,000 8 $750,000 8 $750,000 8 $750,000 8
SR 836Express
This route would provide Express servicebetween west Miami-Dade County and theMIC and/or downtown Miami via the DolphinExpressway (SR836) during the morning andafternoon peak periods only every 15minutes. To be operated as one of thespecial use lanes project routes.
15 N/S N/S $500,000 6 $500,000 6 $500,000 6 $500,000 6 $500,000 6 $500,000 6 $500,000 6 $500,000 6 $500,000 6 $500,000 6
BiscayneRapid Bus
(old Route 93)
This route would provide limited-stop servicealong Biscayne Boulevard between Aventuraand Downtown Miami, and would be createdby adjusting the Biscayne MAX with peakheadways improvements.
12 20 N/S $1,200,000 14 $1,200,000 14 $1,200,000 14 $1,200,000 14 $1,200,000 14 $1,200,000 14 $1,200,000 14 $1,200,000 14 $1,200,000 14 $1,200,000 14
Flagler RapidBus (old
Route 51)
This route would provide limited-stop servicealong Flagler Street between west Miami-Dade County and Downtown Miami, andwould be created by adjusting the FlaglerMAX with peak headways improvements.
15 30 N/S $1,200,000 15 $1,200,000 15 $1,200,000 15 $1,200,000 15 $1,200,000 15 $1,200,000 15 $1,200,000 15 $1,200,000 15 $1,200,000 15 $1,200,000 15
INCREMENTAL TOTALS $2,900,000 35 $2,900,000 10 $3,650,000 8 $3,650,000 0 $3,650,000 0 $3,650,000 0 $3,650,000 0 $3,650,000 0 $3,650,000 0 $3,650,000 0
(MINI-BUSES) 0 0 0 0 0 0 0 0 0 0
(FULL SIZE BUSES) 35 10 8 0 0 0 0 0 0 0
CUMULATIVE TOTALS $2,900,000 35 $5,800,000 45 $9,450,000 53 $13,100,000 53 $16,750,000 53 $20,400,000 53 $24,050,000 53 $27,700,000 53 $31,350,000 53 $35,000,000 53
(MINI-BUSES) 0 0 0 0 0 0 0 0 0 0
(FULL SIZE BUSES) 35 45 53 53 53 53 53 53 53 53
20192018 2020NewRoute
Headways 2011 2016 20172012 2013 2014 2015Description

Annual Update7.0 - Ten Year Implementation Program
T R A N S I T D E V E L O P M E N T P L A N F Y 2 0 1 1 - 2 0 2 07-17
Figure 7-2: Recommended Service Plan New Transit Routes
Source: Miami-Dade Transit, 2010

T R A N S I T D E V E L O P M E N T P L A N F Y 2 0 1 1 - 2 0 2 07-18
Annual Update7.0 - Ten Year Implementation Program
7.2.2.1 Transit Hubs and Feeder Routes for New Routes
The 2020 RSP provided that nine (9) transit hubs were proposed for implementation in locationsthroughout the county. As a result, these new bus routes would serve local corridors andstations, while also providing connecting service to transit hubs. Table 7-5 provides a summaryoverview of the new routes that have been added to provide additional service to identifiedtransit hub locations.
The 2009 MDT TDP Major Update RSP included nine (9) proposed new transit routes of whicheight (8) were unfunded or partially funded. Four (4) new proposed routes listed in the tableserve as replacements for old existing routes. In total, five (5) of the nine (9) recommended newtransit routes were implemented following the 2009 MDT TDP Major Update.
Table 7-5: Transit Hub Locations and Feeder Routes for New Routes
Terminals
RoutesBiscayne
Rapid Bus(Old Route 93)
Flagler RapidBus
(old Route 51)
NW 27 AvenueRapid Bus
(old route 97)SR-836Express
SW 8th StreetRapid Bus
DadelandMetrorail StationsFlaglerMarketplace(CBD)Homestead(Busway/SW344th Street)Miami Beach -LincolnRd/WashingtonMiamiInternationalCenter (Airport)NortheastPassengerActivities CenterWest Dade(Dolphin Station)West Kendall(Kendall TownCenter)7th AvenueTransit Village (at62nd St)Source: Miami-Dade Transit, 2010

Annual Update7.0 - Ten Year Implementation Program
T R A N S I T D E V E L O P M E N T P L A N F Y 2 0 1 1 - 2 0 2 07-19
7.2.3 Recommended Service Plan – Metrorail
The Metrorail expansion program continues to progress with the construction of the Orange LinePhase 1: Earlington Heights-Miami Intermodal Center (MIC) Connector. The service willoperate on the new section of elevated tracks being constructed between the MIC andEarlington Heights and share the existing elevated tracks currently used for the Stage 1 linefrom Palmetto to Dadeland South station on Stage 1 (Figure 7-3).
Figure 7-3: Proposed Operating Plan with MIC-Earlington Heights Connector in Service
Source: Miami-Dade Transit, 2009

T R A N S I T D E V E L O P M E N T P L A N F Y 2 0 1 1 - 2 0 2 07-20
Annual Update7.0 - Ten Year Implementation Program
Once in service this Metrorail extension will provide a premium transit service connection to theMIC with a proposed 6.5-minute headway during the peak AM and PM travel times. TheEarlington Heights-MIC Connector is will operate to provide direct service between the MIC andDadeland stations. For those passengers boarding at the MIC a transfer will be required at theEarlington Heights station in order to reach the Palmetto station. The existing Stage 1 Metrorailwill operate at 7.5 minute headways during the peak AM and PM travel times between thePalmetto station and Dadeland station (Figure 7-3).
This new Metrorail service will also provide rail connection to the Miami International Airport viathe MIA PeopleMover line operated by Miami-Dade Aviation Department that will provideservice between the Airport and the MIC at 90-second headways (Figure 7-3). In FY 2012,construction is scheduled to be complete with the Earlington Heights-MIC Connector openingfor passenger service.
Service improvements to the Metrorail System are linked to the expansion program and to theMetrorail Vehicle Replacement Program as previously discussed in the capital improvementplan committed section of this chapter.
7.2.4 Recommended Service Plan – Special Transportation Services
No significant changes are programmed as part of the FY 2011-2020 RSP. MDT is committedto continue improvement of service reliability during this period.
7.3 Capital Needs
7.3.1 Transit Terminals
As identified in the 2019 RSP, the modified grid system requires the development of transit hubsthroughout the region of service. Table 7-6 lists the capital needs identified for transit hublocations along with their respective status and funding needs for the 2020 RSP. This isfollowed by a list of proposed Park and Ride locations.

Annual Update7.0 - Ten Year Implementation Program
T R A N S I T D E V E L O P M E N T P L A N F Y 2 0 1 1 - 2 0 2 07-21
Table 7-6: 2020 Recommended Service Plan Transit Hub Needs
Transit Hubs Status UnfundedNeeds
Flagler Marketplace
The existing downtown Miami bus terminal site will be expandedone block to the north as part of the Flagler Street Marketplaceproject. Additional upgrades are needed to provide necessarypassenger amenities. The 2020 RSP provides the need foradded bus bays at this location.
$3,185,000
Dadeland Stations
Both the Dadeland North and Dadeland South Metrorail stationsprovide a high degree of passenger amenities which in turn offerpassengers efficient and convenient transfers. In addition to thekiosk placed at Dadeland South, the following is the cost for asimilar kiosk at the Dadeland North station.
$23,000
West Kendall
A West Kendall hub is sought to address regional servicelinkages and as a western terminus of the Kendall "PriorityTransit" Corridor. Currently, private developers have includedthe construction of a transit terminal in their developmentproposal. This station will be constructed through private/publicpartnership.
CommittedImprovement
Northeast PAC
This facility will be developed as an enhanced bus hub thatwould connect circulator, regional, and premium bus routeswithin the area. The transit hub would replace and/or supplementthe existing bus terminal located in the vicinity of the Mall at 163rd
Street. There are currently (2010) twelve bus routes that servethe area. It is planned that this facility will be part of a TOD forthis area. MDT is seeking funding from state to implement thisterminal.
CommittedImprovement
Miami IntermodalCenter (MIC)
FDOT is managing this project. FDOT has over $400 millionprogrammed for the MIC distributed among 17 projects. Theseinclude the rental car HUB, the MIC Core Roadway andintersection improvements, transit connections to the terminalbuilding, utilities relocation, etc. Phase I (MIC Core) includes thebus terminal facilities and infrastructure to coordinate with othermodes.
CommittedImprovement
Homestead Busway atSW 344 Street
The facility is proposed to address the increased level of servicesplanned in the south Miami area with the completion of the SouthMiami-Dade Busway extension. This facility will be integratedwith the Busway facility to offer a greater degree of passengerconvenience.
CommittedImprovement
Miami Beach at LincolnRoad and Washington
Avenue
A bus terminal is planned to be built at the site adjacent to theLincoln Road. Committed
Improvement
NW 7th Avenue and62nd Street
This facility will be developed as a multimodal Passenger ActivityCenter (PAC), and located on NW 7th Avenue and NW 62nd
Street as proposed in the City of Miami’s Transportation CorridorStudy. This PAC will promote accessible public transportationand economic development throughout the City of Miami’sTransportation Corridor (NW 7th Avenue between 54 Street andNW 95Street) utilizing a “Transit Village Vision” concept. Thecenter will provide much needed parking relief; promote the useof park-and-ride, and access to privately operated taxi and Jitneyservices.
CommittedImprovement

T R A N S I T D E V E L O P M E N T P L A N F Y 2 0 1 1 - 2 0 2 07-22
Annual Update7.0 - Ten Year Implementation Program
Table 7-6: 2020 Recommended Service Plan Transit Hub Needs (Continued)
Transit Hubs Status UnfundedNeeds
West Dade
This facility is committed to be constructed by private developers.The location slated for the terminal is at NW 12 Street, west ofNW 107th Avenue. The developer has committed to build forMDT a park and ride garage with 260 spaces, 10 bus bays and adriver’s comfort station.
CommittedImprovement
Table 7-7: Proposed Park and Ride LocationsMapID NAME LOCATION
1 Busway Lot Busway and SW 216th Street2 Kendall South/Metrozoo Miami Metrozoo Park3 FPL Lot SW 72nd Street and SW 136th Court4 FPL Lot SW 104th Street and SW 127th Avenue5 West Miami-Dade/SW Eight Street Park and Ride SW 8 Street and SW 147th Avenue6 Bird Central Park and Ride Tropical Park7 West Miami-Dade/Tamiami Park and Ride Tamiami Park8 El Portal Park and Ride Biscayne Boulevard and NE 79th Street9 Church at Kendall and 150th Avenue (purchase) Kendall drive and 150th Avenue10 County Line Park and Ride NW 27th Avenue and NW 215th Street
Source: Miami-Dade Transit, 2010
7.3.2 Bus Fleet Expansion
The 2020 RSP service improvements identify the peak vehicle requirements (PVR) fordesignated bus routes. A determination of bus fleet needs based on the 2020 RSP, whichaccounts for a 20 percent (20%) vehicle spare ratio results in a total requirement of 80 full sizebuses. This fleet need also includes new service routes. Based on the RSP, there will be noadditional purchase needs of minibuses.
7.3.3 Priority Transit Corridor Needs
The TDP Major Update identified eleven priority transit corridors as unfunded needs. Each ofthese corridors currently have existing Metrobus service but due to growing travel demands,traffic congestion, and estimated population and land use changes warrant consideration fornew capital investment. The types of capital investment include additional infrastructure thatwould allow bus service to improve travel time. This could include priority signalization, stylizedstations with shelters, onboard Wi-Fi, real time information systems at bus stops, as well as theimplementation of a branded bus service that would include new transit vehicles.
The Table 7-8 presents the proposed priority corridors together with recommended timeframefor implementation as well as an opinion of the approximate estimated cost for each corridor.

Annual Update7.0 - Ten Year Implementation Program
T R A N S I T D E V E L O P M E N T P L A N F Y 2 0 1 1 - 2 0 2 07-23
Table 7-8: Priority Transit Corridors
Year ofImplementation Priority Transit Corridors
Possible Typesof
Improvements
2010CapitalCost
(000's)
2011 US 1 (Biscayne Boulevard) from DowntownMiami to County line
Station upgrades,Queue jumplanes, traffic
signalpriority/pre-
emption, off-busfare collection
system,passengerinformation
systems
$97,000
2012NE 167th/163rd/Sunny Isles Boulevard fromGolden Glades Tri-Rail Station to CollinsAvenue
$38,700
2013 NW 135th Street from NW 12th Avenue to US 1 $24,200
2014 NW 36th Street/Julia Tuttle Causeway from Tri-Rail Hialeah Market Station to Collins Avenue $62,900
2015 West 12th Avenue from Okeechobee MetrorailStation to NW 186th Street $48,100
2016 SW 107th Avenue from SW 40th Street to NW25th Street $29,400
2017 Flagler Street from SW 107th Avenue toDowntown $74,800
2018 SW 8th Street from SW 107th Avenue toDowntown $73,200
2018 SW 72nd Street from 117th Avenue to US1/Busway $38,100
2019 Kendall Drive from 137th Avenue to US1/Busway $44,600
2019 Coral Reef Drive from 137th Avenue to US1/Busway $30,300
Total $561,300
7.4 Infrastructure Renewal Program NeedsThe following table identifies a number of proposed projects that have been determined by MDTas necessary for the upkeep and maintenance of existing infrastructure to ensure the MDTtransit system operates in a state of good repair. The infrastructure renewal program (IRP)includes planned investments in the following program areas:
Information technology, including data center modernization, network upgrades, andimproved accident/incident reporting;
Passenger amenities, including escalator covers and improved signage;
Passenger facilities, including escalator and elevator replacements, Busway improvements,and platform refurbishments;

T R A N S I T D E V E L O P M E N T P L A N F Y 2 0 1 1 - 2 0 2 07-24
Annual Update7.0 - Ten Year Implementation Program
Rolling stock, including bus maintenance component replacements (bus vehicle fleetreplacement schedule is provided in the Appendix);
Systems, including wayside overhauls, uninterrupted power supplies, AC unit substations,train control system replacement, traction power substations, and traction power cabling;
Maintenance facilities, including bus garage lot resurfacing, emergency backup generators,and A/C replacement;
Safety and security, including fire alarm replacement, railing replacements, and pedestriansafety improvements; and,
Track and guideway, including guideway painting, frog replacement, and work vehicles.
These investments are critical to the continued safe and efficient operation of MDT’s transitnetwork. The proposed year of implementation is also presented for the FY 2011- 2020planning horizon (Table 7-9).
Table 7-9: Proposed Infrastructure Renewal Program Need (2020)
Classification Project Name 2011 2012 2013 2014 2015 2016 2017 2018 2019 2020Total
EstimatedCost YOE
Information TechnologyMDT CAD/AVL SystemUpgrade/Enhancements 6.20$ 3.37$ - - - - - - - - 9.57$
Information Technology Uninterrupted Power Supply forNetwork Equipment 0.44$ 0.01$ 0.01$ 0.01$ 0.08$ 0.01$ 0.01$ 0.01$ 0.10$ 0.01$ 0.68$
Information TechnologyMobile Technology Tools & Bus DriverTraining System -Vigil 0.04$ 0.05$ 0.05$ 0.05$ 0.05$ 0.05$ 0.05$ 0.05$ 0.05$ 0.05$ 0.47$
Information Technology Static Technology Tools 0.18$ 0.19$ 0.19$ 0.20$ 0.20$ 0.21$ 0.22$ 0.23$ 0.23$ 0.24$ 2.08$
Information Technology Server Plan Upgrade/Strategy 0.29$ 0.15$ 0.15$ 0.15$ 0.15$ 0.15$ 0.16$ 0.16$ 0.16$ 0.16$ 1.67$
Information Technology Multi-functionCopier/Fax/Printer/Scanner Services 0.62$ 0.32$ 0.34$ 0.35$ 0.36$ 0.37$ 0.38$ 0.40$ 0.41$ 0.42$ 3.95$
Information Technology Data Center Modernization - - - - - - 0.33$ - - - 0.33$
Information Technology MDT Network Upgrade/Enhancements 0.53$ 0.28$ 0.29$ 0.30$ 0.31$ - 0.33$ 0.34$ 0.35$ 0.36$ 3.07$
Information Technology Data Warehouse - - - 0.32$ - - - 0.36$ - - 0.68$
Information Technology Voice / Data Communication 0.25$ 0.13$ 0.14$ 0.14$ 0.14$ - 0.15$ 0.16$ 0.16$ 0.17$ 1.44$
Information Technology Bus Accidents and Incidents SystemReplacement -$ -$ -$ -$ -$ -$ -$ -$ 0.11$ - 0.11$
Information Technology Electronic Kiosks -$ -$ -$ -$ -$ -$ -$ -$ -$ 0.49$ 0.49$
Information Technology Bus Diagnostic Systems -$ -$ -$ -$ -$ -$ -$ 0.08$ -$ -$ 0.08$
Information Technology Financial Systems Replacement -$ -$ -$ -$ 0.17$ -$ -$ -$ -$ -$ 0.17$
Information Technology Personal / Payrol l SystemsReplacement -$ -$ -$ -$ 0.26$ -$ -$ -$ -$ -$ 0.26$
INFORMATION TECHNOLOGY

Annual Update7.0 - Ten Year Implementation Program
T R A N S I T D E V E L O P M E N T P L A N F Y 2 0 1 1 - 2 0 2 07-25
Table 7-9: Proposed Infrastructure Renewal Program Need (2020) (continued)
Classification Project Name 2011 2012 2013 2014 2015 2016 2017 2018 2019 2020Total
EstimatedCost YOE
Passenger AmenitiesMetromover Escalator Covers &Escalator Replacement andGovernment Center Canopy Extension
1.97$ 2.06$ 2.13$ -$ -$ -$ -$ -$ -$ -$ 6.16$
Passenger Amenities Map Cabinet Replacements -$ -$ -$ -$ -$ 0.06$ 0.09$ -$ -$ -$ 0.15$
Passenger AmenitiesTrailblazer (Wayfinding) SignReplacements -$ -$ -$ -$ -$ 0.06$ 0.03$ -$ -$ -$ 0.09$
Passenger AmenitiesCorporate Identity Signage for BusTerminals -$ -$ -$ -$ -$ 0.04$ -$ -$ -$ -$ 0.04$
Passenger Amenities Map Cabinet Replacements -$ -$ -$ -$ -$ 0.06$ -$ -$ -$ -$ 0.06$
Passenger AmenitiesPermanent Signage Replacements for"Overtown" Station -$ -$ -$ -$ -$ 0.07$ -$ -$ -$ -$ 0.07$
PASSENGER FACILITIES
Passenger Facilities Escalators Replacement/ElevatorsRefurbishment 3.86$ 2.03$ 2.10$ 2.18$ 2.24$ 2.32$ 2.39$ 2.48$ 2.56$ 2.64$ 24.79$
Passenger Facilities Metrorail Piers & Guideway Coating -$ -$ -$ -$ -$ 0.77$ 0.81$ 0.35$ - - 1.93$
Passenger Facilities
SouthMiami-Dade Busway 1/4 MileRadius ADA Improvements BetweenSW 200 & 88 Street (ADAAccessibility on the Busway).
-$ -$ -$ -$ -$ 0.30$ 1.87$ -$ -$ -$ 2.17$
Passenger FacilitiesRequest for Proposal (RFP) forFunctional Assessment of STSApplicants
0.89$ 0.89$ 0.87$ 0.86$ 0.86$ 0.85$ 0.84$ 0.83$ 0.83$ 0.82$ 8.53$
Passenger FacilitiesParking Garages Relamping(Induction) -$ -$ -$ -$ -$ 0.41$ 0.43$ 0.44$ 0.45$ - 1.73$
Passenger Facilities Metrorail Relampling -Stations 0.09$ 0.09$ 0.10$ 0.10$ 0.11$ 0.11$ 0.11$ 0.11$ 0.12$ 0.12$ 1.05$
Passenger FacilitiesReplace Elevator Machine Room &Cab Ventilation 0.08$ - - - - - - - - - 0.08$
Passenger Facilities Metrorail Station Refurbishment / DoorReplacement at Metromover 0.84$ 0.87$ 0.84$ 0.93$ 0.96$ 0.99$ 1.03$ 1.06$ 1.10$ 1.13$ 9.74$
Passenger Facilities Metromover Escalator Covers &Escalator Replacement 0.02$ 2.06$ 2.13$ - - - - - - - 4.21$
Rolling Stock Phase 2 Vehicle Door System Facelift - - - - - - - - 1.06 - 1.06$
Rolling Stock Mover F & G Inspections 0.86$ - - - - - - - 0.39$ 0.41$ 1.66$ Rolling Stock Phase 2 Vehicle HVAC Facelift - - - - - - - - 1.00$ - 1.00$
Rolling StockBus Maintenance ComponentReplacemetn Plan 0.95$ 3.14$ 3.44$ 2.68$ 2.77$ 2.86$ 2.96$ 3.05$ 3.15$ 3.26$ 28.25$
Rolling Stock Rail HVAC Overhaul -$ - - - 0.41$ - - - - - 0.41$
Rolling Stock Purchase of Service & SupportVehicles -$ -$ -$ -$ -$ -$ 0.88$ - - 0.31$ 1.19$
PASSENGER AMENITIES
ROLLING STOCK (Note: IRP assumes, for buses, mid-life overhaul intervals only. No bus overhaul is assumed after the year 2025 due totechnological improvements (hybrid technology starting in the year 2019).

T R A N S I T D E V E L O P M E N T P L A N F Y 2 0 1 1 - 2 0 2 07-26
Annual Update7.0 - Ten Year Implementation Program
Table 7-9: Proposed Infrastructure Renewal Program Need (2020) (continued)
Classification Project Name 2011 2012 2013 2014 2015 2016 2017 2018 2019 2020
Systems Data Transmission System - Mover -$ -$ -$ -$ 4.16$ -$ -$ -$ -$ -$ Systems Conduit Grounding Rebuild -$ -$ -$ -$ 1.94$ 0.97$ -$ -$ -$ -$
Systems Uninterrupted Power Supplies - Mover -$ -$ -$ -$ -$ 1.73$ 1.75$ -$ 0.49$ -$
Systems Wayside Overhaul -$ -$ -$ -$ -$ 29.25$ 15.00$ -$ -$ -$
Systems Switch Machine Cable- Mainline -$ -$ -$ -$ -$ 0.88$ 0.91$ 0.88$ 0.89$ -$
SystemsRebuild Switch Machines (M-3) -Mainline -$ -$ -$ -$ -$ 0.40$ 0.21$ 0.21$ - -$
Systems Tools and Equipment -$ 0.05$ 0.05$ 0.08$ 0.10$ 0.05$ 0.05$ 0.05$ 0.06$ 0.06$
Systems Bus Garages Plumbing -$ -$ 0.39$ -$ - 0.25$ 0.26$ 0.50$ 0.51$ 0.53$
SystemsUninterrupted Power Supply -Government Center -$ -$ -$ -$ -$ -$ 0.08$ - -$ -$
SystemsCAD/AVL RF Vehicular RadioReplacement -$ -$ -$ -$ -$ -$ - 4.65$ -$ -$
Systems Lehman and Mover Facility Plumbing -$ -$ -$ -$ -$ -$ 0.86$ - -$ -$
Systems Replace Switch Machines - Yard -$ -$ 0.20$ 0.20$ 0.20$ 0.21$ 0.22$ 0.23$ -$ -$
Systems AC Unit Substations -$ -$ -$ -$ 2.94$ 2.96$ 3.02$ 3.02$ 3.16$ -$ Systems Running Surface -$ -$ -$ -$ -$ -$ -$ -$ 3.01$ -$
Systems Traction Power Substation - PalmettoYard -$ -$ -$ -$ 1.23$ 1.22$ -$ -$ -$ -$
Systems AC Unit Substations - Palmetto Yard -$ -$ -$ -$ 1.09$ 1.10$ -$ - - -$ Systems Train Control Systems Replacement -$ -$ -$ -$ -$ -$ 14.33$ 13.70$ 12.86$ 13.43$Systems Traction Power Substations -$ -$ -$ -$ 5.47$ 5.38$ 5.01$ 4.76$ 4.94$ -Systems Switch Machine Cable - Yard -$ -$ -$ -$ 0.78$ 0.81$ 0.83$ 0.86$ 0.89$ 0.92$Systems Replace Switch Machines - Mainline -$ -$ -$ -$ 0.45$ 0.46$ 0.47$ 0.42$ -$ -$
Systems LED Signal Upgrades -$ -$ -$ -$ -$ -$ -$ -$ -$ 0.14$
Systems Traction Power Cabling -$ -$ -$ -$ 3.68$ 3.80$ 4.12$ 4.06$ 4.19$ -$
Systems Traction Power Gap Ties -$ -$ -$ -$ 0.92$ 0.90$ 0.93$ -$ -$ -$
SystemsUninterrupted Power Supply - Mainline(Metrorail) -$ -$ -$ 1.74$ 1.80$ -$ -$ -$ -$ -$
Systems Traction Power Cable Requirement -$ -$ -$ -$ -$ 1.24$ -$ -$ -$ -$
Maintenance Facilities Lifts Replacement for Rail and Bus -$ -$ -$ -$ -$ 1.65$ -$ -$ -$ -$Maintenance Facilities Lehman Center Yard Tower Upgrade -$ -$ -$ -$ -$ 0.85$ 2.99$ 1.01$ -$ -$
Maintenance Facilities Replace air compressors at all buslocations -$ -$ -$ -$ -$ 0.92$ 0.60$ -$ -$ -$
Maintenance Facilities A/C & Chiller Unit Replacement -$ -$ -$ -$ -$ 2.42$ 0.14$ 0.14$ 0.14$ 0.38$
Maintenance Facilities Bus Garages: Roofs -$ -$ -$ -$ -$ -$ 0.90$ 0.63$ 0.65$ 0.68$
SYSTEMS
MAINTENANCE FACILITIES

Annual Update7.0 - Ten Year Implementation Program
T R A N S I T D E V E L O P M E N T P L A N F Y 2 0 1 1 - 2 0 2 07-27
Table 7-9: Proposed Infrastructure Renewal Program Need (2020) (continued)
Classification Project Name 2011 2012 2013 2014 2015 2016 2017 2018 2019 2020Total
EstimatedCost YOE
Maintenance Facilities Metrobus: A/C Replacement -$ -$ -$ -$ -$ 0.56$ -$ -$ -$ -$ 0.56$
Maintenance FacilitiesCentral O & I Garage Shop FloorLeveling -$ -$ -$ -$ -$ 0.97$ -$ -$ -$ -$ 0.97$
Maintenance FacilitiesSecondary Guide Rails for BusWashes -$ -$ -$ -$ -$ -$ -$ -$ -$ -$ -$
Maintenance Facilities ETS - Telephone Cable Replacement -Rai l
-$ -$ -$ -$ -$ 0.44$ 0.23$ 0.24$ 0.25$ -$ 1.16$
Maintenance FacilitiesRepairs at Central Bus FacilityStorage Building for 40 Year BuildingRecertification
-$ -$ -$ -$ -$ -$ -$ -$ -$ -$ -$
Maintenance Facilities Emergency Backup Generators -$ -$ -$ -$ -$ 1.94$ -$ -$ -$ -$ 1.94$
Maintenance FacilitiesFlood mitigation at William LehmanFacility -$ -$ -$ -$ -$ 0.06$ -$ -$ -$ -$ 0.06$
Maintenance Facilities Tire Servicing EquipmentReplacement -$ -$ -$ -$ -$ 0.23$ -$ -$ -$ -$ 0.23$
Maintenance Facilities Currency Counters -$ -$ -$ -$ 0.11$ 0.08$ -$ -$ -$ -$ 0.19$
Maintenance Facilities Mover and Lehman Facility - WaterMain -$ -$ -$ -$ -$ 0.32$ -$ -$ -$ -$ 0.32$
Maintenance Facilities Rennovation of Drainfield -$ -$ -$ -$ -$ 0.15$ -$ -$ -$ -$ 0.15$
Maintenance Facilities Bus Garages: Lot Resurfacing -$ -$ -$ -$ -$ 0.72$ 0.74$ 0.77$ -$ -$ 2.23$
Maintenance Facilities Lehman Facility Lot Resurfacing -$ -$ -$ -$ -$ 0.07$ -$ -$ -$ -$ 0.07$
Maintenance Facilities Mover Maintenance Facility - Lifts -$ -$ -$ -$ -$ 0.10$ -$ -$ -$ -$ 0.10$
Maintenance Facilities Bus Garages: Coral Way and Central -$ -$ -$ -$ -$ -$ -$ -$ 1.73$ -$ 1.73$
Maintenance Facilities Mover Maintenance Facility GeneralRefurbishment -$ -$ -$ -$ -$ -$ -$ 0.82$ -$ -$ 0.82$
Safety & Security Lehman Facility - Fire Systems -$ -$ -$ -$ -$ 1.57$ -$ -$ -$ -$ 1.57$
Safety & Security Metrorail: Fire Systems -$ -$ -$ -$ -$ 1.16$ -$ -$ -$ -$ 1.16$
Safety & Security Parking Garages - Fire Suppression -$ -$ -$ -$ -$ 0.95$ -$ -$ -$ -$ 0.95$
Safety & SecurityMover Maintenance Facility - FireSystems -$ -$ -$ -$ -$ 0.29$ -$ -$ -$ -$ 0.29$
Safety & SecurityExisting Metrorail Stations Repair toStair Railing (Part 2) 0.20$ 0.17$ 0.41$ 0.12$ 0.30$ -$ -$ -$ -$ -$ 1.20$
Safety & Security Pedestrian Safety Improvements atCoconut Grove Metrorail Station 0.96$ -$ -$ -$ -$ -$ -$ -$ -$ -$ 0.96$
Safety & Security Rai l Fire Alarm and Halon ReplacementProject
-$ -$ -$ -$ -$ 2.12$ -$ -$ -$ -$ 2.12$
Safety & Security SMI and OKE Garages Fire AlarmReplacement Project
-$ -$ -$ -$ -$ 0.41$ -$ -$ -$ -$ 0.41$
Safety & Security Mover Fire Alarm and HalonReplacement Project
-$ -$ -$ -$ -$ 2.39$ -$ -$ -$ -$ 2.39$
SAFETY & SECURITY

T R A N S I T D E V E L O P M E N T P L A N F Y 2 0 1 1 - 2 0 2 07-28
Annual Update7.0 - Ten Year Implementation Program
Table 7-9: Proposed Infrastructure Renewal Program Need (2020) (continued)
Source: Miami-Dade Transit, Infrastructure Renewal Program Existing System FY 2009-10 (April 21,2009) (PRO-FORMA IRP) IRP is partially funded.
Classification Project Name 2011 2012 2013 2014 2015 2016 2017 2018 2019 2020Total
EstimatedCost YOE
Safety & Security SPCC Fire Alarm and Halon ReplacementProject
-$ -$ -$ -$ -$ 2.60$ -$ -$ -$ -$ 2.60$
Safety & Security Safety Walkway Sections for theMetromover Test Track
-$ -$ -$ -$ -$ 0.37$ -$ -$ -$ -$ 0.37$
Safety & Security Bus Garages: Fire Suppression -$ -$ -$ -$ -$ -$ -$ 0.84$ -$ -$ 0.84$
Safety & Security Emergency Plumbing Fixtures -$ -$ -$ -$ -$ 0.23$ -$ -$ -$ -$ 0.23$
Safety & Security William Lehman Site Lighting -$ -$ -$ -$ -$ 0.50$ -$ -$ -$ -$ 0.50$
Safety & Security Metromover Bridge Navigational Lights -$ -$ -$ -$ -$ 0.04$ -$ -$ -$ -$ 0.04$
Safety & SecurityMetromover Public Address SystemReplacement -$ -$ -$ -$ -$ -$ -$ -$ 3.11$ -$ 3.11$
Safety & SecurityRail Public Address SystemReplacement -$ -$ -$ -$ -$ -$ -$ -$ 2.81$ -$ 2.81$
Safety & Security Rebuild MLK Park-and-Ride Garage -$ -$ -$ -$ -$ 0.42$ -$ -$ -$ -$ 0.42$
Safety & Security DLN Garage Fire Alarm ReplacementProject
-$ -$ -$ -$ -$ -$ -$ -$ -$ 0.46$ 0.46$
Track & Guideway Replacement Work Vehicles 10-15Year Plan -$ 0.81$ 0.39$ 0.36$ 0.41$ 0.31$ 0.20$ 0.20$ 0.19$ 0.20$ 3.07$
Track & Guideway Fastener Replacement Station Areas -$ -$ -$ -$ 1.07$ 1.05$ 1.02$ 1.03$ 1.10$ -$ 5.26$
Track & GuidewayMetromover Brickell ExtensonGuideway Painting -$ -$ 5.17$ -$ -$ -$ -$ -$ -$ -$ 5.17$
Track & Guideway Metromover Inner Loop GuidewayPainting -$ -$ -$ -$ 9.53$ -$ -$ -$ -$ -$ 9.53$
Track & GuidewayMetromover Omni ExtensonGuideway Painting -$ -$ -$ -$ -$ 7.26$ -$ -$ -$ -$ 7.26$
Track & GuidewayMetrorail Steel Box Girder GuidewayPainting -$ -$ -$ -$ -$ 5.22$ 7.83$ -$ -$ -$ 13.05$
19.32$ 16.70$ 19.43$ 10.79$ 45.30$ 99.68$ 75.82$ 49.15$ 53.23$ 27.44$ 416.87$
TRACK & GUIDEWAY
TOTALS:

Annual Update8.0 - Financial Plan
T R A N S I T D E V E L O P M E N T P L A N F Y 2 0 1 1 - 2 0 2 08-1
8.0 Financial Plan
8.1 IntroductionThe TDP financial section provides estimated costs and financial resources for Miami-DadeTransit to provide existing and planned new services from FY 2011 through FY 2020. It isthrough the development of this TDP Annual Update that MDT considers which serviceimprovements can be achieved and when those service improvements should be implemented.
The source document that provides MDT’s accounting of projected expenses and revenues isknown as the “People’s Transportation Plan (PTP) Pro Forma” (or the Pro Forma). The ProForma is regularly updated through collective efforts of both MDT and the County’s Office ofStrategic Business Management. The current Pro Forma projects MDT’s expenses andrevenues for thirty years, through FY 2040. This TDP Annual Update relies directly on the firstten years (FY 2011-2020) of Pro Forma projections.
8.2 Operating ExpensesIn FY 2011 the direct operating budget for MDT is projected to be $466 million. The primarycomponents of the direct operating expenses are presented below to include the four transitmodes and professional support.
Table 8-1: MDT Projected FY 2011 Direct Operating Expenses
Source: RFRO (Working)
In addition to these direct operating expenses, MDT will support over $110 million of otheroperating expenses, debt service payments, and funding of reserves in FY 2011 as detailedbelow.
Direct OperatingExpense Category
Amount (000s)
Metrobus 220,360$
Metrorail 52,695$
Metromover 8,805$
STS/Paratransit 42,850$
Operational Support 106,407$
Customer Support -$
Executive Support 1,319$
Engineering 14,469$
Other 19,696$
TOTAL 466,601$

T R A N S I T D E V E L O P M E N T P L A N F Y 2 0 1 1 - 2 0 2 08-2
Annual Update8.0 - Financial Plan
Table 8-2: MDT Projected FY 2011 Other Operating Expenses
Source: Transit Proforma FY 2010-2011
In FY 2011, MDT will spend approximately $577 million in FY 2011 for the operation of thetransit system and support of MDT’s other local and regional responsibilities.
8.3 Projected Operating ExpensesApart from the expected 10 percent (10%) increase in Metrorail service associated with theopening of the Miami Intermodal Center – Earlington Heights Connector in 2012, MDT is notprojecting any increase in service levels for bus, rail, or Mover between FY 2011 – FY 2020.Therefore, nearly all growth in MDT operating expenses will come from inflationary costincreases. The key inflation assumptions that drive the cost projections, as included in the ProForma, are also summarized below.
Table 8-3: MDT Operating Expense Inflation Assumptions
Source: Transit Pro Forma FY 2010-2011
Direct OperatingExpense Category
Amount (000s)
Municipal Contribution 32,565$CITT Staff 2,514$SFRTA Contribution 4,235$Deficit & Loan Repayment 6,290$Public Works Support 2,916$Pre existing Debt 11,737$Reserves 20,722$Debt Service 29,491$TOTAL 110,470$
Expense Iten Annual Inflation Rate
Labor Increase- Merit 0% (2011)
2.0% thru 2015, and2.20% thereafter
Labor Increase-COLA 3% (2011) 2% (2012)2% (2013) 3% (2014)
3% (2015 and after)
Health Insurance 10% (2010-2014)
3.5% (2015 and after)Major Support Line Items 2.5%Inventory 1%Fuel 1%Maintenance 3.5%

Annual Update8.0 - Financial Plan
T R A N S I T D E V E L O P M E N T P L A N F Y 2 0 1 1 - 2 0 2 08-3
8.4 Operating RevenuesMDT’s transit operations are supported by a range of federal, state, local, and directly-generated revenue streams. Table 8-4 shows the projected agency operating revenues for FY2011 by major category.
Table 8-4: MDT Projected FY 2011 Operating Revenues
Source: Transit Pro Forma FY 2010-2011
8.5 Projected Operating RevenuesFuture revenue growth is projected to fluctuate with a low level of tax revenue growth resultingfrom the existing state of the economy. However, in years without any major policy changes,total available funding for MDT is expected to grow at slightly over three percent (3%) annually.In addition, MDT does foresee two separate major policy actions related to funding during FY2011 – FY 2020 to include:
Regular programmed fare increases: The Pro Forma projects a 25 cent increase in the basefare (from its current level of $2.00 to $2.25) in 2013, with another 25 cent increase levied in2017. These increases have the effect of increasing the overall revenue growth rate inthose years. These programmed fare increases every three years results from the Board ofCounty Commission approved policy that authorizes MDT to implement regular fareincreases to keep pace with inflation.
Additional local funding: In 2014, MDT anticipates to receive two additional local fundingsources to support operations -- the local option gas tax (LOGT) and County General Funds.Miami-Dade County currently imposes three of the five cents allowed under that fuel tax,and the Pro Forma assumes that the other two cents will be approved, levied, and collectedfor MDT’s use in 2014. The value of those additional two cents from the LOGT isapproximately $10 million annually. The second source is additional County General Funds,which is estimated at approximately $43.6 million in the first year.
The critical funding growth assumptions that drive the Pro Forma results are also outlinedbelow.
OperatingRevenue Category
Amount (000s)
Fare Revenues 98,797$Other Operating Revenues 12,493$Federal Grant Funds Used for PM 65,985$State Block Grant 18,764$Other State Operating Support 5,989$PTP Surtax 162,827$County General Funds 153,188$Local Option Gas Tax 16,720$Federal Grants 9,015$Interest, Reimbursement & Other 33,293$TOTAL 577,071$

T R A N S I T D E V E L O P M E N T P L A N F Y 2 0 1 1 - 2 0 2 08-4
Annual Update8.0 - Financial Plan
Table 8-5: MDT Operating Revenue Growth Assumptions
Source: Transit Pro Forma FY 2010-2011
8.6 Summary of Operating BudgetThe operating budget as presented in the 2010 Pro Forma for the ten-year period from FY 2011to FY 2020 is balanced. This means that all projected operating expenses are covered by theforecasted revenues from various local and non-local sources, and there is no funding gap.This balanced budget is achieved by a combination of cost efficiencies and service restructuringin Metrobus; an avoidance of any major service expansion except for the MIC-EarlingtonHeights Metrorail connector service; and aggressive use of available local funding sources(LOGT and general funds) during the second five years of the TDP.
Revenue Item Annual Growth Rate
PTP Surtax 2011: 1.0% 2012: 3.0%
2013+: 5.0%
General Funds (Maintenanceof Effort)
3.50%
Fare Revenue (Trip Growth) 2011: 0% 2012+: 1%
State Block Grant and Transp.Disadv. Funds
2011: 2% 2012+: 2%
Federal Funds2011: 5%and after
Local Option Gas Tax2011: 1.5%
and after 2014: 0.5%

Annual Update8.0 - Financial Plan
T R A N S I T D E V E L O P M E N T P L A N F Y 2 0 1 1 - 2 0 2 08-5
Table 8-6: MDT Operating Budget (FY 2011 - FY 2020)
Source: Transit Pro Forma FY 2010-2011 and RFRO (Working)
Operating Revenues 2011 2012 2013 2014 2015 2016 2017 2018 2019 2020 Total Fare Revenues $98,797 $99,785 $112,121 $113,242 $114,375 $115,518 $127,034 $128,304 $129,587 $141,336 $1,180,099 Other Operating Revenues $12,493 $12,618 $12,744 $12,872 $13,000 $13,130 $13,262 $13,394 $13,528 $13,663 $130,704 Federal Grant Funds Used for PM $65,985 $69,284 $72,748 $76,385 $80,204 $84,214 $86,319 $88,477 $90,689 $92,956 $807,262 State Block Grant $18,764 $19,139 $19,522 $19,913 $20,311 $20,717 $21,131 $21,554 $21,985 $22,425 $205,461 Other State Operating Support $5,989 $5,989 $5,989 $5,989 $5,989 $5,989 $5,989 $5,989 $5,989 $5,989 $59,890 PTP Surtax $162,827 $167,712 $176,098 $184,902 $194,148 $203,855 $214,048 $224,750 $235,988 $247,787 $2,012,114 County General Funds $153,189 $158,486 $163,969 $213,243 $220,424 $228,748 $237,398 $246,385 $255,724 $265,429 $2,142,995 Local Option Gas Tax $16,720 $14,777 $16,877 $26,932 $32,135 $32,481 $32,644 $32,807 $32,971 $33,136 $271,479Federal Grants $9,015 $0 $0 $0 $0 $0 $0 $0 $0 $0 $9,015 Interest, Reimbursements & Other $33,293 $47,294 $27,654 $28,925 $30,258 $31,657 $33,123 $34,662 $36,275 $37,968 $341,109 Total Revenues $577,072 $595,084 $607,721 $682,402 $710,843 $736,309 $770,947 $796,322 $822,737 $860,689 $7,160,128
Operating Expenses Metrobus $220,360 $228,073 $236,055 $244,317 $252,868 $261,719 $270,879 $280,359 $290,172 $300,328 $2,585,130 Metrorail $52,695 $54,539 $56,448 $58,424 $60,469 $62,585 $64,776 $67,043 $69,389 $71,818 $618,186 Metromover $8,805 $9,114 $9,432 $9,763 $10,104 $10,458 $10,824 $11,203 $11,595 $12,001 $103,299 STS/Paratransit $42,850 $44,350 $45,902 $47,509 $49,171 $50,892 $52,674 $54,517 $56,425 $58,400 $502,691 Operational Support $106,407 $110,131 $113,986 $117,975 $122,104 $126,378 $130,801 $135,379 $140,118 $145,022 $1,248,302 Customer Support $0 $0 $0 $0 $0 $0 $0 $0 $0 $0 $ Executive Support $1,319 $1,365 $1,413 $1,462 $1,514 $1,567 $1,621 $1,678 $1,737 $1,798 $15,474 Engineering $14,469 $14,975 $15,500 $16,042 $16,604 $17,185 $17,786 $18,409 $19,053 $19,720 $169,742 SFRTA Contribution $4,235 $4,235 $4,235 $4,235 $4,235 $4,235 $4,235 $4,235 $4,235 $4,235 $42,350 Deficit Repayment $6,290 $6,290 $6,290 $6,290 $6,290 $0 $0 $0 $0 $0 $31,450 Debt Service $29,491 $49,562 $61,997 $86,614 $104,711 $116,526 $131,105 $152,098 $159,959 $171,681 $1,063,744Municipal Contribution $32,565 $33,542 $35,220 $36,980 $38,830 $40,771 $42,810 $44,950 $47,198 $49,557 $402,423PTP Reserve $20,722 $20,723 $20,724 $20,725 $20,726 $20,727 $20,728 $20,729 $20,730 $20,731 $207,265PWD Project Management (Pay Go) $2,916 $3,003 $3,094 $3,186 $3,282 $2,380 $2,452 $2,525 $2,601 $2,679 $28,120CITT Staff $2,514 $2,514 $2,514 $2,514 $2,514 $2,589 $2,667 $2,747 $2,830 $2,914 $26,318Pre Existing Debt Service $11,737 $7,439 $7,439 $2,494 $2,494 $2,494 $0 $0 $0 $0 $34,097Other $19,379 $3,268 $3,754 $4,027 $7,160 $7,101 $7,186 $7,430 $7,848 $9,058 $76,212
Total Expenses $576,754 $593,124 $624,002 $662,558 $703,076 $727,607 $760,543 $803,303 $833,889 $869,943 $7,154,801
Annual Operating Surplus/(Deficit) 318 1,960 (16,281) 19,844 7,767 8,702 10,404 (6,981) (11,153) (9,253)Cumulative Operating Surplus/(Deficit) 318 2,278 (14,004) 5,841 13,608 22,310 32,714 25,733 14,580 5,327

T R A N S I T D E V E L O P M E N T P L A N F Y 2 0 1 1 - 2 0 2 08-6
Annual Update8.0 - Financial Plan
8.7 Capital Expenditures and Funding Sources
8.7.1 Planned Capital Expenditures
MDT’s planned capital expenditures for the period FY 2011 to FY 2020 are divided into twogroups: 1.) Those projects which will be financed with PTP-backed debt; and, 2.) Those projectswhich will be paid for on a “cash” basis with funding from various sources. For large capitalprojects (e.g., MIC-EH connector) or ongoing projects during FY 2011 – FY 2020 (such as busacquisition and replacement), these may be funded by a combination of debt proceeds andcash. A summary of the two groups of projects is provided below.
Table 8-7: Planned MDT Capital Expenditures FY 2011-2020
Source: Transit Pro Forma FY 2010-2011
Many of the listed projects, such as the vehicle replacements (for bus, rail, and peoplemover)and the guideway rehabilitation, will greatly improve the quality and longevity of the existingMDT transit system. However, most of the projects shown above are scheduled for completionon or before 2015. After 2015, the capital program consists only of scheduled bus acquisitionsand the Infrastructure Renewal Program (IRP), which is the agency’s long-term projection offuture rehabilitation and replacement needs throughout the MDT system.
PTP Debt-FinancedCapital Projects
Total Cost FY11-FY20 (000s)
Bus Acquisition 369,099
Mover Vehicle Replacement 12,779
Central Control Overhaul 27,251
MIC-EH Connector 179,189
Rail Vehicle Replacement 366,619
Track and Guideway Rehab 30,560
IRP (Infra. Renewal Prog.) 180,904
All Other Projects 705,153
TOTAL 1,871,554
Pay-as-you-go ("cash")Capital Projects
Total Cost FY11-FY20 (000s)
Bus Acquisition 0
MIC-EH Connector 0
All Other Projects (CI-LOGT) 13,318TOTAL 13,318

Annual Update8.0 - Financial Plan
T R A N S I T D E V E L O P M E N T P L A N F Y 2 0 1 1 - 2 0 2 08-7
8.8 Capital Funding SourcesAs noted, MDT’s capital projects between FY 2011 – FY 2020 will either be debt-financed orfunded on a pay-as-you-go basis. The debt financing is backed by the PTP surtax revenues, asprojected in the previous financial section. The “cash”-funded projects will be supported by acombination of funding sources, which are shown in the figure below. All of these fundingsources for pay-as-you-go capital will be concluded by 2015.
Table 8-8: Projected “Cash” Revenue Sources for Capital Projects, FY 2011-2020
Source: F2 Report, Transit Pro Forma FY 2010-2011
8.9 Summary of Capital PlanThe capital budget as presented in the 2010 Pro Forma for the ten-year period from FY 2011 toFY 2020 is balanced. There is no baseline capital funding gap and all projected capitalexpenditures will be funded with either PTP surtax debt proceeds or on a pay-as-you-go basiswith funds available from a variety of sources. This balanced budget is achieved by aggressiveborrowing against the PTP surtax (ultimately requiring the inclusion of additional LOGT andgeneral funds in MDT’s budget, as described above, to guarantee debt coverage).
Capital Funding Source Total Amount (000s)
Building Better Communities (BBC) 1,015$Future Bus Financing -$FTA Section 5307/5309 Formula Grant 91,403$CI-LOGT PAY GO 6,267$Pay Go Surtax -$FDOT Funds 83,181$TOTAL 181,866$

T R A N S I T D E V E L O P M E N T P L A N F Y 2 0 1 1 - 2 0 2 08-8
Annual Update8.0 - Financial Plan
Table 8-9: MDT Capital Budget (FY 2011 - FY 2020)
Source: MDTD Capital Book, F2 (revenue) and F5 (expense) Reports
Capital Revenues 2011 2012 2013 2014 2015 2016 2017 2018 2019 2020 TOTAL PTP Bond Program 220,064$ 110,158$ 76,496$ 148,090$ 154,929$ 44,620$ 14,276$ 768,633$ Building Better Communities (BBC) 1,015$ 1,015$ Future Financing -$ FTA Section 5307/5309 Formula Grant 121,629$ 82,087$ 77,247$ 78,990$ 82,986$ 87,081$ 530,020$ Local Option Gas Tax 17,458$ 17,720$ 17,986$ 18,255$ 18,529$ 18,807$ 108,755$ PTP Surtax (pay-as-you-go) -$ FDOT Funds 46,553$ 20,557$ 14,024$ 224$ 421$ 81,779$Total Capital Project Revenues 406,719$ 230,522$ 185,753$ 245,559$ 256,865$ 150,508$ 14,276$ -$ -$ -$ 1,490,202$
PTP Debt-Financed ProjectsBusway ADA Improvements 100$ 100$Lehaman Yard Rehab and Expnasion Phase 1 3,546$ 5,067$ 8,613$Bus Acquisition 13,108$ 8,434$ 12,917$ 21,402$ 16,589$ 72,450$Bus Tracker System/Computer Aided Dispatch 4,740$ 9,770$ 14,510$TOS Replacement 938$ 413$ 1,351$IRP 7,080$ 7,500$ 7,500$ 12,500$ 12,500$ 12,500$ 12,500$ 72,080$Mover Bicentennial Park Station Refurbishm 500$ 348$ 848$Mover Vehicle Replacement Phase ll (17 cars) 12,159$ 620$ 12,779$Central Control Overhaul 13,895$ 12,171$ 1,185$ 27,251$EH-MIC Connector 118,224$ 20,473$ 138,697$Rail Vehicle Replacement 25,969$ 28,878$ 48,420$ 108,685$ 121,731$ 31,260$ 1,676$ 366,619$Test Track for Metrorail 6,594$ 9,241$ 15,835$Track and Guideway Rehab Subset 7,413$ 7,243$ 6,377$ 5,503$ 3,589$ 30,125$NE Passenger Activity Center 97$ -$ 520$ 860$ 100$ 1,577$Park and Ride lot Kendall Dr 889$ 889$Park and Ride lot SW 168 St and Busway 700$ 700$Park and Ride lot SW 344 St 2,404$ 2,404$
Total PTP Debt-Financed Project Expenditures 220,064$ 110,158$ 76,496$ 148,090$ 154,929$ 44,620$ 14,276$ -$ -$ -$ 768,633$

Annual Update8.0 - Financial Plan
T R A N S I T D E V E L O P M E N T P L A N F Y 2 0 1 1 - 2 0 2 08-9
Table 8-9: MDT Capital Budget (FY 2011 - FY 2020) (Continued)
Source: MDTD Capital Book, F2 (revenue) and F5 (expense) Reports
Capital Revenues 2011 2012 2013 2014 2015 2016 2017 2018 2019 2020 TOTAL
Other Funding Sources Financed ProjectsAmericans with Disabilities Act Improv&Equip 240$ 252$ 265$ 278$ 292$ 307$ 1,634$Busway ADA Improvements 1,614$ 2,079$ 3,693$Graphics and Signage Upgrade 2,970$ 715$ 3,685$Bus Acquisition 2,626$ 4,028$ 14,617$ 187$ 21,458$Bus and Bus Facilities 2,797$ 2,797$Facilities and Equip Rehab 240$ 252$ 265$ 278$ 292$ 307$ 1,634$TOS Replacement 3,821$ 3,821$Bus Tools and Equipm 240$ 252$ 265$ 278$ 292$ 307$ 1,634$Rail Tools and Equipm 441$ 463$ 486$ 510$ 536$ 563$ 2,999$Passenger Amenities and Enhancements 519$ 545$ 572$ 601$ 631$ 662$ 3,530$Capitalization Preventative Maintenance 82,705$ 84,061$ 89,625$ 93,163$ 98,733$ 103,021$ 551,308$EH-MIC Bus Plaza 8,710$ 8,213$ 80$ 17,003$Kendall Enhanced Bus Service 2,320$ 2,320$Rail Bike Path 1,108$ 92$ 1,200$Mover Bicentennial Park Station Refurbishm 730$ 623$ 1,353$Mover Station Canopies 4,655$ 2,007$ 6,662$Central Control Overhaul 839$ 839$EH-MIC Connector 31,600$ 9,342$ 40,942$Mainline Turnout Replacement 435$ 435$Palmetto Station TPS 13,299$ 2,453$ 15,752$NE Passenger Activity Center 2,276$ 1,574$ 530$ 60$ 4,440$NW 7 Ave NW 62 St Passenger Activity Ctr 2,891$ 1,097$ 235$ 4,223$Park and Ride lot Kendall Dr 889$ 606$ 1,495$ARRA Municipalities 10,577$ 2,288$ 12,865$Park and Ride lot Quail Roost Dr 4,379$ 4,379$Park and Ride lot SW 168 St and Busway 700$ 700$Park and Ride lot SW 344 St 3,535$ 452$ 3,987$Security and Safety Equipm 1,775$ 544$ 571$ 600$ 630$ 661$ 4,781$
Total Other Funding Financed Projects 186,655$ 120,364$ 109,257$ 97,469$ 101,936$ 105,888$ -$ -$ -$ -$ 721,569$
Total Project Expenditures 406,719$ 230,522$ 185,753$ 245,559$ 256,865$ 150,508$ 14,276$ -$ -$ -$ 1,490,202$
Capital Funding Surplus/(Deficit) -$ -$ -$ -$ -$ -$ -$ -$ -$ -$ -$

T R A N S I T D E V E L O P M E N T P L A N F Y 2 0 1 1 - 2 0 2 08-10
Annual Update8.0 - Financial Plan
8.10 Unfunded Needs for New Service InitiativesMDT FY 2011 – FY 2020 TDP Annual Update is based upon four primary initiatives as identifiedby MDT that are currently unfunded, but which represent important areas of need to include:
Bus route improvements, including modifications to existing routes and the introduction ofnew routes, which have both a capital cost component and an operating cost component;
Significant capital investments in eleven (11) priority travel corridors that will improvecustomer comfort and Metrobus service quality and reliability;
Additional Capital Improvement Program (CIP) projects that represent selectiveimprovements to the existing transit network; and
The estimated capital and operating costs to support these service expansion and capitalinvestment initiatives between FY 2011 – FY 2020 are included. These unfunded project costsare presented in year-of-expenditure (YOE) dollars, according to the planned implementationschedules and inflation assumptions.
8.11 Bus Route ImprovementsMDT has identified a number of service improvements to existing routes as well as theimplementation of additional new routes based upon the availability of funding. The projectedYOE costs of implementing these services are presented in Table 8-10. The operating costsrecur annually after the service is introduced. For all these replacement vehicles, a 20 percent(20%) vehicle spare ratio is assumed, and bus costs are assumed to be $600,000 per hybridvehicle in 2011 dollars, which grows at a five percent (5%) annual cost inflation over the tenyear period.
Table 8-10: Proposed Bus Route Improvements (Unfunded)
Source: MDT; YOE capital costs assume a 5% annual cost inflation rate; YOE operating costs assume a3.5% annual cost inflation rate
8.12 Priority CorridorsEleven priority corridors were identified as part of last year’s TDP Major Update. Theseproposed capital/service improvement projects remain unfunded. Table 8-11 shows theunfunded capital cost associated with these priority corridor improvements.
2011 2012 2013 2014 2015 2016 2017 2018 2019 2020 TOTALExisting Routes
Operating Costs 1.2$ 4.5$ 10.6$ 10.9$ 11.9$ 12.3$ 12.8$ 13.3$ 13.8$ 14.3$ 105.8$
Capital Costs 2.9$ 8.6$ 10.1$ -$ 2.2$ -$ 2.2$ 0.7$ -$ -$ 26.6$
New Routes
Operating Costs 3.0$ 3.1$ 4.1$ 4.2$ 4.3$ 4.5$ 4.7$ 4.8$ 5.0$ 5.2$ 42.9$
Capital Costs 21.0$ 0.6$ 4.8$ -$ -$ -$ -$ -$ -$ -$ 26.4$
TOTAL (millions) 28.1$ 16.9$ 29.5$ 15.1$ 18.4$ 16.8$ 19.6$ 18.9$ 18.8$ 19.5$ 201.7$

Annual Update8.0 - Financial Plan
T R A N S I T D E V E L O P M E N T P L A N F Y 2 0 1 1 - 2 0 2 08-11
Table 8-11: Priority Transit Corridors (Unfunded)
Source: MDT; YOE capital costs assume a 5% annual cost inflation rate
8.13 Capital Improvement Program ProjectsMDT has identified three (3) projects from the near-term Capital Improvement Program (CIP)that are important for the agency to achieve its service objectives. However, these projects areunfunded and should funding become available, these projects may be implemented around FY2012, so that is the assumed implementation year shown here. Table 8-12 shows the unfundedcapital cost associated with these CIP projects.
Year ofImplementation
Priority Transit CorridorBase Year (2010)
Capital Cost(millions)
Year-of-ExpenditureCapital Cost
(millions)
2011US 1 (Biscayne Boulevard) from Downtown Miamito County line
96.95$ 106.90$
2012NE 167th/163rd/Sunny Isles Boulevard fromGolden Glades Tri-Rail Station to Collins Avenue
38.74$ 44.80$
2013 NW 135th Street from NW 12th Avenue to US 1 24.22$ 29.40$
2014NW 36th Street/Julia Tuttle Causeway from Tri-Rail Hialeah Market Station to Collins Avenue
62.90$ 80.30$
2015West 12th Avenue from Okeechobee MetrorailStation to NW 186th Street
48.11$ 64.50$
2016SW 107th Avenue from SW 40th Street to NW 25thStreet
29.37$ 41.30$
2017Flagler Street from SW 107th Avenue toDowntown
74.84$ 110.60$
2018SW 8th Street from SW 107th Avenue toDowntown
73.19$ 113.50$
2018SW 72nd Street from 117th Avenue to US1/Busway
38.08$ 59.10$
2019 Kendall Drive from 137th Avenue to US 1/Busway 44.55$ 72.60$
2020Coral Reef Drive from 137th Avenue to US1/Busway
30.30$ 49.30$
561.27$ 772.30$TOTAL

T R A N S I T D E V E L O P M E N T P L A N F Y 2 0 1 1 - 2 0 2 08-12
Annual Update8.0 - Financial Plan
Table 8-12: Additional Capital Improvement Program (CIP) Projects (Unfunded)
Year Project Description Base Year (2009)CCost (millions)
Year-of-expenditureCost
(millions)
2012 Bus Pullout Bays throughout Miami-Dade County $0.8 $0.9
2012 Electronic Information Kiosks $0.5 $0.6
2012 Park and Ride Fcilities throughoutMiami-Dade County $14.6 $17.0
$4.9 $18.5TOTAL
Source: MDT; capital costs are in YOE dollars assuming a 5% capital cost inflation rate
8.14 Total Unfunded NeedsMDT’s total unfunded needs between FY 2011 – FY 2020– covering bus service improvements,capital investment in priority travel corridors, and CIP projects – totals $980 million in YOEdollars.
Table 8-13: Total Unfunded Needs, FY2011-2020 (YOE millions)
Source: MDT 2010
Service Improvement CategoryTotal Funding
Required FY11-20
Bus Improvements (Operating) 148.7$
Bus Improvements (Capital) 53.0$
Priority Corridors (Capital) 772.3$
CIP Projects (Capital) 5.7$
TOTAL UNFUNDED NEEDS 979.7$

Transit Development Plan Annual UpdateAppendix
T R A N S I T D E V E L O P M E N T P L A N F Y 2 0 1 1 - 2 0 2 0
APPENDIX


Transit Development Plan Annual UpdateAppendix
T R A N S I T D E V E L O P M E N T P L A N F Y 2 0 1 1 - 2 0 2 0
A.1
Metrobus Service Characteristics (December 2009)


ROUTEBRANCHES
1 30 40 70 n/a 40 402
NE 84 Street/Miami Avenue 20 20 30 n/a 20 30163rd Street Mall 60 60 50 n/a n/a n/a
3 18 18 30 60 15 206 60 60 n/a n/a 60 607
East of NW 60 Avenue 15 20 30 n/a 20 20Dolphin Mall 30 40 60 n/a 40 40
8East of SW 57 Avenue 10 15 20 n/a 15 20East of SW 82 Avenue 10/20 15 20 n/a 15 20Westchester n/a n/a n/a n/a 15 20FIU via SW 8 Street 30 30 n/a n/a n/a n/aFIU via Coral Way 30 30 30 n/a n/a n/a
9163rd Street Mall 12 30 30 n/a 30 30Aventura Mall 30 30 30 n/a 30 30
10 30 30 30 n/a 30 3011
East of 79 Avenue 8 12 20 60 12 15Mall of the Americas 16 24 40 60 24 30FIU-University Park Campus 16 24 40 60 24 30
12 30 30 40 n/a 40 4016 18 30 30 n/a 24 3017
South of NW 95 Street/North of Flagler Street 15 30 60 n/a 30 30NW 7 Avenue/105 Street 30 n/a n/a n/a n/a n/aNorwood 30 30 60 n/a 30 30South of Flagler Street 30 30 60 n/a 30 30
19 30 30 40 n/a n/a n/a21 30 30 60 n/a 40 4022
North of West Flagler Street 15 30 60 n/a 30 30Coconut Grove Station 30 60 60 n/a 60 60
24Westchester 20 20 24 n/a 30 30FIU-University Park Campus 40 40 24 n/a 60 60SW 137 Avenue/26 Street 40 40 n/a n/a 60 60SW 147 Avenue/26 Street 40 n/a n/a n/a n/a n/a
27South of NW 183 Street 15 15 30 n/a 20 30Via NW 27/32 Avenue & via NW 37 Avenue 30 30 60 60 40 60
29 45 45 n/a n/a n/a n/a31 (Busway Local) 15 30 40 n/a 30 30
32 24 30 60 n/a 40 6033 30 35 60 n/a 30 30
34 (Busway Flyer) 7½ n/a n/a n/a n/a n/a35 30 30 60 n/a 60 6036
East of NW 57 Avenue 20 30 20 n/a 30 30Doral Center 20/40 60 40 n/a 60 60Miami Springs Circle 60 60 60 n/a 60 60Dolphin Mall 60 60 60 n/a n/a n/a
37 30 30 40 n/a 30 3038 (Busway MAX) 12 15 15 60 15 20
40 `East of SW 127 Avenue 15 30 60 n/a 60 60SW 8 Street/SW 129 Avenue 30 60 60 n/a n/a n/aMiller Drive/SW 152 Avenue 30 60 n/a n/a 60 60
42Miami Int'l Airport Terminal 15 30 60 n/a 30 30South of NW 36 Street 15 30 n/a n/a 30 30Miami Springs Circle 30 60 n/a n/a 60 60Opa-locka Tri-Rail Station 30 60 n/a n/a 60 60
OVERNIGHT
MDT METROBUS ROUTE HEADWAYS (December 2009)
SUNDAYPEAK(AM/PM)
OFF-PEAK(Midday)
EVENING(after 8 pm) SATURDAY

ROUTEBRANCHES
OVERNIGHT
MDT METROBUS ROUTE HEADWAYS (December 2009)
SUNDAYPEAK(AM/PM)
OFF-PEAK(Midday)
EVENING(after 8 pm) SATURDAY
46 (Liberty City Connection) 40 n/a n/a n/a n/a n/a48 60 60 n/a n/a n/a n/a49 30 n/a n/a n/a n/a n/a
51 (Flagler MAX) 15 30 30 n/a n/a n/a52 30 45 60 n/a 45 6054
Hialeah Gardens 25 30 30 n/a 30 30Miami Gardens Drive/NW 87 Avenue 50 60 n/a n/a n/a n/a
56East of SW 107 Avenue 30 60 n/a n/a n/a n/aMDC - Kendall Campus 60 n/a n/a n/a n/a n/aMiller Road /SW 152 Avenue 60 60 n/a n/a n/a n/a
57 40 60 n/a n/a n/a n/a59 50 n/a n/a n/a n/a n/a62
Dr. Martin Luther King, Jr. Station 10 15 30 n/a 20 30Hialeah 30 30 30 n/a 20 30Miami Beach 30 n/a n/a n/a n/a n/a
70South Dade Government Center 30 60 60 n/a 60 60Saga Bay n/a 60 n/a n/a 60 60
71 30 60 n/a n/a 60 6072
East of SW 137 Avenue 30 30 n/a n/a 60 60Miller Square 60 60 n/a n/a 60 60Kendall Drive/SW 157 Avenue 60 60 40 n/a 60 60
73 30 40 60 n/a 60 6075 30 30 60 n/a 45 6077
South of NW 183 Street 8 15 30 n/a 15 30NW 199 Street 16 30 30 n/a 30 60
79 (79 Street MAX) 24 n/a n/a n/a n/a n/a87
Koger Center 30 45 60 n/a 45 60Palmetto Station 30 45 60 n/a n/a n/a
88East of SW 132 Avenue 15 30 30 n/a 24 30Kendale Lakes 30 60 n/a n/a 48 60SW 157 Avenue/Kendall Drive 30 60 30 n/a 48 60
93 (Biscayne MAX) 18 30 n/a n/a n/a n/a95 5 n/a n/a n/a n/a n/a
97 (27 Avenue MAX) 20 40 n/a n/a n/a n/a99
East of NW 47 Avenue 30 30 45 n/a 40 40Miami Lakes 60 60 60 n/a 40 40
101 (Route A) 20 45 40 n/a 45 45102 (Route B)
East of Harbor Drive 10/15 30 30 n/a 30 30Cape Florida State Park 10/30 60 30 n/a 60 60Mashta Drive 60 60 n/a n/a 60 60
103 (Route C) 20 20 30 n/a 20 30104 24 60 60 n/a 60 60
105 (Route E) 30 45 60 n/a 60 60107 (Route G) 20/30 30 70 n/a 35 35108 (Route H) 24 24 45 n/a 30 30110 (Route J) 20 30 60 n/a 30 30112 (Route L)
Northside Station 12 12 20 60 15 20Amtrak Station 24 24 n/a * * *Hialeah Station 24 24 30 n/a 30 40
113 (Route M) 45 60 60 n/a 60 60115 (Mid-North Beach Connection) 40 40 60 n/a 60 60
119 (Route S) 12 12 12 60 15 15120 (Beach MAX)
South of Collins Avenue/Haulover Park Entrance 12 12 30 n/a 15 30Haulover Park Marina 24 24 60 n/a 30 n/aAventura Mall 24 24 60 n/a 30 30

ROUTEBRANCHES
OVERNIGHT
MDT METROBUS ROUTE HEADWAYS (December 2009)
SUNDAYPEAK(AM/PM)
OFF-PEAK(Midday)
EVENING(after 8 pm) SATURDAY
123 (South Beach Local) 20 12 20 n/a 12 12132 (Tri-Rail Doral Shuttle) 80/60 n/a n/a n/a n/a n/a
133 (Tri-Rail Airport Shuttle) 15/20 30 30 n/a 30 30135
East of LeJeune Road 30 30 30 n/a 60 60Hialeah Station 50 60 70 n/a 60 60Miami Lakes 50 60 70 n/a n/a n/a
136 50 n/a n/a n/a n/a n/a137 (West Dade Connection) 30 45 60 n/a 40 40
150 (Airport Flyer) 30 30 30 n/a 30 30183 (183 Local)
East of NW 57 Avenue 12 20 24 n/a 20 24Miami Gardens Drive/NW 87 Avenue 24 40 n/a n/a 40 48
202 (Little Haiti Connection) 60 60 n/a n/a 60 60204 (Killian KAT) 7½ n/a 30 n/a n/a n/a
207/208 (Little Havana Connection) 15 20 20 n/a 20 20211 (Overtown Circulator) 30 30 n/a n/a n/a n/a
238 (East-West Connection) 40/50 60 n/a n/a n/a n/a243 (Seaport Connection) 30 n/a n/a n/a n/a n/a
246 (Night Owl) n/a n/a n/a 60 60 60248 (Brickell Key Shuttle) 20 n/a n/a n/a n/a n/a
249 (Coconut Grove Circulator) 18 18 20 n/a 18 18252 (Coral Reef MAX)
East of SW 117 Avenue 20 60 50 n/a 60 60Metrozoo 20 60 n/a n/a 60 60Country Walk 20 60 50 n/a 60 60SW 162 Avenue 40 n/a n/a n/a 60 60
254 (Brownsville Circulator) n/a 30 n/a n/a n/a n/a272 (Sunset KAT) 10 n/a n/a n/a n/a n/a
277 (7 Avenue MAX) 18 n/a n/a n/a n/a n/a286 (North Pointe Circulator) 24 48 n/a n/a 48 n/a
287 (Saga Bay MAX) 30 n/a n/a n/a n/a n/a288 (Kendall KAT) 15 n/a n/a n/a n/a n/a
344 60 60 n/a n/a n/a n/a500 (Midnight Owl) n/a n/a n/a 60 60 60
* = Service via select trips onlyn/a = no service available or not applicable
Gray shaded cells are branches to routes


T R A N S I T D E V E L O P M E N T P L A N F Y 2 0 1 1 - 2 0 2 0
Transit Development Plan Annual UpdateAppendix
A.2
Public Involvement Activities


TRANSIT
DRAFT
TRANSIT DEVELOPMENT PLAN
PUBLIC INVOLVEMENT PLAN
April 2010

MDT TDP Public Involvement PlanTRANSIT Draft
T R A N S I T D E V E L O P M E N T P L A N

MDT TDP Public Involvement PlanTRANSIT Draft
T R A N S I T D E V E L O P M E N T P L A N i
Table of Contents
1.0 INTRODUCTION ....................................................................................................................... 11.1 PUBLIC PARTICIPATION GOAL AND OBJECTIVES ........................................11.2 FDOT PUBLIC INVOLVEMENT OBJECTIVES ...................................................1
2.0 PUBLIC INVOLVEMENT PROGRAM ..................................................................................... 22.1 PUBLIC PARTICIPATION ...................................................................................22.2 PUBLIC ACCESS ................................................................................................22.3 PUBLIC OUTREACH AND INPUT ......................................................................2
3.0 PUBLIC INVOLVEMENT ACTIVITIES ..................................................................................... 33.1 INTER-AGENCY COORDINATION .....................................................................33.2 MIAMI-DADE COUNTY BOARD OF COUNTY COMMISSIONERS ....................43.3 TDP ADVISORY REVIEW COMMITTEE .............................................................43.4 TECHNICAL COMMITTEES................................................................................53.5 COMMUNITY OUTREACH AND INVOLVEMENT OPPORTUNITIES .................6
4.0 PUBLIC INVOLVEMENT COMMENT IMPLEMENTATION.................................................... 8
List of TablesTable 3-1: Inter-Agency Coordination Summary .........................................................................3Table 3-2: TDP Advisory Review Committee Summary .............................................................5Table 3-3: Public Involvement Technical Committees Summary ................................................5Table 3-4: Public Involvement Opportunities Summary ..............................................................7

MDT TDP Public Involvement PlanTRANSIT Draft
T R A N S I T D E V E L O P M E N T P L A N 1
1.0 INTRODUCTION
The Transit Development Plan (TDP) Public Involvement Plan (PIP) for Miami-Dade Transit(MDT) has been developed to provide numerous opportunities for public participation and tofacilitate consensus building for this planning study. The PIP is consistent with the Miami-Dade County Metropolitan Planning Organization’s (MPO) guidelines for public participationin the planning process, and places a particular emphasis on outreach to minorities, low-income groups, environmental justice, and intergovernmental coordination. This plan isconsistent with the Florida Department of Transportation (FDOT) TDP guidelines for publicparticipation.
1.1 Public Participation Goal and ObjectivesThe goal of the MDT PIP is to establish a process that engages public stakeholders byproviding complete project information, timely public notice, and encourages early andcontinuous public involvement for the development of the MDT TDP. The following lists thePIP objectives for the development of the MDT TDP:
Ensure early, frequent and continuous communication with the public and otherstakeholders;
Provide meaningful opportunities for public input and systematic follow-through toaddress issues and ideas identified by the public.
Promote MDT project benefits to the community.
Promote an on-going public partnership to ensure transportation benefits are consideredwithin the context of the communities directly impacted by MDT’s projects.
1.2 FDOT Public Involvement ObjectivesIn addition to goals and objectives set forth by MDT for the TDP PIP, FDOT has alsoestablished four (4) public involvement objectives in an effort to meet and exceed the goalsset forth for TDP’s throughout the state. The TDP PIP will also seek to implement and abideby these objectives as presented below:
1. Educate and present information by promoting proactive and early public involvement.
2. Solicit public input throughout the planning process by gathering full and completeinformation from the public.
3. Integrate public feedback into the TDP.
4. Monitor and improve the public involvement process.

MDT TDP Public Involvement PlanTRANSIT Draft
T R A N S I T D E V E L O P M E N T P L A N 2
2.0 PUBLIC INVOLVEMENT PROGRAM
The PIP utilizes various tools to establish a process for involvement, facilitatecommunication with the public and gather input into the TDP project. In an effort to developconsensus and direction from the public for TDP development, MDT will utilize the followingthree areas of public involvement: Public Participation, Public Access, and Public Outreachand Input. The three avenues through which the public involvement will conduct outreachare through the community, governmental, and media participation.
Public input is being actively sought throughout all phases of TDP development. MDTsolicits input from the public by implementing direct and indirect methods of informationgathering. Miami-Dade Transit has set forth a formal process and system by which toaddress and respond to input. A database to monitor and track input received is utilizedthroughout the year.
2.1 Public ParticipationOne of the main goals of the PIP is that all segments of the public be provided theopportunity to actively participate in the development and preparation of the TDP. Miami-Dade Transit develops, maintains, and implements proactive means and methods tosystematically identify and build relationships with public community stakeholders andencourage ongoing public participation. Coordination with the media is another importantaspect of public participation which MDT utilizes to reach a broad community audience.Furthermore, public involvement activities are part of a continual process designed to reachout to the community and particularly to members in predominantly minority and low-to-moderate income areas.
2.2 Public AccessThe TDP PIP involves providing the public with timely notice and reasonable access toinformation related to MDT transit projects, issues and processes. All meetings will be heldin community locations that are American with Disabilities Act of 1990 (ADA) compliant andaccessible by public transit.
Technical and policy information as well as plans and documents used for the developmentof the TDP will be available for public review. All technical information provided will beavailable in a format that is accessible for use by persons with English as a secondlanguage, and persons with disabilities upon request.
2.3 Public Outreach and InputMiami-Dade Transit maintains a proactive outreach program tailored to inform the public onall aspects of the TDP. MDT will advertise public meetings in local periodicals and on thewebsite advising citizens when a draft is available for review. Community outreach effortsand campaigns will be focused on local citizen, resident, and business participation toensure opportunities for input are provided. TDP related updates will be provided to keygovernmental stakeholders on a regular basis as reports are updated.
All public comments received at the designated public hearing or through the website will beforwarded to appropriate individuals for response. The media is also used as an outreach

MDT TDP Public Involvement PlanTRANSIT Draft
T R A N S I T D E V E L O P M E N T P L A N 3
tool for announcing public participation opportunities as well as notifying the public aboutspecific MDT project information.
3.0 PUBLIC INVOLVEMENT ACTIVITIES
Miami-Dade Transit utilizes a multi-faceted approach for engaging the public and otherstakeholders through various activities and meeting forums. This approach includes acomprehensive coordinated effort by all of MDT’s Divisions with its job basis/executiveworkforce to deliver important transit information to all Miami-Dade County residents.
3.1 Inter-Agency CoordinationMiami-Dade Transit will work closely with inter-governmental agencies in an effort to ensuremaximum public and stakeholder involvement. Coordination with local and stategovernment agencies will allow for ongoing public input and recommendations. Inparticular, MDT will organize its efforts to engage the following governmental agencies forthe development of the TDP:
Florida Department of Transportation
Miami-Dade County Metropolitan Planning Organization
Local Municipalities
Regional Partners
Table 3-1 provides a summary of inter-agency coordination.
Table 3-1: Inter-Agency Coordination Summary
Agency/Stakeholder Function Purpose
FDOT
The Department seeks to improve economic vitalitythroughout the state by facilitating the mobility of peopleand goods while preserving the quality of communitiesand the environment. FDOT will review and provide inputon the TDP to assure it meets all of the Staterequirements.
Informational/Input/ Adoption
MPO
Transportation policy making organization composed ofrepresentatives from local government and governmentaltransportation authorities. Public participation is a vitalelement of the MPO which provides community membersopportunities to become more actively involved intransportation planning. The MPO will be involved in thereview of the TDP through participation on the TDPARCand presentations to its technical committee.
Informational/Input
LocalMunicipalities
Administrative local authorities within the region includingcounty, city, and municipal governments. Supports andrepresents the current and future needs of the communityfor which they govern. Throughout the TDP processcoordination with local municipalities will take place tocoordinate transit services with agencies during thetransportation planning process.
Informational/Input

MDT TDP Public Involvement PlanTRANSIT Draft
T R A N S I T D E V E L O P M E N T P L A N 4
Table 3-1: Inter-Agency Coordination Summary (continued)
Agency/Stakeholder Function Purpose
RegionalPartners
Administrative inter-county agencies within the regionwhich support and represent the current and future needsof the community for which they govern. Regionalpartners include agencies such as the South FloridaRegional Transportation Authority (SFRTA), RegionalPlanning Council (RPC), and the Southeast FloridaTransportation Council (SEFTC). Coordination withregional agencies will take place throughout TDPdevelopment to coordinate transit services during thetransportation planning process.
Informational/Input
3.2 Miami-Dade County Board of County CommissionersThe Miami-Dade County Board of County Commissioners (BCC) is the administrative bodyfor county government which provides policy guidance and the establishment of communitylaws through ordinances and resolutions. Commissioners are elected by residents torepresent each of the 13 districts in Miami-Dade County. The BCC works closely with thegeneral public to make certain that their voice is heard and the needs of the county areaddressed.
The TDP will be reviewed by and presented to the BCC for formal adoption prior to thesubmittal of the TDP document to FDOT for review and approval.
3.3 TDP Advisory Review CommitteeThe TDP Advisory Review Committee (TDPARC) is comprised of representatives fromvarious divisions with MDT such as Finance, Marketing, and Operations. Also,representatives from the South Florida Workforce Board (SFWB), MPO, and FDOTparticipate on the TDPARC.
The main goal of the TDPARC is to provide MDT with a countywide perspective of currentconditions throughout the project milestones of the TDP. Members are encouraged to provideinput, comments, and recommendations throughout the TDP development process. Table 3-2presents a summary overview of the TDPARC.

MDT TDP Public Involvement PlanTRANSIT Draft
T R A N S I T D E V E L O P M E N T P L A N 5
Table 3-2: TDP Advisory Review Committee Summary
3.4 Technical CommitteesMDT expands its public involvement program by engaging members of transportationrelated advisory committees established in Miami-Dade County. MDT will attend thesegroups during regularly scheduled meetings as informational agenda or action items to seekinput, provide information and address questions on the development of the MDT TDP.Table 3-3 provides a summary of the technical committee’s role and intended meetingpurpose.
Transportation Disadvantaged Local Coordinating Board (TDLCB)
Citizen’s Transportation Advisory Committee (CTAC)
Transportation, Infrastructure, and Roads Committee (TIRC)
Transportation Planning Technical Advisory Committee (TPTAC)
Table 3-3: Public Involvement Technical Committees Summary
Committee Committee Function MeetingPurpose
Advisory Committee
TDPARCProvides technical guidance, recommendations, input, and an overallcountywide perspective of transportation related planning issuesthroughout the development of the TDP. The TDARC serves as anactive participant in the development of the MDT TDP.
Informational/Input
Committee Committee Function MeetingPurpose
TDLCB
Ensures the availability of efficient, cost-effective, and qualitytransportation services for transportation disadvantaged persons withinthe county. Provides opportunities for public involvement intransportation disadvantaged planning. Members are appointed by theMPO Governing Board. MDT will provide report drafts and requestcomments from the TDLCB.
Informational/Input
CTAC
Ensures that transportation projects in all stages of the planning processadhere to established visions, goals, objectives and collective needs ofthe community. This group is comprised of Miami-Dade Countyresidents appointed by the MPO Governing Board members. MDT willattend the CTAC to seek input for the TDP based upon a review andformal presentation of the TDP development.
Informational/Input

MDT TDP Public Involvement PlanTRANSIT Draft
T R A N S I T D E V E L O P M E N T P L A N 6
Table 3-3: Public Involvement Technical Committees Summary (continued)
3.5 Community Outreach and Involvement OpportunitiesThrough coordinated county-wide efforts MDT continues upon its mission to provide earlyand ongoing public involvement opportunities to the residents of Miami-Dade County.Opportunities for community outreach take the form of many different forums and outletsalready set in place by the County. The following list the various community outreachopportunities that MDT employs to provide the public access to information and encourageparticipation in the transportation planning process, including the TDP.
South Florida Workforce Board (SFWB)
Community Meetings
Outreach Campaigns
Media Campaigns
Publications
On-Board Surveys
3-1-1 Information Center
Miami-Dade Transit Website (www.miamidade.gov/transit/home.asp)
Table 3-4 provides an overview of the various public involvement opportunities that MDT utilizesto engage the public.
Committee Committee Function MeetingPurpose
TIRC
Provides an oversight of transportation systems from a local perspectiveand the capital and infrastructure program. The TIRC will review andprovide input on the TDP as well as take formal action in recommendingits approval to the BCC based upon a formal presentation. MDT willattend the TIRC to seek input and address comments and questions forthe development of the TDP. MDT will seek formal action by the TIRC toapprove and make recommendation to the BCC.
Input/Hearing
TPTACProvides technical support, via a review process, to the TransportationPlanning Council. TPTAC discussions are focused on technical aspectsrelated to the projects. The TPTAC meets once a month and is open tothe public.
Informational/Input
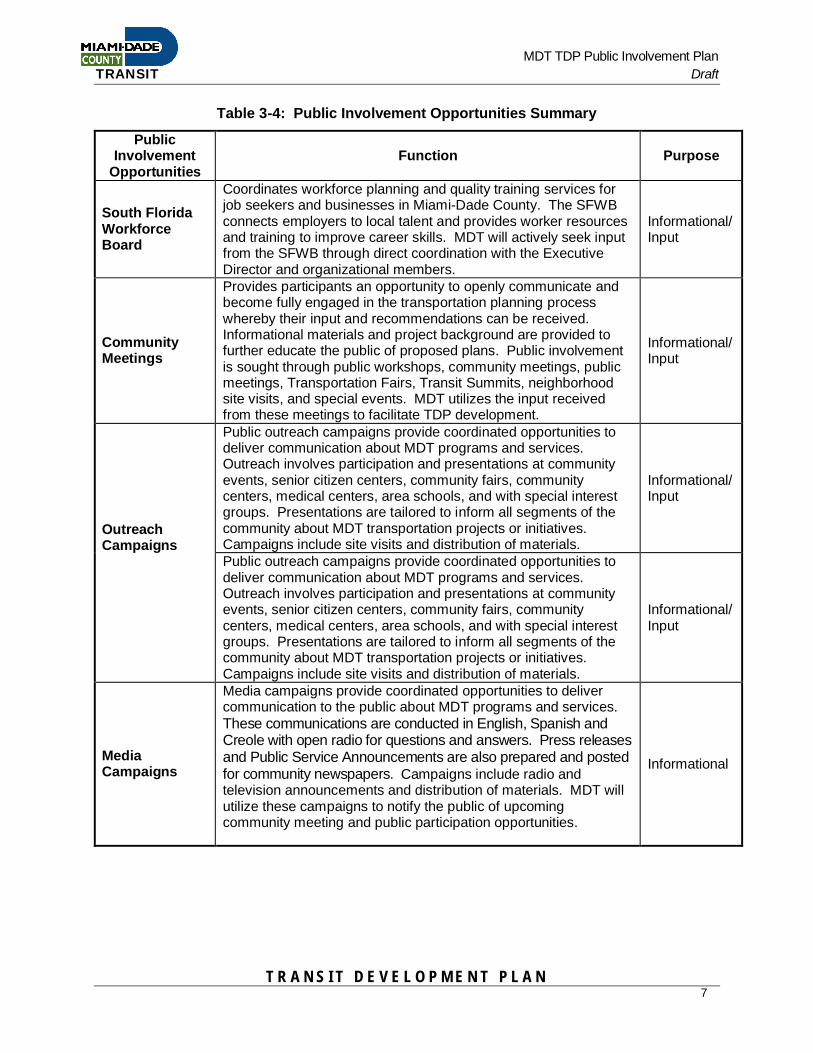
MDT TDP Public Involvement PlanTRANSIT Draft
T R A N S I T D E V E L O P M E N T P L A N 7
Table 3-4: Public Involvement Opportunities Summary
PublicInvolvement
OpportunitiesFunction Purpose
South FloridaWorkforceBoard
Coordinates workforce planning and quality training services forjob seekers and businesses in Miami-Dade County. The SFWBconnects employers to local talent and provides worker resourcesand training to improve career skills. MDT will actively seek inputfrom the SFWB through direct coordination with the ExecutiveDirector and organizational members.
Informational/Input
CommunityMeetings
Provides participants an opportunity to openly communicate andbecome fully engaged in the transportation planning processwhereby their input and recommendations can be received.Informational materials and project background are provided tofurther educate the public of proposed plans. Public involvementis sought through public workshops, community meetings, publicmeetings, Transportation Fairs, Transit Summits, neighborhoodsite visits, and special events. MDT utilizes the input receivedfrom these meetings to facilitate TDP development.
Informational/Input
OutreachCampaigns
Public outreach campaigns provide coordinated opportunities todeliver communication about MDT programs and services.Outreach involves participation and presentations at communityevents, senior citizen centers, community fairs, communitycenters, medical centers, area schools, and with special interestgroups. Presentations are tailored to inform all segments of thecommunity about MDT transportation projects or initiatives.Campaigns include site visits and distribution of materials.
Informational/Input
MediaCampaigns
Media campaigns provide coordinated opportunities to delivercommunication to the public about MDT programs and services.These communications are conducted in English, Spanish andCreole with open radio for questions and answers. Press releasesand Public Service Announcements are also prepared and postedfor community newspapers. Campaigns include radio andtelevision announcements and distribution of materials. MDT willutilize these campaigns to notify the public of upcomingcommunity meeting and public participation opportunities.
Informational

MDT TDP Public Involvement PlanTRANSIT Draft
T R A N S I T D E V E L O P M E N T P L A N 8
Table 3-4: Public Involvement Opportunities Summary (continued)
PublicInvolvement
OpportunitiesFunction Purpose
Publications
MDT informs the public and its customers via a variety ofpublications including individual Metrobus route guides,Metromover and Metrorail system guides, rider alerts and asystem map. MDT publishes information in local newspapers andother publications, posts transit information on bus stop displayslocated at major bus transfer points, at bus stops, at transitfacilities, and with vehicle advertising.
Informational
On-BoardSurveys
Provides an opportunity to receive feedback through origin-destination surveys through on our transportation services. TDPutilizes available survey results.
Input
3-1-1InformationSystem
This system serves as a main point of telephone contact forresidents to inquire about MDT services and provide feedback.This input is utilized for the development of the TDP.
Informational/Input
Miami-DadeTransit Website
MDT maintains a comprehensive website to provide thecommunity with easily accessible up-to-date system information.Offers the public an outlet for involvement to contact MDT, learnabout services, and provide input. MDT utilizes the website topost the TDP for public review and record.The MDT website is www.miamidade.gov/transit/home.asp
Informational/Input
4.0 PUBLIC INVOLVEMENT COMMENT IMPLEMENTATION
Miami-Dade Transit is committed to better understanding and hearing the transportationneeds of the community it serves. As a result of public involvement efforts, the CustomerService Division works to ensure that comment and recommendations received from theTDP outreach opportunities are properly logged, maintained, and responded to. Matrices ofall public involvement activities throughout the year are recorded to include information suchas date, location, project/event subject, attendance, comments received, and the number ofparticipants. Requests received from the public are forwarded to the appropriate division forfollow-up and resolution.

MDT TDP Public Involvement PlanTRANSIT Draft
T R A N S I T D E V E L O P M E N T P L A N

PUBLIC INVOLVEMENT INITIATIVES REPORT APRIL 2009 - MARCH 2010
# DATE LOCATIONPROJECT/ EVENTSUBJECT ATTENDANCE COMMENTS TOTAL
1 4/9/2009 OTVParking under the Guidewayon Sw 1st Avenue
City of Miami NETOffice, City Of MiamiLiza Walton, ADM,Eric Muntan, Forbes
Improving the area with lighting,signs and grass seed from DERM 15
2 4/20/2009 City Year Headquarters
Coordination meeting forpartnership with City Yearvolunteers on taining,activities and logistics
Lee Grever,Development Directorand Lynette Williams,Operations Manager
Initial meeting on distribution of EasyCard brochures by volunteers atMetrobus Passenger Transferlocations and Metrorail Stations 3
3 4/22/2009 OTV
Bermello & Ajamil MIC/EHConnector PublicInvolvement Contract
RosalynContreras/ADM Initial meeting 2
4 5/1/2009 Little Haiti Haitian Career Fair General Public
Outreach to the Haitian Communityon the Easy Card Coming SoonCampaign 50
5 5/1/2009 MICMIC/EH ConnectorGroundbreaking Ceremony
Elected officials andgeneral public
Groundbreaking event on MIC/EHConnector 300
6 5/2/2009Dade County FairGrounds Familia & Hogar Fair General Public
Outreach to the Hispanic Communityon the Easy Card Coming SoonCampaign 2,000
7 5/3/2009Dade County FairGrounds Familia & Hogar Fair General Public
Outreach to the Hispanic Communityon the Easy Card Coming SoonCampaign 2,000
8 5/6/2009 OTV SERI ARRA WorkshopMunicipalities/MDTstaff
Training session on ARRA fundingfor Municipalities by MDT's Fianance 50
9 5/8/2009 Wyndham HotelMIC/EH ConnectorWorkshop
MDT/Constructionstaff Outreach and partnering workshop 75
10 5/9/2009Omni MetromoverStation
Mayor Alvarez's V Initiativesponsors MetromoverStation Cleaning andGreening
City Year Volunteers,MDT staff, Mayor'sOffice Staff
Participation in the cleanup greeningof Metro Mover Stations inpreparation for International PowWow. 25

PUBLIC INVOLVEMENT INITIATIVES REPORT APRIL 2009 - MARCH 2010
11 5/14/2009 Radio PazEasy Card coming soonoutreach ADM
Radio interview anticipating MDT'sparticipation at Cuba Nostalgia Fair 3
12 5/17/2009Dade County FairGrounds Cuba Nostalgia General Public
Outreach to the Hispanic Communityon the Easy Card Coming SoonCampaign 4,000
13 5/19/2009 Caleb Center CAA Fair & Expo General PublicOutreach on the Easy Card ComingSoon Campaign 150
14 5/29/2009 OTVOdebrecht/MDT PublicOutreach collaboration
Tommy Wallace,Marketing Director,ADM
Joint participation effort planningmeeting on Public Outreach forMIC/EH Connector project to areaschools 2
15 5/30/2009Miami BeachConvention Center Storm Preparation Expo General Public Easy Card Outreach 500
16 6/1/2009 Coconut Grove Goombay Festival General PublicOutreach on the Easy Card ComingSoon Campaign 2,000
17 6/8/2009 Metrorail Stations
Coordination of Easy CardRound I brochures fordistribution campaign at 22locations General Public
275 participants distributedbrochures for the Outreach on theEasy Card Coming Soon Campaignfrom 6/8/09-8/11/09 50,000
18 6/8/2009
Major MetrobusTransfer Points andMetrorail Stations
Coordination of Easy Cardbrochures for distributioncampaign by City Year at 19locations General Public
80 City Year volunteers distributedbrochures for the Outreach on theEasy Card Coming Soon Campaignfrom 6/8/09-6/12/09 50,000
19 8/6/2009
Major MetrobusTransfer Points at 9locations
Coordination of Easy CardRound II brochures fordistribution campaign General Public
50 MDT participants distributedbrochures for the Outreach on theEasy Card Coming Soon Campaignwith the Command Bus wrapped withthe Easy Card brand used as visualcenterpiece of the campaign from8/6/09-9/3/09 50,000
20 9/18/2009 Vizcaya Station
Team Captain for Easy CardRound III Distribution from9/18-9/30 General Public Easy Card Outreach 1,000
21 10/7/2009 Brickell Corridor Go Green Event General Public Easy Card Outreach 10022 11/10/2009 Caleb Center Mini Resource Fair General Public Easy Card Outreach 25

PUBLIC INVOLVEMENT INITIATIVES REPORT APRIL 2009 - MARCH 201023 11/12/2009 Radio Luz WKAT 1360 Interview General Public Easy Card Outreach 3
24 11/14/2009Double TreeMerchandise Mart Health Fair General Public Easy Card Outreach 200
25 11/18/2009CommissionChambers Transit Summitt General Public Transit Improvements 300
26 11/30/2009
Major MetrobusTransfer Points,Metrorail Stations,Shopping Malls, Airport
Coordination of SERI lineupchanges Phase I forMetrobus Routesdistribution of MetrobusBooks and Maps at 29locations
75,000 Metrobus Lineup changes booksand maps distributedto the general public
100 MDT participants distributedMetrobus Line up changes booksand maps from 11/30/09-12/14/09 75,000
27 12/1/2009
Major MetrobusTransfer Points,Metrorail Stations,Shopping Malls,Airport, EducationalCenters, Health CareCenters, Elderly CareCenters, HaitianCenters, CentralStation
Coordination of SERI lineupchanges for MetrobusRoutes distribution ofMetrobus Books and Maps General Public
Distribution of 253.37 MetrobusRoute Book Boxes and 75.6 RouteMap boxes from 12/1/09-1/21/10 10,000
28 12/7/2009Miami Springs SeniorCenter
Presentation forCommissioner RebecaSosa District's seniorcitizens on Golden PassportEasy Cards and SERI lineupchanges for MetrobusRoutes distribution ofMetrobus Books and Maps Senior Citizens
Distribution of Metrobus RouteBooks and Route Maps. Renewalapplications and photos wereprocessed for Golden Passport EasyCards 50

PUBLIC INVOLVEMENT INITIATIVES REPORT APRIL 2009 - MARCH 2010
29 12/8/2009 Generations Club
Presentation forCommissioner RebecaSosa District's seniorcitizens on Golden PassportEasy Cards and SERI lineupchanges for MetrobusRoutes distribution ofMetrobus Books and Maps Senior Citizens
Distribution of Metrobus RouteBooks and Route Maps. Renewalapplications and photos wereprocessed for Golden Passport EasyCards 30
30 12/9/2009 Badia Senior Center
Presentation forCommissioner RebecaSosa District's seniorcitizens on Golden PassportEasy Cards and SERI lineupchanges for MetrobusRoutes distribution ofMetrobus Books and Maps Senior Citizens
Distribution of Metrobus RouteBooks and Route Maps. Renewalapplications and photos wereprocessed for Golden Passport EasyCards 35
31 12/10/2009Villa Aida SeniorCenter
Presentation forCommissioner RebecaSosa District's seniorcitizens on Golden PassportEasy Cards and SERI lineupchanges for MetrobusRoutes distribution ofMetrobus Books and Maps Senior Citizens
Distribution of Metrobus RouteBooks and Route Maps. Renewalapplications and photos wereprocessed for Golden Passport EasyCards 90
32 12/11/2009City of West MiamiSenior Center
Presentation for seniorcitizens on Golden PassportEasy Cards and SERI lineupchanges for MetrobusRoutes distribution ofMetrobus Books and Maps Senior Citizens
Distribution of Metrobus RouteBooks and Route Maps. Renewalapplications and photos wereprocessed for Golden Passport EasyCards 100

PUBLIC INVOLVEMENT INITIATIVES REPORT APRIL 2009 - MARCH 2010
33 12/14/2009City of Hialeah GoodletAdult Center
Presentation for seniorcitizens on Golden PassportEasy Cards and SERI lineupchanges for MetrobusRoutes distribution ofMetrobus Books and Maps Senior Citizens
Distribution of Metrobus RouteBooks and Route Maps. Renewalapplications and photos wereprocessed for Golden Passport EasyCards 50
34 12/15/2009City of Hialeah VillaAshley
Presentation for seniorcitizens on Golden PassportEasy Cards and SERI lineupchanges for MetrobusRoutes distribution ofMetrobus Books and Maps Senior Citizens
Distribution of Metrobus RouteBooks and Route Maps. Renewalapplications and photos wereprocessed for Golden Passport EasyCards 55
35 12/15/2009
Major MetrobusTransfer Points,Metrorail Stations,Shopping Malls, Airport
Coordination of SERI lineupchanges Phase II forMetrobus Routesdistribution of MetrobusBooks and Maps at 19locations
75,000 Metrobus Lineup changes booksand maps distributedto the general public
60 MDT participants distributedMetrobus Line up changes booksand maps from 12/15/09-12/23/09 75,000
36 1/4/2010East Ridge RetirementCenter
Presentation forCommissioner KatySorenson District's seniorcitizens on Golden PassportEasy Cards and SERI lineupchanges for MetrobusRoutes distribution ofMetrobus Books and Maps Senior Citizens
Distribution of Metrobus RouteBooks and Route Maps. Renewalapplications and photos wereprocessed for Golden Passport EasyCards 35

PUBLIC INVOLVEMENT INITIATIVES REPORT APRIL 2009 - MARCH 2010
37 1/6//2010 Federation Gardens
Presentation forCommissioner KatySorenson District's seniorcitizens on Golden PassportEasy Cards and SERI lineupchanges for MetrobusRoutes distribution ofMetrobus Books and Maps Senior Citizens
Distribution of Metrobus RouteBooks and Route Maps. Renewalapplications and photos wereprocessed 40 Golden Passport EasyCards 40
38 1/20/2010City of Hialeah WildeCommunity Center
Presentation for seniorcitizens on Golden PassportEasy Cards and SERI lineupchanges for MetrobusRoutes distribution ofMetrobus Books and Maps Senior Citizens
Distribution of Metrobus RouteBooks and Route Maps. Renewalapplications and photos wereprocessed for Golden Passport EasyCards 69
39 1/22/201095 ExpressInauguration Ceremonty for 95 Express
Dignitaries andgeneral public Route inauguration and convoy event 150
40 1/25/2010Coral Bay TerraceSenior Center
Presentation forCommissioner KatySorenson District's seniorcitizens on Golden PassportEasy Cards and SERI lineupchanges for MetrobusRoutes distribution ofMetrobus Books and Maps Senior Citizens
Distribution of Metrobus RouteBooks and Route Maps. Renewalapplications and photos wereprocessed for Golden Passport EasyCards 150
41 1/26/2010 Lakeshore Apartments
Presentation forCommissioner KatySorenson District's seniorcitizens on Golden PassportEasy Cards and SERI lineupchanges for MetrobusRoutes distribution ofMetrobus Books and Maps Senior Citizens
Distribution of Metrobus RouteBooks and Route Maps. Renewalapplications and photos wereprocessed for Golden Passport EasyCards 140

PUBLIC INVOLVEMENT INITIATIVES REPORT APRIL 2009 - MARCH 2010
42 1/27/2020 Saga Bay Apartments
Presentation forCommissioner KatySorenson District's seniorcitizens on Golden PassportEasy Cards and SERI lineupchanges for MetrobusRoutes distribution ofMetrobus Books and Maps Senior Citizens
Distribution of Metrobus RouteBooks and Route Maps. Renewalapplications and photos wereprocessed for Golden Passport EasyCards 130
43 2/2/2010 Pine Woods Villa
Presentation forCommissioner KatySorenson District's seniorcitizens on Golden PassportEasy Cards and SERI lineupchanges for MetrobusRoutes distribution ofMetrobus Books and Maps Senior Citizens
Distribution of Metrobus RouteBooks and Route Maps. Renewalapplications and photos wereprocessed for Golden Passport EasyCards 50
44 2/2/2010Concerned Citizens ofCutler Bay
Presentation forCommissioner KatySorenson District's citizenson Easy Cards and SERIlineup changes for MetrobusRoutes distribution ofMetrobus Books and Maps General Public
Distribution of Metrobus RouteBooks and Route Maps. Routeupdates were provided by ServicePlanning. 30
45 2/12/2010 Census Kick Off
Mayor's Office eventannouncing Censusparticipation by CountySpeakers Bureau
Dignitaries andgeneral public Census Speakers introductions 75
46 2/16/2010Rafael VillaverdeCenter Census presentation Senior Citizens
Distribution of Census information toseniors 100

PUBLIC INVOLVEMENT INITIATIVES REPORT APRIL 2009 - MARCH 2010
47 2/17/2010Walker CommunityCenter
Presentation for seniorcitizens on Golden PassportEasy Cards and SERI lineupchanges for MetrobusRoutes distribution ofMetrobus Books and Maps Senior Citizens
Distribution of Metrobus RouteBooks and Route Maps. Renewalapplications and photos wereprocessed for Golden Passport EasyCards 200
48 2/23/2010 College Park Tower
Presentation forCommissioner KatySorenson District's seniorcitizens on Golden PassportEasy Cards and SERI lineupchanges for MetrobusRoutes distribution ofMetrobus Books and Maps Senior Citizens
Distribution of Metrobus RouteBooks and Route Maps. Route 71and circulator updates were providedby Service Planning to seniors. 50
49 3/4/2010 College Park Tower Census presentation Senior CitizensDistribution of Census information toseniors 60
50 3/9/2010 Myers Senior Center Census presentation Senior CitizensDistribution of Census information toseniors 90
51 3/11/2010
Association forDevelopment ofExceptional Census presentation Disabled persons Distribution of Census information 60
324,642


![Result Update Presentation Q1 FY 16 [Company Update]](https://img.pdfslide.us/doc/110x75/577cb2961a28aba7118c175a/result-update-presentation-q1-fy-16-company-update.jpg)


![Result Update - Q4 & FY 16 [Company Update]](https://img.pdfslide.us/doc/110x75/577c7c7b1a28abe0549ac3b8/result-update-q4-fy-16-company-update.jpg)