Embed Size (px)
Citation preview
ANNUAL REPORT 2014
ICONS by category
DRIVE
CAR
MOTORCYCLE
CAMPER & CARAVAN
TRUCK
SPORT
RUNNING
CYCLING
SWIMMING
GOLF
PRODUCT-RELATED
CONNECTED CAR
DIGITAL MAP
MULTINET-R
REAL-TIME TRAFFIC INFORMATION
NAVKIT NAVIGATION ENGINE
NAVCLOUD
CLOUD-BASED PRODUCTS
WEBFLEET
TELEMATICS APP CENTER
FLEET
FINANCE & STRATEGY
ACCOUNTING POLICIES
SIGNIFICANT ESTIMATES
OUTLOOK
STRATEGY
FORWARD-LOOKING STATEMENTS/IMPORTANT NOTICE
This document contains certain forward-looking statements with respect to the financial condition, results of operations and business of TomTom NV (thecompany) and certain of the plans and objectives of TomTom and its subsidiaries (together with the company referred to as 'the group') with respect tothese items. In particular the words 'expect', 'anticipate', 'estimate', 'may', 'should', 'would', 'believe' and similar expressions are intended to identifyforward-looking statements. By their nature, forward-looking statements involve risk and uncertainty because they relate to events and depend oncircumstances that will occur in the future. Actual results may differ materially from those expressed in these forward-looking statements, and you shouldnot place undue reliance on them. We have based these forward-looking statements on our current expectations and projections about future events,including numerous assumptions regarding our present and future business strategies, operations and the environment in which we will operate in thefuture. There are a number of factors that could cause actual results and developments to differ materially from those expressed or implied by these forward-looking statements. These factors include, but are not limited to, levels of customer spending in major economies, changes in consumer tastes andpreferences, changes in law, the performance of the financial markets, the levels of marketing and promotional expenditures by the group and itscompetitors, raw materials and employee costs, changes in exchange and interest rates (in particular changes in the USD and GBP versus the euro canmaterially affect results), changes in tax rates, future business combinations, acquisitions or disposals, the rate of technological changes, political andmilitary developments in countries where the company operates and the risk of a downturn in the market.
Statements regarding market share, including the company's competitive position, contained in this document are based on outside sources such asspecialised research institutes, industry and dealer panels in combination with management estimates. Where full year information regarding 2014 is notyet available to the company, these statements may also be based on estimates and projections prepared by outside sources or management. Marketshares are based on sales in units unless otherwise stated. The forward-looking statements contained refer only to the date in which they are made, andwe do not undertake any obligation to update any forward-looking statement to reflect events or circumstances after the date of this annual report.
OVERVIEW 4Message from the CEO 5
Key facts and figures 6
TomTom's activities at a glance 7
Strategic priorities 9
2014 Financial highlights 9
TomTom Maps 10
TomTom Traffic 12
TomTom Navigation 13
MANAGEMENT BOARD REPORT 14TomTom Management Board 15
Business and financial review by business unit 16
Group financial review 23
Human resources 24
Corporate social responsibility 25
Business risks 26
In control and responsibility statement 29
CORPORATE GOVERNANCE 30Introduction 31
Deviations from the Corporate Governance Code 31
Legal structure of the company 31
Management Board 31
Supervisory Board 32
General Meeting 33
The capital structure 34
Protection mechanism 34
Notification of substantial shareholdings and short
positions
35
Mandatory corporate governance statement 35
Article 10 of the EU takeover directive decree 35
SUPERVISORY BOARD REPORT 36TomTom Supervisory Board 37
Introduction 39
Composition 39
Supervisory Board meetings 39
Supervisory Board activities 39
Self-assessment 40
Remuneration Committee Report 40
Selection and Appointment Committee Report 43
Audit Committee Report 43
Financial Statements 45
CONSOLIDATED FINANCIAL STATEMENTS 47Consolidated statement of income 47
Consolidated statement of comprehensive income 48
Consolidated balance sheet 49
Consolidated statement of cash flows 50
Consolidated statement of changes in equity 51
Notes to the consolidated financial statements 52
COMPANY FINANCIAL STATEMENTS OFTOMTOM NV
81
Company statement of income of TomTom NV 81
Company balance sheet of TomTom NV 82
Notes to the company financial statements 83
OTHER INFORMATION 85Independent Auditor's Report 86
SUPPLEMENTARY INFORMATION 89Shareholder information 90
Key figures overview 92
Quarterly summary income statement 2014 93
Quarterly summary statement of cash flows 2014 94
Definitions and abbreviations 95
CONTENTS OVERVIEW MANAGEMENTBOARD REPORT
CORPORATEGOVERNANCE
SUPERVISORYBOARD REPORT
FINANCIALSTATEMENTS
SUPPLEMENTARYINFORMATION
ANNUAL REPORT AND ACCOUNTS 2014 / 3
CONTENTS OVERVIEW MANAGEMENTBOARD REPORT
CORPORATEGOVERNANCE
SUPERVISORYBOARD REPORT
FINANCIALSTATEMENTS
SUPPLEMENTARYINFORMATION
ANNUAL REPORT AND ACCOUNTS 2014 / 4
OVERVIEW
Message from the CEO 5Key facts and figures 6TomTom's activities at a glance 7Strategic priorities 92014 Financial highlights 9TomTom Maps 10TomTom Traffic 12TomTom Navigation 13
MESSAGE FROM THE CEO
Dear stakeholder,
I am pleased to report that 2014 was a good year for TomTom. Wemade good progress with our investments in our core technologiesacross the group, achieving important milestones and positioningTomTom back for growth. We made further inroads in establishinga multi-product consumer business with our GPS sport watches, weannounced new deals with automotive customers and we sawaccelerated growth in our fleet management business.
Improvements to our organisational structure and R&D set-up overrecent years have created a stronger basis for the future ofTomTom. As well as being able to look forward to the benefits ofa more efficient organisational structure, we will continue to buildon a growth and performance-oriented culture that embracesteamwork, strong employee engagement, and the drive forexcellence.
2014 marked a year in which we achieved significant milestoneswith our technologies. We made substantial progress with the firstversion of our unique transactional map-making platform that willprovide incremental map updates, enabling near real-time maps.With this technological innovation, TomTom is well positioned toaddress the need for accurate and up-to-date maps, for navigationapplications and driver assistance applications, including HighlyAutomated Driving.
We invested to maintain our leadership position in traffic,increasing our global coverage and enhancing our traffic services.Over 40 countries around the world now have access to TomTom'shistoric and real-time traffic information. TomTom also became thefirst company to use real-time weather information to calculateroutes and arrival times. By knowing the exact traffic situationacross the entire road network, including weather conditions, wegive drivers more insight about the road ahead, making journeysfaster and more predictable.
We made good progress on investments in our modular navigationsoftware, which is used by our consumer drive products such asPNDs and offered as a modular connected navigation system withmaps and traffic to our automotive customers for their embeddedsystems. We are committed to using the Navigation Data Standard(NDS) industry standard map format, which we are integrating intoour navigation software on device-based and server-basednavigation applications. The ability of NDS to support incrementalupdates fits well with our transactional map-making capability,making it possible to keep an on-board map up-to-date.
Our European PND business held up well in 2014. We improved ourEuropean market share and average selling price (ASP). The NorthAmerican market continued to decline faster than in Europe and itremains a challenging market for PNDs. Our strategy is to maximisethe value from the PND category, which we believe will remain ameaningful category in its own right for the foreseeable future.With the introduction of our own branded GPS sport watches wemade a successful step into the sports market. In 2014, weextended our sport watch range with the launch of TomTomRunner Cardio, equipped with a built-in heart rate monitor, whichmade heart rate training easily accessible to athletes. We alsodelivered a GPS watch to help golfers to improve their game. Wewill continue to invest in our consumer business and we look
forward to bringing innovative and relevant new products to themarket in 2015.
Our strategy of offering modular Connected Navigation System(CNS) components, including maps, traffic and navigation softwareand services, to automotive OEMs and Tier 1 vendors is drivinggrowth in our Automotive business. In 2014, we continued todeliver our modular CNS components to our existing customers andwe secured new partnerships and deals. Key strategic partnershipswith Bosch SoftTec and Volkswagen Research to develop AdvancedDriving Systems, and jointly research the future of HighlyAutomated Driving build on TomTom's expertise in mapping, trafficand navigation and position TomTom as a leading innovator in thefuture of automated driving. We also continued to strengthen ourposition as a premium traffic service provider in the automotiveindustry, underlined by new contract wins such as Daimler, Toyota,Fiat, and Audi. Our order bookings for 2014 exceeded €220 million,which together with earlier secured orders will support growth inour Automotive business from 2016 onwards.
In our Licensing business, we diversified and grew our customerbase globally and announced a number of strategic deals thatenable us to offer cloud-based navigation and location services, apedestrian-friendly map layer and an indoor mapping offering.
Our Telematics business performed strongly in 2014. We sawaccelerated growth in the WEBFLEET subscriber base reaching closeto half a million subscriptions by the year end. This was achievedthrough a combination of solid organic growth and twoacquisitions: DAMS Tracking in France and Fleetlogic in theNetherlands. Today, our Telematics business is recognised as thelargest and fastest growing telematics provider in Europe. We areincreasingly becoming the fleet management service provider ofchoice for fleet owners of any size, with recurring revenue streamsaccounting for around 70% of Telematics' total revenue. Ourestablished and scalable technology platform, in combination withour ongoing commitment to innovation, sustained investment inR&D and capacity to leverage economies of scale, enables us tocontinue to capitalise on the favourable industry trends.
The demand for applications that use location is expected tocontinue to grow globally across many industries, and we see newopportunities for TomTom. Over the past year, we have beenpositioning ourselves for growth and the results of our investmentsgive us confidence for the future. Each of our business units has itsown strategy, which includes developing and launching newproducts, and expanding our commercial footprint in both existingand new markets. While remaining cautious about the short-termeconomic outlook in our core markets and closely monitoring thedevelopments in the PND market, we are committed to deliver topline revenue growth in 2015. We will continue to execute on ourexisting strategy to grow our telematics, automotive and consumerbusinesses: we expect continued strong growth in our fleetmanagement business, to announce new deals with automotivecustomers, and to further develop and grow a multi-productconsumer business.
I would like to thank all of our stakeholders: our shareholders fortheir continued support and confidence in TomTom as we continueour journey in this dynamic and fast moving industry; our customersfor their loyalty and valuable feedback that drives us to constantlyinnovate; and finally our employees for their dedication, energy andhard work.
Harold Goddijn / Chief Executive Officer, TomTom NV
CONTENTS OVERVIEW MANAGEMENTBOARD REPORT
CORPORATEGOVERNANCE
SUPERVISORYBOARD REPORT
FINANCIALSTATEMENTS
SUPPLEMENTARYINFORMATION
ANNUAL REPORT AND ACCOUNTS 2014 / 5
KEY FACTS AND FIGURES
Key facts and figures cumulative for the period since the introduction of products and technologies up to the end of 2014, unless stated otherwise
CONTENTS OVERVIEW MANAGEMENTBOARD REPORT
CORPORATEGOVERNANCE
SUPERVISORYBOARD REPORT
FINANCIALSTATEMENTS
SUPPLEMENTARYINFORMATION
ANNUAL REPORT AND ACCOUNTS 2014 / 6
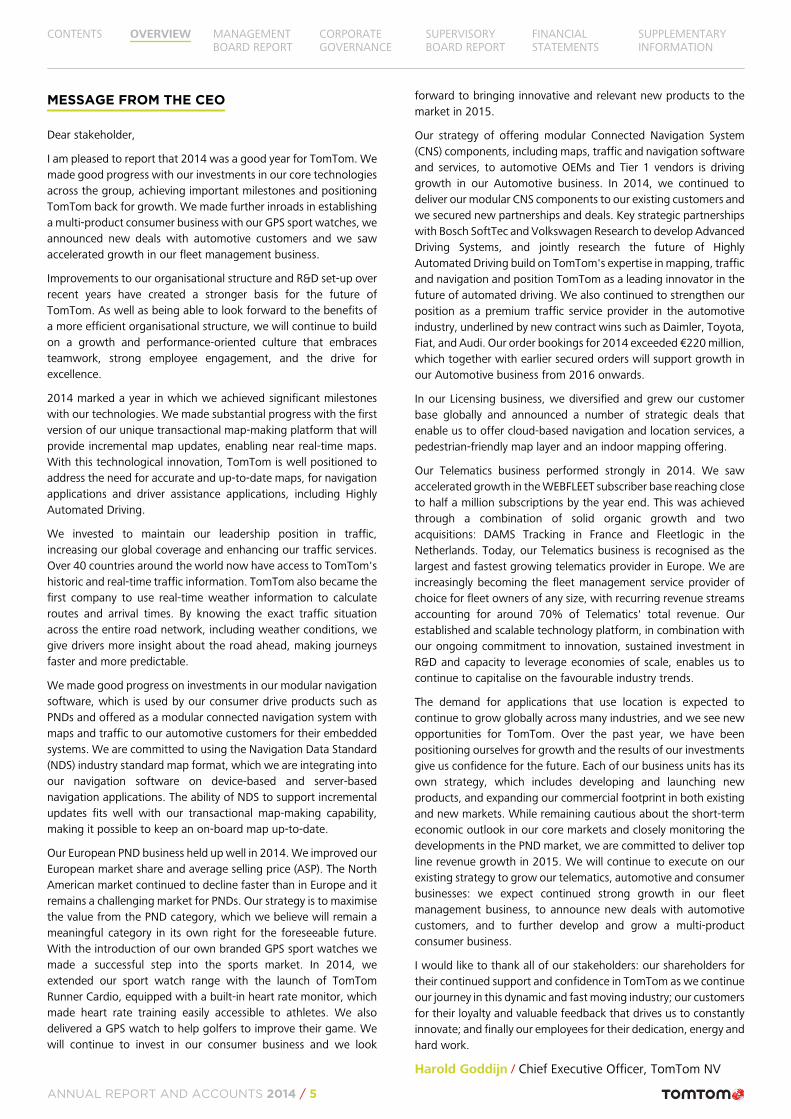
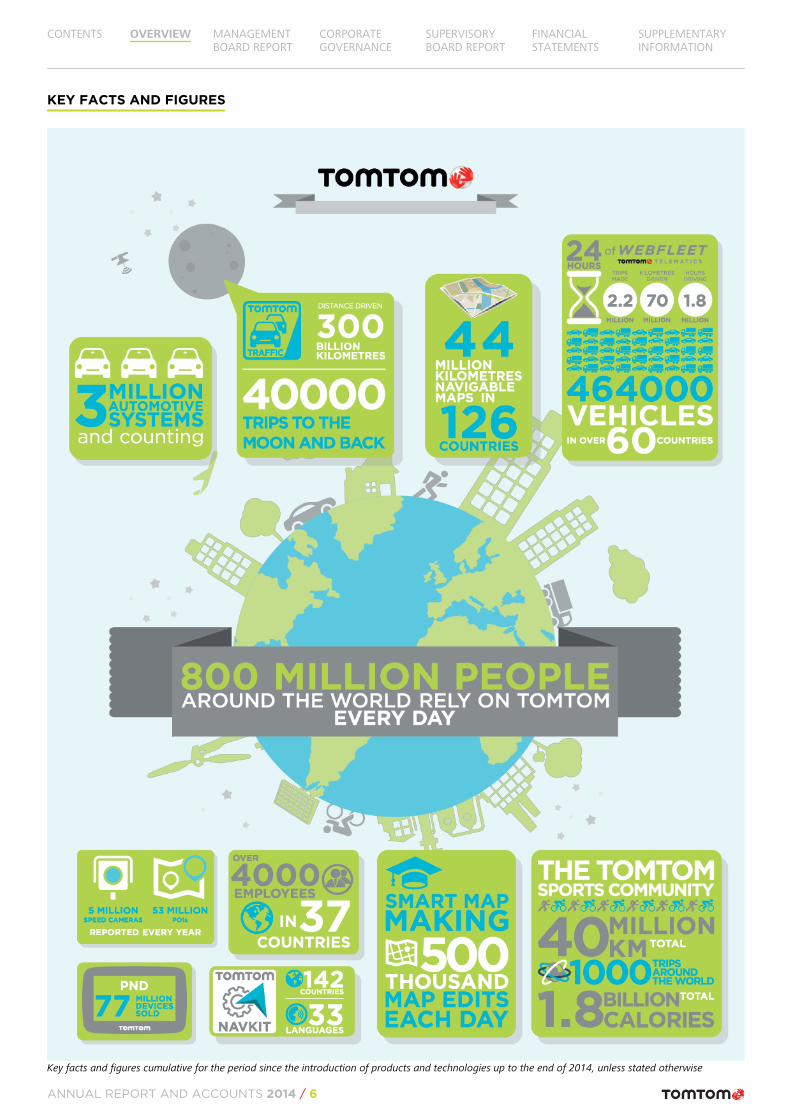
TomTom empowers movement. Every day, millions of people around the world depend on TomTom to make smarter decisions.We design and develop innovative products that make it easy for people to keep moving towards their goals. Best known forbeing a global leader in navigation and mapping products, TomTom also creates GPS sport watches, as well as state-of-the-artfleet management solutions and industry-leading location-based products.
TomTom was founded in 1991 and has grown from a Dutch-based start-up company into a leading multi-national, global brand. The originalfounders remain committed to the business and together with the 4,000 employees are focused on driving innovation and helping peopleachieve their goals.
In 1991, TomTom began a journey that would change the way people drive, beginning with software development for B2B mobile applicationsand personal digital assistants (PDAs) for consumers. In just two years, TomTom became the market leader in PDA software with navigationapplications such as EnRoute (later renamed RoutePlanner) and Citymaps. By June 2002, the TomTom Navigator was launched, providingcustomers across Europe with an easy-to-use, affordable navigation solution for the first time.
A year after the successful launch of TomTom Navigator, it was clear there was a strong demand for an all-in-one, easy-to-use, portablenavigation device. TomTom recruited an experienced hardware team ready to take on this challenge. The result was not just a new product,but also an entirely new category in consumer electronics: the Portable Navigation Device (PND). The PND became the fastest selling consumertechnology device in history, as the trusted travel companion for millions of drivers. Demand grew rapidly across Europe and North Americaand in the ten years since its launch, over 77 million TomTom PND devices have been sold in 35 countries.
In the years that followed, TomTom continued to innovate and create new products, both in the B2C and the B2B segments. Its consumerproduct portfolio was extended with its own branded GPS sport watches, which enable runners, cyclists, swimmers and golfers to keep movingtowards their goals. A number of new businesses were acquired including Datafactory AG (which formed TomTom Telematics), AppliedGenerics (which formed TomTom Traffic), the automotive engineering team from the Siemens R&D division (which formed TomTom'sAutomotive business) and Tele Atlas, one of the largest digital map-making companies in the world (which formed TomTom Maps). Theseacquisitions provided specialist data, technology, knowledge, and resources to deliver a best-in-class navigation and location-based experiencefor our customers.
Today, TomTom's B2B activities are focused on fleet management solutions, embedded navigation systems and location-based solutions.TomTom Telematics grew into a leading global provider of fleet management and vehicle telematics solutions, reaching an installed base of464,000 vehicles at the end of 2014, and is recognised as the fastest growing telematics provider in Europe today. TomTom is set torevolutionise the way maps will be delivered, with the introduction of its new map-making engine that provides incremental map updates,enabling near real-time maps. With the deployment of this important technological innovation, TomTom will be uniquely positioned to fullyaddress the need for highly accurate and always up-to-date maps, enabling its customers to lead the future of Highly Automated Driving.
Together with its state-of-the-art real-time traffic information and navigation software, TomTom's products are sold to customers acrossvarious markets, reaching 800 million people around the world every day.
TOMTOM'S ACTIVITIES AT A GLANCE
Core technologiesTomTom's core technology assets are maps, traffic and navigation. These assets underly many of TomTom's products, and are used in PNDs,embedded navigation systems, smartphone applications, and web-based applications.
MapsTomTom provides global map coverage with fully navigable maps for 126 countries. Its maps with voice-guided navigation areavailable in 46 unique languages. Map-making at TomTom is about efficiently dealing with changes and the increasing use ofour state-of-the-art transactional map-making engine will enable TomTom to deliver high quality map content with short deliverycycles. TomTom is the leader in the use of probe traces in quality map-making and in handling consumer feedback. Today, over
12 trillion probe traces have been collected and over 500,000 map edits are processed each day.
TrafficTomTom creates real-time and historic traffic information for highways, major roads and secondary roads. Its traffic service isavailable in over 40 countries and it provides drivers highly accurate measurements of traffic jams and delays for better routecalculation and expected times of arrival (ETAs). TomTom uses a wide range of sources to generate real-time traffic information;an important source of traffic data comes from its own community input that delivers over 5 billion speed measurements per
day. TomTom's traffic technology intelligently combines the data from all available sources into a database with both traffic flow and incidentdata for the entire road network covered.
CONTENTS OVERVIEW MANAGEMENTBOARD REPORT
CORPORATEGOVERNANCE
SUPERVISORYBOARD REPORT
FINANCIALSTATEMENTS
SUPPLEMENTARYINFORMATION
ANNUAL REPORT AND ACCOUNTS 2014 / 7
NavigationNavKit, TomTom's proprietary navigation engine, is the foundation for many of TomTom's products brought to the market todayand delivers best-in-class dynamic routing performance. The navigation engine provides interfaces (APIs) that enable thedevelopment of a fully customised navigation application on any device or platform. NavKit can be provided with a state-of-the-art and off-the-shelf reference User Interface. NavKit navigation technology is also offered with cloud-based services that enable
on-line navigation. We also offer a cloud service that provides a secure storage facility for navigation data to allow for a seamless navigationexperience across different devices.
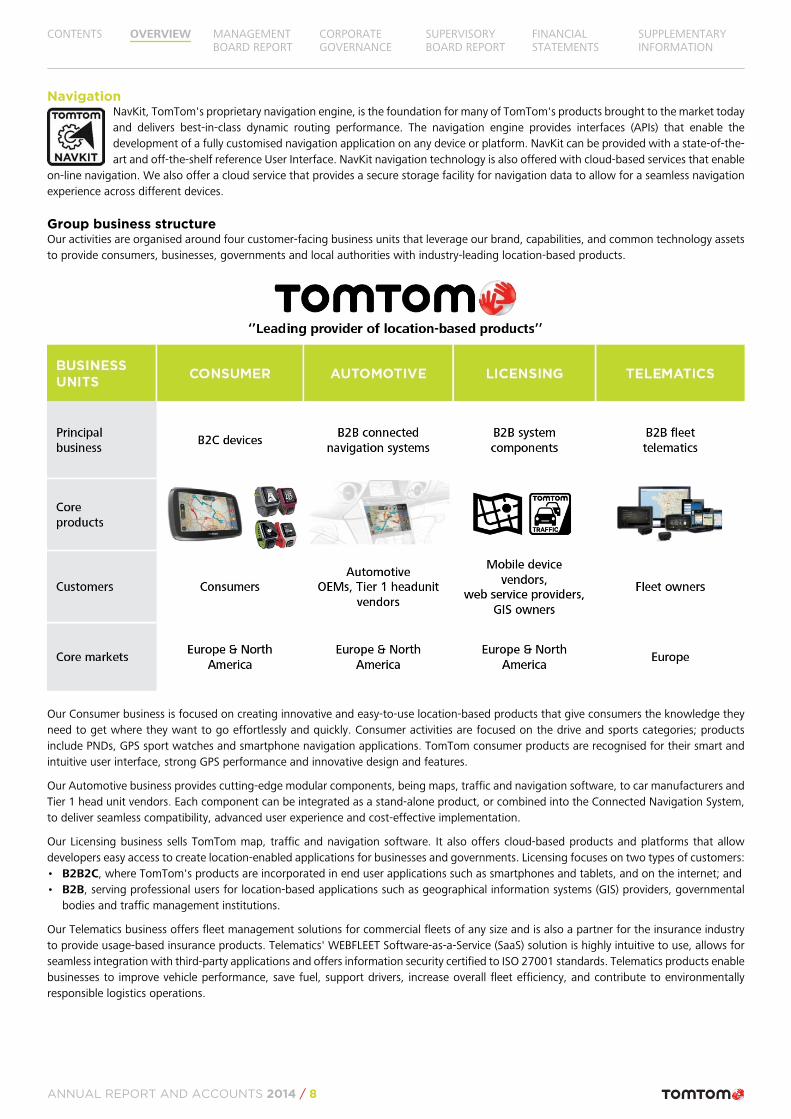
Group business structureOur activities are organised around four customer-facing business units that leverage our brand, capabilities, and common technology assetsto provide consumers, businesses, governments and local authorities with industry-leading location-based products.
Our Consumer business is focused on creating innovative and easy-to-use location-based products that give consumers the knowledge theyneed to get where they want to go effortlessly and quickly. Consumer activities are focused on the drive and sports categories; productsinclude PNDs, GPS sport watches and smartphone navigation applications. TomTom consumer products are recognised for their smart andintuitive user interface, strong GPS performance and innovative design and features.
Our Automotive business provides cutting-edge modular components, being maps, traffic and navigation software, to car manufacturers andTier 1 head unit vendors. Each component can be integrated as a stand-alone product, or combined into the Connected Navigation System,to deliver seamless compatibility, advanced user experience and cost-effective implementation.
Our Licensing business sells TomTom map, traffic and navigation software. It also offers cloud-based products and platforms that allowdevelopers easy access to create location-enabled applications for businesses and governments. Licensing focuses on two types of customers:• B2B2C, where TomTom's products are incorporated in end user applications such as smartphones and tablets, and on the internet; and• B2B, serving professional users for location-based applications such as geographical information systems (GIS) providers, governmental
bodies and traffic management institutions.
Our Telematics business offers fleet management solutions for commercial fleets of any size and is also a partner for the insurance industryto provide usage-based insurance products. Telematics' WEBFLEET Software-as-a-Service (SaaS) solution is highly intuitive to use, allows forseamless integration with third-party applications and offers information security certified to ISO 27001 standards. Telematics products enablebusinesses to improve vehicle performance, save fuel, support drivers, increase overall fleet efficiency, and contribute to environmentallyresponsible logistics operations.
CONTENTS OVERVIEW MANAGEMENTBOARD REPORT
CORPORATEGOVERNANCE
SUPERVISORYBOARD REPORT
FINANCIALSTATEMENTS
SUPPLEMENTARYINFORMATION
ANNUAL REPORT AND ACCOUNTS 2014 / 8
STRATEGIC PRIORITIES
TomTom is determined to turn the company back to growth. This can be achieved through growth from non-PND product saleswhilst maximising the value from the PND category, which we believe will remain a meaningful category in its own right for theforeseeable future. With the introduction of our own branded GPS sport watches, we have successfully diversified into the sportsmarket and aim to continue to build on this positive momentum going forward with innovative new products. TomTom's new
map-making engine is essential for creating a stronger market positioning as well as for pursuing new opportunities in the Automotive andLicensing end markets. We believe that our new map-making engine, together with our traffic and navigation software, will enable TomTomto pursue further growth opportunities with existing and new customers in the area of Highly Automated Driving. The underlying industrydynamics for our fleet management business remain favourable. A combination of short return on investment for our customers and an under-penetrated market allow us to plan for long-term double-digit growth of our Telematics revenue.
TomTom's strategic priorities are summarised as follows:• Maximise value from the PND category;• Establish a multi-product consumer business;• Launch the new map-making engine;• Effectively market automotive Connected Navigation System products to OEMs and Tier 1s;• Pursue new Automotive growth opportunities in the area of Highly Automated Driving;• Maximise Licensing revenue via existing customers and broadening of the product portfolio; and• Continue to expand the WEBFLEET installed base, organically and through bolt-on acquisitions and partnerships.
2014 FINANCIAL HIGHLIGHTS
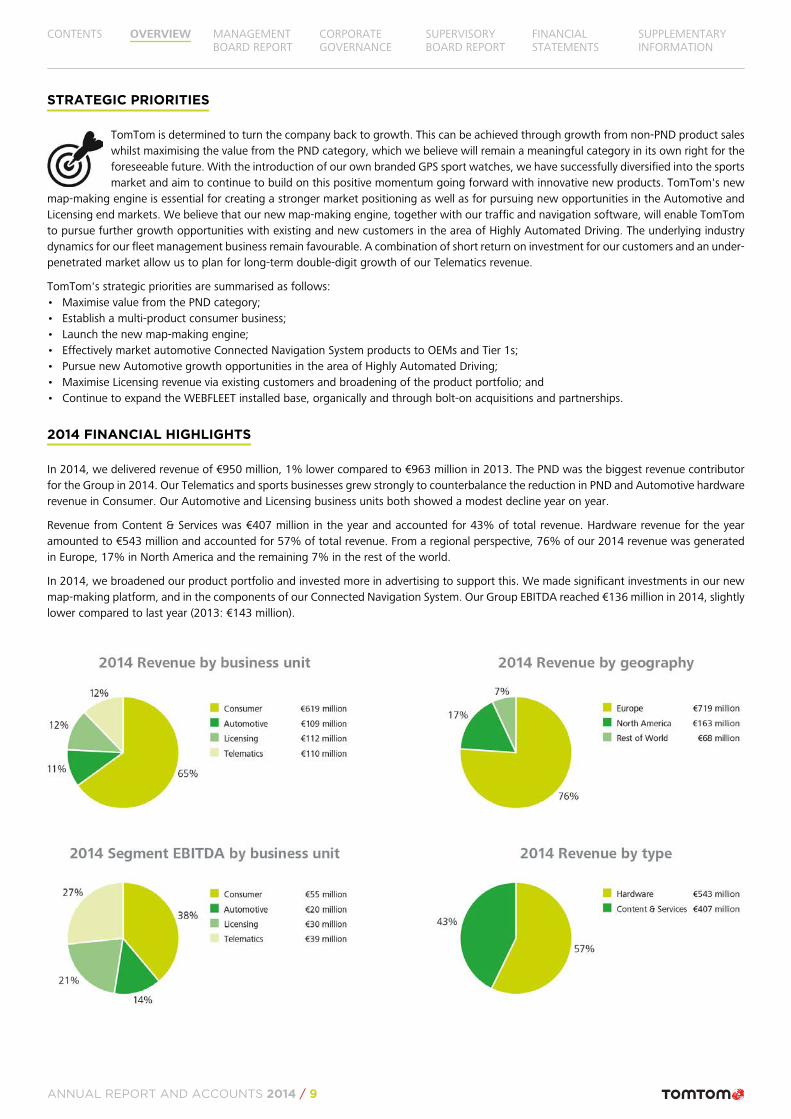
In 2014, we delivered revenue of €950 million, 1% lower compared to €963 million in 2013. The PND was the biggest revenue contributorfor the Group in 2014. Our Telematics and sports businesses grew strongly to counterbalance the reduction in PND and Automotive hardwarerevenue in Consumer. Our Automotive and Licensing business units both showed a modest decline year on year.
Revenue from Content & Services was €407 million in the year and accounted for 43% of total revenue. Hardware revenue for the yearamounted to €543 million and accounted for 57% of total revenue. From a regional perspective, 76% of our 2014 revenue was generatedin Europe, 17% in North America and the remaining 7% in the rest of the world.
In 2014, we broadened our product portfolio and invested more in advertising to support this. We made significant investments in our newmap-making platform, and in the components of our Connected Navigation System. Our Group EBITDA reached €136 million in 2014, slightlylower compared to last year (2013: €143 million).
CONTENTS OVERVIEW MANAGEMENTBOARD REPORT
CORPORATEGOVERNANCE
SUPERVISORYBOARD REPORT
FINANCIALSTATEMENTS
SUPPLEMENTARYINFORMATION
ANNUAL REPORT AND ACCOUNTS 2014 / 9
Location and location awareness are increasingly relevant to everyone todayand to the things they use today. In a connected world, people demand mapsthat are accurate and up-to-date, and which can be seamlessly integratedacross automotive, mobile and location-based applications. Future use cases,such as automated driving, will require significantly more detailed and moreaccurate maps than are available today.
Expectations will continue to grow for a map that perfectly reflects the real-world. This will lead to new opportunities to create cutting edge softwareand technology. For example, we expect to see the development of map usecases in the area of Highly Automated Driving, where connected cars will beequipped with real-time maps that are used with sensors to navigate withouthuman input.
The challenge is to deliver the highest quality and most detailed real-time maps to facilitate this vision, by handling the huge volumes of real-world changes automatically reported by remote in-car sensors and connected devices while minimising the time between detecting changesin the real world and updating the map on the end user's device or platform.
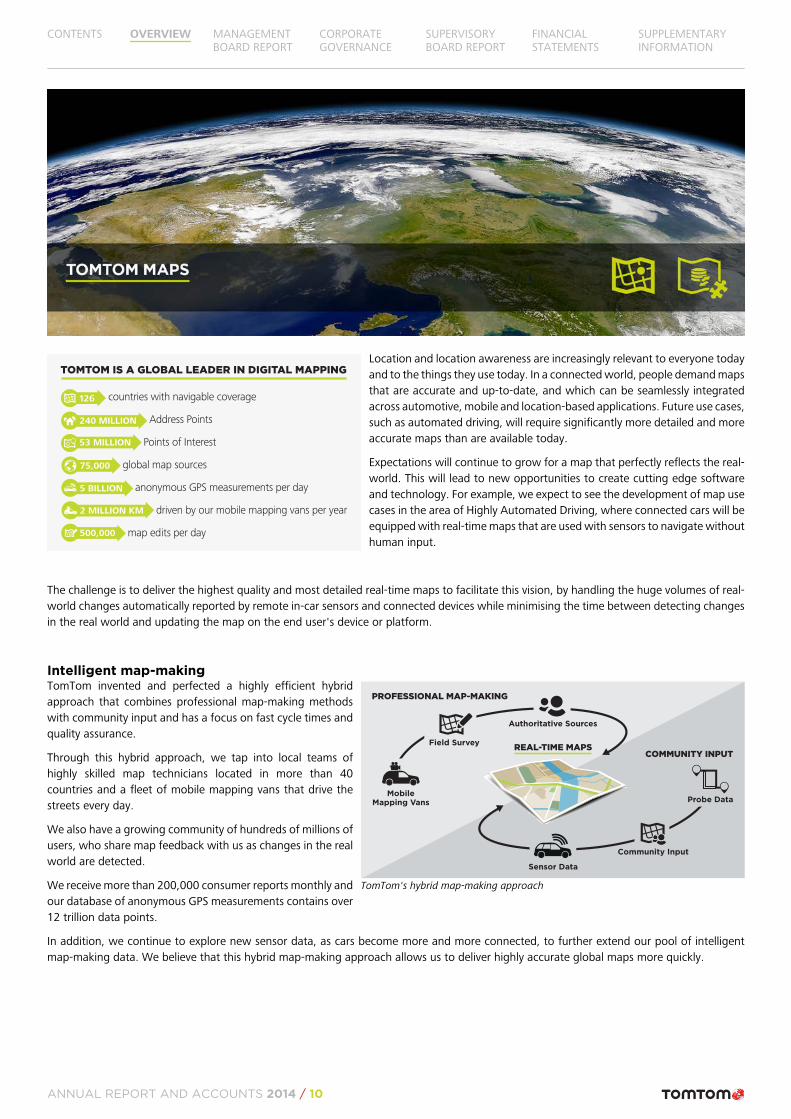
Intelligent map-makingTomTom invented and perfected a highly efficient hybridapproach that combines professional map-making methodswith community input and has a focus on fast cycle times andquality assurance.
Through this hybrid approach, we tap into local teams ofhighly skilled map technicians located in more than 40countries and a fleet of mobile mapping vans that drive thestreets every day.
We also have a growing community of hundreds of millions ofusers, who share map feedback with us as changes in the realworld are detected.
We receive more than 200,000 consumer reports monthly andour database of anonymous GPS measurements contains over12 trillion data points.
In addition, we continue to explore new sensor data, as cars become more and more connected, to further extend our pool of intelligentmap-making data. We believe that this hybrid map-making approach allows us to deliver highly accurate global maps more quickly.
TOMTOM IS A GLOBAL LEADER IN DIGITAL MAPPING
countries with navigable coverage
Address Points
Points of Interest
global map sources
anonymous GPS measurements per day
driven by our mobile mapping vans per year
map edits per day
2 MILLION KM
5 BILLION
500,000
240 MILLION
53 MILLION
75,000
126
MobileMapping Vans
Field Survey
Authoritative Sources
Probe Data
Community Input
COMMUNITY INPUT
PROFESSIONAL MAP-MAKING
REAL-TIME MAPS
Sensor Data
TomTom's hybrid map-making approach
CONTENTS OVERVIEW MANAGEMENTBOARD REPORT
CORPORATEGOVERNANCE
SUPERVISORYBOARD REPORT
FINANCIALSTATEMENTS
SUPPLEMENTARYINFORMATION
ANNUAL REPORT AND ACCOUNTS 2014 / 10
TomTom's transactional map-making engineAt TomTom we believe we are uniquely positioned to address future needs for highly accurate maps that are always up-to-date. Since 2011,we have been working on the redesign and development of our map-making technology. We aim to create a transactional map-makingengine for the future use cases of maps that would optimise professional and community input map-making techniques, and also would beable to handle the vast amounts of data coming from a growing number of connected devices and remote sensors, and deliver map changesin near real-time back to user's devices.
In 2014, we made substantial progress withthe first version of our transactional map-making engine, that will provideincremental map updates, enabling nearreal-time maps.
Our new transactional map-making engineenables a change to pass through ourclosed loop process end-to-end, be qualityassured in real-time, and end up in theproduct in a matter of days, hours andeventually minutes, fulfilling a keyrequirement for real-time maps.
We believe TomTom will be unique in theindustry in being able to offer such atransactional map-making engine with highquality assurance and fast cycle times.
Our new map-making engine will enable TomTom to deliver real-time incremental map updates to customers via fast and frictionless mapdistribution mechanisms, which include Navigation Data Standard (NDS), Multinet-R and our Map Content API.
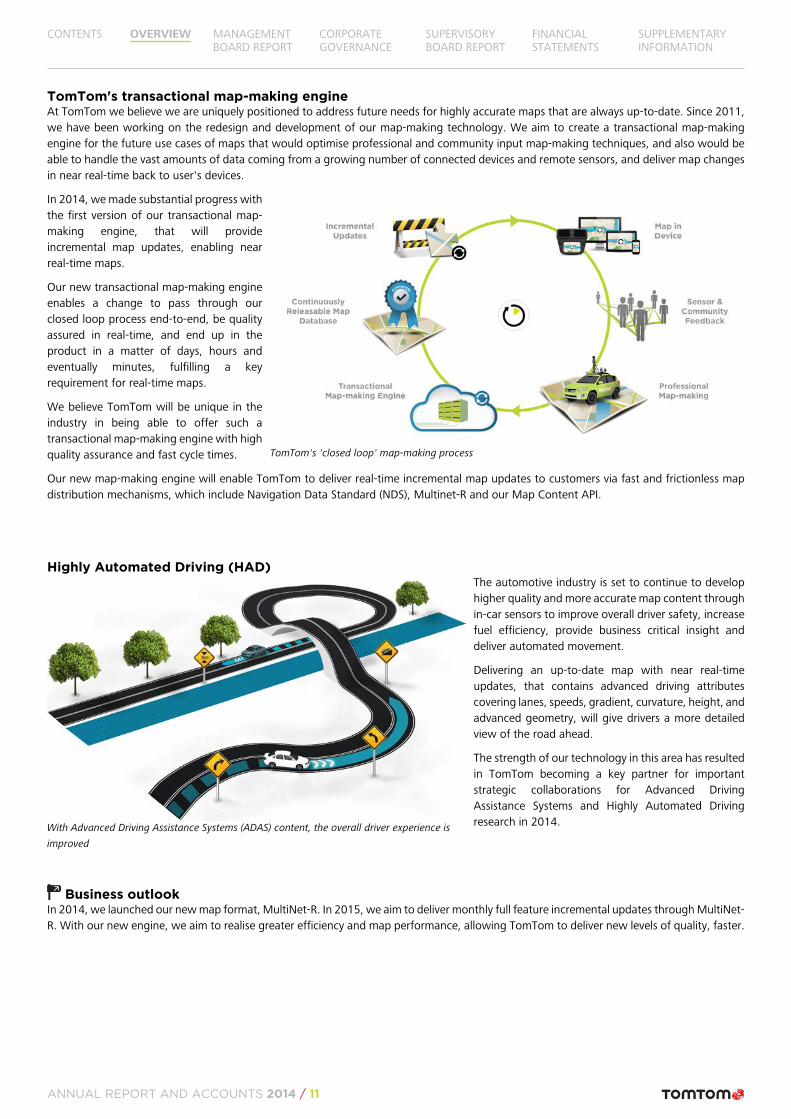
Highly Automated Driving (HAD)The automotive industry is set to continue to develophigher quality and more accurate map content throughin-car sensors to improve overall driver safety, increasefuel efficiency, provide business critical insight anddeliver automated movement.
Delivering an up-to-date map with near real-timeupdates, that contains advanced driving attributescovering lanes, speeds, gradient, curvature, height, andadvanced geometry, will give drivers a more detailedview of the road ahead.
The strength of our technology in this area has resultedin TomTom becoming a key partner for importantstrategic collaborations for Advanced DrivingAssistance Systems and Highly Automated Drivingresearch in 2014.
Business outlookIn 2014, we launched our new map format, MultiNet-R. In 2015, we aim to deliver monthly full feature incremental updates through MultiNet-R. With our new engine, we aim to realise greater efficiency and map performance, allowing TomTom to deliver new levels of quality, faster.
TomTom's 'closed loop' map-making process
With Advanced Driving Assistance Systems (ADAS) content, the overall driver experience is
improved
CONTENTS OVERVIEW MANAGEMENTBOARD REPORT
CORPORATEGOVERNANCE
SUPERVISORYBOARD REPORT
FINANCIALSTATEMENTS
SUPPLEMENTARYINFORMATION
ANNUAL REPORT AND ACCOUNTS 2014 / 11
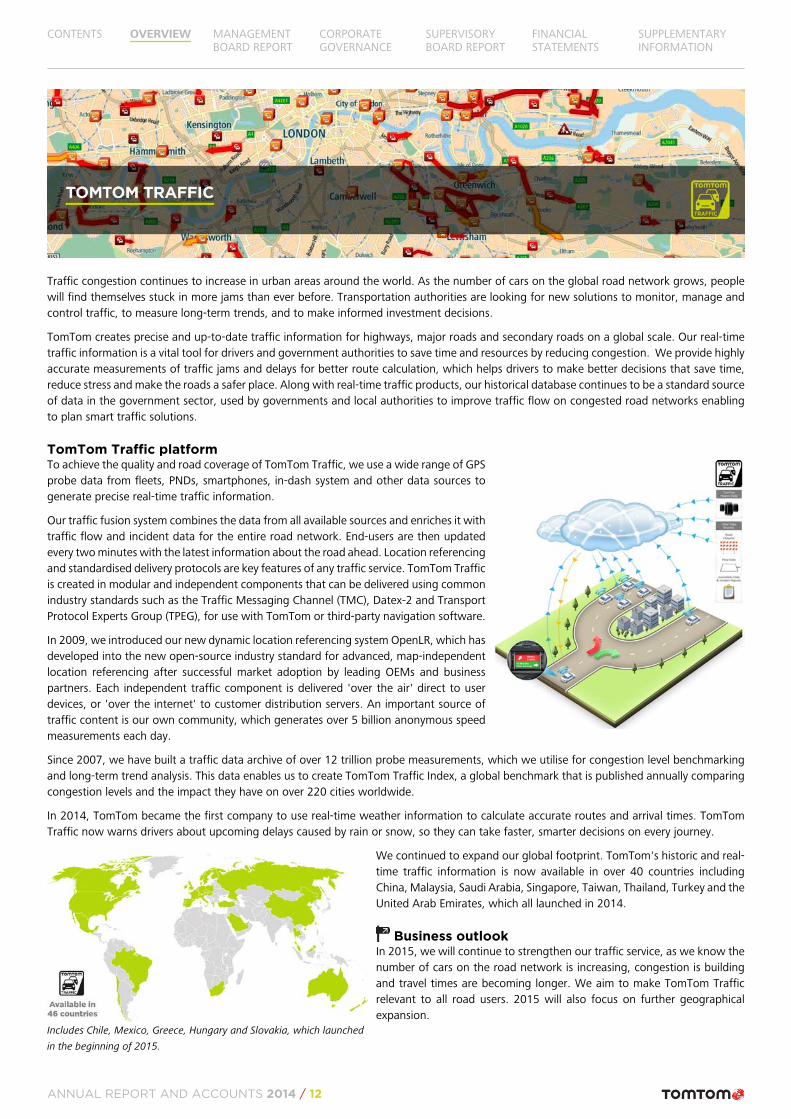
Traffic congestion continues to increase in urban areas around the world. As the number of cars on the global road network grows, peoplewill find themselves stuck in more jams than ever before. Transportation authorities are looking for new solutions to monitor, manage andcontrol traffic, to measure long-term trends, and to make informed investment decisions.
TomTom creates precise and up-to-date traffic information for highways, major roads and secondary roads on a global scale. Our real-timetraffic information is a vital tool for drivers and government authorities to save time and resources by reducing congestion. We provide highlyaccurate measurements of traffic jams and delays for better route calculation, which helps drivers to make better decisions that save time,reduce stress and make the roads a safer place. Along with real-time traffic products, our historical database continues to be a standard sourceof data in the government sector, used by governments and local authorities to improve traffic flow on congested road networks enablingto plan smart traffic solutions.
TomTom Traffic platformTo achieve the quality and road coverage of TomTom Traffic, we use a wide range of GPSprobe data from fleets, PNDs, smartphones, in-dash system and other data sources togenerate precise real-time traffic information.
Our traffic fusion system combines the data from all available sources and enriches it withtraffic flow and incident data for the entire road network. End-users are then updatedevery two minutes with the latest information about the road ahead. Location referencingand standardised delivery protocols are key features of any traffic service. TomTom Trafficis created in modular and independent components that can be delivered using commonindustry standards such as the Traffic Messaging Channel (TMC), Datex-2 and TransportProtocol Experts Group (TPEG), for use with TomTom or third-party navigation software.
In 2009, we introduced our new dynamic location referencing system OpenLR, which hasdeveloped into the new open-source industry standard for advanced, map-independentlocation referencing after successful market adoption by leading OEMs and businesspartners. Each independent traffic component is delivered 'over the air' direct to userdevices, or 'over the internet' to customer distribution servers. An important source oftraffic content is our own community, which generates over 5 billion anonymous speedmeasurements each day.
Since 2007, we have built a traffic data archive of over 12 trillion probe measurements, which we utilise for congestion level benchmarkingand long-term trend analysis. This data enables us to create TomTom Traffic Index, a global benchmark that is published annually comparingcongestion levels and the impact they have on over 220 cities worldwide.
In 2014, TomTom became the first company to use real-time weather information to calculate accurate routes and arrival times. TomTomTraffic now warns drivers about upcoming delays caused by rain or snow, so they can take faster, smarter decisions on every journey.
We continued to expand our global footprint. TomTom's historic and real-time traffic information is now available in over 40 countries includingChina, Malaysia, Saudi Arabia, Singapore, Taiwan, Thailand, Turkey and theUnited Arab Emirates, which all launched in 2014.
Business outlookIn 2015, we will continue to strengthen our traffic service, as we know thenumber of cars on the road network is increasing, congestion is buildingand travel times are becoming longer. We aim to make TomTom Trafficrelevant to all road users. 2015 will also focus on further geographicalexpansion.
Includes Chile, Mexico, Greece, Hungary and Slovakia, which launched
in the beginning of 2015.
CONTENTS OVERVIEW MANAGEMENTBOARD REPORT
CORPORATEGOVERNANCE
SUPERVISORYBOARD REPORT
FINANCIALSTATEMENTS
SUPPLEMENTARYINFORMATION
ANNUAL REPORT AND ACCOUNTS 2014 / 12
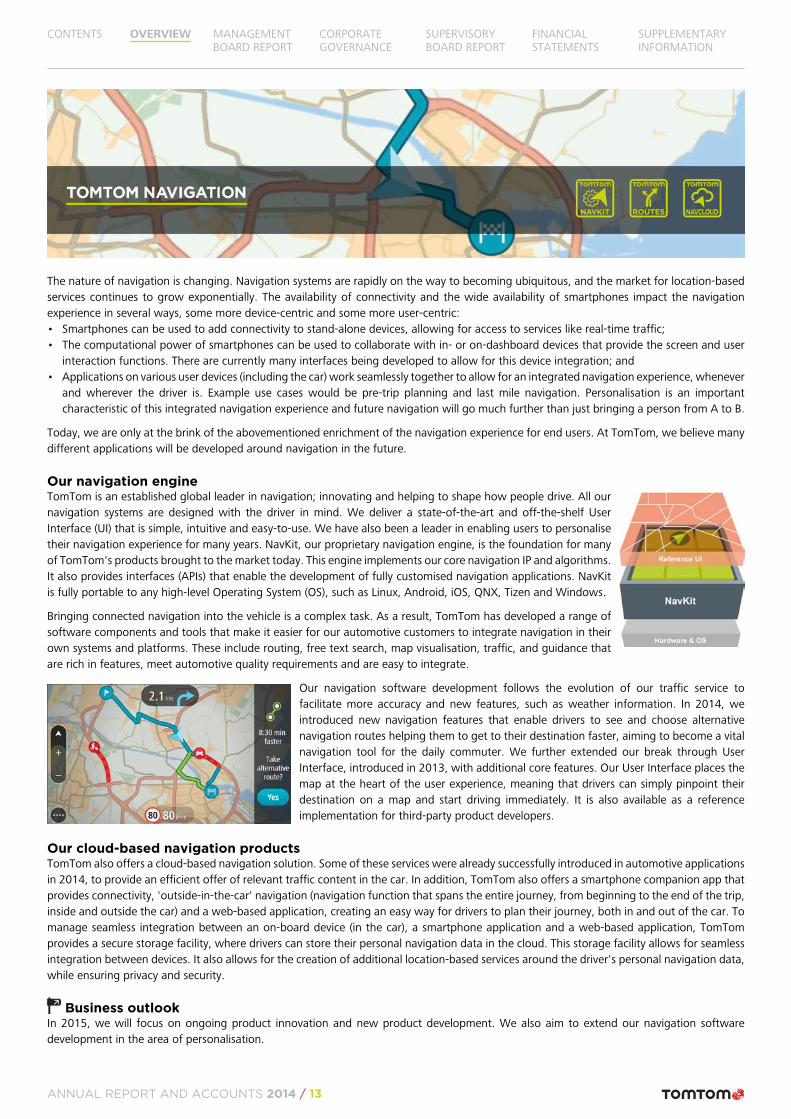
The nature of navigation is changing. Navigation systems are rapidly on the way to becoming ubiquitous, and the market for location-basedservices continues to grow exponentially. The availability of connectivity and the wide availability of smartphones impact the navigationexperience in several ways, some more device-centric and some more user-centric:• Smartphones can be used to add connectivity to stand-alone devices, allowing for access to services like real-time traffic;• The computational power of smartphones can be used to collaborate with in- or on-dashboard devices that provide the screen and user
interaction functions. There are currently many interfaces being developed to allow for this device integration; and• Applications on various user devices (including the car) work seamlessly together to allow for an integrated navigation experience, whenever
and wherever the driver is. Example use cases would be pre-trip planning and last mile navigation. Personalisation is an importantcharacteristic of this integrated navigation experience and future navigation will go much further than just bringing a person from A to B.
Today, we are only at the brink of the abovementioned enrichment of the navigation experience for end users. At TomTom, we believe manydifferent applications will be developed around navigation in the future.
Our navigation engineTomTom is an established global leader in navigation; innovating and helping to shape how people drive. All ournavigation systems are designed with the driver in mind. We deliver a state-of-the-art and off-the-shelf UserInterface (UI) that is simple, intuitive and easy-to-use. We have also been a leader in enabling users to personalisetheir navigation experience for many years. NavKit, our proprietary navigation engine, is the foundation for manyof TomTom's products brought to the market today. This engine implements our core navigation IP and algorithms.It also provides interfaces (APIs) that enable the development of fully customised navigation applications. NavKitis fully portable to any high-level Operating System (OS), such as Linux, Android, iOS, QNX, Tizen and Windows.
Bringing connected navigation into the vehicle is a complex task. As a result, TomTom has developed a range ofsoftware components and tools that make it easier for our automotive customers to integrate navigation in theirown systems and platforms. These include routing, free text search, map visualisation, traffic, and guidance thatare rich in features, meet automotive quality requirements and are easy to integrate.
Our navigation software development follows the evolution of our traffic service tofacilitate more accuracy and new features, such as weather information. In 2014, weintroduced new navigation features that enable drivers to see and choose alternativenavigation routes helping them to get to their destination faster, aiming to become a vitalnavigation tool for the daily commuter. We further extended our break through UserInterface, introduced in 2013, with additional core features. Our User Interface places themap at the heart of the user experience, meaning that drivers can simply pinpoint theirdestination on a map and start driving immediately. It is also available as a referenceimplementation for third-party product developers.
Our cloud-based navigation productsTomTom also offers a cloud-based navigation solution. Some of these services were already successfully introduced in automotive applicationsin 2014, to provide an efficient offer of relevant traffic content in the car. In addition, TomTom also offers a smartphone companion app thatprovides connectivity, 'outside-in-the-car' navigation (navigation function that spans the entire journey, from beginning to the end of the trip,inside and outside the car) and a web-based application, creating an easy way for drivers to plan their journey, both in and out of the car. Tomanage seamless integration between an on-board device (in the car), a smartphone application and a web-based application, TomTomprovides a secure storage facility, where drivers can store their personal navigation data in the cloud. This storage facility allows for seamlessintegration between devices. It also allows for the creation of additional location-based services around the driver's personal navigation data,while ensuring privacy and security.
Business outlookIn 2015, we will focus on ongoing product innovation and new product development. We also aim to extend our navigation softwaredevelopment in the area of personalisation.
CONTENTS OVERVIEW MANAGEMENTBOARD REPORT
CORPORATEGOVERNANCE
SUPERVISORYBOARD REPORT
FINANCIALSTATEMENTS
SUPPLEMENTARYINFORMATION
ANNUAL REPORT AND ACCOUNTS 2014 / 13

CONTENTS OVERVIEW MANAGEMENTBOARD REPORT
CORPORATEGOVERNANCE
SUPERVISORYBOARD REPORT
FINANCIALSTATEMENTS
SUPPLEMENTARYINFORMATION
ANNUAL REPORT AND ACCOUNTS 2014 / 14
MANAGEMENT BOARD REPORT
TomTom Management Board 15Business and financial review by business unit
Consumer 16Automotive 18Licensing 20Telematics 21
Group financial review 23Human resources 24Corporate social responsibility 25Business risks 26
Strategic risks 26Operational risks 27Legal and compliance risks 28Financial risks 28
In control and responsibility statement 29
TomTom Management Board
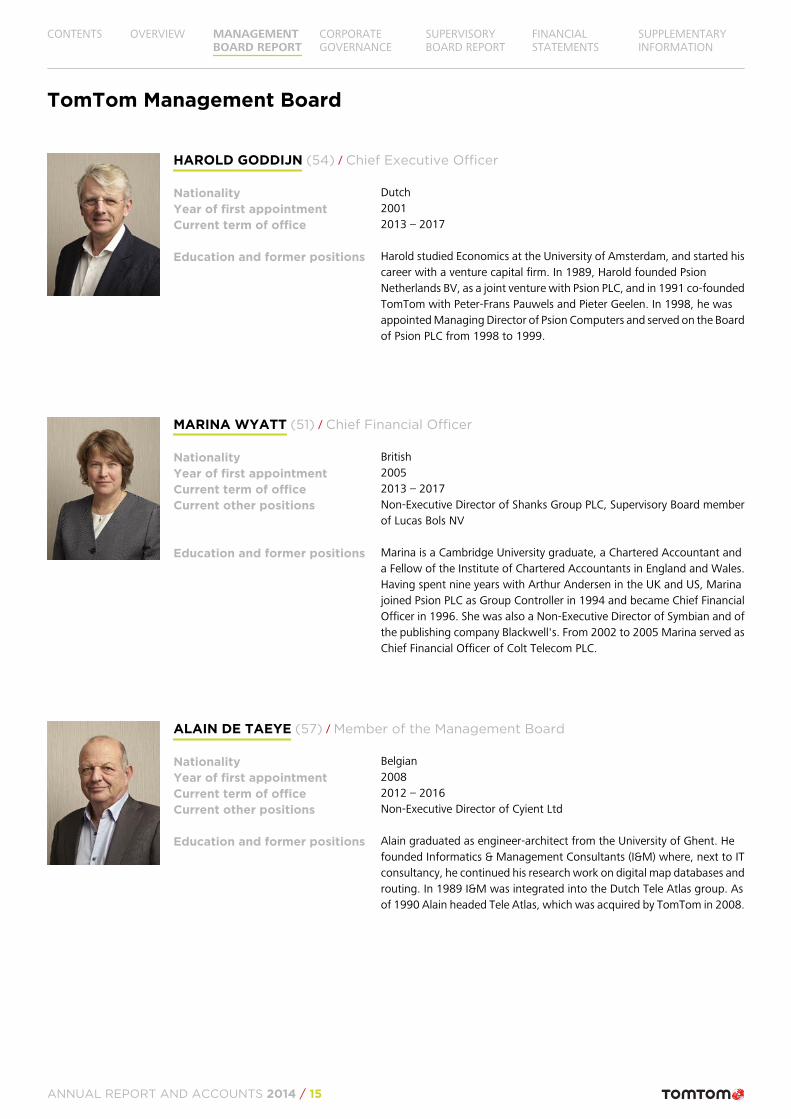
HAROLD GODDIJN (54) / Chief Executive Officer
Nationality DutchYear of first appointment 2001Current term of office 2013 – 2017
Education and former positions Harold studied Economics at the University of Amsterdam, and started hiscareer with a venture capital firm. In 1989, Harold founded PsionNetherlands BV, as a joint venture with Psion PLC, and in 1991 co-foundedTomTom with Peter-Frans Pauwels and Pieter Geelen. In 1998, he wasappointed Managing Director of Psion Computers and served on the Boardof Psion PLC from 1998 to 1999.
MARINA WYATT (51) / Chief Financial Officer
Nationality BritishYear of first appointment 2005Current term of office 2013 – 2017Current other positions Non-Executive Director of Shanks Group PLC, Supervisory Board member
of Lucas Bols NV
Education and former positions Marina is a Cambridge University graduate, a Chartered Accountant anda Fellow of the Institute of Chartered Accountants in England and Wales.Having spent nine years with Arthur Andersen in the UK and US, Marinajoined Psion PLC as Group Controller in 1994 and became Chief FinancialOfficer in 1996. She was also a Non-Executive Director of Symbian and ofthe publishing company Blackwell's. From 2002 to 2005 Marina served asChief Financial Officer of Colt Telecom PLC.
ALAIN DE TAEYE (57) / Member of the Management Board
Nationality BelgianYear of first appointment 2008Current term of office 2012 – 2016Current other positions Non-Executive Director of Cyient Ltd
Education and former positions Alain graduated as engineer-architect from the University of Ghent. Hefounded Informatics & Management Consultants (I&M) where, next to ITconsultancy, he continued his research work on digital map databases androuting. In 1989 I&M was integrated into the Dutch Tele Atlas group. Asof 1990 Alain headed Tele Atlas, which was acquired by TomTom in 2008.
CONTENTS OVERVIEW MANAGEMENTBOARD REPORT
CORPORATEGOVERNANCE
SUPERVISORYBOARD REPORT
FINANCIALSTATEMENTS
SUPPLEMENTARYINFORMATION
ANNUAL REPORT AND ACCOUNTS 2014 / 15
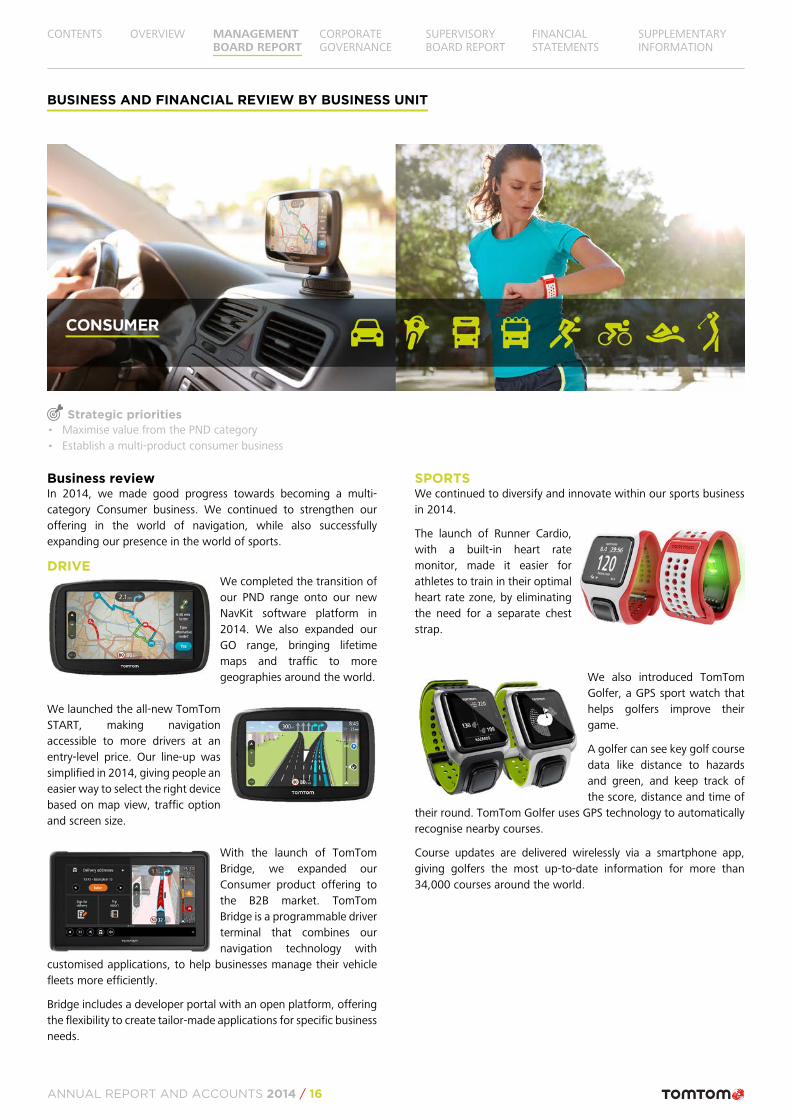
BUSINESS AND FINANCIAL REVIEW BY BUSINESS UNIT
Strategic priorities• Maximise value from the PND category• Establish a multi-product consumer business
Business reviewIn 2014, we made good progress towards becoming a multi-category Consumer business. We continued to strengthen ouroffering in the world of navigation, while also successfullyexpanding our presence in the world of sports.
DRIVEWe completed the transition ofour PND range onto our newNavKit software platform in2014. We also expanded ourGO range, bringing lifetimemaps and traffic to moregeographies around the world.
We launched the all-new TomTomSTART, making navigationaccessible to more drivers at anentry-level price. Our line-up wassimplified in 2014, giving people aneasier way to select the right devicebased on map view, traffic optionand screen size.
With the launch of TomTomBridge, we expanded ourConsumer product offering tothe B2B market. TomTomBridge is a programmable driverterminal that combines ournavigation technology with
customised applications, to help businesses manage their vehiclefleets more efficiently.
Bridge includes a developer portal with an open platform, offeringthe flexibility to create tailor-made applications for specific businessneeds.
SPORTSWe continued to diversify and innovate within our sports businessin 2014.
The launch of Runner Cardio,with a built-in heart ratemonitor, made it easier forathletes to train in their optimalheart rate zone, by eliminatingthe need for a separate cheststrap.
We also introduced TomTomGolfer, a GPS sport watch thathelps golfers improve theirgame.
A golfer can see key golf coursedata like distance to hazardsand green, and keep track ofthe score, distance and time of
their round. TomTom Golfer uses GPS technology to automaticallyrecognise nearby courses.
Course updates are delivered wirelessly via a smartphone app,giving golfers the most up-to-date information for more than34,000 courses around the world.
CONTENTS OVERVIEW MANAGEMENTBOARD REPORT
CORPORATEGOVERNANCE
SUPERVISORYBOARD REPORT
FINANCIALSTATEMENTS
SUPPLEMENTARYINFORMATION
ANNUAL REPORT AND ACCOUNTS 2014 / 16
Financial reviewKey figures overview(€ in millions, unless stated otherwise) 2014 2013 y.o.y.
change
1
Consumer products 548.4 567.0 –3%
Automotive hardware2 70.7 84.8 –17%
Total revenue 619.1 651.8 –5%
EBITDA 55.3 56.7 –2%
EBITDA margin (%) 9% 9%
EBIT 36.2 33.2 9%
EBIT margin (%) 6% 5%
Key PND market data
Market size Europe(# units sold in millions)3
7.7 8.4 –9%
TomTom market share (%) 52% 51%
Market size North America(# units sold in millions)
4.0 5.2 –23%
TomTom market share (%) 15% 17%1 Change percentages are based on non-rounded figures.2 Reporting structure for the Automotive business unit was reclassified in 2014. The hardware
component of previously developed in-dash hardware sales to automotive clients is now reportedin Consumer business unit, in order to clearly identify automotive revenue which comes from CNScomponents.
3 Europe refers to EMEA17: AT, CH, DE, BE, NL, FR, IT, GB, ES, PT, TR, CZ, PL, DK, SE, FI, ZA.
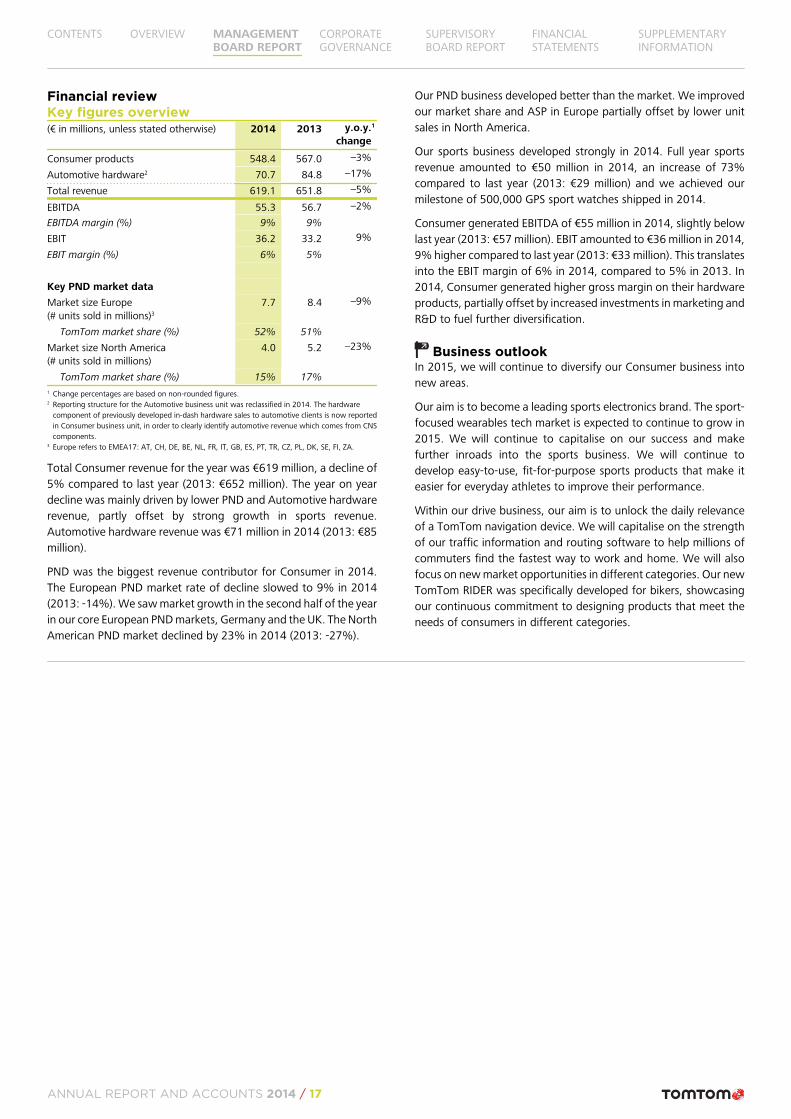
Total Consumer revenue for the year was €619 million, a decline of5% compared to last year (2013: €652 million). The year on yeardecline was mainly driven by lower PND and Automotive hardwarerevenue, partly offset by strong growth in sports revenue.Automotive hardware revenue was €71 million in 2014 (2013: €85million).
PND was the biggest revenue contributor for Consumer in 2014.The European PND market rate of decline slowed to 9% in 2014(2013: -14%). We saw market growth in the second half of the yearin our core European PND markets, Germany and the UK. The NorthAmerican PND market declined by 23% in 2014 (2013: -27%).
Our PND business developed better than the market. We improvedour market share and ASP in Europe partially offset by lower unitsales in North America.
Our sports business developed strongly in 2014. Full year sportsrevenue amounted to €50 million in 2014, an increase of 73%compared to last year (2013: €29 million) and we achieved ourmilestone of 500,000 GPS sport watches shipped in 2014.
Consumer generated EBITDA of €55 million in 2014, slightly belowlast year (2013: €57 million). EBIT amounted to €36 million in 2014,9% higher compared to last year (2013: €33 million). This translatesinto the EBIT margin of 6% in 2014, compared to 5% in 2013. In2014, Consumer generated higher gross margin on their hardwareproducts, partially offset by increased investments in marketing andR&D to fuel further diversification.
Business outlookIn 2015, we will continue to diversify our Consumer business intonew areas.
Our aim is to become a leading sports electronics brand. The sport-focused wearables tech market is expected to continue to grow in2015. We will continue to capitalise on our success and makefurther inroads into the sports business. We will continue todevelop easy-to-use, fit-for-purpose sports products that make iteasier for everyday athletes to improve their performance.
Within our drive business, our aim is to unlock the daily relevanceof a TomTom navigation device. We will capitalise on the strengthof our traffic information and routing software to help millions ofcommuters find the fastest way to work and home. We will alsofocus on new market opportunities in different categories. Our newTomTom RIDER was specifically developed for bikers, showcasingour continuous commitment to designing products that meet theneeds of consumers in different categories.
CONTENTS OVERVIEW MANAGEMENTBOARD REPORT
CORPORATEGOVERNANCE
SUPERVISORYBOARD REPORT
FINANCIALSTATEMENTS
SUPPLEMENTARYINFORMATION
ANNUAL REPORT AND ACCOUNTS 2014 / 17
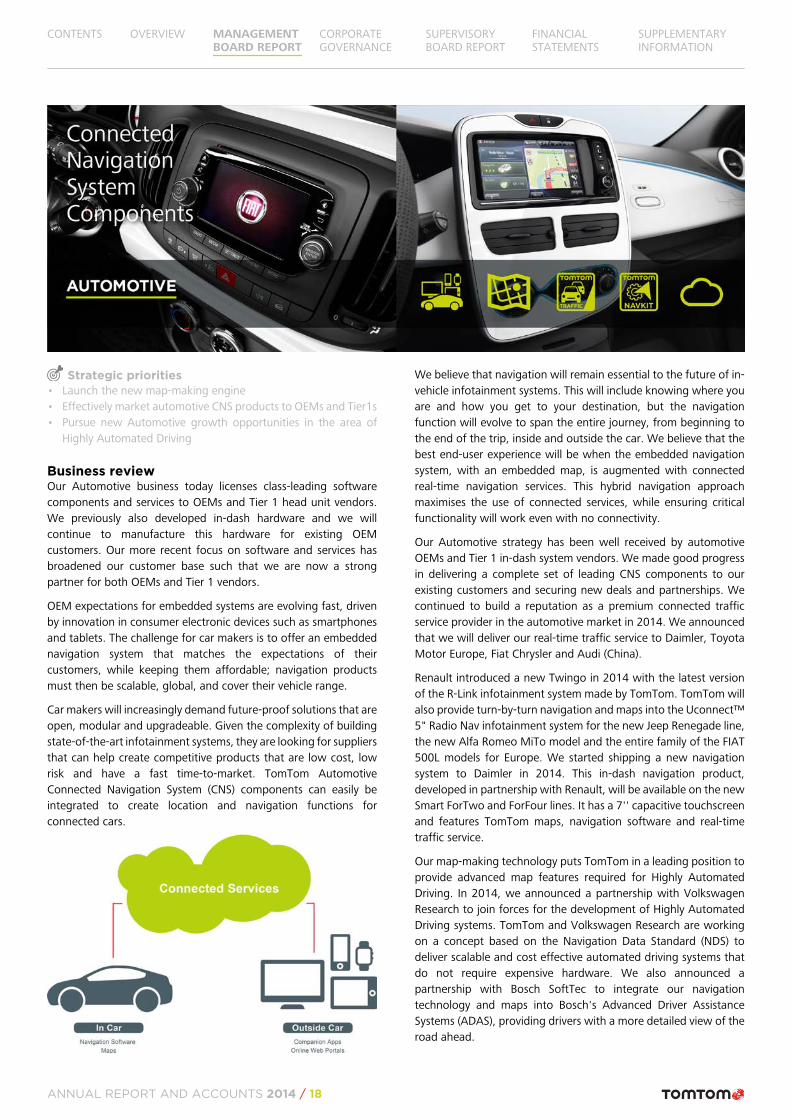
Strategic priorities• Launch the new map-making engine• Effectively market automotive CNS products to OEMs and Tier1s• Pursue new Automotive growth opportunities in the area of
Highly Automated Driving
Business reviewOur Automotive business today licenses class-leading softwarecomponents and services to OEMs and Tier 1 head unit vendors.We previously also developed in-dash hardware and we willcontinue to manufacture this hardware for existing OEMcustomers. Our more recent focus on software and services hasbroadened our customer base such that we are now a strongpartner for both OEMs and Tier 1 vendors.
OEM expectations for embedded systems are evolving fast, drivenby innovation in consumer electronic devices such as smartphonesand tablets. The challenge for car makers is to offer an embeddednavigation system that matches the expectations of theircustomers, while keeping them affordable; navigation productsmust then be scalable, global, and cover their vehicle range.
Car makers will increasingly demand future-proof solutions that areopen, modular and upgradeable. Given the complexity of buildingstate-of-the-art infotainment systems, they are looking for suppliersthat can help create competitive products that are low cost, lowrisk and have a fast time-to-market. TomTom AutomotiveConnected Navigation System (CNS) components can easily beintegrated to create location and navigation functions forconnected cars.
We believe that navigation will remain essential to the future of in-vehicle infotainment systems. This will include knowing where youare and how you get to your destination, but the navigationfunction will evolve to span the entire journey, from beginning tothe end of the trip, inside and outside the car. We believe that thebest end-user experience will be when the embedded navigationsystem, with an embedded map, is augmented with connectedreal-time navigation services. This hybrid navigation approachmaximises the use of connected services, while ensuring criticalfunctionality will work even with no connectivity.
Our Automotive strategy has been well received by automotiveOEMs and Tier 1 in-dash system vendors. We made good progressin delivering a complete set of leading CNS components to ourexisting customers and securing new deals and partnerships. Wecontinued to build a reputation as a premium connected trafficservice provider in the automotive market in 2014. We announcedthat we will deliver our real-time traffic service to Daimler, ToyotaMotor Europe, Fiat Chrysler and Audi (China).
Renault introduced a new Twingo in 2014 with the latest versionof the R-Link infotainment system made by TomTom. TomTom willalso provide turn-by-turn navigation and maps into the Uconnect™5" Radio Nav infotainment system for the new Jeep Renegade line,the new Alfa Romeo MiTo model and the entire family of the FIAT500L models for Europe. We started shipping a new navigationsystem to Daimler in 2014. This in-dash navigation product,developed in partnership with Renault, will be available on the newSmart ForTwo and ForFour lines. It has a 7'' capacitive touchscreenand features TomTom maps, navigation software and real-timetraffic service.
Our map-making technology puts TomTom in a leading position toprovide advanced map features required for Highly AutomatedDriving. In 2014, we announced a partnership with VolkswagenResearch to join forces for the development of Highly AutomatedDriving systems. TomTom and Volkswagen Research are workingon a concept based on the Navigation Data Standard (NDS) todeliver scalable and cost effective automated driving systems thatdo not require expensive hardware. We also announced apartnership with Bosch SoftTec to integrate our navigationtechnology and maps into Bosch's Advanced Driver AssistanceSystems (ADAS), providing drivers with a more detailed view of theroad ahead.
CONTENTS OVERVIEW MANAGEMENTBOARD REPORT
CORPORATEGOVERNANCE
SUPERVISORYBOARD REPORT
FINANCIALSTATEMENTS
SUPPLEMENTARYINFORMATION
ANNUAL REPORT AND ACCOUNTS 2014 / 18
Financial reviewKey figures overview(€ in millions, unless stated otherwise) 2014 2013 y.o.y.
change
1
Revenue2 109.4 110.9 –1%
EBITDA3 20.1 37.9 –47%
EBITDA margin (%) 18% 34%
EBIT –28.7 –11.8 n.m.
EBIT margin (%) –26% –11%1 Change percentages are based on non-rounded figures.2 Reporting structure for the Automotive business unit was reclassified in 2014. The hardware
component of previously developed in-dash hardware sales to automotive clients is now reportedin Consumer business unit, in order to clearly identify automotive revenue which comes from CNScomponents. Additionally, due to client portfolio redistribution a minor amount of revenue wasmoved from Licensing to Automotive.
3 Automotive D&A costs mainly include amortisation related to our map asset (including acquisition-related amortisation) and our navigation software development.
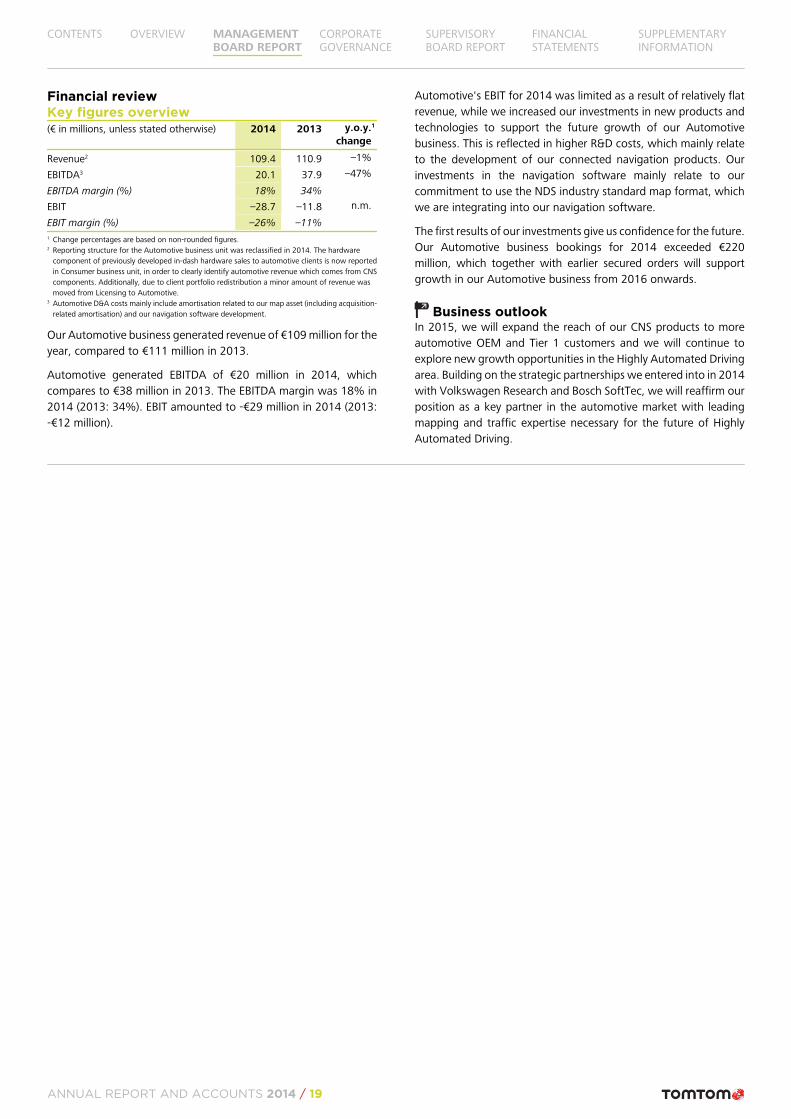
Our Automotive business generated revenue of €109 million for theyear, compared to €111 million in 2013.
Automotive generated EBITDA of €20 million in 2014, whichcompares to €38 million in 2013. The EBITDA margin was 18% in2014 (2013: 34%). EBIT amounted to -€29 million in 2014 (2013:-€12 million).
Automotive's EBIT for 2014 was limited as a result of relatively flatrevenue, while we increased our investments in new products andtechnologies to support the future growth of our Automotivebusiness. This is reflected in higher R&D costs, which mainly relateto the development of our connected navigation products. Ourinvestments in the navigation software mainly relate to ourcommitment to use the NDS industry standard map format, whichwe are integrating into our navigation software.
The first results of our investments give us confidence for the future.Our Automotive business bookings for 2014 exceeded €220million, which together with earlier secured orders will supportgrowth in our Automotive business from 2016 onwards.
Business outlookIn 2015, we will expand the reach of our CNS products to moreautomotive OEM and Tier 1 customers and we will continue toexplore new growth opportunities in the Highly Automated Drivingarea. Building on the strategic partnerships we entered into in 2014with Volkswagen Research and Bosch SoftTec, we will reaffirm ourposition as a key partner in the automotive market with leadingmapping and traffic expertise necessary for the future of HighlyAutomated Driving.
CONTENTS OVERVIEW MANAGEMENTBOARD REPORT
CORPORATEGOVERNANCE
SUPERVISORYBOARD REPORT
FINANCIALSTATEMENTS
SUPPLEMENTARYINFORMATION
ANNUAL REPORT AND ACCOUNTS 2014 / 19
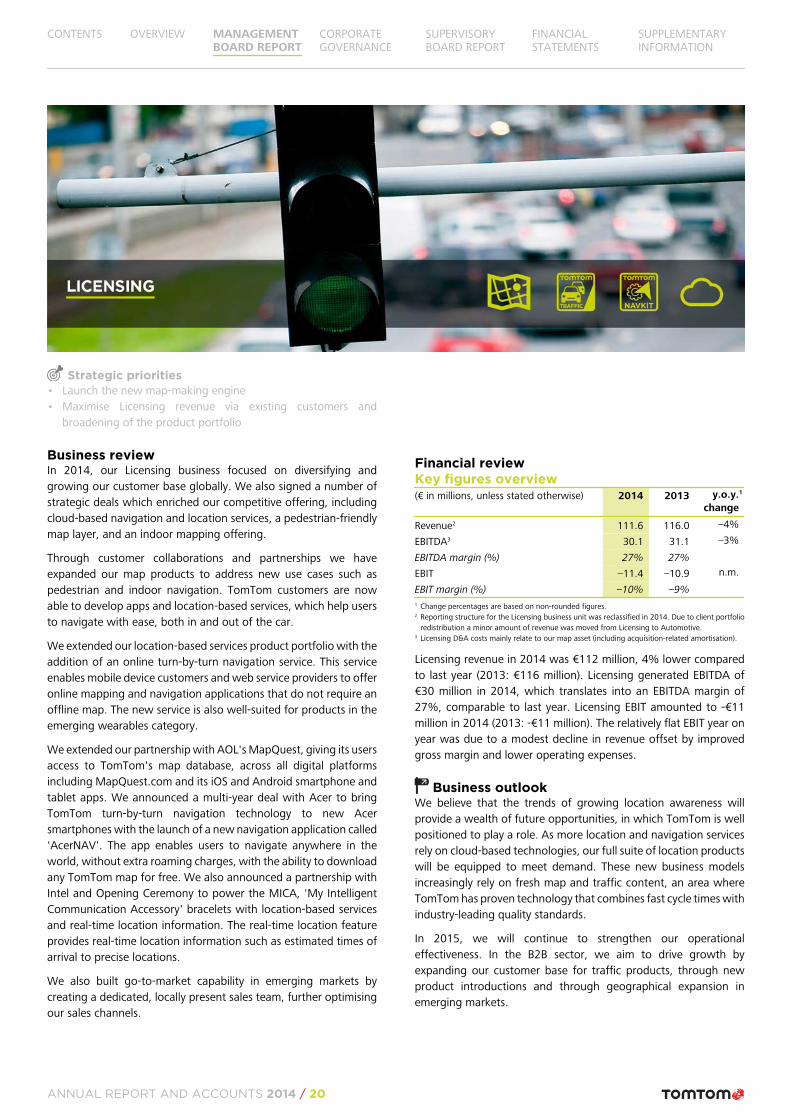
Strategic priorities• Launch the new map-making engine• Maximise Licensing revenue via existing customers and
broadening of the product portfolio
Business reviewIn 2014, our Licensing business focused on diversifying andgrowing our customer base globally. We also signed a number ofstrategic deals which enriched our competitive offering, includingcloud-based navigation and location services, a pedestrian-friendlymap layer, and an indoor mapping offering.
Through customer collaborations and partnerships we haveexpanded our map products to address new use cases such aspedestrian and indoor navigation. TomTom customers are nowable to develop apps and location-based services, which help usersto navigate with ease, both in and out of the car.
We extended our location-based services product portfolio with theaddition of an online turn-by-turn navigation service. This serviceenables mobile device customers and web service providers to offeronline mapping and navigation applications that do not require anoffline map. The new service is also well-suited for products in theemerging wearables category.
We extended our partnership with AOL's MapQuest, giving its usersaccess to TomTom's map database, across all digital platformsincluding MapQuest.com and its iOS and Android smartphone andtablet apps. We announced a multi-year deal with Acer to bringTomTom turn-by-turn navigation technology to new Acersmartphones with the launch of a new navigation application called'AcerNAV'. The app enables users to navigate anywhere in theworld, without extra roaming charges, with the ability to downloadany TomTom map for free. We also announced a partnership withIntel and Opening Ceremony to power the MICA, 'My IntelligentCommunication Accessory' bracelets with location-based servicesand real-time location information. The real-time location featureprovides real-time location information such as estimated times ofarrival to precise locations.
We also built go-to-market capability in emerging markets bycreating a dedicated, locally present sales team, further optimisingour sales channels.
Financial reviewKey figures overview(€ in millions, unless stated otherwise) 2014 2013 y.o.y.
change
1
Revenue2 111.6 116.0 –4%
EBITDA3 30.1 31.1 –3%
EBITDA margin (%) 27% 27%
EBIT –11.4 –10.9 n.m.
EBIT margin (%) –10% –9%1 Change percentages are based on non-rounded figures.2 Reporting structure for the Licensing business unit was reclassified in 2014. Due to client portfolio
redistribution a minor amount of revenue was moved from Licensing to Automotive.3 Licensing D&A costs mainly relate to our map asset (including acquisition-related amortisation).
Licensing revenue in 2014 was €112 million, 4% lower comparedto last year (2013: €116 million). Licensing generated EBITDA of€30 million in 2014, which translates into an EBITDA margin of27%, comparable to last year. Licensing EBIT amounted to -€11million in 2014 (2013: -€11 million). The relatively flat EBIT year onyear was due to a modest decline in revenue offset by improvedgross margin and lower operating expenses.
Business outlookWe believe that the trends of growing location awareness willprovide a wealth of future opportunities, in which TomTom is wellpositioned to play a role. As more location and navigation servicesrely on cloud-based technologies, our full suite of location productswill be equipped to meet demand. These new business modelsincreasingly rely on fresh map and traffic content, an area whereTomTom has proven technology that combines fast cycle times withindustry-leading quality standards.
In 2015, we will continue to strengthen our operationaleffectiveness. In the B2B sector, we aim to drive growth byexpanding our customer base for traffic products, through newproduct introductions and through geographical expansion inemerging markets.
CONTENTS OVERVIEW MANAGEMENTBOARD REPORT
CORPORATEGOVERNANCE
SUPERVISORYBOARD REPORT
FINANCIALSTATEMENTS
SUPPLEMENTARYINFORMATION
ANNUAL REPORT AND ACCOUNTS 2014 / 20
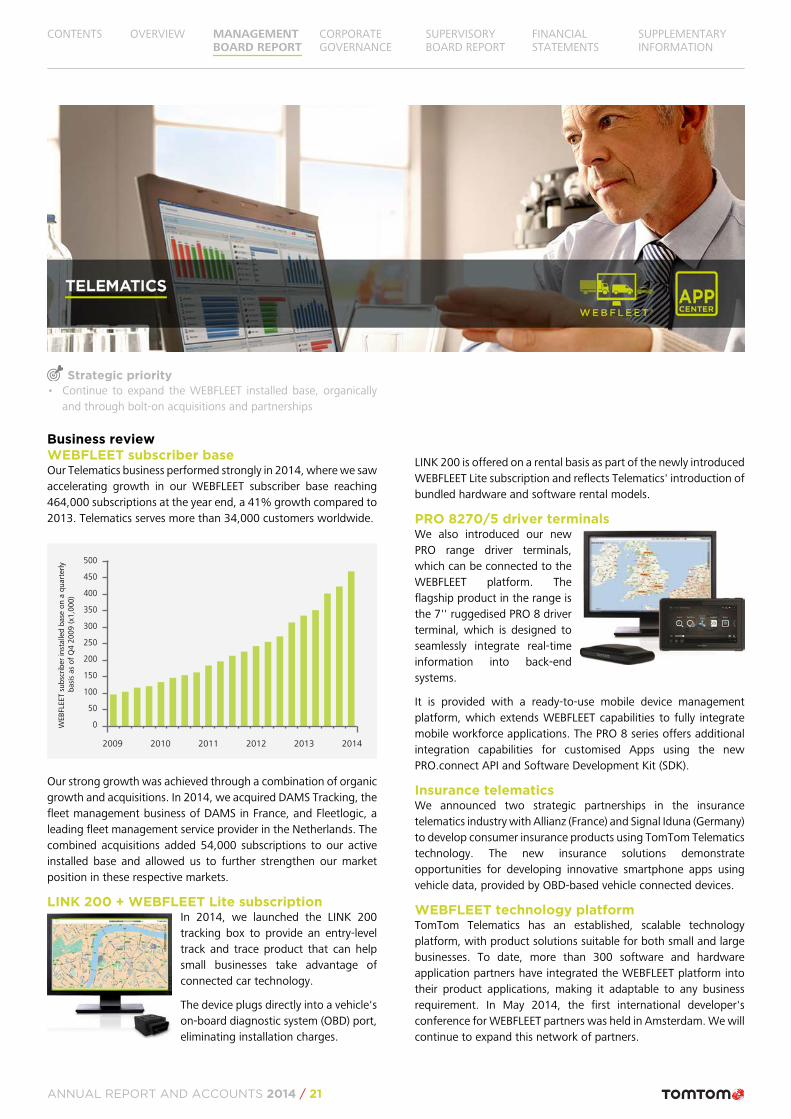
Strategic priority• Continue to expand the WEBFLEET installed base, organically
and through bolt-on acquisitions and partnerships
Business reviewWEBFLEET subscriber baseOur Telematics business performed strongly in 2014, where we sawaccelerating growth in our WEBFLEET subscriber base reaching464,000 subscriptions at the year end, a 41% growth compared to2013. Telematics serves more than 34,000 customers worldwide.
2009 2010 2011 2012 2013 2014
0
50
150
500
450
400
200
250
350
300
100
WEB
FLEET
sub
scri
ber
inst
alle
d b
ase
on a
quart
erl
y
basi
s as
of
Q4 2
009 (x1
,000)
Our strong growth was achieved through a combination of organicgrowth and acquisitions. In 2014, we acquired DAMS Tracking, thefleet management business of DAMS in France, and Fleetlogic, aleading fleet management service provider in the Netherlands. Thecombined acquisitions added 54,000 subscriptions to our activeinstalled base and allowed us to further strengthen our marketposition in these respective markets.
LINK 200 + WEBFLEET Lite subscriptionIn 2014, we launched the LINK 200tracking box to provide an entry-leveltrack and trace product that can helpsmall businesses take advantage ofconnected car technology.
The device plugs directly into a vehicle'son-board diagnostic system (OBD) port,eliminating installation charges.
LINK 200 is offered on a rental basis as part of the newly introducedWEBFLEET Lite subscription and reflects Telematics' introduction ofbundled hardware and software rental models.
PRO 8270/5 driver terminalsWe also introduced our newPRO range driver terminals,which can be connected to theWEBFLEET platform. Theflagship product in the range isthe 7'' ruggedised PRO 8 driverterminal, which is designed toseamlessly integrate real-timeinformation into back-endsystems.
It is provided with a ready-to-use mobile device managementplatform, which extends WEBFLEET capabilities to fully integratemobile workforce applications. The PRO 8 series offers additionalintegration capabilities for customised Apps using the newPRO.connect API and Software Development Kit (SDK).
Insurance telematicsWe announced two strategic partnerships in the insurancetelematics industry with Allianz (France) and Signal Iduna (Germany)to develop consumer insurance products using TomTom Telematicstechnology. The new insurance solutions demonstrateopportunities for developing innovative smartphone apps usingvehicle data, provided by OBD-based vehicle connected devices.
WEBFLEET technology platformTomTom Telematics has an established, scalable technologyplatform, with product solutions suitable for both small and largebusinesses. To date, more than 300 software and hardwareapplication partners have integrated the WEBFLEET platform intotheir product applications, making it adaptable to any businessrequirement. In May 2014, the first international developer'sconference for WEBFLEET partners was held in Amsterdam. We willcontinue to expand this network of partners.
CONTENTS OVERVIEW MANAGEMENTBOARD REPORT
CORPORATEGOVERNANCE
SUPERVISORYBOARD REPORT
FINANCIALSTATEMENTS
SUPPLEMENTARYINFORMATION
ANNUAL REPORT AND ACCOUNTS 2014 / 21
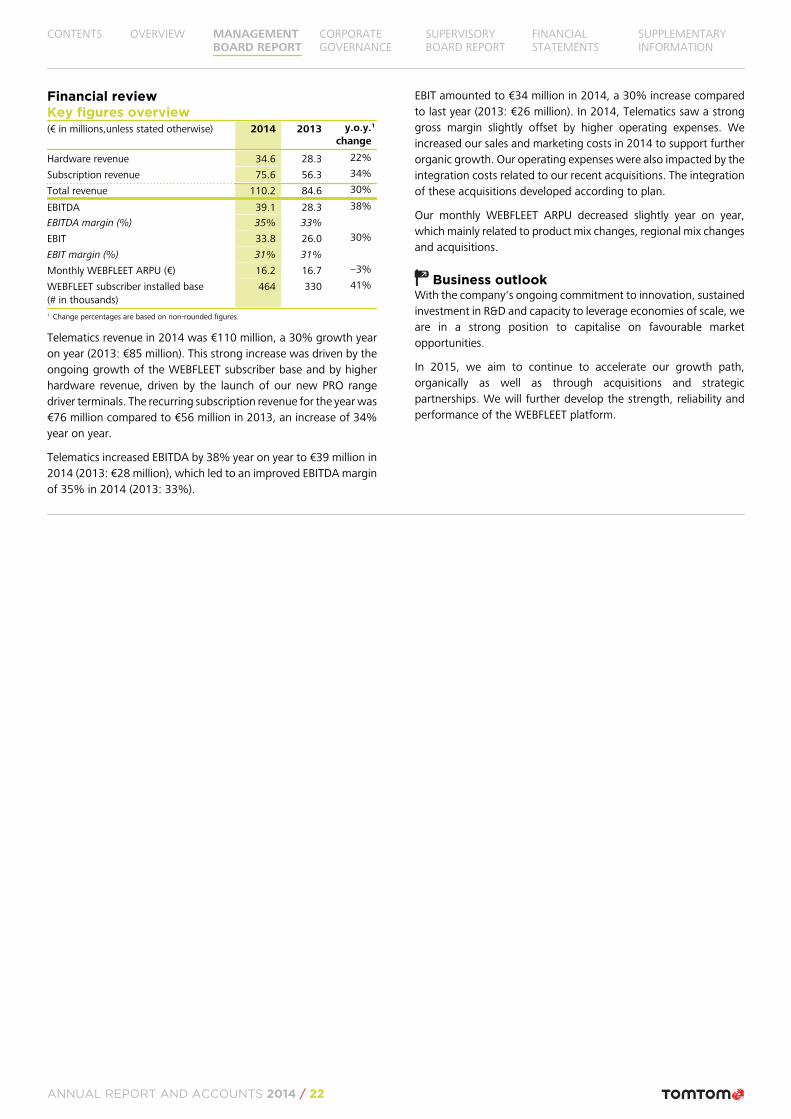
Financial reviewKey figures overview(€ in millions,unless stated otherwise) 2014 2013 y.o.y.
change
1
Hardware revenue 34.6 28.3 22%
Subscription revenue 75.6 56.3 34%
Total revenue 110.2 84.6 30%
EBITDA 39.1 28.3 38%
EBITDA margin (%) 35% 33%
EBIT 33.8 26.0 30%
EBIT margin (%) 31% 31%
Monthly WEBFLEET ARPU (€) 16.2 16.7 –3%
WEBFLEET subscriber installed base(# in thousands)
464 330 41%
1 Change percentages are based on non-rounded figures.
Telematics revenue in 2014 was €110 million, a 30% growth yearon year (2013: €85 million). This strong increase was driven by theongoing growth of the WEBFLEET subscriber base and by higherhardware revenue, driven by the launch of our new PRO rangedriver terminals. The recurring subscription revenue for the year was€76 million compared to €56 million in 2013, an increase of 34%year on year.
Telematics increased EBITDA by 38% year on year to €39 million in2014 (2013: €28 million), which led to an improved EBITDA marginof 35% in 2014 (2013: 33%).
EBIT amounted to €34 million in 2014, a 30% increase comparedto last year (2013: €26 million). In 2014, Telematics saw a stronggross margin slightly offset by higher operating expenses. Weincreased our sales and marketing costs in 2014 to support furtherorganic growth. Our operating expenses were also impacted by theintegration costs related to our recent acquisitions. The integrationof these acquisitions developed according to plan.
Our monthly WEBFLEET ARPU decreased slightly year on year,which mainly related to product mix changes, regional mix changesand acquisitions.
Business outlookWith the company's ongoing commitment to innovation, sustainedinvestment in R&D and capacity to leverage economies of scale, weare in a strong position to capitalise on favourable marketopportunities.
In 2015, we aim to continue to accelerate our growth path,organically as well as through acquisitions and strategicpartnerships. We will further develop the strength, reliability andperformance of the WEBFLEET platform.
CONTENTS OVERVIEW MANAGEMENTBOARD REPORT
CORPORATEGOVERNANCE
SUPERVISORYBOARD REPORT
FINANCIALSTATEMENTS
SUPPLEMENTARYINFORMATION
ANNUAL REPORT AND ACCOUNTS 2014 / 22
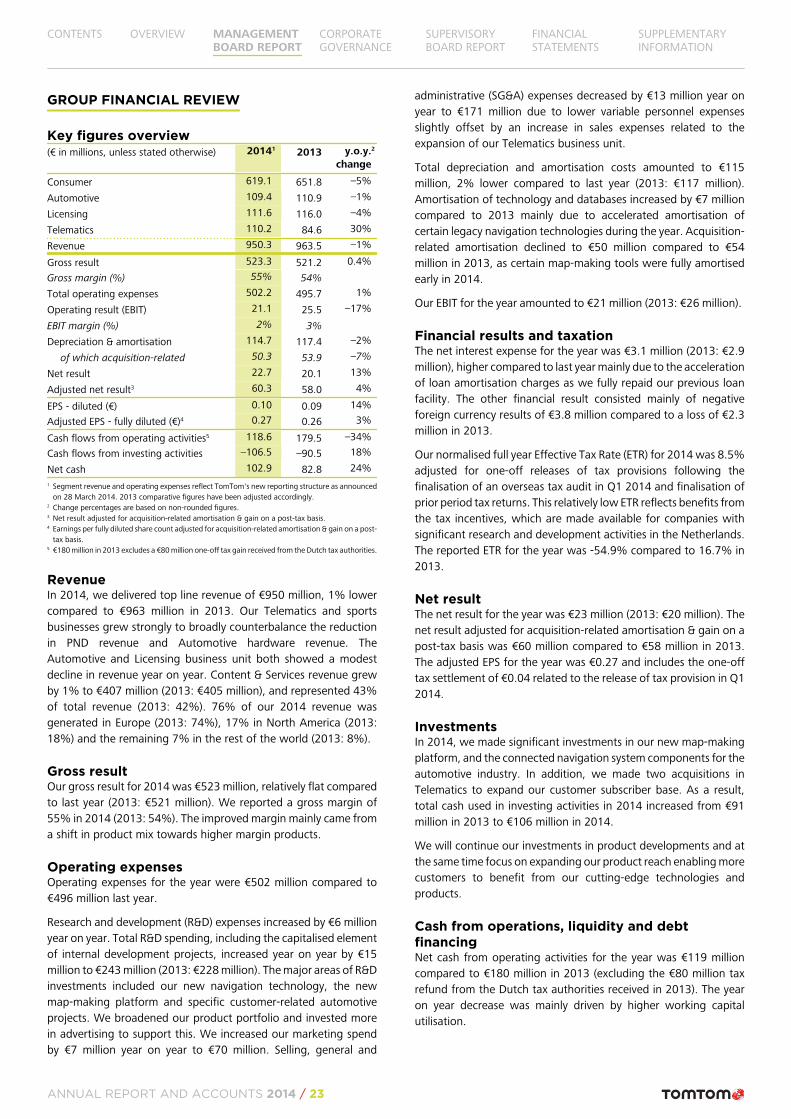
GROUP FINANCIAL REVIEW
Key figures overview(€ in millions, unless stated otherwise) 20141 2013 y.o.y.
change
2
Consumer 619.1 651.8 –5%
Automotive 109.4 110.9 –1%
Licensing 111.6 116.0 –4%
Telematics 110.2 84.6 30%
Revenue 950.3 963.5 –1%
Gross result 523.3 521.2 0.4%
Gross margin (%) 55% 54%
Total operating expenses 502.2 495.7 1%
Operating result (EBIT) 21.1 25.5 –17%
EBIT margin (%) 2% 3%
Depreciation & amortisation 114.7 117.4 –2%
of which acquisition-related 50.3 53.9 –7%
Net result 22.7 20.1 13%
Adjusted net result3 60.3 58.0 4%
EPS - diluted (€) 0.10 0.09 14%
Adjusted EPS - fully diluted (€)4 0.27 0.26 3%
Cash flows from operating activities5 118.6 179.5 –34%
Cash flows from investing activities –106.5 –90.5 18%
Net cash 102.9 82.8 24%1 Segment revenue and operating expenses reflect TomTom's new reporting structure as announced
on 28 March 2014. 2013 comparative figures have been adjusted accordingly.2 Change percentages are based on non-rounded figures.3 Net result adjusted for acquisition-related amortisation & gain on a post-tax basis.4 Earnings per fully diluted share count adjusted for acquisition-related amortisation & gain on a post-
tax basis.5 €180 million in 2013 excludes a €80 million one-off tax gain received from the Dutch tax authorities.
RevenueIn 2014, we delivered top line revenue of €950 million, 1% lowercompared to €963 million in 2013. Our Telematics and sportsbusinesses grew strongly to broadly counterbalance the reductionin PND revenue and Automotive hardware revenue. TheAutomotive and Licensing business unit both showed a modestdecline in revenue year on year. Content & Services revenue grewby 1% to €407 million (2013: €405 million), and represented 43%of total revenue (2013: 42%). 76% of our 2014 revenue wasgenerated in Europe (2013: 74%), 17% in North America (2013:18%) and the remaining 7% in the rest of the world (2013: 8%).
Gross resultOur gross result for 2014 was €523 million, relatively flat comparedto last year (2013: €521 million). We reported a gross margin of55% in 2014 (2013: 54%). The improved margin mainly came froma shift in product mix towards higher margin products.
Operating expensesOperating expenses for the year were €502 million compared to€496 million last year.
Research and development (R&D) expenses increased by €6 millionyear on year. Total R&D spending, including the capitalised elementof internal development projects, increased year on year by €15million to €243 million (2013: €228 million). The major areas of R&Dinvestments included our new navigation technology, the newmap-making platform and specific customer-related automotiveprojects. We broadened our product portfolio and invested morein advertising to support this. We increased our marketing spendby €7 million year on year to €70 million. Selling, general and
administrative (SG&A) expenses decreased by €13 million year onyear to €171 million due to lower variable personnel expensesslightly offset by an increase in sales expenses related to theexpansion of our Telematics business unit.
Total depreciation and amortisation costs amounted to €115million, 2% lower compared to last year (2013: €117 million).Amortisation of technology and databases increased by €7 millioncompared to 2013 mainly due to accelerated amortisation ofcertain legacy navigation technologies during the year. Acquisition-related amortisation declined to €50 million compared to €54million in 2013, as certain map-making tools were fully amortisedearly in 2014.
Our EBIT for the year amounted to €21 million (2013: €26 million).
Financial results and taxationThe net interest expense for the year was €3.1 million (2013: €2.9million), higher compared to last year mainly due to the accelerationof loan amortisation charges as we fully repaid our previous loanfacility. The other financial result consisted mainly of negativeforeign currency results of €3.8 million compared to a loss of €2.3million in 2013.
Our normalised full year Effective Tax Rate (ETR) for 2014 was 8.5%adjusted for one-off releases of tax provisions following thefinalisation of an overseas tax audit in Q1 2014 and finalisation ofprior period tax returns. This relatively low ETR reflects benefits fromthe tax incentives, which are made available for companies withsignificant research and development activities in the Netherlands.The reported ETR for the year was -54.9% compared to 16.7% in2013.
Net resultThe net result for the year was €23 million (2013: €20 million). Thenet result adjusted for acquisition-related amortisation & gain on apost-tax basis was €60 million compared to €58 million in 2013.The adjusted EPS for the year was €0.27 and includes the one-offtax settlement of €0.04 related to the release of tax provision in Q12014.
InvestmentsIn 2014, we made significant investments in our new map-makingplatform, and the connected navigation system components for theautomotive industry. In addition, we made two acquisitions inTelematics to expand our customer subscriber base. As a result,total cash used in investing activities in 2014 increased from €91million in 2013 to €106 million in 2014.
We will continue our investments in product developments and atthe same time focus on expanding our product reach enabling morecustomers to benefit from our cutting-edge technologies andproducts.
Cash from operations, liquidity and debtfinancingNet cash from operating activities for the year was €119 millioncompared to €180 million in 2013 (excluding the €80 million taxrefund from the Dutch tax authorities received in 2013). The yearon year decrease was mainly driven by higher working capitalutilisation.
CONTENTS OVERVIEW MANAGEMENTBOARD REPORT
CORPORATEGOVERNANCE
SUPERVISORYBOARD REPORT
FINANCIALSTATEMENTS
SUPPLEMENTARYINFORMATION
ANNUAL REPORT AND ACCOUNTS 2014 / 23
Net cash used in financing activities was €118 million (2013: €74million), which included €7 million cash in from the exercise of 1.4million options related to our long-term employee incentiveprogrammes.
In December 2014, we replaced our existing term loan andrevolving credit facility, which originated from 2011. The new creditfacility comprises of a revolving credit facility of €250 million, whichwill provide us with the flexibility to manage our operating andinvestment financing needs. The agreement is effective for a three-year period with a renewal option at the end of this period. Theinterest rate on this new facility is based on Euribor plus a spreadwhich depends on specified leverage covenants. In December2014, we made a full repayment of our previous term loan and atthe same time drew down an amount of €50 million from our newcredit facility. At the end of the year our cash position was €153million versus €258 million at the end of 2013 and the net cashposition was €103 million (2013: €83 million).
Outlook for 2015In 2015, we plan for revenue growth and expect revenue of around€1 billion. Adjusted EPS is expected of around €0.20, which is lowerthan 2014 because of adverse currency movements and the one-off tax settlement of €0.04 that was reported in the first quarter oflast year.
In 2015, we will maintain the level of investment (both capitalexpenditures and operating expenses) in our core technologies. Inparticular, we are investing in advanced content and software forthe automotive industry (e.g. to enable Highly Automated Driving)and in our new map-making platform. We expect these investmentsto lead in the medium term to higher Automotive revenue. The2014 bookings of more than €220 million provides support that weare on the right track.
The number of employees in 2015 is expected to be broadlycomparable to 2014.
HUMAN RESOURCES
Our goal is to employ highly talented people who are fully engagedin our business and who deliver high levels of personal performanceat work. TomTom employs more than 4,000 people across 54locations in 37 countries. Our HR Team is responsible for thedevelopment and delivery of all initiatives to retain talentedemployees and attract new talent to the company. TomTombelieves in fairness. Our employment policies provide equalopportunities for all, regardless of age, gender, ethnicity, socialbackground, religion, disability or sexuality.
Employee engagement programmeTomTom currently operates several key employee initiatives withinthe company-wide global engagement programme. The initiativeswithin the programme are designed to ensure that we motivateand engage our employees. They include initiatives in careerdevelopment, management and leadership, organisationaleffectiveness, workplace processes and policies, and compensationand benefits.
Career developmentTomTom is committed to enabling our employees to develop theirtalents and realise their ambitions within the company. The careerdevelopment initiatives aim to motivate and retain employees byproviding them with career opportunities and developmentchallenges. Over the past few years, we have created career tracksfor our Engineering, Finance, Customer Care and Map Operationsemployees. In 2014, we worked on enhancing these career tracks.In 2014, we conducted a successful graduate programme with 10top graduates from renowned universities. Their roles relate toSales, Product Marketing, Product Management and UX Design.We also launched “Interns on Track”, a programme that aims tocontinuously attract and develop young talent and offer studentsfrom universities worldwide the opportunity to apply their learning.We have a company-wide talent management process includingsuccession planning. Our succession planning approach helpsmanagement to identify and support a ready pipeline of talent thatis capable of taking on challenging roles and management positionswithin the company in the future. In 2014, we introduced anadditional process to succession planning that includes
development assessments for potential successors in order todetermine their readiness for their next career steps.
Management and leadershipWe introduced a consistent approach to training our peoplemanagers three years ago. In 2014, we conducted training in theNetherlands and Poland, and over 240 managers have completedthe programme to date. We continued the investment in ourleadership development programme aimed at our executive levelmanagers. The programme was developed in close cooperationwith a global training provider, as well as a number of academicsfrom a leading European business school. In 2014, we continued atraining and development programme to assist the leaders of ourShared Services Units to support the business. Members of the IT,Finance, Legal and Human Resources teams have followed thisprogramme. During 2014, we launched a Sales training anddevelopment programme for non-sales employees, withparticipants from the Engineering, Product Management, ProductMarketing and Finance departments.
Organisational effectivenessIn 2014, we continued to focus attention on further improving thesoftware development capabilities within our engineering teams.We also launched a global programme for Product Management.The programme targets hiring practices and internal developmentprogrammes. We have reorganised the group managementstructure to allow greater focus on the markets in which we operateand to secure our technology assets in dedicated organisationalunits. Finally, we completed the acquisition of businesses locatedin France and the Netherlands and continued to expand our Polandand India operations. In Pune, we now employ approximately 650people. At the end of 2014, 28% of our employees were based inthe Netherlands, compared to 31% at the end of 2013. In terms ofemployee statistics, we ended 2014 with 65% of our employeesbased in EMEA, 24% in APAC and 11% in the Americas. Thesefigures exclude interns. In terms of gender diversity, 29% of ourworkforce is female and 71% is male. For management roles, 26%of middle management (defined as up to Director level) is female,29% of Executive Management is female, and of the threemembers of our Management Board one is female.
CONTENTS OVERVIEW MANAGEMENTBOARD REPORT
CORPORATEGOVERNANCE
SUPERVISORYBOARD REPORT
FINANCIALSTATEMENTS
SUPPLEMENTARYINFORMATION
ANNUAL REPORT AND ACCOUNTS 2014 / 24
Workplace processes and policiesAs a company, we believe that our work processes and employmentpolicies should enable employees to work effectively with minimalbureaucracy. During 2014, we continued to monitor and wherenecessary amend employment policies and work processes. Weimproved reporting tools for line managers, including detailedinformation on both their permanent and contingent workforces.In 2014, we introduced easier processes for people managersthrough user-friendly self-service functions.
Compensation and benefitsOur remuneration strategy is key for attracting and retaining talent.We aim to provide fair, competitive and responsible compensationfor each of our employees. Our performance-related bonus plan,which rewards company performance and individual performance,was introduced in 2009. The bonuses paid as a percentage of basepay vary according to the job grade and reflect the level of influenceof each role in the execution of TomTom's strategy.
Our performance-related bonus plan is in line with TomTom'svision, which is that success for our business should also meansuccess for the individual employee.
Long-term incentives are part of our remuneration policy, for boththe Management Board and our employees. They are intended toattract and retain key talent to the company. Our long-termincentive programmes include phantom stock, along with stockoptions and restricted stock, which are offered to selected keytalents. All of our long-term incentive programmes have a vestingperiod of three years.
In terms of employee benefits, TomTom is committed to offeringall employees secure pension, health and disability cover.Accordingly, our benefit programmes focus primarily on theseaspects. Next to these important benefit programmes, we also offera product discount programme worldwide as part of our benefitspackage to encourage ownership of TomTom products.
CORPORATE SOCIAL RESPONSIBILITY
Community givingAt TomTom we are committed to having a strong, positive socialimpact. We take an active role in supporting the communities inwhich we work. In 2014, we continued to focus our CSR activitieson supporting causes across the world through financial donationsand donations of TomTom products. In May, Serbia suffered theworst flooding in its history. As a result, over 40% of the countrysuffered damage and 3,500 kilometres of roads were destroyed. Tosupport the efforts to rebuild the country’s road infrastructure, wedonated €10,000 to the Serbian Red Cross.
Our PND donation programme supported several charities,including The American Red Cross which received over 1,000devices to help emergency responders get where they needed tobe faster in the event of a national disaster. We also donated PNDsto smaller charities which promote road safety, provide charitablecare and help disadvantaged youth.
Taking an active role and giving back to the community has alwaysbeen an important part of our working culture. In 2015, we arelaunching a new CSR initiative working with local charities that arefocused on getting Children fit and active. For any charitable eventwe organise or take part in, the money raised will go to thesecharities and, as a company, we will also provide funding andresources to these charities.
Supply chainAs a global business we are committed to continuously improvingour supply management practices. To enable us to effectivelyachieve these objectives, TomTom has been a member of theElectronic Industry Citizenship Coalition (EICC) since 2012.
We expect our suppliers to share our commitment to corporatesocial responsibility and continuous improvement in social andenvironmental performance; not only in the development andmanufacturing of products but also in the way they conduct theirbusinesses.
In order to assess our supply chain against these goals, we apply athree-step framework:1. Secure the commitment of our suppliers to meet our
requirements;2. Use a range of analytical tools to identify and monitor supplier
risk;3. Manage risks by monitoring where best to focus our auditing
efforts.
We have an Electronics Code of Conduct, based on the EICCindustry code of conduct, which sets out the electronics supplychain standards and practices for business conduct that we expectfrom our suppliers. This code is embedded in our vendor selectionprocess and is signed by all our tier 1 major suppliers. We expectour suppliers to comply with this code. We believe that a riskmanagement approach enables us to spend our resourcesefficiently by identifying areas of high risk. The risk profile, self-assessments and audits are all based on EICC industry-developedtools and practices, which we believe to be the most appropriateand relevant to our business and our supply chain. Using EICC toolsis not only efficient for TomTom but it also sends a consistentmessage to our suppliers, and minimises the duplication of theireffort between different customer requirements.
In 2014, we completed facility risk assessments for 100% of ourtier 1 suppliers using EICC-developed tools. This includes electronicsassembly suppliers for the PND, in-dash navigation systems andsports products. These suppliers account for almost 85% ofTomTom's total supply chain spend. It also included 50% of ourlogistics suppliers, accounting for a further 6% of total supply chainspend. We found that the majority of the supplier facility riskassessments had a low-risk profile and there were no high-riskfindings. As a result, we did not conduct any independent supplieraudits in 2014. We also maintained our efforts to improve internalprocesses for the management of environmental productcompliance in 2014. Our focus for CSR in 2015 will be to grow ourcommunity giving programme to help more local communities, andto maintain our efforts to work with our suppliers to make sure theyfollow the required standards of business conduct regardingenvironmental and social responsibility.
CONTENTS OVERVIEW MANAGEMENTBOARD REPORT
CORPORATEGOVERNANCE
SUPERVISORYBOARD REPORT
FINANCIALSTATEMENTS
SUPPLEMENTARYINFORMATION
ANNUAL REPORT AND ACCOUNTS 2014 / 25
BUSINESS RISKS
TomTom can be adversely affected by a variety of business risks andeconomic developments. A structured risk management processhelps management to better understand how risks might impactthe company and to take appropriate risk mitigation initiatives. Weupdate our business risk profile every year in order to manage ourmost important risks.
Below is an overview of our key business risks. The sequence of risksbelow does not reflect an order of importance, vulnerability ormateriality. We believe that the careful management of all of theserisks is important and that singling out particular risks could disruptthe balance of our risk management programme.
Approach to risk managementSenior management together agree on the risk managementpriorities for the group. A single owner is assigned responsibility foreach risk, which helps ensure clear accountability for the mitigatingactions. The Business Assurance department facilitates the annualassessment of business risks to achieve an appropriate level ofobjectivity in our assessment of risks. The business risk profile istaken into account when establishing our strategy, annual businessplans and budgets.
Group risk profileBelow is an overview of the risks that we believe are most relevantto the achievement of our strategy. This overview is not exhaustiveand should be considered in connection with forward-lookingstatements. There may be risks not yet known to us or which arecurrently not deemed to be material, which could later turn out tohave a significant impact on our business and could have a materialadverse effect on TomTom's financial condition, results ofoperations and liquidity.
Strategic risksCompetitive landscapeWe operate in a highly dynamic and competitive industrycharacterised by convergence of technologies, consolidation ofcompetitors, as well as new and disruptive technologies andinnovations. Failure to adapt our organisation to industry trends orotherwise remain competitive could have a material adverse effecton our business and TomTom's financial condition, results ofoperations and liquidity.
Many of our current competitors are large, well-knownorganisations with greater financial, technical and human resourcesthan ours. They may have greater ability to fund product researchand development and capitalise on potential market opportunities.New competitors interested in the same markets and products mayalso emerge. Industry consolidation may also result in increasedcompetition.
We have entered into a number of strategic partnerships and jointventures to bring competitive product and service offerings tomarket. If any of our strategic partners fail to perform as plannedor if we fail to find suitable partners for our business activities, wemay be unable to bring our products and services to the marketand maintain a competitive market position.
Global economicsThe majority of our sales are generated in Europe which makes usvulnerable to the continued concerns about the macro-economicenvironment across the region. The US is also an important marketfor us and deterioration in consumer demand in this region wouldhave a negative impact on our financial results.
The majority of our purchases are made in USD. Any devaluationof the euro against the USD would therefore have a negative impacton our profitability. We use foreign exchange contracts to mitigatethe risks, although these are short term in nature and do not coverall our open exposures.
The impact of global economic conditions on consumer demandcould impair our ability to generate sufficient cash flow to supportour operational and investment plans. These or other unforeseenmacro-economic conditions may render us unable to implementour strategic agenda as planned and consequently could have amaterial adverse effect on TomTom's financial condition, results ofoperations and liquidity.
Geographical sustainabilityThe largest portion of our revenue is generated in Europe and weview maintaining market share in Europe as vital to our commercialsuccess. The US is also an important market for us in which we aimto maintain market share.
Our aspirations to grow in high growth markets such as the BRICScountries will expose us to additional political, legal, social andeconomic risks. We cannot be certain that our products and serviceswill meet consumer acceptance in these markets and we may beunable to realise our growth objectives in these emerging markets.If we are unable to realise our growth plans in emerging marketsour anticipated revenues and profits could be adversely affected.
AutomotiveThe automotive market is continuously evolving with respect tonavigation. Although the navigation experience for our end usersis similar, whether the navigation system is built in the dash orprovided on a PND, the dynamics of supplying to the automotiveindustry are different from those for delivering mass-marketconsumer electronics. Our easy-to-integrate Navigation DataStandard (NDS)-based Connected Navigation System will aid inaddressing the Automotive opportunity.
There could be additional operational and technical challenges ingrowing our automotive business and maintaining profitability overthe longer term in such a rapidly evolving environment.Furthermore, new map and navigation providers may choose toenter the automotive market, which could significantly increase thelevel of competition we face. If we are unsuccessful in maintainingand growing a profitable automotive business, our financialcondition, results of operations and liquidity may be materiallyadversely affected.
Brand All our products and services are brought to market under onebrand. This leads to brand concentration risk. Brand value can beseverely damaged, even by isolated incidents affecting thereputation of our business or our products and services. Some ofthese incidents may be beyond our ability to control and can erodeconsumer confidence in our products or services.
CONTENTS OVERVIEW MANAGEMENTBOARD REPORT
CORPORATEGOVERNANCE
SUPERVISORYBOARD REPORT
FINANCIALSTATEMENTS
SUPPLEMENTARYINFORMATION
ANNUAL REPORT AND ACCOUNTS 2014 / 26
Factors that negatively affect our reputation or brand image, suchas adverse consumer publicity, inferior product quality or poorservice, could have a material adverse effect on our financialcondition and results of operations.
Innovation and engineering capabilitiesOur markets are characterised by rapid technological change,which challenges us to deliver highly competitive products andservices on an ongoing basis. We will continue to focus on ourproduct management capabilities and producing high qualityinnovative solutions, but there can be no guarantee that ourproducts and services will compete successfully against current ornew market entrants or competing technologies.
Our success depends on our ability to rapidly develop, market andcommercialise new and upgraded products and services. The timingof our new product and service releases, our ability to accuratelyforecast market demand, our product mix relative to that of ourcompetitors and our ability to understand and meet changingconsumer preferences are vital to this effort. Should we be unableto meet these challenges it may have a material adverse effect onour financial condition and results of operations.
Digital mappingThe competitive environment requires continuous investment innew technology for creating and updating map databases. Mapsneed to be continuously updated for changes in the environmentand we are continuously adding new geographies and attributes toour map database to enable us to meet the needs of existingcustomers, bring out new products and expand into new markets.
If we are unable to invest sufficiently to compete with other globalmap providers in terms of both the quality and coverage and tomodernise our map delivery platforms, our business, our financialcondition, results of operations and liquidity may be materiallyadversely affected.
Dependency on GPS satellitesOur navigation products and services depend on GPS satellitetransmissions that provide position data to our customers. GPSsatellites are funded and maintained by the US government. Wehave no control over their maintenance, support or repair. Theavailability and free use of GPS signals to the level of accuracyrequired for commercial use remains at the sole discretion of theUS government.
GPS signals are carried on radio frequency bands. Any reallocationof, or interference with these bands could impair the functionalityof our products. Our Navigation products use positioning chipswhich are compatible with GLONASS (Russian Satellite System).Chinese and European systems are in various stages ofdevelopment; these systems again remain under the control ofsponsoring governments and agencies.
Operational risksHuman resourcesIn order to be a market leader in our industry we need to have themost talented people working effectively together. The success ofour business depends on attracting, integrating and retaining highlyskilled personnel in all business units and development centres.
We aim to employ highly talented people in our organisation. Wehave a rigorous recruitment process so that we can have high levelsof confidence in the people we hire. To retain talent within our
organisation we monitor the organisational health of the companyand have programmes in place to retain and keep key employeesengaged. However, if we are unable to attract and retain the highlytalented people we require, our ability to operate our businesssuccessfully could be significantly impaired.
Supply chainWe depend on a limited number of third parties and, in certaininstances, on sole suppliers, for map content, component supply,connectivity and manufacturing. Any disruption to or terminationof our relationships with third-party manufacturers, suppliers ordistributors, or any reduction in their ability to supply our needswould adversely affect our business.
Our capacity to deliver innovative products to the market meansthat we will continue to be dependent to some extent oncomponents that are only available from specific leadingtechnology organisations. Single-source component risk willremain a part of our business model for the foreseeable future. Ifwe are unable to source any critical components, particularly criticalsingle-source components, our business could be significantlyimpaired and our financial condition, results of operations andliquidity could be materially adversely affected.
Product QualityOur industry is characterised by frequent technological advances.In order to remain competitive, we need to continuously innovateto introduce new and upgraded products and services. Difficultiesmay be experienced that delay the development, introduction ormarket acceptance of our new or enhanced products.
Furthermore, we develop complex hardware and softwareproducts which may experience material defects, errors or failure.We have internal quality control standards and procedures tomitigate these risks. However, should any of our products fail tooperate as intended or otherwise experience quality problems, ourreputation and brand value may suffer and we may be exposed toincreased operating costs and the possibility of significant warrantyand consumer product liability, which could adversely affect ourfinancial condition, results of operations and liquidity.
Performance of real-time servicesWe provide a variety of e-commerce and service portals for ourproducts and services on a 24/7 basis, these include: fleetmanagement services, live traffic information and sales via ourwebsite. To provide these services to our customers we rely on ourown, as well as outsourced, information technology,telecommunications and other infrastructure systems.
A significant disruption to the availability of these systems couldcause interruptions in our service to customers that may causereputational damage for us and could trigger contractual penaltieswhich could have a material adverse effect on our financialcondition and results of operations.
Disaster recovery planningUnforeseen business disruptions could affect our service tocustomers and cause loss of, or delays in TomTom's critical businesssystems, our research and development work and/or productshipments. Any permanent or temporary loss of these systemswould result in reputational damage, loss of revenue and liabilitiesto our clients. In the case of a catastrophic disaster our company'ssuccess rests on our ability to restore our critical data and rebuildour IT business systems.
CONTENTS OVERVIEW MANAGEMENTBOARD REPORT
CORPORATEGOVERNANCE
SUPERVISORYBOARD REPORT
FINANCIALSTATEMENTS
SUPPLEMENTARYINFORMATION
ANNUAL REPORT AND ACCOUNTS 2014 / 27
We have business continuity and disaster recovery planning in placefor certain systems and various eventualities. However, we areunable to plan for every possible disaster or incident. A major failureof a business critical system from which we are not able to quicklyrecover could have a material adverse effect on our financialcondition, results of operations and liquidity.
Legal and compliance risksIntellectual propertyWe rely on a combination of trademarks, trade names, patents,confidentiality and non-disclosure clauses and agreements,copyrights and design rights to defend and protect our tradesecrets, and rights to the intellectual property in our products.
We may be faced with claims that we have infringed the intellectualproperty rights or patents of others, which if successfully assertedagainst us may result in us being ordered to pay substantialdamages or forced to stop or delay the development, manufactureor sale of infringing products. Any such outcome could have amaterial adverse effect on our financial condition, results ofoperations and liquidity. Furthermore, even if we were to prevail,any litigation could be costly and time-consuming.
Privacy of customer dataThe focus of our business providing location-based products andservices to individual customers, growing public awareness andincreased scrutiny by regulatory authorities, means that compliancewith privacy regulations and customer expectations is increasinglyimportant in maintaining our competitive position.
While we anonymise the trace data we collect from our individualcustomers, and our privacy programme is designed to ensureTomTom's Privacy Principles are adhered to throughout ouroperations and in the design of our products and services, ourreputation and brand may suffer if we fail to comply with privacyregulations or otherwise fail to meet our customers' expectationsin relation to privacy matters.
Information securityOur business operations and reputation are substantiallydependent on our ability to maintain confidentiality, integrity andavailability over information regarding customers, employees,suppliers, proprietary technologies, intellectual property andbusiness processes. Our information security programme requiresthat we deploy and maintain information security controls,processes and tools in our operations and products using a risk-based approach. However, the volume and sophistication ofinformation security threats continue to grow. The leakage ofconfidential information, unauthorised use of our systems andnetworks or defective products could adversely affect our businessand could have a material adverse effect on our financial conditions,results of operations and liquidity.
Financial risksFinancial risks are presented in note 28. Financial risk managementin the consolidated financial statements.
CONTENTS OVERVIEW MANAGEMENTBOARD REPORT
CORPORATEGOVERNANCE
SUPERVISORYBOARD REPORT
FINANCIALSTATEMENTS
SUPPLEMENTARYINFORMATION
ANNUAL REPORT AND ACCOUNTS 2014 / 28
IN CONTROL AND RESPONSIBILITY STATEMENT
The Management Board is responsible for TomTom's riskmanagement and internal control systems. The Management Boardbelieves that the company maintains an adequate and effectivesystem of risk management and internal control that complies withthe requirements of the Dutch Corporate Governance Code (theCode).
The internal control systems are designed to manage, rather thaneliminate, the risk that we fail to achieve our business objectivesand can provide reasonable, but not absolute, assurance againstfinancial loss or material misstatements in the financial statements.
The Management Board reviews the effectiveness of TomTom'ssystems of internal control relative to strategic, financial,operational and compliance risks and discusses risk managementand internal controls with the Audit Committee on at least aquarterly basis.
TomTom embeds risk management in its strategic businessplanning. A top-down approach is followed in which managementidentifies the major risks that could affect the company's businessobjectives - and assesses the effectiveness of the processes andinternal controls in place to manage and mitigate these risks. Foran overview of our most important business risks, please refer tothe Business Risks section. Assurance on the effectiveness ofcontrols is obtained through management reviews, monitoringcontrol dashboards, control self-assessments, internal audits andtesting of certain aspects of our internal financial control systemsby the external auditors during their annual audit.
This, however, does not imply that certainty as to the realisation ofour business and financial objectives can be provided, nor can theapproach taken by the company to internal control over financialreporting be expected to prevent or detect all misstatements,errors, fraud or violation of law or regulations.
The key features of the systems of internal control are as follows:• Clearly defined lines of accountability and delegation of
authority are in place, together with comprehensive reportingand analysis against approved budgets;
• A financial shared service centre with a centralised ERPenvironment which allows us to monitor our businessthroughout all regions and apply a consistent level of control;
• Operating risk is minimised by ensuring that the appropriateinfrastructure, controls, systems and people are in placethroughout the business;
• An organisational design is in place that supports businessobjectives and a culture that encourages open and transparentcommunication;
• Centralised Treasury operations manage cash balances andexposure to credit default and currency risks through treasurypolicies, risk limits and monitoring procedures; and
• A Code of Conduct is accessible to all staff via the intranet, whichincludes whistleblowing facilities.
The key controls over financial reporting policies and proceduresinclude controls to ensure that:• Commitments and expenditures are appropriately authorised by
the Management Board;• Records are maintained which accurately and fairly reflect
transactions;• Any unauthorised acquisition, use or disposal of the company's
assets that could have a material effect on the FinancialStatements are detected on a timely basis;
• Transactions are recorded as required to permit the preparationof financial statements; and
• Reporting of the financial statements is done in compliance withIFRS.
The Management Board believes, based on the activities performedin 2014 and in accordance with best practice provision II.1.5 of theCode, that the risk management and control systems with regardto the financial reporting risks have functioned effectively in 2014,and that the risk management and control systems provide areasonable assurance that the 2014 financial statements do notcontain any errors of material importance.
With reference to the statement within the meaning of Article 5:25(2c) of the Financial Supervision Act, the Management Board statesthat, to the best of its knowledge:• The annual financial statements give a true and fair view of the
assets, liabilities, financial position and profit or loss of thecompany and the undertakings included in the consolidationtaken as a whole; and that
• The Management Board Report includes a fair review of thedevelopment and performance of the business and the positionof the company and the undertakings included in theconsolidation taken as a whole, together with a description ofthe principal risks and uncertainties that the company faces.
Amsterdam, 12 February 2015
The Management BoardHarold Goddijn / Chief Executive OfficerMarina Wyatt / Chief Financial OfficerAlain De Taeye / Member of the Management Board
CONTENTS OVERVIEW MANAGEMENTBOARD REPORT
CORPORATEGOVERNANCE
SUPERVISORYBOARD REPORT
FINANCIALSTATEMENTS
SUPPLEMENTARYINFORMATION
ANNUAL REPORT AND ACCOUNTS 2014 / 29

CONTENTS OVERVIEW MANAGEMENTBOARD REPORT
CORPORATEGOVERNANCE
SUPERVISORYBOARD REPORT
FINANCIALSTATEMENTS
SUPPLEMENTARYINFORMATION
ANNUAL REPORT AND ACCOUNTS 2014 / 30
CORPORATE GOVERNANCE
Introduction 31Deviations from the Corporate Governance Code 31Legal structure of the company 31Management Board 31Supervisory Board 32General Meeting 33The capital structure 34Protection mechanism 34Notification of substantial shareholdings and short positions 35Mandatory corporate governance statement 35Article 10 of the EU takeover directive decree 35
INTRODUCTION
TomTom is committed to being transparent and accountable in theway we do business. Our corporate governance structure supportsand contributes to fulfilling this commitment to all our stakeholders.We monitor our corporate governance structure continuously, toensure compliance with Dutch legislation, the Dutch CorporateGovernance Code (the Code), the company's Articles ofAssociation, applicable securities laws, and the rules andregulations of NYSE Euronext Amsterdam, complemented byseveral internal policies and procedures.
In this section, TomTom addresses its overall corporate governancestructure and compliance with the best practice provisions of theCode. Occasional deviations from the Code are explained andinformation is provided on the reasons for doing so.
Furthermore, any substantial changes in the corporate governancestructure of TomTom and its compliance with the Code will beexplained to the shareholders at a General Meeting.
DEVIATIONS FROM THE CORPORATE
GOVERNANCE CODE
As a Dutch listed company, TomTom is subject to the Code. TheManagement Board and Supervisory Board are committed tocomplying with the best practice provisions of the Code and willcontinue to do so.
TomTom complies with all of the relevant provisions of the Code,with the exception of the following provisions: II.2.4 and IV.1.1.The reasons for these deviations are explained below.
Provision II.2.4Best practice provision II.2.4 provides that if options are granted,they shall, in any event, not be exercised in the first three yearsafter the date of granting. The number of options to be grantedshall be dependent on the achievement of challenging targetsspecified beforehand.
At the 2014 General Meeting, the proposal to amend theremuneration policy with regard to the long-term incentivecomponent laid down in the TomTom NV Management BoardStock Option Plan (the Plan) was adopted. As a result of thisdecision, the performance conditions for the vesting of the optionswere removed. All options granted under the Plan shall be grantedconditional to continued employment of the members of theManagement Board only. TomTom deviates from best practiceprovision II.2.4 to the extent that it does not specify targetsbeforehand. A vesting period of three years remains applicable.
The reason for amending the remuneration policy was to align itbetter with international high-tech sector practice. Under the newplan, the Management Board remains continuously focused oncreating more value for its shareholders.
TomTom's comparator companies are international companies inthe high-tech sector. These companies continue to favour stockoption plans and operate in environments not subject to the Code.The current Plan is reflective of competitive practices and enablesTomTom to be competitive for international senior leadershiptalent.
Furthermore, the inclusion of vesting conditions in addition to theincrease of TomTom's share price of the options results in multiplelayers of hurdles for the Management Board to potentially obtainvalue. Stock options carry an innate de facto performance conditionthat focuses on achieving stock price growth before value can bederived from stock option grants. The value of the stock optionremains wholly dependent on the development of the company'sstock price.
This new remuneration policy is deemed to be appropriate for thecompany at this time.
Provision IV.1.1Best practice provision IV.1.1 provides that the General Meetingmay pass a resolution to cancel the binding nature of a nominationfor the appointment of a member of the Management Board orthe Supervisory Board and/or a resolution to dismiss a member ofthe Management Board or of the Supervisory Board by an absolutemajority of the votes cast. It may be provided that this majorityshould represent a given proportion of the issued capital, whichproportion may not exceed one-third.
TomTom's Articles of Association provide that a bindingnomination for the appointment of members of the ManagementBoard or of the Supervisory Board may only be set aside by aresolution of the General Meeting passed with a two-thirds majorityrepresenting more than 50% of its issued share capital. The sameprovision applies to any resolution to dismiss a member of theManagement Board or of the Supervisory Board.
The company deviates from the best practice provision outlined inthe preceding paragraph because it believes that maintainingcontinuity in its Management Board and Supervisory Board is criticalfor delivering long-term shareholder value. The company would liketo protect its stakeholders against a sudden change in managementby maintaining the qualified majority and voting quorumrequirement, which is consistent with Dutch law.
LEGAL STRUCTURE OF THE COMPANY
TomTom NV is a public limited liability company established underDutch law and listed on NYSE Euronext Amsterdam in theNetherlands. TomTom has a two-tier governance structureconsisting of a Management Board and a Supervisory Board.
MANAGEMENT BOARD
GeneralThe Management Board is responsible for the day-to-daymanagement of the operations of the company. Its responsibilitiesinvolve setting and achieving the company's strategic objectives,managing the company's strategic risks, legal compliance andcorporate social responsibility matters insofar as these are relevantto the company's business. In these areas the Management Boardis accountable to the Supervisory Board and to the GeneralMeeting. In performing its duties, the Management Board is guidedby the interests of the company, taking into consideration theinterests of the company's stakeholders as a whole. TheManagement Board must provide the Supervisory Board with allinformation necessary for the exercise of the duties of theSupervisory Board in a timely manner. Furthermore, theManagement Board must consult with the Supervisory Board on
CONTENTS OVERVIEW MANAGEMENTBOARD REPORT
CORPORATEGOVERNANCE
SUPERVISORYBOARD REPORT
FINANCIALSTATEMENTS
SUPPLEMENTARYINFORMATION
ANNUAL REPORT AND ACCOUNTS 2014 / 31
important matters and submit important decisions to theSupervisory Board for its prior approval.
Composition and appointmentThe Articles of Association provide that the Management Boardmust consist of at least two members. Each member of theManagement Board is appointed for a maximum period of fouryears and may be re-appointed for another period of not more thanfour years. The General Meeting appoints the members of theManagement Board, subject to the right of the Supervisory Boardto make a binding nomination.
The General Meeting may at all times, by a resolution passed witha majority of at least two-thirds of the votes cast, and representingmore than 50% of the issued share capital, resolve that thenomination submitted by the Supervisory Board is not binding. Insuch a case, the General Meeting may appoint a member of theManagement Board in contravention of the Supervisory Board'snomination by a resolution passed with a majority of at least two-thirds of the votes cast, representing more than 50% of the issuedshare capital. If the Supervisory Board fails to use its right to submita binding nomination, the General Meeting may appoint membersof the Management Board with a majority of at least two-thirds ofthe votes cast, representing more than 50% of the issued sharecapital.
A resolution of the General Meeting to suspend or dismiss membersof the Management Board requires a majority of at least two-thirdsof the votes cast, representing more than 50% of the company'sissued share capital.
Members of the Management BoardThe Management Board currently consists of three members andmeets the requirements set by the Act on Management andSupervision (Wet Bestuur en Toezicht) with respect to genderdiversity. The members of the Management Board are jointlyauthorised to represent the company.
Biographies of the members of the Management Board, as well asother details relating to their careers can be found in theManagement Board Report section.
RemunerationUpon a proposal by the Remuneration Committee, the SupervisoryBoard determines the remuneration of the individual members ofthe Management Board in accordance with the company'sremuneration policy for the Management Board. The remunerationpolicy was adopted in 2009 and amended by the General Meetingin 2011 respectively in 2014 as further set out in the Deviationsfrom the Corporate Governance Code section of this report.
For further information about the remuneration of the members ofthe Management Board, reference is made to the RemunerationReport included in the Supervisory Board Report, as well as note33. Remunerations of members of the Management Board and theSupervisory Board in the consolidated financial statements.
Conflicts of interestMembers of the Management Board must report any (potential)conflict of interest to the Chairman of the Supervisory Board. TheSupervisory Board shall decide whether a conflict of interest exists.The member of the Management Board who has a (potential)
conflict of interest may not be present at such meetings. Mattersin which the company has a conflict of interest with a member ofthe Management Board in his private capacity are subject to theprior approval of the Supervisory Board. During 2014, no suchconflicts of interest were reported.
SUPERVISORY BOARD
GeneralThe Supervisory Board is responsible for supervising the conduct ofmanagement by the Management Board and the general course ofaffairs of the company and its affiliates. The Supervisory Board mayon its own initiative provide advice to the Management Board. TheManagement Board can also request the Supervisory Board'sadvice. The Supervisory Board acts in the interest of the companyas well as that of its stakeholders as a whole in performing its duties.
The Articles of Association require that certain decisions of theManagement Board be subject to the approval of the SupervisoryBoard. Resolutions of the Management Board to issue shares, togrant rights to acquire shares or to restrict or exclude pre-emptiverights require prior approval from the Supervisory Board. Otherresolutions requiring such approval include, among others:• Proposals to amend the Articles of Association;• Proposals to conclude a legal merger or a legal demerger;• Proposals to reduce the issued share capital; and• Matters in which the company has a conflict of interest with a
member of the Management Board in his private capacity.
Composition and appointmentThe Articles of Association provide that the Supervisory Boardshould consist of three or more members. Members of theSupervisory Board may be appointed for a maximum of three timesa term of four years. The Supervisory Board appoints a Chairmanand a Deputy Chairman from amongst its members. The membersof the Supervisory Board retire periodically in accordance with arotation plan.
The General Meeting appoints the members of the SupervisoryBoard, subject to the right of the Supervisory Board to make abinding nomination.
The General Meeting may at all times, by a resolution passed witha majority of at least two-thirds of the votes cast, and representingmore than 50% of the issued share capital, resolve that thenomination submitted by the Supervisory Board is not binding. Insuch cases, the appointment of a member of the Supervisory Boardin contravention of the nomination requires a resolution of theGeneral Meeting adopted with a majority of at least two-thirds ofthe votes cast, representing more than 50% of the issued sharecapital. A resolution of the General Meeting to suspend or dismissmembers of the Supervisory Board requires a majority of at leasttwo-thirds of the votes cast, representing more than 50% of theissued share capital.
The Supervisory Board has determined a profile regarding its sizeand composition, taking into account the nature of TomTom'sbusiness, its activities and the desired expertise. The SupervisoryBoard aims for a diverse composition and will strive for a fairbalance between experience, expertise, gender, age andbackground. When nominating a candidate for (re)appointment,
CONTENTS OVERVIEW MANAGEMENTBOARD REPORT
CORPORATEGOVERNANCE
SUPERVISORYBOARD REPORT
FINANCIALSTATEMENTS
SUPPLEMENTARYINFORMATION
ANNUAL REPORT AND ACCOUNTS 2014 / 32
however, the qualifications of the candidate and the specificrequirements of the positions to be filled will prevail.
The Supervisory Board profile and other rules and regulationscovering its decision-making process are posted on TomTom'scorporate website: corporate.tomtom.com/articles.cfm.
Members of the Supervisory BoardThe Supervisory Board currently consists of seven members.Biographies of the members of the Supervisory Board, as well asother details relating to their careers can be found in theSupervisory Board Report section.
The Supervisory Board confirms that its current composition has thenecessary experience, expertise, and independence to ensure thatits members are able to properly execute their duties. All currentmembers of the Supervisory Board were appointed in accordancewith the Supervisory Board profile. Mr Vuursteen retired from theSupervisory Board following the 2014 General Meeting and wassucceeded by Mr Wakkie as Chairman. Mr Van den Bergh resignedfrom the Supervisory Board following the 2014 General Meeting.The proposals for the appointments of Ms Tammenoms Bakker andMs Elberse were adopted at the 2014 General Meeting. Bothappointments were made for a period of four years. According tothe Act on Management and Supervision (Wet Bestuur enToezicht), a proper composition of the Supervisory Board meansthat at least 30% of the seats are held by women and at least 30%by men. Two out of seven Supervisory Board members are female(29%). With regards to the same Act, no member of the SupervisoryBoard holds more than five supervisory positions at Dutch 'largecompanies'.
The committeesIn line with the Code, the Supervisory Board has established anAudit Committee, a Remuneration Committee and a Selection andAppointment Committee. Each of these committees is staffed bymembers of the Supervisory Board. For an overview of all activitiesperformed by the Committees, reference is made to the SupervisoryBoard Report section. The terms of reference of each committeecan be found on TomTom's corporate website:corporate.tomtom.com/supboard.cfm.
RemunerationThe remuneration of the Supervisory Board members and theadditional remuneration of the Chairman and the members of itscommittees is determined by the General Meeting. Members of theSupervisory Board are not authorised to receive any paymentsunder the company's pension or bonus schemes or under theoption or share plans. The annual remuneration of the SupervisoryBoard and sub-committees membership remained unchangedduring 2014. The annual remuneration of the Chairman of theSupervisory Board is €50,000; the other Supervisory Boardmembers receive €40,000.
The annual remuneration of the Chairman of the Audit Committeeis €10,000, while the other members of the committee receive€7,000. The annual remuneration of the Chairman of theRemuneration Committee and of the Chairman of the Selection andAppointment Committee is €7,000, while the other members ofthese committees receive €4,000. The remuneration of SupervisoryBoard members and committee members is proportional to thenumber of months served. The remuneration of Mr Vuursteen and
Mr Van den Bergh was paid out pro rata. The aggregateremuneration of the Supervisory Board members in 2014 amountedto €351,000.
For more detailed information about the remuneration of individualmembers of the Supervisory Board see note 33. Remunerations ofmembers of the Management Board and the Supervisory Board inthe consolidated financial statements.
Conflicts of interestMembers of the Supervisory Board (excluding the Chairman) mustreport any (potential) conflict of interest to the Chairman of theSupervisory Board. If the (potential) conflict of interest involves theChairman of the Supervisory Board, it must be reported to theDeputy Chairman of the Supervisory Board. The Supervisory Boardshall decide whether a conflict of interest exists. The member of theSupervisory Board who has a (potential) conflict of interest may notbe present at such meetings. The member of the Supervisory Boardwith a (potential) conflict of interest shall not participate indiscussions and decision-making on a subject or transaction inrelation to which the member has a conflict of interest with thecompany. Such transactions shall be disclosed in the annual report.No transactions in which there were conflicts of interest withmembers of the Supervisory Board were reported in 2014.
ShareholdingsNo shares or rights to shares were granted to a Supervisory Boardmember by way of remuneration. No shares in the company areheld by any Supervisory Board member.
GENERAL MEETING
Functioning of the General MeetingThe General Meeting must be held within six months after the endof each financial year. The General Meeting is convened by publicnotice via the company's corporate website:corporate.tomtom.com/agm.cfm.
The compilation of the annual report is a recurring agenda item, asare the adoption of the annual accounts, the release from liabilityof the members of the Management Board and Supervisory Boardand the execution of the remuneration policy during the presentyear. When deemed necessary in the interests of the company, anExtraordinary General Meeting may be convened by resolution ofthe Management Board or the Supervisory Board.
Shareholders may appoint a proxy who is then empowered to voteon their behalf in the General Meeting. The minutes and theresolutions of the General Meeting are recorded in writing.
The minutes will be made available to the shareholders onTomTom's corporate website no later than three months after themeeting.
Voting rightsEach of our ordinary shares and preferred shares is entitled to onevote. Shareholders may vote by proxy. The voting rights attachedto any company shares held by the company are suspended as longas they are held in treasury.
Resolutions of the General Meeting are adopted by an absolutemajority of votes cast, except where Dutch law or TomTom'sArticles of Association provide for a special majority.
CONTENTS OVERVIEW MANAGEMENTBOARD REPORT
CORPORATEGOVERNANCE
SUPERVISORYBOARD REPORT
FINANCIALSTATEMENTS
SUPPLEMENTARYINFORMATION
ANNUAL REPORT AND ACCOUNTS 2014 / 33
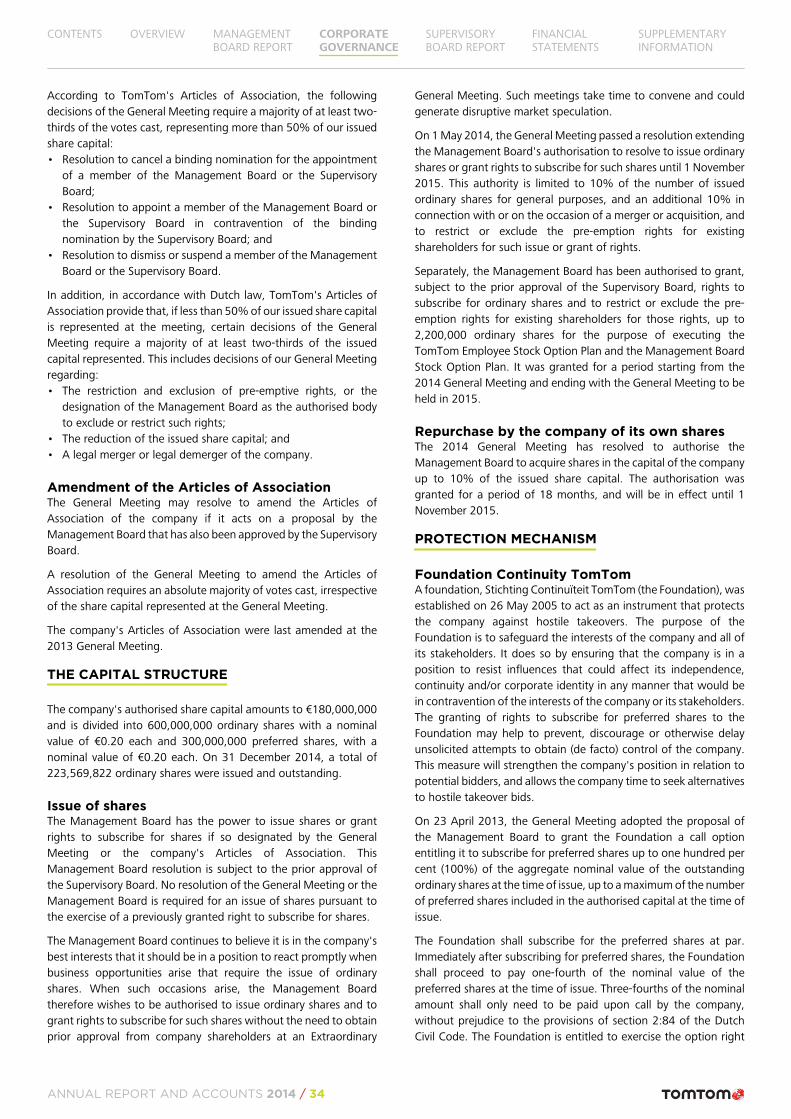
According to TomTom's Articles of Association, the followingdecisions of the General Meeting require a majority of at least two-thirds of the votes cast, representing more than 50% of our issuedshare capital:• Resolution to cancel a binding nomination for the appointment
of a member of the Management Board or the SupervisoryBoard;
• Resolution to appoint a member of the Management Board orthe Supervisory Board in contravention of the bindingnomination by the Supervisory Board; and
• Resolution to dismiss or suspend a member of the ManagementBoard or the Supervisory Board.
In addition, in accordance with Dutch law, TomTom's Articles ofAssociation provide that, if less than 50% of our issued share capitalis represented at the meeting, certain decisions of the GeneralMeeting require a majority of at least two-thirds of the issuedcapital represented. This includes decisions of our General Meetingregarding:• The restriction and exclusion of pre-emptive rights, or the
designation of the Management Board as the authorised bodyto exclude or restrict such rights;
• The reduction of the issued share capital; and• A legal merger or legal demerger of the company.
Amendment of the Articles of AssociationThe General Meeting may resolve to amend the Articles ofAssociation of the company if it acts on a proposal by theManagement Board that has also been approved by the SupervisoryBoard.
A resolution of the General Meeting to amend the Articles ofAssociation requires an absolute majority of votes cast, irrespectiveof the share capital represented at the General Meeting.
The company's Articles of Association were last amended at the2013 General Meeting.
THE CAPITAL STRUCTURE
The company's authorised share capital amounts to €180,000,000and is divided into 600,000,000 ordinary shares with a nominalvalue of €0.20 each and 300,000,000 preferred shares, with anominal value of €0.20 each. On 31 December 2014, a total of223,569,822 ordinary shares were issued and outstanding.
Issue of sharesThe Management Board has the power to issue shares or grantrights to subscribe for shares if so designated by the GeneralMeeting or the company's Articles of Association. ThisManagement Board resolution is subject to the prior approval ofthe Supervisory Board. No resolution of the General Meeting or theManagement Board is required for an issue of shares pursuant tothe exercise of a previously granted right to subscribe for shares.
The Management Board continues to believe it is in the company'sbest interests that it should be in a position to react promptly whenbusiness opportunities arise that require the issue of ordinaryshares. When such occasions arise, the Management Boardtherefore wishes to be authorised to issue ordinary shares and togrant rights to subscribe for such shares without the need to obtainprior approval from company shareholders at an Extraordinary
General Meeting. Such meetings take time to convene and couldgenerate disruptive market speculation.
On 1 May 2014, the General Meeting passed a resolution extendingthe Management Board's authorisation to resolve to issue ordinaryshares or grant rights to subscribe for such shares until 1 November2015. This authority is limited to 10% of the number of issuedordinary shares for general purposes, and an additional 10% inconnection with or on the occasion of a merger or acquisition, andto restrict or exclude the pre-emption rights for existingshareholders for such issue or grant of rights.
Separately, the Management Board has been authorised to grant,subject to the prior approval of the Supervisory Board, rights tosubscribe for ordinary shares and to restrict or exclude the pre-emption rights for existing shareholders for those rights, up to2,200,000 ordinary shares for the purpose of executing theTomTom Employee Stock Option Plan and the Management BoardStock Option Plan. It was granted for a period starting from the2014 General Meeting and ending with the General Meeting to beheld in 2015.
Repurchase by the company of its own sharesThe 2014 General Meeting has resolved to authorise theManagement Board to acquire shares in the capital of the companyup to 10% of the issued share capital. The authorisation wasgranted for a period of 18 months, and will be in effect until 1November 2015.
PROTECTION MECHANISM
Foundation Continuity TomTomA foundation, Stichting Continuïteit TomTom (the Foundation), wasestablished on 26 May 2005 to act as an instrument that protectsthe company against hostile takeovers. The purpose of theFoundation is to safeguard the interests of the company and all ofits stakeholders. It does so by ensuring that the company is in aposition to resist influences that could affect its independence,continuity and/or corporate identity in any manner that would bein contravention of the interests of the company or its stakeholders.The granting of rights to subscribe for preferred shares to theFoundation may help to prevent, discourage or otherwise delayunsolicited attempts to obtain (de facto) control of the company.This measure will strengthen the company's position in relation topotential bidders, and allows the company time to seek alternativesto hostile takeover bids.
On 23 April 2013, the General Meeting adopted the proposal ofthe Management Board to grant the Foundation a call optionentitling it to subscribe for preferred shares up to one hundred percent (100%) of the aggregate nominal value of the outstandingordinary shares at the time of issue, up to a maximum of the numberof preferred shares included in the authorised capital at the time ofissue.
The Foundation shall subscribe for the preferred shares at par.Immediately after subscribing for preferred shares, the Foundationshall proceed to pay one-fourth of the nominal value of thepreferred shares at the time of issue. Three-fourths of the nominalamount shall only need to be paid upon call by the company,without prejudice to the provisions of section 2:84 of the DutchCivil Code. The Foundation is entitled to exercise the option right
CONTENTS OVERVIEW MANAGEMENTBOARD REPORT
CORPORATEGOVERNANCE
SUPERVISORYBOARD REPORT
FINANCIALSTATEMENTS
SUPPLEMENTARYINFORMATION
ANNUAL REPORT AND ACCOUNTS 2014 / 34
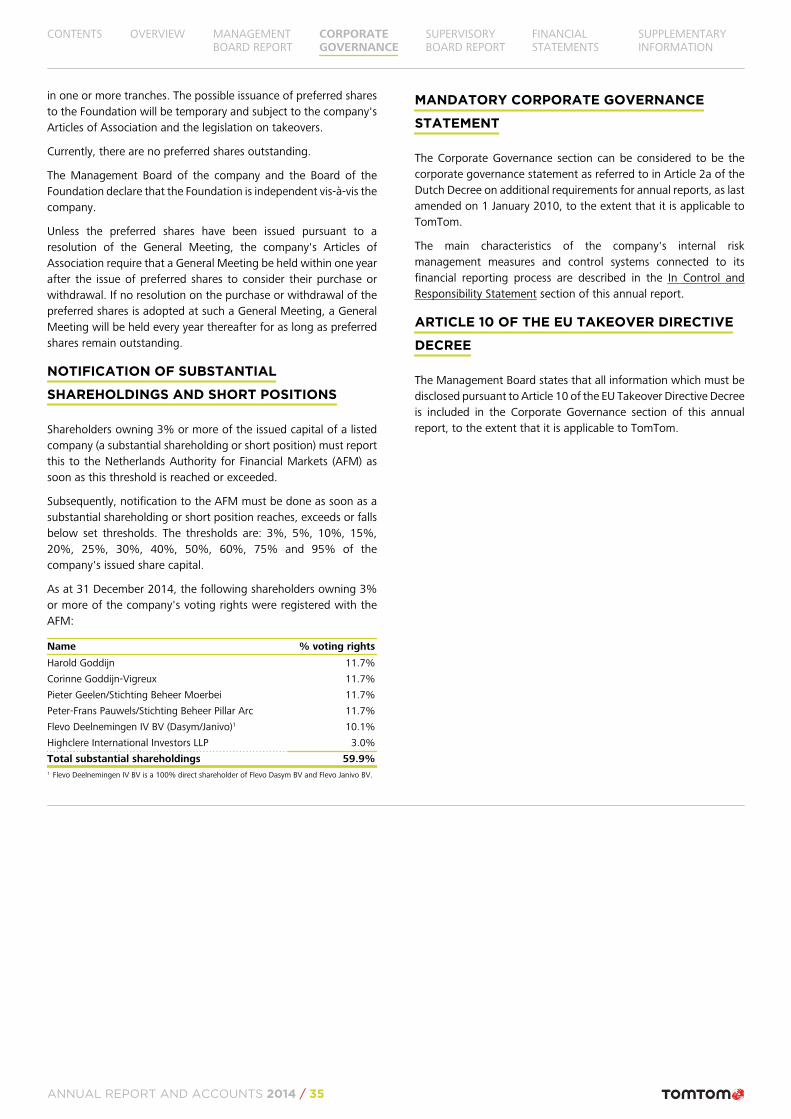
in one or more tranches. The possible issuance of preferred sharesto the Foundation will be temporary and subject to the company'sArticles of Association and the legislation on takeovers.
Currently, there are no preferred shares outstanding.
The Management Board of the company and the Board of theFoundation declare that the Foundation is independent vis-à-vis thecompany.
Unless the preferred shares have been issued pursuant to aresolution of the General Meeting, the company's Articles ofAssociation require that a General Meeting be held within one yearafter the issue of preferred shares to consider their purchase orwithdrawal. If no resolution on the purchase or withdrawal of thepreferred shares is adopted at such a General Meeting, a GeneralMeeting will be held every year thereafter for as long as preferredshares remain outstanding.
NOTIFICATION OF SUBSTANTIAL
SHAREHOLDINGS AND SHORT POSITIONS
Shareholders owning 3% or more of the issued capital of a listedcompany (a substantial shareholding or short position) must reportthis to the Netherlands Authority for Financial Markets (AFM) assoon as this threshold is reached or exceeded.
Subsequently, notification to the AFM must be done as soon as asubstantial shareholding or short position reaches, exceeds or fallsbelow set thresholds. The thresholds are: 3%, 5%, 10%, 15%,20%, 25%, 30%, 40%, 50%, 60%, 75% and 95% of thecompany's issued share capital.
As at 31 December 2014, the following shareholders owning 3%or more of the company's voting rights were registered with theAFM:
Name % voting rights
Harold Goddijn 11.7%
Corinne Goddijn-Vigreux 11.7%
Pieter Geelen/Stichting Beheer Moerbei 11.7%
Peter-Frans Pauwels/Stichting Beheer Pillar Arc 11.7%
Flevo Deelnemingen IV BV (Dasym/Janivo)1 10.1%
Highclere International Investors LLP 3.0%
Total substantial shareholdings 59.9%1 Flevo Deelnemingen IV BV is a 100% direct shareholder of Flevo Dasym BV and Flevo Janivo BV.
MANDATORY CORPORATE GOVERNANCE
STATEMENT
The Corporate Governance section can be considered to be thecorporate governance statement as referred to in Article 2a of theDutch Decree on additional requirements for annual reports, as lastamended on 1 January 2010, to the extent that it is applicable toTomTom.
The main characteristics of the company's internal riskmanagement measures and control systems connected to itsfinancial reporting process are described in the In Control andResponsibility Statement section of this annual report.
ARTICLE 10 OF THE EU TAKEOVER DIRECTIVE
DECREE
The Management Board states that all information which must bedisclosed pursuant to Article 10 of the EU Takeover Directive Decreeis included in the Corporate Governance section of this annualreport, to the extent that it is applicable to TomTom.
CONTENTS OVERVIEW MANAGEMENTBOARD REPORT
CORPORATEGOVERNANCE
SUPERVISORYBOARD REPORT
FINANCIALSTATEMENTS
SUPPLEMENTARYINFORMATION
ANNUAL REPORT AND ACCOUNTS 2014 / 35
CONTENTS OVERVIEW MANAGEMENTBOARD REPORT
CORPORATEGOVERNANCE
SUPERVISORYBOARD REPORT
FINANCIALSTATEMENTS
SUPPLEMENTARYINFORMATION
ANNUAL REPORT AND ACCOUNTS 2014 / 36
SUPERVISORY BOARD REPORT
TomTom Supervisory Board 37Introduction 39Composition 39Supervisory Board meetings 39Supervisory Board activities 39Self-assessment 40Remuneration Committee Report 40Selection and Appointment Committee Report 43Audit Committee Report 43Financial Statements 45
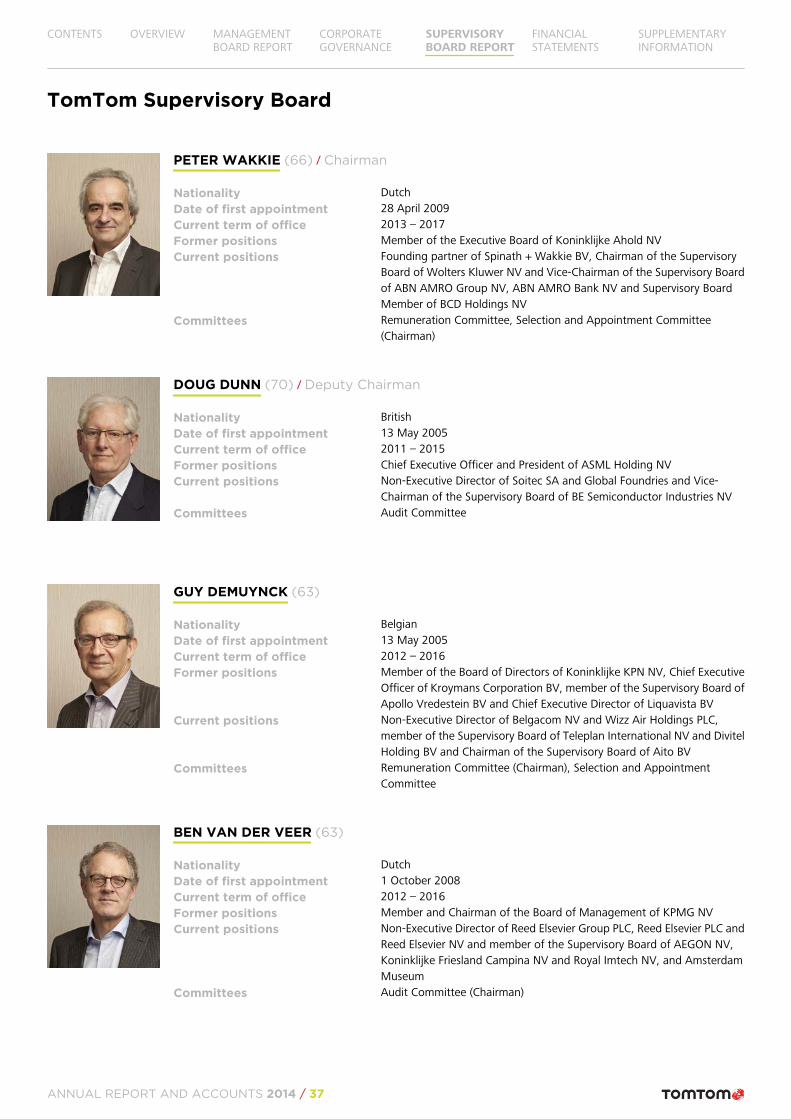
TomTom Supervisory Board
PETER WAKKIE (66) / Chairman
Nationality DutchDate of first appointment 28 April 2009Current term of office 2013 – 2017Former positions Member of the Executive Board of Koninklijke Ahold NVCurrent positions Founding partner of Spinath + Wakkie BV, Chairman of the Supervisory
Board of Wolters Kluwer NV and Vice-Chairman of the Supervisory Boardof ABN AMRO Group NV, ABN AMRO Bank NV and Supervisory BoardMember of BCD Holdings NV
Committees Remuneration Committee, Selection and Appointment Committee(Chairman)
DOUG DUNN (70) / Deputy Chairman
Nationality BritishDate of first appointment 13 May 2005Current term of office 2011 – 2015Former positions Chief Executive Officer and President of ASML Holding NVCurrent positions Non-Executive Director of Soitec SA and Global Foundries and Vice-
Chairman of the Supervisory Board of BE Semiconductor Industries NVCommittees Audit Committee
GUY DEMUYNCK (63)
Nationality BelgianDate of first appointment 13 May 2005Current term of office 2012 – 2016Former positions Member of the Board of Directors of Koninklijke KPN NV, Chief Executive
Officer of Kroymans Corporation BV, member of the Supervisory Board ofApollo Vredestein BV and Chief Executive Director of Liquavista BV
Current positions Non-Executive Director of Belgacom NV and Wizz Air Holdings PLC,member of the Supervisory Board of Teleplan International NV and DivitelHolding BV and Chairman of the Supervisory Board of Aito BV
Committees Remuneration Committee (Chairman), Selection and AppointmentCommittee
BEN VAN DER VEER (63)
Nationality DutchDate of first appointment 1 October 2008Current term of office 2012 – 2016Former positions Member and Chairman of the Board of Management of KPMG NVCurrent positions Non-Executive Director of Reed Elsevier Group PLC, Reed Elsevier PLC and
Reed Elsevier NV and member of the Supervisory Board of AEGON NV,Koninklijke Friesland Campina NV and Royal Imtech NV, and AmsterdamMuseum
Committees Audit Committee (Chairman)
CONTENTS OVERVIEW MANAGEMENTBOARD REPORT
CORPORATEGOVERNANCE
SUPERVISORYBOARD REPORT
FINANCIALSTATEMENTS
SUPPLEMENTARYINFORMATION
ANNUAL REPORT AND ACCOUNTS 2014 / 37
TOINE VAN LAACK (51)
Nationality DutchDate of first appointment 23 April 2013Current term of office 2013 – 2017Former positions Member of the Board of Management Ernst & Young Netherlands and
BelgiumCurrent positions CEO of Janivo Holding BV and member of the Supervisory Board of Nidera
Capital BV and Hespri Holding BVCommittees Audit Committee
JACQUELINE TAMMENOMS BAKKER (61)
Nationality DutchDate of first appointment 1 May 2014Current term of office 2014 – 2018Former positions Director General at the Dutch Ministry of Transport, responsible for Civil
Aviation and Freight Transport and Chairman of the High Level Group forthe future of aviation regulation in Europe
Current positions Non-executive Director of Tesco PLC (UK) and independent board memberof CNH Industrial NV, Chairman of the Van Leer Group Foundation (NL)and Vice-Chair of the advisory board of the Rotterdam School ofManagement, Erasmus University (NL)
Committees Remuneration Committee, Selection and Appointment Committee
ANITA ELBERSE (42)
Nationality AmericanDate of first appointment 1 May 2014Current term of office 2014 – 2018Former positions Visiting Fellow and Lecturer at The Wharton School University of
Pennsylvania (2001-2003)Current positions Lincoln Filene Professor of Business Administration at Harvard Business
SchoolCommittees Audit Committee
CONTENTS OVERVIEW MANAGEMENTBOARD REPORT
CORPORATEGOVERNANCE
SUPERVISORYBOARD REPORT
FINANCIALSTATEMENTS
SUPPLEMENTARYINFORMATION
ANNUAL REPORT AND ACCOUNTS 2014 / 38
INTRODUCTION
It was a good year for TomTom; 2014 saw substantial progress inthe development of the company's core technologies and itspositioning back for growth. The company again achieved itsfinancial objectives in 2014 and delivered important milestones inits technologies. The efforts made by the employees of thecompany and its Management Board are greatly appreciated by theSupervisory Board. We look forward to the further successfulexecution of TomTom's strategy.
The TomTom Supervisory Board is responsible for supervising andadvising the Management Board in setting and achieving thecompany's strategy and its objectives. The interests of the companyand TomTom's stakeholders guide the performance of the dutiesof the Supervisory Board. The Supervisory Board is assisted in itsdecision-making process by the Audit Committee, theRemuneration Committee and the Selection and AppointmentCommittee.
COMPOSITION
The Supervisory Board of TomTom consists of seven members. Atthe 2014 General Meeting, Karel Vuursteen (former Chairman) andRob van den Bergh stepped down from the Supervisory Board andthe two new Supervisory Board members Jacqueline TammenomsBakker and Anita Elberse were appointed. The Supervisory Boardresolved to appoint Peter Wakkie as its new Chairman.
The term of Doug Dunn will expire at the 2015 General Meeting,by which time he will have served for ten years on the SupervisoryBoard. At this meeting, Doug Dunn will be nominated forreappointment for a term of a further two years. He will then haveserved a total of twelve years, the maximum term according to bestpractice provision III.3.5 of the Corporate Governance Code (theCode).
The Supervisory Board confirms that six of its members areindependent as meant within the terms of best practice provisionIII.2.2 of the Code. Toine van Laack does not qualify asindependent, as he is a board member of Janivo Holding BV, whichis indirectly related to the substantial shareholder of the companyFlevo Deelnemingen IV BV.
The composition of the Supervisory Board is in line with theSupervisory Board profile, as drawn up by the Supervisory Boardand published on the company's website, in terms of experience,expertise, nationality, gender and age. According to the Act onManagement and Supervision (Wet Bestuur en Toezicht), a propercomposition of the Supervisory Board means that at least 30% ofthe members should be female. With the appointment of the twonew members of the Supervisory Board at the 2014 GeneralMeeting, two out of seven Supervisory Board members (29%) isfemale. No member of the Supervisory Board holds more than fivedirectorships at Dutch 'large companies'.
Biographies of the members of the Supervisory Board, as well asthe information as prescribed by provision III.1.3 of the Code canbe found at the start of this report. This section also provides detailson the committees of the Supervisory Board.
SUPERVISORY BOARD MEETINGS
The Supervisory Board met twelve times in 2014: six physicalmeetings and six conference calls. The non-physical meetings wereheld to discuss financial updates and recent developments withinthe company, usually in months when there was no physicalmeeting. The Management Board members attended all thosemeetings either in full or in part. The meetings of the SupervisoryBoard achieved an overall average attendance rate of 87%.
All members have sufficient time available for their duties relatingto their membership of the Supervisory Board. No member of theSupervisory Board was regularly absent from the meetings. Theiravailability for ad-hoc calls and prompt response to emails, and thefact that the members attended the meetings well prepared andactively participated in the discussions, demonstrate they were allable to devote sufficient attention to the company.
The agenda for the meetings was prepared through consultationbetween the Chairman, the Management Board and the CompanySecretary. In addition to the regular meetings, the Chairman of theSupervisory Board was in regular contact with the CEO of thecompany. The members of the Supervisory Board also held informalconsultations with members of the Management Board and seniormanagement of the company to keep closely informed about thebusiness.
Meetings of the Supervisory Board are preceded by committeemeetings. The chairs of the committees work closely with seniormanagement and conduct regular face-to-face meetings to set theagendas and prepare all relevant information for the committeemeetings.
The two new Supervisory Board members followed an inductionprogramme which covered, among other matters, generalfinancial, social and legal affairs, financial reporting by the companyand the responsibilities of a supervisory board member. Severalmeetings with the Management Board members and seniormanagement were organised to familiarise the two newSupervisory Board members with the company strategy, thebusiness unit strategies and activities. The programme also includedsite visits.
SUPERVISORY BOARD ACTIVITIES
To facilitate open and productive discussions, senior managementprovided the Supervisory Board with comprehensive quarterlyreports that outline the developments, achievements, challengesand opportunities in each business unit of the company before eachphysical meeting. These reports include insight into noticeablemarket developments, trends and analyses. During the year, seniormanagement was frequently invited to present a range of topics tothe Supervisory Board. It is important for the Supervisory Board tokeep in touch with the talents within the company. The membersof the Supervisory Board strongly support the company's efforts inthe area of talent management and this will remain a key attentionarea moving forward.
The Supervisory Board devoted considerable time to reviewingstrategic options and discussing the company's long-term strategy.An active role was played in ensuring that the Management Board'sideas were challenged and tested in order to reach decisions thatwould underpin the company's strategy. Every quarter, the business
CONTENTS OVERVIEW MANAGEMENTBOARD REPORT
CORPORATEGOVERNANCE
SUPERVISORYBOARD REPORT
FINANCIALSTATEMENTS
SUPPLEMENTARYINFORMATION
ANNUAL REPORT AND ACCOUNTS 2014 / 39
unit strategies were presented, and constructive discussions andreviews were performed with the Management Board. In addition,the Supervisory Board was kept regularly informed of intendedorganisational changes, appointments of key positions and materialcontracts.
During discussions with the Management Board, specific attentionwas given to the various R&D projects, which were discussed andmonitored at each quarterly meeting. A strong attention point ofthe Supervisory Board was the company's delivery of significanttechnology milestones, including the delivery of the first version ofthe unique transactional map-making platform that will provideincremental map updates. In addition, progress on investments inthe field of modular navigation software was closely monitored.The Supervisory Board was regularly updated on the positioning ofthese technological innovations and their traction in the market.
The Consumer business, and in particular the continued decline ofthe PND market in North America, were important attention topicsduring discussions with the Management Board. The company'sundertakings in the sports market were closely monitored andseveral product presentations and demonstrations were providedduring the year.
Updates on the progress made with modular Connected NavigationSystem components, an important driver for growth for theAutomotive business, featured regularly on the Supervisory Boardagenda. Also in this respect, the Supervisory Board was frequentlyupdated on the bookings made which, together with orderssecured earlier, will support growth for the Automotive businessonwards.
For the Telematics business, the Supervisory Board was involved inthe acquisitions of DAMS Tracking, in France, and Fleetlogic, in theNetherlands. These acquisitions reflected the execution of thestrategy of the Telematics business to expand the WEBFLEETinstalled base, both organically and through potential bolt-onacquisitions and partnerships.
The company's results and its cash generation from operationswere presented and closely monitored throughout the year.Regarding the financial management of the company, theSupervisory Board reviewed and approved the budget for 2015 andwas involved in the refinancing project that resulted in a new €250million revolving credit facility for the company. It oversaw thetendering procedure for the selection of a new audit firm anddecided to nominate Ernst & Young Accountants LLP forappointment by the General Meeting in 2015 for a three-year term.The Supervisory Board was regularly updated on the company'sInvestor Relations activities, such as share price developments andfinancial analysts' research and communication with shareholdersand investors. The press releases regarding the full year and half-year results, and the quarterly trading updates were reviewed andapproved. A proposal from the Management Board in relation tothe dividend policy was discussed and challenged by the membersof the Supervisory Board. The decision of the Management Boardon the company's dividend policy was published on the company'swebsite in October 2014.
Through its Audit Committee, the Supervisory Board was keptinformed of the company's risks, both general and financial, and ofthe actions taken and systems in place to manage these risks. Timewas also dedicated to discussing the company's organisational
structure and R&D set-up, and it was concluded that theimprovements made over the past years have created a strongerbasis for the future of TomTom.
The composition and functioning of the Management Board andthe performance of its individual members were discussed,alongside the succession planning for the key positions within theorganisation.
The Supervisory Board received updates on the company's legalcompliance programme, corporate social responsibility and thedevelopments with respect to corporate governance.
SELF-ASSESSMENT
The Supervisory Board reviewed and discussed its own functioning,as well as that of its members, its committees and the Chairman.During this meeting the Management Board was not present buthad been requested to provide feedback. The evaluation of theChairman was discussed by the entire Supervisory Board, withoutthe Chairman present. In preparation for these discussions, themembers of the Supervisory Board and Management Boardprovided feedback through a written assessment. The assessmentincluded reviews of the composition and expertise of theSupervisory Board, its time management, effectiveness, dynamicsand succession planning. The Supervisory Board's overview of thecompany's strategy, human resources management, riskmanagement and internal controls was also reviewed.
The Supervisory Board was very positive about the organisation ofthe meetings, its agenda setting, effectiveness and strategicoverview. The dynamics between the Management Board and theSupervisory Board was perceived as transparent. The improvementmade with regard to gaining insights into the constantly changinglandscape in which TomTom operates was welcomed by theSupervisory Board. In order to be kept more up-to-date on theactual functioning of new technologies and products, theSupervisory Board requested that demonstrations of suchinnovations would feature regularly on the agenda for 2015.
The Supervisory Board intends to bring in a third-party to assess itsfunctioning every three years; the next such occasion being in 2015.
REMUNERATION COMMITTEE REPORT
The Remuneration Report describes the activities of theRemuneration Committee (Committee), the Remuneration Policyand its application in 2014. The Remuneration Policy (including theManagement Board Stock Option Plan) was first adopted by theGeneral Meeting in 2005 and has since been amended severaltimes, most recently in 2014. In line with Dutch legislation, theexecution of the Remuneration Policy in 2014 will be put on theagenda for discussion as a separate agenda item at the GeneralMeeting on 24 April, 2015.
Committee meetingsThe Remuneration Committee met four times in the course of 2014,with an overall attendance rate of 100%. Each meeting was alsoattended by Alain De Taeye, the VP Reward and HR Operations, theSVP Group HR and the Company Secretary. Preparation meetingsattended by the Chairman of the Committee, the VP Reward andHR Operations and the Company Secretary were held prior to eachCommittee meeting.
CONTENTS OVERVIEW MANAGEMENTBOARD REPORT
CORPORATEGOVERNANCE
SUPERVISORYBOARD REPORT
FINANCIALSTATEMENTS
SUPPLEMENTARYINFORMATION
ANNUAL REPORT AND ACCOUNTS 2014 / 40
Committee activitiesThe Committee monitored the effectiveness and relevance ofTomTom's Management Board Remuneration Policy throughoutthe year. It also considered the extent to which the individualremuneration packages of the Management Board members werein line with the company's policy.
The Committee spent time during their meetings in February andApril on its preparation for the 2014 General Meeting. Topics thatappeared on the agenda of the General Meeting were theexecution of the Remuneration Policy in 2013, as a separate agendaitem, and the proposed changes to the policy to better align it withinternational high-tech sector practice by removing theperformance conditions of the Long-Term Incentive plan for theManagement Board members.
The Committee agreed on the key performance indicators (KPIs)and weighting levels set for the short-term variable remunerationof the Management Board and periodically reviewed the progresson the achievement of the KPIs that had been set for the ongoingshort-term and long-term variable remuneration components ofthe Management Board.
It was concluded that the vesting conditions for the options grantedto the members of the Management Board in 2012 were partly met,which will result in a vesting of 65% of the granted options for eachManagement Board member, which equals a total number of113,750 options.
A scenario analysis was carried out within the terms of the bestpractice provision II.2.1 of the Code to evaluate the variablecomponents of the remuneration packages of the ManagementBoard members. The Committee members were also presentedwith a report on the market trends on the remunerationcomponents in Europe and the Netherlands and within the high-tech sector, prepared by an independent remuneration expert. Inaddition, new and upcoming legislation were addressed.
Since an extensive remuneration benchmark was performed in2013, the Committee decided to perform the next benchmarkagainst its peer group in 2015. The peer group consists of thecompanies Wolters Kluwer, Invensys, Harman, Garmin, ASMInternational, Temenos, Imagination Technology Group, SimCorp,Unit 4, CompuGroup Medical, Pace, Kudelski and Exact Holding.
The Committee carried out a self-assessment of the functioning ofthe Committee and concluded that it works effectively.
Remuneration PolicyThe company's Articles of Association state that the SupervisoryBoard must propose the Remuneration Policy for the members ofthe Management Board and that the Remuneration Policy must beadopted by the General Meeting. The Supervisory Board determinesthe remuneration of individual members of the Management Boardon the basis of criteria established by the Remuneration Policy. Itreviews this policy regularly in the light of internal and/or externaldevelopments. The full text of the policy can be found on thecompany's corporate website:corporate.tomtom.com/remuneration.cfm.
The company's Remuneration Policy must ensure that the companyis able to attract and retain highly qualified and expert executivesto its Management Board in an internationally competitive market.It must also ensure that the Management Board members'
remuneration is consistent with the company's strategy, itsoperational and financial results and delivery of value toshareholders. Another aim of the policy is to apply a responsibleand sustainable remuneration framework in line with the generalresult-driven remuneration principles and practices throughout thecompany. The Remuneration Policy establishes that remunerationfor the Management Board must consist of four components: basesalary, short-term incentive, long-term incentive and benefits(including pension scheme contributions).
Application in 2014The details of the individual remuneration of all members of theManagement Board and its costs to the company are presented innote 33. Remunerations of members of the Management Boardand the Supervisory Board in the consolidated financial statements.The information described in the best practice provision II.2.13 (d)of the Code is also provided there.
1. Base salary at median market levelFixed remuneration consists of base salary plus holiday allowance,where applicable and in accordance with market practice. Theobjective of this element of the policy is to align the base salarylevels of TomTom Management Board members with medianmarket practice in a measured way. The base salary levels arereviewed annually, taking into account developments in the paymarket and the level of position as graded within the company.
Based on the outcome of the benchmarking performed in 2013,the Supervisory Board concluded that Marina Wyatt's base salaryand Alain De Taeye's base salary were in line with the medianmarket level and did not need adjustment for 2014. The CEO's basesalary remains under median market level. However, it was decidednot to bring the CEO's base salary closer to the median andtherefore the CEO's base salary has not been adjusted in 2014. Thebase salaries of all Management Board members comply with theRemuneration Policy.
2. Short-term incentiveThe intention of the percentage-of-salary bonus scheme is toensure a uniform bonus structure throughout the organisation. Italigns the Management Board's bonus scheme with the bonusstructure that applies to other staff within the company and withDutch market practice. This component of Management Boardremuneration was benchmarked against the same peer group aswas used for the base salary comparison.
The level of cash payment is determined according topredetermined criteria and objectives. TomTom's 'on-target' bonuspercentages are assessed relative to the median 'on-target' bonuspercentages of our peer group companies. The on-target bonuspercentage for the CEO position is 80% of his base salary. It is 64%of the base salary for the other members of the ManagementBoard. The maximum bonus amount may be increased to 1.5 timesthe 'on-target' bonus amounts. For example, in cases of excellentperformance the CEO may receive 120% of his base salary, and theother members of the Management Board 96% of their basesalaries. In addition to the incentive scheme based on pre-determined performance criteria, the Supervisory Board may at itsown discretion also decide to reward bonuses for exceptionalindividual performance.
For 2014, it was decided to replace the revenue KPI for the short-term incentive plan with a gross profit KPI with a weighting level
CONTENTS OVERVIEW MANAGEMENTBOARD REPORT
CORPORATEGOVERNANCE
SUPERVISORYBOARD REPORT
FINANCIALSTATEMENTS
SUPPLEMENTARYINFORMATION
ANNUAL REPORT AND ACCOUNTS 2014 / 41
of 40% to reflect the company's strategy and to align the metricwith the employee bonus plan. The other two performance criteria,the EBIT KPI and the cash flow KPI, remained the same as in theprevious year. The EBIT KPI remained at the same weighting levelof 40% while the weighting for the cash flow KPI is reduced to20%. The focused nature of the KPIs reflects the SupervisoryBoard's opinion that the current economic climate continues torequire strong financially driven KPIs with a focus on top linegrowth. These KPIs are an important measure of the success of theexecution of the company's strategy and, as such, the remunerationis directly linked to performance and the company's strategy.
Applying the pre-determined performance criteria to the 2014results of the company, the Supervisory Board has awarded anoverall pay-out ratio of 101% of the 'on-target' bonus percentageunder the short-term incentive scheme.
The Supervisory Board is of the opinion that the continuouschallenging economic environment and competitive marketwarranted strong financial control and that therefore the strictlyfinancial nature of the KPIs set for 2014 was appropriate.
3. Long-term incentiveThe long-term incentive component is laid down in the TomTomManagement Board Stock Option Plan. The Management BoardStock Option Plan is aimed at attracting and retaining key talent, inorder to ensure the company's continued high performance. Ittherefore aligns the company's long-term incentives with commonpractices within international companies operating in thetechnology sector.
With regard to the Management Board Stock Option Plan, alloptions shall be granted conditional to continued employment ofthe Management Board members only. The vesting of the optionsis not subject to the achievement of pre-determined performancecriteria. The options will vest three years after the grant date.
The Supervisory Board confirmed that the unconditional optionplan, where value only materialises upon the successful executionof the company's long-term strategy by the Management Board,reflects the company's vision and the corresponding strategyconsiderations for 2014 to 2016, with a strong focus on top linegrowth.
In 2014, the Supervisory Board decided to set annual stock optiongrants as a percentage of the annual base salary of theManagement Board members. The level for the CEO was set to agrant value equivalent to 100% of the annual base salary, and forthe other two members of the Management Board to a grant valueequivalent to 60% of the annual base salary.
4. Benefits Members of the Management Board are eligible for, and can optto participate in the company's pension plans or receive acontribution to their respective private pension plan. According tothe Remuneration Policy, the contribution to be paid by thecompany on behalf of a member of the Management Board isbased on a percentage of the gross annual base salary and is cappedat 20% of the gross annual base salary.
The contribution to the respective private pension plan of Alain DeTaeye is capped at 10% of his gross annual base salary.
Harold Goddijn has opted to waive his rights to take part in thecompany's pension plan and does not receive any contribution fromthe company.
In addition to the abovementioned remuneration components, theManagement Board members are entitled to remuneration foritems such as medical insurance, death and disability insurance,housing and car allowances. They also benefit from directors' andofficers' liability insurance coverage. These benefits are in line withmarket practice. The company does not provide loans to membersof the Management Board.
Outlook 2015The Supervisory Board does not intend to change the RemunerationPolicy in the foreseeable future.
A remuneration benchmark against TomTom's peer group shall beperformed in the course of 2015 to assess the appropriateness ofthe base salary of the members of the Management Board. Theoutcome of this benchmark may have an impact on the base salariesof the Management Board members. In any event, an indexationof 2.7% of the salaries of all members of the Management Boardshall take place in 2015.
For the short-term incentive scheme of 2015, the Supervisory Boardfeels it is appropriate to apply KPIs and weighting that measure thecompany's strategy in consideration of its financial position. Giventhe focus on revenue growth and considering the company'scurrent financial position, the Supervisory Board decided to removethe cash flow KPI for 2015. As such, the two performance criteriawill be a revenue KPI weighted at 50% and an EBIT KPI alsoweighted at 50%. These KPIs fully align with the KPIs set for theemployee annual bonus plan.
The Supervisory Board is of the opinion that the unconditionalManagement Board Option Plan is appropriate and correspondswith the company's long-term focus on growth.
To align the company's contribution to the private pension plan ofAlain De Taeye with competitive market levels, the SupervisoryBoard decided to increase the contribution from 10% to 20% ofthe annual base salary. This means that both members of theManagement Board who benefit from the company's contributionto their respective private pension plans receive the maximumcontribution as provided for in the Remuneration Policy.
Employee arrangements and severanceagreementsAll members of the Management Board have an employmentcontract with the company. The employment contracts are enteredinto for an indefinite period, but the term of office of members ofthe Management Board is four years. After this period, they maybe reappointed for another term of not more than four years at atime.
A notice period of 12 months is applicable to all members of theManagement Board. In the event that the employment of amember of the Management Board is terminated by the company,or on its initiative, he or she shall be entitled to a fixed amount of50% of one year's base salary, including holiday allowance ifapplicable. The severance compensation due will be paid tomembers of the Management Board during the agreed noticeperiod of 12 months in addition to the salary.
CONTENTS OVERVIEW MANAGEMENTBOARD REPORT
CORPORATEGOVERNANCE
SUPERVISORYBOARD REPORT
FINANCIALSTATEMENTS
SUPPLEMENTARYINFORMATION
ANNUAL REPORT AND ACCOUNTS 2014 / 42
These terms will not apply if the employment of a member of theManagement Board is terminated for any reason as set out inArticles 7:677 (1) and 7:678 of the Dutch Civil Code. In suchsituations, the Management Board member will not be entitled toany severance compensation. A member of the Management Boardwill not be entitled to severance compensation if the employmentis terminated by him or her, or on his or her initiative.
Members of the Supervisory Board are not entitled to any benefitsupon the termination of their appointment.
SELECTION AND APPOINTMENT COMMITTEE
REPORT
The Selection and Appointment Committee Report describes themain items discussed by the Selection and Appointment Committee(Committee) during the year 2014. Following the retirement ofKarel Vuursteen, the Committee appointed Peter Wakkie as thenew Chairman of the Committee.
Committee meetingsThe Selection and Appointment Committee met four times duringthe course of 2014, with an overall attendance rate of 100%. Eachmeeting was also attended by Alain De Taeye, the SVP Group HRand the Company Secretary.
Committee activitiesAt the beginning of the year the HR strategy within the companywas shared with the Committee, and quarterly updates wereprovided by the SVP Global HR. Topics that were shared in thisrespect with the Committee were initiatives concerning careerdevelopment, management and leadership, and compensation andbenefits. These initiatives all underpin the company's efforts in thearea of talent management, with the aim to attract, retain anddevelop talent.
The Committee focused on the company's progress on itssuccession planning for key positions within the company. On aquarterly basis, the Committee was given an update on therecruitment status of vacant key positions in senior management.An annual update was provided on TomTom's DiversityProgramme.
The Committee rules were reviewed and discussed and textualchanges were made in this respect.
The term of Doug Dunn will expire at the 2015 General Meeting bywhich time he will have served for ten years on the SupervisoryBoard. In this respect, the Committee considered the compositionof the Supervisory Board and concluded its recommendation to theSupervisory Board to nominate Doug Dunn for reappointment fora term of a further two years, meaning that he will have servedtwelve years in total. The composition of the Management Boardwas also discussed.
AUDIT COMMITTEE REPORT
The Audit Committee considers that it has sufficient breadth, depth,industry-relevant knowledge, experience and expertise available toenable it to discharge its duties appropriately. In particular, theAudit Committee considers that the financial skills and experience
that can reasonably be expected of an audit committee in thedischarge of its duties were available during the year.
Committee meetingsThe Audit Committee met six times during the course of 2014, withan overall attendance rate of 83%. Four meetings were held priorto the publication of the financial results, and the additionalmeetings were to discuss the impairment review relating to theFinancial Statements. All meetings were attended by the CFO andthe VP of Business Assurance in full during the year. The othermembers of the Management Board attended the meetings asrequired (for instance, where important group risks and internalcontrols were discussed). The external auditor attended all agendaitems relevant to the publication of the quarterly financial results.During the year, the Audit Committee also met with other companyemployees, such as the CIO, VP of Tax, the General Counsel, andhead of Treasury and Group Control.
Committee activitiesThe Audit Committee assisted the Supervisory Board in overseeingthe following areas of the business:• The integrity of the company's quarterly financial results and
related press releases;• The integrity of the annual report, including the company's
accounting and financial reporting policies and processes;• A more in-depth review of specific accounting topics was
performed for revenue recognition, provisions, accrualaccounting and valuation of intangible assets, includinggoodwill;
• The integrity of the company's disclosure controls andprocedures;
• Relations with the external auditor, including the scope of theirplans, assessment of their independence, approval of theirremuneration, and their annual reappointment;
• Review of external auditor management letter and actions takenby management to address the recommendations andobservations of the external auditor;
• The role and functioning of the Internal Audit department (partof the Business Assurance team that coordinates oversight ofthe company's business risk management);
• The maintenance of an effective system of risk management andinternal control relating to strategic, financial, operational andcompliance risks;
• Compliance with the recommendations and observations of theinternal auditor;
• The company's approach to financing, cash and foreignexchange management;
• The application of information and communication technology(ICT);
• The company's policy on tax planning and compliance;• The company's approach to business conduct and ethics, as well
as its approach to protecting and securing key company assets;and
• The tender of the external auditor, please refer to the section onErnst & Young below.
In April 2014, the Audit Committee reviewed and updated the AuditCommittee Charter. The Audit Committee Charter is available onthe TomTom website.
CONTENTS OVERVIEW MANAGEMENTBOARD REPORT
CORPORATEGOVERNANCE
SUPERVISORYBOARD REPORT
FINANCIALSTATEMENTS
SUPPLEMENTARYINFORMATION
ANNUAL REPORT AND ACCOUNTS 2014 / 43
Financial reportingThe Supervisory Board and Audit Committee reviewed the quarterlyfinancial results and full year financial statements prior to theirrelease. Attention was paid to critical accounting policies, thevaluation of goodwill and assets and the clarity of the rules fordisclosure, as well as the company's compliance with accountingstandards, the requirements of NYSE Euronext Amsterdam andother corporate governance, legal and regulatory bodies.
Business assuranceThe company monitors its internal controls through a systematicapproach to risk assessment and internal audit. The BusinessAssurance team assists in the independent review of the company'srisk management controls. The VP of Business Assurance reportsfunctionally to the Audit Committee and administratively to theCFO. During 2014, the VP of Business Assurance reported eachquarter to the Audit Committee.
The internal audit programme covers key business processes,subsidiary office reviews, the auditing of major ICT projects beforego live and special requests. Working with management, InternalAudit selects the areas of the business to be audited during the year.Members of the Audit Committee and Management Board may atany time request Internal Audit to carry out an internal audit orspecial consulting service.
The Internal Audit Plan for 2014 – 2016 was developed by theBusiness Assurance team working with Management. A top-downapproach was used, taking into consideration the key risk areas ofthe business as well as the geographical spread of our offices andthe core activities performed there. The external auditors providedtheir input to the Internal Audit Plan. The Audit Committeereviewed and approved the final Internal Audit Plan 2014 – 2016.
IndependenceThe Business Assurance department maintains a high-level ofindependence and objectivity within the company based on thefollowing principles:• The Audit Committee Charter describes the purpose, authority
and responsibilities of Internal Audit;• The VP of Business Assurance has unrestricted access to the
Supervisory Board and Audit Committee and reports regularly tothe Audit Committee, as well as maintaining a direct relationshipwith the Audit Committee chairman;
• The VP of Business Assurance meets at least once annually withthe Audit Committee without the Management Board beingpresent;
• Members of the Internal Audit department are qualifiedprofessionals who uphold the ethical guidelines coveringindependence laid down by the professional bodies governingregistered accountants and internal auditors; and
• The internal auditor's role is to provide assurance and advice tomanagement, who are ultimately accountable for theeffectiveness of the internal control and risk systems.
External auditorDeloitte – 2014 financial auditThe Audit Committee agrees the compensation of the externalauditor and recommends the appointment of an external auditorto the Supervisory Board. Each new appointment is subject to theapproval of the company's shareholders at the General Meeting.
Deloitte Accountants BV has acted as external auditor for thecompany since 2004. During 2014, the external auditor attendedeach of the four Audit Committee meetings to address agendaitems relating to the external financial reporting and related pressreleases. The Audit Committee and the external auditor also metseparately, without the Management Board present, in order tofacilitate free and open discussions.
The Audit Committee reviewed the independence of the externalauditor, taking into account qualitative and quantitative factors.The committee concluded that the external auditor has sufficientobjectivity and independence to perform the external auditfunction. Below a summary is provided of services performed byDeloitte Accountants BV, its network affiliates and the fees earned.
Breakdown of fees by type of service(€ in thousands) 2014 % of
total2013 % of
total
Audit - group 445 58% 445 48%
Audit - statutory 141 19% 141 15%
Audit - related services1 60 8% 60 6%
Tax compliance2 117 15% 289 31%
TOTAL 763 100% 935 100%1 During 2014, audit-related services consisted of quarterly analytical procedures.2 Tax compliance comprises local tax compliance services, including local tax filings and HR-related
compliance services. These services are based on a contract that existed prior to 31 December 2012.
Ernst & Young Accountants LLP – 2015 to 2017financial auditsDuring 2014, TomTom decided to change its auditor in order toremain at the forefront of good governance and in recognition ofregulatory changes in the Netherlands. The Chairman of the AuditCommittee represented the Audit Committee in the audit tenderprocess by chairing the Audit Tender Steering Committee. TheCommittee was made up of several key people within the company.
Three audit firms were approached to tender for the audit in March2014 and the Audit Committee recommended to the SupervisoryBoard that Ernst & Young Accountants LLP (EY) be proposed forappointment. In line with our tender, in the interest of efficiency,the proposal is for a three-year term, as opposed to an annualreappointment as in the past. As a result of the tender, Deloitte'sappointment will expire on completion of the 2015 GeneralMeeting, following which EY will become TomTom's statutoryauditor for three years subject to approval by the shareholders atthe same meeting.
The company has developed a transition plan with EY such thatminimal disruption will occur within the business. This includesensuring no independence concerns arise through the performingof non-audit services, as EY previously provided tax advisoryservices to the company.
CONTENTS OVERVIEW MANAGEMENTBOARD REPORT
CORPORATEGOVERNANCE
SUPERVISORYBOARD REPORT
FINANCIALSTATEMENTS
SUPPLEMENTARYINFORMATION
ANNUAL REPORT AND ACCOUNTS 2014 / 44
FINANCIAL STATEMENTS
The annual Financial Statements of the company for 2014, asprepared by the Management Board, have been audited by DeloitteAccountants BV. The financial statements, the report andmanagement letter of the external auditor were discussedextensively with the auditors by the Audit Committee in thepresence of the Management Board, and by the full SupervisoryBoard with the Management Board.
The Supervisory Board is of the opinion that the 2014 FinancialStatements of TomTom NV meet all requirements for correctnessand transparency. The Supervisory Board has approved theseFinancial Statements for 2014 and all individual members of theSupervisory Board and members of the Management Board havesigned the Financial Statements for 2014 pursuant to the statutoryobligations under Article 2:101 (2) of the Dutch Civil Code.
The Supervisory Board recommends to the General Meeting toadopt the Financial Statements for 2014. In addition, theSupervisory Board requests that the General Meeting discharge themembers of the Management Board of their responsibility for theconduct of business in 2014 and the members of the SupervisoryBoard for their supervision in 2014.
The Annual Report for 2014 is available at the company's officeson request and on the company's website:corporate.tomtom.com/annuals.cfm.
The Supervisory Board would like to thank all employees and theManagement Board members for their continued dedication andcommitment in 2014.
Amsterdam, 12 February 2015
The Supervisory Board
Peter WakkieDoug DunnGuy DemuynckBen van der VeerToine van LaackJacqueline Tammenoms BakkerAnita Elberse
CONTENTS OVERVIEW MANAGEMENTBOARD REPORT
CORPORATEGOVERNANCE
SUPERVISORYBOARD REPORT
FINANCIALSTATEMENTS
SUPPLEMENTARYINFORMATION
ANNUAL REPORT AND ACCOUNTS 2014 / 45
CONTENTS OVERVIEW MANAGEMENTBOARD REPORT
CORPORATEGOVERNANCE
SUPERVISORYBOARD REPORT
FINANCIALSTATEMENTS
SUPPLEMENTARYINFORMATION
ANNUAL REPORT AND ACCOUNTS 2014 / 46
FINANCIAL STATEMENTS
CONSOLIDATED FINANCIAL STATEMENTSConsolidated statement of income 47Consolidated statement of comprehensive income 48Consolidated balance sheet 49Consolidated statement of cash flows 50Consolidated statement of changes in equity 51Notes to the consolidated financial statements 52
COMPANY FINANCIAL STATEMENTS OF TOMTOM NVCompany statement of income of TomTom NV 81Company balance sheet of TomTom NV 82Notes to the company financial statements 83
OTHER INFORMATION 85Independent Auditor's Report 86
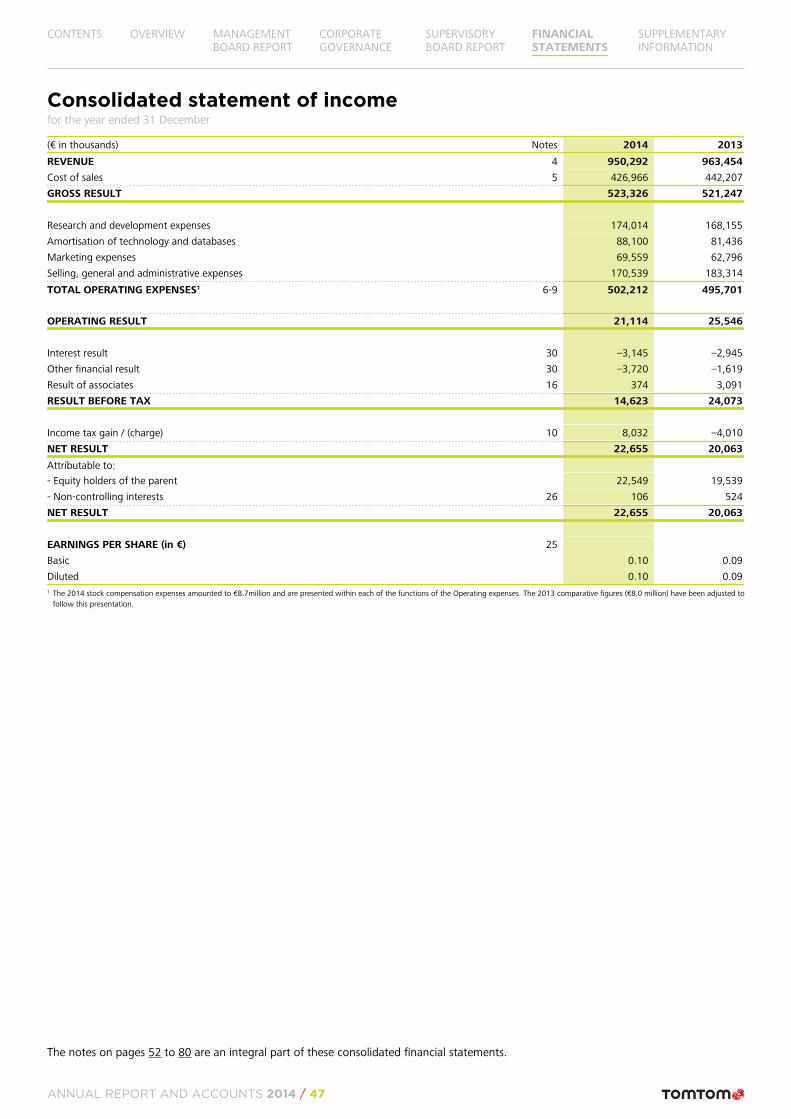
Consolidated statement of incomefor the year ended 31 December
(€ in thousands) Notes 2014 2013
REVENUE 4 950,292 963,454
Cost of sales 5 426,966 442,207
GROSS RESULT 523,326 521,247
Research and development expenses 174,014 168,155
Amortisation of technology and databases 88,100 81,436
Marketing expenses 69,559 62,796
Selling, general and administrative expenses 170,539 183,314
TOTAL OPERATING EXPENSES1 6-9 502,212 495,701
OPERATING RESULT 21,114 25,546
Interest result 30 –3,145 –2,945
Other financial result 30 –3,720 –1,619
Result of associates 16 374 3,091
RESULT BEFORE TAX 14,623 24,073
Income tax gain / (charge) 10 8,032 –4,010
NET RESULT 22,655 20,063
Attributable to:
- Equity holders of the parent 22,549 19,539
- Non-controlling interests 26 106 524
NET RESULT 22,655 20,063
EARNINGS PER SHARE (in €) 25
Basic 0.10 0.09
Diluted 0.10 0.091 The 2014 stock compensation expenses amounted to €8.7million and are presented within each of the functions of the Operating expenses. The 2013 comparative figures (€8.0 million) have been adjusted to
follow this presentation.
The notes on pages 52 to 80 are an integral part of these consolidated financial statements.
CONTENTS OVERVIEW MANAGEMENTBOARD REPORT
CORPORATEGOVERNANCE
SUPERVISORYBOARD REPORT
FINANCIALSTATEMENTS
SUPPLEMENTARYINFORMATION
ANNUAL REPORT AND ACCOUNTS 2014 / 47
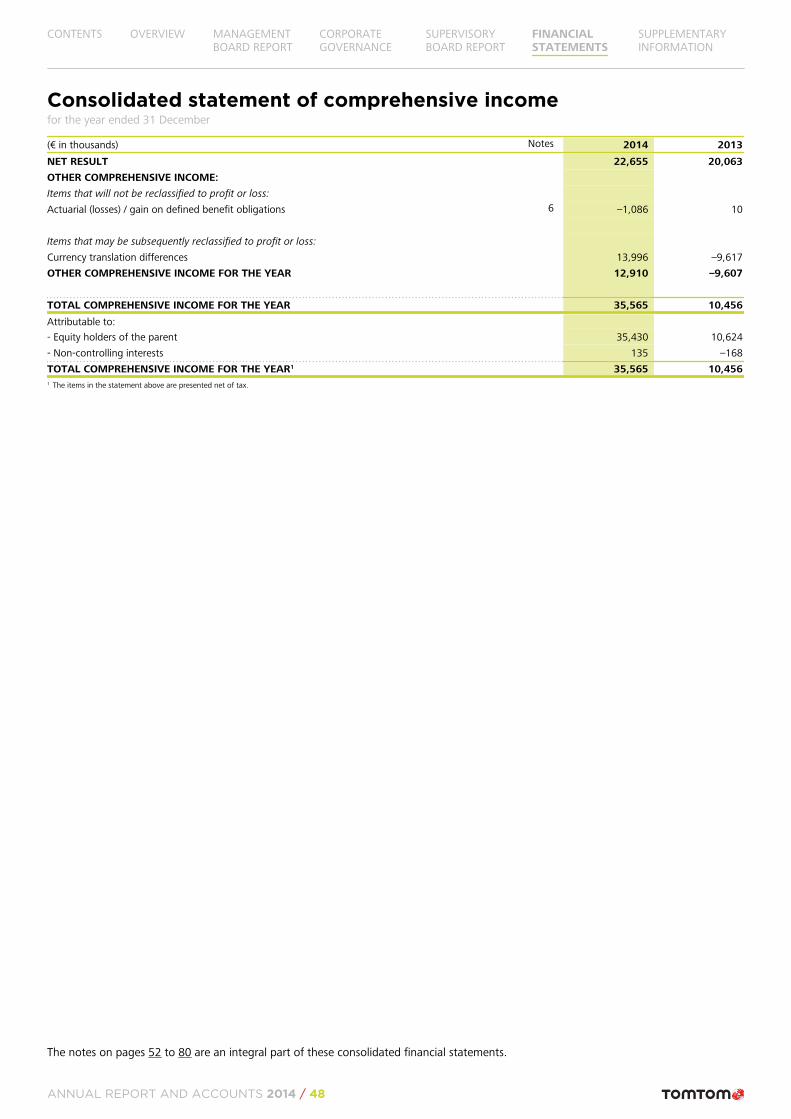
Consolidated statement of comprehensive incomefor the year ended 31 December
(€ in thousands) Notes 2014 2013
NET RESULT 22,655 20,063
OTHER COMPREHENSIVE INCOME:
Items that will not be reclassified to profit or loss:
Actuarial (losses) / gain on defined benefit obligations 6 –1,086 10
Items that may be subsequently reclassified to profit or loss:
Currency translation differences 13,996 –9,617
OTHER COMPREHENSIVE INCOME FOR THE YEAR 12,910 –9,607
TOTAL COMPREHENSIVE INCOME FOR THE YEAR 35,565 10,456
Attributable to:
- Equity holders of the parent 35,430 10,624
- Non-controlling interests 135 –168
TOTAL COMPREHENSIVE INCOME FOR THE YEAR1 35,565 10,4561 The items in the statement above are presented net of tax.
The notes on pages 52 to 80 are an integral part of these consolidated financial statements.
CONTENTS OVERVIEW MANAGEMENTBOARD REPORT
CORPORATEGOVERNANCE
SUPERVISORYBOARD REPORT
FINANCIALSTATEMENTS
SUPPLEMENTARYINFORMATION
ANNUAL REPORT AND ACCOUNTS 2014 / 48
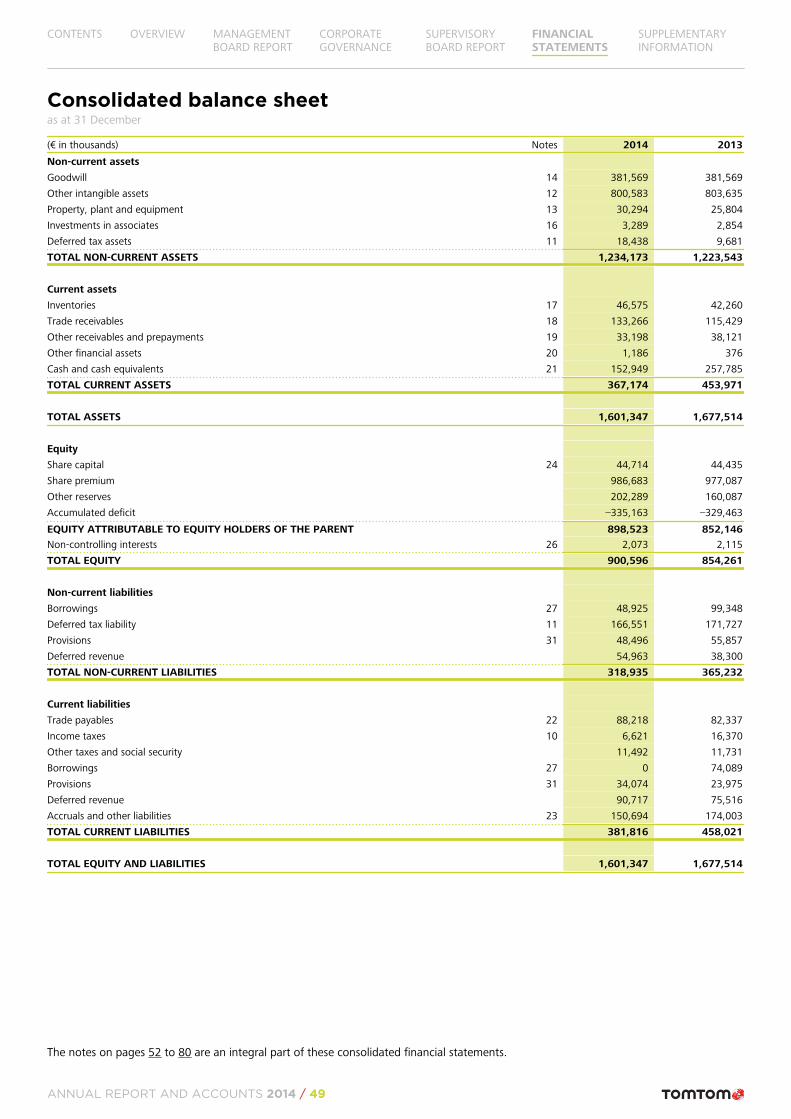
Consolidated balance sheetas at 31 December
(€ in thousands) Notes 2014 2013
Non-current assets
Goodwill 14 381,569 381,569
Other intangible assets 12 800,583 803,635
Property, plant and equipment 13 30,294 25,804
Investments in associates 16 3,289 2,854
Deferred tax assets 11 18,438 9,681
TOTAL NON-CURRENT ASSETS 1,234,173 1,223,543
Current assets
Inventories 17 46,575 42,260
Trade receivables 18 133,266 115,429
Other receivables and prepayments 19 33,198 38,121
Other financial assets 20 1,186 376
Cash and cash equivalents 21 152,949 257,785
TOTAL CURRENT ASSETS 367,174 453,971
TOTAL ASSETS 1,601,347 1,677,514
Equity
Share capital 24 44,714 44,435
Share premium 986,683 977,087
Other reserves 202,289 160,087
Accumulated deficit –335,163 –329,463
EQUITY ATTRIBUTABLE TO EQUITY HOLDERS OF THE PARENT 898,523 852,146
Non-controlling interests 26 2,073 2,115
TOTAL EQUITY 900,596 854,261
Non-current liabilities
Borrowings 27 48,925 99,348
Deferred tax liability 11 166,551 171,727
Provisions 31 48,496 55,857
Deferred revenue 54,963 38,300
TOTAL NON-CURRENT LIABILITIES 318,935 365,232
Current liabilities
Trade payables 22 88,218 82,337
Income taxes 10 6,621 16,370
Other taxes and social security 11,492 11,731
Borrowings 27 0 74,089
Provisions 31 34,074 23,975
Deferred revenue 90,717 75,516
Accruals and other liabilities 23 150,694 174,003
TOTAL CURRENT LIABILITIES 381,816 458,021
TOTAL EQUITY AND LIABILITIES 1,601,347 1,677,514
The notes on pages 52 to 80 are an integral part of these consolidated financial statements.
CONTENTS OVERVIEW MANAGEMENTBOARD REPORT
CORPORATEGOVERNANCE
SUPERVISORYBOARD REPORT
FINANCIALSTATEMENTS
SUPPLEMENTARYINFORMATION
ANNUAL REPORT AND ACCOUNTS 2014 / 49
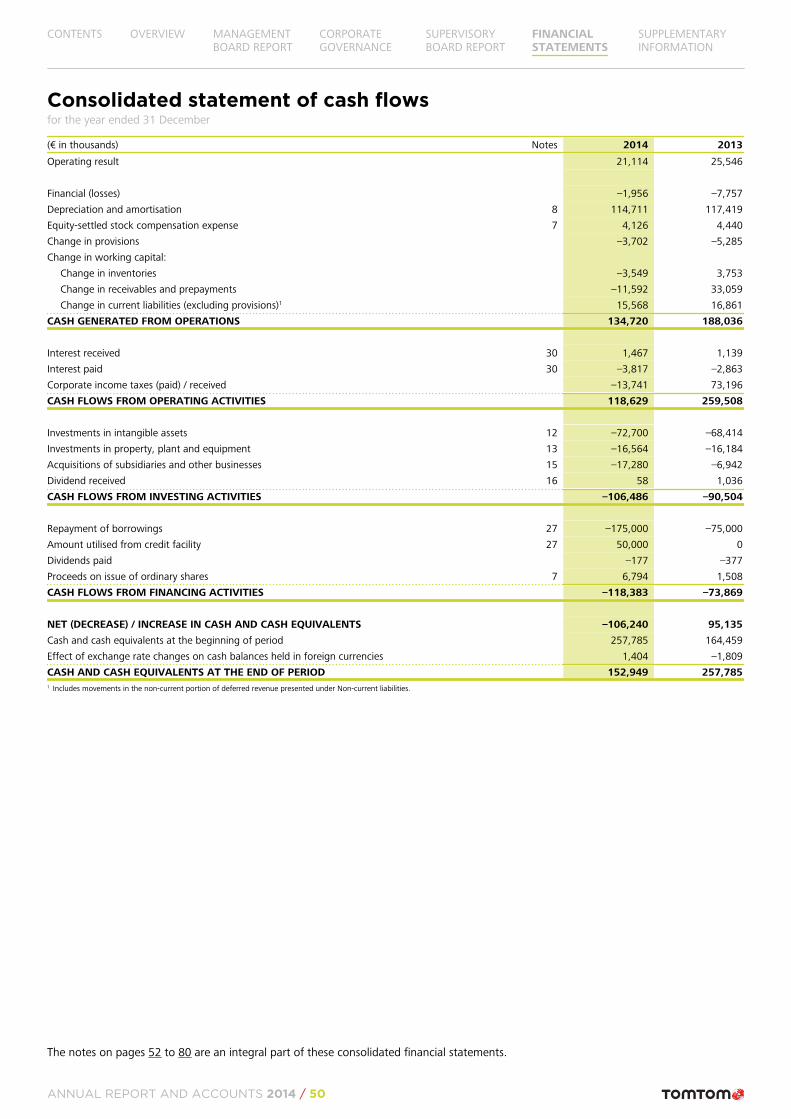
Consolidated statement of cash flowsfor the year ended 31 December
(€ in thousands) Notes 2014 2013
Operating result 21,114 25,546
Financial (losses) –1,956 –7,757
Depreciation and amortisation 8 114,711 117,419
Equity-settled stock compensation expense 7 4,126 4,440
Change in provisions –3,702 –5,285
Change in working capital:
Change in inventories –3,549 3,753
Change in receivables and prepayments –11,592 33,059
Change in current liabilities (excluding provisions)1 15,568 16,861
CASH GENERATED FROM OPERATIONS 134,720 188,036
Interest received 30 1,467 1,139
Interest paid 30 –3,817 –2,863
Corporate income taxes (paid) / received –13,741 73,196
CASH FLOWS FROM OPERATING ACTIVITIES 118,629 259,508
Investments in intangible assets 12 –72,700 –68,414
Investments in property, plant and equipment 13 –16,564 –16,184
Acquisitions of subsidiaries and other businesses 15 –17,280 –6,942
Dividend received 16 58 1,036
CASH FLOWS FROM INVESTING ACTIVITIES –106,486 –90,504
Repayment of borrowings 27 –175,000 –75,000
Amount utilised from credit facility 27 50,000 0
Dividends paid –177 –377
Proceeds on issue of ordinary shares 7 6,794 1,508
CASH FLOWS FROM FINANCING ACTIVITIES –118,383 –73,869
NET (DECREASE) / INCREASE IN CASH AND CASH EQUIVALENTS –106,240 95,135
Cash and cash equivalents at the beginning of period 257,785 164,459
Effect of exchange rate changes on cash balances held in foreign currencies 1,404 –1,809
CASH AND CASH EQUIVALENTS AT THE END OF PERIOD 152,949 257,7851 Includes movements in the non-current portion of deferred revenue presented under Non-current liabilities.
The notes on pages 52 to 80 are an integral part of these consolidated financial statements.
CONTENTS OVERVIEW MANAGEMENTBOARD REPORT
CORPORATEGOVERNANCE
SUPERVISORYBOARD REPORT
FINANCIALSTATEMENTS
SUPPLEMENTARYINFORMATION
ANNUAL REPORT AND ACCOUNTS 2014 / 50
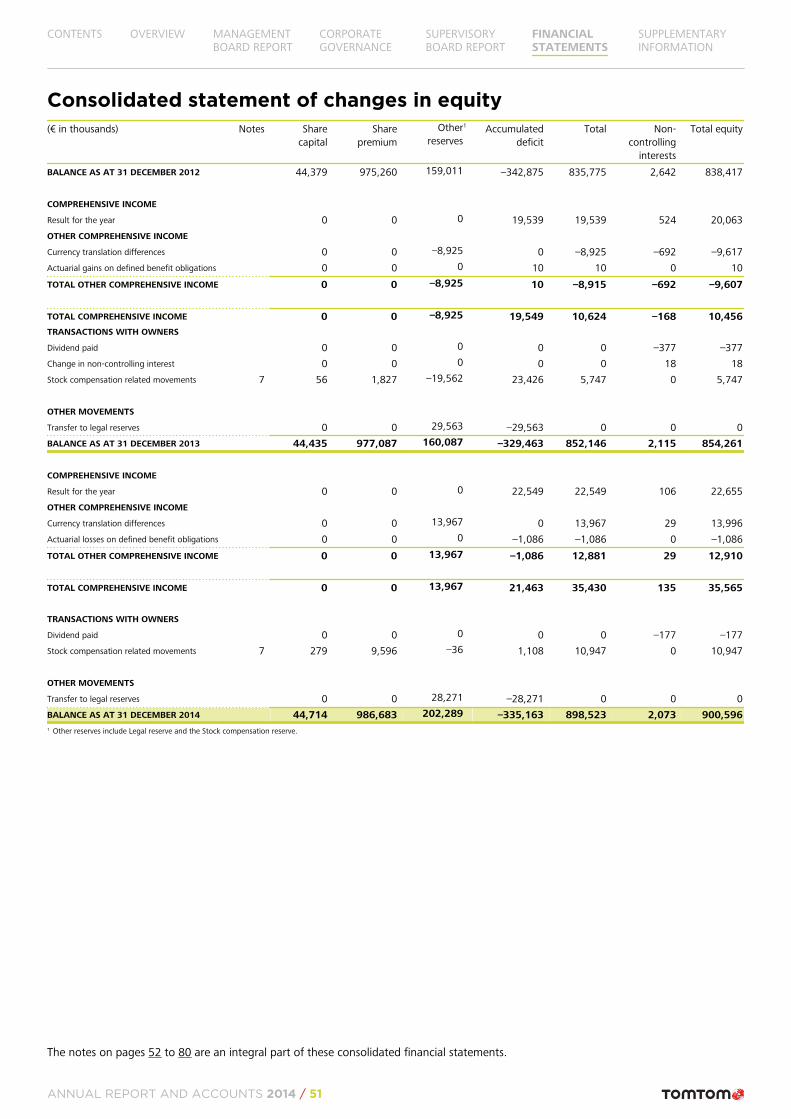
Consolidated statement of changes in equity(€ in thousands) Notes Share
capitalShare
premiumOther
reserves
1 Accumulateddeficit
Total Non-controlling
interests
Total equity
BALANCE AS AT 31 DECEMBER 2012 44,379 975,260 159,011 –342,875 835,775 2,642 838,417
COMPREHENSIVE INCOME
Result for the year 0 0 0 19,539 19,539 524 20,063
OTHER COMPREHENSIVE INCOME
Currency translation differences 0 0 –8,925 0 –8,925 –692 –9,617
Actuarial gains on defined benefit obligations 0 0 0 10 10 0 10
TOTAL OTHER COMPREHENSIVE INCOME 0 0 –8,925 10 –8,915 –692 –9,607
TOTAL COMPREHENSIVE INCOME 0 0 –8,925 19,549 10,624 –168 10,456TRANSACTIONS WITH OWNERS
Dividend paid 0 0 0 0 0 –377 –377
Change in non-controlling interest 0 0 0 0 0 18 18
Stock compensation related movements 7 56 1,827 –19,562 23,426 5,747 0 5,747
OTHER MOVEMENTS
Transfer to legal reserves 0 0 29,563 –29,563 0 0 0
BALANCE AS AT 31 DECEMBER 2013 44,435 977,087 160,087 –329,463 852,146 2,115 854,261
COMPREHENSIVE INCOME
Result for the year 0 0 0 22,549 22,549 106 22,655
OTHER COMPREHENSIVE INCOME
Currency translation differences 0 0 13,967 0 13,967 29 13,996
Actuarial losses on defined benefit obligations 0 0 0 –1,086 –1,086 0 –1,086
TOTAL OTHER COMPREHENSIVE INCOME 0 0 13,967 –1,086 12,881 29 12,910
TOTAL COMPREHENSIVE INCOME 0 0 13,967 21,463 35,430 135 35,565
TRANSACTIONS WITH OWNERS
Dividend paid 0 0 0 0 0 –177 –177
Stock compensation related movements 7 279 9,596 –36 1,108 10,947 0 10,947
OTHER MOVEMENTS
Transfer to legal reserves 0 0 28,271 –28,271 0 0 0
BALANCE AS AT 31 DECEMBER 2014 44,714 986,683 202,289 –335,163 898,523 2,073 900,5961 Other reserves include Legal reserve and the Stock compensation reserve.
The notes on pages 52 to 80 are an integral part of these consolidated financial statements.
CONTENTS OVERVIEW MANAGEMENTBOARD REPORT
CORPORATEGOVERNANCE
SUPERVISORYBOARD REPORT
FINANCIALSTATEMENTS
SUPPLEMENTARYINFORMATION
ANNUAL REPORT AND ACCOUNTS 2014 / 51
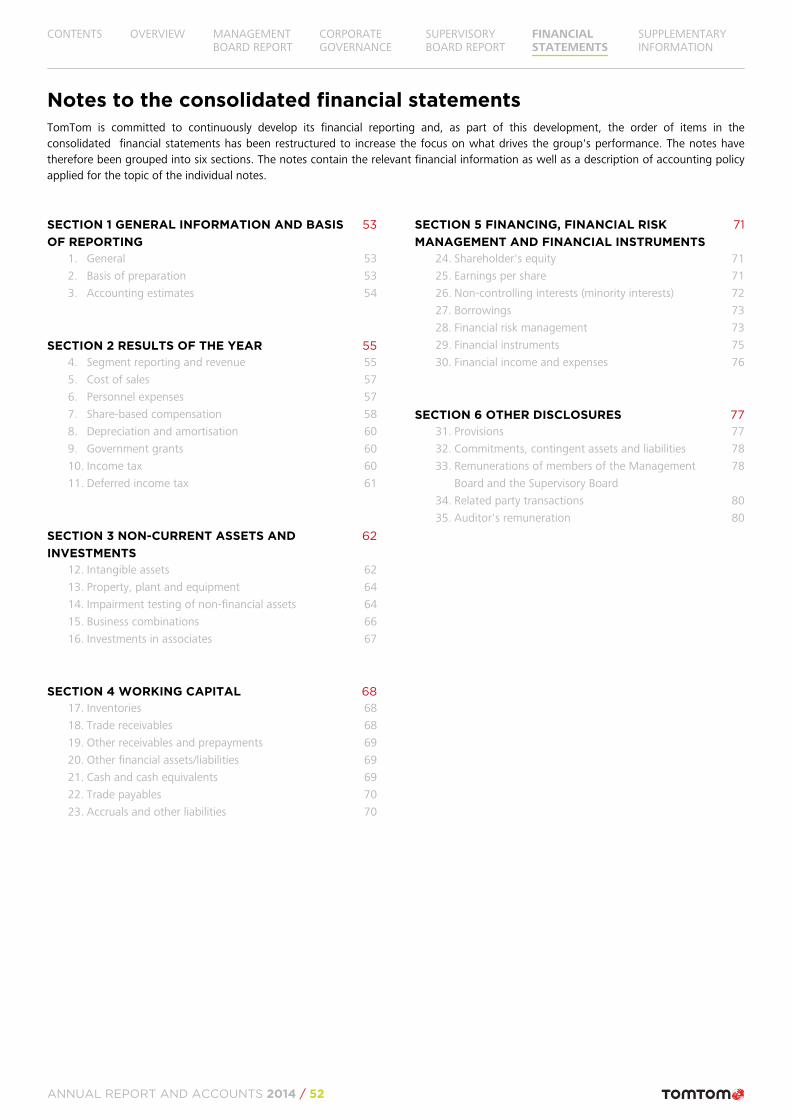
Notes to the consolidated financial statementsTomTom is committed to continuously develop its financial reporting and, as part of this development, the order of items in theconsolidated financial statements has been restructured to increase the focus on what drives the group's performance. The notes havetherefore been grouped into six sections. The notes contain the relevant financial information as well as a description of accounting policyapplied for the topic of the individual notes.
SECTION 1 GENERAL INFORMATION AND BASISOF REPORTING
53
1. General 53
2. Basis of preparation 53
3. Accounting estimates 54
SECTION 2 RESULTS OF THE YEAR 554. Segment reporting and revenue 55
5. Cost of sales 57
6. Personnel expenses 57
7. Share-based compensation 58
8. Depreciation and amortisation 60
9. Government grants 60
10. Income tax 60
11. Deferred income tax 61
SECTION 3 NON-CURRENT ASSETS ANDINVESTMENTS
62
12. Intangible assets 62
13. Property, plant and equipment 64
14. Impairment testing of non-financial assets 64
15. Business combinations 66
16. Investments in associates 67
SECTION 4 WORKING CAPITAL 6817. Inventories 68
18. Trade receivables 68
19. Other receivables and prepayments 69
20. Other financial assets/liabilities 69
21. Cash and cash equivalents 69
22. Trade payables 70
23. Accruals and other liabilities 70
SECTION 5 FINANCING, FINANCIAL RISKMANAGEMENT AND FINANCIAL INSTRUMENTS
71
24. Shareholder's equity 71
25. Earnings per share 71
26. Non-controlling interests (minority interests) 72
27. Borrowings 73
28. Financial risk management 73
29. Financial instruments 75
30. Financial income and expenses 76
SECTION 6 OTHER DISCLOSURES 7731. Provisions 77
32. Commitments, contingent assets and liabilities 78
33. Remunerations of members of the Management
Board and the Supervisory Board
78
34. Related party transactions 80
35. Auditor's remuneration 80
CONTENTS OVERVIEW MANAGEMENTBOARD REPORT
CORPORATEGOVERNANCE
SUPERVISORYBOARD REPORT
FINANCIALSTATEMENTS
SUPPLEMENTARYINFORMATION
ANNUAL REPORT AND ACCOUNTS 2014 / 52
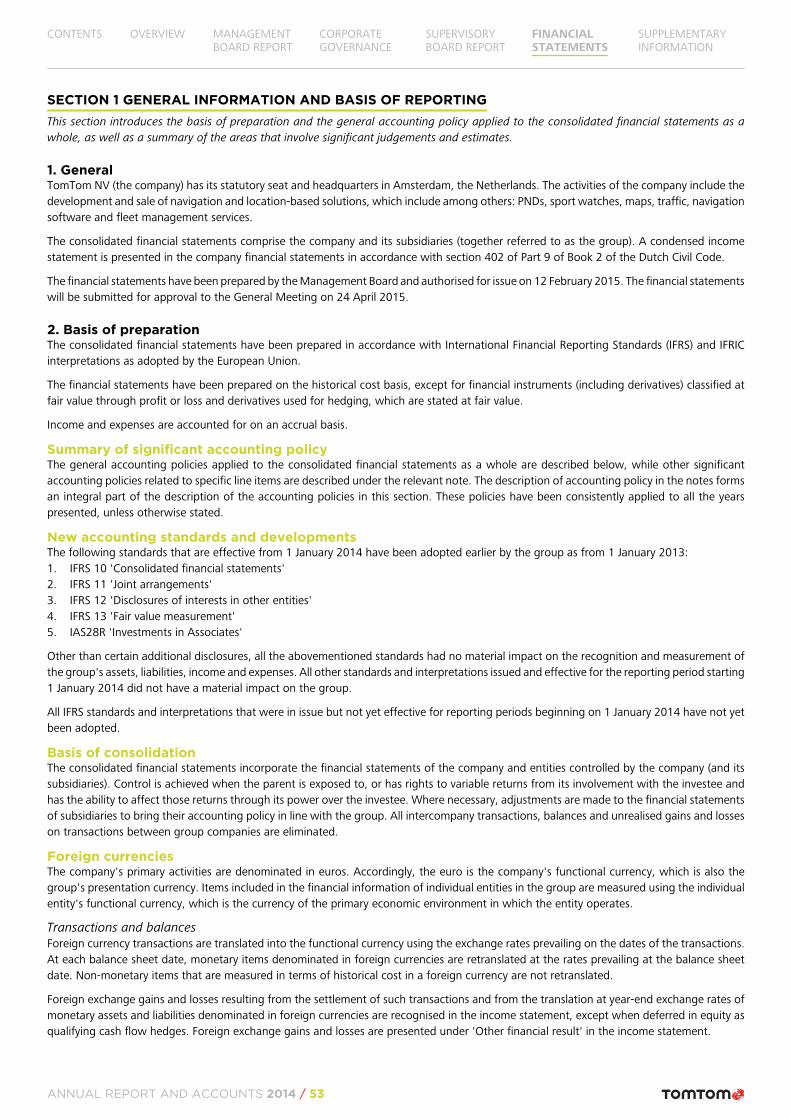
SECTION 1 GENERAL INFORMATION AND BASIS OF REPORTINGThis section introduces the basis of preparation and the general accounting policy applied to the consolidated financial statements as awhole, as well as a summary of the areas that involve significant judgements and estimates.
1. GeneralTomTom NV (the company) has its statutory seat and headquarters in Amsterdam, the Netherlands. The activities of the company include thedevelopment and sale of navigation and location-based solutions, which include among others: PNDs, sport watches, maps, traffic, navigationsoftware and fleet management services.
The consolidated financial statements comprise the company and its subsidiaries (together referred to as the group). A condensed incomestatement is presented in the company financial statements in accordance with section 402 of Part 9 of Book 2 of the Dutch Civil Code.
The financial statements have been prepared by the Management Board and authorised for issue on 12 February 2015. The financial statementswill be submitted for approval to the General Meeting on 24 April 2015.
2. Basis of preparationThe consolidated financial statements have been prepared in accordance with International Financial Reporting Standards (IFRS) and IFRICinterpretations as adopted by the European Union.
The financial statements have been prepared on the historical cost basis, except for financial instruments (including derivatives) classified atfair value through profit or loss and derivatives used for hedging, which are stated at fair value.
Income and expenses are accounted for on an accrual basis.
Summary of significant accounting policyThe general accounting policies applied to the consolidated financial statements as a whole are described below, while other significantaccounting policies related to specific line items are described under the relevant note. The description of accounting policy in the notes formsan integral part of the description of the accounting policies in this section. These policies have been consistently applied to all the yearspresented, unless otherwise stated.
New accounting standards and developmentsThe following standards that are effective from 1 January 2014 have been adopted earlier by the group as from 1 January 2013:1. IFRS 10 'Consolidated financial statements'2. IFRS 11 'Joint arrangements'3. IFRS 12 'Disclosures of interests in other entities'4. IFRS 13 'Fair value measurement'5. IAS28R 'Investments in Associates'
Other than certain additional disclosures, all the abovementioned standards had no material impact on the recognition and measurement ofthe group's assets, liabilities, income and expenses. All other standards and interpretations issued and effective for the reporting period starting1 January 2014 did not have a material impact on the group.
All IFRS standards and interpretations that were in issue but not yet effective for reporting periods beginning on 1 January 2014 have not yetbeen adopted.
Basis of consolidationThe consolidated financial statements incorporate the financial statements of the company and entities controlled by the company (and itssubsidiaries). Control is achieved when the parent is exposed to, or has rights to variable returns from its involvement with the investee andhas the ability to affect those returns through its power over the investee. Where necessary, adjustments are made to the financial statementsof subsidiaries to bring their accounting policy in line with the group. All intercompany transactions, balances and unrealised gains and losseson transactions between group companies are eliminated.
Foreign currenciesThe company's primary activities are denominated in euros. Accordingly, the euro is the company's functional currency, which is also thegroup's presentation currency. Items included in the financial information of individual entities in the group are measured using the individualentity's functional currency, which is the currency of the primary economic environment in which the entity operates.
Transactions and balancesForeign currency transactions are translated into the functional currency using the exchange rates prevailing on the dates of the transactions.At each balance sheet date, monetary items denominated in foreign currencies are retranslated at the rates prevailing at the balance sheetdate. Non-monetary items that are measured in terms of historical cost in a foreign currency are not retranslated.
Foreign exchange gains and losses resulting from the settlement of such transactions and from the translation at year-end exchange rates ofmonetary assets and liabilities denominated in foreign currencies are recognised in the income statement, except when deferred in equity asqualifying cash flow hedges. Foreign exchange gains and losses are presented under 'Other financial result' in the income statement.
CONTENTS OVERVIEW MANAGEMENTBOARD REPORT
CORPORATEGOVERNANCE
SUPERVISORYBOARD REPORT
FINANCIALSTATEMENTS
SUPPLEMENTARYINFORMATION
ANNUAL REPORT AND ACCOUNTS 2014 / 53
Group companiesFor consolidation purposes, the assets and liabilities of entities that have a functional currency other than the group's presentation currencyare translated at the closing rate at the date of the balance sheet, whereas the income statement is translated at the average exchange ratefor the period. Translation differences arising thereon are recognised in 'Other comprehensive income'.
Cash flow statementsCash flow statements are prepared using the indirect method. Cash flows from derivative instruments are classified consistently with thenature of the instrument.
3. Accounting estimatesThe preparation of these financial statements requires management to make certain assumptions, estimates and judgements that affect thereported amounts of assets, liabilities and disclosure of contingent assets and liabilities as of the date of the consolidated financial statementsand the reported amounts of revenues and expenses during the reporting period. Actual results may differ from those estimates. The estimatesand underlying assumptions are reviewed on an ongoing basis. Revisions to accounting estimates are recognised in the period in which theestimate is revised if the revision affects only that period or in the period of revision and the future periods if the revision affects both currentand future periods.
The table below presents the areas that involve a higher degree of judgement or areas where assumptions and estimates are significant tothe financial statements:
Note
Revenue recognition 4
Internally generated intangible assets 12
Impairment of goodwill 14
Income tax 10 - 11
Provisions and contingent assets / liabilities 31 - 32
Detailed explanations of the degree of judgement and assumptions used are included under each of the respective sections in the notes tothe financial statements as referenced above.
CONTENTS OVERVIEW MANAGEMENTBOARD REPORT
CORPORATEGOVERNANCE
SUPERVISORYBOARD REPORT
FINANCIALSTATEMENTS
SUPPLEMENTARYINFORMATION
ANNUAL REPORT AND ACCOUNTS 2014 / 54
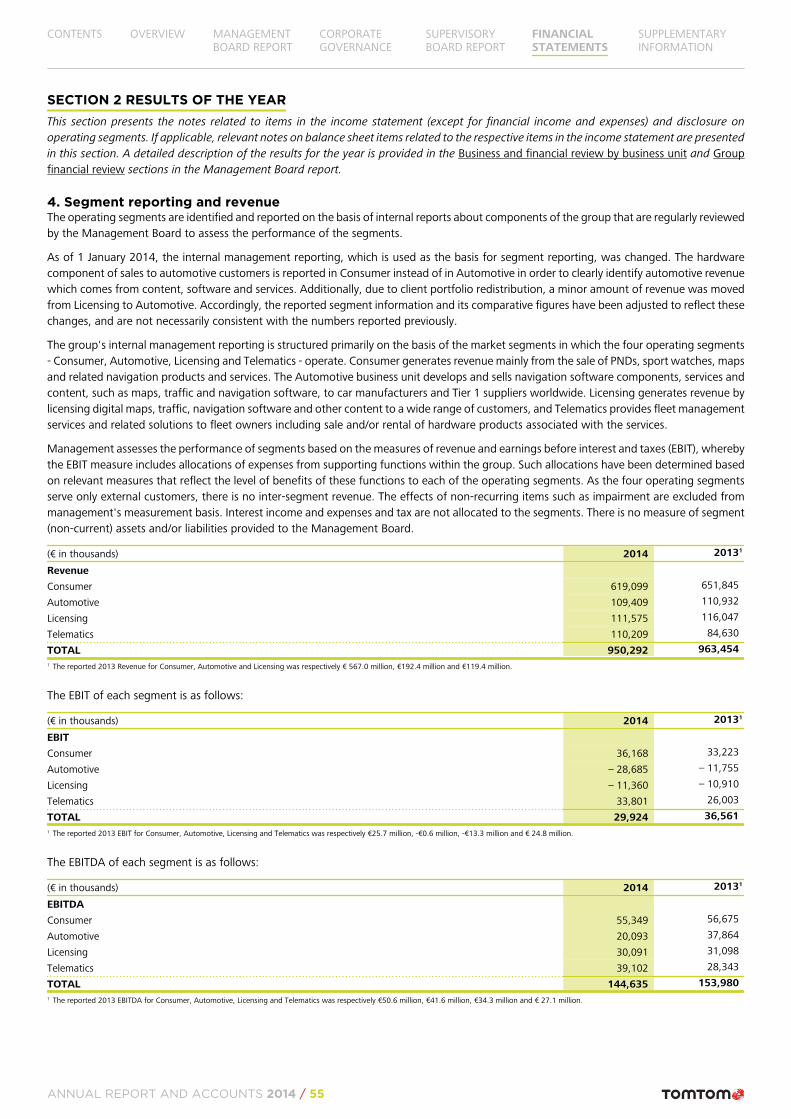
SECTION 2 RESULTS OF THE YEARThis section presents the notes related to items in the income statement (except for financial income and expenses) and disclosure onoperating segments. If applicable, relevant notes on balance sheet items related to the respective items in the income statement are presentedin this section. A detailed description of the results for the year is provided in the Business and financial review by business unit and Groupfinancial review sections in the Management Board report.
4. Segment reporting and revenueThe operating segments are identified and reported on the basis of internal reports about components of the group that are regularly reviewedby the Management Board to assess the performance of the segments.
As of 1 January 2014, the internal management reporting, which is used as the basis for segment reporting, was changed. The hardwarecomponent of sales to automotive customers is reported in Consumer instead of in Automotive in order to clearly identify automotive revenuewhich comes from content, software and services. Additionally, due to client portfolio redistribution, a minor amount of revenue was movedfrom Licensing to Automotive. Accordingly, the reported segment information and its comparative figures have been adjusted to reflect thesechanges, and are not necessarily consistent with the numbers reported previously.
The group's internal management reporting is structured primarily on the basis of the market segments in which the four operating segments- Consumer, Automotive, Licensing and Telematics - operate. Consumer generates revenue mainly from the sale of PNDs, sport watches, mapsand related navigation products and services. The Automotive business unit develops and sells navigation software components, services andcontent, such as maps, traffic and navigation software, to car manufacturers and Tier 1 suppliers worldwide. Licensing generates revenue bylicensing digital maps, traffic, navigation software and other content to a wide range of customers, and Telematics provides fleet managementservices and related solutions to fleet owners including sale and/or rental of hardware products associated with the services.
Management assesses the performance of segments based on the measures of revenue and earnings before interest and taxes (EBIT), wherebythe EBIT measure includes allocations of expenses from supporting functions within the group. Such allocations have been determined basedon relevant measures that reflect the level of benefits of these functions to each of the operating segments. As the four operating segmentsserve only external customers, there is no inter-segment revenue. The effects of non-recurring items such as impairment are excluded frommanagement's measurement basis. Interest income and expenses and tax are not allocated to the segments. There is no measure of segment(non-current) assets and/or liabilities provided to the Management Board.
(€ in thousands) 2014 20131
Revenue
Consumer 619,099 651,845
Automotive 109,409 110,932
Licensing 111,575 116,047
Telematics 110,209 84,630
TOTAL 950,292 963,4541 The reported 2013 Revenue for Consumer, Automotive and Licensing was respectively € 567.0 million, €192.4 million and €119.4 million.
The EBIT of each segment is as follows:
(€ in thousands) 2014 20131
EBIT
Consumer 36,168 33,223
Automotive – 28,685 – 11,755
Licensing – 11,360 – 10,910
Telematics 33,801 26,003
TOTAL 29,924 36,5611 The reported 2013 EBIT for Consumer, Automotive, Licensing and Telematics was respectively €25.7 million, -€0.6 million, -€13.3 million and € 24.8 million.
The EBITDA of each segment is as follows:
(€ in thousands) 2014 20131
EBITDA
Consumer 55,349 56,675
Automotive 20,093 37,864
Licensing 30,091 31,098
Telematics 39,102 28,343
TOTAL 144,635 153,9801 The reported 2013 EBITDA for Consumer, Automotive, Licensing and Telematics was respectively €50.6 million, €41.6 million, €34.3 million and € 27.1 million.
CONTENTS OVERVIEW MANAGEMENTBOARD REPORT
CORPORATEGOVERNANCE
SUPERVISORYBOARD REPORT
FINANCIALSTATEMENTS
SUPPLEMENTARYINFORMATION
ANNUAL REPORT AND ACCOUNTS 2014 / 55
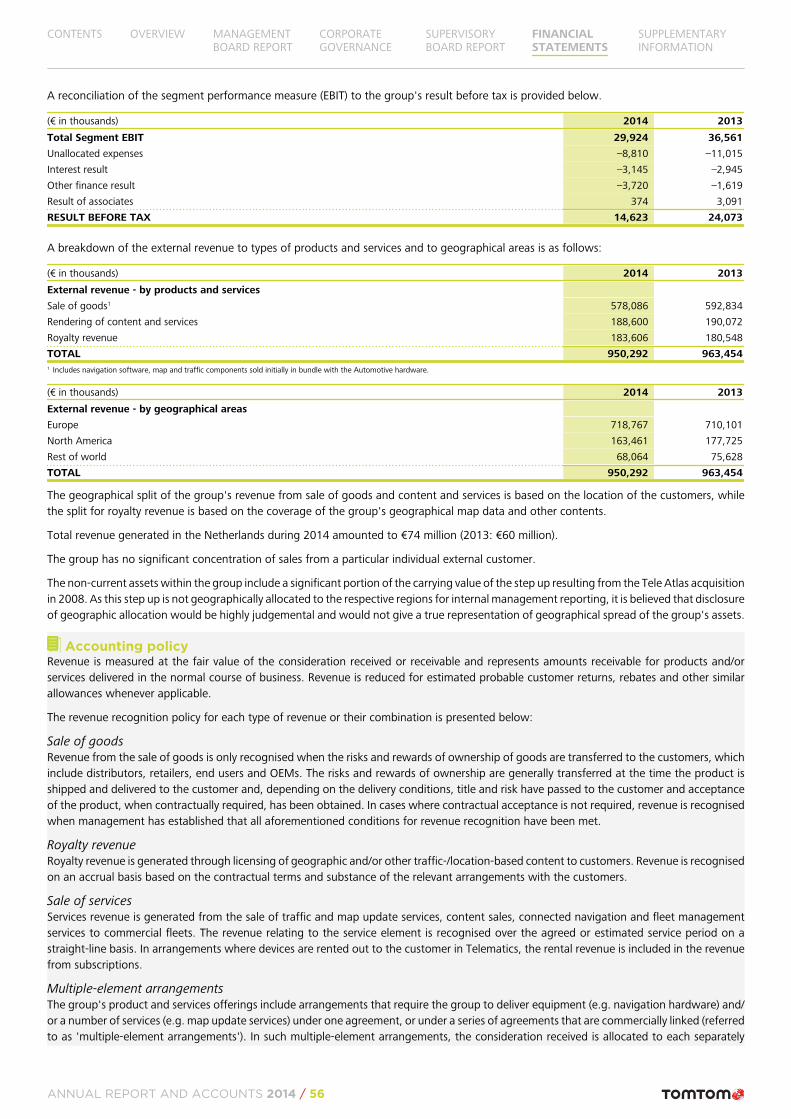
A reconciliation of the segment performance measure (EBIT) to the group's result before tax is provided below.
(€ in thousands) 2014 2013
Total Segment EBIT 29,924 36,561
Unallocated expenses –8,810 –11,015
Interest result –3,145 –2,945
Other finance result –3,720 –1,619
Result of associates 374 3,091
RESULT BEFORE TAX 14,623 24,073
A breakdown of the external revenue to types of products and services and to geographical areas is as follows:
(€ in thousands) 2014 2013
External revenue - by products and services
Sale of goods1 578,086 592,834
Rendering of content and services 188,600 190,072
Royalty revenue 183,606 180,548
TOTAL 950,292 963,4541 Includes navigation software, map and traffic components sold initially in bundle with the Automotive hardware.
(€ in thousands) 2014 2013
External revenue - by geographical areas
Europe 718,767 710,101
North America 163,461 177,725
Rest of world 68,064 75,628
TOTAL 950,292 963,454
The geographical split of the group's revenue from sale of goods and content and services is based on the location of the customers, whilethe split for royalty revenue is based on the coverage of the group's geographical map data and other contents.
Total revenue generated in the Netherlands during 2014 amounted to €74 million (2013: €60 million).
The group has no significant concentration of sales from a particular individual external customer.
The non-current assets within the group include a significant portion of the carrying value of the step up resulting from the Tele Atlas acquisitionin 2008. As this step up is not geographically allocated to the respective regions for internal management reporting, it is believed that disclosureof geographic allocation would be highly judgemental and would not give a true representation of geographical spread of the group's assets.
Accounting policyRevenue is measured at the fair value of the consideration received or receivable and represents amounts receivable for products and/orservices delivered in the normal course of business. Revenue is reduced for estimated probable customer returns, rebates and other similarallowances whenever applicable.
The revenue recognition policy for each type of revenue or their combination is presented below:
Sale of goodsRevenue from the sale of goods is only recognised when the risks and rewards of ownership of goods are transferred to the customers, whichinclude distributors, retailers, end users and OEMs. The risks and rewards of ownership are generally transferred at the time the product isshipped and delivered to the customer and, depending on the delivery conditions, title and risk have passed to the customer and acceptanceof the product, when contractually required, has been obtained. In cases where contractual acceptance is not required, revenue is recognisedwhen management has established that all aforementioned conditions for revenue recognition have been met.
Royalty revenueRoyalty revenue is generated through licensing of geographic and/or other traffic-/location-based content to customers. Revenue is recognisedon an accrual basis based on the contractual terms and substance of the relevant arrangements with the customers.
Sale of servicesServices revenue is generated from the sale of traffic and map update services, content sales, connected navigation and fleet managementservices to commercial fleets. The revenue relating to the service element is recognised over the agreed or estimated service period on astraight-line basis. In arrangements where devices are rented out to the customer in Telematics, the rental revenue is included in the revenuefrom subscriptions.
Multiple-element arrangementsThe group's product and services offerings include arrangements that require the group to deliver equipment (e.g. navigation hardware) and/or a number of services (e.g. map update services) under one agreement, or under a series of agreements that are commercially linked (referredto as 'multiple-element arrangements'). In such multiple-element arrangements, the consideration received is allocated to each separately
CONTENTS OVERVIEW MANAGEMENTBOARD REPORT
CORPORATEGOVERNANCE
SUPERVISORYBOARD REPORT
FINANCIALSTATEMENTS
SUPPLEMENTARYINFORMATION
ANNUAL REPORT AND ACCOUNTS 2014 / 56
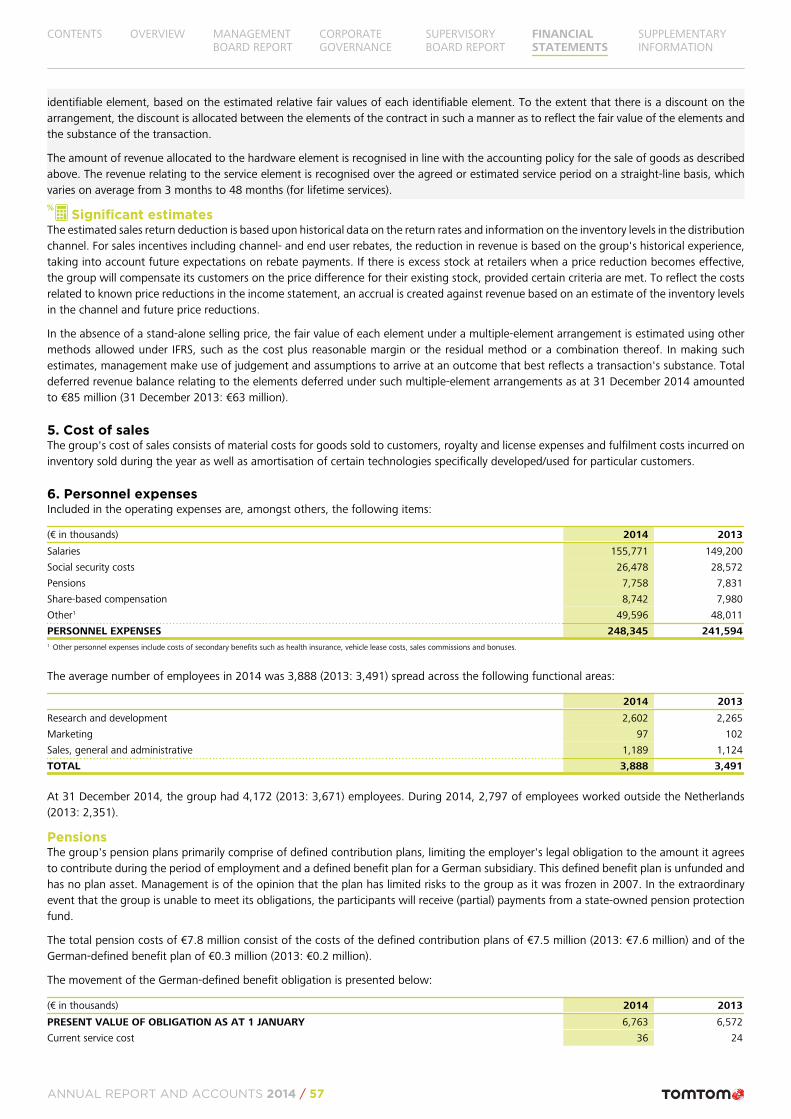
identifiable element, based on the estimated relative fair values of each identifiable element. To the extent that there is a discount on thearrangement, the discount is allocated between the elements of the contract in such a manner as to reflect the fair value of the elements andthe substance of the transaction.
The amount of revenue allocated to the hardware element is recognised in line with the accounting policy for the sale of goods as describedabove. The revenue relating to the service element is recognised over the agreed or estimated service period on a straight-line basis, whichvaries on average from 3 months to 48 months (for lifetime services).
Significant estimatesThe estimated sales return deduction is based upon historical data on the return rates and information on the inventory levels in the distributionchannel. For sales incentives including channel- and end user rebates, the reduction in revenue is based on the group's historical experience,taking into account future expectations on rebate payments. If there is excess stock at retailers when a price reduction becomes effective,the group will compensate its customers on the price difference for their existing stock, provided certain criteria are met. To reflect the costsrelated to known price reductions in the income statement, an accrual is created against revenue based on an estimate of the inventory levelsin the channel and future price reductions.
In the absence of a stand-alone selling price, the fair value of each element under a multiple-element arrangement is estimated using othermethods allowed under IFRS, such as the cost plus reasonable margin or the residual method or a combination thereof. In making suchestimates, management make use of judgement and assumptions to arrive at an outcome that best reflects a transaction's substance. Totaldeferred revenue balance relating to the elements deferred under such multiple-element arrangements as at 31 December 2014 amountedto €85 million (31 December 2013: €63 million).
5. Cost of salesThe group's cost of sales consists of material costs for goods sold to customers, royalty and license expenses and fulfilment costs incurred oninventory sold during the year as well as amortisation of certain technologies specifically developed/used for particular customers.
6. Personnel expensesIncluded in the operating expenses are, amongst others, the following items:
(€ in thousands) 2014 2013
Salaries 155,771 149,200
Social security costs 26,478 28,572
Pensions 7,758 7,831
Share-based compensation 8,742 7,980
Other1 49,596 48,011
PERSONNEL EXPENSES 248,345 241,5941 Other personnel expenses include costs of secondary benefits such as health insurance, vehicle lease costs, sales commissions and bonuses.
The average number of employees in 2014 was 3,888 (2013: 3,491) spread across the following functional areas:
2014 2013
Research and development 2,602 2,265
Marketing 97 102
Sales, general and administrative 1,189 1,124
TOTAL 3,888 3,491
At 31 December 2014, the group had 4,172 (2013: 3,671) employees. During 2014, 2,797 of employees worked outside the Netherlands(2013: 2,351).
PensionsThe group's pension plans primarily comprise of defined contribution plans, limiting the employer's legal obligation to the amount it agreesto contribute during the period of employment and a defined benefit plan for a German subsidiary. This defined benefit plan is unfunded andhas no plan asset. Management is of the opinion that the plan has limited risks to the group as it was frozen in 2007. In the extraordinaryevent that the group is unable to meet its obligations, the participants will receive (partial) payments from a state-owned pension protectionfund.
The total pension costs of €7.8 million consist of the costs of the defined contribution plans of €7.5 million (2013: €7.6 million) and of theGerman-defined benefit plan of €0.3 million (2013: €0.2 million).
The movement of the German-defined benefit obligation is presented below:
(€ in thousands) 2014 2013
PRESENT VALUE OF OBLIGATION AS AT 1 JANUARY 6,763 6,572
Current service cost 36 24
CONTENTS OVERVIEW MANAGEMENTBOARD REPORT
CORPORATEGOVERNANCE
SUPERVISORYBOARD REPORT
FINANCIALSTATEMENTS
SUPPLEMENTARYINFORMATION
ANNUAL REPORT AND ACCOUNTS 2014 / 57
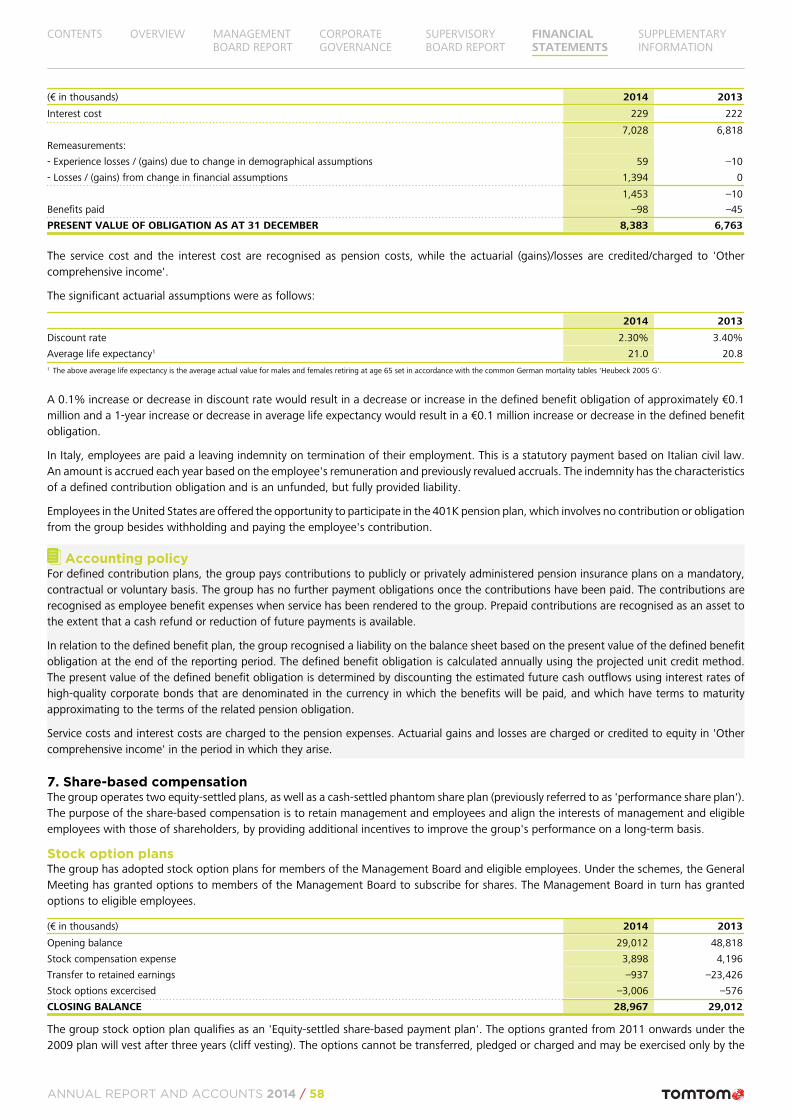
(€ in thousands) 2014 2013
Interest cost 229 222
7,028 6,818
Remeasurements:
- Experience losses / (gains) due to change in demographical assumptions 59 –10
- Losses / (gains) from change in financial assumptions 1,394 0
1,453 –10
Benefits paid –98 –45
PRESENT VALUE OF OBLIGATION AS AT 31 DECEMBER 8,383 6,763
The service cost and the interest cost are recognised as pension costs, while the actuarial (gains)/losses are credited/charged to 'Othercomprehensive income'.
The significant actuarial assumptions were as follows:
2014 2013
Discount rate 2.30% 3.40%
Average life expectancy1 21.0 20.81 The above average life expectancy is the average actual value for males and females retiring at age 65 set in accordance with the common German mortality tables 'Heubeck 2005 G'.
A 0.1% increase or decrease in discount rate would result in a decrease or increase in the defined benefit obligation of approximately €0.1million and a 1-year increase or decrease in average life expectancy would result in a €0.1 million increase or decrease in the defined benefitobligation.
In Italy, employees are paid a leaving indemnity on termination of their employment. This is a statutory payment based on Italian civil law.An amount is accrued each year based on the employee's remuneration and previously revalued accruals. The indemnity has the characteristicsof a defined contribution obligation and is an unfunded, but fully provided liability.
Employees in the United States are offered the opportunity to participate in the 401K pension plan, which involves no contribution or obligationfrom the group besides withholding and paying the employee's contribution.
Accounting policyFor defined contribution plans, the group pays contributions to publicly or privately administered pension insurance plans on a mandatory,contractual or voluntary basis. The group has no further payment obligations once the contributions have been paid. The contributions arerecognised as employee benefit expenses when service has been rendered to the group. Prepaid contributions are recognised as an asset tothe extent that a cash refund or reduction of future payments is available.
In relation to the defined benefit plan, the group recognised a liability on the balance sheet based on the present value of the defined benefitobligation at the end of the reporting period. The defined benefit obligation is calculated annually using the projected unit credit method.The present value of the defined benefit obligation is determined by discounting the estimated future cash outflows using interest rates ofhigh-quality corporate bonds that are denominated in the currency in which the benefits will be paid, and which have terms to maturityapproximating to the terms of the related pension obligation.
Service costs and interest costs are charged to the pension expenses. Actuarial gains and losses are charged or credited to equity in 'Othercomprehensive income' in the period in which they arise.
7. Share-based compensationThe group operates two equity-settled plans, as well as a cash-settled phantom share plan (previously referred to as 'performance share plan').The purpose of the share-based compensation is to retain management and employees and align the interests of management and eligibleemployees with those of shareholders, by providing additional incentives to improve the group's performance on a long-term basis.
Stock option plansThe group has adopted stock option plans for members of the Management Board and eligible employees. Under the schemes, the GeneralMeeting has granted options to members of the Management Board to subscribe for shares. The Management Board in turn has grantedoptions to eligible employees.
(€ in thousands) 2014 2013
Opening balance 29,012 48,818
Stock compensation expense 3,898 4,196
Transfer to retained earnings –937 –23,426
Stock options excercised –3,006 –576
CLOSING BALANCE 28,967 29,012
The group stock option plan qualifies as an 'Equity-settled share-based payment plan'. The options granted from 2011 onwards under the2009 plan will vest after three years (cliff vesting). The options cannot be transferred, pledged or charged and may be exercised only by the
CONTENTS OVERVIEW MANAGEMENTBOARD REPORT
CORPORATEGOVERNANCE
SUPERVISORYBOARD REPORT
FINANCIALSTATEMENTS
SUPPLEMENTARYINFORMATION
ANNUAL REPORT AND ACCOUNTS 2014 / 58
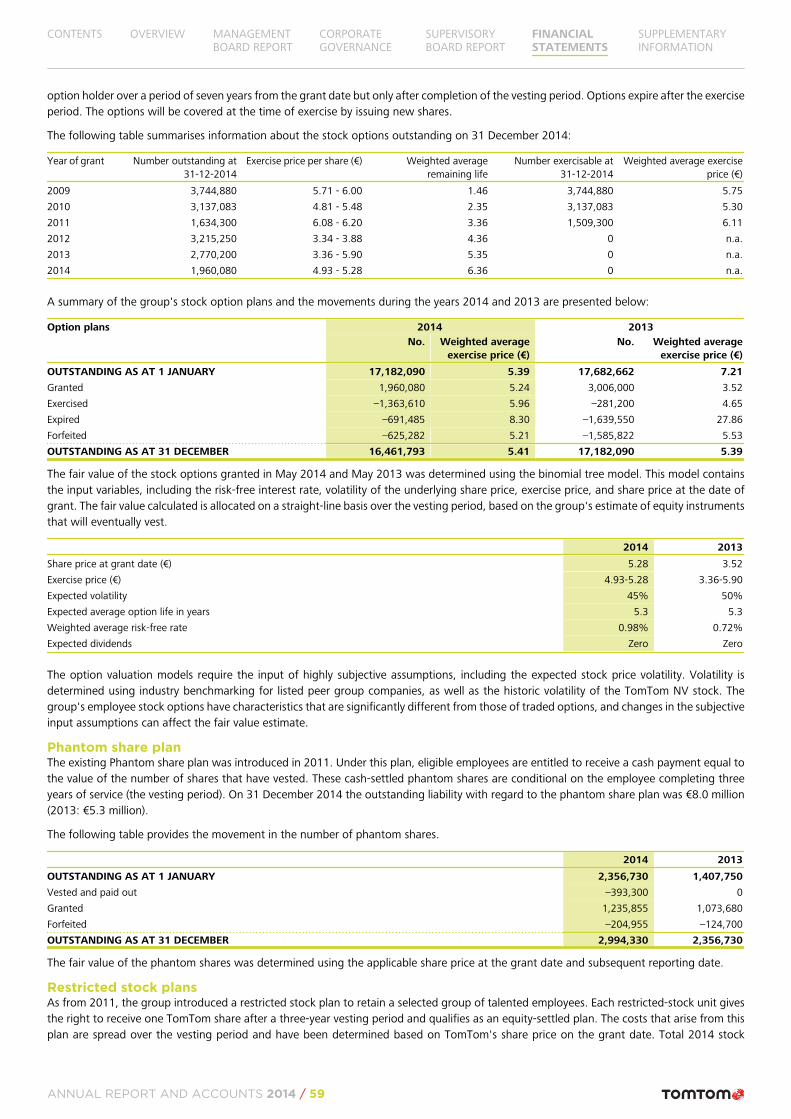
option holder over a period of seven years from the grant date but only after completion of the vesting period. Options expire after the exerciseperiod. The options will be covered at the time of exercise by issuing new shares.
The following table summarises information about the stock options outstanding on 31 December 2014:
Year of grant Number outstanding at31-12-2014
Exercise price per share (€) Weighted averageremaining life
Number exercisable at31-12-2014
Weighted average exerciseprice (€)
2009 3,744,880 5.71 - 6.00 1.46 3,744,880 5.75
2010 3,137,083 4.81 - 5.48 2.35 3,137,083 5.30
2011 1,634,300 6.08 - 6.20 3.36 1,509,300 6.11
2012 3,215,250 3.34 - 3.88 4.36 0 n.a.
2013 2,770,200 3.36 - 5.90 5.35 0 n.a.
2014 1,960,080 4.93 - 5.28 6.36 0 n.a.
A summary of the group's stock option plans and the movements during the years 2014 and 2013 are presented below:
Option plans 2014 2013No. Weighted average
exercise price (€)No. Weighted average
exercise price (€)
OUTSTANDING AS AT 1 JANUARY 17,182,090 5.39 17,682,662 7.21
Granted 1,960,080 5.24 3,006,000 3.52
Exercised –1,363,610 5.96 –281,200 4.65
Expired –691,485 8.30 –1,639,550 27.86
Forfeited –625,282 5.21 –1,585,822 5.53
OUTSTANDING AS AT 31 DECEMBER 16,461,793 5.41 17,182,090 5.39
The fair value of the stock options granted in May 2014 and May 2013 was determined using the binomial tree model. This model containsthe input variables, including the risk-free interest rate, volatility of the underlying share price, exercise price, and share price at the date ofgrant. The fair value calculated is allocated on a straight-line basis over the vesting period, based on the group's estimate of equity instrumentsthat will eventually vest.
2014 2013
Share price at grant date (€) 5.28 3.52
Exercise price (€) 4.93-5.28 3.36-5.90
Expected volatility 45% 50%
Expected average option life in years 5.3 5.3
Weighted average risk-free rate 0.98% 0.72%
Expected dividends Zero Zero
The option valuation models require the input of highly subjective assumptions, including the expected stock price volatility. Volatility isdetermined using industry benchmarking for listed peer group companies, as well as the historic volatility of the TomTom NV stock. Thegroup's employee stock options have characteristics that are significantly different from those of traded options, and changes in the subjectiveinput assumptions can affect the fair value estimate.
Phantom share planThe existing Phantom share plan was introduced in 2011. Under this plan, eligible employees are entitled to receive a cash payment equal tothe value of the number of shares that have vested. These cash-settled phantom shares are conditional on the employee completing threeyears of service (the vesting period). On 31 December 2014 the outstanding liability with regard to the phantom share plan was €8.0 million(2013: €5.3 million).
The following table provides the movement in the number of phantom shares.
2014 2013
OUTSTANDING AS AT 1 JANUARY 2,356,730 1,407,750
Vested and paid out –393,300 0
Granted 1,235,855 1,073,680
Forfeited –204,955 –124,700
OUTSTANDING AS AT 31 DECEMBER 2,994,330 2,356,730
The fair value of the phantom shares was determined using the applicable share price at the grant date and subsequent reporting date.
Restricted stock plansAs from 2011, the group introduced a restricted stock plan to retain a selected group of talented employees. Each restricted-stock unit givesthe right to receive one TomTom share after a three-year vesting period and qualifies as an equity-settled plan. The costs that arise from thisplan are spread over the vesting period and have been determined based on TomTom's share price on the grant date. Total 2014 stock
CONTENTS OVERVIEW MANAGEMENTBOARD REPORT
CORPORATEGOVERNANCE
SUPERVISORYBOARD REPORT
FINANCIALSTATEMENTS
SUPPLEMENTARYINFORMATION
ANNUAL REPORT AND ACCOUNTS 2014 / 59
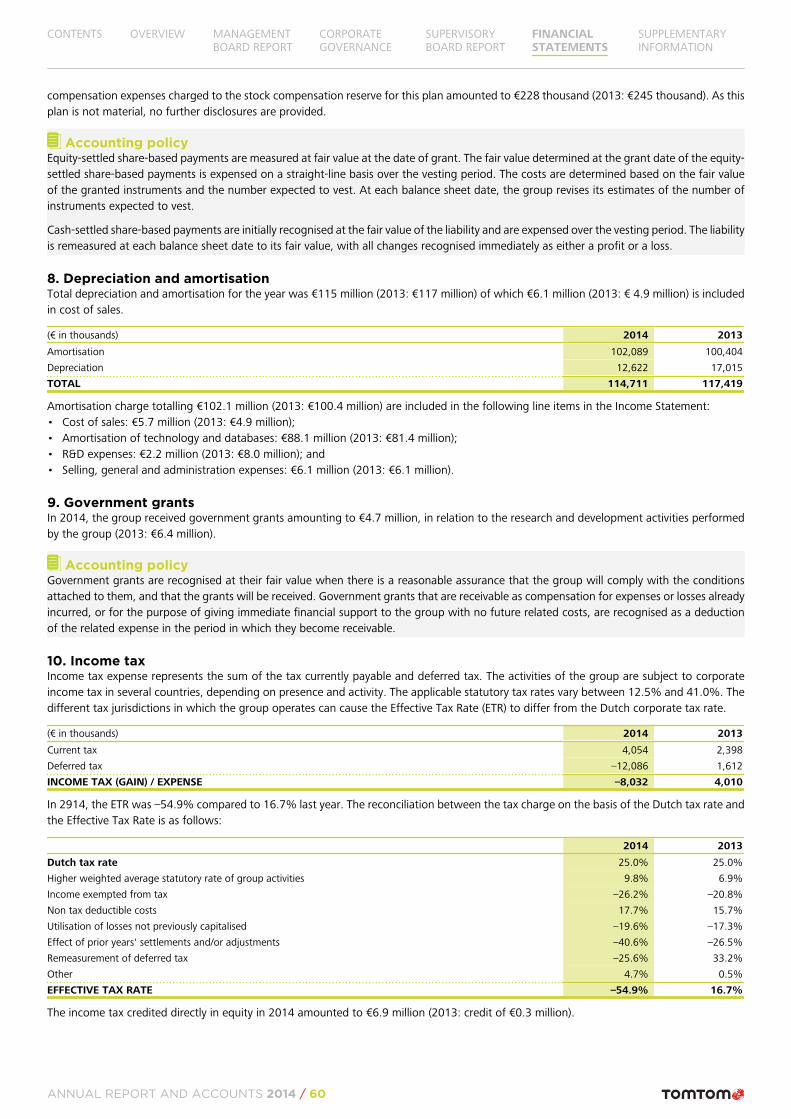
compensation expenses charged to the stock compensation reserve for this plan amounted to €228 thousand (2013: €245 thousand). As thisplan is not material, no further disclosures are provided.
Accounting policyEquity-settled share-based payments are measured at fair value at the date of grant. The fair value determined at the grant date of the equity-settled share-based payments is expensed on a straight-line basis over the vesting period. The costs are determined based on the fair valueof the granted instruments and the number expected to vest. At each balance sheet date, the group revises its estimates of the number ofinstruments expected to vest.
Cash-settled share-based payments are initially recognised at the fair value of the liability and are expensed over the vesting period. The liabilityis remeasured at each balance sheet date to its fair value, with all changes recognised immediately as either a profit or a loss.
8. Depreciation and amortisationTotal depreciation and amortisation for the year was €115 million (2013: €117 million) of which €6.1 million (2013: € 4.9 million) is includedin cost of sales.
(€ in thousands) 2014 2013
Amortisation 102,089 100,404
Depreciation 12,622 17,015
TOTAL 114,711 117,419
Amortisation charge totalling €102.1 million (2013: €100.4 million) are included in the following line items in the Income Statement:• Cost of sales: €5.7 million (2013: €4.9 million);• Amortisation of technology and databases: €88.1 million (2013: €81.4 million);• R&D expenses: €2.2 million (2013: €8.0 million); and• Selling, general and administration expenses: €6.1 million (2013: €6.1 million).
9. Government grantsIn 2014, the group received government grants amounting to €4.7 million, in relation to the research and development activities performedby the group (2013: €6.4 million).
Accounting policyGovernment grants are recognised at their fair value when there is a reasonable assurance that the group will comply with the conditionsattached to them, and that the grants will be received. Government grants that are receivable as compensation for expenses or losses alreadyincurred, or for the purpose of giving immediate financial support to the group with no future related costs, are recognised as a deductionof the related expense in the period in which they become receivable.
10. Income taxIncome tax expense represents the sum of the tax currently payable and deferred tax. The activities of the group are subject to corporateincome tax in several countries, depending on presence and activity. The applicable statutory tax rates vary between 12.5% and 41.0%. Thedifferent tax jurisdictions in which the group operates can cause the Effective Tax Rate (ETR) to differ from the Dutch corporate tax rate.
(€ in thousands) 2014 2013
Current tax 4,054 2,398
Deferred tax –12,086 1,612
INCOME TAX (GAIN) / EXPENSE –8,032 4,010
In 2914, the ETR was –54.9% compared to 16.7% last year. The reconciliation between the tax charge on the basis of the Dutch tax rate andthe Effective Tax Rate is as follows:
2014 2013
Dutch tax rate 25.0% 25.0%
Higher weighted average statutory rate of group activities 9.8% 6.9%
Income exempted from tax –26.2% –20.8%
Non tax deductible costs 17.7% 15.7%
Utilisation of losses not previously capitalised –19.6% –17.3%
Effect of prior years' settlements and/or adjustments –40.6% –26.5%
Remeasurement of deferred tax –25.6% 33.2%
Other 4.7% 0.5%
EFFECTIVE TAX RATE –54.9% 16.7%
The income tax credited directly in equity in 2014 amounted to €6.9 million (2013: credit of €0.3 million).
CONTENTS OVERVIEW MANAGEMENTBOARD REPORT
CORPORATEGOVERNANCE
SUPERVISORYBOARD REPORT
FINANCIALSTATEMENTS
SUPPLEMENTARYINFORMATION
ANNUAL REPORT AND ACCOUNTS 2014 / 60
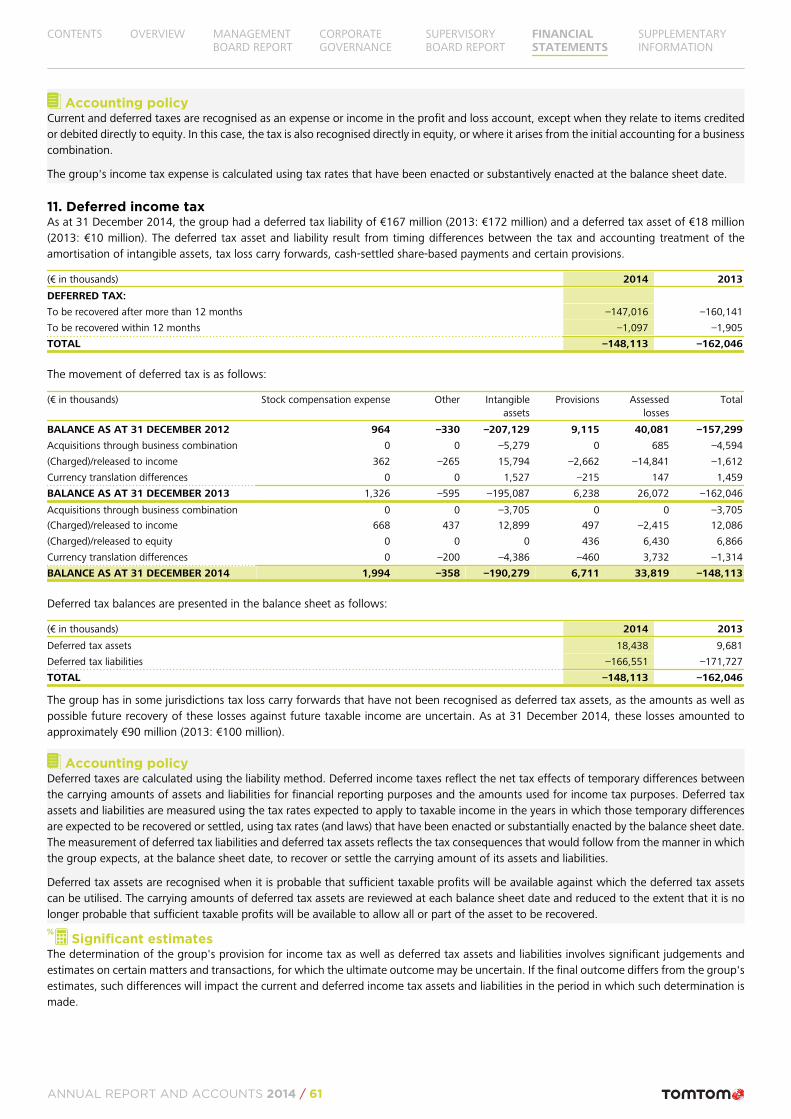
Accounting policyCurrent and deferred taxes are recognised as an expense or income in the profit and loss account, except when they relate to items creditedor debited directly to equity. In this case, the tax is also recognised directly in equity, or where it arises from the initial accounting for a businesscombination.
The group's income tax expense is calculated using tax rates that have been enacted or substantively enacted at the balance sheet date.
11. Deferred income taxAs at 31 December 2014, the group had a deferred tax liability of €167 million (2013: €172 million) and a deferred tax asset of €18 million(2013: €10 million). The deferred tax asset and liability result from timing differences between the tax and accounting treatment of theamortisation of intangible assets, tax loss carry forwards, cash-settled share-based payments and certain provisions.
(€ in thousands) 2014 2013
DEFERRED TAX:
To be recovered after more than 12 months –147,016 –160,141
To be recovered within 12 months –1,097 –1,905
TOTAL –148,113 –162,046
The movement of deferred tax is as follows:
(€ in thousands) Stock compensation expense Other Intangibleassets
Provisions Assessedlosses
Total
BALANCE AS AT 31 DECEMBER 2012 964 –330 –207,129 9,115 40,081 –157,299
Acquisitions through business combination 0 0 –5,279 0 685 –4,594
(Charged)/released to income 362 –265 15,794 –2,662 –14,841 –1,612
Currency translation differences 0 0 1,527 –215 147 1,459
BALANCE AS AT 31 DECEMBER 2013 1,326 –595 –195,087 6,238 26,072 –162,046
Acquisitions through business combination 0 0 –3,705 0 0 –3,705
(Charged)/released to income 668 437 12,899 497 –2,415 12,086
(Charged)/released to equity 0 0 0 436 6,430 6,866
Currency translation differences 0 –200 –4,386 –460 3,732 –1,314
BALANCE AS AT 31 DECEMBER 2014 1,994 –358 –190,279 6,711 33,819 –148,113
Deferred tax balances are presented in the balance sheet as follows:
(€ in thousands) 2014 2013
Deferred tax assets 18,438 9,681
Deferred tax liabilities –166,551 –171,727
TOTAL –148,113 –162,046
The group has in some jurisdictions tax loss carry forwards that have not been recognised as deferred tax assets, as the amounts as well aspossible future recovery of these losses against future taxable income are uncertain. As at 31 December 2014, these losses amounted toapproximately €90 million (2013: €100 million).
Accounting policyDeferred taxes are calculated using the liability method. Deferred income taxes reflect the net tax effects of temporary differences betweenthe carrying amounts of assets and liabilities for financial reporting purposes and the amounts used for income tax purposes. Deferred taxassets and liabilities are measured using the tax rates expected to apply to taxable income in the years in which those temporary differencesare expected to be recovered or settled, using tax rates (and laws) that have been enacted or substantially enacted by the balance sheet date.The measurement of deferred tax liabilities and deferred tax assets reflects the tax consequences that would follow from the manner in whichthe group expects, at the balance sheet date, to recover or settle the carrying amount of its assets and liabilities.
Deferred tax assets are recognised when it is probable that sufficient taxable profits will be available against which the deferred tax assetscan be utilised. The carrying amounts of deferred tax assets are reviewed at each balance sheet date and reduced to the extent that it is nolonger probable that sufficient taxable profits will be available to allow all or part of the asset to be recovered.
Significant estimatesThe determination of the group's provision for income tax as well as deferred tax assets and liabilities involves significant judgements andestimates on certain matters and transactions, for which the ultimate outcome may be uncertain. If the final outcome differs from the group'sestimates, such differences will impact the current and deferred income tax assets and liabilities in the period in which such determination ismade.
CONTENTS OVERVIEW MANAGEMENTBOARD REPORT
CORPORATEGOVERNANCE
SUPERVISORYBOARD REPORT
FINANCIALSTATEMENTS
SUPPLEMENTARYINFORMATION
ANNUAL REPORT AND ACCOUNTS 2014 / 61
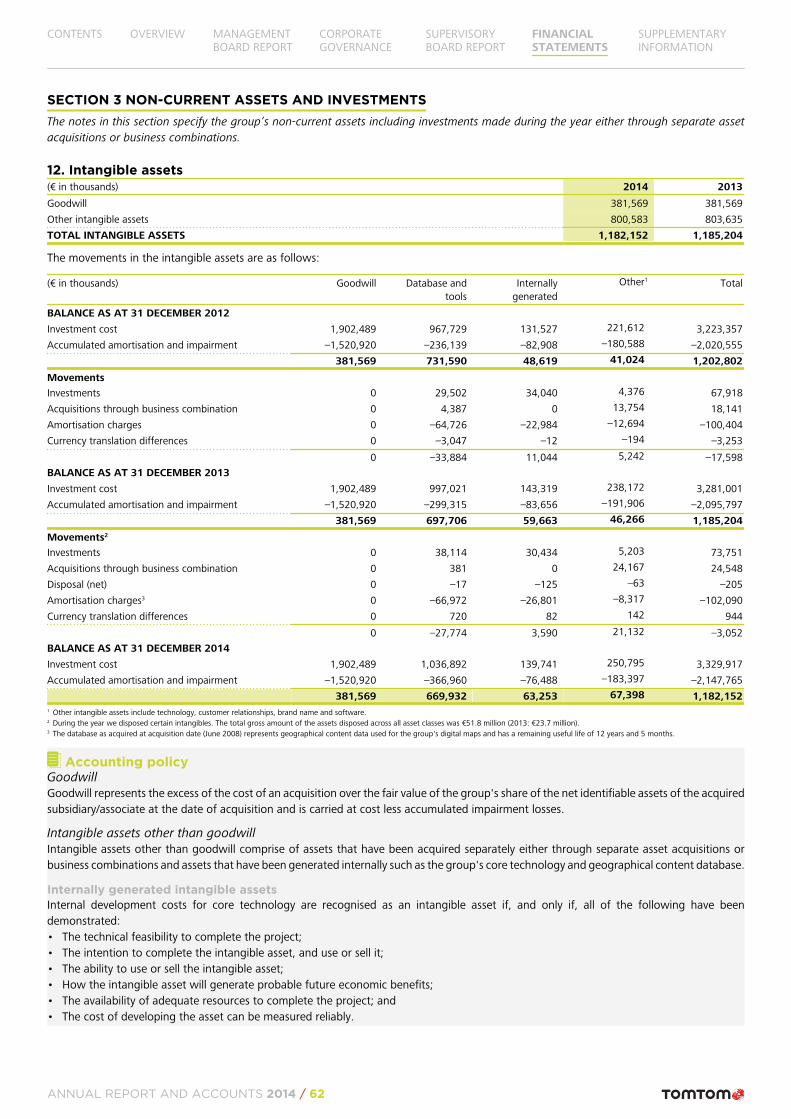
SECTION 3 NON-CURRENT ASSETS AND INVESTMENTSThe notes in this section specify the group’s non-current assets including investments made during the year either through separate assetacquisitions or business combinations.
12. Intangible assets(€ in thousands) 2014 2013
Goodwill 381,569 381,569
Other intangible assets 800,583 803,635
TOTAL INTANGIBLE ASSETS 1,182,152 1,185,204
The movements in the intangible assets are as follows:
(€ in thousands) Goodwill Database andtools
Internallygenerated
Other1 Total
BALANCE AS AT 31 DECEMBER 2012
Investment cost 1,902,489 967,729 131,527 221,612 3,223,357
Accumulated amortisation and impairment –1,520,920 –236,139 –82,908 –180,588 –2,020,555
381,569 731,590 48,619 41,024 1,202,802
Movements
Investments 0 29,502 34,040 4,376 67,918
Acquisitions through business combination 0 4,387 0 13,754 18,141
Amortisation charges 0 –64,726 –22,984 –12,694 –100,404
Currency translation differences 0 –3,047 –12 –194 –3,253
0 –33,884 11,044 5,242 –17,598
BALANCE AS AT 31 DECEMBER 2013
Investment cost 1,902,489 997,021 143,319 238,172 3,281,001
Accumulated amortisation and impairment –1,520,920 –299,315 –83,656 –191,906 –2,095,797
381,569 697,706 59,663 46,266 1,185,204
Movements2
Investments 0 38,114 30,434 5,203 73,751
Acquisitions through business combination 0 381 0 24,167 24,548
Disposal (net) 0 –17 –125 –63 –205
Amortisation charges3 0 –66,972 –26,801 –8,317 –102,090
Currency translation differences 0 720 82 142 944
0 –27,774 3,590 21,132 –3,052
BALANCE AS AT 31 DECEMBER 2014
Investment cost 1,902,489 1,036,892 139,741 250,795 3,329,917
Accumulated amortisation and impairment –1,520,920 –366,960 –76,488 –183,397 –2,147,765
381,569 669,932 63,253 67,398 1,182,1521 Other intangible assets include technology, customer relationships, brand name and software.2 During the year we disposed certain intangibles. The total gross amount of the assets disposed across all asset classes was €51.8 million (2013: €23.7 million).3 The database as acquired at acquisition date (June 2008) represents geographical content data used for the group's digital maps and has a remaining useful life of 12 years and 5 months.
Accounting policyGoodwillGoodwill represents the excess of the cost of an acquisition over the fair value of the group's share of the net identifiable assets of the acquiredsubsidiary/associate at the date of acquisition and is carried at cost less accumulated impairment losses.
Intangible assets other than goodwillIntangible assets other than goodwill comprise of assets that have been acquired separately either through separate asset acquisitions orbusiness combinations and assets that have been generated internally such as the group's core technology and geographical content database.
Internally generated intangible assetsInternal development costs for core technology are recognised as an intangible asset if, and only if, all of the following have beendemonstrated:• The technical feasibility to complete the project;• The intention to complete the intangible asset, and use or sell it;• The ability to use or sell the intangible asset;• How the intangible asset will generate probable future economic benefits;• The availability of adequate resources to complete the project; and• The cost of developing the asset can be measured reliably.
CONTENTS OVERVIEW MANAGEMENTBOARD REPORT
CORPORATEGOVERNANCE
SUPERVISORYBOARD REPORT
FINANCIALSTATEMENTS
SUPPLEMENTARYINFORMATION
ANNUAL REPORT AND ACCOUNTS 2014 / 62
Internally generated databases are capitalised until a certain level of map coverage is reached and ongoing activities focus on maintenance.At this point, capitalisation is discontinued.
Internal software costs relating to development of non-core software with an estimated average useful life of less than one year andengineering costs relating to the detailed manufacturing design of new products are expensed in the period in which they are incurred.
The amount initially recognised for internally generated intangible assets is the sum of the expenditure incurred from the date when theintangible asset first meets the recognition criteria listed above.
All expenditures on research activities are expensed in the income statement as incurred.
Acquired intangible assetsDefinite-lived intangible assets acquired separately are initially recognised at cost. The cost of assets acquired separately includes directlyattributable costs to bring the asset to its intended use. Intangible assets acquired in a business combination are identified and recognisedseparately from goodwill where they satisfy the definition of an intangible asset and their fair values can be measured reliably. The cost ofsuch intangible assets is their fair value at the acquisition date.
Subsequent to initial recognition, all intangible assets other than goodwill are carried at cost less accumulated amortisation and accumulatedimpairment losses.
The amortisation of other intangible assets is recorded on a straight-line basis over the following estimated useful lives as follows:• Internally generated core technology: 3-5 years• Databases and tools: 5-20 years• Customer relationships: 5-27 years• Computer software: 2-5 years• Acquired technology: 4-5 years
Customer relationships include customers for maps; there is a high cost involved in changing map providers and historically there is a highcustomer retention.
Significant estimatesManagement made use of assumptions and judgement in assessing the expected future economic benefits that can be attributed to theinternally generated technology, databases and tools, as well as their expected useful lives. For internally generated databases, assumptionis also made on the level of completion, at which point the capitalisation is discontinued and future activities are considered as maintenance.
Such estimates are made on a regular basis, as they can be significantly affected by changes in technology and other factors.
CONTENTS OVERVIEW MANAGEMENTBOARD REPORT
CORPORATEGOVERNANCE
SUPERVISORYBOARD REPORT
FINANCIALSTATEMENTS
SUPPLEMENTARYINFORMATION
ANNUAL REPORT AND ACCOUNTS 2014 / 63
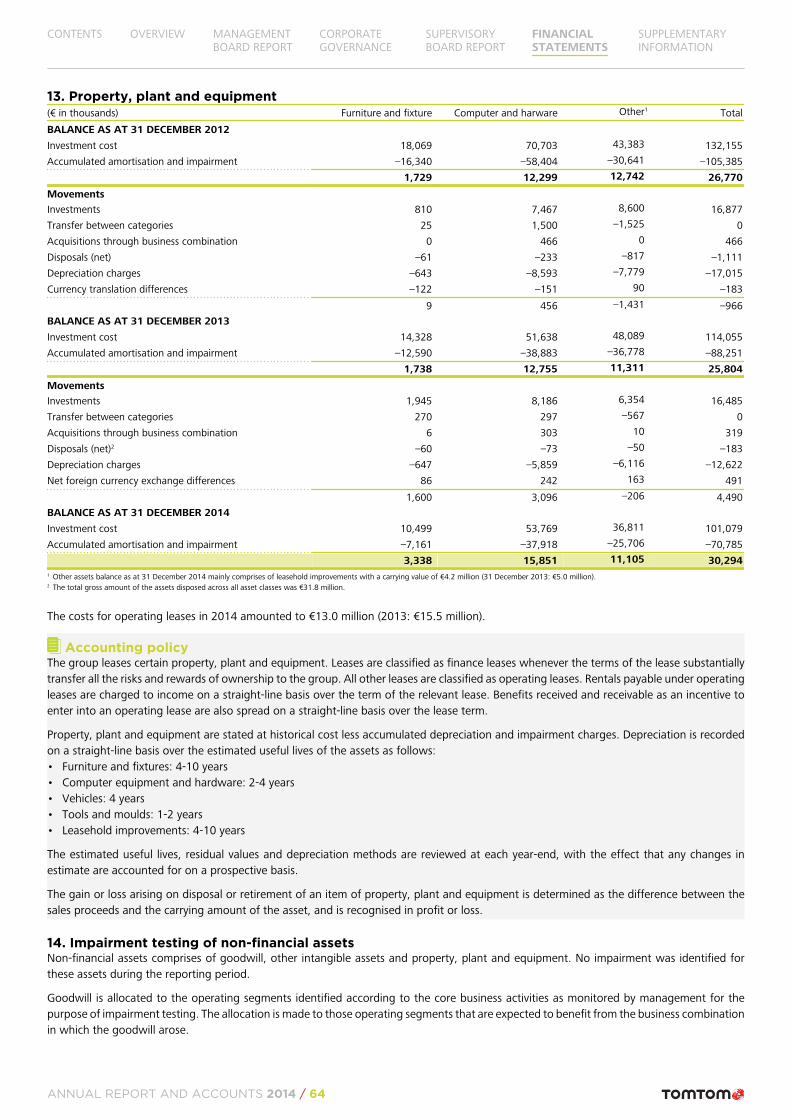
13. Property, plant and equipment(€ in thousands) Furniture and fixture Computer and harware Other1 Total
BALANCE AS AT 31 DECEMBER 2012
Investment cost 18,069 70,703 43,383 132,155
Accumulated amortisation and impairment –16,340 –58,404 –30,641 –105,385
1,729 12,299 12,742 26,770
Movements
Investments 810 7,467 8,600 16,877
Transfer between categories 25 1,500 –1,525 0
Acquisitions through business combination 0 466 0 466
Disposals (net) –61 –233 –817 –1,111
Depreciation charges –643 –8,593 –7,779 –17,015
Currency translation differences –122 –151 90 –183
9 456 –1,431 –966
BALANCE AS AT 31 DECEMBER 2013
Investment cost 14,328 51,638 48,089 114,055
Accumulated amortisation and impairment –12,590 –38,883 –36,778 –88,251
1,738 12,755 11,311 25,804
Movements
Investments 1,945 8,186 6,354 16,485
Transfer between categories 270 297 –567 0
Acquisitions through business combination 6 303 10 319
Disposals (net)2 –60 –73 –50 –183
Depreciation charges –647 –5,859 –6,116 –12,622
Net foreign currency exchange differences 86 242 163 491
1,600 3,096 –206 4,490
BALANCE AS AT 31 DECEMBER 2014
Investment cost 10,499 53,769 36,811 101,079
Accumulated amortisation and impairment –7,161 –37,918 –25,706 –70,785
3,338 15,851 11,105 30,2941 Other assets balance as at 31 December 2014 mainly comprises of leasehold improvements with a carrying value of €4.2 million (31 December 2013: €5.0 million).2 The total gross amount of the assets disposed across all asset classes was €31.8 million.
The costs for operating leases in 2014 amounted to €13.0 million (2013: €15.5 million).
Accounting policyThe group leases certain property, plant and equipment. Leases are classified as finance leases whenever the terms of the lease substantiallytransfer all the risks and rewards of ownership to the group. All other leases are classified as operating leases. Rentals payable under operatingleases are charged to income on a straight-line basis over the term of the relevant lease. Benefits received and receivable as an incentive toenter into an operating lease are also spread on a straight-line basis over the lease term.
Property, plant and equipment are stated at historical cost less accumulated depreciation and impairment charges. Depreciation is recordedon a straight-line basis over the estimated useful lives of the assets as follows:• Furniture and fixtures: 4-10 years• Computer equipment and hardware: 2-4 years• Vehicles: 4 years• Tools and moulds: 1-2 years• Leasehold improvements: 4-10 years
The estimated useful lives, residual values and depreciation methods are reviewed at each year-end, with the effect that any changes inestimate are accounted for on a prospective basis.
The gain or loss arising on disposal or retirement of an item of property, plant and equipment is determined as the difference between thesales proceeds and the carrying amount of the asset, and is recognised in profit or loss.
14. Impairment testing of non-financial assetsNon-financial assets comprises of goodwill, other intangible assets and property, plant and equipment. No impairment was identified forthese assets during the reporting period.
Goodwill is allocated to the operating segments identified according to the core business activities as monitored by management for thepurpose of impairment testing. The allocation is made to those operating segments that are expected to benefit from the business combinationin which the goodwill arose.
CONTENTS OVERVIEW MANAGEMENTBOARD REPORT
CORPORATEGOVERNANCE
SUPERVISORYBOARD REPORT
FINANCIALSTATEMENTS
SUPPLEMENTARYINFORMATION
ANNUAL REPORT AND ACCOUNTS 2014 / 64
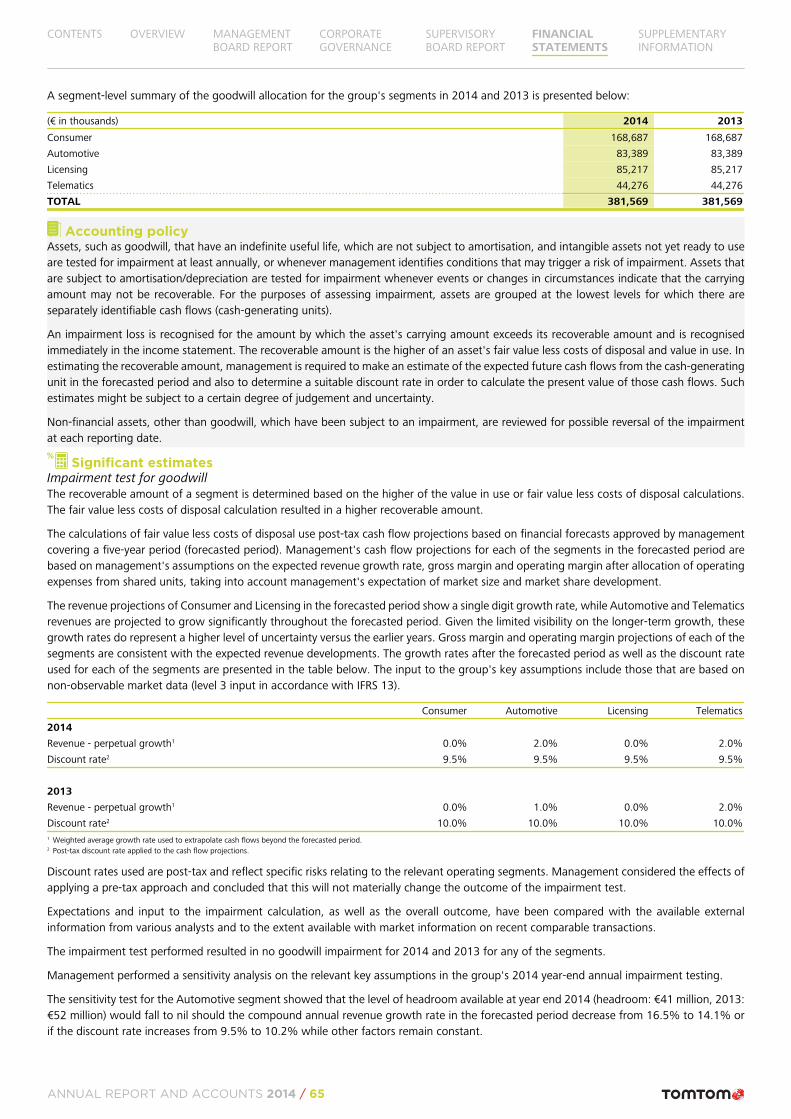
A segment-level summary of the goodwill allocation for the group's segments in 2014 and 2013 is presented below:
(€ in thousands) 2014 2013
Consumer 168,687 168,687
Automotive 83,389 83,389
Licensing 85,217 85,217
Telematics 44,276 44,276
TOTAL 381,569 381,569
Accounting policyAssets, such as goodwill, that have an indefinite useful life, which are not subject to amortisation, and intangible assets not yet ready to useare tested for impairment at least annually, or whenever management identifies conditions that may trigger a risk of impairment. Assets thatare subject to amortisation/depreciation are tested for impairment whenever events or changes in circumstances indicate that the carryingamount may not be recoverable. For the purposes of assessing impairment, assets are grouped at the lowest levels for which there areseparately identifiable cash flows (cash-generating units).
An impairment loss is recognised for the amount by which the asset's carrying amount exceeds its recoverable amount and is recognisedimmediately in the income statement. The recoverable amount is the higher of an asset's fair value less costs of disposal and value in use. Inestimating the recoverable amount, management is required to make an estimate of the expected future cash flows from the cash-generatingunit in the forecasted period and also to determine a suitable discount rate in order to calculate the present value of those cash flows. Suchestimates might be subject to a certain degree of judgement and uncertainty.
Non-financial assets, other than goodwill, which have been subject to an impairment, are reviewed for possible reversal of the impairmentat each reporting date.
Significant estimatesImpairment test for goodwillThe recoverable amount of a segment is determined based on the higher of the value in use or fair value less costs of disposal calculations.The fair value less costs of disposal calculation resulted in a higher recoverable amount.
The calculations of fair value less costs of disposal use post-tax cash flow projections based on financial forecasts approved by managementcovering a five-year period (forecasted period). Management's cash flow projections for each of the segments in the forecasted period arebased on management's assumptions on the expected revenue growth rate, gross margin and operating margin after allocation of operatingexpenses from shared units, taking into account management's expectation of market size and market share development.
The revenue projections of Consumer and Licensing in the forecasted period show a single digit growth rate, while Automotive and Telematicsrevenues are projected to grow significantly throughout the forecasted period. Given the limited visibility on the longer-term growth, thesegrowth rates do represent a higher level of uncertainty versus the earlier years. Gross margin and operating margin projections of each of thesegments are consistent with the expected revenue developments. The growth rates after the forecasted period as well as the discount rateused for each of the segments are presented in the table below. The input to the group's key assumptions include those that are based onnon-observable market data (level 3 input in accordance with IFRS 13).
Consumer Automotive Licensing Telematics
2014
Revenue - perpetual growth1 0.0% 2.0% 0.0% 2.0%
Discount rate2 9.5% 9.5% 9.5% 9.5%
2013
Revenue - perpetual growth1 0.0% 1.0% 0.0% 2.0%
Discount rate2 10.0% 10.0% 10.0% 10.0%1 Weighted average growth rate used to extrapolate cash flows beyond the forecasted period.2 Post-tax discount rate applied to the cash flow projections.
Discount rates used are post-tax and reflect specific risks relating to the relevant operating segments. Management considered the effects ofapplying a pre-tax approach and concluded that this will not materially change the outcome of the impairment test.
Expectations and input to the impairment calculation, as well as the overall outcome, have been compared with the available externalinformation from various analysts and to the extent available with market information on recent comparable transactions.
The impairment test performed resulted in no goodwill impairment for 2014 and 2013 for any of the segments.
Management performed a sensitivity analysis on the relevant key assumptions in the group's 2014 year-end annual impairment testing.
The sensitivity test for the Automotive segment showed that the level of headroom available at year end 2014 (headroom: €41 million, 2013:€52 million) would fall to nil should the compound annual revenue growth rate in the forecasted period decrease from 16.5% to 14.1% orif the discount rate increases from 9.5% to 10.2% while other factors remain constant.
CONTENTS OVERVIEW MANAGEMENTBOARD REPORT
CORPORATEGOVERNANCE
SUPERVISORYBOARD REPORT
FINANCIALSTATEMENTS
SUPPLEMENTARYINFORMATION
ANNUAL REPORT AND ACCOUNTS 2014 / 65
The sensitivity test for the Licensing segment showed that the level of headroom available at year-end 2014 (headroom: €104 million, 2013:€64 million) would fall to nil should the compound annual revenue growth rate in the forecasted period decrease from 7.4% to 3.5% whileother factors remain constant. A reasonably possible change in either the perpetual revenue growth rate or discount rate would not reducethe headroom to nil.
For Consumer and Telematics, a reasonably possible change in any of the abovementioned key assumptions as well as other assumptions inthe forecasted period would not cause the fair value less costs of disposal of either unit to fall below the level of their respective carryingvalue.
15. Business combinations2014In 2014, the group made several acquisitions for an aggregate consideration of €22.0 million. This consideration includes cash considerationsas well as an estimate of contingent consideration, which has been determined based on certain financial and non-financial key performanceindicators.
The main acquisitions were the acquisitions of DAMS Tracking in France on 1 June 2014 and Fleetlogic in the Netherlands on 1 December2014. Both companies are fleet management service providers which in aggregate added approximately 54,000 subscribers to our Telematicssubscribers' base.
The Fleetlogic acquisition was effectuated through the acquisition of 100% equity interest of the companies: Fleetlogic BV and Inalise BV,while DAMS Tracking was acquired through a sale and asset purchase agreement.
The main assets and liabilities that arose from all acquisitions combined were intangible assets of €24.5 million and deferred tax liabilities of€3.7 million. None of the acquisitions resulted in goodwill. The fair value of the assets and liabilities acquired have been determined usingdiscounted cash flow technique, which includes inputs that are not based on observable market data (level 3 input).
The acquired businesses contributed a revenue of €3.2 million and a net loss of €0.8 million in 2014. Excluding the impact of the acquisition-related amortisation from the purchase price allocations, the contributed result in 2014 was a net profit of €0.1 million. If the group hadacquired all companies from 1 January 2014, the group revenue and net result for 2014 would have been €961 million and €20 millionrespectively.
As none of the transactions are material individually, they are not disclosed separately in accordance with IFRS 3.
2013In 2013, the group acquired a 100% equity interest in Coordina (Gestion Electronica Logistica, S.L.) and 51% in mapIT for an aggregatedconsideration of €15.1 million. This consideration includes a cash consideration as well as an estimated contingent consideration, which hasbeen determined based on certain financial and non-financial key performance indicators.
mapIT is a South Africa-based associate company, in which the group previously held a 49% interest. With this acquisition, which was effectivefrom 1 June 2013, the group gained full control over mapIT. The previously held 49% interest has been remeasured to its fair value, resultingin a gain of €2.5 million, which is included under the line 'Result of associates' in the income statement.
Coordina, which was acquired on 31 July 2013, is the largest fleet management service provider in Spain and has a broad local sales networkand a well-established local service hub. This acquisition will enable us to deliver the group’s innovative and easy-to-use products incombination with the group's TomTom WEBFLEET SaaS services to more Spanish fleets faster.
The main assets and liabilities that arose from both acquisitions combined were intangible assets of €18.3 million, deferred tax assets of €0.7million and deferred tax liabilities of €5.3 million. Neither acquisition resulted in goodwill.
The acquired businesses contributed a revenue of €3.8 million and a net loss of €0.7 million in 2013. Excluding the impact of the acquisition-related amortisation from the purchase price allocations, the contributed result in 2013 was a net profit €0.4 million. If the group had acquiredboth companies from 1 January 2013, the group revenue and net result for 2013 would have been €968 million and €21 million respectively.
As neither transaction is material individually, they are not disclosed separately in accordance with IFRS 3.
Accounting policyThe group applies the acquisition method to account for business combinations. The consideration transferred for the acquisition of asubsidiary is the fair value of the assets transferred, the liabilities incurred to the former owners of the acquiree and the equity interests issuedby the group. The consideration transferred includes the fair value of any asset or liability resulting from a contingent considerationarrangement. Acquisition-related costs are expensed as incurred.
Identifiable assets acquired and liabilities and contingent liabilities assumed in a business combination are measured initially at their fair valuesat the acquisition date. The group recognises any non-controlling interest in the acquiree on an acquisition-by-acquisition basis, either at fairvalue or at the non-controlling interest's proportionate share of the recognised amounts of acquiree's identifiable net assets.
Acquisition of additional interest in associates, which results in the group gaining control over the associate, is accounted for as a businesscombination. The previously held interest in the associate is considered as part of the consideration and hence is remeasured to its fair value.
CONTENTS OVERVIEW MANAGEMENTBOARD REPORT
CORPORATEGOVERNANCE
SUPERVISORYBOARD REPORT
FINANCIALSTATEMENTS
SUPPLEMENTARYINFORMATION
ANNUAL REPORT AND ACCOUNTS 2014 / 66
The gain or loss from this remeasurement is included in the 'Result of associates' in the income statement. The associate is accounted for asa subsidiary and included in the consolidated financial statements from the date the control passes to the group.
16. Investments in associatesAs at 31 December 2014, the group held interest in a number of associates: Cyient Ltd. ('Cyient', 2013: Infotech Enterprises Ltd.), BeijingGolden Tom Information Technology Co. Ltd. (Beijing Golden Tom) and WayTag (Pty) Ltd. (WayTag). Cyient provides content developmentand support services while Beijing Golden Tom provides support in licensing TomTom map and traffic content in the Chinese market. WayTagis a South Africa-based company that allows people and businesses to create a unique location identifier that either refers to a fixed locationor to an individual's current location.
The movements in the investments in associates can be specified as follows:
(€ in thousands) 2014 2013
BALANCE AS AT 1 JANUARY 2,854 3,880
Result of associates1 536 3,091
Transfer to subsidiary2 0 –2,957
Dividend received –117 –1,036
Other direct equity movements 16 –124
BALANCE AS AT 31 DECEMBER 3,289 2,8541 Total comprehensive income equalled the net results of the associates as there were no other items recognised in 'Other comprehensive income' of the associates. The 2013 result included a gain of €2.5 million
relating to remeasurement of previously held interest in mapIT to its fair value.2 Following the acquisition of 51% interest in mapIT in 2013, this associate company is included as a subsidiary in the consolidated financial statements from 2013.
As the associates are not material to the group, no further information is provided other than those detailed below. The (estimated) full yearrevenues and net profits of the associates and their assets (excluding goodwill) and liabilities are as follows:
Name of associate Country of incorporation Assets Liabilities Revenue Net result Interest held(€ in thousands) (%)
2014
Cyient Ltd. (prev. Infotech Ent. Ltd.)1 India 255,243 46,954 287,021 34,339 1.35%
Beijing Golden Tom China 788 1,489 1,124 –637 49.00%
WayTag South Africa 106 596 0 –1,200 16.00%
2013
Infotech Enterprises Ltd.1 India 189,492 33,879 220,454 27,195 1.35%
Beijing Golden Tom China 5,878 5,401 1,524 –636 49.00%
WayTag South Africa 167 41 0 –271 16.00%1 This associate has a 31 March year-end. Data for calculating the result of associate, based on the equity method, is obtained from January through to December. The summarised financial information presented
above is based on financial statements for the year ending 31 March 2014 and 31 March 2013.
Cyient and WayTag are regarded as associates as TomTom is represented on their Board of Directors. The fair value of the investment in Cyientis €10.1 million (2013: €6.2 million).
Accounting policyAssociates are all entities over which the group has significant influence but not control, generally accompanying a shareholding of between20% and 50% of the voting rights, or other evidence of significant influence. Investments in associates are accounted for using the equitymethod of accounting, and are initially recognised at cost. The group's investment in associates includes goodwill identified on acquisition,net of any accumulated impairment loss.
The group's share of its associates' post-acquisition profits or losses is recognised in the income statement, and its share of post-acquisitionmovements in 'Other comprehensive income' is recognised in 'Other comprehensive income'. The cumulative post-acquisition movementsare adjusted against the carrying amount of the investment. When the group's share of losses in an associate equals or exceeds its interestin the associate, including any other unsecured receivables, the group does not recognise further losses, unless it has incurred obligations ormade payments on behalf of the associate. Unrealised gains on transactions between the group and its associates are eliminated to the extentof the group's interest in the associates. Unrealised losses are also eliminated, unless the transaction provides evidence of an impairment ofthe asset transferred. Accounting policy of associates has been changed where necessary to ensure consistency with the policy adopted bythe group.
CONTENTS OVERVIEW MANAGEMENTBOARD REPORT
CORPORATEGOVERNANCE
SUPERVISORYBOARD REPORT
FINANCIALSTATEMENTS
SUPPLEMENTARYINFORMATION
ANNUAL REPORT AND ACCOUNTS 2014 / 67
SECTION 4 WORKING CAPITALThe notes in this section specify items that form part of group’s working capital. Disclosure on cash and cash equivalents is included in thissection.
17. Inventories(€ in thousands) 2014 2013
Finished goods 24,632 21,492
Components and sub-assemblies 21,943 20,768
INVENTORIES 46,575 42,260
The amount of inventories recognised as an expense when the inventories are sold and included in cost of sales amounted to €319 million(2013: €320 million).
As a result of the write-down of inventories to their net realisable value, the group recognised a cost of €3.1 million (2013: €2.7 million). Thecosts are included in cost of sales.
Accounting policyInventories are stated at the lower of cost and net realisable value. The cost of inventories comprises costs of purchase, assembly and conversionto finished products. The cost of inventories is determined using the first-in, first-out (FIFO) method, net of reserves for obsolescence and anyexcess stock. Net realisable value represents the estimated selling price less an estimate of the costs of completion and direct selling costs.
18. Trade receivables(€ in thousands) 2014 2013
Gross accounts receivables 136,812 118,546
Allowance for doubtful receivables –3,546 –3,117
TRADE RECEIVABLES (NET) 133,266 115,429
The group expects to recover all receivables within a year. An allowance has been made for estimated unrecoverable amounts from the saleof goods. The carrying amount of trade receivables approximates their fair value. The group does not hold any collateral over these balances.
The group's exposure to credit risk is influenced mainly by the individual characteristics of each customer. There is some concentration ofcredit risk with certain of the group's large customers' accounts. Management actively monitors the credit risk related to these customersand takes pro-active action to reduce credit limits if required.
The following table summarises the movement in the allowance for doubtful trade receivables account:
(€ in thousands) 2014 2013
BALANCE AS AT 1 JANUARY –3,117 –1,863
Additional receivables impairment –1,321 –2,567
Receivables written off during the year as uncollectible 837 410
Unused amounts reversed 15 654
Translation effects 40 249
BALANCE AS AT 31 DECEMBER –3,546 –3,117
The following table sets out details of the age of trade accounts receivable that are not overdue, as the payment terms specified in the termsand conditions established with the group's customers have not been exceeded, and an analysis of overdue amounts and related provisionsfor doubtful trade accounts receivable:
(€ in thousands) 2014 2013
Of which:
Not overdue 118,289 94,883
Overdue < 3 months 13,422 20,594
3 to 6 months 2,826 1,463
Over 6 months 2,275 1,606
less provision –3,546 –3,117
TRADE RECEIVABLES (NET) 133,266 115,429
The provisions recorded in 2014 and 2013 are mainly related to the overdue amounts.
CONTENTS OVERVIEW MANAGEMENTBOARD REPORT
CORPORATEGOVERNANCE
SUPERVISORYBOARD REPORT
FINANCIALSTATEMENTS
SUPPLEMENTARYINFORMATION
ANNUAL REPORT AND ACCOUNTS 2014 / 68
Trade accounts receivable include amounts denominated in the following major currencies:
(€ in thousands) 2014 2013
EUR 71,358 57,146
GBP 24,785 12,507
USD 22,914 33,193
Other 14,209 12,583
TRADE RECEIVABLES (NET) 133,266 115,429
Accounting policyTrade receivables are initially recognised at fair value, and subsequently measured at amortised cost (if the time value is material), using theeffective interest method, less provision for impairment. A provision for impairment of trade receivables is established when there is objectiveevidence that the group will not be able to collect all amounts due, according to the original terms of the receivables. The amount of theprovision is the difference between the asset's carrying amount and the present value of estimated future cash flows, discounted at the originaleffective interest rate. The carrying amount of the asset is reduced through the use of an allowance account and the amount of the loss isrecognised in the income statement within 'Cost of sales'. When a trade receivable is uncollectible, it is written off against the allowanceaccount for trade receivables. Subsequent recoveries of amounts previously written off are credited against 'Cost of sales' in the incomestatement.
19. Other receivables and prepayments(€ in thousands) 2014 2013
Prepayments 12,673 6,247
VAT and other taxes 3,389 6,551
Unbilled revenue 9,475 11,057
Deferred cost of sales 4,721 10,969
Other receivables 2,940 3,297
TOTAL OTHER RECEIVABLES 33,198 38,121
The carrying amount of the other receivables and prepayments approximates their fair value.
20. Other financial assets/liabilitiesOther financial assets/liabilities include derivative financial instruments carried at fair value through profit or loss.
2014 2013(€ in thousands) Assets Liabilities Assets Liabilities
Derivatives at fair value through profit or loss 1,186 –23 376 –236
The notional principal amounts of the outstanding forward foreign exchange and option contracts on 31 December 2014 were €54 million(2013: €69 million).
All the group's outstanding options and forwards have a contractual maturity of less than one year.
Accounting policyDerivatives are initially and subsequently measured at fair value. Gains or losses arising from changes in fair value of derivatives are recognisedin the income statement, except for derivatives designated as hedging instruments, in a highly effective hedge relationship, for which cashflow hedge accounting is applied. Transaction costs are expensed in the income statement.
21. Cash and cash equivalents(€ in thousands) 2014 2013
Cash and equivalents 148,614 119,361
Deposits 4,335 138,424
TOTAL CASH AND CASH EQUIVALENTS 152,949 257,785
Cash and cash equivalents consist of cash held by the group partly invested in short-term bank deposits with an original maturity of threemonths or less. The carrying amount of cash and cash equivalents approximates its fair value.
All cash and cash equivalents are available for immediate use by the group.
Accounting policyCash and cash equivalents are stated at face value and comprise cash on hand, deposits held on call with banks, and other short-term highlyliquid investments that are readily convertible to a known amount of cash and subject to an insignificant risk of changes in value.
CONTENTS OVERVIEW MANAGEMENTBOARD REPORT
CORPORATEGOVERNANCE
SUPERVISORYBOARD REPORT
FINANCIALSTATEMENTS
SUPPLEMENTARYINFORMATION
ANNUAL REPORT AND ACCOUNTS 2014 / 69
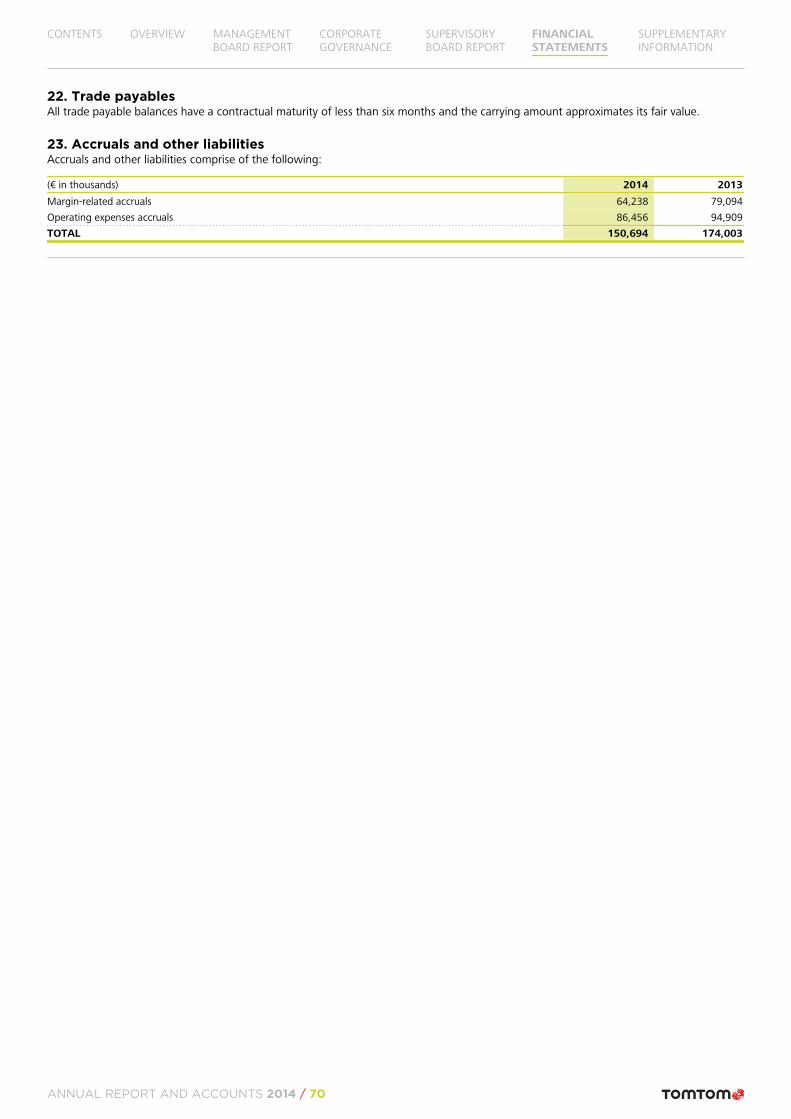
22. Trade payablesAll trade payable balances have a contractual maturity of less than six months and the carrying amount approximates its fair value.
23. Accruals and other liabilitiesAccruals and other liabilities comprise of the following:
(€ in thousands) 2014 2013
Margin-related accruals 64,238 79,094
Operating expenses accruals 86,456 94,909
TOTAL 150,694 174,003
CONTENTS OVERVIEW MANAGEMENTBOARD REPORT
CORPORATEGOVERNANCE
SUPERVISORYBOARD REPORT
FINANCIALSTATEMENTS
SUPPLEMENTARYINFORMATION
ANNUAL REPORT AND ACCOUNTS 2014 / 70
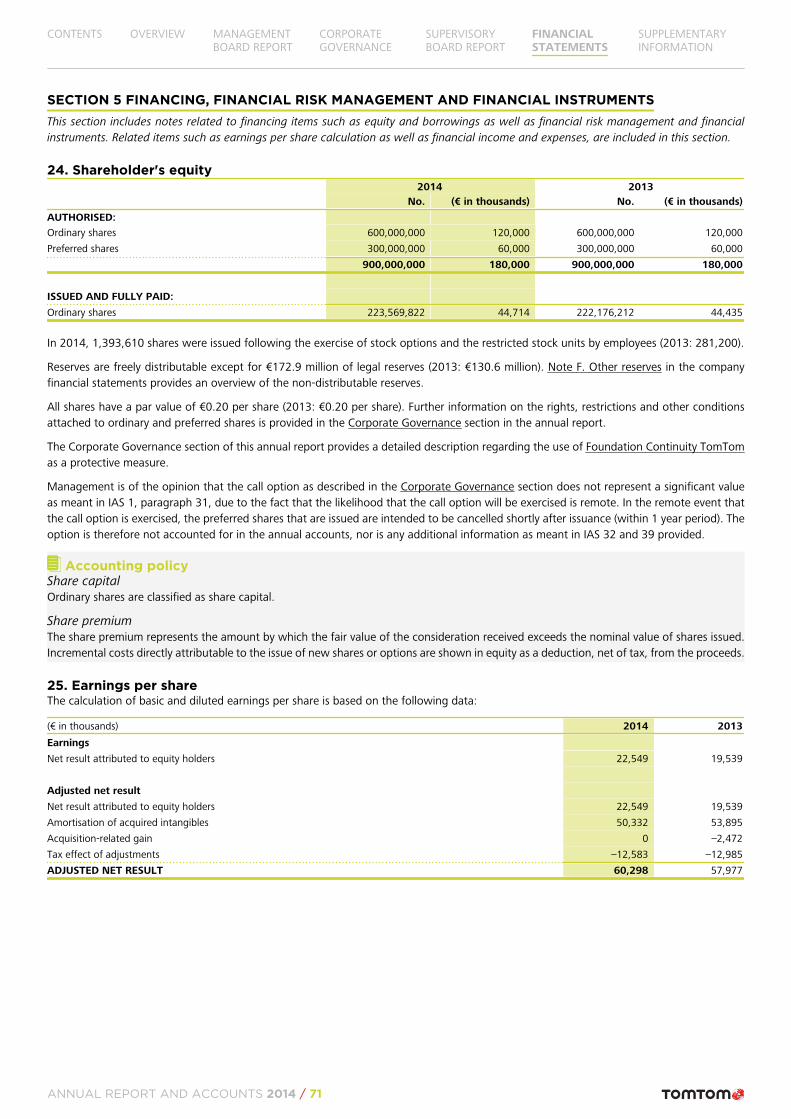
SECTION 5 FINANCING, FINANCIAL RISK MANAGEMENT AND FINANCIAL INSTRUMENTSThis section includes notes related to financing items such as equity and borrowings as well as financial risk management and financialinstruments. Related items such as earnings per share calculation as well as financial income and expenses, are included in this section.
24. Shareholder's equity2014 2013
No. (€ in thousands) No. (€ in thousands)
AUTHORISED:
Ordinary shares 600,000,000 120,000 600,000,000 120,000
Preferred shares 300,000,000 60,000 300,000,000 60,000
900,000,000 180,000 900,000,000 180,000
ISSUED AND FULLY PAID:
Ordinary shares 223,569,822 44,714 222,176,212 44,435
In 2014, 1,393,610 shares were issued following the exercise of stock options and the restricted stock units by employees (2013: 281,200).
Reserves are freely distributable except for €172.9 million of legal reserves (2013: €130.6 million). Note F. Other reserves in the companyfinancial statements provides an overview of the non-distributable reserves.
All shares have a par value of €0.20 per share (2013: €0.20 per share). Further information on the rights, restrictions and other conditionsattached to ordinary and preferred shares is provided in the Corporate Governance section in the annual report.
The Corporate Governance section of this annual report provides a detailed description regarding the use of Foundation Continuity TomTomas a protective measure.
Management is of the opinion that the call option as described in the Corporate Governance section does not represent a significant valueas meant in IAS 1, paragraph 31, due to the fact that the likelihood that the call option will be exercised is remote. In the remote event thatthe call option is exercised, the preferred shares that are issued are intended to be cancelled shortly after issuance (within 1 year period). Theoption is therefore not accounted for in the annual accounts, nor is any additional information as meant in IAS 32 and 39 provided.
Accounting policyShare capitalOrdinary shares are classified as share capital.
Share premiumThe share premium represents the amount by which the fair value of the consideration received exceeds the nominal value of shares issued.Incremental costs directly attributable to the issue of new shares or options are shown in equity as a deduction, net of tax, from the proceeds.
25. Earnings per shareThe calculation of basic and diluted earnings per share is based on the following data:
(€ in thousands) 2014 2013
Earnings
Net result attributed to equity holders 22,549 19,539
Adjusted net result
Net result attributed to equity holders 22,549 19,539
Amortisation of acquired intangibles 50,332 53,895
Acquisition-related gain 0 –2,472
Tax effect of adjustments –12,583 –12,985
ADJUSTED NET RESULT 60,298 57,977
CONTENTS OVERVIEW MANAGEMENTBOARD REPORT
CORPORATEGOVERNANCE
SUPERVISORYBOARD REPORT
FINANCIALSTATEMENTS
SUPPLEMENTARYINFORMATION
ANNUAL REPORT AND ACCOUNTS 2014 / 71
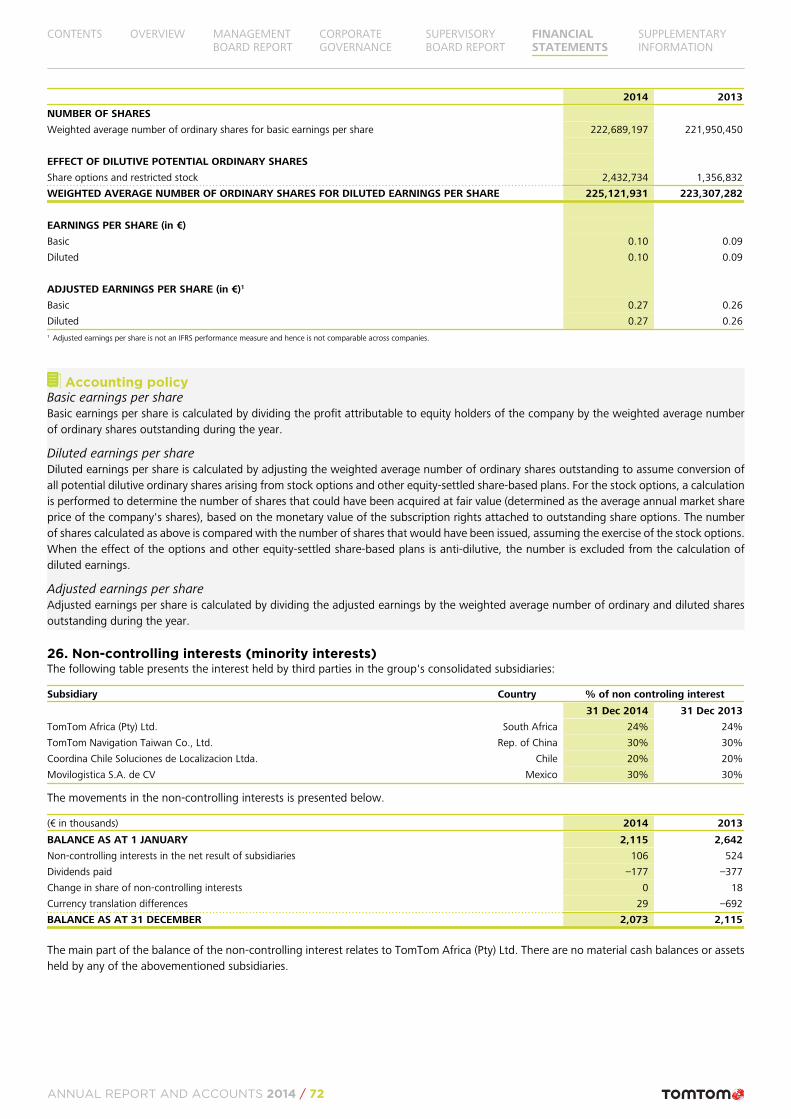
2014 2013
NUMBER OF SHARES
Weighted average number of ordinary shares for basic earnings per share 222,689,197 221,950,450
EFFECT OF DILUTIVE POTENTIAL ORDINARY SHARES
Share options and restricted stock 2,432,734 1,356,832
WEIGHTED AVERAGE NUMBER OF ORDINARY SHARES FOR DILUTED EARNINGS PER SHARE 225,121,931 223,307,282
EARNINGS PER SHARE (in €)
Basic 0.10 0.09
Diluted 0.10 0.09
ADJUSTED EARNINGS PER SHARE (in €)1
Basic 0.27 0.26
Diluted 0.27 0.261 Adjusted earnings per share is not an IFRS performance measure and hence is not comparable across companies.
Accounting policyBasic earnings per shareBasic earnings per share is calculated by dividing the profit attributable to equity holders of the company by the weighted average numberof ordinary shares outstanding during the year.
Diluted earnings per shareDiluted earnings per share is calculated by adjusting the weighted average number of ordinary shares outstanding to assume conversion ofall potential dilutive ordinary shares arising from stock options and other equity-settled share-based plans. For the stock options, a calculationis performed to determine the number of shares that could have been acquired at fair value (determined as the average annual market shareprice of the company's shares), based on the monetary value of the subscription rights attached to outstanding share options. The numberof shares calculated as above is compared with the number of shares that would have been issued, assuming the exercise of the stock options.When the effect of the options and other equity-settled share-based plans is anti-dilutive, the number is excluded from the calculation ofdiluted earnings.
Adjusted earnings per shareAdjusted earnings per share is calculated by dividing the adjusted earnings by the weighted average number of ordinary and diluted sharesoutstanding during the year.
26. Non-controlling interests (minority interests)The following table presents the interest held by third parties in the group's consolidated subsidiaries:
Subsidiary Country % of non controling interest
31 Dec 2014 31 Dec 2013
TomTom Africa (Pty) Ltd. South Africa 24% 24%
TomTom Navigation Taiwan Co., Ltd. Rep. of China 30% 30%
Coordina Chile Soluciones de Localizacion Ltda. Chile 20% 20%
Movilogistica S.A. de CV Mexico 30% 30%
The movements in the non-controlling interests is presented below.
(€ in thousands) 2014 2013
BALANCE AS AT 1 JANUARY 2,115 2,642
Non-controlling interests in the net result of subsidiaries 106 524
Dividends paid –177 –377
Change in share of non-controlling interests 0 18
Currency translation differences 29 –692
BALANCE AS AT 31 DECEMBER 2,073 2,115
The main part of the balance of the non-controlling interest relates to TomTom Africa (Pty) Ltd. There are no material cash balances or assetsheld by any of the abovementioned subsidiaries.
CONTENTS OVERVIEW MANAGEMENTBOARD REPORT
CORPORATEGOVERNANCE
SUPERVISORYBOARD REPORT
FINANCIALSTATEMENTS
SUPPLEMENTARYINFORMATION
ANNUAL REPORT AND ACCOUNTS 2014 / 72
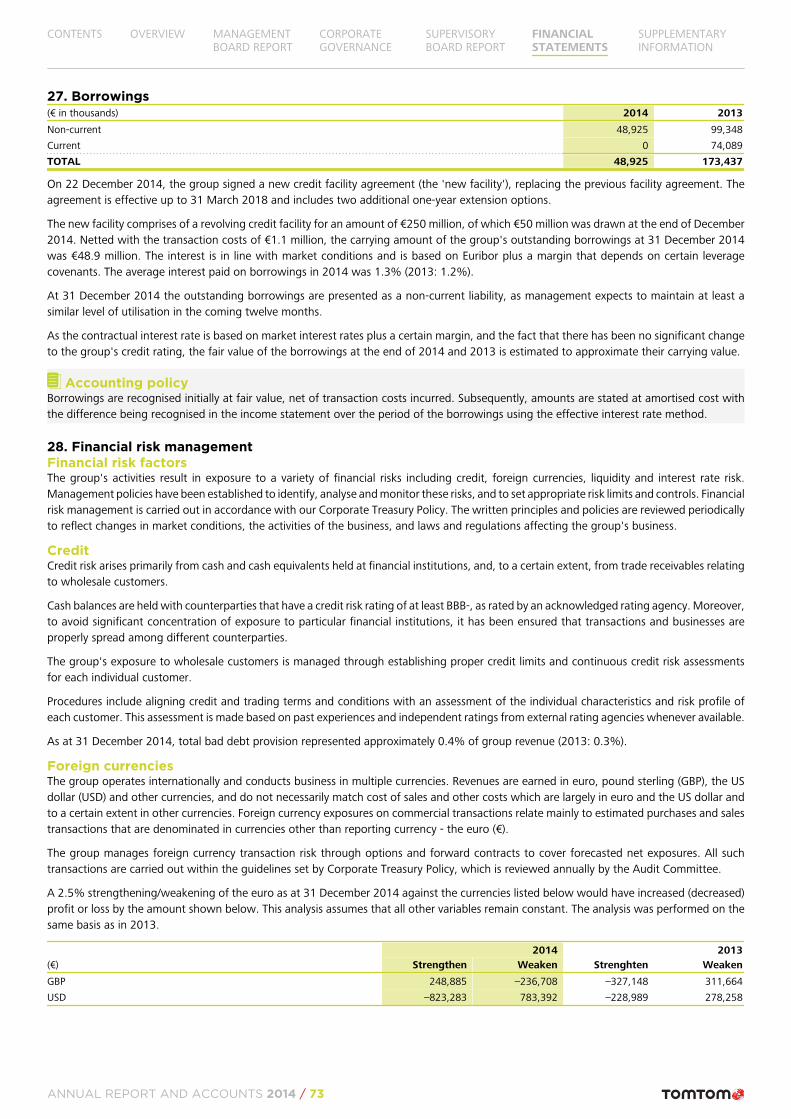
27. Borrowings(€ in thousands) 2014 2013
Non-current 48,925 99,348
Current 0 74,089
TOTAL 48,925 173,437
On 22 December 2014, the group signed a new credit facility agreement (the 'new facility'), replacing the previous facility agreement. Theagreement is effective up to 31 March 2018 and includes two additional one-year extension options.
The new facility comprises of a revolving credit facility for an amount of €250 million, of which €50 million was drawn at the end of December2014. Netted with the transaction costs of €1.1 million, the carrying amount of the group's outstanding borrowings at 31 December 2014was €48.9 million. The interest is in line with market conditions and is based on Euribor plus a margin that depends on certain leveragecovenants. The average interest paid on borrowings in 2014 was 1.3% (2013: 1.2%).
At 31 December 2014 the outstanding borrowings are presented as a non-current liability, as management expects to maintain at least asimilar level of utilisation in the coming twelve months.
As the contractual interest rate is based on market interest rates plus a certain margin, and the fact that there has been no significant changeto the group's credit rating, the fair value of the borrowings at the end of 2014 and 2013 is estimated to approximate their carrying value.
Accounting policyBorrowings are recognised initially at fair value, net of transaction costs incurred. Subsequently, amounts are stated at amortised cost withthe difference being recognised in the income statement over the period of the borrowings using the effective interest rate method.
28. Financial risk managementFinancial risk factorsThe group's activities result in exposure to a variety of financial risks including credit, foreign currencies, liquidity and interest rate risk.Management policies have been established to identify, analyse and monitor these risks, and to set appropriate risk limits and controls. Financialrisk management is carried out in accordance with our Corporate Treasury Policy. The written principles and policies are reviewed periodicallyto reflect changes in market conditions, the activities of the business, and laws and regulations affecting the group's business.
CreditCredit risk arises primarily from cash and cash equivalents held at financial institutions, and, to a certain extent, from trade receivables relatingto wholesale customers.
Cash balances are held with counterparties that have a credit risk rating of at least BBB-, as rated by an acknowledged rating agency. Moreover,to avoid significant concentration of exposure to particular financial institutions, it has been ensured that transactions and businesses areproperly spread among different counterparties.
The group's exposure to wholesale customers is managed through establishing proper credit limits and continuous credit risk assessmentsfor each individual customer.
Procedures include aligning credit and trading terms and conditions with an assessment of the individual characteristics and risk profile ofeach customer. This assessment is made based on past experiences and independent ratings from external rating agencies whenever available.
As at 31 December 2014, total bad debt provision represented approximately 0.4% of group revenue (2013: 0.3%).
Foreign currenciesThe group operates internationally and conducts business in multiple currencies. Revenues are earned in euro, pound sterling (GBP), the USdollar (USD) and other currencies, and do not necessarily match cost of sales and other costs which are largely in euro and the US dollar andto a certain extent in other currencies. Foreign currency exposures on commercial transactions relate mainly to estimated purchases and salestransactions that are denominated in currencies other than reporting currency - the euro (€).
The group manages foreign currency transaction risk through options and forward contracts to cover forecasted net exposures. All suchtransactions are carried out within the guidelines set by Corporate Treasury Policy, which is reviewed annually by the Audit Committee.
A 2.5% strengthening/weakening of the euro as at 31 December 2014 against the currencies listed below would have increased (decreased)profit or loss by the amount shown below. This analysis assumes that all other variables remain constant. The analysis was performed on thesame basis as in 2013.
2014 2013(€) Strengthen Weaken Strenghten Weaken
GBP 248,885 –236,708 –327,148 311,664
USD –823,283 783,392 –228,989 278,258
CONTENTS OVERVIEW MANAGEMENTBOARD REPORT
CORPORATEGOVERNANCE
SUPERVISORYBOARD REPORT
FINANCIALSTATEMENTS
SUPPLEMENTARYINFORMATION
ANNUAL REPORT AND ACCOUNTS 2014 / 73
Liquidity and loan covenantThe approach to managing liquidity is to ensure that sufficient funds are available to meet financial obligations when they fall due under bothnormal and stressed conditions, without incurring unacceptable losses or risking damage to the group's reputation.
To ensure there is sufficient cash to meet expected operational expenses, including the servicing of financial obligations, actual and futurecash flow requirements are regularly monitored, taking into account the maturity profiles of financial assets and liabilities and the rollingforecast of the group's liquidity reserve, which comprises cash and cash equivalents and an undrawn credit facility of €200 million.
Under the covenants of the facility, the group is required to meet certain performance indicators with regard to its interest cover (4.0) andleverage ratio (3.0), which are tested twice a year. Interest cover is defined as the ratio of the last twelve months (LTM) EBITDA to LTM interestexpense for the relevant test period. The leverage ratio is defined as the ratio of total consolidated net debt as at the testing date to theconsolidated LTM EBITDA in respect of the relevant period ending on that date. In case of a breach of these covenants, the banks arecontractually entitled to request early repayment of the outstanding amount. On 31 December 2014, the group complied with the loancovenants and, based on the group's plan for 2015, management expects to be able to comply with the loan covenants during 2015.
The outstanding borrowings of €50 million from the credit facility has a one-month maturity period from the date of draw down but cancontinuously be rolled-over up to the end date of the facility agreement at management's discretion. Assuming the amount utilised remainsthe same until the end of the agreement and the level of market interest as well as the required performance indicators remain constant basedon the situation as at 31 December 2014, the annual interest due up to 31 March 2018 would be €0.4 million.
Interest ratesInterest rate risk arises primarily from the existing long-term borrowings. These borrowings have a floating interest coupon based on Euriborplus a spread that depends on leverage levels. Interest rate risk is hedged with appropriate hedging instruments whenever deemed necessaryin accordance with the Corporate Treasury Policy.
Based on the expectation of interest rate movements in the coming period and the acceptability of potential exposure, the current policy isnot to hedge the interest rate of current borrowings. Accordingly, changes in Euribor may have an impact on the group's results for thecoming year.
Market-related interest income is received on the cash balances. Our intention is to prioritise capital preservation and when possible we investour surplus cash using approved investment instruments, such as bank deposits and money market fund investments. All transactions andcounterparty risk limits are governed by Corporate Treasury Policy.
Capital risk managementThe group's financing policy aims to maintain a capital structure that enables the group to achieve its strategic objectives and daily operationalneeds, and to safeguard the group's ability to continue as a going concern.
In order to maintain or adjust the capital structure, the group may issue new shares, adjust its dividend policy, return capital to shareholdersor sell assets to reduce debt, taking into account relevant interest cover and leverage covenants of external borrowings as disclosed above.
As at 31 December 2014, the group had a net cash position of €103 million (31 December 2013: €83 million).
Further quantitative disclosures are included throughout these consolidated financial statements.
CONTENTS OVERVIEW MANAGEMENTBOARD REPORT
CORPORATEGOVERNANCE
SUPERVISORYBOARD REPORT
FINANCIALSTATEMENTS
SUPPLEMENTARYINFORMATION
ANNUAL REPORT AND ACCOUNTS 2014 / 74
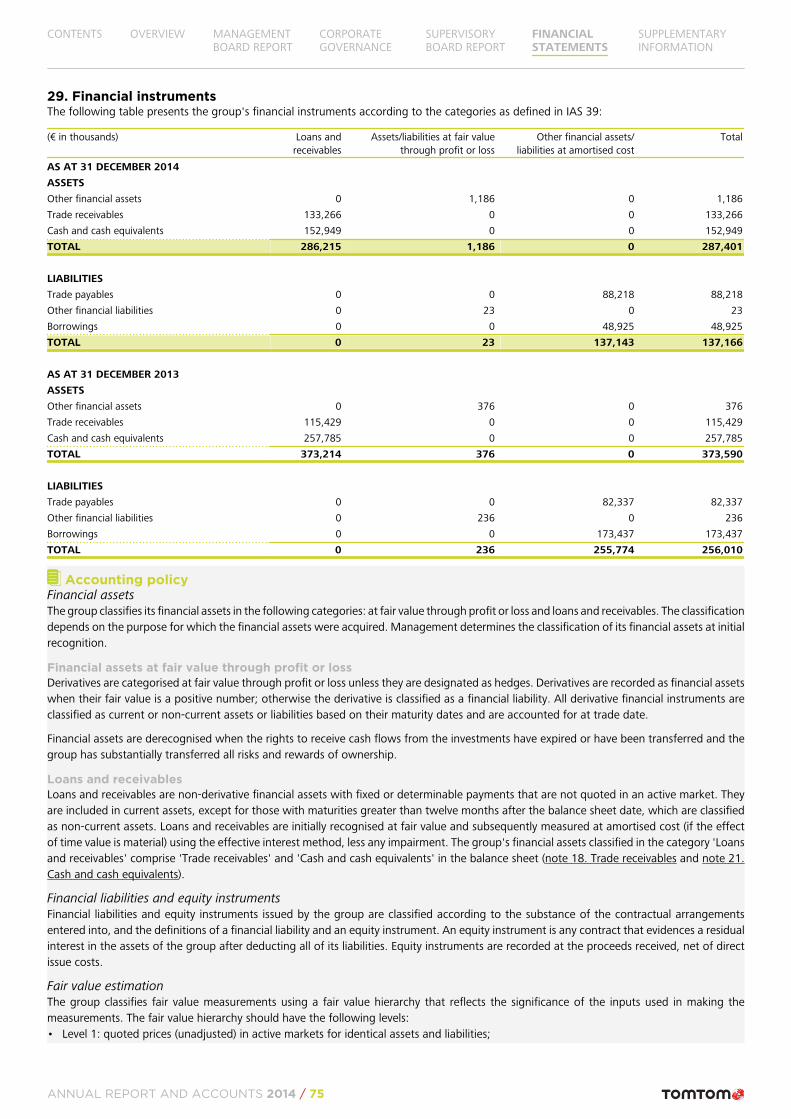
29. Financial instrumentsThe following table presents the group's financial instruments according to the categories as defined in IAS 39:
(€ in thousands) Loans andreceivables
Assets/liabilities at fair valuethrough profit or loss
Other financial assets/liabilities at amortised cost
Total
AS AT 31 DECEMBER 2014
ASSETS
Other financial assets 0 1,186 0 1,186
Trade receivables 133,266 0 0 133,266
Cash and cash equivalents 152,949 0 0 152,949
TOTAL 286,215 1,186 0 287,401
LIABILITIES
Trade payables 0 0 88,218 88,218
Other financial liabilities 0 23 0 23
Borrowings 0 0 48,925 48,925
TOTAL 0 23 137,143 137,166
AS AT 31 DECEMBER 2013
ASSETS
Other financial assets 0 376 0 376
Trade receivables 115,429 0 0 115,429
Cash and cash equivalents 257,785 0 0 257,785
TOTAL 373,214 376 0 373,590
LIABILITIES
Trade payables 0 0 82,337 82,337
Other financial liabilities 0 236 0 236
Borrowings 0 0 173,437 173,437
TOTAL 0 236 255,774 256,010
Accounting policyFinancial assetsThe group classifies its financial assets in the following categories: at fair value through profit or loss and loans and receivables. The classificationdepends on the purpose for which the financial assets were acquired. Management determines the classification of its financial assets at initialrecognition.
Financial assets at fair value through profit or lossDerivatives are categorised at fair value through profit or loss unless they are designated as hedges. Derivatives are recorded as financial assetswhen their fair value is a positive number; otherwise the derivative is classified as a financial liability. All derivative financial instruments areclassified as current or non-current assets or liabilities based on their maturity dates and are accounted for at trade date.
Financial assets are derecognised when the rights to receive cash flows from the investments have expired or have been transferred and thegroup has substantially transferred all risks and rewards of ownership.
Loans and receivablesLoans and receivables are non-derivative financial assets with fixed or determinable payments that are not quoted in an active market. Theyare included in current assets, except for those with maturities greater than twelve months after the balance sheet date, which are classifiedas non-current assets. Loans and receivables are initially recognised at fair value and subsequently measured at amortised cost (if the effectof time value is material) using the effective interest method, less any impairment. The group's financial assets classified in the category 'Loansand receivables' comprise 'Trade receivables' and 'Cash and cash equivalents' in the balance sheet (note 18. Trade receivables and note 21.Cash and cash equivalents).
Financial liabilities and equity instrumentsFinancial liabilities and equity instruments issued by the group are classified according to the substance of the contractual arrangementsentered into, and the definitions of a financial liability and an equity instrument. An equity instrument is any contract that evidences a residualinterest in the assets of the group after deducting all of its liabilities. Equity instruments are recorded at the proceeds received, net of directissue costs.
Fair value estimationThe group classifies fair value measurements using a fair value hierarchy that reflects the significance of the inputs used in making themeasurements. The fair value hierarchy should have the following levels:• Level 1: quoted prices (unadjusted) in active markets for identical assets and liabilities;
CONTENTS OVERVIEW MANAGEMENTBOARD REPORT
CORPORATEGOVERNANCE
SUPERVISORYBOARD REPORT
FINANCIALSTATEMENTS
SUPPLEMENTARYINFORMATION
ANNUAL REPORT AND ACCOUNTS 2014 / 75
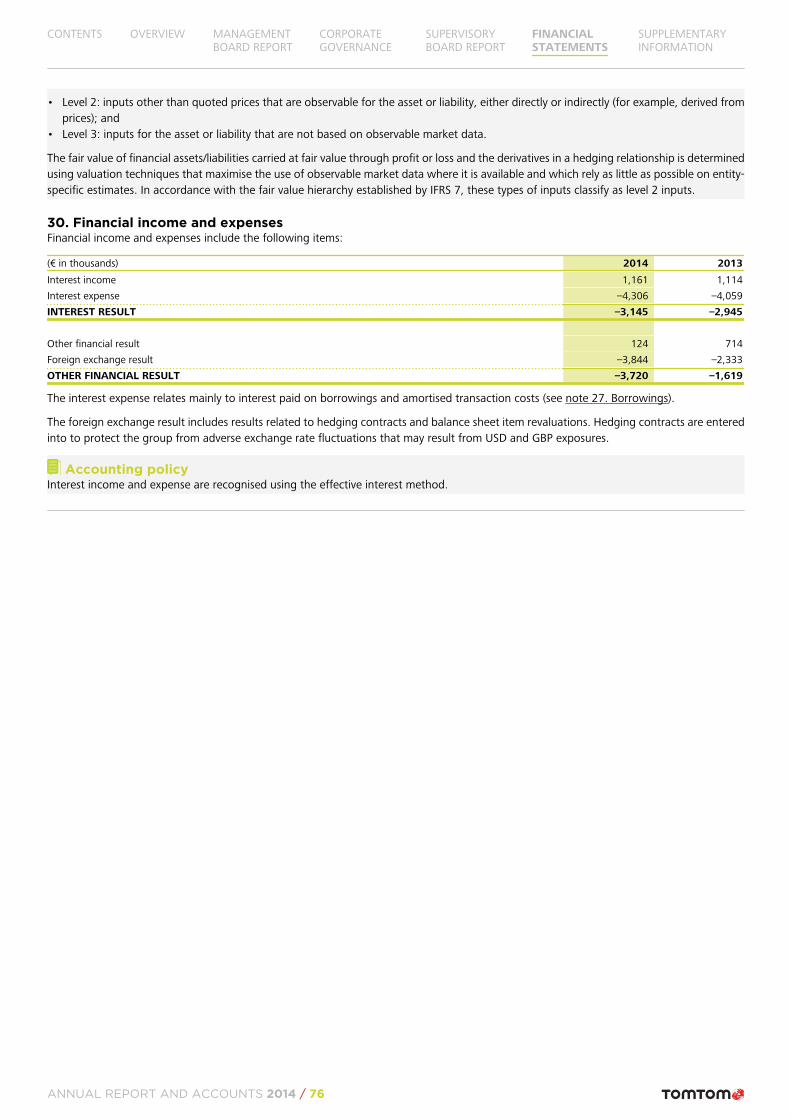
• Level 2: inputs other than quoted prices that are observable for the asset or liability, either directly or indirectly (for example, derived fromprices); and
• Level 3: inputs for the asset or liability that are not based on observable market data.
The fair value of financial assets/liabilities carried at fair value through profit or loss and the derivatives in a hedging relationship is determinedusing valuation techniques that maximise the use of observable market data where it is available and which rely as little as possible on entity-specific estimates. In accordance with the fair value hierarchy established by IFRS 7, these types of inputs classify as level 2 inputs.
30. Financial income and expensesFinancial income and expenses include the following items:
(€ in thousands) 2014 2013
Interest income 1,161 1,114
Interest expense –4,306 –4,059
INTEREST RESULT –3,145 –2,945
Other financial result 124 714
Foreign exchange result –3,844 –2,333
OTHER FINANCIAL RESULT –3,720 –1,619
The interest expense relates mainly to interest paid on borrowings and amortised transaction costs (see note 27. Borrowings).
The foreign exchange result includes results related to hedging contracts and balance sheet item revaluations. Hedging contracts are enteredinto to protect the group from adverse exchange rate fluctuations that may result from USD and GBP exposures.
Accounting policyInterest income and expense are recognised using the effective interest method.
CONTENTS OVERVIEW MANAGEMENTBOARD REPORT
CORPORATEGOVERNANCE
SUPERVISORYBOARD REPORT
FINANCIALSTATEMENTS
SUPPLEMENTARYINFORMATION
ANNUAL REPORT AND ACCOUNTS 2014 / 76
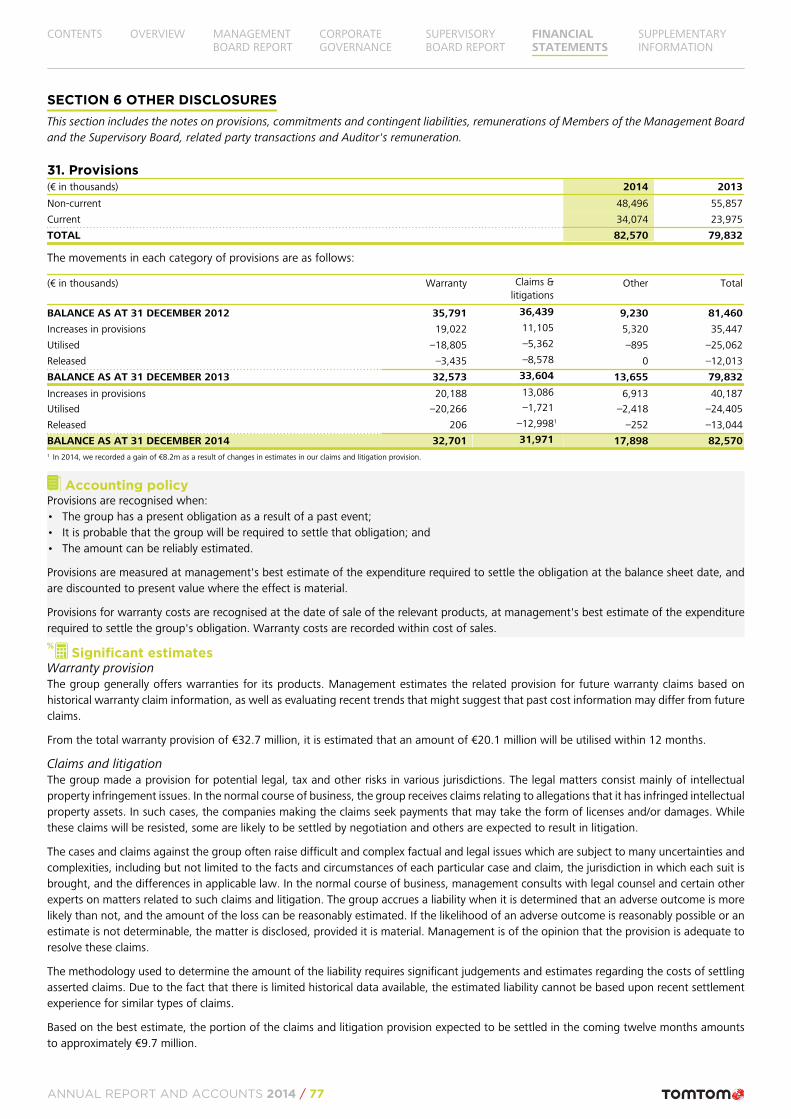
SECTION 6 OTHER DISCLOSURESThis section includes the notes on provisions, commitments and contingent liabilities, remunerations of Members of the Management Boardand the Supervisory Board, related party transactions and Auditor's remuneration.
31. Provisions(€ in thousands) 2014 2013
Non-current 48,496 55,857
Current 34,074 23,975
TOTAL 82,570 79,832
The movements in each category of provisions are as follows:
(€ in thousands) Warranty Claims &litigations
Other Total
BALANCE AS AT 31 DECEMBER 2012 35,791 36,439 9,230 81,460
Increases in provisions 19,022 11,105 5,320 35,447
Utilised –18,805 –5,362 –895 –25,062
Released –3,435 –8,578 0 –12,013
BALANCE AS AT 31 DECEMBER 2013 32,573 33,604 13,655 79,832
Increases in provisions 20,188 13,086 6,913 40,187
Utilised –20,266 –1,721 –2,418 –24,405
Released 206 –12,9981 –252 –13,044
BALANCE AS AT 31 DECEMBER 2014 32,701 31,971 17,898 82,5701 In 2014, we recorded a gain of €8.2m as a result of changes in estimates in our claims and litigation provision.
Accounting policyProvisions are recognised when:• The group has a present obligation as a result of a past event;• It is probable that the group will be required to settle that obligation; and• The amount can be reliably estimated.
Provisions are measured at management's best estimate of the expenditure required to settle the obligation at the balance sheet date, andare discounted to present value where the effect is material.
Provisions for warranty costs are recognised at the date of sale of the relevant products, at management's best estimate of the expenditurerequired to settle the group's obligation. Warranty costs are recorded within cost of sales.
Significant estimatesWarranty provisionThe group generally offers warranties for its products. Management estimates the related provision for future warranty claims based onhistorical warranty claim information, as well as evaluating recent trends that might suggest that past cost information may differ from futureclaims.
From the total warranty provision of €32.7 million, it is estimated that an amount of €20.1 million will be utilised within 12 months.
Claims and litigationThe group made a provision for potential legal, tax and other risks in various jurisdictions. The legal matters consist mainly of intellectualproperty infringement issues. In the normal course of business, the group receives claims relating to allegations that it has infringed intellectualproperty assets. In such cases, the companies making the claims seek payments that may take the form of licenses and/or damages. Whilethese claims will be resisted, some are likely to be settled by negotiation and others are expected to result in litigation.
The cases and claims against the group often raise difficult and complex factual and legal issues which are subject to many uncertainties andcomplexities, including but not limited to the facts and circumstances of each particular case and claim, the jurisdiction in which each suit isbrought, and the differences in applicable law. In the normal course of business, management consults with legal counsel and certain otherexperts on matters related to such claims and litigation. The group accrues a liability when it is determined that an adverse outcome is morelikely than not, and the amount of the loss can be reasonably estimated. If the likelihood of an adverse outcome is reasonably possible or anestimate is not determinable, the matter is disclosed, provided it is material. Management is of the opinion that the provision is adequate toresolve these claims.
The methodology used to determine the amount of the liability requires significant judgements and estimates regarding the costs of settlingasserted claims. Due to the fact that there is limited historical data available, the estimated liability cannot be based upon recent settlementexperience for similar types of claims.
Based on the best estimate, the portion of the claims and litigation provision expected to be settled in the coming twelve months amountsto approximately €9.7 million.
CONTENTS OVERVIEW MANAGEMENTBOARD REPORT
CORPORATEGOVERNANCE
SUPERVISORYBOARD REPORT
FINANCIALSTATEMENTS
SUPPLEMENTARYINFORMATION
ANNUAL REPORT AND ACCOUNTS 2014 / 77
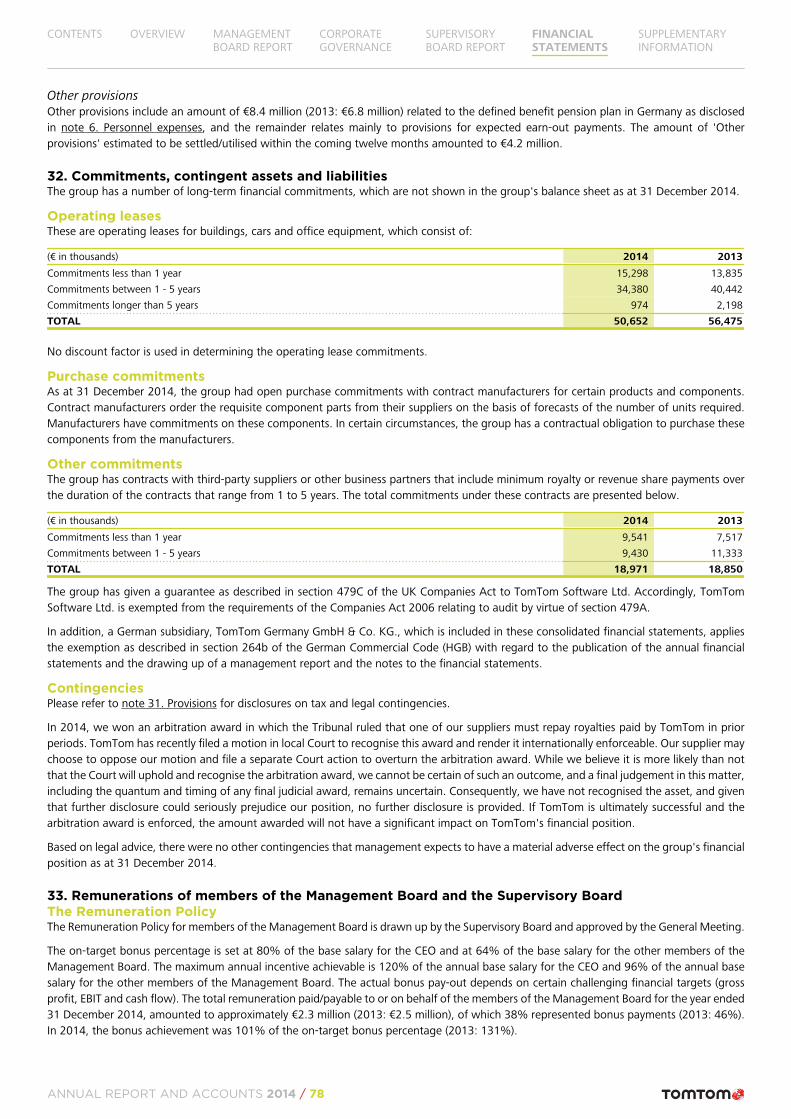
Other provisionsOther provisions include an amount of €8.4 million (2013: €6.8 million) related to the defined benefit pension plan in Germany as disclosedin note 6. Personnel expenses, and the remainder relates mainly to provisions for expected earn-out payments. The amount of 'Otherprovisions' estimated to be settled/utilised within the coming twelve months amounted to €4.2 million.
32. Commitments, contingent assets and liabilitiesThe group has a number of long-term financial commitments, which are not shown in the group's balance sheet as at 31 December 2014.
Operating leasesThese are operating leases for buildings, cars and office equipment, which consist of:
(€ in thousands) 2014 2013
Commitments less than 1 year 15,298 13,835
Commitments between 1 - 5 years 34,380 40,442
Commitments longer than 5 years 974 2,198
TOTAL 50,652 56,475
No discount factor is used in determining the operating lease commitments.
Purchase commitmentsAs at 31 December 2014, the group had open purchase commitments with contract manufacturers for certain products and components.Contract manufacturers order the requisite component parts from their suppliers on the basis of forecasts of the number of units required.Manufacturers have commitments on these components. In certain circumstances, the group has a contractual obligation to purchase thesecomponents from the manufacturers.
Other commitmentsThe group has contracts with third-party suppliers or other business partners that include minimum royalty or revenue share payments overthe duration of the contracts that range from 1 to 5 years. The total commitments under these contracts are presented below.
(€ in thousands) 2014 2013
Commitments less than 1 year 9,541 7,517
Commitments between 1 - 5 years 9,430 11,333
TOTAL 18,971 18,850
The group has given a guarantee as described in section 479C of the UK Companies Act to TomTom Software Ltd. Accordingly, TomTomSoftware Ltd. is exempted from the requirements of the Companies Act 2006 relating to audit by virtue of section 479A.
In addition, a German subsidiary, TomTom Germany GmbH & Co. KG., which is included in these consolidated financial statements, appliesthe exemption as described in section 264b of the German Commercial Code (HGB) with regard to the publication of the annual financialstatements and the drawing up of a management report and the notes to the financial statements.
ContingenciesPlease refer to note 31. Provisions for disclosures on tax and legal contingencies.
In 2014, we won an arbitration award in which the Tribunal ruled that one of our suppliers must repay royalties paid by TomTom in priorperiods. TomTom has recently filed a motion in local Court to recognise this award and render it internationally enforceable. Our supplier maychoose to oppose our motion and file a separate Court action to overturn the arbitration award. While we believe it is more likely than notthat the Court will uphold and recognise the arbitration award, we cannot be certain of such an outcome, and a final judgement in this matter,including the quantum and timing of any final judicial award, remains uncertain. Consequently, we have not recognised the asset, and giventhat further disclosure could seriously prejudice our position, no further disclosure is provided. If TomTom is ultimately successful and thearbitration award is enforced, the amount awarded will not have a significant impact on TomTom's financial position.
Based on legal advice, there were no other contingencies that management expects to have a material adverse effect on the group's financialposition as at 31 December 2014.
33. Remunerations of members of the Management Board and the Supervisory BoardThe Remuneration PolicyThe Remuneration Policy for members of the Management Board is drawn up by the Supervisory Board and approved by the General Meeting.
The on-target bonus percentage is set at 80% of the base salary for the CEO and at 64% of the base salary for the other members of theManagement Board. The maximum annual incentive achievable is 120% of the annual base salary for the CEO and 96% of the annual basesalary for the other members of the Management Board. The actual bonus pay-out depends on certain challenging financial targets (grossprofit, EBIT and cash flow). The total remuneration paid/payable to or on behalf of the members of the Management Board for the year ended31 December 2014, amounted to approximately €2.3 million (2013: €2.5 million), of which 38% represented bonus payments (2013: 46%).In 2014, the bonus achievement was 101% of the on-target bonus percentage (2013: 131%).
CONTENTS OVERVIEW MANAGEMENTBOARD REPORT
CORPORATEGOVERNANCE
SUPERVISORYBOARD REPORT
FINANCIALSTATEMENTS
SUPPLEMENTARYINFORMATION
ANNUAL REPORT AND ACCOUNTS 2014 / 78
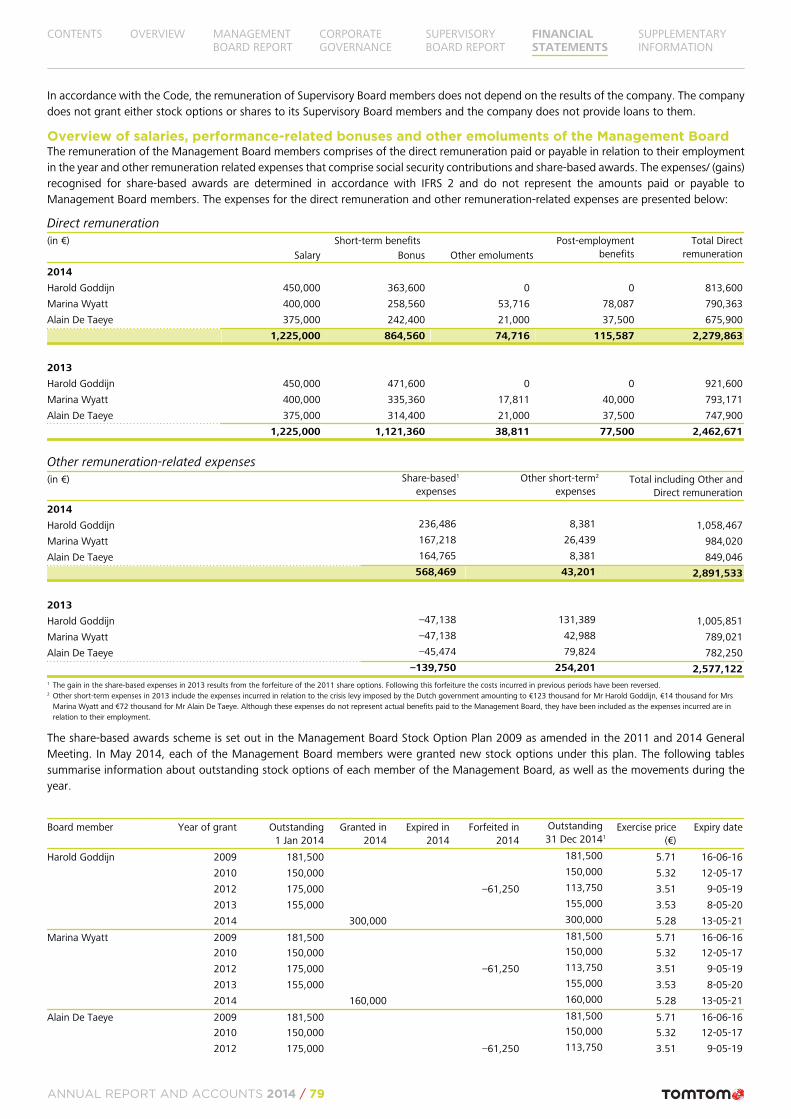
In accordance with the Code, the remuneration of Supervisory Board members does not depend on the results of the company. The companydoes not grant either stock options or shares to its Supervisory Board members and the company does not provide loans to them.
Overview of salaries, performance-related bonuses and other emoluments of the Management BoardThe remuneration of the Management Board members comprises of the direct remuneration paid or payable in relation to their employmentin the year and other remuneration related expenses that comprise social security contributions and share-based awards. The expenses/ (gains)recognised for share-based awards are determined in accordance with IFRS 2 and do not represent the amounts paid or payable toManagement Board members. The expenses for the direct remuneration and other remuneration-related expenses are presented below:
Direct remuneration(in €) Short-term benefits Post-employment
benefitsTotal Direct
remunerationSalary Bonus Other emoluments
2014
Harold Goddijn 450,000 363,600 0 0 813,600
Marina Wyatt 400,000 258,560 53,716 78,087 790,363
Alain De Taeye 375,000 242,400 21,000 37,500 675,900
1,225,000 864,560 74,716 115,587 2,279,863
2013
Harold Goddijn 450,000 471,600 0 0 921,600
Marina Wyatt 400,000 335,360 17,811 40,000 793,171
Alain De Taeye 375,000 314,400 21,000 37,500 747,900
1,225,000 1,121,360 38,811 77,500 2,462,671
Other remuneration-related expenses(in €) Share-based
expenses
1 Other short-termexpenses
2 Total including Other andDirect remuneration
2014
Harold Goddijn 236,486 8,381 1,058,467
Marina Wyatt 167,218 26,439 984,020
Alain De Taeye 164,765 8,381 849,046568,469 43,201 2,891,533
2013
Harold Goddijn –47,138 131,389 1,005,851
Marina Wyatt –47,138 42,988 789,021
Alain De Taeye –45,474 79,824 782,250–139,750 254,201 2,577,122
1 The gain in the share-based expenses in 2013 results from the forfeiture of the 2011 share options. Following this forfeiture the costs incurred in previous periods have been reversed.2 Other short-term expenses in 2013 include the expenses incurred in relation to the crisis levy imposed by the Dutch government amounting to €123 thousand for Mr Harold Goddijn, €14 thousand for Mrs
Marina Wyatt and €72 thousand for Mr Alain De Taeye. Although these expenses do not represent actual benefits paid to the Management Board, they have been included as the expenses incurred are inrelation to their employment.
The share-based awards scheme is set out in the Management Board Stock Option Plan 2009 as amended in the 2011 and 2014 GeneralMeeting. In May 2014, each of the Management Board members were granted new stock options under this plan. The following tablessummarise information about outstanding stock options of each member of the Management Board, as well as the movements during theyear.
Board member Year of grant Outstanding1 Jan 2014
Granted in2014
Expired in2014
Forfeited in2014
Outstanding31 Dec 20141
Exercise price(€)
Expiry date
Harold Goddijn 2009 181,500 181,500 5.71 16-06-16
2010 150,000 150,000 5.32 12-05-17
2012 175,000 –61,250 113,750 3.51 9-05-19
2013 155,000 155,000 3.53 8-05-20
2014 300,000 300,000 5.28 13-05-21
Marina Wyatt 2009 181,500 181,500 5.71 16-06-16
2010 150,000 150,000 5.32 12-05-17
2012 175,000 –61,250 113,750 3.51 9-05-19
2013 155,000 155,000 3.53 8-05-20
2014 160,000 160,000 5.28 13-05-21
Alain De Taeye 2009 181,500 181,500 5.71 16-06-16
2010 150,000 150,000 5.32 12-05-17
2012 175,000 –61,250 113,750 3.51 9-05-19
CONTENTS OVERVIEW MANAGEMENTBOARD REPORT
CORPORATEGOVERNANCE
SUPERVISORYBOARD REPORT
FINANCIALSTATEMENTS
SUPPLEMENTARYINFORMATION
ANNUAL REPORT AND ACCOUNTS 2014 / 79
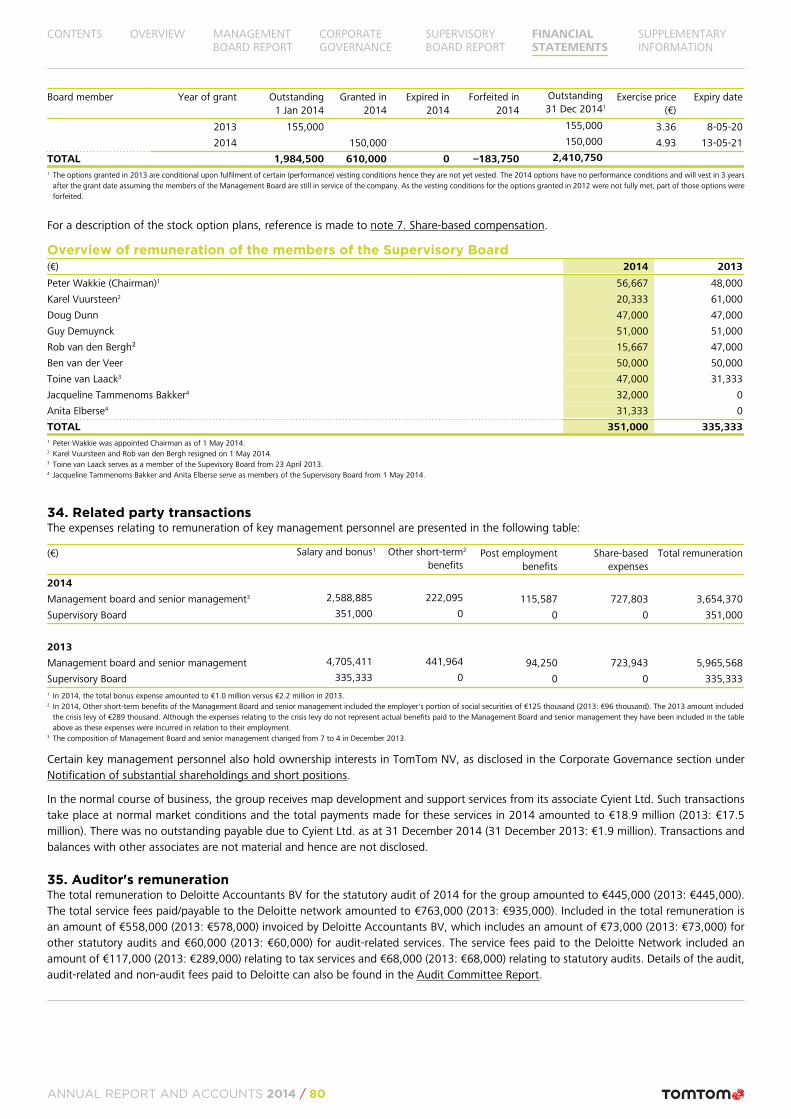
Board member Year of grant Outstanding1 Jan 2014
Granted in2014
Expired in2014
Forfeited in2014
Outstanding31 Dec 20141
Exercise price(€)
Expiry date
2013 155,000 155,000 3.36 8-05-20
2014 150,000 150,000 4.93 13-05-21
TOTAL 1,984,500 610,000 0 –183,750 2,410,7501 The options granted in 2013 are conditional upon fulfilment of certain (performance) vesting conditions hence they are not yet vested. The 2014 options have no performance conditions and will vest in 3 years
after the grant date assuming the members of the Management Board are still in service of the company. As the vesting conditions for the options granted in 2012 were not fully met, part of those options wereforfeited.
For a description of the stock option plans, reference is made to note 7. Share-based compensation.
Overview of remuneration of the members of the Supervisory Board(€) 2014 2013
Peter Wakkie (Chairman)1 56,667 48,000
Karel Vuursteen2 20,333 61,000
Doug Dunn 47,000 47,000
Guy Demuynck 51,000 51,000
Rob van den Bergh² 15,667 47,000
Ben van der Veer 50,000 50,000
Toine van Laack3 47,000 31,333
Jacqueline Tammenoms Bakker4 32,000 0
Anita Elberse4 31,333 0
TOTAL 351,000 335,3331 Peter Wakkie was appointed Chairman as of 1 May 2014.2 Karel Vuursteen and Rob van den Bergh resigned on 1 May 2014.3 Toine van Laack serves as a member of the Supevisory Board from 23 April 2013.4 Jacqueline Tammenoms Bakker and Anita Elberse serve as members of the Supervisory Board from 1 May 2014.
34. Related party transactionsThe expenses relating to remuneration of key management personnel are presented in the following table:
(€) Salary and bonus1 Other short-termbenefits
2 Post employmentbenefits
Share-basedexpenses
Total remuneration
2014
Management board and senior management3 2,588,885 222,095 115,587 727,803 3,654,370
Supervisory Board 351,000 0 0 0 351,000
2013
Management board and senior management 4,705,411 441,964 94,250 723,943 5,965,568
Supervisory Board 335,333 0 0 0 335,3331 In 2014, the total bonus expense amounted to €1.0 million versus €2.2 million in 2013.2 In 2014, Other short-term benefits of the Management Board and senior management included the employer's portion of social securities of €125 thousand (2013: €96 thousand). The 2013 amount included
the crisis levy of €289 thousand. Although the expenses relating to the crisis levy do not represent actual benefits paid to the Management Board and senior management they have been included in the tableabove as these expenses were incurred in relation to their employment.
3 The composition of Management Board and senior management changed from 7 to 4 in December 2013.
Certain key management personnel also hold ownership interests in TomTom NV, as disclosed in the Corporate Governance section underNotification of substantial shareholdings and short positions.
In the normal course of business, the group receives map development and support services from its associate Cyient Ltd. Such transactionstake place at normal market conditions and the total payments made for these services in 2014 amounted to €18.9 million (2013: €17.5million). There was no outstanding payable due to Cyient Ltd. as at 31 December 2014 (31 December 2013: €1.9 million). Transactions andbalances with other associates are not material and hence are not disclosed.
35. Auditor's remunerationThe total remuneration to Deloitte Accountants BV for the statutory audit of 2014 for the group amounted to €445,000 (2013: €445,000).The total service fees paid/payable to the Deloitte network amounted to €763,000 (2013: €935,000). Included in the total remuneration isan amount of €558,000 (2013: €578,000) invoiced by Deloitte Accountants BV, which includes an amount of €73,000 (2013: €73,000) forother statutory audits and €60,000 (2013: €60,000) for audit-related services. The service fees paid to the Deloitte Network included anamount of €117,000 (2013: €289,000) relating to tax services and €68,000 (2013: €68,000) relating to statutory audits. Details of the audit,audit-related and non-audit fees paid to Deloitte can also be found in the Audit Committee Report.
CONTENTS OVERVIEW MANAGEMENTBOARD REPORT
CORPORATEGOVERNANCE
SUPERVISORYBOARD REPORT
FINANCIALSTATEMENTS
SUPPLEMENTARYINFORMATION
ANNUAL REPORT AND ACCOUNTS 2014 / 80
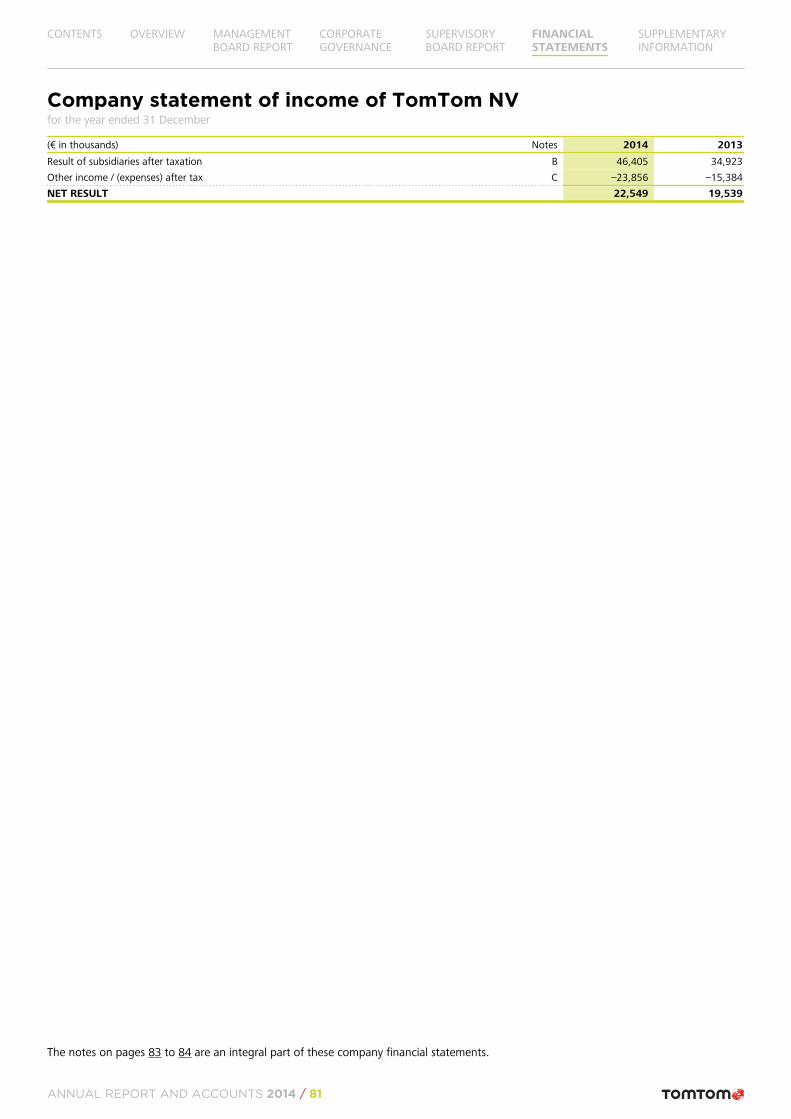
Company statement of income of TomTom NVfor the year ended 31 December
(€ in thousands) Notes 2014 2013
Result of subsidiaries after taxation B 46,405 34,923
Other income / (expenses) after tax C –23,856 –15,384
NET RESULT 22,549 19,539
The notes on pages 83 to 84 are an integral part of these company financial statements.
CONTENTS OVERVIEW MANAGEMENTBOARD REPORT
CORPORATEGOVERNANCE
SUPERVISORYBOARD REPORT
FINANCIALSTATEMENTS
SUPPLEMENTARYINFORMATION
ANNUAL REPORT AND ACCOUNTS 2014 / 81
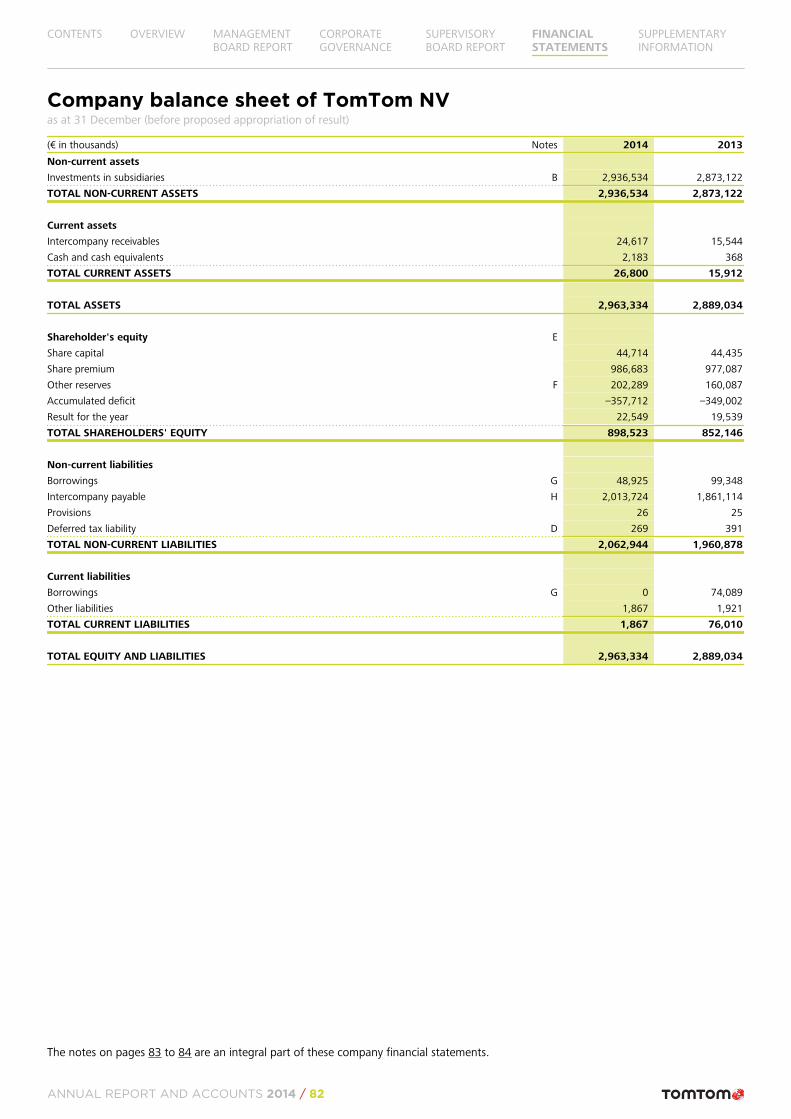
Company balance sheet of TomTom NVas at 31 December (before proposed appropriation of result)
(€ in thousands) Notes 2014 2013
Non-current assets
Investments in subsidiaries B 2,936,534 2,873,122
TOTAL NON-CURRENT ASSETS 2,936,534 2,873,122
Current assets
Intercompany receivables 24,617 15,544
Cash and cash equivalents 2,183 368
TOTAL CURRENT ASSETS 26,800 15,912
TOTAL ASSETS 2,963,334 2,889,034
Shareholder's equity E
Share capital 44,714 44,435
Share premium 986,683 977,087
Other reserves F 202,289 160,087
Accumulated deficit –357,712 –349,002
Result for the year 22,549 19,539
TOTAL SHAREHOLDERS' EQUITY 898,523 852,146
Non-current liabilities
Borrowings G 48,925 99,348
Intercompany payable H 2,013,724 1,861,114
Provisions 26 25
Deferred tax liability D 269 391
TOTAL NON-CURRENT LIABILITIES 2,062,944 1,960,878
Current liabilities
Borrowings G 0 74,089
Other liabilities 1,867 1,921
TOTAL CURRENT LIABILITIES 1,867 76,010
TOTAL EQUITY AND LIABILITIES 2,963,334 2,889,034
The notes on pages 83 to 84 are an integral part of these company financial statements.
CONTENTS OVERVIEW MANAGEMENTBOARD REPORT
CORPORATEGOVERNANCE
SUPERVISORYBOARD REPORT
FINANCIALSTATEMENTS
SUPPLEMENTARYINFORMATION
ANNUAL REPORT AND ACCOUNTS 2014 / 82
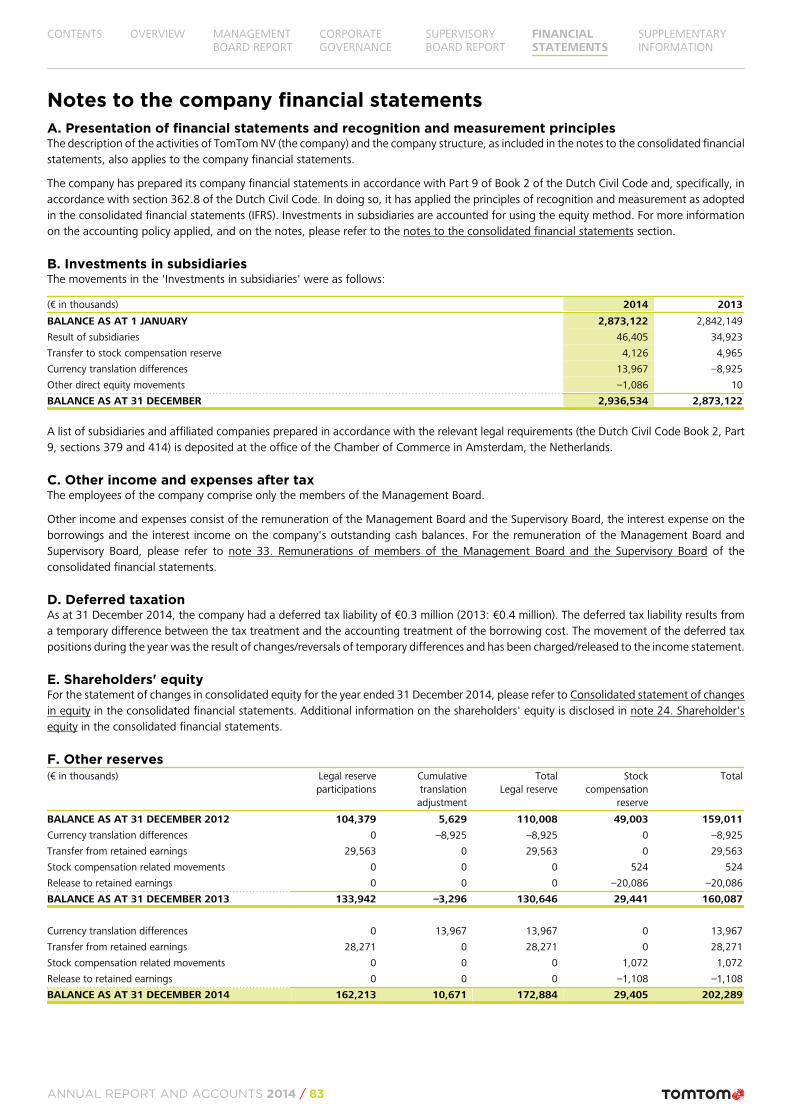
Notes to the company financial statementsA. Presentation of financial statements and recognition and measurement principlesThe description of the activities of TomTom NV (the company) and the company structure, as included in the notes to the consolidated financialstatements, also applies to the company financial statements.
The company has prepared its company financial statements in accordance with Part 9 of Book 2 of the Dutch Civil Code and, specifically, inaccordance with section 362.8 of the Dutch Civil Code. In doing so, it has applied the principles of recognition and measurement as adoptedin the consolidated financial statements (IFRS). Investments in subsidiaries are accounted for using the equity method. For more informationon the accounting policy applied, and on the notes, please refer to the notes to the consolidated financial statements section.
B. Investments in subsidiariesThe movements in the 'Investments in subsidiaries' were as follows:
(€ in thousands) 2014 2013
BALANCE AS AT 1 JANUARY 2,873,122 2,842,149
Result of subsidiaries 46,405 34,923
Transfer to stock compensation reserve 4,126 4,965
Currency translation differences 13,967 –8,925
Other direct equity movements –1,086 10
BALANCE AS AT 31 DECEMBER 2,936,534 2,873,122
A list of subsidiaries and affiliated companies prepared in accordance with the relevant legal requirements (the Dutch Civil Code Book 2, Part9, sections 379 and 414) is deposited at the office of the Chamber of Commerce in Amsterdam, the Netherlands.
C. Other income and expenses after taxThe employees of the company comprise only the members of the Management Board.
Other income and expenses consist of the remuneration of the Management Board and the Supervisory Board, the interest expense on theborrowings and the interest income on the company's outstanding cash balances. For the remuneration of the Management Board andSupervisory Board, please refer to note 33. Remunerations of members of the Management Board and the Supervisory Board of theconsolidated financial statements.
D. Deferred taxationAs at 31 December 2014, the company had a deferred tax liability of €0.3 million (2013: €0.4 million). The deferred tax liability results froma temporary difference between the tax treatment and the accounting treatment of the borrowing cost. The movement of the deferred taxpositions during the year was the result of changes/reversals of temporary differences and has been charged/released to the income statement.
E. Shareholders' equityFor the statement of changes in consolidated equity for the year ended 31 December 2014, please refer to Consolidated statement of changesin equity in the consolidated financial statements. Additional information on the shareholders' equity is disclosed in note 24. Shareholder'sequity in the consolidated financial statements.
F. Other reserves(€ in thousands) Legal reserve
participationsCumulativetranslationadjustment
TotalLegal reserve
Stockcompensation
reserve
Total
BALANCE AS AT 31 DECEMBER 2012 104,379 5,629 110,008 49,003 159,011
Currency translation differences 0 –8,925 –8,925 0 –8,925
Transfer from retained earnings 29,563 0 29,563 0 29,563
Stock compensation related movements 0 0 0 524 524
Release to retained earnings 0 0 0 –20,086 –20,086
BALANCE AS AT 31 DECEMBER 2013 133,942 –3,296 130,646 29,441 160,087
Currency translation differences 0 13,967 13,967 0 13,967
Transfer from retained earnings 28,271 0 28,271 0 28,271
Stock compensation related movements 0 0 0 1,072 1,072
Release to retained earnings 0 0 0 –1,108 –1,108
BALANCE AS AT 31 DECEMBER 2014 162,213 10,671 172,884 29,405 202,289
CONTENTS OVERVIEW MANAGEMENTBOARD REPORT
CORPORATEGOVERNANCE
SUPERVISORYBOARD REPORT
FINANCIALSTATEMENTS
SUPPLEMENTARYINFORMATION
ANNUAL REPORT AND ACCOUNTS 2014 / 83
Legal reservesLegal reserves are the non-distributable reserves that are recorded for an amount equal to the restricted reserves of the company's subsidiariesand the cumulative translation adjustment reserve.
Stock compensation reserveThe stock compensation reserve represents the cumulative expense of issued stock options that have been granted but not exercised.
G. BorrowingsPlease refer to note 27. Borrowings in the consolidated financial statements.
H. Intercompany payable'Intercompany payable' comprises of loans provided by subsidiaries. The interest rate on the loan during 2014 is based upon LIBOR plus amargin of 1.3% (2013: LIBOR plus a margin of 0.6%). Although no repayment period has been agreed the loan has a long-term nature.
I. Off-balance sheet commitmentsThe company has issued several declarations of joint and several liability for various group companies, in compliance with section 403 of Part9 of Book 2 of the Dutch Civil Code. Besides these declarations, TomTom NV has given a guarantee as described in article 479C of the UKCompanies Act for UK subsidiary TomTom Software Ltd.
In addition, a German subsidiary, TomTom Germany GmbH & Co. KG., applies the exemption as described in section 264b of the GermanCommercial Code (HGB) with regard to the publication of the annual financial statements.
The company forms a fiscal unity for corporate income tax and value added tax (VAT) purposes with several of its Dutch subsidiaries. Eachcompany within the fiscal unity is jointly and severally liable for the fiscal liability of the fiscal unity.
Amsterdam, 12 February 2015
The Management BoardHarold GoddijnMarina WyattAlain De Taeye
Amsterdam, 12 February 2015
The Supervisory BoardPeter WakkieDoug DunnGuy DemuynckBen van der VeerToine van LaackJacqueline Tammenoms BakkerAnita Elberse
TomTom NVAmsterdam
CONTENTS OVERVIEW MANAGEMENTBOARD REPORT
CORPORATEGOVERNANCE
SUPERVISORYBOARD REPORT
FINANCIALSTATEMENTS
SUPPLEMENTARYINFORMATION
ANNUAL REPORT AND ACCOUNTS 2014 / 84
Other informationStatutory provision with respect to appropriation of resultsAccording to the company's Articles of Association, the company's result is freely at the disposal of the shareholders, provided that totalshareholders' equity exceeds the called-up and paid-up capital of the company, increased by legal and statutory reserves.
Subsequent eventsThere has been no subsequent event from 31 December 2014 to the date of issue of these financial statements.
Proposed appropriation of resultThe Management Board proposes to add the net result in full to the Accumulated deficit.
Foundation Continuity TomTomFor a description of the Foundation Continuity TomTom, refer to the Corporate Governance section in this annual report.
Auditor's reportReference is made to the Independent Auditor's Report section in this annual report.
CONTENTS OVERVIEW MANAGEMENTBOARD REPORT
CORPORATEGOVERNANCE
SUPERVISORYBOARD REPORT
FINANCIALSTATEMENTS
SUPPLEMENTARYINFORMATION
ANNUAL REPORT AND ACCOUNTS 2014 / 85
Independent Auditor's ReportTo: the Shareholders and Supervisory Board of TomTom NV
Report on the audit of the financial statements 2014Our OpinionWe have audited the accompanying financial statements 2014 of TomTom NV (‘the company’), based in Amsterdam. The financial statementsinclude the consolidated financial statements and the company financial statements.
In our opinion:• The consolidated financial statements give a true and fair view of the financial position of TomTom NV as at 31 December 2014 and of its
results and its cash flows for the year 2014 in accordance with International Financial Reporting Standards as adopted by the EuropeanUnion (EU-IFRS) and with Part 9 of Book 2 of the Dutch Civil Code.
• The company financial statements give a true and fair view of the financial position of TomTom NV as at 31 December 2014 and of itsresults for the year 2014 in accordance with Part 9 of Book 2 of the Dutch Civil Code.
The consolidated financial statements comprise:1. The consolidated balance sheet as at 31 December 2014;2. The following statements for 2014: the consolidated statements of income, comprehensive income, changes in equity and cash flows;
and3. The notes comprising a summary of the significant accounting policies and other explanatory information.
The company financial statements comprise:1. The company balance sheet as at 31 December 2014;2. The company statement of income for the year 2014; and3. The notes comprising a summary of the significant accounting policies and other explanatory information.
Basis for Our OpinionWe conducted our audit in accordance with Dutch law, which also covers Dutch Standards on Auditing. Our responsibilities under thosestandards are further described in the “Our responsibilities for the audit of the financial statements” section of our report.
We are independent of TomTom NV in accordance with the “Verordening inzake de onafhankelijkheid van accountants bij assurance-opdrachten” (ViO) and other relevant independence regulations in the Netherlands. Furthermore we have complied with the “Verordeninggedrags- en beroepsregels accountants” (VGBA).
We believe the audit evidence we have obtained is sufficient and appropriate to provide a basis for our opinion.
MaterialityMisstatements can arise due to fraud or error and are considered material if, individually or in the aggregate, they could reasonably be expectedto influence the economic decisions of users on the basis of these financial statements. The materiality affects the nature, timing and extentof our audit procedures and the evaluation of the effect of identified misstatements on our opinion.
Based on our professional judgement we determined the materiality for the financial statements as a whole at EUR 7,400,000. The materialityis based on various criteria including the levels of profit before tax, revenues and total assets. As profit before tax is volatile, revenues wasconsidered the appropriate primary benchmark. Materiality was calculated using a percentage of 0.8% and an estimated revenue level of EUR925 million. We have also taken into account misstatements and/or possible misstatements that in our opinion are material for the users ofthe consolidated financial statements for qualitative reasons.
We agreed with the Supervisory Board that misstatements in excess of EUR 370,000, which are identified during the audit, would be reportedto them, as well as smaller misstatements that in our view must be reported on qualitative grounds.
Scope of our group auditTomTom NV is at the head of a group of entities. The financial information of this group is included in the consolidated financial statementsof TomTom NV.
Because we are ultimately responsible for the opinion, we are also responsible for directing, supervising and performing the group audit. Inthis respect we have determined the nature and extent of the audit procedures to be carried out for group entities. The criteria used are thesize and/or risk profile of the group entities or operations. On this basis, we selected group entities for which an audit or review had to becarried out on the complete set of financial statements or specific items.
Our group audit mainly concentrated on significant group entities TomTom NV, TomTom International BV, TomTom Sales BV, TomTom GlobalContent BV, TomTom Global Assets BV and TomTom Inc. which are the main operating entities in Europe and the United States of America.We have performed audit procedures ourselves for all significant group entities. We performed review procedures or specific audit proceduresfor other group entities.
CONTENTS OVERVIEW MANAGEMENTBOARD REPORT
CORPORATEGOVERNANCE
SUPERVISORYBOARD REPORT
FINANCIALSTATEMENTS
SUPPLEMENTARYINFORMATION
ANNUAL REPORT AND ACCOUNTS 2014 / 86
By performing the procedures mentioned above at group entities, together with additional procedures at group level, we have been able toobtain sufficient and appropriate audit evidence about the group's financial information to provide an opinion on the consolidated andcompany financial statements.
Our Key Audit MattersKey audit matters are those matters that, in our professional judgement, were of most significance in our audit of the financial statements.We have communicated the key audit matters to the Supervisory Board. The key audit matters are not a comprehensive reflection of all mattersdiscussed.
These matters were addressed in the context of our audit of the financial statements as a whole and in forming our opinion thereon, and wedo not provide a separate opinion on these matters.
• Impairment of non-financial assetAssets that have an indefinite useful life, such as goodwill, are tested for impairment at least on an annual basis. Other intangible assets aretested for impairment whenever events or changes in circumstances indicate that the carrying amount may not be recoverable. An impairmentloss is recognised for the amount by which the asset's carrying amount exceeds its recoverable amount. The recoverable amount is based oncertain key assumptions, such as cash flow projections covering a five-year period and the perpetual growth rate and discount rate per cashgenerating unit. These assumptions which are determined by management are judgemental. As a result the valuation of intangible assetsincluding goodwill is significant to our audit. Our audit procedures included, among others, obtaining an understanding of the valuationmodel and assumptions used, challenging management's assumptions and involving independent valuation experts to support us in ourevaluation of the model. We also focused on the adequacy of disclosures about key assumptions and sensitivity. Management's disclosureson the impairment of non-financial assets are included in note 14 to the consolidated financial statements.
• Revenue recognitionThe process of revenue recognition, including the appropriate allocation of multiple-element arrangements and the estimation of rebates,involves significant management judgement. As such we have considered revenue recognition significant to our audit, requiring special auditconsideration. We performed focused procedures to test the allocation of revenue to separately identifiable components of multiple elementarrangements, particularly in relation to transactions that include the delivery of hardware products combined with a service element. Thisallocation is based on the estimated fair value per deliverable. We also performed substantive testing in relation to deferred revenue balances.Management's disclosures on revenue are included in note 4.
• Provisions and accrualsThere are several accruals and provisions that are subject to a high level of judgment such as the provision for claims and litigations, tax risksand the warranty provision. Due to the uncertainty involved, this area is significant to our audit. As part of our procedures, we challengedmanagement's rationale for determining the probability of related risks and considered information from both company representatives andexternal sources to be able to assess the reasonableness of the recorded amounts. Management has included information about these risksin note 31.
Responsibilities of Management and the Supervisory Board for Financial StatementsManagement is responsible for the preparation and fair presentation of the financial statements in accordance with EU-IFRS and Part 9 ofBook 2 of the Dutch Civil Code, and for the preparation of the management board report in accordance with Part 9 of Book 2 of the DutchCivil Code. Furthermore management is responsible for such internal control as management determines is necessary to enable the preparationof financial statements that are free from material misstatement, whether due to fraud or error.
As part of the preparation of the financial statements, management is responsible for assessing the company's ability to continue as a goingconcern. Based on the financial reporting frameworks mentioned, management should prepare the financial statements using the goingconcern basis of accounting unless management either intends to liquidate the company or to cease operations, or has no realistic alternativebut to do so. Management should disclose events and circumstances that may cast significant doubt on the company's ability to continue asa going concern.
The Supervisory Board is responsible for overseeing the company's financial reporting process.
Our Responsibilities for the Audit of the Financial StatementsOur objective is to plan and perform the audit assignment in a manner that allows sufficient and appropriate audit evidence to be obtainedfor our final opinion.
Our audit has been performed with a high, but not absolute, level of assurance, which means we may have not have detected all errors andfraud.
We have exercised professional judgement and have maintained professional skepticism throughout the audit, in accordance with DutchStandards on Auditing, ethical requirements and independence requirements. Our audit included e.g.:• Identifying and assessing the risks of material misstatement of the financial statements, whether due to fraud or error, designing and
performing audit procedures responsive to those risks, and obtain audit evidence that is sufficient and appropriate to provide a basis forour opinion. The risk of not detecting a material misstatement resulting from fraud is higher than for one resulting from error, as fraudmay involve collusion, forgery, intentional omissions, misrepresentations, or the override of internal control.
CONTENTS OVERVIEW MANAGEMENTBOARD REPORT
CORPORATEGOVERNANCE
SUPERVISORYBOARD REPORT
FINANCIALSTATEMENTS
SUPPLEMENTARYINFORMATION
ANNUAL REPORT AND ACCOUNTS 2014 / 87
• Obtaining an understanding of internal control relevant to the audit in order to design audit procedures that are appropriate in thecircumstances, but not for the purpose of expressing an opinion on the effectiveness of the company's internal control.
• Evaluating the appropriateness of accounting policies used and the reasonableness of accounting estimates and related disclosures madeby management.
• Concluding on the appropriateness of management's use of the going concern basis of accounting, and based on the audit evidenceobtained, whether a material uncertainty exists related to events and or conditions that may cast significant doubt on the company's abilityto continue as a going concern. If we conclude that a material uncertainty exists, we are required to draw attention in our auditor's reportto the related disclosures in the financial statements or, if such disclosures are inadequate, to modify our opinion. Our conclusions arebased on the audit evidence obtained up to the date of our auditor’s report. However, future events or conditions may cause the Companyto cease to continue as a going concern.
• Evaluating the overall presentation, structure and content of the financial statements, including the disclosures. and• Evaluating whether the financial statements represent the underlying transactions and events in a manner that achieves fair presentation.
We communicate with the Supervisory Board regarding, among other matters, the planned scope and timing of the audit and significantaudit findings, including any significant findings in internal control that we identify during our audit.
We provide the Supervisory Board with a statement that we have complied with relevant ethical requirements regarding independence, andto communicate with them all relationships and other matters that may reasonably be thought to bear on our independence, and whereapplicable, related safeguards.
From the matters communicated with the Supervisory Board, we determine those matters that were of most significance in the audit of thefinancial statements of the current period and are therefore the key audit matters. We describe these matters in our auditor's report unlesslaw or regulation precludes public disclosure about the matter or when, in extremely rare circumstances, not communicating the matter is inthe public interest.
Report on other legal and regulatory requirementsReport on the management board report and the other informationPursuant to legal requirements of Part 9 of Book 2 of the Dutch Civil Code (concerning our obligation to report about the management boardreport and other data):• We have no deficiencies to report as a result of our examination whether the management board report, to the extent we can assess, has
been prepared in accordance with Part 9 of Book 2 of the Dutch Civil Code, and whether the information as required Part 9 of Book 2 ofthe Dutch Civil Code has been annexed.
We report that the management board report, to the extent we can assess, is consistent with the financial statements.
EngagementWe were appointed by the General Meeting of TomTom NV on 1 May 2014 to carry out the 2014 audit and have acted as statutory auditorof the company since the year 2004.
Amsterdam, 12 February 2015
Deloitte Accountants BVSigned by: B. E. Savert
CONTENTS OVERVIEW MANAGEMENTBOARD REPORT
CORPORATEGOVERNANCE
SUPERVISORYBOARD REPORT
FINANCIALSTATEMENTS
SUPPLEMENTARYINFORMATION
ANNUAL REPORT AND ACCOUNTS 2014 / 88
CONTENTS OVERVIEW MANAGEMENTBOARD REPORT
CORPORATEGOVERNANCE
SUPERVISORYBOARD REPORT
FINANCIALSTATEMENTS
SUPPLEMENTARYINFORMATION
ANNUAL REPORT AND ACCOUNTS 2014 / 89
SUPPLEMENTARY INFORMATION
Shareholder information 90Key figures overview 92Quarterly summary income statement 2014 93Quarterly summary statement of cash flows 2014 94Definitions and abbreviations 95
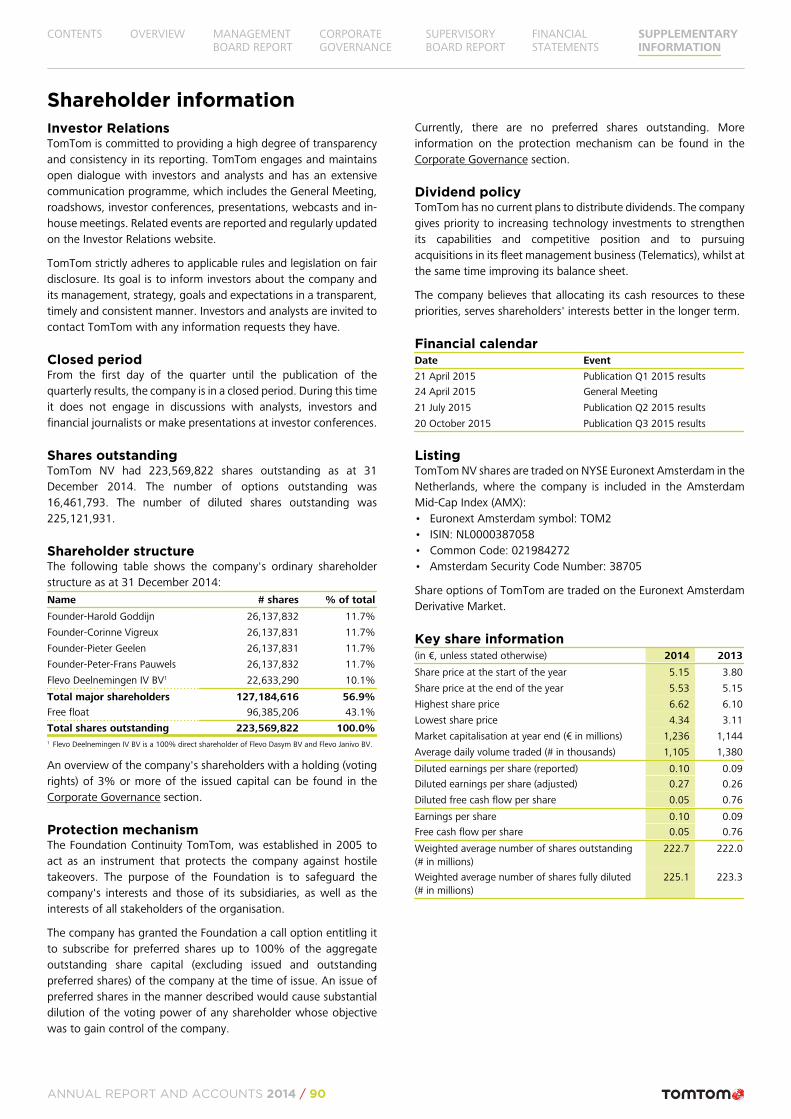
Shareholder informationInvestor RelationsTomTom is committed to providing a high degree of transparencyand consistency in its reporting. TomTom engages and maintainsopen dialogue with investors and analysts and has an extensivecommunication programme, which includes the General Meeting,roadshows, investor conferences, presentations, webcasts and in-house meetings. Related events are reported and regularly updatedon the Investor Relations website.
TomTom strictly adheres to applicable rules and legislation on fairdisclosure. Its goal is to inform investors about the company andits management, strategy, goals and expectations in a transparent,timely and consistent manner. Investors and analysts are invited tocontact TomTom with any information requests they have.
Closed periodFrom the first day of the quarter until the publication of thequarterly results, the company is in a closed period. During this timeit does not engage in discussions with analysts, investors andfinancial journalists or make presentations at investor conferences.
Shares outstandingTomTom NV had 223,569,822 shares outstanding as at 31December 2014. The number of options outstanding was16,461,793. The number of diluted shares outstanding was225,121,931.
Shareholder structureThe following table shows the company's ordinary shareholderstructure as at 31 December 2014:Name # shares % of total
Founder-Harold Goddijn 26,137,832 11.7%
Founder-Corinne Vigreux 26,137,831 11.7%
Founder-Pieter Geelen 26,137,831 11.7%
Founder-Peter-Frans Pauwels 26,137,832 11.7%
Flevo Deelnemingen IV BV1 22,633,290 10.1%
Total major shareholders 127,184,616 56.9%
Free float 96,385,206 43.1%
Total shares outstanding 223,569,822 100.0%1 Flevo Deelnemingen IV BV is a 100% direct shareholder of Flevo Dasym BV and Flevo Janivo BV.
An overview of the company's shareholders with a holding (votingrights) of 3% or more of the issued capital can be found in theCorporate Governance section.
Protection mechanismThe Foundation Continuity TomTom, was established in 2005 toact as an instrument that protects the company against hostiletakeovers. The purpose of the Foundation is to safeguard thecompany's interests and those of its subsidiaries, as well as theinterests of all stakeholders of the organisation.
The company has granted the Foundation a call option entitling itto subscribe for preferred shares up to 100% of the aggregateoutstanding share capital (excluding issued and outstandingpreferred shares) of the company at the time of issue. An issue ofpreferred shares in the manner described would cause substantialdilution of the voting power of any shareholder whose objectivewas to gain control of the company.
Currently, there are no preferred shares outstanding. Moreinformation on the protection mechanism can be found in theCorporate Governance section.
Dividend policyTomTom has no current plans to distribute dividends. The companygives priority to increasing technology investments to strengthenits capabilities and competitive position and to pursuingacquisitions in its fleet management business (Telematics), whilst atthe same time improving its balance sheet.
The company believes that allocating its cash resources to thesepriorities, serves shareholders' interests better in the longer term.
Financial calendarDate Event
21 April 2015 Publication Q1 2015 results
24 April 2015 General Meeting
21 July 2015 Publication Q2 2015 results
20 October 2015 Publication Q3 2015 results
ListingTomTom NV shares are traded on NYSE Euronext Amsterdam in theNetherlands, where the company is included in the AmsterdamMid-Cap Index (AMX):• Euronext Amsterdam symbol: TOM2• ISIN: NL0000387058• Common Code: 021984272• Amsterdam Security Code Number: 38705
Share options of TomTom are traded on the Euronext AmsterdamDerivative Market.
Key share information(in €, unless stated otherwise) 2014 2013
Share price at the start of the year 5.15 3.80
Share price at the end of the year 5.53 5.15
Highest share price 6.62 6.10
Lowest share price 4.34 3.11
Market capitalisation at year end (€ in millions) 1,236 1,144
Average daily volume traded (# in thousands) 1,105 1,380
Diluted earnings per share (reported) 0.10 0.09
Diluted earnings per share (adjusted) 0.27 0.26
Diluted free cash flow per share 0.05 0.76
Earnings per share 0.10 0.09
Free cash flow per share 0.05 0.76
Weighted average number of shares outstanding(# in millions)
222.7 222.0
Weighted average number of shares fully diluted(# in millions)
225.1 223.3
CONTENTS OVERVIEW MANAGEMENTBOARD REPORT
CORPORATEGOVERNANCE
SUPERVISORYBOARD REPORT
FINANCIALSTATEMENTS
SUPPLEMENTARYINFORMATION
ANNUAL REPORT AND ACCOUNTS 2014 / 90
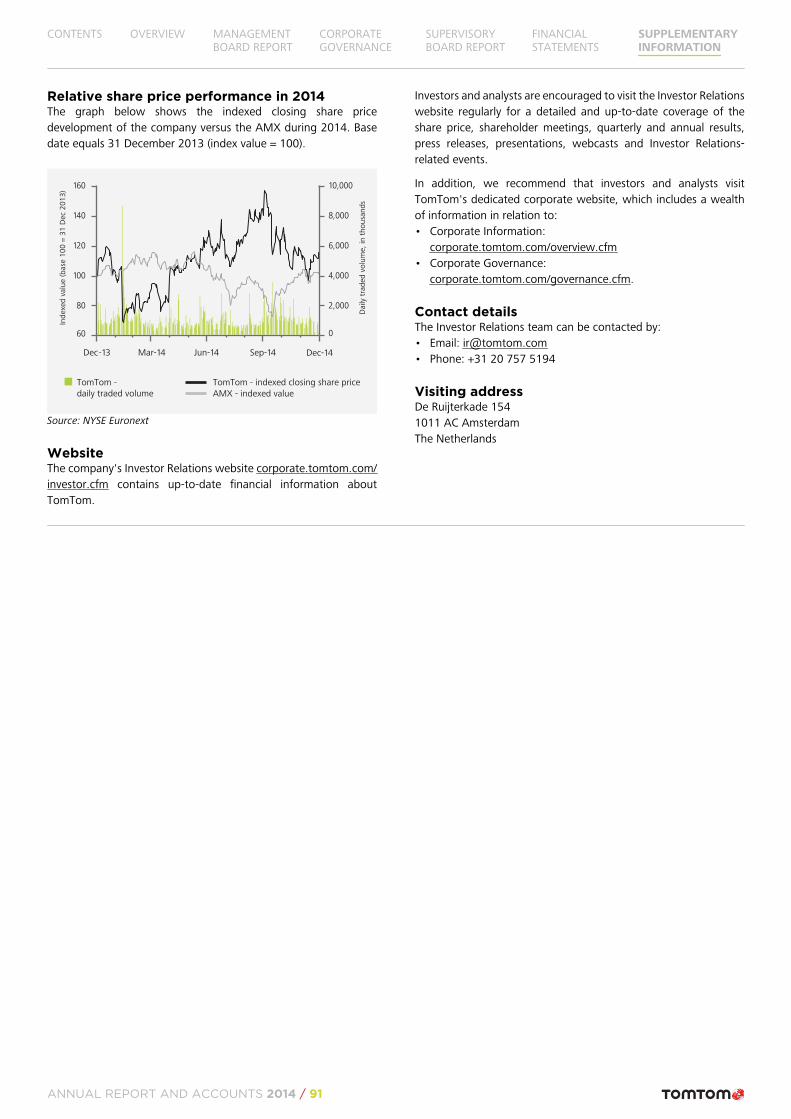
Relative share price performance in 2014The graph below shows the indexed closing share pricedevelopment of the company versus the AMX during 2014. Basedate equals 31 December 2013 (index value = 100).
TomTom -
daily traded volume AMX - indexed value
TomTom - indexed closing share price
Daily
tra
ded
vo
lum
e,
in t
ho
usa
nd
s
Ind
exe
d v
alu
e (b
ase
10
0 =
31
Dec
20
13
)
Dec-13 Mar-14 Jun-14 Sep-14 Dec-14
60
160
140
120
100
80
10,000
8,000
6,000
4,000
2,000
0
Source: NYSE Euronext
WebsiteThe company's Investor Relations website corporate.tomtom.com/investor.cfm contains up-to-date financial information aboutTomTom.
Investors and analysts are encouraged to visit the Investor Relationswebsite regularly for a detailed and up-to-date coverage of theshare price, shareholder meetings, quarterly and annual results,press releases, presentations, webcasts and Investor Relations-related events.
In addition, we recommend that investors and analysts visitTomTom's dedicated corporate website, which includes a wealthof information in relation to:• Corporate Information:
corporate.tomtom.com/overview.cfm • Corporate Governance:
corporate.tomtom.com/governance.cfm.
Contact detailsThe Investor Relations team can be contacted by:• Email: [email protected] • Phone: +31 20 757 5194
Visiting addressDe Ruijterkade 1541011 AC AmsterdamThe Netherlands
CONTENTS OVERVIEW MANAGEMENTBOARD REPORT
CORPORATEGOVERNANCE
SUPERVISORYBOARD REPORT
FINANCIALSTATEMENTS
SUPPLEMENTARYINFORMATION
ANNUAL REPORT AND ACCOUNTS 2014 / 91
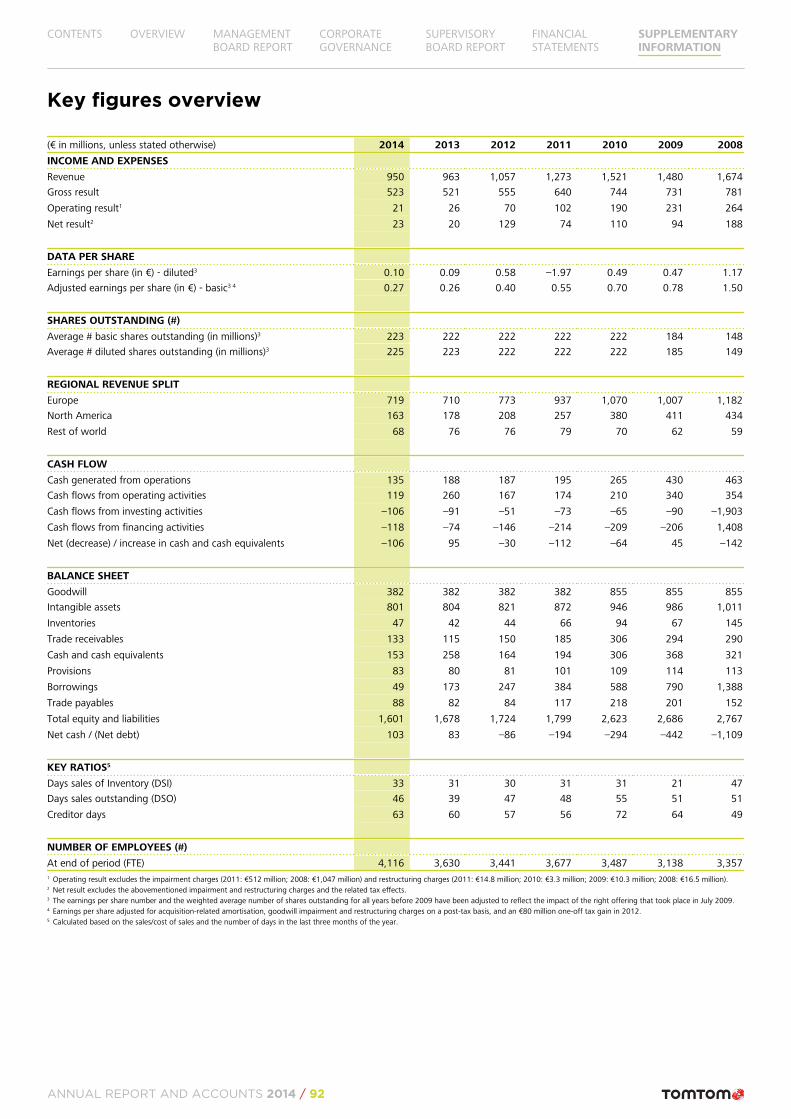
Key figures overview
(€ in millions, unless stated otherwise) 2014 2013 2012 2011 2010 2009 2008
INCOME AND EXPENSES
Revenue 950 963 1,057 1,273 1,521 1,480 1,674
Gross result 523 521 555 640 744 731 781
Operating result1 21 26 70 102 190 231 264
Net result2 23 20 129 74 110 94 188
DATA PER SHARE
Earnings per share (in €) - diluted3 0.10 0.09 0.58 –1.97 0.49 0.47 1.17
Adjusted earnings per share (in €) - basic3 4 0.27 0.26 0.40 0.55 0.70 0.78 1.50
SHARES OUTSTANDING (#)
Average # basic shares outstanding (in millions)3 223 222 222 222 222 184 148
Average # diluted shares outstanding (in millions)3 225 223 222 222 222 185 149
REGIONAL REVENUE SPLIT
Europe 719 710 773 937 1,070 1,007 1,182
North America 163 178 208 257 380 411 434
Rest of world 68 76 76 79 70 62 59
CASH FLOW
Cash generated from operations 135 188 187 195 265 430 463
Cash flows from operating activities 119 260 167 174 210 340 354
Cash flows from investing activities –106 –91 –51 –73 –65 –90 –1,903
Cash flows from financing activities –118 –74 –146 –214 –209 –206 1,408
Net (decrease) / increase in cash and cash equivalents –106 95 –30 –112 –64 45 –142
BALANCE SHEET
Goodwill 382 382 382 382 855 855 855
Intangible assets 801 804 821 872 946 986 1,011
Inventories 47 42 44 66 94 67 145
Trade receivables 133 115 150 185 306 294 290
Cash and cash equivalents 153 258 164 194 306 368 321
Provisions 83 80 81 101 109 114 113
Borrowings 49 173 247 384 588 790 1,388
Trade payables 88 82 84 117 218 201 152
Total equity and liabilities 1,601 1,678 1,724 1,799 2,623 2,686 2,767
Net cash / (Net debt) 103 83 –86 –194 –294 –442 –1,109
KEY RATIOS5
Days sales of Inventory (DSI) 33 31 30 31 31 21 47
Days sales outstanding (DSO) 46 39 47 48 55 51 51
Creditor days 63 60 57 56 72 64 49
NUMBER OF EMPLOYEES (#)
At end of period (FTE) 4,116 3,630 3,441 3,677 3,487 3,138 3,3571 Operating result excludes the impairment charges (2011: €512 million; 2008: €1,047 million) and restructuring charges (2011: €14.8 million; 2010: €3.3 million; 2009: €10.3 million; 2008: €16.5 million).2 Net result excludes the abovementioned impairment and restructuring charges and the related tax effects.3 The earnings per share number and the weighted average number of shares outstanding for all years before 2009 have been adjusted to reflect the impact of the right offering that took place in July 2009.4 Earnings per share adjusted for acquisition-related amortisation, goodwill impairment and restructuring charges on a post-tax basis, and an €80 million one-off tax gain in 2012.5 Calculated based on the sales/cost of sales and the number of days in the last three months of the year.
CONTENTS OVERVIEW MANAGEMENTBOARD REPORT
CORPORATEGOVERNANCE
SUPERVISORYBOARD REPORT
FINANCIALSTATEMENTS
SUPPLEMENTARYINFORMATION
ANNUAL REPORT AND ACCOUNTS 2014 / 92
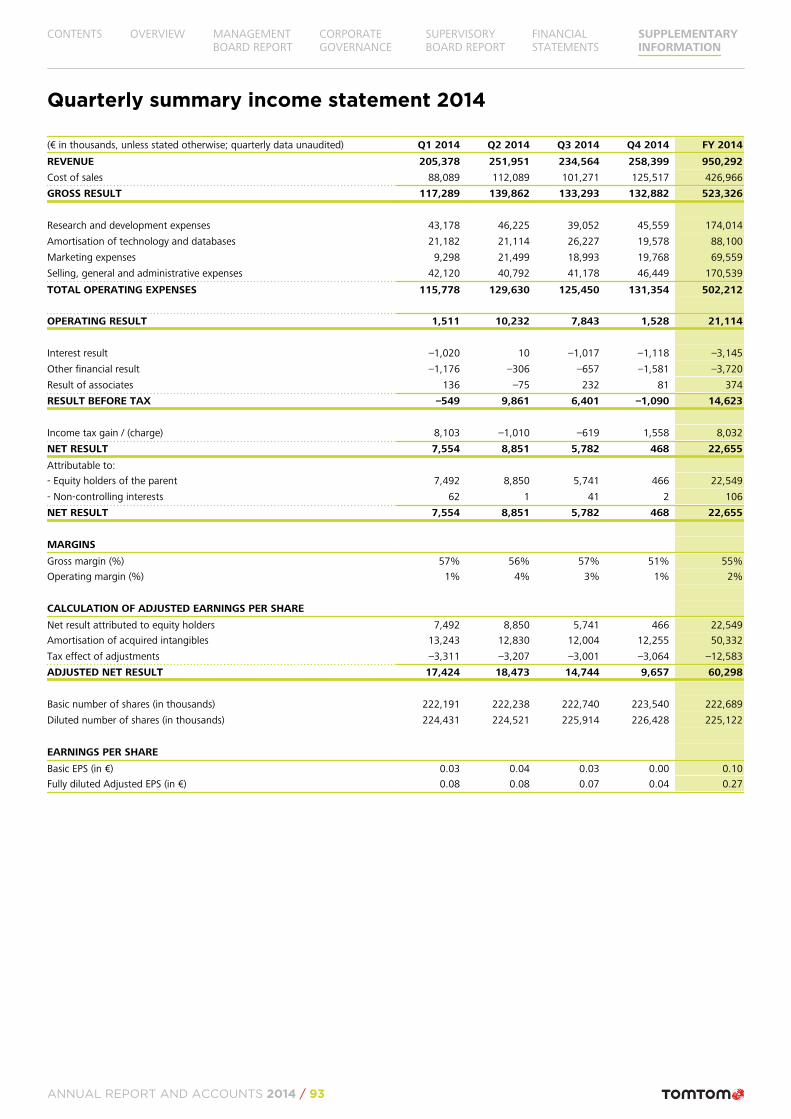
Quarterly summary income statement 2014
(€ in thousands, unless stated otherwise; quarterly data unaudited) Q1 2014 Q2 2014 Q3 2014 Q4 2014 FY 2014
REVENUE 205,378 251,951 234,564 258,399 950,292
Cost of sales 88,089 112,089 101,271 125,517 426,966
GROSS RESULT 117,289 139,862 133,293 132,882 523,326
Research and development expenses 43,178 46,225 39,052 45,559 174,014
Amortisation of technology and databases 21,182 21,114 26,227 19,578 88,100
Marketing expenses 9,298 21,499 18,993 19,768 69,559
Selling, general and administrative expenses 42,120 40,792 41,178 46,449 170,539
TOTAL OPERATING EXPENSES 115,778 129,630 125,450 131,354 502,212
OPERATING RESULT 1,511 10,232 7,843 1,528 21,114
Interest result –1,020 10 –1,017 –1,118 –3,145
Other financial result –1,176 –306 –657 –1,581 –3,720
Result of associates 136 –75 232 81 374
RESULT BEFORE TAX –549 9,861 6,401 –1,090 14,623
Income tax gain / (charge) 8,103 –1,010 –619 1,558 8,032
NET RESULT 7,554 8,851 5,782 468 22,655
Attributable to:
- Equity holders of the parent 7,492 8,850 5,741 466 22,549
- Non-controlling interests 62 1 41 2 106
NET RESULT 7,554 8,851 5,782 468 22,655
MARGINS
Gross margin (%) 57% 56% 57% 51% 55%
Operating margin (%) 1% 4% 3% 1% 2%
CALCULATION OF ADJUSTED EARNINGS PER SHARE
Net result attributed to equity holders 7,492 8,850 5,741 466 22,549
Amortisation of acquired intangibles 13,243 12,830 12,004 12,255 50,332
Tax effect of adjustments –3,311 –3,207 –3,001 –3,064 –12,583
ADJUSTED NET RESULT 17,424 18,473 14,744 9,657 60,298
Basic number of shares (in thousands) 222,191 222,238 222,740 223,540 222,689
Diluted number of shares (in thousands) 224,431 224,521 225,914 226,428 225,122
EARNINGS PER SHARE
Basic EPS (in €) 0.03 0.04 0.03 0.00 0.10
Fully diluted Adjusted EPS (in €) 0.08 0.08 0.07 0.04 0.27
CONTENTS OVERVIEW MANAGEMENTBOARD REPORT
CORPORATEGOVERNANCE
SUPERVISORYBOARD REPORT
FINANCIALSTATEMENTS
SUPPLEMENTARYINFORMATION
ANNUAL REPORT AND ACCOUNTS 2014 / 93
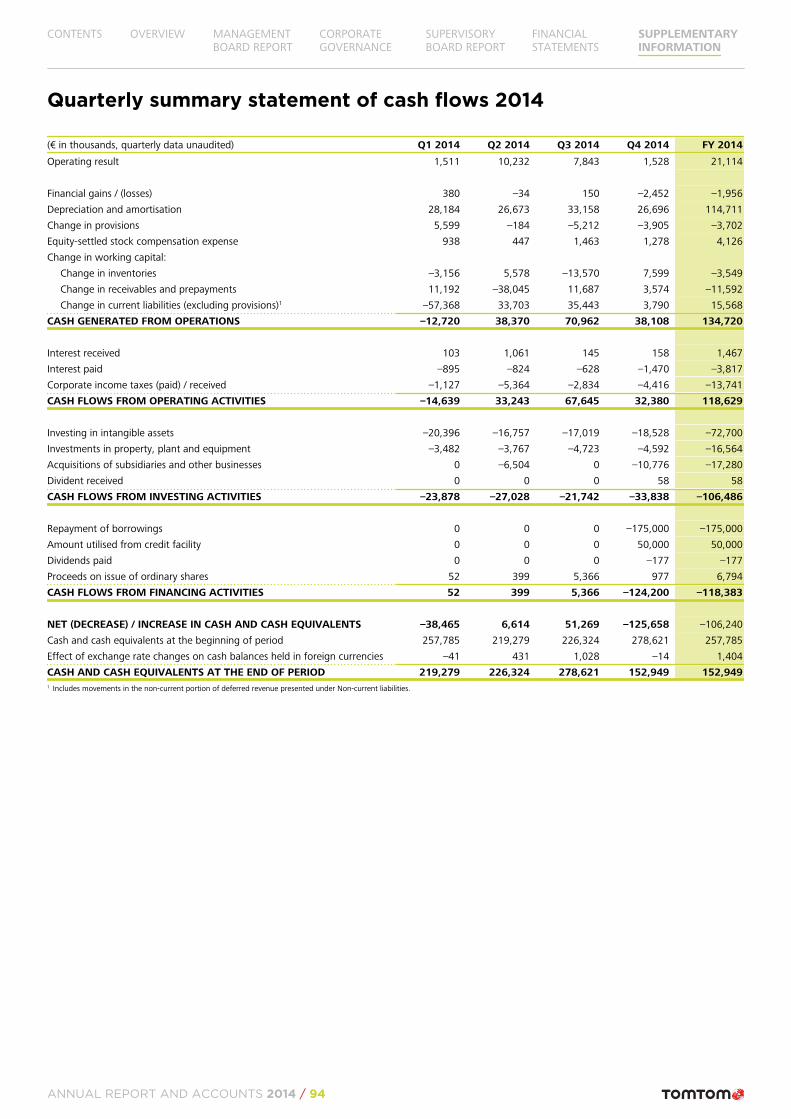
Quarterly summary statement of cash flows 2014
(€ in thousands, quarterly data unaudited) Q1 2014 Q2 2014 Q3 2014 Q4 2014 FY 2014
Operating result 1,511 10,232 7,843 1,528 21,114
Financial gains / (losses) 380 –34 150 –2,452 –1,956
Depreciation and amortisation 28,184 26,673 33,158 26,696 114,711
Change in provisions 5,599 –184 –5,212 –3,905 –3,702
Equity-settled stock compensation expense 938 447 1,463 1,278 4,126
Change in working capital:
Change in inventories –3,156 5,578 –13,570 7,599 –3,549
Change in receivables and prepayments 11,192 –38,045 11,687 3,574 –11,592
Change in current liabilities (excluding provisions)1 –57,368 33,703 35,443 3,790 15,568
CASH GENERATED FROM OPERATIONS –12,720 38,370 70,962 38,108 134,720
Interest received 103 1,061 145 158 1,467
Interest paid –895 –824 –628 –1,470 –3,817
Corporate income taxes (paid) / received –1,127 –5,364 –2,834 –4,416 –13,741
CASH FLOWS FROM OPERATING ACTIVITIES –14,639 33,243 67,645 32,380 118,629
Investing in intangible assets –20,396 –16,757 –17,019 –18,528 –72,700
Investments in property, plant and equipment –3,482 –3,767 –4,723 –4,592 –16,564
Acquisitions of subsidiaries and other businesses 0 –6,504 0 –10,776 –17,280
Divident received 0 0 0 58 58
CASH FLOWS FROM INVESTING ACTIVITIES –23,878 –27,028 –21,742 –33,838 –106,486
Repayment of borrowings 0 0 0 –175,000 –175,000
Amount utilised from credit facility 0 0 0 50,000 50,000
Dividends paid 0 0 0 –177 –177
Proceeds on issue of ordinary shares 52 399 5,366 977 6,794
CASH FLOWS FROM FINANCING ACTIVITIES 52 399 5,366 –124,200 –118,383
NET (DECREASE) / INCREASE IN CASH AND CASH EQUIVALENTS –38,465 6,614 51,269 –125,658 –106,240
Cash and cash equivalents at the beginning of period 257,785 219,279 226,324 278,621 257,785
Effect of exchange rate changes on cash balances held in foreign currencies –41 431 1,028 –14 1,404
CASH AND CASH EQUIVALENTS AT THE END OF PERIOD 219,279 226,324 278,621 152,949 152,9491 Includes movements in the non-current portion of deferred revenue presented under Non-current liabilities.
CONTENTS OVERVIEW MANAGEMENTBOARD REPORT
CORPORATEGOVERNANCE
SUPERVISORYBOARD REPORT
FINANCIALSTATEMENTS
SUPPLEMENTARYINFORMATION
ANNUAL REPORT AND ACCOUNTS 2014 / 94
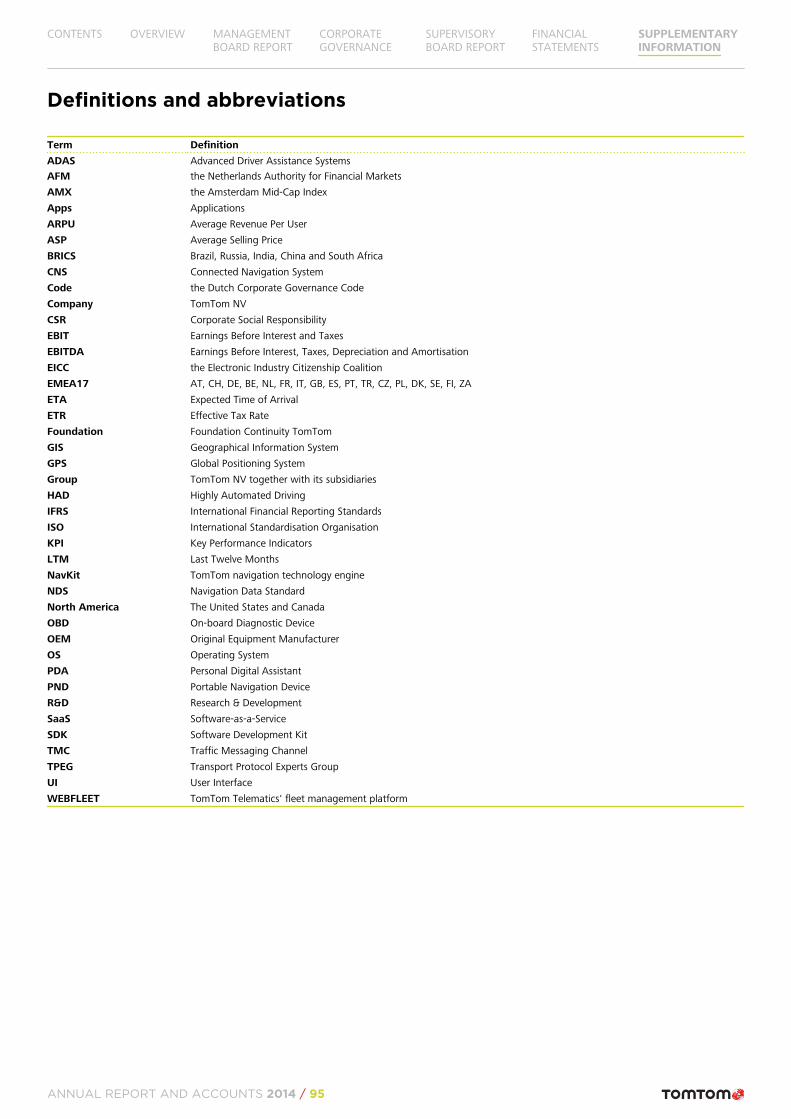
Definitions and abbreviations
Term Definition
ADAS Advanced Driver Assistance Systems
AFM the Netherlands Authority for Financial Markets
AMX the Amsterdam Mid-Cap Index
Apps Applications
ARPU Average Revenue Per User
ASP Average Selling Price
BRICS Brazil, Russia, India, China and South Africa
CNS Connected Navigation System
Code the Dutch Corporate Governance Code
Company TomTom NV
CSR Corporate Social Responsibility
EBIT Earnings Before Interest and Taxes
EBITDA Earnings Before Interest, Taxes, Depreciation and Amortisation
EICC the Electronic Industry Citizenship Coalition
EMEA17 AT, CH, DE, BE, NL, FR, IT, GB, ES, PT, TR, CZ, PL, DK, SE, FI, ZA
ETA Expected Time of Arrival
ETR Effective Tax Rate
Foundation Foundation Continuity TomTom
GIS Geographical Information System
GPS Global Positioning System
Group TomTom NV together with its subsidiaries
HAD Highly Automated Driving
IFRS International Financial Reporting Standards
ISO International Standardisation Organisation
KPI Key Performance Indicators
LTM Last Twelve Months
NavKit TomTom navigation technology engine
NDS Navigation Data Standard
North America The United States and Canada
OBD On-board Diagnostic Device
OEM Original Equipment Manufacturer
OS Operating System
PDA Personal Digital Assistant
PND Portable Navigation Device
R&D Research & Development
SaaS Software-as-a-Service
SDK Software Development Kit
TMC Traffic Messaging Channel
TPEG Transport Protocol Experts Group
UI User Interface
WEBFLEET TomTom Telematics' fleet management platform
CONTENTS OVERVIEW MANAGEMENTBOARD REPORT
CORPORATEGOVERNANCE
SUPERVISORYBOARD REPORT
FINANCIALSTATEMENTS
SUPPLEMENTARYINFORMATION
ANNUAL REPORT AND ACCOUNTS 2014 / 95
TomTom NVDe Ruijterkade 154
1011 AC Amsterdam
The Netherlands
Tel: +31 (0)20 757 5000
www.tomtom.com