Embed Size (px)
Citation preview

Announcing TIBCO Spotfire 3.3
TIBCO is pleased to announce the general availability of Spotfire® version 3.3. Please read on for more details on this important new release of the Spotfire software.
What’s New in Spotfire version 3.3
Table of Contents:
I. Collaborative: Enhanced bookmarks simplify sharing of insights Collaborative bookmarks - capture precise state of all dashboard elements
Empowers mainstream Web Player users; bookmarks work across clients
Increases productivity of distributed project teams & work groups
II. Productive: Accelerates operational agility Free native iPad application; publish once, read anywhere (desktop, browser or
mobile)
Multiple visual enhancements further empower end users and speed insights
New labeling techniques add analytic depth
III. Helps IT:
Backend platform improvements ease burden on IT Qualification Module validates installation & operation for highly regulated
industries
Massive gains in memory utilization enables IT to provide enterprise-class scalability
Smart mappings of data sources ensures self-service query access

Harnessing the power of collaboration Collaborative Bookmarks capture insights & share them broadly with a simple click – right from your browser
Interacting with visualized data can yield powerful insights. In Spotfire version 3.3, we’ve
enhanced existing bookmarking capabilities because we recognize the value of immediately
capturing and sharing a moment of insight. New
in Spotfire version 3.3, Collaborative
Bookmarking enables all Spotfire users (Web
Player analysts as well as users of the full
Professional and Enterprise Player clients) to
capture a dashboard - its complete configuration,
including markings, drop down selections, and
filter settings – and, if desired, to share that
visualization immediately with other users of that
same dashboard. Similar to creating “favorites” in
a favorite web browser, Spotfire’s new
Collaborative Bookmarks is a powerful capability
that’s ideal for distributed project teams, group
decision making, and simply quick periodic access
to key metrics.
“See For Yourself!”
As you already know, your organization can make better decisions by monitoring and
interrogating its data. When conclusions and decisions are driven by data, there is no better way
to gain trust and alignment that to provide transparency right to the source. This is why
Bookmarks in Spotfire 3.3 can be made “Public”. If you capture a Bookmark while analyzing
data, you can choose to make it “Public,” which means that anyone else viewing the same
Spotfire file will see the Bookmark you captured. When clicked, others will see exactly what
you saw as you captured that Bookmark – including the file’s filter settings, markings, and drop
down selections.
If you don’t want everyone to see your
Bookmark sitting there in plain view, you still
have a way to easily, yet discreetly, share it with
others. Just grab the URL from the Bookmark’s
menu and paste it into your email, wiki, portal –
wherever. People who click the link will launch
the analysis straight into the previously captured
state. You can send people to your insight using
the thick client or a browser - your choice.

Spotfire application for the iPad™!
Now iPad users can easily interact with visualizations, quickly extract insights buried in data, and collaborate with colleagues - all from their personal iPad!
To download the TIBCO Spotfire iPad application – Click here http://itunes.apple.com/us/app/spotfire/id417436823?mt=8
With the native Spotfire application for the iPad, you can now use:
Touch-Enabled Dashboards – Right in Your Hand.
Interact with charts, graphs and tables in real time, users can tap, pinch or swipe the screen, with
every movement providing a new view of the data instantly.
Powerful Analysis – On the Go. iPad users can access important information where and when
they need it – whether looking at the latest update to a key metrics dashboard so questions can be
asked and answered on the run, or running a predictive analytic application..
Knowledge-Sharing – In a Mobile Environment. Unlike some competing applications, Spotfire
files don’t require special preparation to be published on the web. All files viewable in Spotfire
Web Player are iPad compatible as well.
Decision Making doesn‟t have to happen in the Office. With Spotfire for the iPad, not only can
you open reports and dashboards, but you get all the analytics capabilities you’ll need to make
better, more data-driven decisions, faster.
Export and Send reports from the iPad. Reached an interesting insight? Export your reports and
visualizations to images or PDF files with just one touch.

Visualizations to improve productivity
Horizontal Bar Option The Bar Chart can now be configured so that the
bars extend horizontally. Not merely a matter of
aesthetic preference, this option greatly improves
the readability of the bar identifiers. Switching
between horizontal and vertical bars can be done
on-the-fly from the context menu of the Bar Chart
so you don’t miss a beat.
Customizing Cross Tables
Condense your Cross Tables down to only the most important facts. Now you can limit the cross
table to show only the top or bottom N values per category. The analyst uses column sorting to
control which measure is used to judge top or bottom values. When used at the same time as the
subtotal feature, you can get both your summary and your critical details right in the same place.
Set these preferences in Cross Table > Properties > Sorting.
1.Horizontal Bars – they kind of speak for themselves
2.This cross table is configured to only
show the “top 5” values per category.
The user has sorted by the Total Sales
column in descending order, so this
chart shows the top 5 by total sales per
category. If the user sorts by “Avg
Profit”, he would see the product with
the top 5 highest (or lowest!) profits
instead. *Note that the subtotals are still calculated for
the unseen values beyond the top 5

Compensate for Missing Time Series Values
Spotfire 3.3 has the option to show time series as a more natural continuum. Prior to 3.3,
categorical axes in Spotfire were purely data driven. As a consequence, plots with date or time
hierarchies weren’t capable of illustrating missing time periods when no data existed for them.
Now in 3.3, you can configure axes to show complete time hierarchies for a more natural,
comprehensive view of time series data. For example, missing data would have made
cumulative stacked bar charts appear jaded. With Spotfire version 3.3, though, these
visualizations appear much more elegantly, as missing values can be accounted for.
3.Prior to 3.3 (left), cumulative trends over time could appear jagged due to missing data. In 3.3 (right), the option
to compensate for missing values will maintain continuity of cumulative series to aid interpretation.
Tiled Marker for Grid Layouts in Scatter Plot and Map Chart
A new Tiled Marker option makes it easy to visualize and analyze grid-like data in Spotfire.
Typical application areas include visualizing high throughput screening plates in research, as
well as semiconductor wafer layouts for high-tech manufacturing.
4.The tiled marker type forms seamless grid, which is more intuitive and easy to navigate for certain applications.
Labels for this tiled marker type are specially designed to work smoothly for these analysis cases – labels are centered and will only appear if enough screen space exists to display

them. Also relevant for these analytic cases: the scatter plot now supports mouse-wheel zooming for quick navigation of these kinds of visuals.
Hollow Markers in Scatter Plot and Map Chart
Hollow markers can convey a better sense of overlap and density in your data, and also offer a
greater diversity of choice to help distinguish data categories.
5.New marker types better illustrate overlap and density, and help distinguish more data categories at once.
New horizontal and vertical hash marker types are helpful additions, for example, when
visualizing chromosome maps in genomic research:
6.More natural chromosome maps in 3.3 using the new vertical or horizontal marker type.

Improved Labeling
Use Images as Labels and Tooltips Drive home the meaning in your data by using images directly as marker labels (scatter plot
only) or as tooltips (in all plots except Box Plot).
If you can get the image into the dataset, or access it via URL (see below), then you can show it
right in your analysis. Show chemical structures, geospatial geometry, corporate logos, brand
logos, advertising campaign artifacts, and more.
Label Map Regions Quickly & Easily
When using the interactive shape mode of the Spotfire Map Chart, you can now label the shapes.
Especially in geographic mapping cases, it is not always easy to determine the best location for a
region’s label, so this is why Spotfire 3.3 will let you manually determine where to place region
labels. Just right click the map and choose to “Edit Label Positions.”
7.Set labels and label positions when using interactive shape mode of the Map Chart.

Easing the Burden on IT
Spotfire Qualification
Validate Spotfire Installation and Application Performance: Installation
Qualification (IQ) and Operational Qualification (OQ)
We are pleased to announce a new product: Spotfire Qualification 3.3. This product was
designed to address the requirements of highly regulated industries, such as clinical trials. This
new product, therefore, may also address the needs of organizations that are not as highly
regulated, but that nonetheless seek to establish more rigor in validating the proper the
installation and operation of our software.
We understand that up to half the development time for any highly regulated software solution is
wrapped up in validating the installation and performance of software, especially for software
systems involved in storing, calculating, and presenting data. We also understand that the high
cost of validation, and all its accompanying documentation, can prevent organizations from
getting the most out of a product like Spotfire, whose core benefits lie in agility and freedom to
quickly respond to changing conditions. Helping our customers reduce costs associated with
validation helps you get more out of your Spotfire investment.
How to we speed up validation processes? (From the Spotfire Help documentation)
“TIBCO Spotfire Qualification allows you to verify that an analysis in TIBCO Spotfire gives the
same results on different installations of TIBCO Spotfire. This is done with the TIBCO Spotfire
Qualification tool that exports all parts of an analysis for a user-defined „gold standard‟
application. The tool can then automatically compare that gold standard with exports performed
on other computers, or after upgrades of TIBCO Spotfire.”
Tools to export and
compare spotfire file
contents are under:
Tools Qualification
8.A sample result after automatically comparing the
exports of the same Spotfire file from two different
Spotfire installations.
This makes it easy to verify that Spotfire is successfully
installed and is working as expected compared to known
good previous

Spotfire Web Player: More Efficient Memory Utilization
Many Spotfire customers will be able to support a greater number of web users on their existing
hardware by upgrading to 3.3. Spotfire Web Player 3.3 includes significant improvements in
memory consumption, with the disclaimer that this only applies to certain usage scenarios. Our
goal was to minimize the amount of system memory needed to support larger numbers of
simultaneous users on the same analysis file. You should find that the larger the file and the
greater the number of simultaneous web users on that file, initial system memory required to
support each additional user is greatly reduced compared to previous versions. In other words,
each additional simultaneous user of a web analysis initially claims very little additional system
memory. We hope this allows customers expand usage of Spotfire Web Player with this
significant leap in scalability.
Server Installation Manual: For the System Administrator
We continue to improve the Spotfire Server installation process and make the manual easier to
follow for your tasks. Be sure to follow the manual with every new release.

Smart Mappings: Automated Creation of Information Models
Spotfire 3.3 Information Services users can automatically generate 1-to-1 mappings of the
existing tables and columns in their Data Sources. Just generate a Data Source in Spotfire, then
right click it and select “Create Default Information Model…” This helps a lot when the work
has already been done to nicely model and expose tables for business applications such as
Spotfire, so the mapping step is more about transparency than transformation. For example, if
you use Spotfire Application Data Services, you do the work in ADS to expose Spotfire-ready
tables and columns, so a simple transparent mapping of those elements through Spotfire
Information Services can now be accomplished in one click. Note that the automated creation
will work through nested levels of data objects in the data source you supply.
The result is a folder structure that matches the catalogs, schemas etc. that were selected with a
column element for each column and an information link for each table containing those column
elements. Procedures will get a procedure element and an information link of their own if they
return data.
10.Right-click on Data Sources in Spotfire 3.3 reveals
the option to automatically model all the tables,
columns, and procedures in that Data Source. 9.An example of the results after choosing
to “Create Default information Model” for a
Data Source.
Increased Uptime of Spotfire When Changing Configuration
Now, Spotfire system administrators can view and edit the current server configuration without
stopping the servers in the cluster. The services don’t have to be stopped until any new changes
are saved and applied.
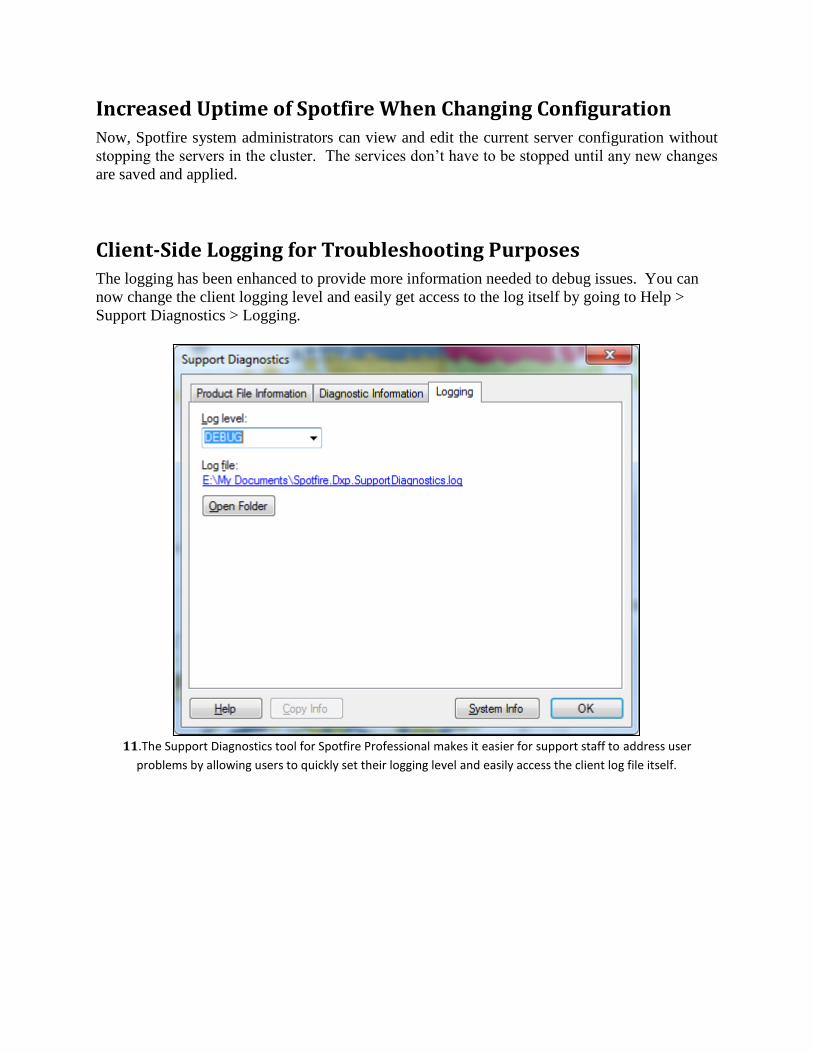
Client-Side Logging for Troubleshooting Purposes
The logging has been enhanced to provide more information needed to debug issues. You can
now change the client logging level and easily get access to the log itself by going to Help >
Support Diagnostics > Logging.
11.The Support Diagnostics tool for Spotfire Professional makes it easier for support staff to address user
problems by allowing users to quickly set their logging level and easily access the client log file itself.

Spotfire Training Update
With today’s economy, many companies are experiencing cuts in training and travel budgets.
Spotfire’s training department has been working to create economical training options like
virtual classes to provide high quality content that still provides a high return on investment.
Click here to see our many training options that will meet your learning needs as well as your
budget.
We hope you are as excited about these new capabilities as we are! We work tirelessly to apply
more than a decade of collective experience to continuously improve the way you interact with
and analyze data. Our team is dedicated to helping you and your organizations win by rapidly
discovering new insights in information and we are committed to delivering the fastest and most
adaptable analytics platform in the market. Thank you for your continued interest and please
drop us a line with any questions you may have.
The Spotfire Team

How to Upgrade to Spotfire 3.3
License Administrators: Accounts with current maintenance agreements using their predefined download credentials should download the latest Spotfire software from the TIBCO download site at http://download.tibco.com. Users: End users should contact their organization’s TIBCO Spotfire® Analytics Server Administrator to determine when their site will be ready to upgrade and deploy to the latest release. Once deployed on the Spotfire® Analytics Server, TIBCO Spotfire clients on previous versions will automatically update after next login. If you need assistance, reference the Product Download Site Help section or contact TIBCO Spotfire Support at: http://support.spotfire.com
About TIBCO TIBCO Software Inc. is a leading provider of enterprise analytics software for next generation business intelligence. TIBCO Spotfire products offer a visual and interactive experience that helps professionals quickly discover new and actionable insights in information. Distinguished by its speed to insight and adaptability to specific business challenges, TIBCO Spotfire products rapidly reveal unseen threats and new opportunities, creating significant economic value. TIBCO Spotfire customers include industry leaders among the Global 2000 that have deployed TIBCO Spotfire analytics to gain an information advantage over their competitors. For more information, visit http://spotfire.tibco.com