Embed Size (px)
Citation preview
1
Earnings Release 1Q 2019
Despegar.com Announces 1Q19 year-over-year Transaction Growth of 5% and Gross Bookings up 24% on an FX neutral basis
Buenos Aires, May 9, 2019 – Despegar.com, Corp. (NYSE: DESP), (“Despegar” or the “Company”) a leading online travel company in Latin America, today announced unaudited results for the three months ended March 31, 2019. Financial results are expressed in U.S. dollars and are presented in accordance with U.S. generally accepted accounting principles.
First Quarter 2019 Key Financial and Operating Highlights
Transactions up 5% year-over-year, with Room Nights up 4% YoY
Gross bookings reached $1.2 billion, a year-over-year increase of 24% on an FX neutral basis (down 6% as reported)
Excluding Argentina, transactions, room nights and gross bookings increased 11%, 22%, and 7% YoY, respectively
Share of mobile transactions up 720 basis points YoY, accounting for 38% of total transactions in 1Q19
Net Promoter Score (NPS) up 586 bps YoY
Revenues totaled $133.1 million, up 19% on an FX neutral basis (down 10% as reported)
Packages, Hotels and Other Travel Products accounted for 63% of total revenue in 1Q19, up 361 basis points from first quarter 2018
Adjusted EBITDA decreased 44% year-over-year
Operating cash flow of ($5.6) million in 1Q19, compared to $14.2 million in 1Q18
Agreed to acquire 100% of Viajes Falabella with operations in Chile, Colombia, Peru and Argentina, and entered into long-term strategic alliance with Falabella Financiero
Message from CEO Commenting on the Company’s results, Damian Scokin, CEO stated, “We continue to execute on our strategic initiatives, making disciplined investment decisions to accelerate growth. To that end, we recently announced that we reached an agreement to acquire Viajes Falabella, a business with strong focus on packages and operating across our fastest growing markets. Successful execution of our strategy resulted in a strong first quarter 2019 performance across our key commercial and operational metrics given the challenging macro environment, particularly in Argentina. Importantly, profitability improved sequentially while posting attractive growth despite tougher comps from last year’s record first quarter. And, on an FX neutral basis, we reported year-over-year increases in gross bookings, ASPs, revenues, and gross profit.”
“We are focused on pursuing organic and inorganic growth and profitability opportunities as competitive dynamics evolve in light of the weakening macro environment unfolding. We will not lose focus on our long-term growth strategy, while in the medium-term balancing growth versus profitability. We have the right strategy to create long term shareholder value, which will become increasingly evident as our business strategy continues gaining traction in the marketplace and macro conditions improve,” concluded Mr. Scokin.
2
Earnings Release 1Q 2019
Overview of First Quarter 2019 Results
Operating Metrics
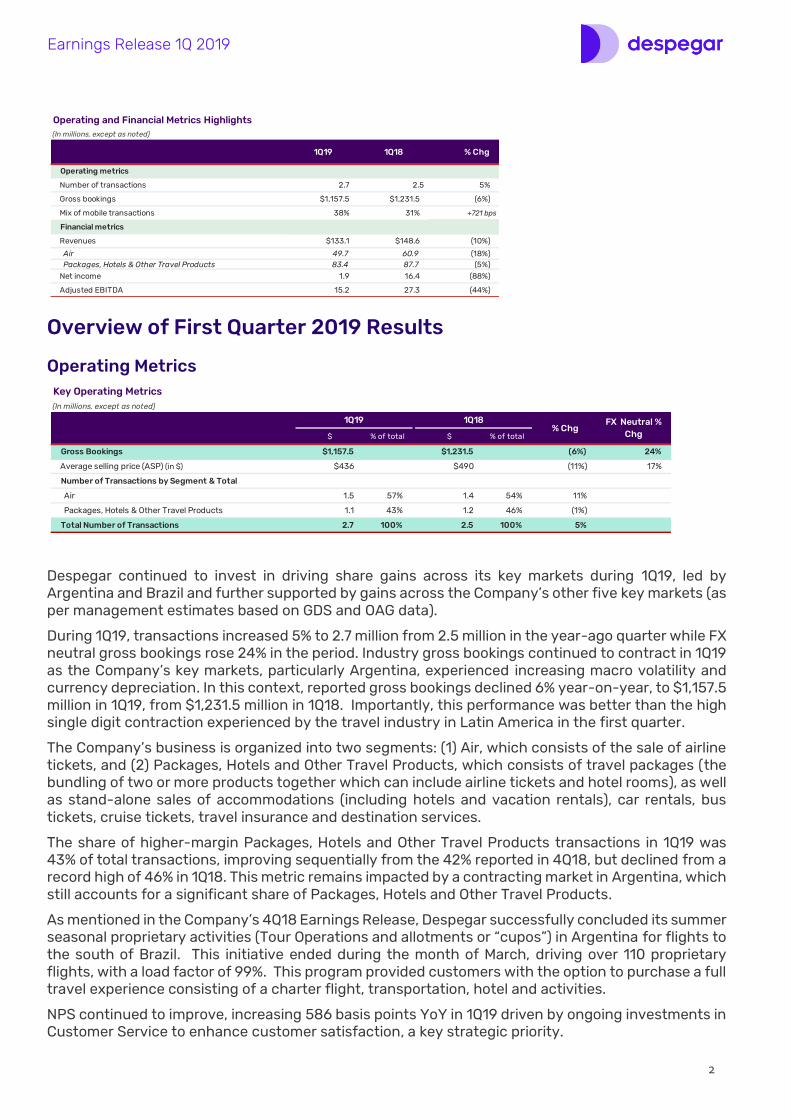
Despegar continued to invest in driving share gains across its key markets during 1Q19, led by Argentina and Brazil and further supported by gains across the Company’s other five key markets (as per management estimates based on GDS and OAG data).
During 1Q19, transactions increased 5% to 2.7 million from 2.5 million in the year-ago quarter while FX neutral gross bookings rose 24% in the period. Industry gross bookings continued to contract in 1Q19 as the Company’s key markets, particularly Argentina, experienced increasing macro volatility and currency depreciation. In this context, reported gross bookings declined 6% year-on-year, to $1,157.5 million in 1Q19, from $1,231.5 million in 1Q18. Importantly, this performance was better than the high single digit contraction experienced by the travel industry in Latin America in the first quarter.
The Company’s business is organized into two segments: (1) Air, which consists of the sale of airline tickets, and (2) Packages, Hotels and Other Travel Products, which consists of travel packages (the bundling of two or more products together which can include airline tickets and hotel rooms), as well as stand-alone sales of accommodations (including hotels and vacation rentals), car rentals, bus tickets, cruise tickets, travel insurance and destination services.
The share of higher-margin Packages, Hotels and Other Travel Products transactions in 1Q19 was 43% of total transactions, improving sequentially from the 42% reported in 4Q18, but declined from a record high of 46% in 1Q18. This metric remains impacted by a contracting market in Argentina, which still accounts for a significant share of Packages, Hotels and Other Travel Products.
As mentioned in the Company’s 4Q18 Earnings Release, Despegar successfully concluded its summer seasonal proprietary activities (Tour Operations and allotments or “cupos”) in Argentina for flights to the south of Brazil. This initiative ended during the month of March, driving over 110 proprietary flights, with a load factor of 99%. This program provided customers with the option to purchase a full travel experience consisting of a charter flight, transportation, hotel and activities.
NPS continued to improve, increasing 586 basis points YoY in 1Q19 driven by ongoing investments in Customer Service to enhance customer satisfaction, a key strategic priority.
Operating and Financial Metrics Highlights(In millions, except as noted)
1Q19 1Q18 % Chg
Operating metrics
Number of transactions 2.7 2.5 5%
Gross bookings $1,157.5 $1,231.5 (6%)
Mix of mobile transactions 38% 31% +721 bps
Financial metrics
Revenues $133.1 $148.6 (10%)
Air 49.7 60.9 (18%) Packages, Hotels & Other Travel Products 83.4 87.7 (5%)Net income 1.9 16.4 (88%)
Adjusted EBITDA 15.2 27.3 (44%)
Key Operating Metrics(In millions, except as noted)
$ % of total $ % of total
Gross Bookings $1,157.5 $1,231.5 (6%) 24%
Average selling price (ASP) (in $) $436 $490 (11%) 17%
Number of Transactions by Segment & Total
Air 1.5 57% 1.4 54% 11%
Packages, Hotels & Other Travel Products 1.1 43% 1.2 46% (1%)
Total Number of Transactions 2.7 100% 2.5 100% 5%
1Q19 1Q18% Chg
FX Neutral % Chg
3
Earnings Release 1Q 2019
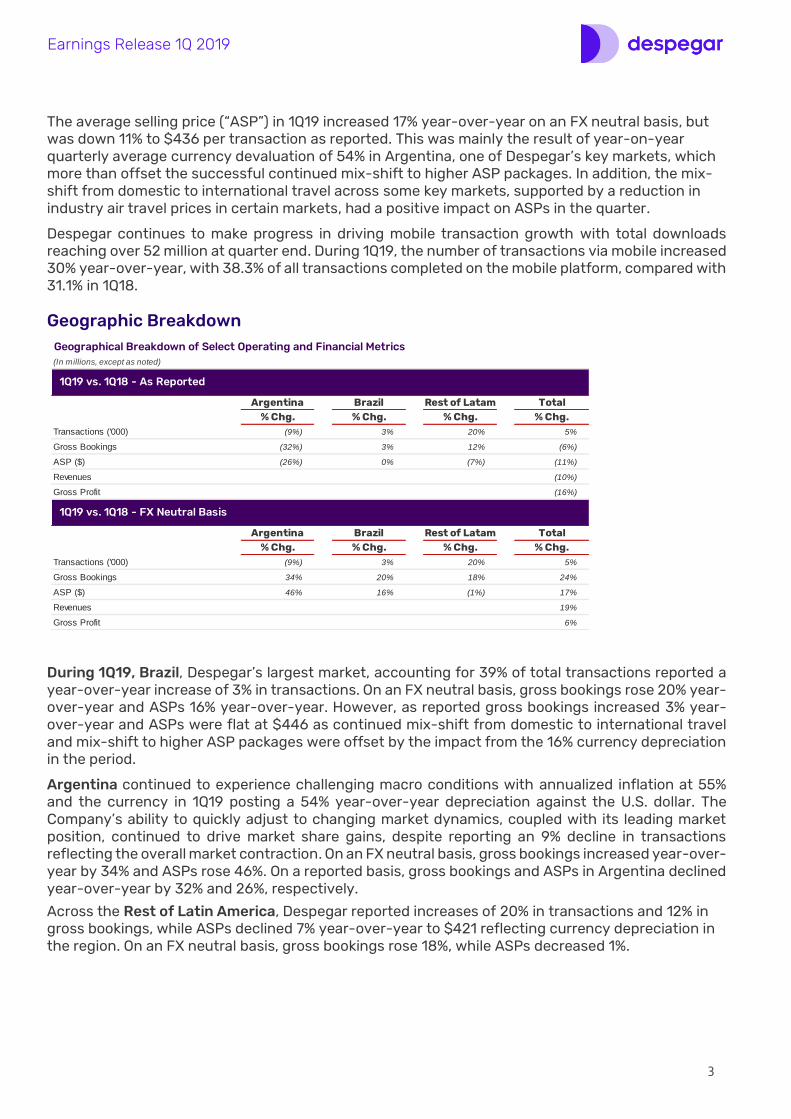
The average selling price (“ASP”) in 1Q19 increased 17% year-over-year on an FX neutral basis, but was down 11% to $436 per transaction as reported. This was mainly the result of year-on-year quarterly average currency devaluation of 54% in Argentina, one of Despegar’s key markets, which more than offset the successful continued mix-shift to higher ASP packages. In addition, the mix-shift from domestic to international travel across some key markets, supported by a reduction in industry air travel prices in certain markets, had a positive impact on ASPs in the quarter.
Despegar continues to make progress in driving mobile transaction growth with total downloads reaching over 52 million at quarter end. During 1Q19, the number of transactions via mobile increased 30% year-over-year, with 38.3% of all transactions completed on the mobile platform, compared with 31.1% in 1Q18.
Geographic Breakdown
During 1Q19, Brazil, Despegar’s largest market, accounting for 39% of total transactions reported a year-over-year increase of 3% in transactions. On an FX neutral basis, gross bookings rose 20% year-over-year and ASPs 16% year-over-year. However, as reported gross bookings increased 3% year-over-year and ASPs were flat at $446 as continued mix-shift from domestic to international travel and mix-shift to higher ASP packages were offset by the impact from the 16% currency depreciation in the period.
Argentina continued to experience challenging macro conditions with annualized inflation at 55% and the currency in 1Q19 posting a 54% year-over-year depreciation against the U.S. dollar. The Company’s ability to quickly adjust to changing market dynamics, coupled with its leading market position, continued to drive market share gains, despite reporting an 9% decline in transactions reflecting the overall market contraction. On an FX neutral basis, gross bookings increased year-over-year by 34% and ASPs rose 46%. On a reported basis, gross bookings and ASPs in Argentina declined year-over-year by 32% and 26%, respectively.
Across the Rest of Latin America, Despegar reported increases of 20% in transactions and 12% in gross bookings, while ASPs declined 7% year-over-year to $421 reflecting currency depreciation in the region. On an FX neutral basis, gross bookings rose 18%, while ASPs decreased 1%.
Geographical Breakdown of Select Operating and Financial Metrics(In millions, except as noted)
Argentina Brazil Rest of Latam Total% Chg. % Chg. % Chg. % Chg.
Transactions ('000) (9%) 3% 20% 5%
Gross Bookings (32%) 3% 12% (6%)
ASP ($) (26%) 0% (7%) (11%)
Revenues (10%)
Gross Profit (16%)
Argentina Brazil Rest of Latam Total% Chg. % Chg. % Chg. % Chg.
Transactions ('000) (9%) 3% 20% 5%
Gross Bookings 34% 20% 18% 24%
ASP ($) 46% 16% (1%) 17%
Revenues 19%
Gross Profit 6%
1Q19 vs. 1Q18 - As Reported
1Q19 vs. 1Q18 - FX Neutral Basis

4
Earnings Release 1Q 2019
Revenue
Total FX neutral revenue in 1Q19 increased 19% year-on-year as the Company continued to gain market share. However, as reported, revenue decreased 10% to $133.1 million in 1Q19, from $148.6 million in the year-ago period. This was principally due to the 11% year-on-year decline in ASP from the FX translation impact from currency depreciation. Additionally, a reduction in industry prices to adjust for lower purchasing power brought about by the unfavorable macro conditions in Argentina, was a contributing factor. These factors more than offset a positive reversal in mix shift in 1Q19 towards international travel versus domestic in some key markets.
Revenue margin declined 57 basis points year-on-year, to 11.5% in 1Q19. Two key factors contributed to this: 1) reductions in customer fees and discounts in package transactions taken place in the second quarter of 2018 to drive further share gains and 2) a reduction in air supplier volume bonuses as a result of lower demand. Sequentially, revenue margin increased 50 basis points due to customer fee increases and lower Package discounts during 1Q19 in certain markets. The improvement is notable as Q1 is a seasonally lower.
The year-on-year decline in revenue was mainly the result of lower revenues from Air and to a lesser extent from Packages, Hotels & Other Travel Products segments.
Air segment revenue was $49.7 million in the 1Q19, decreasing 18% year-over-year from $60.9 million in 1Q18. Transactions increased 11% year-on-year driving market share gains despite softer overall market growth. Higher volumes were more than offset by a 27% decline in average revenue per transaction, principally driven by the decline in ASPs resulting from the FX translation impact on domestic transactions, lower supplier pricing and the above noted Company’s strategy of lowering air customer fees in several markets last year to support share gains and drive additional cross-selling opportunities. This, together with a reduction in supplier volume bonuses due to lower demand, more than offset a positive mix-shift from domestic towards international travel this quarter across some key markets.
Packages, Hotels & Other Travel Products segment revenue declined 5% in 1Q19 to $83.4 million, from $87.7 million in the year-ago quarter. Transactions declined 1% impacted by the challenging macro environment in Argentina while revenue per transaction fell 4% impacted by the FX translation, lower air supplier prices, and the impact from discounts for package transactions introduced in 2018. This more than offset a positive mix-shift to international travel from domestic this quarter across some key markets. Excluding Argentina, transactions increased 10% YoY. The Packages, Hotels and Other Travel Products segment accounted for 63% of total revenue in 1Q19, up from 59% in 1Q18.
Revenue Breakdown1
$ % of total $ % of total
Revenue by business segment (in $Ms)
Air 49.7 37% 60.9 41% (18%)
Packages, Hotels & Other Travel Products 83.4 63% 87.7 59% (5%)
Total revenue $133.1 100% $148.6 100% (10%)
Revenue per transaction (in $)
Air 32.8 44.7 (27%)
Packages, Hotels & Other Travel Products 73.5 76.2 (4%)
Total revenue per transaction $50.2 $59.1 (15%)
Total revenue margin 11.5% 12.1% (57) bps
1. Net of sales tax
1Q19 1Q18% Chg

5
Earnings Release 1Q 2019
Cost of Revenue and Gross Profit
Cost of revenue, which mainly consists of credit card processing fees, bank fees related to customer financing installment plans offered and fulfillment center expenses, increased 4% year-on-year to $45.2 million in 1Q19 compared to $43.6 million in 1Q18. As a percentage of revenue, cost of revenue expanded by 462 basis points to 34.0% from 29.4% in 1Q18.
The year-on-year increase in cost of revenue was primarily driven by higher installment plan costs mainly reflecting increased interest rates despite a reduction in the availability and duration of installments in Argentina. To a lesser extent, higher fulfillment costs also contributed to higher cost of revenue, partially offset by a continued reduction in fraud. However, fulfillment cost per transaction declined 6% year-on-year reflecting higher operating leverage. These customer-oriented initiatives drove a 586-basis point year-on-year increase in after trip NPS.
On an FX neutral basis, gross profit increased 6% to $111.4 million. However, as reported gross profit, declined 16% year-on-year to $87.9 million in 1Q19, impacted by increases in cost of installments and to a lesser extent in fulfillment costs as discussed above.
Operating Expenses
Total operating expenses in 1Q19 decreased 2% year-over-year to $80.3 million, mainly benefitting from regional currency depreciation, principally in Argentina, which accounts for approximately half of total operating expenses. As a percentage of revenues, however, total operating expenses increased 545 basis points to 60.3%.
Selling and marketing (S&M) expenses declined 12% year-over-year to $40.9 million, from $46.4 million in 1Q18. On a per transaction basis, Despegar achieved savings of 18%, with S&M declining to $15.1 from $18.5 per transaction in 1Q18. Measured as a percentage of revenues, these expenses declined 48 basis points to 30.8% in 1Q19, mainly benefitting from more efficient marketing spend and the impact of regional currency depreciation on costs.
General and administrative (G&A) expenses increased 30% year-over-year to $20.6 million, from $15.9 million in 1Q18. As a percentage of revenues, G&A increased 481 basis points to 15.5% in 1Q19 from 10.7% in 1Q18 reflecting the impact of export rights tax on services introduced in Argentina in January 2019 equivalent to $1.9 million, a $1.8 million increase in
Cost of Revenue and Gross Profit(In millions, except as noted)
1Q19 1Q18 % Chg
Revenue $133.1 $148.6 (10%)
Cost of Revenue $45.2 $43.6 4%
% of revenues 34.0% 29.4% +462 bps
Gross Profit 87.9 104.9 (16%)
Gross Profit Margin 66.0% 70.6% (462) bps
Operating Expenses(In millions, except as noted)
1Q19 1Q18 % Chg
Selling and marketing $40.9 $46.4 (12%)
% of revenues 30.8% 31.2% -48 bps
General and administrative $20.6 $15.9 30%
% of revenues 15.5% 10.7% +481 bps
Technology and product development $18.7 $19.2 (3%)
% of revenues 14.1% 12.9% +112 bps
Total operating expenses $80.3 $81.5 (2%)
Total operating expenses as a % of revenues 60.3% 54.9% +545 bps

6
Earnings Release 1Q 2019
stock-based compensation, and a $0.8 million increase in administrative and professional fees in connection with the Company’s strategic initiatives.
Technology and product development expenses declined 3% year-over-year to $18.7 million in 1Q19, from $19.2 million in the prior year quarter reflecting lower USD expenses from currency depreciation in Argentina where the majority of headcount is based, partially offset by a 16% year-over-year increase in headcount as the Company continues to introduce new services and functionalities on its platform. As a percentage of revenue, technology and product expenses increased by 112 basis points year-over-year to 14.1%.
Financial Income/Expenses
In 1Q19, the Company reported a net financial expense of $5.2 million compared to $2.8 million in 1Q18. The increase was primarily due to higher credit card receivable factoring expenses in Brazil due to the increase in the discounted amounts and foreign exchange losses given the currency devaluation in Argentina and Brazil. Financial expenses were partially offset by higher interest income from invested cash balances.
Income Taxes
The Company reported an income tax expense of $0.5 million in 1Q19, compared to $4.2 million in 1Q18. The effective tax rate in 1Q19 was 20.3%, compared to 20.6% in 1Q18. The decrease in the effective rate is primarily driven by the geographical mix of profits and losses.
Adjusted EBITDA & Margin
Adjusted EBITDA declined 44%, or $12.1 million, to $15.2 million in 1Q19 from $27.3 million in 1Q18.
Adjusted EBITDA margin contracted to 11.4% from 18.4% in the prior year quarter, primarily resulting from lower year-on-year customer fees in air and price discounts in packages introduced in 2018 to support top line growth and lower supplier bonuses from softer volumes. Higher installment expense to drive top line growth and lower operating leverage also impacted Adjusted EBITDA margin.
Balance Sheet and Cash Flow
Unrestricted cash and cash equivalents, including restricted cash, at March 31, 2019 was $316.0 million. During the quarter, cash and cash equivalents decreased by $36.1 million, while the total debt balance decreased by $22.7 million.
Despegar reported a use of cash flow from operating activities of $5.6 million in 1Q19 compared to cash generation of $14.2 million in 1Q18. This usage of cash resulted mainly from a decrease in the Company’s travel supplier payables resulting from lower year-over-year sales, an increase in other assets and prepaid expense balances, and lower net income. This was partially offset by a decrease in the credit card receivables balance driven by Brazil and Argentina reflecting higher factored amounts and lower US$ gross bookings growth, respectively.
Adjusted EBITDA Reconciliation & Adjusted EBITDA Margin(In millions, except as noted)
1Q19 1Q18 % Chg
Net income/ (loss) $1.9 $16.4 (88%)
Add (deduct):
Financial expense, net 5.2 2.8 84%
Income tax expense 0.5 4.2 (89%)
Depreciation expense 0.8 0.9 (2%)
Amortization of intangible assets 3.8 2.0 86%
Share-based compensation expense 3.0 1.0 205%
Adjusted EBITDA $15.2 $27.3 (44%)
Adjusted EBITDA Margin 11.4% 18.4% (696) bps
7
Earnings Release 1Q 2019
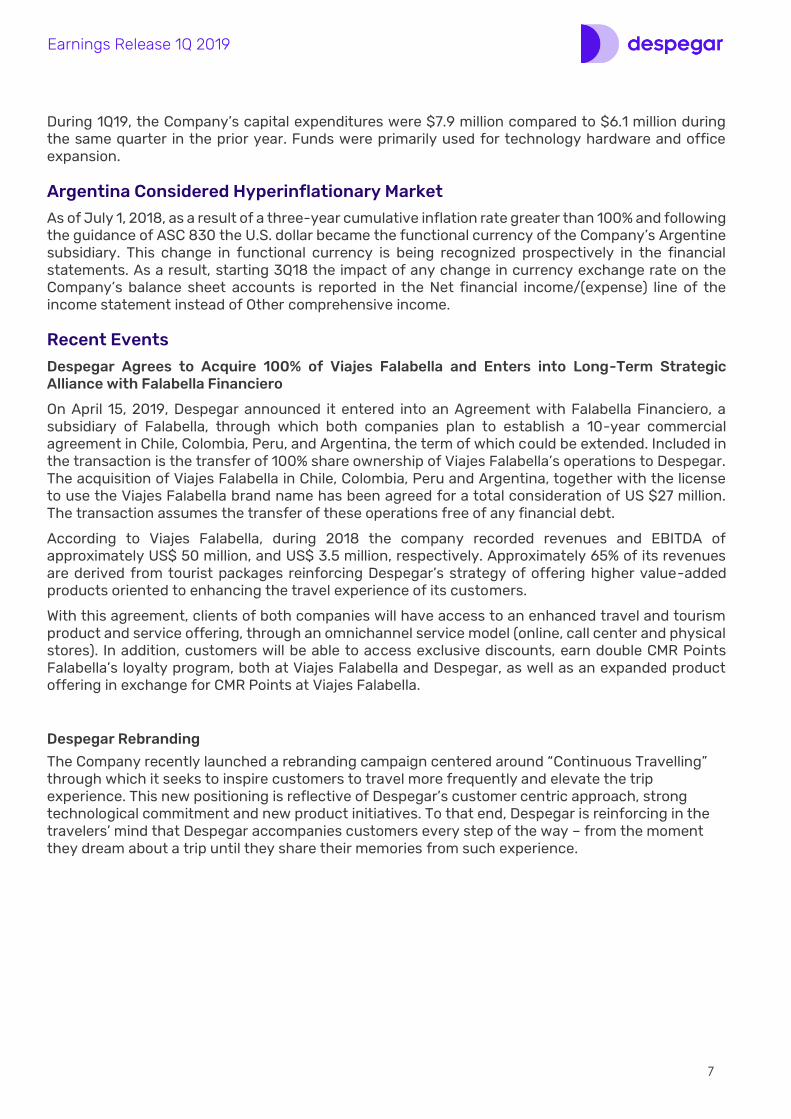
During 1Q19, the Company’s capital expenditures were $7.9 million compared to $6.1 million during the same quarter in the prior year. Funds were primarily used for technology hardware and office expansion.
Argentina Considered Hyperinflationary Market
As of July 1, 2018, as a result of a three-year cumulative inflation rate greater than 100% and following the guidance of ASC 830 the U.S. dollar became the functional currency of the Company’s Argentine subsidiary. This change in functional currency is being recognized prospectively in the financial statements. As a result, starting 3Q18 the impact of any change in currency exchange rate on the Company’s balance sheet accounts is reported in the Net financial income/(expense) line of the income statement instead of Other comprehensive income.
Recent Events
Despegar Agrees to Acquire 100% of Viajes Falabella and Enters into Long-Term Strategic Alliance with Falabella Financiero
On April 15, 2019, Despegar announced it entered into an Agreement with Falabella Financiero, a subsidiary of Falabella, through which both companies plan to establish a 10-year commercial agreement in Chile, Colombia, Peru, and Argentina, the term of which could be extended. Included in the transaction is the transfer of 100% share ownership of Viajes Falabella’s operations to Despegar. The acquisition of Viajes Falabella in Chile, Colombia, Peru and Argentina, together with the license to use the Viajes Falabella brand name has been agreed for a total consideration of US $27 million. The transaction assumes the transfer of these operations free of any financial debt.
According to Viajes Falabella, during 2018 the company recorded revenues and EBITDA of approximately US$ 50 million, and US$ 3.5 million, respectively. Approximately 65% of its revenues are derived from tourist packages reinforcing Despegar’s strategy of offering higher value-added products oriented to enhancing the travel experience of its customers.
With this agreement, clients of both companies will have access to an enhanced travel and tourism product and service offering, through an omnichannel service model (online, call center and physical stores). In addition, customers will be able to access exclusive discounts, earn double CMR Points Falabella’s loyalty program, both at Viajes Falabella and Despegar, as well as an expanded product offering in exchange for CMR Points at Viajes Falabella.
Despegar Rebranding
The Company recently launched a rebranding campaign centered around “Continuous Travelling” through which it seeks to inspire customers to travel more frequently and elevate the trip experience. This new positioning is reflective of Despegar’s customer centric approach, strong technological commitment and new product initiatives. To that end, Despegar is reinforcing in the travelers’ mind that Despegar accompanies customers every step of the way – from the moment they dream about a trip until they share their memories from such experience.

8
Earnings Release 1Q 2019
1Q19 Earnings Conference Call
When: 8:00 a.m. Eastern time, May 9, 2019
Who: Mr. Damián Scokin, Chief Executive Officer Mr. Alberto López-Gaffney, Chief Financial Officer Mr. Javier Kelly Grinner, Investor Relations
Dial-in: 1-866-270-1533 (U.S. domestic); 1-412-317-0797 (international)
Webcast: CLICK HERE
Definitions and concepts
Average Selling Price (ASP): reflects gross bookings divided by the total number of transactions. Gross Bookings: Gross bookings is an operating measure that represents the aggregate purchase price of all travel products booked by the Company’s customers through its platform during a given period. The Company generates substantially all of its revenue from commissions and other incentive payments paid by its suppliers and service fees paid by its customers for transactions through its platform, and, as a result, it monitors gross bookings as an important indicator of its ability to generate revenue. Foreign Exchange (“FX”) Neutral calculated by using the average monthly exchange rate of each month of 2018 and applying it to the corresponding months in the current year, so as to calculate what the results would have been had exchange rates remained constant. These calculations do not include any other macroeconomic effect such as local currency inflation effects. Number of Transactions: The number of transactions for a period is an operating measure that represents the total number of customer orders completed on our platform in such period. The number of transactions is an important metric because it is an indicator of the level of engagement with the Company’s customers and the scale of its business from period to period but, unlike gross bookings, the number of transactions is independent of the average selling price of each transaction, which can be influenced by fluctuations in currency exchange rates among other factors. Revenue: The Company reports its revenue on a net basis, and in some cases on a gross basis, deducting cancellations and amounts that it collects as sales taxes. Despegar derives substantially all of its revenue from commissions and other incentive payments paid by its suppliers and service fees paid by its customers for transactions through its platform. To a lesser extent, Despegar also derives revenue from the sale of third-party advertisements on its websites and from certain suppliers when their brands appears in the Company advertisements in mass media. Revenue Margin: calculated as revenue divided by gross bookings. Seasonality: Despegar’s financial results experience fluctuations due to seasonal variations in demand for travel services. Bookings for vacation and leisure travel are generally higher during the fourth quarter, although to date and prior to the revenue recognition change beginning in the first quarter of 2018, the Company has recognized more revenue associated with those bookings in the fourth quarter of each year. Latin American travelers, particularly leisure travelers, who are Despegar’s primary customers, tend to travel most frequently at the end of the fourth quarter and during the first quarter of each year.

9
Earnings Release 1Q 2019
About Despegar.com Despegar is the leading online travel company in Latin America. With over two decades of business experience and operating in 20 countries in the region, Despegar accompanies Latin American travelers from the moment they dream of taking a trip until they share their memories of that trip. Thanks to the strong commitment to technological development and customer service, Despegar offers a customized experience to more than 18 million customers.
Despegar’s websites and leading mobile apps, offer products from over 270 airlines, more than 512,000 accommodation options, as well as approximately 1,190 car rental agencies and approximately 326 destination services suppliers with more than 5,690 activities throughout Latin America. The Company owns and operates two well-recognized brands, Despegar, its global brand, and Decolar, its Brazilian brand. Despegar is traded on the New York Stock Exchange (NYSE: DESP). For more information, please visit www.despegar.com.
Forward-Looking Statements
This press release includes forward-looking statements. We base these forward-looking statements on our current beliefs, expectations and projections about future events and financial trends affecting our business and our market. Many important factors could cause our actual results to differ substantially from those anticipated in our forward-looking statements. Forward-looking statements are not guarantees of future performance. Forward-looking statements speak only as of the date they are made, and we undertake no obligation to update publicly or to revise any forward-looking statements.
Investor Relations Contact
Javier Kelly Grinner Investor Relations Phone: (+5411) 5173 3501 E-mail: [email protected]
-- Financial Tables Follow --
10
Earnings Release 1Q 2019
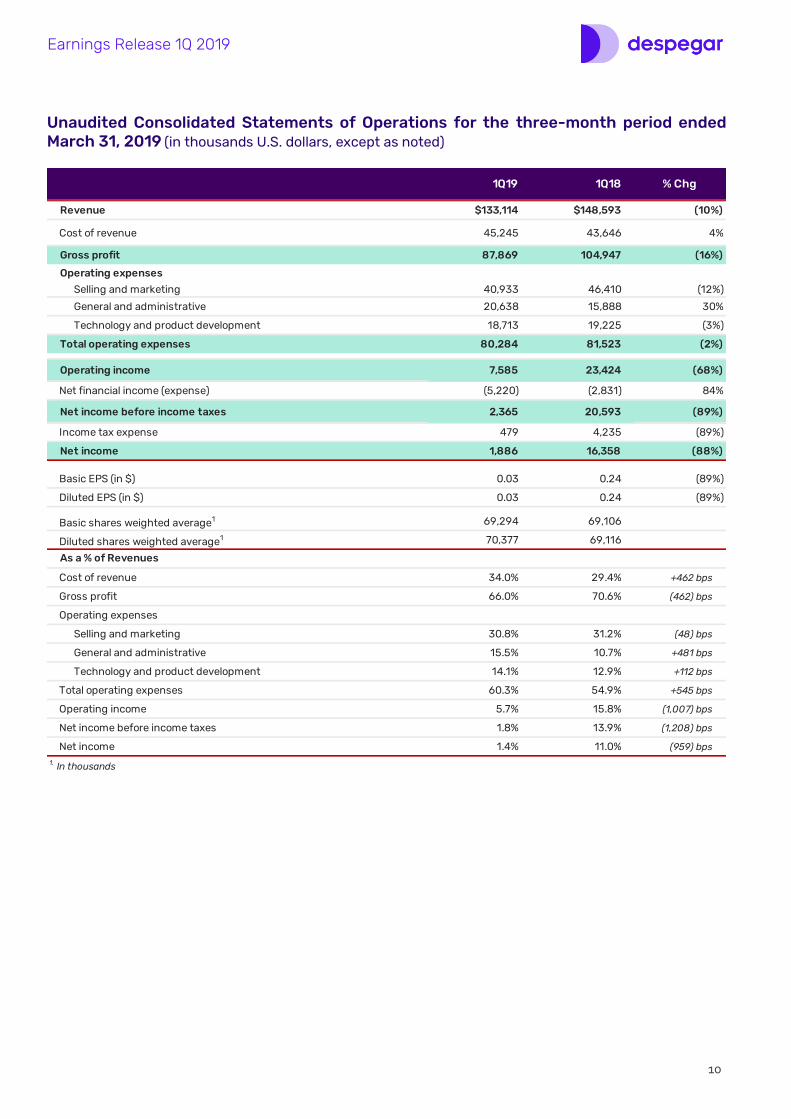
Unaudited Consolidated Statements of Operations for the three-month period ended March 31, 2019 (in thousands U.S. dollars, except as noted)
1Q19 1Q18 % Chg
Revenue $133,114 $148,593 (10%)
Cost of revenue 45,245 43,646 4%
Gross profit 87,869 104,947 (16%)
Operating expenses
Selling and marketing 40,933 46,410 (12%)
General and administrative 20,638 15,888 30%
Technology and product development 18,713 19,225 (3%)
Total operating expenses 80,284 81,523 (2%)
Operating income 7,585 23,424 (68%)
Net financial income (expense) (5,220) (2,831) 84%
Net income before income taxes 2,365 20,593 (89%)
Income tax expense 479 4,235 (89%)
Net income 1,886 16,358 (88%)
Basic EPS (in $) 0.03 0.24 (89%)
Diluted EPS (in $) 0.03 0.24 (89%)
Basic shares weighted average1 69,294 69,106
Diluted shares weighted average1 70,377 69,116
As a % of Revenues
Cost of revenue 34.0% 29.4% +462 bps
Gross profit 66.0% 70.6% (462) bps
Operating expenses
Selling and marketing 30.8% 31.2% (48) bps
General and administrative 15.5% 10.7% +481 bps
Technology and product development 14.1% 12.9% +112 bps
Total operating expenses 60.3% 54.9% +545 bps
Operating income 5.7% 15.8% (1,007) bps
Net income before income taxes 1.8% 13.9% (1,208) bps
Net income 1.4% 11.0% (959) bps
1. In thousands
11
Earnings Release 1Q 2019
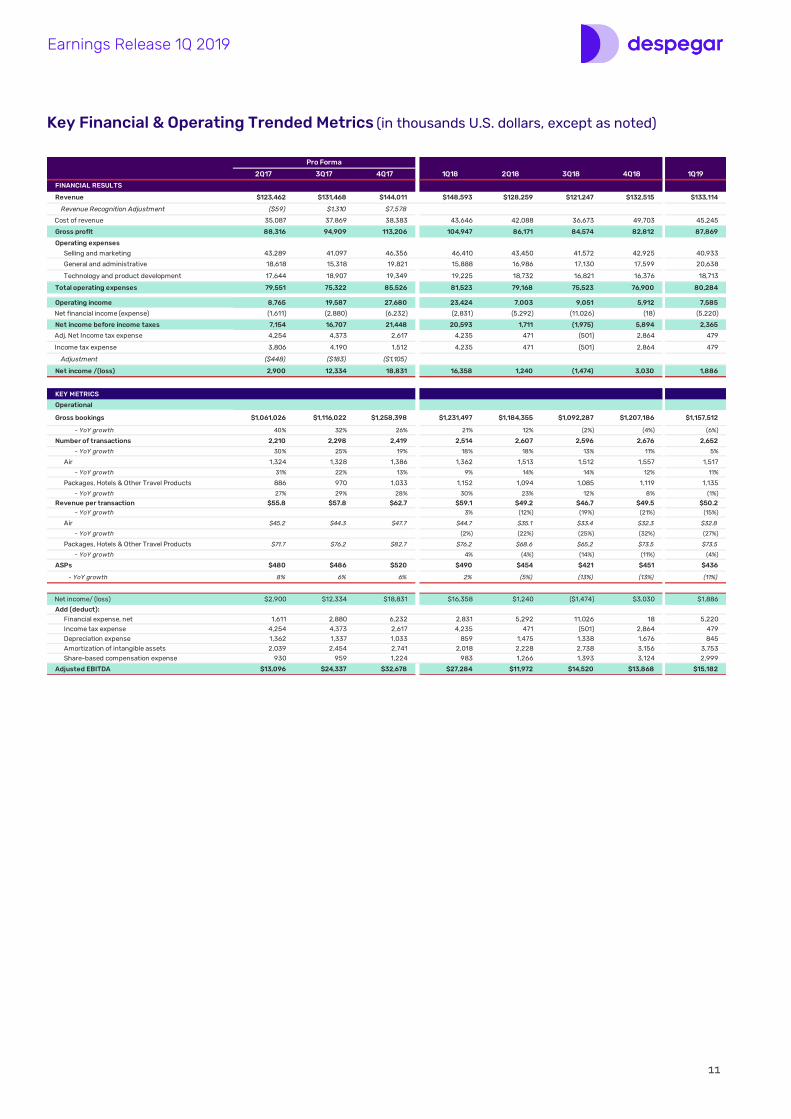
Key Financial & Operating Trended Metrics (in thousands U.S. dollars, except as noted)
2Q17 3Q17 4Q17 1Q18 2Q18 3Q18 4Q18 1Q19
FINANCIAL RESULTS
Revenue $123,462 $131,468 $144,011 $148,593 $128,259 $121,247 $132,515 $133,114
Revenue Recognition Adjustment ($59) $1,310 $7,578
Cost of revenue 35,087 37,869 38,383 43,646 42,088 36,673 49,703 45,245
Gross profit 88,316 94,909 113,206 104,947 86,171 84,574 82,812 87,869
Operating expenses
Selling and marketing 43,289 41,097 46,356 46,410 43,450 41,572 42,925 40,933
General and administrative 18,618 15,318 19,821 15,888 16,986 17,130 17,599 20,638
Technology and product development 17,644 18,907 19,349 19,225 18,732 16,821 16,376 18,713
Total operating expenses 79,551 75,322 85,526 81,523 79,168 75,523 76,900 80,284
Operating income 8,765 19,587 27,680 23,424 7,003 9,051 5,912 7,585
Net financial income (expense) (1,611) (2,880) (6,232) (2,831) (5,292) (11,026) (18) (5,220)
Net income before income taxes 7,154 16,707 21,448 20,593 1,711 (1,975) 5,894 2,365
Adj. Net Income tax expense 4,254 4,373 2,617 4,235 471 (501) 2,864 479
Income tax expense 3,806 4,190 1,512 4,235 471 (501) 2,864 479
Adjustment ($448) ($183) ($1,105)
Net income /(loss) 2,900 12,334 18,831 16,358 1,240 (1,474) 3,030 1,886
KEY METRICS
Operational
Gross bookings $1,061,026 $1,116,022 $1,258,398 $1,231,497 $1,184,355 $1,092,287 $1,207,186 $1,157,512
- YoY growth 40% 32% 26% 21% 12% (2%) (4%) (6%)
Number of transactions 2,210 2,298 2,419 2,514 2,607 2,596 2,676 2,652
- YoY growth 30% 25% 19% 18% 18% 13% 11% 5%
Air 1,324 1,328 1,386 1,362 1,513 1,512 1,557 1,517
- YoY growth 31% 22% 13% 9% 14% 14% 12% 11%
Packages, Hotels & Other Travel Products 886 970 1,033 1,152 1,094 1,085 1,119 1,135
- YoY growth 27% 29% 28% 30% 23% 12% 8% (1%)
Revenue per transaction $55.8 $57.8 $62.7 $59.1 $49.2 $46.7 $49.5 $50.2 - YoY growth 3% (12%) (19%) (21%) (15%)
Air $45.2 $44.3 $47.7 $44.7 $35.1 $33.4 $32.3 $32.8
- YoY growth (2%) (22%) (25%) (32%) (27%)
Packages, Hotels & Other Travel Products $71.7 $76.2 $82.7 $76.2 $68.6 $65.2 $73.5 $73.5
- YoY growth 4% (4%) (14%) (11%) (4%)
ASPs $480 $486 $520 $490 $454 $421 $451 $436
- YoY growth 8% 6% 6% 2% (5%) (13%) (13%) (11%)
Net income/ (loss) $2,900 $12,334 $18,831 $16,358 $1,240 ($1,474) $3,030 $1,886
Add (deduct): Financial expense, net 1,611 2,880 6,232 2,831 5,292 11,026 18 5,220 Income tax expense 4,254 4,373 2,617 4,235 471 (501) 2,864 479 Depreciation expense 1,362 1,337 1,033 859 1,475 1,338 1,676 845 Amortization of intangible assets 2,039 2,454 2,741 2,018 2,228 2,738 3,156 3,753 Share-based compensation expense 930 959 1,224 983 1,266 1,393 3,124 2,999
Adjusted EBITDA $13,096 $24,337 $32,678 $27,284 $11,972 $14,520 $13,868 $15,182
Pro Forma

12
Earnings Release 1Q 2019
Unaudited Consolidated Balance Sheets as of March 31, 2019 (in thousands U.S. dollars, except as noted)
As of March 31, 2019 As of December 31, 2018
ASSETS
Current assets
Cash and cash equivalents $311,657 $346,480
Restricted cash and cash equivalents $4,390 $5,709
Accounts receivable, net of allowances $214,173 $228,448
Related party receivable 8,606 8,653
Other current assets and prepaid expenses 75,877 68,471
Total current assets 614,703 657,761
Non-current assets
Other Assets 14,119 12,751
Restricted cash and cash equivalents – –
Right of use 5,818 –
Property and equipment net 19,767 19,716
Intangible assets, net 40,745 37,512
Goodwill 36,162 36,207
Total non-current assets 116,611 106,186
TOTAL ASSETS 731,314 763,947
LIABILITIES AND SHAREHOLDERS’ DEFICIT
Current liabilities
Accounts payable and accrued expenses 46,086 42,353
Travel suppliers payable 160,988 185,450
Related party payable 82,378 83,904
Loans and other financial liabilities 8,423 31,162
Deferred Revenue 8,560 8,229
Other liabilities 35,345 33,270
Contingent liabilities 4,082 4,794
Total current liabilities 345,862 389,162
Non-current liabilities
Other liabilities 361 243
Contingent liabilities 2,052 1,968
Lease liabilities 5,456 –
Related party liability 125,000 125,000
Total non-current liabilities 132,869 127,211
TOTAL LIABILITIES 478,731 516,373
SHAREHOLDERS’ EQUITY (DEFICIT)
Common stock 259,781 255,254
Additional paid-in capital 320,099 321,627
Other reserves (728) (728)
Accumulated other comprehensive income 3,175 3,051
Accumulated losses (303,714) (305,600)
Treasury Stock (26,030) (26,030)
Total Shareholders' Equity Attributable / (Deficit) to Despegar.com Corp 252,583 247,574
TOTAL LIABILITIES AND SHAREHOLDERS’ EQUITY 731,314 763,947

13
Earnings Release 1Q 2019
Unaudited Statements of Cash Flows for the three-month period ended March 31, 2019 and 2018 (in thousands U.S. dollars, except as noted)
2019 2018
Cash flows from operating activities
Net income $1,886 $16,358
Adjustments to reconcile net income to net cash flow from operating activities
Unrealized foreign currency translation losses 2,120 367
Depreciation expense 845 859
Amortization of intangible assets 3,753 2,018
Stock based compensation expense 2,999 983
Interest and penalties 241 257
Income taxes (375) 2,865
Allowance for doubtful accounts 497 643
Provision / (recovery) for contingencies (464) 515
Changes in assets and liabilities, net of non-cash transactions
(Increase) / Decrease in accounts receivable, net of allowances 13,683 (17,767)
(Increase) / Decrease in related party receivables 45 (825)
(Increase) / Decrease in other assets and prepaid expenses (9,015) (10,320)
Increase / (Decrease) in accounts payable and accrued expenses 3,661 9,597
Increase / (Decrease) in travel suppliers payable (26,925) 4,034
Increase / (Decrease) in other liabilities 2,418 (4,627)
Increase / (Decrease) in contingencies (208) (603)
Increase / (Decrease) in related party liabilities (1,129) 10,542
Increase / (Decrease) in deferred revenue 332 (662)
Net cash flows provided by / (used in) operating activities (5,636) 14,234
Cash flows from investing activities
Payments for short-term investments – –
Acquisition of property and equipment (914) (3,413)
Increase of intangible assets including internal-use software and website development (6,961) (2,645)
(Increase) / Decrease in restricted cash and cash equivalents – –
Net cash (used in) /provided by investing activities (7,875) (6,058)
Cash flows from financing activities
Increase / (Decrease) in loans and other financial liabilities (23,416) 7,019
Capital contributions – –
Lease obligations (362) –
Treasury Stock –
Net cash (used in) / provided by financing activities (23,778) 7,019
Effect of exchange rate changes on cash, cash equivalents and restricted cash 1,147 (623)
Net increase / (decrease) in cash, cash equivalents and restricted cash (36,142) 14,572
Cash, cash equivalents and restricted cash as of beginning of the period 352,189 410,777
Cash, cash equivalents and restricted cash as of end of the period 316,047 425,349
3 months ended March 31,
14
Earnings Release 1Q 2019
Use of Non-GAAP Financial Measures This announcement includes certain references to Adjusted EBITDA and non-GAAP financial measures. The Company defines: Adjusted EBITDA is defined as net income/(loss) exclusive of financial income/(expense), income tax, depreciation, amortization and share-based compensation expense. Free cash flow is defined as cash flow from operating activities less capital expenditures including capitalized software. Adjusted EBITDA and Free cash flow are not measures recognized under U.S. GAAP. Accordingly, readers are cautioned not to place undue reliance on this information and should note that these measures as calculated by the Company, differ materially from similarly titled measures reported by other companies, including its competitors. Adjusted EBITDA margin refers to Adjusted EBITDA as defined above divided by revenue. To supplement our consolidated financial statements presented in accordance with U.S. GAAP, we use foreign exchange (“FX”) neutral measures. This non-GAAP measure should not be considered in isolation or as a substitute for measures of performance prepared in accordance with U.S. GAAP and may be different from non-GAAP measures used by other companies. In addition, this non-GAAP measure is not based on any comprehensive set of accounting rules or principles. Non-GAAP measures have limitations in that they do not reflect all of the amounts associated with our results of operations as determined in accordance with U.S. GAAP. This non-GAAP financial measure should only be used to evaluate our results of operations in conjunction with the most comparable U.S. GAAP financial measures. Reconciliation of this non-GAAP financial measure to the most comparable U.S. GAAP financial measures can be found in the tables included in this quarterly report. The Company believes that reconciliation of FX neutral measures to the most directly comparable GAAP measure provides investors an overall understanding of our current financial performance and its prospects for the future. Specifically, we believe this non-GAAP measure provide useful information to both management and investors by excluding the foreign currency exchange rate impact that may not be indicative of our core operating results and business outlook. The FX neutral measures were calculated by using the average monthly exchange rates for each month during 2017 and applying them to the corresponding months in 2018, so as to calculate what our results would have been had exchange rates remained stable from one year to the next. The table below excludes intercompany allocation FX effects. Finally, this measure does not include any other macroeconomic effect such as local currency inflation effects, the impact on impairment calculations or any price adjustment to compensate local currency inflation or devaluations. The following table sets forth the FX neutral measures related to our reported results of the operations for the three-month period ended March 31, 2019:

15
Earnings Release 1Q 2019
Geographical Breakdown of Select Operating and Financial Metrics(In millions, except as noted)
1Q19 1Q18 % Chg. 1Q19 1Q18 % Chg. 1Q19 1Q18 % Chg. 1Q19 1Q18 % Chg.Transactions ('000) 618 675 (9%) 1,045 1,013 3% 989 826 20% 2,652 2,514 5%
Gross Bookings 275 407 (32%) 466 452 3% 416 373 12% 1,158 1,232 (6%)
ASP ($) 445 603 (26%) 446 446 0% 421 451 (7%) 436 490 (11%)
Revenues 133 149 (10%)
Gross Profit 88 105 (16%)
1Q19 1Q18 % Chg. 1Q19 1Q18 % Chg. 1Q19 1Q18 % Chg. 1Q19 1Q18 % Chg.Transactions ('000) 618 675 (9%) 1,045 1,013 3% 989 826 20% 2,652 2,514 5%
Gross Bookings 545 407 34% 541 452 20% 440 373 18% 1,526 1,232 24%
ASP ($) 882 603 46% 518 446 16% 445 451 (1%) 575 490 17%
Revenues 177 149 19%
Gross Profit 111 105 6%
1Q19 vs. 1Q18 - As Reported
Argentina
Argentina Brazil Rest of Latin America Total
Brazil Rest of Latin America Total
1Q19 vs. 1Q18 - FX Neutral Basis