Embed Size (px)
Citation preview

1
Announcements
• Next Tuesday (March 12th). Department meeting.– Ms. Liron’s office hours start at 2:15pm
• TAKE NOTES! fill in the blanks!

2
Exam2 – Coding Review
3
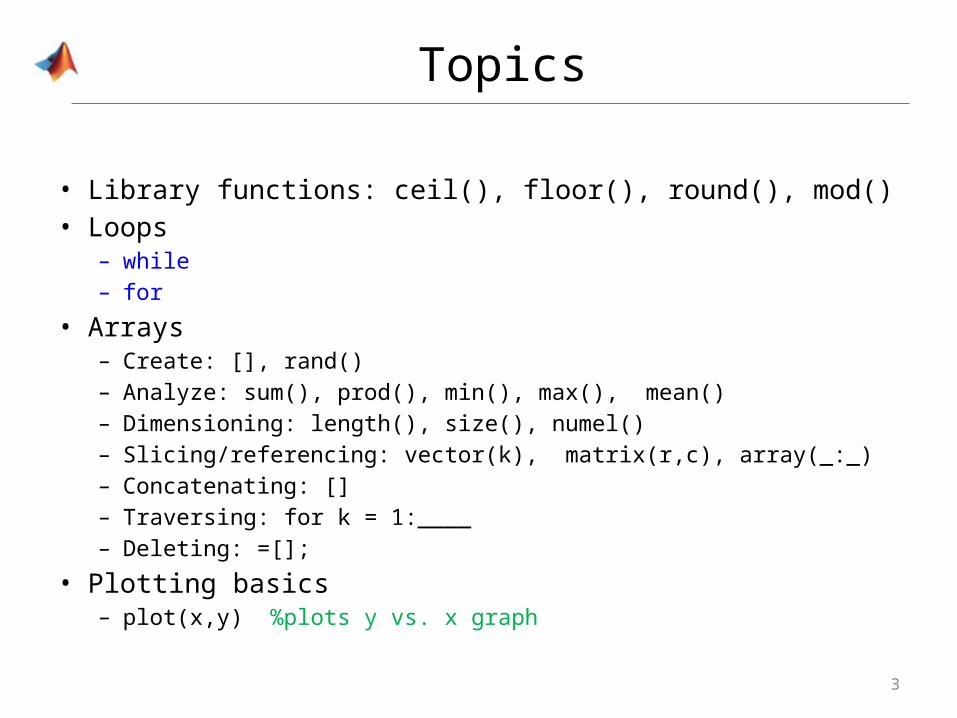
Topics
• Library functions: ceil(), floor(), round(), mod()• Loops
– while– for
• Arrays – Create: [], rand()– Analyze: sum(), prod(), min(), max(), mean()– Dimensioning: length(), size(), numel()– Slicing/referencing: vector(k), matrix(r,c), array(_:_)– Concatenating: []– Traversing: for k = 1:____– Deleting: =[];
• Plotting basics– plot(x,y) %plots y vs. x graph
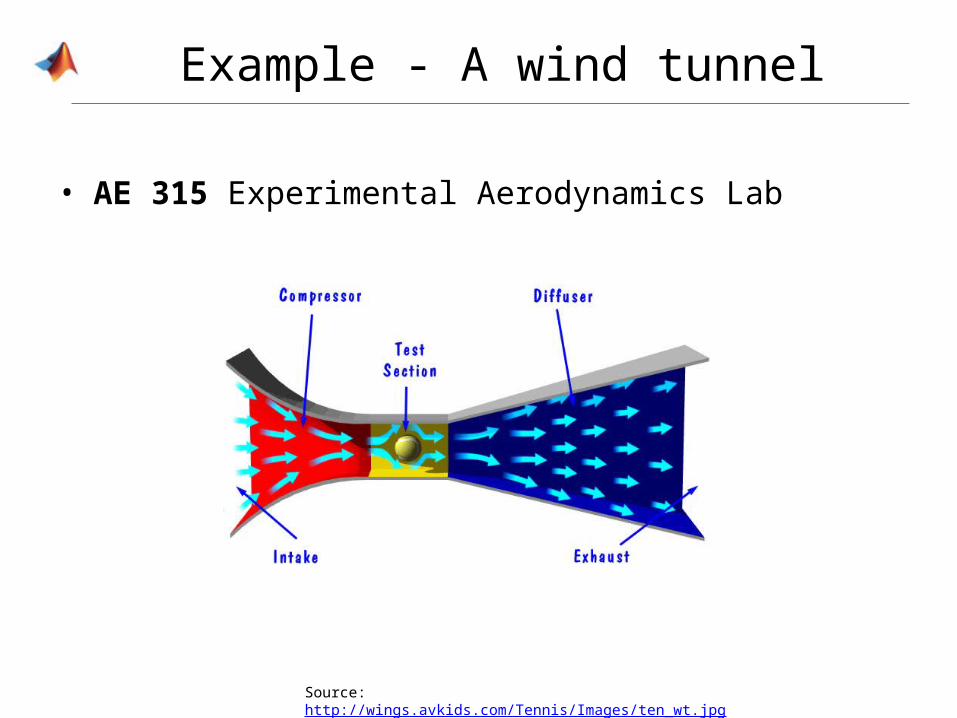
Example - A wind tunnel
• AE 315 Experimental Aerodynamics Lab
Source: http://wings.avkids.com/Tennis/Images/ten_wt.jpg
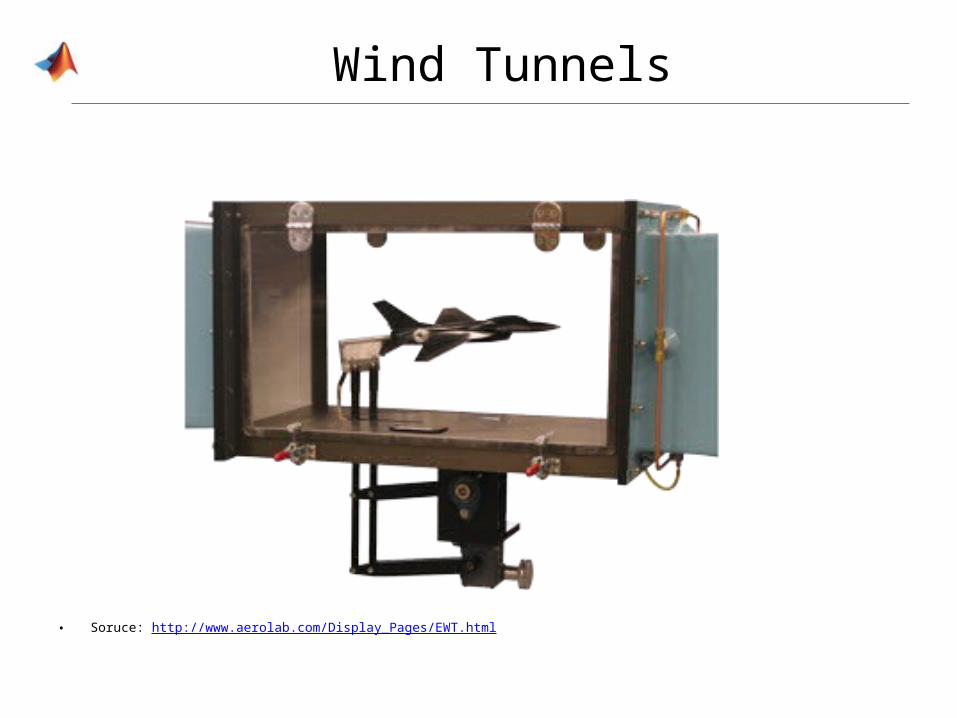
Wind Tunnels
• Soruce: http://www.aerolab.com/Display_Pages/EWT.html
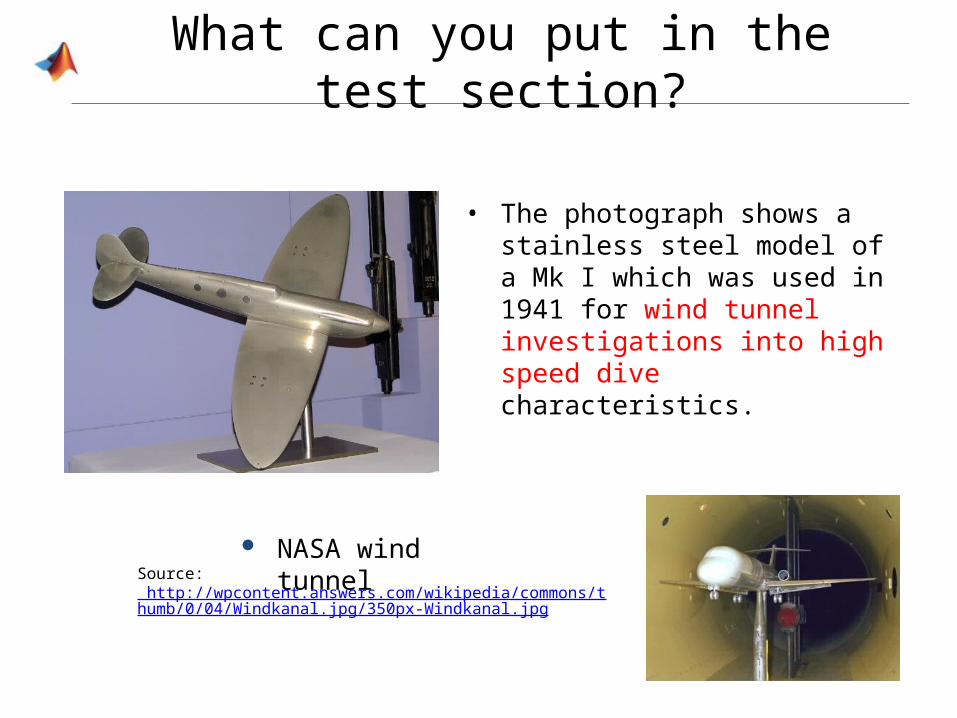
What can you put in the test section?
• The photograph shows a stainless steel model of a Mk I which was used in 1941 for wind tunnel investigations into high speed dive characteristics.
Source: http://wpcontent.answers.com/wikipedia/commons/thumb/0/04/Windkanal.jpg/350px-Windkanal.jpg
NASA wind tunnel
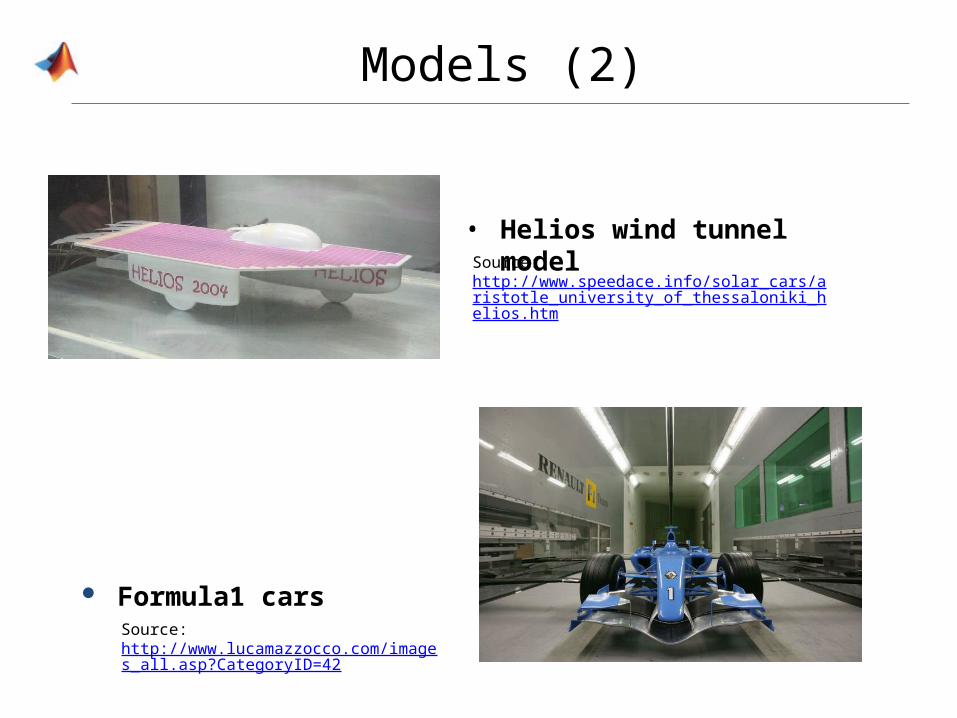
Models (2)
• Helios wind tunnel modelSource: http://www.speedace.info/solar_cars/aristotle_university_of_thessaloniki_helios.htm
Formula1 carsSource: http://www.lucamazzocco.com/images_all.asp?CategoryID=42
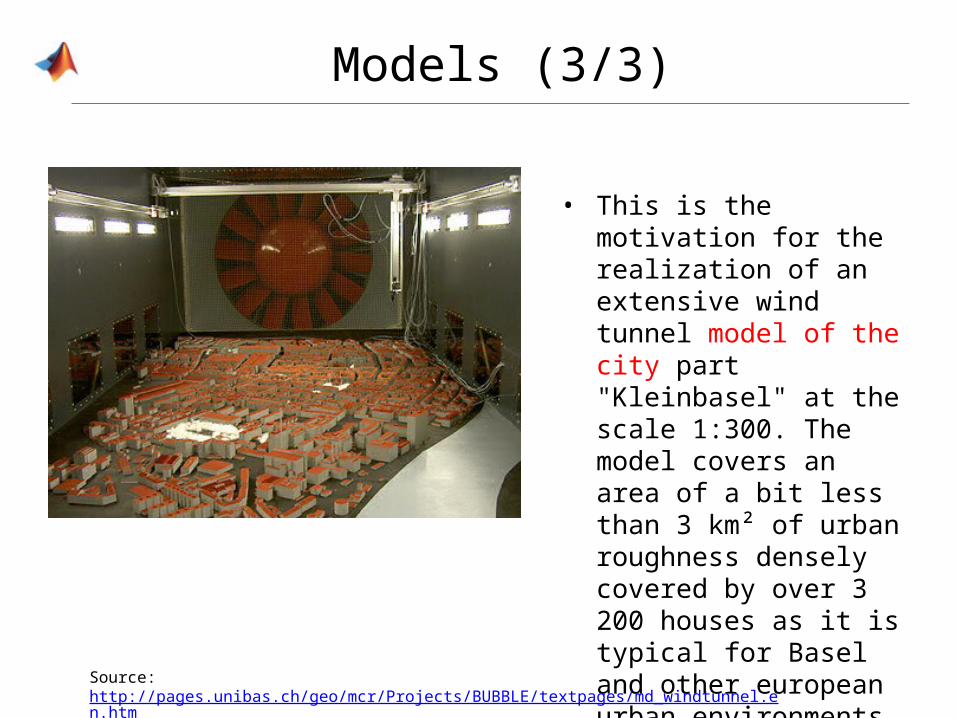
Models (3/3)
• This is the motivation for the realization of an extensive wind tunnel model of the city part "Kleinbasel" at the scale 1:300. The model covers an area of a bit less than 3 km² of urban roughness densely covered by over 3 200 houses as it is typical for Basel and other european urban environments of comparable size.
Source: http://pages.unibas.ch/geo/mcr/Projects/BUBBLE/textpages/md_windtunnel.en.htm
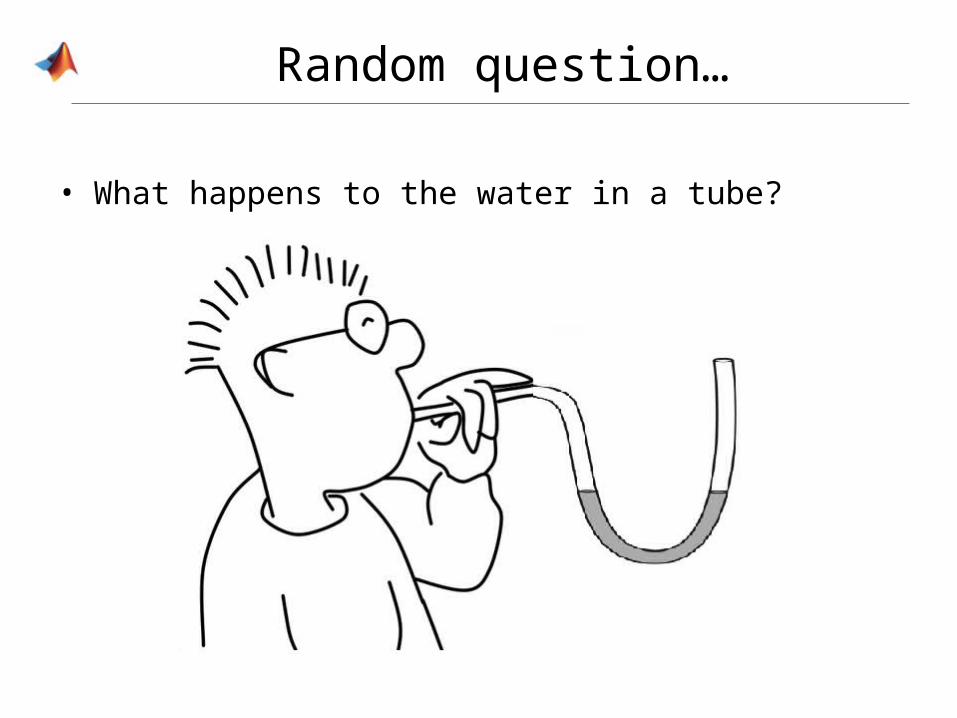
Random question…
• What happens to the water in a tube?
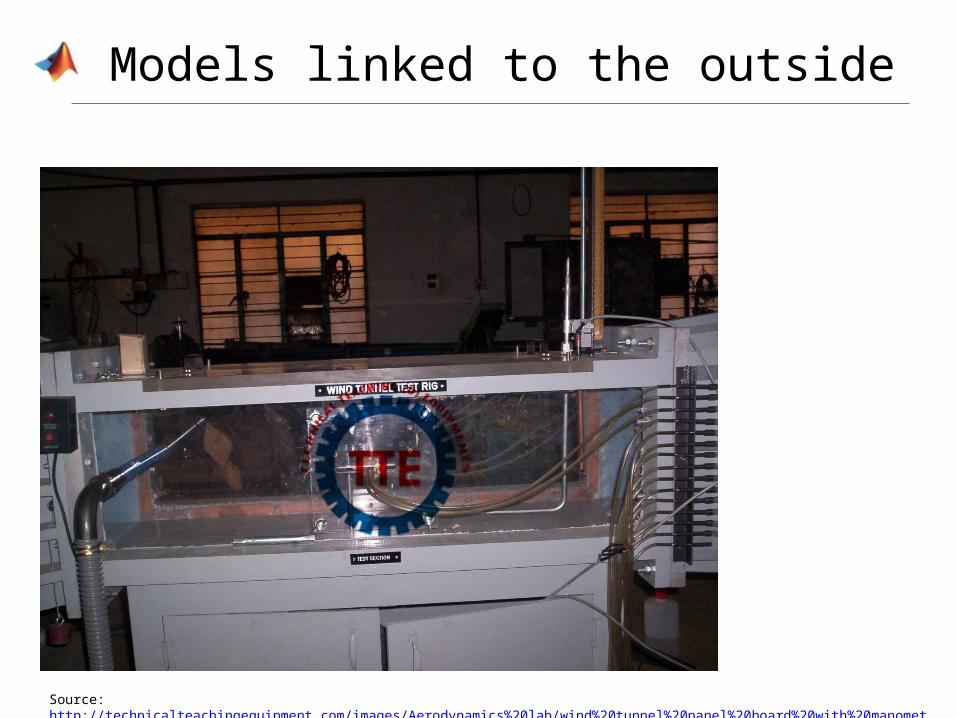
Models linked to the outside
Source: http://technicalteachingequipment.com/images/Aerodynamics%20lab/wind%20tunnel%20panel%20board%20with%20manometer.JPG
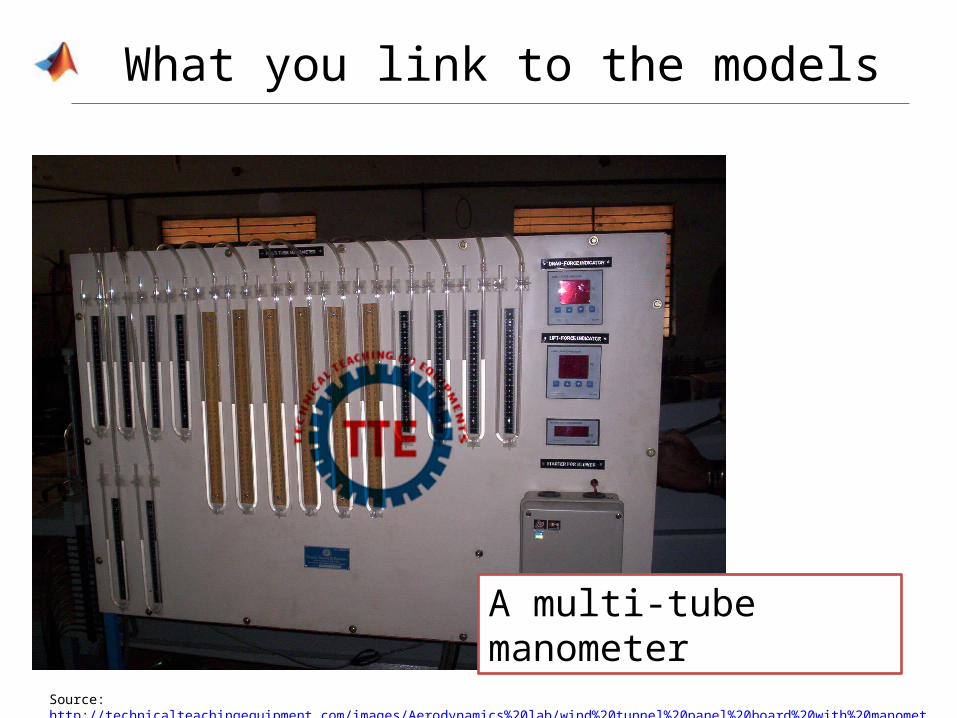
What you link to the models
A multi-tube manometer
Source: http://technicalteachingequipment.com/images/Aerodynamics%20lab/wind%20tunnel%20panel%20board%20with%20manometer.JPG
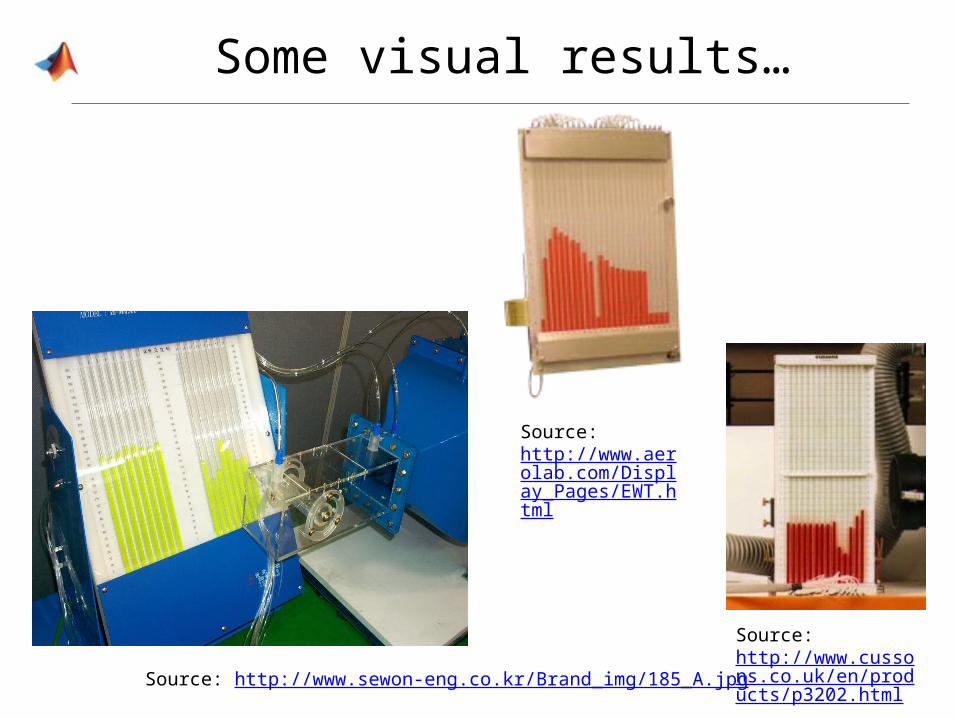
Some visual results…
Source: http://www.sewon-eng.co.kr/Brand_img/185_A.jpg
Source: http://www.cussons.co.uk/en/products/p3202.html
Source: http://www.aerolab.com/Display_Pages/EWT.html
13
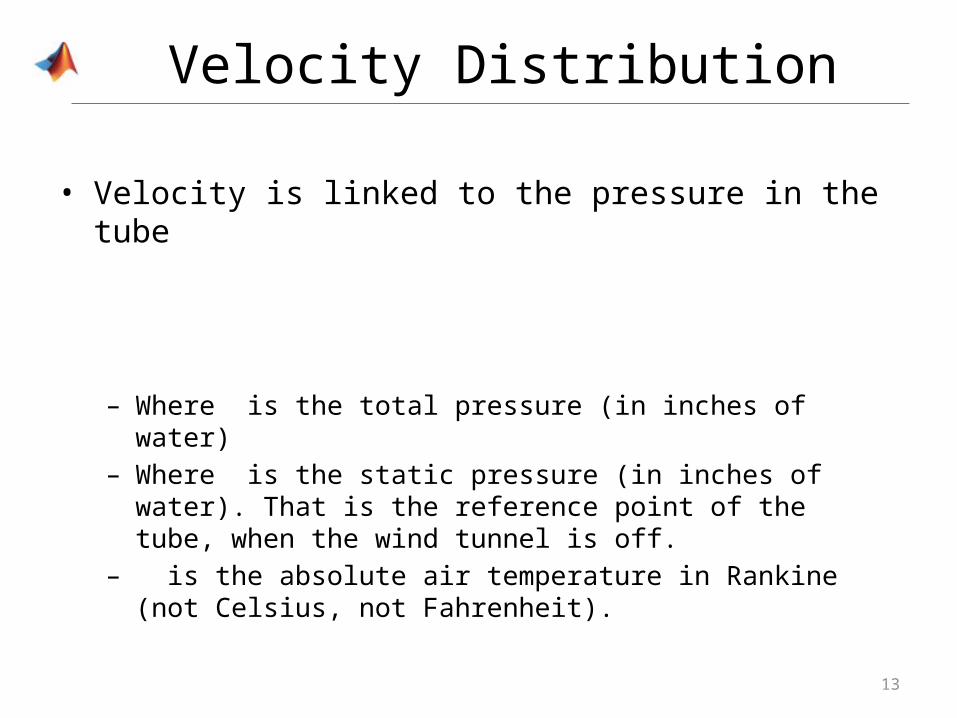
Velocity Distribution
• Velocity is linked to the pressure in the tube
– Where is the total pressure (in inches of water)– Where is the static pressure (in inches of water). That is the reference
point of the tube, when the wind tunnel is off.– is the absolute air temperature in Rankine (not Celsius, not
Fahrenheit).
14
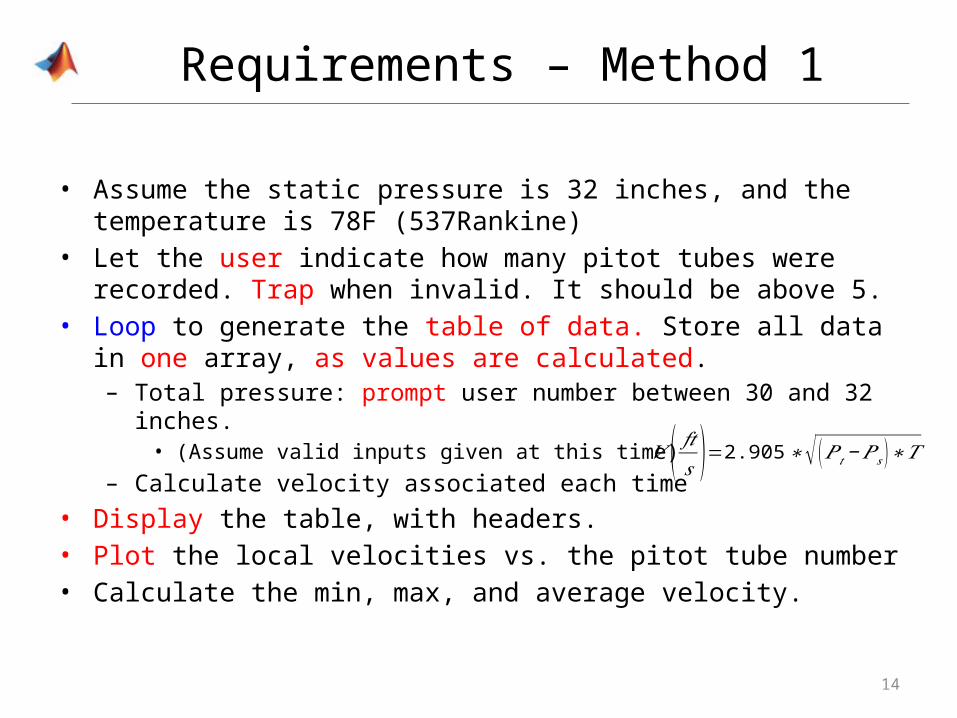
Requirements – Method 1
• Assume the static pressure is 32 inches, and the temperature is 78F (537Rankine)
• Let the user indicate how many pitot tubes were recorded. Trap when invalid. It should be above 5.
• Loop to generate the table of data. Store all data in one array, as values are calculated. – Total pressure: prompt user number between 30 and 32 inches.
• (Assume valid inputs given at this time)– Calculate velocity associated each time
• Display the table, with headers.• Plot the local velocities vs. the pitot tube number• Calculate the min, max, and average velocity.
𝑉 ( 𝑓𝑡𝑠 )=2.905∗√ (𝑃 𝑡−𝑃 𝑠 )∗𝑇
15
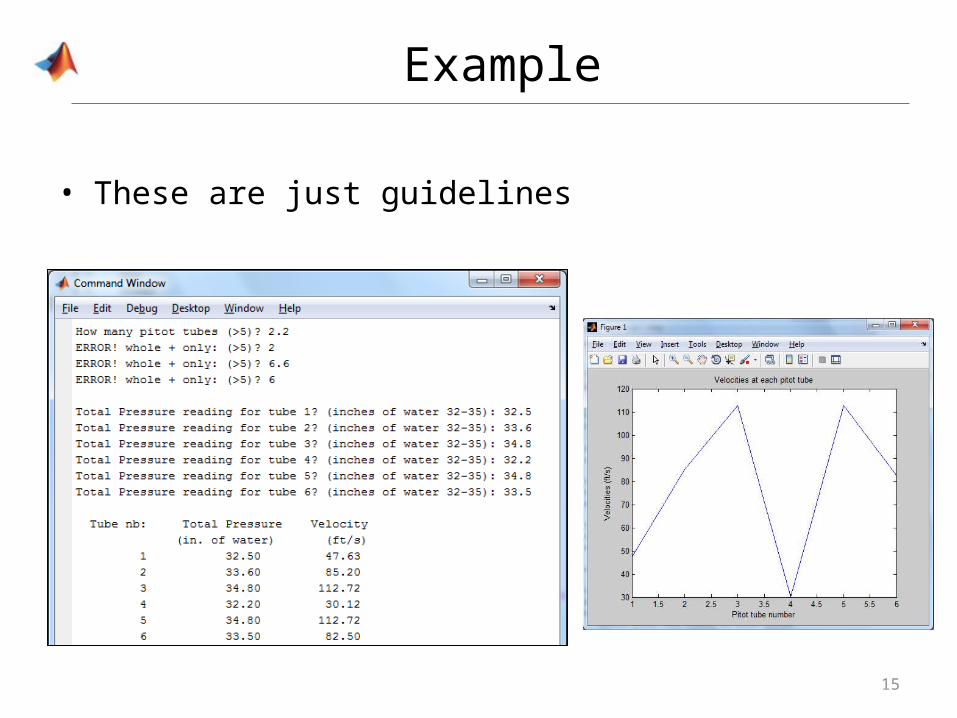
Example
• These are just guidelines

16
Brainstorm
• Keywords?• Algorithm ideas?

17
Algorithmclcclear
… develop your algorithm please!
18
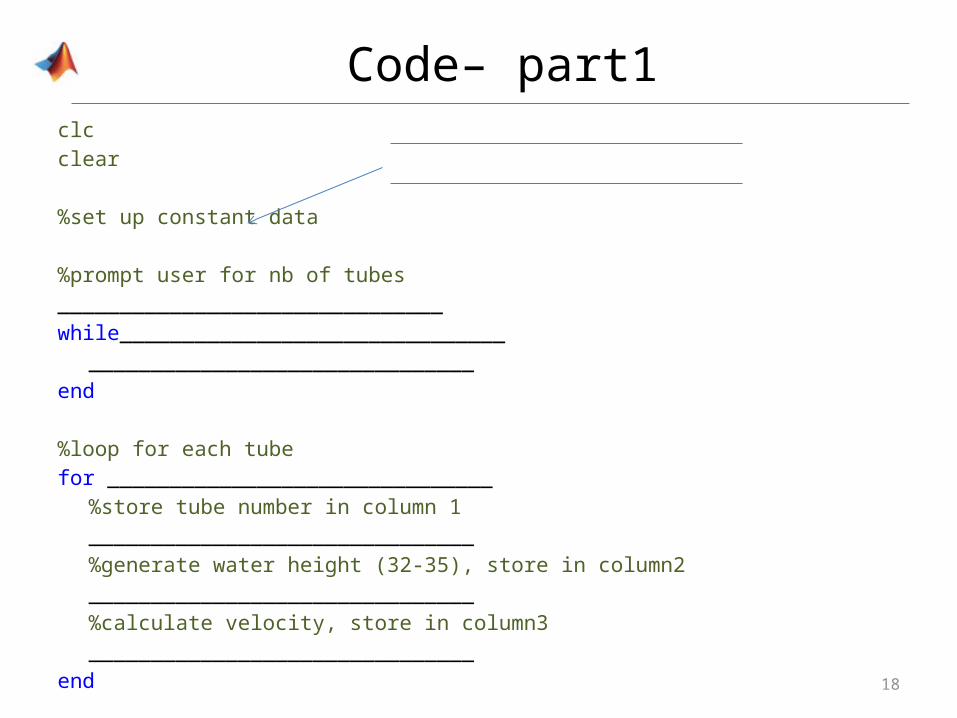
Code– part1clcclear
%set up constant data
%prompt user for nb of tubes_______________________________while_______________________________
_______________________________end
%loop for each tubefor _______________________________
%store tube number in column 1_______________________________%generate water height (32-35), store in column2_______________________________%calculate velocity, store in column3_______________________________
end

19
continued…
%display header___________________________________________________________________________________
%display table___________________________________________________________________________________
%plot velocity vs. tube number____________________________________________________________________________________________________________________________________________________________
%find min, max, average____________________________________________________________________________________________________________________________________________________________
20
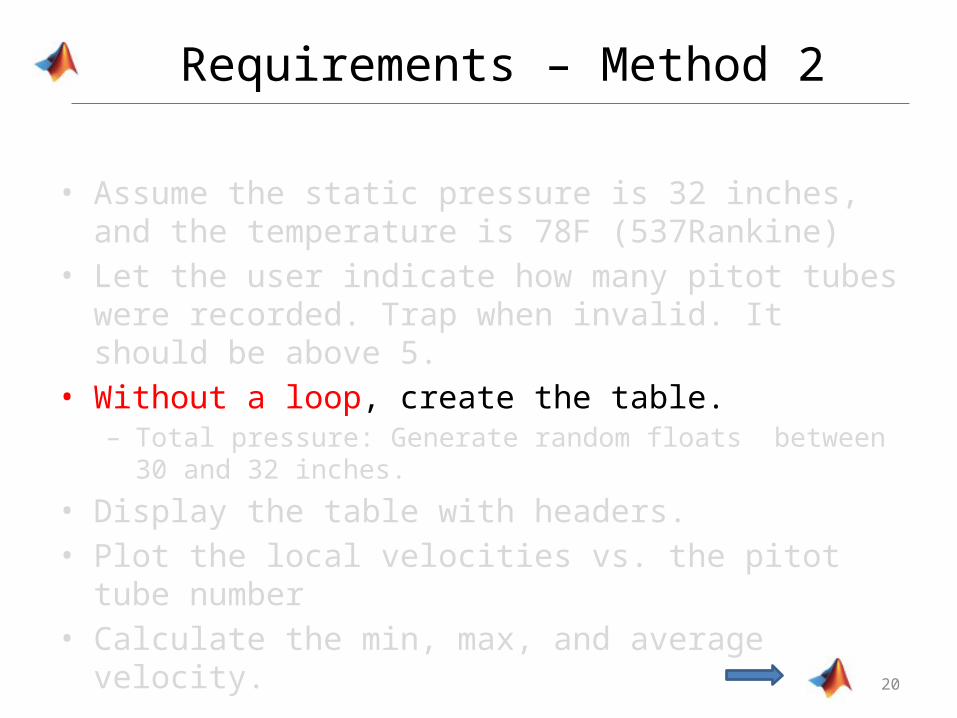
Requirements – Method 2
• Assume the static pressure is 32 inches, and the temperature is 78F (537Rankine)
• Let the user indicate how many pitot tubes were recorded. Trap when invalid. It should be above 5.
• Without a loop, create the table.– Total pressure: Generate random floats between 30 and 32 inches.
• Display the table with headers.• Plot the local velocities vs. the pitot tube number• Calculate the min, max, and average velocity.
21
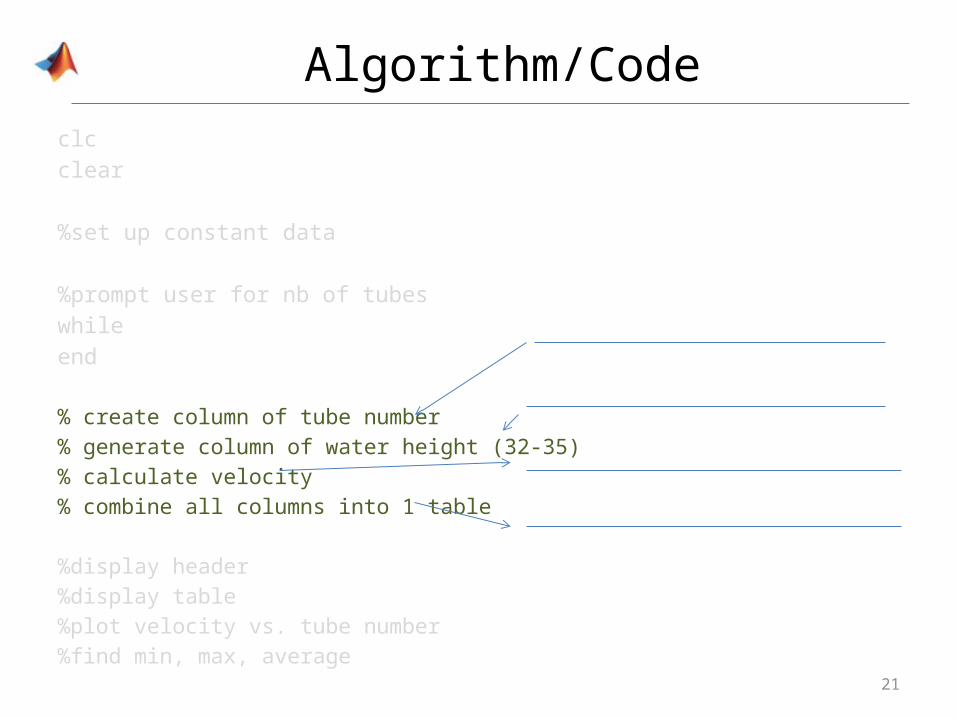
Algorithm/Codeclcclear
%set up constant data
%prompt user for nb of tubeswhileend
% create column of tube number% generate column of water height (32-35)% calculate velocity% combine all columns into 1 table
%display header%display table%plot velocity vs. tube number%find min, max, average

22
STUDY HARD!
• Practice tonight. • Take the notes you just took, and code the example!
• The more practice, the easier it gets!