Embed Size (px)
Citation preview

Announcements
Ch. 5 homework will post tomorrow
Test 2 score will post by Monday night
Scores on Mastering Physics continue to be updatedExpect to be fully updated by April 4

Nuclear Energy vs. Nuclear Bombs
Energy in Chocolate Chip Cookie = 5 food calories per gram
Energy in TNT – Dynamite = 0.65 food calories per gram
Why do the cookies have 9x more energy per gram?

Nuclear Energy vs. Nuclear Bombs
Atomic Bomb• 80% of Uranium is U235 (0.7% of natural Uranium=U235)• Need fast neutrons• Chain Reaction => explosion• E = mc2 in very little time – less than a second
Nuclear Reactor• 3% of Uranium core is U235
• Needs slow neutrons• Sustained Chain Reaction => goes for years
15,000 killed + 10,000 missing from Earthquake and Tsunami

How many people killed from radiation from Fukishima reactor in Japan

What causes the drift?
Convection! Mantle slightly fluid and can support convection. Plates ride on top of convective cells. Lava flows through cell boundaries. Earth loses internal heat this way.
Cycles take ~108 years.
Plates form lithosphere (crust and solid upper mantle).Partially melted, circulating part of mantle is asthenosphere.

Pangaea Theory: 200 million years ago, all the continents were together!

Convection
Earth's surface heated by Sun. What would happen if it couldn't get rid of the energy as fast as it gets in?
Convection causes both small-scale turbulence and large scale circulation patterns. It also occurs within Earth, on other planets, and in stars.
Convection also occurs when you boil water, or soup. Think of Earth's surface as a boiling pot!

The Greenhouse Effect
Main greenhouse gases are H
2O and
CO2 .
If no greenhouse effect, surface would be 40 oC cooler!

Intergovernmental Panel on Climate Change (IPCC – UN Agency) says
Translating terminology into probabilities


Temperature for last 14,000 years


Burning carbon-containing fossil fuels produces carbon dioxide.
(Combustion)C + O2 CO2
Global Warming Basics
Burning Fossil Fuels is the Primary CauseBurning Fossil Fuels is the Primary Cause
Glo
bal W
arm
ing:
The
Gre
ates
t T
hrea
t ©
200
6 D
ebor
ah L
. W
illia
ms

Global Warming BasicsG
loba
l War
min
g: T
he G
reat
est
Thr
eat
© 2
006
Deb
orah
L.
Will
iam
s
Humans have increased carbon dioxide (CO2) in the
atmosphere by more
than 35% since the Industrial Revolution.
(National Oceanic and Atmospheric Administration 2006)
The most carbon dioxide in 650,000 years. (IPCC 2007)
(CO2)
10,000 BC 2009
391ppm

CO2 in Atmosphere and Temperature

Temperature Predictions
.

Alaska is Ground ZeroAlaska is Ground Zero
Chapman and Walsh, 2004
In past 50 years,
Alaska: Temperatures haveincreased
• 4oF overall(National Assessment Synthesis Team)
Worldwide:Temperatures haveincreased
• Slightly more than 1oF
(IPCC 2007)
Surface Air Temperature Trends 1942-2003
Global Warming BasicsG
loba
l War
min
g: T
he G
reat
est
Thr
eat
© 2
006
Deb
orah
L.
Will
iam
s
Chapman and Walsh, 2004

Snow and sea ice reflect 85-90% of sun’s energy.
Ocean surface and dark soil reflect only
10-20%.
The Albedo Effect
“White shirt versus Black shirt”
Why has Alaska warmed the most?Why has Alaska warmed the most?
Increased melting of snow
and sea ice
Increased melting of snow
and sea ice
More of sun’s heat energy is
absorbed
More of sun’s heat energy is
absorbed
More dark earthand ocean surface
is exposed
More dark earthand ocean surface
is exposedLand or water warms faster
Land or water warms faster
Global Warming BasicsG
loba
l War
min
g: T
he G
reat
est
Thr
eat
© 2
006
Deb
orah
L.
Will
iam
s
(ACIA 2004)

Source ACIA, 2004Jennifer Allen Animation
An area twice the size of Texas has melted away since 1979 (over 20%
decrease). (National Snow and
Ice Data Center 2005)
Ice 40% thinner. (Rothrock,D.A, et al. 1999)
Ice only 6 – 9 feet thick at North Pole (NOAA FAQ 2007).
Northwest passage opened Aug 21, 2007
Impacts in Alaska1. Melting
Melting Sea IceMelting Sea Ice
1978 1983 1988 1993 1998 2003
9
8
7
6
-
-
-
-| | | | |
Arc
tic S
ea Ic
e E
xten
t (m
illio
ns o
f sq.
km
.)
Source: NSIDC, 2005
ARCTIC SEA ICE AREA1979-2005
2005Glo
bal W
arm
ing:
The
Gre
ates
t T
hrea
t ©
200
6 D
ebor
ah L
. W
illia
ms

Impact World-wide1. Melting
Glo
bal W
arm
ing:
The
Gre
ates
t T
hrea
t ©
200
6 D
ebor
ah L
. W
illia
ms
Impact on Ski IndustryImpact on Ski Industry
• In the US skiing is a $5B industry• 2006 saw a 78% decline in skiers visiting the pacific northwest US• Ski Seasons have shortened by 1 day/year for the last 20 years• Many European ski resorts below 1800 m (6000 ft) will close • 50 to 90% of Alpine glaciers will be gone by 2100• Some resort to snowmaking
• Expensive• Requires lots of water• Requires lots of energy
• In New Mexico, many ski areas can’t open until after Xmas

Impacts in Alaska1. Melting
The rapid retreat of Alaska’s glaciers represents about 50% of the estimated mass loss by glaciers through 2004 worldwide. (ACIA 2004)
Loss of over 588 billion cubic yards between ’61 and ’98. (Climate Change 11/05)
Alaska’s glaciers are responsible for at least 9% of the global sea level rise in the past century. (ACIA 2004)
19411941
20042004
Glacier Bay (Riggs Glacier)
USGS photo
Bruce Molnia photo
Glacial RetreatGlacial Retreat
20032003
Mat
t Nol
an p
hoto
Aus
tin P
ost p
hoto
19581958
McCall Glacier

• Polar bears• Walruses• Ice seals• Black guillemots• Kittiwakes• Salmon• Caribou• Arctic grayling
Impacts in Alaska3. Animals
Animals at RiskAnimals at Risk
Rising temperatures
Shrinking habitat
Food harder to get
Expanding diseases
Competition
Polar bearsWalrusesIce seals
Caribou
Black guillemotsKittiwakesSalmon
Arctic grayling

Ocean AcidificationOcean Acidification
CO2 + H20 HCO3- + H+
Water becomes more acidic.
(ACID)
Remains in the atmosphere (greenhouse gas)
Dissolves in sea water
CO2
CO2
Over the last 200 years, about 50% of all CO2 produced on earth has been absorbed by the ocean.
Glo
bal W
arm
ing:
The
Gre
ates
t T
hrea
t ©
200
6 D
ebor
ah L
. W
illia
ms
(Royal Society 6/05)
Inundation
Sea level has increased 3.2 mm/year between 1993 and 2008 (IPCC 2007).
This is 10-20 times faster than during the last 3,000 years (ACIA 2004).
0.4-0.6 meters of sea level rise by 2100 if 3 times pre-industrial CO2 or 1% increase/year (Overpeck et al. 2006).
As Greenland and Antarctic ice sheets melt ...

Ocean Nations Threatened
Maldives nation held cabinet meeting 20 feet under water.
Tuvalu nation considering exodus (highest elevation is 15 feet)
New Moore Island goes under in March 2010

Inundation InundationInundation from Four Meter Sea Level Rise (or, 1m rise + 3m storm surge)
Weiss and Overpeck, 2006
Pho
to c
ourt
esy
of 7
sum
mits
.com
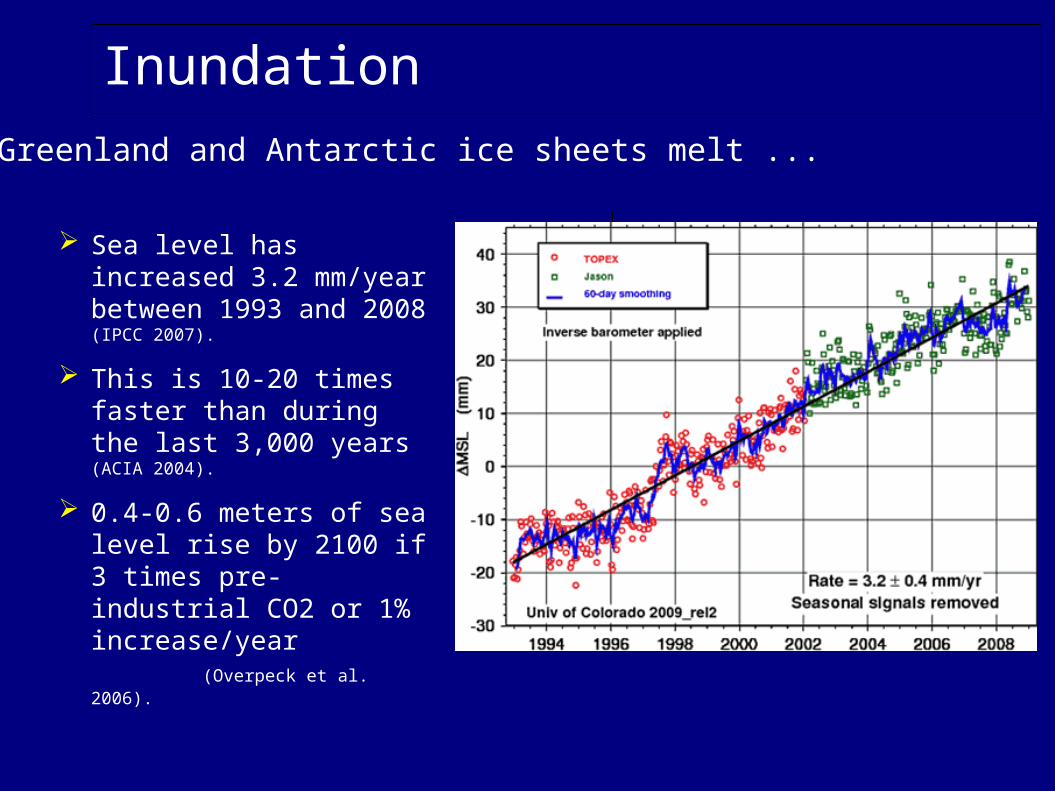
What We Can DoWhat We Can Do
1. Is it Achievable?
2. Action Is Essential at Every Level
• Individual• Corporate• Local• State• Federal• International
3. Critical Steps
R E D U C E C O 2 E M I S
S I O N S
Glo
bal W
arm
ing:
The
Gre
ates
t T
hrea
t ©
200
6 D
ebor
ah L
. W
illia
ms

1954 2004 2054
14
7
1.9
Carbon Emissions(Billions of tons per year)
Current P
ath
At leastTRIPLING
CO2
Avoiddoubling
CO2
Flat Path
STABILIZATION TRIANGLE
What We Can DoIs it Achievable?Is it Achievable?
Pacala and Socolow, Science 2004Glo
bal W
arm
ing:
The
Gre
ates
t T
hrea
t ©
200
6 D
ebor
ah L
. W
illia
ms

What We Can Do
Wind PowerWind Power
Glo
bal W
arm
ing:
The
Gre
ates
t T
hrea
t ©
200
6 D
ebor
ah L
. W
illia
ms
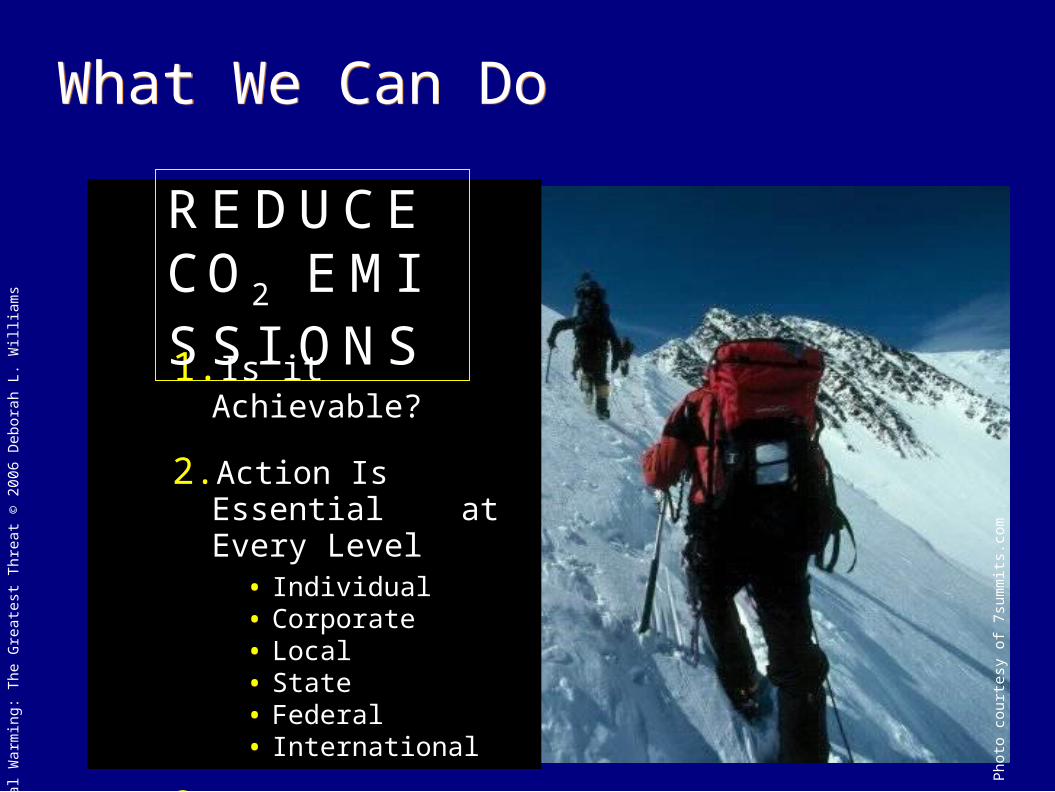
Measuring Your Carbon Footprint
Major Carbon Contributors:
Electric Consumption Gas/Heating Oil Consumption Car and Miles Driven Miles Flown Recreational Vehicle Use
Average Footprint is 30,000 pounds

Making a Difference as an Individual
Conservation Measures:
Walk, bike, ride public transit, or carpool
Make sure your tires are fully inflated and your car tuned up Lower your water heater and
home thermostats Don't preheat your oven Only run your dishwasher with
full loads paint your roof white Buy locally produced food Unplug appliances not in use Turn off lights when leaving a room Use recycled paper Reuse or recycle as much as you can Cut down on consumerism

Conservation: Three Examples
Unplug Appliances Vampires! 43 billion kWH lost/year in
US Est: 1,000 lbs/year/person
Pump Up Tires 4 million gallon of gas
wasted daily in US Extends life of tires by 25% Est: 1,000 lbs/year/person
Lower Thermostat 2 degrees Est: 2000 lbs/year/person

Energy Efficiency: Two Examples
Compact Fluorescents Four to six times more
efficient Est: for each bulb
converted, save about 100 lbs/year
Bus/Walk/Bike Save money on fuel and
maintenance Est: 5,000 lbs/year

Clicker Question:
What steps are you willing to take to reduce your carbon dioxide footprint?
A: Walk/bike/bus to work
B: Unplug appliances when not in use
C: Replace light bulbs with compact fluorescents
D: Wash clothes in cold or warm water
E: Buy a Prius

Clicker Question:
A leading cause of Global Warming is:
A: Increased soot (smog) in the atmosphere.
B: Increased carbon dioxide in the atmosphere.
C: The Earth is getting closer to the sun.
D: The luminosity of the sun is steadily increasing.
Clicker Question:
The Greenhouse effect would not occur if:
A: The Earth had no atmosphere.
B: The amount of carbon dioxide doubled.
C: We got rid of all the forests.
D: The Earth didn’t have an ocean.