Embed Size (px)
Citation preview
Annotated example of a land
carbon stock calculation using
standard values
OUR MISSION: A SUS TAINABLE ENE RGY SUPP LY FOR EVERYONE

OUR MISSION: A SUS TAINABLE ENE RGY SUPP LY FOR EVERYONE
ECOFYS INTERNATIONAL BV, A PRIVATE LIMITED LIABILITY COMPANY INCORPORATED UNDER THE LAWS OF THE NETHERLANDS HAVING ITS OFFICIAL SEAT AT UTRECHT
AND REGISTERED WITH THE TRADE REGISTER OF THE CHAMBER OF COMMERCE IN UTRECHT UNDER FILE NUMBER 24343898
OUR MISSION: A SUS TAINABLE ENE RGY SUPP LY FOR EVERYONE
Ecofys UK Ltd
1 Alie street
Aldgate
London
E1 8DE
UK
W: www.ecofys.co.uk
T: +44 (0) 207 702 0972
F: +44 (0) 207 702 0971
By: Sacha Alberici, Carlo Hamelinck, Vivian Schueler
Date: 30-09-10
Project number: PEGENL083540
Annotated example of a land
carbon stock calculation using
standard values
© Ecofys 2010
by order of:
European Commission

i
OUR MISSION: A SUS TAINABLE ENE RGY SUPP LY FOR EVERYONE
Table of contents
1 Background .............................................................................................. 1
2 Structure of report.................................................................................... 1
3 General GHG methodology........................................................................ 1
4 Annotated example................................................................................... 3
4.1 Calculation of carbon stocks for grassland (CSR) ........................................ 6
4.1.1 Calculation of SOCR ........................................................................ 6
4.1.2 Calculation of CVEG.......................................................................... 7
4.1.3 Calculation of CSR .......................................................................... 7
4.2 Calculation of carbon stocks for cropland (CSA).......................................... 8
4.2.1 Calculation of SOCA ........................................................................ 8
4.2.2 Calculation of CVEG.......................................................................... 8
4.2.3 Calculation of CSA .......................................................................... 8
4.3 Calculation of emissions from carbon stock change from grassland to cropland9
4.3.1 Calculation of P.............................................................................. 9
4.3.2 Calculation of el ............................................................................. 9
4.4 Checking that the 35% GHG threshold is still met with the inclusion of carbon
stock emissions resulting from land use change........................................10
5 Annexes ............................................................................................. 11

1
OUR MISSION: A SUS TAINABLE ENE RGY SUPP LY FOR EVERYONE
Annotated example of a land carbon stock
calculation using standard values
1 Background
The purpose of this paper is to provide insight into how economic operators and other
interested bodies can execute a carbon stock calculation resulting from a land use
change. This example calculation shows how the methodology as laid down in the
Renewable Energy Directive (RED) and also further addressed by the European
Commission (EC) in the Decision on guidelines for the calculation of land carbon
stocks1, works in practice.
The annotated example decribed in this report represents a hypothethetical carbon
stock change and uses standard values from the Decision.
2 Structure of report
A brief explanation of the methodology for calculating the GHG emissions resulting
from a land use change is described in the next section, where it is shown what
consecutive calculation steps need to be taken. This does not reproduce what’s
already written in the RED or from the Decision, but functions as a guidance to our
annotated example. The annotated example is described in Section 4 and in Section 5
we present the annexes where all relevant input values are given.
3 General GHG methodology
Emissions resulting from land use change are included as el in the GHG methodology
outlined in the RED2.
The GHG calculation formula is detailed below:
E = eec + el + ep + etd + eu – esca – eccs – eccr – eee
1 On guidelines for the calculation of land carbon stocks for the purpose of Annex V to Directive 2009/28/EC.
Refer to: http://eur-lex.europa.eu/LexUriServ/LexUriServ.do?uri=OJ:L:2010:151:0019:0041:EN:PDF
2 Annex V, Section C - Methodology
2
OUR MISSION: A SUS TAINABLE ENE RGY SUPP LY FOR EVERYONE
where
E = total emissions from the use of the fuel;
eec = emissions from the extraction or cultivation of raw materials;
el = annualised emissions from carbon stock changes caused by land-use change;
ep = emissions from processing;
etd = emissions from transport and distribution;
eu = emissions from the fuel in use;
esca = emission saving from soil carbon accumulation via improved agricultural
management;
eccs = emission saving from carbon capture and geological storage;
eccr = emission saving from carbon capture and replacement; and
eee = emission saving from excess electricity from cogeneration.
The RED further states that GHG emissions from carbon stock changes caused by
land-use change are calculated as:
el = (CSR – CSA) x 3.6643 x 1/20 x 1/P – eB
where
el = annualised emissions from carbon stock changes caused by land-use change;
CSR = the carbon stock per unit area associated with the reference land use;
(measured as mass of carbon per unit area, including both soil and vegetation)4;
CSA = the carbon stock per unit area associated with the actual land use (measured as
mass of carbon per unit area, including both soil and vegetation)5;
'20' refers to the annualising over a 20 year period;
P = the productivity of the crop (measured as biofuel or bioliquid energy per unit area
per year); and
eB = bonus of 29 gCO2eq/MJ biofuel or bioliquid if biomass is obtained from restored
degraded land6.
3 The quotient obtained by dividing the molecular weight of carbon dioxide (44.010 g/mol) by the molecular
weight of carbon (12.011 g/mol) is equal to 3.664.
4 The reference land use shall be the land use in January 2008, or 20 years before the raw material was
obtained, whichever was the later.
5 See notes regarding calculation rules for CSA on page 8 of this document.
6 Under the conditions provides for in point 8 of Annex V, section C.
3
ECOFYS INTERNATIONAL BV, A PRIVATE LIMITED LIABILITY COMPANY INCORPORATED UNDER THE LAWS OF THE NETHERLANDS HAVING ITS OFFICIAL SEAT AT UTRECHT
AND REGISTERED WITH THE TRADE REGISTER OF THE CHAMBER OF COMMERCE IN UTRECHT UNDER FILE NUMBER 24343898
OUR MISSION: A SUS TAINABLE ENE RGY SUPP LY FOR EVERYONE
Guidelines for the calculation of the land carbon stocks, both for the reference land
use (CSR) and actual land use (CSA) are provided in the Decision, and are based on
the IPCC Tier 1 methodology.
CSR/A = (SOC + CVEG) x A
where
CSR/A = the carbon stock per unit area associated with the land use (measured as
mass of carbon per unit area, including both soil and vegetation);
SOC = soil organic carbon (measured as mass of carbon per hectare);
CVEG = above and below ground vegetation carbon stock (measured as mass of carbon
per hectare);
A = factor scaling to the area concerned (measured as hectares per unit area).
The Decision states that for consistent representation of land carbon stocks, the
following rules for determining the carbon stock per unit area associated with CSR and
CSA shall apply:
1. The area for which the land carbon stocks are calculated shall for the entire area
have similar:
(a) biophysical conditions in terms of climate and soil type;
(b) management history in terms of tillage;
(c) input history in terms of carbon input to soil.
2. The carbon stock of the actual land use CSA, shall be taken as:
• in the case of loss of carbon stock: the estimated equilibrium carbon stock that
the land will reach in its new use,
• in the case of carbon stock accumulation: the estimated carbon stock after 20
years or when the crop reached maturity, whichever the earlier.
4 Annotated example
In this example, a land use change from grassland to cropland, used for the
cultivation of sugar beet in the East of England, the principal sugar beet growing area
in the UK, will be illustrated. It is assumed that the grassland in question is not
4
OUR MISSION: A SUS TAINABLE ENE RGY SUPP LY FOR EVERYONE
classified as a type of degraded land, and so the bonus of 29 gCO2/MJ is not applicable
in this example.
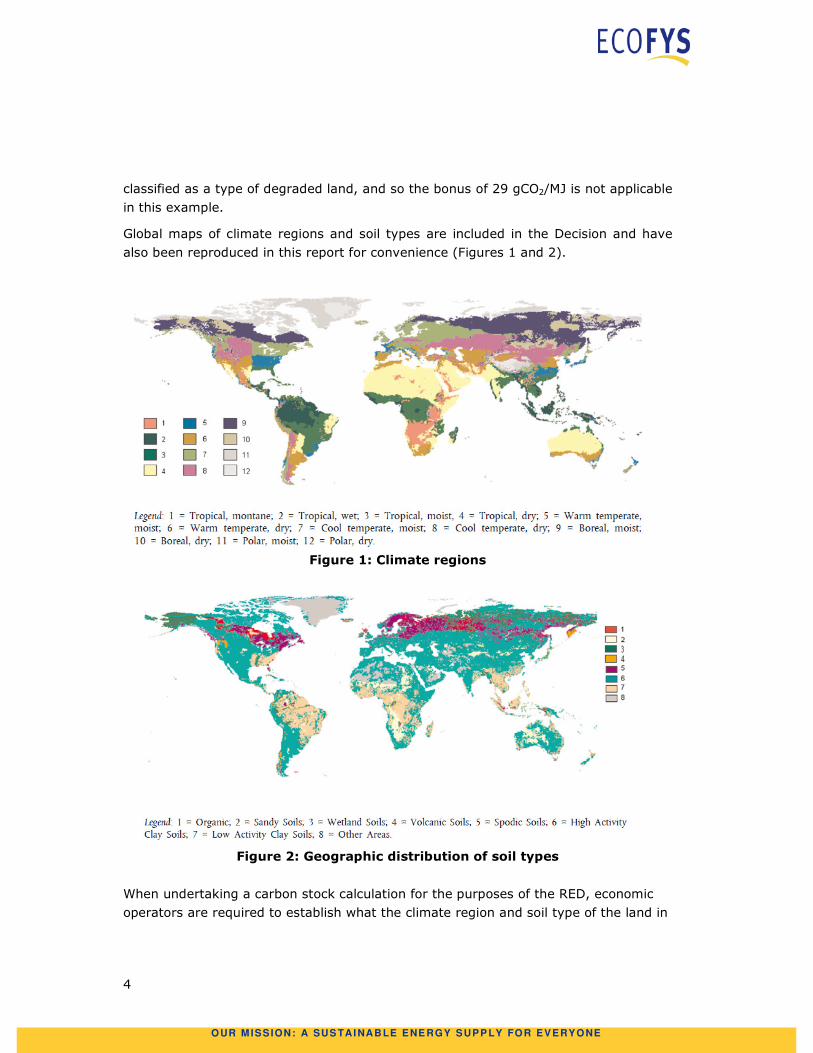
Global maps of climate regions and soil types are included in the Decision and have
also been reproduced in this report for convenience (Figures 1 and 2).
Figure 1: Climate regions
Figure 2: Geographic distribution of soil types
When undertaking a carbon stock calculation for the purposes of the RED, economic
operators are required to establish what the climate region and soil type of the land in
5
ECOFYS INTERNATIONAL BV, A PRIVATE LIMITED LIABILITY COMPANY INCORPORATED UNDER THE LAWS OF THE NETHERLANDS HAVING ITS OFFICIAL SEAT AT UTRECHT
AND REGISTERED WITH THE TRADE REGISTER OF THE CHAMBER OF COMMERCE IN UTRECHT UNDER FILE NUMBER 24343898
OUR MISSION: A SUS TAINABLE ENE RGY SUPP LY FOR EVERYONE
question is. Climate region data layers and soil type data layers are available through
the EC’s Transparency Platform7. These are based on GIS mapping.
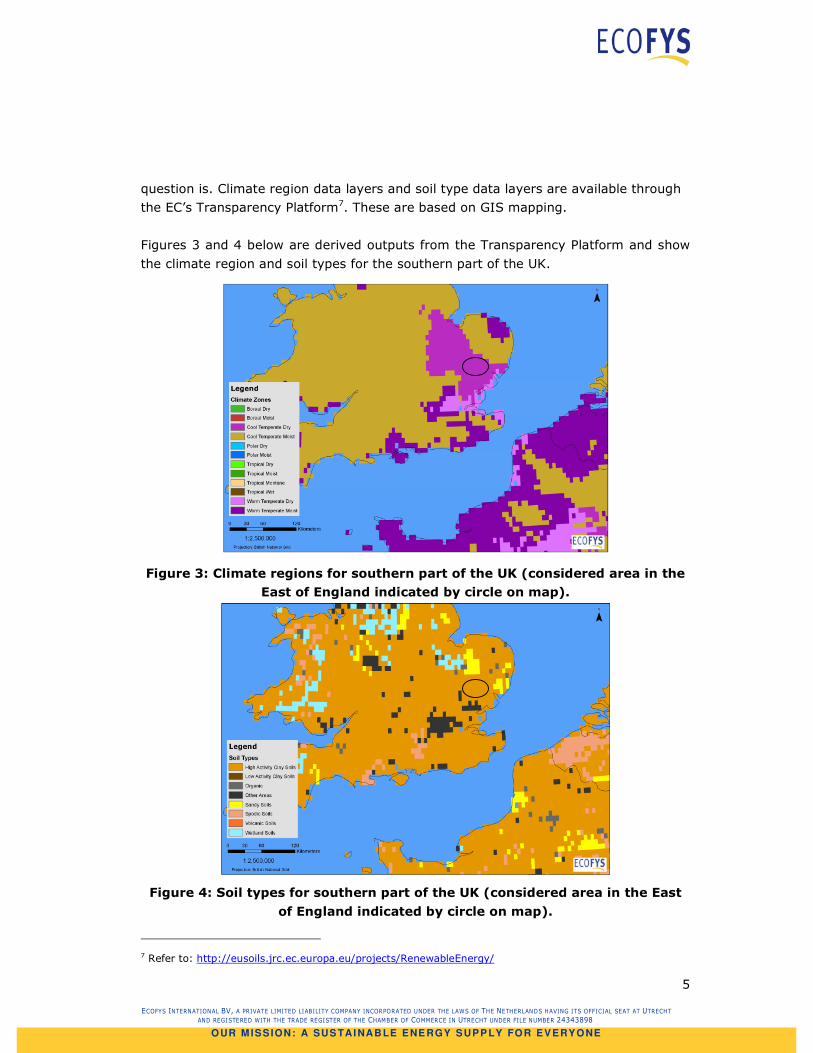
Figures 3 and 4 below are derived outputs from the Transparency Platform and show
the climate region and soil types for the southern part of the UK.
Figure 3: Climate regions for southern part of the UK (considered area in the
East of England indicated by circle on map).
Figure 4: Soil types for southern part of the UK (considered area in the East
of England indicated by circle on map).
7 Refer to: http://eusoils.jrc.ec.europa.eu/projects/RenewableEnergy/
6
OUR MISSION: A SUS TAINABLE ENE RGY SUPP LY FOR EVERYONE
Based on this data the following climate region and soil type were determined for this
hypothetical example of sugar beet for an area in the East of England.
• Climate region: Cold Temperate, dry8;
• Soil type: High activity clay (and mineral soil).
4.1 Calculation of carbon stocks for grassland (CSR)
As a recap, CSR is calculated as: CSR/A = (SOCR + CVEG) x A
4.1.1 Calculation of SOCR
There are two methods of determining SOCR:
• Use of actual measurements; or
• Application of a calculation rule and use of standard values taking into account the
climate region, soil type, land cover, land management and inputs.
In this example, the application of a calculation rule and the use of standard values
will be used. For mineral soils, SOCR can be calculated using the following formula:
SOCR = SOCST x FLU x FMG x Fl
where
SOCR = soil organic carbon (measured as mass of carbon per hectare);
SOCST = standard soil organic carbon in the 0-30 centimeter topsoil layer (measured
as mass of carbon per hectare);
FLU = land use factor reflecting the difference in soil organic carbon associated with
the type of land use compared to the standard soil organic carbon;
FMG = management factor reflecting the difference in soil organic carbon associated
with the principle management practice compared to the standard soil organic carbon;
FI = input factor reflecting the difference in soil organic carbon associated with
different levels of carbon input to soil compared to the standard soil organic carbon.
The Decision provides data that can be used for the purposes of calculating SOC.
Specifically, Section 6 (Table 1) for SOCST and Section 7 (Tables 2 to 8) for FLU, FMG
and FI. The relevant parts of these data tables that are applicable to this annotated
example are included in the Annex for convenience.
8 Cold temperate, moist would have been an alternative climate region to use.
7
ECOFYS INTERNATIONAL BV, A PRIVATE LIMITED LIABILITY COMPANY INCORPORATED UNDER THE LAWS OF THE NETHERLANDS HAVING ITS OFFICIAL SEAT AT UTRECHT
AND REGISTERED WITH THE TRADE REGISTER OF THE CHAMBER OF COMMERCE IN UTRECHT UNDER FILE NUMBER 24343898
OUR MISSION: A SUS TAINABLE ENE RGY SUPP LY FOR EVERYONE
In this example, it is assumed that the land was ‘Nominally managed’ (represents
non-degraded and sustainably managed grassland, but without significant
management improvements) and subject to ‘Medium input’ (applies where no
additional management inputs have been used).
Using Tables 1, 5 and 6 in the Decision (see also Tables 2, 3 and 4 in the Annex of this
report):
SOCST = 50 tC/ha
FLU = 1 (Grassland)
FMG = 1 (Nominally managed)
FI = 1 (Medium input)
Using SOCR = SOCST x FLU x FMG x Fl
SOCR = (50 x 1 x 1 x 1) tC/ha
= 50 tC/ha
4.1.2 Calculation of CVEG
There are two methods of determining CVEG:
• Application of a calculation rule and actual measurements9; or
• Use of standard values taking into account the climate region and soil type.
In this example, the latter option will be used.
The Decision guidelines provide an overview of the CVEG values for all land types and
climate regions10.
For grasslands, in the Cool Temperate, Dry climate region, CVEG is 3.3 tC/ha.
4.1.3 Calculation of CSR
Using CSR = (SOC + CVEG) x A
CSR = (50 + 3.3) x 111
= 53.3 tC/ha
9 Refer to Section 5 of the Decision.
10 Refer to Section 8 for the vegetation values for cropland, grassland and forestland (see tables 13-18).
Vegetation values for grassland are detailed in Table 13.
11 A, the scaling factor, is assumed to be 1 in this annotated example.
8
OUR MISSION: A SUS TAINABLE ENE RGY SUPP LY FOR EVERYONE
4.2 Calculation of carbon stocks for cropland (CSA)
A similar approach to that describe above in section 4.1 should be followed for the
calculation of CSA.
4.2.1 Calculation of SOCA
In this example, it is assumed that the land is subject to ‘Reduced Tillage’ (Primary
and/or secondary tillage but with reduced soil disturbance (usually shallow and
without full soil inversion) and normally leaves surface with > 30 % coverage by
residues at planting.) and ‘Medium input’ (representative for annual cropping with
cereals where all crop residues are returned to the field. If residues are removed then
supplemental organic matter (e.g. manure) is added. Also requires mineral fertilisation
or nitrogen-fixing crop in rotation.)
Using Tables 1, 2 and 3 in the Decision (see also Tables 2, 5 and 6 in the Annex of this
report):
SOCST = 50 tC/ha
FLU = 0.8 (Cultivated)
FMG = 1.02 (Reduced tillage)
FI = 1 (Medium input)
Using SOCA = SOCST x FLU x FMG x Fl
SOCA = (50 x 0.8 x 1.02 x 1) tC/ha
= 40.8 tC/ha
4.2.2 Calculation of CVEG
As indicated in 4.1.1, the Decision guidelines provide an overview of the CVEG values
for all land types and climate regions12.
For cropland cultivating sugar beet, in the Cool Temperate, Dry climate region, CVEG is
0 tC/ha.
4.2.3 Calculation of CSA
Using CSA = (SOC + CVEG) x A
CSA = (40.8 + 0) x 1
= 40.8 tC/ha
12 Refer to Section 8 for the vegetation values for cropland, grassland and forestland (see tables 9-12).
Vegetation values for cropland are detailed in Table 9. Note that all crops have a vegetation value of 0, with
the exception of sugarcane and perennial crops (including short rotation coppice and oil palm).
9
ECOFYS INTERNATIONAL BV, A PRIVATE LIMITED LIABILITY COMPANY INCORPORATED UNDER THE LAWS OF THE NETHERLANDS HAVING ITS OFFICIAL SEAT AT UTRECHT
AND REGISTERED WITH THE TRADE REGISTER OF THE CHAMBER OF COMMERCE IN UTRECHT UNDER FILE NUMBER 24343898
OUR MISSION: A SUS TAINABLE ENE RGY SUPP LY FOR EVERYONE
4.3 Calculation of emissions from carbon stock change from grassland to
cropland
To recap, the carbon stock emissions associated with a land use change are calculated
using the following formula:
el = (CSR – CSA) x 3.664 x 1/20 x 1/P – eB
In this example, CSR – CSA have been calculated, while eB is assumed to be 0.
Therefore, only P remains to be calculated.
4.3.1 Calculation of P
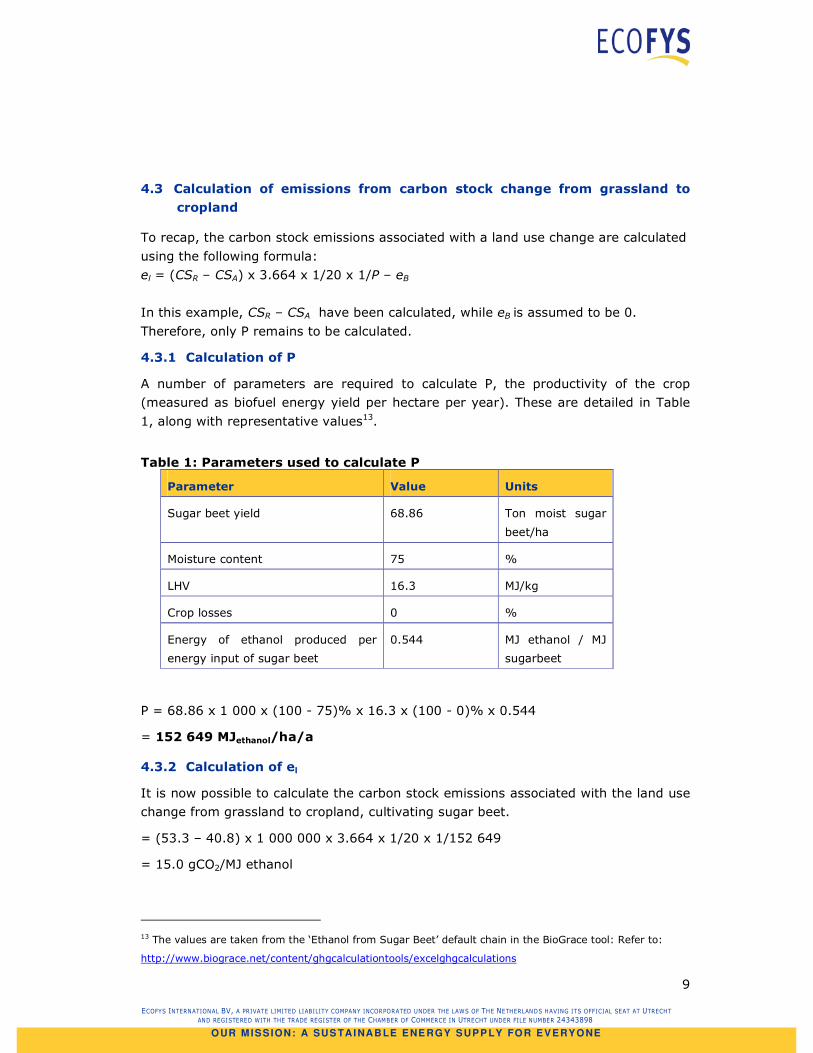
A number of parameters are required to calculate P, the productivity of the crop
(measured as biofuel energy yield per hectare per year). These are detailed in Table
1, along with representative values13.
Table 1: Parameters used to calculate P
Parameter Value Units
Sugar beet yield 68.86 Ton moist sugar
beet/ha
Moisture content 75 %
LHV 16.3 MJ/kg
Crop losses 0 %
Energy of ethanol produced per
energy input of sugar beet
0.544 MJ ethanol / MJ
sugarbeet
P = 68.86 x 1 000 x (100 - 75)% x 16.3 x (100 - 0)% x 0.544
= 152 649 MJethanol/ha/a
4.3.2 Calculation of el
It is now possible to calculate the carbon stock emissions associated with the land use
change from grassland to cropland, cultivating sugar beet.
= (53.3 – 40.8) x 1 000 000 x 3.664 x 1/20 x 1/152 649
= 15.0 gCO2/MJ ethanol
13 The values are taken from the ‘Ethanol from Sugar Beet’ default chain in the BioGrace tool: Refer to:
http://www.biograce.net/content/ghgcalculationtools/excelghgcalculations
10
OUR MISSION: A SUS TAINABLE ENE RGY SUPP LY FOR EVERYONE
A further calculation needs to be performed to allocate the GHG emissions between
the biofuel and co-product (i.e. sugar beet pulp), resulting from the production of
sugar beet ethanol. In this example, 71.3% of the GHG emissions are allocated to the
biofuel and the remainder to the co-product.
= (15.0 x 0.713) gCO2/MJ ethanol
= 10.7 gCO2/MJ ethanol
4.4 Checking that the 35% GHG threshold is still met with the inclusion of
carbon stock emissions resulting from land use change
The GHG emissions from land use change calculated in 4.3.2 need to be added to the
other actual or default GHG emissions for the production of ethanol from sugar beet to
determine whether the GHG savings threshold of 35% has been met.
In case disaggregated default values are used (12 gCO2/MJ for 'cultivation', 26
gCO2/MJ for 'processing', 2 gCO2/MJ for 'transport and distribution' and other factors
are zero), this leads to:
= 40 (12 + 26 + 2) + 10.7 gCO2/MJ ethanol
= 50.7 gCO2/MJ ethanol
Compared with the fossil fuel reference of 83.8 gCO2/MJ this is equivalent to 39%
GHG savings
So, in this example, the biofuel still meets the GHG savings threshold (of 35%) with
the inclusion of the carbon stock emissions resulting from land use change.
11
ECOFYS INTERNATIONAL BV, A PRIVATE LIMITED LIABILITY COMPANY INCORPORATED UNDER THE LAWS OF THE NETHERLANDS HAVING ITS OFFICIAL SEAT AT UTRECHT
AND REGISTERED WITH THE TRADE REGISTER OF THE CHAMBER OF COMMERCE IN UTRECHT UNDER FILE NUMBER 24343898
OUR MISSION: A SUS TAINABLE ENE RGY SUPP LY FOR EVERYONE
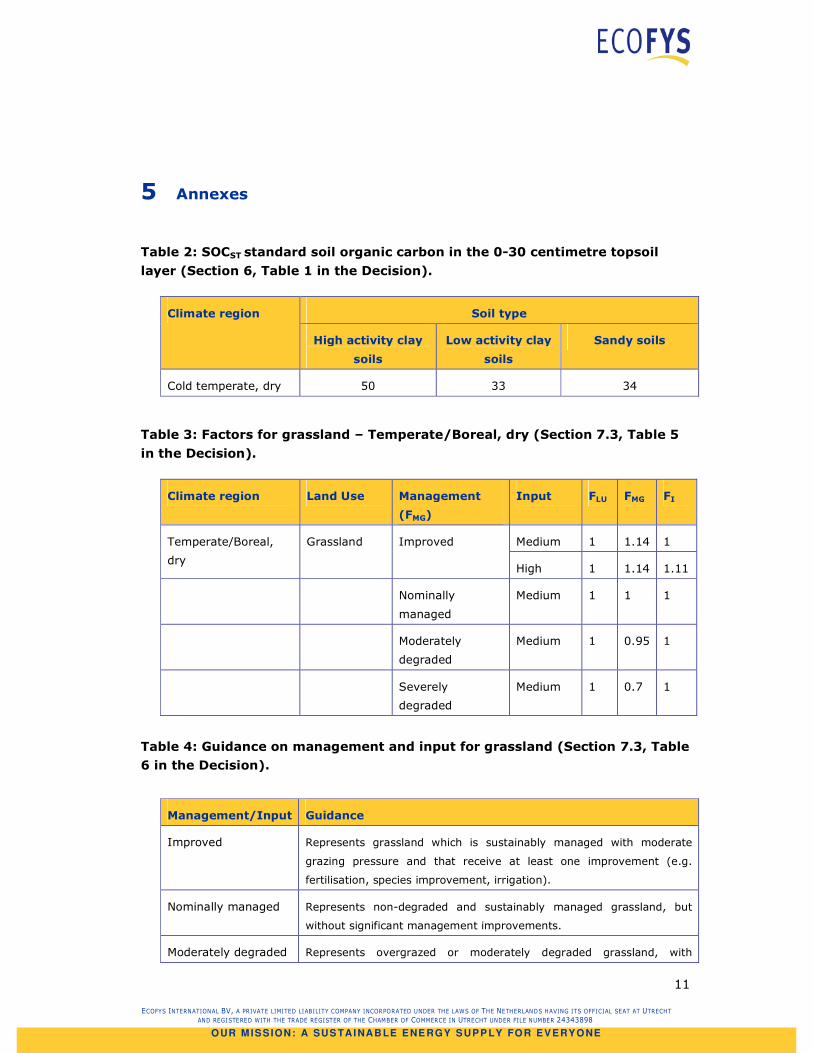
5 Annexes
Table 2: SOCST standard soil organic carbon in the 0-30 centimetre topsoil
layer (Section 6, Table 1 in the Decision).
Soil type Climate region
High activity clay
soils
Low activity clay
soils
Sandy soils
Cold temperate, dry 50 33 34
Table 3: Factors for grassland – Temperate/Boreal, dry (Section 7.3, Table 5
in the Decision).
Climate region Land Use Management
(FMG)
Input FLU FMG FI
Medium 1 1.14 1 Temperate/Boreal,
dry
Grassland Improved
High 1 1.14 1.11
Nominally
managed
Medium 1 1 1
Moderately
degraded
Medium 1 0.95 1
Severely
degraded
Medium 1 0.7 1
Table 4: Guidance on management and input for grassland (Section 7.3, Table
6 in the Decision).
Management/Input Guidance
Improved Represents grassland which is sustainably managed with moderate
grazing pressure and that receive at least one improvement (e.g.
fertilisation, species improvement, irrigation).
Nominally managed Represents non-degraded and sustainably managed grassland, but
without significant management improvements.
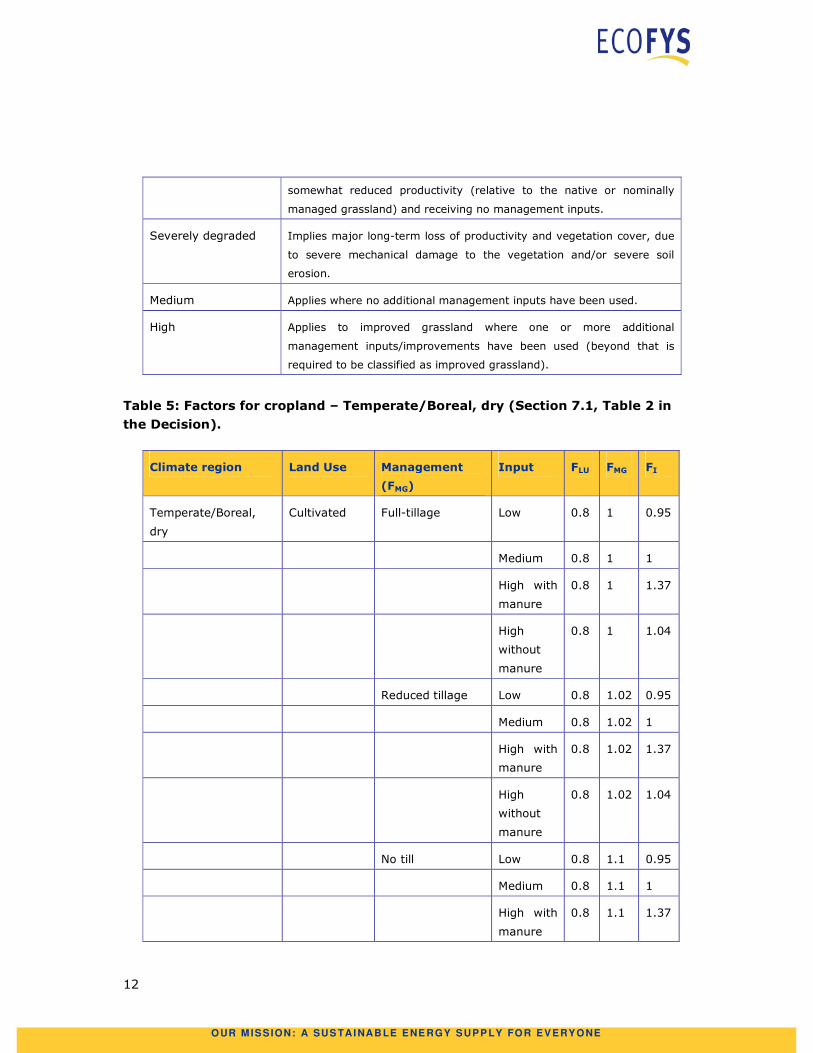
Moderately degraded Represents overgrazed or moderately degraded grassland, with
12
OUR MISSION: A SUS TAINABLE ENE RGY SUPP LY FOR EVERYONE
somewhat reduced productivity (relative to the native or nominally
managed grassland) and receiving no management inputs.
Severely degraded Implies major long-term loss of productivity and vegetation cover, due
to severe mechanical damage to the vegetation and/or severe soil
erosion.
Medium Applies where no additional management inputs have been used.
High Applies to improved grassland where one or more additional
management inputs/improvements have been used (beyond that is
required to be classified as improved grassland).
Table 5: Factors for cropland – Temperate/Boreal, dry (Section 7.1, Table 2 in
the Decision).
Climate region Land Use Management
(FMG)
Input FLU FMG FI
Temperate/Boreal,
dry
Cultivated Full-tillage Low 0.8 1 0.95
Medium 0.8 1 1
High with
manure
0.8 1 1.37
High
without
manure
0.8 1 1.04
Reduced tillage Low 0.8 1.02 0.95
Medium 0.8 1.02 1
High with
manure
0.8 1.02 1.37
High
without
manure
0.8 1.02 1.04
No till Low 0.8 1.1 0.95
Medium 0.8 1.1 1
High with
manure
0.8 1.1 1.37
13
ECOFYS INTERNATIONAL BV, A PRIVATE LIMITED LIABILITY COMPANY INCORPORATED UNDER THE LAWS OF THE NETHERLANDS HAVING ITS OFFICIAL SEAT AT UTRECHT
AND REGISTERED WITH THE TRADE REGISTER OF THE CHAMBER OF COMMERCE IN UTRECHT UNDER FILE NUMBER 24343898
OUR MISSION: A SUS TAINABLE ENE RGY SUPP LY FOR EVERYONE
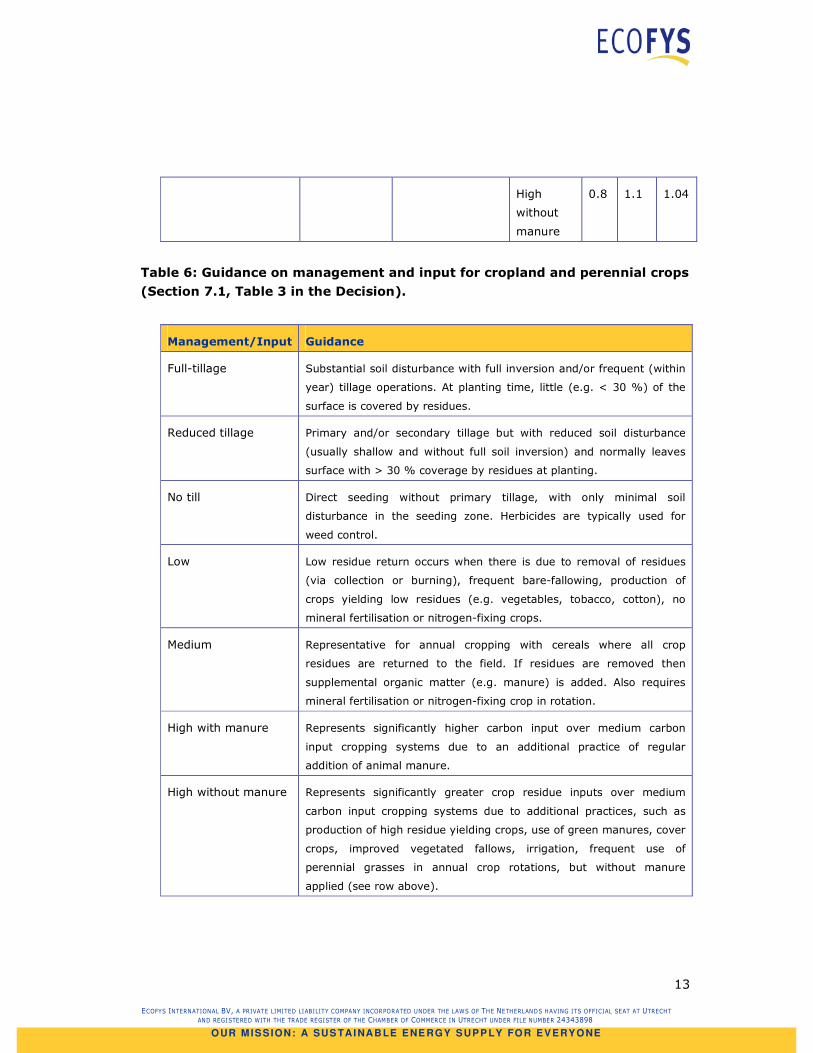
High
without
manure
0.8 1.1 1.04
Table 6: Guidance on management and input for cropland and perennial crops
(Section 7.1, Table 3 in the Decision).
Management/Input Guidance
Full-tillage Substantial soil disturbance with full inversion and/or frequent (within
year) tillage operations. At planting time, little (e.g. < 30 %) of the
surface is covered by residues.
Reduced tillage Primary and/or secondary tillage but with reduced soil disturbance
(usually shallow and without full soil inversion) and normally leaves
surface with > 30 % coverage by residues at planting.
No till Direct seeding without primary tillage, with only minimal soil
disturbance in the seeding zone. Herbicides are typically used for
weed control.
Low Low residue return occurs when there is due to removal of residues
(via collection or burning), frequent bare-fallowing, production of
crops yielding low residues (e.g. vegetables, tobacco, cotton), no
mineral fertilisation or nitrogen-fixing crops.
Medium Representative for annual cropping with cereals where all crop
residues are returned to the field. If residues are removed then
supplemental organic matter (e.g. manure) is added. Also requires
mineral fertilisation or nitrogen-fixing crop in rotation.
High with manure Represents significantly higher carbon input over medium carbon
input cropping systems due to an additional practice of regular
addition of animal manure.
High without manure Represents significantly greater crop residue inputs over medium
carbon input cropping systems due to additional practices, such as
production of high residue yielding crops, use of green manures, cover
crops, improved vegetated fallows, irrigation, frequent use of
perennial grasses in annual crop rotations, but without manure
applied (see row above).
14
OUR MISSION: A SUS TAINABLE ENE RGY SUPP LY FOR EVERYONE
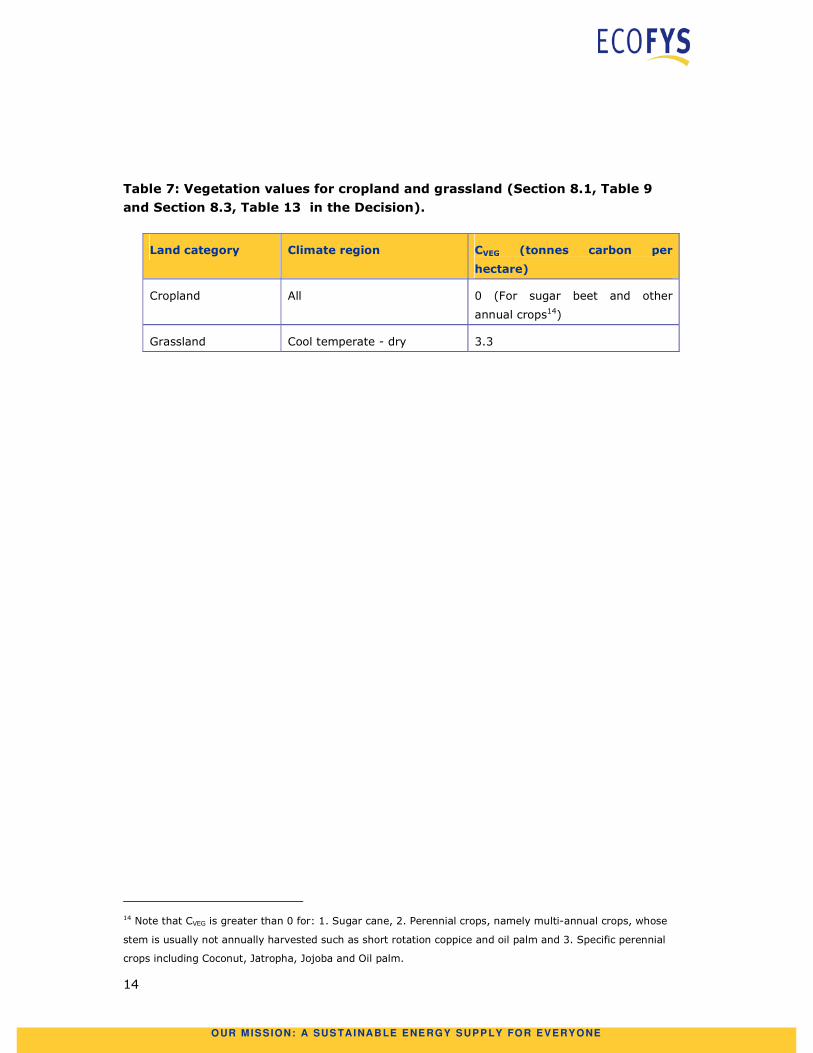
Table 7: Vegetation values for cropland and grassland (Section 8.1, Table 9
and Section 8.3, Table 13 in the Decision).
Land category Climate region CVEG (tonnes carbon per
hectare)
Cropland All 0 (For sugar beet and other
annual crops14)
Grassland Cool temperate - dry 3.3
14 Note that CVEG is greater than 0 for: 1. Sugar cane, 2. Perennial crops, namely multi-annual crops, whose
stem is usually not annually harvested such as short rotation coppice and oil palm and 3. Specific perennial
crops including Coconut, Jatropha, Jojoba and Oil palm.