Embed Size (px)
Citation preview
Istituto Nazionale diGeofisica e Vulcanologia
21
miscellaneaINGV
4th General Meeting UPStrat-MAFAUrban Disaster Prevention StrategiesUsing Macroseismic Fields and FAult SourcesCatania 11 | 14 December 2013
Anno 2013_Numero 21m ISSN 2039-6651

Editorial BoardAndrea Tertulliani - Editor in Chief (INGV - RM1)Luigi Cucci (INGV - RM1)Nicola Pagliuca (INGV - RM1)Umberto Sciacca (INGV - RM1)Alessandro Settimi (INGV - RM2)Aldo Winkler (INGV - RM2)Salvatore Stramondo (INGV - CNT)Gaetano Zonno (INGV - MI)Viviana Castelli (INGV - BO)Marcello Vichi (INGV - BO)Sara Barsotti (INGV - PI)Mario Castellano (INGV - NA)Mauro Di Vito (INGV - NA)Raffaele Azzaro (INGV - CT)Rosa Anna Corsaro (INGV - CT)Mario Mattia (INGV - CT)Marcello Liotta (Univ. Caserta)
Segreteria di RedazioneFrancesca Di Stefano - coordinatoreTel. +39 06 51860068Fax +39 06 36915617Rossella CeliTel. +39 095 7165851
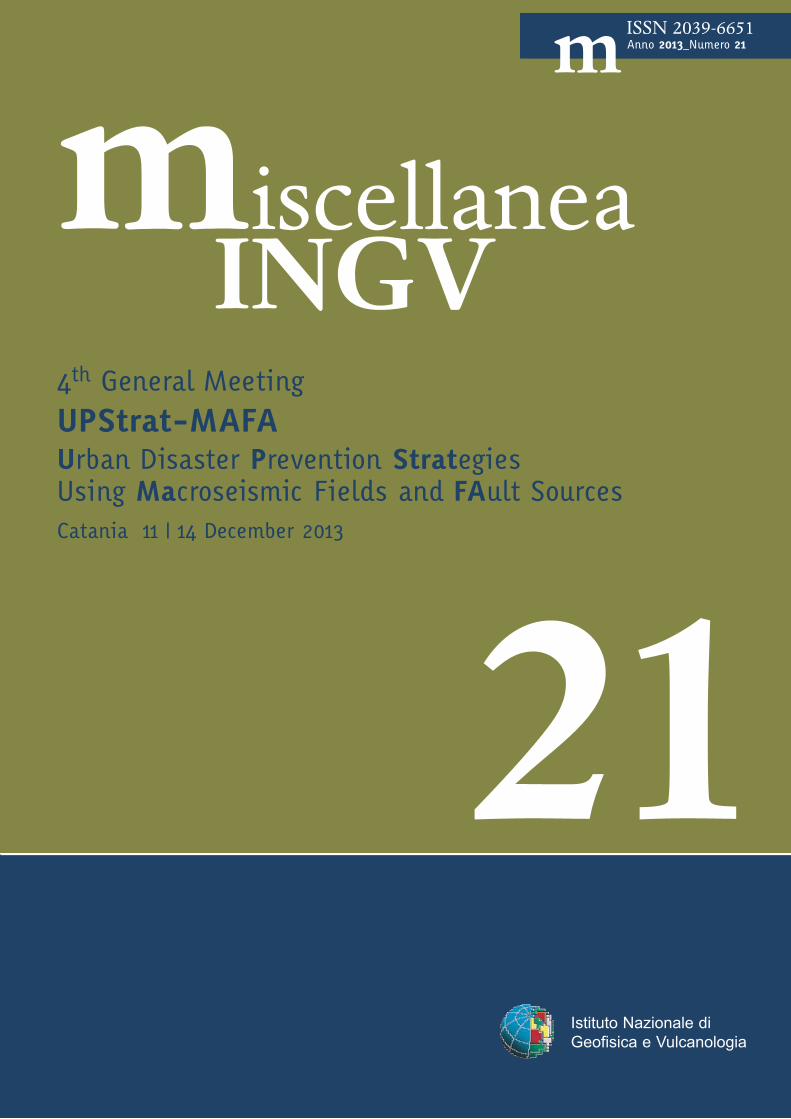
Anno 2013_Numero 21mmiscellaneaINGV
4th GENERAL MEETING
UPSTRAT-MAFA URBAN DISASTER PREVENTION STRATEGIES USING MACROSEISMIC FIELDS AND FAULT SOURCES
CATANIA 11 | 14 DECEMBER 2013
Editors Susanna Falsaperla, Horst Langer, Salvatore Mangiagli, Luciano Scarfì
21
ISSN 2039-6651
Revisione e normazione ortoeditorialeRossella Celi Centro Editoriale Nazionale INGV
Francesca Di Stefano Centro Editoriale Nazionale INGV
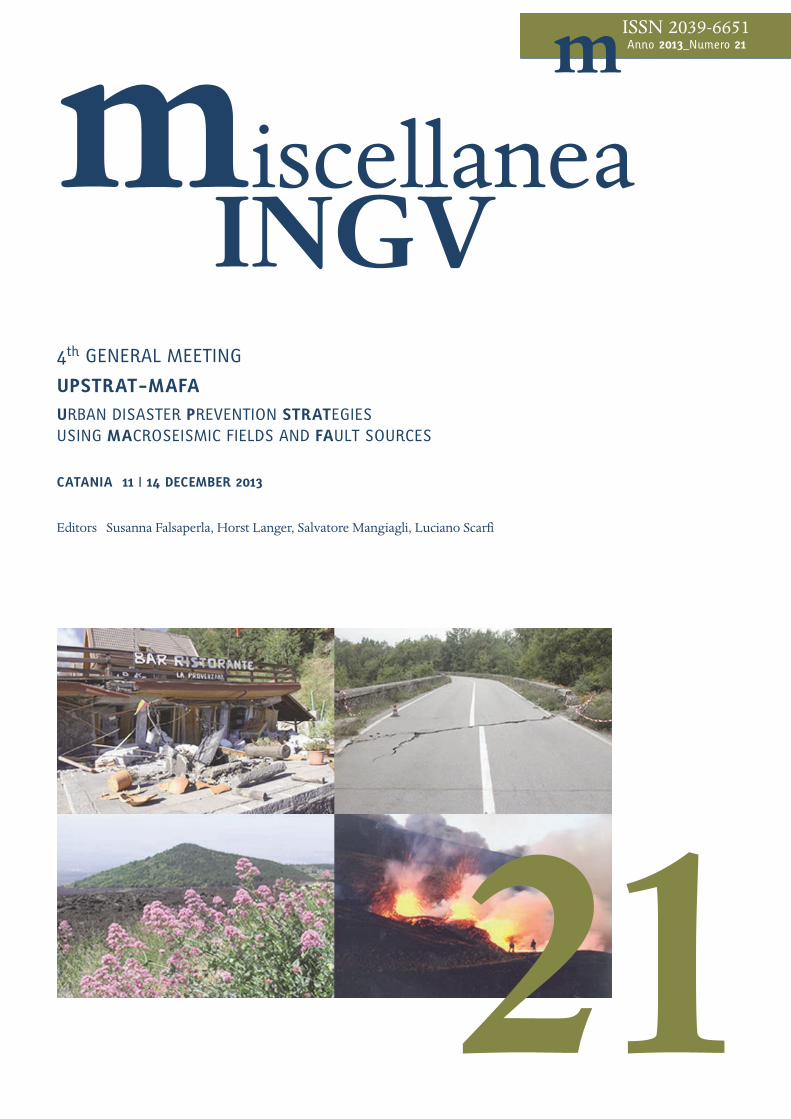
Organizing Team
Gaetano Zonno, Senior Researcher, Project LeaderSusanna Falsaperla, Senior Researcher, Leader Organizing and Scientific CommitteeRaffaele Azzaro, Senior Researcher, Working Group LeaderMauro Amore, Computer Specialist, Member of Organizing Committee, WebBoris Behncke, Researcher, Member of Organizing and Scientific Committee, Leader of Field TripMassimo Cascone, Technician, Member of Organizing Committee, Editorial officeSalvatore D’Amico, Researcher, Member of Organizing and Scientific CommitteeHorst Langer, Senior Researcher, Member of Organizing and Scientific CommitteeSalvatore Mangiagli, Engineer, Member of Organizing Committee, Web MasterLuciano Scarfì, Researcher, Member of Organizing and Scientific CommitteeGiuseppina Tusa, Researcher, Member of Organizing and Scientific CommitteeTiziana Tuvè, Researcher, Member of Organizing and Scientific Committee
Partners
Istituto Nazionale di Geofisica e Vulcanologia (INGV, Italy)Consiglio Nazionale delle Ricerche - Istituto di Matematica Applicata e Tecnologie Informatiche (CNR-IMATI, Italy)Instituto Superior Técnico (IST, Portugal)Agencia Estatal Consejo Superior de Investigaciones Cientificas (CSIC, Spain)Laboratorio Nacional de Engenharia Civil (LNEC, Portugal)Earthquake Engineering Research Centre (EERC, Iceland)
Per l’immagine di frontespizio si ringraziaFabrizio Villa autore della foto in alto a sinistra (il bar ristorante distrutto dal terremoto)
Raffaele Azzaro autore della foto in alto a destra (la strada con la linea di mezzeria dislocata) Alfio Amantia autore delle due foto in basso
Istituto Nazionale diGeofisica e Vulcanologia
Anno 2013_Numero 21m
PrefaceGaetano Zonno 7
Can the ‘bookshelf’ mechanism improve the earthquake modelling in SISZ? Rajesh Rupakhety, Ragnar Sigbjörnsson 9
Mt. Etna volcano: a laboratory for seismic and volcanic hazard and risk assessmentsRaffaele Azzaro 10
On the macroseismic attenuation from the probabilistic perspectiveRenata Rotondi, Carla Brambilla, Elisa Varini 11
A beta-binomial model for macroseismic attenuation. Case studies in European countriesRenata Rotondi, Carla Brambilla, Elisa Varini 13
Validation of macroseismic scenarios from a beta-binomial modelRenata Rotondi, Carla Brambilla, Elisa Varini 15
Statistical tools in the analysis of macroseismic fields for probability modelling of the attenuationRenata Rotondi 17
From small to large earthquakes ground motion simulations: The stochastic finite fault approach applied to Campi Flegrei volcanic areaDanilo Galluzzo, Francesca Bianco, Mario La Rocca, Gaetano Zonno 19
Ground Motion Scenarios in the Area of Mt. Etna inferred from Synthetic SimulationsHorst Langer, Giuseppina Tusa, Luciano Scarfì, Raffaele Azzaro 21
Ground motion modeling based on Icelandic and Italian dataSímon Ólafsson, Ragnar Sigbjörnsson 23
Calibration of the stochastic finite-fault model parameters for Portugal Mainland and Azores areaAlexandra Carvalho, Cláudia Reis and Dina Vales 24
On local empirical relationships to convert strong-motion recordings into macroseismic intensityRagnar Sigbjörnsson, Rajesh Rupakhety, Símon Ólafsson 25
Calibration, Simulation and Site EffectsMariano García-Fernández and Task C Working Group 26
Seismic Hazard at Site using the SASHA ApproachDario Albarello, Vera D’Amico 27
Application of SASHA to seismic hazard assessment for IcelandVera D’Amico, Dario Albarello, Ragnar Sigbjörnsson, Rajesh Rupakhety 29
Applications of the SASHA procedure for PSHA in Portugal MainlandAlexandra Carvalho, Dario Albarello 30
Probabilistic Seismic hazard assessment for Mt. EtnaRaffaele Azzaro, Salvatore D'Amico, Tiziana Tuvè, Gaetano Zonno 31
Index
ISSN 2039-6651
Disruption index: a holistic assessment of earthquake riskMónica Amaral Ferreira, Francisco Mota de Sá, Carlos Sousa Oliveira 33
Sustainable Seismic Risk Mitigation Strategies based on Probabilistic Loss ScenariosAlfredo Campos Costa, Alexandra Carvalho, Paulo Candeias, António Correia, Luisa Sousa, Ema Coelho 36
Vulnerability and seismic risk analysis in the urban Mt. Etna areaMaria Luisa Sousa, Salvatore D’Amico, Fabrizio Meroni, Gaetano Zonno 37
Impact Assessment of the 2011 Lorca Earthquake: QUAKEIST Seismic Simulator ApproachAlba Beltrán Díez , Maria Jose Jiménez, Mariano García-Fernández, Monica Amaral Ferreira, Carlos Sousa Oliveira, Francisco Mota de Sá 39
The Disruption Index evaluation in the urban Mt. Etna area (Italy)Fabrizio Meroni, Raffaele Azzaro, Salvatore D'Amico, Tiziana Tuvè, Gaetano Zonno, Monica A. Ferreira, Francisco Mota de Sà, Carlos Sousa Oliveira, Carla Brambilla, Renata Rotondi, Elisa Varini 41
Disruption index: application to Portugal (Azores, Algarve and Lisbon)Mónica Amaral Ferreira, Francisco Mota de Sá, Carlos Sousa Oliveira 43
QuakeIST®: risk softwareFrancisco Mota de Sá, Carlos Sousa Oliveira, Mónica Amaral Ferreira 44
Disruption Index Analysis: A case study for Hveragerdi TownRajesh Rupakhety, Ásthildur Elva Bernhardsdóttir, Ragnar Sigbjörnsson 45
Earthquake impacts and strategies to reduce itCarlos Sousa Oliveira 47
A multimedia tool for dissemination of tasks and results of the EU Project UPStrat-MAFA(Urban disaster Prevention Strategies using MAcroseismic Fields and FAult Sources)Rosella Nave, Fabio Sansivero, Gaetano Zonno and the UPStrat-MAFA Outreach Working Group 48
A self-designed portable exhibit as interactive educational toolSusanna Falsaperla, Ferruccio Ferrari, Danilo Reitano, Salvo Sterlini 50
Augment reality on Earth Science: a basic approach on disseminationSimone Sorge, Giuseppe Mangioni, Susanna Falsaperla, Danilo Reitano 51
Cooperation between EERC and local autorities in the South Iceland LowlandÁsthildur Elva Bernhardsdóttir, Ragnar Sigbjörnsson 52
Surveys on Seismic Risk ReductionÁsthildur Elva Bernhardsdóttir, Gemma Musacchio, Monica Amaral Ferreira 53
The EERC Educational Film: “HVERAGERÐI in Compliance with Nature”Ásthildur Elva Bernhardsdóttir, Eva Lind Höskuldsdóttir, Ragnar Sigbjörnsson 54
Implementation, harmonization and further development of the EurocodesFabio Taucer 55
UPStrat-MAFA 4TH General Meeting Catania 11 | 14 December 2013
7
PREFACE The European project UPStrat-MAFA (Urban Disaster Prevention Strategies using MAcroseismic and FAult Sources) is a European Commission Project in the area of “Developing knowledge-based disaster prevention policies” whose primary aim is to produce seismic risk analyses for disaster prevention strategies. The European project has been co-financed by UE - Civil Protection Financial Instrument. The main goal of the project was to reach a harmonisation at the urban risk level, merging the best practices and available data in particular locations - Mt. Etna, Campi Flegrei areas (Italy), the Azores Islands and areas hit by offshore seismic activity (Portugal), Southeast Spain (i.e., Alicante-Murcia) and South Iceland including the metropolitan area of Reykjavik. Fruitful collaborations have been established among the members of this two years project, being the group well balanced between seismologists, engineers and statisticians. The project has covered all the issues that need to be addressed for the development of the proposed research and the achievement of measurable progresses beyond the state-of-the-art for urban prevention strategies based on the level of risk and on the education information system. The project focuses on two main aspects: a) Disaster prevention strategies based on the level of risk: A new concept of global disruption measures is
introduced, with the objective to provide a systematic way to measure earthquake impact in urban areas. Then, a framework is provided where urbanised areas are seen as a complex network where nodal points have roles as sources and sinks, interacting together in an interdependent fashion. These properties are then used to identify which nodes are likely to introduce major disruptions in the whole urban system, and also which of these nodes are the most relevant, implying greater risk reduction if suitable actions are taken.
b) Disaster prevention strategies based on education information system. Effective disaster-risk reduction can be developed in particular through long-term activities, such as education. Often, people have the idea that natural hazards will strike others, but not themselves. In part, this is connected with education itself: textbooks often present “horrible” cases from places far away, compared to which local disasters appear trivial. Consequently, there is an absence of risk perception in people’s lives, which influences development and planning of the community and state, as well as the educational curriculum, and media priorities.
The final beneficiaries will be the Civil Protection, Local Authority and civil society of the State Members participating in the project, and in general, the European Institutions acting in the field of urban disaster-prevention strategies. During the 4th General Meeting in Catania (Italy) on 11th-14th December 2013, the development and final achievements will be presented through oral presentations, posters and round table discussions. The tasks will be presented according to the following structure: • Seismic hazard assessment: a) forecast damage scenarios using observed and synthetic macroseismic
fields to simulate intensity shake maps, given the parameters on the location and intensity of an earthquake; b) evaluate the seismic hazard at a site using macroseismic fields and fault sources; in this case, the seismic histories at the site will be integrated by synthetic effects using finite-fault ground-motion stochastic simulations.
• Seismic risk assessment: a) collect urban-scale vulnerability information on building and network systems; b) evaluate urban-scale exposure by defining synthetic indices and by the use of GIS tools; c) define urban risk, convolving the shaking ground-motion parameters at the site with the vulnerability and exposure.
• Disaster prevention strategies: a) define disaster prevention strategies based on the level of risk (typologies, schools, strategic buildings, critical infrastructures; and so on) and based on an education management information system linked to information about areas and population groups that are prone to particular kinds of emergencies.
Project Leader Gaetano Zonno

UPStrat-MAFA 4TH General Meeting Catania 11 | 14 December 2013
9
Can the ‘bookshelf’ mechanism improve the earthquake modelling in SISZ?
Rajesh Rupakhety, Ragnar Sigbjörnsson
Earthquake Engineering Research Centre, University of Iceland, Selfoss, Iceland
Iceland is a superstructural part of the Mid-Atlantic Ridge, a diverging boundary in the North Atlantic Ocean between the North American and the Eurasian Plates. Across Iceland from southwest to the north, the rift zone is displaced towards the east through two major fracture zones or ‘transform faults’. These are the South Iceland Seismic Zone (SISZ), located on-land, and the Tjörnes Fracture Zone (TFZ), which is mainly placed off-shore. The most destructive earthquakes in Iceland have occurred within the SISZ. It extends about 80 km in the east-west direction through the South Iceland Lowland with earthquake epicentres aligned in a 5-10 km wide band. The area towards north of the zone belongs to the North American Plate, which is moving in westerly direction; while the area south of the zone is a part of the eastward moving Eurasian Plate. However, an east-west trending fault is not visible on the surface. On the other hand, the left lateral motion across the zone is accommodated by a series of north-south trending parallel faults, the traces of which are clearly visible on the surface. Hence, the overall relative left lateral motion is accommodated by right lateral motion across the north-south trending, nearly vertical, strike-slip faults. A simplified description of this tectonics is analogous to the so-called ‘bookshelf’ mechanism, modelling the SISZ as a series of rotating blocks deforming in shear. A characteristic of this ‘bookshelf’ mechanism is that more than one north-south trending faults-most commonly neighbouring ones as in the case of the 2008 Ölfus Earthquake-rupture at the same or nearly the same time. Similar mechanisms were also observed during the June 2000 Earthquake Sequence as well as in the 1896 South Iceland Earthquake Sequence. In this regard, the earthquakes in SISZ are peculiar, and consequently, the commonly adopted ground-motion modelling that considers slip on a single fault might not be appropriate. Apart from this, magnitude and location estimation of earthquakes in this region need to consider the two-fault mechanism commonly observed there. The poster visualises these phenomena and outlines its implications both from the theoretical and practical point of view.
UPStrat-MAFA 4TH General Meeting Catania 11 | 14 December 2013
10
Mt. Etna volcano: a laboratory for seismic and volcanic hazard and risk assessments
Raffaele Azzaro
Istituto Nazionale di Geofisica e Vulcanologia - Osservatorio Etneo, Catania, Italy
Mt. Etna, the largest active volcano in Europe, is well-known for its continuous and intense eruptive phenomena. The frequent summit activity, with vigorous ash emissions, cause problems in the aeronautic traffic of Southern Italy; flank eruptions generate lava-flows destroying man-made features and invading cultivated or inhabited zones; recurrent volcano-tectonic earthquakes damage buildings and infrastructures. In some cases, all these events occur at the same time, therefore the assessment of hazard at Etna is a multidisciplinary matter, which should be faced by an integrated approach. The analyses regarding seismic hazard and risk under the perspective of disaster prevention strategies, is covered by the UPStrat-MAFA Project, which applied common methodological approaches to some volcanic regions in Europe such as Iceland, Mt. Vesuvius-Campi Flegrei and Etna. The opportunities that this last mentioned volcano offers for testing methodological approaches in different application fields, derive from its high degree of instrumental monitoring, together with the availability of a long record of historical information on seismic and volcanic phenomena occurring in the last centuries, features not common for other volcanic areas worldwide. These have led in the latest years to undertake studies aimed at assessing seismic hazard at a local scale, due to the availability both of a detailed volcano-tectonic earthquake catalogue and the well-known seismotectonic behaviour of faults. The first probabilistic seismic hazard assessment (PSHA) was carried out at Etna by applying a procedure based on the use of macroseismic data, namely SASHA. The method produces PSHA expressed in terms of maximum intensity expected in a given exposure time. This study demonstrated that for an exposure time of 50 years, the standard interval used by the national seismic hazard map MPS04, the hazard in the Etna region is controlled by the destructive regional earthquakes (6.6 ≤ MW ≤ 7.4) that struck eastern Sicily in 1169, 1693, 1818 and 1908, while for shorter periods (30-10 yrs) the local seismicity (ML ≤ 5.1) due to the seismogenic faults in the eastern flank of the volcano begins to influence the hazard. More recently, it has been tested a fault-based seismic hazard approach using the same macroseismic dataset, in order to investigate alternative earthquake occurrence models, under the Poissonian (stationary) and time-dependent assumptions. The study focused on the methodological approach and validation of results in the perspective of a mid-term (5 years) earthquake rupture forecast also in a volcanic region such as Etna. On the other hand, an earthquake scenario procedure has been implemented in the software PROSCEN, which is an alternative to the worldwide adopted approach SHAKEMAP. Given the location and the epicentral intensity of the earthquake to be simulated, and according to an isotropic or anisotropic model of attenuation (if fault parameters are known), the software generates the probabilistic seismic scenario as (i) the intensity that can be exceeded with a fixed probability, or (ii) the probability of exceeding a fixed intensity value. The first representation may also find application in seismic monitoring at Etna volcano, in order to produce real-time intensity shake maps based on the instrumental parameters calculated by the automatic earthquake processing system. Starting from this “state of art”, the UPStrat-MAFA Project worked to pass to the risk analysis, sharing methodologies set up by the other project partners. After some refinements of the SASHA tools and probabilistic attenuation models, the activity focused on the estimation of ground motion scenarios through synthetic simulations, adopting complex seismic source models and the computer code EXSIM. Finally, the assessment of the seismic risk at Etna was obtained according to the method of Disruption Index (DI) approach. It provides a global measure of the effects of an earthquake taking into account not only the size of the event (epicentral intensity, magnitude), but also the impact on the local network of lifelines and infrastructures and their interconnections. To apply DI, we use a probabilistic approach to estimate the seismic input hazard evaluation based on both macroseismic fields and fault parameters. Data used to assess the vulnerability at the urban scale, are organized by a GIS; the main fields of information include building typologies, location of schools and other strategic infrastructures, type and pattern of essential lifelines, etc. The computation of DI is based on the convolution of ground motion parameters and vulnerability/impact values by a Monte Carlo simulation. The results of the first application of DI provide the identification of the municipalities more exposed to seismic risk for the scenario earthquake, and the elements that contribute to DI.
UPStrat-MAFA 4TH General Meeting Catania 11 | 14 December 2013
11
On the macroseismic attenuation from the probabilistic perspective
Renata Rotondi, Carla Brambilla, Elisa Varini
Consiglio Nazionale delle Ricerche, Istituto di Matematica Applicata e Tecnologie Informatiche, Milano, Italy
In this work we address the issue of the seismic attenuation from a probabilistic perspective, which enables to formalize both the aleatory variability and epistemic uncertainty inherent the decay process. To this end the intensity at site Is, or analogously the intensity decay, is considered as a random variable which follows a beta-binomial model, in which, given the epicentral intensity Io, Is has a binomial distribution over [0, Io] with parameter p that, in its turn, follows a beta distribution depending on the epicentre-site distance [Zonno et al., BSSA, 2009]. The model can be applied both under the isotropic and the anisotropic assumption for intensity decay. As for the anisotropic assumption, up to date only the hypothesis of elliptic isoseismal lines has been taken into account, but in principle other curves could be considered as long as it is possible to find a transformation which brings back to the circular pattern typical of the isotropic assumption.
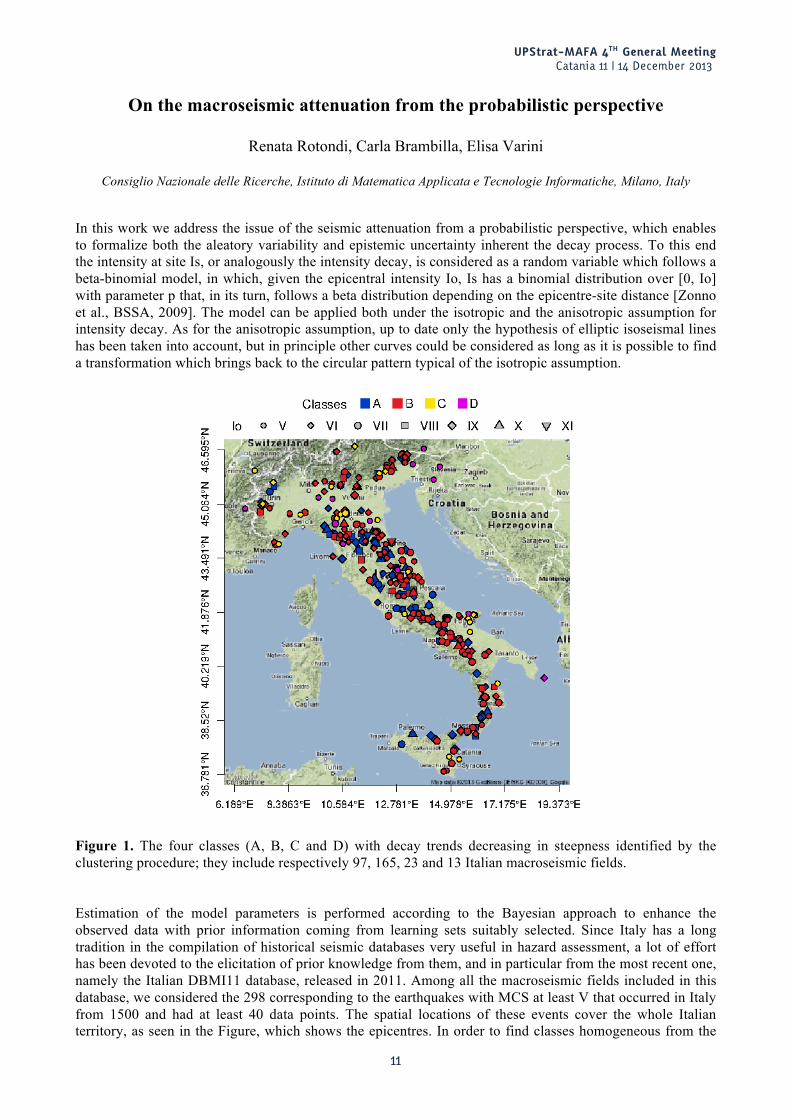
Figure 1. The four classes (A, B, C and D) with decay trends decreasing in steepness identified by the clustering procedure; they include respectively 97, 165, 23 and 13 Italian macroseismic fields.
Estimation of the model parameters is performed according to the Bayesian approach to enhance the observed data with prior information coming from learning sets suitably selected. Since Italy has a long tradition in the compilation of historical seismic databases very useful in hazard assessment, a lot of effort has been devoted to the elicitation of prior knowledge from them, and in particular from the most recent one, namely the Italian DBMI11 database, released in 2011. Among all the macroseismic fields included in this database, we considered the 298 corresponding to the earthquakes with MCS at least V that occurred in Italy from 1500 and had at least 40 data points. The spatial locations of these events cover the whole Italian territory, as seen in the Figure, which shows the epicentres. In order to find classes homogeneous from the
UPStrat-MAFA 4TH General Meeting Catania 11 | 14 December 2013
12
attenuation point of view, the selected macroseismic fields have been characterized through summaries of the spatial distribution of the intensity decay (more specifically through location and dispersion measures computed for each set of distances from the epicentre to the sites where the same intensity is recorded), and then clustered through a hierarchical agglomerative clustering method on the basis of that characterization. The result of the clustering procedure is four classes (A, B, C and D in the Figure) with decay trends decreasing in steepness; the remaining macroseismic fields of DBMI11 with less than 40 points (therefore less informative) have been associated to one of the four classes by using a classification tree built with the 298 more informative macroseismic fields. At present the four classes derived as above described are the learning sets available for applications of the model. In each specific application the choice of the most suitable class is carried out by graphically comparing the decay trends of the earthquakes under study with those of the classes and then by choosing the most similar one. Where needed, the result of the graphical comparison is complemented by the use of the above mentioned classification tree. Once a suitable class is selected, for each Io and inside circular bins around the epicentre (whose width can be variable depending on the case under study), we assign the hyperparameters of the prior beta distribution of p on the basis of the information provided by the macroseismic fields of the selected class; then the hyperparameters are updated on the basis of the relevant data of the study in question, thereby obtaining the posterior estimate of p and of the binomial distribution of Is for each bin. By smoothing the posterior estimates of p we obtain then the so-called smoothed binomial distribution of Is at any given distance d from the epicentre. The mode of this probability distribution is taken as estimate of Is and it is used to forecast a future damage scenario expressed in terms of macroseismic intensity. It is also possible to express the uncertainty of the phenomenon by computing the probability of exceeding a given intensity at the site, the value of Is not exceeded at least with a fixed probability, the probability that the intensity is in a given range, and so on. In the framework of the European project “Urban Prevention Strategies using MAcroseismic and Fault sources” (UPStrat-MAFA), the beta-binomial model has been applied in different European test areas: South Iceland, Alicante-Murcia region (Spain), Mt.Etna (Italy), Azores Islands and Portugal (inland and offshore).
UPStrat-MAFA 4TH General Meeting Catania 11 | 14 December 2013
13
A beta-binomial model for macroseismic attenuation. Case studies in European countries
Renata Rotondi, Carla Brambilla, Elisa Varini
Consiglio Nazionale delle Ricerche, Istituto di Matematica Applicata e Tecnologie Informatiche, Milano, Italy
In the last years the issue of the macroseismic attenuation has been tackled from a probabilistic point of view and inside this perspective a beta-binomial model has been proposed by Zonno et al. [BSSA, 2009] and tested on Italian macroseismic data. The model can be applied both under the assumption of isotropic and anisotropic intensity decay.
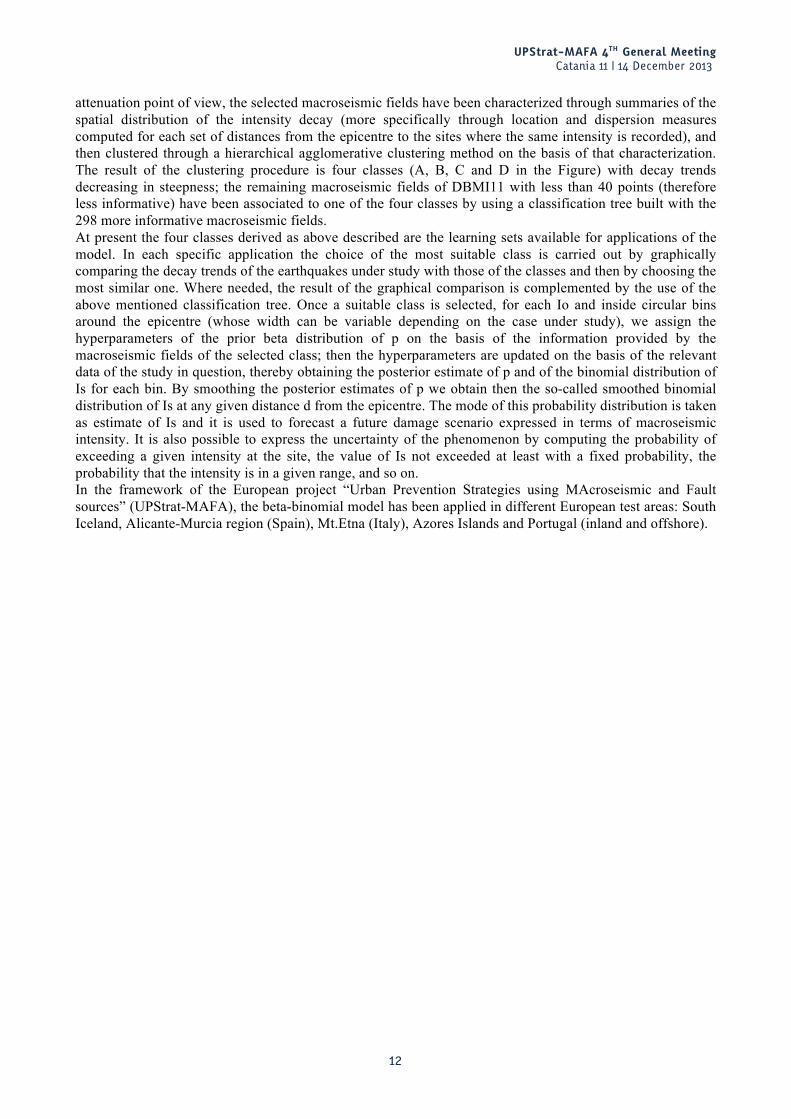
Figure 1. Estimated attenuation distributions of the intensity for isotropic and anisotropic (right, Iceland and Etna) cases. Color bar indicates probability; in black the intensities at sites as forecast by the mode of the smoothed binomial probability.
UPStrat-MAFA 4TH General Meeting Catania 11 | 14 December 2013
14
This work refers to the application of the model in different test areas in Europe, namely South Iceland, Alicante-Murcia region (Spain), Azores Islands, inland and offshore Portugal, and Mt. Etna region (Italy). This Italian region was not taken into account when at first the model was tested because of the peculiar decay trend of the volcanic earthquakes occurring in the area. The data sets for South Iceland, Azores Islands, Alicante-Murcia region and Mt Etna include respectively 3, 15, 30 and 54 macroseismic fields (Mfs), together with the coordinates of the epicentres. The data sets of mainland and offshore Portugal contains respectively 10 and 9 Mfs. For most of them we have the coordinates of the epicentres, whereas for few we have the coordinates of the extremes of the fault ruptures. It is worth to highlight a peculiarity of the Mfs of offshore Portugal, namely the lack of felt reports at short distances from the epicentre or from the fault rupture. We have the coordinates of the extremes of the fault ruptures also for the 3 Icelandic earthquakes, for 14 among the 54 Mt Etna region earthquakes above mentioned and for 3 additional Mfs of Mt Etna region. In all the case studies we considered the isotropic assumption for the intensity decay. The anisotropic assumption was considered for the sets of the 3 Icelandic earthquakes and of the 17 Mt Etna region earthquakes for which we know the coordinates of the extremes of the fault ruptures. Anisotropy was expressed by elliptical isoseismal lines such that the major axis of the first isoseismal line corresponds to the fault rupture of the earthquake; anisotropic trends are turned in isotropic trends through a plane transformation of the ellipse into a circle. For each test area at first we carried out an explanatory analysis of the decay trends of the earthquakes under study in order to compare them with those of the four classes of Italian Mfs (with decay trends decreasing in steepness) which at present are the learning sets at disposal for implementing the Bayesian estimation procedure required by the model. Because of the difference with the impact area of the Italian earthquakes, this involved to look for a shrinkage spatial factor k which made comparable in the two environments the distances at which the same decays were observed. The comparison drove us to consider the class with steepest decay trend (A) as learning set for South Iceland, Alicante-Murcia region (Spain) and Azores Islands, and the class with the second steepest decay trend (B) for inland and offshore Portugal, and for Mt Etna region. By applying the model we obtain damage scenarios expressed in terms of estimated macroseismic intensity, and auxiliary information about the uncertainty of the phenomenon. Very interesting is the possibility of comparing the estimated attenuation distributions of different regions for every given epicentral intensity, as shown in the Figure for the epicentral intensity IX.

UPStrat-MAFA 4TH General Meeting Catania 11 | 14 December 2013
15
Validation of macroseismic scenarios from a beta-binomial model
Renata Rotondi, Carla Brambilla, Elisa Varini
Consiglio Nazionale delle Ricerche, Istituto di Matematica Applicata e Tecnologie Informatiche, Milano, Italy
A beta-binomial model for the attenuation of the macroseismic intensity [Zonno et al., BSSA, 2009], developed on the basis of Italian macroseismic data, has been applied in different European test areas considering also the anisotropic assumption of intensity attenuation, where feasible. Given the epicentral intensity Io, the model enables to forecast damage scenarios in terms of macroseismic intensity at site at every given distance from the epicentre or the fault rupture. Validation is carried out by comparing the observed macroseismic fields and the predicted scenarios. Three validation criteria are used; two of them, called respectively scoring rule (s1) and log-odds ratio (s2), are expressed in probabilistic terms, the third one, called discrepancy score (s3), is simply based on the absolute differences between observed and predicted intensities. For all the criteria small values signify successful predicted scenarios. Small score values (s1=1.3930, s2= 0.0033 and s3=0.0313) were obtained for example for the 2007/02/12 earthquake, Io X, occurred in offshore Portugal; the predicted scenario generated by applying a regional attenuation model for inter-plate zones of Portugal [Sousa and Oliveira, Natural Hazard, 1997] provides a much higher value (0.5547) of the discrepancy score. The predicted scenario of the 1909 Benavente earthquake, Io X, obtained under the anisotropic attenuation assumption is quite satisfactory too; the score values are s1=1.6049, s2=0.2336 and s3=0.8277 and, in particular, the discrepancy score s3 is less than half the one obtained by applying the regional attenuation model for intra-plate zones of Portugal [Sousa and Oliveira; Natural Hazard, 1997]. The average discrepancy of 0.8277 between felt and predicted intensities is mainly due to the overestimation of low intensity values. It is worth to mention the results on the Great Lisbon earthquake occurred on 1755, Io XII, for which the discrepancy score is clearly in favor of the beta-binomial model (s3=0.6604) when compared with the one obtained by the regional model (2.3608). For Portugal, scenarios derived by the beta-binomial model on average have a discrepancy of 0.5 degree with respect to observed intensities and show often a better performance than those obtained by the regional attenuation models, for which the average discrepancy exceeds one degree of intensity.
Figure 1. Observed macroseismic field of Mt Etna 1984/10/25 earthquake, Io VIII, and predicted scenario obtained under the anisotropic attenuation assumption. Black lines correspond to the fault rupture.
UPStrat-MAFA 4TH General Meeting Catania 11 | 14 December 2013
16
Predicted scenarios from both the beta-binomial model and suitable regional attenuation laws were generated also for the earthquakes of the other European test areas. For Alicante-Murcia region three regional attenuation laws have been considered; two of them are the very high and high attenuation trends as formulated by Casado et al. [BSSA, 2000], the other one derives from Martin [PhD thesis, 1980]. For Mt Etna region we used the ad hoc regional attenuation model given in Azzaro et al. [Annals of Geophysics, 2006], whereas for South Iceland we used the one given in Sigbjörnsson et al. [Bull. Earthquake Eng., 2007]. For the Alicante-Murcia region, the discrepancy score is in favor of the beta-binomial model for the 67%, 63% and 80% of the predicted scenarios with respect to the three regional attenuation laws taken into account; on average, the discrepancy score for the beta-binomial model is 0.9026, a significantly better value than the values 1.3424, 0.9973 and 1.1263 obtained with the three regional laws. As for the Mt Etna volcanic area, both beta-binomial and regional models have similar performance under the isotropic assumption but, on average, the beta-binomial model is preferable under the anisotropic assumption, even if it tends to slightly overestimate. For the 2002/10/29 earthquake, Io VIII, for example, the discrepancy score for the anisotropic scenarios is 0.6486, which improves the value 0.7027 obtained by the ad hoc attenuation law. In this case, the beta-binomial model suffers from the slight overestimation of the intensities at intermediate distances from the fault rupture, whereas the regional law seems both to underestimate the high felt intensities and overestimate the low ones. Similar arguments hold also for the 1914/05/08 earthquake, Io IX. Excellent results are obtained for the 1984/10/25 earthquake, Io VIII, whose observed and predicted scenarios are shown in the Figure. The comparison of isotropic and anisotropic scenarios for the available macroseismic fields in South Iceland shows some weak evidence in favor of the anisotropic assumption; in this case, the average discrepancy score from the beta-binomial model is 0.7034, compared to the value 0.8834 obtained by the regional attenuation law. A detailed understanding of overestimation and underestimation can be obtained by the so called confusion matrices, which allow to compare observed and estimated intensity values separately for each degree.

UPStrat-MAFA 4TH General Meeting Catania 11 | 14 December 2013
17
Statistical tools in the analysis of macroseismic fields for probability modelling of the attenuation
Renata Rotondi
Consiglio Nazionale delle Ricerche, Istituto di Matematica Applicata e Tecnologie Informatiche, Milano, Italy
Information content of a macroseismic field is generally summarized by tracing the isoseismals. A simple examination of a series of fields on the basis of these curves fully proves the complexity of the problem to identify a global pattern among the trends of decay of the macroseismic intensity shown by the various earthquakes. This investigation raises some questions on: 1) the dependence of the decay pattern on the epicentral intensity; 2) the existence of a specific shape for the isoseismals in a seismogenic zone; 3) the way in which the velocity of the decay changes as a function of the epicentre-site distance; 4) the possible correlation among shape of the isoseismals and some tectonic features; 5) how to quantify and include into the model the various sources of uncertainty inherent in the phenomenon. Some kinds of explorative analysis can give hints on these points. In the UPStrat-MAFA project the following logical path has been made: circular - under the isotropic assumption – and elliptical – under the anisotropic assumption – shapes were chosen for the isoseismals. Fixed a value of the epicentral intensity, the field generated by each earthquake of that Io was characterized by the mean, the median and the 3rd quartile of the sets of distances between the epicentre and the sites where the same intensity decay was observed. The large matrix that collected all these characterizations was the basis for the computation of a dissimilarity matrix among the macroseismic fields, required for the application of a clustering method. Finally, the fields that turned out to be homogeneous from the decay viewpoint were used to estimate the parameters of a beta-binomial probability model.
Figure 1. Mt Etna test area - Data depth median curves representative of the trend of decay of the macroseismic fields with a point source (a) and with a finite source (b). Red crosses indicate the virtual epicentre (a) and middle point of finite source (b), respectively. In this presentation another approach is proposed which is borrowed from the multivariate nonparametric (free model) statistics. In 1975 a function was introduced which measures the depth or centrality of an arbitrary point z with respect to a data cloud in a multidimensional space. Since then, on the basis of the notion of data depth a rich and fruitful statistical methodology has been developed and many different data depth functions have been studied. Recently these ideas have been extended to objects belonging to an infinite dimensional space, like functions and curves. In this framework data depth induces ordering and ranking for a set of curves such that the most central curve, the median, gets the highest depth and the least
UPStrat-MAFA 4TH General Meeting Catania 11 | 14 December 2013
18
central ones the smallest depth. Moreover, as the quantiles of p- and (1-p)-order of an univariate distribution F can be built around the median, analogously in the functional case, on the basis of a depth function, it is possible to define, around the median curve, the “pth central region” as the band delimited by the proportion p of deepest curves. In this way, while in the first approach statistical summaries, like mean, median, and quartiles, have been computed on univariate data (site-epicentre distances), now the representative pattern of a sample of curves is illustrated by the deepest curve - median – and the dispersion around it is visualized by the central regions. Moreover, particular depth functions also enable to detect clusters and outliers in the set of curves which denote sub-patterns and anomalous behaviours. Among the advantages of this second approach there are the robusteness and the independence on any model: indeed, the median resists effects of polluted data while it is sufficient a heavily deflecting datum to influence the mean. On the other hand, data-depth methods allow to perform truly data-driven analyses without imposing too rigid structures as the elliptical symmetry and unimodality when a multivariate normal distribution is assumed. Unfortunately, lacking the possibility to exploit prior or external information as in the Bayesian approach applied in the first explorative methodology, the quality of the results depends heavily on the amount of the data that is generally quite limited in the case of macroseismic fields. The Figure shows an example of the results obtained for the data related to Mt. Etna test area, by analyzing macroseismic fields with a point source (a) and those with a finite source (b). In both the cases all the data points have been translated so that, for each field, the epicentre or the middle point of the source coincides with a virtual origin; in this way all the data can be examined jointly. Each curve is the median, in the sense of the chosen depth function, of the set of curves including the sites of each field with decay not larger than a fixed value; the curves in Figure 1 represent the global pattern of the decay corresponding, from center outward, to decay equal to 1, 2, 3 degrees, respectively. In the isotropic case, the analysis globally supports the choice made in the UPStrat-MAFA project to use circular-shaped attenuation trends; also in the anisotropic case the elliptical shape seems to be confirmed, and some indication on the directivity emerges from the data at least in the first two median curves.
UPStrat-MAFA 4TH General Meeting Catania 11 | 14 December 2013
19
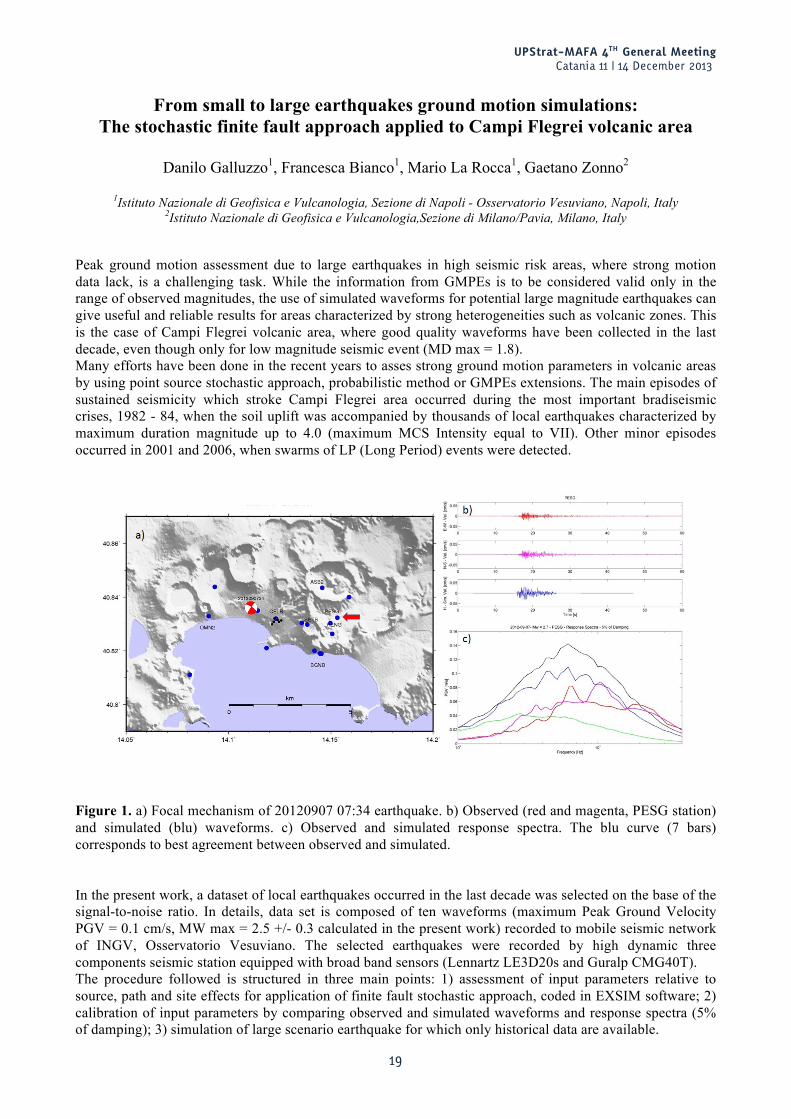
From small to large earthquakes ground motion simulations: The stochastic finite fault approach applied to Campi Flegrei volcanic area
Danilo Galluzzo1, Francesca Bianco1, Mario La Rocca1, Gaetano Zonno2
1Istituto Nazionale di Geofisica e Vulcanologia, Sezione di Napoli - Osservatorio Vesuviano, Napoli, Italy
2Istituto Nazionale di Geofisica e Vulcanologia,Sezione di Milano/Pavia, Milano, Italy
Peak ground motion assessment due to large earthquakes in high seismic risk areas, where strong motion data lack, is a challenging task. While the information from GMPEs is to be considered valid only in the range of observed magnitudes, the use of simulated waveforms for potential large magnitude earthquakes can give useful and reliable results for areas characterized by strong heterogeneities such as volcanic zones. This is the case of Campi Flegrei volcanic area, where good quality waveforms have been collected in the last decade, even though only for low magnitude seismic event (MD max = 1.8). Many efforts have been done in the recent years to asses strong ground motion parameters in volcanic areas by using point source stochastic approach, probabilistic method or GMPEs extensions. The main episodes of sustained seismicity which stroke Campi Flegrei area occurred during the most important bradiseismic crises, 1982 - 84, when the soil uplift was accompanied by thousands of local earthquakes characterized by maximum duration magnitude up to 4.0 (maximum MCS Intensity equal to VII). Other minor episodes occurred in 2001 and 2006, when swarms of LP (Long Period) events were detected.
Figure 1. a) Focal mechanism of 20120907 07:34 earthquake. b) Observed (red and magenta, PESG station) and simulated (blu) waveforms. c) Observed and simulated response spectra. The blu curve (7 bars) corresponds to best agreement between observed and simulated. In the present work, a dataset of local earthquakes occurred in the last decade was selected on the base of the signal-to-noise ratio. In details, data set is composed of ten waveforms (maximum Peak Ground Velocity PGV = 0.1 cm/s, MW max = 2.5 +/- 0.3 calculated in the present work) recorded to mobile seismic network of INGV, Osservatorio Vesuviano. The selected earthquakes were recorded by high dynamic three components seismic station equipped with broad band sensors (Lennartz LE3D20s and Guralp CMG40T). The procedure followed is structured in three main points: 1) assessment of input parameters relative to source, path and site effects for application of finite fault stochastic approach, coded in EXSIM software; 2) calibration of input parameters by comparing observed and simulated waveforms and response spectra (5% of damping); 3) simulation of large scenario earthquake for which only historical data are available.
UPStrat-MAFA 4TH General Meeting Catania 11 | 14 December 2013
20
Source features (geometrical parameters, length and width, stress drop, seismic moment) were taken from focal mechanism solutions and source scaling dynamics results that indicate a stress drop range between 5 and 15 bar. The values of seismic moment M0 were calculated by considering the flat part of seismic spectra in the range between 2-6 Hz. Path features in terms of attenuation parameter of shear waves has been set equal to QS = 21f^0.6. Empirical site effects functions (amplification vs frequency) was taken by published results and high frequency decay “k” parameter was set equal to 0.015 as evidenced by other analyses. By taking into account these parameters, stochastic simulations were performed by using EXSIM code. Several tests have been performed to obtain a set of solutions mainly by varying stress drop values (in the range between 1 and 15 bar), k parameter and subfaults division size. We have chosen to generate 30 simulations for each case, in order to evaluate the comparison between observations and simulations on the base of averaged peak ground motion PGV and response spectra. The choice of 30 simulations has resulted as the best compromise between the cost of calculation (in terms of time consuming) and stability of averaged results. An example of comparison between observed and simulated seismograms is shown in Figure 1. Figure 1 shows the solutions retrieved for the earthquake of September 7th 2012, (Mw = 2.5 +/- 0.3) recorded at station PESG (indicated by red arrow in the map). The different solutions for the Response Spectra are referred to different stress drop values (Figure1c). The better solution is obtained for stress drop equal to 7 bar and subfault division equal to 100 m. The calibration procedure confirm the Qs and k parameterization. Once the calibrated parameters tuned, we have performed one simulation for a large scenario earthquake. By considering the CPTI11 (Catalogo Parametrico dei Terremoti Italiani), we have performed a simulation in terms of PGV for the MW=5.4 earthquake of 1537 as reported in the catalogue. The results show a maximum PGV values equal to 6 cm/s near the epicenter (maximum Housner Intensity equal to 40) and the distribution of PGV values results strongly influenced by source geometrical properties. Finally, in the case of Campi Flegrei area, the stochastic approach has revealed a good tool to calibrate source, path and site parameters/physical quantities on small earthquakes and to generate large earthquake scenario. It is to note that the investigated magnitudes represents a lower limit on which apply the stochastic method as a calibration tool, due to the small size (around 200 x 200 m^2) of involved faults.

UPStrat-MAFA 4TH General Meeting Catania 11 | 14 December 2013
21
Ground Motion Scenarios in the Area of Mt. Etna inferred from Synthetic Simulations
Horst Langer, Giuseppina Tusa, Luciano Scarfì, Raffaele Azzaro
Istituto Nazionale di Geofisica e Vulcanologia, Sezione di Catania - Osservatorio Etneo, Catania, Italy
Synthetic simulation discloses the possibility to forecast ground motion parameters for those earthquakes for which no instrumental data is available or does not correspond to the standards we may request for our needs. On the other hand, the existing data recorded during more frequent small events is rich and can be exploited for the estimation of a number of parameters relevant for the simulation, in particular those related to effects of the propagation of the seismic energy. The identification of these parameters is the first, crucial step for the “Calibration of Input”. Finally the synthetic simulation is carried out for examples of strong earthquakes trying to create maps of ground motion parameters suitably mimicking observations, being them instrumental or macroseismic intensities. In the area of Mt. Etna a large amount of high quality seismic data is available, covering a magnitude range from very small earthquakes up to M ca 4.8. The data used in this study were recorded by the permanent seismic network of INGV – Osservatorio Etneo and covers the time span from 2006-2012. These events occurred at depth ranging from ca 30 km to very shallow. Empirical laws for the attenuation of ground motion parameters were established, distinguishing between events with depth deeper than 5 km from those occurring close to the surface. The latter are of particular interest on Mt. Etna as shallow earthquakes are rather frequent and, despite their limited magnitude (Mmax ca 5), have caused severe damage to the villages situated on the flanks of the volcano.
Figure 1. a) The concept of complex source modeling, b) observed and simulated intensities. The simulated intensities were derived by converting the Housner Intensities Ih using the relation : I = 1.41 ln (Ih/cm)+7.98.
UPStrat-MAFA 4TH General Meeting Catania 11 | 14 December 2013
22
The simulation applied here follows concepts of complex seismic source modeling as proposed by Motazdian and Atkinson [2005] and realized in a computer code called “EXSIM” [see Boore, 2009]. In the concept the seismic source is supposed to be composed of elementary subfaults, and the seismic signal arriving at the receiver is represented as the sum of the contribution of the each element, applying appropriate corrections for amplitude decay and time delay (Figure 1a). The concept overcomes limitations of the point source and allows realistic description of ground motion in the vicinity of geometrically extended sources. In a first step the code was applied for the modeling of small earthquakes (M=3…4) in order to fix the parameters controlling the amplitude decay of the signals. Typical damaging earthquakes occurred on Mt Etna were simulated comparing the observed marcoseismic field to the simulated ground motion parameters. In Figure 1b the Housner-Intensity is used as a numerical equivalent to EMS-Intensity. On the whole one observes a fair match of simulated and observed intensities, even though a detailed analysis requires an in-depth knowledge of each single site, which was not possible here. Besides, the comparison reveals that stress drops of the damaging events (like the earthquake occurred in 1914 or the 29 October 2002 Santa Venerina earthquake) are probably higher (ca. 20 bars) than those assumed for the small events (5 bar).

UPStrat-MAFA 4TH General Meeting Catania 11 | 14 December 2013
23
Ground motion modeling based on Icelandic and Italian data
Símon Ólafsson, Ragnar Sigbjörnsson
Earthquake Engineering Research Centre, University of Iceland, Selfoss, Iceland
In this study we consider ground motion records from Icelandic and Italian earthquakes. The records used in the study are obtained from a database of ground motion recordings from the two test areas of the European project UPStrat-MAFA with the addition of some low magnitude events. The stochastic modelling approach is applied to the data and finite-fault simulations are perfomed using the EXSIM code proposed by Motazedian and Atkinson [2005]. The model parameters used in study have been obtained in prior studies [see Galluzzo et al, 2012]. In addition source parameters for some of the records have been reevaluted applying a method in Olafsson et al. [1999]. References Motazedian and Atkinson, (2005). Stochastic Finite-Fault Modeling Based on a Dynamic Corner Frequency.
Bulletin of the Seismological Society of America, Vol. 95(3), pp. 995-1010. Galluzzo D. et al., (2012). Calibration of input parameters in volcanic areas and an elarged dataset by
stochastic finite-fault simulations. Proceedings of the 15th World Conference on Earthquake Engineering, Lisboa, paper 0498 (pp. 10).
Olafsson S., Einarsson P. and Sigbjörnsson R., (1998). Estimation of source parameters and Q from acceleration recorded in the Vatnafjöll Earthquake. Bulletin of the Seismological Society of America 88 (2), 556-563.
UPStrat-MAFA 4TH General Meeting Catania 11 | 14 December 2013
24
Calibration of the stochastic finite-fault model parameters for Portugal Mainland and Azores area
Alexandra Carvalho1, Cláudia Reis1 and Dina Vales2
1Laboratorio Nacional de Engenheria Civil, Lisboa, Portugal 2Instituto Português do Mar e da Atmosfera, Lisboa, Portugal
The strong ground motion prediction based on finite-fault simulation (namely Exsim program) requires the identification of the fault (strike, dip, length and width), source kinematics parameters (stress drop, velocity of rupture, slip distribution), regional crustal properties (geometrical spreading, anelastic structure, amplification and attenuation upper crust parameters) and the determination of amplification effects due to the local site geology. This work presents the input parameters calibration, namely source parameters (stress drop, seismic moment), path parameters (coda Q, geometric spreading) and crustal properties (kappa parameter), through records obtained by the Portuguese digital accelerometer network and by Azores seismographic and accelerometric network. The Q-value is estimated based on the coda decay in the time domain and the kappa parameter is estimated by fitting the high-frequency decay of the acceleration spectrum with a straight line in a log-linear scale. Source spectra of S wave is then determined for all the records, after the correction of the geometrical spreading and elimination of the anelastic and crustal attenuation effects, allowing estimates of stress drop.
UPStrat-MAFA 4TH General Meeting Catania 11 | 14 December 2013
25
On local empirical relationships to convert strong-motion recordings into macroseismic intensity
Ragnar Sigbjörnsson, Rajesh Rupakhety, Símon Ólafsson
Earthquake Engineering Research Centre, University of Iceland, Selfoss, Iceland
The objective of this work is to present local empirical relationships relating recorded peak ground-motion values like peak ground acceleration or their derivatives, e.g. PGx, where x refers to acceleration, velocity or displacement, and macroseismic intensity, e.g. MMI. It also aims to explore which quantity derived from the recorded ground motion provides the most comprehensive representation of the macroseismic intensities. Instrumental ground-motion records and their derivatives cannot be related directly to the macroseismic intensities due to the fact that while the macroseismic intensities are scalar quantities, the accelerometric series are time dependent vector quantities. Furthermore, the as-recorded vector components of ground acceleration depend on the sensor orientation which, in general, is arbitrary and may differ from one station to the next. Hence, it is required to eliminate the dependence on sensor orientation by introducing rotation-invariant quantities derived from the as-recorded components. When the effects of sensor orientation have been suitably addressed in a statistical sense, the ground-motion amplitude parameters derived thereof are termed, in this work, as rotation-invariant. The rotation-invariant amplitude parameters considered in this work are PGXes, Arias Intensity, Normalized Energy Intensity, Acceleration Spectral Intensity, Housner Intensity, and response spectra. The relationship between these amplitude parameters and macroseismic intensities are studied, obtaining empirically calibrated conversion equations. The data used is obtained from collocated stations in the South Iceland Seismic Zone providing both accelerometric records and macroseismic intensities from moderate sized earthquakes. References Rupakhety R., Sigbjörnsson R., (2013). Rotation-invariant mean duration of strong ground motion. Bulletin
of Earthquake Engineering, DOI 10.1007/s10518-013-9521-9. Rupakhety R., Sigbjörnsson R., (2013). Rotation-invariant measures of earthquake response spectra.
Bulletin of Earthquake Engineering, DOI 10.1007/s10518-013-9472-1. Sigbjörnsson R., Ragnarsdóttir S., Rupakhety R, (2013). Is perception of earthquake effects gender
dependent? Annals of Geophysics (submitted, under review).
UPStrat-MAFA 4TH General Meeting Catania 11 | 14 December 2013
26
Calibration, Simulation and Site Effects
Mariano García-Fernández1 and Task C Working Group*
*Task C Working Group: Francesca Bianco2, Alexandra Carvalho3, Paola Cusano2, Danilo Galluzzo2, María José Jiménez1, Horst Langer2, Simon Olafsson4, Rajesh Rupakhety4, Luciano Scarfì2, Ragnar Sigbjörnsson4, Gaetano Zonno2
1Instituto de Geociencias (CSIC, UCM), Madrid, Spain
2Istituto Nazionale di Geofisica e Vulcanologia, Italy 3Laboratorio Nacional de Engenheria Civil, Lisboa, Portugal
4Earthquake Engineering Research Centre, Selfoss, Iceland
This presentation summarizes the results of Task C ‘Calibration of the input parameters in pilot test area and completion of dataset’ from project UPStrat - MAFA, developed in the framework of the EU Civil Protection Financial Instrument. The main objectives of Task C are a) To develop a common approach to generate simulations of earthquake ground motion, and b) The integration of observed macroseismic fields with synthetic ones obtained by ground motion simulations. This approach has been applied to the test areas selected in the project, which include both volcanic (Vesubius-Campi Flegrei-Etna, in southern Italy; Azores Islands, in Portugal, and South Iceland) and tectonic (Main land and offshore Portugal, and Alicante-Murcia in SE Spain). The stochastic finite-fault methodology has been selected for generating ground motion simulations. This approach requires modelling source (e.g., fault geometry, slip, stress parameter, magnitude), path (e.g., crustal model, geometric spreading, Q) and local site effects. After compilation of available ground-motion time histories, the first step is to calibrate the main input parameters involved in the generation of stochastic finite-fault ground motion simulations, including parameter tests to evaluate the sensitivity of the generated synthetic ground motion to some key input parameters. The validation of the estimated input parameters is performed by comparing FAS and PSA from synthetic and recorded acceleration time series. Using the validated input parameters, synthetic ground shaking is computed for different earthquake scenarios that simulate both past and possible large events, in each test area. A specific analysis of site effects is performed and, when identified, they are taken in account in the simulations. Observed macroseimic fields are completed by comparing and calibrating ground-motion simulations at sites with available felt intensities. Furthermore, synthetic macroseismic files for expected large events affecting the selected test areas can be generated.

UPStrat-MAFA 4TH General Meeting Catania 11 | 14 December 2013
27
Seismic Hazard at Site using the SASHA Approach
Dario Albarello1, Vera D’Amico2
1Dip. Scienze Fisiche, della Terra e dell’Ambiente, University of Siena, Italy
2Istituto Nazionale di Geofisica e Vulcanologia, Sezione di Milano/Pavia, Milano, Italy
The use of macroseismic intensity to parameterize earthquakes effects allows a direct link of hazard assessment with risk estimates in urban areas. This is particularly true in most of European countries where long lasting documentary history is available about the effects of past earthquakes. However, intensity present specific features (ordinal, discrete, finite in range, site-dependent) that hamper their direct application in the current standard proceduers devoted to seismic hazard assessment [e.g., Cornell, 1968]. Furthermore, this kind of data requires specific procedures di manage relevant source of uncertainty affecting macroseismic information (completeness, ill-definition of the oldest earthquakes, etc.). In order to face these difficulties the new computational code SASHA (Site Approach to Seismic Hazard Assessment) was on purpose developed [D’Amico and Albarello, 2008] to provide seismic hazard estimates by a a coherent probabilistic analysis of intensity data locally available (site seismic histories).
Figure 1. Flow chart of the SASHA code.
In its earlier version, the SASHA approach presented two main limitations. The first one concerned the extensive use of only macroseismic information that prevented its application also in areas where available seismic history is relatively poor. The second was related to SASHA outcomes that are expressed in terms of intensity and connot be easily implemented in seismic design. During the UPStrat-MAFA “Urban Disaster Prevention Strategies Using MAcroseismic Fields and FAult Sources” (Grant Agreement n. 230301/2011/613486/SUB/A5) both these problems were considered by providing a new version of the code making its application more feasible also in non ideal situations and for engineering purposes (Figure1). In order to extend the application of this approach to sites and countries where local seismic histories are relatively poor, a new implementation of the code was provided, allowing to include in the hazard assessment information coming from different branches (historical studies, seismological instrumental
UPStrat-MAFA 4TH General Meeting Catania 11 | 14 December 2013
28
information and numerical simulations). In particular, macroseismic information related to the seismic history locally documented, that represents the bulk of the considered information, can be integrated with “virtual” intensities deduced from epicentral data (via earthquake-specific probabilistic attenuation relationships) and “simulated” intensities deduced via physically constrained stochastic simulations from data on seismogenic faults activated during past earthquakes. This allows a more complete reconstruction of local seismic history and also reducing uncertainty affecting macroseismic data relative to older earthquakes. Furthermore, in order to obtain information useful for enginnering application (mainly deign and site response studies) a deaggregation procedure was implemented allowing the identification of magnitude-distance pairs more representative for the local hazard [Albarello, 2012]. Effectiveness of this new version of SASHA was tested in the frame of the UPStrat-MAFA project by considering several different sites (Italy, Portugal, Iceland) including both “ideal” and “difficult” situations. References Albarello D., (2012). Design earthquake from site-oriented macroseismic hazard estimates. Boll. Geofis.
Teor. Appl., Vol. 53, n. 1, pp. 7-17, DOI 10.4430/bgta 0035. Cornell C.A., (1968). Engineering seismic risk analysis. Bulletin of the Seismological Society of America
58, 1, 583–1, 606. D’Amico V., Albarello D., (2008). SASHA: a computer program to assess seismic hazard from intensity
data. Seism.Res.Lett., 79, 5, 663-671.
UPStrat-MAFA 4TH General Meeting Catania 11 | 14 December 2013
29
Application of SASHA to seismic hazard assessment for Iceland
Vera D’Amico1, Dario Albarello2, Ragnar Sigbjörnsson3, Rajesh Rupakhety3
1Istituto Nazionale di Geofisica e Vulcanologia, Sezione di Milano/Pavia, Milano, Italy
2Dip. Scienze Fisiche, della Terra e dell’Ambiente, University of Siena, Italy 3Earthquake Engineering Research Centre, University of Iceland, Selfoss, Iceland
We present the results of probabilistic seismic hazard assessment for Iceland using the SASHA program. SASHA (Site Approach to Seismic Hazard Assessment) is a computational code developed to estimate seismic hazard in terms of macroseismic intensity by basically relying on local information about documented effects of past earthquakes, with a minor role of seismic source data. This approach allows to fully exploiting macroseismic information available at the site in the frame of a formally coherent and complete treatment of intensity data, by taking into account the relevant uncertainty and the inherently bounded, ordinal and discrete character of intensity values. For the sake of this project, the code has been significantly improved to make it applicable to areas where local seismic histories are relatively sparse. Major changes concern the reconstruction of the site seismic history: documented intensity data can be integrated with “virtual” intensities deduced either from epicentral data through empirical ground-motion prediction equations or from geological/seismological information via numerical simulations. In the case of Iceland, due to the lack of observed intensities for past earthquakes, local seismic histories were reconstructed by only using epicentral information reduced at the site through a probabilistic ground-motion prediction model. In particular, the SHEEC earthquake catalogue recently released by the EU project SHARE was adopted together with the probabilistic attenuation model developed in this project (task B) with empirical parameters assessed for Iceland. Since this model requires epicentral intensity Io for each earthquake of the catalogue, an empirical relation between Mw (the magnitude listed by SHEEC) and Io was first derived. Seismic hazard was computed over a regular grid covering the Icelandic territory for four exceedance probabilities for an exposure time of 50 years, equivalent to mean return periods of 50, 200, 475 and 975 years. For some selected localities, further return periods were examined and de-aggregation analysis was performed in order to identify magnitude/distance couples and, thus, past earthquakes more responsible for the local hazard. Results of this study appear fairly consistent with the published seismic hazard map of Iceland (in terms of PGA with 10% exceedance probability in 50 years), even though just a qualitative comparison can be made because of the different shaking measure considered (intensity versus PGA), and the different computational methodology (SASHA versus Cornell-type approach) and input data (earthquake catalogue, attenuation model, etc.) used in the two studies.
UPStrat-MAFA 4TH General Meeting Catania 11 | 14 December 2013
30
Applications of the SASHA procedure for PSHA in Portugal Mainland
Alexandra Carvalho1, Dario Albarello2
1Laboratório National de Engenharia Civil, Lisboa, Portugal
2Dip. Scienze Fisiche, della Terra e dell’Ambiente, University of Siena, Italy
Seismic hazard estimates provided in the form of any reference macroseismic intensity can be of great help in providing reliable risk estimates. Thus, in the frame of the UPStrat-MAFA “Urban Disaster Prevention Strategies Using MAcroseismic Fields and FAult Sources” (Grant Agreement n. 230301/2011/613486/SUB/A5), in order to provide seismic risk estimates in mainland Portugal, probabilistic seismic hazard assessment has been performed by using a new version of the SASHA code on purpose modified to account for this specific application. To feed this application, a database of macroseismic intensities observed in the area has been compiled by gathering macroseismic observations documented since 1500 a.C. until 2003. In this way, local seismic histories have been compiled for a number of localities in mainland Portugal. Along with this information, epicentral data relative of earthquakes responsible for intensities locally observed were also collected. The epicentral catalogue spans from 63 b.C. up to 2007 a.C. As two physical mechanisms of earthquakes generation exists in Portugal Mainland, namely earthquakes with their epicenters mainly offshore and events with their epicenters inland, two different attenuation laws were applied, consistent with the two above mentioned seismic scenarios. An attenuation relationship was assessed by a team of this project, by considering a standard approach and an innovative one, on purpose developed for this analysis and calibrated with Portuguese data, and also accounting for anisotropic attenuation. In order to evaluate the impact of attenuation pattern on the hazard estimate, different runs of the SASHA code were performed: (i) considering just epicentral data; (ii) considering two different kinds of attenuation relationships -the ones mentioned above and developed in the framework of this project and another one already in use for Portugal and (iii) combined attenuation law and epicentral catalogue. Results are compared for an exceedance probability of 10% in 50 years (475 average return period) and show the significant role played by this element in the hazard estimate. Along with these estimates, deaggregation analysis was also performed and implemented in the new version of the SASHA code. To complete the analysis, outcomes of some numerical simulations have been also implemented. These results will be presented and discussed during the meeting.
UPStrat-MAFA 4TH General Meeting Catania 11 | 14 December 2013
31
Probabilistic Seismic hazard assessment for Mt. Etna
Raffaele Azzaro1, Salvatore D’Amico1, Tiziana Tuvè1, Gaetano Zonno2
1Istituto Nazionale di Geofisica e Vulcanologia, Sezione di Catania - Osservatorio Etneo, Catania, Italy
2Istituto Nazionale di Geofisica e Vulcanologia, Sezione di Milano/Pavia, Milano, Italy
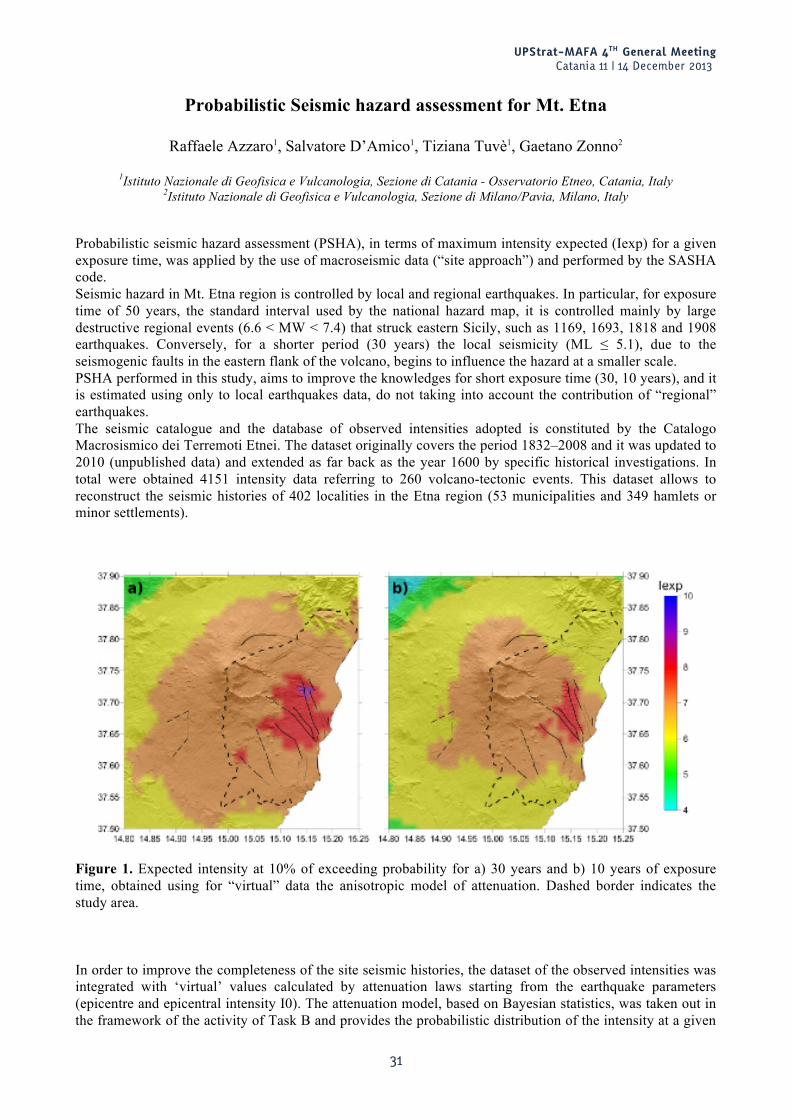
Probabilistic seismic hazard assessment (PSHA), in terms of maximum intensity expected (Iexp) for a given exposure time, was applied by the use of macroseismic data (“site approach”) and performed by the SASHA code. Seismic hazard in Mt. Etna region is controlled by local and regional earthquakes. In particular, for exposure time of 50 years, the standard interval used by the national hazard map, it is controlled mainly by large destructive regional events (6.6 < MW < 7.4) that struck eastern Sicily, such as 1169, 1693, 1818 and 1908 earthquakes. Conversely, for a shorter period (30 years) the local seismicity (ML ≤ 5.1), due to the seismogenic faults in the eastern flank of the volcano, begins to influence the hazard at a smaller scale. PSHA performed in this study, aims to improve the knowledges for short exposure time (30, 10 years), and it is estimated using only to local earthquakes data, do not taking into account the contribution of “regional” earthquakes. The seismic catalogue and the database of observed intensities adopted is constituted by the Catalogo Macrosismico dei Terremoti Etnei. The dataset originally covers the period 1832–2008 and it was updated to 2010 (unpublished data) and extended as far back as the year 1600 by specific historical investigations. In total were obtained 4151 intensity data referring to 260 volcano-tectonic events. This dataset allows to reconstruct the seismic histories of 402 localities in the Etna region (53 municipalities and 349 hamlets or minor settlements).
Figure 1. Expected intensity at 10% of exceeding probability for a) 30 years and b) 10 years of exposure time, obtained using for “virtual” data the anisotropic model of attenuation. Dashed border indicates the study area. In order to improve the completeness of the site seismic histories, the dataset of the observed intensities was integrated with ‘virtual’ values calculated by attenuation laws starting from the earthquake parameters (epicentre and epicentral intensity I0). The attenuation model, based on Bayesian statistics, was taken out in the framework of the activity of Task B and provides the probabilistic distribution of the intensity at a given

UPStrat-MAFA 4TH General Meeting Catania 11 | 14 December 2013
32
site. The model may be applied in two forms: i) as isotropic model, representing a point seismic source, and ii) as anisotropic model, representing a linear finite seismic source. In this second case it is taken into account the different intensity attenuation observed between localities sited in along the fault plane and localities sited in direction orthogonal to the fault. From the integrated seismic history of each site, SASHA calculated the probability distribution of the intensities for 10 and 30 years of exposure time. Hazard maps, for both isotropic and anisotropic attenuation model (Figure 1), were obtained using a grid with nodes spaced 1 km in longitude and latitude. In this configuration SASHA reconstructs the seismic history at each grid node by using the value of the maximum intensity observed (Isite) inside a search radius of 1 km from the node centre. If Isite data are missing, the “virtual” intensity is computed by the attenuation relationship. The results confirm the high level of hazard affecting the eastern flank. The disaggregation analysis of intensity probability distribution at site, allowed to recognize which earthquakes, and the related seismogenic fault, mostly contribute to hazard.
UPStrat-MAFA 4TH General Meeting Catania 11 | 14 December 2013
33
Disruption index: a holistic assessment of earthquake risk
Mónica Amaral Ferreira, Francisco Mota de Sá, Carlos Sousa Oliveira
Instituto Superior Técnico, Lisboa, Portugal
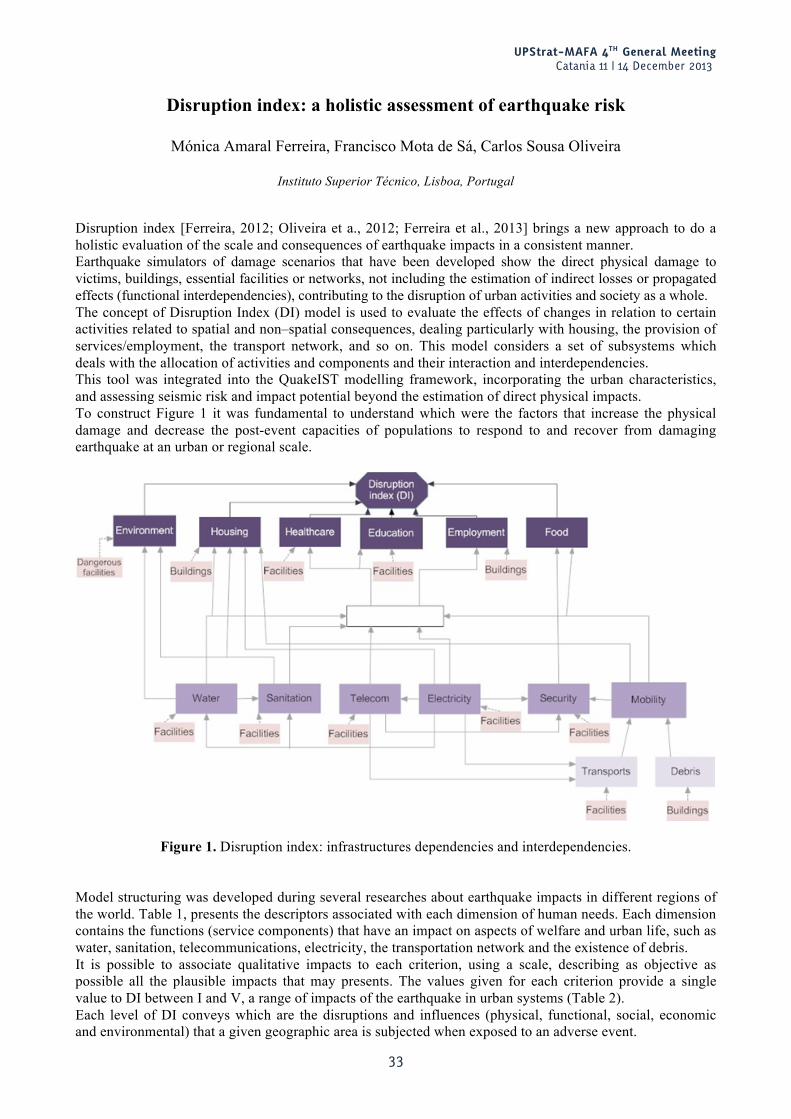
Disruption index [Ferreira, 2012; Oliveira et a., 2012; Ferreira et al., 2013] brings a new approach to do a holistic evaluation of the scale and consequences of earthquake impacts in a consistent manner. Earthquake simulators of damage scenarios that have been developed show the direct physical damage to victims, buildings, essential facilities or networks, not including the estimation of indirect losses or propagated effects (functional interdependencies), contributing to the disruption of urban activities and society as a whole. The concept of Disruption Index (DI) model is used to evaluate the effects of changes in relation to certain activities related to spatial and non–spatial consequences, dealing particularly with housing, the provision of services/employment, the transport network, and so on. This model considers a set of subsystems which deals with the allocation of activities and components and their interaction and interdependencies. This tool was integrated into the QuakeIST modelling framework, incorporating the urban characteristics, and assessing seismic risk and impact potential beyond the estimation of direct physical impacts. To construct Figure 1 it was fundamental to understand which were the factors that increase the physical damage and decrease the post-event capacities of populations to respond to and recover from damaging earthquake at an urban or regional scale.
Figure 1. Disruption index: infrastructures dependencies and interdependencies. Model structuring was developed during several researches about earthquake impacts in different regions of the world. Table 1, presents the descriptors associated with each dimension of human needs. Each dimension contains the functions (service components) that have an impact on aspects of welfare and urban life, such as water, sanitation, telecommunications, electricity, the transportation network and the existence of debris. It is possible to associate qualitative impacts to each criterion, using a scale, describing as objective as possible all the plausible impacts that may presents. The values given for each criterion provide a single value to DI between I and V, a range of impacts of the earthquake in urban systems (Table 2). Each level of DI conveys which are the disruptions and influences (physical, functional, social, economic and environmental) that a given geographic area is subjected when exposed to an adverse event.
UPStrat-MAFA 4TH General Meeting Catania 11 | 14 December 2013
34
Testing and evaluation is being implemented in several test areas of the UPStrat-MAFA project (Portugal, Italy, Spain and Iceland). Composite factors of our livelihood, impacts and indirect losses can be coupled to physical risk (loss and damage estimates) in order to assess risk holistically, allowing users, communities and decision makers to understanding, asses and communicate risk. This is an important tool to facilitate the disaster preparedness and policy recommendations to increase earthquake resilience.
Dimensions (criteria) Descriptors
Environment Identifies materials that can pose a substantial or potential hazard to human health or the environment when improperly managed, e.g., soil and water contamination, radiation, radioactive waste and oil spills. It also assesses the impact of service disruption of urban hygiene/public health from debris storage (building materials, personal property, and sediment from mudslides), contamination of water (unsafe drinking water and sanitation) and a high concentration of people in the same space.
Housing Evaluates whether a particular area may be occupied as housing as a result of the damage. Also indicates alternative housing/shelter.
Food Evaluates whether food is accessible to the majority of the population and identifies alternatives for food supplies (coping strategies).
Healthcare Determines whether the population is served by a sufficient number of health facilities. Education Measures the discontinuity of education and the number of people without school lessons
and identifies alternatives for recovery. Employment Evaluates whether a certain area retains its economic activity as a result of the damage
after an earthquake and identifies new clusters of jobs that can be generated.
Table 1. Dimension (Human needs) and respective consequence descriptors.
Impact level Description of the impact level
V
From a serious disruption at the physical and functional levels to the paralysis of the entire system: buildings, population, infrastructure, health, mobility, administrative and political structures, among others. Lack of conditions to exercise the functions and activities of daily life. High costs for recovery.
IV
Partial paralysis of main buildings, housing, administrative and political systems. The region affected by the disaster presents moderate damage and a small percentage of totally collapsed buildings. Victims and injuries and a considerable number of homeless are present because their houses have been damaged, which, although not collapsed, are damaged severely enough to lose their function as housing. Normal daily activities are disrupted; school activities are suspended; economic activities are at a stand-still.
III
Part of the population may lose their property and need to be permanently relocated, which means strong disturbances in everyday life. This level is characterized by significant dysfunction in terms of equipment, critical infrastructures and losses of some assets and certain damage involving the conduct of professional activities for some time. The most affected areas show significant problems in mobility due to the existence of debris or damage to the road network. There may be some significant problems providing food and water, which must be remedied by civil protection agencies.
II
The region affected by the disaster results in a few homeless (approximately 5%) due to the occurrence of some damage to buildings affecting the habitability of a given geographical area. Some people may experience problems with access to water, electricity and/or gas. Some cases require temporary relocation.
I
The region affected by the disaster continues with its normal functions. No injured, killed or displaced people are registered. Some light damage may occur (non-structural damage) that can be repaired in a short time, and a temporary service interruption sometimes exists. The political process begins with an awareness that the problem exists, and some investments in strengthening policy and risk mitigation are/should be made.
Table 2. Qualitative descriptor of Disruption index, DI (the impact levels are numbered in decreasi).

UPStrat-MAFA 4TH General Meeting Catania 11 | 14 December 2013
35
References Ferreira M.A., (2012). Risco sísmico em sistemas urbanos. Instituto Superior Técnico, PhD Thesis (in
portuguese). Oliveira C.S., Ferreira M.A. and Mota de Sá F., (2012). The concept of a disruption index: application to the
overall impact of the July 9, 1998 Faial earthquake (Azores islands). Bulletin of Earthquake Engineering. 10(1): 7-25.
Ferreira M.A., Mota de Sá F. and Oliveira C.S. (2013). Disruption index, DI: an approach to assess seismic risk in urban systems. Bulletin of Earthquake Engineering (submitted).
UPStrat-MAFA 4TH General Meeting Catania 11 | 14 December 2013
36
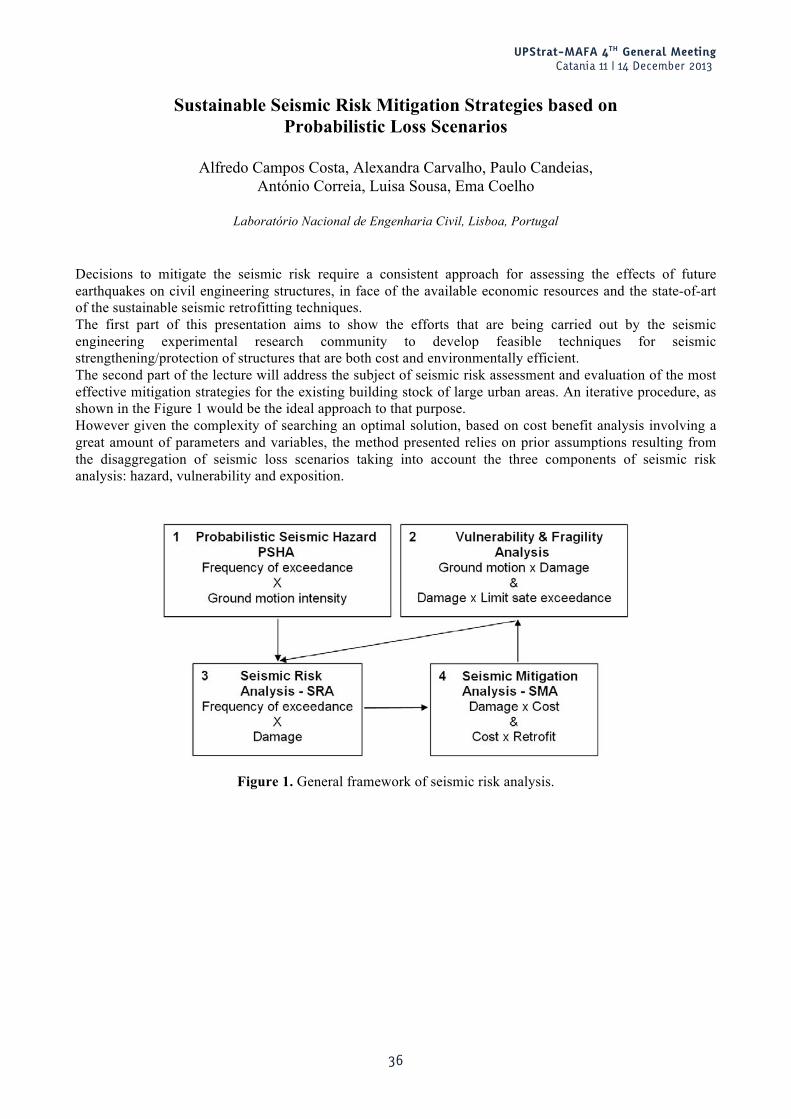
Sustainable Seismic Risk Mitigation Strategies based on Probabilistic Loss Scenarios
Alfredo Campos Costa, Alexandra Carvalho, Paulo Candeias,
António Correia, Luisa Sousa, Ema Coelho
Laboratório Nacional de Engenharia Civil, Lisboa, Portugal
Decisions to mitigate the seismic risk require a consistent approach for assessing the effects of future earthquakes on civil engineering structures, in face of the available economic resources and the state-of-art of the sustainable seismic retrofitting techniques. The first part of this presentation aims to show the efforts that are being carried out by the seismic engineering experimental research community to develop feasible techniques for seismic strengthening/protection of structures that are both cost and environmentally efficient. The second part of the lecture will address the subject of seismic risk assessment and evaluation of the most effective mitigation strategies for the existing building stock of large urban areas. An iterative procedure, as shown in the Figure 1 would be the ideal approach to that purpose. However given the complexity of searching an optimal solution, based on cost benefit analysis involving a great amount of parameters and variables, the method presented relies on prior assumptions resulting from the disaggregation of seismic loss scenarios taking into account the three components of seismic risk analysis: hazard, vulnerability and exposition.
Figure 1. General framework of seismic risk analysis.
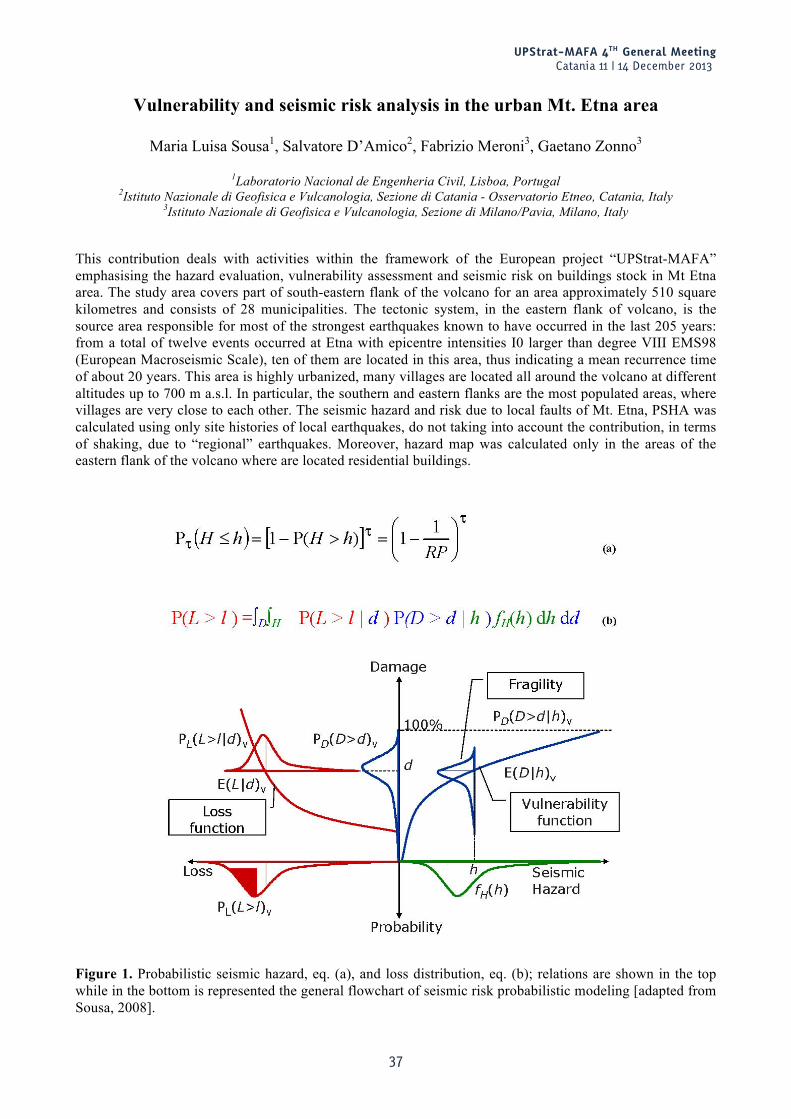
UPStrat-MAFA 4TH General Meeting Catania 11 | 14 December 2013
37
Vulnerability and seismic risk analysis in the urban Mt. Etna area
Maria Luisa Sousa1, Salvatore D’Amico2, Fabrizio Meroni3, Gaetano Zonno3
1Laboratorio Nacional de Engenheria Civil, Lisboa, Portugal
2Istituto Nazionale di Geofisica e Vulcanologia, Sezione di Catania - Osservatorio Etneo, Catania, Italy 3Istituto Nazionale di Geofisica e Vulcanologia, Sezione di Milano/Pavia, Milano, Italy
This contribution deals with activities within the framework of the European project “UPStrat-MAFA” emphasising the hazard evaluation, vulnerability assessment and seismic risk on buildings stock in Mt Etna area. The study area covers part of south-eastern flank of the volcano for an area approximately 510 square kilometres and consists of 28 municipalities. The tectonic system, in the eastern flank of volcano, is the source area responsible for most of the strongest earthquakes known to have occurred in the last 205 years: from a total of twelve events occurred at Etna with epicentre intensities I0 larger than degree VIII EMS98 (European Macroseismic Scale), ten of them are located in this area, thus indicating a mean recurrence time of about 20 years. This area is highly urbanized, many villages are located all around the volcano at different altitudes up to 700 m a.s.l. In particular, the southern and eastern flanks are the most populated areas, where villages are very close to each other. The seismic hazard and risk due to local faults of Mt. Etna, PSHA was calculated using only site histories of local earthquakes, do not taking into account the contribution, in terms of shaking, due to “regional” earthquakes. Moreover, hazard map was calculated only in the areas of the eastern flank of the volcano where are located residential buildings.
Figure 1. Probabilistic seismic hazard, eq. (a), and loss distribution, eq. (b); relations are shown in the top while in the bottom is represented the general flowchart of seismic risk probabilistic modeling [adapted from Sousa, 2008].
UPStrat-MAFA 4TH General Meeting Catania 11 | 14 December 2013
38
The dependence of the average annual seismic risk on predictive variables, like hazard and vulnerability, is analyzed in detail. Of note is the fact that, in this work, the economic losses are exclusively based on building damage estimates and on related lost area repair costs. Adopting the SASHA approach, an average hazard index, denoted by IH, was estimated the urban Mt. Etna area. IH was computed as the expected value of the random variable H, represented by a macroseismic intensity (EMS-98), and weighted by the probability hazard distribution for a reference time interval, t, of 50 years, Pt=50(H ≤ h), assuming that the exceedance of ground motion is independent in each year, as shown in Figure 1, relation (a). In this application we follow the approach for the probabilistic analysis of seismic risk shown in the Figure 1, relation (b), where is presented also the general flowchart of adopted procedure [adapted from Sousa, 2008]. In Figure 1 (bottom) are shown, for a building typology of vulnerability v, i.e., for a homogeneous group of elements at risk the different probabilistic distribution of quantities involved in the analysis. Notice that each variable distribution is plotted with the same color in the relation (b) of Figure 1. The seismic hazard is represented by the green distribution in the 4th quadrant of Figure 1., seismic vulnerability by the blue distributions in the 1st and 2nd quadrants and losses by the red distributions in the 2nd and 3rd quadrants of that Figure 1. The damage data used in this application refers to residential buildings. The data about the buildings were extracted from the 1991 and 2001 Italian National Institute of Statistics (ISTAT) census. The data are grouped according to the census sections, and the vulnerability indices were evaluated using the approach proposed by Lagomarsino and Giovinazzi [2006]. The ISTAT data on residential buildings allows the definition of the frequencies of groups of homogenous structures, with respect to a number of typological parameters: vertical structures, age of construction, number of storeys, state of maintenance, and state of aggregation with adjacent buildings. Seismic vulnerability of the elements at risk, belonging to a given building typology, was described by the vulnerability index, varying between 0 and 1, and independent from the hazard severity level. The average vulnerability of a region, was obtained by weighting the typology vulnerability index by the existences of the several typologies present in the region. As seismic risk is a function of seismic hazard, vulnerability and exposure (value of the building inventory and its inhabitants), average indicators of these variables were built in order to study their influence on expected annualized earthquake losses. The conditionally expected loss is obtained by averaging the number of buildings that belong to a given damage state and a typological class with vulnerability V=v, weighted by the mentioned damage factors. This conditionally expected loss is obtained by averaging the number of buildings that belong to a given damage state and a typological class with vulnerability V=v, weighted by the mentioned damage factors, as described in the relation (b).
UPStrat-MAFA 4TH General Meeting Catania 11 | 14 December 2013
39
Impact Assessment of the 2011 Lorca Earthquake: QUAKEIST Seismic Simulator Approach
Alba Beltrán Díez1, Maria Jose Jiménez1, Mariano García-Fernández1,
Monica Amaral Ferreira2, Carlos Sousa Oliveira2, Francisco Mota de Sá2
1Instituto de Geociencias (CSIC, UCM), Madrid, Spain
2Instituto Superior Técnico, Lisboa, Portugal
Lorca is a moderate size town located in the Murcia region (SE-Spain). The Lorca municipality is 1675 square kilometers wide with a population of around 90000 inhabitants and 17550 buildings (INE, 2011). On 11 May 2011, at 18:47 local time, a Mw5.1 earthquake shook the city of Lorca, SE Spain. This event caused 9 fatalities and more than 300 people were injured. Nearby towns and provinces were not seriously affected. The main shock was preceded by a large Mw4.5 foreshock at 17:05. The 11 May 2011 Lorca earthquake, although of very moderate magnitude caused a huge shock in the whole country since the only fatalities from earthquakes in the 20th century were from two events in 1956 (11) and 1969 (4). Only one building collapsed, but around 1000 were seriously damaged (including residential buildings, cultural heritage, schools, government buildings, sanitary centers, security facilities etc.) and a great impact on socioeconomic activity. Damage was concentrated in several areas of the town where around 40% of buildings were damaged. In the historical centre 16% of buildings were damaged and historical heritage was severely affected including old churches and medieval wall towers. Several events in the historical record reached intensity VIII in the Lorca area (e.g. 1674 and two in 1911), while in the last 10 years a number of events have occurred in the same region in 1999, 2002, and 2005 of magnitudes 4.8, 5.0, and 4.7 respectively. These three events reached intensities EMS98 VI-VII causing damage and economic losses in several towns in the region. The event has provided a large amount of data on damages in constructions, urban infrastructures and facilities which were vital for the emergency response and for the functionality of the city during and after the earthquake. The goal of this work is to assess the impact of the 2011 Lorca earthquake on the city functionality using the QuakeIST seismic simulator (IST). The exposed elements considered are: buildings, healthcare system, schools, security, bridges, water pipelines and local power transformers. All data have been collected from several official sources and implemented in a GIS environment. Data related to building stock including ordinary dwelling, schools, sanitary centers, security buildings have been extracted from the Spanish Cadastral (http://www.sedecatastro.gob.es/), The elements included are: geographical coordinates, number of floors, year of construction, main use, area, perimeter and shape. Data of supply facilities and urban infrastructures (e.g. local transformers, electric substations, bridges, water pipes etc.) have been obtained from Spanish Geographic Institute (IGN) and SISMIMUR (in force Seismic Risk Plan of the Murcia region) databases. The building typologies have been established according to the age of construction and the number of floors. The vulnerability values were obtained through RISK-UE approach considering up to six building typologies as follows: EMM: Masonry <1921 EML: Masonry 1921-1940 EMH: Brick masonry 1941-1964 EHP: Reinforced concrete 1965-1996 EHP94: Reinforced concrete>1996 <2004 (NCSE 94) EHP02: Reinforced concrete>2004 (NCSE 02) Due to the lack of information parameters such as the state of preservation of buildings, existence of soft floor, irregularities on shape and height have been not considered. Vulnerability of supply facilities and urban infrastructures was assigned using the default values included on the QuakeIST software. Figure 1 shows the city of Lorca, the building vulnerability and the main urban infrastructures. A 70x70 m grid covering the city of Lorca has been created subdividing areas where the exposed objects are located and where constant value of surface ground motion is assumed.
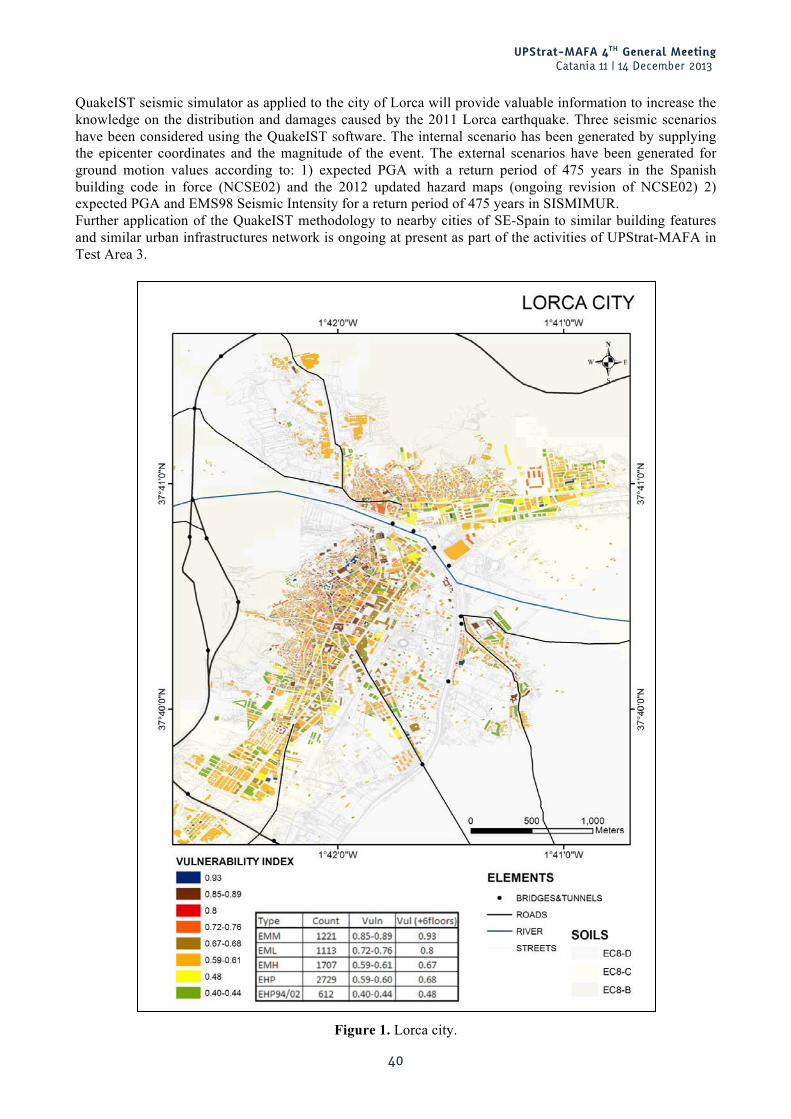
UPStrat-MAFA 4TH General Meeting Catania 11 | 14 December 2013
40
QuakeIST seismic simulator as applied to the city of Lorca will provide valuable information to increase the knowledge on the distribution and damages caused by the 2011 Lorca earthquake. Three seismic scenarios have been considered using the QuakeIST software. The internal scenario has been generated by supplying the epicenter coordinates and the magnitude of the event. The external scenarios have been generated for ground motion values according to: 1) expected PGA with a return period of 475 years in the Spanish building code in force (NCSE02) and the 2012 updated hazard maps (ongoing revision of NCSE02) 2) expected PGA and EMS98 Seismic Intensity for a return period of 475 years in SISMIMUR. Further application of the QuakeIST methodology to nearby cities of SE-Spain to similar building features and similar urban infrastructures network is ongoing at present as part of the activities of UPStrat-MAFA in Test Area 3.
Figure 1. Lorca city.
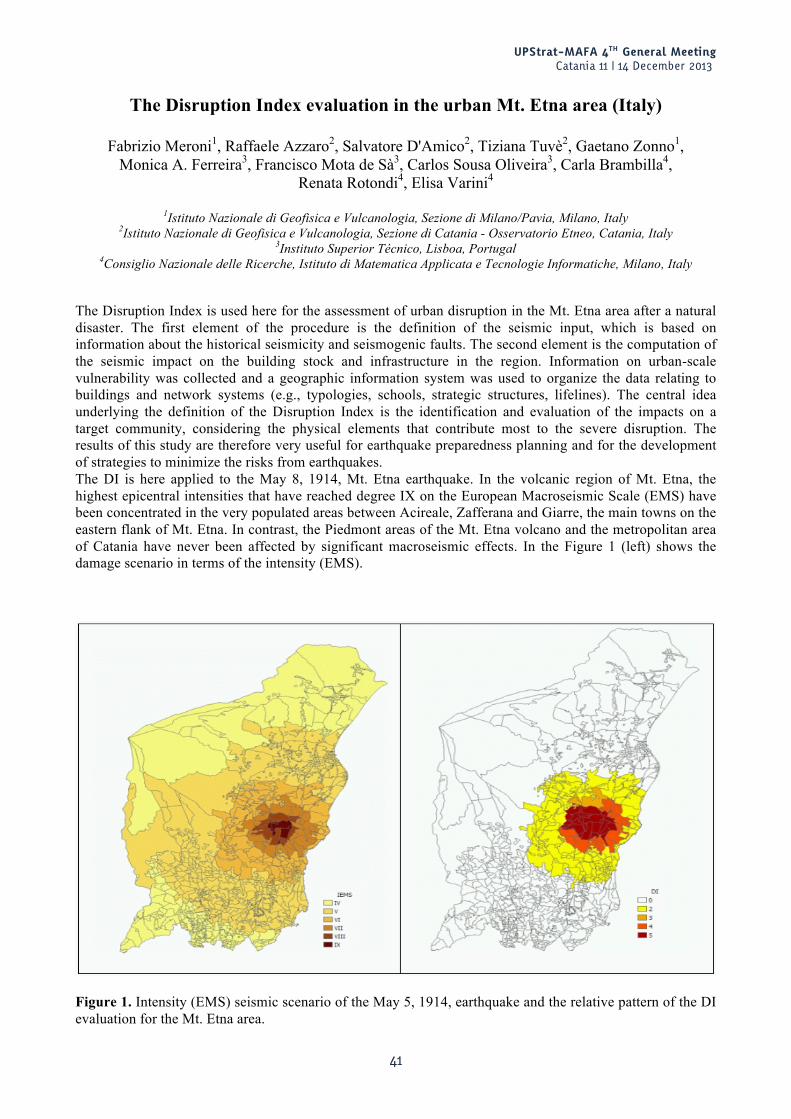
UPStrat-MAFA 4TH General Meeting Catania 11 | 14 December 2013
41
The Disruption Index evaluation in the urban Mt. Etna area (Italy)
Fabrizio Meroni1, Raffaele Azzaro2, Salvatore D'Amico2, Tiziana Tuvè2, Gaetano Zonno1, Monica A. Ferreira3, Francisco Mota de Sà3, Carlos Sousa Oliveira3, Carla Brambilla4,
Renata Rotondi4, Elisa Varini4
1Istituto Nazionale di Geofisica e Vulcanologia, Sezione di Milano/Pavia, Milano, Italy
2Istituto Nazionale di Geofisica e Vulcanologia, Sezione di Catania - Osservatorio Etneo, Catania, Italy 3Instituto Superior Técnico, Lisboa, Portugal
4Consiglio Nazionale delle Ricerche, Istituto di Matematica Applicata e Tecnologie Informatiche, Milano, Italy
The Disruption Index is used here for the assessment of urban disruption in the Mt. Etna area after a natural disaster. The first element of the procedure is the definition of the seismic input, which is based on information about the historical seismicity and seismogenic faults. The second element is the computation of the seismic impact on the building stock and infrastructure in the region. Information on urban-scale vulnerability was collected and a geographic information system was used to organize the data relating to buildings and network systems (e.g., typologies, schools, strategic structures, lifelines). The central idea underlying the definition of the Disruption Index is the identification and evaluation of the impacts on a target community, considering the physical elements that contribute most to the severe disruption. The results of this study are therefore very useful for earthquake preparedness planning and for the development of strategies to minimize the risks from earthquakes. The DI is here applied to the May 8, 1914, Mt. Etna earthquake. In the volcanic region of Mt. Etna, the highest epicentral intensities that have reached degree IX on the European Macroseismic Scale (EMS) have been concentrated in the very populated areas between Acireale, Zafferana and Giarre, the main towns on the eastern flank of Mt. Etna. In contrast, the Piedmont areas of the Mt. Etna volcano and the metropolitan area of Catania have never been affected by significant macroseismic effects. In the Figure 1 (left) shows the damage scenario in terms of the intensity (EMS).
Figure 1. Intensity (EMS) seismic scenario of the May 5, 1914, earthquake and the relative pattern of the DI evaluation for the Mt. Etna area.

UPStrat-MAFA 4TH General Meeting Catania 11 | 14 December 2013
42
The damage data used to compute the DI in this application refers to residential buildings, hospitals, schools, police stations, lifeline services (electricity, water, gas, wastewater) and roads. The data about the buildings were extracted from the 1991 and 2001 Italian National Institute of Statistics (ISTAT) census. The data are grouped according to the census sections, and the vulnerability indices were evaluated using the approach proposed by Lagomarsino and Giovinazzi [2006]. The ISTAT data on residential buildings allows the definition of the frequencies of groups of homogenous structures, with respect to a number of typological parameters: vertical structures, age of construction, number of storeys, state of maintenance, and state of aggrega-tion with adjacent buildings. We applied this information only to the urbanized areas of the whole of the territory of the municipality also using a huge quantity of data collected by the local Civil Defense Protection as part of project Lavori Socialmente Utili (LSU, 1999). Regarding the lifelines, we considered the main lines. High voltage power lines and their related pylons were mapped into the geographic information system, together with the positions of high and low voltage substations. For roads, a dense network of roads connects the villages, and the Messina-Catania main road runs along the coast on the eastern flank of the Mt. Etna volcano. Moreover, a dense network of roads connects the villages, and within this network we have considered the positions and the seismic vulnerabilities of the bridges, which are the most sensitive elements. In the Figure 1 (right) shows the resulting pattern of the DI.
UPStrat-MAFA 4TH General Meeting Catania 11 | 14 December 2013
43
Disruption index: application to Portugal (Azores, Algarve and Lisbon)
Mónica Amaral Ferreira, Francisco Mota de Sá, Carlos Sousa Oliveira
Instituto Superior Técnico, Lisboa, Portugal
Disruption index [Oliveira et al., 2012; Ferreira et al., 2013] attempts to evaluate the impact of earthquakes on a targeted community’s well-being, particularly considering housing, provision of services, employment and a transportation network. The consequential effects of unavailability, translated through an indicator of disruption to users, would be assessed in a qualitative way. DI provides the basis for understanding the resource requirements, not only for recovery after events but also to identify, prior to events, the physical elements that contribute most to severe disruption. Many types of data need to be collected and analysed in order to run the DI. Among the types of data that need to be collected:
• Selection of geologic data is vital to understand the type of earthquake scenario as well as to understanding the performance of buildings and infrastructure.
• Analysis of lifelines and infrastructure systems (water, sewer, power, telecommunications, transportation) typologies and vulnerabilities are important in understanding not only site-specific effects of the earthquake (breaks in pipelines, power outages, etc.) but in understanding regional implications for the economy (such as transporting goods, services, people in and out of the area).
• Analysis of building typology and vulnerabilities are used to understand the performance of certain construction building damage. It is important to differentiate the buildings in housing and commercial buildings to determine immediate shelter needs, economic impacts and implications for repair and reconstruction strategies, and so on.
• Population is important to understand impacts of the earthquake on the injuries and deaths on the health care system, as well as understanding the population relocations imposed by earthquakes.
• For the present analysis three different regions in Portugal (Faial in Azores, Lisbon and Algarve region) were selected to assess and calculate the earthquake impacts in a holistic approach. Our simulation results highlight the potential importance of incorporating dependencies and cascading failures into such models.
References Oliveira C.S., Ferreira M. A., Mota de Sá F., (2012). The concept of a disruption index: application to the
overall impact of the July 9, 1998 Faial earthquake (Azores islands). Bulletin of Earthquake Engineering, 10, 7-25. doi: 10.1007/s10518-011-9333-8.
Ferreira M.A., Mota de Sá F., Oliveira C.S., (2013). Disruption Index, DI: an approach for assessing seismic risk in urban systems (theoretical aspects). Bulletin of Earthquake Engineering (submitted).
UPStrat-MAFA 4TH General Meeting Catania 11 | 14 December 2013
44
QuakeIST®: risk software
Francisco Mota de Sá, Carlos Sousa Oliveira, Mónica Amaral Ferreira
Instituto Superior Técnico, Lisboa, Portugal
The QuakeIST® was developed by the IST Team [Mota de Sá, 2012] to provide assistance in risk assessment and disaster management. This sophisticated software can model hazard, physical risk assessment and is the first earthquake risk simulator that offer the DI (Disruption index) [Oliveira et al., 2012] an integrated cascade effects at an urban or regional scale. The results provided by QuakeIST® identify important factors and systems contributing to main urban disruptions, providing plans and guidance for short-, medium-, and long-term investment projects to reduce risk. The UPStrat-MAFA Project used the QuakeIST® software in several countries (Italy, Portugal, Spain and Iceland) to generate and measure risk, quantify the impacts, and improve the capacity to define strategies to address adverse natural events. The locations under study were very important to calibrate several parameters of the model. Below is a brief description of the key features of the QuakeIST® software:
- The simulator (QuakeIST®) can handle different ground motion scenarios provided by the user, referring the coordinates and ground motion values or other external scenarios obtained from SASHA, EXSIM, etc.
- The QuakeIST® contains well-known attenuation relationships that the user may select. - The QuakeIST® loss model requires shaking intensity, PGA or PGV as an input parameter to some
objects. PGA and/or PGV attenuation relationships as converting PGA and/or PGV into intensity (EMS) have been implemented. Soil information can be handled through EC8 soil classes.
- It uses a display platform geographical information system (GIS) to create maps and measure the possible impact caused by earthquakes in urban systems.
- Various vulnerability functions are included and users can upload their own vulnerability models or include new ones.
- Different types of assets can be modeled (buildings, schools, bridges, networks, population, etc.). - QuakeIST® contains algorithms for propagation effects and impact assessment. - For a given asset typology can be plotted losses maps and maps illustrating the cascade effects. - The Disruption index can be plotted, which is very important to share information to general public
(people without a scientific background). For what concerns validation or calibration (i.e. checking that the results match reality, and modifying them accordingly), such tests are being performed with UPStrat-MAFA project, using real earthquakes [Lorca, 2011; Faial, 1998 and Iceland, 1998]. References Mota de Sá F., (2012). QuakeIST® software (personal communication, paper in preparation). Oliveira C.S., Ferreira M.A. and Mota de Sá F., (2012). The concept of a disruption index: application to the
overall impact of the July 9, 1998 Faial earthquake (Azores islands). Bulletin of Earthquake Engineering. 10(1): 7-25.
UPStrat-MAFA 4TH General Meeting Catania 11 | 14 December 2013
45
Disruption Index Analysis: A case study for Hveragerdi Town
Rajesh Rupakhety, Ásthildur Elva Bernhardsdóttir, Ragnar Sigbjörnsson
Earthquake Engineering Research Centre, University of Iceland, Selfoss, Iceland
The disruption philosophy, as introduced into earthquake engineering by the IST team headed by Professor Oliveira, addresses conditions under which society ceases to function in regular manner after an earthquake. The modelling technique applied can be characterised as a systems engineering approach where the physical environment is divided into interlinked sub-systems, key elements of which are the critical infrastructure systems. One of the main outputs of the systems analysis is the disruption index, DI [Oliveira et. al. 2012], which is a metric designed to quantify overall earthquake impact on the built environment by considering all direct and indirect effects and their propagation within each sub-system and interactions among the sub-systems in a cascading fashion. It was proposed at the Selfoss WS to initiate the Icelandic pilot study by using the Hveragerdi Town as a “full-scale field laboratory” emphasising the development and application of the disruption index (DI). The Hveragerdi Town is about 50 km from Reykjavik City Centre; located south of the Hengill Central Volcano at a very earthquake prone site. The town is commonly shaken by (i) geothermal related earthquakes from local sources, (ii) volcanic earthquakes originating in the Hengill Central Volcano, and (iii) shallow tectonic strike-slip earthquakes originating in the South Iceland Seismic Zone. The town is built on an approximately 5,000 year old lava field. The existence of hot springs led people to settle in Hveragerdi. The natural hot water could be used for heating of houses, for cooking, baking and for laundry. In addition, it led to the development of industrial gardening. The first market garden was founded by the Varmá River in 1929. A year later the first greenhouse was built, marking the beginning of greenhouse horticulture, which later became a key sector of the local economy. The town contains all the essential infrastructure systems that characterises the Reykjavik metropolitan area, including lifeline systems like geothermal district heating, cold water supply, electrical supply and sewage system. The data applied in the current study for model calibration originate from resent destructive earthquakes influencing Hveragerdi Town. These are the June 2000 earthquakes, and the 29th of May 2008 Ölfus Earthquake. The epicentre of the latter earthquake was close to Hveragerði and the distance to the causative fault only about 2 km. The Hveragerdi Town suffered severe damage of houses and building contents as they were being thrown around during the earthquake. The effects of the earthquakes, as well as induced damage to buildings and infrastructures, are fairly well documented. Furthermore, through surveys and studies in close cooperation with local authorities, the data set has been augmented, as a part of this project. The systems model developed for this study contains three basic super elements: (i) The first and essential super-element is Hveragerdi Town, where all buildings and infrastructure systems are included. (ii) The second basic super-element is a circular area (with a radius of roughly 40 km) surrounding Hveragerdi Town including only critical infrastructure elements required for normal functioning of Hveragerdi’s societal environment. (iii) The third basic super-element is the area outside the second super-element which, in principle, contains the rest of Iceland; however, only few critical infrastructure elements are accounted for, e.g. power plants and power transmission lines. The earthquake scenarios considered in the current study are limited to seismic activities in the South Iceland Seismic Zone, even though earthquakes in other areas might, at least theoretically, influence the DI for Hveragerdi Town. The above outlined study is still on-going. Therefore, limited results are available at this point in time. However, preliminary results indicate that the geothermal district heating system, including the active sources of geothermal energy are among the most critical infrastructure systems. Furthermore, it is seen that the date (and the origin time) of threatening earthquakes is an important factor, revealing obviously the cold winter period as the critical setting for the earthquake scenarios. The potential practical applications of the DI approach are many. It is suggested to analyse the Hveragerdi’s master plan using the DI concept. The objective is to answer the questions: Is DI increasing or decreasing? What is governing the changes in DI as visualised by de-aggregation? What intervention, strengthening, and back-up strategies are optimal in reducing the overall earthquake-induced disruption in the region? This is believed to be useful information for local authorities and planners as well as for disaster managers.

UPStrat-MAFA 4TH General Meeting Catania 11 | 14 December 2013
46
References Oliveira C.S., Ferreira M.A., Mota de Sá F., (2012). The concept of a disruption index: application to the
overall impact of the July 9, 1998 Faial earthquake (Azores islands). Bulletin of Earthquake Engineering. 10(1): 7-25.
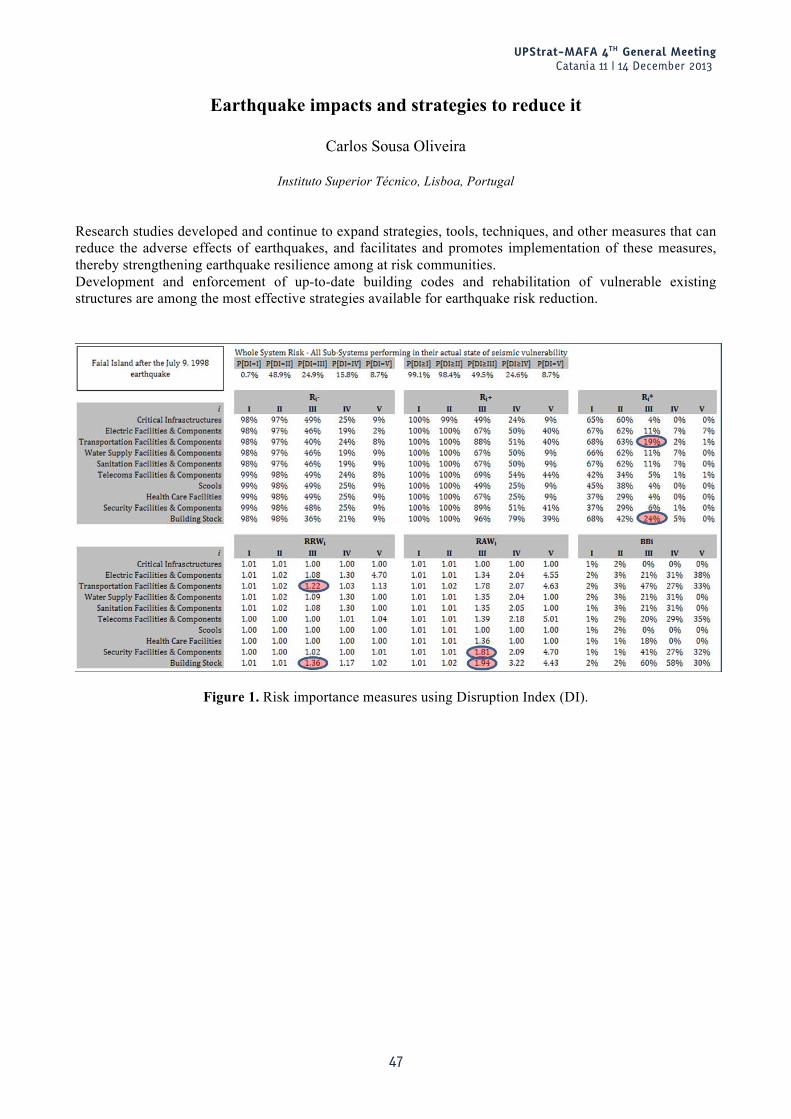
UPStrat-MAFA 4TH General Meeting Catania 11 | 14 December 2013
47
Earthquake impacts and strategies to reduce it
Carlos Sousa Oliveira
Instituto Superior Técnico, Lisboa, Portugal
Research studies developed and continue to expand strategies, tools, techniques, and other measures that can reduce the adverse effects of earthquakes, and facilitates and promotes implementation of these measures, thereby strengthening earthquake resilience among at risk communities. Development and enforcement of up-to-date building codes and rehabilitation of vulnerable existing structures are among the most effective strategies available for earthquake risk reduction.
Figure 1. Risk importance measures using Disruption Index (DI).

UPStrat-MAFA 4TH General Meeting Catania 11 | 14 December 2013
48
A multimedia tool for dissemination of tasks and results of the EU Project UPStrat-MAFA
(Urban disaster Prevention Strategies using MAcroseismic Fields and FAult Sources)
Rosella Nave1, Fabio Sansivero1, Gaetano Zonno1 and the UPStrat-MAFA Outreach Working Group* *UPStrat-MAFA Outreach Working Group: Solveig Thorvaldsdattir2, Alexandra Carvalho4, Maria Luisa Sousa4, Sonia Raposo4, Susanna Falsaperla1, Gemma Musacchio1, Carlos Sousa Oliveira3, Monica Amaral Ferreira3, Ásthildur Elva Bernhardsdóttir2, Ragnar Sigbjornsson2
1Istituto Nazionale di Geofisica e Vulcanologia, Italy
2Earthquake Engineering Research Centre, Selfoss, Iceland 3Instituto Superior Técnico, Lisboa, Portugal
4Laboratorio Nacional de Engenheria Civil, Lisboa, Portugal
Information and outreach activities on natural hazard and risks have a peculiar role in risk mitigation strategies, increasing people’s risk awareness and their preparedness in coping with disastrous events, such as earthquakes and eruptions. In order to achive a public education training on seismic and volcanic risk, educational initiatives has been planned as a task (task H) of the UPStrat-MAFA (Urban disaster Prevention Strategies using MAcroseismic Fields and FAult Sources) EU Project. In particular, a tool which could take advantage of different communication methods and suitable for different contexts, has been developed for specific Action (Action H.4) of the Project. The product is a multimedia application based on an interactive educational path especially designed to explain UPStrat-MAFA tasks and results, in order to mainly promote risk mitigation knowledge in a accessible and simple language.An interactive product is a valuable tool to attract and retain user’s attention, as it can offer: a) multi-level approach in presenting contents details; b) high portability; c) high flexibility to follow personalized reading paths; d) relevant impact due to multimedia characteristics.
Figure 1. Main page (a) of the Multimedia Product and Chapter regarding Project technical aspects (b).
UPStrat-MAFA 4TH General Meeting Catania 11 | 14 December 2013
49
The graphical user interface (GUI) is planned to give more than one choice to navigate among the contents’ structure. In most cases the user can gain access to the same content by using both a textual menu than a graphical button or a hotspot in an image. The GUI also provides specific tools such as bookmark management and a personal notebook area in which the user can store texts from the single chapter and save them to a file in order to preserve or print them. The application is subdivided in 7 main chapters: three of them represent a direct access to main results of the Project related to probabilistic hazard assessment, seismic risk analysis and disaster prevention strategies. The remaining chapters provide all the technical information about the Project and give access to educational material. The user can also access to the content of the chapters in two manners: a) by following a path belonging to a specific Country (among Iceland, Italy, Portugal and Spain) and gaining access to topics linked to this country only; b) by following a path related to a specific topic in all the Partners’ Countries. In the first case the graphical interface of the main page (a geographic map of Europe; Figure 1a) is the better way to begin the navigation in a specific Country by clicking on it. The educational chapter is intended to contain material on risk mitigation coming from different Countries of the Project Partners. A particular Chapter is for the UPStrat-MAFA AudioVideo Project whose purpose is to show how the residents of a town, located in a seismic/volcanic area, live with continuous risk of earthquakes and eruptions and how science can provide better understanding and mitigation of natural hazards through knowledge-based disaster prevention policies.

UPStrat-MAFA 4TH General Meeting Catania 11 | 14 December 2013
50
A self-designed portable exhibit as interactive educational tool
Susanna Falsaperla1, Ferruccio Ferrari1, Danilo Reitano1, Salvo Sterlini2
1Istituto Nazionale di Geofisica e Vulcanologia, Sezione di Catania - Osservatorio Etneo, Catania, Italy
2MODESIGNER, Pedara, Catania, Italy
Several years of seismological observations and continuous seismic monitoring have revealed that the region of Mt. Etna has a high rate of earthquakes with magnitude mostly below Ml 4. Despite the relatively moderate strain release associated with each single event, seismic activity can cause huge damage due to the shallow foci of earthquakes, which are mainly at depth less than 5 km. In the framework of the UPStrat-MAFA project, we at INGV-OE have addressed this important aspect for the promotion of science education, with particular emphasis to seismic hazard. In particular, we have realized an interactive educational shaking table, which can be used in initiatives of scientific dissemination with schools and public as their target groups. The devise is a self-designed portable exhibit, which will allow us: i) the simulation of ground motions, including reproductions of recorded earthquake time-histories, ii) to communicate at a broad (non specialized) audience starting from children, and iii) to provide simple rules about how to behave correctly in case of earthquakes.
UPStrat-MAFA 4TH General Meeting Catania 11 | 14 December 2013
51
Augment reality on Earth Science: a basic approach on dissemination
Simone Sorge1, Giuseppe Mangioni1, Susanna Falsaperla2, Danilo Reitano2
1Università degli studi di Catania - Falcoltà di Ingegneria
2Istituto Nazionale di Geofisica e Vulcanologia, Sezione di Catania - Osservatorio Etneo, Catania, Italy
Mobile devices are nowadays fundamental parts of our lives. Custom sensors are active on board (accelerometers, GPS receivers, digital compass, etc) on last generation smartphones and tablets. Augmented reality (AR) is a portable live experience and represents a new view of a physical, real-world environment: real elements are augmented by computer-generated sensory input such as sound, video, graphics or GPS data. On Earth Science, INGV-OE would start a new experience using these devices helping scientists in their own monitoring and surveillance activities. The goal would be achieved making custom apps based on AR features. In particular in the UPStrat-MAFA project, INGV-OE has pointed out some new aspects for the promotion of science education, giving a new attractive point of view for all outreach recipients.
UPStrat-MAFA 4TH General Meeting Catania 11 | 14 December 2013
52
Cooperation between EERC and local autorities in the South Iceland Lowland
Ásthildur Elva Bernhardsdóttir, Ragnar Sigbjörnsson
Earthquake Engineering Research Centre, University of Iceland, Selfoss, Iceland
The most destructive earthquakes in Iceland occur within the South Iceland Lowland. To meet this challenge there has been established long term cooperation between EERC and the local authorities in the area. In fact it was the Commissionaire in the Rangaárvallasýsla County who took the initiative to the so-called SESMIS project in 1996, resulting in an extensive survey outcome of which were safety guidelines for house owners [Sigbjörnsson and Ragnarsdóttir, 1999]. After the June 2000 Earthquake Sequence surveys in the area were repeated with the aim of checking the effectiveness and further improving the guidelines [Ákason, et al., 2005]. In 2006, an extensive project was established [Thorvaldsdóttir et al., 2008] with the aim of directly assisting local authorities in need of managing long-term relief and recovery process within their communities in the aftermath of disasters. The local authorities in the South Iceland Lowland used the guidelines (provided by the project) immediately after the earthquake in Ölfus, May 2008. The UPStrat-MAFA Project made it possible to review, summarise and develop further the knowledge gained during the 2000 and 2008 crisis. This has been outlined from the standpoint of the local authorities by the Mayor of Hveragerdi and the Police Commissionaire of Árnessýsla County who is heading the crisis management in the area. Contributions from them will be published under separate cover. Characteristic for the earthquake action in the South Iceland Lowland is very high acceleration but short duration; furthermore, collapse of buildings in above mentioned earthquakes are rear; however, damage to interiors and building contents is extensive and injuries of occupants are in most cases related to these. Therefore, a special emphasise has been placed on recommendations to reduce the damage to building content. The Mayor of Hveragerdi summarised the EERC recommendations in four effective (low cost) items outlined in the poster presentation. A useful instrument for the local authorities growing out of the UPStrat-MAFA Project is the analysis and assessment tool based on the Disruption Index (DI) Philosophy. The DI study is currently being carried out for Hveragerdi - as the central observation spot - in close cooperation between the local authorities and EERC. References Sigbjörnsson R. and Ragnarsdóttir S., (1999). Earthquake risk mitigation: A survey on buildings in the South
Iceland Seismic Zone (in Icelandic). EERC, 98 pages. Ákason J.B., Ólafsson S., Sigbjörnsson R., (2005). “Þá varð landskjálfti mikill”: Samfélagsleg áhrif
Suðurlandsskjálftanna í júní árið 2000 (in Icelandic). University of Iceland Press, XXIII + 111 pages. Thorvaldsdóttir S., Bernhardsdottir A.E., Sigurjónsdóttir H., Oddsson G., Petursdóttir G., (2008).
Langtímaviðbrögð við náttúruhamförum (in Icelandic). Stofnun Sæmundar fróða, Reykjavík, 197 pages.
UPStrat-MAFA 4TH General Meeting Catania 11 | 14 December 2013
53
Surveys on Seismic Risk Reduction
Ásthildur Elva Bernhardsdóttir1, Gemma Musacchio2, Monica Amaral Ferreira3
1Earthquake Engineering Research Centre, University of Iceland, Selfoss, Iceland
2Istituto Nazionale di Geofisica e Vulcanologia, Sezione di Milano/Pavia, Milano, Italy 3Instituto Superior Técnico, Lisboa, Portugal
The collaborative effort of the H task group lies in the analysis of both formal and informal education on risk reduction within the different EU-countries participating in the project. This poster focuses on the analysis of the prevalent informal education provided by local responsible authorities. As knowledge is clearly connected with understanding risks, perception of natural hazards and risks in the local environment should be developed with the help of education. The information also needs to be easily understood and accessible to all, and should be linked to the areas and population groups that are prone to particular kinds of emergencies. Importantly, the information needs to include guidelines regarding how people can protect themselves against possible consequences of natural hazards in their communities. The informal education was evaluated by measuring the information on risk reduction (both preventive measures and preparedness) provided by local responsible authorities, used and elaborated in schools within the participants’ countries. The result of preventive measures within school buildings not only lies in safer environment for school children but also raises awareness among them. Surveys were used as a measurement tool. Questionnaire was developed by H task members and then tested in Hveragerði, an Icelandic town included in the UPStrat-MAFA study area. After finalizing the questions (presented in the poster), the survey was run on-line. Directors were contacted by e-mail; they asked to participate and to click a link at the end of the message to open up the questionnaire. Each participant country ran the survey in its native language. In Iceland, the survey was also sent to health institutions, old people’s homes and homes for people with disabilities—institutions that serve groups that are especially prone to emergencies. Analysis shows that in Iceland, less than half of the institutions had information about preventive measures related with seismic risk delivered by the local responsible authorities. Preschools are more likely than elementary schools to have such information, and also to have distributed guidelines on preventive measures among school staff members. Loose objects have also more likely been especially attached within the preschools. The explanation for this difference can be a sense of more responsibility among managers within preschools due to the fact that the schools are not only educational institutions but also day-care homes for small children. Elementary schools, on the other hand, are understandably more likely to provide special education on the topic of natural disasters. The few earthquake drills within schools are noted, especially within preschools, indicating that a valuable time to train children at early age is being lost. The poster presents analysis of the state of preventive measures taken within schools in each of the countries and comparison of this form of informal education wihtin the countries.

UPStrat-MAFA 4TH General Meeting Catania 11 | 14 December 2013
54
The EERC Educational Film: “HVERAGERÐI … in Compliance with Nature”
Ásthildur Elva Bernhardsdóttir, Eva Lind Höskuldsdóttir, Ragnar Sigbjörnsson
Earthquake Engineering Research Centre, University of Iceland, Selfoss, Iceland
The EERC educational film is entitled: “HVERAGERÐI … in Compliance with Nature” and is dealing with Hveragerði, a seismically active town, in 45 km distance from Reykjavik City Centre; located south of the Hengill Central Volcano a very earthquake prone site. The town is commonly shaken by (i) geothermal originating earthquakes from local sources, (ii) volcanic earthquakes originating in the Hengill Central Volcano, and (iii) shallow tectonic strike earthquakes originating in the South Iceland Seismic Zone. The film provides educational material both for schools and for the general public. It introduces how inhabitants in seismic active town are able to live with the risk and the consequences of earthquakes. Furthermore it shows how seismicity along with volcanic activity can add quality to life, by a geothermal energy and demonstrates how science and engineering can provide understanding on natural hazards and risk. The film displays video-clips from the Icelandic National Television Broadcasting Service (RUV) over the last half a century that gives insight into the effect of previous earthquakes on the lives of Hveragerði’s inhabitants. Both responders and inhabitants are interviewed. Special interviewees of the film are the Police Commissioner who is responsible for civil protection in the county Árnessýsla, the Mayor of Hveragerði, several scientists and engineers. The disruption index developed by UPStrat-MAFA scientists are introduced, elaborating how it can be adapted by local authorities, but Hveragerði is used as a “full scale field laboratory” emphasizing the development and application of the index. The film is approximately 15 minutes long and will be accessible to the public on the World-Wide Web.
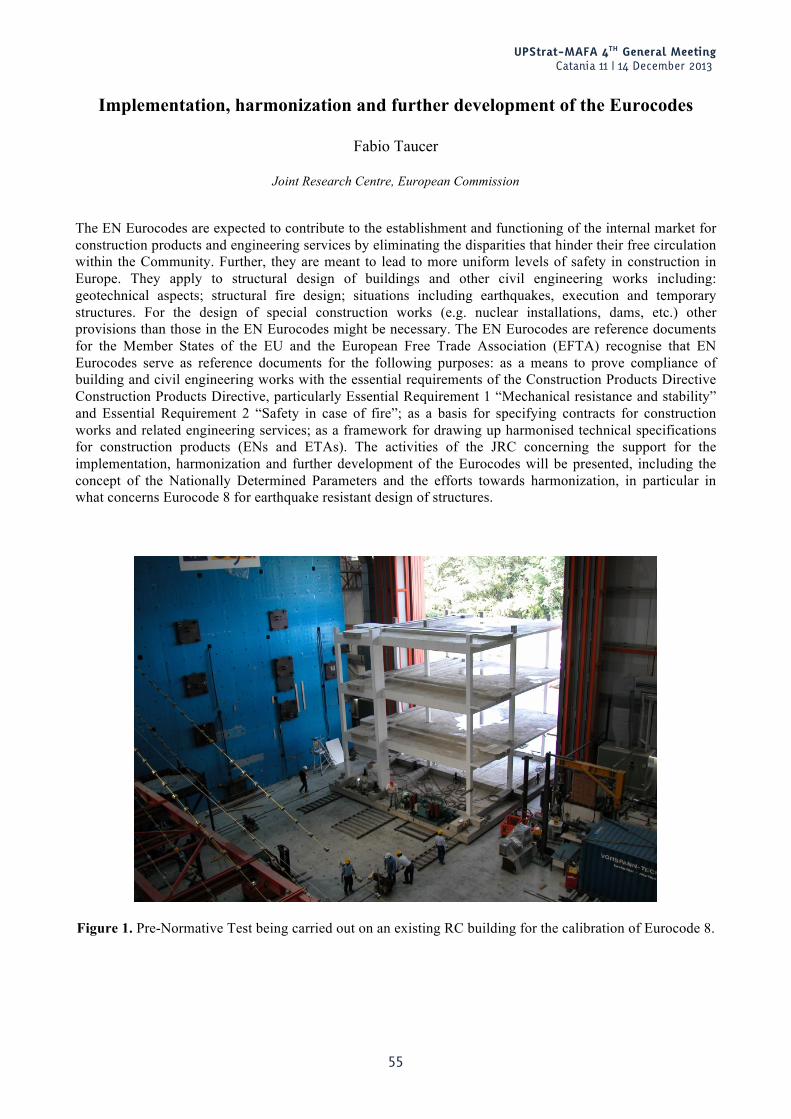
UPStrat-MAFA 4TH General Meeting Catania 11 | 14 December 2013
55
Implementation, harmonization and further development of the Eurocodes
Fabio Taucer
Joint Research Centre, European Commission
The EN Eurocodes are expected to contribute to the establishment and functioning of the internal market for construction products and engineering services by eliminating the disparities that hinder their free circulation within the Community. Further, they are meant to lead to more uniform levels of safety in construction in Europe. They apply to structural design of buildings and other civil engineering works including: geotechnical aspects; structural fire design; situations including earthquakes, execution and temporary structures. For the design of special construction works (e.g. nuclear installations, dams, etc.) other provisions than those in the EN Eurocodes might be necessary. The EN Eurocodes are reference documents for the Member States of the EU and the European Free Trade Association (EFTA) recognise that EN Eurocodes serve as reference documents for the following purposes: as a means to prove compliance of building and civil engineering works with the essential requirements of the Construction Products Directive Construction Products Directive, particularly Essential Requirement 1 “Mechanical resistance and stability” and Essential Requirement 2 “Safety in case of fire”; as a basis for specifying contracts for construction works and related engineering services; as a framework for drawing up harmonised technical specifications for construction products (ENs and ETAs). The activities of the JRC concerning the support for the implementation, harmonization and further development of the Eurocodes will be presented, including the concept of the Nationally Determined Parameters and the efforts towards harmonization, in particular in what concerns Eurocode 8 for earthquake resistant design of structures.
Figure 1. Pre-Normative Test being carried out on an existing RC building for the calibration of Eurocode 8.


Coordinamento editoriale e impaginazioneCentro Editoriale Nazionale | INGV
Progetto grafico e redazionaleDaniela Riposati | Laboratorio Grafica e Immagini | INGV
© 2013 INGV Istituto Nazionale di Geofisica e VulcanologiaVia di Vigna Murata, 605
00143 RomaTel. +39 06518601 Fax +39 065041181
http://www.ingv.it

Istituto Nazionale di Geofisica e Vulcanologia


![MISCELLANEA - Applied Physics Laboratory · MISCELLANEA PUBLICA TIONS APL ... V., "Large-and maU- cale Cir ... and Suter, J.]. (APL), "Fiber-Optic Link for Intrasatellite Communications,"](https://img.pdfslide.us/doc/110x75/5afb72b27f8b9aff288fe3dd/miscellanea-applied-physics-publica-tions-apl-v-large-and-mau-cale-cir.jpg)