Embed Size (px)
Citation preview

Annita Florou, Urska Kosi, Peter F. Pope Are international accounting standards more credit relevant than domestic standards? Article (Accepted version) (Refereed) Original citation: Florou, Annita, Kosi, Urska and Pope, Peter F. (2016) Are international accounting standards more credit relevant than domestic standards? Accounting and Business Research . pp. 1-29. ISSN 0001-4788 DOI: 10.1080/00014788.2016.1224968 © 2016 Informa UK Limited This version available at: http://eprints.lse.ac.uk68202/ Available in LSE Research Online: November 2016 LSE has developed LSE Research Online so that users may access research output of the School. Copyright © and Moral Rights for the papers on this site are retained by the individual authors and/or other copyright owners. Users may download and/or print one copy of any article(s) in LSE Research Online to facilitate their private study or for non-commercial research. You may not engage in further distribution of the material or use it for any profit-making activities or any commercial gain. You may freely distribute the URL (http://eprints.lse.ac.uk) of the LSE Research Online website. This document is the author’s final accepted version of the journal article. There may be differences between this version and the published version. You are advised to consult the publisher’s version if you wish to cite from it.

Are International Accounting Standards more Credit Relevant than Domestic
Standards?
Annita Florou
King’s College London
Department of Management
Franklin-Wilkins Building
150 Stamford Street
London SE1 8WA
Tel: +44(0)20 7848 4169
Email: [email protected]
Urska Kosi
Vienna University of Economics and Business
Institute of Accounting and Auditing
Welthandelsplatz 1
1020 Vienna
Austria
Tel: +43(0)1 31336 5691
Email: [email protected]
Peter F. Pope London School of Economics and Political Science
Department of Accounting
25 Houghton Street
London WC2A 2AE
Tel: +44(0)20 7849 4925
Email: [email protected]
July 2016
Corresponding author. We appreciate comments from Sreedhar Bharath, Darren Henderson, Mark
Schaffer, Steve Stillman, Marco Trombetta, Florin Vasvari and participants at research workshops at WHU
– Otto Beisheim School of Management, ESSEC and Humboldt University Berlin, the AAA 2010 Annual
Meeting, the VIII Workshop on Empirical Research in Financial Accounting, the 33rd EAA Annual
Congress and the 2012 International Accounting Section Midyear Meeting. This work was supported by
the EC-funded INTACCT programme - The European IFRS Revolution: Compliance, Consequences and
Policy Lessons under Grant Contract No. MRTN-CT-2006-035850.
Are International Accounting Standards more Credit Relevant than Domestic
Standards?
ABSTRACT
We examine whether the credit relevance of financial statements, defined as the ability of
accounting numbers to explain credit ratings, is higher after firms are required to report under
International Financial Reporting Standards (IFRS). We find an improvement in credit relevance
for firms in seventeen countries after mandatory IFRS reporting is introduced in 2005; this increase
is higher than that reported for a matched sample of US firms. The increase in credit relevance is
particularly pronounced for higher risk speculative-grade issuers, where accounting information is
predicted to be more important; and for IFRS adopters with large first-time reconciliations, where
the impact of IFRS is expected to be greater. These tests provide reassurance that the overall
enhancement in estimated credit relevance is driven by accounting changes related to IFRS
adoption. Our results suggest that credit rating analysts’ views of economic fundamentals are more
closely aligned with IFRS numbers, and that analysts anticipate at least some of the effects of the
IFRS transition.
Keywords: IFRS; debt markets; credit ratings; credit relevance.
JEL Classifications: G15, G33, K20, M41, M48.

1
1. Introduction
Debt markets are a more important source of new capital for companies than equity markets
(Henderson et al. 2006); and accounting standard setters recognize that creditors are an important
financial statement user group (e.g. International Accounting Standards Board 2015).1 Yet
comparatively little is known about how well financial statements address creditors’ needs,
especially in the international context. Research confirms that US GAAP information is important
in the credit rating process (Blume et al. 1998, Hann et al. 2007) and in bond pricing (Easton et al.
2009). But recent requirements for firms in many countries to report under IFRS have not been
evaluated from a credit market perspective, with most studies on the relevance of IFRS accounting
numbers focusing on the equity market perspective (e.g. Barth et al. 2008, Barth et al. 2012). Since
creditors’ decisions and information needs differ from those of equity investors (Holthausen and
Watts 2001, Hann et al. 2007), evidence that IFRS is relevant to equity markets does not imply
relevance for creditors.
In this paper we compare the credit relevance of financial statement numbers prepared
under IFRS and under domestic accounting standards for a sample of firms that are required to
switch to IFRS reporting in 2005. We follow Hann et al. (2007) in defining credit relevance as the
ability of accounting numbers to explain credit analysts’ ratings. We show that IFRS financial
statements capture information used by rating analysts better than financial statements prepared
under domestic standards. Our results also suggest that credit rating analysts understand the
1 For example, during the 2000-2011 period, the average European country’s corporate debt market was three times
the size of its equity market; the balance between private sector debt and equity in other non-EU countries over the
same period was comparable. In particular, over 2000-2011 the total amount of debt in the EU was 193 percent (as a
percentage of GDP), whereas the total value of all shares listed on European stock markets was 59 percent. Similarly,
the total amount of US corporate debt over the same period was 323 percent as opposed to the total market
capitalization of stocks which was 126 percent (for further details see World Bank, Global Financial Development
Database).

2
limitations of domestic accounting standards and anticipate some of the changes resulting from
IFRS adoption.
Because general purpose financial reporting standards can require standard setters to trade-
off the interests of different user groups, there is a degree of ambiguity concerning the relevance
of IFRS to creditors. On the one hand, some IFRS requirements are expected to enhance the
information available to creditors, e.g. the recognition of previously unrecognized pension deficits
under IAS 19 provides more information on effective debt obligations; and impairment accounting
under IAS 36 leads to more timely loss recognition (Ball et al. 2008). On the other hand, IFRS
requires or permits fair valuation of many assets and liabilities and this might be inconsistent with
creditors’ needs if it results in the recognition of economic gains before realization occurs or to the
understatement of the carrying value of debt relative to contractual obligations. While such
accounting treatments are argued by some to be consistent with equity investors’ needs, they
undermine the usefulness of financial statements to creditors (Schipper 2005, Ball et al. 2008).
Additionally, IFRS often requires preparers to exercise a high degree of judgment and estimation,
producing less verifiable and less reliable accounting numbers and creating opportunities for
opportunistic manipulation of financial statements (Ball et al. 2015); for example, firms that
choose the fair value measurement basis for their non-financial assets under IAS 16 provide
potentially less reliable asset values and therefore less credit relevant information. In light of such
doubts about whether IFRS enhances the usefulness of financial statements for creditors, the
question of how the credit relevance of financial statements changes in the switch from domestic
accounting standards to IFRS is essentially an empirical issue.
Our analysis is based on an international sample of firms from seventeen countries which
mandated IFRS for the first time in 2005 and for which long-term issuer credit ratings are available

3
from Standard & Poor’s (S&P). In line with prior studies we use credit ratings as a surrogate for
estimated default risk and employ a model that includes only accounting variables, because our
interest is in assessing the ability of accounting fundamentals to capture attributes considered
relevant by rating analysts (Blume et al. 1998, Hann et al. 2007, Jorion et al. 2009). As in Hann et
al. (2007) we estimate credit relevance using the explanatory power (the pseudo-R2) of an
accounting-based credit rating model estimated by ordered probit.
In baseline tests we find that the explanatory power of the credit rating model increases by
a modest 2.5 percentage points in the post-IFRS adoption period. We also document that the
accuracy of probabilistic forecasts of credit ratings for mandatory IFRS adopters improves after
the adoption. Next, in line with Barth et al. (2012), we perform comparative analysis using a
sample of a contemporaneously matched US firms reporting under US GAAP and show that the
increase in credit relevance for IFRS adopting firms is higher than the improvement in credit
relevance for their US peers. Inferences remain qualitatively unchanged when we compare IFRS
adopters to the full population of US firms with S&P credit ratings. Results remain robust to further
analysis, including alternative samples, rating model specifications and credit relevance metrics.
We interpret our findings as showing that relative to domestic standards, IFRS financial statement
numbers map more closely onto latent attributes assessed by credit analysts.
To improve confidence that our baseline results are capturing effects related to the
accounting standards regime change, we conduct two further sets of analysis. First, based on prior
research findings that accounting numbers are more relevant to creditors when the likelihood of
borrower default is higher (e.g. De Franco et al. 2009), we predict that IFRS-related changes in
credit relevance will be higher when firms have higher default risk. Results support this prediction

4
– the increase in credit relevance associated with IFRS adoption is twice as high for speculative-
grade firms compared to investment-grade firms.
Second, we predict that IFRS-related changes in credit relevance should be greatest when
the switch from domestic standards to IFRS results in relatively large changes to the credit ratings
model inputs. Similar to Horton et al. (2013) we exploit the requirement under IFRS 1 for first-
time IFRS adopters to restate and reconcile to IFRS the financial statements prepared under
domestic accounting standards in the previous year. Based on line item reconciliations between
domestic standards and IFRS we develop firm-level measures of the distance between local GAAP
and IFRS. Results show that when first-time IFRS reconciliations are small (i.e. when domestic
GAAP accounting numbers are relatively close to IFRS numbers) credit relevance in the pre-IFRS
period is considerably higher than when reconciliations are large; this finding suggests that
financial statements prepared under domestic standards can be relatively successful in capturing
the fundamentals of concern to credit rating analysts when firm-level accounting numbers are close
to IFRS. We also find that credit relevance increases between the pre-IFRS and the post-IFRS
periods only for firms with large first-time IFRS reconciliation differences, i.e. where the expected
impact of IFRS adoption is greatest. Finally, when we focus on the IFRS transition year alone,
credit ratings are better explained by IFRS-restated accounting numbers than by domestic standard
accounting numbers only for issuers where the differences between domestic standards and IFRS
are large; this result suggests that credit analysts are able to estimate at least some of the accounting
differences associated with IFRS transition and that these differences are considered relevant in
credit rating decisions. The analysis based on first-time reconciliations of firms is informative
because it demonstrates that changes in credit relevance are associated with de facto accounting
changes, assessed from the perspective of the credit analyst.

5
Broadly, our study contributes to the growing literature on the consequences of IFRS
financial reporting for debt markets by considering changes in the credit relevance of accounting
information linked to mandatory IFRS adoption.2 Our paper is most closely related to the study of
Wu and Zhang (2014) who examine changes in the sensitivity of credit ratings to accounting
numbers for IFRS adopters; they find that credit ratings are more sensitive to an accounting default
factor after mandatory IFRS adoption, but only in countries with strong rule of law. Bhat et al.
(2014) conduct a similar analysis relating the sensitivity of credit default swap rates to earnings,
book value and leverage; contrary to Wu and Zhang (2014) they find no evidence that mandatory
IFRS adoption affects the sensitivity of credit default swaps to accounting earnings. Our research
focus differs because credit relevance captures the extent to which financial statement numbers
explain credit ratings. In contrast, changes in the estimated sensitivity (slope coefficients) in a
credit rating (or credit default swap rate) model do not necessarily imply changes in credit
relevance.3 For this reason, we are agnostic about the magnitude and changes of values of slope
coefficients and focus on the ability of accounting numbers to explain variation in credit ratings.4
Overall, our analysis points to credit rating analysts displaying a degree of accounting
sophistication in their decision making (Standard & Poor’s 2008, Moody’s 2010, Kraft 2015). Our
paper suggests that credit rating analysts understand how accounting measurement rules differ
across accounting standards regimes and that they do not mechanistically use accounting numbers
in determining credit ratings. Based on the assumption that ratings depend on assessment of the
2 For studies of the implications of IFRS adoption for financing decisions and debt security valuation, see e.g. Florou
and Kosi (2015) and Naranjo et al. (2015); for studies of the consequences of IFRS adoption for debt contracting see
Chen et al. (2013), Ball et al. (2015) and Brown (2016). 3 Slope coefficients are a function of the underlying measurement scales of variables as well as the degree to which
economic attributes are captured by accounting numbers. For example, if IFRS numbers are a constant multiple of
domestic standards numbers, slope coefficients will change by a factor proportional to that multiple. But this does not
imply that explanatory power (credit relevance) changes. 4 Similar to Bhat et al. (2014), in a recent working paper Kraft and Landsman (2014) examine the effects of mandatory
IFRS adoption on accounting-based prediction models for CDS spreads.
6
economic fundamentals of firms, the evidence we report is consistent with financial statement
numbers prepared under IFRS better capturing the economic fundamentals that matter for credit
ratings. In view of the importance of credit ratings in the market pricing of debt, our results
complement prior results on the decision relevance of IFRS accounting numbers for equity markets
obtained by Barth et al. (2008, 2012).
The remainder of the paper is organized as follows. In the next section we provide a brief
overview of related literature. Section 3 elaborates on our research design. Section 4 outlines the
sample construction and describes the data. In Section 5 we present our empirical findings. Section
6 concludes.
2. Theoretical background and motivation
2.1. IFRS and credit relevance
Several prior studies document differences between IFRS and domestic accounting standards in
respect of both measurement and recognition rules, and in disclosure requirements (e.g. Ding et al.
2007, Bae et al. 2008). IFRS are predicted to improve financial reporting because of more
extensive and informative disclosures, better measurement and recognition rules and enhanced
comparability (Hail et al. 2010). The potential benefits from IFRS due to enhanced disclosures
may be less important to solicited rating analysts because they can mitigate weak public disclosure
through access to private information provided directly by issuers (Jorion et al. 2005, Frost 2007,
De Franco et al. 2009). Because rating analysts have private access to issuers, we expect that credit
relevance effects of IFRS will derive primarily from improved recognition and measurement and
improved accounting comparability.

7
Credit ratings are designed to inform debt market participants interested in assessing the
ability of borrowers to service future debt obligations. Hence the economic fundamentals of
importance to creditors include the future cash flow prospects of a borrower relative to its debt
obligations, the risk of a borrower defaulting on its debt obligations and the values of a borrower’s
assets that could be liquidated to meet debt obligations if future cash flows are insufficient to meet
debt obligations. Asset values are also important when debt contracts include collateral provisions
(Armstrong et al. 2010). Therefore, financial statements will be useful to creditors and credit rating
analysts if they contain information that is useful in the prediction of future cash flows or if they
provide reliable estimates of asset and liability values (Watts 2003).
Financial statements prepared under IFRS seek to achieve two important qualitative
characteristics affecting the usefulness of accounting numbers to creditors: decision relevance (in
forecasting future cash flows and net asset values) and representational faithfulness (International
Accounting Standards Board 2015). Fair value accounting methods are an important feature of
IFRS that is often motivated by reference to these two characteristics. Fair value accounting is
required in accounting for many categories of financial instruments under IFRS 9, and available
as an option for other categories of assets and liabilities, including property plant and equipment
under IAS 16 and investment property under IAS 39. On the one hand, fair value accounting results
in more timely recognition of economic gains and losses in financial statements, resulting in more
relevant balance sheet values; on the other hand, it can lead to less informative net income
measurement because fair value gains and losses are transitory in nature, reducing the usefulness
of net income in forecasting future cash flows and future debt servicing capacity (Ball et al. 2015).
Fair value accounting under IFRS 9 can also result in the understatement of the book value of debt
relative to its redemption value if a borrower’s issued debt is measured at fair value (Schipper

8
2005, Ball et al. 2008). Fair value accounting is also a potential source of concern for creditors
because some fair valued balance sheet items can be less useful when based on difficult-to-verify
inputs requiring management judgement and estimates as inputs to valuation models used if liquid
market prices are not observable (Ball et al. 2015).
Accounting rules governing assets carried at amortized historical cost are less likely to be
relevant because carrying values are generally different from economic values. But impairment
tests applied under IAS 36 should ensure relatively timely recognition of economic losses and
ensure alignment of carrying value with economic value when economic values fall below
historical cost carrying amounts. Such asymmetric re-measurement of asset values is relevant to
creditors because the values of debt claims are more sensitive to economic losses than to economic
gains (Ball et al. 2008). But again, relevance may be compromised because management
judgments and estimates are required in the calculation of recoverable amounts.
Harmonised financial reporting under IFRS also aims to produce more comparable
financial statements. Potential comparability effects can influence estimated credit relevance in
an international setting via two main channels. First, when reporting is under domestic accounting
standards, differences in recognition and measurement rules across countries represent a source of
country-level idiosyncratic measurement error in accounting numbers relative to the fundamental
economic attributes assessed by rating analysts. This measurement error has a negative effect on
estimated credit relevance. When all issuers report under IFRS, financial statements should be
more comparable across countries, even if they do not capture economic fundamentals perfectly
due to measurement and recognition properties of IFRS or cross-country differences in reporting
incentives and enforcement. Subject to these qualifications, country-level recognition and
measurement effects attributable to local GAAP are eliminated, leading us to expect higher credit

9
relevance under IFRS since accounting numbers should map more closely on to the economic
fundamentals on average. The second channel through which comparability effects might
influence credit relevance is linked to the importance of peer comparisons in the credit rating
process (Standard & Poor’s 2008). Country or industry peer comparisons are informative because
they contribute to identification of common trends in economic fundamentals, and any expansion
in the set of comparable issuers potentially generates richer information on which to make credit
rating assessments. This channel for comparability effects suggests that credit ratings could change
as a result of enhanced information.
Our empirical tests establish whether financial statement numbers produced under IFRS
explain credit ratings better than accounting numbers produced under domestic standards. Credit
relevance tests assume that credit ratings reflect analysts’ assessments of the likelihood that issuers
will default, and if default occurs the expected recovery rate of amounts in arrears. Expectations
are conditional on analysts’ understanding of the economic position and performance of issuers
informed by the public disclosures of issuers, including financial statements, and private
communications between credit rating analysts and issuers. IFRS will be more credit relevant than
domestic accounting standards if IFRS financial statement numbers capture the economic
fundamentals determining credit ratings more reliably than numbers prepared under domestic
standards.
Observing increased credit relevance after the adoption of IFRS does not necessarily imply
that IFRS adoption causes analysts to revise their assessments of economic fundamentals – hence
it does not imply that credit ratings change. The reason for this is that IFRS reporting could
effectively bring into the public domain information that was previously obtained by rating
analysts through private communications with the borrower (Jorion et al. 2005, Frost 2007, De

10
Franco et al. 2009). For example, IFRS reporting enhances transparency relating to pension assets,
liabilities and deficits in many countries; it is quite likely that prior to IFRS adoption rating analysts
obtained pensions-related information through communications with the borrower when domestic
accounting standards did not require such disclosures. However, if IFRS adoption does provide
new information to rating analysts beyond domestic accounting standards and private
communications with borrowers, then this would be a further channel positively affecting credit
relevance as well as, potentially, credit ratings.5
2.2. Proximity to default and credit relevance
Holders of debt securities receive payoffs that are non-linear in the value of firms’ assets. When
the value of assets is higher than the value of debt obligations, the holders of debt securities receive
only the cash flows specified in debt contracts. However, when borrowers default, cash flows to
debt holders are less than specified contractually. Consequently the value of debt is less sensitive
to positive news than to negative news, leading to debt market demand for accounting information
being asymmetric (Ball et al. 2008). Consistent with these arguments, prior research has found that
bond price sensitivity to news about firm fundamentals is greatest when default risk is relatively
high. For example, Easton et al. (2009) document a larger reaction of bond prices to earnings
announcements for speculative-grade bonds; De Franco et al. (2009) provide evidence of greater
reaction of bond market trading volume and returns to bond analysts’ reports for low-rated bonds;
and Givoly et al. (2013) find higher explanatory power of an accounting-based bond returns model
for higher yield bonds.
5 In a 2004 report anticipating the transition to IFRS reporting in Europe Standard & Poor’s stated that they were not
expecting any widespread or significant rating actions due to IFRS adoption (Standard & Poor’s 2004).

11
In our empirical tests we build on these insights by examining whether changes in the
ability of accounting numbers to explain credit ratings across the pre- and post-IFRS periods differs
between investment- and speculative-grade firms. If IFRS are more informative and if fundamental
accounting factors are more important when the proximity to default is higher, changes in credit
relevance associated with IFRS should be higher for speculative-grade firms.
2.3. Materiality of accounting differences
IFRS 1 First-Time Adoption of IFRS requires firms to reconcile prior year accounting numbers
prepared under domestic accounting standards to IFRS when they switch from domestic
accounting standards to IFRS. We exploit the first-time reconciliations as firm-level measures of
de facto divergence between domestic accounting standards and IFRS assuming that higher
divergence will lead to larger firm-specific reconciliations. We make three main predictions
relating estimated credit relevance and changes in credit relevance to the magnitude of
reconciliations. First, if IFRS financial statements better capture the economic fundamentals
underlying credit ratings than domestic accounting standards then estimated credit relevance in the
pre-IFRS period should be higher for borrowers with relatively small first-time reconciliations;
second, when first-time reconciliations are relatively large, IFRS-restated accounting amounts for
the year prior to IFRS adoption should better explain credit ratings in that year than accounting
amounts prepared under domestic standards; and third, the increase in the informativeness of
financial statements following the switch to IFRS should be higher for firms with larger first-time
reconciliations (Brochet et al. 2013, Horton et al. 2013).

12
3. Research design
3.1. Estimating credit relevance
We follow Hann et al. (2007) and define credit relevance as the ability of financial statement
numbers to explain default probabilities, using S&P long-term issuer credit rating as a proxy for
default risk. Issuer credit ratings are an adequate proxy for default risk for at least three reasons:
(a) they have been shown to be associated with ex post payment defaults and bond yields (Liu et
al. 1999, Standard & Poor’s 2008, Jorion et al. 2009); (b) they are determined by rating agencies'
professional assessments of the probability distribution of future cash flows to debt holders
(Ashbaugh-Skaife et al. 2006); and (c) in contrast to issue-level credit ratings, they indicate the
probability of default for the entire firm regardless of the degree of protection afforded to holders
of specific debt instruments (Cheng and Subramanyam 2008).
We employ the following empirical model predicting credit ratings as a function of
contemporaneous financial statement numbers (Blume et al. 1998, Ashbaugh-Skaife et al. 2006,
Hann et al. 2007, Jorion et al. 2009):6
Rating = f (IntCov1, IntCov2, IntCov3, IntCov4, ROA, LTD Leverage,
TD Leverage, Size, CI, Loss) (1)
In line with most prior studies, which collapse multiple ratings into fewer categories (e.g.
Ashbaugh-Skaife et al. 2006, Jorion et al. 2009), the dependent variable, Rating, is Standard &
Poor’s long-term issuer credit rating at the end of fiscal year t, coded as ordered numerical values
from 1 (CC) to 8 (AAA) so that credit ratings assigned higher numerical scores are assessed as
6 Consistent with prior studies (Hann et al. 2007; Jorion et al. 2009) we exclude non-accounting variables (e.g. equity
beta and equity volatility). This choice is justified by our research objective of comparing the credit relevance of
financial statements prepared under different accounting regimes. However, we assess the robustness of our results to
the inclusion of market-based factors in Section 5.2. For earlier research on the determinants of credit ratings see
Horrigan (1966), West (1970) and Kaplan and Urwitz (1979).

13
having higher credit quality. The explanatory variables are based on published financial statement
numbers and have been found to be important in prior research: interest coverage is coded to allow
for non-linear effects as proposed by Blume et al. (1998) and Jorion et al. (2009) (IntCov1,
IntCov2, IntCov3, IntCov4);7 profitability, measured by return on assets (ROA); long-term debt
leverage (LTD Leverage) and total debt leverage (TD Leverage); total assets, a proxy for firm size
(Size); capital intensity (CI); and a loss indicator equal to one if the firm has negative earnings in
the current and prior fiscal years, and zero otherwise (Loss). Prior research finds that credit ratings
are positively related to interest coverage, profitability, firm size and capital intensity; and
negatively related to both measures of leverage and to the loss indicator (e.g. Jorion et al. 2009).
Detailed variable definitions are provided in Appendix 1.
Since we are interested in predicting discrete ratings probabilities, following prior literature
(e.g. Blume et al. 1998, Jorion et al. 2009) we estimate equation (1) using ordered probit models.8
To mitigate the impact of extreme observations all continuous variables are winsorized at the
extreme percentiles.
Based on the approach of Hann et al. (2007) and Jorion et al. (2009) we estimate the
explanatory power of equation (1) with reference to the pseudo-R2 statistic, an overall measure of
goodness of fit equal to one in the case of a perfect fit. We follow Ohlson (1980) and Jorion et al.
(2009) and employ the McFadden (1974) pseudo-R2 statistic.9
7 Blume et al. (1998) argue that although the relation between the latent variable for credit ratings and interest coverage
is predicted to be positive, the effect should be non-linear. For example, a small change in interest coverage when
interest coverage is high is expected to have a negligible effect on credit risk. Consequently, Blume et al. (1998) and
Jorion et al. (2009) capture potential non-linear interest coverage effects by recoding interest coverage as four indicator
variables, as described in Appendix 1. 8 Our findings are robust to the employment of OLS as in Hann et al. (2007). 9 Several alternative pseudo-R2 measures have been defined for models with categorical response variables. However,
the McFadden (1974) pseudo-R2 is generally accepted as a reasonable measure of goodness of fit analogous to the
OLS R2 statistic, with values close to one (zero) indicating high (low) ability to explain categorical outcomes. The
McFadden (1974) pseudo-R2 is defined as 1- LLM/LLR, where LLM is the log likelihood of the estimated model and
LLR is the log likelihood of the restricted intercept-only model. See Hu et al. (2006) for further discussion.

14
3.2. Comparing credit relevance
As in prior research, we interpret differences in the model’s explanatory power between two
accounting regimes (or two time periods) as evidence of differences in credit relevance (Hann et
al. 2007, Jorion et al. 2009). Specifically, for our primary test of whether the credit relevance of
accounting numbers changes in the switch to IFRS from domestic accounting standards, we
compare the pseudo-R2 of equation (1) based on a constant sample of mandatory IFRS adopters
for which credit ratings are available in both the pre-IFRS (2000-2004) and the post-IFRS (2005-
2009) periods. We perform this comparison for the full IFRS sample and separately for IFRS firms
with investment-grade and speculative-grade credit ratings. If IFRS financial statements have
higher credit relevance than financial statements prepared under domestic accounting standards
then we expect an increase in the explanatory power of the credit rating model from the pre-IFRS
period to the post-IFRS period. In this design each IFRS firm serves as its own control, thereby
mitigating the potential impact of changes in sample composition over time and allowing us to be
more confident that observed changes in credit relevance are attributable to the switch from
domestic accounting standards to IFRS.10 We also predict that any increase in the model’s
explanatory power is more pronounced for speculative-grade issuers with higher default risk than
for investment-grade issuers.
To address possible concerns that estimated changes in credit relevance could be driven by
changes in the economic environment of IFRS adopters unrelated to the financial reporting system,
we also employ a matched-sample design where the IFRS sample is matched to a sample of US
10 We note that if estimated changes in credit relevance are to be attributed to financial reporting changes, the
methodology mapping economic fundamentals into credit ratings should be relatively stable. Indeed, credit rating
agencies emphasize the consistency of their rating processes over time and across firms. In line with such claims
Jorion et al. (2009) find no evidence suggesting that credit standards have tightened over time. The stability of ratings
processes over time helps mitigate concerns that any observed credit relevance changes subsequent to the adoption of
IFRS could be attributed to changes in rating practices rather than changes in financial reporting.

15
firms that are subject to the same credit rating process but report under US GAAP. Similarly to
Barth et al. (2012), for each year over the 2000-2009 period we match each mandatory adopter to
a US firm in the same credit rating category (i.e. investment/speculative), same industry sector and
year and of similar size, measured by equity market value.11 We then estimate comparative changes
in the credit relevance of financial statement numbers under IFRS and US GAAP using a
difference-in-differences design. If IFRS provide more informative accounting numbers
(compared to domestic accounting standards) then we expect any increase in credit relevance to
be greater for IFRS adopters than for the US control group. In robustness checks we demonstrate
that results are insensitive to the matched sample design by repeating our comparative analysis
using the full US population of firms with credit ratings.
3.3. IFRS reconciliations analysis
We establish a direct link between credit relevance changes and a firm-level measure of the impact
of IFRS on accounting amounts, exploiting reconciliations of pre-adoption year comparative
financial statements. For the majority of firms where first-time IFRS financial statements are for
fiscal year end December 2005, the restated accounting numbers are for fiscal year end December
2004; for the remaining firms that adopt IFRS for the first time during 2006, reconciliations relate
to the fiscal year ending during 2005.
11 Ideally we would like to match on the same credit rating score rather than the same credit rating category. However,
this is not possible due to the smaller pool of available US peers. But, we assess the sensitivity of our results to
alternative matching procedures in Section 5.2. We group firms into 12 aggregate sector groups based on Campbell
(1996) using the SIC industry classifications (WS07021). Sectors are defined as follows (WS industry numbers in
parentheses): Petroleum (13 and 29), Consumer Durables (25, 30, 36, 37, 50, 55, 57, and 39), Basic Industry (10, 12,
14, 24, 26, 28, 33, and 8), Food and Tobacco (1, 20, 21, 54, and 2), Construction (15-17, 32, and 52), Capital Goods
(34, 35 and 38), Transportation (40-42, 44, 45, and 47), Utilities (46, 48, and 49), Textiles and Trade (22, 23, 31, 51,
53, 56, and 59), Services (72, 73, 75, 80, 82, 89, 7, 76, 83, and 87), Leisure (27, 58, 70, 78, 79, and 91-99) Finance
and Real Estate (60-69).

16
We perform two complementary tests using first-time IFRS reconciliations. First, we
examine the pseudo-R2 of equation (1) for sub-samples of mandatory adopters based on the degree
to which IFRS affects the accounting variables in the credit rating model. Second, we focus on the
year prior to IFRS adoption and investigate the relative explanatory power of equation (1), first
using accounting items prepared under domestic standards and then using IFRS-restated
accounting items; we execute this analysis for sub-sets with different levels of reconciliations.
We collect all firm-level restated accounting items from Worldscope and identify those due
to first-time IFRS application if the indicator Restatement Reason (WS11559) is coded 4 (i.e.
‘Accounts are restated due to a change in GAAP followed by the company’) and the indicator
Accounting Standards Followed (WS07536) is coded 23 (i.e. ‘IFRS’). We estimate firm-specific
IFRS reconciliations as (accounting item under domestic standards - IFRS restated accounting
item) for each variable used in equation (1). We winsorize each reconciliation item at the extreme
percentiles.
We define extreme reconciliations using the following procedure. For each of the six
accounting variables in equation (1) we generate a binary indicator equal to one if the
reconciliation is either in the top or the bottom quartile of the distribution.12 We then add the six
extreme reconciliation indicators and obtain a composite score, labelled Total Extreme
Reconciliations, with a theoretical range from 0 (i.e. the firm reports no extreme reconciliations at
all) to 6 (i.e. the firm reports extreme reconciliations for all six accounting variables). We classify
a firm as having large (small) reconciliations if Total Extreme Reconciliations is greater than or
12 Applying different cut-off points to identify extreme firm reconciliations, i.e. top and bottom 15 and 35 percent,
does not alter our inferences. Similarly, using the absolute value of firm actual reconciliations yields consistent results.
17
equal to 4 (lower than 4).13 We assume that large (small) reconciliations indicate higher (lower)
de facto divergence between domestic accounting standards and IFRS.
We use the extreme reconciliations proxy to test whether IFRS have higher credit relevance
as follows. First we test whether firms with small first-time reconciliations have higher estimated
credit relevance than those with large reconciliations in the pre-IFRS period. Then we examine
credit relevance in the pre-IFRS adoption year and test whether any increase in credit relevance in
moving from domestic accounting standards to IFRS-restated numbers is higher for the large
reconciliations sub-sample. Finally, we test whether any observed improvement in credit relevance
between the pre- and post-IFRS periods is more pronounced for mandatory IFRS adopters with
large reconciliations.
4. Sample and descriptive statistics
4.1. Sample composition
We compile our data by merging the S&P long-term issuer credit ratings database with Worldscope
fundamentals data. We merge databases based on company name, the only firm identifier provided
by S&P, employing a name-matching algorithm supplemented by manual checks. The S&P
database covers 15,401 unique rated entities over the sample period 2000-2009 and our matching
process yields an initial sample of 3,863 firms with Worldscope data.14
We identify the accounting standards used in each firm-year based on the Worldscope
reporting standards code (WS07536) as applied by Daske et al. (2013). In defining the mandatory
13 For example, a firm with ROA and SIZE extreme reconciliations obtains a Total Extreme Reconciliations score of
two; in this case the ROA and the SIZE reconciliation (i.e. the difference between local GAAP and IFRS in ROA and
SIZE, respectively) are below the 25th or above the 75th percentile of the respective reconciliation distribution. 14 Our matched sample accounts for 25 percent of the S&P issuer universe over the period 2000-2009. However, the
true matched proportion is higher after excluding non-corporate issuers (e.g. states, municipalities, etc.) and non-listed
issuer entities (i.e. private firms or subsidiaries of public firms). Unfortunately, the S&P database does not allow us to
identify such entities explicitly.

18
IFRS sample we then exclude: firms without necessary financial statement and credit rating data;
firms from countries that do not mandate IFRS reporting in the sample period (e.g. Canada, Japan,
and US) or from countries that did not mandate IFRS for first time in 2005 (e.g. Singapore, Israel,
and New Zealand); voluntary IFRS adopters; firms that do not switch to IFRS (e.g. firms in
mandated IFRS countries that do not prepare consolidated financial statements); firms that used
US GAAP before IFRS adoption; and mandatory adopters without observations in both the pre-
IFRS and the post-IFRS periods. Applying these criteria we obtain a final sample of 202 unique
firms with credit ratings and reporting under IFRS from seventeen countries yielding a total of
1,664 firm-years.15 We summarize the IFRS sample selection process in Table 1.
The sample of IFRS firms with credit ratings represents a relatively small proportion of the
universe of all mandatory IFRS adopters. To provide some insights to the representativeness of
our sample we compare sample firm characteristics to the Worldscope universe and the subset of
mandatory IFRS adopters within the Worldscope universe. Un-tabulated results show that our
sample firms are larger, more leveraged and more profitable than both the Worldscope universe
and the broader set of mandatory IFRS adopters. These differences are unsurprising given that
Worldscope (and in turn the subset of firms in countries where IFRS is mandated) includes a large
number of smaller and younger firms which rely less on public debt financing and are therefore
less likely to receive an S&P issuer credit rating (Denis and Mihov 2003). We also compare
financial and credit rating data of US firms in the S&P-Worldscope intersection to those of US
rated firms examined in prior studies (Ashbaugh-Skaife et al. 2006, Jorion et al. 2009). In general,
15 Our final sample is smaller compared to that of related prior studies (Ashbaugh-Skaife et al. 2006, Hann et al. 2007,
Jorion et al. 2009). However, these papers focus exclusively on US firms and therefore obtain larger samples due to
credit rating and financial data being obtained from the same database, i.e. Compustat. Similar to our study Wu and
Zhang (2014) match data from the Moody's default risk database and Worldscope and obtain an international credit
rating sample of comparable size to ours (i.e. 1,917 vs. 1,664 firm-year observations).

19
un-tabulated results show that there are no marked differences in firm characteristics, suggesting
that our matching process is unlikely to introduce important biases to the analysis.
Table 2 presents the sample composition analyzed by credit rating (Panel A), country
(Panel B) and industry sector (Panel C). As shown in Panel A, S&P long-term issuer credit ratings
range from AAA to CC with rating BBB+ (CC) having the highest (lowest) proportion of total
observations (19.89 and 0.12 percent, respectively). Further, the majority of firms (86.66 percent)
are rated investment grade, i.e. BBB- or above. Panel B indicates that UK, Australia and France
have the highest representation in the sample. We note that the low number of firms in several
countries (e.g. Belgium, Denmark, Italy etc.) can be attributed to the small population of these
countries provided by the S&P database. Our sample is fairly evenly allocated between the pre-
and post-IFRS period with 56.43 and 43.67 percent of observations respectively in the pre-IFRS
and the post-IFRS periods. Rating agencies often group firms into four major industry sectors; as
reported in Panel C, the majority of sample firms are industrials (63.53 percent).
4.2. Descriptive statistics
Table 3 provides descriptive statistics of the variables used to estimate equation (1). We report
results separately for the pre-IFRS period and the post-IFRS period. Panel A refers to the sample
of mandatory IFRS adopters, while Panels B and C relate to the matched US sample and the US
population, respectively. In the case of mandatory IFRS adopters, there are significant differences
between the pre-IFRS period and the post-IFRS period for several accounting variables. For
example, after IFRS adoption firms have, on average, higher interest coverage, higher profitability,
lower total debt, higher total assets and lower capital intensity. The reported differences are
consistent with IFRS having systematic effects on financial statement numbers used in the credit

20
relevance model to capture economic fundamentals. We also note that the proportions of firms
rated with investment (speculative) grade do not change significantly over the periods surrounding
mandated IFRS adoption. The similarity in the distributions of ratings over sub-sample periods
provides reassurance that the ratings process is relatively stable and is therefore unlikely to be a
factor that could lead to differences in estimated credit relevance.16
5. Empirical results
In this section we present our empirical findings. First, we compare the explanatory power of the
accounting-based credit rating model between the pre-IFRS period and the post-IFRS adoption
period, using the overall IFRS and matched US samples, as well as the US population. Next, we
assess the robustness of our primary findings in many ways. Then we examine credit relevance
changes for sub-samples comprising mandatory IFRS adopters with investment-grade and
speculative-grade ratings; and with small and large reconciliations at first-time IFRS application.
5.1. Credit relevance before and after mandatory IFRS adoption
Table 4 reports the difference-in-differences analysis comparing credit relevance between
mandatory IFRS adopters and US firms before and after the mandatory IFRS adoption date. Panels
A and B refer to the matched US sample and the US population of firms, respectively. The reported
pseudo-R2 statistics are in line with those documented in prior studies (e.g. Jorion et al. 2009). As
shown, the pseudo-R2 statistic for mandatory IFRS adopters is higher by 2.5 percentage points in
the post-IFRS period compared to the pre-IFRS period (24.5 percent and 22.0 percent,
16 Un-tabulated analysis reveals that there are no significant correlations between the independent variables, with the
exception of the two leverage factors that, as expected, are highly correlated. Because of this we assess the sensitivity
of our results to the exclusion of LTD Leverage and find similar results.

21
respectively). This finding suggests that IFRS accounting numbers are more capable than
accounting numbers prepared under domestic accounting standards of capturing the economic
fundamentals explaining default probabilities, as reflected in analysts’ credit ratings.
Table 4 Panel A shows that the pseudo-R2 measure is higher by 0.9 percentage points for
the US counterparts over the pre- to post-IFRS period, albeit this increase is smaller than that for
the IFRS firms. After controlling for time trends in credit relevance captured in the US benchmark
sample, we observe an increase of 1.6 percentage points in estimated credit relevance between the
two groups of firms following mandatory IFRS adoption.17 Empirical findings in Panel B are
broadly consistent with those in Panel A; for example, while credit relevance for the population of
US firms increases slightly between the pre-IFRS period and the post-IFRS period by 0.2
percentage points, this increase is lower than that reported for the IFRS sample. Collectively, these
findings enhance our confidence that the observed improvement in credit relevance for the IFRS
sample is likely attributed to the transition to the IFRS financial reporting regime.
As mentioned earlier, we are agnostic about the magnitude and change in values of the
slope coefficients of the accounting-based factors. However, we present the estimation results of
equation (1) in Appendix II. In general, the accounting variables have the expected signs; that is,
larger firms as well as firms with higher interest coverage, profitability and capital intensity and
lower long-term leverage receive higher credit ratings. Also, we find that in the post-IFRS period
17 To the best of our knowledge there is no parametric test of statistical significance for differences in goodness of fit
statistics from models estimated on different samples. The absence of such tests in prior literature (Jorion et al. 2009)
is consistent with this claim. It is possible to apply bootstrap techniques where the treatment effect is randomly
assigned to produce simulated distributions of goodness of fit statistics. However, in this case as shown by Barth et
al. (2012) it is important to control for country and industry fixed effects when using an international sample. Failure
to do so would confound the simulated distribution of goodness of fit statistics with country and industry effects. As
mentioned in footnote 6 our aim is to compare the relevance of accounting information in explaining credit ratings
under two alternative financial reporting regimes; therefore, we focus our analysis on the model specification that
excludes fixed effects and contains accounting variables only. We are able to test for statistical significance controlling
for country and industry fixed effects as described in Section 5.2.

22
the estimates of interest coverage (i.e. IntCov2 and IntCov3) as well as Size become more positive
and the estimate of Loss becomes more negative. These findings, although not directly comparable
to prior work due to different research designs, are broadly consistent with the results of Wu and
Zhang (2014); they document a significant post-adoption increase in the sensitivity of credit ratings
to accounting numbers for mandatory IFRS adopters, but only in countries with strong rules of law
(see their Table 5, columns 3 and 4). To examine further the impact of the legal environment we
replicate our analysis reported in Table 4 after splitting the IFRS sample into two groups of
countries conditioning on financial reporting enforcement based on the Brown et al. (2014)
index.18 Consistent with Wu and Zhang (2014) un-tabulated analysis reports that the increase in
the pseudo-R2 of the credit rating model from the pre-IFRS period to the post-IFRS period is
evident primarily for IFRS adopters in countries where financial reporting compliance is higher.
Overall, the results in Table 4 are consistent with IFRS financial statements being more successful
than domestic accounting standards in capturing the economic fundamentals underpinning credit
ratings.
5.2. Robustness of basic test results
We perform a number of additional tests to assess the robustness of the findings reported in Table
4. We tabulate selected analyses in Table 5. Note that we estimate sensitivity tests using as
benchmark both the US matched sample and US population, wherever applicable; inferences
18 To focus explicitly on factors that affect how compliance with accounting standards was promoted around the time
of IFRS adoption we use the index of financial reporting enforcement constructed by Brown et al. (2014). This index
measures the degree of accounting enforcement activity by independent enforcement bodies and is constructed based
on publicly available data provided by the International Federation of Accountants (IFAC), the World Bank and the
national securities regulators. In our analysis we partition the IFRS sample using the country-level median value of
the ENFORCE index for years 2002 or 2005 or 2008; the country-level median value of the average ENFORCE index
for years 2002, 2005 and 2008; and the median value of the ENFORCE index based on all 1,664 observations.

23
remain qualitatively unchanged across the two alternative control groups, but for brevity we
tabulate findings only for the US matched sample.19
First, we employ a series of different IFRS sample definitions, as follows: (a) we focus
only on IFRS adopting countries with relatively large numbers of observations (i.e. UK, Australia
and France) to ensure that results are not driven by small countries; (b) we extend our sample to
all mandatory IFRS adopters without requiring them to have credit rating and financial statement
data in both the pre- and post-IFRS periods to address concerns of potential survivorship bias in
our sample; (c) we exclude UK firms to ensure our findings are not attributed to the largest country
in the sample; (d) we eliminate financial firms because of the specific structure of their financial
statements and distinct reporting requirements; (e) we drop countries where voluntary adoption of
IFRS was permitted prior to 2005 (i.e. Denmark, Finland, Germany and South Africa) to address
potential selection bias concerns; and (f) we exclude countries that introduced a change from
reactive review of financial statements to proactive review at the same time as mandatory IFRS
adoption, to mitigate concerns that the reported increase in credit relevance results from
enforcement reforms (Christensen et al. 2013).20 In all these tests the observed increased credit
relevance persists.
Second, we employ the populations of Canadian and Japanese firms as alternative
benchmark samples (see Panel A).21 Similarly, we adopt alternative matching procedures by
matching each IFRS firm-year with a US peer in the same year having similar predicted credit
19 Empirical findings for all sensitivity tests are available from the authors on request. 20 These countries include Finland, Germany, Netherlands, Norway and UK. However, we acknowledge that credit
ratings are relatively sticky and therefore provide a potentially less appropriate setting for testing the Christensen et
al. (2013) hypothesis. Accordingly, we cannot entirely rule out the possibility that the observed credit relevance effects
are the joint outcome of mandatory IFRS adoption and contemporaneous regulatory changes. 21 It is not feasible to follow a matched-sample process as in the case of US; such an analysis would reduce the IFRS
sample due to the lower number of total observations of the Canadian and Japanese population with all the required
financial and credit rating data (i.e. 803 and 1,618 firm-years, respectively).

24
rating probability and size; and by matching each IFRS observation with a random US observation
in the same industry and year.22 In all cases, empirical findings are qualitatively identical to those
reported in Table 4.
Third, in line with prior literature we estimate alternative versions of the credit rating
model, including: (a) Operating Margin and Return on Equity (ROE) as alternative profitability
measures (Jorion et al. 2009); (b) Current Ratio and Operating Cash Flow Ratio as additional
explanatory variables capturing liquidity effects (Jorion et al. 2009); (c) interest coverage ratio
(IntCov) as a linear term in place of the four interest coverage indicators (Ashbaugh-Skaife et al.
2006, Cheng and Subramanyam 2008, Wu and Zhang 2014); and d) market-based factors, namely
Equity Beta, Residual Volatility and Returns Variability in addition to the accounting-based
variables (Jorion et al. 2009) (see Panel B).23 Again, results remain qualitatively unchanged.
Fourth, similar to Barth et al. (2012) we repeat our empirical analysis after including
country and industry fixed effects to control for any systematic differences in credit ratings across
countries and industries that could affect credit relevance comparisons. As expected, the inclusion
of these fixed effects increases the statistical performance of the credit rating model and estimated
pseudo-R2 statistics are higher than those reported in Table 4 in both the pre- and post-IFRS
periods. In this specification the credit relevance for the IFRS sample increases by 7.9 percentage
22 In the first approach we estimate predicted credit rating probabilities based on our model described in equation (1)
and after including industry dummies whereas in the second approach we select a random sample of US counterparts
irrespective of their size and calculate the average difference in pseudo-R2 over the pre- to post-IFRS period based on
100 random samples. 23 Equity Beta is estimated from the market model using daily stock returns in each calendar year. The beta estimates
are controlled for nonsynchronous trading effects using the Dimson (1979) procedure with one leading and lagging
value of the market return (market return is based on MSCI World Index). Residual Volatility is the standard error of
the market model. Returns Variability is computed as the annual standard deviation of monthly stock returns. Data is
obtained from Datastream.

25
points after the adoption while the equivalent change for the matched US sample is 0.2 percentage
points.24
Fifth, we assess the robustness of our inferences to using two alternative goodness of fit
measures for credit relevance, namely the McKelvey and Zavoina (1975) pseudo-R2 and the Rank
Probability Score (see Panels C and D, respectively).25 Using these alternative criteria, base line
inferences remain unchanged. For example, the overall prediction accuracy of the credit rating
model based on the Rank Probability Score increases by 2.7 percentage points for mandatory IFRS
adopters following the adoption but only by 0.5 percentage points for the US matched firms over
the same period.
Sixth, we restrict our sample period to 2000-2007 to control for the potential effects of the
global financial crisis (see Panel E). Then we employ an ordered probit model after equally
weighting each firm in estimation (i.e. using firm averages for the pre- and post-IFRS periods
instead of weighting each firm by the number of firm-years in a sub-sample); after averaging
accounting variables over a 2-year and 3-year period (Jorion et al. 2009); and after measuring
credit ratings three months following fiscal year-end (see Panel F). In all these tests we find results
consistent with our main findings in Table 4.
24 As discussed earlier in footnote 17, the inclusion of fixed effects allows us to assess the statistical significance of
the difference in the pseudo-R2 statistic between the IFRS and US samples in the post-IFRS period using bootstrap
techniques. Specifically, following Barth et al. (2012) we randomize between treated and benchmark US firms around
IFRS adoption to obtain bootstrap treatment and control samples and then calculate a difference in the pseudo-R2
statistics across the two samples. Repeating the above procedure 1,000 times, we obtain the empirical distribution of
the difference in pseudo-R2 statistics. Results indicate that this difference is statistically significant (p-value=0.029). 25 Compared to the McFadden pseudo-R2 the McKelvey and Zavoina (1975) pseudo-R2 has the disadvantage that it
does not indicate the level of improvement in goodness of fit of the full model relative to the ‘naive’ intercept-only
model. The Rank Probability Score (RPS) measures the accuracy of probability estimates when the response variable
has more than two categories. In general, prediction accuracy increases as the model fit improves (BarNiv and
McDonald 1999). The RPS score is zero for a perfect forecast and positive otherwise; lower values, therefore, imply
higher prediction accuracy. We multiply differences in RPS by -1 for easier interpretation of results.

26
Finally, we perform a series of ‘placebo tests’ by shifting the IFRS adoption date two years
backwards (i.e. to 2003); by randomly assigning each firm-year to the pre- and post-IFRS periods;
and by randomly shifting IFRS adoption one, two or three years backwards for each firm. In all
these tests the explanatory power of the credit rating model for mandatory adopters does not
increase between the pre-placebo date and the post-placebo date periods; instead it either remains
unchanged or decreases slightly.
Overall, our inferences concerning the incremental credit relevance of IFRS financial
statement numbers appear insensitive to a wide range of research design choices.
5.3. Changes in credit relevance of IFRS: investment-grade versus speculative-grade firms
We now continue our analysis by examining changes in credit relevance for investment-grade and
speculative-grade mandatory IFRS adopters separately. Table 6 reports the findings. As shown,
for both investment-rated and speculative-rated issuers accounting numbers prepared under IFRS
are more successful in capturing the economic fundamentals underpinning credit ratings than those
prepared under domestic accounting standards. However, consistent with predictions the increase
in credit relevance is more than twice as high for the speculative-grade sub-sample (10.0
percentage points) compared to the investment-grade sub-sample (4.9 percentage points).
Un-tabulated analysis comparing investment-grade and speculative-grade firms across the
IFRS and US GAAP samples reveals a larger increase in credit relevance in the post-IFRS period
for both IFRS sub-sets relative to their respective US GAAP peers. Also, empirical findings remain
qualitatively unchanged when we repeat the analysis after constraining slope coefficient estimates
in the ordered probit models to be equal across models for investment-grade and speculative-grade
IFRS issuers. This ensures that changes in estimated credit relevance are not driven by differences

27
in model calibration arising from estimation in different sub-samples partitioned on the dependent
variable. In this case, the explanatory power of the credit-relevant accounting items increases for
both groups of IFRS firms in the post-IFRS period, but the increase is much higher for those with
a speculative credit rating; the difference between the two estimates is 20.7 percentage points.
In sum, our empirical findings suggest stronger links between credit ratings and IFRS
accounting numbers for speculative-grade firms. This finding is consistent with prior studies
indicating stronger association between bond values and accounting information (e.g. De Franco
et al. 2009, Givoly et al. 2013) for lower credit quality issuers. Overall our results suggest that the
documented increase in credit relevance after IFRS adoption is more likely associated with IFRS
per se than with other omitted correlated factors.
5.4. Changes in credit relevance of IFRS: small versus large reconciliations
Next, we discuss sub-sample analysis based on the magnitude of the first-time IFRS adoption
reconciliations. Table 7 reports the results of this analysis. Panels A and B provide descriptive
statistics while Panels C, D and E document the regression analysis findings. Panel A presents the
distribution of Total Extreme Reconciliations. We classify 44.06 percent (55.94 percent) of the
IFRS sample as reporting large (small) overall IFRS impact on credit relevant accounting numbers.
Panel B reports the descriptive statistics for the absolute values of accounting item reconciliations
across the small and large reconciliation sub-samples. Our classification shows that the economic
significance of restatements of accounting variables as a result of switching to IFRS can be quite
high. For example, for the small reconciliation group, the mean (median) absolute value of the
change in interest coverage is 1.35 (0.495) times, while for the large reconciliation group the
change is 1.967 (1.124) times. Un-tabulated analysis shows that our composite extreme

28
reconciliations measure captures firm-level information beyond country or industry effects. For
example, 34 percent (66 percent) of the UK sample is classified as having small (large)
reconciliations; while 55 percent (45 percent) of utilities firms are assigned to the small (large)
reconciliation sub-sample.
In Panel C we repeat the credit relevance analysis based on equation (1) after partitioning
firms into small and large reconciliation sub-samples in both the pre- and post-IFRS periods. Prior
to the implementation of IFRS the pseudo-R2 statistic of the credit rating model is much higher for
IFRS adopters with small reconciliations; the difference in estimated credit relevance between the
small and large reconciliation sub-sets is 12.8 percentage points. This result suggests that credit
rating analysts understand the deficiencies of domestic accounting standards in capturing
economic fundamentals relevant to credit ratings decisions. It also suggests that they are able to
anticipate some of the potential effects of IFRS on financial reporting. We also see from Panel C
that the overall increase in credit relevance for IFRS adopters depends on the magnitude of first-
time reconciliations, and hence on the impact of IFRS on credit relevant accounting numbers; the
increase in the pseudo-R2 of the credit rating model from the pre-IFRS period to the post-IFRS
period is evident only for IFRS adopters with large reconciliations, the magnitude of the increase
being 4.9 percentage points. This finding is similar in spirit to results in Horton et al. (2013), who
find a higher increase in the accuracy of equity analysts’ earnings forecasts for mandatory IFRS
adopters with larger reconciliations.
Panel D reports the comparative credit relevance of domestic standards relative to IFRS-
restated accounting amounts for the year prior to IFRS adoption. Again, the credit relevance of the
IFRS-restated accounting numbers depends strongly on the magnitude of the reconciliations; the
pseudo-R2 of the IFRS-based credit rating model is higher than that of the local GAAP-based

29
model but only for mandatory IFRS adopters with large reconciliations (credit relevance increases
by 5.6 percentage points). In Panel E we repeat the above analysis for each reconciliation item
separately, and we summarise the differences in the pseudo-R2 statistics between the IFRS-based
and the domestic accounting standards-based models for small and large reconciliations. As
shown, in all cases (with the exception of LTD Leverage) the credit relevance of the IFRS-restated
accounting numbers is higher than that of the equivalent local GAAP numbers, but only for issuers
with large reconciliations. Consistent with Panel C, these finding suggests that credit rating
analysts understand the differences between domestic accounting standards and IFRS and that
IFRS numbers better reflect economic fundamentals.
Overall, empirical findings in Table 7 support our expectation that the positive impact of
the mandatory transition to IFRS on the credit relevance of accounting numbers is associated
primarily with firms where there is higher de facto divergence between reporting under domestic
accounting standards and under IFRS. Consequently, these findings help mitigate concerns that
the observed changes in credit relevance are driven by other concurrent changes excluded from
the analysis.
6. Conclusions
In this study we examine changes in the credit relevance of accounting information at the time of
mandatory IFRS adoption. We define credit relevance as the extent to which accounting numbers
are associated with default probabilities. We employ S&P issuer credit ratings as a surrogate for
default risk and estimate the relation between credit ratings and financial statement numbers
reported by mandatory IFRS issuers under domestic accounting standards in the pre-IFRS period

30
and under IFRS in the post-IFRS period. Our credit relevance metric is based on the explanatory
power of the model, as captured by the pseudo-R2 statistic.
Using a constant sample of mandatory IFRS adopters from seventeen countries over the
period 2000-2009, we document a number of findings that are new to the literature. First, we
document an increase in the explanatory power of the credit rating model after IFRS adoption for
the full sample of mandatory adopters. Second, the observed credit relevance improvement is
greater than that reported for a matched sample of US firms over the same period. We interpret
our empirical findings as indicating that IFRS provide more reliable and informative financial
statements to creditors than financial statements prepared under domestic accounting standards.
In subsequent tests we demonstrate that improvements in the credit relevance of IFRS
financial statements are more pronounced in specific sub-samples for which stronger effects are
predicted; namely, for mandatory IFRS adopters with speculative credit ratings rather than
investment credit ratings, where the demand for accounting information is expected to be higher;
and for IFRS adopters with large first-time reconciliations, where the impact of IFRS on credit-
relevant accounting numbers is greater. These findings improve confidence that the changes in
credit relevance we observe for the full sample are related to the financial reporting changes
resulting from the switch from domestic accounting standards to IFRS, rather than to other un-
modelled factors.
Two findings in particular point to credit rating analysts being effective in processing
financial statement information and understanding differences between accounting standards
regimes. First, prior to IFRS adoption the ability of accounting numbers to determine credit ratings
is higher for IFRS issuers who subsequently report small first-time reconciliations. Second, IFRS
restatements of accounting numbers relating to the pre-IFRS adoption year have higher

31
explanatory power for contemporaneous credit ratings than the equivalent accounting numbers
reported under domestic accounting standards, but only for IFRS adopters reporting large first-
time reconciliations, even though they are not known at the time.
Our results are subject to at least two caveats. First, they are based on a selected sample of
firms that are rated by one of the major rating agencies. Results might not generalize to other rating
agencies; or to firms that do not have credit ratings. Second, we assume that credit ratings capture
fundamental differences in default risk across firms. To the extent that credit ratings are incomplete
measures of default risk, our results could understate the credit relevance of IFRS financial
statements. Nevertheless, subject to these caveats, our study documents that mandatory IFRS
adoption is associated with improved informativeness of financial statements from the perspective
of creditors.

32
References
Armstrong, C., Guay, W.R. and Weber, J.P., 2010. The role of information and financial reporting
in corporate governance and debt contracting. Journal of Accounting and Economics, 50(2-3),
179234.
Ashbaugh-Skaife, H., Collins, D.W. and LaFond, R., 2006. The effects of corporate governance
on firms' credit ratings. Journal of Accounting and Economics, 42 (1-2), 203–243.
Bae, K.H., Tan, H. and Welker, M., 2008. International GAAP differences: the impact on foreign
analysts. Accounting Review, 83 (3), 593628.
Ball, R., Askon, R. and Sadka, G., 2008. Is financial reporting shaped by equity markets or by debt
markets? An international study of timeliness and conservatism. Review of Accounting
Studies, 13 (2), 168205.
Ball, R., Li, X. and Shivakumar, L., 2015. Contractibility and transparency of financial statement
information prepared under IFRS: evidence from debt contracts around IFRS adoption. Journal
of Accounting Research, 53 (5), 915963.
BarNiv, R., and McDonald, J.B., 1999. Review of categorical models for classification issues in
accounting and finance. Review of Quantitative Finance and Accounting, 13 (1), 39–62.
Barth, M.E., Landsman, W.R. and Lang, M.H., 2008. International accounting standards and
accounting quality. Journal of Accounting Research, 46 (3), 467498.
Barth, M.E., Landsman, W.R., Lang, M.H. and Williams, C., 2012. Are international accounting
standards-based and US GAAP-based accounting amounts comparable? Journal of Accounting
and Economics, 54 (1), 68–93.
Bhat G., Callen, J.L. and Segal, D., 2014. Credit risk and IFRS: the case of credit default swaps.
Journal of Accounting, Auditing and Finance, 29 (2), 129–162.
Blume, M.E., Lim, F. and MacKinlay, A.C., 1998. The declining credit quality of U.S. corporate
debt: myth or reality? Journal of Finance, 53 (4), 13891413.
Brochet, F., Jagolinzer, A.D. and Riedl, E.J., 2013. Mandatory IFRS adoption and financial
statement comparability. Contemporary Accounting Research, 30 (4), 1373–1400.
Brown, A.B., 2016. Institutional differences and international private debt markets: A test using
mandatory IFRS Adoption. Journal of Accounting Research, 54 (3), 679–723.

33
Brown, P., Preiato, J. and Tarca, A. 2014. Measuring country differences in enforcement of
accounting standards: an audit and enforcement proxy. Journal of Business Finance and
Accounting, 41 (1-2), 152.
Campbell, J.Y., 1996. Understanding risk and return. Journal of Political Economy, 104 (2),
298345.
Chen, T.Y., Chin, C.L. and Wang, S. (2013). The effect of mandatory IFRS adoption on bank loan
contracting. SSRN Working paper.
Cheng, M. and Subramanyam, K.R., 2008. Analyst following and credit ratings. Contemporary
Accounting Research, 25 (4), 1007–1044.
Christensen, H.B., Hail, L. and Leuz, C., 2013. Mandatory IFRS reporting and changes in
enforcement. Journal of Accounting and Economics, 56 (2-3), 147–177.
Daske, H., Hail, L., Leuz, C. and Verdi, R., 2013. Adopting a label: heterogeneity in the economic
consequences around IAS/IFRS adoptions. Journal of Accounting Research, 51 (3), 495547.
De Franco, G., Vasvari, F.P. and Wittenberg-Moerman, R., 2009. The informational role of bond
analysts. Journal of Accounting Research, 47 (5), 12011248.
Denis, D. J. and Mihov, V.T., 2003. The choice among bank debt, non-bank private debt, and
public debt: evidence from new corporate borrowings. Journal of Financial Economics, 70 (1),
328.
Dimson, E., 1979. Risk measurement when shares are subject to infrequent trading. Journal of
Financial Economics, 7 (2), 197-226.
Ding, Y., Hope, O.K., Jeanjean, T. and Stolowy, H. 2007. Differences between domestic
accounting standards and IAS: measurements, determinants and implications. Journal of
Accounting and Public Policy, 26 (1), 138.
Easton, P.D., Monahan, S.J. and Vasvari, F.P., 2009. Initial evidence on the role of accounting
earnings in the bond market. Journal of Accounting Research, 47 (3), 721766.
Florou, A. and Kosi, U. 2015. Does mandatory IFRS adoption facilitate debt financing. Review of
Accounting Studies, 20 (4), 14071456.
Frost, C.A., 2007. Credit rating agencies in capital markets: a review of research evidence on
selected criticisms of the agencies. Journal of Accounting Auditing and Finance, 22 (3),
469492.

34
Givoly, D., Hayn, C. and Katz, S., 2013. The changing relevance of accounting numbers to debt
holders over time. SSRN Working paper.
Hail, L., Leuz, C. and Wysocki, P., 2010. Global accounting convergence and the potential
adoption of IFRS by the US (Part I): conceptual underpinnings and economic analysis.
Accounting Horizons, 24 (3), 355394.
Hann, R.N., Heflin, F. and Subramanayam, K.R., 2007. Fair-value pension accounting. Journal of
Accounting and Economics, 44 (3), 328–358.
Henderson, B., Jegadeesh, N. and Weisbach, M., 2006. World markets for raising new capital.
Journal of Financial Economics, 82 (1), 63101.
Holthausen, R.W. and Watts, R.L., 2001. The relevance of the value-relevance literature for
financial accounting standard setting. Journal of Accounting and Economics, 31 (1-3), 3–75.
Horrigan, J.O., 1966. The determination of long-term credit standing with financial ratios. Journal
of Accounting Research, 4, pp. 44-62.
Horton, J., Serafeim, G. and Serafeim, I., 2013. Does mandatory IFRS adoption improve the
information environment? Contemporary Accounting Research, 30 (1), 388–423.
Hu, B., Shao, J. and Palta, M., 2006. Pseudo-R2 in logistic regression model. Statistica Sinica, 16,
847–860.
International Accounting Standards Board, 2015. Exposure draft: the conceptual framework for
financial reporting. London: IFRS Foundation.
Jorion, P., Liu, Z. and Shi, C., 2005. Informational effects of regulation FD: evidence from rating
agencies. Journal of Financial Economics, 76 (2), 309–330.
Jorion, P., Shi, C. and Zhang, S., 2009. Tightening credit standards: the role of accounting quality.
Review of Accounting Studies, 14 (1), 123–160.
Kaplan, R.S and Urwitz, G., 1979. Statistical models of bond ratings: a methodological inquiry.
Journal of Business, 52 (2), pp. 231261.
Kraft, P., 2015. Rating agency adjustments to GAAP financial statements and their effect on
ratings and credit spreads. Accounting Review, 90 (2), 641–674.
Kraft, P. and Landsman, W.R., 2014. Effect of mandatory IFRS adoption on accounting-based
prediction models for CDS spreads. SSRN Working paper.

35
Liu, P., Seyyed, F.J. and Smith, S.D., 1999. The independent impact of credit rating changes – the
case of Moody's rating refinement on yield premiums. Journal of Business Finance and
Accounting, 26 (3-4), 337–363.
McFadden, D., 1974. Conditional logit analysis of qualitative choice behaviour. In: P. Zarembka,
eds. Frontiers in Econometrics. New York: Academic Press.
McKelvey, R.D. and Zavoina, W., 1975. A statistical model for the analysis of ordinal level
dependent variables. Journal of Mathematical Sociology, 4 (1), 103–120.
Moody's, 2010. Moody's approach to global standard adjustments in the analysis of financial
statements for non-financial corporations.
Naranjo, P., Saavedra, D. and Verdi, R.S., 2015. Financial reporting regulation and financing
decisions. SSRN Working paper.
Ohlson, J.A., 1980. Financial ratios and the probabilistic prediction of bankruptcy. Journal of
Accounting Research, 18 (1), 109–131.
Petersen, M.A., 2009. Estimating standard errors in finance panel data sets: comparing approaches.
Review of Financial Studies, 22 (1), 435480.
Schipper, K., (2005). The introduction of International Accounting Standards in Europe:
implications for international convergence. European Accounting Review, 14 (1), 101126.
Standard & Poor's, 2004. Transition without tears: a five-point plan for IFRS disclosure. London:
Ratings Direct.
Standard & Poor's, 2008. Corporate criteria: analytical methodology. Available from:
http://www.standardandpoors.com/prot/ratings/articles/en/us/?assetID=1245319323579.
Watts, R.L., 2003. Conservatism in accounting part I: explanations and implications. Accounting
Horizons, 17 (3), 207221.
West, R.R., 1970. An alternative approach to predicting corporate bond ratings. Journal of
Accounting Research, 8 (1), 118125.
Wu, J.S., and Zhang, I.X. 2014. The adoption of internationally recognized accounting standards:
implications for the credit markets. Journal of Accounting, Auditing and Finance, 29 (2), 95–
128.

36
APPENDIX 1
Variable definitions
Rating Rating score assigned to Standard & Poor’s long-term issuer credit rating at the end
of fiscal year, converted into numerical values from 1 (CC) to 8 (AAA)
InvGrade Binary variable that equals 1 if a firm’s credit rating is investment grade (i.e. BBB-
or higher), and 0 if rating is speculative grade
IntCov Interest coverage ratio measured as operating income before depreciation
(WS18155) minus depreciation (WS01151) deflated by interest expense
(WS01251). The variable is treated in a non-linear fashion. After setting IntCov to
0 for negative values and to 100 for values above 100, four variables are
constructed as described below
IntCov1 Variable equals IntCov if 0 ≤ IntCov < 5, and 5 otherwise
IntCov2 Variable equals 0 if IntCov< 5, equals (IntCov-5) if 5 ≤ IntCov< 10, and 5 otherwise
IntCov3 Variable equals 0 if IntCov< 10, equals (IntCov-10) if 10 ≤ IntCov< 20, and 10
otherwise
IntCov4 Variable equals 0 if IntCov< 20, and (IntCov-20) otherwise
ROA Net income before extraordinary items (WS01551) deflated by total assets
(WS02999)
LTD Leverage Long-term debt leverage measured as a ratio of long-term debt (WS03251) to total
assets (WS02999)
TD Leverage Total debt leverage measured as a ratio of total debt (WS03255) to total assets
(WS02999)
Size Natural log of total assets in USD (WS07230)
CI Capital intensity measured as a ratio of net property, plant and equipment
(WS02501) to total assets (WS02999)
Loss Binary variable that equals 1 if net income before extraordinary items (WS01551) is
negative in the current and prior fiscal year, and 0 otherwise
Operating Margin Operating income before depreciation (WS18155) deflated by sales (WS01001)
ROE Net income before extraordinary items (WS01551) deflated by book value of equity
(WS03501)
Current Ratio Current assets (WS02201) deflated by current liabilities (WS03101)
Operating Cash Flow Net income bottom-line (WS01651) plus depreciation (WS01151) minus change in
current assets (WS02201) plus change in current liabilities (WS03101) deflated
by total debt (WS03255)
Market Capitalisation
Equity Beta
Residual Volatility
Returns Variability
Market value in USD (WS07210)
Estimated from the market model using daily stock returns in each calendar year. The
beta estimates are controlled for nonsynchronous trading effects using the Dimson
(1979) procedure with one leading and lagging value of the market return (market
return is based on MSCI World Index)
The standard error of residuals from the market model
Annual standard deviation of monthly stock returns
This table provides details on the definition of all variables. Worldscope item codes are in parentheses.
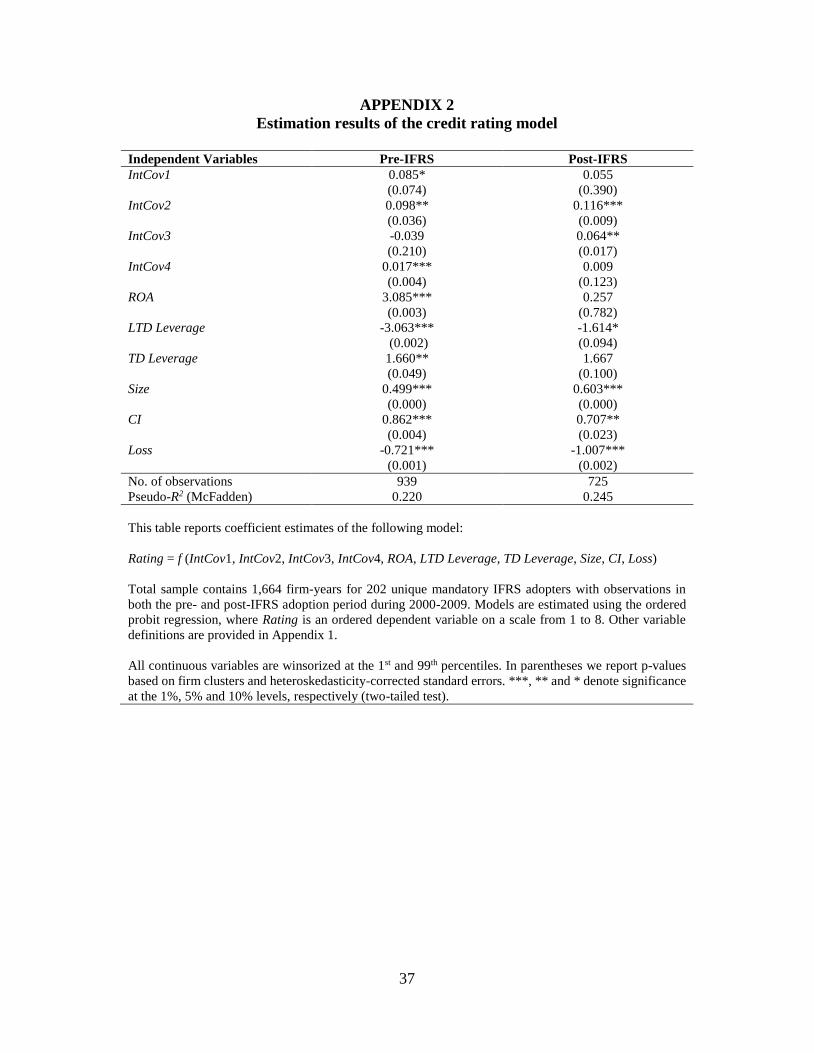
37
APPENDIX 2
Estimation results of the credit rating model
Independent Variables Pre-IFRS Post-IFRS
IntCov1 0.085*
(0.074)
0.055
(0.390)
IntCov2 0.098**
(0.036)
0.116***
(0.009)
IntCov3 -0.039
(0.210)
0.064**
(0.017)
IntCov4 0.017***
(0.004)
0.009
(0.123)
ROA 3.085***
(0.003)
0.257
(0.782)
LTD Leverage -3.063***
(0.002)
-1.614*
(0.094)
TD Leverage 1.660**
(0.049)
1.667
(0.100)
Size 0.499***
(0.000)
0.603***
(0.000)
CI 0.862***
(0.004)
0.707**
(0.023)
Loss -0.721***
(0.001)
-1.007***
(0.002)
No. of observations 939 725
Pseudo-R2 (McFadden) 0.220 0.245
This table reports coefficient estimates of the following model:
Rating = f (IntCov1, IntCov2, IntCov3, IntCov4, ROA, LTD Leverage, TD Leverage, Size, CI, Loss)
Total sample contains 1,664 firm-years for 202 unique mandatory IFRS adopters with observations in
both the pre- and post-IFRS adoption period during 2000-2009. Models are estimated using the ordered
probit regression, where Rating is an ordered dependent variable on a scale from 1 to 8. Other variable
definitions are provided in Appendix 1.
All continuous variables are winsorized at the 1st and 99th percentiles. In parentheses we report p-values
based on firm clusters and heteroskedasticity-corrected standard errors. ***, ** and * denote significance
at the 1%, 5% and 10% levels, respectively (two-tailed test).

38
TABLE 1
Sample formation
Firms Firm-years
S&P database (2000 - 2009) 15,401 -
WS database (2000 - 2009) 45,440 -
Matched firms 3,863 -
Less firms with missing financial data (311) -
Matched firms with required financial data 3,552 26,869
Less firms from countries that do not mandate IFRS (either at all or
in 2005) (2,897) (22,146)
Matched firms with required financial data and from countries that
mandate IFRS in 2005 655 4,723
Less firms/observations with missing credit rating data (23) (1,095)
Matched firms with required financial and credit rating data and from
countries that mandate IFRS in 2005 632 3,628
Less voluntary IFRS adopters (160) (935)
Less firms not switching to IFRS (119) (550)
Less firms using US GAAP (21) (107)
Mandatory IFRS adopters 332 2,036
Less mandatory IFRS adopters without observations in both periods (130) (372)
Final IFRS sample 202 1,664

39
TABLE 2
Sample composition
Panel A: By credit rating
S&P Issuer Credit
Rating Firm-years % Rating InvGrade
AAA 9 0.54 8 Investment
AA+ 20 1.20 7 Investment
AA 34 2.04 7 Investment
AA- 107 6.43 7 Investment
A+ 134 8.05 6 Investment
A 162 9.74 6 Investment
A- 257 15.44 6 Investment
BBB+ 331 19.89 5 Investment
BBB 251 15.08 5 Investment
BBB- 137 8.23 5 Investment
BB+ 69 4.15 4 Speculative
BB 48 2.88 4 Speculative
BB- 47 2.82 4 Speculative
B+ 20 1.20 3 Speculative
B 8 0.48 3 Speculative
B- 16 0.96 3 Speculative
CCC+ 4 0.24 2 Speculative
CCC 8 0.48 2 Speculative
CC 2 0.12 1 Speculative
Total 1,664 100
Panel B: By country
Pre-IFRS Post-IFRS
Country
Firm-
years % Firms Firm-years Firm-years
Australia 338 20.31 40 193 145
Belgium 13 0.78 2 5 8
Denmark 10 0.60 1 6 4
Finland 17 1.02 2 9 8
France 256 15.38 31 145 111
Germany 39 2.34 5 19 20
Ireland 23 1.38 3 12 11
Italy 4 0.24 1 1 3
Netherlands 109 6.55 13 68 41
Norway 29 1.74 4 14 15
Philippines 26 1.56 4 11 15
Poland 7 0.42 1 4 3
Portugal 34 2.04 4 18 16
South Africa 13 0.78 2 5 8
Spain 102 6.13 12 58 44
Sweden 110 6.61 12 65 45
UK 534 32.09 65 306 228
Total 1,664 100 202 939 725

40
Panel C: By industry sector
Pre-IFRS Post-IFRS
Industry Sector
Firm-
years % Firms Firm-years Firm-years
Industrials 1,039 63.53 120 608 431
Transport 88 4.90 11 49 39
Utilities 350 21.16 42 194 156
Financials 187 10.41 29 88 99
Total 1,664 100 202 939 725
Total sample contains 1,664 firm-years for 202 unique mandatory IFRS adopters with
observations in both the pre- and post-IFRS adoption period during 2000-2009. Panel A shows
how ratings are grouped into eight categories to generate the dependent variable Rating. We also
split ratings into investment grade and speculative grade (InvGrade). Panel B reports
composition of the sample by country and shows number of observations in the pre- and post-
IFRS adoption period. Panel C reports composition of the sample by industry sector and reports
number of observations in the pre- and post-IFRS adoption period.

41
TABLE 3
Descriptive statistics Panel A: IFRS firms
Pre-IFRS (N=939) Post-IFRS (N=725) Diff. in
mean
Mean SD P25 Median P75 Mean SD P25 Median P75 p-value
IntCov 6.748 13.670 2.603 4.091 6.931 9.575 18.234 3.286 5.122 8.459 0.000
IntCov1 3.646 1.488 2.603 4.091 5.000 4.067 1.313 3.286 5.000 5.000 -
IntCov2 1.129 1.799 0.000 0.000 1.931 1.591 2.039 0.000 0.122 3.459 -
IntCov3 0.640 2.147 0.000 0.000 0.000 1.176 2.898 0.000 0.000 0.000 -
IntCov4 1.129 8.509 0.000 0.000 0.000 2.288 11.925 0.000 0.000 0.000 -
ROA 0.035 0.064 0.017 0.038 0.063 0.057 0.063 0.026 0.053 0.088 0.000
LTD Leverage 0.268 0.150 0.164 0.252 0.342 0.262 0.159 0.154 0.229 0.346 0.425
TD Leverage 0.347 0.157 0.236 0.341 0.433 0.331 0.167 0.211 0.307 0.430 0.038
Size 15.885 1.384 14.928 15.733 16.745 16.378 1.481 15.414 16.289 17.267 0.000
CI 0.393 0.259 0.179 0.360 0.600 0.360 0.268 0.130 0.308 0.560 0.010
Loss 0.068 0.252 0.000 0.000 0.000 0.036 0.186 0.000 0.000 0.000 0.004
Rating 5.420 0.987 5.000 5.000 6.000 5.292 0.922 5.000 5.000 6.000 0.007
InvGrade 0.880 0.326 1.000 1.000 1.000 0.850 0.358 1.000 1.000 1.000 0.074
Panel B: Matched US firms
Pre-IFRS (N=939) Post-IFRS (N=725) Diff. in
mean
Mean SD P25 Median P75 Mean SD P25 Median P75 p-value
IntCov 8.829 9.999 3.486 5.522 9.849 9.801 11.700 3.513 5.860 11.070 0.068
IntCov1 4.185 1.178 3.486 5.000 5.000 4.157 1.304 3.513 5.000 5.000 -
IntCov2 1.818 2.137 0.000 0.522 4.849 2.008 2.183 0.000 0.860 5.000 -
IntCov3 1.477 3.196 0.000 0.000 0.000 1.767 3.441 0.000 0.000 1.070 -
IntCov4 1.349 5.935 0.000 0.000 0.000 1.870 7.512 0.000 0.000 0.000 -
ROA 0.050 0.051 0.025 0.044 0.074 0.051 0.061 0.026 0.048 0.083 0.493
LTD Leverage 0.283 0.151 0.180 0.264 0.368 0.286 0.169 0.166 0.264 0.364 0.676
TD Leverage 0.330 0.156 0.229 0.317 0.416 0.333 0.172 0.210 0.310 0.416 0.744
Size 15.638 1.331 14.647 15.541 16.624 16.089 1.276 15.132 16.078 17.068 0.000
CI 0.408 0.254 0.193 0.371 0.603 0.401 0.274 0.166 0.338 0.634 0.620
Loss 0.045 0.207 0.000 0.000 0.000 0.039 0.193 0.000 0.000 0.000 0.539
Rating 5.279 0.911 5.000 5.000 6.000 5.206 0.901 5.000 5.000 6.000 0.101
InvGrade 0.880 0.326 1.000 1.000 1.000 0.850 0.358 1.000 1.000 1.000 0.074

42
Panel C: US population
Pre-IFRS (N=5,924) Post-IFRS (N=4,254) Diff. in
mean
Mean SD P25 Median P75 Mean SD P25 Median P75 p-value
IntCov 7.325 11.848 2.279 3.952 7.361 9.075 13.939 2.553 4.699 9.666 0.000
IntCov1 3.523 1.576 2.279 3.952 5.000 3.721 1.580 2.553 4.699 5.000 -
IntCov2 1.278 1.968 0.000 0.000 2.361 1.684 2.151 0.000 0.000 4.666 -
IntCov3 1.072 2.829 0.000 0.000 0.000 1.566 3.293 0.000 0.000 0.000 -
IntCov4 1.674 9.006 0.000 0.000 0.000 2.426 11.013 0.000 0.000 0.000 -
ROA 0.021 0.095 0.005 0.032 0.060 0.020 0.115 0.008 0.036 0.070 0.835
LTD Leverage 0.329 0.209 0.188 0.299 0.431 0.306 0.211 0.157 0.269 0.411 0.000
TD Leverage 0.380 0.215 0.238 0.350 0.484 0.351 0.221 0.200 0.317 0.461 0.000
Size 14.924 1.406 13.893 14.752 15.881 15.277 1.447 14.276 15.153 16.225 0.000
CI 0.380 0.263 0.159 0.329 0.586 0.347 0.271 0.115 0.279 0.557 0.000
Loss 0.147 0.354 0.000 0.000 0.000 0.119 0.324 0.000 0.000 0.000 0.000
Rating 4.569 1.212 4.000 5.000 5.000 4.466 1.182 4.000 5.000 5.000 0.000
InvGrade 0.536 0.499 0.000 1.000 1.000 0.505 0.500 0.000 1.000 1.000 0.002
Total sample contains 1,664 firm-years for 202 unique mandatory IFRS adopters with observations in both the pre- and post-IFRS adoption period during 2000-
2009. Panels A, B and C report descriptive statistics for mandatory IFRS adopters, matched and all US firms, respectively, for the pre- and post-IFRS adoption
period separately and the test of the difference in means. We report exact levels of significance of a two-sided test. For each year over the 2000-2009 period
we match each mandatory adopter to a US firm in the same credit rating category (i.e. investment/speculative), same industry sector and year and of similar
size, measured by equity market value. All continuous variables are winsorized at the 1st and 99th percentiles. Variable definitions are provided in Appendix 1.

43
TABLE 4
Credit relevance before and after mandatory IFRS adoption
IFRS vs. US
Panel A: IFRS vs. matched US sample
Sample Pre-IFRS
(a)
Post-IFRS
(b)
(b)-(a)
IFRS firms (i) 0.220
(N=939)
0.245
(N=725)
0.025
US firms (ii) 0.240
(N=939)
0.249
(N=725)
0.009
(i)-(ii) -0.020 -0.004 0.016
Panel B: IFRS vs. US population
Sample Pre-IFRS
(a)
Post-IFRS
(b)
(b)-(a)
IFRS firms (i) 0.220
(N=939)
0.245
(N=725)
0.025
US firms (ii) 0.263
(N=5,924)
0.265
(N=4,254)
0.002
(i)-(ii) -0.043 -0.020 0.023
This table reports McFadden's pseudo-R2 as the credit relevance metric of estimated models. Total sample
contains 1,664 firm-years for 202 unique mandatory IFRS adopters with observations in both the pre- and post-
IFRS adoption period during 2000-2009. For each year over the 2000-2009 period we match each mandatory
adopter to a US firm in the same credit rating category (i.e. investment/speculative), same industry sector and
year and of similar size, measured by equity market value.
All models are estimated using the ordered probit regression, where Rating is an ordered dependent variable on
a scale from 1 to 8. Other variable definitions are provided in Appendix 1. Models are estimated separately for
the pre- and post-IFRS adoption period and are of the form:
Rating = f (IntCov1, IntCov2, IntCov3, IntCov4, ROA, LTD Leverage, TD Leverage, Size, CI, Loss)
All continuous variables are winsorized at the 1st and 99th percentiles. All models are estimated with White
standard errors adjusted to account for correlation within firm clusters.

44
TABLE 5
Credit relevance before and after mandatory IFRS adoption
Selected robustness analyses
Panel A: Employ the population of Canadian and Japanese firms as alternative benchmark samples
Sample Pre-IFRS
(a)
Post-IFRS
(b)
(b)-(a)
IFRS firms (i) 0.220
(N=939)
0.245
(N=725)
0.025
Canadian firms (ii) 0.301
(N=451)
0.291
(N=352)
-0.010
(i)-(ii) -0.081 -0.046 0.035
Japanese firms (iii) 0.196
(N=977)
0.133
(N=641)
-0.063
(i)-(iii) 0.024 0.112 0.088
Panel B: Include market-based variables
Sample Pre-IFRS
(a)
Post-IFRS
(b)
(b)-(a)
IFRS (i) 0.266
(N=893)
0.299
(N=621)
0.033
US matched (ii) 0.294
(N=893)
0.281
(N=621)
-0.013
(i)-(ii) -0.028 0.018 0.046
Panel C: Estimate the McKelvey and Zavoina pseudo-R2
Sample Pre-IFRS
(a)
Post-IFRS
(b)
(b)-(a)
IFRS firms (i) 0.500
(N=939)
0.529
(N=725)
0.029
US firms (ii) 0.521
(N=939)
0.530
(N=725)
0.009
(i)-(ii) -0.021 -0.001 0.020
Panel D: Estimate the Rank Probability Score
Sample Pre-IFRS
(a)
Post-IFRS
(b)
(b)-(a)
IFRS firms (i) 0.353
(N=939)
0.326
(N=725)
0.027
US firms (ii) 0.320
(N=939)
0.315
(N=725)
0.005
(i)-(ii) -0.033 -0.011 0.022

45
Panel E: Restrict sample period to 2000-2007
Sample Pre-IFRS
(a)
Post-IFRS
(b)
(b)-(a)
IFRS firms (i) 0.220
(N=939)
0.256
(N=505)
0.036
US firms (ii) 0.240
(N=939)
0.243
(N=505)
0.003
(i)-(ii) -0.020 0.013 0.033
Panel F: Measure credit ratings three months after fiscal year-end
Sample Pre-IFRS
(a)
Post-IFRS
(b)
(b)-(a)
IFRS firms (i) 0.233
(N=939)
0.247
(N=725)
0.014
US firms (ii) 0.243
(N=939)
0.251
(N=725)
0.008
(i)-(ii) -0.010 -0.004 0.006
This table presents selected analyses assessing the robustness of findings reported in Table 4. For each year over
the 2000-2009 period we match each mandatory adopter to a US firm in the same credit rating category (i.e.
investment/speculative), same industry sector and year and of similar size, measured by equity market value.
All models are estimated using the ordered probit regression, where Rating is an ordered dependent variable on
a scale from 1 to 8. Other variable definitions are provided in Appendix 1. Models are estimated separately for
the pre- and post-IFRS adoption period and are of the form:
Rating = f (IntCov1, IntCov2, IntCov3, IntCov4, ROA, LTD Leverage, TD Leverage, Size, CI, Loss)
All continuous variables are winsorized at the 1st and 99th percentiles. All models are estimated with White
standard errors adjusted to account for correlation within firm clusters.
In Panel B we include market-based variables, namely Equity Beta, Residual Volatility and Returns Variability.
In Panels C and D, we employ two alternative goodness of fit measures of credit relevance, namely the McKelvey
and Zavoina pseudo-R2and the Rank Probability Score (RPS), respectively. The RPS measures the accuracy of
probability estimates when the response variable has more than two categories; lower values imply higher
prediction accuracy. For easier interpretation of results, we multiple differences in RPS by -1.

46
TABLE 6
Credit relevance before and after mandatory IFRS adoption
Investment-grade vs. speculative-grade firms
Sample Pre-IFRS
(a)
Post-IFRS
(b)
(b)-(a)
Investment-grade (i) 0.181
(N=826)
0.230
(N=616)
0.049
Speculative-grade (ii) 0.208
(N=113)
0.308
(N=109)
0.100
(ii)-(i) 0.027 0.078 0.051
This table reports McFadden's pseudo-R2 as the credit relevance metric of estimated models. Total sample contains
1,664 firm-years for 202 unique mandatory IFRS adopters with observations in both the pre- and post-IFRS
adoption period during 2000-2009. Investment grade firms are rated BBB- or above.
All models are estimated using the ordered probit regression, where Rating is an ordered dependent variable on a
scale from 1 to 8. Other variable definitions are provided in Appendix 1. Models are estimated separately for the
pre- and post-IFRS adoption period and are of the form:
Rating = f (IntCov1, IntCov2, IntCov3, IntCov4, ROA, LTD Leverage, TD Leverage, Size, CI, Loss)
All continuous variables are winsorized at the 1st and 99th percentiles. All models are estimated with White standard
errors adjusted to account for correlation within firm clusters.

47
TABLE 7
Credit relevance at the time of mandatory IFRS adoption
Small vs. large first-time IFRS reconciliations
Panel A: Total extreme reconciliations
Range No. observations (%)
0 16 (7.92)
1 32 (15.84)
2 37 (18.32)
3 28 (13.86)
4 40 (19.80)
5 32 (15.84)
6 17 (8.42)
Panel B: Descriptive statistics
Small (N=113) Large (N=89)
Mean Median SD Mean Median SD
IntCov 1.350 0.495 2.440 1.967 1.124 2.823
ROA 0.012 0.006 0.018 0.022 0.011 0.026
LTD
Leverage
0.009 0.004 0.017 0.032 0.023 0.029
TD Leverage 0.005 0.003 0.005 0.027 0.019 0.028
Size 0.015 0.013 0.012 0.079 0.068 0.072
CI 0.011 0.006 0.015 0.030 0.024 0.030
Panel C: Pre-IFRS vs. post-IFRS period
Sample Pre-IFRS
(a)
Post-IFRS
(b)
(b)-(a)
Small reconciliations (i) 0.295
(N=501)
0.285
(N=394)
-0.010
Large reconciliations (ii) 0.167
(N=438)
0.216
(N=331)
0.049
(ii)-(i) -0.128 -0.069 0.059
Panel D: Local GAAP vs. IFRS-restated accounting factors
Sample Local GAAP
(a)
IFRS-restated
(b)
(b)-(a)
Small reconciliations (i) 0.296
(N=113)
0.291
(N=113)
-0.005
Large reconciliations (ii) 0.211
(N=89)
0.267
(N=89)
0.056
(ii)-(i) -0.085 -0.024 0.061

48
Panel E: Local GAAP vs. IFRS-restated accounting factors for each reconciliation
Variables Small reconciliations (i) Large reconciliations (ii) (ii)-(i)
IntCov -0.002 0.030 0.032
ROA -0.001 0.022 0.023
LTD Leverage 0.018 0.013 -0.005
TD Leverage -0.004 0.034 0.038
Size 0.002 0.058 0.056
CI -0.003 0.038 0.041
Total sample contains 1,664 firm-years for 202 unique mandatory IFRS adopters with observations in both the pre-
and post-IFRS adoption period during 2000-2009. Firm-level reconciliations are measured as (Local GAAP
accounting item - IFRS restated accounting item). Panel A describes the distribution of Total Extreme
Reconciliations, which is a categorical variable equal to the sum of six binary indicators (one for each accounting
factor used in the credit rating model); each indicator takes the value of 1 if the reconciliation is extreme, i.e. it is
in the top or bottom 25 percent, and 0 otherwise. Total Extreme Reconciliations may range from 0 (i.e. the firm
reports no extreme reconciliations at all) to 6 (i.e. the firm reports extreme reconciliations for all six accounting
variables). We classify a firm as having large (small) reconciliations if Total Extreme Reconciliations is equal to
or higher than 4 (lower than 4). Panel B reports descriptive statistics of the absolute values of accounting item
reconciliations for small and large firm-level reconciliation sub-samples. All actual reconciliations are winsorized
at the 1st and 99th percentiles.
Panels C, D and E report McFadden's pseudo-R2 as the credit relevance metric of estimated models. In Panel C we
estimate the credit rating model in the pre- and post-IFRS period separately. In Panel D we focus on the last year
prior to IFRS adoption and run the credit rating model using local GAAP and IFRS-restated accounting variables
separately. In Panel E we repeat the analysis reported in Panel D for each reconciliation separately and we present
the difference in McFadden's pseudo-R2 between IFRS-restated and Local GAAP for small (i) and large (ii)
reconciliations.
All models are estimated using the ordered probit regression, where Rating is an ordered dependent variable on a
scale from 1 to 8. Other variable definitions are provided in Appendix 1. Estimated models are of the form:
Rating = f (IntCov1, IntCov2, IntCov3, IntCov4, ROA, LTD Leverage, TD Leverage, Size, CI, Loss)
All continuous variables are winsorized at the 1st and 99th percentiles. All models are estimated with White standard
errors adjusted to account for correlation within firm clusters.