Embed Size (px)
Citation preview

Company Registration No. 08271384
ANNINGTON LIMITED
Half-Year
Condensed Consolidated Financial Statements
For the six months ended 30 September 2018
ANNINGTON LIMITED
HALF-YEAR CONDENSED CONSOLIDATED FINANCIAL STATEMENTS FORTHE SIX MONTHS ENDED 30 SEPTEMBER 2018
CONTENTS Page
Half-year results 1
Financial statements 4
Condensed consolidated income statement 4
Condensed consolidated statement of comprehensive income 4
Condensed consolidated balance sheet 5
Condensed consolidated statement of changes in equity 6
Condensed consolidated cash flow statement 7
Notes to the condensed consolidated financial statements 8
Directors’ responsibility statement 18
NOTE ON FORWARD LOOKING STATEMENTS
This Financial Report contains various forward-looking statements. These forward-looking statements reflect currentviews with respect to future events and anticipated financial and operational performance. Forward-looking statementsas a general matter are all statements other than statements as to historical facts or present facts or circumstances.Forward-looking statements are sometimes, but not always, identified by their use of the words “aim”, “anticipate”,“assume”, “believe”, “contemplate”, “continue”, “could”, “estimate”, “expect”, “forecast”, “intend”, “likely”, “may”,“might”, “plan”, “positioned”, “potential”, “predict”, “project”, “remain”, “should”, “will” or “would”, or, in each case,their negative, or similar expressions. Other forward-looking statements can be identified in the context in which thestatements are made.
By their nature, forward-looking statements involve known and unknown risks, uncertainties and other factors becausethey relate to events and depend on circumstances that may or may not occur in the future. Forward-looking statementsare not guarantees of future performance. Many of these factors are beyond the control of the Group and are not possibleto estimate precisely. Because these forward-looking statements are based on assumptions or estimates and are subjectto risks and uncertainties, the actual results or outcome could differ materially from those set out in the forward-lookingstatements. Readers are cautioned not to place undue reliance on such forward-looking statements, which speak only asof the date of this Report.
We expressly undertake no obligation to publicly update or revise any forward-looking statements, whether as a resultof new information, future events or otherwise, other than as required by law or regulation. Accordingly, prospectiveinvestors are cautioned not to place undue reliance on any of the forward-looking statements herein. In addition, allsubsequent written and oral forward-looking statements attributable to or made on behalf of Annington Limited areexpressly qualified in their entirety.

1
ANNINGTON LIMITED
HALF-YEAR RESULTSFor the six months ended 30 September 2018
FINANCIAL HIGHLIGHTS
The carrying value of Group investment properties is £7.1 billion (31 March 2018: £7.1 billion). At30 September 2018, the Group owned 40,453 units (31 March 2018: 40,348 units).
Rental income was £98.5 million (30 September 2017: £96.2 million).
Profit after taxation was £33.8 million (30 September 2017: Loss after taxation £862.7 million).
The Group made progress in growing its private rented sector (“PRS”) offering, with 111 homes added to theportfolio during the first half of the financial year.
Portfolio Summary
At 30 September 2018 the Group’s investment properties consisted of:
• the MQE Retained Estate, comprising 38,966 Units (“Retained Units”) (31 March 2018: 38,969) and181 Related Assets (31 March 2018: 181), representing the majority of the Ministry of Defence's (“MoD”)total Service Family Accommodation, and the MQE Surplus Estate totalling 12 Units (“Surplus Units”)(31 March 2018: 120); and
• the “Non-MQE Portfolio”, a separate property portfolio of PRS accommodation which, as at 30 September2018, consisted of 1,475 (31 March 2018: 1,365) property units let on bulk or assured shorthold tenancies.
As of 30 September 2018, the carrying value of the Group’s portfolio was:
• the MQE Retained Estate was £6,761.3 million (31 March 2018: £6,761.7 million), including £39.7 million(31 March 2018: £39.7 million) relating to the separately recorded utilities provision added back to fairvalue within the book value;
• the MQE Surplus Estate was £5.1 million (31 March 2018: £8.5 million); and
• the Non-MQE Portfolio was £381.5 million (31 March 2018: £334.7 million).
To take account of changes in value of the MQE Retained Estate’s underlying assets, the Group uses a SpecialAssumption of Vacant Possession Value (“SAVPV”). This measure is used to help gauge whether the Group hasbeen achieving reasonable value upon disposal of units released from the MQE Retained Estate and to providemanagement with a basis upon which to calculate an estimated value for the Retained Estate and potential value tobe realised from future sales. SAVPV is defined by the Group as the value estimated for a property based on thehypothetical assumption that each such property is vacant, sold on an individual basis with no costs on disposaland introduced to the market in a phased and orderly manner, such that local markets do not become over-supplied and values are not depressed as a result.
SAVPV is calculated by the Group by indexing the SAVPV estimated at the time of the Group’s initial acquisitionof the portfolio in 1996 for inflation, using the average of the regional Halifax House Price Index (All HousePrices) and the Nationwide House Price Index and adjusting this by a factor representing actual sales performanceon disposals from the MQE Retained Estate (99.9% at both March and September 2018). At 30 September 2018,the SAVPV of the MQE Retained Estate is:
30 September 2018 31 March 2018
Number SAVPV Number SAVPVRegion of units £’000 of units £’000East Anglia 3,026 558,434 3,029 540,946East Midlands 2,496 393,383 2,496 390,369Greater London 1,958 1,090,849 1,958 1,056,094North 395 47,047 395 48,285North West 509 64,232 509 61,089South East 15,439 4,374,041 15,439 4,269,146South West 9,575 1,906,747 9,575 1,843,534Wales 851 137,096 851 130,929West Midlands 1,625 259,422 1,625 252,020Yorks & Humberside 3,092 463,345 3,092 457,096Total 38,966 9,294,596 38,969 9,049,508

2
ANNINGTON LIMITED
HALF-YEAR RESULTSFor the six months ended 30 September 2018 (continued)
Market Environment
Although there was growth in house prices during FY 2017/18, as at March 2018 there was a growing consensusthat annual house price growth was beginning to slow, particularly in London and the South East.
In the period from March to September, the situation has remained much the same, with Brexit concerns adding tothe caution in the market. The trend of slowing house price growth is evident across all main measures of houseprice inflation. Statistics released by Land Registry in November show annual house price growth as 3.5% atSeptember 2018 vs 4.6% the year before. Nationwide reports an annual growth rate of 2.0% in September 2018.In the period from October to December average asking prices fell by 3.2% according to Rightmove, whichshowed price drops of 1.7% and 1.5% in November and December respectively. The overall decline across thequarter demonstrates the same directional trend as the UK equity market, supporting the position that Brexituncertainty is having an impact on market sentiment.
Regional variation has persisted with growth strongest in the East Midlands, Wales and Yorkshire & the Humberwhile London has fared the worst, with values down 2.2% across 2018.
The RICS, in its UK Residential Market Survey, noted a drop off in buyer demand as buyers struggled withaffordability, deposits, and apprehension of rising interest rates. The limited choice of properties for sale has alsocontributed to a lack of buyer interest as stock levels are reported to be close to record lows. New instructions andenquiries continued to fall in December, reaching their lowest levels since the immediate aftermath of the Brexitvote. Brexit is the most cited cause (RICS survey) for reduced activity, and housing market uncertainty is likelycontinue until some clarity emerges.
Turning to the lettings market, the Office of National Statistics reports that annual rental price growth for the UKwas 0.9% in September. While London private rental prices fell 0.2% over the year to September 2018, otherregions fared better, with annual increases of 2.9% in the East Midlands and 1.9% in the South West and the Eastof England.
Operational Strategy
During the 2018 financial year, only two Married Quarters Estate units were released to Annington. This is thelowest number of units released in any financial year during Annington’s history. However, in the periodsubsequent to 31 March 2018, we received notices to terminate the leases on 243 MQE units. To date, one ofthese has been released and sold and a further two have been released and demolished, with the remainder to bereleased in the period to March 2019. Notwithstanding this, we expect the trend of lower volumes of propertyreleases, as seen over the last five years, to continue in the short term.
It was recently announced that the MoD’s pilot of the Future Accommodation Model, a new way of providingliving accommodation to personnel and their families which increases opportunities for home ownership andprivate rental, has been delayed from this year to the end of 2019. Whilst it had been considered that this pilotmight have been able to provide some insight into the potential for future releases, this delay means that outcomesfrom this trial will not be available in the near term.
In the meantime, we continue to prepare for the Site Review and are currently in talks with the MoD around thepractical aspects of conducting this exercise. Throughout this process, we remain focused on securing a positiveoutcome in December 2021 for all stakeholders, including military families and our shareholders.
Our PRS offering has expanded since the year end to include 73 homes purchased under a developmentagreement, through which acquisitions are phased based on completed properties. To date, 35 homes have beencompleted and transferred to our PRS portfolio.
Further, in May 2018, the Group completed the purchase of 104 homes from the Mill Group. These units wereacquired pre-let, providing an income stream from the point of purchase.
Most recently, the first block of 54 units at Pinn Point in Uxbridge has been completed and has been madeavailable to rent. Two further blocks are scheduled for completion during the next six months, taking the totalnumber of units on the site to 207.
At our key development site at Brize Norton, following completion of the Highways Agreement, there has beensignificant progress on site in the half-year. The first completions remain scheduled for May 2019.

3
ANNINGTON LIMITED
HALF-YEAR RESULTSFor the six months ended 30 September 2018 (continued)
Financial Performance
The Group’s net rental income increased by 2.4%, or £2.2 million, from £93.8 million for the six months ended30 September 2017 to £96.0 million for the six months ended 30 September 2018. This is partially due to anincrease in rent after the December 2017 rent review, but is also a reflection of the expansion of our PRS offering.Property operating expenses, on the whole, remained stable in the first six months of the year compared to thesame period in 2017. Property operating expenses comprise the direct operating expenses incurred in connectionwith the conduct and operation of the business. These include refurbishment costs incurred (net of dilapidationincome) in connection with released units (including raw materials, labour costs and professional fees), marketingand property holding costs.
The Group made an operating profit of £97.5 million in the six months ended 30 September 2018, compared to aloss of £95.4 million for the six months ended 30 September 2017. This reflects the impact of the unrealisedlosses on the revaluation of investment properties recognised in the income statement in 2017. This valuation wasperformed outside the normal course of business and no valuation was performed for the six months ended30 September 2018.
Finance costs have decreased significantly in the six months ended 30 September 2018, compared to the sixmonths ended 30 September 2017, which included £834.7 million in costs related to the redemption of the debtthat existed at the time of the July 2017 refinancing. Ongoing financing costs are also significantly lower thanthose that would have existed under the legacy debt structure.
The Group ended the half-year to September 2018 with a profit after tax of £33.8 million (September 2017: loss of£862.7 million) and reflects a return to more “normalised” circumstances, without the distorting effects of arefinancing and an additional investment property revaluation.
Outlook
The overall picture for house prices remains subdued. Market direction will depend on how broader economicconditions evolve, especially in the labour market, but also with respect to interest rates and on the Brexit outcomeand any resulting clarity on the impact on the UK Economy.
In the short term, the RICS expects a fall in national house price inflation, with the twelve month outlook broadlyflat. Transaction volumes are likely to remain low while we wait for some clarity of the direction of the countryafter 28 March 19.
Savills predicts that the North-South house price divide will reverse in the next five years as property values risefaster in northern England, Wales and Scotland than those across London. House prices are expected to increaseby 14.8% nationally from 2019 to 2023, though regionally they will vary from 4.5% in London to 21.6% in theNorth West.
The continuing uncertainty surrounding Brexit and the possible economic impact this may have, has required amore cautious approach to our investment strategy. We anticipate this to continue at least through to the end ofMarch, but we will remain focused on actively managing the Group's current operations and developments. Wewill continue to manage tenancies and rental levels, and assess potential options to enhance value, includingrefurbishment, redevelopment and disposal.
In terms of the MQE Portfolio, the first Site Review will remain a key focus area for management. Our ongoingtalks with the MoD around the practical aspects of conducting the site review remain high on our agenda, so thatthe process for completing the site review is clear on both sides and the Site Review can be completed asefficiently as possible, securing a positive outcome for all stakeholders.

4
ANNINGTON LIMITED
CONDENSED CONSOLIDATED INCOME STATEMENTFor the six month period ended 30 September 2018
Six months ended
Note
30 September2018
(unaudited)£’000
30 September2017
(unaudited)£’000
Property rental income 5 98,479 96,208Property operating expenses 5 (2,498) (2,450)
Net rental income 95,981 93,758
Other operating income 2,987 37Administrative expenses (6,125) (8,264)Other operating expenses (394) -Utilities provision (expense)/release 8 (50) 295Unrealised property revaluation losses 5 - (191,881)Profit on disposal of property assets 1,282 3,414Share of results of joint ventures after taxation 6 495 7,201Reversal of impairment of joint ventures 3,306 -
Operating profit/(loss) 2 97,482 (95,440)
Finance income 3 257 2,355Finance costs 3 (56,682) (952,611)
Profit/(loss) before taxation 41,057 (1,045,696)
Taxation 4 (7,226) 182,991
Profit/(loss) for the period after taxation 33,831 (862,705)
Profit/(loss) attributable to shareholder 33,831 (862,705)
CONDENSED CONSOLIDATED STATEMENT OF COMPREHENSIVE INCOMEFor the six month period ended 30 September 2018
Six months ended
Note
30 September2018
(unaudited)£’000
30 September2017
(unaudited)£’000
Profit/(loss) for the period 33,831 (862,705)Items that may subsequently be recycled throughthe income statementFair value gains on cash flow hedge 9 11,060 4,189Reclassification of fair value gains included in profitand loss (8,525) (2,381)
Total other comprehensive income 2,535 1,808
Total comprehensive income/(loss) for the period 36,366 (860,897)
Total comprehensive income/(loss) attributable toshareholder 36,366 (860,897)

5
ANNINGTON LIMITED
CONDENSED CONSOLIDATED BALANCE SHEETAt 30 September 2018
Note
30 September2018
(unaudited)£’000
31 March2018
(audited)£’000
Non-current assetsInvestment properties 5 7,146,795 7,102,224Plant and equipment 223 217Investment in joint ventures 6 11,552 14,198Derivative financial instruments 9 14,619 3,559
7,173,189 7,120,198
Current assetsInventory 7,527 5,732Trade and other receivables 1,347 607Cash, cash equivalents and restricted cash 151,176 156,607
160,050 162,946
Investment properties held for sale 5 1,024 2,711
Total assets 7,334,263 7,285,855
Current liabilitiesTrade and other payables (68,004) (73,773)Provisions 8 (7,422) (3,635)
(75,426) (77,408)
Non-current liabilitiesOther payables (74) (202)Loans and borrowings 7 (3,387,226) (3,377,499)Deferred tax 4 (581,895) (574,561)Provisions 8 (33,119) (36,028)
(4,002,314) (3,988,290)
Total liabilities (4,077,740) (4,065,698)
Net assets 3,256,523 3,220,157
Capital and reservesShare capital 84,756 84,756Share premium 480,401 480,401Merger reserve (10,000) (10,000)Hedging reserve 3,034 499Retained earnings 2,698,332 2,664,501
Total equity 3,256,523 3,220,157
The accompanying notes (1 to 12) should be read in conjunction with these financial statements.

6
ANNINGTON LIMITED
CONDENSED CONSOLIDATED STATEMENT OF CHANGES IN EQUITYFor the six month period ended 30 September 2018
Sharecapital
£’000
Sharepremium
£’000
Mergerreserve
£’000
Hedgingreserve
£’000
Retainedearnings
£’000
Totalequity£’000
At 1 April 2017 84,756 - (10,000) - 3,724,303 3,799,059Total comprehensive income/(loss)for the period - - - 1,808 (862,705) (860,897)Share issue - 480,401 - - - 480,401
At 30 September 2017 (unaudited) 84,756 480,401 (10,000) 1,808 2,861,598 3,418,563
At 1 April 2018 84,756 480,401 (10,000) 499 2,664,501 3,220,157Total comprehensive income for theperiod - - - 2,535 33,831 36,366
At 30 September 2018 (unaudited) 84,756 480,401 (10,000) 3,034 2,698,332 3,256,523

7
ANNINGTON LIMITED
CONDENSED CONSOLIDATED CASH FLOW STATEMENTFor the six month period ended 30 September 2018
Six months ended
Note
30 September2018
(unaudited)£’000
30 September2017
(unaudited)£’000
Net cash from operating activities 11 83,213 72,128Tax paid 108 -
Net cash inflow from operating activities 83,321 72,128
Investing activitiesProceeds from sale of property assets 5,578 13,731Purchase of property assets 5 (47,180) (1,363)Purchase of plant and equipment (24) (22)Distributions from joint ventures 6 5,447 -Loan repayments from joint ventures 6 1,000 6,475Interest received 257 23
Net cash (outflow)/inflow from investing activities (34,922) 18,844
Financing activitiesIssue of share capital - 164,000Increase in borrowings 7 - 3,376,189Repayment of borrowings 7 - (3,461,956)Purchase of offsetting swaps - (24,544)Interest and other financing costs (53,831) (116,771)
Net cash outflow from financing activities (53,831) (63,082)
Net (decrease)/increase in cash and cash equivalents (5,432) 27,890Cash and cash equivalents at the beginning of the period 156,607 131,421Exchange differences on cash and cash equivalents 1 -
Cash and cash equivalents at the end of theperiod 151,176 159,311
8
ANNINGTON LIMITED
NOTES TO THE CONDENSED CONSOLIDATED FINANCIAL STATEMENTSFor the six months ended 30 September 2018
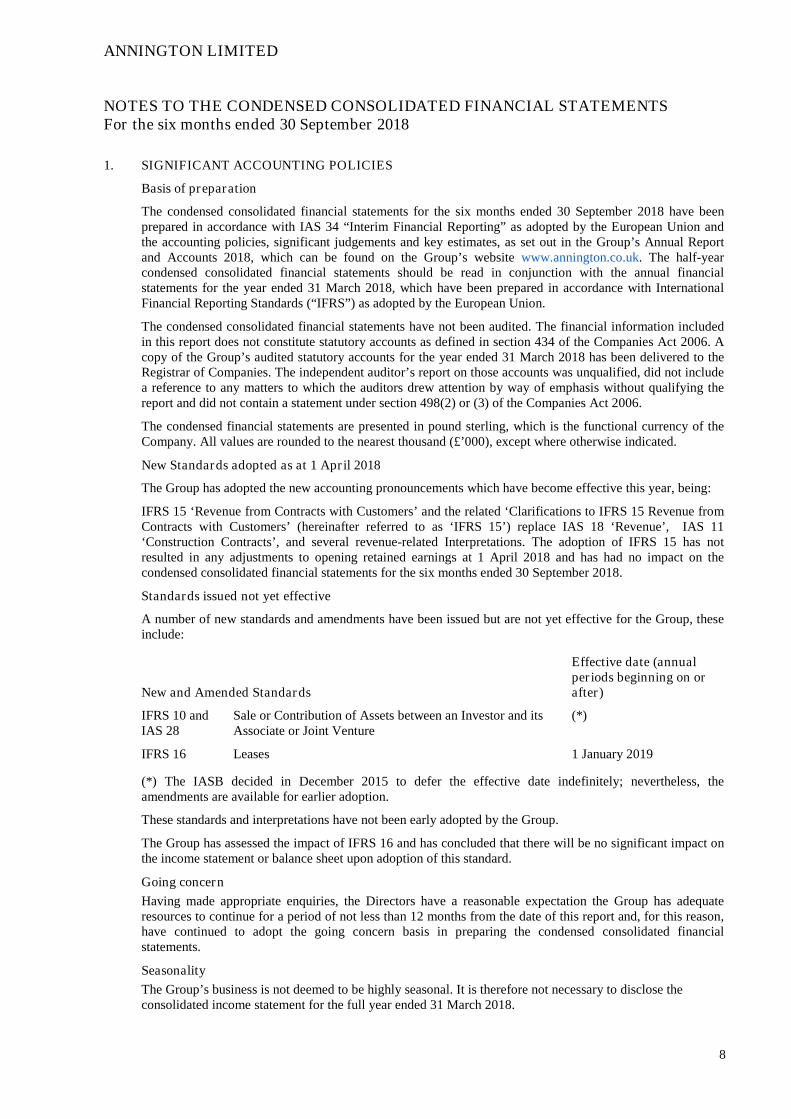
1. SIGNIFICANT ACCOUNTING POLICIES
Basis of preparation
The condensed consolidated financial statements for the six months ended 30 September 2018 have beenprepared in accordance with IAS 34 “Interim Financial Reporting” as adopted by the European Union andthe accounting policies, significant judgements and key estimates, as set out in the Group’s Annual Reportand Accounts 2018, which can be found on the Group’s website www.annington.co.uk. The half-yearcondensed consolidated financial statements should be read in conjunction with the annual financialstatements for the year ended 31 March 2018, which have been prepared in accordance with InternationalFinancial Reporting Standards (“IFRS”) as adopted by the European Union.
The condensed consolidated financial statements have not been audited. The financial information includedin this report does not constitute statutory accounts as defined in section 434 of the Companies Act 2006. Acopy of the Group’s audited statutory accounts for the year ended 31 March 2018 has been delivered to theRegistrar of Companies. The independent auditor’s report on those accounts was unqualified, did not includea reference to any matters to which the auditors drew attention by way of emphasis without qualifying thereport and did not contain a statement under section 498(2) or (3) of the Companies Act 2006.
The condensed financial statements are presented in pound sterling, which is the functional currency of theCompany. All values are rounded to the nearest thousand (£’000), except where otherwise indicated.
New Standards adopted as at 1 April 2018
The Group has adopted the new accounting pronouncements which have become effective this year, being:
IFRS 15 ‘Revenue from Contracts with Customers’ and the related ‘Clarifications to IFRS 15 Revenue fromContracts with Customers’ (hereinafter referred to as ‘IFRS 15’) replace IAS 18 ‘Revenue’, IAS 11‘Construction Contracts’, and several revenue-related Interpretations. The adoption of IFRS 15 has notresulted in any adjustments to opening retained earnings at 1 April 2018 and has had no impact on thecondensed consolidated financial statements for the six months ended 30 September 2018.
Standards issued not yet effective
A number of new standards and amendments have been issued but are not yet effective for the Group, theseinclude:
New and Amended Standards
Effective date (annualperiods beginning on orafter)
IFRS 10 andIAS 28
Sale or Contribution of Assets between an Investor and itsAssociate or Joint Venture
(*)
IFRS 16 Leases 1 January 2019
(*) The IASB decided in December 2015 to defer the effective date indefinitely; nevertheless, theamendments are available for earlier adoption.
These standards and interpretations have not been early adopted by the Group.
The Group has assessed the impact of IFRS 16 and has concluded that there will be no significant impact onthe income statement or balance sheet upon adoption of this standard.
Going concern
Having made appropriate enquiries, the Directors have a reasonable expectation the Group has adequateresources to continue for a period of not less than 12 months from the date of this report and, for this reason,have continued to adopt the going concern basis in preparing the condensed consolidated financialstatements.
Seasonality
The Group’s business is not deemed to be highly seasonal. It is therefore not necessary to disclose theconsolidated income statement for the full year ended 31 March 2018.

9
ANNINGTON LIMITED
NOTES TO THE CONDENSED CONSOLIDATED FINANCIAL STATEMENTSFor the six months ended 30 September 2018 (continued)
2. OPERATING PROFIT/(LOSS)
Operating profit for the period includes £18,000 of depreciation (2017: £ 10,000).
3. FINANCE INCOME AND COSTS
Six months ended30 September
2018(unaudited)
£’000
30 September2017
(unaudited)£’000
Finance incomeInterest receivable 257 825Fair value gain on interest rate swaps - 1,530
Total finance income 257 2,355
Finance costsInterest payable on secured floating and fixed rate notes 49,082 64,757Amortisation of discount and issue costs and finance expenses 1,202 36,479Interest payable on bank loans 4,514 3,276Foreign exchange losses on financing 8,525 2,381Transfer from equity for cash flow hedge (8,525) (2,381)Unwinding of discount of provision 1,181 3,754Bond redemption costs - 834,663Debt issue costs - 8,415Other finance expenses 703 1,267
Total finance costs 56,682 952,611
4. TAXATION
The Group has estimated the effective annual tax rate in each jurisdiction in which it is taxed. The effectivetax rate for the interim period is calculated with reference to the anticipated operations and result of theGroup for the full tax year. Any known adjustments to the opening figure, based on additional workperformed on the closing tax losses reported in the preceding annual report and accounts, are also reflected inthe movement for the period.
Within the United Kingdom, the Group’s effective tax rate has been assessed as 17.6%.
Deferred tax assets and liabilities are offset where the Group is permitted to do so. The following is ananalysis of the deferred tax balances:
30 September2018
(unaudited)£’000
31 March2018
(audited)£’000
Deferred tax liabilities (791,946) (791,946)Deferred tax assets 210,051 217,385
Net deferred tax liabilities (581,895) (574,561)

10
ANNINGTON LIMITED
NOTES TO THE CONDENSED CONSOLIDATED FINANCIAL STATEMENTSFor the six months ended 30 September 2018 (continued)
5. INVESTMENT PROPERTIES
In accordance with the Group’s accounting policy on investment properties, the fair value of these assets aredetermined annually at the Group’s financial year end, 31 March. Therefore, for the condensed consolidatedfinancial statements ended 30 September 2018 (covering a period other than a full financial year), a valuationwas not obtained and the previous year end carrying value for investment properties, reflecting fair value atthat date, is adjusted for acquisitions and disposals in the period.
30 September 2018(unaudited)
Investmentproperties
£’000
Investmentproperties
held forsale
£’000Total£’000
ValuationCarrying value at 1 April 2018 7,102,224 2,711 7,104,935Additions - capital expenditure 47,180 - 47,180Disposals (1,585) (2,711) (4,296)Transfer to investment properties held for sale (1,024) 1,024 -
Total carrying value at 30 September 2018 7,146,795 1,024 7,147,819
31 March 2018(audited)
Investmentproperties
£’000
Investmentproperties
held forsale
£’000Total£’000
ValuationCarrying value at 1 April 2017 7,563,065 7,428 7,570,493Additions - capital expenditure 39,438 - 39,438Disposals (15,710) (7,428) (23,138)Transfer to investment properties held for sale (2,567) 2,567 -Unrealised property revaluation gains (482,002) 144 (481,858)
Total carrying value at 31 March 2018 7,102,224 2,711 7,104,935
Properties would have been included on an historical cost basis at £1,465.9 million (31 March 2018:£1,421.0 million).
As at 30 September 2018 there were four (31 March 2018: 11) property assets classified as held for sale,with disposal expected within the next 12 months.

11
ANNINGTON LIMITED
NOTES TO THE CONDENSED CONSOLIDATED FINANCIAL STATEMENTSFor the six months ended 30 September 2018 (continued)
5. INVESTMENT PROPERTIES (continued) 30 September2018
£’000
30 September2017
£’000
Property rental income from investment properties: 98,479 96,208
Property rental expenses:Refurbishment costs (45) (1,578)Dilapidations recovered from tenants - 1,379Rental running expenses (2,453) (2,251)
(2,498) (2,450)
Refurbishment costs are incurred where significant repairs are required to bring vacated properties back up totenantable standard. Included in refurbishment costs are £nil (2017: £426,000) spent on former MQEproperties which were released within one year prior to the expenditure. Dilapidations recovered fromtenants are used to defray these costs.
Substantially all of the Group’s property assets generated rental income in the current and prior year, withthe exception of the plots and infill areas held in the MQE Surplus Estate that have future long-termdevelopment potential.
6. INVESTMENT IN JOINT VENTURES
The Group’s joint venture undertakings at 30 September 2018 are shown below:
Name of joint venture Principal activity Holding
Annington Wates (Cove) Limited Property development 50.00%Countryside Annington (Colchester) Limited Property development 50.00%Countryside Annington (Mill Hill) Limited Property development 50.00%The Inglis Consortium LLP Property development 28.55%
The Group’s investment in joint ventures is presented in aggregate in the table below:Share of
net assets£’000
Loans£’000
Total£’000
At 1 April 2017 12,584 12,700 25,284Additions 13,920 - 13,920Repayments - (7,775) (7,775)Distributions (28,978) - (28,978)Share of profit for the year 15,053 - 15,053Impairment (3,306) - (3,306)
At 31 March 2018 9,273 4,925 14,198
Repayments - (1,000) (1,000)Distributions (5,447) - (5,447)Share of profit for the period 495 - 495Reversal of impairment 3,306 - 3,306
At 30 September 2018 7,627 3,925 11,552
The Group’s share of profits from joint ventures represents profits from continued operations. There are nodiscontinued operations within the joint ventures. The joint ventures have not recorded any othercomprehensive income and the share of profits disclosed in the above table also represents the Group’s shareof total comprehensive income.

12
ANNINGTON LIMITED
NOTES TO THE CONDENSED CONSOLIDATED FINANCIAL STATEMENTSFor the six months ended 30 September 2018 (continued)
7. LOANS AND BORROWINGS
30 September2018
(unaudited)£’000
31 March2018
(audited)£’000
Amounts falling due between one and five yearsBank loans 396,456 396,010
396,456 396,010
Amounts falling due after five yearsUnsecured notes 2,990,770 2,981,489
2,990,770 2,981,489
3,387,226 3,377,499
Total loans and borrowings 3,387,226 3,377,499
In July 2017, the Group completed a refinancing transaction, involving an injection of new capital into theGroup, the issuance of new debt instruments and the early redemption of all the existing debt within theGroup. Annington Limited issued new share capital for cash consideration of £164 million and an amountthat offset the £316.4 million liability under the Zero Coupon Notes due to Annington Limited’s 100%parent.
Annington Funding plc (“AFP”) issued five tranches totalling £3 billion of corporate, unsecured bonds undera Euro Medium Term Note (“EMTN”) programme and drew down a term loan totalling £400 million, alsounsecured, with overall borrowing costs significantly lower than the legacy financing structures. Arranged aspart of the refinancing, a £300 million five-year revolving credit facility, which is currently undrawn, isavailable to Annington Funding plc.
AFP issued the new bonds in the following denominations, maturities and fixed interest rates:
Currency Sterling (£) Euro (€)
Principal Amount 625m 600m 625m 625m 600m
Final Maturity 12-Jul-25 12-Jul-29 12-Jul-34 12-Jul-47 12-Jul-24
Coupon 2.646% 3.184% 3.685% 3.935% 1.650%
Cross currency swaps are in place for the EUR €600 million bond, converting the nominal balance to£526.26 million. These swaps also mitigate volatility of foreign currency movements in future interest andcapital repayments. The function of these swaps increases the effective interest rate of the Euro Tranche debtto 2.764%, fixed for the life of the bond.

13
ANNINGTON LIMITED
NOTES TO THE CONDENSED CONSOLIDATED FINANCIAL STATEMENTSFor the six months ended 30 September 2018 (continued)
7. LOANS AND BORROWINGS (continued)
Critical to the Group’s future as a going concern is the ability to service and repay this debt. For theforeseeable future, at least until the maturity of the term loan in 2022, the Group only needs to pay theinterest on the debt. The new debt has a number of covenants to comply with under both the bonds and loanfacility. The covenants attaching to the debt are:
Covenant Test Limit for Bonds Limit for Loans
Limitation on Debt Total debt / total assets <65% <65%
Limitation on SecuredDebt
Secured debt / totalassets
<40% <40%
Interest Cover Ratio EBITDA / interest1.0x (dividend lockup at
1.3x)1.15x (dividend lockup
at 1.3x)
Unencumbered AssetsUnencumbered assets /
unsecured debt>125% >125%
The Group’s forecasts do not indicate any of these covenants will be breached in the foreseeable future.Forecasts indicate that sufficient cash flow will be generated to cover payments of interest on its debt andgenerate significant additional free cash flows to allow for reinvestment or potential dividends toshareholders. Furthermore, if this is not possible, the undrawn revolving credit facility provides additionalliquidity to the Group to allow the continued operation for the foreseeable future.
Reconciliation of movement
30September
2018(unaudited)
£’000
Revaluationadjustment
£’000
Amortisationbond issue
costs andwrite offs
£’000
31March
2018(audited)
£’000Annington Funding plcFixed Rate Euro Notes 2024 531,664 8,525 222 522,917Fixed Rate GBP Notes 2025 621,203 - 254 620,949Fixed Rate GBP Notes 2029 596,210 - 146 596,064Fixed Rate GBP Notes 2034 620,914 - 95 620,819Fixed Rate GBP Notes 2047 620,780 - 39 620,741Term Loan 2022 396,455 - 446 396,009
Total loans and borrowings 3,387,226 8,525 1,202 3,377,499

14
ANNINGTON LIMITED
NOTES TO THE CONDENSED CONSOLIDATED FINANCIAL STATEMENTSFor the six months ended 30 September 2018 (continued)
8. PROVISIONS
30 September2018
(unaudited)£’000
31 March2018
(audited)£’000
Utilities provisionAt 1 April 39,663 39,519Unwinding of discount 1,181 4,958Amounts credited to income statement 50 (4,069)Utilised (353) (745)
At period end 40,541 39,663
Current provision 7,422 3,635Non-current provision 33,119 36,028
40,541 39,663
There is a legal agreement to provide for the adoption of private utilities on sites where there have beenreleases of property that are currently dependent, for the supply of water and/or certain sewage treatment, onadjacent MoD bases. In addition, there is a constructive liability to provide for the adoption of certainutilities on certain sites which are not base dependent. Full provision has been made on the base dependentsites in accordance with the legal agreement and for all obligations which have crystallised on non-basedependent sites. The provision has been discounted in accordance with the relevant borrowing costs of theGroup. There is a contingent liability in respect of base dependent sites where properties have not beenreleased.
9. DERIVATIVE FINANCIAL INSTRUMENTS
30 September2018
(unaudited)£’000
31 March2018
(audited)£’000
Financial assets carried at fair value through OCICross currency swaps that are designated in hedge accountingrelationships 14,619 3,559
Reconciliation of movements
30September
2018(unaudited)
£’000
Revaluationadjustment
£’000
31March
2018(audited)
£’000
Cross currency swaps 14,619 11,060 3,559
Total derivative financial assets 14,619 11,060 3,559
Further details of derivative financial instruments are provided in Notes 7 and 10.
15
ANNINGTON LIMITED
NOTES TO THE CONDENSED CONSOLIDATED FINANCIAL STATEMENTSFor the six months ended 30 September 2018 (continued)
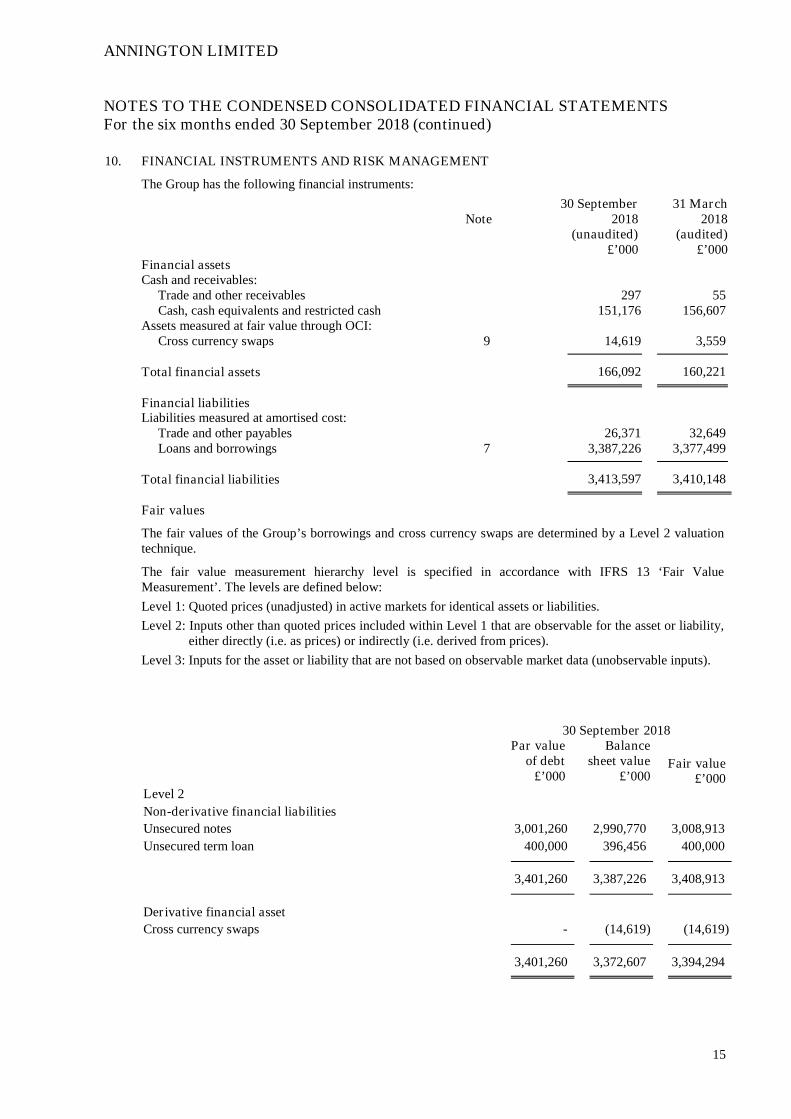
10. FINANCIAL INSTRUMENTS AND RISK MANAGEMENT
The Group has the following financial instruments:
Note30 September
2018(unaudited)
£’000
31 March2018
(audited)£’000
Financial assetsCash and receivables:
Trade and other receivables 297 55Cash, cash equivalents and restricted cash 151,176 156,607
Assets measured at fair value through OCI:Cross currency swaps 9 14,619 3,559
Total financial assets 166,092 160,221
Financial liabilitiesLiabilities measured at amortised cost:
Trade and other payables 26,371 32,649Loans and borrowings 7 3,387,226 3,377,499
Total financial liabilities 3,413,597 3,410,148
Fair values
The fair values of the Group’s borrowings and cross currency swaps are determined by a Level 2 valuationtechnique.
The fair value measurement hierarchy level is specified in accordance with IFRS 13 ‘Fair ValueMeasurement’. The levels are defined below:
Level 1: Quoted prices (unadjusted) in active markets for identical assets or liabilities.
Level 2: Inputs other than quoted prices included within Level 1 that are observable for the asset or liability,either directly (i.e. as prices) or indirectly (i.e. derived from prices).
Level 3: Inputs for the asset or liability that are not based on observable market data (unobservable inputs).
30 September 2018Par value
of debt£’000
Balancesheet value
£’000Fair value
£’000Level 2
Non-derivative financial liabilities
Unsecured notes 3,001,260 2,990,770 3,008,913
Unsecured term loan 400,000 396,456 400,000
3,401,260 3,387,226 3,408,913
Derivative financial asset
Cross currency swaps - (14,619) (14,619)
3,401,260 3,372,607 3,394,294

16
ANNINGTON LIMITED
NOTES TO THE CONDENSED CONSOLIDATED FINANCIAL STATEMENTSFor the six months ended 30 September 2018 (continued)
10. FINANCIAL INSTRUMENTS AND RISK MANAGEMENT (continued)31 March 2018
Par valueof debt
£’000
Balancesheet value
£’000Fair value
£’000Level 2
Non-derivative financial liabilities
Unsecured notes 3,001,260 2,981,489 3,020,152
Unsecured term loan 400,000 396,010 400,000
3,401,260 3,377,499 3,420,152
Derivative financial asset
Cross currency swap - (3,599) (3,599)
3,401,260 3,373,900 3,416,553
Unsecured notesListed Notes have been valued based on the indicative price contributed by market participants at balancesheet date. This represents a Level 2 fair value measurement. Further details, including covenant informationis included in Note 7.
Cross currency swapsThe fair value of derivative financial instruments is based on valuations by an independent valuer using thepresent value of estimated future cash flows, which are discounted using the applicable yield curves derivedfrom quoted interest rates as at 30 September 2018.
Unsecured term loanThis loan relates to a £400 million term loan ending in July 2022 that is unsecured. Further details, includingcovenant information is included in Note 7.

17
ANNINGTON LIMITED
NOTES TO THE CONDENSED CONSOLIDATED FINANCIAL STATEMENTSFor the six months ended 30 September 2018 (continued)
11. NOTE TO THE CONDENSED CASH FLOW STATEMENT
Six months ended30 September
2018(unaudited)
£’000
30 September2017
(unaudited)£’000
Profit/(Loss) after taxation 33,831 (862,705)Adjustment for:Taxation 7,226 (182,991)Finance costs 56,682 952,611Finance income (257) (2,355)Share of results of joint ventures after taxation (495) (7,201)Impairment of joint ventures (3,306) -Profit on disposal of property assets (1,282) (3,414)Unrealised property revaluation losses - 191,881Utilities provision expense/(release) 50 (295)Depreciation expense 18 10Movements in working capital:Increase in inventory (1,795) (265)(Increase)/decrease in debtors (740) 336Decrease in creditors (6,366) (13,043)Decrease in provisions (353) (441)
Net cash inflow from operating activities 83,213 72,128
12. RELATED PARTY DISCLOSURES
Balances and transactions between the Company and its subsidiaries, which are related parties, have beeneliminated on consolidation and are not disclosed in this note.
During the period, the Group has had transactions with joint ventures that include distributions, loans andassociated interest. These transactions form the basis for the movements disclosed in Note 6.
18
ANNINGTON LIMITED
DIRECTORS’ RESPONSIBILITIES STATEMENT
The directors are responsible for preparing the half-year condensed consolidated financial statements in accordancewith applicable law and regulations. The directors confirm that to the best of their knowledge these half-yearcondensed consolidated financial statements have been prepared in accordance with IAS 34 “Interim FinancialReporting” as adopted by the European Union.
The Directors are responsible for the maintenance and integrity of the corporate and financial information includedon the Company's website. Legislation in the United Kingdom governing the preparation and dissemination offinancial information differs from legislation in other jurisdictions.
Approved by
A P Chadd
Director
25 January 2019

REGISTERED OFFICE
1 James StreetLondon, United KingdomW1U 1DR
Telephone: 020 7960 7500www.annington.co.ukRegistered in England and Wales No 08271384