Embed Size (px)
Citation preview
1
Annex A The 2018 review of the UK Nutrient Profiling Model
The 2018 review of the UK Nutrient Profiling Model
2
About Public Health England
Public Health England exists to protect and improve the nation’s health and
wellbeing, and reduce health inequalities. We do this through world-class
science, knowledge and intelligence, advocacy, partnerships and the delivery of
specialist public health services. We are an executive agency of the Department
of Health and Social Care, and are a distinct delivery organisation with
operational autonomy to advise and support government, local authorities and
the NHS in a professionally independent manner.
Public Health England
Wellington House
133-155 Waterloo Road
London SE1 8UG
Tel: 020 7654 8000
www.gov.uk/phe
Twitter: @PHE_uk
Facebook: www.facebook.com/PublicHealthEngland
Prepared by: PHE. For queries relating to this document, please contact:
© Crown copyright 2018
You may re-use this information (excluding logos) free of charge in any format
or medium, under the terms of the Open Government Licence v3.0. To view this
licence, visit OGL. Where we have identified any third party copyright
information you will need to obtain permission from the copyright holders
concerned.
Published: March 2018
PHE publications PHE supports the UN
gateway number: 2017829 Sustainable Development Goals
The 2018 review of the UK Nutrient Profiling Model
3
Contents
About Public Health England 2
List of tables 5
List of figures 6
Abbreviations and glossary 7
Executive summary 9
Introduction 12
The UK Nutrient Profiling Model 2004/5 14
The purpose of the UK Nutrient Profiling Model 2004/5 14 Summary of the UK Nutrient Profiling Model 2004/5 14 Development of the UK Nutrient Profiling Model 2004/5 14
The 2007 review of the effectiveness of the UK Nutrient Profiling Model 2004/5 15 International Nutrient Profiling Models 16
Approach used in the 2018 review of the UK Nutrient Profiling Model 17
Aim of this review 17
Nutrient Profiling Model expert group and Nutrient Profiling Model reference group 17
Methods of the review 19
Development of the Nutrient Profiling Model test dataset 19 Assessing model performance 20 Analysis of model modifications 22
Testing of modifications to the UK Nutrient Profiling Model 2004/5 23
Considerations and modifications to the theoretical basis of the UK NPM 2004/5 25
Modifications to ‘A’ nutrients (energy, saturated fat, sugars and sodium) in the UK NPM 2004/5 27
Modifications to ‘C’ nutrients/food components (fruit, vegetables and nuts, fibre and protein) in the UK NPM 2004/5 33
Results tables 44
Conclusion 56
Appendices 60
Appendix A: History of the UK’s Nutrient Profiling Model 2004/5 61
Appendix B: Population Dietary Reference Values and derivatives of Dietary
Reference Values for children aged 11-16 years used for developing the UK
Nutrient Profiling Model 2004/5 62
The 2018 review of the UK Nutrient Profiling Model
4
Appendix C: How to calculate a nutrient profiling score using the UK Nutrient
Profiling Model 2004/5 64
Appendix D: Summary of International Nutrient Profiling Models 66
Appendix E: Nutrient Profiling Model expert group terms of reference 74
Appendix F: Nutrient Profiling Model reference group terms of reference 77
Appendix G: Nutrient Profiling Model test dataset - overview of data sources 81
Appendix H: Nutrient Profiling Model test dataset - processes involved in its
development 84
Appendix I: Nutrient Profiling Model test dataset - estimating free sugars 97
Appendix J: Nutrient Profiling Model test dataset - list of foods and drinks 114
Appendix K: Rationale for the development of the Nutrient Profiling Model
performance measure cut-off values 120
Appendix L: Free sugars decision tree to assess the need for calculation of free
sugars within a product 122
Appendix M: Points scale and scoring bands for the UK Nutrient Profiling Model
2004/5, modification 1, modification 2 (including modelling) and modification 3
(including modelling) 123
References 127
The 2018 review of the UK Nutrient Profiling Model
5
List of tables
Table 1: Nutrient/food values used to derive a scoring system for the UK NPM 2004/5 and the draft 2018 NPM 11 Table 2: Performance measure values for the 2018 review of the UK NPM 22
Table 3: Dietary Reference Values and derivatives of Dietary Reference Values used for developing the ‘A’ nutrients for the UK NPM 2004/5 and modifications 1, 2 and 3 26
Table 4: Details of removing the energy component of modification 2d and modification 3d 28
Table 5: Modification to fruit, vegetables and nuts modelling (modifications 2 and 3: a, b, c) and rationale 34 Table 6: Details of fibre modifications (modifications 2 and 3: e, f, g) and rationale 37
Table 7: Details of fibre modifications (modification 3: h, i, j, k, l, m, n, o, p) and rationale 38 Table 8: The overall number and percentage of foods and drinks that pass the UK NPM 2004/5 (baseline) and the draft 2018 NPM against selected performance measures 42
Table 9: The overall number and percentage of foods and drinks in the NPM test dataset that pass the UK NPM 2004/5 and at each modification (modification 1, modification 2 and modification 3) by category 45
Table 10: The overall number and percentage of foods and drinks in the NPM test dataset that pass various modifications of the NPM for; sugar (3 modifications 1, 2 and 3: see table 3); fruit, vegetables and nuts (3 modifications a, b, c: see table 5), fibre (12 modifications e, f, g, h, i, j, k, l, m, n, o, p: see table 6 and 7) and no energy scoring in comparison to the UK NPM 2004/5 (baseline), against selected performance measures 53
Table 11: Basis of the nutrient/food component and scoring for the UK NPM 2004/5 and the draft 2018 NPM 59

The 2018 review of the UK Nutrient Profiling Model
6
List of figures
Figure 1: A summary map outlining the modifications made to the UK NPM 2004/5 and nutrient/food component values for the draft 2018 NPM 24 Figure 2: Summary of the differences between the UK NPM 2004/5 and the draft 2018 NPM 58
The 2018 review of the UK Nutrient Profiling Model
7
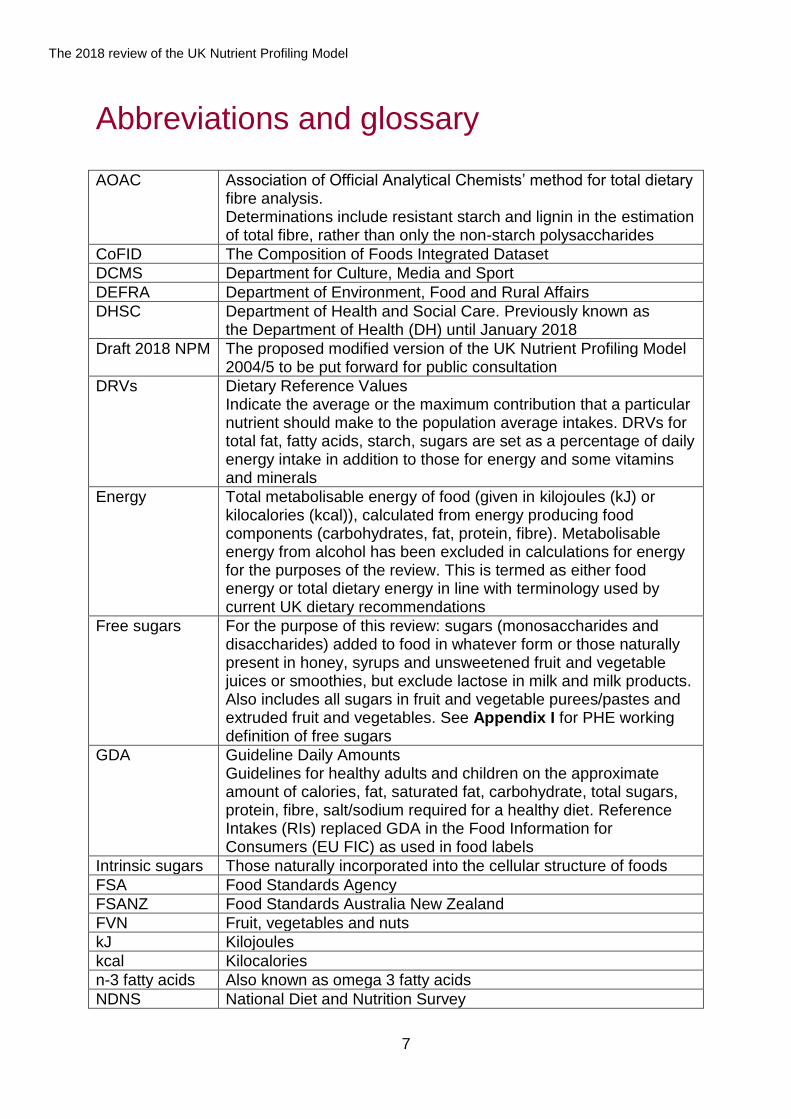
Abbreviations and glossary
AOAC Association of Official Analytical Chemists’ method for total dietary fibre analysis. Determinations include resistant starch and lignin in the estimation of total fibre, rather than only the non-starch polysaccharides
CoFID The Composition of Foods Integrated Dataset
DCMS Department for Culture, Media and Sport
DEFRA Department of Environment, Food and Rural Affairs
DHSC Department of Health and Social Care. Previously known as the Department of Health (DH) until January 2018
Draft 2018 NPM The proposed modified version of the UK Nutrient Profiling Model 2004/5 to be put forward for public consultation
DRVs Dietary Reference Values Indicate the average or the maximum contribution that a particular nutrient should make to the population average intakes. DRVs for total fat, fatty acids, starch, sugars are set as a percentage of daily energy intake in addition to those for energy and some vitamins and minerals
Energy Total metabolisable energy of food (given in kilojoules (kJ) or kilocalories (kcal)), calculated from energy producing food components (carbohydrates, fat, protein, fibre). Metabolisable energy from alcohol has been excluded in calculations for energy for the purposes of the review. This is termed as either food energy or total dietary energy in line with terminology used by current UK dietary recommendations
Free sugars For the purpose of this review: sugars (monosaccharides and disaccharides) added to food in whatever form or those naturally present in honey, syrups and unsweetened fruit and vegetable juices or smoothies, but exclude lactose in milk and milk products. Also includes all sugars in fruit and vegetable purees/pastes and extruded fruit and vegetables. See Appendix I for PHE working definition of free sugars
GDA Guideline Daily Amounts Guidelines for healthy adults and children on the approximate amount of calories, fat, saturated fat, carbohydrate, total sugars, protein, fibre, salt/sodium required for a healthy diet. Reference Intakes (RIs) replaced GDA in the Food Information for Consumers (EU FIC) as used in food labels
Intrinsic sugars Those naturally incorporated into the cellular structure of foods
FSA Food Standards Agency
FSANZ Food Standards Australia New Zealand
FVN Fruit, vegetables and nuts
kJ Kilojoules
kcal Kilocalories
n-3 fatty acids Also known as omega 3 fatty acids
NDNS National Diet and Nutrition Survey
The 2018 review of the UK Nutrient Profiling Model
8
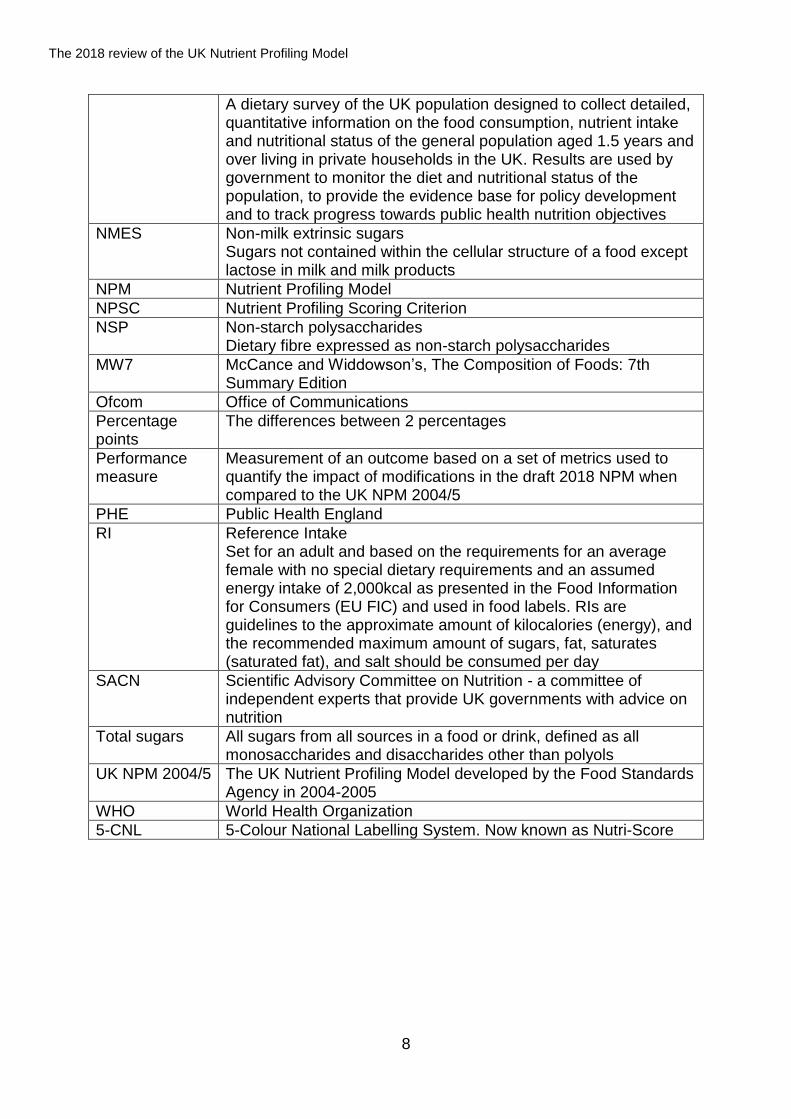
A dietary survey of the UK population designed to collect detailed, quantitative information on the food consumption, nutrient intake and nutritional status of the general population aged 1.5 years and over living in private households in the UK. Results are used by government to monitor the diet and nutritional status of the population, to provide the evidence base for policy development and to track progress towards public health nutrition objectives
NMES Non-milk extrinsic sugars Sugars not contained within the cellular structure of a food except lactose in milk and milk products
NPM Nutrient Profiling Model
NPSC Nutrient Profiling Scoring Criterion
NSP Non-starch polysaccharides Dietary fibre expressed as non-starch polysaccharides
MW7 McCance and Widdowson’s, The Composition of Foods: 7th Summary Edition
Ofcom Office of Communications
Percentage points
The differences between 2 percentages
Performance measure
Measurement of an outcome based on a set of metrics used to quantify the impact of modifications in the draft 2018 NPM when compared to the UK NPM 2004/5
PHE Public Health England
RI Reference Intake Set for an adult and based on the requirements for an average female with no special dietary requirements and an assumed energy intake of 2,000kcal as presented in the Food Information for Consumers (EU FIC) and used in food labels. RIs are guidelines to the approximate amount of kilocalories (energy), and the recommended maximum amount of sugars, fat, saturates (saturated fat), and salt should be consumed per day
SACN Scientific Advisory Committee on Nutrition - a committee of independent experts that provide UK governments with advice on nutrition
Total sugars All sugars from all sources in a food or drink, defined as all monosaccharides and disaccharides other than polyols
UK NPM 2004/5 The UK Nutrient Profiling Model developed by the Food Standards Agency in 2004-2005
WHO World Health Organization
5-CNL 5-Colour National Labelling System. Now known as Nutri-Score
The 2018 review of the UK Nutrient Profiling Model
9
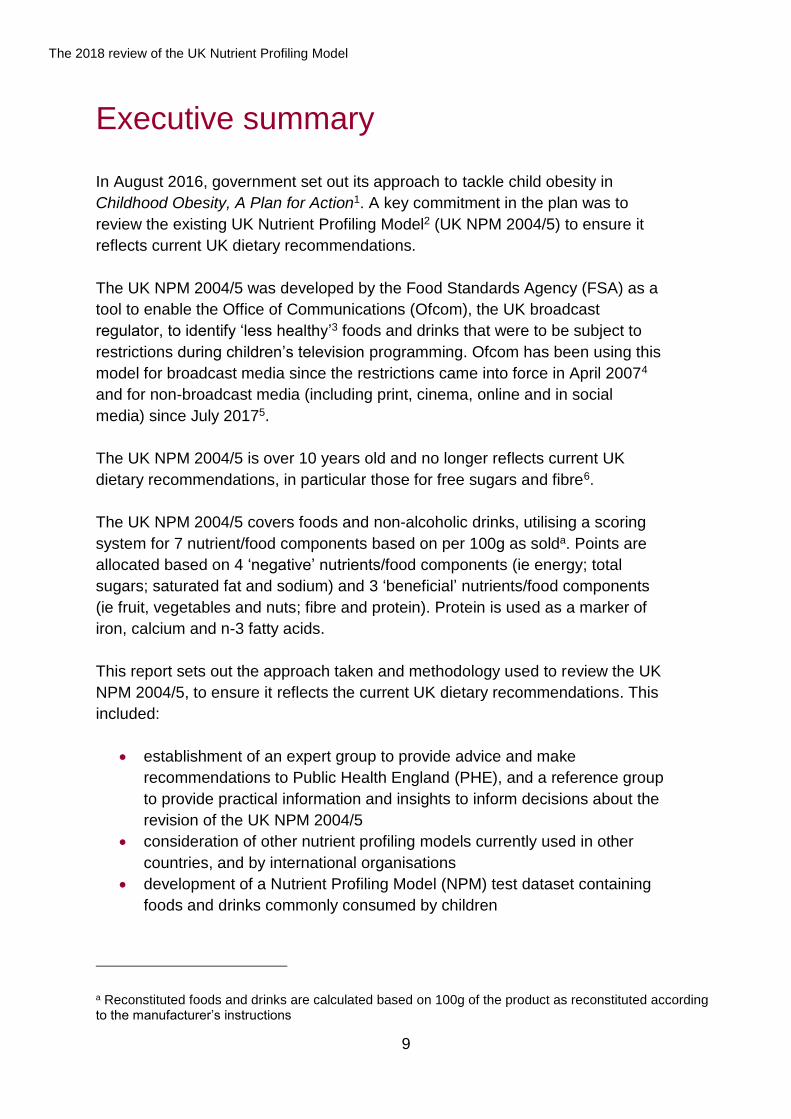
Executive summary
In August 2016, government set out its approach to tackle child obesity in
Childhood Obesity, A Plan for Action1. A key commitment in the plan was to
review the existing UK Nutrient Profiling Model2 (UK NPM 2004/5) to ensure it
reflects current UK dietary recommendations.
The UK NPM 2004/5 was developed by the Food Standards Agency (FSA) as a
tool to enable the Office of Communications (Ofcom), the UK broadcast
regulator, to identify ‘less healthy’3 foods and drinks that were to be subject to
restrictions during children’s television programming. Ofcom has been using this
model for broadcast media since the restrictions came into force in April 20074
and for non-broadcast media (including print, cinema, online and in social
media) since July 20175.
The UK NPM 2004/5 is over 10 years old and no longer reflects current UK
dietary recommendations, in particular those for free sugars and fibre6.
The UK NPM 2004/5 covers foods and non-alcoholic drinks, utilising a scoring
system for 7 nutrient/food components based on per 100g as solda. Points are
allocated based on 4 ‘negative’ nutrients/food components (ie energy; total
sugars; saturated fat and sodium) and 3 ‘beneficial’ nutrients/food components
(ie fruit, vegetables and nuts; fibre and protein). Protein is used as a marker of
iron, calcium and n-3 fatty acids.
This report sets out the approach taken and methodology used to review the UK
NPM 2004/5, to ensure it reflects the current UK dietary recommendations. This
included:
establishment of an expert group to provide advice and make
recommendations to Public Health England (PHE), and a reference group
to provide practical information and insights to inform decisions about the
revision of the UK NPM 2004/5
consideration of other nutrient profiling models currently used in other
countries, and by international organisations
development of a Nutrient Profiling Model (NPM) test dataset containing
foods and drinks commonly consumed by children
a Reconstituted foods and drinks are calculated based on 100g of the product as reconstituted according to the manufacturer’s instructions
The 2018 review of the UK Nutrient Profiling Model
10
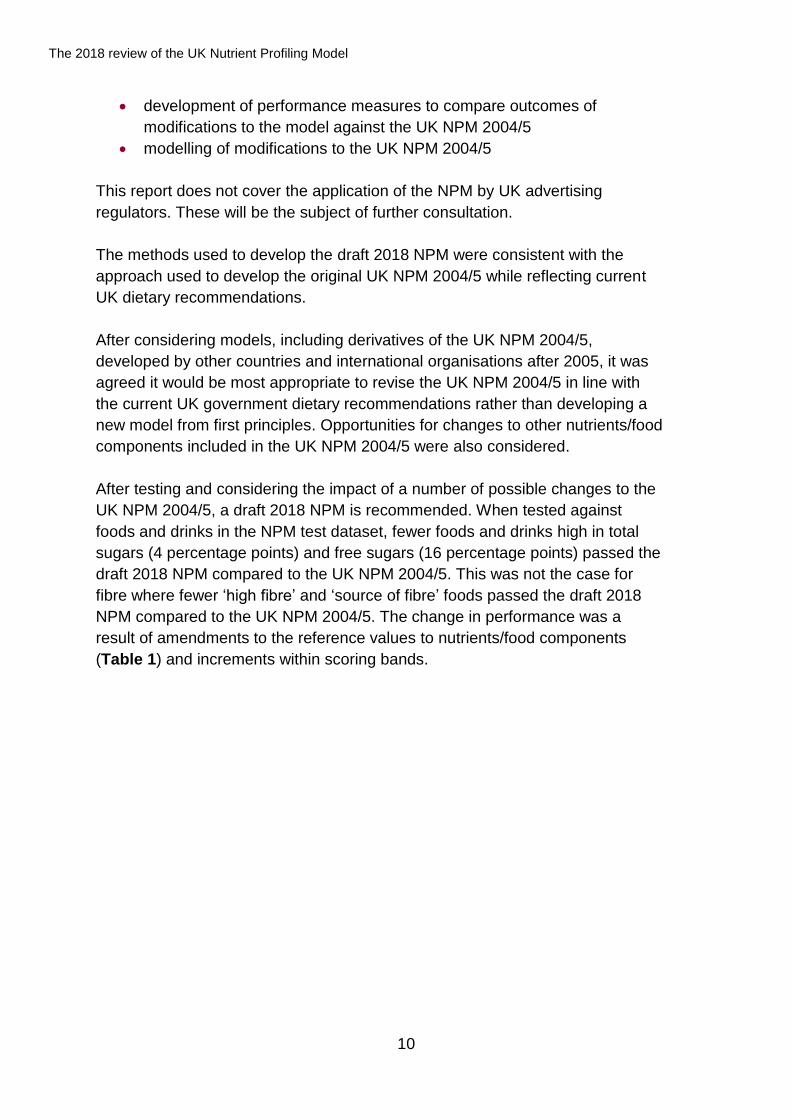
development of performance measures to compare outcomes of
modifications to the model against the UK NPM 2004/5
modelling of modifications to the UK NPM 2004/5
This report does not cover the application of the NPM by UK advertising
regulators. These will be the subject of further consultation.
The methods used to develop the draft 2018 NPM were consistent with the
approach used to develop the original UK NPM 2004/5 while reflecting current
UK dietary recommendations.
After considering models, including derivatives of the UK NPM 2004/5,
developed by other countries and international organisations after 2005, it was
agreed it would be most appropriate to revise the UK NPM 2004/5 in line with
the current UK government dietary recommendations rather than developing a
new model from first principles. Opportunities for changes to other nutrients/food
components included in the UK NPM 2004/5 were also considered.
After testing and considering the impact of a number of possible changes to the
UK NPM 2004/5, a draft 2018 NPM is recommended. When tested against
foods and drinks in the NPM test dataset, fewer foods and drinks high in total
sugars (4 percentage points) and free sugars (16 percentage points) passed the
draft 2018 NPM compared to the UK NPM 2004/5. This was not the case for
fibre where fewer ‘high fibre’ and ‘source of fibre’ foods passed the draft 2018
NPM compared to the UK NPM 2004/5. The change in performance was a
result of amendments to the reference values to nutrients/food components
(Table 1) and increments within scoring bands.
The 2018 review of the UK Nutrient Profiling Model
11
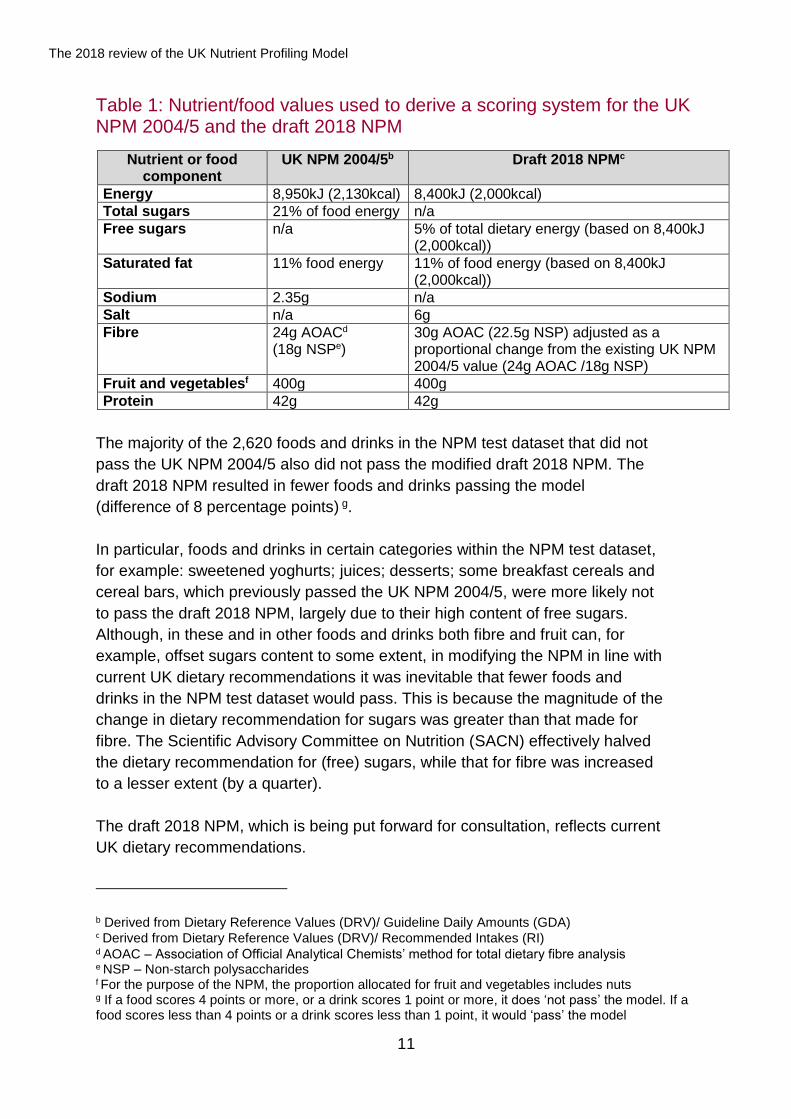
Table 1: Nutrient/food values used to derive a scoring system for the UK NPM 2004/5 and the draft 2018 NPM
Nutrient or food component
UK NPM 2004/5b
Draft 2018 NPMc
Energy 8,950kJ (2,130kcal) 8,400kJ (2,000kcal)
Total sugars 21% of food energy n/a
Free sugars n/a 5% of total dietary energy (based on 8,400kJ (2,000kcal))
Saturated fat 11% food energy 11% of food energy (based on 8,400kJ (2,000kcal))
Sodium 2.35g n/a
Salt n/a 6g
Fibre 24g AOACd (18g NSPe)
30g AOAC (22.5g NSP) adjusted as a proportional change from the existing UK NPM 2004/5 value (24g AOAC /18g NSP)
Fruit and vegetablesf 400g 400g
Protein 42g 42g
The majority of the 2,620 foods and drinks in the NPM test dataset that did not
pass the UK NPM 2004/5 also did not pass the modified draft 2018 NPM. The
draft 2018 NPM resulted in fewer foods and drinks passing the model
(difference of 8 percentage points) g.
In particular, foods and drinks in certain categories within the NPM test dataset,
for example: sweetened yoghurts; juices; desserts; some breakfast cereals and
cereal bars, which previously passed the UK NPM 2004/5, were more likely not
to pass the draft 2018 NPM, largely due to their high content of free sugars.
Although, in these and in other foods and drinks both fibre and fruit can, for
example, offset sugars content to some extent, in modifying the NPM in line with
current UK dietary recommendations it was inevitable that fewer foods and
drinks in the NPM test dataset would pass. This is because the magnitude of the
change in dietary recommendation for sugars was greater than that made for
fibre. The Scientific Advisory Committee on Nutrition (SACN) effectively halved
the dietary recommendation for (free) sugars, while that for fibre was increased
to a lesser extent (by a quarter).
The draft 2018 NPM, which is being put forward for consultation, reflects current
UK dietary recommendations.
b Derived from Dietary Reference Values (DRV)/ Guideline Daily Amounts (GDA) c Derived from Dietary Reference Values (DRV)/ Recommended Intakes (RI) d AOAC – Association of Official Analytical Chemists’ method for total dietary fibre analysis e NSP – Non-starch polysaccharides f For the purpose of the NPM, the proportion allocated for fruit and vegetables includes nuts g If a food scores 4 points or more, or a drink scores 1 point or more, it does ‘not pass’ the model. If a food scores less than 4 points or a drink scores less than 1 point, it would ‘pass’ the model
The 2018 review of the UK Nutrient Profiling Model
12
Introduction
1.1 Individual foods and drinks are composed of a mixture of nutrients and by nature
of their nutrient content will be more, or less aligned with a healthy dietary pattern.
There is no single, simple measurement that defines these foods as ‘healthier’ or
‘less healthy’. In an attempt to help such considerations nutrient profile models
have been developed.
1.2 In July 2015, SACN published its Carbohydrates and Health report6 which
concluded that the:
recommended average population intake of free sugars should be no
more than 5% of total dietary energy (compared to no more than 10% of
total dietary energy for non-milk extrinsic sugars (NMES) as previously
recommended)
recommended average population intake of fibre should be increased to
30g AOAC fibre (compared to 18g non-starch polysaccharides (NSP);
equivalent to 24g AOAC fibre7) with additional recommendations for
children
1.3 These values have been incorporated into current UK dietary recommendations8
and messaging tools such as the Eatwell Guide9,h which shows the types and
proportions of foods that help achieve a healthy balanced diet.
1.4 In 2015, PHE identified a need to review and strengthen the NPM developed by
the FSA in 2004-2005 (UK NPM 2004/5) as part of a potential programme of work
to reduce sugar intakes in England10, and to bring various nutrition policy
instruments in line with the most recent advice from SACN.
1.5 In August 2016, the Childhood Obesity Plan1 set out the government’s
commitment to tackling childhood obesity. In England, 22.6% of children are
overweight or obese when they begin school and 34.2% of children are overweight
or obese by the time they leave primary school11. Obesity is associated with poor
psychological and emotional health, and many children experience bullying linked
to their weight12. Obese children are also more likely to become obese adults and
have a higher risk of morbidity, disability and premature mortality in adulthood13.
Evidence also shows that on average children are consuming too much saturated
fat, salt and sugars and too little fibre, oily fish and fruit and vegetables in
comparison to recommendations14,15.
h The Eatwell Guide replaced the eatwell plate as the UK healthy eating tool in 2016

The 2018 review of the UK Nutrient Profiling Model
13
1.6 One of PHE’s contributions to the Childhood Obesity Plan is the review of the UK
NPM 2004/5. The UK NPM 2004/5 is over 10 years old and does not reflect
current dietary recommendations including those for sugar and fibre.
1.7 This report describes the approach taken and methodology used by PHE, working
with academics, industry, non-governmental health organisations and other
stakeholders, to review the UK NPM 2004/5 to ensure it reflects the current UK
dietary recommendations. This report does not cover the application of the NPM
by UK advertising` regulators. These will be the subject of further consultation.
The 2018 review of the UK Nutrient Profiling Model
14
The UK Nutrient Profiling Model 2004/5
The purpose of the UK Nutrient Profiling Model 2004/5
2.1 The UK NPM 2004/5 was developed by the FSA as a tool to help Ofcom identify
‘less healthy’ foods and drinks that were to be subject to restrictions during
children’s television programming. Ofcom has been using this model for broadcast
media since the restrictions came into force from April 2007. It has also been
adopted for non-broadcast media (including print, cinema, online and in social
media) since July 2017. The history of the UK NPM 2004/5 is provided in
Appendix A.
Summary of the UK Nutrient Profiling Model 2004/5
2.2 The UK NPM 2004/5 uses a scoring system, which attempts to balance the
contribution made by ‘beneficial’ components/nutrients of food and drink to a
child’s overall diet alongside the negative contributions from nutrients where
children’s intakes are higher than recommended (paragraph 2.4). Each food and
drink is assigned an overall score that determines whether it can be advertised
during children’s television programming. Supporting technical guidance was also
developed to assist food manufacturers, retailers and advertisers to correctly
calculate nutrient profiling scores for their products.
Development of the UK Nutrient Profiling Model 2004/5
2.3 Rayner et al16 documented the theoretical approaches taken and decisions made
in the development of the UK NPM 2004/5.
2.4 The UK NPM 2004/5 is a semi continuous model17 with a simple scoring approach,
based on the following:
number of categories: 2 categories (one for foods and one for non-
alcoholic drinks)
choice of nutrients and other food components: 7 nutrients/food
components:
o three nutrients where children’s intakes are higher than recommended: total
sugars; saturated fat; sodium , as well as energy - so called ‘negative’
nutrients (or 'A' nutrients)
o three ‘beneficial’ nutrients/food components (or ‘C’ nutrients/food
components) to children’s diets: fruit, vegetables and nuts; fibre; protein (as a

The 2018 review of the UK Nutrient Profiling Model
15
marker for iron, calcium and n-3 polyunsaturated fatty acids to encompass
products such as meat, dairy and fish products)
protein cap: a protein cap was also included in the model to safeguard
against foods high in fat, salt and/or sugars being classified as 'healthier'
due to their high protein content unless the food contained more than
80% fruit, vegetables or nuts
base amount: the amount of nutrient/food component in a food per 100g
(termed the ‘base’)
scoring system: a scoring system was based on Dietary Reference
Values (DRV) and Guideline Daily Amounts (GDA)i for children aged 11-
16 years16. See Appendices B and C for details
2.5 Given the nature of nutrient profiling and the nutrient content of some foods and
drinks, there may be apparent anomalies for individual foods and drinks that would
be subject to advertising restrictions.
The 2007 review of the effectiveness of the UK Nutrient Profiling Model
2004/5
2.6 In 2007, the UK FSA established an independent review panel to assess the
effectiveness of the UK NPM 2004/5 at differentiating foods and drinks on the
basis of their nutrient profile.
2.7 The independent review panel recommended the removal of the protein cap18
because the impact appeared minimal compared with the additional complexity it
added to the calculations. SACN expressed reservations about the public health
implications associated with removal of the protein cap, and advised that if the
modification was made the impact would need to be monitored. In 2009, the FSA
Board advised Ministers that the protein cap should remain and the UK NPM
2004/5 remained unchanged18.
i GDAs have been replaced with Reference Intakes (RIs) in the EU (2011)
The 2018 review of the UK Nutrient Profiling Model
16
International Nutrient Profiling Models
2.8 The UK was one of the first countries to develop and use a nutrient profile model.
Since then several different models have been introduced internationally (for more
information see Appendix D). The following models are derivatives of the UK
NPM 2004/5:
Food Standards Australia New Zealand (FSANZ) Nutrient Profiling
Scoring Criterion (NPSC)19
South African Nutrient Profile Model20
Health Star Rating System (Australia and New Zealand)21
5-Colour National Labelling (5-CNL) System22, now named Nutri-Score
(France)
Adapted FSA NPM for use in Ireland23
2.9 The European Regional Office of the World Health Organization (WHO) developed
an alternative model in 201524, based on 2 existing schemes developed to restrict
food marketing to children by Norway and Denmark.
2.10 The main differences between these models relate to the subjective
considerations of:
choice of nutrients and other food components included
number of food and drink categories
base used (ie nutrient content per 100g; per 100kcal, or per portion)
type of model (categorical [threshold]; levels set or continuous [scoring
systems]; number of points scored for a particular nutrient content)
reference values used to underpin the model
The 2018 review of the UK Nutrient Profiling Model
17
Approach used in the 2018 review of
the UK Nutrient Profiling Model
Aim of this review
3.1 The aim of this review of the UK NPM 2004/5 was to ensure the NPM reflected
current UK dietary recommendations.
Nutrient Profiling Model expert group and Nutrient Profiling Model
reference group
3.2 In July 2016, PHE established a NPM expert group (expert group) and NPM
reference group (reference group), under the same independent Chair, to oversee
approaches and support progress of the NPM review to an agreed timeline25. The
expert group was supported by and received technical support throughout the
process from a secretariat provided by PHE.
3.3 The expert group consisted of invited representatives from academia, and non-
governmental health organisations. Its remit was to provide technical guidance
and scrutiny for the overall work and make recommendations to PHE. Government
departments, the food industry and non-governmental health organisations were
also involved as observers and included the Department of Health and Social
Care (DHSC), Department for Culture, Media and Sport (DCMS), Department of
Environment, Food and Rural Affairs (DEFRA) and the devolved administrations.
3.4 Differences of opinion were debated and a consensus was facilitated through the
Chair.
3.5 The reference group consisted of invited representatives from academia, the UK
advertising regulator, the food industry, and non-governmental health
organisations. The expert group were also members of the reference group. The
remit of the reference group was to represent a range of stakeholder views on
matters relating to the NPM and provide advice and comment on modifications in
relation to their potential applicability of the NPM in practice. Government
departments were also involved as observers and included the DHSC, DCMS,
DEFRA and the devolved administrations.
3.6 Terms of reference, detailed objectives, responsibilities, membership and ways of
working for the expert and reference groups were published in October 201626,27.
The 2018 review of the UK Nutrient Profiling Model
18
Details of the terms of reference and membership are provided in Appendices E
and F.
3.7 The agenda, minutes and action points from the expert and reference group
meetings were also published28 to ensure that advice, technical scrutiny and
recommendations were delivered in an open and transparent manner.
3.8 The scope of this review focused on updating the UK NPM 2004/5 to reflect the
current UK dietary recommendations. In particular, those for free sugars and fibre
rather than developing a new model from first principles. The approach also
considered opportunities for changes to other nutrients/food components included
in the UK NPM 2004/5.
3.9 As such this review excludes consideration of:
the use of NPM for any other use beyond that related to restricting
advertising of foods and drinks high in fat (saturated), sugars and salt
to children
non-nutrient substances (covered by other voluntary and mandatory
routes eg alcohol) or caffeine (considered outside the aims of the
review)
trans fatty acids given the average intake in the UK is now below the
population maximum recommendation (0.5% of food energy versus
2%29)
3.10 The review considered international nutrient profiling models, the majority of which
were based on the UK NPM 2004/5. The changes introduced by other countries
and organisations were reviewed against the specific elements of UK NPM
2004/5. See Appendix D for a summary of international nutrient profiling models.
The 2018 review of the UK Nutrient Profiling Model
19
Methods of the review
4.1 From July 2016 to February 2018, the expert and reference groups generally met
every 2 months. In addition, telephone conference meetings were scheduled with
the expert group as and when required. In total, there were 10 expert group
meetings, 6 expert group teleconferences and 9 reference group meetings.
4.2 The expert group considered and made decisions on the development of:
a NPM test dataset containing foods and drinks consumed by children
to test the impact of modifications to the UK NPM 2004/5
performance measures to compare outcomes of the modifications to
the model against the UK NPM 2004/5
modifications to the UK NPM 2004/5
In considering possible modifications the review of other models developed
since 2005 was also taken into account (see Appendix D).
Development of the Nutrient Profiling Model test dataset
4.3 There was no known readily available dataset containing foods and drinks
consumed by children. The National Diet and Nutrition Survey (NDNS) contained
only limited data for branded products. Therefore, a bespoke NPM test dataset of
food and drink products was developed to determine the impact of modifications to
the UK NPM 2004/5.
4.4 Food and drink purchase data adjusted to reflect differences between adults’ and
children’s average consumption was considered a reasonable proxy of foods and
drinks commonly consumed by children.
4.5 The NPM test dataset was developed using a variety of data sources (ie Kantar
Worldpanel (2014 and 2015), Brandbank and the Composition of Foods Integrated
Dataset (CoFID30)). A summary of the content, methodology and population
descriptions of these data sources can be found in Appendix G.
4.6 In summary, the NPM test dataset consists of the most frequently purchased
products at a household level after some adjustment for the likelihood of
consumption of those products by children. The products within the Kantar
Worldpanel were ranked according to sales. The ranking was then adjusted to
reflect children’s consumption using data from the NDNS. UK food composition
The 2018 review of the UK Nutrient Profiling Model
20
tables from CoFIDj were also used to incorporate additional foods (including basic
food commodities such as fruit and vegetables, eggs and milk). Ingredient and/or
nutrient data for each product was obtained from the Brandbank database,
manufacturers’ and retailers’ websites or UK food composition tables. For further
details of the processes undertaken to construct the NPM test dataset including
estimating free sugars, see Appendices H and I.
4.7 Two PHE nutritionists independently reviewed the resulting dataset to remove
duplicates, discontinued or unidentifiable products and products with missing or
implausible nutritional data.
4.8 The final NPM test dataset consisted of 2,620 food and drink products (2,249
foods and 371 drinks). The dataset was not intended to be representative of all
foods and drinks or those advertised. However, it was considered adequate as it
represented a range of products that covered a proportion of the foods and drinks
which are purchased. Details of the foods and drinks contained within the final
NPM test dataset are provided in Appendix J.
Assessing model performance
4.9 Performance measures were established to determine the impact of modifications
when compared to the UK NPM 2004/5. The expert group considered setting a
numerical objective. However, due to the arbitrary nature of this approach, chose
to use performance measures.
4.10 A literature review was conducted to identify any established performance
measures for adapting nutrient profile models. A search of Medline, Embase and
Scopus for relevant literature published between 1991 and February 2017 was
undertaken. No relevant papers in peer-reviewed journals specifically related to
performance measures were identified.
4.11 It was agreed a priori that the draft 2018 NPM should allow fewer foods that are
high in free sugars to pass the modified NPM. Alongside the primary performance
for free sugars, an additional performance measure for total sugars was also
included. Other performance measures included: saturated fat, salt and fibre in
order to guard against unintended consequences of the modelling. It was
recognised that the change in free sugars dietary recommendations was much
greater than that for fibre and that it was likely that some apparent anomalies may
arise, especially for foods that contain both of these.
j CoFID values were re-calculated in the format required for nutrition labelling
The 2018 review of the UK Nutrient Profiling Model
21
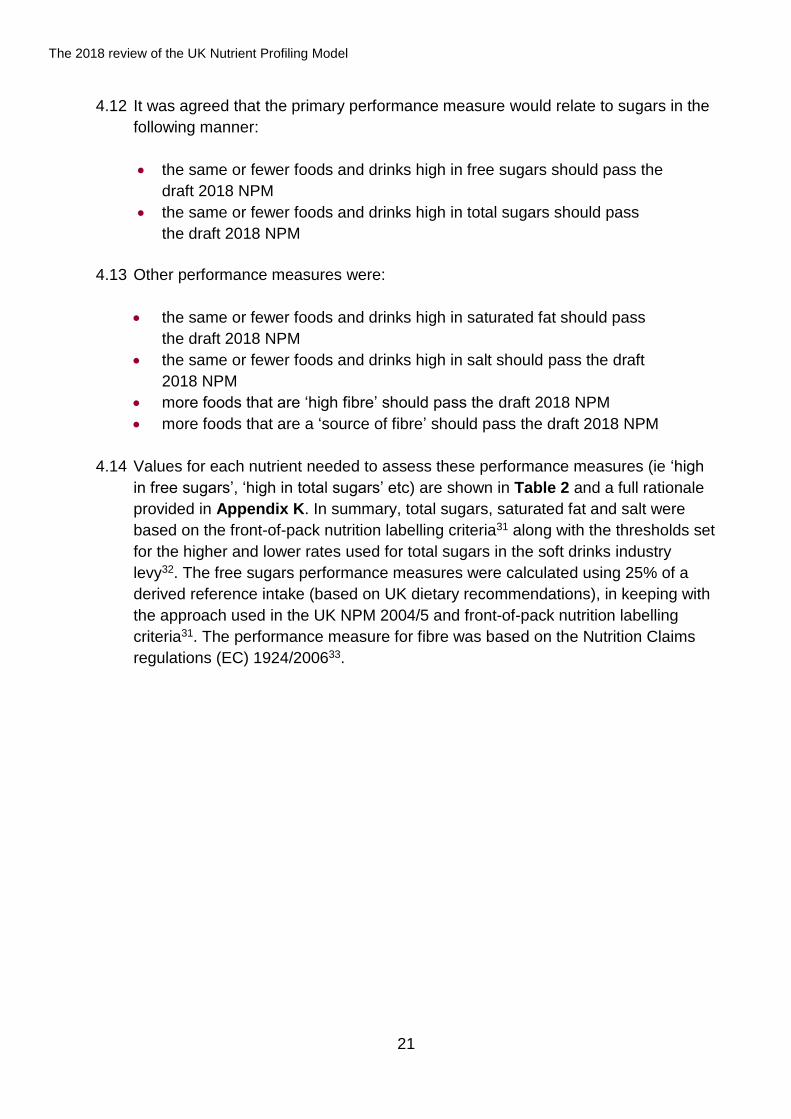
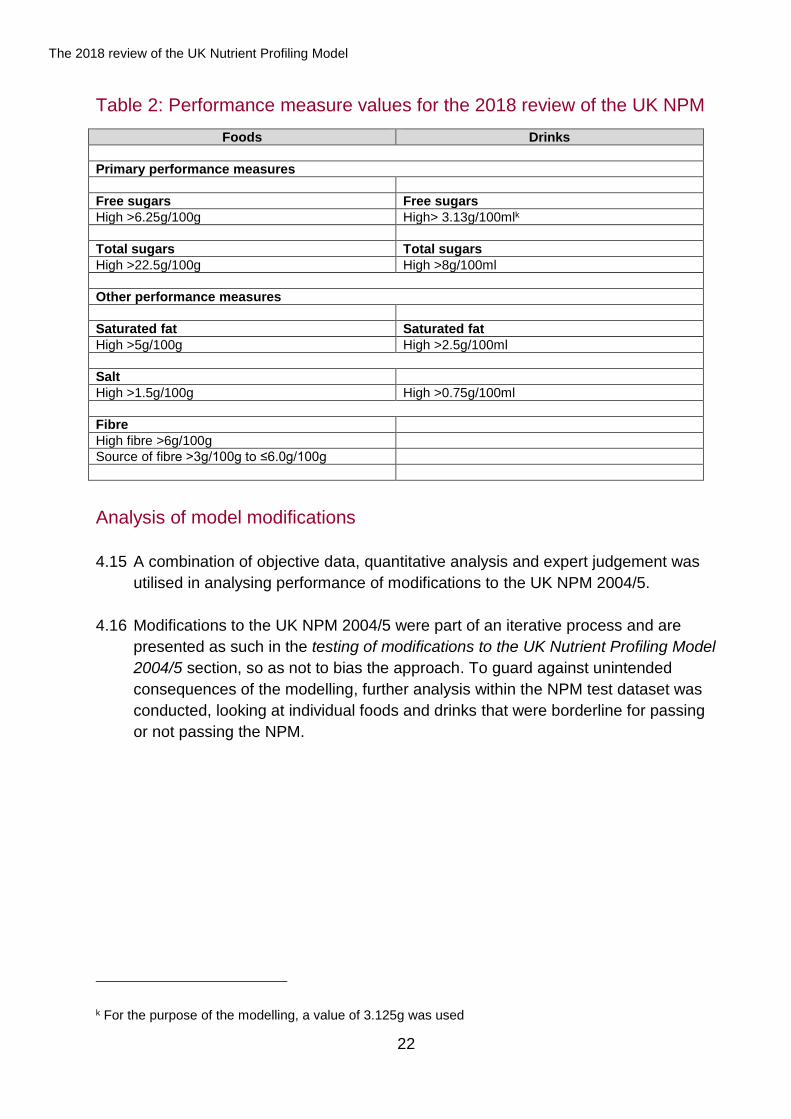
4.12 It was agreed that the primary performance measure would relate to sugars in the
following manner:
the same or fewer foods and drinks high in free sugars should pass the
draft 2018 NPM
the same or fewer foods and drinks high in total sugars should pass
the draft 2018 NPM
4.13 Other performance measures were:
the same or fewer foods and drinks high in saturated fat should pass
the draft 2018 NPM
the same or fewer foods and drinks high in salt should pass the draft
2018 NPM
more foods that are ‘high fibre’ should pass the draft 2018 NPM
more foods that are a ‘source of fibre’ should pass the draft 2018 NPM
4.14 Values for each nutrient needed to assess these performance measures (ie ‘high
in free sugars’, ‘high in total sugars’ etc) are shown in Table 2 and a full rationale
provided in Appendix K. In summary, total sugars, saturated fat and salt were
based on the front-of-pack nutrition labelling criteria31 along with the thresholds set
for the higher and lower rates used for total sugars in the soft drinks industry
levy32. The free sugars performance measures were calculated using 25% of a
derived reference intake (based on UK dietary recommendations), in keeping with
the approach used in the UK NPM 2004/5 and front-of-pack nutrition labelling
criteria31. The performance measure for fibre was based on the Nutrition Claims
regulations (EC) 1924/200633.
The 2018 review of the UK Nutrient Profiling Model
22
Table 2: Performance measure values for the 2018 review of the UK NPM
Foods Drinks
Primary performance measures
Free sugars Free sugars
High >6.25g/100g High> 3.13g/100mlk
Total sugars Total sugars
High >22.5g/100g High >8g/100ml
Other performance measures
Saturated fat Saturated fat
High >5g/100g High >2.5g/100ml
Salt
High >1.5g/100g High >0.75g/100ml
Fibre
High fibre >6g/100g
Source of fibre >3g/100g to ≤6.0g/100g
Analysis of model modifications
4.15 A combination of objective data, quantitative analysis and expert judgement was
utilised in analysing performance of modifications to the UK NPM 2004/5.
4.16 Modifications to the UK NPM 2004/5 were part of an iterative process and are
presented as such in the testing of modifications to the UK Nutrient Profiling Model
2004/5 section, so as not to bias the approach. To guard against unintended
consequences of the modelling, further analysis within the NPM test dataset was
conducted, looking at individual foods and drinks that were borderline for passing
or not passing the NPM.
k For the purpose of the modelling, a value of 3.125g was used
The 2018 review of the UK Nutrient Profiling Model
23
Testing of modifications to the UK Nutrient
Profiling Model 2004/5
5.1 This section outlines modifications to the theoretical basis of the UK NPM 2004/5.
Individual nutrients and food components were considered in a systematic manner
while the basis of the modifications were developed iteratively.
5.2 Where modifications are not outlined, all existing UK NPM 2004/5 rules apply. For
example, calculating overall nutrient profiling scores and application of the protein
cap. For further information for calculating a nutrient profiling model score, see
Appendix C.
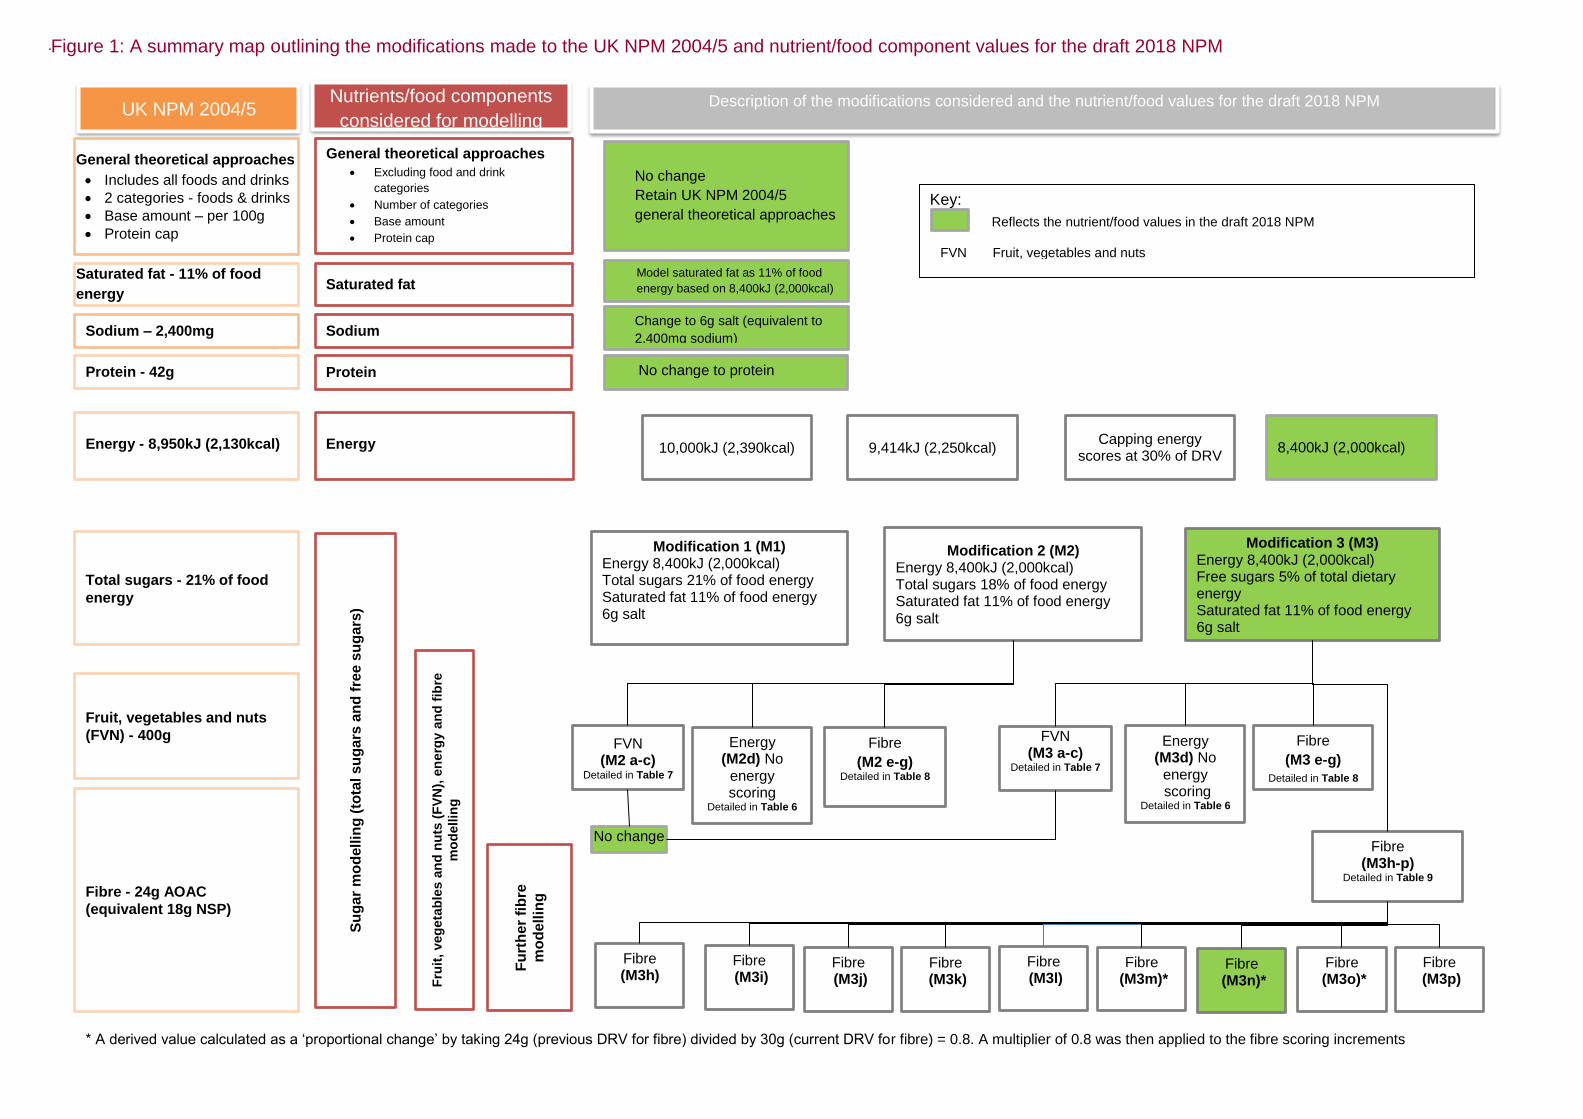
5.3 A summary map outlining the steps taken to reach the draft 2018 NPM is
presented in Figure 1.
The 2018 review of the UK Nutrient Profiling Model
24
Key:
General theoretical approaches
Excluding food and drink
categories
Number of categories
Base amount
Protein cap
No change
Retain UK NPM 2004/5
general theoretical approaches
Saturated fat
Energy
Fu
rth
er
fib
re
mo
dellin
g
Fru
it, veg
eta
ble
s a
nd
nu
ts (
FV
N),
en
erg
y a
nd
fib
re
mo
dellin
g
Su
ga
r m
od
ellin
g (
tota
l s
ug
ars
an
d f
ree s
ug
ars
)
10,000kJ (2,390kcal) 9,414kJ (2,250kcal) Capping energy
scores at 30% of DRV 8,400kJ (2,000kcal)
Model saturated fat as 11% of food
energy based on 8,400kJ (2,000kcal)
Modification 1 (M1) Energy 8,400kJ (2,000kcal) Total sugars 21% of food energy Saturated fat 11% of food energy 6g salt
Modification 2 (M2) Energy 8,400kJ (2,000kcal) Total sugars 18% of food energy Saturated fat 11% of food energy 6g salt
Modification 3 (M3) Energy 8,400kJ (2,000kcal) Free sugars 5% of total dietary energy Saturated fat 11% of food energy 6g salt
FVN (M2 a-c)
Detailed in Table 7
Energy (M2d) No
energy scoring
Detailed in Table 6
Fibre
(M2 e-g)
Detailed in Table 8
Sodium
Protein
Change to 6g salt (equivalent to
2,400mg sodium)
No change to protein
General theoretical approaches
Includes all foods and drinks
2 categories - foods & drinks
Base amount – per 100g
Protein cap
Saturated fat - 11% of food
energy
Sodium – 2,400mg
Protein - 42g
Energy - 8,950kJ (2,130kcal)
Total sugars - 21% of food
energy
Fruit, vegetables and nuts
(FVN) - 400g
UK NPM 2004/5 Nutrients/food components
considered for modelling Description of the modifications considered and the nutrient/food values for the draft 2018 NPM
Fibre - 24g AOAC
(equivalent 18g NSP)
FVN (M3 a-c)
Detailed in Table 7
Energy (M3d) No
energy scoring
Detailed in Table 6
Fibre
(M3 e-g) Detailed in Table 8
Fibre (M3h-p)
Detailed in Table 9
Fibre (M3h)
Fibre (M3j)
Fibre (M3l)
Fibre (M3n)*
Fibre (M3o)*
Fibre (M3p)
Fibre (M3m)*
Fibre (M3k)
Fibre (M3i)
No change
* A derived value calculated as a ‘proportional change’ by taking 24g (previous DRV for fibre) divided by 30g (current DRV for fibre) = 0.8. A multiplier of 0.8 was then applied to the fibre scoring increments
Figure 1: A summary map outlining the modifications made to the UK NPM 2004/5 and nutrient/food component values for the draft 2018 NPM
Reflects the nutrient/food values in the draft 2018 NPM
FVN Fruit, vegetables and nuts
The 2018 review of the UK Nutrient Profiling Model
25
Considerations and modifications to the theoretical basis of the UK NPM
2004/5
Excluding food/drink categories:
5.4 Some food and drink categories, owing to their nutrient profiles, either tend to
always or never pass the UK NPM 2004/5. For example, plain vegetables tend to
pass while sugar sweetened drinks tend not to pass.
5.5 Excluding whole food and drink categories from the NPM would require starting
from first principles and could introduce bias inconsistent with messages around a
balanced diet. Therefore, it was agreed not to exclude whole categories of foods
and drinks from the draft 2018 NPM, consistent with the UK NPM 2004/5.
Number of categories:
5.6 It was agreed that the classification of items as foods and drinks (non-alcoholic)
used in the UK NPM 2004/5 would be retained.
Base amount:
5.7 The possible effects of changing the base to per portion were extensively
considered in the 2007 review of the effectiveness of the UK NPM 2004/518. At the
time, retention of per 100g was agreed in order to avoid unnecessary complexity,
as there are few UK dietary recommendations on portion sizes and a variety of
sizes used on food/drink packs. The expert group agreed that these conclusions
remained valid.
Protein cap:
5.8 It was agreed not to remove or modify the protein cap given comments previously
considered as part of the 2007 review of the effectiveness of the UK NPM 2004/518
and SACN’s recommendations6.
Scoring bands:
5.9 The maximum range of scores within the model for individual nutrients/food
components and the increments were considered systematically and are detailed
in subsequent sections.
Nutrients/food components:
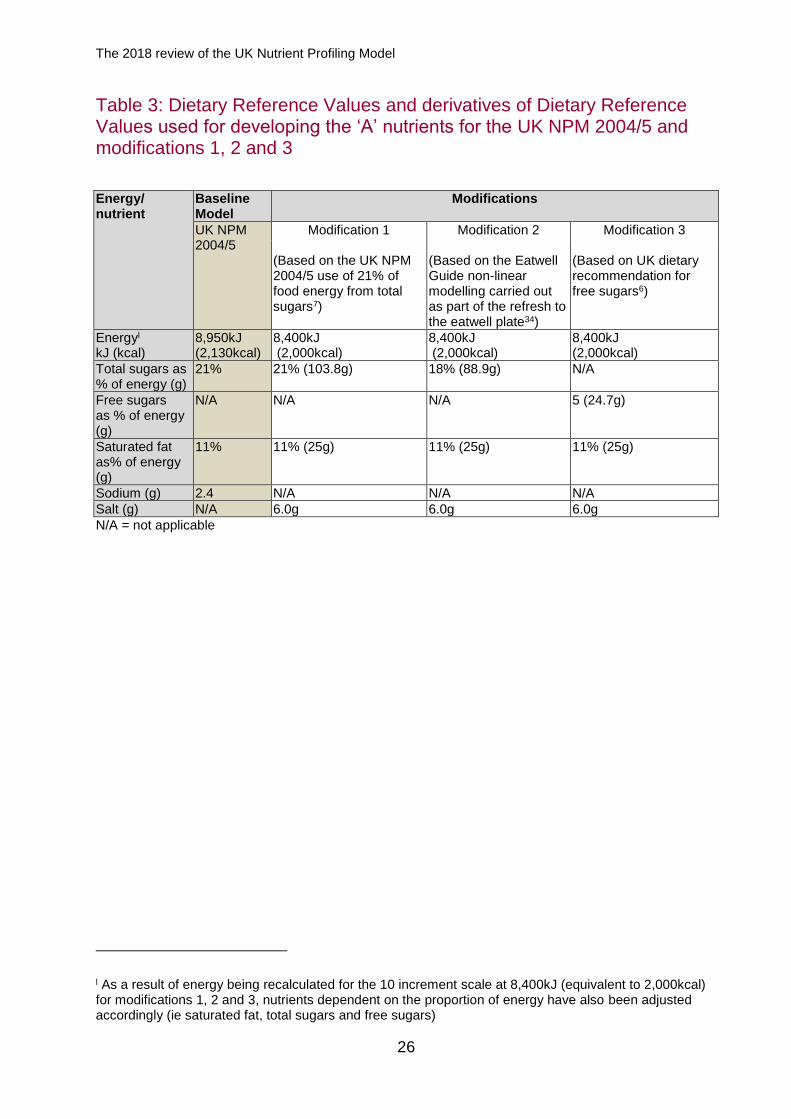
5.10 Several modifications to the UK NPM 2004/5 were tested. Changes made to the
DRVs and derivatives of DRVs used for developing ‘A’ nutrients in comparison to
the UK NPM 2004/5 are summarised in Tables 3 and 4. Changes to DRVs and
derivatives of DRVs for ‘C’ nutrients were assessed as a second stage following
discussion of ‘A’ nutrient modifications and are summarised in Tables 5, 6 and 7.
The 2018 review of the UK Nutrient Profiling Model
26
Table 3: Dietary Reference Values and derivatives of Dietary Reference Values used for developing the ‘A’ nutrients for the UK NPM 2004/5 and modifications 1, 2 and 3
Energy/ nutrient
Baseline Model
Modifications
UK NPM 2004/5
Modification 1 (Based on the UK NPM 2004/5 use of 21% of food energy from total sugars7)
Modification 2 (Based on the Eatwell Guide non-linear modelling carried out as part of the refresh to the eatwell plate34)
Modification 3 (Based on UK dietary recommendation for free sugars6)
Energyl kJ (kcal)
8,950kJ (2,130kcal)
8,400kJ (2,000kcal)
8,400kJ (2,000kcal)
8,400kJ (2,000kcal)
Total sugars as % of energy (g)
21% 21% (103.8g) 18% (88.9g) N/A
Free sugars as % of energy (g)
N/A N/A N/A 5 (24.7g)
Saturated fat as% of energy (g)
11% 11% (25g) 11% (25g) 11% (25g)
Sodium (g) 2.4 N/A N/A N/A
Salt (g) N/A 6.0g 6.0g 6.0g
N/A = not applicable
l As a result of energy being recalculated for the 10 increment scale at 8,400kJ (equivalent to 2,000kcal) for modifications 1, 2 and 3, nutrients dependent on the proportion of energy have also been adjusted accordingly (ie saturated fat, total sugars and free sugars)
The 2018 review of the UK Nutrient Profiling Model
27
Modifications to ‘A’ nutrients (energy, saturated fat, sugars and sodium) in
the UK NPM 2004/5
Energy
5.11 A number of approaches to review the energy reference value were considered:
adopting an energy reference value in line with SACN’s 2011 energy
estimates35 ie 10,000 kJ (2,390kcal) as an average for males and
females aged 11-18 years. Retaining a 10 point scale starting at 3.75%
of the reference value with increments of 3.75% of the reference value
(in line with increments of the original UK NPM 2004/5)
adopting the UK government recommendation for energy ie 9,414kJ
(equivalent to 2,250kcal8) as an average for males and females aged
11-18 yearsm. Retaining a 10 point scale with score bands starting at
3.75% of the DRV with increments of 3.75% of the DRV
adopting a derived energy reference value of 8,400kJ (equivalent to
2,000kcal) consistent with food labelling regulations33 and government
population advice for everyone over the age of 11 years, retaining a 10
point scale with score bands starting at 3.75% of the reference value
with increments of 3.75% of the reference value
capping the energy scores at 30% of the energy DRV in line with PHE
catering guidance recommendations for a main lunch and evening
eating occasion36
5.12 Following SACN’s 2011 recommendations for energy reference values35, the UK
government decided not to adopt the higher revised energy values in light of the
increasing prevalence of obesity. As a result, adjusting the model to reflect a
reference value of 8,400kJ (equivalent to 2,000kcal) daily intake was
recommended, consistent with food labelling regulations and government
population advice for everyone over the age of 11 years. A 10 point scale was
retained with score bands starting at 3.75% of the reference value with increments
of 3.75% of the DRV.
m Energy reference values for 11 - 18 year olds have been capped at 10.5 MJ (2,500kcal)/day for males
and 8.4MJ (2,000kcal)/day for females to help address issues of overweight and obesity (on average 9,414kJ (2,250kcal))
The 2018 review of the UK Nutrient Profiling Model
28
Energy modelling (removing the energy component)
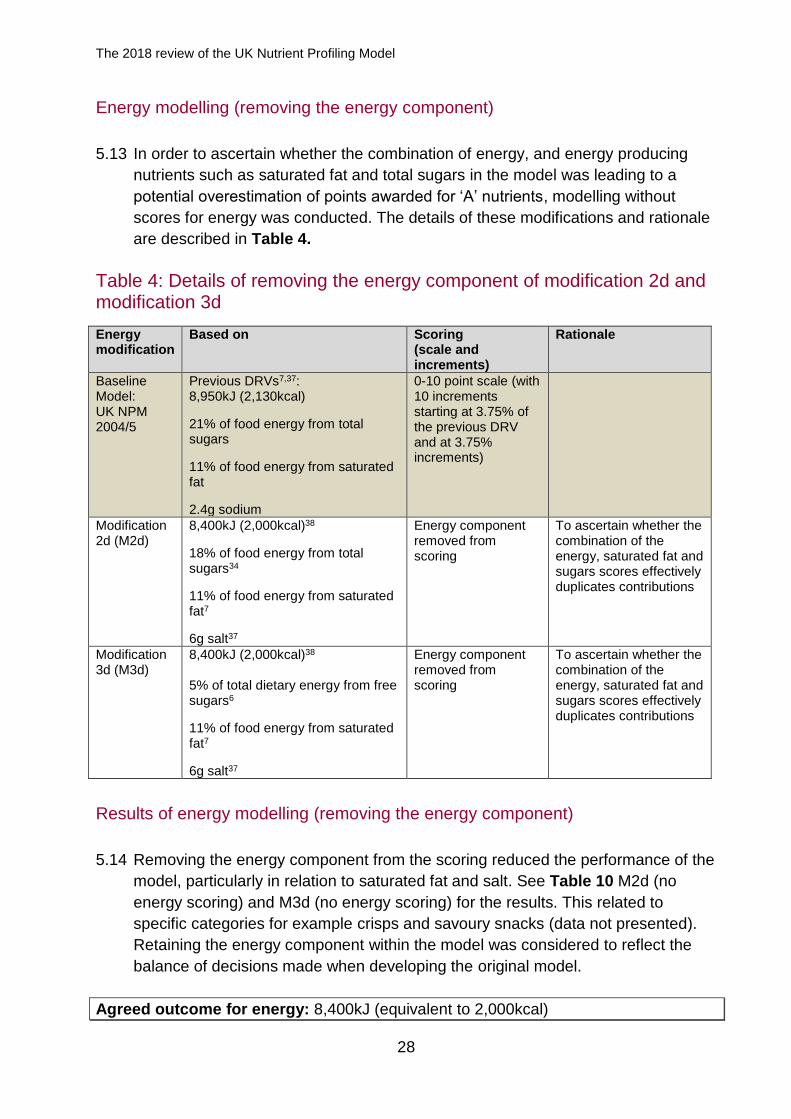
5.13 In order to ascertain whether the combination of energy, and energy producing
nutrients such as saturated fat and total sugars in the model was leading to a
potential overestimation of points awarded for ‘A’ nutrients, modelling without
scores for energy was conducted. The details of these modifications and rationale
are described in Table 4.
Table 4: Details of removing the energy component of modification 2d and modification 3d
Energy modification
Based on Scoring (scale and increments)
Rationale
Baseline Model: UK NPM 2004/5
Previous DRVs7,37: 8,950kJ (2,130kcal)
21% of food energy from total sugars
11% of food energy from saturated fat
2.4g sodium
0-10 point scale (with 10 increments starting at 3.75% of the previous DRV and at 3.75% increments)
Modification 2d (M2d)
8,400kJ (2,000kcal)38
18% of food energy from total sugars34
11% of food energy from saturated fat7
6g salt37
Energy component removed from scoring
To ascertain whether the combination of the energy, saturated fat and sugars scores effectively duplicates contributions
Modification 3d (M3d)
8,400kJ (2,000kcal)38 5% of total dietary energy from free sugars6
11% of food energy from saturated fat7
6g salt37
Energy component removed from scoring
To ascertain whether the combination of the energy, saturated fat and sugars scores effectively duplicates contributions
Results of energy modelling (removing the energy component)
5.14 Removing the energy component from the scoring reduced the performance of the
model, particularly in relation to saturated fat and salt. See Table 10 M2d (no
energy scoring) and M3d (no energy scoring) for the results. This related to
specific categories for example crisps and savoury snacks (data not presented).
Retaining the energy component within the model was considered to reflect the
balance of decisions made when developing the original model.
Agreed outcome for energy: 8,400kJ (equivalent to 2,000kcal)
The 2018 review of the UK Nutrient Profiling Model
29
Sugars
5.15 The UK NPM 2004/5 initially included non-milk extrinsic sugars (NMES) as the
determinant of sugar content. The term NMES was replaced with total sugars in
the UK NPM 2004/5 following consultation feedback suggesting that this
addressed the practical difficulties associated with estimating NMES. Since then a
UK dietary recommendation for free sugars has been adopted.
Sugar modelling
5.16 Approaches based on total sugars or free sugars, using derived reference values,
were explored. The 3 approaches (also outlined in Table 3) were:
modification 1 - total sugars: 21% of food energy intake, in line with the
UK NPM 2004/5. Retaining a 10 point scale commencing at 3.75% of
the reference value, with increments of 3.75% of the reference value
modification 2 - a derivation representing total sugars modelled within
the refreshed Eatwell Guide, which reflects government
recommendations including those for free sugars (equivalent to total
sugars: 18% of food energy intake34). Retaining a 10 point scale
commencing at 3.75% of the reference value, with increments of 3.75%
of the reference value
modification 3 - a derivation of a free sugars DRV (free sugars: no more
than 5% of total dietary energy6). Retaining a 10 point scale
commencing at 3.75% of the reference value, with increments of 3.75%
of the DRV (see Appendix I for details of the free sugars assumptions)
Results of sugar modelling (modifications 1, 2 and 3)
5.17 When comparing modifications 1, 2 and 3 with the UK NPM 2004/5, all
modifications allowed fewer foods and drinks that were high in free and total
sugars to pass the draft 2018 NPM. Modification 3 performed better than
modifications 1 and 2 and allowed fewer foods and drinks high in free and total
sugars to pass the model compared with the UK NPM 2004/5. 176 (18%) foods
and drinks high in free sugars passed the UK NPM 2004/5 model (results
presented in Table 10), whilst for:
modification 1, 36 fewer foods and drinks high in free sugars (a
difference of 4 percentage points) passed the model compared to the UK
NPM 2004/5
The 2018 review of the UK Nutrient Profiling Model
30
modification 2, 60 fewer foods and drinks high in free sugars (a difference
of 6 percentage points) passed the model compared to the UK NPM
2004/5
modification 3, 155 fewer foods and drinks high in free sugars (a
difference of 16 percentage points) passed the model compared to the
UK NPM 2004/5
5.18 38 (6%) foods and drinks high in total sugars passed the UK NPM 2004/5 model
(results presented in Table 10), whilst for:
modification 1, 6 fewer foods and drinks high in total sugars (a difference
of 1 percentage point) passed the model compared to the UK NPM
2004/5
modification 2, 8 fewer foods and drinks high in total sugars (a difference
of 1 percentage point) passed the model compared to the UK NPM
2004/5
modification 3, 25 fewer foods and drinks high in total sugars (a
difference of 4 percentage points) passed the model compared to the UK
NPM 2004/5
Decisions on sugar modelling (modifications 1, 2 and 3)
5.19 Given the limited impact of modification 1 compared to modifications 2 and 3, no
further discussion or modelling utilising modification 1 was considered appropriate.
5.20 Given the current UK dietary recommendation for free sugars (no more than 5%
free sugars from total dietary energy) has halved from previous advice (<10% total
dietary energy from NMES) it was not surprising that more foods and drinks high
in free sugars did not pass modification 3 compared to modification 2 (based on
total sugars). For example, most fruit juices, vegetable juices and smoothies would
pass modification 2 whereas most would not pass modification 3. The increase in
free sugars was not offset by increasing scoring for fibre as nutrient composition
data shows that fruit juice is not a ‘source of fibre’ and government recommends
limiting fruit juice/smoothie intake to a combined total of 150ml a day.
5.21 Other food and drink products in certain categories, for example: sugar sweetened
drinks, yoghurts, desserts, some breakfast cereals and cereal bars, which
currently pass UK NPM 2004/5 and can be advertised, also did not pass
modification 3 due to their free sugars content.
5.22 The contribution of foods naturally high in sugars to a balanced diet was
addressed through the inclusion of scoring for fruit, vegetables and nuts in the UK
NPM 2004/5.
The 2018 review of the UK Nutrient Profiling Model
31
5.23 While there was a preference to utilise modification 3 (based on a free sugars
criterion) it was agreed that further revisions to modification 2 and modification 3
would be conducted before agreeing on the approach to be used in the draft 2018
NPM.
5.24 After further testing on fruit, vegetables and nuts, and fibre (paragraphs 5.30 –
5.36), it was agreed that free sugars should be adopted at 5% of total dietary
energy in line with UK dietary recommendations (equivalent to 24.7g based on
8,400kJ (equivalent to 2,000kcal) diet). Appendix L provides a free sugars
decision tree to help decide whether a food or drink contains free sugars. It may
be necessary to produce revised technical guidance to support how free sugars is
estimated.
Agreed outcome for sugars: Free sugars at 5% of total dietary energy (calculated
reference value of 24.7g based on 8,400kJ (equivalent to 2,000kcal) diet) retaining a
10 point scale commencing at 3.75% of the reference value, with increments of 3.75%
of the DRV.
Saturated Fat
5.25 As the UK dietary recommendation for saturated fat had not changed since
the UK NPM 2004/5 was developed, it was agreed that saturated fat would
remain at 11% of food energy7 (equivalent to 25g calculated based on an
8,400kJ (2,000kcal) diet and a conversion factor of 37kJ for 1g fat).
5.26 The reference value for saturated fat (11% of food energy based on
8,400kJ (2,000kcal) diet) applied to modifications 1, 2 and 3, showed that
no change was observed between the percentage of foods and drinks high
in saturated fat which passed modifications 1, 2 and 3. In comparison to
the UK NPM 2004/2005, approximately a difference of 10 products
(1 percentage point) was observed.
Agreed outcome for saturated fat: Retain the DRV for saturated fat at 11% of food energy (based on 8,400kJ (equivalent to 2,000kcal)) with a corresponding reference value of 25g.

The 2018 review of the UK Nutrient Profiling Model
32
Sodium
5.27 UK dietary recommendations are that, the maximum salt intake should be
no more than 6g a day (equivalent to 2,400mg sodium) for everyone over
11 years of age37 and the UK NPM 2004/5 sodium criterion is based on
these values. Adopting a revised salt reference value was considered
given the population were not currently consuming a diet at or below the
UK dietary recommendation. However, for consistency it was agreed to
retain the values used in the UK NPM 2004/5.
5.28 It was agreed that the use of salt rather than sodium would be consistent
with the mandatory nutrition declaration as presented in the Food
Information for Consumers (EU FIC) Regulation (EU) No 1169/201138.
5.29 Extending the scale for salt/sodium was initially considered as it was
suggested that extending the scales could be a driver to reduce population
salt intakes. However, the expert group considered that the approach used
should be consistent with that for the other ‘A’ nutrients and therefore
agreed not to extend the scale.
Agreed outcome for sodium: Replace sodium criterion with salt criterion in the draft 2018 NPM. Retain the maximum salt intake reference value used in the UK NPM 2004/5 at 6g/day.
The 2018 review of the UK Nutrient Profiling Model
33
Modifications to ‘C’ nutrients/food components (fruit, vegetables and nuts,
fibre and protein) in the UK NPM 2004/5
Fruit, vegetables and nuts modelling
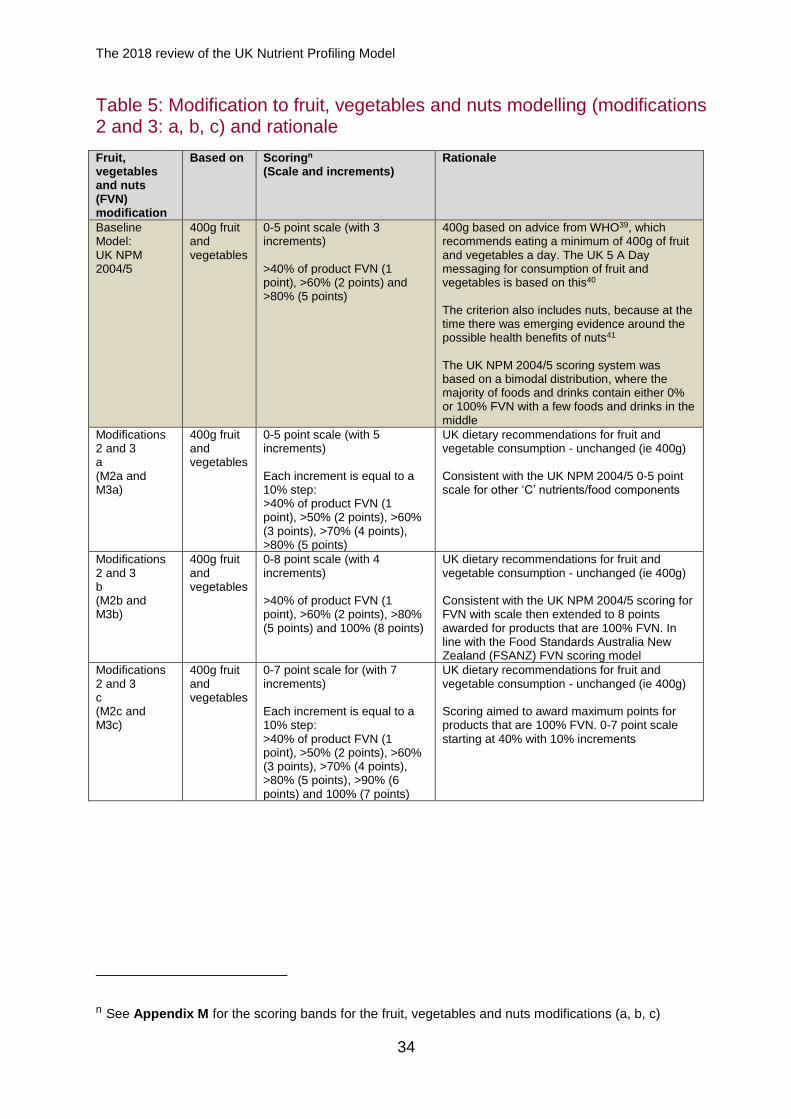
5.30 Options of extending the UK NPM 2004/5 scoring scale for fruit, vegetables and
nuts (FVN) were considered, given the change in public health advice on sugars
and fibre recommended by SACN. It was decided that this modification might bias
the outcome and mask the overall score for foods and drinks high in salt, sugar
and fat.
5.31 It was agreed to retain the 5 A Day recommendation of 400g, consistent with the
UK NPM 2004/5 and model extending the scale to allow for a product containing
100% FVN to score more points.
5.32 Modifications to fruit, vegetables and nuts (ie a, b, and c in modification 2 and
modification 3) are shown in Table 5.
The 2018 review of the UK Nutrient Profiling Model
34
Table 5: Modification to fruit, vegetables and nuts modelling (modifications 2 and 3: a, b, c) and rationale
Fruit, vegetables and nuts (FVN) modification
Based on Scoringn (Scale and increments)
Rationale
Baseline Model: UK NPM 2004/5
400g fruit and vegetables
0-5 point scale (with 3 increments) >40% of product FVN (1 point), >60% (2 points) and >80% (5 points)
400g based on advice from WHO39, which recommends eating a minimum of 400g of fruit and vegetables a day. The UK 5 A Day messaging for consumption of fruit and vegetables is based on this40 The criterion also includes nuts, because at the time there was emerging evidence around the possible health benefits of nuts41 The UK NPM 2004/5 scoring system was based on a bimodal distribution, where the majority of foods and drinks contain either 0% or 100% FVN with a few foods and drinks in the middle
Modifications 2 and 3 a (M2a and M3a)
400g fruit and vegetables
0-5 point scale (with 5 increments) Each increment is equal to a 10% step: >40% of product FVN (1 point), >50% (2 points), >60% (3 points), >70% (4 points), >80% (5 points)
UK dietary recommendations for fruit and vegetable consumption - unchanged (ie 400g) Consistent with the UK NPM 2004/5 0-5 point scale for other ‘C’ nutrients/food components
Modifications 2 and 3 b (M2b and M3b)
400g fruit and vegetables
0-8 point scale (with 4 increments) >40% of product FVN (1 point), >60% (2 points), >80% (5 points) and 100% (8 points)
UK dietary recommendations for fruit and vegetable consumption - unchanged (ie 400g) Consistent with the UK NPM 2004/5 scoring for FVN with scale then extended to 8 points awarded for products that are 100% FVN. In line with the Food Standards Australia New Zealand (FSANZ) FVN scoring model
Modifications 2 and 3 c (M2c and M3c)
400g fruit and vegetables
0-7 point scale for (with 7 increments) Each increment is equal to a 10% step: >40% of product FVN (1 point), >50% (2 points), >60% (3 points), >70% (4 points), >80% (5 points), >90% (6 points) and 100% (7 points)
UK dietary recommendations for fruit and vegetable consumption - unchanged (ie 400g) Scoring aimed to award maximum points for products that are 100% FVN. 0-7 point scale starting at 40% with 10% increments
n See Appendix M for the scoring bands for the fruit, vegetables and nuts modifications (a, b, c)
The 2018 review of the UK Nutrient Profiling Model
35
Results of fruit, vegetables and nuts modelling (a, b & c for modification 2 and
modification 3)
5.33 The UK NPM 2004/5 scoring system for FVN was based on a bimodal distribution.
The majority of foods and drinks used during testing of the UK NPM 2004/5
contained either 0% or 100% of FVN with a few foods and drinks in the middle.
5.34 Other performance measures for ‘source of fibre’ and ‘high fibre’ were used to
compare outcomes of the FVN modifications against the UK NPM 2004/5.
Adjustments to extend the FVN scoring within the model made little difference to
the performance of the model (see paragraph 4.13 for the other performance
measures).
5.35 Of 2,620 food and drink products in the NPM test dataset, there was a very
small/no difference in the overall number of foods and drinks passing the model in
modifications 2 and 3 with FVN scoring modifications a, b and c in comparison to
modifications 2 and 3 (Table 10).
5.36 It was concluded that there was no justification for making amendments to FVN
component of the UK NPM 2004/5.
Agreed outcome for fruit, vegetables and nuts: No change to the UK NPM 2004/5 approach and to retain at 400g/dayo.
Fibre
5.37 The current UK fibre recommendation of 30g AOAC fibre was considered to
represent an increased relevance for fibre in the NPM. While fruit, vegetables and
nuts were recognised within the UK NPM 2004/5 as acknowledging some fibre
content, the major ‘source of fibre’ in the UK diet is from cereals and cereal
products14. Different approaches to recognising the fibre content of foods and
drinks were therefore considered.
Fibre modelling
5.38 Approaches to adjusting the UK NPM 2004/5 to take into account the revised UK
dietary fibre recommendations were:
o The 400g/day relates to dietary guidance around 5 A Day. There are no dietary recommendations for
nut consumption
The 2018 review of the UK Nutrient Profiling Model
36
extending the maximum range of fibre content for which points are
awarded
adjusting the UK NPM 2004/5 proportionally to reflect the increase in fibre
adopting a maximum achievable score of 20% of the 30g reference value
for fibre, consistent with the approach used for other ‘C’ nutrients/food
components (protein, fruit, vegetables and nuts)
adopting a fibre reference value of 30g AOAC (equivalent NSP 22.5g) to
reflect the current fibre recommendations
adopting a reference value related to a nutrition claims definition of ‘high’
(6g AOAC fibre/100g) or ‘source’ (3g AOAC fibre/100g) of fibre
awarding additional points for a given content of fibre within the UK NPM
2004/5
5.39 The aim of these modifications was to assess whether it would be possible to
promote the intake of fibre without encouraging high intake of free sugars. The
modified models looked at the impact on the number of foods that are considered
a ‘source of fibre’ or ‘high fibre’ that passed the UK NPM 2004/5.
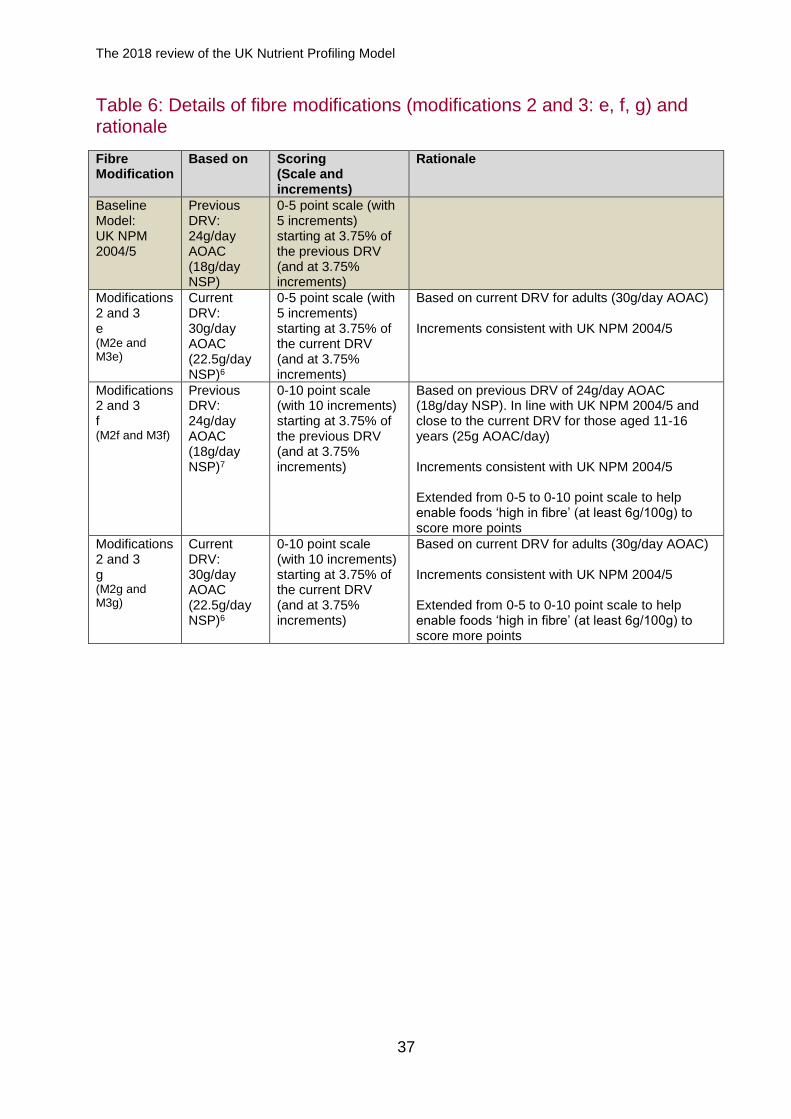
5.40 Modifications 2 and 3 were undertaken iteratively to assess the impact of:
adopting the 30g reference value while retaining a 5 point scale
retaining a 24g reference value with a 10 point scale
adopting the 30g reference value with a 10 point scale (modifications
M2e-g and M3e-g)
5.41 This initial modelling indicated that modification 3 performed better than
modification 2 at promoting fibre without encouraging high intake of free sugars.
Subsequent additional fibre adaptations were applied to modification 3
(modifications h-p). The details of these fibre modifications and rationale are
described in Tables 6 and 7. For details of the points scale and scoring bands see
Appendix M.
The 2018 review of the UK Nutrient Profiling Model
37
Table 6: Details of fibre modifications (modifications 2 and 3: e, f, g) and rationale
Fibre Modification
Based on Scoring (Scale and increments)
Rationale
Baseline Model: UK NPM 2004/5
Previous DRV: 24g/day AOAC (18g/day NSP)
0-5 point scale (with 5 increments) starting at 3.75% of the previous DRV (and at 3.75% increments)
Modifications 2 and 3 e (M2e and M3e)
Current DRV: 30g/day AOAC (22.5g/day NSP)6
0-5 point scale (with 5 increments) starting at 3.75% of the current DRV (and at 3.75% increments)
Based on current DRV for adults (30g/day AOAC) Increments consistent with UK NPM 2004/5
Modifications 2 and 3 f (M2f and M3f)
Previous DRV: 24g/day AOAC (18g/day NSP)7
0-10 point scale (with 10 increments) starting at 3.75% of the previous DRV (and at 3.75% increments)
Based on previous DRV of 24g/day AOAC (18g/day NSP). In line with UK NPM 2004/5 and close to the current DRV for those aged 11-16 years (25g AOAC/day) Increments consistent with UK NPM 2004/5 Extended from 0-5 to 0-10 point scale to help enable foods ‘high in fibre’ (at least 6g/100g) to score more points
Modifications 2 and 3 g (M2g and M3g)
Current DRV: 30g/day AOAC (22.5g/day NSP)6
0-10 point scale (with 10 increments) starting at 3.75% of the current DRV (and at 3.75% increments)
Based on current DRV for adults (30g/day AOAC) Increments consistent with UK NPM 2004/5 Extended from 0-5 to 0-10 point scale to help enable foods ‘high in fibre’ (at least 6g/100g) to score more points
The 2018 review of the UK Nutrient Profiling Model
38
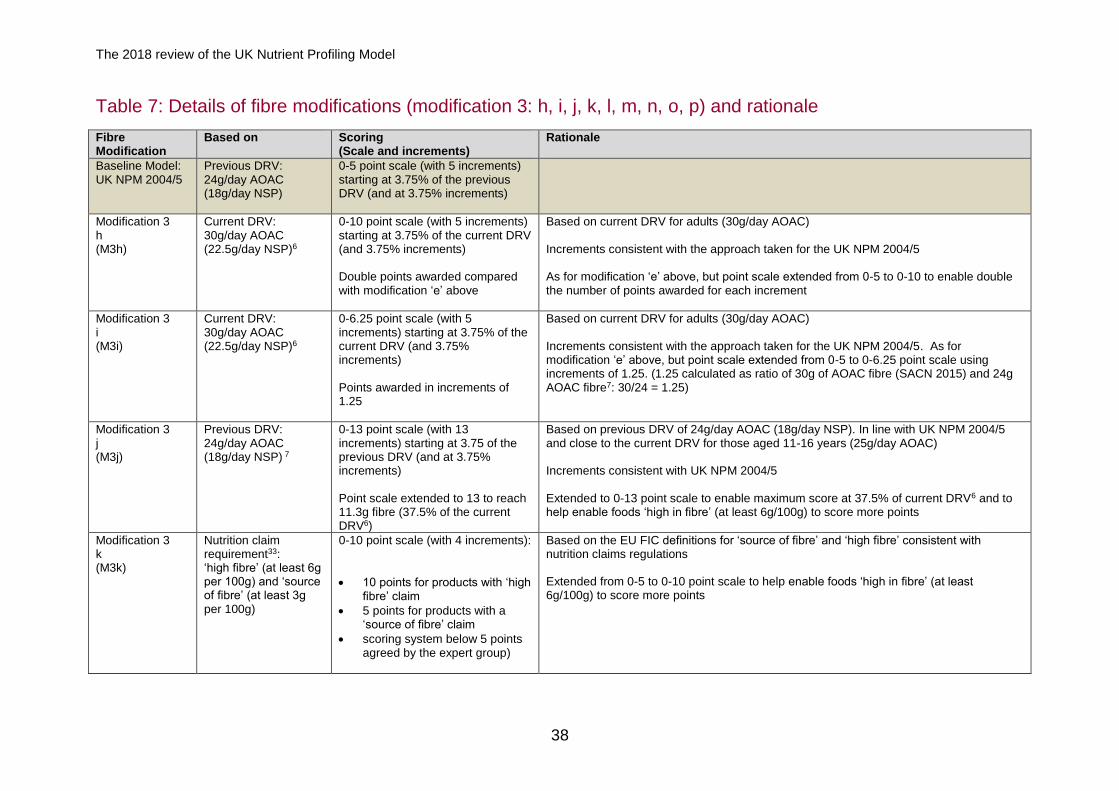
Table 7: Details of fibre modifications (modification 3: h, i, j, k, l, m, n, o, p) and rationale
Fibre Modification
Based on Scoring (Scale and increments)
Rationale
Baseline Model: UK NPM 2004/5
Previous DRV: 24g/day AOAC (18g/day NSP)
0-5 point scale (with 5 increments) starting at 3.75% of the previous DRV (and at 3.75% increments)
Modification 3 h (M3h)
Current DRV: 30g/day AOAC (22.5g/day NSP)6
0-10 point scale (with 5 increments) starting at 3.75% of the current DRV (and 3.75% increments) Double points awarded compared with modification ‘e’ above
Based on current DRV for adults (30g/day AOAC) Increments consistent with the approach taken for the UK NPM 2004/5 As for modification ‘e’ above, but point scale extended from 0-5 to 0-10 to enable double the number of points awarded for each increment
Modification 3 i (M3i)
Current DRV: 30g/day AOAC (22.5g/day NSP)6
0-6.25 point scale (with 5 increments) starting at 3.75% of the current DRV (and 3.75% increments) Points awarded in increments of 1.25
Based on current DRV for adults (30g/day AOAC) Increments consistent with the approach taken for the UK NPM 2004/5. As for modification ‘e’ above, but point scale extended from 0-5 to 0-6.25 point scale using increments of 1.25. (1.25 calculated as ratio of 30g of AOAC fibre (SACN 2015) and 24g AOAC fibre7: 30/24 = 1.25)
Modification 3 j (M3j)
Previous DRV: 24g/day AOAC (18g/day NSP) 7
0-13 point scale (with 13 increments) starting at 3.75 of the previous DRV (and at 3.75% increments) Point scale extended to 13 to reach 11.3g fibre (37.5% of the current DRV6)
Based on previous DRV of 24g/day AOAC (18g/day NSP). In line with UK NPM 2004/5 and close to the current DRV for those aged 11-16 years (25g/day AOAC) Increments consistent with UK NPM 2004/5 Extended to 0-13 point scale to enable maximum score at 37.5% of current DRV6 and to help enable foods ‘high in fibre’ (at least 6g/100g) to score more points
Modification 3 k (M3k)
Nutrition claim requirement33: ‘high fibre’ (at least 6g per 100g) and ‘source of fibre’ (at least 3g per 100g)
0-10 point scale (with 4 increments):
10 points for products with ‘high fibre’ claim
5 points for products with a ‘source of fibre’ claim
scoring system below 5 points agreed by the expert group)
Based on the EU FIC definitions for ‘source of fibre’ and ‘high fibre’ consistent with nutrition claims regulations Extended from 0-5 to 0-10 point scale to help enable foods ‘high in fibre’ (at least 6g/100g) to score more points
The 2018 review of the UK Nutrient Profiling Model
39
Fibre modification
Based on Scoring (Scale and increments)
Rationale
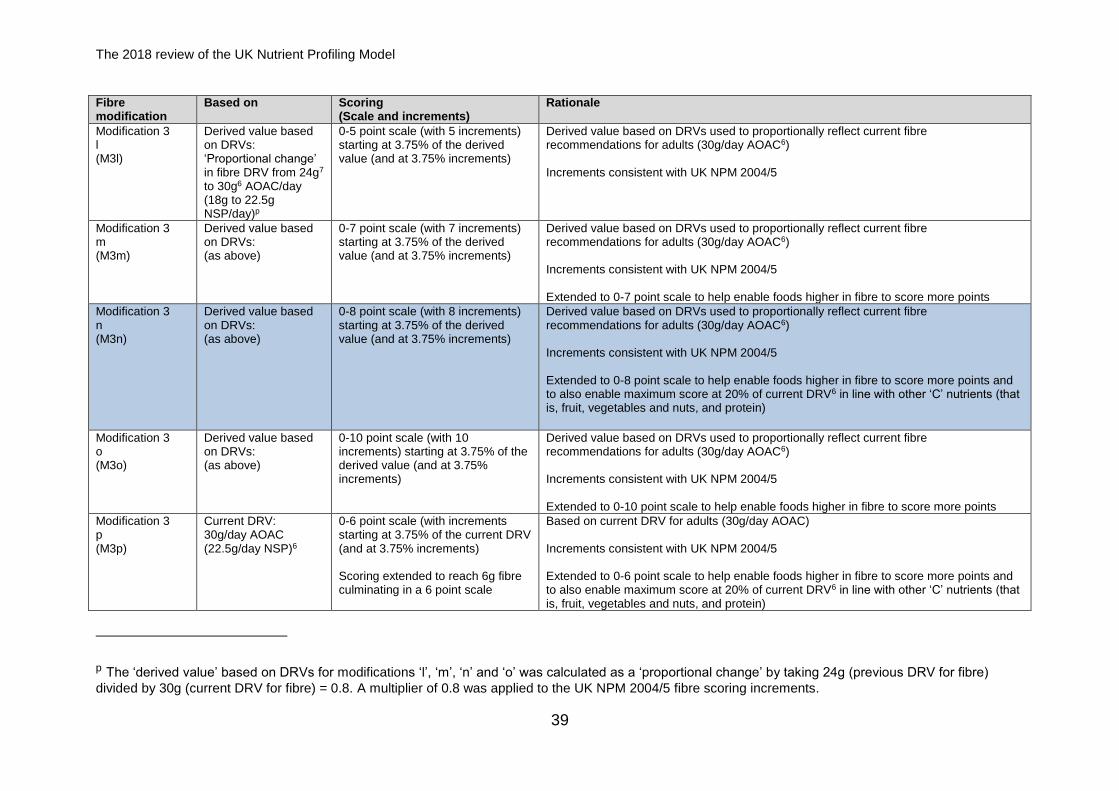
Modification 3 l (M3l)
Derived value based on DRVs: ‘Proportional change’ in fibre DRV from 24g7 to 30g6 AOAC/day (18g to 22.5g NSP/day)p
0-5 point scale (with 5 increments) starting at 3.75% of the derived value (and at 3.75% increments)
Derived value based on DRVs used to proportionally reflect current fibre recommendations for adults (30g/day AOAC6) Increments consistent with UK NPM 2004/5
Modification 3 m (M3m)
Derived value based on DRVs: (as above)
0-7 point scale (with 7 increments) starting at 3.75% of the derived value (and at 3.75% increments)
Derived value based on DRVs used to proportionally reflect current fibre recommendations for adults (30g/day AOAC6) Increments consistent with UK NPM 2004/5 Extended to 0-7 point scale to help enable foods higher in fibre to score more points
Modification 3 n (M3n)
Derived value based on DRVs: (as above)
0-8 point scale (with 8 increments) starting at 3.75% of the derived value (and at 3.75% increments)
Derived value based on DRVs used to proportionally reflect current fibre recommendations for adults (30g/day AOAC6) Increments consistent with UK NPM 2004/5 Extended to 0-8 point scale to help enable foods higher in fibre to score more points and to also enable maximum score at 20% of current DRV6 in line with other ‘C’ nutrients (that is, fruit, vegetables and nuts, and protein)
Modification 3 o (M3o)
Derived value based on DRVs: (as above)
0-10 point scale (with 10 increments) starting at 3.75% of the derived value (and at 3.75% increments)
Derived value based on DRVs used to proportionally reflect current fibre recommendations for adults (30g/day AOAC6) Increments consistent with UK NPM 2004/5 Extended to 0-10 point scale to help enable foods higher in fibre to score more points
Modification 3 p (M3p)
Current DRV: 30g/day AOAC (22.5g/day NSP)6
0-6 point scale (with increments starting at 3.75% of the current DRV (and at 3.75% increments) Scoring extended to reach 6g fibre culminating in a 6 point scale
Based on current DRV for adults (30g/day AOAC) Increments consistent with UK NPM 2004/5 Extended to 0-6 point scale to help enable foods higher in fibre to score more points and to also enable maximum score at 20% of current DRV6 in line with other ‘C’ nutrients (that is, fruit, vegetables and nuts, and protein)
p The ‘derived value’ based on DRVs for modifications ‘l’, ‘m’, ‘n’ and ‘o’ was calculated as a ‘proportional change’ by taking 24g (previous DRV for fibre)
divided by 30g (current DRV for fibre) = 0.8. A multiplier of 0.8 was applied to the UK NPM 2004/5 fibre scoring increments.
The 2018 review of the UK Nutrient Profiling Model
40
Results of fibre modelling (modification 3: e, f, g, h, i, j, k, l, m, n, o, p)
5.42 Table 10 shows the results of fibre modifications (modification 3: e, f, g, h, i, j, k, l,
m, n, o and p) against the performance measures.
5.43 None of the modifications for fibre had a major impact on the overall number of
foods passing compared with the UK NPM 2004/5. It was considered that this was
likely to be the result of the impact of the greater change in the reduction of free
sugars compared to a smaller increase in the fibre component of the model.
5.44 Regardless of the fibre adaptations made, modification 3 consistently increased
the number of foods and drinks high in free sugars that would not pass compared
to the UK NPM 2004/5. For products high in free sugars this represented 155
fewer foods and drinks for modification 3 (difference of 16 percentage points),
compared to UK NPM 2004/5 (a total of 176 (18%) foods and drinks passing the
model). Modification 3 was chosen as the basis for further modifications.
5.45 The following further adaptations were conducted on modification 3. These aimed
to assess:
the impact for opportunities to encourage reformulation ie greater
amounts of fibre
impact on foods with lower amounts of fibre (‘source of fibre’)
5.46 Some adaptations of modification 3 resulted in fewer foods which met the
definition of ‘source of fibre’, passing the models compared to UK NPM 2004/5 (h,
i, k and p)
5.47 Other adaptations of modification 3 (for example, j, l, m, n and o) resulted in a
smaller number of foods with a lower fibre content (defined as ‘source of fibre’)
passing the model compared to modification 3 with no fibre adaptations.
5.48 Discussions then focused on whether fibre should be scored in the same way as
other ‘C’ nutrients/ food components and remain on a 5 point scale or whether the
scale should be extended to allow more points to be scored. There was little
difference in the impact of the different modifications, but the 5 point scale models
appeared to slightly increase the number of foods with a lower fibre content not
passing the model. Extending the scale resulted in slightly more foods, which are
either low or high in fibre gaining positive points for fibre.
The 2018 review of the UK Nutrient Profiling Model
41
Decisions of fibre modelling (modifications 3: e, f, g, h, i, j, k, l, m, n, o, p)
5.49 Modification 3n (fibre) was identified as the recommended fibre modification owing
to:
consistency with revised UK dietary recommendation of 30g AOAC fibre
(equivalent 22.5g NSP)
consistency with other ‘C’ nutrients in relation to the 20% score band
maximum
use of an 8 point scale to pragmatically emphasise the increased UK
recommendation for fibre
potential for contribution of greater fibre intake through recognising the
contribution of foods which contain a ‘source of fibre’ and encouraging
reformulation
Agreed outcome for fibre: reference value of 30g AOAC (equivalent to 22.5g NSP)
with scoring band adjusted as a proportional change from the existing UK NPM 2004/5
value of 24g (equivalent to 18g NSP). The maximum cut-off point relates to 20% of
reference value with an 8 point scale.
Protein
5.50 The focus of the UK NPM 2004/5 review was to align the model with
revised UK dietary recommendations for sugar and fibre. As the protein
criterion was not within the scope of the review, the expert group decided
to retain the weighted average of the Reference Nutrient Intake (RNI) for
protein7 in children aged 11-14 years and 15-18 years (42g of protein) as
the derived reference value. Preliminary analysis to model the impact of
adjusting the protein scoring, in line with the dietary recommendations for
adults in line with other nutrients in the NPM, made no material difference
to the outcome.
Agreed outcome for protein: Retain the derived reference value of 42g.
The 2018 review of the UK Nutrient Profiling Model
42
Summary of the changes to the draft 2018 NPM
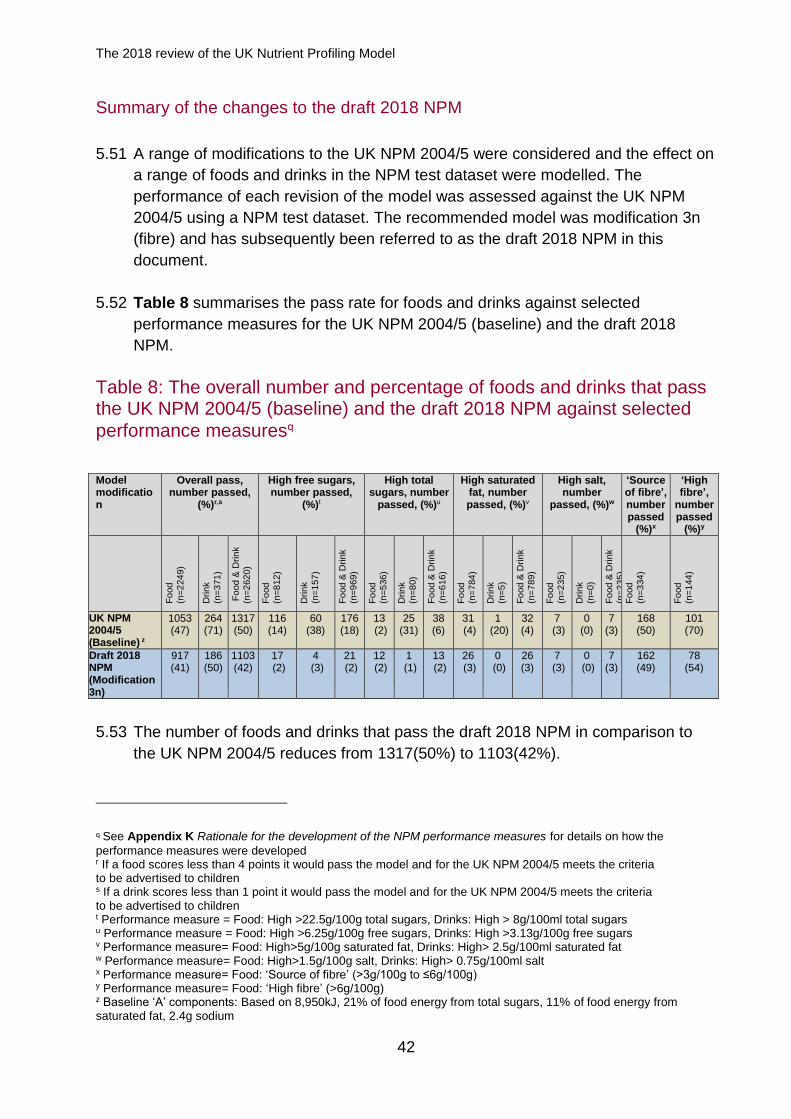
5.51 A range of modifications to the UK NPM 2004/5 were considered and the effect on
a range of foods and drinks in the NPM test dataset were modelled. The
performance of each revision of the model was assessed against the UK NPM
2004/5 using a NPM test dataset. The recommended model was modification 3n
(fibre) and has subsequently been referred to as the draft 2018 NPM in this
document.
5.52 Table 8 summarises the pass rate for foods and drinks against selected
performance measures for the UK NPM 2004/5 (baseline) and the draft 2018
NPM.
Table 8: The overall number and percentage of foods and drinks that pass the UK NPM 2004/5 (baseline) and the draft 2018 NPM against selected
performance measuresq
Model modification
Overall pass, number passed,
(%)r,s
High free sugars, number passed,
(%)t
High total sugars, number
passed, (%)u
High saturated fat, number passed, (%)v
High salt, number
passed, (%)w
‘Source of fibre’, number passed
(%)x
‘High fibre’,
number passed
(%)y
Fo
od
(n=
224
9)
Drink
(n=
371
)
Fo
od &
Drin
k
(n=
262
0)
Fo
od
(n=
812
)
Drink
(n=
157
)
Fo
od &
Drink
(n=
969
)
Fo
od
(n=
536
)
Drink
(n=
80)
Fo
od &
Drink
(n=
616
)
Fo
od
(n=
784
)
Drink
(n=
5)
Fo
od &
Drink
(n=
789
)
Fo
od
(n=
235
)
Drink
(n=
0)
Fo
od &
Drink
(n=
235
) F
ood
(n=
334
)
Fo
od
(n=
144
)
UK NPM 2004/5 (Baseline) z
1053 (47)
264 (71)
1317 (50)
116 (14)
60 (38)
176 (18)
13 (2)
25 (31)
38 (6)
31 (4)
1 (20)
32 (4)
7 (3)
0 (0)
7 (3)
168 (50)
101 (70)
Draft 2018 NPM (Modification 3n)
917 (41)
186 (50)
1103 (42)
17 (2)
4 (3)
21 (2)
12 (2)
1 (1)
13 (2)
26 (3)
0 (0)
26 (3)
7 (3)
0 (0)
7 (3)
162 (49)
78 (54)
5.53 The number of foods and drinks that pass the draft 2018 NPM in comparison to
the UK NPM 2004/5 reduces from 1317(50%) to 1103(42%).
q See Appendix K Rationale for the development of the NPM performance measures for details on how the
performance measures were developed r If a food scores less than 4 points it would pass the model and for the UK NPM 2004/5 meets the criteria to be advertised to children s If a drink scores less than 1 point it would pass the model and for the UK NPM 2004/5 meets the criteria to be advertised to children t Performance measure = Food: High >22.5g/100g total sugars, Drinks: High > 8g/100ml total sugars u Performance measure = Food: High >6.25g/100g free sugars, Drinks: High >3.13g/100g free sugars v Performance measure= Food: High>5g/100g saturated fat, Drinks: High> 2.5g/100ml saturated fat w Performance measure= Food: High>1.5g/100g salt, Drinks: High> 0.75g/100ml salt x Performance measure= Food: ‘Source of fibre’ (>3g/100g to ≤6g/100g) y Performance measure= Food: ‘High fibre’ (>6g/100g) z Baseline ‘A’ components: Based on 8,950kJ, 21% of food energy from total sugars, 11% of food energy from saturated fat, 2.4g sodium
The 2018 review of the UK Nutrient Profiling Model
43
5.54 The draft 2018 NPM has the following impact on primary and other performance
measures (ie foods and drinks passing the draft 2018 NPM compared to the UK
NPM 2004/5):
fewer foods and drinks high in free sugars pass the draft 2018 NPM
(n=21, 2%) in comparison to the UK NPM 2004/5 (n=176,18%)
fewer foods and drinks high in total sugars pass the draft 2018 NPM
(n=13, 2%) in comparison to the UK NPM 2004/5 (n=38, 6%)
fewer foods and drinks high in saturated fat pass the draft 2018 NPM
(n=26, 3%) in comparison to the UK NPM 2004/5 (n=32, 4%)
no change in the number of high salt foods and drinks passing the model
fewer foods with a ‘source of fibre’ pass the draft 2018 NPM (n=162,
49%) in comparison to the UK NPM 2004/5 (n=168,50%)
fewer foods with ‘high fibre’ pass the draft 2018 NPM (n=78, 54%) in
comparison to the UK NPM 2004/5 (n=101,70%)
5.55 Some of the foods ‘high in fibre’ that passed the UK NPM 2004/5 do not now pass
the draft 2018 NPM because of their free sugars content (some breakfast cereals
and cereal bars for example).
The 2018 review of the UK Nutrient Profiling Model
44
Results tables
6.1 This section presents the results tables that show the overall percentage of foods
and drinks in the NPM test dataset that pass the UK NPM 2004/5, and each
modification by category. It also presents the draft 2018 NPM compared to the UK
NPM 2004/5 (baseline).
6.2 Table 9 shows the overall percentage of foods and drinks in the NPM test dataset
that pass the UK NPM 2004/5 and at each modification (modification 1,
modification 2 and modification 3) by category.
6.3 Table 10 shows the overall percentage of foods and drinks in the NPM test
dataset that pass the UK NPM 2004/5 (baseline): for 3 sugar modifications
(modifications 1, 2 and 3: (see Table 3), for 3 fruit, vegetables and nuts
modifications (modifications a, b, c: see Table 5), 12 fibre modification
(modifications e, f, g, h, i, j, k, l, m, n, o, p; see Tables 6 and 7) and no energy
scoring against selected performance measures.
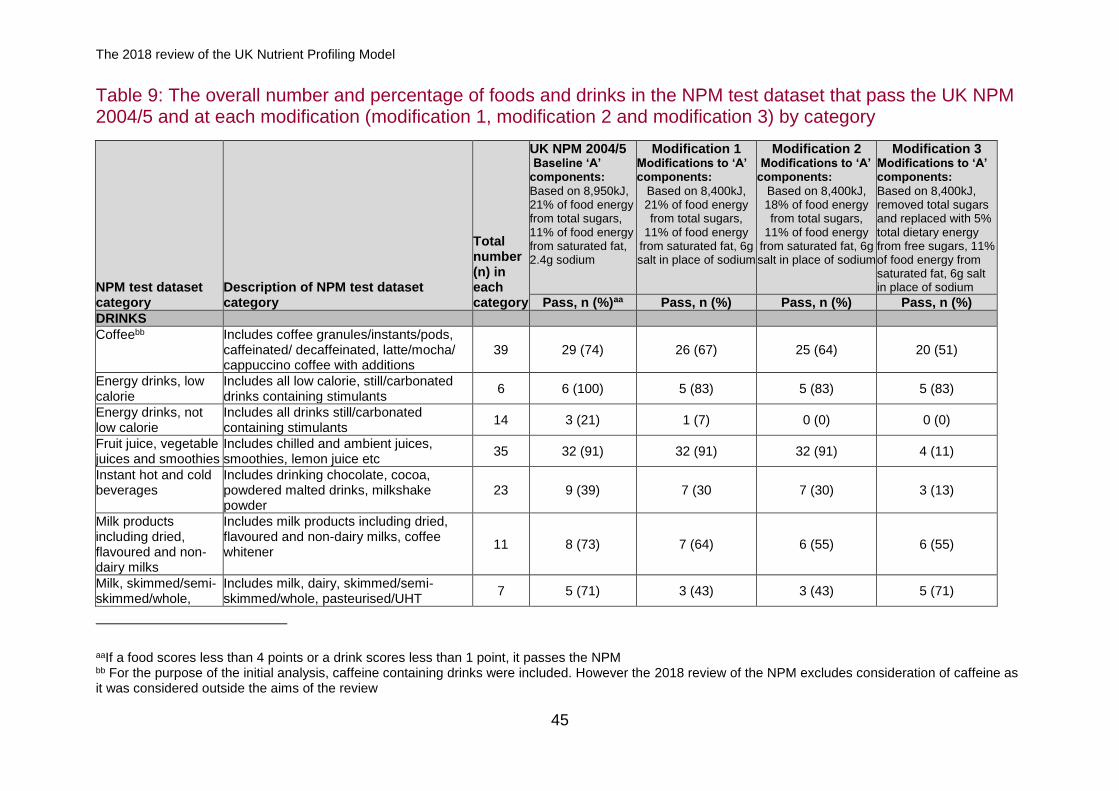
The 2018 review of the UK Nutrient Profiling Model
45
Table 9: The overall number and percentage of foods and drinks in the NPM test dataset that pass the UK NPM 2004/5 and at each modification (modification 1, modification 2 and modification 3) by category
NPM test dataset category
Description of NPM test dataset category
Total number (n) in each category
UK NPM 2004/5 Baseline ‘A’ components:
Based on 8,950kJ, 21% of food energy from total sugars, 11% of food energy from saturated fat, 2.4g sodium
Modification 1 Modifications to ‘A’ components:
Based on 8,400kJ, 21% of food energy from total sugars,
11% of food energy from saturated fat, 6g salt in place of sodium
Modification 2 Modifications to ‘A’ components:
Based on 8,400kJ, 18% of food energy from total sugars,
11% of food energy from saturated fat, 6g salt in place of sodium
Modification 3 Modifications to ‘A’ components:
Based on 8,400kJ, removed total sugars and replaced with 5% total dietary energy from free sugars, 11% of food energy from saturated fat, 6g salt in place of sodium
Pass, n (%)aa Pass, n (%) Pass, n (%) Pass, n (%)
DRINKS
Coffeebb Includes coffee granules/instants/pods, caffeinated/ decaffeinated, latte/mocha/ cappuccino coffee with additions
39 29 (74) 26 (67) 25 (64) 20 (51)
Energy drinks, low calorie
Includes all low calorie, still/carbonated drinks containing stimulants
6 6 (100) 5 (83) 5 (83) 5 (83)
Energy drinks, not low calorie
Includes all drinks still/carbonated containing stimulants
14 3 (21) 1 (7) 0 (0) 0 (0)
Fruit juice, vegetable juices and smoothies
Includes chilled and ambient juices, smoothies, lemon juice etc
35 32 (91) 32 (91) 32 (91) 4 (11)
Instant hot and cold beverages
Includes drinking chocolate, cocoa, powdered malted drinks, milkshake powder
23 9 (39) 7 (30 7 (30) 3 (13)
Milk products including dried, flavoured and non-dairy milks
Includes milk products including dried, flavoured and non-dairy milks, coffee whitener
11 8 (73) 7 (64) 6 (55) 6 (55)
Milk, skimmed/semi-skimmed/whole,
Includes milk, dairy, skimmed/semi-skimmed/whole, pasteurised/UHT
7 5 (71) 3 (43) 3 (43) 5 (71)
aaIf a food scores less than 4 points or a drink scores less than 1 point, it passes the NPM bb For the purpose of the initial analysis, caffeine containing drinks were included. However the 2018 review of the NPM excludes consideration of caffeine as it was considered outside the aims of the review
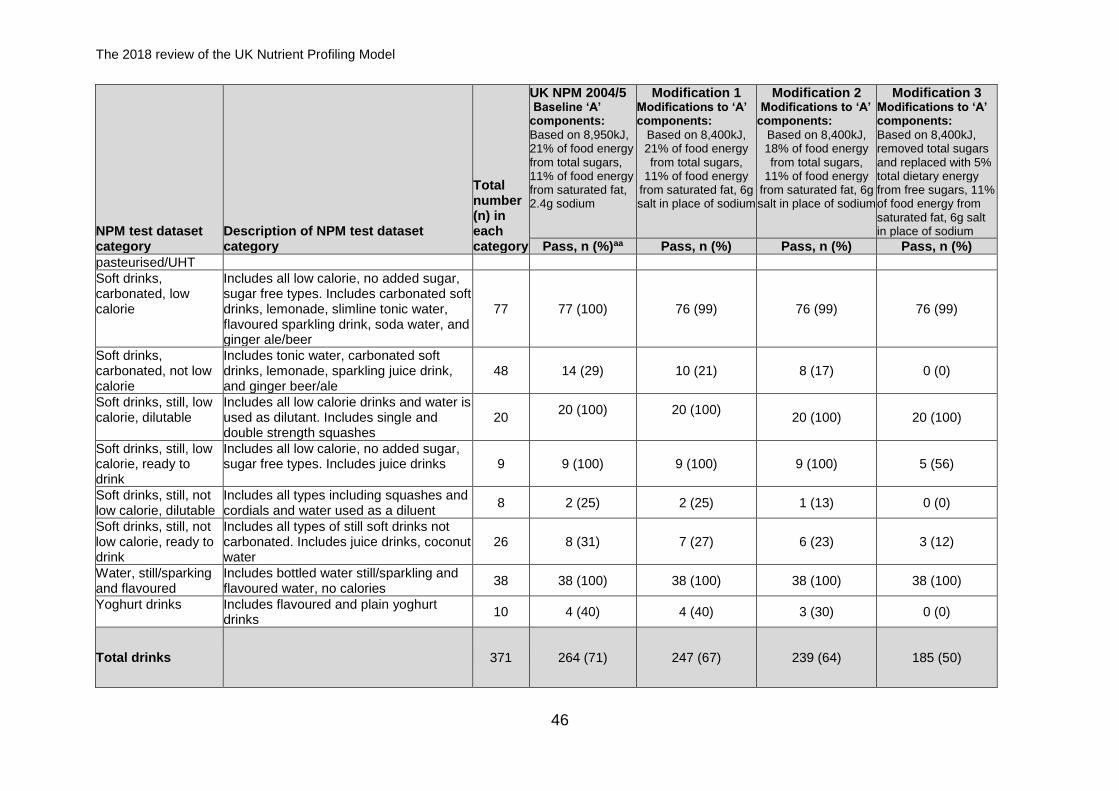
The 2018 review of the UK Nutrient Profiling Model
46
NPM test dataset category
Description of NPM test dataset category
Total number (n) in each category
UK NPM 2004/5 Baseline ‘A’ components:
Based on 8,950kJ, 21% of food energy from total sugars, 11% of food energy from saturated fat, 2.4g sodium
Modification 1 Modifications to ‘A’ components:
Based on 8,400kJ, 21% of food energy from total sugars,
11% of food energy from saturated fat, 6g salt in place of sodium
Modification 2 Modifications to ‘A’ components:
Based on 8,400kJ, 18% of food energy from total sugars,
11% of food energy from saturated fat, 6g salt in place of sodium
Modification 3 Modifications to ‘A’ components:
Based on 8,400kJ, removed total sugars and replaced with 5% total dietary energy from free sugars, 11% of food energy from saturated fat, 6g salt in place of sodium
Pass, n (%)aa Pass, n (%) Pass, n (%) Pass, n (%)
pasteurised/UHT
Soft drinks, carbonated, low calorie
Includes all low calorie, no added sugar, sugar free types. Includes carbonated soft drinks, lemonade, slimline tonic water, flavoured sparkling drink, soda water, and ginger ale/beer
77 77 (100) 76 (99) 76 (99) 76 (99)
Soft drinks, carbonated, not low calorie
Includes tonic water, carbonated soft drinks, lemonade, sparkling juice drink, and ginger beer/ale
48 14 (29) 10 (21) 8 (17) 0 (0)
Soft drinks, still, low calorie, dilutable
Includes all low calorie drinks and water is used as dilutant. Includes single and double strength squashes
20 20 (100)
20 (100)
20 (100) 20 (100)
Soft drinks, still, low calorie, ready to drink
Includes all low calorie, no added sugar, sugar free types. Includes juice drinks 9 9 (100) 9 (100) 9 (100) 5 (56)
Soft drinks, still, not low calorie, dilutable
Includes all types including squashes and cordials and water used as a diluent
8 2 (25) 2 (25) 1 (13) 0 (0)
Soft drinks, still, not low calorie, ready to drink
Includes all types of still soft drinks not carbonated. Includes juice drinks, coconut water
26 8 (31) 7 (27) 6 (23) 3 (12)
Water, still/sparking and flavoured
Includes bottled water still/sparkling and flavoured water, no calories
38 38 (100) 38 (100) 38 (100) 38 (100)
Yoghurt drinks Includes flavoured and plain yoghurt drinks
10 4 (40) 4 (40) 3 (30) 0 (0)
Total drinks
371 264 (71) 247 (67) 239 (64) 185 (50)
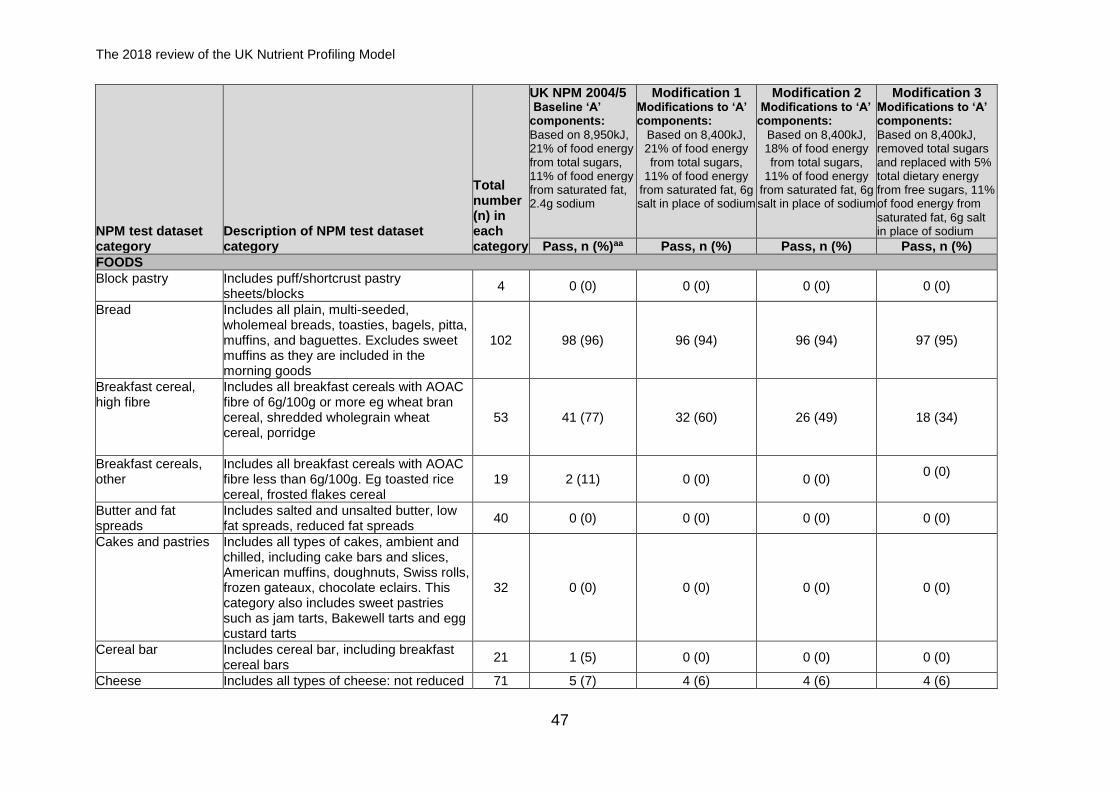
The 2018 review of the UK Nutrient Profiling Model
47
NPM test dataset category
Description of NPM test dataset category
Total number (n) in each category
UK NPM 2004/5 Baseline ‘A’ components:
Based on 8,950kJ, 21% of food energy from total sugars, 11% of food energy from saturated fat, 2.4g sodium
Modification 1 Modifications to ‘A’ components:
Based on 8,400kJ, 21% of food energy from total sugars,
11% of food energy from saturated fat, 6g salt in place of sodium
Modification 2 Modifications to ‘A’ components:
Based on 8,400kJ, 18% of food energy from total sugars,
11% of food energy from saturated fat, 6g salt in place of sodium
Modification 3 Modifications to ‘A’ components:
Based on 8,400kJ, removed total sugars and replaced with 5% total dietary energy from free sugars, 11% of food energy from saturated fat, 6g salt in place of sodium
Pass, n (%)aa Pass, n (%) Pass, n (%) Pass, n (%)
FOODS
Block pastry Includes puff/shortcrust pastry sheets/blocks
4 0 (0) 0 (0) 0 (0) 0 (0)
Bread Includes all plain, multi-seeded, wholemeal breads, toasties, bagels, pitta, muffins, and baguettes. Excludes sweet muffins as they are included in the morning goods
102 98 (96) 96 (94) 96 (94) 97 (95)
Breakfast cereal, high fibre
Includes all breakfast cereals with AOAC fibre of 6g/100g or more eg wheat bran cereal, shredded wholegrain wheat cereal, porridge
53 41 (77) 32 (60) 26 (49) 18 (34)
Breakfast cereals, other
Includes all breakfast cereals with AOAC fibre less than 6g/100g. Eg toasted rice cereal, frosted flakes cereal
19 2 (11) 0 (0) 0 (0) 0 (0)
Butter and fat spreads
Includes salted and unsalted butter, low fat spreads, reduced fat spreads
40 0 (0) 0 (0) 0 (0) 0 (0)
Cakes and pastries Includes all types of cakes, ambient and chilled, including cake bars and slices, American muffins, doughnuts, Swiss rolls, frozen gateaux, chocolate eclairs. This category also includes sweet pastries such as jam tarts, Bakewell tarts and egg custard tarts
32 0 (0) 0 (0) 0 (0) 0 (0)
Cereal bar Includes cereal bar, including breakfast cereal bars
21 1 (5) 0 (0) 0 (0) 0 (0)
Cheese Includes all types of cheese: not reduced 71 5 (7) 4 (6) 4 (6) 4 (6)
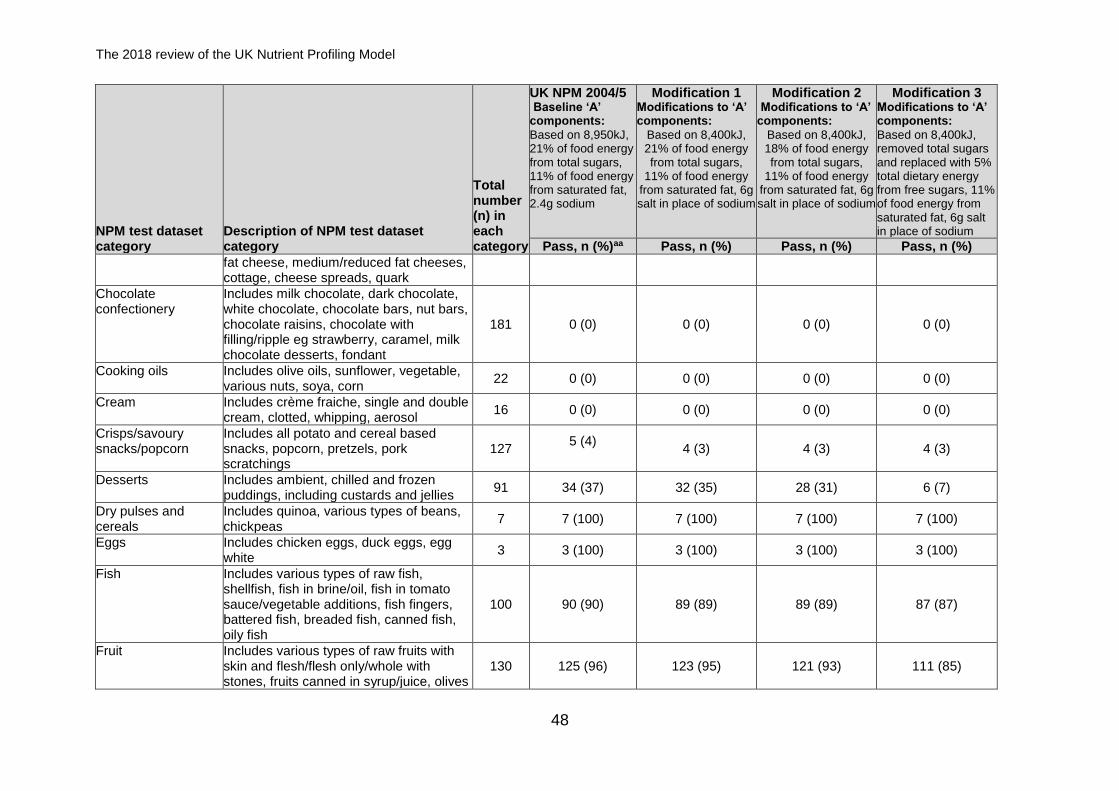
The 2018 review of the UK Nutrient Profiling Model
48
NPM test dataset category
Description of NPM test dataset category
Total number (n) in each category
UK NPM 2004/5 Baseline ‘A’ components:
Based on 8,950kJ, 21% of food energy from total sugars, 11% of food energy from saturated fat, 2.4g sodium
Modification 1 Modifications to ‘A’ components:
Based on 8,400kJ, 21% of food energy from total sugars,
11% of food energy from saturated fat, 6g salt in place of sodium
Modification 2 Modifications to ‘A’ components:
Based on 8,400kJ, 18% of food energy from total sugars,
11% of food energy from saturated fat, 6g salt in place of sodium
Modification 3 Modifications to ‘A’ components:
Based on 8,400kJ, removed total sugars and replaced with 5% total dietary energy from free sugars, 11% of food energy from saturated fat, 6g salt in place of sodium
Pass, n (%)aa Pass, n (%) Pass, n (%) Pass, n (%)
fat cheese, medium/reduced fat cheeses, cottage, cheese spreads, quark
Chocolate confectionery
Includes milk chocolate, dark chocolate, white chocolate, chocolate bars, nut bars, chocolate raisins, chocolate with filling/ripple eg strawberry, caramel, milk chocolate desserts, fondant
181 0 (0) 0 (0) 0 (0) 0 (0)
Cooking oils Includes olive oils, sunflower, vegetable, various nuts, soya, corn
22 0 (0) 0 (0) 0 (0) 0 (0)
Cream Includes crème fraiche, single and double cream, clotted, whipping, aerosol
16 0 (0) 0 (0) 0 (0) 0 (0)
Crisps/savoury snacks/popcorn
Includes all potato and cereal based snacks, popcorn, pretzels, pork scratchings
127 5 (4)
4 (3) 4 (3) 4 (3)
Desserts Includes ambient, chilled and frozen puddings, including custards and jellies
91 34 (37) 32 (35) 28 (31) 6 (7)
Dry pulses and cereals
Includes quinoa, various types of beans, chickpeas
7 7 (100) 7 (100) 7 (100) 7 (100)
Eggs Includes chicken eggs, duck eggs, egg white
3 3 (100) 3 (100) 3 (100) 3 (100)
Fish Includes various types of raw fish, shellfish, fish in brine/oil, fish in tomato sauce/vegetable additions, fish fingers, battered fish, breaded fish, canned fish, oily fish
100 90 (90) 89 (89) 89 (89) 87 (87)
Fruit Includes various types of raw fruits with skin and flesh/flesh only/whole with stones, fruits canned in syrup/juice, olives
130 125 (96) 123 (95) 121 (93) 111 (85)
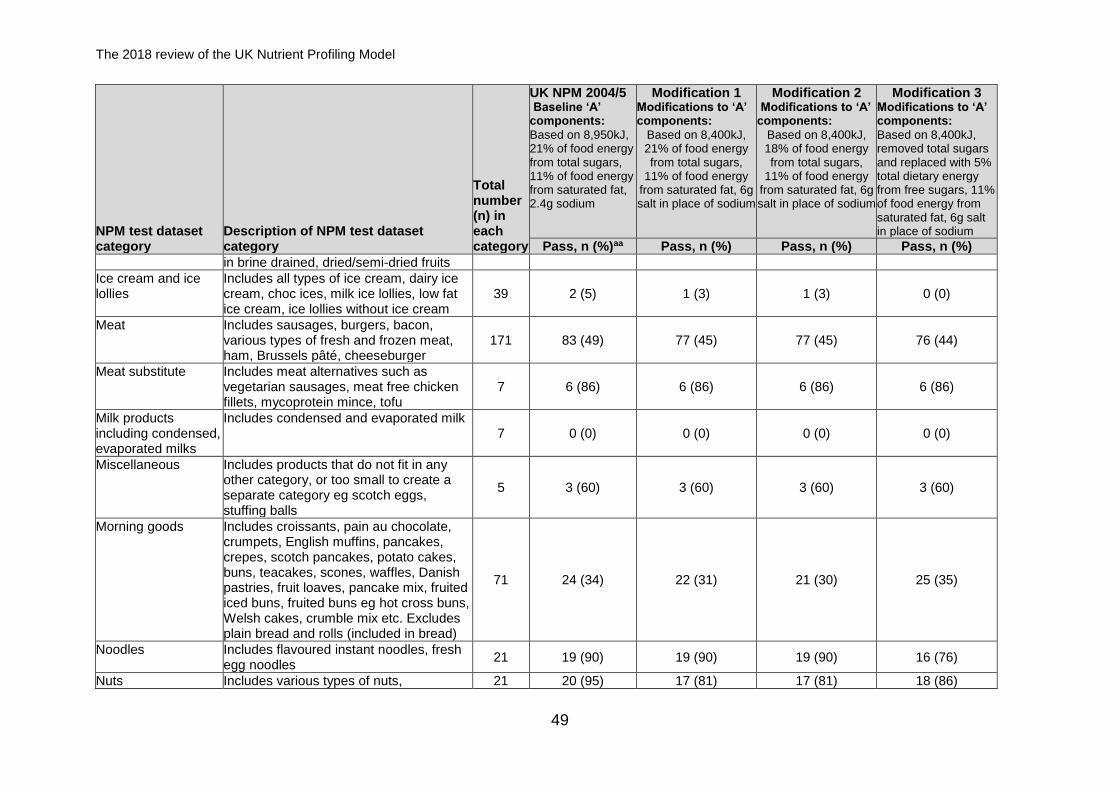
The 2018 review of the UK Nutrient Profiling Model
49
NPM test dataset category
Description of NPM test dataset category
Total number (n) in each category
UK NPM 2004/5 Baseline ‘A’ components:
Based on 8,950kJ, 21% of food energy from total sugars, 11% of food energy from saturated fat, 2.4g sodium
Modification 1 Modifications to ‘A’ components:
Based on 8,400kJ, 21% of food energy from total sugars,
11% of food energy from saturated fat, 6g salt in place of sodium
Modification 2 Modifications to ‘A’ components:
Based on 8,400kJ, 18% of food energy from total sugars,
11% of food energy from saturated fat, 6g salt in place of sodium
Modification 3 Modifications to ‘A’ components:
Based on 8,400kJ, removed total sugars and replaced with 5% total dietary energy from free sugars, 11% of food energy from saturated fat, 6g salt in place of sodium
Pass, n (%)aa Pass, n (%) Pass, n (%) Pass, n (%)
in brine drained, dried/semi-dried fruits
Ice cream and ice lollies
Includes all types of ice cream, dairy ice cream, choc ices, milk ice lollies, low fat ice cream, ice lollies without ice cream
39 2 (5) 1 (3) 1 (3) 0 (0)
Meat Includes sausages, burgers, bacon, various types of fresh and frozen meat, ham, Brussels pâté, cheeseburger
171 83 (49) 77 (45) 77 (45) 76 (44)
Meat substitute Includes meat alternatives such as vegetarian sausages, meat free chicken fillets, mycoprotein mince, tofu
7 6 (86) 6 (86) 6 (86) 6 (86)
Milk products including condensed, evaporated milks
Includes condensed and evaporated milk 7 0 (0) 0 (0) 0 (0) 0 (0)
Miscellaneous Includes products that do not fit in any other category, or too small to create a separate category eg scotch eggs, stuffing balls
5 3 (60) 3 (60) 3 (60) 3 (60)
Morning goods Includes croissants, pain au chocolate, crumpets, English muffins, pancakes, crepes, scotch pancakes, potato cakes, buns, teacakes, scones, waffles, Danish pastries, fruit loaves, pancake mix, fruited iced buns, fruited buns eg hot cross buns, Welsh cakes, crumble mix etc. Excludes plain bread and rolls (included in bread)
71 24 (34) 22 (31) 21 (30) 25 (35)
Noodles Includes flavoured instant noodles, fresh egg noodles
21 19 (90) 19 (90) 19 (90) 16 (76)
Nuts Includes various types of nuts, 21 20 (95) 17 (81) 17 (81) 18 (86)
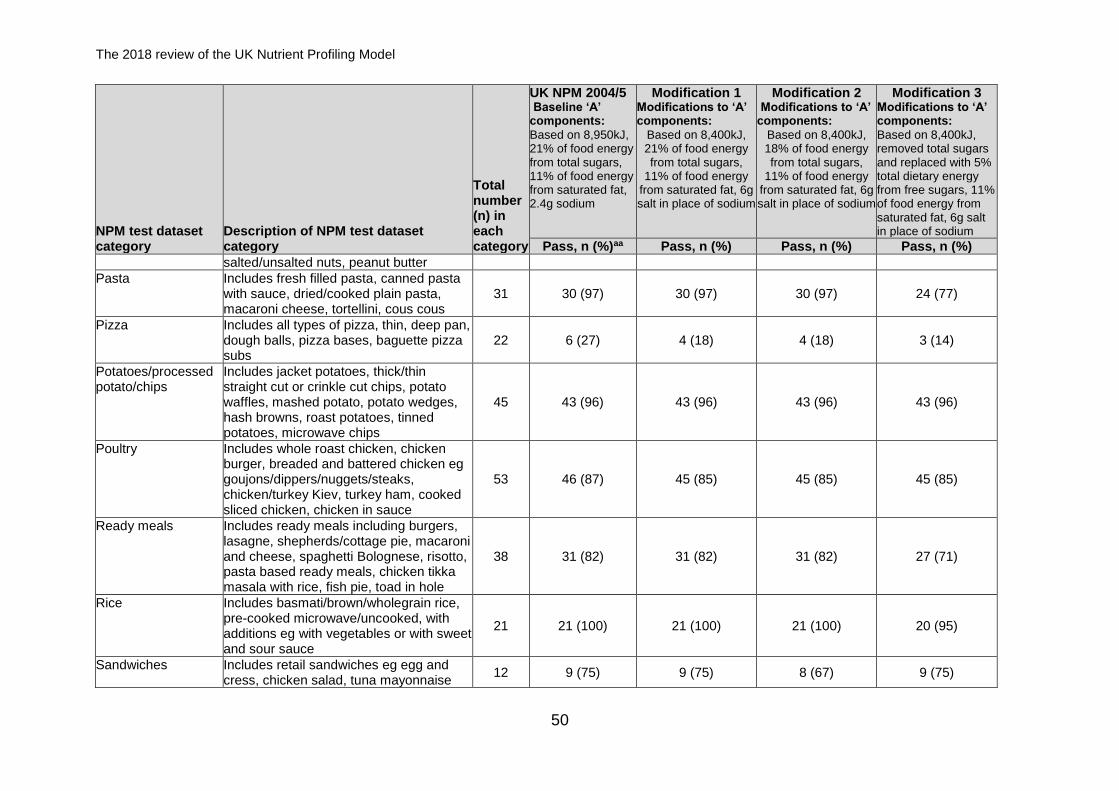
The 2018 review of the UK Nutrient Profiling Model
50
NPM test dataset category
Description of NPM test dataset category
Total number (n) in each category
UK NPM 2004/5 Baseline ‘A’ components:
Based on 8,950kJ, 21% of food energy from total sugars, 11% of food energy from saturated fat, 2.4g sodium
Modification 1 Modifications to ‘A’ components:
Based on 8,400kJ, 21% of food energy from total sugars,
11% of food energy from saturated fat, 6g salt in place of sodium
Modification 2 Modifications to ‘A’ components:
Based on 8,400kJ, 18% of food energy from total sugars,
11% of food energy from saturated fat, 6g salt in place of sodium
Modification 3 Modifications to ‘A’ components:
Based on 8,400kJ, removed total sugars and replaced with 5% total dietary energy from free sugars, 11% of food energy from saturated fat, 6g salt in place of sodium
Pass, n (%)aa Pass, n (%) Pass, n (%) Pass, n (%)
salted/unsalted nuts, peanut butter
Pasta Includes fresh filled pasta, canned pasta with sauce, dried/cooked plain pasta, macaroni cheese, tortellini, cous cous
31 30 (97) 30 (97) 30 (97) 24 (77)
Pizza Includes all types of pizza, thin, deep pan, dough balls, pizza bases, baguette pizza subs
22 6 (27) 4 (18) 4 (18) 3 (14)
Potatoes/processed potato/chips
Includes jacket potatoes, thick/thin straight cut or crinkle cut chips, potato waffles, mashed potato, potato wedges, hash browns, roast potatoes, tinned potatoes, microwave chips
45 43 (96) 43 (96) 43 (96) 43 (96)
Poultry Includes whole roast chicken, chicken burger, breaded and battered chicken eg goujons/dippers/nuggets/steaks, chicken/turkey Kiev, turkey ham, cooked sliced chicken, chicken in sauce
53 46 (87) 45 (85) 45 (85) 45 (85)
Ready meals Includes ready meals including burgers, lasagne, shepherds/cottage pie, macaroni and cheese, spaghetti Bolognese, risotto, pasta based ready meals, chicken tikka masala with rice, fish pie, toad in hole
38 31 (82) 31 (82) 31 (82) 27 (71)
Rice Includes basmati/brown/wholegrain rice, pre-cooked microwave/uncooked, with additions eg with vegetables or with sweet and sour sauce
21 21 (100) 21 (100) 21 (100) 20 (95)
Sandwiches Includes retail sandwiches eg egg and cress, chicken salad, tuna mayonnaise
12 9 (75) 9 (75) 8 (67) 9 (75)
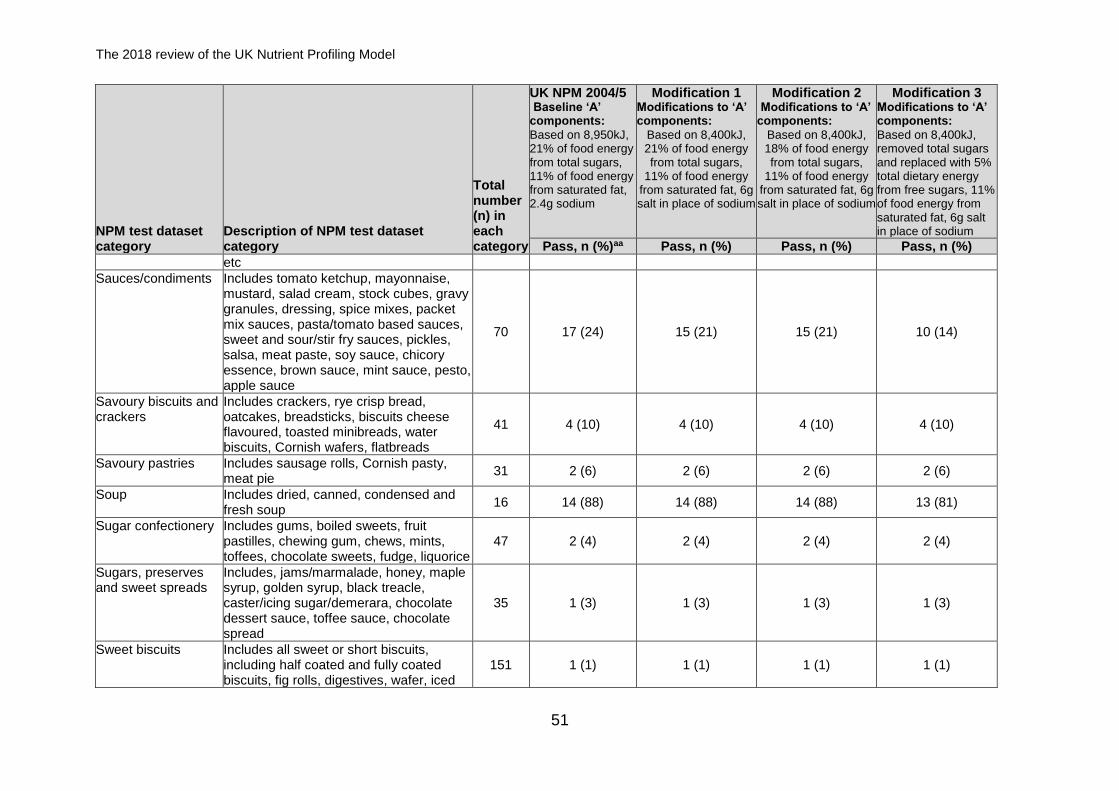
The 2018 review of the UK Nutrient Profiling Model
51
NPM test dataset category
Description of NPM test dataset category
Total number (n) in each category
UK NPM 2004/5 Baseline ‘A’ components:
Based on 8,950kJ, 21% of food energy from total sugars, 11% of food energy from saturated fat, 2.4g sodium
Modification 1 Modifications to ‘A’ components:
Based on 8,400kJ, 21% of food energy from total sugars,
11% of food energy from saturated fat, 6g salt in place of sodium
Modification 2 Modifications to ‘A’ components:
Based on 8,400kJ, 18% of food energy from total sugars,
11% of food energy from saturated fat, 6g salt in place of sodium
Modification 3 Modifications to ‘A’ components:
Based on 8,400kJ, removed total sugars and replaced with 5% total dietary energy from free sugars, 11% of food energy from saturated fat, 6g salt in place of sodium
Pass, n (%)aa Pass, n (%) Pass, n (%) Pass, n (%)
etc
Sauces/condiments Includes tomato ketchup, mayonnaise, mustard, salad cream, stock cubes, gravy granules, dressing, spice mixes, packet mix sauces, pasta/tomato based sauces, sweet and sour/stir fry sauces, pickles, salsa, meat paste, soy sauce, chicory essence, brown sauce, mint sauce, pesto, apple sauce
70 17 (24) 15 (21) 15 (21) 10 (14)
Savoury biscuits and crackers
Includes crackers, rye crisp bread, oatcakes, breadsticks, biscuits cheese flavoured, toasted minibreads, water biscuits, Cornish wafers, flatbreads
41 4 (10) 4 (10) 4 (10) 4 (10)
Savoury pastries Includes sausage rolls, Cornish pasty, meat pie
31 2 (6) 2 (6) 2 (6) 2 (6)
Soup Includes dried, canned, condensed and fresh soup
16 14 (88) 14 (88) 14 (88) 13 (81)
Sugar confectionery Includes gums, boiled sweets, fruit pastilles, chewing gum, chews, mints, toffees, chocolate sweets, fudge, liquorice
47 2 (4) 2 (4) 2 (4) 2 (4)
Sugars, preserves and sweet spreads
Includes, jams/marmalade, honey, maple syrup, golden syrup, black treacle, caster/icing sugar/demerara, chocolate dessert sauce, toffee sauce, chocolate spread
35 1 (3) 1 (3) 1 (3) 1 (3)
Sweet biscuits Includes all sweet or short biscuits, including half coated and fully coated biscuits, fig rolls, digestives, wafer, iced
151 1 (1) 1 (1) 1 (1) 1 (1)
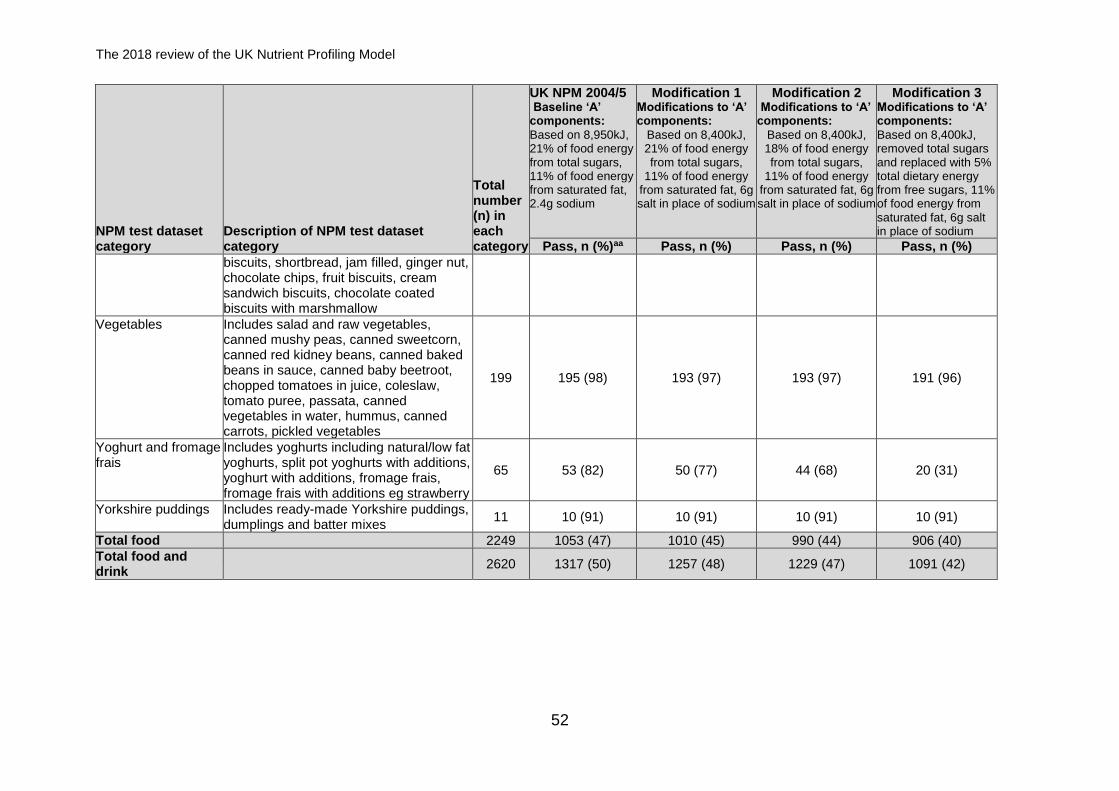
The 2018 review of the UK Nutrient Profiling Model
52
NPM test dataset category
Description of NPM test dataset category
Total number (n) in each category
UK NPM 2004/5 Baseline ‘A’ components:
Based on 8,950kJ, 21% of food energy from total sugars, 11% of food energy from saturated fat, 2.4g sodium
Modification 1 Modifications to ‘A’ components:
Based on 8,400kJ, 21% of food energy from total sugars,
11% of food energy from saturated fat, 6g salt in place of sodium
Modification 2 Modifications to ‘A’ components:
Based on 8,400kJ, 18% of food energy from total sugars,
11% of food energy from saturated fat, 6g salt in place of sodium
Modification 3 Modifications to ‘A’ components:
Based on 8,400kJ, removed total sugars and replaced with 5% total dietary energy from free sugars, 11% of food energy from saturated fat, 6g salt in place of sodium
Pass, n (%)aa Pass, n (%) Pass, n (%) Pass, n (%)
biscuits, shortbread, jam filled, ginger nut, chocolate chips, fruit biscuits, cream sandwich biscuits, chocolate coated biscuits with marshmallow
Vegetables Includes salad and raw vegetables, canned mushy peas, canned sweetcorn, canned red kidney beans, canned baked beans in sauce, canned baby beetroot, chopped tomatoes in juice, coleslaw, tomato puree, passata, canned vegetables in water, hummus, canned carrots, pickled vegetables
199 195 (98) 193 (97) 193 (97) 191 (96)
Yoghurt and fromage frais
Includes yoghurts including natural/low fat yoghurts, split pot yoghurts with additions, yoghurt with additions, fromage frais, fromage frais with additions eg strawberry
65 53 (82) 50 (77) 44 (68) 20 (31)
Yorkshire puddings Includes ready-made Yorkshire puddings, dumplings and batter mixes
11 10 (91) 10 (91) 10 (91) 10 (91)
Total food 2249 1053 (47) 1010 (45) 990 (44) 906 (40)
Total food and drink
2620 1317 (50) 1257 (48) 1229 (47) 1091 (42)
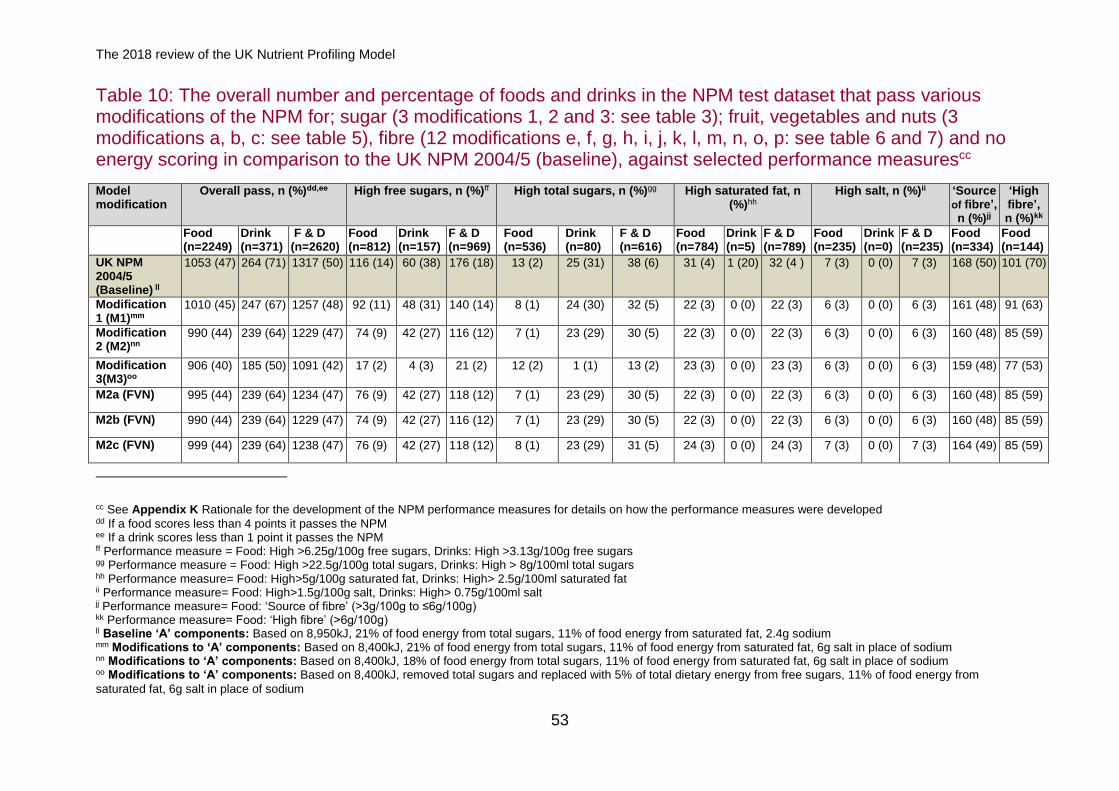
The 2018 review of the UK Nutrient Profiling Model
53
Table 10: The overall number and percentage of foods and drinks in the NPM test dataset that pass various modifications of the NPM for; sugar (3 modifications 1, 2 and 3: see table 3); fruit, vegetables and nuts (3 modifications a, b, c: see table 5), fibre (12 modifications e, f, g, h, i, j, k, l, m, n, o, p: see table 6 and 7) and no energy scoring in comparison to the UK NPM 2004/5 (baseline), against selected performance measurescc
Model modification
Overall pass, n (%)dd,ee High free sugars, n (%)ff High total sugars, n (%)gg High saturated fat, n (%)hh
High salt, n (%)ii ‘Source of fibre’, n (%)jj
‘High fibre’, n (%)kk
Food (n=2249)
Drink (n=371)
F & D (n=2620)
Food (n=812)
Drink (n=157)
F & D (n=969)
Food (n=536)
Drink (n=80)
F & D (n=616)
Food (n=784)
Drink (n=5)
F & D (n=789)
Food (n=235)
Drink (n=0)
F & D (n=235)
Food (n=334)
Food (n=144)
UK NPM 2004/5 (Baseline) ll
1053 (47) 264 (71) 1317 (50) 116 (14) 60 (38) 176 (18) 13 (2) 25 (31) 38 (6) 31 (4) 1 (20) 32 (4 ) 7 (3) 0 (0) 7 (3) 168 (50) 101 (70)
Modification 1 (M1)mm
1010 (45) 247 (67) 1257 (48) 92 (11) 48 (31) 140 (14) 8 (1) 24 (30) 32 (5) 22 (3) 0 (0) 22 (3) 6 (3) 0 (0) 6 (3) 161 (48) 91 (63)
Modification 2 (M2)nn
990 (44) 239 (64) 1229 (47) 74 (9) 42 (27) 116 (12) 7 (1) 23 (29) 30 (5) 22 (3) 0 (0) 22 (3) 6 (3) 0 (0) 6 (3) 160 (48) 85 (59)
Modification 3(M3)oo
906 (40) 185 (50) 1091 (42) 17 (2) 4 (3) 21 (2) 12 (2) 1 (1) 13 (2) 23 (3) 0 (0) 23 (3) 6 (3) 0 (0) 6 (3) 159 (48) 77 (53)
M2a (FVN) 995 (44) 239 (64) 1234 (47) 76 (9) 42 (27) 118 (12) 7 (1) 23 (29) 30 (5) 22 (3) 0 (0) 22 (3) 6 (3) 0 (0) 6 (3) 160 (48) 85 (59)
M2b (FVN) 990 (44) 239 (64) 1229 (47) 74 (9) 42 (27) 116 (12) 7 (1) 23 (29) 30 (5) 22 (3) 0 (0) 22 (3) 6 (3) 0 (0) 6 (3) 160 (48) 85 (59)
M2c (FVN) 999 (44) 239 (64) 1238 (47) 76 (9) 42 (27) 118 (12) 8 (1) 23 (29) 31 (5) 24 (3) 0 (0) 24 (3) 7 (3) 0 (0) 7 (3) 164 (49) 85 (59)
cc See Appendix K Rationale for the development of the NPM performance measures for details on how the performance measures were developed dd If a food scores less than 4 points it passes the NPM ee If a drink scores less than 1 point it passes the NPM ff Performance measure = Food: High >6.25g/100g free sugars, Drinks: High >3.13g/100g free sugars gg Performance measure = Food: High >22.5g/100g total sugars, Drinks: High > 8g/100ml total sugars hh Performance measure= Food: High>5g/100g saturated fat, Drinks: High> 2.5g/100ml saturated fat ii Performance measure= Food: High>1.5g/100g salt, Drinks: High> 0.75g/100ml salt jj Performance measure= Food: ‘Source of fibre’ (>3g/100g to ≤6g/100g) kk Performance measure= Food: ‘High fibre’ (>6g/100g) ll Baseline ‘A’ components: Based on 8,950kJ, 21% of food energy from total sugars, 11% of food energy from saturated fat, 2.4g sodium mm Modifications to ‘A’ components: Based on 8,400kJ, 21% of food energy from total sugars, 11% of food energy from saturated fat, 6g salt in place of sodium nn Modifications to ‘A’ components: Based on 8,400kJ, 18% of food energy from total sugars, 11% of food energy from saturated fat, 6g salt in place of sodium oo Modifications to ‘A’ components: Based on 8,400kJ, removed total sugars and replaced with 5% of total dietary energy from free sugars, 11% of food energy from
saturated fat, 6g salt in place of sodium
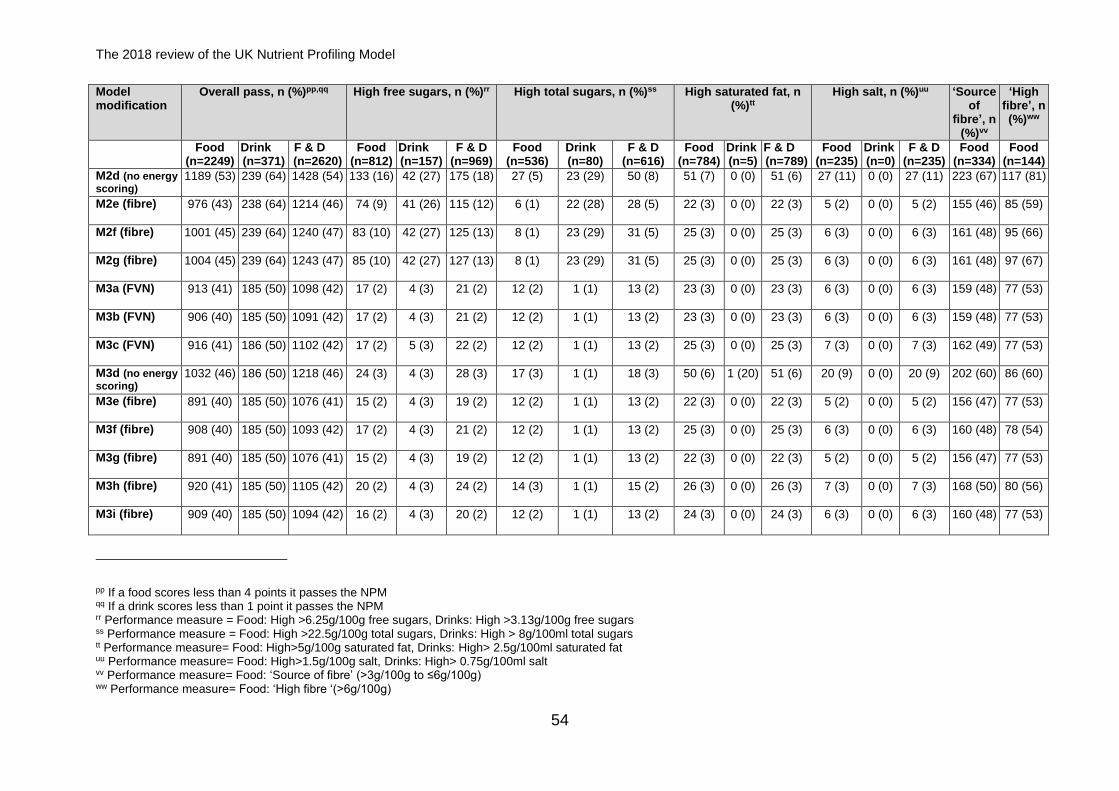
The 2018 review of the UK Nutrient Profiling Model
54
Model modification
Overall pass, n (%)pp,qq High free sugars, n (%)rr High total sugars, n (%)ss High saturated fat, n (%)tt
High salt, n (%)uu ‘Source of
fibre’, n (%)vv
‘High fibre’, n (%)ww
Food (n=2249)
Drink (n=371)
F & D (n=2620)
Food (n=812)
Drink (n=157)
F & D (n=969)
Food (n=536)
Drink (n=80)
F & D (n=616)
Food (n=784)
Drink (n=5)
F & D (n=789)
Food (n=235)
Drink (n=0)
F & D (n=235)
Food (n=334)
Food (n=144)
M2d (no energy
scoring) 1189 (53) 239 (64) 1428 (54) 133 (16)
42 (27)
175 (18)
27 (5) 23 (29) 50 (8) 51 (7)
0 (0)
51 (6) 27 (11)
0 (0)
27 (11)
223 (67) 117 (81)
M2e (fibre) 976 (43)
238 (64) 1214 (46) 74 (9)
41 (26)
115 (12)
6 (1) 22 (28) 28 (5) 22 (3)
0 (0) 22 (3) 5 (2)
0 (0) 5 (2)
155 (46) 85 (59)
M2f (fibre) 1001 (45)
239 (64) 1240 (47) 83 (10)
42 (27)
125 (13)
8 (1) 23 (29) 31 (5) 25 (3)
0 (0) 25 (3) 6 (3)
0 (0) 6 (3)
161 (48) 95 (66)
M2g (fibre) 1004 (45)
239 (64) 1243 (47) 85 (10)
42 (27)
127 (13)
8 (1) 23 (29) 31 (5) 25 (3)
0 (0) 25 (3) 6 (3)
0 (0) 6 (3)
161 (48) 97 (67)
M3a (FVN)
913 (41)
185 (50) 1098 (42) 17 (2)
4 (3)
21 (2)
12 (2) 1 (1)
13 (2)
23 (3)
0 (0) 23 (3) 6 (3)
0 (0) 6 (3)
159 (48) 77 (53)
M3b (FVN)
906 (40)
185 (50) 1091 (42) 17 (2)
4 (3)
21 (2)
12 (2) 1 (1)
13 (2)
23 (3)
0 (0) 23 (3) 6 (3)
0 (0) 6 (3)
159 (48) 77 (53)
M3c (FVN)
916 (41)
186 (50) 1102 (42) 17 (2)
5 (3)
22 (2)
12 (2) 1 (1)
13 (2)
25 (3)
0 (0) 25 (3) 7 (3)
0 (0) 7 (3)
162 (49) 77 (53)
M3d (no energy
scoring) 1032 (46)
186 (50) 1218 (46) 24 (3)
4 (3)
28 (3)
17 (3) 1 (1)
18 (3)
50 (6)
1 (20)
51 (6) 20 (9)
0 (0) 20 (9)
202 (60) 86 (60)
M3e (fibre) 891 (40)
185 (50) 1076 (41) 15 (2)
4 (3)
19 (2)
12 (2) 1 (1)
13 (2)
22 (3)
0 (0) 22 (3) 5 (2)
0 (0) 5 (2)
156 (47)
77 (53)
M3f (fibre) 908 (40)
185 (50) 1093 (42) 17 (2)
4 (3)
21 (2)
12 (2) 1 (1)
13 (2)
25 (3) 0 (0) 25 (3) 6 (3)
0 (0) 6 (3)
160 (48)
78 (54)
M3g (fibre) 891 (40)
185 (50) 1076 (41) 15 (2)
4 (3)
19 (2)
12 (2) 1 (1)
13 (2)
22 (3)
0 (0) 22 (3) 5 (2)
0 (0) 5 (2)
156 (47)
77 (53)
M3h (fibre) 920 (41)
185 (50) 1105 (42) 20 (2) 4 (3) 24 (2) 14 (3) 1 (1) 15 (2) 26 (3) 0 (0) 26 (3) 7 (3) 0 (0) 7 (3) 168 (50) 80 (56)
M3i (fibre) 909 (40) 185 (50) 1094 (42) 16 (2)
4 (3)
20 (2)
12 (2) 1 (1)
13 (2)
24 (3) 0 (0) 24 (3) 6 (3) 0 (0) 6 (3) 160 (48) 77 (53)
pp If a food scores less than 4 points it passes the NPM qq If a drink scores less than 1 point it passes the NPM rr Performance measure = Food: High >6.25g/100g free sugars, Drinks: High >3.13g/100g free sugars ss Performance measure = Food: High >22.5g/100g total sugars, Drinks: High > 8g/100ml total sugars tt Performance measure= Food: High>5g/100g saturated fat, Drinks: High> 2.5g/100ml saturated fat uu Performance measure= Food: High>1.5g/100g salt, Drinks: High> 0.75g/100ml salt vv Performance measure= Food: ‘Source of fibre’ (>3g/100g to ≤6g/100g) ww Performance measure= Food: ‘High fibre ‘(>6g/100g)
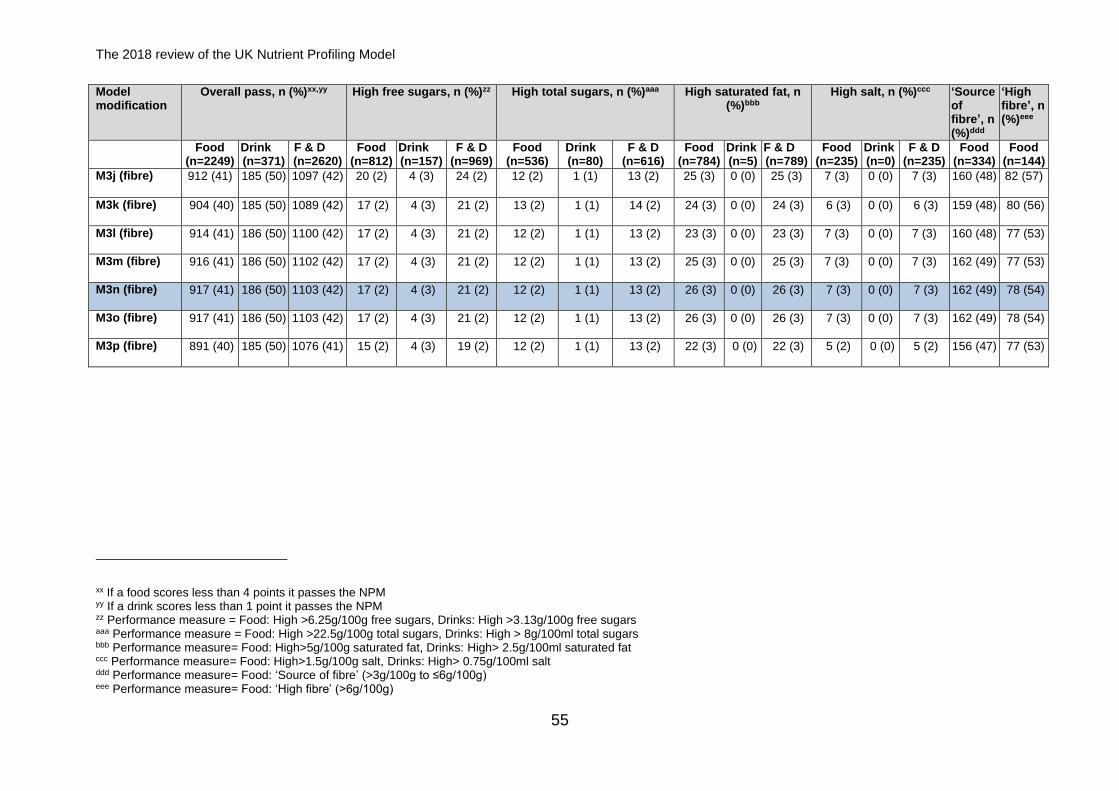
The 2018 review of the UK Nutrient Profiling Model
55
Model modification
Overall pass, n (%)xx,yy High free sugars, n (%)zz High total sugars, n (%)aaa High saturated fat, n (%)bbb
High salt, n (%)ccc ‘Source of fibre’, n (%)ddd
‘High fibre’, n (%)eee
Food (n=2249)
Drink (n=371)
F & D (n=2620)
Food (n=812)
Drink (n=157)
F & D (n=969)
Food (n=536)
Drink (n=80)
F & D (n=616)
Food (n=784)
Drink (n=5)
F & D (n=789)
Food (n=235)
Drink (n=0)
F & D (n=235)
Food (n=334)
Food (n=144)
M3j (fibre) 912 (41) 185 (50) 1097 (42) 20 (2)
4 (3) 24 (2) 12 (2) 1 (1) 13 (2) 25 (3) 0 (0) 25 (3) 7 (3)
0 (0) 7 (3) 160 (48) 82 (57)
M3k (fibre) 904 (40)
185 (50) 1089 (42) 17 (2)
4 (3)
21 (2)
13 (2)
1 (1)
14 (2)
24 (3)
0 (0) 24 (3) 6 (3)
0 (0) 6 (3)
159 (48)
80 (56)
M3l (fibre) 914 (41)
186 (50) 1100 (42) 17 (2)
4 (3)
21 (2)
12 (2)
1 (1)
13 (2)
23 (3)
0 (0) 23 (3) 7 (3) 0 (0) 7 (3) 160 (48)
77 (53)
M3m (fibre) 916 (41)
186 (50) 1102 (42) 17 (2) 4 (3)
21 (2)
12 (2)
1 (1)
13 (2)
25 (3)
0 (0) 25 (3) 7 (3) 0 (0) 7 (3) 162 (49)
77 (53)
M3n (fibre) 917 (41)
186 (50) 1103 (42) 17 (2)
4 (3)
21 (2)
12 (2)
1 (1)
13 (2)
26 (3)
0 (0) 26 (3) 7 (3)
0 (0) 7 (3)
162 (49)
78 (54)
M3o (fibre) 917 (41)
186 (50) 1103 (42) 17 (2)
4 (3)
21 (2)
12 (2)
1 (1)
13 (2)
26 (3)
0 (0) 26 (3) 7 (3)
0 (0) 7 (3) 162 (49)
78 (54)
M3p (fibre)
891 (40) 185 (50) 1076 (41) 15 (2)
4 (3)
19 (2)
12 (2)
1 (1)
13 (2)
22 (3)
0 (0)
22 (3) 5 (2)
0 (0)
5 (2)
156 (47)
77 (53)
xx If a food scores less than 4 points it passes the NPM yy If a drink scores less than 1 point it passes the NPM zz Performance measure = Food: High >6.25g/100g free sugars, Drinks: High >3.13g/100g free sugars aaa Performance measure = Food: High >22.5g/100g total sugars, Drinks: High > 8g/100ml total sugars bbb Performance measure= Food: High>5g/100g saturated fat, Drinks: High> 2.5g/100ml saturated fat ccc Performance measure= Food: High>1.5g/100g salt, Drinks: High> 0.75g/100ml salt ddd Performance measure= Food: ‘Source of fibre’ (>3g/100g to ≤6g/100g) eee Performance measure= Food: ‘High fibre’ (>6g/100g)
The 2018 review of the UK Nutrient Profiling Model
56
Conclusion
7.1 It is recommended that the UK NPM 2004/5 is amended as set out in Figure
2 and Table 11. These also outline the differences between the UK NPM
2004/5 and the draft 2018 NPM in terms of the nutrient/food components and
scores.
Overall rationale
7.2 The theoretical basis used in the draft 2018 NPM is consistent with the
approach used to develop the original UK NPM 2004/5.
7.3 After reviewing arguments considered during the development of the UK
NPM 2004/5 and models currently used in other countries, and by
international organisations, it was agreed that no changes to the underlying
principles of the model should be made. The draft 2018 NPM remains based
on per 100g of product rather than per portion and uses 2 product categories
(foods and drinks) and 7 nutrients/food components to score foods and
drinks. Where appropriate, general principles of the UK NPM 2004/5 would
be retained for consistency.
7.4 The draft 2018 NPM is in line with the current UK dietary recommendations,
which recommended average population maximum intakes of free sugars
should be no more than 5% of total dietary energy and fibre intake should
increase to 30g in adults.
7.5 Following SACN’s 2011 recommendations on energy, the UK government
decided not to adopt the revised energy values in light of the increasing
prevalence of obesity. Adjusting the model to reflect a reference value of
8,400kJ (equivalent to 2,000kcal) daily intake was recommended, consistent
with food labelling regulations and government recommendations on energy
intake for everyone aged 11 years and above. As a result, of the change in
the energy criterion, nutrient components such as saturated fat and sugars
(total and free sugars as applicable) were recalculated as a proportion of
food/total dietary energy.
7.6 The aim of the review was to ensure the NPM reflects the current UK dietary
recommendations. This is achieved in the draft 2018 NPM by:
replacing the total sugars component of the UK NPM 2004/5 by 5% of total
dietary energy for free sugars
The 2018 review of the UK Nutrient Profiling Model
57
adjusting the fibre component as a proportional change from the existing
UK NPM 2004/5 value to the current UK dietary recommendation for fibre
the requirement for mandatory food labelling as presented in the Food
Information for Consumers (EU FIC) Regulation (EU) No 1169/201138
states declaration of salt rather than sodium as this is more readily
comprehensible by consumers, therefore the decision was made to adopt
the salt criterion instead of sodium
the fruit, vegetables and nut component of the model remains unchanged
and is consistent with the approach adopted for the UK NPM 2004/5
the protein component of the model remains unchanged and is consistent
with the approach taken in the UK NPM 2004/5
7.7 The performance measures enabled assessment of effectiveness of the
modifications against the UK NPM 2004/5.
7.8 The performance of the draft 2018 NPM, in comparison with the UK NPM
2004/5, showed that fewer foods and drinks high in free sugars in particular,
high in total sugars and slightly fewer foods and drinks high in saturated fat
passed the model. The number of foods and drinks high in salt, which pass
the model, remained the same.
7.9 When comparing the performance for fibre, fewer ‘source of fibre’ foods and
‘high fibre’ foods passed the draft 2018 NPM compared to the UK NPM
2004/5. This is mainly because of the high free sugars content in some
breakfast cereals, for example.
7.10 Fruit juices largely no longer pass the model because of their free sugars
content.
7.11 Changes to the foods and drinks, which now pass reflect the change in public
health advice on sugar recommended by SACN. SACN effectively halved
dietary recommendations for sugars, while those for fibre were increased to a
lesser extent.
7.12 The expert group agreed that the draft 2018 NPM is put forward for public
consultation.
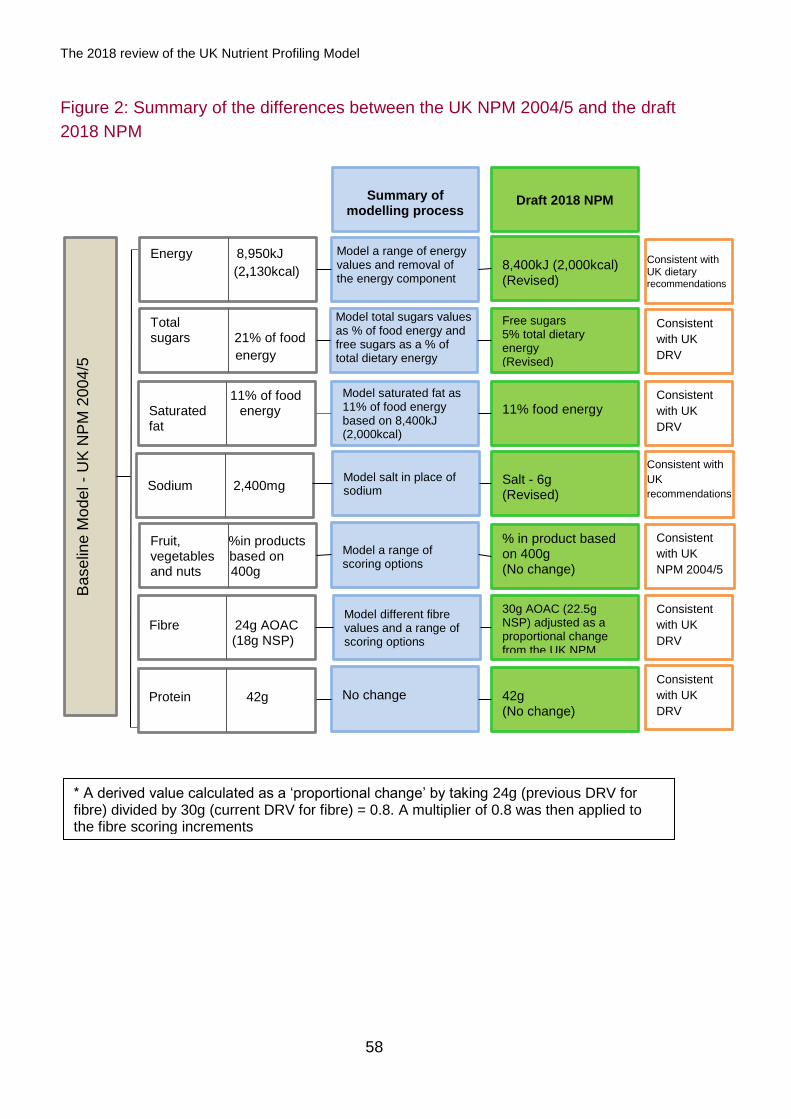
The 2018 review of the UK Nutrient Profiling Model
58
Figure 2: Summary of the differences between the UK NPM 2004/5 and the draft
2018 NPM
Draft 2018 NPM
30g AOAC (22.5g NSP) adjusted as a proportional change from the UK NPM
42g (No change)
8,400kJ (2,000kcal) (Revised)
11% food energy
% in product based on 400g (No change)
Salt - 6g (Revised)
Summary of modelling process
Model a range of energy values and removal of the energy component
Model total sugars values as % of food energy and free sugars as a % of total dietary energy
Model saturated fat as 11% of food energy based on 8,400kJ (2,000kcal)
Model salt in place of sodium
Model a range of scoring options
Model different fibre values and a range of scoring options
No change
Energy 8,950kJ
……………… (2,130kcal)
Total sugars 21% of food
energy energy
(FE)
11% of food Saturated energy fat
Sodium 2,400mg
Fibre 24g AOAC (1 ) (18g NSP)
Protein 42g
Ba
se
line M
od
el -
UK
NP
M 2
004
/5
Free sugars 5% total dietary energy (Revised)
Fruit, %in products vegetables based on and nuts 400g
Consistent with UK dietary recommendations
Consistent
with UK
DRV
Consistent
with UK
DRV
Consistent with
UK
recommendations
Consistent
with UK
NPM 2004/5
Consistent
with UK
DRV
Consistent
with UK
DRV
* A derived value calculated as a ‘proportional change’ by taking 24g (previous DRV for fibre) divided by 30g (current DRV for fibre) = 0.8. A multiplier of 0.8 was then applied to the fibre scoring increments
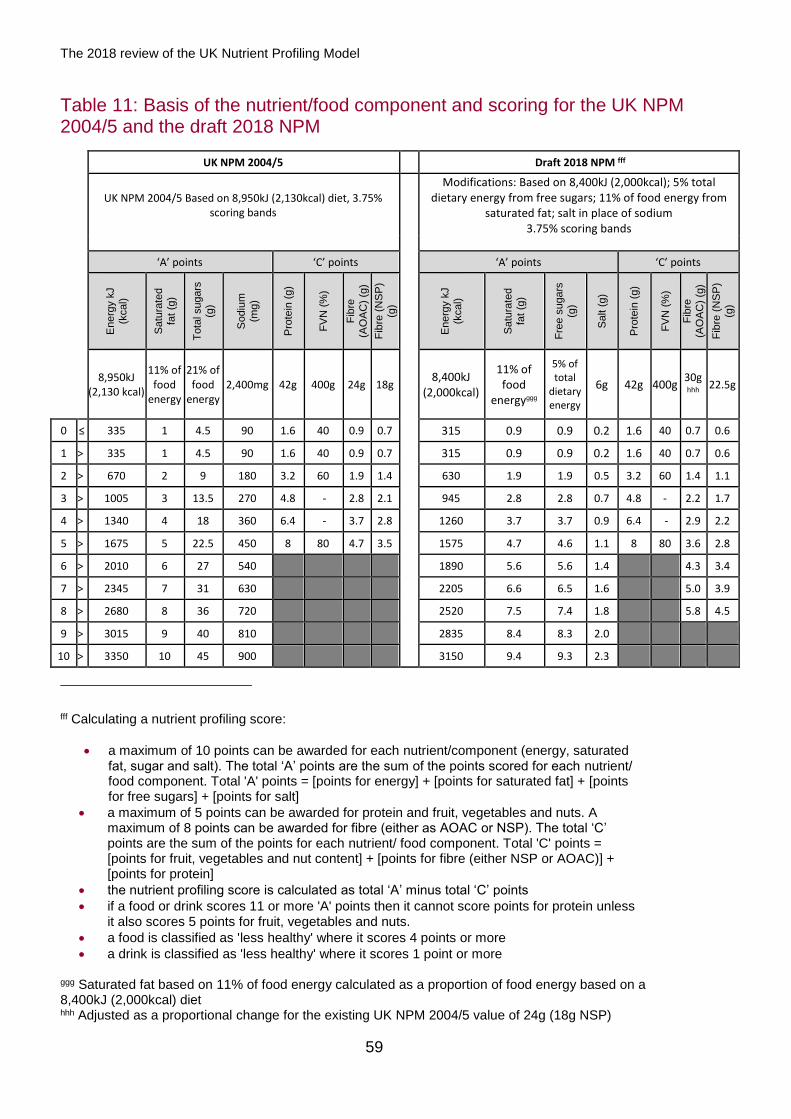
The 2018 review of the UK Nutrient Profiling Model
59
Table 11: Basis of the nutrient/food component and scoring for the UK NPM 2004/5 and the draft 2018 NPM
UK NPM 2004/5
Draft 2018 NPM fff
UK NPM 2004/5 Based on 8,950kJ (2,130kcal) diet, 3.75% scoring bands
Modifications: Based on 8,400kJ (2,000kcal); 5% total dietary energy from free sugars; 11% of food energy from
saturated fat; salt in place of sodium 3.75% scoring bands
‘A’ points ‘C’ points
‘A’ points ‘C’ points
Energ
y k
J
(kcal)
Satu
rate
d
fat
(g)
To
tal sugars
(g
)
Sodiu
m
(mg
)
Pro
tein
(g)
FV
N (
%)
Fib
re
(AO
AC
) (g
)
Fib
re (
NS
P)
(g)
Energ
y k
J
(kcal)
Satu
rate
d
fat
(g)
Fre
e s
ugars
(g)
Salt (
g)
Pro
tein
(g)
FV
N (
%)
Fib
re
(AO
AC
) (g
)
Fib
re (
NS
P)
(g)
8,950kJ (2,130 kcal)
11% of food
energy
21% of food
energy 2,400mg 42g 400g 24g 18g
8,400kJ (2,000kcal)
11% of food
energyggg
5% of total
dietary energy
6g 42g 400g 30ghhh
22.5g
0 ≤ 335 1 4.5 90 1.6 40 0.9 0.7 315 0.9 0.9 0.2 1.6 40 0.7 0.6
1 > 335 1 4.5 90 1.6 40 0.9 0.7 315 0.9 0.9 0.2 1.6 40 0.7 0.6
2 > 670 2 9 180 3.2 60 1.9 1.4 630 1.9 1.9 0.5 3.2 60 1.4 1.1
3 > 1005 3 13.5 270 4.8 - 2.8 2.1 945 2.8 2.8 0.7 4.8 - 2.2 1.7
4 > 1340 4 18 360 6.4 - 3.7 2.8 1260 3.7 3.7 0.9 6.4 - 2.9 2.2
5 > 1675 5 22.5 450 8 80 4.7 3.5 1575 4.7 4.6 1.1 8 80 3.6 2.8
6 > 2010 6 27 540 1890 5.6 5.6 1.4 4.3 3.4
7 > 2345 7 31 630 2205 6.6 6.5 1.6 5.0 3.9
8 > 2680 8 36 720 2520 7.5 7.4 1.8 5.8 4.5
9 > 3015 9 40 810 2835 8.4 8.3 2.0
10 > 3350 10 45 900 3150 9.4 9.3 2.3
fff Calculating a nutrient profiling score:
a maximum of 10 points can be awarded for each nutrient/component (energy, saturated fat, sugar and salt). The total ‘A’ points are the sum of the points scored for each nutrient/ food component. Total 'A' points = [points for energy] + [points for saturated fat] + [points for free sugars] + [points for salt]
a maximum of 5 points can be awarded for protein and fruit, vegetables and nuts. A maximum of 8 points can be awarded for fibre (either as AOAC or NSP). The total ‘C’ points are the sum of the points for each nutrient/ food component. Total 'C' points = [points for fruit, vegetables and nut content] + [points for fibre (either NSP or AOAC)] + [points for protein]
the nutrient profiling score is calculated as total ‘A’ minus total ‘C’ points
if a food or drink scores 11 or more 'A' points then it cannot score points for protein unless it also scores 5 points for fruit, vegetables and nuts.
a food is classified as 'less healthy' where it scores 4 points or more
a drink is classified as 'less healthy' where it scores 1 point or more ggg Saturated fat based on 11% of food energy calculated as a proportion of food energy based on a 8,400kJ (2,000kcal) diet hhh Adjusted as a proportional change for the existing UK NPM 2004/5 value of 24g (18g NSP)
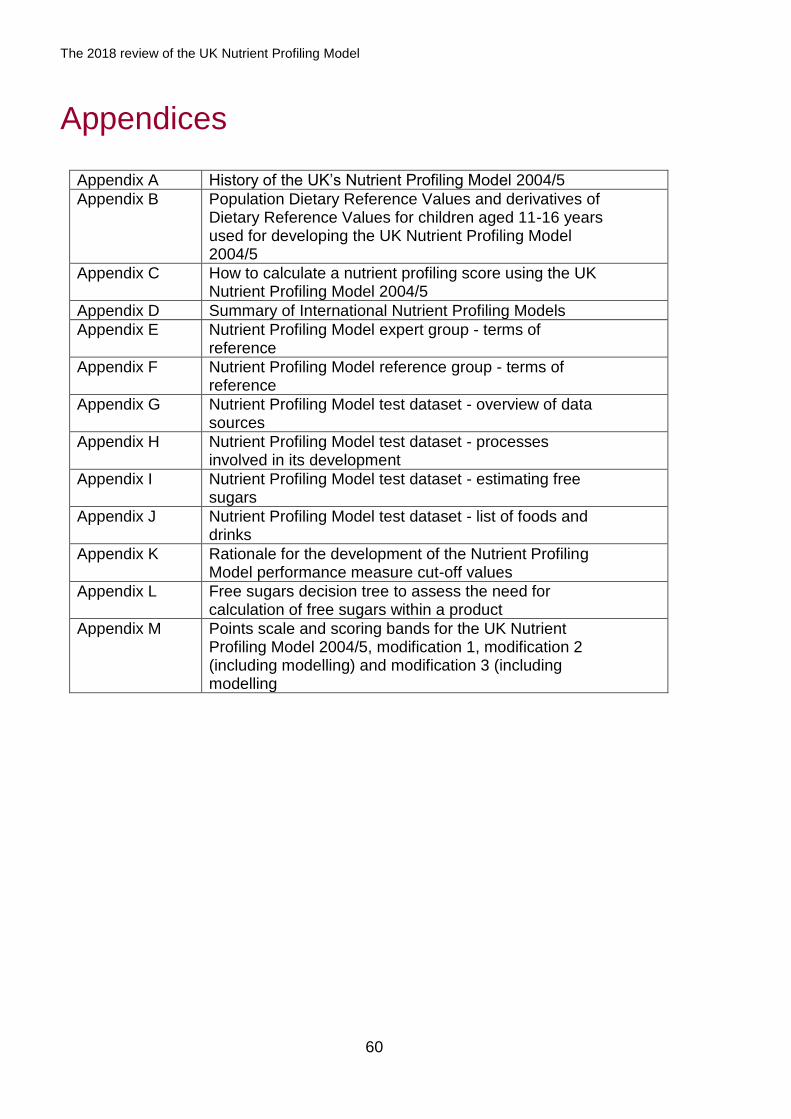
The 2018 review of the UK Nutrient Profiling Model
60
Appendices
Appendix A History of the UK’s Nutrient Profiling Model 2004/5
Appendix B Population Dietary Reference Values and derivatives of Dietary Reference Values for children aged 11-16 years used for developing the UK Nutrient Profiling Model 2004/5
Appendix C How to calculate a nutrient profiling score using the UK Nutrient Profiling Model 2004/5
Appendix D Summary of International Nutrient Profiling Models
Appendix E Nutrient Profiling Model expert group - terms of reference
Appendix F Nutrient Profiling Model reference group - terms of reference
Appendix G Nutrient Profiling Model test dataset - overview of data sources
Appendix H Nutrient Profiling Model test dataset - processes involved in its development
Appendix I Nutrient Profiling Model test dataset - estimating free sugars
Appendix J Nutrient Profiling Model test dataset - list of foods and drinks
Appendix K Rationale for the development of the Nutrient Profiling Model performance measure cut-off values
Appendix L Free sugars decision tree to assess the need for calculation of free sugars within a product
Appendix M Points scale and scoring bands for the UK Nutrient Profiling Model 2004/5, modification 1, modification 2 (including modelling) and modification 3 (including modelling
The 2018 review of the UK Nutrient Profiling Model
61
Appendix A: History of the UK’s Nutrient
Profiling Model 2004/5
8.1 The Department of Health White Paper, Choosing Health: Making healthy
choices42 and the Food Standards Agency’s (FSA) 2004 Action Plan on Food
Promotions and Children’s Diets43 contained a series of recommendations aimed
at addressing the imbalance in promotional activity of foods to children. In 2004,
the FSA commissioned research to develop a nutrient profiling model to support
the Office of Communications (Ofcom’s) work to further regulate broadcast
advertising of foods to children.
8.2 The nutrient profiling model was initially developed to be relevant for foods and
drinks consumed by children aged 11-16 years, but was subsequently found to be
equally applicable to foods and drinks consumed by people over the age of 5
years44.
8.3 In October 2005, the FSA Board recommended that the UK NPM 2004/5 was
suitable for use by Ofcom to determine which foods would be allowed to be
advertised during children’s TV programming (where children aged 5-16 years
make up over 25% of the audience), and committed to reviewing the effectiveness
of the model one year from its first date of use. The final nutrient profiling model
was handed over to Ofcom in December 2005. In February 2007, Ofcom
announced its intention to use the UK NPM 2004/5 to restrict broadcast
advertising of food and drink that did not pass the model in and around
programmes specifically made for children and of particular appeal to children.
8.4 An independent review of the UK NPM 2004/5 was completed at the end of 2008.
An associated FSA board paper45 set out how the UK NPM 2004/5 was
developed, including the independent review process and its outcome. Following
this review, it was agreed that the FSA UK NPM 2004/5 would remain unchanged.
8.5 Responsibility for nutrition policy including the UK NPM 2004/5 transferred from
the FSA to the Department of Health in 2010. In 2011, the Department of Health
published supporting technical guidance to assist food manufacturers, retailers
and advertisers to correctly calculate nutrient profiling scores for their products.
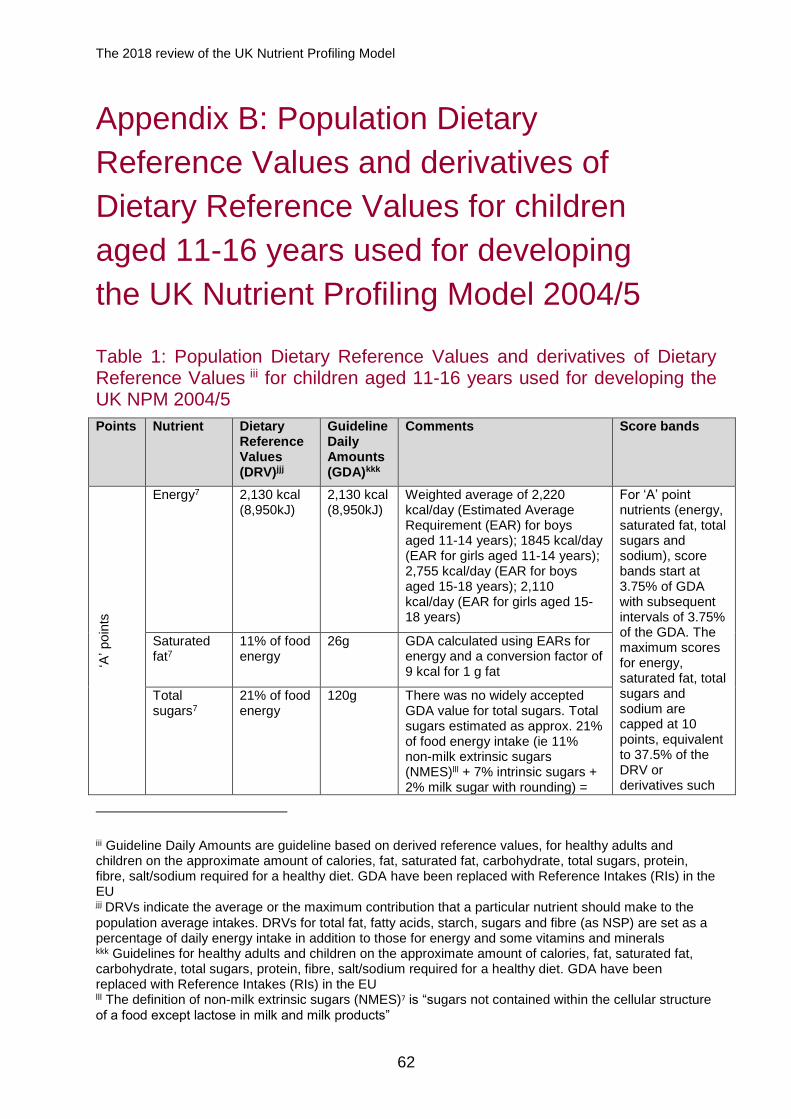
The 2018 review of the UK Nutrient Profiling Model
62
Appendix B: Population Dietary
Reference Values and derivatives of
Dietary Reference Values for children
aged 11-16 years used for developing
the UK Nutrient Profiling Model 2004/5
Table 1: Population Dietary Reference Values and derivatives of Dietary Reference Values iii for children aged 11-16 years used for developing the
UK NPM 2004/5
Points Nutrient Dietary Reference Values (DRV)jjj
Guideline Daily Amounts (GDA)kkk
Comments Score bands
‘A’ po
ints
Energy7 2,130 kcal (8,950kJ)
2,130 kcal (8,950kJ)
Weighted average of 2,220 kcal/day (Estimated Average Requirement (EAR) for boys aged 11-14 years); 1845 kcal/day (EAR for girls aged 11-14 years); 2,755 kcal/day (EAR for boys aged 15-18 years); 2,110 kcal/day (EAR for girls aged 15-18 years)
For ‘A’ point nutrients (energy, saturated fat, total sugars and sodium), score bands start at 3.75% of GDA with subsequent intervals of 3.75% of the GDA. The maximum scores for energy, saturated fat, total sugars and sodium are capped at 10 points, equivalent to 37.5% of the DRV or derivatives such
Saturated fat7
11% of food energy
26g GDA calculated using EARs for energy and a conversion factor of 9 kcal for 1 g fat
Total sugars7
21% of food energy
120g There was no widely accepted GDA value for total sugars. Total sugars estimated as approx. 21% of food energy intake (ie 11% non-milk extrinsic sugars (NMES)lll + 7% intrinsic sugars + 2% milk sugar with rounding) =
iii Guideline Daily Amounts are guideline based on derived reference values, for healthy adults and children on the approximate amount of calories, fat, saturated fat, carbohydrate, total sugars, protein, fibre, salt/sodium required for a healthy diet. GDA have been replaced with Reference Intakes (RIs) in the EU jjj DRVs indicate the average or the maximum contribution that a particular nutrient should make to the
population average intakes. DRVs for total fat, fatty acids, starch, sugars and fibre (as NSP) are set as a percentage of daily energy intake in addition to those for energy and some vitamins and minerals kkk Guidelines for healthy adults and children on the approximate amount of calories, fat, saturated fat, carbohydrate, total sugars, protein, fibre, salt/sodium required for a healthy diet. GDA have been replaced with Reference Intakes (RIs) in the EU lll The definition of non-milk extrinsic sugars (NMES)7 is “sugars not contained within the cellular structure
of a food except lactose in milk and milk products”
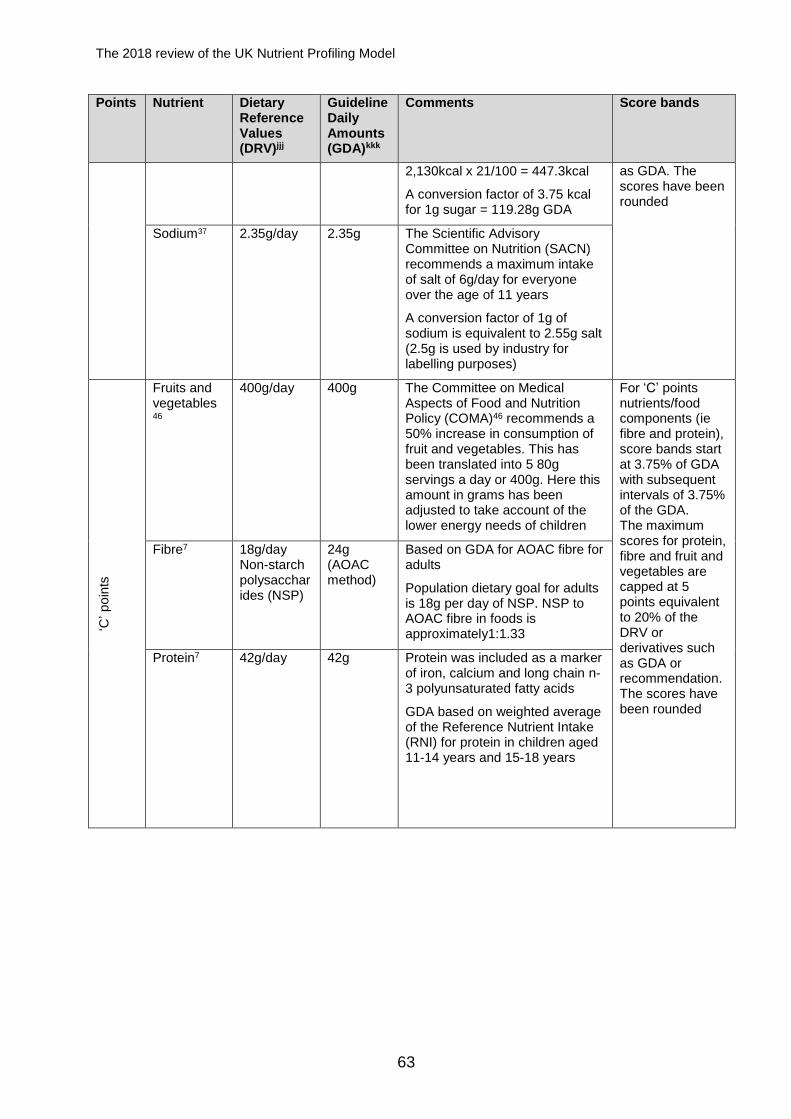
The 2018 review of the UK Nutrient Profiling Model
63
Points Nutrient Dietary Reference Values (DRV)jjj
Guideline Daily Amounts (GDA)kkk
Comments Score bands
2,130kcal x 21/100 = 447.3kcal
A conversion factor of 3.75 kcal for 1g sugar = 119.28g GDA
as GDA. The scores have been rounded
Sodium37 2.35g/day 2.35g The Scientific Advisory Committee on Nutrition (SACN) recommends a maximum intake of salt of 6g/day for everyone over the age of 11 years
A conversion factor of 1g of sodium is equivalent to 2.55g salt (2.5g is used by industry for labelling purposes)
‘C’ po
ints
Fruits and vegetables46
400g/day 400g The Committee on Medical Aspects of Food and Nutrition Policy (COMA)46 recommends a 50% increase in consumption of fruit and vegetables. This has been translated into 5 80g servings a day or 400g. Here this amount in grams has been adjusted to take account of the lower energy needs of children
For ‘C’ points nutrients/food components (ie fibre and protein), score bands start at 3.75% of GDA with subsequent intervals of 3.75% of the GDA. The maximum scores for protein, fibre and fruit and vegetables are capped at 5 points equivalent to 20% of the DRV or derivatives such as GDA or recommendation. The scores have been rounded
Fibre7 18g/day Non-starch polysaccharides (NSP)
24g (AOAC method)
Based on GDA for AOAC fibre for adults
Population dietary goal for adults is 18g per day of NSP. NSP to AOAC fibre in foods is approximately1:1.33
Protein7 42g/day 42g Protein was included as a marker of iron, calcium and long chain n-3 polyunsaturated fatty acids
GDA based on weighted average of the Reference Nutrient Intake (RNI) for protein in children aged 11-14 years and 15-18 years
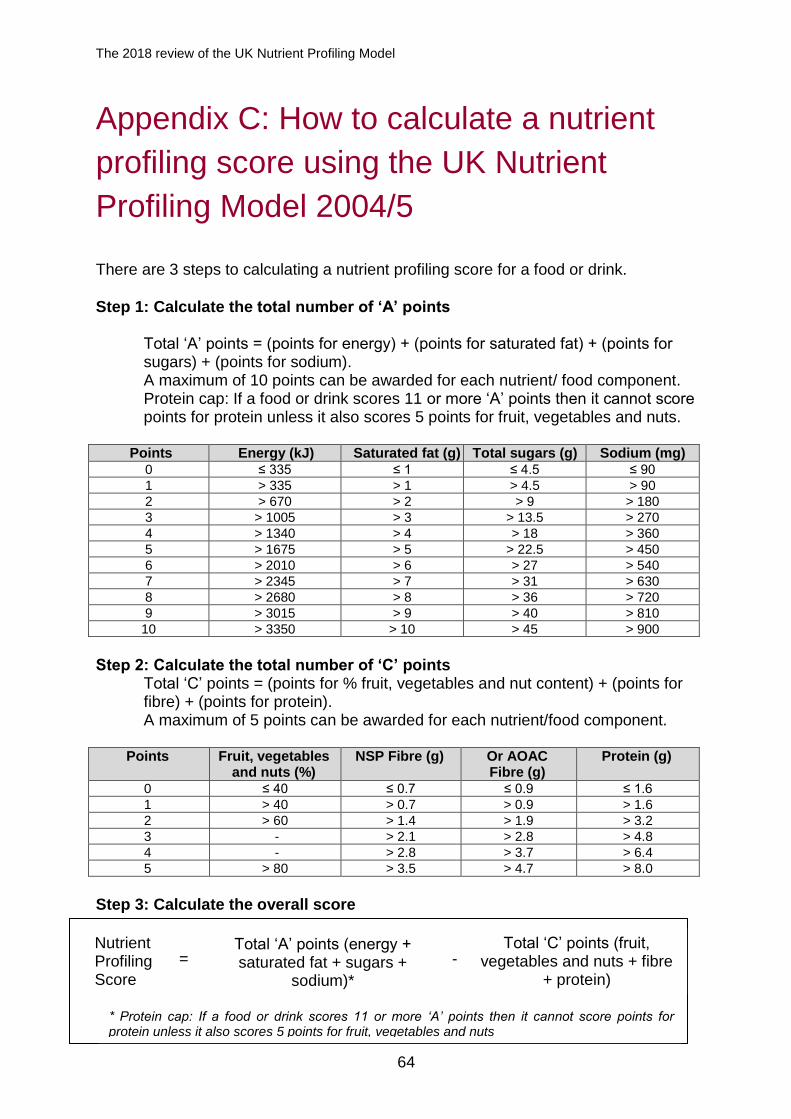
The 2018 review of the UK Nutrient Profiling Model
64
Appendix C: How to calculate a nutrient
profiling score using the UK Nutrient
Profiling Model 2004/5
There are 3 steps to calculating a nutrient profiling score for a food or drink.
Step 1: Calculate the total number of ‘A’ points
Total ‘A’ points = (points for energy) + (points for saturated fat) + (points for sugars) + (points for sodium). A maximum of 10 points can be awarded for each nutrient/ food component. Protein cap: If a food or drink scores 11 or more ‘A’ points then it cannot score points for protein unless it also scores 5 points for fruit, vegetables and nuts.
Points Energy (kJ) Saturated fat (g) Total sugars (g) Sodium (mg)
0 ≤ 335 ≤ 1 ≤ 4.5 ≤ 90
1 > 335 > 1 > 4.5 > 90
2 > 670 > 2 > 9 > 180
3 > 1005 > 3 > 13.5 > 270
4 > 1340 > 4 > 18 > 360
5 > 1675 > 5 > 22.5 > 450
6 > 2010 > 6 > 27 > 540
7 > 2345 > 7 > 31 > 630
8 > 2680 > 8 > 36 > 720
9 > 3015 > 9 > 40 > 810
10 > 3350 > 10 > 45 > 900
Step 2: Calculate the total number of ‘C’ points
Total ‘C’ points = (points for % fruit, vegetables and nut content) + (points for fibre) + (points for protein). A maximum of 5 points can be awarded for each nutrient/food component.
Points Fruit, vegetables and nuts (%)
NSP Fibre (g) Or AOAC Fibre (g)
Protein (g)
0 ≤ 40 ≤ 0.7 ≤ 0.9 ≤ 1.6
1 > 40 > 0.7 > 0.9 > 1.6
2 > 60 > 1.4 > 1.9 > 3.2
3 - > 2.1 > 2.8 > 4.8
4 - > 2.8 > 3.7 > 6.4
5 > 80 > 3.5 > 4.7 > 8.0
Step 3: Calculate the overall score
Interpretation of the Nutrient Profiling Score
Total ‘A’ points (energy + saturated fat + sugars +
sodium)*
Total ‘C’ points (fruit, vegetables and nuts + fibre
+ protein)
Nutrient Profiling Score
= -
* Protein cap: If a food or drink scores 11 or more ‘A’ points then it cannot score points for protein unless it also scores 5 points for fruit, vegetables and nuts
The 2018 review of the UK Nutrient Profiling Model
65
Foods
A food is classified as ‘less healthy’ where it scores 4 points or more.
For the purposes of this report: If a food scores 4 points or more it ‘does not
pass’ the model and would not meet the criteria to be able to be advertised to
children. If a food scores less than 4 points it ‘passes’ the model and would
meet the criteria to be able to be advertised to children.
Drinks
A drink is classified as ‘less healthy’ where it scores 1 point or more.
For the purposes of this report: If a drink scores 1 point or more it ‘does not
pass’ the model and would not meet the criteria to be able to be advertised to
children. If a drink scores less than 1 point it ‘passes’ the model and would meet
the criteria to be able to be advertised to children.
The 2018 review of the UK Nutrient Profiling Model
66
Appendix D: Summary of International
Nutrient Profiling Models
9.1 The purpose of the summary is to identify international developments in the use
and adaption of the UK Nutrient Profiling Model (NPM) 2004/5. Five nutrient
profiling models had been identified that had been adapted from the UK NPM
2004/5. The World Health Organization Europe nutrient profile model24 is also
summarised.
Food Standards Australia New Zealand (FSANZ) Nutrient Profiling Scoring
Criterion (NPSC)19
Purpose of the model:
9.2 To determine the eligibility of foods to make health claims and certain nutrition
content claims.
Use of the model:
9.3 Consultation of use of the model ended in 2008, with the model implemented for
use in January 2013.
Characteristics of the model:
9.4 The Food Standards Australia New Zealand Nutrient Profiling Scoring Criterion
(NPSC) is based on the UK NPM 2004/5. It has 3 categories:
category 1 is for beverages
category 2 is for any food other than those included in category 1 or 3
category 3 is for the following foods: cheese and processed cheese (with
calcium content >320mg/100g); edible oils; edible oil spreads, margarine;
butter as defined in the Australia New Zealand Food Standards Code
9.5 The following scoring is used for a food/drink item to be eligible:
category 1: <1
category 2: <4
category 3: <28
Adaptations of the UK NPM 2004/5:
9.6 The FSANZ NPSC is based on the nutrient composition of 100g or 100ml of a food
or drink. The following adaptations were introduced in the FSANZ NPSC, including
The 2018 review of the UK Nutrient Profiling Model
67
the use of definitions in the Food Standards Code eg fruit, vegetable, fruit juice,
cheese etc.
Introduction of a third category:
9.7 During consultation on the FSANZ NPSC, it was suggested that the current
requirements for low saturated fatty acid claims do not discriminate between
other fatty acids or provide consumers enough information when purchasing
other fats (for example, vegetable oils, fat spreads). A new category was
developed for foods that had a low saturated fatty acid proportion (no more than
28%) relative to the total fatty acid.
Increasing the first and second scoring bands for total sugars criterion (eg UK NPM
2004/5 total sugars cut point: (≤4.5g) vs FSANZ NPSC (≤5.0g)):
9.8 The cut-off point between the first and second scoring bands was very close to
the average lactose content of whole milk, where some milks would score 0
points for total sugars and some would score 1 point. The extra point was
enough to make these milks ineligible. The UK NPM 2004/5 uses total sugars in
the model, rather than non-milk extrinsic sugars (NMES), because total sugars
are measurable and the modifying points were used to account for the lactose
content of milk and the intrinsic sugars in fruit. By adjusting the cut-off point
between the first and second scoring bands to ≤5.0g for total sugars, whole milks
were more likely to score 0 sugar points.
Raising the protein cap from <11 points (as developed for the UK NPM 2004/5) to <13
points (FSANZ NPSC):
9.9 This was suggested by a consultation respondent specifically to ensure eligibility
of some breakfast cereals. Breakfast cereals are a low moisture food compared
to, for example bread and is therefore scores more energy points per 100g. The
alteration offsets the extra energy points the food scores resulting from their low
moisture content.
Extending the scoring scale for fruit/vegetables/nuts/legumes criterion from 5 points (UK
NPM 2004/5) to 8 points (FSANZ NPSC):
9.10 This change was suggested to allow all raw or fresh nuts to become eligible.
FSANZ modelled various extensions of the scoring range and it was concluded
that by extending the points to 8 for 100% fruit/vegetable/nut/legume content,
such foods could be eligible to carry a health claim.
9.11 As a result of extending the maximum scoring scale from 5 points to 8 points for
fruit/vegetable/nut/legume content, the requirement to score the ‘maximum’
points was amended. Foods that have a total score of 13 or more baseline points
are still required to score at least 5 or more points for
The 2018 review of the UK Nutrient Profiling Model
68
fruits/vegetables/nuts/legumes in order to also score points for protein (see
above in relation to protein cap, paragraph 9.9).
9.12 It was also noted that potatoes are included in the fruit, vegetable, nut and
legume criterion of the FSANZ NPSC. In contrast to the UK NPM 2004/5 where
potatoes and other starchy vegetables such as yams are not categorised this
way in the UK NPM 2004/5.
South African Nutrient Profile Model20
Purpose of the model:
9.13 Recommended as a screening tool for nutrient and/or health claims.
Use of the model:
9.14 No information available.
Characteristics and adaptation of the UK NPM 2004/5:
9.15 The South African NPM is based on an early version of the FSANZ NPSC model.
The FSANZ NPSC model was validated47 (content validity to assess it against
South African food based dietary guidelinesmmm, convergentnnn and constructooo
validation testing). The validation showed that there was no reason to adjust the
NPM to be applicable to the South African environment and can be used as it is.
Health Star Rating System21
Purpose of the model
9.16 Voluntary front-of-pack labelling scheme endorsed by the Australia and New
Zealand Ministerial Forum on Food Regulation. It rates the overall nutritional
profile of packaged food and assigns it a rating from ½ a star (‘less healthier
choice’) to 5 stars (‘healthier choice’).
Use of the model
9.17 From June 2014, food manufacturers and retailers could voluntarily apply the
Health Star Rating to their products.
Characteristics of the model
9.18 The Health Star Rating System is a modified version of the Nutrient Profiling
Scoring Criterion (NPSC) developed by FSANZ for the Regulation of health
mmm Comparing the classification of a number of „indicator food items as determined by the nutrient profiling model with the Food Based Dietary Guidelines nnn Comparing the standard ranking of food items as determined by nutrition experts to the classification of the same food items by the nutrient profiling model ooo Examine the relationship between the way the profile model categorises foods and the healthiness of diets in South Africa
The 2018 review of the UK Nutrient Profiling Model
69
claims in Australia and New Zealand and prescribed in Standard 1.2.7 –
Nutrition, Health and Related Claims of the Food Standards Code.
9.19 Each food or drink item (100g or 100ml) is assigned to one of 6 categories:
1 Beverages other than dairy beverages
1D Milk and dairy beverages
2 All foods other than those included in Category 1, 1D, 2D, 3 or 3D
2D Dairy foods other than those included in Category 1D or 3D
3 Oils and spreads
3D Cheese and processed cheese (with calcium content
>320mg/100g)
9.20 Food products which are not expected to display the Health Star Rating, include:
fresh unpackaged food (such as fresh fruit and vegetables)
alcoholic beverages
formulated products for infants and young children
non-nutritive condiments (such as vinegar, herbs and spices)
non-nutritive foods (such as tea, coffee)
single ingredient foods not intended to be eaten on their own (such as flour)
foods where a nutrition information panel is not required
9.21 The difference between the FSANZ NPSC and the Health Star Rating System is
that the FSANZ NPSC has a maximum of 10 points for each criterion (ie energy,
total sugars, saturated fat, sodium). Whilst the Health Star Rating has up to a
maximum of 11 points for energy, 30 points for saturated fatty acids, 22 points for
total sugars (excluding categories 3 and 3D) and 30 points for sodium.
5-Colour National Labelling (5-CNL) System/ Nutri-Score22
Purpose of the model
9.22 French front-of-pack nutrition labelling to help consumers make healthier food
choices at point of purchase. The 5-CNL is the former graphical format of the
French labelling system, which is now named Nutri-Score.
Use of the model
9.23 The 5-CNL (now known as Nutri-Score) model was implemented in France from
October 2017.
Characteristics of the model
9.24 Food and drinks are run through an adapted version of the UK NPM 2004/5. The
total scores represent the nutritional quality of the product and correspond to a
particular colour. The output is a chain of 5 discs of the different colours
(a=green/b=yellow/c=orange/ d=pink/e=red), with a larger disc representing the
The 2018 review of the UK Nutrient Profiling Model
70
nutritional quality of the product. Foods labelled with A or “green” discs
correspond to foods which consumption is recommended, whereas foods
labelled with E or red discs correspond to foods which consumption should be
limited.
Adaptation of the UK NPM 2004/5
9.25 Exceptions were made for cheese, fats and drinks to better rank them according
to their nutrient profile and consistent with the French nutritional
recommendations Programme National Nutrition Santé (PNNS) guidelines. No
modifications were performed on the definition of the ‘fruit, vegetables and nuts’.
9.26 The French nutritional PNNS guidelines48 consider cheese as a good source of
calcium49 and recommends consuming 3 dairy products per day. The original
score for cheese was modified, so that protein content would be used in the
computation, whatever the total ‘A’ score points of the product: UK NPM 2004/5
score =Total A points – Total C points. The initial algorithm categorised all
cheeses in category E “Red”. After adapting the score to take into account of the
protein content of cheese, cheeses are spread across 3 categories of the 5-CNL
and predominantly categorised in D “Pink”.
9.27 The PNNS guidelines also recommend vegetable fats (eg olive oil, rapeseed oil)
over animal fats and encourage diversity in the types of fats used. The original
UK NPM 2004/5 does not allow differences in types of fats to be taken into
account. The maximum number of points that can be attributed to saturated fat in
the UK NPM 2004/5 is equivalent to 10g/100g saturated fat. It was suggested
that the saturated fat content is differential across different types of fats, from
80g/100g for butter to 20–30g/100g for margarines and vegetable fats. The
points for saturated fat were modified to allow redistribution of added fats within
multiple categories of the 5-CNL and to discriminate between animal and
vegetable fats.
9.28 The only recommended beverage in the PNNS guidelines is water and the
guidelines suggest intake of sugary drinks should be limited. The UK NPM
2004/5 score does not reflect considerations such as encouraging artificially
sweetened beverages as an alternative to regular sweetened options. The UK
NPM 2004/5 scoring for energy and sugar were modified to take into account the
specific composition of sugar and energy in drinks. A two-step approach was
taken, modifying the model for beverages, and then the labelling system was set
so that only water is categorised as A “green”.
The 2018 review of the UK Nutrient Profiling Model
71
Adapted UK NPM 2004/5 for use in Ireland23
Purpose and characteristics of the model
9.29 Ireland adopted the UK NPM 2004/5 for (statutory) marketing restrictions with an
exemption for cheese. Advertisements for cheese products that appear in
children’s programmes or which are directed at children are required to carry an
on-screen message indicating the recommended maximum daily consumption
limit for cheese. This exemption applies to cheese products only and not to
products where cheese is an ingredient eg pizza.
Use of the model
9.30 The codes were formally launched in January 2013 and came into full effect from
1 July 2013.
Exemption of cheese
9.31 The Broadcasting Authority of Ireland (BAI) convened an Expert Working Group
(EWG) to examine health concerns for children in Ireland and to determine if the
promotion to children of high fat, sugar or salt (HFSS) foods and drinks should be
restricted.
9.32 The EWG Report recommended the NPM, developed by the UK Food Standards
Agency (FSA) specifically for broadcast regulation as the mechanism for defining
HFSS food and drink should be adopted completely without amendment.
9.33 The EWG had previously considered whether exemption from the model should
apply to cheese, as it was considered a source of calcium. It was agreed that
cheese is also rich in fat and saturated fat, and examination of dietary guidelines
in Ireland for those over 5 years has shown that in order to meet desirable goals
for saturated fat, consumption of cheese should be limited and lower-fat calcium
sources should be encouraged. Hence, the EWG recommended that no
exemption should be made for cheese in the application of the NPM.
9.34 The House of the Oireachtas Joint Committee on Health and Children50 had
concerns that foods and drinks with no particular nutrient content (eg low calorie
drinks) were categorised as ‘more healthy’ than foods, such as cheese which
although admittedly high in saturated fat, also contain high levels of calcium and
protein. The Committee also suggested to ‘take cognizance of the importance of
certain markets for the economy – markets which are not as important for the UK
economy, where the nutrient profiling model was designed’.
9.35 After further consideration and seeking advice from an independent nutritionist23,
the Joint Committee on Health and Children further stated they were not
convinced that ‘the proportionate intake of cheese, by children relative to its
score in the NPM can identify it as a serious cause of childhood obesity, or that
The 2018 review of the UK Nutrient Profiling Model
72
the incidence of advertising of cheese directed at children ….is high enough that
restrictions on such advertising would have a marked effect’.
World Health Organization Europe nutrient profile model24
Purpose of the model
9.36 The World Health Organization (WHO) model is designed for use by
governments for the purpose of restricting food marketing to children.
Use of the model
9.37 The WHO European nutrient profile model was published in 2015. As of July
2016, Slovenia is currently adapting the WHO Europe nutrient profile model for
national use.
Characteristics of the model
9.38 The WHO Europe nutrient profile model consists of a total of 17 food categories
(with some sub-categories) and is based on 2 existing models developed by
Norway51 and Denmark52. The rationale for using the Danish and Norwegian
models, as opposed to the UK NPM 2004/5, is that the models use ‘food
category’ approaches, which are easier to adapt or modify rather than using a
scoring system.
9.39 Thresholds for the categories are largely taken from the Norwegian model,
except in cases where the criteria for the same category are stricter or more
comprehensive in the Danish model.
9.40 The model includes total fat, saturated fats, added sugar and salt per 100g of the
product. Thresholds for salt for certain categories have been taken from the
Finnish Ministry of Trade and Industry Decree on food packing markings
1084/2004, section 25, as the salt criteria for some categoriesppp were missing
from the Danish and Norwegian models but during consultation and pilot testing
with countries it was considered important to set thresholds for those categories.
9.41 The model contains 5 categories for which marketing is never permitted:
chocolate and sugar confectionary, energy bars, sweet toppings and
desserts
cakes, sweets biscuits and pastries; other sweet bakery wares and
dry mixes for making these
juices
energy drinks
ppp Categories include: breakfast cereals; cheese; bread, bread products and crisp breads; fresh or dried pasta, rice and grains; processed meat, poultry, fish and similar
The 2018 review of the UK Nutrient Profiling Model
73
edible ices
9.42 Additionally, marketing of products that contain >1g/100g total fat in the form of
industrially produced trans fatty acids (countries that have implemented
legislation that bans or virtually eliminates trans fats from the food supply may
choose to adopt a per 100 g figure in line with their statutory limits), or ≥0.5% of
total energy in the form of alcohol are prohibited.
9.43 The model contains 2 categories for which marketing is always permitted:
fresh and frozen meat, poultry, fish and similar
fresh and frozen fruit, vegetables and legumes
The 2018 review of the UK Nutrient Profiling Model
74
Appendix E: Nutrient Profiling Model
expert group terms of reference
Accountability and governance
In order to oversee approaches and support progress, a Nutrient Profiling Model
(NPM) reference group and a NPM expert group will be established for this
programme of work. The role of the NPM expert group will be to provide
technical guidance and scrutiny for the overall work and make recommendations
to PHE. The role of the NPM reference group will expose the full range of
stakeholder views and advise on matters relating to the NPM. Both the NPM
expert group and NPM reference group will be chaired by the same chair.
Objectives
The NPM expert group will:
1. Review the existing UK NPM 2014/5 and provide technical scrutiny.
2. Review and provide advice on existing models, evidence, relevant
methodologies and the latest scientific developments.
3. Provide advice and technical scrutiny to the approach, methodology,
modelling and validation processes for updating/revising the NPM.
4. Review the results of the modelling and assist in the selection of the model(s)
to be put forward for public consultation.
5. Review comments from the public consultation and assist in developing the
recommendations to PHE on the final NPM.
Responsibilities of the NPM expert group
1. The NPM expert group will provide technical leadership, knowledge and
intelligence about the NPM, including any practical application for its intended
purpose.
2. To contribute to the discussion and advise on the process of reviewing and
updating the NPM.
3. To scrutinise proposals developed by PHE ensuring that such activity takes
full account of the prevention agenda; innovation; resources; and wider
developments in and external to PHE, ensuring interrogation of identified
issues.
4. Act as a source of advice to the NPM reference group on technical aspects of
the NPM and support progress of work.

The 2018 review of the UK Nutrient Profiling Model
75
5. To give a cohesive and balanced stakeholder perspective to inform reviewing
and updating the NPM.
6. To consider the current risks to delivery, provide insights to potential future.
threats and risks and consider the escalation of risks where appropriate
7. All advice should be scientifically based, and not be driven by bias, personal
opinion or lobbying.
NPM expert group membership*
Number Member Organisation/Role
Chair
1 Professor Russell Viner**
Institute of Child Health (ICH), Professor in Adolescent Health
Members
2 Dr Jean Adams University of Cambridge, School of Clinical Medicine, Centre for Diet and Activity Research Programme Lead for Evaluation of Population Interventions in Dietary Public Health
3 Professor Judy Buttriss British Nutrition Foundation, Director General
4 Professor Mike Rayner Nuffield Department of Population Health, University of Oxford, Professor of Population Health and Director
5 Dr Nicole Darmon – until November 2016
Aix-Marseille Université, Marseille, French National Research Institute for Agricultural Research, Research Director
6 Professor Sian Robinson
University of Southampton, Professor of Nutritional Epidemiology
7 Dr Tim Lobstein World Obesity Federation, Director of Policy
Observers
8 Liliya Skotarenko (Sharon Egan – until June 2016)
Department of Health and Social Care (DHSC)
9 Kate Halliwell Food and Drink Federation
10 Dr Modi Mwatsana UK Health Forum
11 Andrew Taylor Committee of Advertising Practice
12 Joanne Casey Food Standards Agency Northern Ireland
13 Dr Gillian Purdon Food Standards Scotland
14 Dr Sarah Rowles Welsh Government
Secretariat
15 Dr Alison Tedstone PHE Deputy Director Diet and Obesity and Chief Nutritionist
16 Professor Louis Levy PHE Head of Nutrition Science
17 Charlie Parker – until October 2016
PHE Diet and Obesity
18 Kate Sweeney PHE, Deputy Head of Risk Factors Intelligence

The 2018 review of the UK Nutrient Profiling Model
76
* This includes overlap of members on the NPM reference group * *The secretariat will appoint a Deputy Chair to chair meetings in the absence of the appointed Chair
Review
The NPM expert group will review the relevance and value of the groups
function, performance and review the terms of reference every 6 months to
ensure that it is operating effectively. Membership will be regularly reviewed with
the secretariat. Additional members with the relevant expertise may be invited to
join the NPM expert group following the publication of the UK government’s
Childhood Obesity Plan.
NPM work plan
The outline of the NPM timeline is set out: https://app.box.com/v/NPMTimeline Ways of working
Meetings
The NPM expert group will meet once every 2 months. The first meeting will be
held on 1 July 2016. Meetings will be aligned with the NPM reference group and
will be held on the same day.
Ad hoc teleconference meetings will be scheduled accordingly. Ad hoc
teleconference meetings, will be used for members to give a steer to ensure that
the work prepared by the secretariat is on course.
19 Rebecca Worboys – until August 2017
PHE, Health Economist
20 Sakhi Dodhia PHE Diet and Obesity
21 Penny Blair PHE Diet and Obesity
22 Rachel Manners PHE Diet and Obesity
The 2018 review of the UK Nutrient Profiling Model
77
Appendix F: Nutrient Profiling Model
reference group terms of reference
Accountability and governance
In order to oversee approaches and support progress, a Nutrient Profiling
Model (NPM) reference group and a NPM expert group will be established for
this programme of work. The role of the NPM expert group will be to provide
technical guidance and scrutiny for the overall work and make
recommendations to PHE. Members of the NPM expert group will also sit on
the NPM reference group. The role of the NPM reference group is detailed
below under objectives. Both the NPM expert group and NPM reference
group will be chaired by the same chair.
Objectives The NPM reference group will:
1. Expose the full range of stakeholder views, advise on matters relating to
the NPM, and appraise a selection of models in relation to their
applicability.
2. Provide oversight and comments to the methodology, approach and
validation processes for updating/revising the NPM.
3. Review comments from the public consultation.
Responsibilities of the NPM reference group
1. The NPM reference group will provide, through its multi-disciplinary
membership, knowledge about NPM, including proportionality through its
practical application for its intended purpose.
2. To observe and contribute to the discussion on the process of updating the
NPM that can be fed back to the NPM expert group.
3. To comment on proposals developed by PHE ensuring that such activity
takes full account of the prevention agenda; innovation; resources; and
wider developments in and external to PHE, ensuring interrogation of
identified issues.
4. To give a cohesive and balanced stakeholder perspective to inform
reviewing and updating the NPM and support progress of work.
5. To consider the current risks to delivery, provide insights to potential future
threats and risks and consider the escalation of risks where appropriate.

The 2018 review of the UK Nutrient Profiling Model
78
6. To represent their members and communicate processes and issues to
them as appropriate.

The 2018 review of the UK Nutrient Profiling Model
79
NPM reference group membership*
Number Member** Organisation/Role
Chair
1 Professor Russell Viner***
Institute of Child Health (ICH), Professor in Adolescent Health
Members
2 Andy Taylor Committee of Advertising Practice (CAP), Regulatory Policy Executive
3 Andrea Martinez-Inchausti
British Retail Consortium (BRC), Deputy Director of Food Policy
4 Kate Halliwell Food and Drink Federation (FDF), Nutrition and Health Manager
5 Malcolm Clark Cancer Research UK Policy Manager [from January2018. Prior January 2018 - Children’s Food Campaign co-ordinator]
6 Dr Modi Mwatsama UK Health Forum, Director of Global Health
7 Wan Mak Sodexo, Head of Dietetics and Nutrition and British Hospitality Association (BHA) representative
8 Dr Jean Adams University of Cambridge, School of Clinical Medicine, Centre for Diet and Activity Research Programme Lead for Evaluation of Population Interventions in Dietary Public Health
9 Professor Judy Buttriss British Nutrition Foundation, Director General
10 Professor Mike Rayner Nuffield Department of Population Health, University of Oxford, Professor of Population Health and Director
11 Dr Nicole Darmon – until November 2016
Aix-Marseille Université, Marseille, French National Research Institute for Agricultural Research, Research Director
12 Professor Sian Robinson University of Southampton, Professor of Nutritional Epidemiology
13 Dr Tim Lobstein World Obesity Federation, Director of Policy
Observers
14 Gwyn Owens Department of Culture, Media and Sports (DCMS)
15 Dr Michelle McQuillan Department of Environment, Food and Rural Affairs (Defra)
16 Liliya Skotarenko (Sharon Egan – until June 2016)
Department of Health and Social Care (DHSC)
17 Joanne Casey Food Standards Agency Northern Ireland
18 Dr Gillian Purdon Food Standards Scotland
19 Dr Sarah Rowles Welsh Government
Secretariat
20 Dr Alison Tedstone PHE Deputy Director Diet and Obesity and

The 2018 review of the UK Nutrient Profiling Model
80
* This includes overlap of members on the NPM expert group ** Invited guests eg PHE behavioural Insights team, SACN members, PHE dietary improvement representatives, PHE Chief Knowledge Officers team etc will be invited as appropriate. The NPM reference group through the secretariat will work with DHSC, DCMS and Defra to ensure the below are briefed on any relevant activities:
Ofcom, CAP, BCAP, ASA, AA
Behavioural Insights Team
Devolved administrations *** The secretariat will appoint a Deputy Chair to chair meetings in the absence of the appointed Chair
Review
The NPM reference group will review the relevance and value of the groups
function, performance and review the terms of reference every 6 months to
ensure that it is operating effectively. Membership will be regularly reviewed
with the secretariat. Additional members may be invited to join the NPM
reference group following the publication of the UK government’s Childhood
Obesity Plan.
NPM work plan The outline of the NPM timeline is set out: https://app.box.com/v/NPMTimeline.
Chief Nutritionist
21 Professor Louis Levy PHE Head of Nutrition Science
22 Charlie Parker – until October 2016
PHE Diet and Obesity
23 Kate Sweeney PHE Deputy Head of Risk Factors Intelligence
24 Rebecca Worboys – until August 2017
PHE Health Economist
25 Sakhi Dodhia PHE Diet and Obesity
26 Penny Blair PHE Diet and Obesity
27 Rachel Manners PHE Diet and Obesity
The 2018 review of the UK Nutrient Profiling Model
81
Appendix G: Nutrient Profiling Model
test dataset - overview of data sources
10.1 PHE has used a variety of data sources to construct the NPM test dataset. The
justification for using other data sources is provided in Appendix H. These include:
Kantar database
10.2 The Kantar Worldpanel is a global market research company, which runs and
analyses a continuously reporting panel of approximately 30,000 GB shoppers.
The Kantar Worldpanel database consists of >110,000 retail food and drink
products, which cover all food and drink categories. The information for each
product includes the price, sales volume, category, sub-category, information on
manufacturer and nutritional information (calories, total fat, saturated fat,
carbohydrate, sugars, protein, fibre and sodium).
10.3 The demographic make-up of the panel is defined using the Broadcasters’
Audience Research Board (BARB) survey and government census. The key
demographic targets are based on geographic region, social class, household
composition, size, and the age of the main shopper.
10.4 Each household is provided with barcode scanning equipment, which allows them
to record all take-home grocery purchases and report the data together with till
receipts. Panel members scan the barcodes of all grocery products purchased and
bring back into the home. Data on non-barcoded items (fruit and vegetables, store
bakery items for example) are collected using a patented codebook with food
photographs and barcodes. ‘Out of home purchasing’ is also collected from an
additional panel since 2015.
10.5 Nutritional information is sourced from Brandbank or alternatively fieldworkers visit
key retail stores and capture images with nutritional information on the packaging
on a rolling 6-month basis. Products not found or missing nutritional information
during the fieldwork process are estimated either from a similar product (cloned) or
otherwise using a category average (imputed). Nutritional values for a small
number of non-barcoded products are taken from McCance and Widdowson’s, The
Composition of Foods 7th Summary Edition53.
10.6 Quality control procedures assessing household eligibility are run every 4 weeks.
These include tracking household purchasing patterns, monitoring correct data
capture, panel continuity and household compliance. Any household that has not
been recording data on the panel for the full 4-week period is removed from the
The 2018 review of the UK Nutrient Profiling Model
82
final Kantar Worldpanel database (approximately 10-15% of the 30,000 GB
household panel do not meet the eligibility criteria in a typical 4-week period).
Compliance with scanning is encouraged by frequent email, postal, or telephone
reminders.
10.7 Data from Kantar Worldpanel was selected for use in constructing the NPM test
dataset as it provides relevant sales and nutrient information for products bought
for consumption at home. PHE had access to Kantar Worldpanel (2015) data for
product categories which make a substantial contribution to sugar intakes and only
selected nutrient information as the data was originally purchased by PHE for the
purpose of sugar reduction work; therefore Kantar Worldpanel (2014) and other
data sources were required to supplement this data.
Nielsen Brandbank database
10.8 The Nielsen Brandbank database consists of nutritional information for >100,000
food and drink products, from over 7,000 suppliers, including 200 major retailers
and manufacturers worldwide.
10.9 Nielsen Brandbank captures the back-of-pack and front-of-pack data as well as
high-resolution images of each product. Brandbank captures data from physical
samples of every product. Manufacturers send Brandbank a sample of the product,
and Brandbank then photograph it to provide all the images of the product that
consumers will later see on e-retail platforms. It is then the role of the data entry
teams to capture the nutritional information, which online manufacturers and retail
brands communicate to consumers, so that consumers buying the product online
can make an informed choice; as if they were holding the package in front of them
in a shop. The backbone of this data capture is the product barcode standard
GTIN, maintained by GS1, which sets rigorous standards around, for example,
when changes to products necessitate new barcodes.
10.10 Data is initially captured from product images supplied to Nielsen Brandbank's
office in India then a further 2 proof checks are carried out at the UK office before
uploading to their manufacturer/retail brand portal for approval. Once the
manufacturer/retail brand owner has approved the images and data captured by
Brandbank, it goes live on Brandbank’s product database and is date stamped. No
new or updated product data is ever published without approval from
manufacturer/brand, which improves accuracy and ensures the most current data
are used.
10.11 Product data, including nutrient data is updated when manufacturers alert
(Nielsen) Brandbank that a product’s content, composition or packaging has
changed. This occurs on an ongoing basis and the most up-to-date nutrient data is
The 2018 review of the UK Nutrient Profiling Model
83
provided by the manufacture at that point in time, for Brandbank to then code into
their systems. New or updated product data received by Brandbank is subjected to
the capture and approval process described above.
10.12 The Nielsen Brandbank database was selected for use in constructing the NPM
test dataset as it provides the full back-of-pack, front-of-pack nutrient information
and ingredients listing for a large number of products. As no sales information was
available from the Nielsen Brandbank database, supplementary data from other
sources (that is, Kantar Worldpanel data) was required to establish the most
commonly consumed products.
The Composition of Foods Integrated Dataset
10.13 The Composition of Foods Integrated Dataset (CoFID30), first published in 2008
and reviewed and updated in 2015, contains the nutrient values for a range of
commonly consumed foods in the UK. The nutrient data includes macronutrients,
vitamins, vitamin fractions, minerals, fatty acid fractions, phytosterols and organic
acids.
10.14 The nutrient data contained in CoFID have been obtained from a range of sources.
Although most of the data have been derived by analysis of foods, where analytical
data were not available the values have been taken from manufacturers’ data,
scientific literature and determined by calculation.
10.15 PHE had access to Kantar Worldpanel data for product categories, which made a
substantial contribution to sugar intakes only, and therefore some categories were
excluded. CoFIDqqq values was used to ‘gap-fill’ some of these excluded product
categories such as:
standardised/regulated (eg eggs, milk)
generic/unbranded products (eg fruit, vegetables and nuts)
other missing products (eg oils and spreads, dried pasta, cream,
cheese and packaged sandwiches)
qqq For the purpose of the review, CoFID values re-calculated in the format required for nutrition labelling
were used

The 2018 review of the UK Nutrient Profiling Model
84
Appendix H: Nutrient Profiling Model
test dataset - processes involved in its
development
11.1 The NPM test dataset contained 2,620 food and drink products.
11.2 Figure 1 summarises the processes involved in the development of the
NPM test dataset. This is followed by a detailed account for each
procedure.
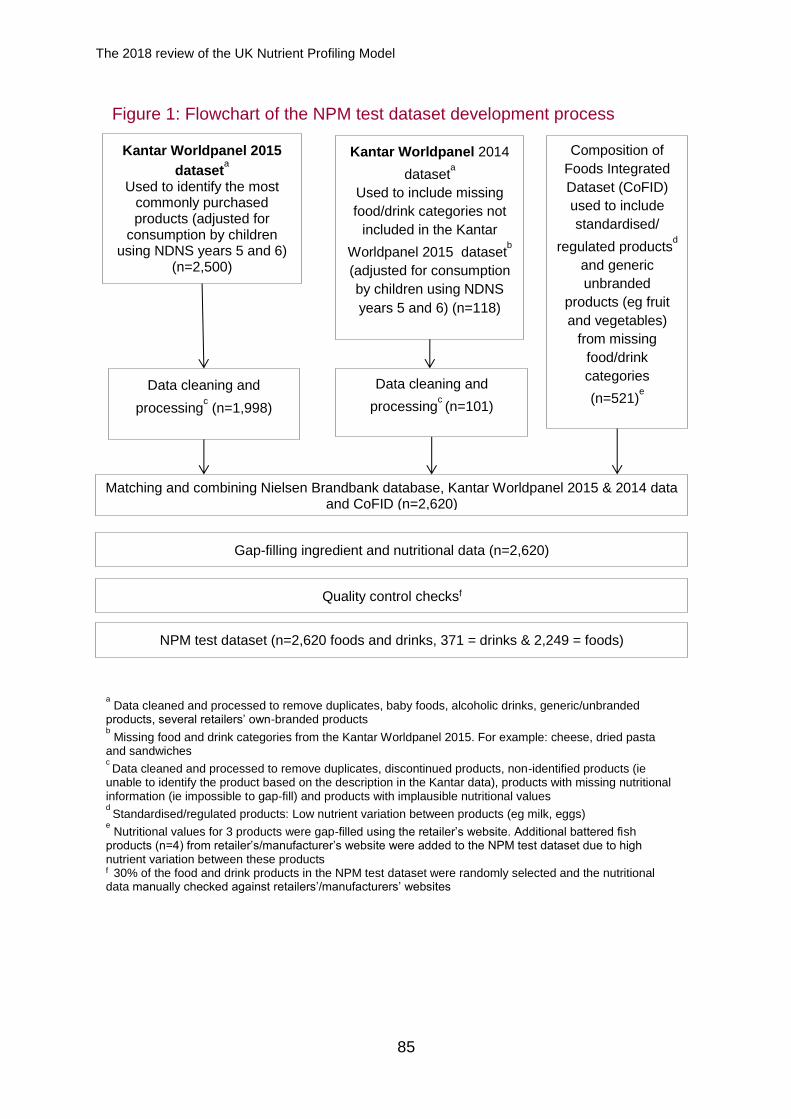
The 2018 review of the UK Nutrient Profiling Model
85
Kantar Worldpanel 2015
dataseta
Used to identify the most commonly purchased products (adjusted for
consumption by children using NDNS years 5 and 6)
(n=2,500)
Kantar Worldpanel 2014
dataseta
Used to include missing
food/drink categories not
included in the Kantar
Worldpanel 2015 datasetb
(adjusted for consumption
by children using NDNS
years 5 and 6) (n=118)
Composition of
Foods Integrated
Dataset (CoFID)
used to include
standardised/
regulated productsd
and generic
unbranded
products (eg fruit
and vegetables)
from missing
food/drink
categories
(n=521)e
Data cleaning and
processingc (n=1,998)
Data cleaning and
processingc (n=101)
Matching and combining Nielsen Brandbank database, Kantar Worldpanel 2015 & 2014 data and CoFID (n=2,620)
Gap-filling ingredient and nutritional data (n=2,620)
Quality control checksf
NPM test dataset (n=2,620 foods and drinks, 371 = drinks & 2,249 = foods)
a Data cleaned and processed to remove duplicates, baby foods, alcoholic drinks, generic/unbranded
products, several retailers’ own-branded products b Missing food and drink categories from the Kantar Worldpanel 2015. For example: cheese, dried pasta
and sandwiches c Data cleaned and processed to remove duplicates, discontinued products, non-identified products (ie
unable to identify the product based on the description in the Kantar data), products with missing nutritional information (ie impossible to gap-fill) and products with implausible nutritional values d
Standardised/regulated products: Low nutrient variation between products (eg milk, eggs) e Nutritional values for 3 products were gap-filled using the retailer’s website. Additional battered fish
products (n=4) from retailer’s/manufacturer’s website were added to the NPM test dataset due to high nutrient variation between these products f 30% of the food and drink products in the NPM test dataset were randomly selected and the nutritional data manually checked against retailers’/manufacturers’ websites
Figure 1: Flowchart of the NPM test dataset development process
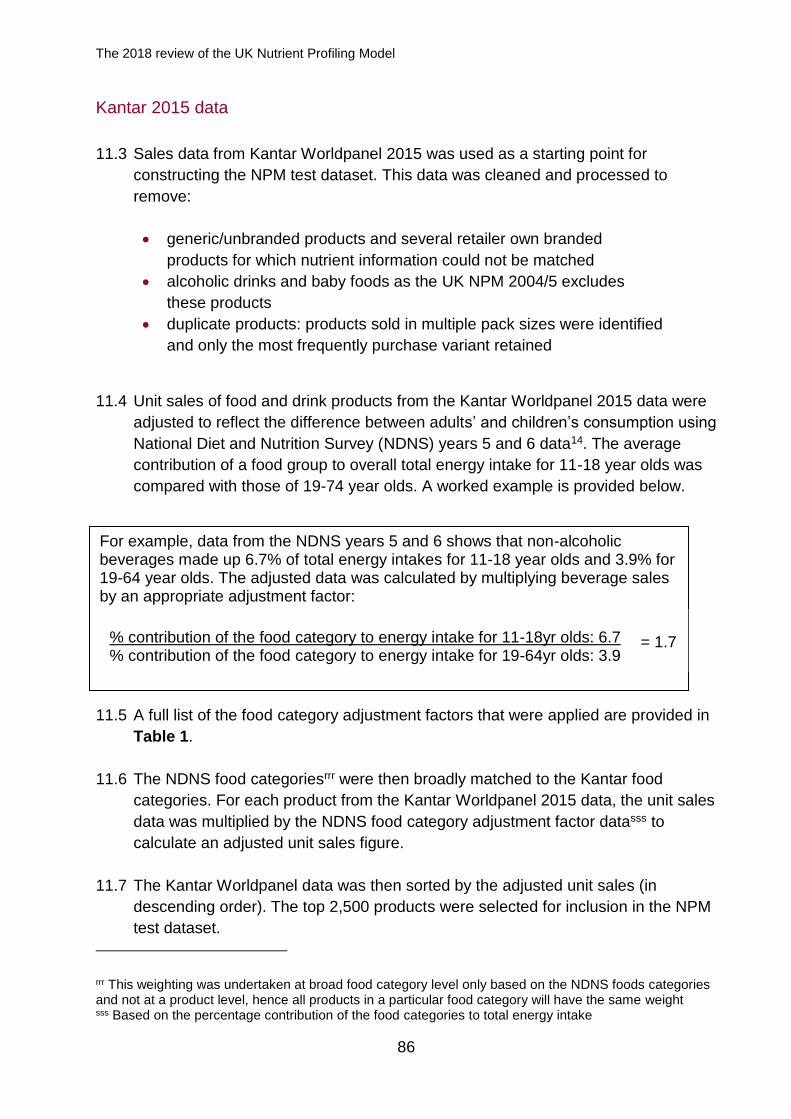
The 2018 review of the UK Nutrient Profiling Model
86
Kantar 2015 data
11.3 Sales data from Kantar Worldpanel 2015 was used as a starting point for
constructing the NPM test dataset. This data was cleaned and processed to
remove:
generic/unbranded products and several retailer own branded
products for which nutrient information could not be matched
alcoholic drinks and baby foods as the UK NPM 2004/5 excludes
these products
duplicate products: products sold in multiple pack sizes were identified
and only the most frequently purchase variant retained
11.4 Unit sales of food and drink products from the Kantar Worldpanel 2015 data were
adjusted to reflect the difference between adults’ and children’s consumption using
National Diet and Nutrition Survey (NDNS) years 5 and 6 data14. The average
contribution of a food group to overall total energy intake for 11-18 year olds was
compared with those of 19-74 year olds. A worked example is provided below.
11.5 A full list of the food category adjustment factors that were applied are provided in
Table 1.
11.6 The NDNS food categoriesrrr were then broadly matched to the Kantar food
categories. For each product from the Kantar Worldpanel 2015 data, the unit sales
data was multiplied by the NDNS food category adjustment factor datasss to
calculate an adjusted unit sales figure.
11.7 The Kantar Worldpanel data was then sorted by the adjusted unit sales (in
descending order). The top 2,500 products were selected for inclusion in the NPM
test dataset.
rrr This weighting was undertaken at broad food category level only based on the NDNS foods categories and not at a product level, hence all products in a particular food category will have the same weight sss Based on the percentage contribution of the food categories to total energy intake
For example, data from the NDNS years 5 and 6 shows that non-alcoholic beverages made up 6.7% of total energy intakes for 11-18 year olds and 3.9% for 19-64 year olds. The adjusted data was calculated by multiplying beverage sales by an appropriate adjustment factor:
% contribution of the food category to energy intake for 11-18yr olds: 6.7 % contribution of the food category to energy intake for 19-64yr olds: 3.9
= 1.7
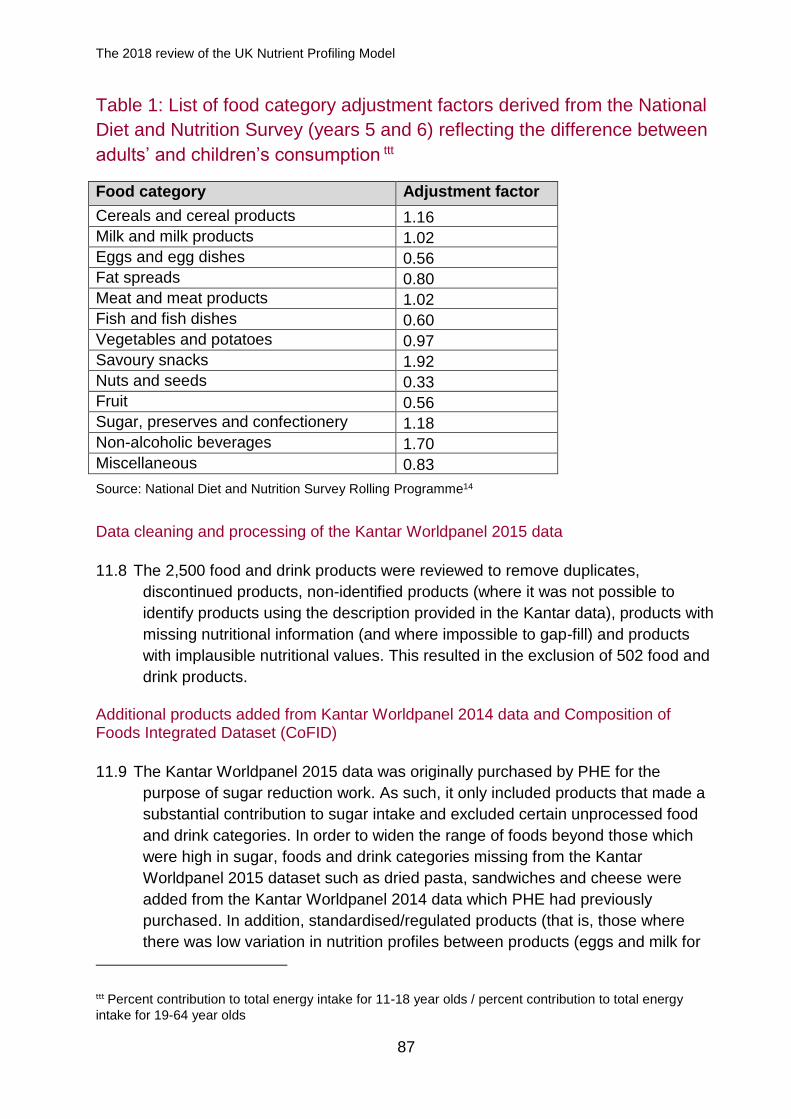
The 2018 review of the UK Nutrient Profiling Model
87
Table 1: List of food category adjustment factors derived from the National
Diet and Nutrition Survey (years 5 and 6) reflecting the difference between
adults’ and children’s consumption ttt
Food category Adjustment factor
Cereals and cereal products 1.16
Milk and milk products 1.02
Eggs and egg dishes 0.56
Fat spreads 0.80
Meat and meat products 1.02
Fish and fish dishes 0.60
Vegetables and potatoes 0.97
Savoury snacks 1.92
Nuts and seeds 0.33
Fruit 0.56
Sugar, preserves and confectionery 1.18
Non-alcoholic beverages 1.70
Miscellaneous 0.83
Source: National Diet and Nutrition Survey Rolling Programme14
Data cleaning and processing of the Kantar Worldpanel 2015 data
11.8 The 2,500 food and drink products were reviewed to remove duplicates,
discontinued products, non-identified products (where it was not possible to
identify products using the description provided in the Kantar data), products with
missing nutritional information (and where impossible to gap-fill) and products
with implausible nutritional values. This resulted in the exclusion of 502 food and
drink products.
Additional products added from Kantar Worldpanel 2014 data and Composition of Foods Integrated Dataset (CoFID)
11.9 The Kantar Worldpanel 2015 data was originally purchased by PHE for the
purpose of sugar reduction work. As such, it only included products that made a
substantial contribution to sugar intake and excluded certain unprocessed food
and drink categories. In order to widen the range of foods beyond those which
were high in sugar, foods and drink categories missing from the Kantar
Worldpanel 2015 dataset such as dried pasta, sandwiches and cheese were
added from the Kantar Worldpanel 2014 data which PHE had previously
purchased. In addition, standardised/regulated products (that is, those where
there was low variation in nutrition profiles between products (eggs and milk for
ttt Percent contribution to total energy intake for 11-18 year olds / percent contribution to total energy
intake for 19-64 year olds
The 2018 review of the UK Nutrient Profiling Model
88
example) and generic/unbranded products (fruit, vegetables and nuts for
example) were added from the CoFID30.
11.10 Unit sales were adjusted for the difference between adults’ and children’s
consumption using the same methodology used for the Kantar Worldpanel 2015
data. An additional 118 products were identified for potential inclusion in the
NPM test dataset. Data cleaning of these products was also carried out as per
the Kantar Worldpanel 2015 data (paragraph 11.8) resulting in 101 food and
drink products to be added to the NPM test dataset.
11.11 514 standardised/regulated products and generic/unbranded products were
added from CoFID as these were missing from the Nielsen Brandbank and
Kantar Worldpanel dataset to ensure the dataset was more rounded and
contained a wide range of products. Nutritional values for 3 CoFID products were
gap-filled (paragraph 11.17) using retailer’s websites and additional battered fish
products (n=4) were added from retailer’s/manufacturer’s websites due to high
nutrient variation between these products, bringing the total to 521 food and drink
products.
Matching and combining of the Nielsen Brandbank database, Kantar Worldpanel 2015 data, Kantar Worldpanel 2014 data and CoFID
11.12 Data from Brandbank was used to populate the nutrient composition data
(energy, total carbohydrate, total sugars, total fat, saturated fat, fibre and salt per
100g or per 100ml) within the NPM test dataset. This was because the Kantar
data available to PHE did not contain nutrient information on fibre and protein or
ingredient information.
11.13 The data from Brandbank was exported in October 2016. Therefore, any
changes to a product’s nutritional profile after that date, due to reformulation for
example, were not captured.
11.14 The exported Brandbank data was cleaned and processed to remove duplicates.
In addition, food items with very high nutritional values (cut-off points) for energy,
carbohydrate, sugar, protein, total fat, saturated fat, fibre and salt were identified
and manually inspected to confirm that the top food contributors to the nutrient
were correct. Cut-off points were applied to identify foods with very high
nutritional values based on values obtained from McCance Widdowson’s the
Composition of Foods: 7th Summary Edition (MW7)53. These cut-off points are
provided in Table 2.
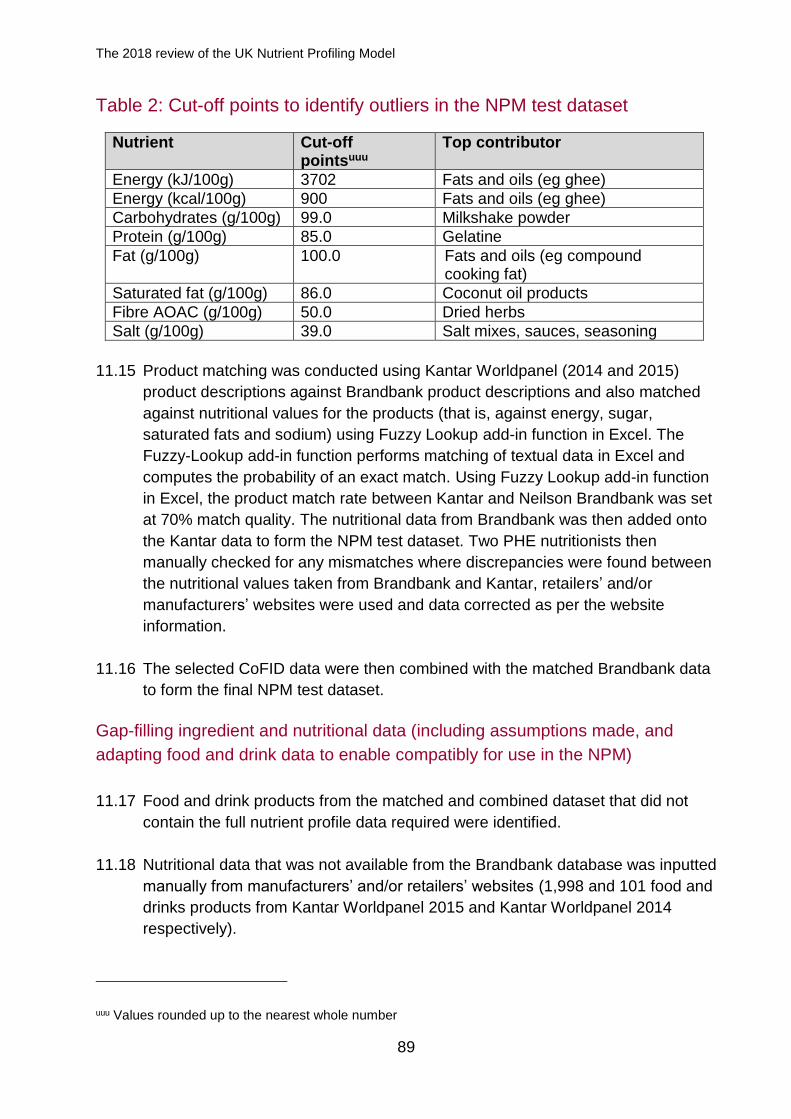
The 2018 review of the UK Nutrient Profiling Model
89
Table 2: Cut-off points to identify outliers in the NPM test dataset
Nutrient Cut-off pointsuuu
Top contributor
Energy (kJ/100g) 3702 Fats and oils (eg ghee)
Energy (kcal/100g) 900 Fats and oils (eg ghee)
Carbohydrates (g/100g) 99.0 Milkshake powder
Protein (g/100g) 85.0 Gelatine
Fat (g/100g) 100.0 Fats and oils (eg compound cooking fat)
Saturated fat (g/100g) 86.0 Coconut oil products
Fibre AOAC (g/100g) 50.0 Dried herbs
Salt (g/100g) 39.0 Salt mixes, sauces, seasoning
11.15 Product matching was conducted using Kantar Worldpanel (2014 and 2015)
product descriptions against Brandbank product descriptions and also matched
against nutritional values for the products (that is, against energy, sugar,
saturated fats and sodium) using Fuzzy Lookup add-in function in Excel. The
Fuzzy-Lookup add-in function performs matching of textual data in Excel and
computes the probability of an exact match. Using Fuzzy Lookup add-in function
in Excel, the product match rate between Kantar and Neilson Brandbank was set
at 70% match quality. The nutritional data from Brandbank was then added onto
the Kantar data to form the NPM test dataset. Two PHE nutritionists then
manually checked for any mismatches where discrepancies were found between
the nutritional values taken from Brandbank and Kantar, retailers’ and/or
manufacturers’ websites were used and data corrected as per the website
information.
11.16 The selected CoFID data were then combined with the matched Brandbank data
to form the final NPM test dataset.
Gap-filling ingredient and nutritional data (including assumptions made, and
adapting food and drink data to enable compatibly for use in the NPM)
11.17 Food and drink products from the matched and combined dataset that did not
contain the full nutrient profile data required were identified.
11.18 Nutritional data that was not available from the Brandbank database was inputted
manually from manufacturers’ and/or retailers’ websites (1,998 and 101 food and
drinks products from Kantar Worldpanel 2015 and Kantar Worldpanel 2014
respectively).
uuu Values rounded up to the nearest whole number
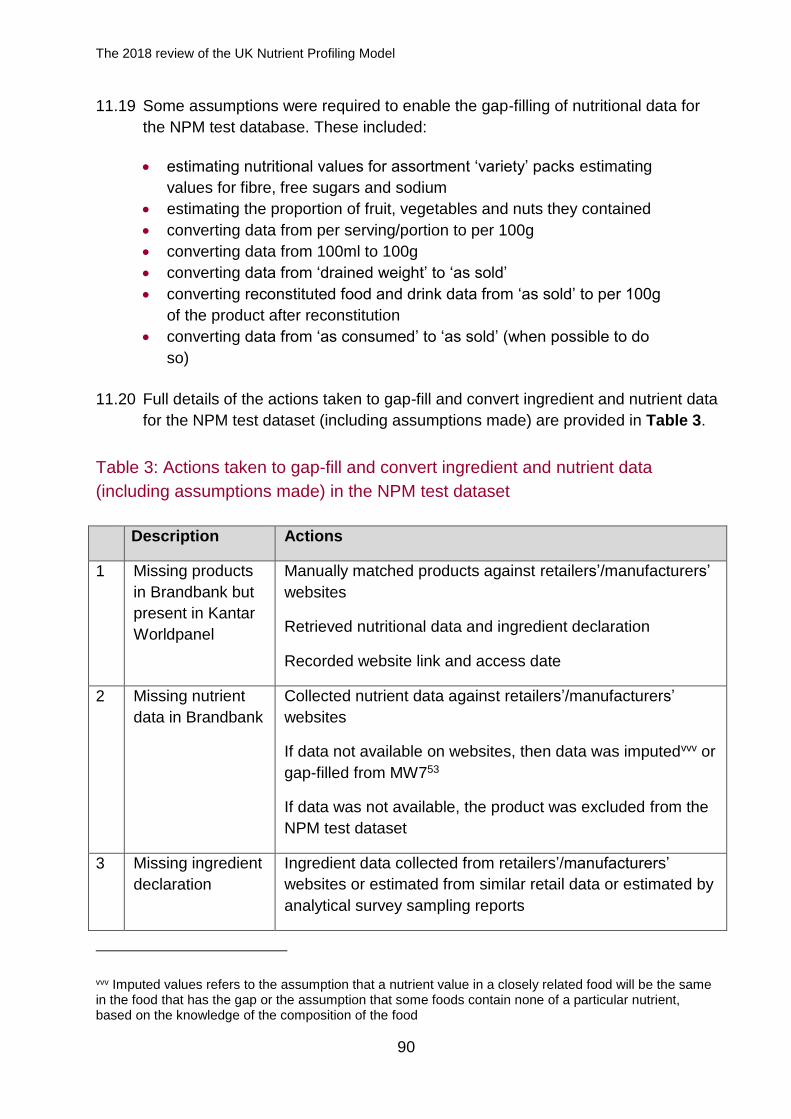
The 2018 review of the UK Nutrient Profiling Model
90
11.19 Some assumptions were required to enable the gap-filling of nutritional data for
the NPM test database. These included:
estimating nutritional values for assortment ‘variety’ packs estimating
values for fibre, free sugars and sodium
estimating the proportion of fruit, vegetables and nuts they contained
converting data from per serving/portion to per 100g
converting data from 100ml to 100g
converting data from ‘drained weight’ to ‘as sold’
converting reconstituted food and drink data from ‘as sold’ to per 100g
of the product after reconstitution
converting data from ‘as consumed’ to ‘as sold’ (when possible to do
so)
11.20 Full details of the actions taken to gap-fill and convert ingredient and nutrient data
for the NPM test dataset (including assumptions made) are provided in Table 3.
Table 3: Actions taken to gap-fill and convert ingredient and nutrient data
(including assumptions made) in the NPM test dataset
Description Actions
1 Missing products
in Brandbank but
present in Kantar
Worldpanel
Manually matched products against retailers’/manufacturers’
websites
Retrieved nutritional data and ingredient declaration
Recorded website link and access date
2 Missing nutrient
data in Brandbank
Collected nutrient data against retailers’/manufacturers’
websites
If data not available on websites, then data was imputedvvv or
gap-filled from MW753
If data was not available, the product was excluded from the
NPM test dataset
3 Missing ingredient
declaration
Ingredient data collected from retailers’/manufacturers’
websites or estimated from similar retail data or estimated by
analytical survey sampling reports
vvv Imputed values refers to the assumption that a nutrient value in a closely related food will be the same in the food that has the gap or the assumption that some foods contain none of a particular nutrient, based on the knowledge of the composition of the food
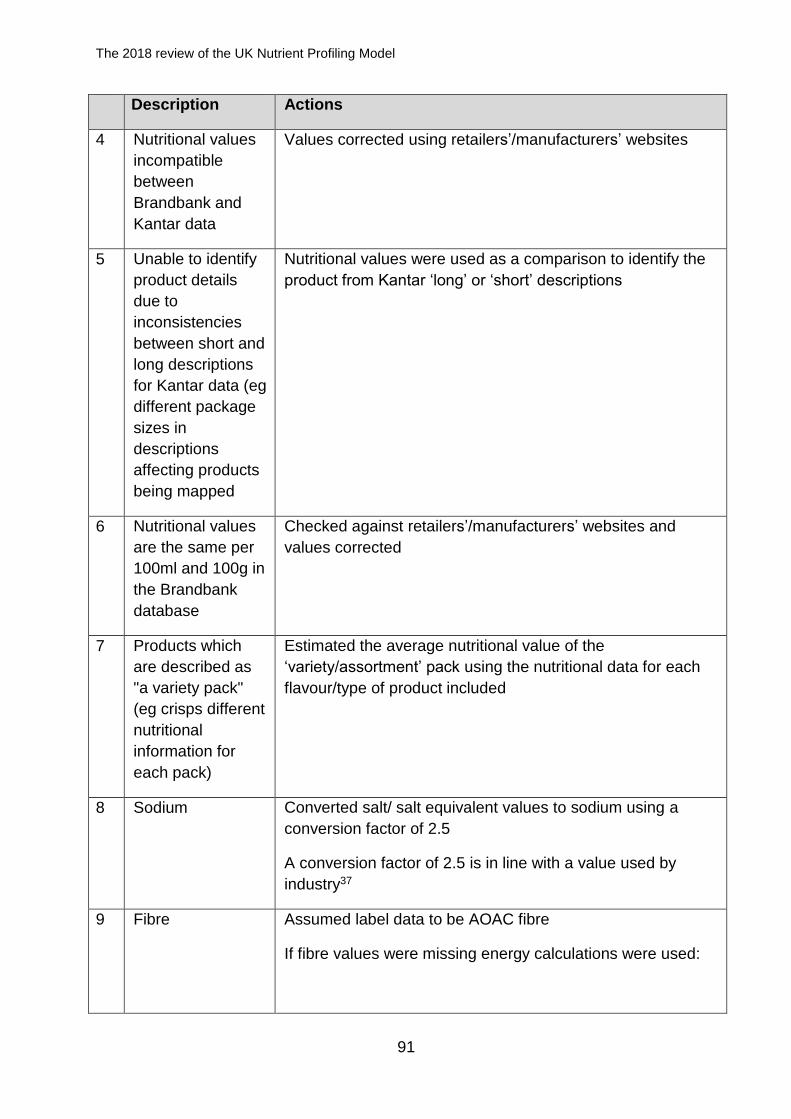
The 2018 review of the UK Nutrient Profiling Model
91
Description Actions
4 Nutritional values
incompatible
between
Brandbank and
Kantar data
Values corrected using retailers’/manufacturers’ websites
5 Unable to identify
product details
due to
inconsistencies
between short and
long descriptions
for Kantar data (eg
different package
sizes in
descriptions
affecting products
being mapped
Nutritional values were used as a comparison to identify the
product from Kantar ‘long’ or ‘short’ descriptions
6 Nutritional values
are the same per
100ml and 100g in
the Brandbank
database
Checked against retailers’/manufacturers’ websites and
values corrected
7 Products which
are described as
"a variety pack"
(eg crisps different
nutritional
information for
each pack)
Estimated the average nutritional value of the
‘variety/assortment’ pack using the nutritional data for each
flavour/type of product included
8 Sodium Converted salt/ salt equivalent values to sodium using a
conversion factor of 2.5
A conversion factor of 2.5 is in line with a value used by
industry37
9 Fibre Assumed label data to be AOAC fibre
If fibre values were missing energy calculations were used:
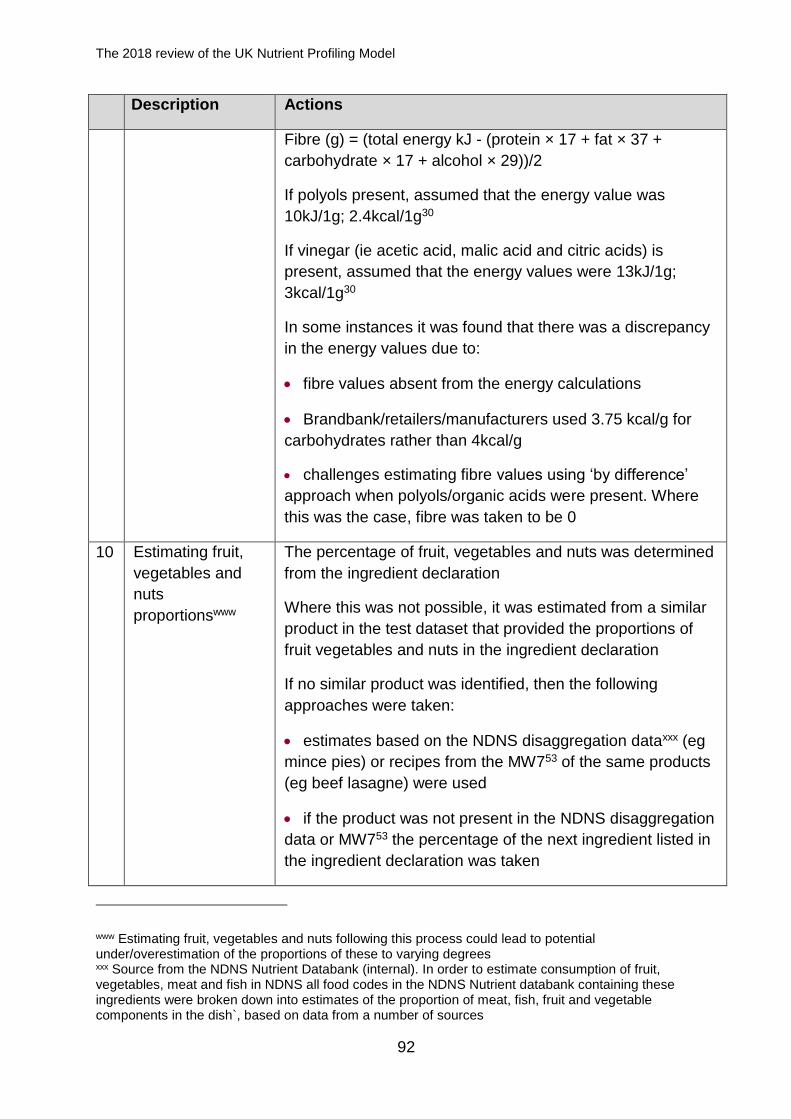
The 2018 review of the UK Nutrient Profiling Model
92
Description Actions
Fibre (g) = (total energy kJ - (protein × 17 + fat × 37 +
carbohydrate × 17 + alcohol × 29))/2
If polyols present, assumed that the energy value was
10kJ/1g; 2.4kcal/1g30
If vinegar (ie acetic acid, malic acid and citric acids) is
present, assumed that the energy values were 13kJ/1g;
3kcal/1g30
In some instances it was found that there was a discrepancy
in the energy values due to:
fibre values absent from the energy calculations
Brandbank/retailers/manufacturers used 3.75 kcal/g for
carbohydrates rather than 4kcal/g
challenges estimating fibre values using ‘by difference’
approach when polyols/organic acids were present. Where
this was the case, fibre was taken to be 0
10 Estimating fruit,
vegetables and
nuts
proportionswww
The percentage of fruit, vegetables and nuts was determined
from the ingredient declaration
Where this was not possible, it was estimated from a similar
product in the test dataset that provided the proportions of
fruit vegetables and nuts in the ingredient declaration
If no similar product was identified, then the following
approaches were taken:
estimates based on the NDNS disaggregation dataxxx (eg
mince pies) or recipes from the MW753 of the same products
(eg beef lasagne) were used
if the product was not present in the NDNS disaggregation
data or MW753 the percentage of the next ingredient listed in
the ingredient declaration was taken
www Estimating fruit, vegetables and nuts following this process could lead to potential under/overestimation of the proportions of these to varying degrees xxx Source from the NDNS Nutrient Databank (internal). In order to estimate consumption of fruit, vegetables, meat and fish in NDNS all food codes in the NDNS Nutrient databank containing these ingredients were broken down into estimates of the proportion of meat, fish, fruit and vegetable components in the dish`, based on data from a number of sources
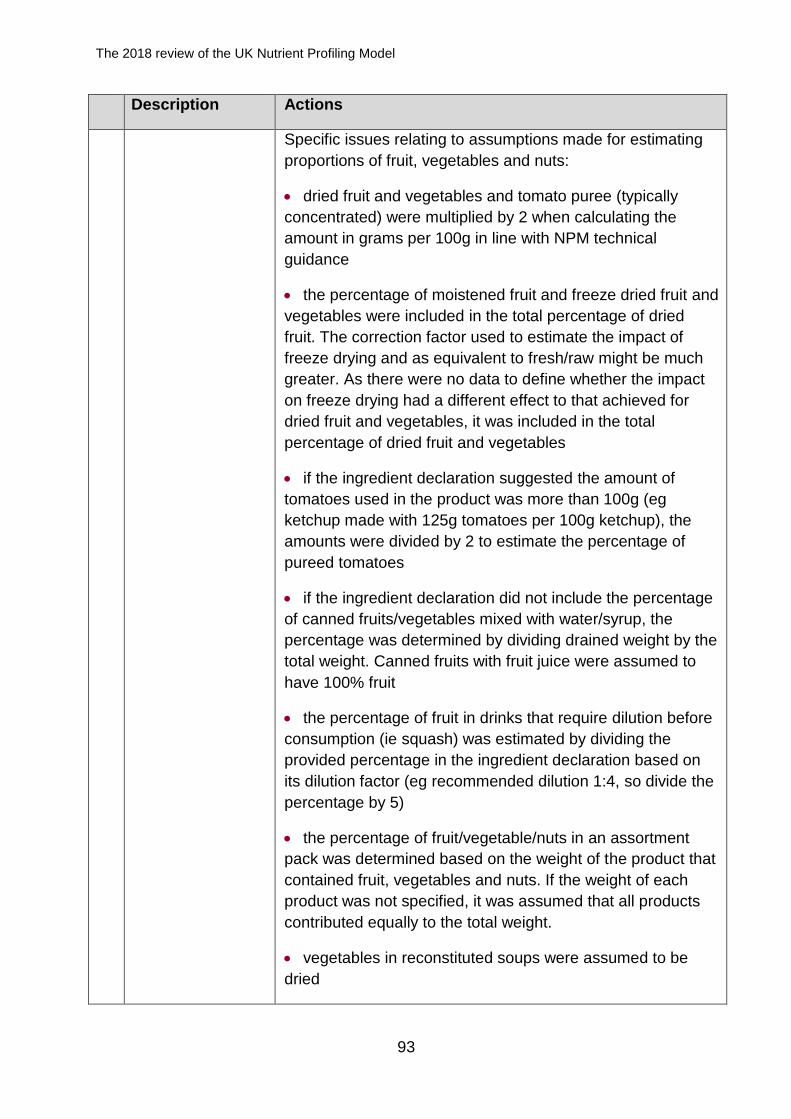
The 2018 review of the UK Nutrient Profiling Model
93
Description Actions
Specific issues relating to assumptions made for estimating
proportions of fruit, vegetables and nuts:
dried fruit and vegetables and tomato puree (typically
concentrated) were multiplied by 2 when calculating the
amount in grams per 100g in line with NPM technical
guidance
the percentage of moistened fruit and freeze dried fruit and
vegetables were included in the total percentage of dried
fruit. The correction factor used to estimate the impact of
freeze drying and as equivalent to fresh/raw might be much
greater. As there were no data to define whether the impact
on freeze drying had a different effect to that achieved for
dried fruit and vegetables, it was included in the total
percentage of dried fruit and vegetables
if the ingredient declaration suggested the amount of
tomatoes used in the product was more than 100g (eg
ketchup made with 125g tomatoes per 100g ketchup), the
amounts were divided by 2 to estimate the percentage of
pureed tomatoes
if the ingredient declaration did not include the percentage
of canned fruits/vegetables mixed with water/syrup, the
percentage was determined by dividing drained weight by the
total weight. Canned fruits with fruit juice were assumed to
have 100% fruit
the percentage of fruit in drinks that require dilution before
consumption (ie squash) was estimated by dividing the
provided percentage in the ingredient declaration based on
its dilution factor (eg recommended dilution 1:4, so divide the
percentage by 5)
the percentage of fruit/vegetable/nuts in an assortment
pack was determined based on the weight of the product that
contained fruit, vegetables and nuts. If the weight of each
product was not specified, it was assumed that all products
contributed equally to the total weight.
vegetables in reconstituted soups were assumed to be
dried
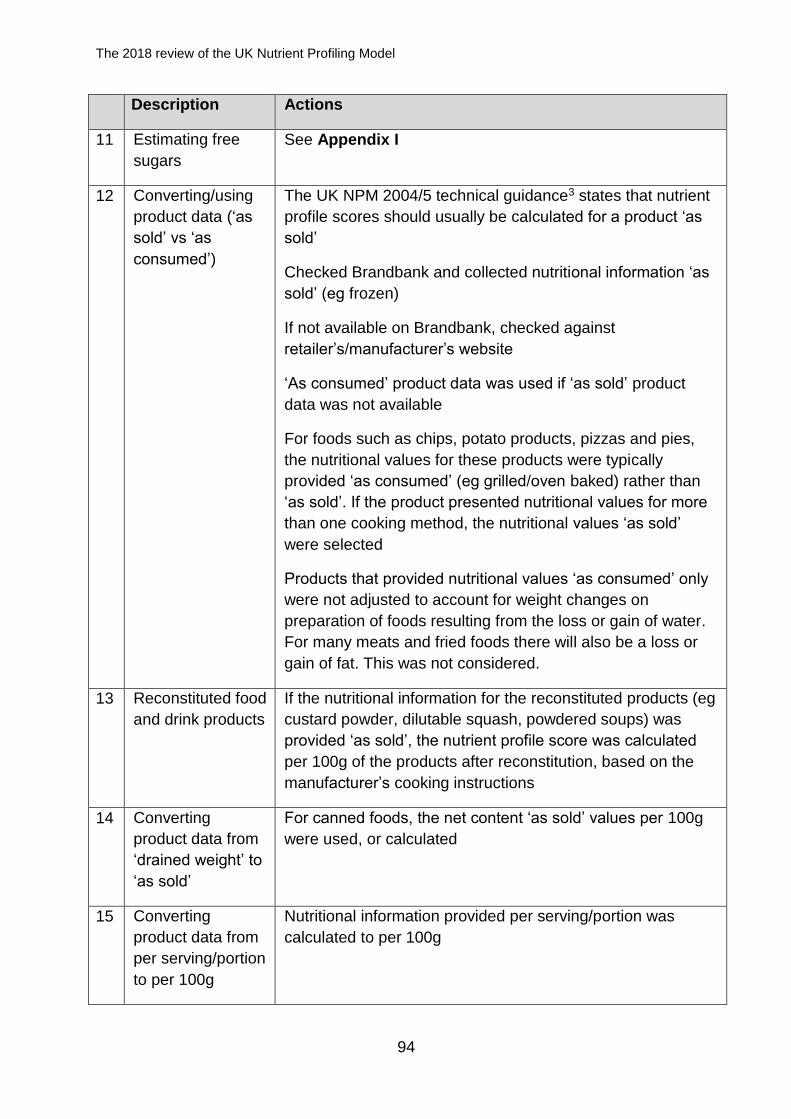
The 2018 review of the UK Nutrient Profiling Model
94
Description Actions
11 Estimating free
sugars
See Appendix I
12 Converting/using
product data (‘as
sold’ vs ‘as
consumed’)
The UK NPM 2004/5 technical guidance3 states that nutrient
profile scores should usually be calculated for a product ‘as
sold’
Checked Brandbank and collected nutritional information ‘as
sold’ (eg frozen)
If not available on Brandbank, checked against
retailer’s/manufacturer’s website
‘As consumed’ product data was used if ‘as sold’ product
data was not available
For foods such as chips, potato products, pizzas and pies,
the nutritional values for these products were typically
provided ‘as consumed’ (eg grilled/oven baked) rather than
‘as sold’. If the product presented nutritional values for more
than one cooking method, the nutritional values ‘as sold’
were selected
Products that provided nutritional values ‘as consumed’ only
were not adjusted to account for weight changes on
preparation of foods resulting from the loss or gain of water.
For many meats and fried foods there will also be a loss or
gain of fat. This was not considered.
13 Reconstituted food
and drink products
If the nutritional information for the reconstituted products (eg
custard powder, dilutable squash, powdered soups) was
provided ‘as sold’, the nutrient profile score was calculated
per 100g of the products after reconstitution, based on the
manufacturer’s cooking instructions
14 Converting
product data from
‘drained weight’ to
‘as sold’
For canned foods, the net content ‘as sold’ values per 100g
were used, or calculated
15 Converting
product data from
per serving/portion
to per 100g
Nutritional information provided per serving/portion was
calculated to per 100g
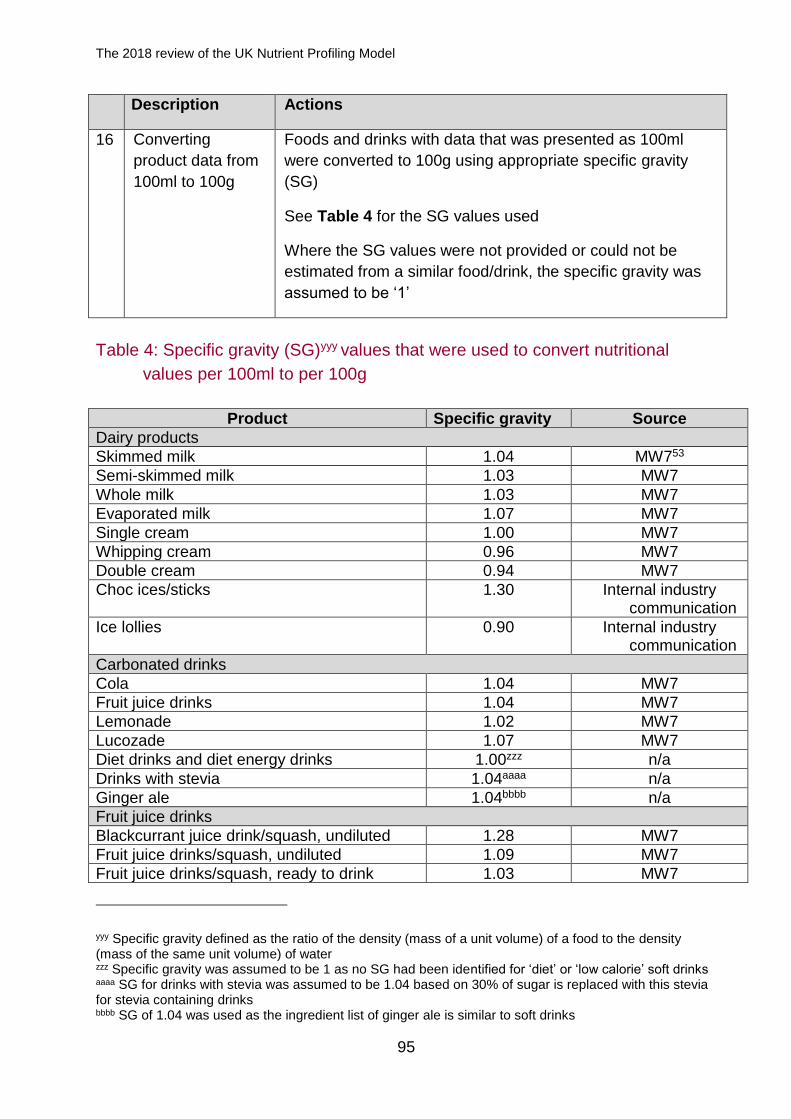
The 2018 review of the UK Nutrient Profiling Model
95
Description Actions
16 Converting
product data from
100ml to 100g
Foods and drinks with data that was presented as 100ml
were converted to 100g using appropriate specific gravity
(SG)
See Table 4 for the SG values used
Where the SG values were not provided or could not be
estimated from a similar food/drink, the specific gravity was
assumed to be ‘1’
Table 4: Specific gravity (SG)yyy values that were used to convert nutritional
values per 100ml to per 100g
Product Specific gravity Source
Dairy products
Skimmed milk 1.04 MW753
Semi-skimmed milk 1.03 MW7
Whole milk 1.03 MW7
Evaporated milk 1.07 MW7
Single cream 1.00 MW7
Whipping cream 0.96 MW7
Double cream 0.94 MW7
Choc ices/sticks 1.30 Internal industry communication
Ice lollies 0.90 Internal industry communication
Carbonated drinks
Cola 1.04 MW7
Fruit juice drinks 1.04 MW7
Lemonade 1.02 MW7
Lucozade 1.07 MW7
Diet drinks and diet energy drinks 1.00zzz n/a
Drinks with stevia 1.04aaaa n/a
Ginger ale 1.04bbbb n/a
Fruit juice drinks
Blackcurrant juice drink/squash, undiluted 1.28 MW7
Fruit juice drinks/squash, undiluted 1.09 MW7
Fruit juice drinks/squash, ready to drink 1.03 MW7
yyy Specific gravity defined as the ratio of the density (mass of a unit volume) of a food to the density (mass of the same unit volume) of water zzz Specific gravity was assumed to be 1 as no SG had been identified for ‘diet’ or ‘low calorie’ soft drinks aaaa SG for drinks with stevia was assumed to be 1.04 based on 30% of sugar is replaced with this stevia for stevia containing drinks bbbb SG of 1.04 was used as the ingredient list of ginger ale is similar to soft drinks
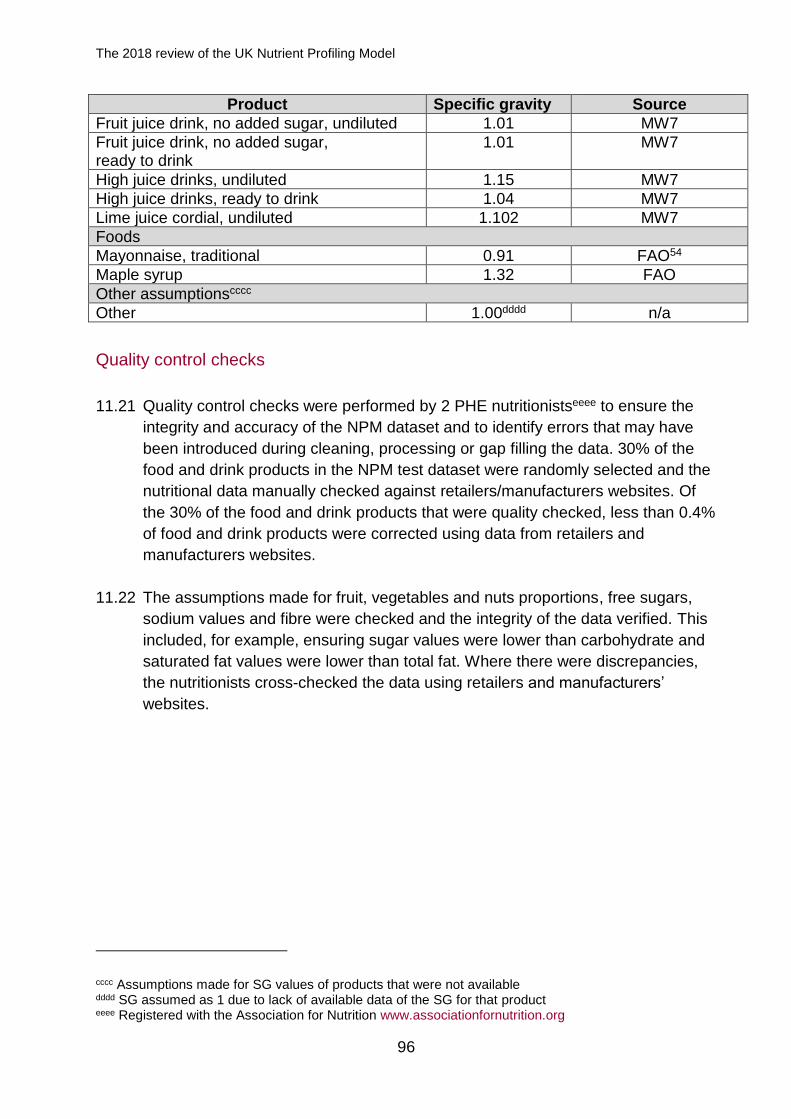
The 2018 review of the UK Nutrient Profiling Model
96
Product Specific gravity Source
Fruit juice drink, no added sugar, undiluted 1.01 MW7
Fruit juice drink, no added sugar, ready to drink
1.01 MW7
High juice drinks, undiluted 1.15 MW7
High juice drinks, ready to drink 1.04 MW7
Lime juice cordial, undiluted 1.102 MW7
Foods
Mayonnaise, traditional 0.91 FAO54
Maple syrup 1.32 FAO
Other assumptionscccc
Other 1.00dddd n/a
Quality control checks
11.21 Quality control checks were performed by 2 PHE nutritionistseeee to ensure the
integrity and accuracy of the NPM dataset and to identify errors that may have
been introduced during cleaning, processing or gap filling the data. 30% of the
food and drink products in the NPM test dataset were randomly selected and the
nutritional data manually checked against retailers/manufacturers websites. Of
the 30% of the food and drink products that were quality checked, less than 0.4%
of food and drink products were corrected using data from retailers and
manufacturers websites.
11.22 The assumptions made for fruit, vegetables and nuts proportions, free sugars,
sodium values and fibre were checked and the integrity of the data verified. This
included, for example, ensuring sugar values were lower than carbohydrate and
saturated fat values were lower than total fat. Where there were discrepancies,
the nutritionists cross-checked the data using retailers and manufacturers’
websites.
cccc Assumptions made for SG values of products that were not available dddd SG assumed as 1 due to lack of available data of the SG for that product eeee Registered with the Association for Nutrition www.associationfornutrition.org
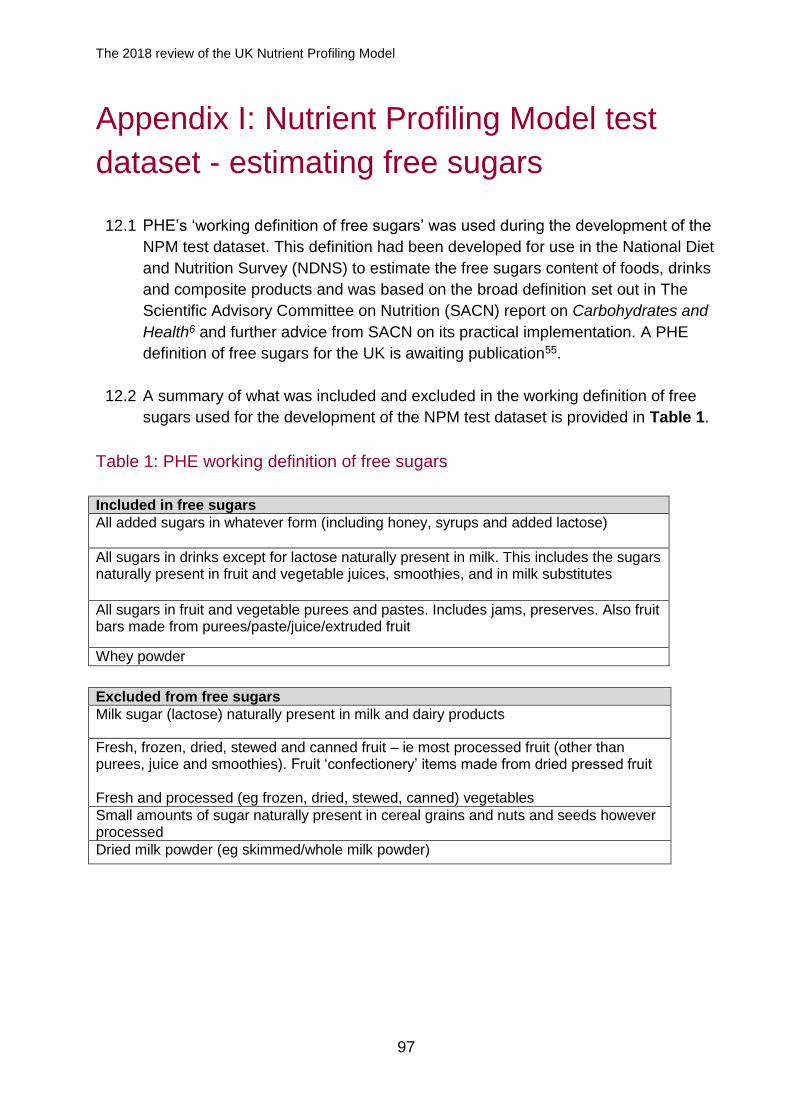
The 2018 review of the UK Nutrient Profiling Model
97
Appendix I: Nutrient Profiling Model test
dataset - estimating free sugars
12.1 PHE’s ‘working definition of free sugars’ was used during the development of the
NPM test dataset. This definition had been developed for use in the National Diet
and Nutrition Survey (NDNS) to estimate the free sugars content of foods, drinks
and composite products and was based on the broad definition set out in The
Scientific Advisory Committee on Nutrition (SACN) report on Carbohydrates and
Health6 and further advice from SACN on its practical implementation. A PHE
definition of free sugars for the UK is awaiting publication55.
12.2 A summary of what was included and excluded in the working definition of free
sugars used for the development of the NPM test dataset is provided in Table 1.
Table 1: PHE working definition of free sugars
Included in free sugars
All added sugars in whatever form (including honey, syrups and added lactose)
All sugars in drinks except for lactose naturally present in milk. This includes the sugars naturally present in fruit and vegetable juices, smoothies, and in milk substitutes
All sugars in fruit and vegetable purees and pastes. Includes jams, preserves. Also fruit bars made from purees/paste/juice/extruded fruit
Whey powder
Excluded from free sugars
Milk sugar (lactose) naturally present in milk and dairy products
Fresh, frozen, dried, stewed and canned fruit – ie most processed fruit (other than purees, juice and smoothies). Fruit ‘confectionery’ items made from dried pressed fruit Fresh and processed (eg frozen, dried, stewed, canned) vegetables
Small amounts of sugar naturally present in cereal grains and nuts and seeds however processed
Dried milk powder (eg skimmed/whole milk powder)
The 2018 review of the UK Nutrient Profiling Model
98
12.4 Wherever possible assumptions were made on a category basis (which can be
found in Table 2. However, some categories required further consideration on
foods and drinks.
12.5 During the development of the NPM test dataset, it became apparent that further
decisions were required on whether whey powder and dried milk powders should
be included as free sugars.
12.6 Table 2 presents the assumptions used in estimating free sugars values by
category (and where possible sub-category) level in the NPM test dataset. For
the purpose of estimating free sugars, the categories developed to estimate free
sugars are not aligned with categories used(including the numbers in each
category), in reporting the results tables (ie those foods and drinks listed in
Appendix J).
12.7 A free sugars decision tree which could be used to help decide whether a food or
drink contains free sugars, is provided in Appendix L.
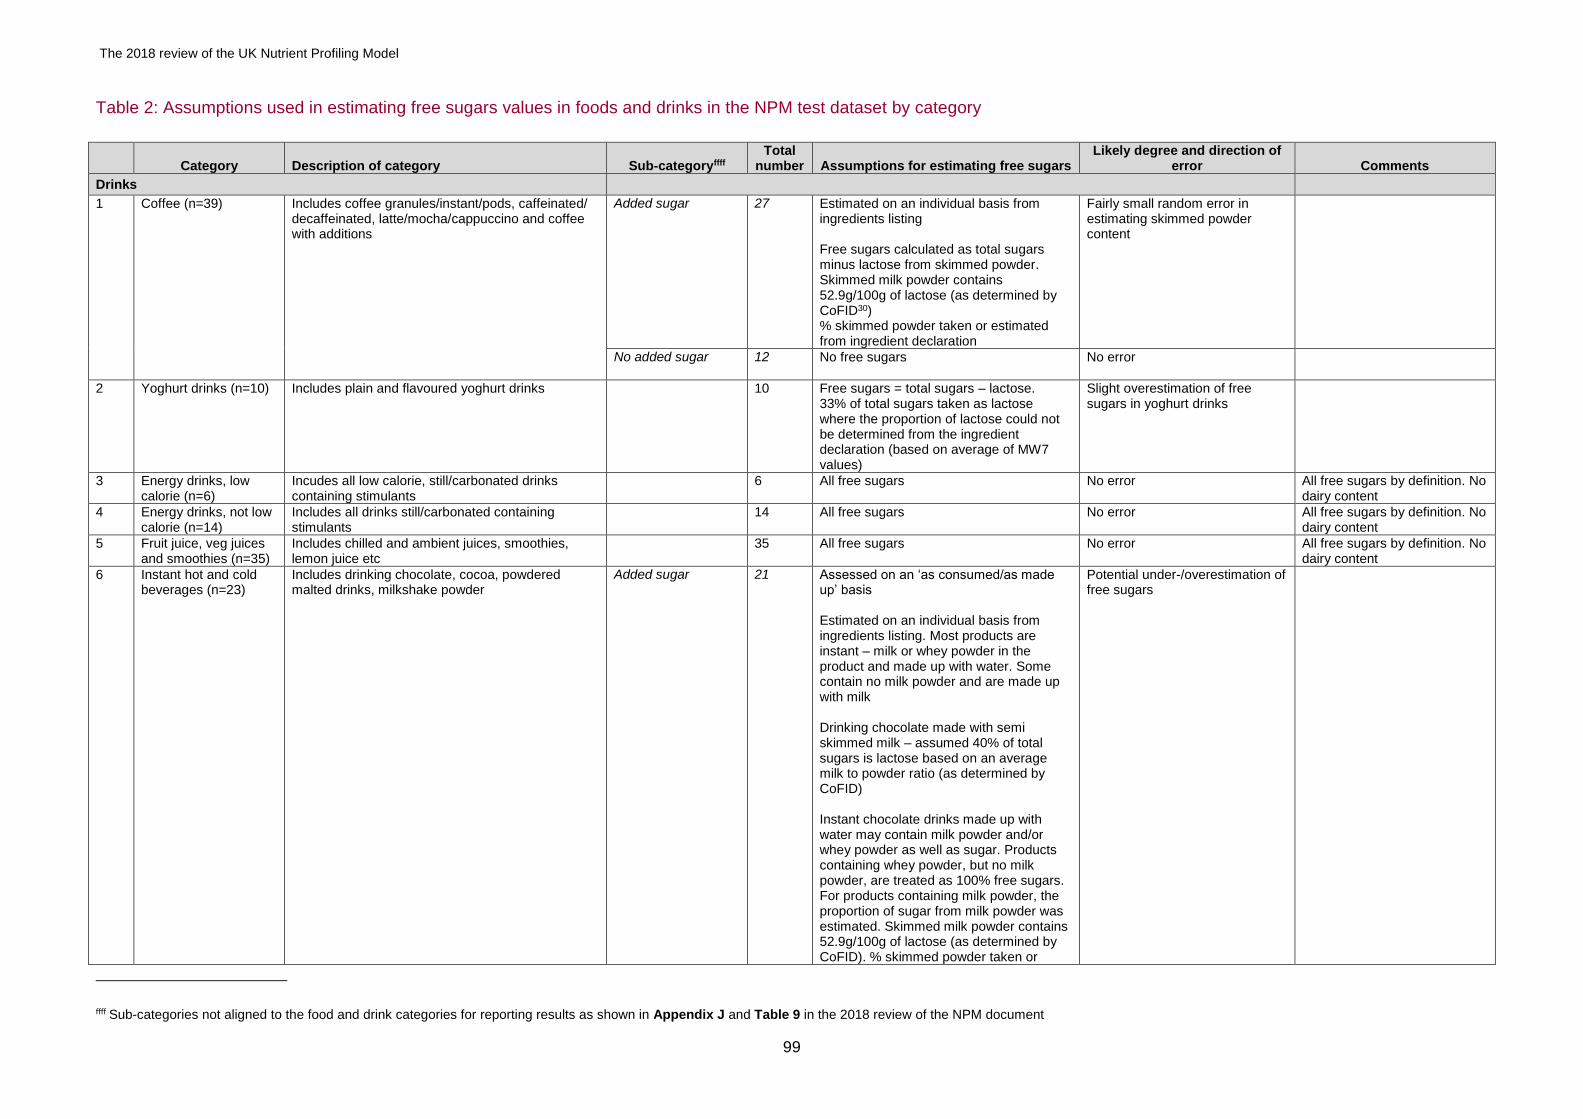
The 2018 review of the UK Nutrient Profiling Model
99
Table 2: Assumptions used in estimating free sugars values in foods and drinks in the NPM test dataset by category
Category Description of category Sub-categoryffff Total
number Assumptions for estimating free sugars Likely degree and direction of
error Comments
Drinks
1 Coffee (n=39) Includes coffee granules/instant/pods, caffeinated/ decaffeinated, latte/mocha/cappuccino and coffee with additions
Added sugar
27
Estimated on an individual basis from ingredients listing Free sugars calculated as total sugars minus lactose from skimmed powder. Skimmed milk powder contains 52.9g/100g of lactose (as determined by CoFID30) % skimmed powder taken or estimated from ingredient declaration
Fairly small random error in estimating skimmed powder content
No added sugar 12
No free sugars No error
2 Yoghurt drinks (n=10) Includes plain and flavoured yoghurt drinks 10 Free sugars = total sugars – lactose. 33% of total sugars taken as lactose where the proportion of lactose could not be determined from the ingredient declaration (based on average of MW7 values)
Slight overestimation of free sugars in yoghurt drinks
3 Energy drinks, low calorie (n=6)
Incudes all low calorie, still/carbonated drinks containing stimulants
6 All free sugars No error All free sugars by definition. No dairy content
4 Energy drinks, not low calorie (n=14)
Includes all drinks still/carbonated containing stimulants
14 All free sugars No error All free sugars by definition. No dairy content
5 Fruit juice, veg juices and smoothies (n=35)
Includes chilled and ambient juices, smoothies, lemon juice etc
35 All free sugars No error All free sugars by definition. No dairy content
6 Instant hot and cold beverages (n=23)
Includes drinking chocolate, cocoa, powdered malted drinks, milkshake powder
Added sugar 21
Assessed on an ‘as consumed/as made up’ basis Estimated on an individual basis from ingredients listing. Most products are instant – milk or whey powder in the product and made up with water. Some contain no milk powder and are made up with milk Drinking chocolate made with semi skimmed milk – assumed 40% of total sugars is lactose based on an average milk to powder ratio (as determined by CoFID) Instant chocolate drinks made up with water may contain milk powder and/or whey powder as well as sugar. Products containing whey powder, but no milk powder, are treated as 100% free sugars. For products containing milk powder, the proportion of sugar from milk powder was estimated. Skimmed milk powder contains 52.9g/100g of lactose (as determined by CoFID). % skimmed powder taken or
Potential under-/overestimation of free sugars
ffff Sub-categories not aligned to the food and drink categories for reporting results as shown in Appendix J and Table 9 in the 2018 review of the NPM document
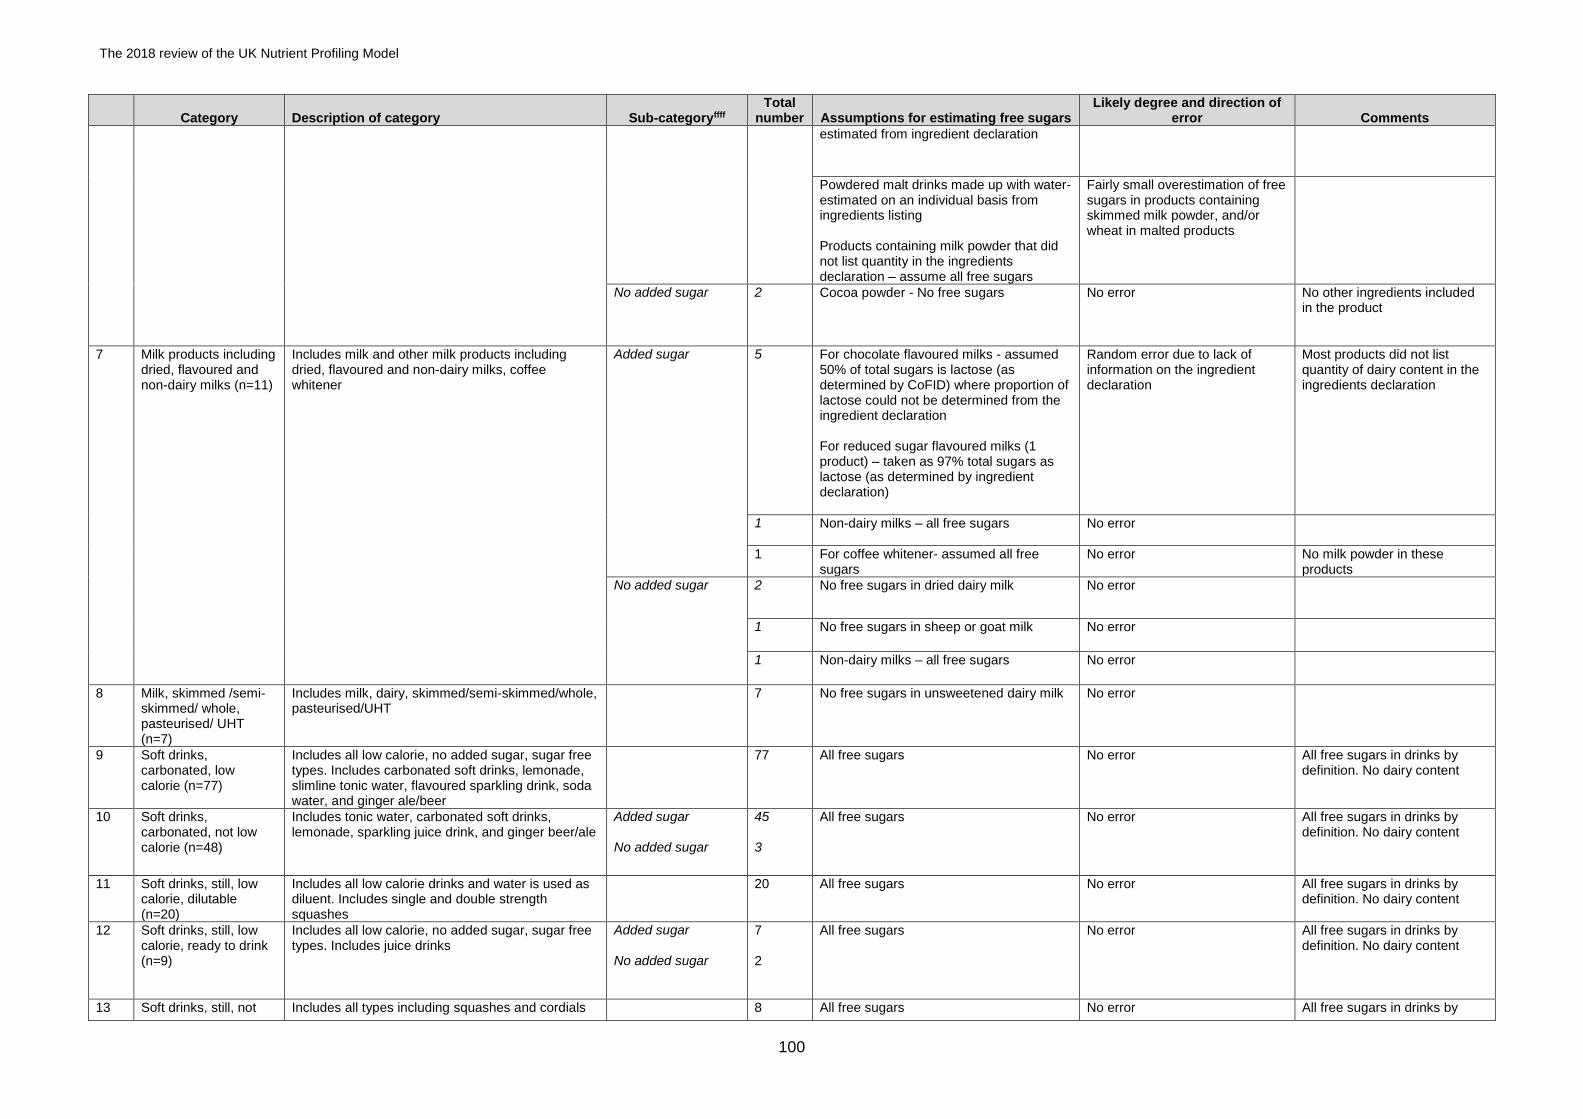
The 2018 review of the UK Nutrient Profiling Model
100
Category Description of category Sub-categoryffff Total
number Assumptions for estimating free sugars Likely degree and direction of
error Comments
estimated from ingredient declaration
Powdered malt drinks made up with water- estimated on an individual basis from ingredients listing Products containing milk powder that did not list quantity in the ingredients declaration – assume all free sugars
Fairly small overestimation of free sugars in products containing skimmed milk powder, and/or wheat in malted products
No added sugar 2
Cocoa powder - No free sugars No error No other ingredients included in the product
7 Milk products including dried, flavoured and non-dairy milks (n=11)
Includes milk and other milk products including dried, flavoured and non-dairy milks, coffee whitener
Added sugar
5
For chocolate flavoured milks - assumed 50% of total sugars is lactose (as determined by CoFID) where proportion of lactose could not be determined from the ingredient declaration For reduced sugar flavoured milks (1 product) – taken as 97% total sugars as lactose (as determined by ingredient declaration)
Random error due to lack of information on the ingredient declaration
Most products did not list quantity of dairy content in the ingredients declaration
1 Non-dairy milks – all free sugars No error
1 For coffee whitener- assumed all free sugars
No error No milk powder in these products
No added sugar 2 No free sugars in dried dairy milk No error
1 No free sugars in sheep or goat milk No error
1 Non-dairy milks – all free sugars No error
8 Milk, skimmed /semi-skimmed/ whole, pasteurised/ UHT (n=7)
Includes milk, dairy, skimmed/semi-skimmed/whole, pasteurised/UHT
7 No free sugars in unsweetened dairy milk No error
9 Soft drinks, carbonated, low calorie (n=77)
Includes all low calorie, no added sugar, sugar free types. Includes carbonated soft drinks, lemonade, slimline tonic water, flavoured sparkling drink, soda water, and ginger ale/beer
77 All free sugars No error All free sugars in drinks by definition. No dairy content
10 Soft drinks, carbonated, not low calorie (n=48)
Includes tonic water, carbonated soft drinks, lemonade, sparkling juice drink, and ginger beer/ale
Added sugar No added sugar
45 3
All free sugars No error All free sugars in drinks by definition. No dairy content
11 Soft drinks, still, low calorie, dilutable (n=20)
Includes all low calorie drinks and water is used as diluent. Includes single and double strength squashes
20 All free sugars No error All free sugars in drinks by definition. No dairy content
12 Soft drinks, still, low calorie, ready to drink (n=9)
Includes all low calorie, no added sugar, sugar free types. Includes juice drinks
Added sugar No added sugar
7 2
All free sugars No error All free sugars in drinks by definition. No dairy content
13 Soft drinks, still, not Includes all types including squashes and cordials 8 All free sugars No error All free sugars in drinks by
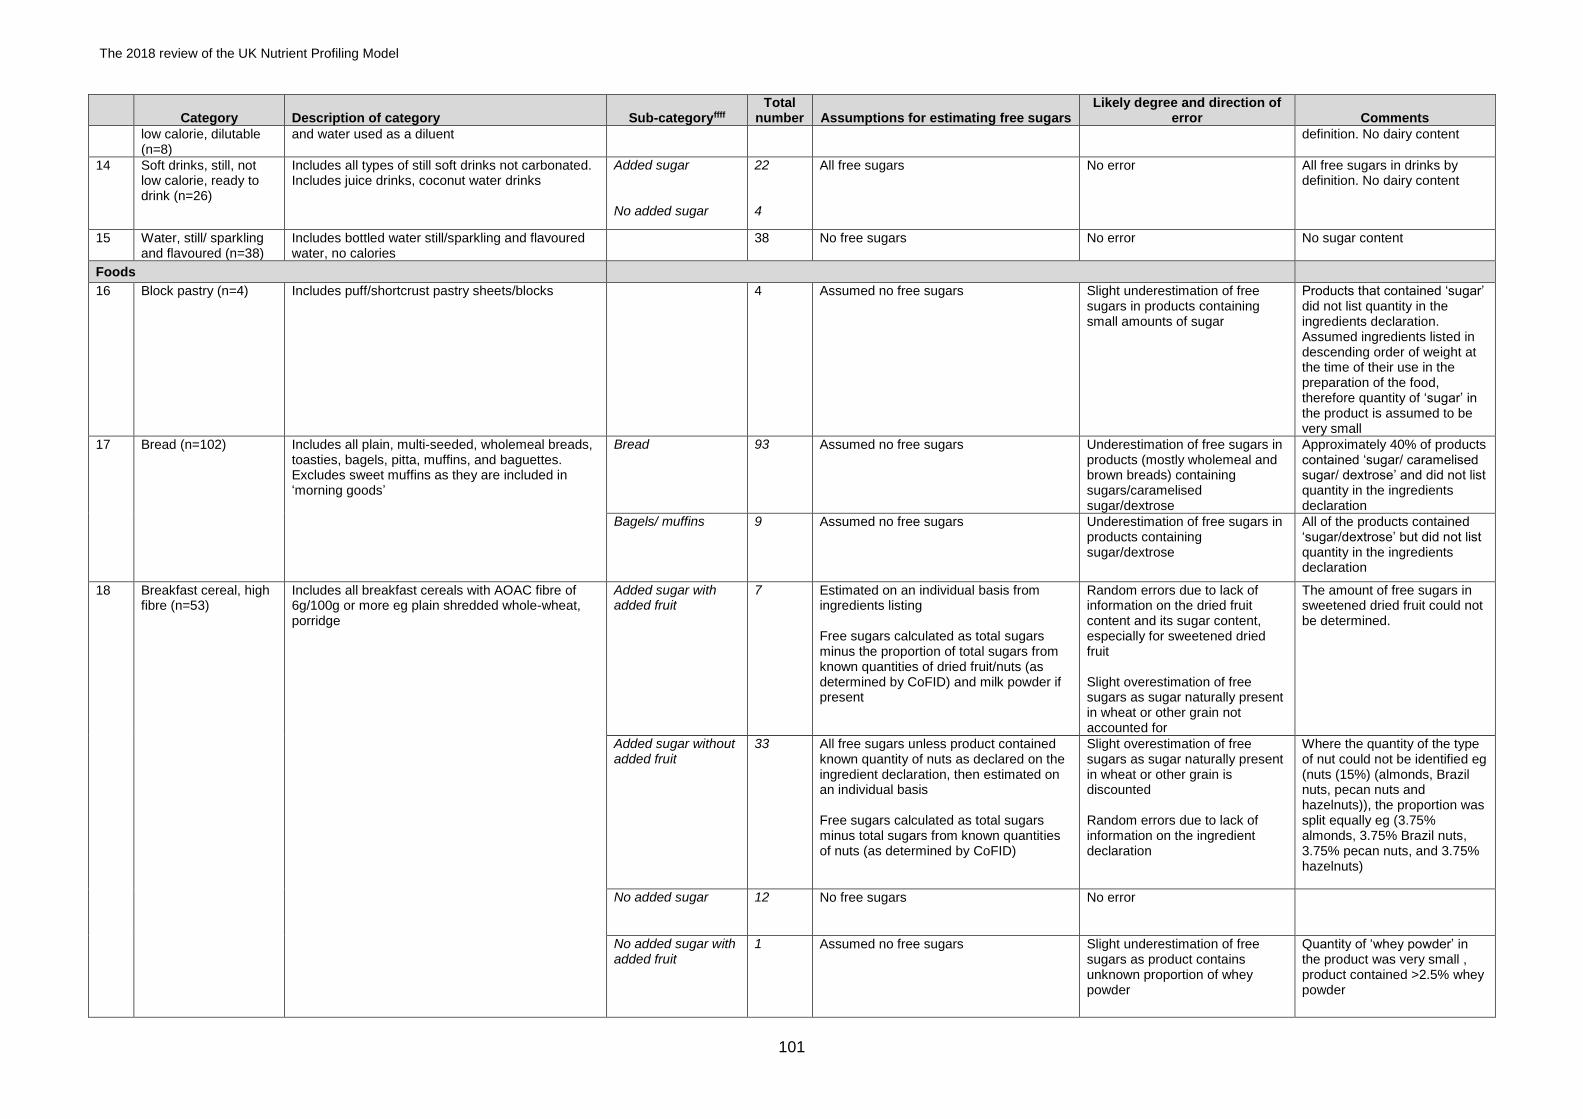
The 2018 review of the UK Nutrient Profiling Model
101
Category Description of category Sub-categoryffff Total
number Assumptions for estimating free sugars Likely degree and direction of
error Comments
low calorie, dilutable (n=8)
and water used as a diluent definition. No dairy content
14 Soft drinks, still, not low calorie, ready to drink (n=26)
Includes all types of still soft drinks not carbonated. Includes juice drinks, coconut water drinks
Added sugar No added sugar
22 4
All free sugars No error All free sugars in drinks by definition. No dairy content
15 Water, still/ sparkling and flavoured (n=38)
Includes bottled water still/sparkling and flavoured water, no calories
38 No free sugars No error No sugar content
Foods
16 Block pastry (n=4) Includes puff/shortcrust pastry sheets/blocks 4 Assumed no free sugars Slight underestimation of free sugars in products containing small amounts of sugar
Products that contained ‘sugar’ did not list quantity in the ingredients declaration. Assumed ingredients listed in descending order of weight at the time of their use in the preparation of the food, therefore quantity of ‘sugar’ in the product is assumed to be very small
17 Bread (n=102) Includes all plain, multi-seeded, wholemeal breads, toasties, bagels, pitta, muffins, and baguettes. Excludes sweet muffins as they are included in ‘morning goods’
Bread
93
Assumed no free sugars Underestimation of free sugars in products (mostly wholemeal and brown breads) containing sugars/caramelised sugar/dextrose
Approximately 40% of products contained ‘sugar/ caramelised sugar/ dextrose’ and did not list quantity in the ingredients declaration
Bagels/ muffins 9
Assumed no free sugars Underestimation of free sugars in products containing sugar/dextrose
All of the products contained ‘sugar/dextrose’ but did not list quantity in the ingredients declaration
18 Breakfast cereal, high fibre (n=53)
Includes all breakfast cereals with AOAC fibre of 6g/100g or more eg plain shredded whole-wheat, porridge
Added sugar with added fruit
7
Estimated on an individual basis from ingredients listing Free sugars calculated as total sugars minus the proportion of total sugars from known quantities of dried fruit/nuts (as determined by CoFID) and milk powder if present
Random errors due to lack of information on the dried fruit content and its sugar content, especially for sweetened dried fruit Slight overestimation of free sugars as sugar naturally present in wheat or other grain not accounted for
The amount of free sugars in sweetened dried fruit could not be determined.
Added sugar without added fruit
33
All free sugars unless product contained known quantity of nuts as declared on the ingredient declaration, then estimated on an individual basis Free sugars calculated as total sugars minus total sugars from known quantities of nuts (as determined by CoFID)
Slight overestimation of free sugars as sugar naturally present in wheat or other grain is discounted Random errors due to lack of information on the ingredient declaration
Where the quantity of the type of nut could not be identified eg (nuts (15%) (almonds, Brazil nuts, pecan nuts and hazelnuts)), the proportion was split equally eg (3.75% almonds, 3.75% Brazil nuts, 3.75% pecan nuts, and 3.75% hazelnuts)
No added sugar
12
No free sugars No error
No added sugar with added fruit
1
Assumed no free sugars Slight underestimation of free sugars as product contains unknown proportion of whey powder
Quantity of ‘whey powder’ in the product was very small , product contained >2.5% whey powder
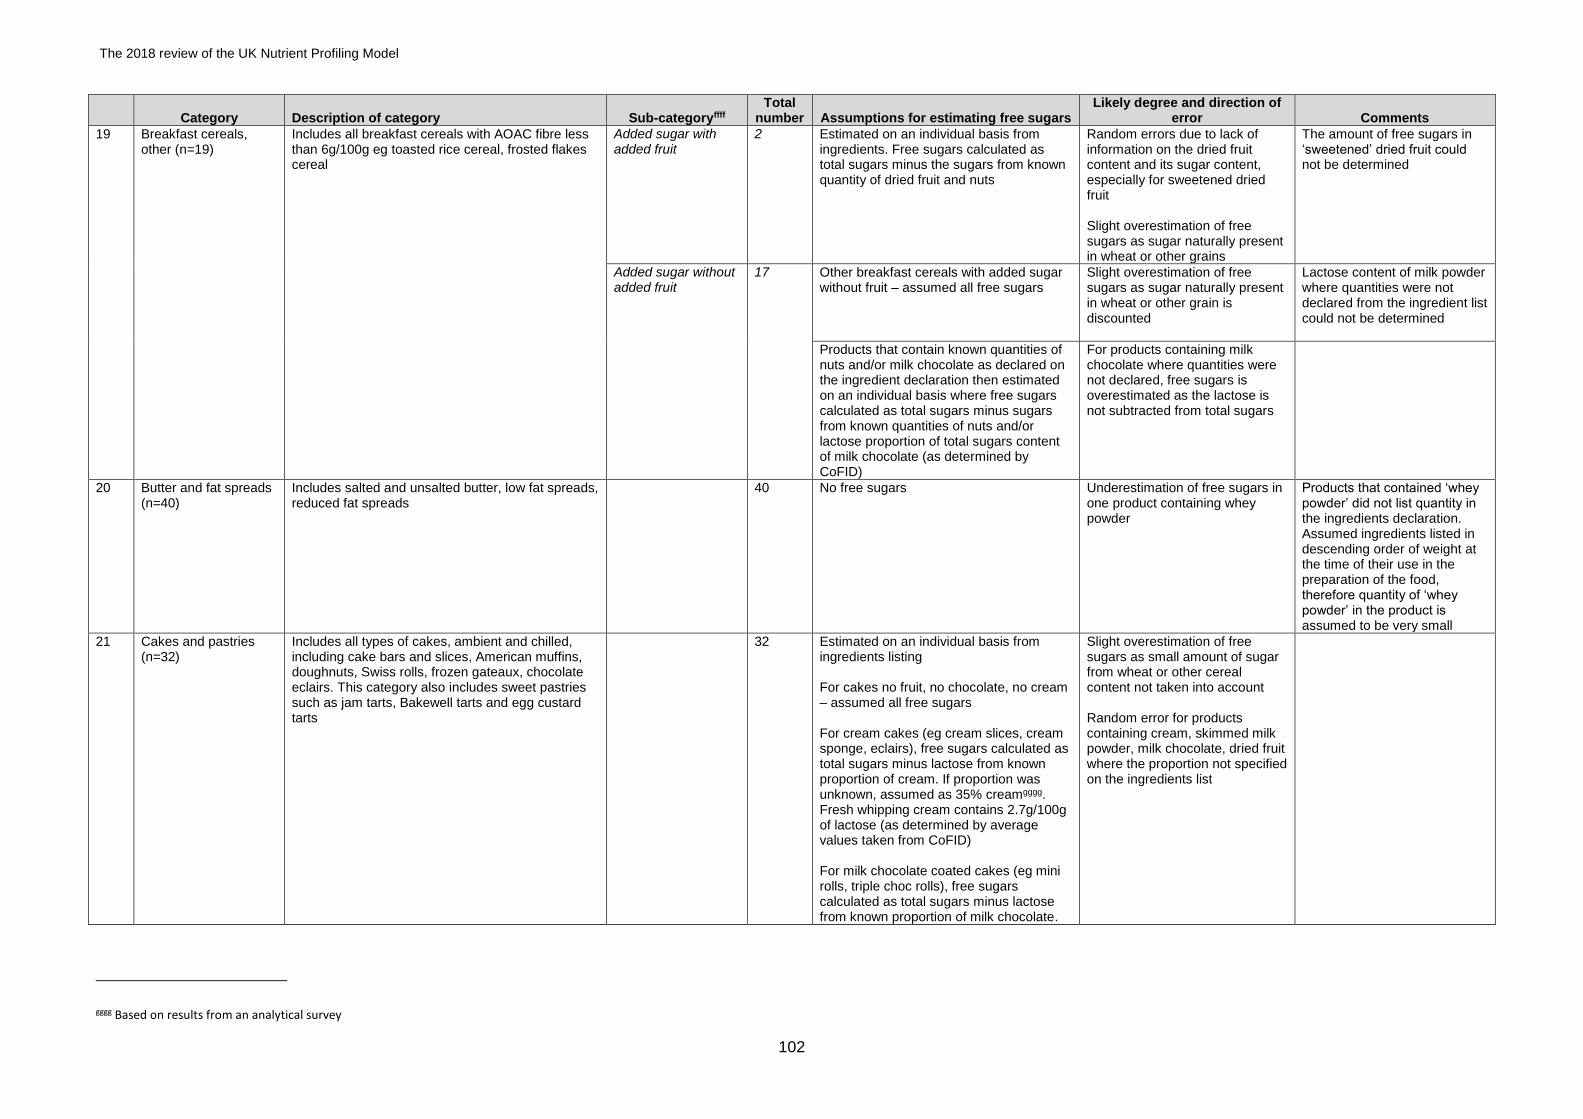
The 2018 review of the UK Nutrient Profiling Model
102
Category Description of category Sub-categoryffff Total
number Assumptions for estimating free sugars Likely degree and direction of
error Comments
19 Breakfast cereals, other (n=19)
Includes all breakfast cereals with AOAC fibre less than 6g/100g eg toasted rice cereal, frosted flakes cereal
Added sugar with added fruit
2
Estimated on an individual basis from ingredients. Free sugars calculated as total sugars minus the sugars from known quantity of dried fruit and nuts
Random errors due to lack of information on the dried fruit content and its sugar content, especially for sweetened dried fruit Slight overestimation of free sugars as sugar naturally present in wheat or other grains
The amount of free sugars in ‘sweetened’ dried fruit could not be determined
Added sugar without added fruit
17
Other breakfast cereals with added sugar without fruit – assumed all free sugars
Slight overestimation of free sugars as sugar naturally present in wheat or other grain is discounted
Lactose content of milk powder where quantities were not declared from the ingredient list could not be determined
Products that contain known quantities of nuts and/or milk chocolate as declared on the ingredient declaration then estimated on an individual basis where free sugars calculated as total sugars minus sugars from known quantities of nuts and/or lactose proportion of total sugars content of milk chocolate (as determined by CoFID)
For products containing milk chocolate where quantities were not declared, free sugars is overestimated as the lactose is not subtracted from total sugars
20 Butter and fat spreads (n=40)
Includes salted and unsalted butter, low fat spreads, reduced fat spreads
40 No free sugars Underestimation of free sugars in one product containing whey powder
Products that contained ‘whey powder’ did not list quantity in the ingredients declaration. Assumed ingredients listed in descending order of weight at the time of their use in the preparation of the food, therefore quantity of ‘whey powder’ in the product is assumed to be very small
21 Cakes and pastries (n=32)
Includes all types of cakes, ambient and chilled, including cake bars and slices, American muffins, doughnuts, Swiss rolls, frozen gateaux, chocolate eclairs. This category also includes sweet pastries such as jam tarts, Bakewell tarts and egg custard tarts
32 Estimated on an individual basis from ingredients listing For cakes no fruit, no chocolate, no cream – assumed all free sugars For cream cakes (eg cream slices, cream sponge, eclairs), free sugars calculated as total sugars minus lactose from known proportion of cream. If proportion was unknown, assumed as 35% creamgggg. Fresh whipping cream contains 2.7g/100g of lactose (as determined by average values taken from CoFID) For milk chocolate coated cakes (eg mini rolls, triple choc rolls), free sugars calculated as total sugars minus lactose from known proportion of milk chocolate.
Slight overestimation of free sugars as small amount of sugar from wheat or other cereal content not taken into account Random error for products containing cream, skimmed milk powder, milk chocolate, dried fruit where the proportion not specified on the ingredients list
gggg Based on results from an analytical survey
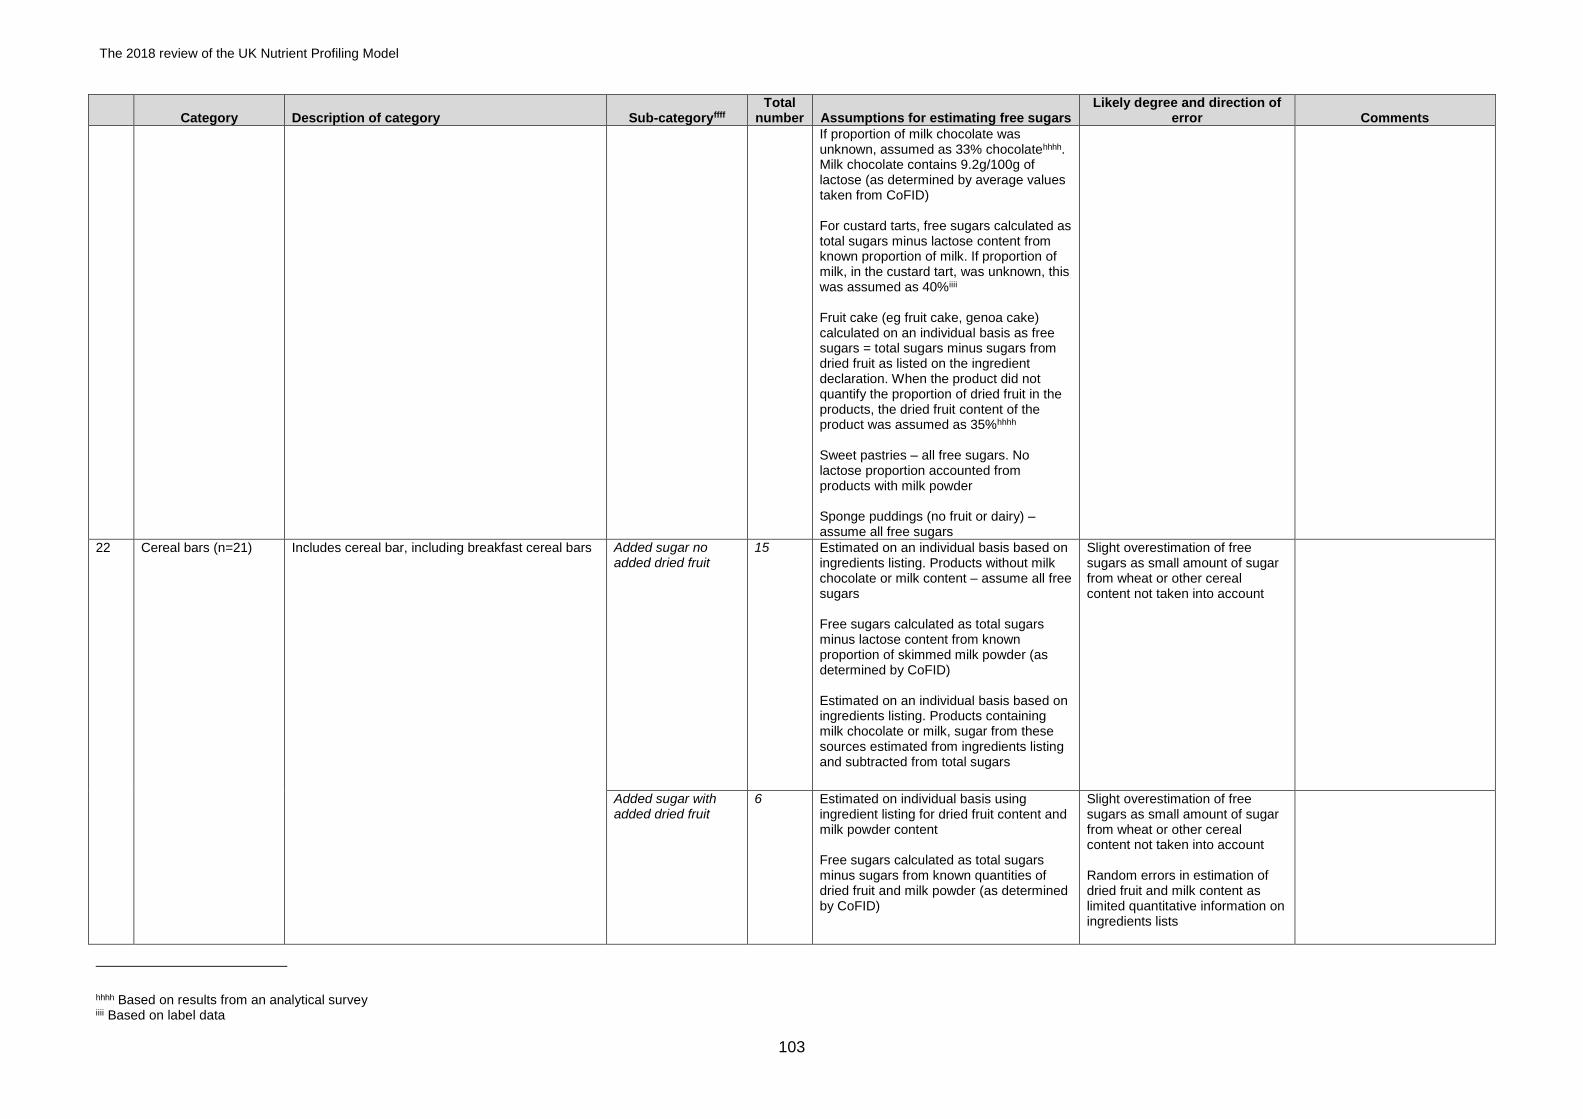
The 2018 review of the UK Nutrient Profiling Model
103
Category Description of category Sub-categoryffff Total
number Assumptions for estimating free sugars Likely degree and direction of
error Comments
If proportion of milk chocolate was unknown, assumed as 33% chocolatehhhh. Milk chocolate contains 9.2g/100g of lactose (as determined by average values taken from CoFID) For custard tarts, free sugars calculated as total sugars minus lactose content from known proportion of milk. If proportion of milk, in the custard tart, was unknown, this was assumed as 40%iiii Fruit cake (eg fruit cake, genoa cake) calculated on an individual basis as free sugars = total sugars minus sugars from dried fruit as listed on the ingredient declaration. When the product did not quantify the proportion of dried fruit in the products, the dried fruit content of the product was assumed as 35%hhhh Sweet pastries – all free sugars. No lactose proportion accounted from products with milk powder Sponge puddings (no fruit or dairy) – assume all free sugars
22 Cereal bars (n=21) Includes cereal bar, including breakfast cereal bars Added sugar no added dried fruit
15
Estimated on an individual basis based on ingredients listing. Products without milk chocolate or milk content – assume all free sugars Free sugars calculated as total sugars minus lactose content from known proportion of skimmed milk powder (as determined by CoFID) Estimated on an individual basis based on ingredients listing. Products containing milk chocolate or milk, sugar from these sources estimated from ingredients listing and subtracted from total sugars
Slight overestimation of free sugars as small amount of sugar from wheat or other cereal content not taken into account
Added sugar with added dried fruit
6
Estimated on individual basis using ingredient listing for dried fruit content and milk powder content Free sugars calculated as total sugars minus sugars from known quantities of dried fruit and milk powder (as determined by CoFID)
Slight overestimation of free sugars as small amount of sugar from wheat or other cereal content not taken into account Random errors in estimation of dried fruit and milk content as limited quantitative information on ingredients lists
hhhh Based on results from an analytical survey iiii Based on label data
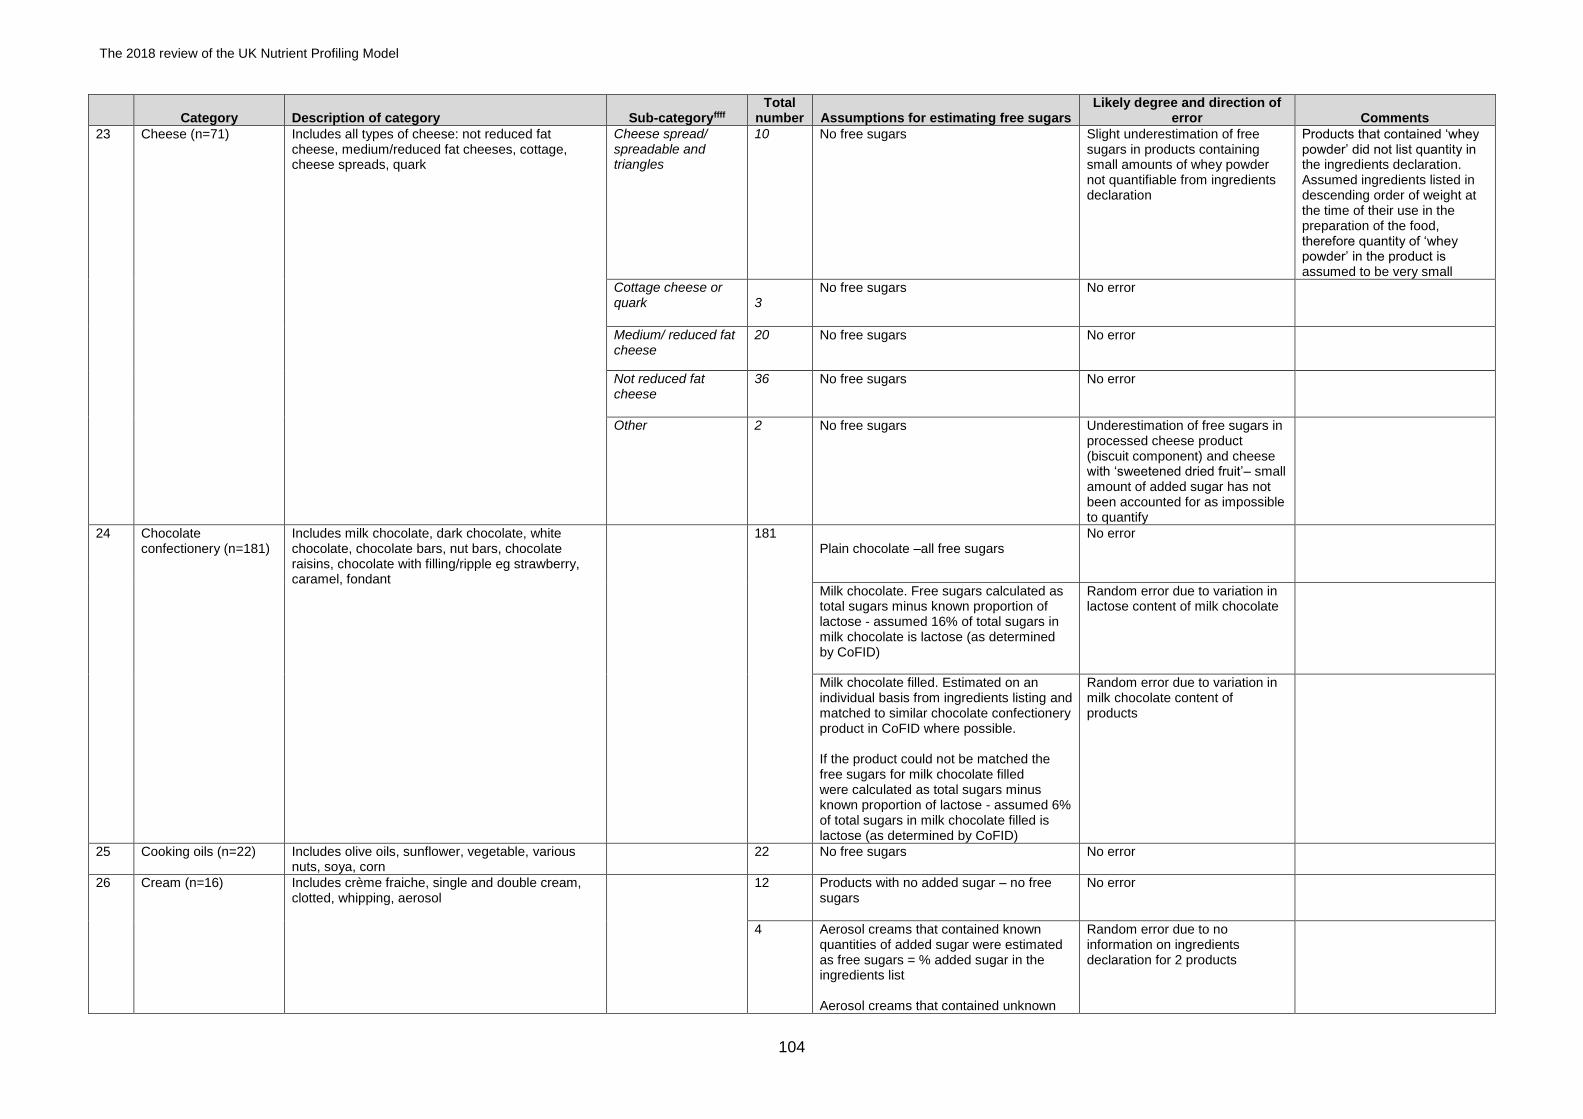
The 2018 review of the UK Nutrient Profiling Model
104
Category Description of category Sub-categoryffff Total
number Assumptions for estimating free sugars Likely degree and direction of
error Comments
23 Cheese (n=71) Includes all types of cheese: not reduced fat cheese, medium/reduced fat cheeses, cottage, cheese spreads, quark
Cheese spread/ spreadable and triangles
10
No free sugars Slight underestimation of free sugars in products containing small amounts of whey powder not quantifiable from ingredients declaration
Products that contained ‘whey powder’ did not list quantity in the ingredients declaration. Assumed ingredients listed in descending order of weight at the time of their use in the preparation of the food, therefore quantity of ‘whey powder’ in the product is assumed to be very small
Cottage cheese or quark
3
No free sugars No error
Medium/ reduced fat cheese
20
No free sugars No error
Not reduced fat cheese
36
No free sugars No error
Other 2
No free sugars Underestimation of free sugars in processed cheese product (biscuit component) and cheese with ‘sweetened dried fruit’– small amount of added sugar has not been accounted for as impossible to quantify
24 Chocolate confectionery (n=181)
Includes milk chocolate, dark chocolate, white chocolate, chocolate bars, nut bars, chocolate raisins, chocolate with filling/ripple eg strawberry, caramel, fondant
181 Plain chocolate –all free sugars
No error
Milk chocolate. Free sugars calculated as total sugars minus known proportion of lactose - assumed 16% of total sugars in milk chocolate is lactose (as determined by CoFID)
Random error due to variation in lactose content of milk chocolate
Milk chocolate filled. Estimated on an individual basis from ingredients listing and matched to similar chocolate confectionery product in CoFID where possible. If the product could not be matched the free sugars for milk chocolate filled were calculated as total sugars minus known proportion of lactose - assumed 6% of total sugars in milk chocolate filled is lactose (as determined by CoFID)
Random error due to variation in milk chocolate content of products
25 Cooking oils (n=22) Includes olive oils, sunflower, vegetable, various nuts, soya, corn
22 No free sugars No error
26 Cream (n=16) Includes crème fraiche, single and double cream, clotted, whipping, aerosol
12 Products with no added sugar – no free sugars
No error
4 Aerosol creams that contained known quantities of added sugar were estimated as free sugars = % added sugar in the ingredients list Aerosol creams that contained unknown
Random error due to no information on ingredients declaration for 2 products
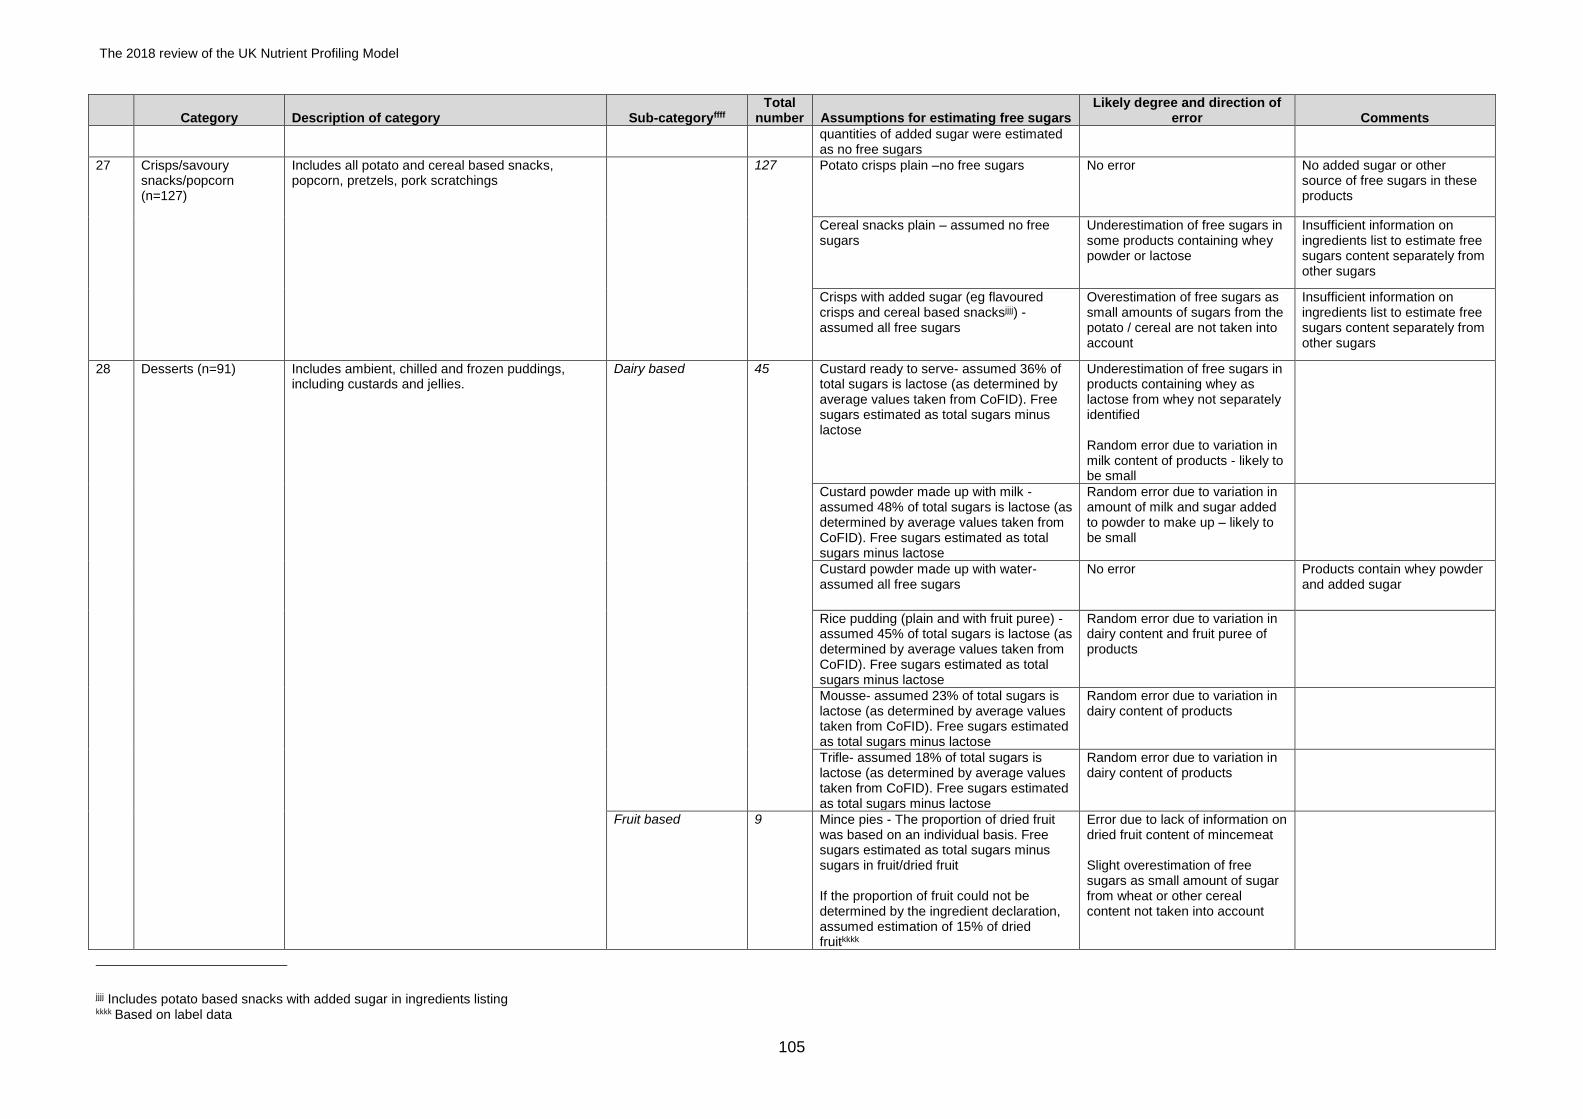
The 2018 review of the UK Nutrient Profiling Model
105
Category Description of category Sub-categoryffff Total
number Assumptions for estimating free sugars Likely degree and direction of
error Comments
quantities of added sugar were estimated as no free sugars
27 Crisps/savoury snacks/popcorn (n=127)
Includes all potato and cereal based snacks, popcorn, pretzels, pork scratchings
127 Potato crisps plain –no free sugars No error No added sugar or other source of free sugars in these products
Cereal snacks plain – assumed no free sugars
Underestimation of free sugars in some products containing whey powder or lactose
Insufficient information on ingredients list to estimate free sugars content separately from other sugars
Crisps with added sugar (eg flavoured crisps and cereal based snacksjjjj) - assumed all free sugars
Overestimation of free sugars as small amounts of sugars from the potato / cereal are not taken into account
Insufficient information on ingredients list to estimate free sugars content separately from other sugars
28 Desserts (n=91) Includes ambient, chilled and frozen puddings, including custards and jellies.
Dairy based
45
Custard ready to serve- assumed 36% of total sugars is lactose (as determined by average values taken from CoFID). Free sugars estimated as total sugars minus lactose
Underestimation of free sugars in products containing whey as lactose from whey not separately identified Random error due to variation in milk content of products - likely to be small
Custard powder made up with milk - assumed 48% of total sugars is lactose (as determined by average values taken from CoFID). Free sugars estimated as total sugars minus lactose
Random error due to variation in amount of milk and sugar added to powder to make up – likely to be small
Custard powder made up with water- assumed all free sugars
No error Products contain whey powder and added sugar
Rice pudding (plain and with fruit puree) - assumed 45% of total sugars is lactose (as determined by average values taken from CoFID). Free sugars estimated as total sugars minus lactose
Random error due to variation in dairy content and fruit puree of products
Mousse- assumed 23% of total sugars is lactose (as determined by average values taken from CoFID). Free sugars estimated as total sugars minus lactose
Random error due to variation in dairy content of products
Trifle- assumed 18% of total sugars is lactose (as determined by average values taken from CoFID). Free sugars estimated as total sugars minus lactose
Random error due to variation in dairy content of products
Fruit based
9
Mince pies - The proportion of dried fruit was based on an individual basis. Free sugars estimated as total sugars minus sugars in fruit/dried fruit If the proportion of fruit could not be determined by the ingredient declaration, assumed estimation of 15% of dried fruitkkkk
Error due to lack of information on dried fruit content of mincemeat Slight overestimation of free sugars as small amount of sugar from wheat or other cereal content not taken into account
jjjj Includes potato based snacks with added sugar in ingredients listing kkkk Based on label data
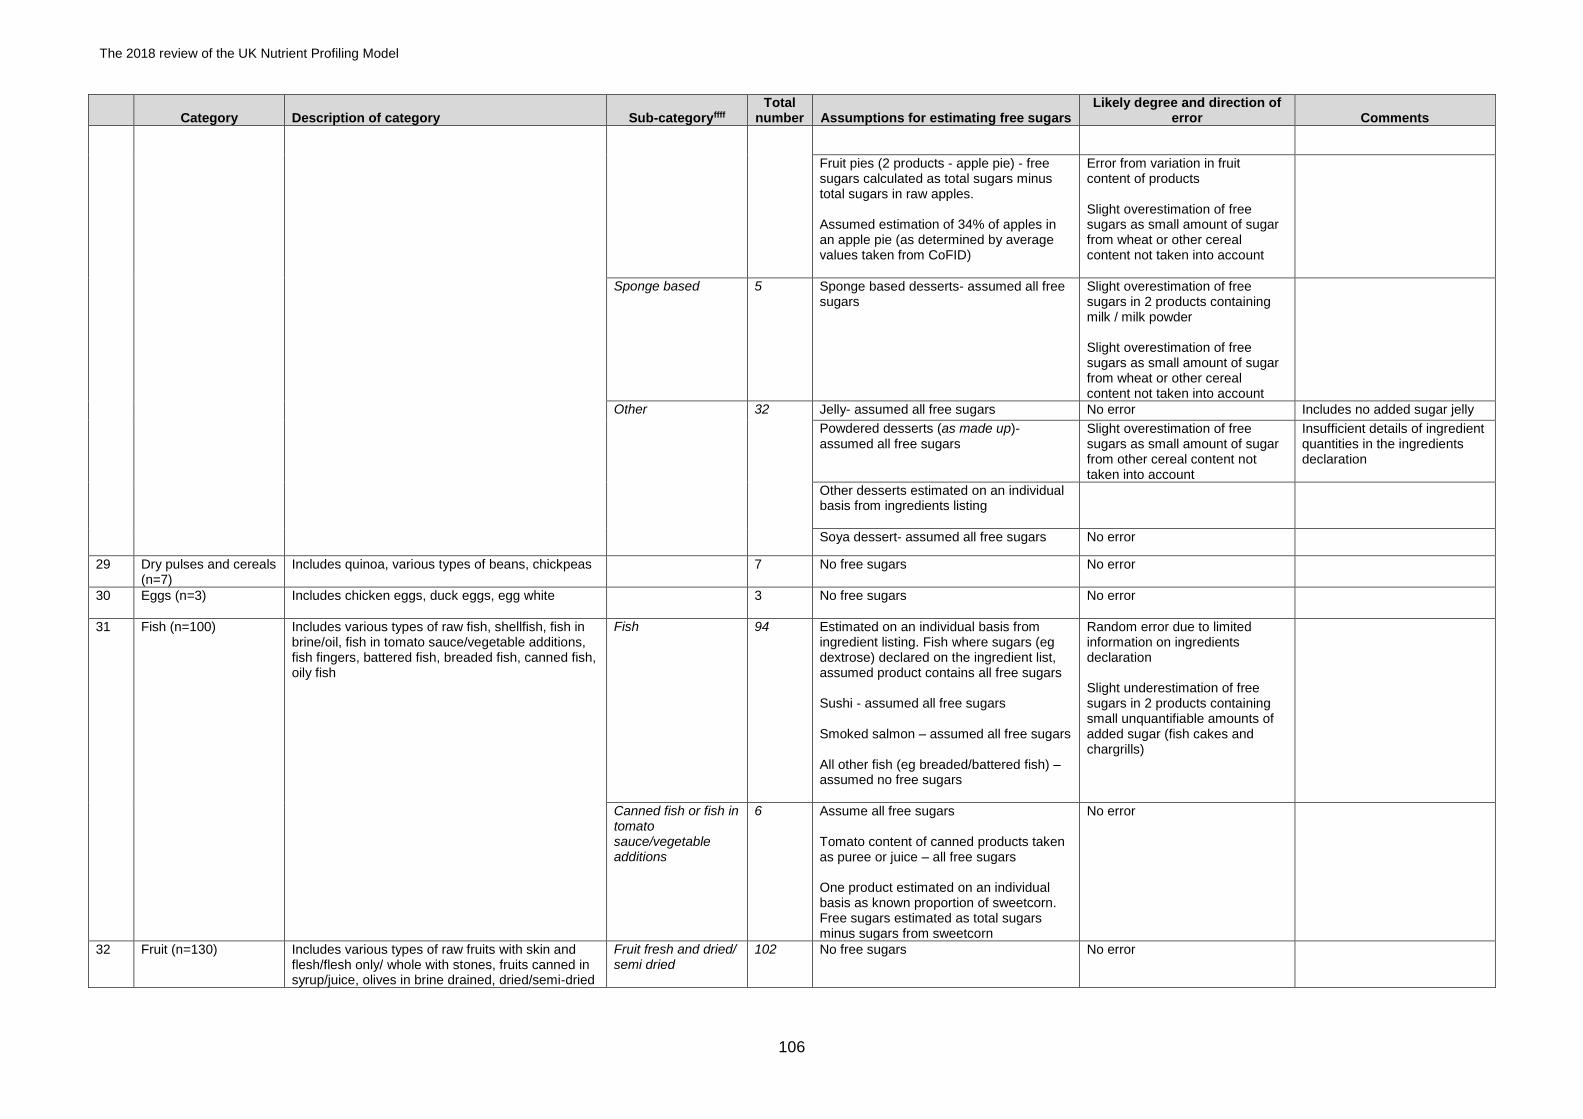
The 2018 review of the UK Nutrient Profiling Model
106
Category Description of category Sub-categoryffff Total
number Assumptions for estimating free sugars Likely degree and direction of
error Comments
Fruit pies (2 products - apple pie) - free sugars calculated as total sugars minus total sugars in raw apples. Assumed estimation of 34% of apples in an apple pie (as determined by average values taken from CoFID)
Error from variation in fruit content of products Slight overestimation of free sugars as small amount of sugar from wheat or other cereal content not taken into account
Sponge based
5
Sponge based desserts- assumed all free sugars
Slight overestimation of free sugars in 2 products containing milk / milk powder Slight overestimation of free sugars as small amount of sugar from wheat or other cereal content not taken into account
Other 32
Jelly- assumed all free sugars No error Includes no added sugar jelly
Powdered desserts (as made up)- assumed all free sugars
Slight overestimation of free sugars as small amount of sugar from other cereal content not taken into account
Insufficient details of ingredient quantities in the ingredients declaration
Other desserts estimated on an individual basis from ingredients listing
Soya dessert- assumed all free sugars No error
29 Dry pulses and cereals (n=7)
Includes quinoa, various types of beans, chickpeas 7 No free sugars
No error
30 Eggs (n=3) Includes chicken eggs, duck eggs, egg white 3 No free sugars
No error
31 Fish (n=100) Includes various types of raw fish, shellfish, fish in brine/oil, fish in tomato sauce/vegetable additions, fish fingers, battered fish, breaded fish, canned fish, oily fish
Fish
94
Estimated on an individual basis from ingredient listing. Fish where sugars (eg dextrose) declared on the ingredient list, assumed product contains all free sugars Sushi - assumed all free sugars Smoked salmon – assumed all free sugars All other fish (eg breaded/battered fish) – assumed no free sugars
Random error due to limited information on ingredients declaration Slight underestimation of free sugars in 2 products containing small unquantifiable amounts of added sugar (fish cakes and chargrills)
Canned fish or fish in tomato sauce/vegetable additions
6
Assume all free sugars Tomato content of canned products taken as puree or juice – all free sugars One product estimated on an individual basis as known proportion of sweetcorn. Free sugars estimated as total sugars minus sugars from sweetcorn
No error
32 Fruit (n=130) Includes various types of raw fruits with skin and flesh/flesh only/ whole with stones, fruits canned in syrup/juice, olives in brine drained, dried/semi-dried
Fruit fresh and dried/ semi dried
102
No free sugars
No error
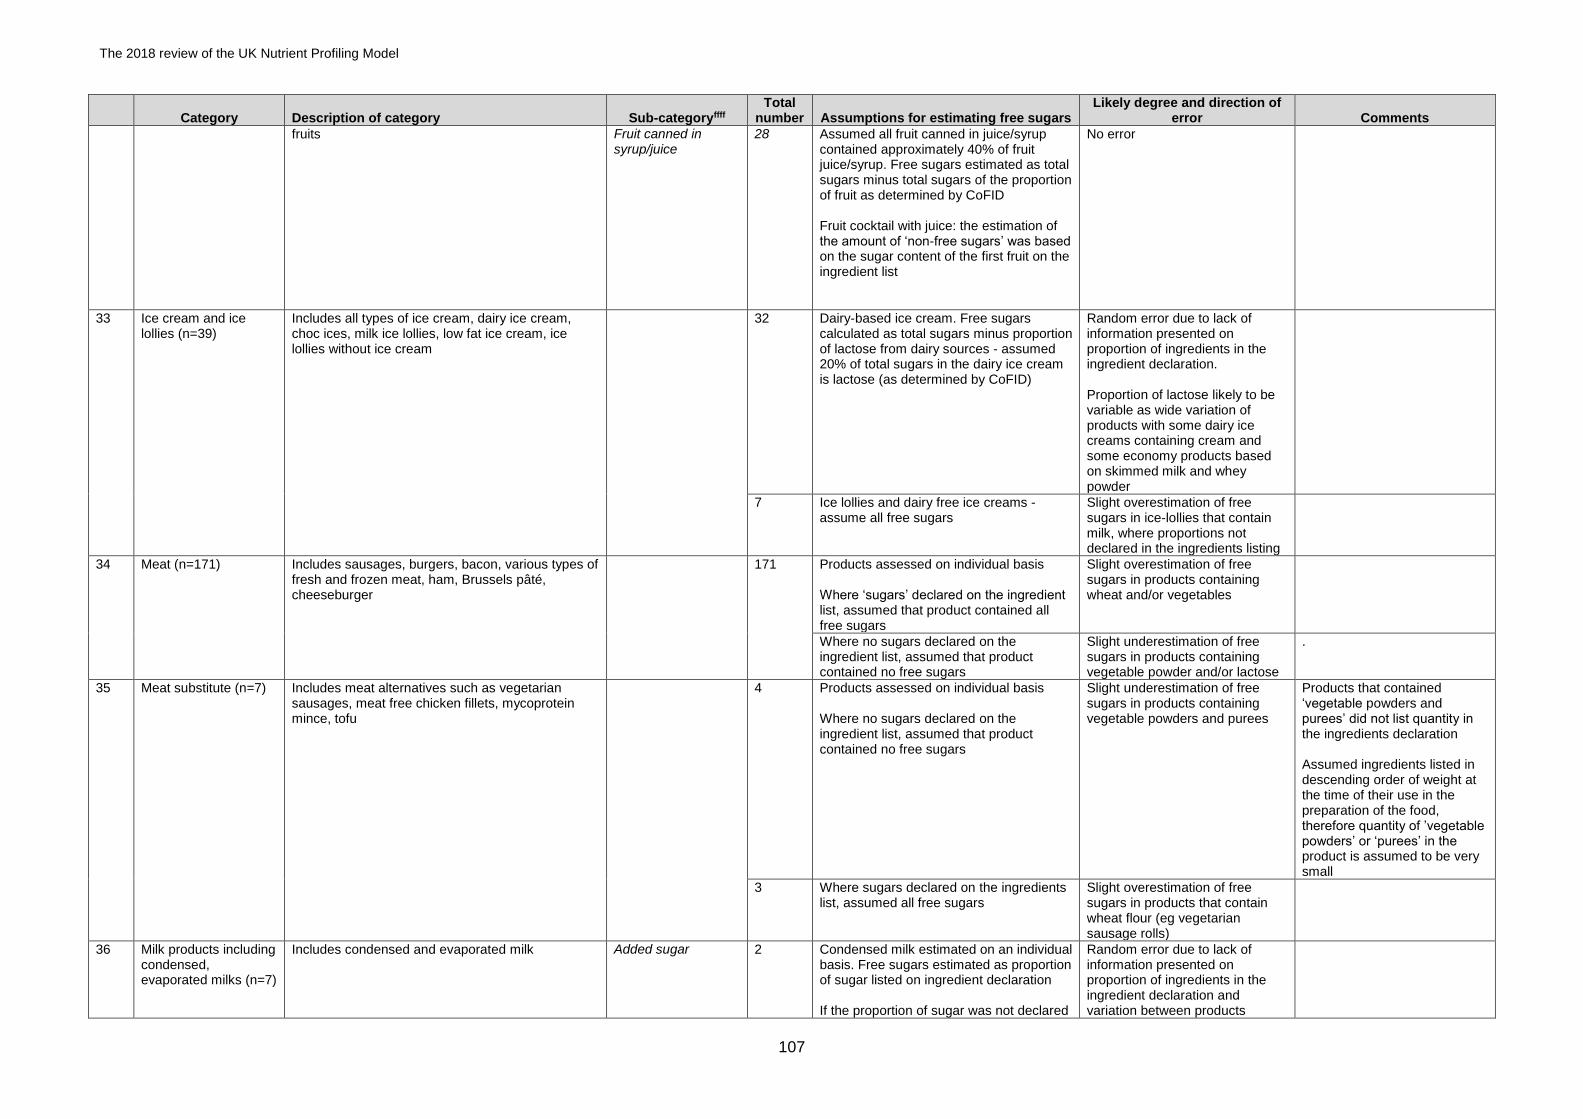
The 2018 review of the UK Nutrient Profiling Model
107
Category Description of category Sub-categoryffff Total
number Assumptions for estimating free sugars Likely degree and direction of
error Comments
fruits Fruit canned in syrup/juice
28
Assumed all fruit canned in juice/syrup contained approximately 40% of fruit juice/syrup. Free sugars estimated as total sugars minus total sugars of the proportion of fruit as determined by CoFID Fruit cocktail with juice: the estimation of the amount of ‘non-free sugars’ was based on the sugar content of the first fruit on the ingredient list
No error
33 Ice cream and ice lollies (n=39)
Includes all types of ice cream, dairy ice cream, choc ices, milk ice lollies, low fat ice cream, ice lollies without ice cream
32 Dairy-based ice cream. Free sugars calculated as total sugars minus proportion of lactose from dairy sources - assumed 20% of total sugars in the dairy ice cream is lactose (as determined by CoFID)
Random error due to lack of information presented on proportion of ingredients in the ingredient declaration. Proportion of lactose likely to be variable as wide variation of products with some dairy ice creams containing cream and some economy products based on skimmed milk and whey powder
7 Ice lollies and dairy free ice creams - assume all free sugars
Slight overestimation of free sugars in ice-lollies that contain milk, where proportions not declared in the ingredients listing
34 Meat (n=171) Includes sausages, burgers, bacon, various types of fresh and frozen meat, ham, Brussels pâté, cheeseburger
171 Products assessed on individual basis Where ‘sugars’ declared on the ingredient list, assumed that product contained all free sugars
Slight overestimation of free sugars in products containing wheat and/or vegetables
Where no sugars declared on the ingredient list, assumed that product contained no free sugars
Slight underestimation of free sugars in products containing vegetable powder and/or lactose
.
35 Meat substitute (n=7) Includes meat alternatives such as vegetarian sausages, meat free chicken fillets, mycoprotein mince, tofu
4 Products assessed on individual basis Where no sugars declared on the ingredient list, assumed that product contained no free sugars
Slight underestimation of free sugars in products containing vegetable powders and purees
Products that contained ‘vegetable powders and purees’ did not list quantity in the ingredients declaration Assumed ingredients listed in descending order of weight at the time of their use in the preparation of the food, therefore quantity of ’vegetable powders’ or ‘purees’ in the product is assumed to be very small
3 Where sugars declared on the ingredients list, assumed all free sugars
Slight overestimation of free sugars in products that contain wheat flour (eg vegetarian sausage rolls)
36 Milk products including condensed, evaporated milks (n=7)
Includes condensed and evaporated milk Added sugar
2 Condensed milk estimated on an individual basis. Free sugars estimated as proportion of sugar listed on ingredient declaration If the proportion of sugar was not declared
Random error due to lack of information presented on proportion of ingredients in the ingredient declaration and variation between products
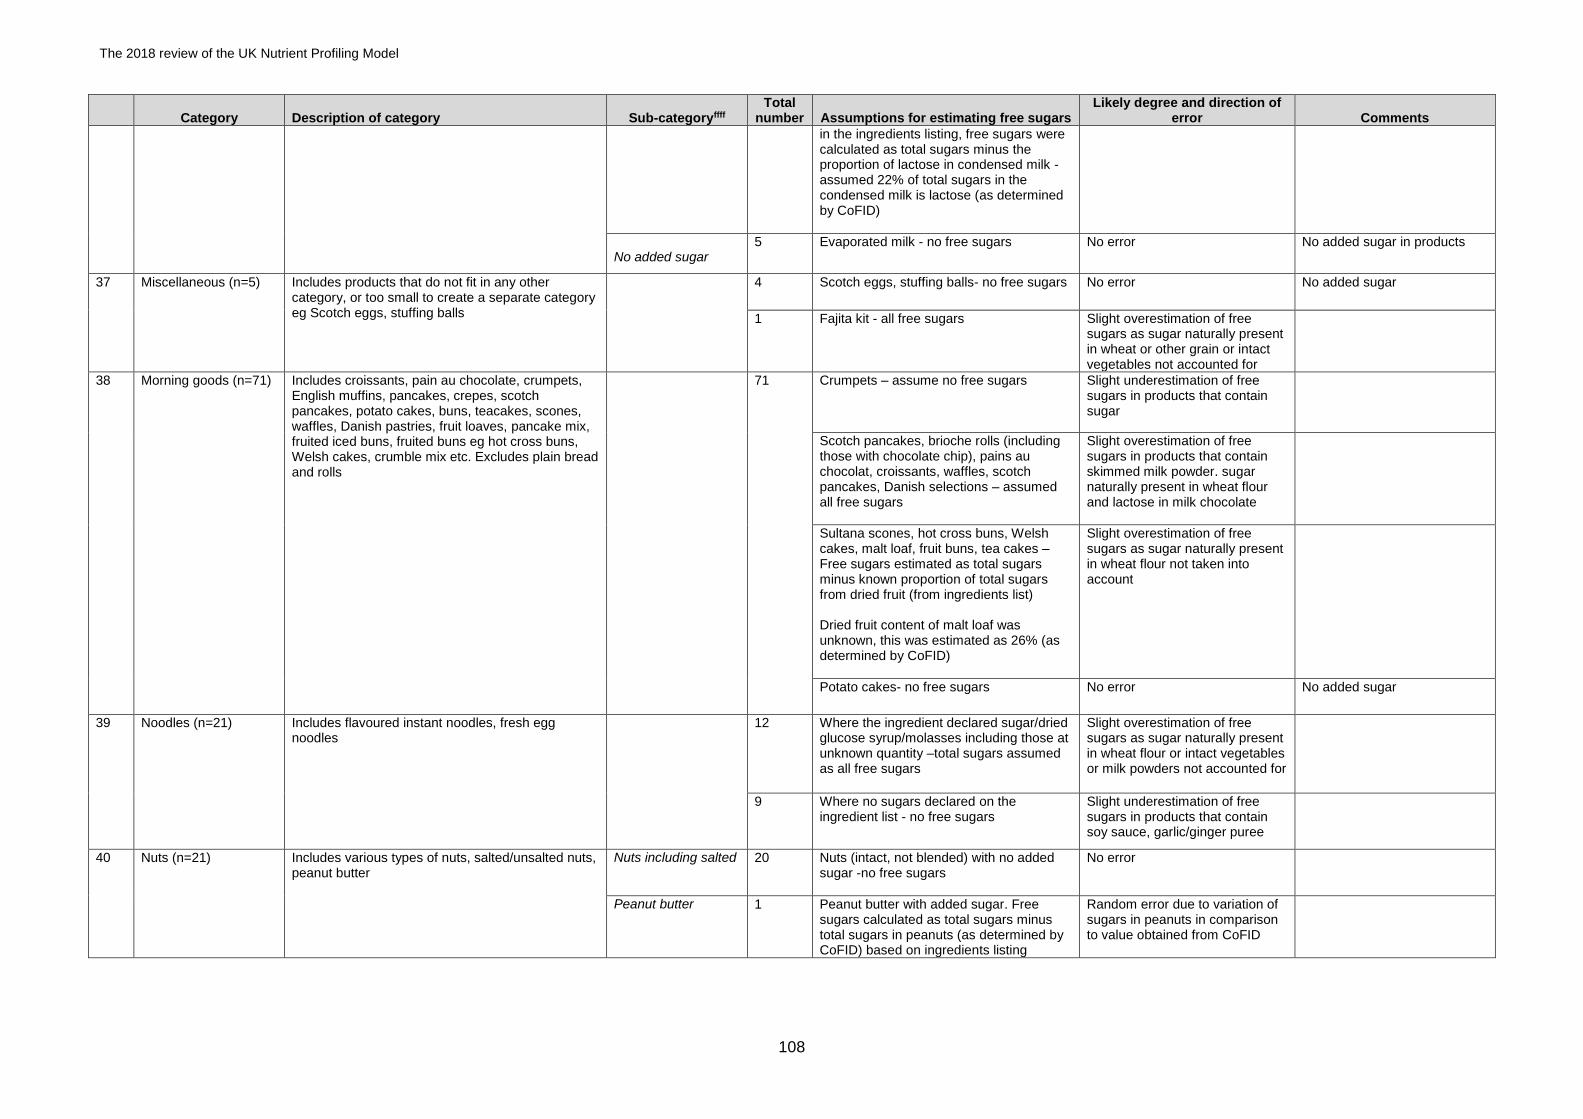
The 2018 review of the UK Nutrient Profiling Model
108
Category Description of category Sub-categoryffff Total
number Assumptions for estimating free sugars Likely degree and direction of
error Comments
in the ingredients listing, free sugars were calculated as total sugars minus the proportion of lactose in condensed milk - assumed 22% of total sugars in the condensed milk is lactose (as determined by CoFID)
No added sugar
5
Evaporated milk - no free sugars No error No added sugar in products
37 Miscellaneous (n=5) Includes products that do not fit in any other category, or too small to create a separate category eg Scotch eggs, stuffing balls
4 Scotch eggs, stuffing balls- no free sugars No error No added sugar
1 Fajita kit - all free sugars Slight overestimation of free sugars as sugar naturally present in wheat or other grain or intact vegetables not accounted for
38 Morning goods (n=71) Includes croissants, pain au chocolate, crumpets, English muffins, pancakes, crepes, scotch pancakes, potato cakes, buns, teacakes, scones, waffles, Danish pastries, fruit loaves, pancake mix, fruited iced buns, fruited buns eg hot cross buns, Welsh cakes, crumble mix etc. Excludes plain bread and rolls
71 Crumpets – assume no free sugars Slight underestimation of free sugars in products that contain sugar
Scotch pancakes, brioche rolls (including those with chocolate chip), pains au chocolat, croissants, waffles, scotch pancakes, Danish selections – assumed all free sugars
Slight overestimation of free sugars in products that contain skimmed milk powder. sugar naturally present in wheat flour and lactose in milk chocolate
Sultana scones, hot cross buns, Welsh cakes, malt loaf, fruit buns, tea cakes – Free sugars estimated as total sugars minus known proportion of total sugars from dried fruit (from ingredients list) Dried fruit content of malt loaf was unknown, this was estimated as 26% (as determined by CoFID)
Slight overestimation of free sugars as sugar naturally present in wheat flour not taken into account
Potato cakes- no free sugars No error No added sugar
39 Noodles (n=21) Includes flavoured instant noodles, fresh egg noodles
12 Where the ingredient declared sugar/dried glucose syrup/molasses including those at unknown quantity –total sugars assumed as all free sugars
Slight overestimation of free sugars as sugar naturally present in wheat flour or intact vegetables or milk powders not accounted for
9 Where no sugars declared on the ingredient list - no free sugars
Slight underestimation of free sugars in products that contain soy sauce, garlic/ginger puree
40 Nuts (n=21) Includes various types of nuts, salted/unsalted nuts, peanut butter
Nuts including salted
20 Nuts (intact, not blended) with no added sugar -no free sugars
No error
Peanut butter 1 Peanut butter with added sugar. Free sugars calculated as total sugars minus total sugars in peanuts (as determined by CoFID) based on ingredients listing
Random error due to variation of sugars in peanuts in comparison to value obtained from CoFID
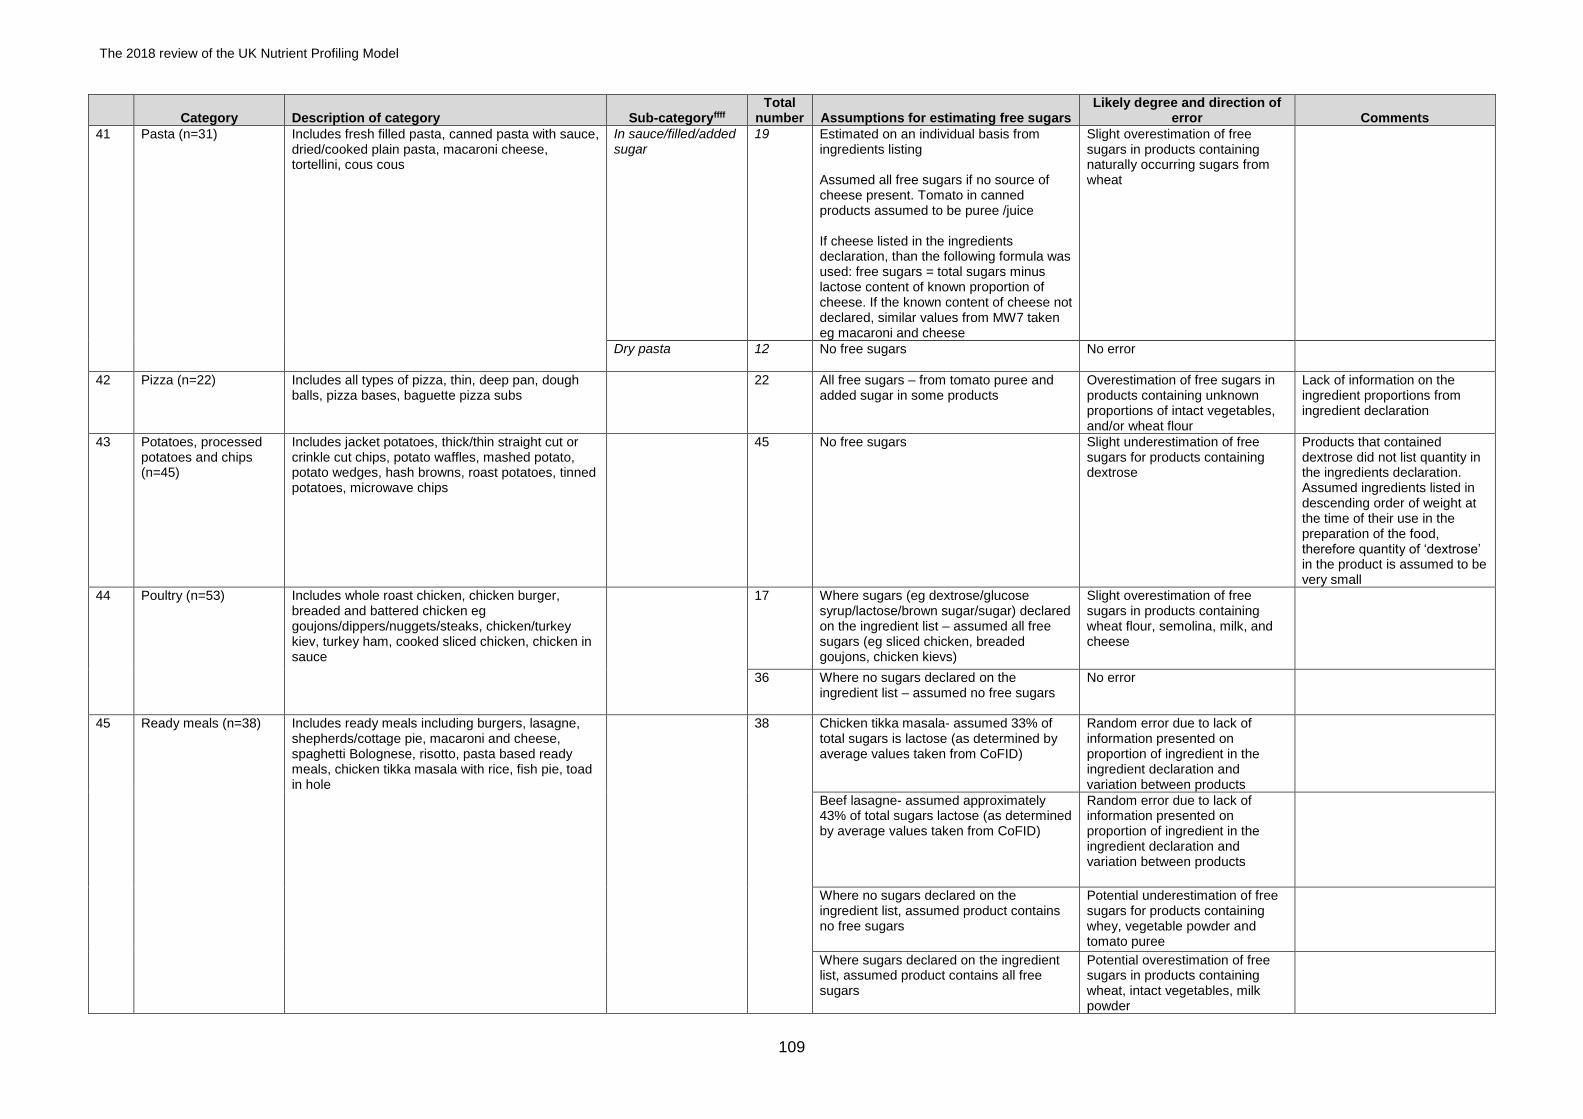
The 2018 review of the UK Nutrient Profiling Model
109
Category Description of category Sub-categoryffff Total
number Assumptions for estimating free sugars Likely degree and direction of
error Comments
41 Pasta (n=31) Includes fresh filled pasta, canned pasta with sauce, dried/cooked plain pasta, macaroni cheese, tortellini, cous cous
In sauce/filled/added sugar
19
Estimated on an individual basis from ingredients listing Assumed all free sugars if no source of cheese present. Tomato in canned products assumed to be puree /juice If cheese listed in the ingredients declaration, than the following formula was used: free sugars = total sugars minus lactose content of known proportion of cheese. If the known content of cheese not declared, similar values from MW7 taken eg macaroni and cheese
Slight overestimation of free sugars in products containing naturally occurring sugars from wheat
Dry pasta 12
No free sugars No error
42 Pizza (n=22) Includes all types of pizza, thin, deep pan, dough balls, pizza bases, baguette pizza subs
22 All free sugars – from tomato puree and added sugar in some products
Overestimation of free sugars in products containing unknown proportions of intact vegetables, and/or wheat flour
Lack of information on the ingredient proportions from ingredient declaration
43 Potatoes, processed potatoes and chips (n=45)
Includes jacket potatoes, thick/thin straight cut or crinkle cut chips, potato waffles, mashed potato, potato wedges, hash browns, roast potatoes, tinned potatoes, microwave chips
45 No free sugars Slight underestimation of free sugars for products containing dextrose
Products that contained dextrose did not list quantity in the ingredients declaration. Assumed ingredients listed in descending order of weight at the time of their use in the preparation of the food, therefore quantity of ‘dextrose’ in the product is assumed to be very small
44 Poultry (n=53) Includes whole roast chicken, chicken burger, breaded and battered chicken eg goujons/dippers/nuggets/steaks, chicken/turkey kiev, turkey ham, cooked sliced chicken, chicken in sauce
17 Where sugars (eg dextrose/glucose syrup/lactose/brown sugar/sugar) declared on the ingredient list – assumed all free sugars (eg sliced chicken, breaded goujons, chicken kievs)
Slight overestimation of free sugars in products containing wheat flour, semolina, milk, and cheese
36 Where no sugars declared on the ingredient list – assumed no free sugars
No error
45 Ready meals (n=38) Includes ready meals including burgers, lasagne, shepherds/cottage pie, macaroni and cheese, spaghetti Bolognese, risotto, pasta based ready meals, chicken tikka masala with rice, fish pie, toad in hole
38 Chicken tikka masala- assumed 33% of total sugars is lactose (as determined by average values taken from CoFID)
Random error due to lack of information presented on proportion of ingredient in the ingredient declaration and variation between products
Beef lasagne- assumed approximately 43% of total sugars lactose (as determined by average values taken from CoFID)
Random error due to lack of information presented on proportion of ingredient in the ingredient declaration and variation between products
Where no sugars declared on the ingredient list, assumed product contains no free sugars
Potential underestimation of free sugars for products containing whey, vegetable powder and tomato puree
Where sugars declared on the ingredient list, assumed product contains all free sugars
Potential overestimation of free sugars in products containing wheat, intact vegetables, milk powder
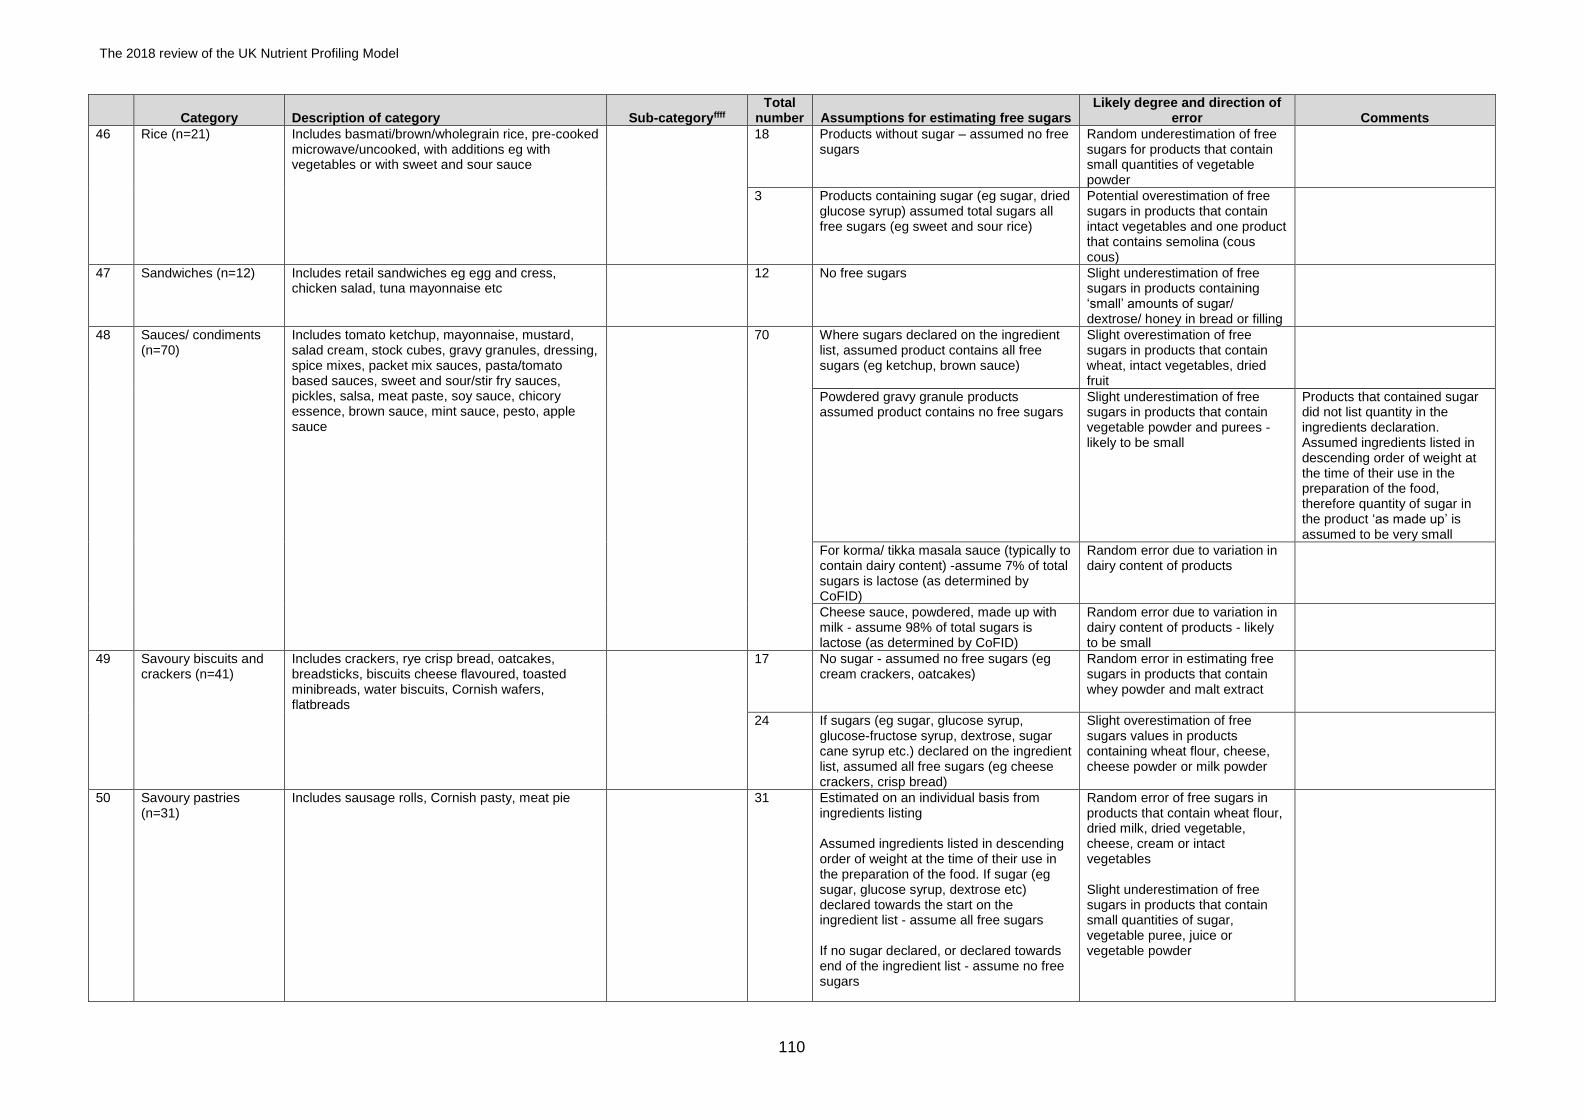
The 2018 review of the UK Nutrient Profiling Model
110
Category Description of category Sub-categoryffff Total
number Assumptions for estimating free sugars Likely degree and direction of
error Comments
46 Rice (n=21) Includes basmati/brown/wholegrain rice, pre-cooked microwave/uncooked, with additions eg with vegetables or with sweet and sour sauce
18 Products without sugar – assumed no free sugars
Random underestimation of free sugars for products that contain small quantities of vegetable powder
3 Products containing sugar (eg sugar, dried glucose syrup) assumed total sugars all free sugars (eg sweet and sour rice)
Potential overestimation of free sugars in products that contain intact vegetables and one product that contains semolina (cous cous)
47 Sandwiches (n=12) Includes retail sandwiches eg egg and cress, chicken salad, tuna mayonnaise etc
12 No free sugars Slight underestimation of free sugars in products containing ‘small’ amounts of sugar/ dextrose/ honey in bread or filling
48 Sauces/ condiments (n=70)
Includes tomato ketchup, mayonnaise, mustard, salad cream, stock cubes, gravy granules, dressing, spice mixes, packet mix sauces, pasta/tomato based sauces, sweet and sour/stir fry sauces, pickles, salsa, meat paste, soy sauce, chicory essence, brown sauce, mint sauce, pesto, apple sauce
70 Where sugars declared on the ingredient list, assumed product contains all free sugars (eg ketchup, brown sauce)
Slight overestimation of free sugars in products that contain wheat, intact vegetables, dried fruit
Powdered gravy granule products assumed product contains no free sugars
Slight underestimation of free sugars in products that contain vegetable powder and purees - likely to be small
Products that contained sugar did not list quantity in the ingredients declaration. Assumed ingredients listed in descending order of weight at the time of their use in the preparation of the food, therefore quantity of sugar in the product ‘as made up’ is assumed to be very small
For korma/ tikka masala sauce (typically to contain dairy content) -assume 7% of total sugars is lactose (as determined by CoFID)
Random error due to variation in dairy content of products
Cheese sauce, powdered, made up with milk - assume 98% of total sugars is lactose (as determined by CoFID)
Random error due to variation in dairy content of products - likely to be small
49 Savoury biscuits and crackers (n=41)
Includes crackers, rye crisp bread, oatcakes, breadsticks, biscuits cheese flavoured, toasted minibreads, water biscuits, Cornish wafers, flatbreads
17 No sugar - assumed no free sugars (eg cream crackers, oatcakes)
Random error in estimating free sugars in products that contain whey powder and malt extract
24 If sugars (eg sugar, glucose syrup, glucose-fructose syrup, dextrose, sugar cane syrup etc.) declared on the ingredient list, assumed all free sugars (eg cheese crackers, crisp bread)
Slight overestimation of free sugars values in products containing wheat flour, cheese, cheese powder or milk powder
50 Savoury pastries (n=31)
Includes sausage rolls, Cornish pasty, meat pie 31
Estimated on an individual basis from ingredients listing Assumed ingredients listed in descending order of weight at the time of their use in the preparation of the food. If sugar (eg sugar, glucose syrup, dextrose etc) declared towards the start on the ingredient list - assume all free sugars If no sugar declared, or declared towards end of the ingredient list - assume no free sugars
Random error of free sugars in products that contain wheat flour, dried milk, dried vegetable, cheese, cream or intact vegetables Slight underestimation of free sugars in products that contain small quantities of sugar, vegetable puree, juice or vegetable powder
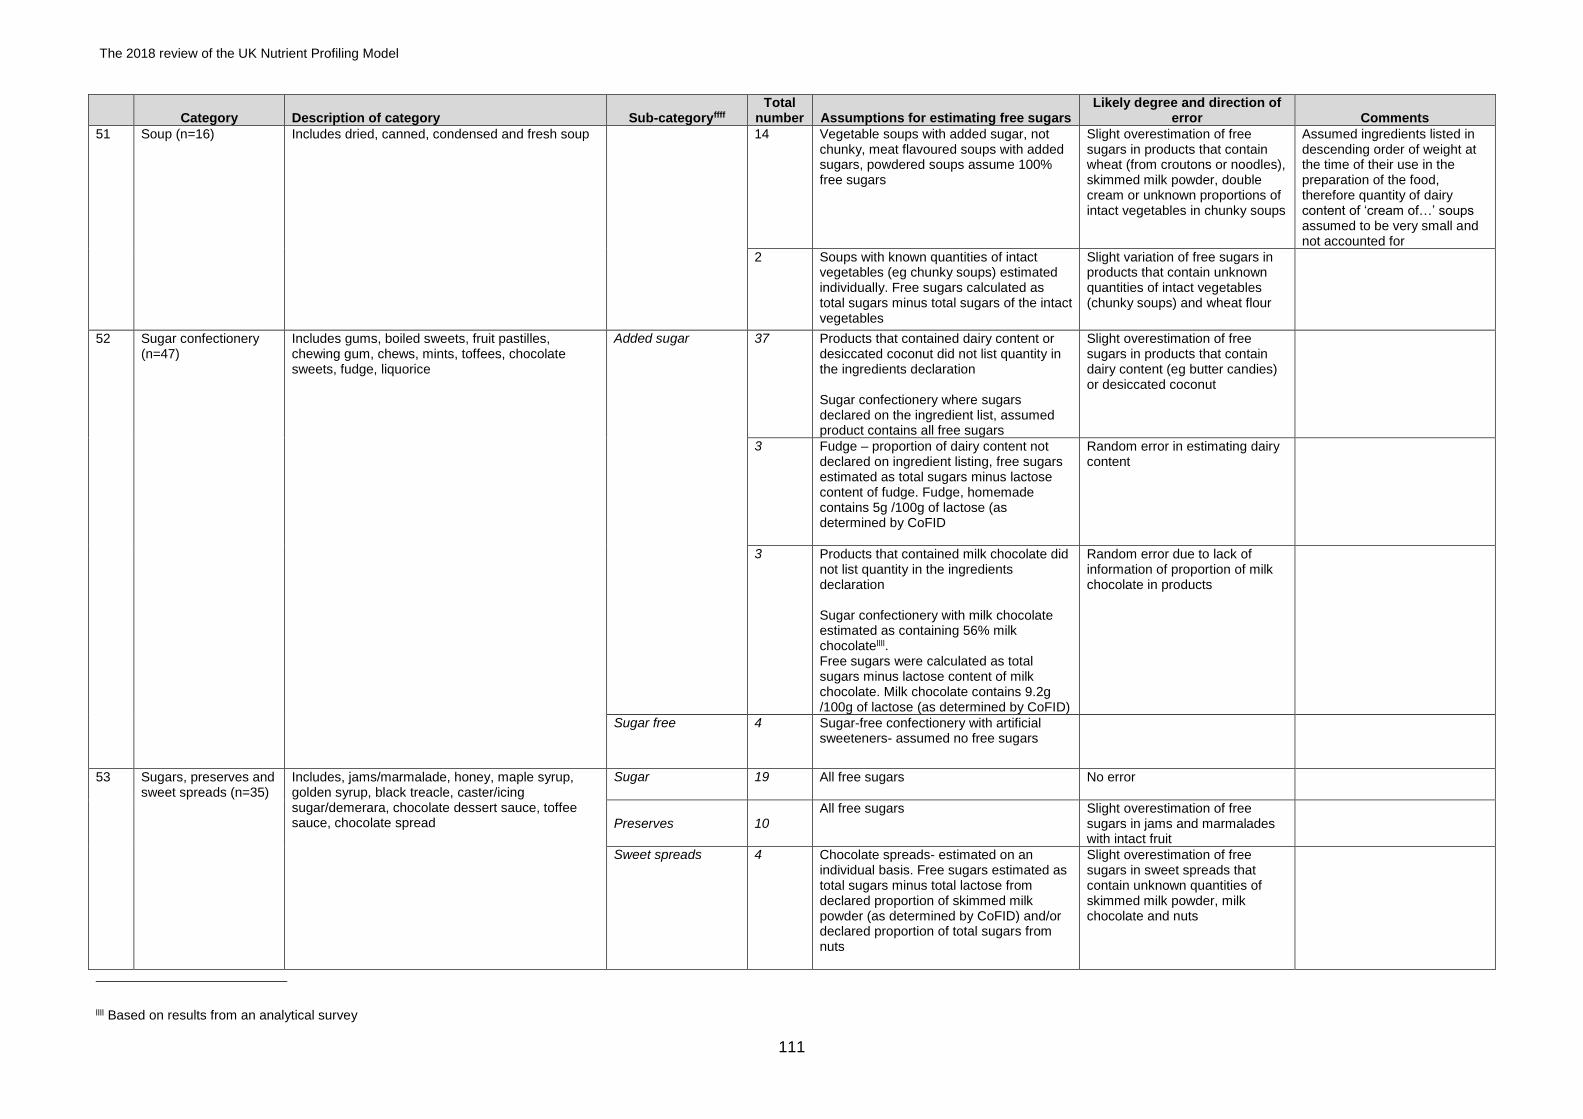
The 2018 review of the UK Nutrient Profiling Model
111
Category Description of category Sub-categoryffff Total
number Assumptions for estimating free sugars Likely degree and direction of
error Comments
51 Soup (n=16) Includes dried, canned, condensed and fresh soup 14 Vegetable soups with added sugar, not chunky, meat flavoured soups with added sugars, powdered soups assume 100% free sugars
Slight overestimation of free sugars in products that contain wheat (from croutons or noodles), skimmed milk powder, double cream or unknown proportions of intact vegetables in chunky soups
Assumed ingredients listed in descending order of weight at the time of their use in the preparation of the food, therefore quantity of dairy content of ‘cream of…’ soups assumed to be very small and not accounted for
2 Soups with known quantities of intact vegetables (eg chunky soups) estimated individually. Free sugars calculated as total sugars minus total sugars of the intact vegetables
Slight variation of free sugars in products that contain unknown quantities of intact vegetables (chunky soups) and wheat flour
52 Sugar confectionery (n=47)
Includes gums, boiled sweets, fruit pastilles, chewing gum, chews, mints, toffees, chocolate sweets, fudge, liquorice
Added sugar
37
Products that contained dairy content or desiccated coconut did not list quantity in the ingredients declaration Sugar confectionery where sugars declared on the ingredient list, assumed product contains all free sugars
Slight overestimation of free sugars in products that contain dairy content (eg butter candies) or desiccated coconut
3 Fudge – proportion of dairy content not declared on ingredient listing, free sugars estimated as total sugars minus lactose content of fudge. Fudge, homemade contains 5g /100g of lactose (as determined by CoFID
Random error in estimating dairy content
3 Products that contained milk chocolate did not list quantity in the ingredients declaration Sugar confectionery with milk chocolate estimated as containing 56% milk chocolatellll. Free sugars were calculated as total sugars minus lactose content of milk chocolate. Milk chocolate contains 9.2g /100g of lactose (as determined by CoFID)
Random error due to lack of information of proportion of milk chocolate in products
Sugar free 4
Sugar-free confectionery with artificial sweeteners- assumed no free sugars
53 Sugars, preserves and sweet spreads (n=35)
Includes, jams/marmalade, honey, maple syrup, golden syrup, black treacle, caster/icing sugar/demerara, chocolate dessert sauce, toffee sauce, chocolate spread
Sugar
19
All free sugars
No error
Preserves
10
All free sugars Slight overestimation of free sugars in jams and marmalades with intact fruit
Sweet spreads
4 Chocolate spreads- estimated on an individual basis. Free sugars estimated as total sugars minus total lactose from declared proportion of skimmed milk powder (as determined by CoFID) and/or declared proportion of total sugars from nuts
Slight overestimation of free sugars in sweet spreads that contain unknown quantities of skimmed milk powder, milk chocolate and nuts
llll Based on results from an analytical survey
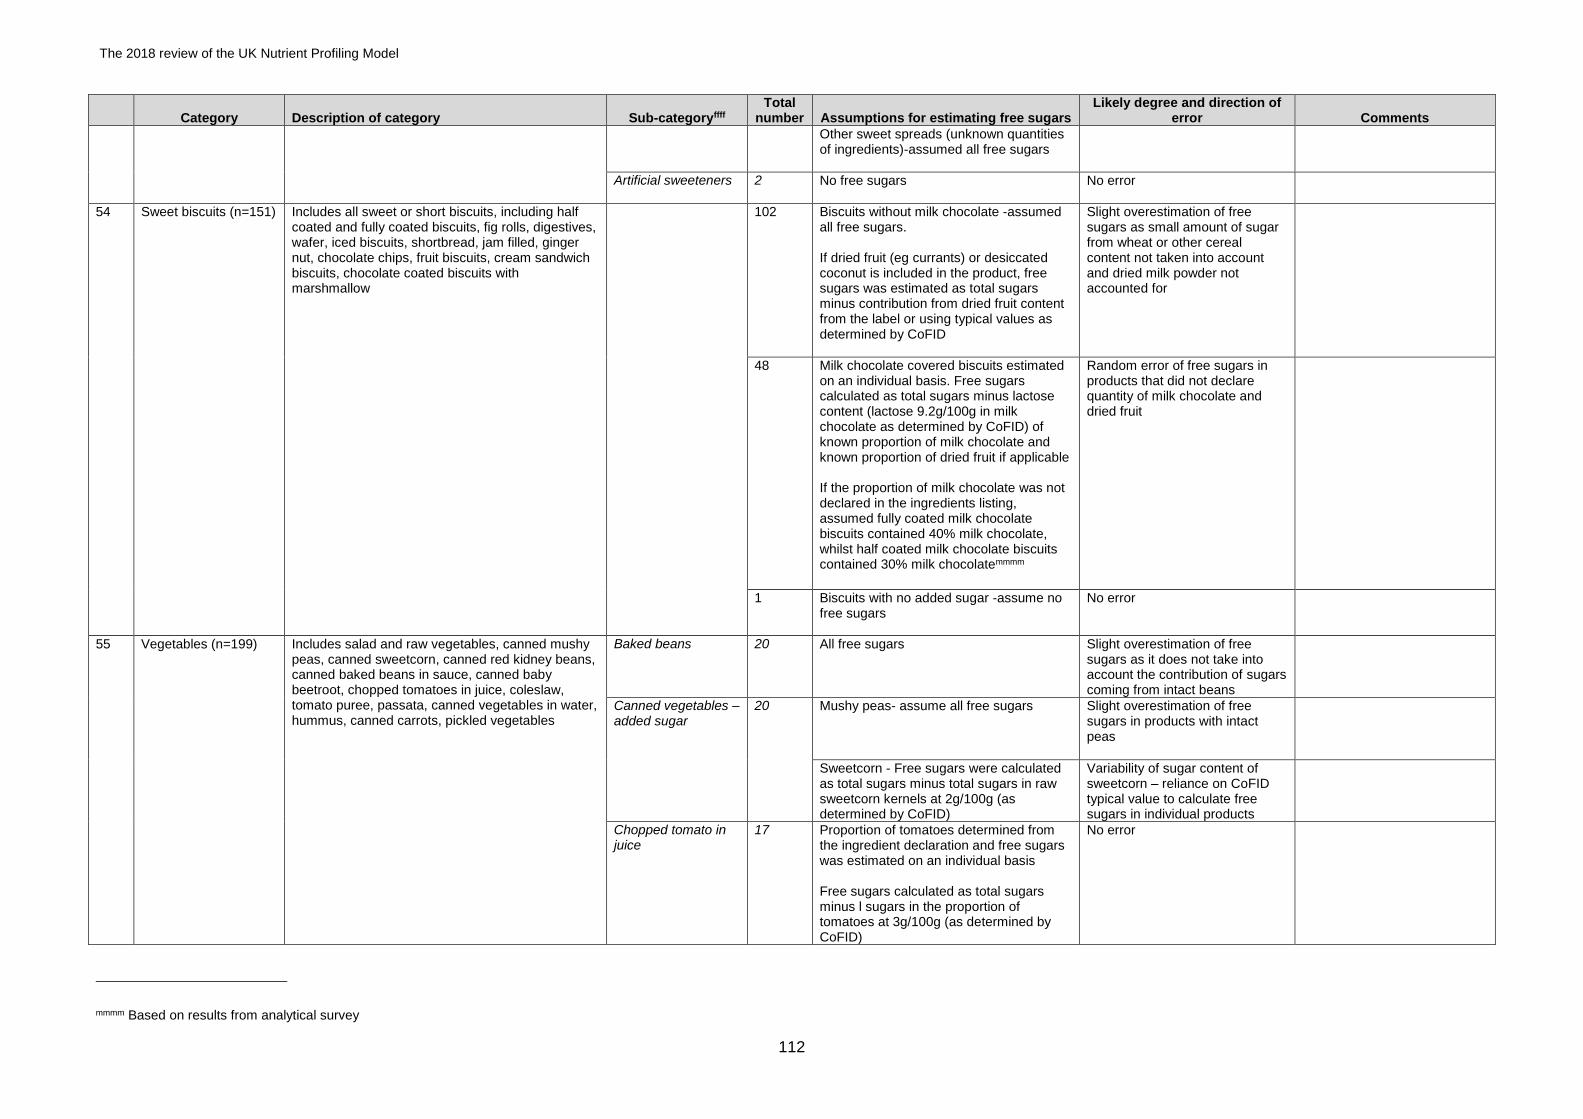
The 2018 review of the UK Nutrient Profiling Model
112
Category Description of category Sub-categoryffff Total
number Assumptions for estimating free sugars Likely degree and direction of
error Comments
Other sweet spreads (unknown quantities of ingredients)-assumed all free sugars
Artificial sweeteners 2
No free sugars No error
54 Sweet biscuits (n=151) Includes all sweet or short biscuits, including half coated and fully coated biscuits, fig rolls, digestives, wafer, iced biscuits, shortbread, jam filled, ginger nut, chocolate chips, fruit biscuits, cream sandwich biscuits, chocolate coated biscuits with marshmallow
102 Biscuits without milk chocolate -assumed all free sugars. If dried fruit (eg currants) or desiccated coconut is included in the product, free sugars was estimated as total sugars minus contribution from dried fruit content from the label or using typical values as determined by CoFID
Slight overestimation of free sugars as small amount of sugar from wheat or other cereal content not taken into account and dried milk powder not accounted for
48 Milk chocolate covered biscuits estimated on an individual basis. Free sugars calculated as total sugars minus lactose content (lactose 9.2g/100g in milk chocolate as determined by CoFID) of known proportion of milk chocolate and known proportion of dried fruit if applicable If the proportion of milk chocolate was not declared in the ingredients listing, assumed fully coated milk chocolate biscuits contained 40% milk chocolate, whilst half coated milk chocolate biscuits contained 30% milk chocolatemmmm
Random error of free sugars in products that did not declare quantity of milk chocolate and dried fruit
1 Biscuits with no added sugar -assume no free sugars
No error
55 Vegetables (n=199) Includes salad and raw vegetables, canned mushy peas, canned sweetcorn, canned red kidney beans, canned baked beans in sauce, canned baby beetroot, chopped tomatoes in juice, coleslaw, tomato puree, passata, canned vegetables in water, hummus, canned carrots, pickled vegetables
Baked beans
20
All free sugars Slight overestimation of free sugars as it does not take into account the contribution of sugars coming from intact beans
Canned vegetables – added sugar
20 Mushy peas- assume all free sugars
Slight overestimation of free sugars in products with intact peas
Sweetcorn - Free sugars were calculated as total sugars minus total sugars in raw sweetcorn kernels at 2g/100g (as determined by CoFID)
Variability of sugar content of sweetcorn – reliance on CoFID typical value to calculate free sugars in individual products
Chopped tomato in juice
17 Proportion of tomatoes determined from the ingredient declaration and free sugars was estimated on an individual basis Free sugars calculated as total sugars minus l sugars in the proportion of tomatoes at 3g/100g (as determined by CoFID)
No error
mmmm Based on results from analytical survey
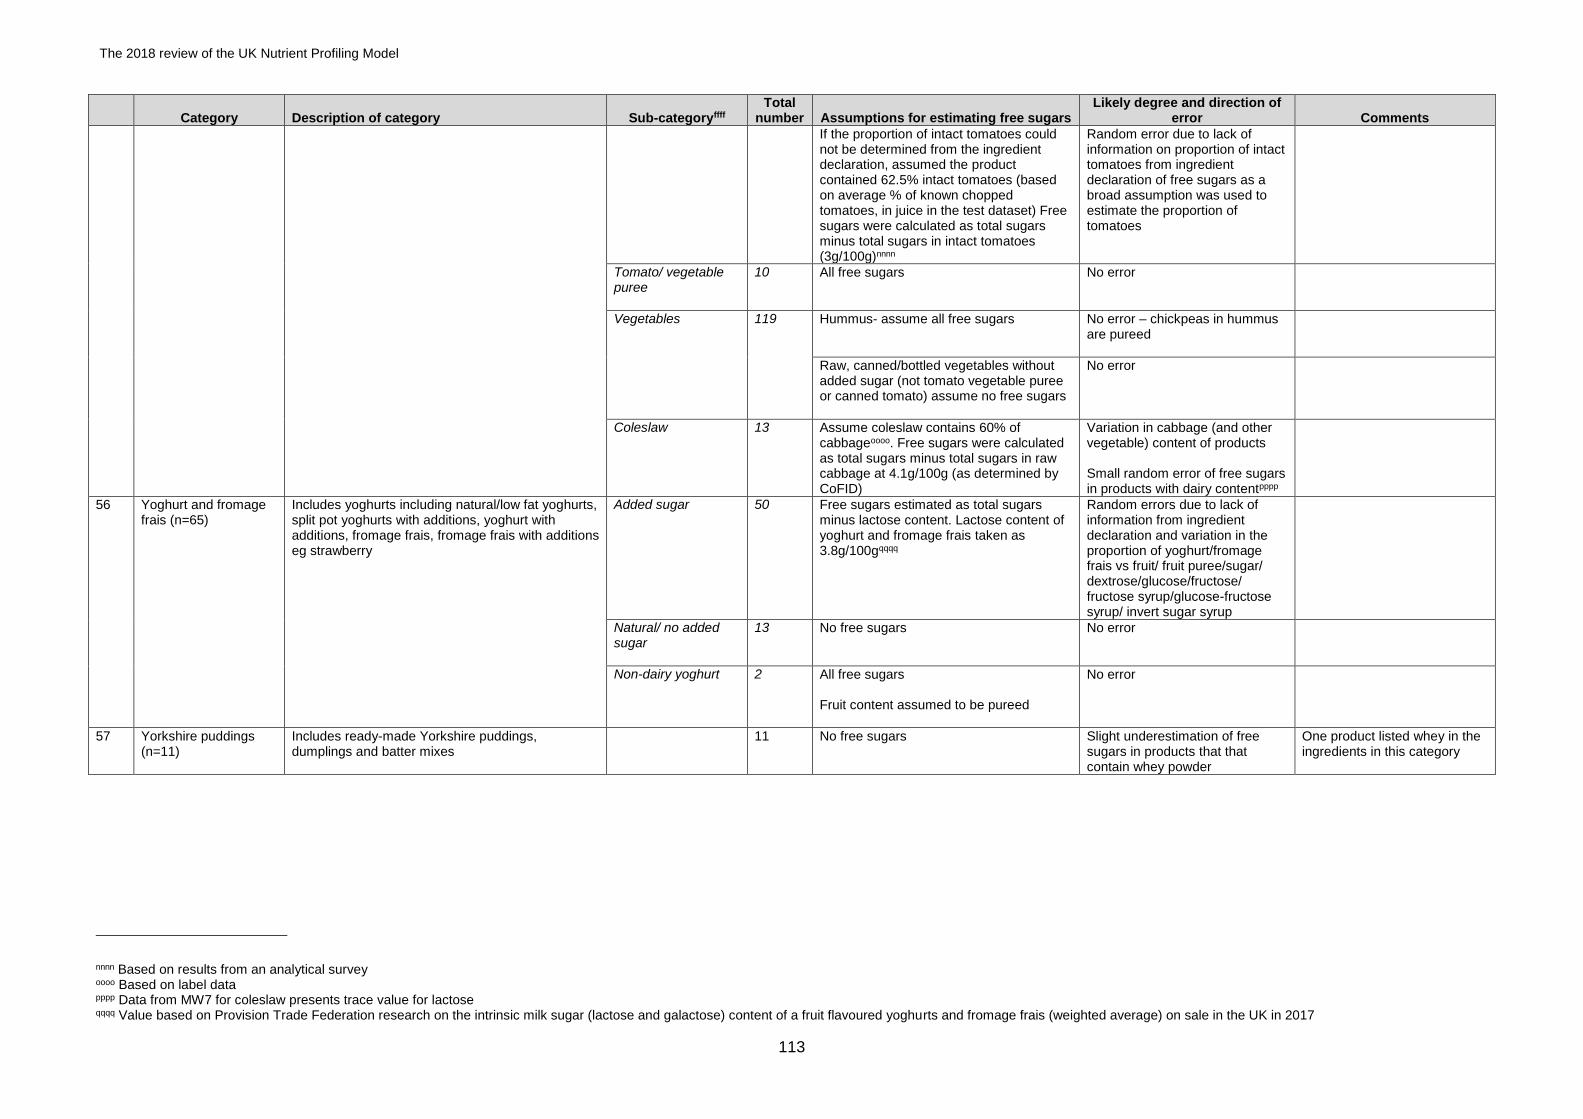
The 2018 review of the UK Nutrient Profiling Model
113
Category Description of category Sub-categoryffff Total
number Assumptions for estimating free sugars Likely degree and direction of
error Comments
If the proportion of intact tomatoes could not be determined from the ingredient declaration, assumed the product contained 62.5% intact tomatoes (based on average % of known chopped tomatoes, in juice in the test dataset) Free sugars were calculated as total sugars minus total sugars in intact tomatoes (3g/100g)nnnn
Random error due to lack of information on proportion of intact tomatoes from ingredient declaration of free sugars as a broad assumption was used to estimate the proportion of tomatoes
Tomato/ vegetable puree
10 All free sugars No error
Vegetables
119 Hummus- assume all free sugars
No error – chickpeas in hummus are pureed
Raw, canned/bottled vegetables without added sugar (not tomato vegetable puree or canned tomato) assume no free sugars
No error
Coleslaw
13
Assume coleslaw contains 60% of cabbageoooo. Free sugars were calculated as total sugars minus total sugars in raw cabbage at 4.1g/100g (as determined by CoFID)
Variation in cabbage (and other vegetable) content of products Small random error of free sugars in products with dairy contentpppp
56 Yoghurt and fromage frais (n=65)
Includes yoghurts including natural/low fat yoghurts, split pot yoghurts with additions, yoghurt with additions, fromage frais, fromage frais with additions eg strawberry
Added sugar
50
Free sugars estimated as total sugars minus lactose content. Lactose content of yoghurt and fromage frais taken as 3.8g/100gqqqq
Random errors due to lack of information from ingredient declaration and variation in the proportion of yoghurt/fromage frais vs fruit/ fruit puree/sugar/ dextrose/glucose/fructose/ fructose syrup/glucose-fructose syrup/ invert sugar syrup
Natural/ no added sugar
13
No free sugars No error
Non-dairy yoghurt 2
All free sugars Fruit content assumed to be pureed
No error
57 Yorkshire puddings (n=11)
Includes ready-made Yorkshire puddings, dumplings and batter mixes
11 No free sugars Slight underestimation of free sugars in products that that contain whey powder
One product listed whey in the ingredients in this category
nnnn Based on results from an analytical survey oooo Based on label data pppp Data from MW7 for coleslaw presents trace value for lactose qqqq Value based on Provision Trade Federation research on the intrinsic milk sugar (lactose and galactose) content of a fruit flavoured yoghurts and fromage frais (weighted average) on sale in the UK in 2017
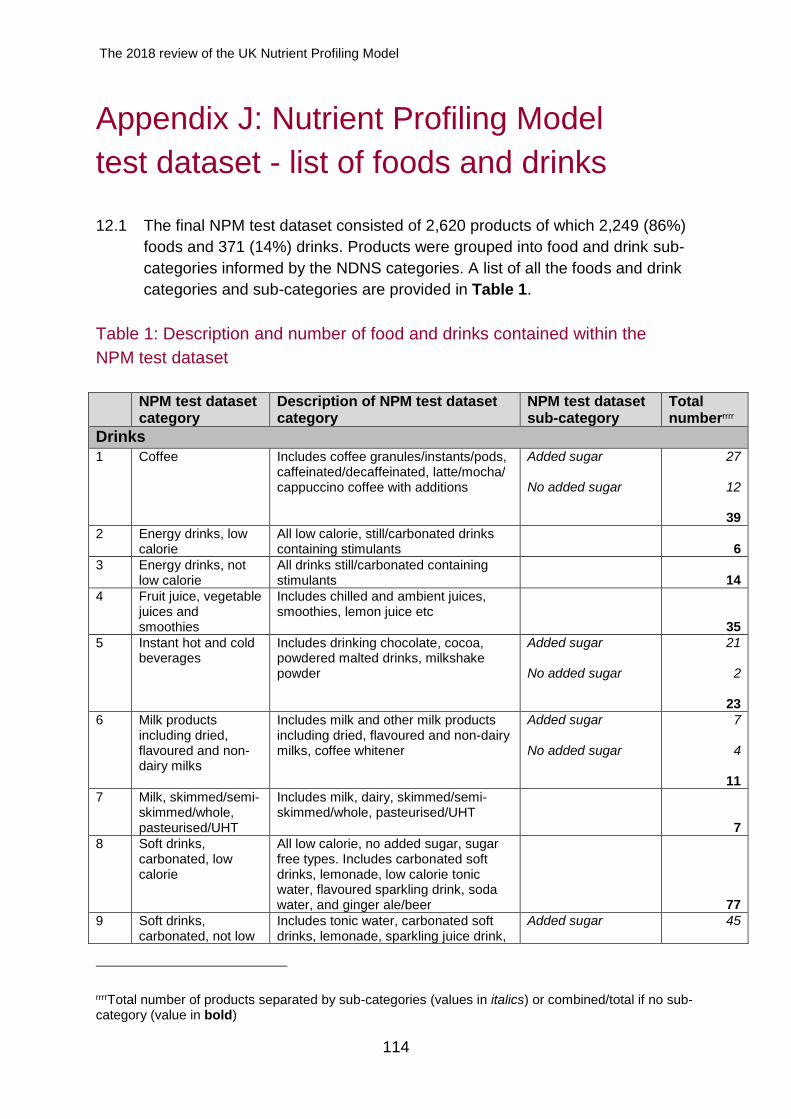
The 2018 review of the UK Nutrient Profiling Model
114
Appendix J: Nutrient Profiling Model
test dataset - list of foods and drinks
12.1 The final NPM test dataset consisted of 2,620 products of which 2,249 (86%)
foods and 371 (14%) drinks. Products were grouped into food and drink sub-
categories informed by the NDNS categories. A list of all the foods and drink
categories and sub-categories are provided in Table 1.
Table 1: Description and number of food and drinks contained within the
NPM test dataset
NPM test dataset category
Description of NPM test dataset category
NPM test dataset sub-category
Total numberrrrr
Drinks
1 Coffee Includes coffee granules/instants/pods, caffeinated/decaffeinated, latte/mocha/ cappuccino coffee with additions
Added sugar No added sugar
27
12
39
2 Energy drinks, low calorie
All low calorie, still/carbonated drinks containing stimulants 6
3 Energy drinks, not low calorie
All drinks still/carbonated containing stimulants 14
4 Fruit juice, vegetable juices and smoothies
Includes chilled and ambient juices, smoothies, lemon juice etc
35
5 Instant hot and cold beverages
Includes drinking chocolate, cocoa, powdered malted drinks, milkshake powder
Added sugar No added sugar
21
2
23
6 Milk products including dried, flavoured and non-dairy milks
Includes milk and other milk products including dried, flavoured and non-dairy milks, coffee whitener
Added sugar No added sugar
7
4
11
7 Milk, skimmed/semi-skimmed/whole, pasteurised/UHT
Includes milk, dairy, skimmed/semi-skimmed/whole, pasteurised/UHT
7
8 Soft drinks, carbonated, low calorie
All low calorie, no added sugar, sugar free types. Includes carbonated soft drinks, lemonade, low calorie tonic water, flavoured sparkling drink, soda water, and ginger ale/beer 77
9 Soft drinks, carbonated, not low
Includes tonic water, carbonated soft drinks, lemonade, sparkling juice drink,
Added sugar
45
rrrrTotal number of products separated by sub-categories (values in italics) or combined/total if no sub-category (value in bold)
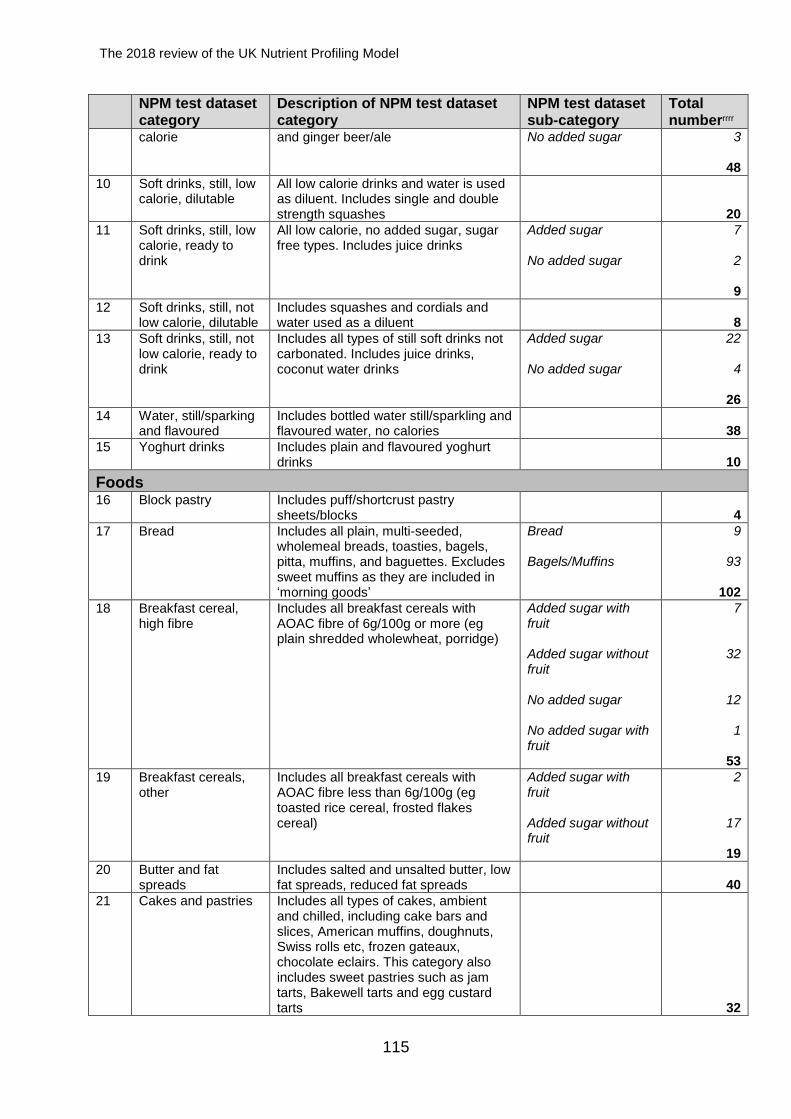
The 2018 review of the UK Nutrient Profiling Model
115
NPM test dataset category
Description of NPM test dataset category
NPM test dataset sub-category
Total numberrrrr
calorie and ginger beer/ale No added sugar 3
48
10 Soft drinks, still, low calorie, dilutable
All low calorie drinks and water is used as diluent. Includes single and double strength squashes 20
11 Soft drinks, still, low calorie, ready to drink
All low calorie, no added sugar, sugar free types. Includes juice drinks
Added sugar No added sugar
7
2
9
12 Soft drinks, still, not low calorie, dilutable
Includes squashes and cordials and water used as a diluent 8
13 Soft drinks, still, not low calorie, ready to drink
Includes all types of still soft drinks not carbonated. Includes juice drinks, coconut water drinks
Added sugar No added sugar
22
4
26
14 Water, still/sparking and flavoured
Includes bottled water still/sparkling and flavoured water, no calories 38
15 Yoghurt drinks Includes plain and flavoured yoghurt drinks 10
Foods 16 Block pastry Includes puff/shortcrust pastry
sheets/blocks 4
17 Bread Includes all plain, multi-seeded, wholemeal breads, toasties, bagels, pitta, muffins, and baguettes. Excludes sweet muffins as they are included in ‘morning goods’
Bread Bagels/Muffins
9
93
102
18 Breakfast cereal, high fibre
Includes all breakfast cereals with AOAC fibre of 6g/100g or more (eg plain shredded wholewheat, porridge)
Added sugar with fruit Added sugar without fruit No added sugar No added sugar with fruit
7
32
12
1
53
19 Breakfast cereals, other
Includes all breakfast cereals with AOAC fibre less than 6g/100g (eg toasted rice cereal, frosted flakes cereal)
Added sugar with fruit Added sugar without fruit
2
17
19
20 Butter and fat spreads
Includes salted and unsalted butter, low fat spreads, reduced fat spreads 40
21 Cakes and pastries Includes all types of cakes, ambient and chilled, including cake bars and slices, American muffins, doughnuts, Swiss rolls etc, frozen gateaux, chocolate eclairs. This category also includes sweet pastries such as jam tarts, Bakewell tarts and egg custard tarts 32
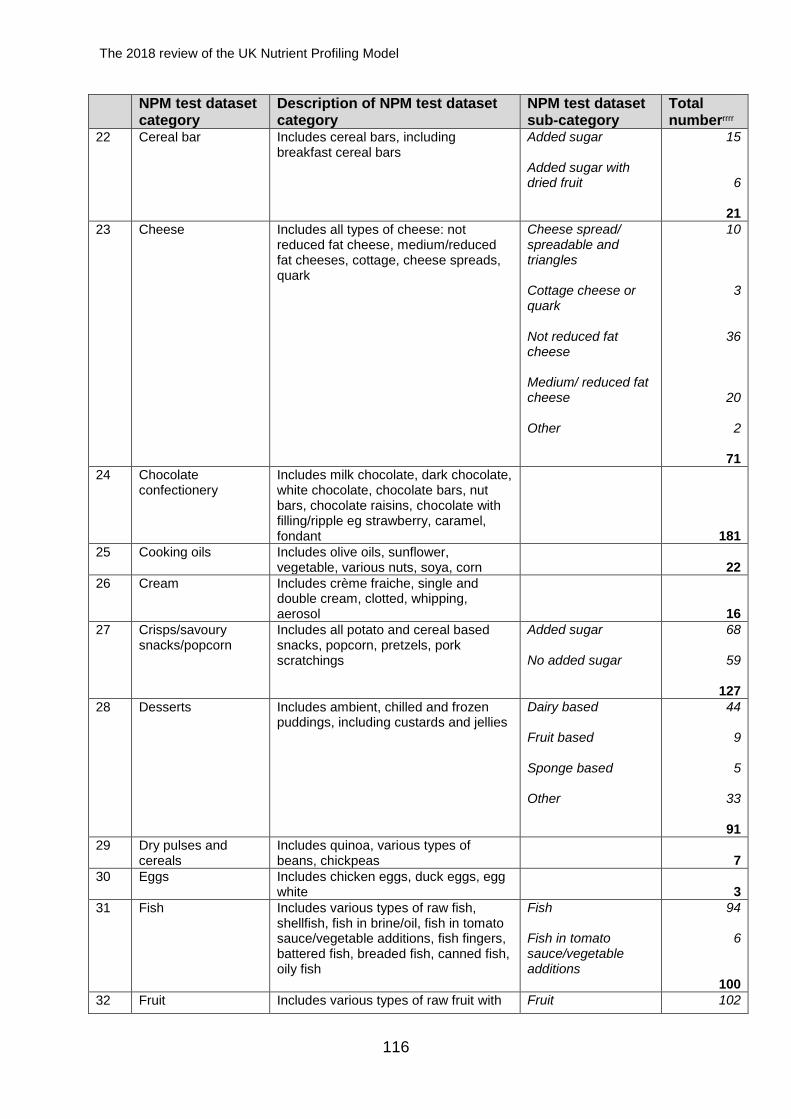
The 2018 review of the UK Nutrient Profiling Model
116
NPM test dataset category
Description of NPM test dataset category
NPM test dataset sub-category
Total numberrrrr
22 Cereal bar Includes cereal bars, including breakfast cereal bars
Added sugar Added sugar with dried fruit
15
6
21
23 Cheese Includes all types of cheese: not reduced fat cheese, medium/reduced fat cheeses, cottage, cheese spreads, quark
Cheese spread/ spreadable and triangles Cottage cheese or quark Not reduced fat cheese Medium/ reduced fat cheese Other
10
3
36
20
2
71
24 Chocolate confectionery
Includes milk chocolate, dark chocolate, white chocolate, chocolate bars, nut bars, chocolate raisins, chocolate with filling/ripple eg strawberry, caramel, fondant 181
25 Cooking oils Includes olive oils, sunflower, vegetable, various nuts, soya, corn 22
26 Cream Includes crème fraiche, single and double cream, clotted, whipping, aerosol 16
27 Crisps/savoury snacks/popcorn
Includes all potato and cereal based snacks, popcorn, pretzels, pork scratchings
Added sugar No added sugar
68
59
127
28 Desserts Includes ambient, chilled and frozen puddings, including custards and jellies
Dairy based Fruit based Sponge based Other
44
9
5
33
91
29 Dry pulses and cereals
Includes quinoa, various types of beans, chickpeas 7
30 Eggs Includes chicken eggs, duck eggs, egg white 3
31 Fish Includes various types of raw fish, shellfish, fish in brine/oil, fish in tomato sauce/vegetable additions, fish fingers, battered fish, breaded fish, canned fish, oily fish
Fish Fish in tomato sauce/vegetable additions
94
6
100
32 Fruit Includes various types of raw fruit with Fruit 102
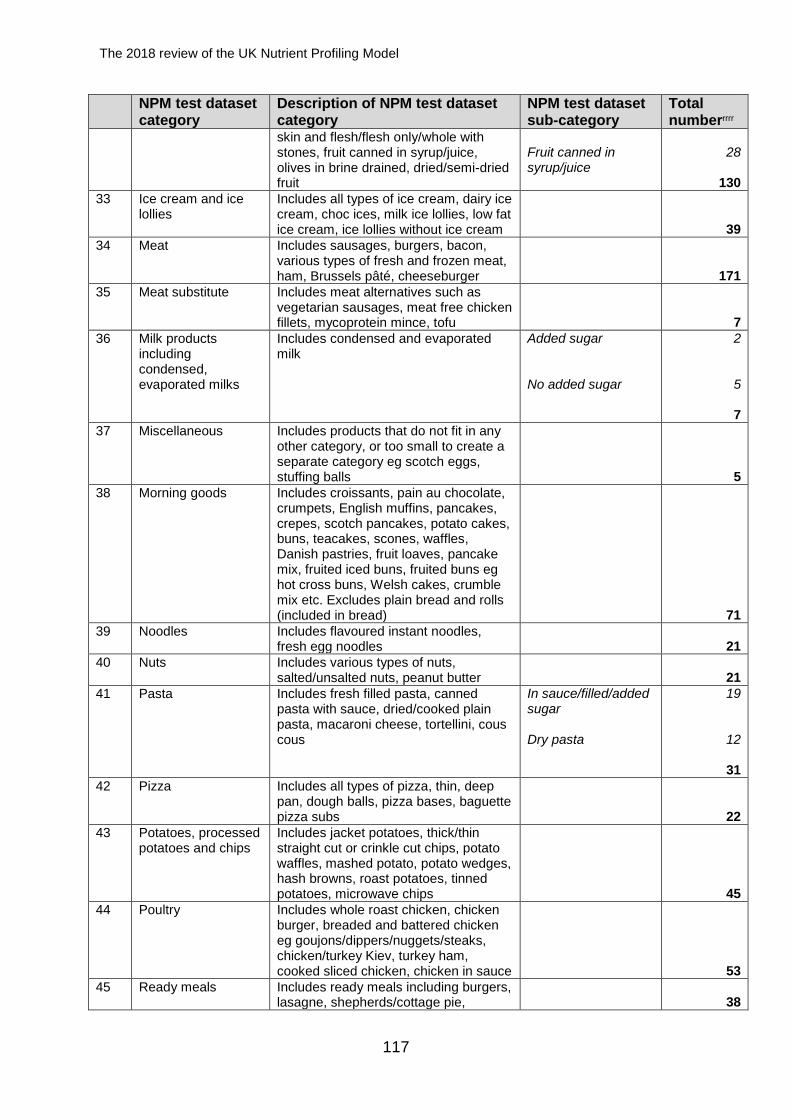
The 2018 review of the UK Nutrient Profiling Model
117
NPM test dataset category
Description of NPM test dataset category
NPM test dataset sub-category
Total numberrrrr
skin and flesh/flesh only/whole with stones, fruit canned in syrup/juice, olives in brine drained, dried/semi-dried fruit
Fruit canned in syrup/juice
28
130
33 Ice cream and ice lollies
Includes all types of ice cream, dairy ice cream, choc ices, milk ice lollies, low fat ice cream, ice lollies without ice cream 39
34 Meat Includes sausages, burgers, bacon, various types of fresh and frozen meat, ham, Brussels pâté, cheeseburger 171
35 Meat substitute Includes meat alternatives such as vegetarian sausages, meat free chicken fillets, mycoprotein mince, tofu 7
36 Milk products including condensed, evaporated milks
Includes condensed and evaporated milk
Added sugar No added sugar
2
5
7
37 Miscellaneous Includes products that do not fit in any other category, or too small to create a separate category eg scotch eggs, stuffing balls 5
38 Morning goods Includes croissants, pain au chocolate, crumpets, English muffins, pancakes, crepes, scotch pancakes, potato cakes, buns, teacakes, scones, waffles, Danish pastries, fruit loaves, pancake mix, fruited iced buns, fruited buns eg hot cross buns, Welsh cakes, crumble mix etc. Excludes plain bread and rolls (included in bread) 71
39 Noodles Includes flavoured instant noodles, fresh egg noodles 21
40 Nuts Includes various types of nuts, salted/unsalted nuts, peanut butter 21
41 Pasta Includes fresh filled pasta, canned pasta with sauce, dried/cooked plain pasta, macaroni cheese, tortellini, cous cous
In sauce/filled/added sugar Dry pasta
19
12
31
42 Pizza Includes all types of pizza, thin, deep pan, dough balls, pizza bases, baguette pizza subs 22
43 Potatoes, processed potatoes and chips
Includes jacket potatoes, thick/thin straight cut or crinkle cut chips, potato waffles, mashed potato, potato wedges, hash browns, roast potatoes, tinned potatoes, microwave chips 45
44 Poultry Includes whole roast chicken, chicken burger, breaded and battered chicken eg goujons/dippers/nuggets/steaks, chicken/turkey Kiev, turkey ham, cooked sliced chicken, chicken in sauce 53
45 Ready meals Includes ready meals including burgers, lasagne, shepherds/cottage pie, 38
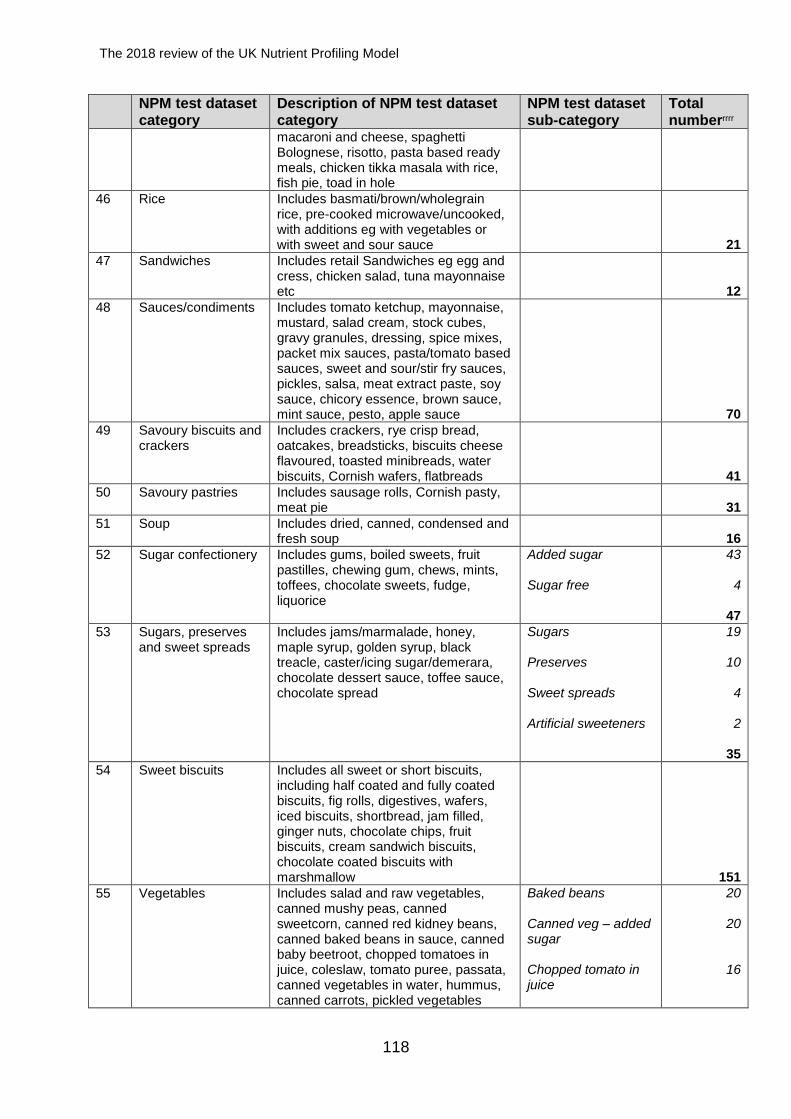
The 2018 review of the UK Nutrient Profiling Model
118
NPM test dataset category
Description of NPM test dataset category
NPM test dataset sub-category
Total numberrrrr
macaroni and cheese, spaghetti Bolognese, risotto, pasta based ready meals, chicken tikka masala with rice, fish pie, toad in hole
46 Rice Includes basmati/brown/wholegrain rice, pre-cooked microwave/uncooked, with additions eg with vegetables or with sweet and sour sauce 21
47 Sandwiches Includes retail Sandwiches eg egg and cress, chicken salad, tuna mayonnaise etc 12
48 Sauces/condiments Includes tomato ketchup, mayonnaise, mustard, salad cream, stock cubes, gravy granules, dressing, spice mixes, packet mix sauces, pasta/tomato based sauces, sweet and sour/stir fry sauces, pickles, salsa, meat extract paste, soy sauce, chicory essence, brown sauce, mint sauce, pesto, apple sauce 70
49 Savoury biscuits and crackers
Includes crackers, rye crisp bread, oatcakes, breadsticks, biscuits cheese flavoured, toasted minibreads, water biscuits, Cornish wafers, flatbreads 41
50 Savoury pastries Includes sausage rolls, Cornish pasty, meat pie 31
51 Soup Includes dried, canned, condensed and fresh soup 16
52 Sugar confectionery Includes gums, boiled sweets, fruit pastilles, chewing gum, chews, mints, toffees, chocolate sweets, fudge, liquorice
Added sugar Sugar free
43
4
47
53 Sugars, preserves and sweet spreads
Includes jams/marmalade, honey, maple syrup, golden syrup, black treacle, caster/icing sugar/demerara, chocolate dessert sauce, toffee sauce, chocolate spread
Sugars Preserves Sweet spreads Artificial sweeteners
19
10
4
2
35
54 Sweet biscuits Includes all sweet or short biscuits, including half coated and fully coated biscuits, fig rolls, digestives, wafers, iced biscuits, shortbread, jam filled, ginger nuts, chocolate chips, fruit biscuits, cream sandwich biscuits, chocolate coated biscuits with marshmallow 151
55 Vegetables Includes salad and raw vegetables, canned mushy peas, canned sweetcorn, canned red kidney beans, canned baked beans in sauce, canned baby beetroot, chopped tomatoes in juice, coleslaw, tomato puree, passata, canned vegetables in water, hummus, canned carrots, pickled vegetables
Baked beans Canned veg – added sugar Chopped tomato in juice
20
20
16
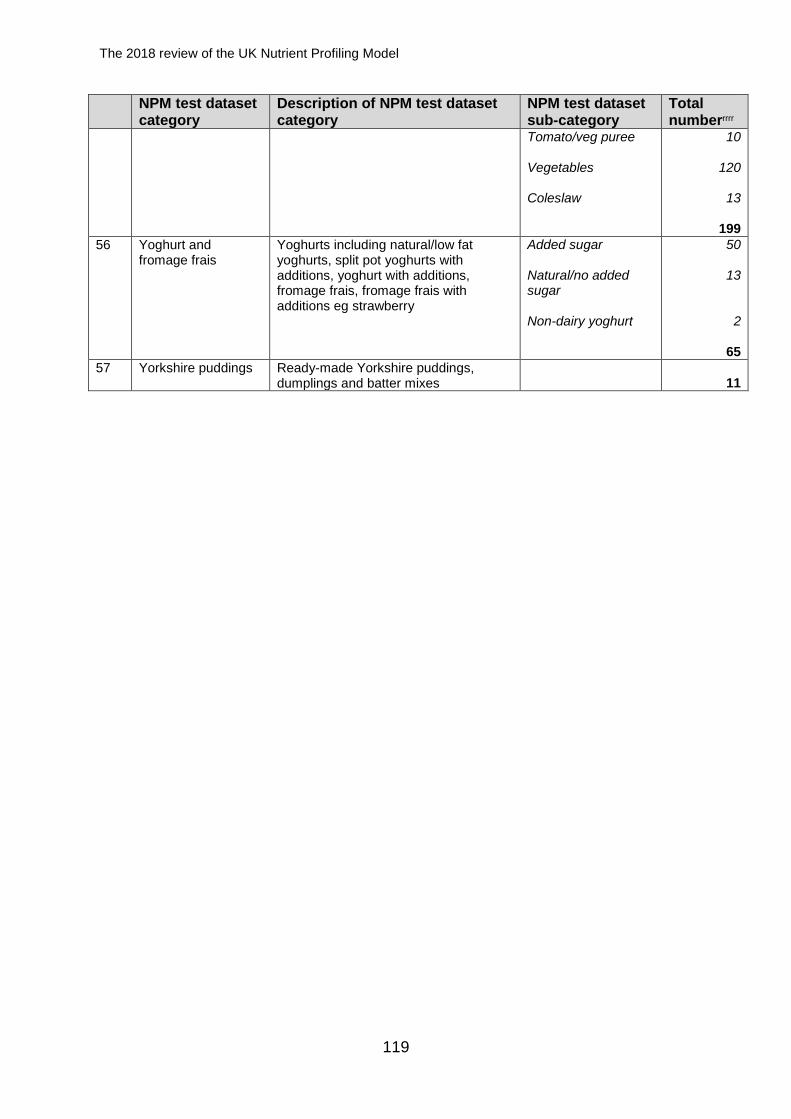
The 2018 review of the UK Nutrient Profiling Model
119
NPM test dataset category
Description of NPM test dataset category
NPM test dataset sub-category
Total numberrrrr
Tomato/veg puree Vegetables Coleslaw
10
120
13
199
56 Yoghurt and fromage frais
Yoghurts including natural/low fat yoghurts, split pot yoghurts with additions, yoghurt with additions, fromage frais, fromage frais with additions eg strawberry
Added sugar Natural/no added sugar Non-dairy yoghurt
50
13
2
65
57 Yorkshire puddings Ready-made Yorkshire puddings, dumplings and batter mixes 11
The 2018 review of the UK Nutrient Profiling Model
120
Appendix K: Rationale for the development
of the Nutrient Profiling Model performance
measure cut-off values
13.1 The performance measure cut-off values agreed by the expert group were
developed pragmatically and initially focused on total and free sugars, to ensure
high sugar products would not be potentially advertised to children. Other
performance measure cut-off values included: saturated fat, salt and fibre in
order to guard against unintended consequences of the modelling. Table 1
details the rationale for performance measure cut-off values used in the NPM
review.
13.2 A performance measure for fruit and vegetables was not developed, as this
would have been unlikely to change the outcome as few foods and drinks in the
NPM test dataset contain sufficient fruit and vegetables to increase the likelihood
of achieving a pass score.
13.3 To help support the development of the performance measures, a literature
review was carried out to determine which performance measures were being
used in other nutrient profiling models and how they were determined. The
review found no papers directly relevant to the performance measures used in
nutrient profiling models, and therefore no additional information was available to
inform the expert group when making their recommendations.

The 2018 review of the UK Nutrient Profiling Model
121
Table 1: Rationale for the development of the NPM performance measure cut-off values
Performance measure cut-off values
Rationale
Total sugars
Food High>22.5g/100g
Based on the front-of-pack ‘high’ labelling criteria31
Drinks High> 8g/100ml Medium-High >5.0g to ≤8.0g/100ml
Based on the higher and lower levy rates outlined in the soft drinks industry levy32. The ‘high’ is based on the higher levy rate of a total sugars content of 8g or more per 100ml, the ‘medium – high’ on the lower levy rate of a total sugars content of 5g or more per 100ml
Free Sugars
Food High >6.25g/100g
The ‘high’ front-of-pack labelling criteria31 for total sugars, saturated fat and salt are determined using 25% of the reference intake. Therefore, 25% of the reference intake of free sugars, 5% of total dietary energy based on a 2,000kcal diet, has been used
Drinks High> 3.13ssssg/100ml
The ‘high’ front-of-pack labelling criteria 31for total sugars, saturated fat and salt is determined using 12.5% of the reference intake. Therefore 12.5% of the reference intake of free sugars, 5% of total dietary energy based on a 2,000kcal diet, has been used for the performance measure
Saturated fat
Food High >5g/100g
Based on the front-of-pack ‘high’ labelling criteria31
Drinks High > 2.5g/100ml
Based on the front-of-pack ‘high’ labelling criteria31
Salt
Food High >1.5g/100g
Based on the front-of-pack ‘high’ labelling criteria31
Drinks High > 0.75g/100ml
Based on the front-of-pack ‘high’ labelling criteria31
Fibre
Food High fibre >6g/100g Source of fibre >3g/100g to ≤6.0g/100g
There is no front-of-pack ‘high’ labelling criteria38 or Recommended Intake (RI) for fibre. The performance measure was based on the Nutrition Claims legislation Regulation (EC) No 1924/200633. For High the ‘high fibre’ claim was used (product contains at least 6g fibre per 100g) and for ‘source of fibre’ the source of fibre claim was used (product contains at least 3g fibre per 100g)
Drinks
No performance measure cut-off values were developed for fibre for drinks
ssss For the purpose of the modelling, a value of 3.125g was used
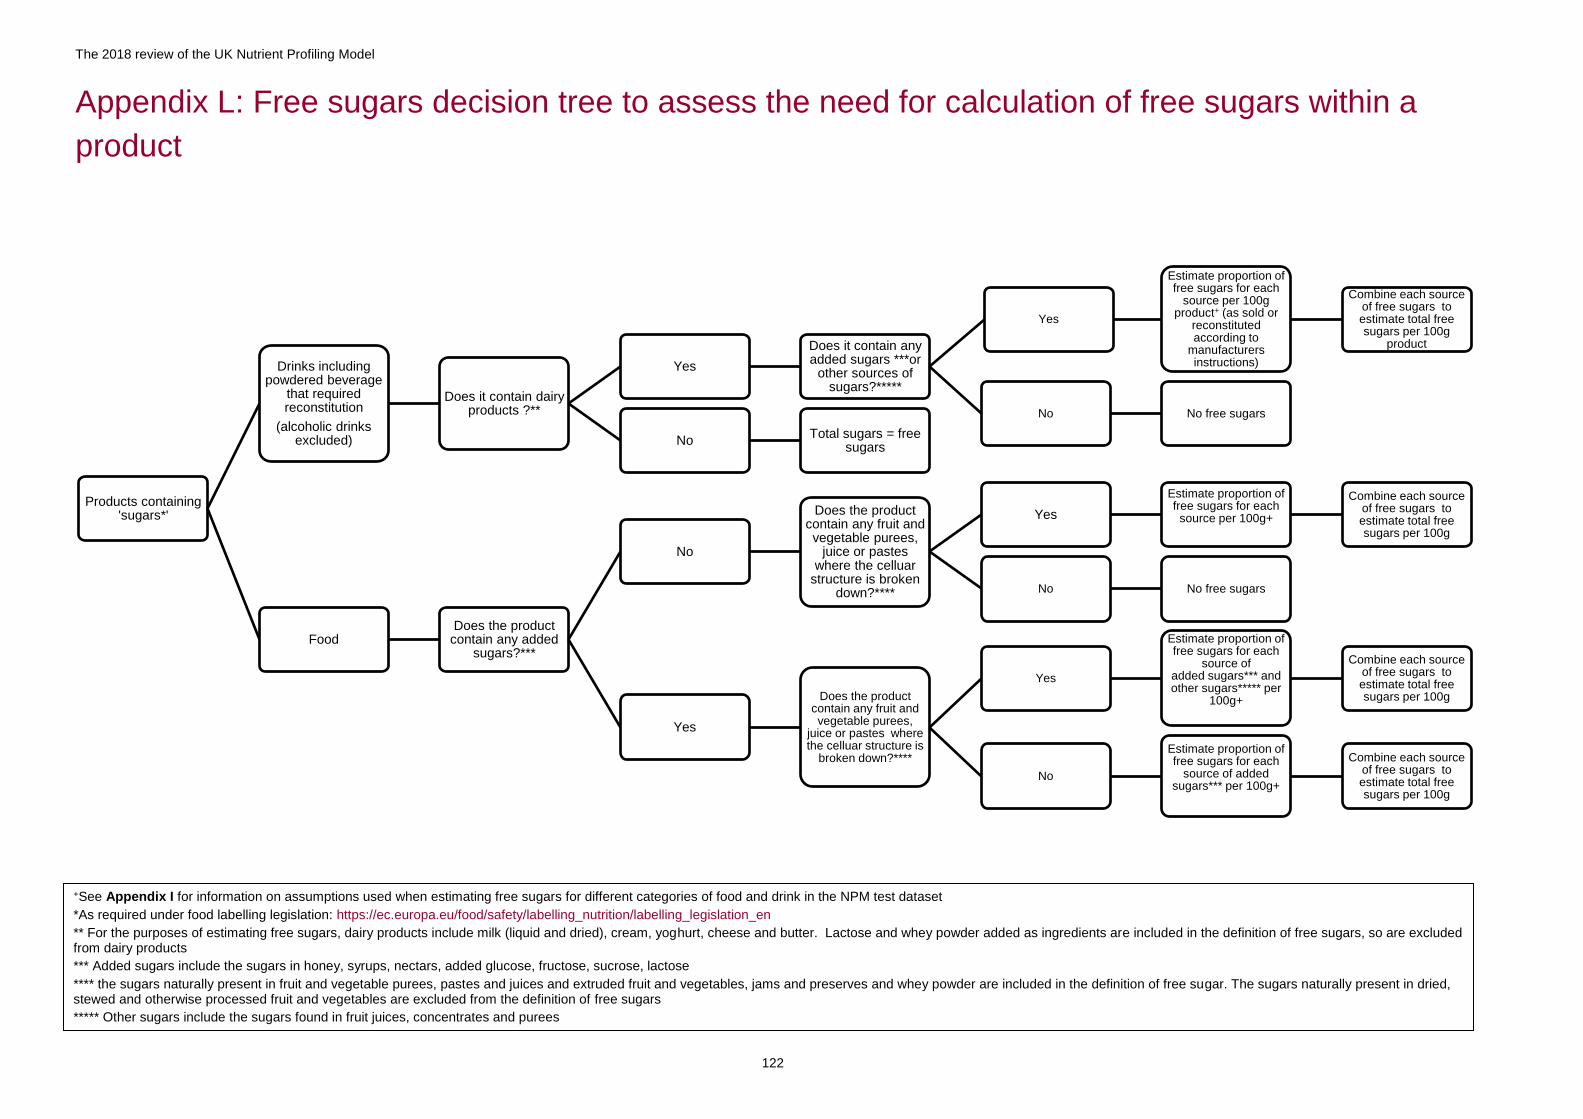
The 2018 review of the UK Nutrient Profiling Model
122
Appendix L: Free sugars decision tree to assess the need for calculation of free sugars within a
product
Products containing 'sugars*'
Drinks including powdered beverage
that required reconstitution
(alcoholic drinks excluded)
Does it contain dairy products ?**
Yes
Does it contain any added sugars ***or
other sources of sugars?*****
Yes
Estimate proportion of free sugars for each
source per 100g product+ (as sold or
reconstituted according to
manufacturers instructions)
Combine each source of free sugars to estimate total free sugars per 100g
product
No No free sugars
NoTotal sugars = free
sugars
FoodDoes the product contain any added
sugars?***
No
Does the product contain any fruit and vegetable purees,
juice or pastes where the celluar
structure is broken down?****
Yes
Estimate proportion of free sugars for each source per 100g+
Combine each source of free sugars to estimate total free sugars per 100g
No No free sugars
Yes
Does the product contain any fruit and vegetable purees,
juice or pastes where the celluar structure is
broken down?****
Yes
Estimate proportion of free sugars for each
source of added sugars*** and other sugars***** per
100g+
Combine each source of free sugars to estimate total free sugars per 100g
No
Estimate proportion of free sugars for each
source of added sugars*** per 100g+
Combine each source of free sugars to estimate total free sugars per 100g
+See Appendix I for information on assumptions used when estimating free sugars for different categories of food and drink in the NPM test dataset
*As required under food labelling legislation: https://ec.europa.eu/food/safety/labelling_nutrition/labelling_legislation_en
** For the purposes of estimating free sugars, dairy products include milk (liquid and dried), cream, yoghurt, cheese and butter. Lactose and whey powder added as ingredients are included in the definition of free sugars, so are excluded from dairy products
*** Added sugars include the sugars in honey, syrups, nectars, added glucose, fructose, sucrose, lactose
**** the sugars naturally present in fruit and vegetable purees, pastes and juices and extruded fruit and vegetables, jams and preserves and whey powder are included in the definition of free sugar. The sugars naturally present in dried, stewed and otherwise processed fruit and vegetables are excluded from the definition of free sugars
***** Other sugars include the sugars found in fruit juices, concentrates and purees
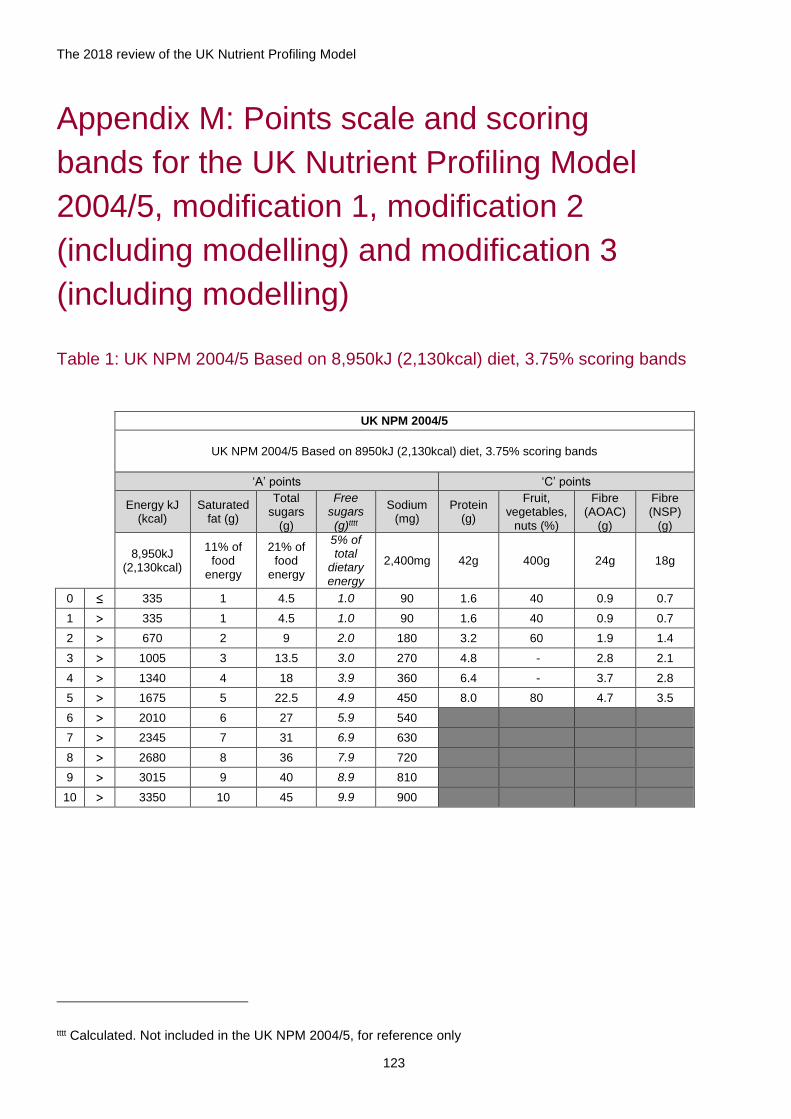
The 2018 review of the UK Nutrient Profiling Model
123
Appendix M: Points scale and scoring
bands for the UK Nutrient Profiling Model
2004/5, modification 1, modification 2
(including modelling) and modification 3
(including modelling)
Table 1: UK NPM 2004/5 Based on 8,950kJ (2,130kcal) diet, 3.75% scoring bands
UK NPM 2004/5
UK NPM 2004/5 Based on 8950kJ (2,130kcal) diet, 3.75% scoring bands
‘A’ points ‘C’ points
Energy kJ (kcal)
Saturated fat (g)
Total sugars
(g)
Free sugars (g)tttt
Sodium (mg)
Protein (g)
Fruit, vegetables,
nuts (%)
Fibre (AOAC)
(g)
Fibre (NSP)
(g)
8,950kJ (2,130kcal)
11% of food
energy
21% of food
energy
5% of total
dietary energy
2,400mg 42g 400g 24g 18g
0 ≤ 335 1 4.5 1.0 90 1.6 40 0.9 0.7
1 > 335 1 4.5 1.0 90 1.6 40 0.9 0.7
2 > 670 2 9 2.0 180 3.2 60 1.9 1.4
3 > 1005 3 13.5 3.0 270 4.8 - 2.8 2.1
4 > 1340 4 18 3.9 360 6.4 - 3.7 2.8
5 > 1675 5 22.5 4.9 450 8.0 80 4.7 3.5
6 > 2010 6 27 5.9 540
7 > 2345 7 31 6.9 630
8 > 2680 8 36 7.9 720
9 > 3015 9 40 8.9 810
10 > 3350 10 45 9.9 900
tttt Calculated. Not included in the UK NPM 2004/5, for reference only

The 2018 review of the UK Nutrient Profiling Model
124
Table 2: Modification 1 - Based on 8,400kJ (2,000kcal) diet (changes to energy,
saturated fat, total sugars and salt in place of sodium)
Modification 1
Modifications: Based on 8,400kJ (2,000kcal); 21%of food energy from total sugars; 11% of energy from saturated fat; salt in place of sodium.
3.75% scoring bands.
‘A’ points ‘C’ points
Energy kJ (kcal)
Saturated fat (g)
Total sugars (g)
Salt (g) Protein (g) Fruit,
vegetables,
nuts (%)
Fibre (AOAC) (g)
Fibre (NSP) (g)
8,400kJ
(2,000kcal) 11% of food
energy 21% of food
energy 6g 42g 400g 24g 18g
0 ≤ 315 0.9 3.9 0.2 1.6 40 0.9 0.7
1 > 315 0.9 3.9 0.2 1.6 40 0.9 0.7
2 > 630 1.9 7.8 0.5 3.2 60 1.9 1.4
3 > 945 2.8 12 0.7 4.8 - 2.8 2.1
4 > 1260 3.7 16 0.9 6.4 - 3.7 2.8
5 > 1575 4.7 19 1.1 8.0 80 4.7 3.5
6 > 1890 5.6 23 1.4
7 > 2205 6.6 27 1.6
8 > 2520 7.5 31 1.8
9 > 2835 8.4 35 2.0
10 > 3150 9.4 39 2.3
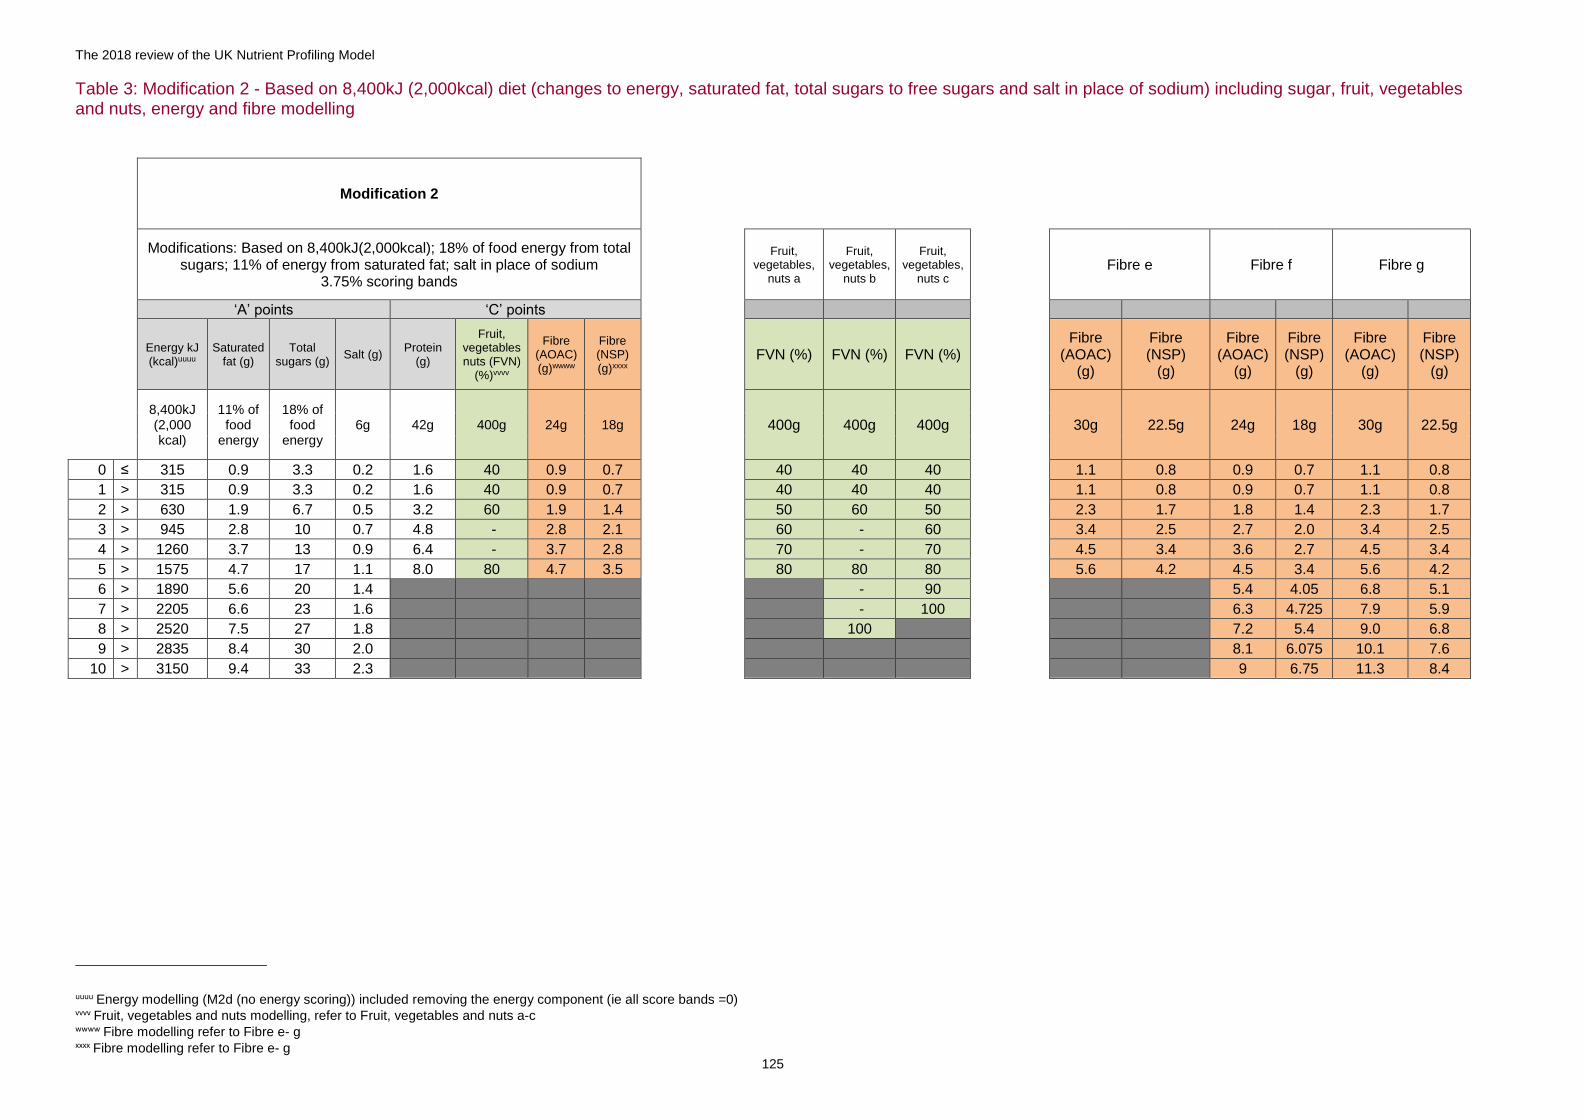
The 2018 review of the UK Nutrient Profiling Model
125
Table 3: Modification 2 - Based on 8,400kJ (2,000kcal) diet (changes to energy, saturated fat, total sugars to free sugars and salt in place of sodium) including sugar, fruit, vegetables and nuts, energy and fibre modelling
Modification 2
Modifications: Based on 8,400kJ(2,000kcal); 18% of food energy from total
sugars; 11% of energy from saturated fat; salt in place of sodium 3.75% scoring bands
Fruit, vegetables,
nuts a
Fruit, vegetables,
nuts b
Fruit, vegetables,
nuts c Fibre e Fibre f Fibre g
‘A’ points ‘C’ points
Energy kJ (kcal)uuuu
Saturated fat (g)
Total sugars (g)
Salt (g) Protein
(g)
Fruit, vegetables nuts (FVN)
(%)vvvv
Fibre (AOAC) (g)wwww
Fibre (NSP) (g)xxxx
FVN (%) FVN (%) FVN (%)
Fibre (AOAC)
(g)
Fibre (NSP)
(g)
Fibre (AOAC)
(g)
Fibre (NSP)
(g)
Fibre (AOAC)
(g)
Fibre (NSP)
(g)
8,400kJ (2,000 kcal)
11% of food
energy
18% of food
energy 6g 42g 400g 24g 18g 400g 400g 400g
30g 22.5g 24g 18g 30g 22.5g
0 ≤ 315 0.9 3.3 0.2 1.6 40 0.9 0.7 40 40 40
1.1 0.8 0.9 0.7 1.1 0.8
1 > 315 0.9 3.3 0.2 1.6 40 0.9 0.7
40 40 40
1.1 0.8 0.9 0.7 1.1 0.8
2 > 630 1.9 6.7 0.5 3.2 60 1.9 1.4
50 60 50
2.3 1.7 1.8 1.4 2.3 1.7
3 > 945 2.8 10 0.7 4.8 - 2.8 2.1
60 - 60
3.4 2.5 2.7 2.0 3.4 2.5
4 > 1260 3.7 13 0.9 6.4 - 3.7 2.8
70 - 70
4.5 3.4 3.6 2.7 4.5 3.4
5 > 1575 4.7 17 1.1 8.0 80 4.7 3.5
80 80 80
5.6 4.2 4.5 3.4 5.6 4.2
6 > 1890 5.6 20 1.4
- 90
5.4 4.05 6.8 5.1
7 > 2205 6.6 23 1.6
- 100
6.3 4.725 7.9 5.9
8 > 2520 7.5 27 1.8
100
7.2 5.4 9.0 6.8
9 > 2835 8.4 30 2.0
8.1 6.075 10.1 7.6
10 > 3150 9.4 33 2.3
9 6.75 11.3 8.4
uuuu Energy modelling (M2d (no energy scoring)) included removing the energy component (ie all score bands =0) vvvv Fruit, vegetables and nuts modelling, refer to Fruit, vegetables and nuts a-c wwww Fibre modelling refer to Fibre e- g xxxx Fibre modelling refer to Fibre e- g
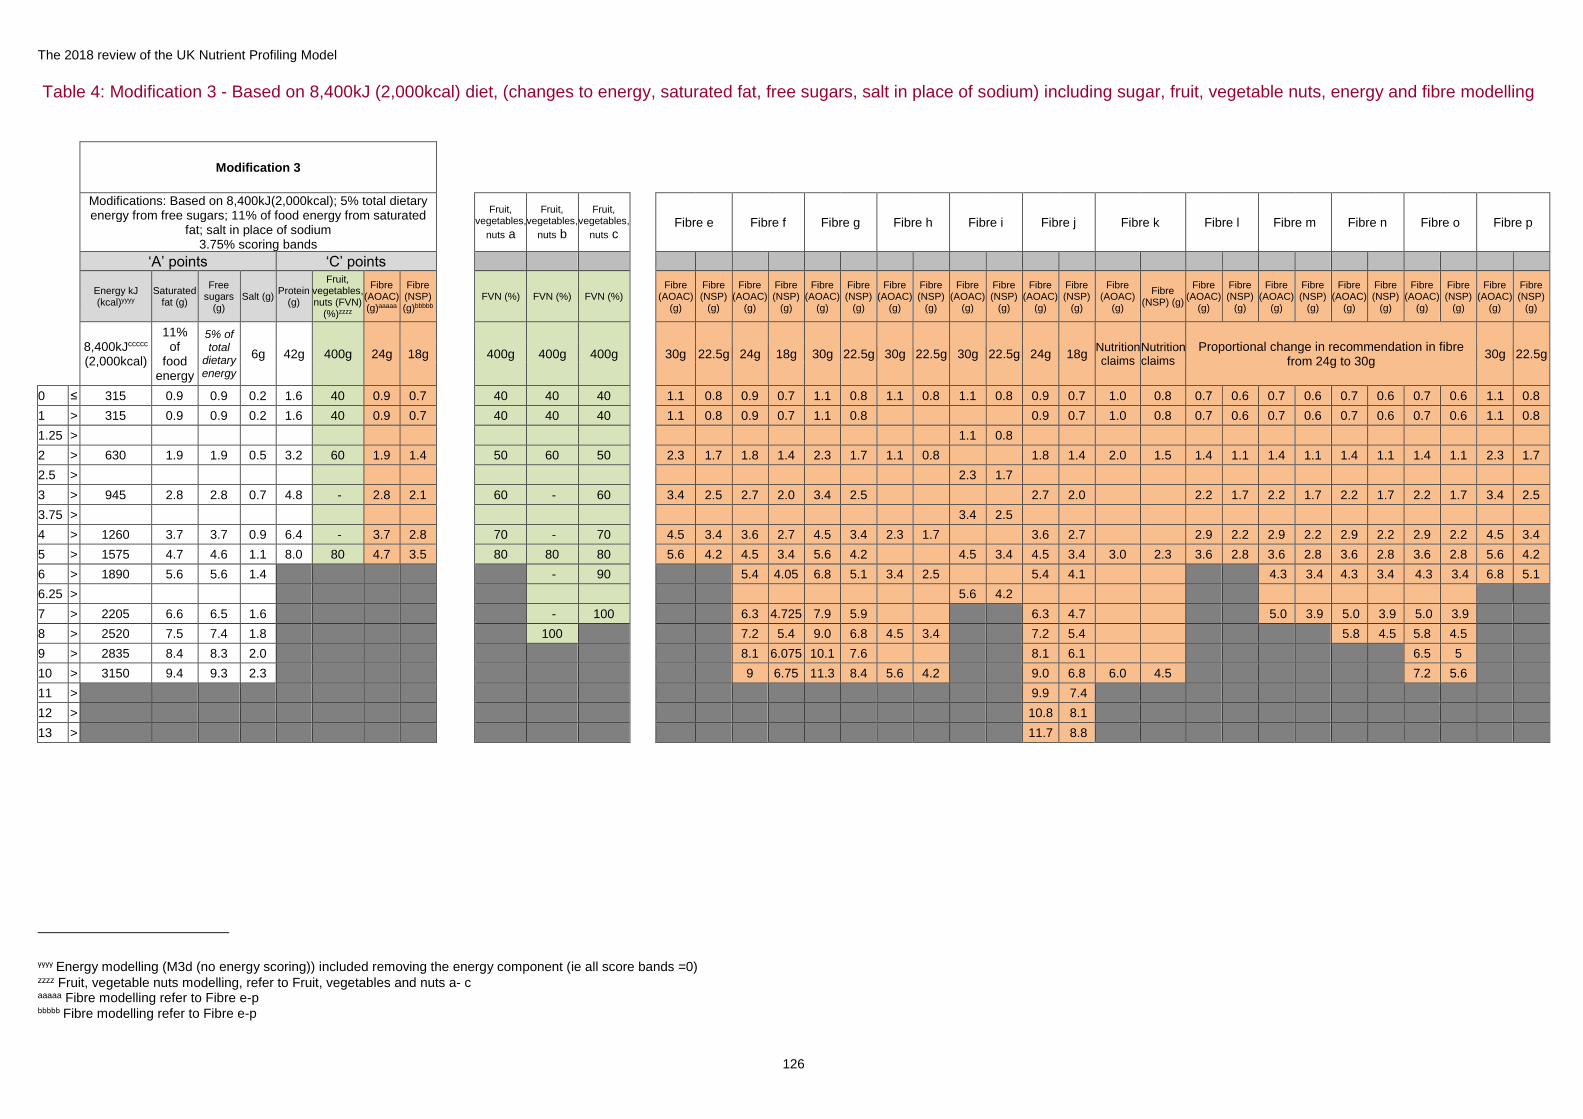
The 2018 review of the UK Nutrient Profiling Model
126
Table 4: Modification 3 - Based on 8,400kJ (2,000kcal) diet, (changes to energy, saturated fat, free sugars, salt in place of sodium) including sugar, fruit, vegetable nuts, energy and fibre modelling
Modification 3
Modifications: Based on 8,400kJ(2,000kcal); 5% total dietary energy from free sugars; 11% of food energy from saturated
fat; salt in place of sodium 3.75% scoring bands
Fruit, vegetables,
nuts a
Fruit, vegetables,
nuts b
Fruit, vegetables,
nuts c Fibre e Fibre f Fibre g Fibre h Fibre i Fibre j Fibre k Fibre l Fibre m Fibre n Fibre o Fibre p
‘A’ points ‘C’ points
Energy kJ (kcal)yyyy
Saturated fat (g)
Free sugars
(g) Salt (g)
Protein (g)
Fruit, vegetables, nuts (FVN)
(%)zzzz
Fibre (AOAC) (g)aaaaa
Fibre (NSP) (g)bbbbb
FVN (%) FVN (%) FVN (%)
Fibre (AOAC)
(g)
Fibre (NSP)
(g)
Fibre (AOAC)
(g)
Fibre (NSP)
(g)
Fibre (AOAC)
(g)
Fibre (NSP)
(g)
Fibre (AOAC)
(g)
Fibre (NSP)
(g)
Fibre (AOAC)
(g)
Fibre (NSP)
(g)
Fibre (AOAC)
(g)
Fibre (NSP)
(g)
Fibre (AOAC)
(g)
Fibre (NSP) (g)
Fibre (AOAC)
(g)
Fibre (NSP)
(g)
Fibre (AOAC)
(g)
Fibre (NSP)
(g)
Fibre (AOAC)
(g)
Fibre (NSP)
(g)
Fibre (AOAC)
(g)
Fibre (NSP)
(g)
Fibre (AOAC)
(g)
Fibre (NSP)
(g)
8,400kJccccc (2,000kcal)
11% of
food energy
5% of total
dietary energy
6g 42g 400g 24g 18g 400g 400g 400g
30g 22.5g 24g 18g 30g 22.5g 30g 22.5g 30g 22.5g 24g 18g Nutrition claims
Nutrition claims
Proportional change in recommendation in fibre from 24g to 30g
30g 22.5g
0 ≤ 315 0.9 0.9 0.2 1.6 40 0.9 0.7
40 40 40
1.1 0.8 0.9 0.7 1.1 0.8 1.1 0.8 1.1 0.8 0.9 0.7 1.0 0.8 0.7 0.6 0.7 0.6 0.7 0.6 0.7 0.6 1.1 0.8
1 > 315 0.9 0.9 0.2 1.6 40 0.9 0.7
40 40 40
1.1 0.8 0.9 0.7 1.1 0.8 0.9 0.7 1.0 0.8 0.7 0.6 0.7 0.6 0.7 0.6 0.7 0.6 1.1 0.8
1.25 >
1.1 0.8
2 > 630 1.9 1.9 0.5 3.2 60 1.9 1.4
50 60 50
2.3 1.7 1.8 1.4 2.3 1.7 1.1 0.8 1.8 1.4 2.0 1.5 1.4 1.1 1.4 1.1 1.4 1.1 1.4 1.1 2.3 1.7
2.5 >
2.3 1.7
3 > 945 2.8 2.8 0.7 4.8 - 2.8 2.1
60 - 60
3.4 2.5 2.7 2.0 3.4 2.5 2.7 2.0 2.2 1.7 2.2 1.7 2.2 1.7 2.2 1.7 3.4 2.5
3.75 >
3.4 2.5
4 > 1260 3.7 3.7 0.9 6.4 - 3.7 2.8
70 - 70
4.5 3.4 3.6 2.7 4.5 3.4 2.3 1.7 3.6 2.7 2.9 2.2 2.9 2.2 2.9 2.2 2.9 2.2 4.5 3.4
5 > 1575 4.7 4.6 1.1 8.0 80 4.7 3.5
80 80 80
5.6 4.2 4.5 3.4 5.6 4.2 4.5 3.4 4.5 3.4 3.0 2.3 3.6 2.8 3.6 2.8 3.6 2.8 3.6 2.8 5.6 4.2
6 > 1890 5.6 5.6 1.4
- 90
5.4 4.05 6.8 5.1 3.4 2.5 5.4 4.1 4.3 3.4 4.3 3.4 4.3 3.4 6.8 5.1
6.25 >
5.6 4.2
7 > 2205 6.6 6.5 1.6
- 100
6.3 4.725 7.9 5.9 6.3 4.7 5.0 3.9 5.0 3.9 5.0 3.9
8 > 2520 7.5 7.4 1.8
100
7.2 5.4 9.0 6.8 4.5 3.4 7.2 5.4 5.8 4.5 5.8 4.5
9 > 2835 8.4 8.3 2.0
8.1 6.075 10.1 7.6 8.1 6.1 6.5 5
10 > 3150 9.4 9.3 2.3
9 6.75 11.3 8.4 5.6 4.2 9.0 6.8 6.0 4.5 7.2 5.6
11 >
9.9 7.4
12 >
10.8 8.1
13 >
11.7 8.8
yyyy Energy modelling (M3d (no energy scoring)) included removing the energy component (ie all score bands =0) zzzz Fruit, vegetable nuts modelling, refer to Fruit, vegetables and nuts a- c aaaaa Fibre modelling refer to Fibre e-p bbbbb Fibre modelling refer to Fibre e-p
The 2018 review of the UK Nutrient Profiling Model
127
References
1 HM Government. Childhood obesity: A plan for action. 2016. Online. Available from: www.gov.uk/government/publications/childhood-obesity-a-plan-for-action (accessed 26/06/17) 2 Department of Health. The Nutrient Profiling Model. 2011. Online. Available from: www.gov.uk/government/publications/the-nutrient-profiling-model (accessed 24/11/17) 3 Department of Health. Nutrient Profiling Technical Guidance. 2011. Online. Available from: www.gov.uk/government/uploads/system/uploads/attachment_data/file/216094/dh_123492.pdf (accessed 26/06/17) 4 Office of Communication (Ofcom). Ofcom publishes final Statement on the television advertising of food and drink products to children. 2007. Online. Available from: www.ofcom.org.uk/about-ofcom/latest/media/media-releases/2007/ofcom-publishes-final-statement-on-the-television-advertising-of-food-and-drink-products-to-children (accessed 26/06/17) 5 Committee of Advertising Practice. New rules ban the advertising of high fat, salt and sugar food and drink products in children’s media. 2016. Online. Available from: www.asa.org.uk/news/new-rules-ban-the-advertising-of-high-fat-salt-and-sugar-food-and-drink-products-in-childrens-media.html (accessed 24/11/17) 6 Scientific Advisory Committee on Nutrition. Carbohydrates and Health. 2015. Online. Available from: www.gov.uk/government/publications/sacn-carbohydrates-and-health-report (accessed 28/11/17) 7 Department of Health. Dietary Reference Values for Food Energy and Nutrients for the United Kingdom. Report on Health and Social Subjects No 41. London: HMSO; 1991. 8 Public Health England. Government Dietary Recommendations: Government recommendations for energy and nutrients for males and females aged 1 – 18 years and 19+ years. 2016. Online. Available from: www.gov.uk/government/uploads/system/uploads/attachment_data/file/618167/government_dietary_recommendations.pdf (accessed 07/09/17) 9 Public Health England in association with the Welsh Government, Food Standards Scotland and the Food Standards Agency in Northern Ireland. The Eatwell Guide. 2016. Online. Available from: www.gov.uk/government/uploads/system/uploads/attachment_data/file/551502/Eatwell_Guide_booklet.pdf (accessed 28/11/17) 10Public Health England. Sugar Reduction: The evidence for action. 2015. Online. Available from: www.gov.uk/government/publications/sugar-reduction-from-evidence-into-action (accessed 26/06/17) 11 NHS Digital. National Child Measurement Programme - England, 2016-17. 2017. Online. Available from: https://digital.nhs.uk/catalogue/PUB30113 (accessed 28/11/17) 12 Gatineau M, Dent M. Obesity and Mental Health. Oxford: National Obesity Observatory; 2011. Online. Available from: //khub.net/c/document_library/get_file?uuid=18cd2173-408a-4322-b577-6aba3354b7ca&groupId=31798783 (accessed on 28/11/17) 13 Singer MR, Moore LL, Garrahie EJ, Ellison RC. The tracking of nutrient intake in young children: the Framingham Children's Study. Am J Public Health.1995;85:1673-1677. 10.2105/AJPH.85.12.1673
The 2018 review of the UK Nutrient Profiling Model
128
14 Bates B, Cox L, Nicholson S, Page P, Prentice A, Steer T, et al. National Diet and Nutrition Survey: Results from years 5 and 6 (combined) of the Rolling Programme (2012/2013 - 2013/2014). 2016. Online. Available from: www.gov.uk/government/statistics/ndns-results-from-years-5-and-6-combined (accessed 01/08/17) 15 Bates B, Lennox A, Prentice A, Bates C, Page P, Nicholson S, et al. National Diet and Nutrition Survey: Results from years 1, 2, 3 and 4 (combined) of the Rolling Programme (2008/2009 - 2011/2012). 2014. Online. Available from: www.gov.uk/government/statistics/national-diet-and-nutrition-survey-results-from-years-1-to-4-combined-of-the-rolling-programme-for-2008-and-2009-to-2011-and-2012 (accessed 01/08/17) 16 Rayner M, Scarborough P, Stockley L. Nutrient Profiles: Options for definitions for use in relation to food promotion and children’s diets. London: Food Standards Agency; 2004 17 Scarborough P, Boxer A, Rayner M, & Stockley L. Testing nutrient profile models using data from a survey of nutrition professionals. Public Health Nutrition. 2007;10(4): 337-345 18 Food Standards Agency. Board Paper - FSA 09/03/06 Review of the Agency’s Nutrient Profiling Model. 2009. Online. Available from: webarchive.nationalarchives.gov.uk/20120413225357/http://www.food.gov.uk/multimedia/pdfs/board/fsa090306v2.pdf (accessed 28/11/17) 19 Food Standards Australia New Zealand. Nutrient Profiling Scoring Calculator for Standard 1.2.7. 2012. Online. Available from: www.foodstandards.gov.au/industry/labelling/Pages/nutrientprofilingcalculator/Default.aspx 20 Department of Health Republic of South Africa. Nutrient Profiling Model. Online: Available from: www.health.gov.za/phocadownload/FoodInfor/NPC_NWU.html (accessed 01/02/18) 21 Australian Government Department of Health. Guide for Industry to the Health Star Rating Calculator (HSRC). Canberra: Australian Government Department of Health; 2016. Online. Available from: healthstarrating.gov.au/internet/healthstarrating/publishing.nsf/content/E380CCCA07E1E42FCA257DA500196044/$File/Guide%20for%20Industry%20to%20the%20HSR%20Calculator%20v5%20June%202016.pdf (accessed 28/11/17) 22 Julia C, Ducrot P, Péneau S, et al. Discriminating nutritional quality of foods using the 5-Color nutrition label in the French food market: consistency with nutritional recommendations. Nutrition Journal. 2015;14:100. doi:10.1186/s12937-015-0090-4 23 Houses of the Oireachtas. Joint Committee on Health and Children. Debate on the nutritional value of certain foods. Online. Available from: oireachtasdebates.oireachtas.ie/Debates%20Authoring/DebatesWebPack.nsf/committeetakes/HEJ2011101100004?opendocument (accessed 28/11/17) 24 World Health Organization (WHO) Regional Office for Europe. Nutrient Profile Model. Copenhagen; 2015.Online. Available from: www.euro.who.int/__data/assets/pdf_file/0005/270716/Nutrient-children_web-new.pdf?ua=1 25Public Health England. Timeline for review of the Nutrient Profiling Model (NPM). 2017. Online. Available from: app.box.com/v/NPMTimeline/file/97258159259 (accessed 28/11/17) 26 Public Health England. Nutrient Profiling Model Reference Group, Terms of Reference. 2016. Online. Available from: www.gov.uk/government/uploads/system/uploads/attachment_data/file/558213/NPM_reference_group_terms_of_reference.pdf (accessed 28/11/17) 27Public Health England. Nutrient Profiling Model Expert Group, Terms of Reference. 2016. Online. Available from:
The 2018 review of the UK Nutrient Profiling Model
129
www.gov.uk/government/uploads/system/uploads/attachment_data/file/558212/NPM_expert_group_terms_of_reference.pdf (accessed 28/11/17)) 28Public Health England. Review of the Nutrient Profiling Model. Agenda, action points and minutes of the Nutrient Profiling Model Reference and Expert Group. 2016. Online. Available from: www.gov.uk/government/collections/review-of-the-nutrient-profiling-model (accessed 28/11/17) 29 Scientific Advisory Committee on Nutrition. Update on trans fatty acids and health – position statement by the Scientific Advisory Committee on Nutrition. 2007. Online. Available from: www.gov.uk/government/collections/sacn-reports-and-position-statements (accessed 28/11/17) 30 Public Health England. (2015) Composition of foods integrated dataset. Online. Available from: www.gov.uk/government/publications/composition-of-foods-integrated-datasetcofid (accessed 28/11/17) 31Department of Health, the Food Standards Agency and devolved administrations in Scotland, Northern Ireland and Wales. Guide to creating a front of pack (FoP) nutrition label for pre-packed products sold through retail outlets. 2016. Online. Available from: www.gov.uk/government/uploads/system/uploads/attachment_data/file/566251/FoP_Nutrition_labelling_UK_guidance.pdf (accessed 28/11/17) 32 HM Revenue and Customs. Policy paper Soft Drinks Industry Levy. 2016. Online. Available from: www.gov.uk/government/publications/soft-drinks-industry-levy/soft-drinks-industry-levy (accessed 28/11/17) 33 European Parliament and Council. Regulation (EC) No 1924/2006 on nutrition and health claims made on foods. 2006. Online. Available from: http://eur-lex.europa.eu/legal-content/en/ALL/?uri=CELEX:32006R1924 (accessed 28/11/17) 34 Public Health England. From Plate to Guide: What, why and how for the eatwell model. 2016. Online. Available from: www.gov.uk/government/uploads/system/uploads/attachment_data/file/579388/eatwell_model_guide_report.pdf (accessed 28/11/17) 35 Scientific Advisory Committee on Nutrition (SACN). Dietary Reference Values for Energy. London: The Stationery Office; 2011 36 Public Health England. Healthier and more sustainable catering: Nutrition principles. 2017. Online. Available from: www.gov.uk/government/uploads/system/uploads/attachment_data/file/648744/healthier_and_more_sustainable_nutrition_principles.pdf (accessed 28/11/17) 37 Scientific Advisory Committee on Nutrition. Salt and Health. 2003. Online. Available from: www.gov.uk/government/publications/sacn-salt-and-health-report (accessed 28/11/17) 38 European Parliament and Council. Regulation (EU) No 1169/2011 of the European Parliament and of the council Provision of food Information to Consumers (FIC). 2011. Online. Available from: eur-lex.europa.eu/legal-content/en/ALL/?uri=CELEX:32011R1169 (accessed 28/11/17) 39 World Health Organization. Diet, nutrition and the prevention of chronic diseases. 2003. Online. Available from: whqlibdoc.who.int/trs/WHO_TRS_916.pdf (accessed 28/11/17) and World Health Organization. Diet, nutrition and the prevention of chronic diseases. 1990. Online. Available from: www.who.int/nutrition/publications/obesity/WHO_TRS_797/en/index.html (accessed 28/11/17) 40 National Health Service (NHS). 5 A Day. 2011. Online. Available from: www.nhs.uk/LiveWell/5ADAY/Pages/5ADAYhome.aspx (accessed 28/11/17)
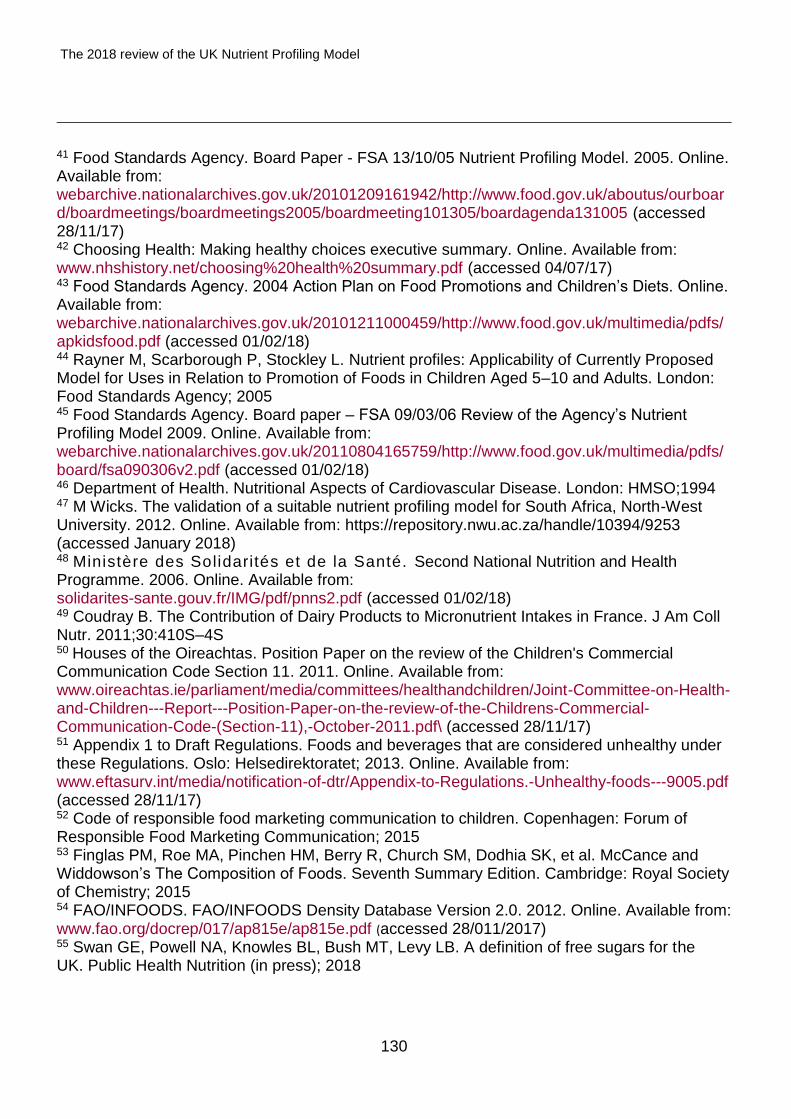
The 2018 review of the UK Nutrient Profiling Model
130
41 Food Standards Agency. Board Paper - FSA 13/10/05 Nutrient Profiling Model. 2005. Online. Available from: webarchive.nationalarchives.gov.uk/20101209161942/http://www.food.gov.uk/aboutus/ourboard/boardmeetings/boardmeetings2005/boardmeeting101305/boardagenda131005 (accessed 28/11/17) 42 Choosing Health: Making healthy choices executive summary. Online. Available from: www.nhshistory.net/choosing%20health%20summary.pdf (accessed 04/07/17) 43 Food Standards Agency. 2004 Action Plan on Food Promotions and Children’s Diets. Online. Available from: webarchive.nationalarchives.gov.uk/20101211000459/http://www.food.gov.uk/multimedia/pdfs/apkidsfood.pdf (accessed 01/02/18) 44 Rayner M, Scarborough P, Stockley L. Nutrient profiles: Applicability of Currently Proposed Model for Uses in Relation to Promotion of Foods in Children Aged 5–10 and Adults. London: Food Standards Agency; 2005 45 Food Standards Agency. Board paper – FSA 09/03/06 Review of the Agency’s Nutrient Profiling Model 2009. Online. Available from: webarchive.nationalarchives.gov.uk/20110804165759/http://www.food.gov.uk/multimedia/pdfs/board/fsa090306v2.pdf (accessed 01/02/18) 46 Department of Health. Nutritional Aspects of Cardiovascular Disease. London: HMSO;1994 47 M Wicks. The validation of a suitable nutrient profiling model for South Africa, North-West University. 2012. Online. Available from: https://repository.nwu.ac.za/handle/10394/9253 (accessed January 2018) 48 Ministère des Solidarités et de la Santé. Second National Nutrition and Health Programme. 2006. Online. Available from: solidarites-sante.gouv.fr/IMG/pdf/pnns2.pdf (accessed 01/02/18) 49 Coudray B. The Contribution of Dairy Products to Micronutrient Intakes in France. J Am Coll Nutr. 2011;30:410S–4S 50 Houses of the Oireachtas. Position Paper on the review of the Children's Commercial Communication Code Section 11. 2011. Online. Available from: www.oireachtas.ie/parliament/media/committees/healthandchildren/Joint-Committee-on-Health-and-Children---Report---Position-Paper-on-the-review-of-the-Childrens-Commercial-Communication-Code-(Section-11),-October-2011.pdf\ (accessed 28/11/17) 51 Appendix 1 to Draft Regulations. Foods and beverages that are considered unhealthy under these Regulations. Oslo: Helsedirektoratet; 2013. Online. Available from: www.eftasurv.int/media/notification-of-dtr/Appendix-to-Regulations.-Unhealthy-foods---9005.pdf (accessed 28/11/17) 52 Code of responsible food marketing communication to children. Copenhagen: Forum of Responsible Food Marketing Communication; 2015 53 Finglas PM, Roe MA, Pinchen HM, Berry R, Church SM, Dodhia SK, et al. McCance and Widdowson’s The Composition of Foods. Seventh Summary Edition. Cambridge: Royal Society of Chemistry; 2015 54 FAO/INFOODS. FAO/INFOODS Density Database Version 2.0. 2012. Online. Available from: www.fao.org/docrep/017/ap815e/ap815e.pdf (accessed 28/011/2017) 55 Swan GE, Powell NA, Knowles BL, Bush MT, Levy LB. A definition of free sugars for the UK. Public Health Nutrition (in press); 2018