Embed Size (px)
Citation preview
FSA STUDY ON BULK CARRIER SAFETY CONDUCTED BY JAPAN MSC75/5/2 ANNEX 5
Page 1
ANNEX 5 Risk Analysis 1 Method of Risk Analysis
In order to obtain statistical and quantified risk data, risk analysis was conducted through the following process:
1) Investigate bulk carrier world fleet statistics by year and each ship-size; 2) Analyze historical data such as LMIS casualty database; 3) Establish risk contribution diagrams such as Event Tree, Fault Tree, etc., based upon the casualty
data; and 4) Estimate and evaluate risk of bulk carrier by each accident category for each ship size.
Taking the background information and the result of hazard identification meetings into consideration,
accidents under concern are segmented into the following 4 accident scenario groups: Scenario-1: Progressive flooding after the following initial failures/flooding;
- Scenario-1-1: Flooding due to structural failure such as side shell failure; - Scenario-1-2: Flooding into Fore Peak from failure of deck fittings; (and) - Scenario-1-3: Flooding due to hatch cover failure or its securing failure
Scenario-2: Structural failure without water ingress in heavy weather; Scenario-3: Structural failure during loading operation; and Scenario-4: Accident due to cargo shift at sea.
In analyzing the historical casualty data, they were grouped into 4 groups by ship-size: i.e. Cape-size bulk
carrier, Panamax bulk carrier, Handy-size bulk carrier and Small-handy bulk carrier. The classification of each bulk carrier group is referred to Table 3.3.1and Table 3.3.2 in MSC75/5/2 ANNEX. Furthermore, the risks of bulk carrier were calculated in the following 2 stages of risk analysis: 1) Assuming that recently introduced measures such as ESP, SOLAS Chapter XII, etc. have little
effected the past casualty data, the risk level, before these measures were introduced, was estimated at the 1st stage of analysis.
2) Examining the potential effect of these measures to each accident case, the historical data was simulated, as if sufficient years have passed after these measures came into effect, and imaginary risk levels, supposed to be improved by these measures, were estimated.
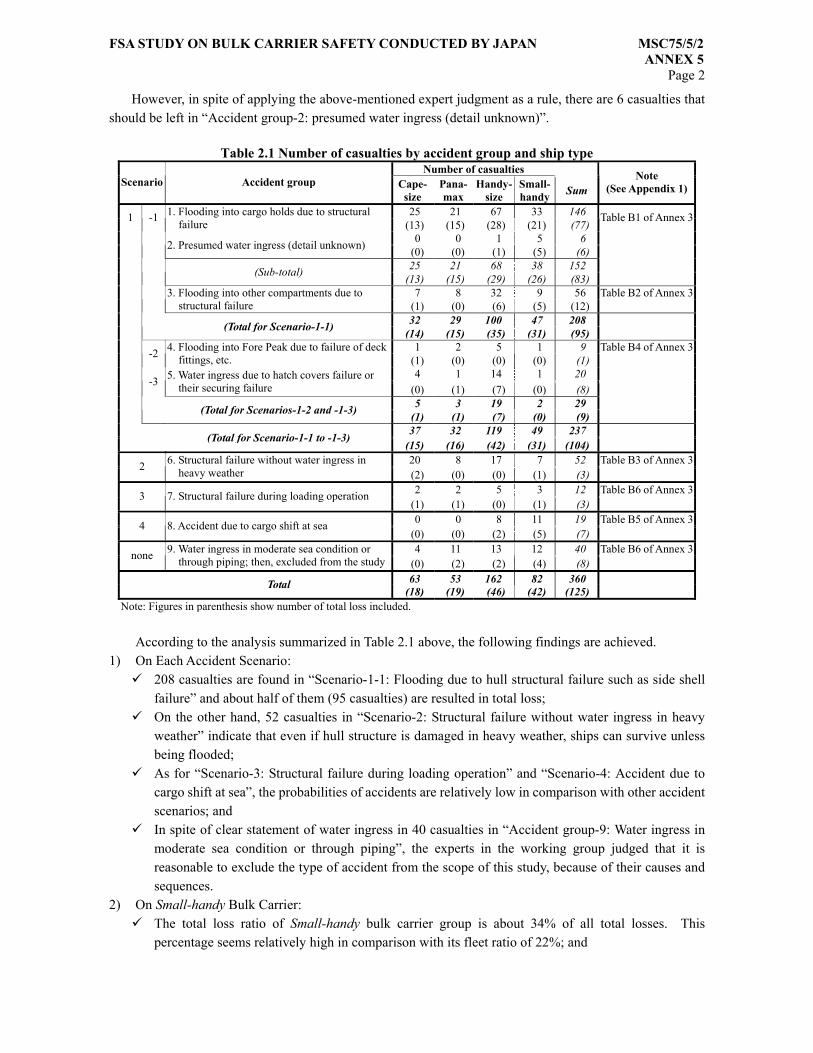
2 Estimation of Risk Levels before the Introduction of these Risk Control Measures 2.1 Results of Historical Data Analysis 2.1.1 Investigation of Casualties by Accident Scenario and Ship Type Table 2.1 summarizes the number of casualties by accident group and ship type. The lists of casualties in each accident groups are attached as Appendix 1. In the historical data, there are some total loss casualties, which are not clearly specified with any involvement of flooding or water ingress. However, the experts in the working group judged some of them to group into “Accident group-1: hold flooding due to structural failure”, taking the following factors into consideration.
Age of ship at the time of casualty Density of the cargo which was loaded at the time of casualty
FSA STUDY ON BULK CARRIER SAFETY CONDUCTED BY JAPAN MSC75/5/2 ANNEX 5
Page 2
However, in spite of applying the above-mentioned expert judgment as a rule, there are 6 casualties that should be left in “Accident group-2: presumed water ingress (detail unknown)”.
According to the analysis summarized in Table 2.1 above, the following findings are achieved. 1) On Each Accident Scenario:
208 casualties are found in “Scenario-1-1: Flooding due to hull structural failure such as side shell failure” and about half of them (95 casualties) are resulted in total loss; On the other hand, 52 casualties in “Scenario-2: Structural failure without water ingress in heavy
weather” indicate that even if hull structure is damaged in heavy weather, ships can survive unless being flooded; As for “Scenario-3: Structural failure during loading operation” and “Scenario-4: Accident due to
cargo shift at sea”, the probabilities of accidents are relatively low in comparison with other accident scenarios; and In spite of clear statement of water ingress in 40 casualties in “Accident group-9: Water ingress in
moderate sea condition or through piping”, the experts in the working group judged that it is reasonable to exclude the type of accident from the scope of this study, because of their causes and sequences.
2) On Small-handy Bulk Carrier: The total loss ratio of Small-handy bulk carrier group is about 34% of all total losses. This
percentage seems relatively high in comparison with its fleet ratio of 22%; and
Table 2.1 Number of casualties by accident group and ship type Number of casualties
Scenario Accident group Cape-size
Pana- max
Handy-size
Small-handy Sum
Note (See Appendix 1)
25 21 67 33 146 1 -1 1. Flooding into cargo holds due to structural failure (13) (15) (28) (21) (77)
Table B1 of Annex 3
0 0 1 5 6 2. Presumed water ingress (detail unknown) (0) (0) (1) (5) (6) 25 21 68 38 152 (Sub-total) (13) (15) (29) (26) (83) 7 8 32 9 56 Table B2 of Annex 3 3. Flooding into other compartments due to
structural failure (1) (0) (6) (5) (12) 32 29 100 47 208 (Total for Scenario-1-1) (14) (15) (35) (31) (95) 1 2 5 1 9 Table B4 of Annex 3 -2 4. Flooding into Fore Peak due to failure of deck
fittings, etc. (1) (0) (0) (0) (1) 4 1 14 1 20
-3 5. Water ingress due to hatch covers failure or their securing failure (0) (1) (7) (0) (8)
5 3 19 2 29 (Total for Scenarios-1-2 and -1-3) (1) (1) (7) (0) (9) 37 32 119 49 237 (Total for Scenario-1-1 to -1-3)
(15) (16) (42) (31) (104) 20 8 17 7 52 Table B3 of Annex 32 6. Structural failure without water ingress in
heavy weather (2) (0) (0) (1) (3) 2 2 5 3 12 Table B6 of Annex 33 7. Structural failure during loading operation
(1) (1) (0) (1) (3) 0 0 8 11 19 Table B5 of Annex 34 8. Accident due to cargo shift at sea
(0) (0) (2) (5) (7) 4 11 13 12 40 Table B6 of Annex 3none 9. Water ingress in moderate sea condition or
through piping; then, excluded from the study (0) (2) (2) (4) (8) 63 53 162 82 360 Total
(18) (19) (46) (42) (125) Note: Figures in parenthesis show number of total loss included.
FSA STUDY ON BULK CARRIER SAFETY CONDUCTED BY JAPAN MSC75/5/2 ANNEX 5
Page 3
The Small-handy group result in high total loss ratio in every scenario except “Scenario-2: Structural failure without water ingress in heavy weather”, which resulted in no total loss casualty.
3) On Cape-size Bulk Carrier: The total loss ratio of Cape-size bulk carrier group is about 14% of all total losses. This percentage seems
relatively high in comparison with its fleet ratio of 8.8%; and Although the casualty ratio on “Scenario-2: Structural failure without water ingress in heavy weather” of
Cape-size bulk carrier group also shows high figure of about 38% of all casualties, only 2 total loss cases (eventual broken up and scuttle) were reported.
Even excluding “Accident groups –2: Presumed water ingress (detail unknown)” from “Scenario-1”, total 231 casualties are relating to eventual flooding. An estimate of the frequency of casualty hence is given as:
31057.2900,89
231 −⋅===mgf annual frequency of casualty including total loss involving water
ingress With adding 6 casualties in “Accident group-2: Presumed water ingress (detail unknown)”, 237 casualties including total loss were found as upper side frequency. An estimate of the upper side frequency of casualty hence is given as:
31064.2900,89
237 −⋅===mgfupper
annual frequency of casualty including total loss involving water
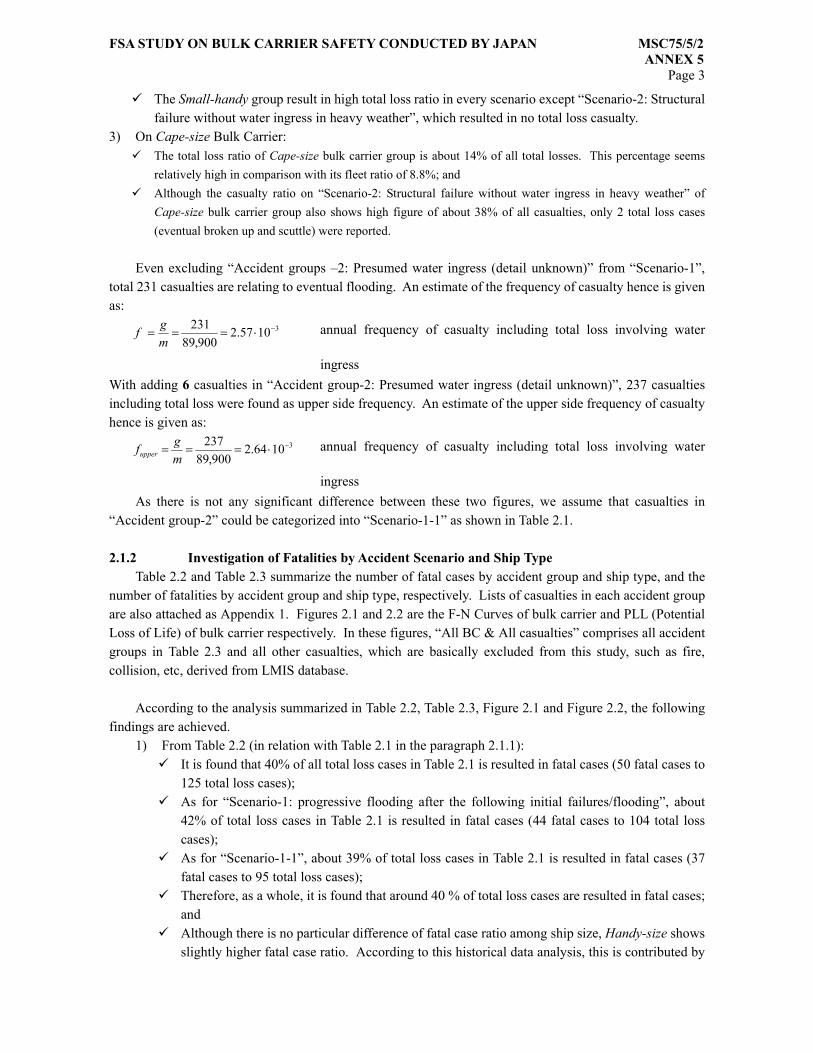
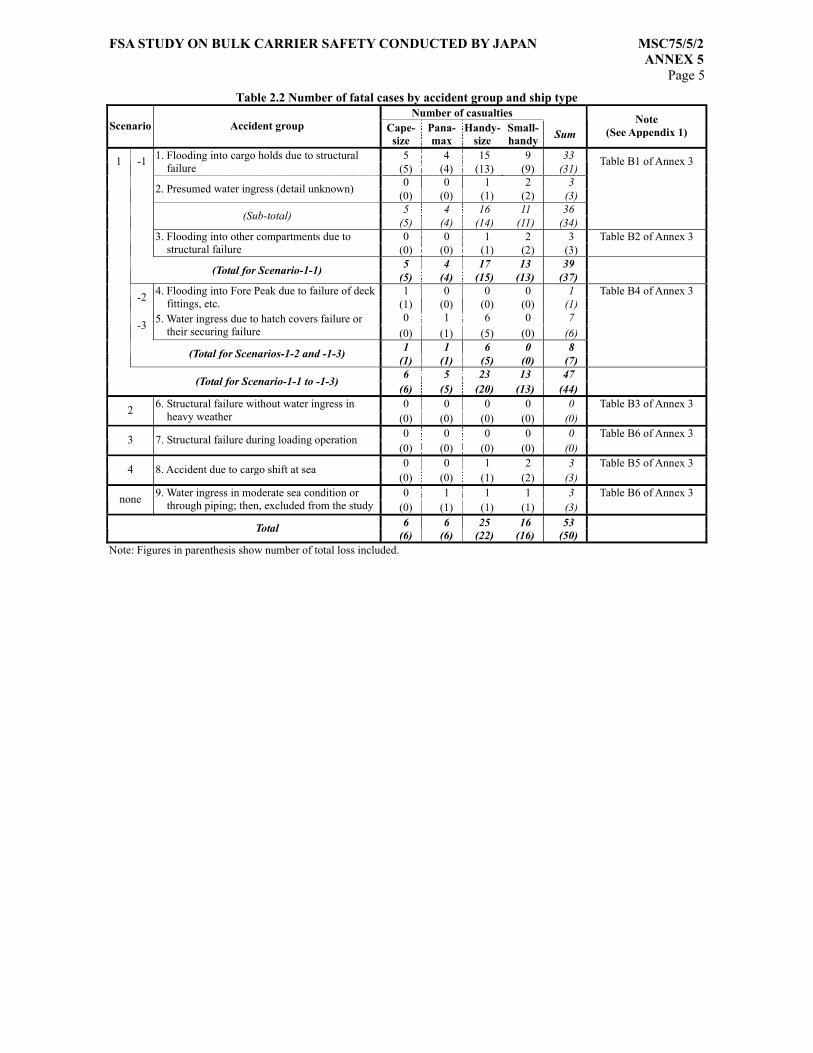
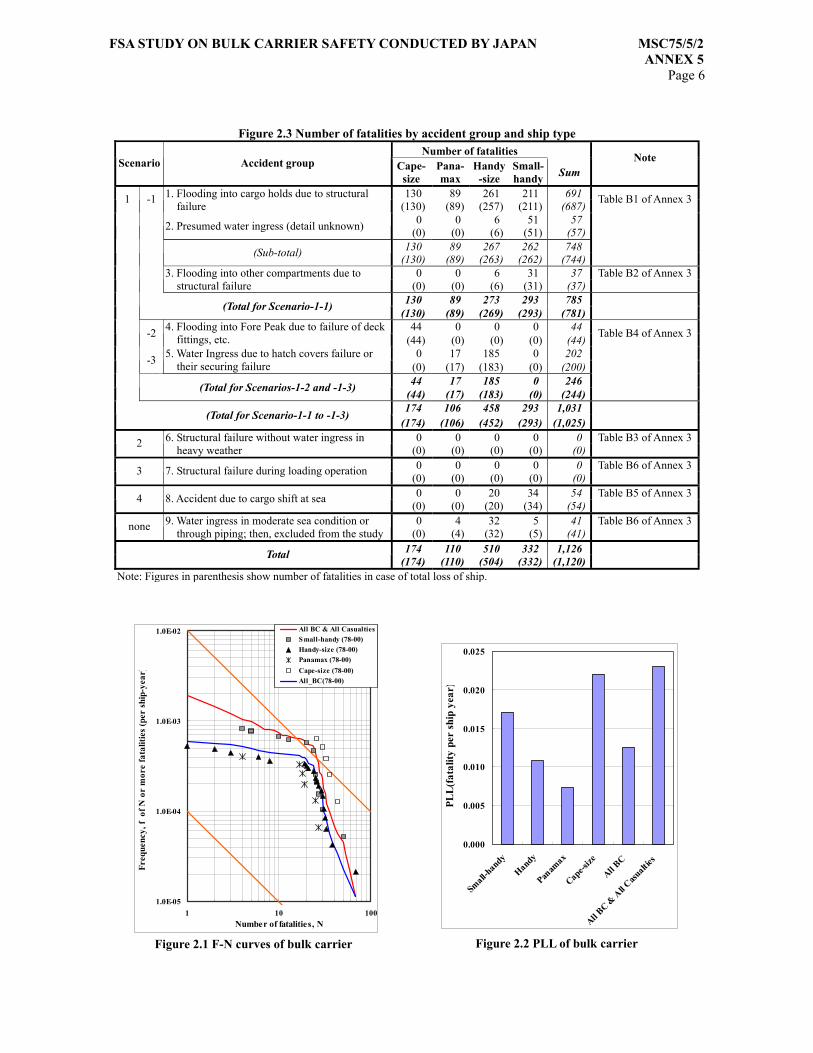
ingress As there is not any significant difference between these two figures, we assume that casualties in “Accident group-2” could be categorized into “Scenario-1-1” as shown in Table 2.1. 2.1.2 Investigation of Fatalities by Accident Scenario and Ship Type Table 2.2 and Table 2.3 summarize the number of fatal cases by accident group and ship type, and the number of fatalities by accident group and ship type, respectively. Lists of casualties in each accident group are also attached as Appendix 1. Figures 2.1 and 2.2 are the F-N Curves of bulk carrier and PLL (Potential Loss of Life) of bulk carrier respectively. In these figures, “All BC & All casualties” comprises all accident groups in Table 2.3 and all other casualties, which are basically excluded from this study, such as fire, collision, etc, derived from LMIS database. According to the analysis summarized in Table 2.2, Table 2.3, Figure 2.1 and Figure 2.2, the following findings are achieved. 1) From Table 2.2 (in relation with Table 2.1 in the paragraph 2.1.1):
It is found that 40% of all total loss cases in Table 2.1 is resulted in fatal cases (50 fatal cases to 125 total loss cases); As for “Scenario-1: progressive flooding after the following initial failures/flooding”, about
42% of total loss cases in Table 2.1 is resulted in fatal cases (44 fatal cases to 104 total loss cases); As for “Scenario-1-1”, about 39% of total loss cases in Table 2.1 is resulted in fatal cases (37
fatal cases to 95 total loss cases); Therefore, as a whole, it is found that around 40 % of total loss cases are resulted in fatal cases;
and Although there is no particular difference of fatal case ratio among ship size, Handy-size shows
slightly higher fatal case ratio. According to this historical data analysis, this is contributed by
FSA STUDY ON BULK CARRIER SAFETY CONDUCTED BY JAPAN MSC75/5/2 ANNEX 5
Page 4
the high fatal case ratio in “Scenario 1-3: water ingress due to hatch covers failure or their securing failure” (5 fatal loss cases to 7 total loss cases).
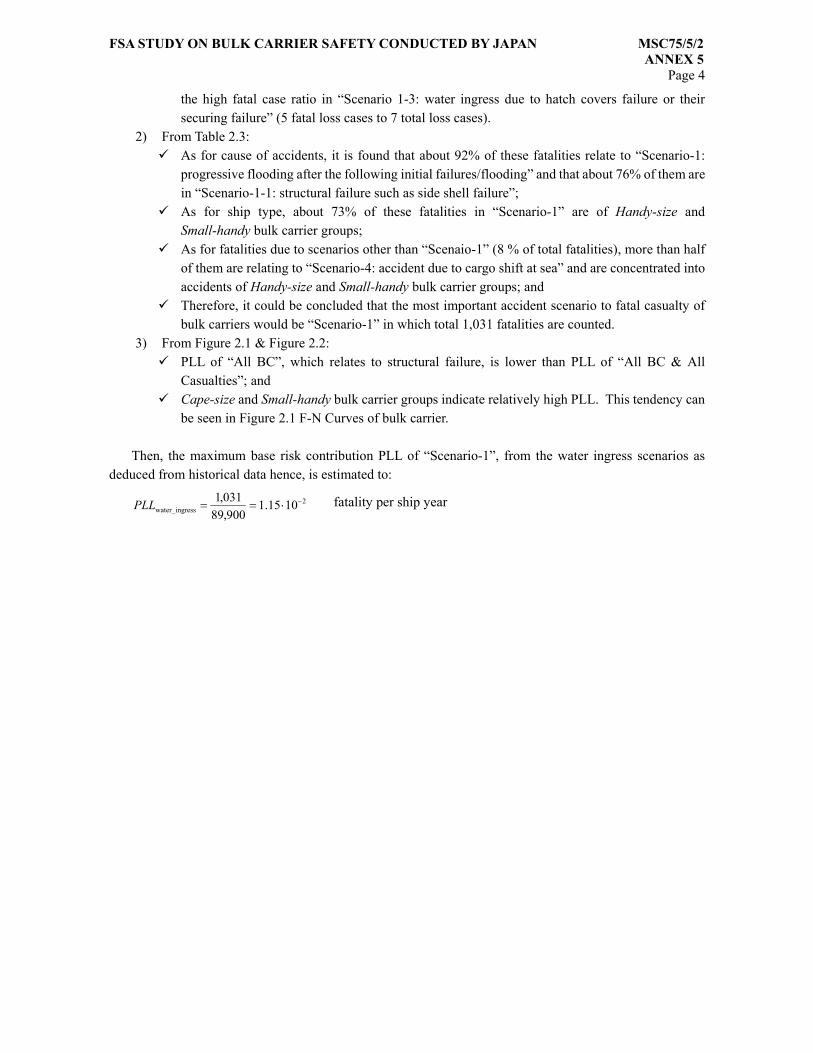
2) From Table 2.3: As for cause of accidents, it is found that about 92% of these fatalities relate to “Scenario-1:
progressive flooding after the following initial failures/flooding” and that about 76% of them are in “Scenario-1-1: structural failure such as side shell failure”; As for ship type, about 73% of these fatalities in “Scenario-1” are of Handy-size and
Small-handy bulk carrier groups; As for fatalities due to scenarios other than “Scenaio-1” (8 % of total fatalities), more than half
of them are relating to “Scenario-4: accident due to cargo shift at sea” and are concentrated into accidents of Handy-size and Small-handy bulk carrier groups; and Therefore, it could be concluded that the most important accident scenario to fatal casualty of
bulk carriers would be “Scenario-1” in which total 1,031 fatalities are counted. 3) From Figure 2.1 & Figure 2.2:
PLL of “All BC”, which relates to structural failure, is lower than PLL of “All BC & All Casualties”; and Cape-size and Small-handy bulk carrier groups indicate relatively high PLL. This tendency can
be seen in Figure 2.1 F-N Curves of bulk carrier.
Then, the maximum base risk contribution PLL of “Scenario-1”, from the water ingress scenarios as deduced from historical data hence, is estimated to:
2esswater_ingr 1015.1
900,89031,1 −⋅==PLL fatality per ship year
FSA STUDY ON BULK CARRIER SAFETY CONDUCTED BY JAPAN MSC75/5/2 ANNEX 5
Page 5 Table 2.2 Number of fatal cases by accident group and ship type
Number of casualties Scenario Accident group Cape-
size Pana- max
Handy-size
Small-handy Sum
Note (See Appendix 1)
5 4 15 9 33 1 -1 1. Flooding into cargo holds due to structural failure (5) (4) (13) (9) (31)
Table B1 of Annex 3
0 0 1 2 3 2. Presumed water ingress (detail unknown) (0) (0) (1) (2) (3) 5 4 16 11 36 (Sub-total) (5) (4) (14) (11) (34) 0 0 1 2 3 Table B2 of Annex 3 3. Flooding into other compartments due to
structural failure (0) (0) (1) (2) (3) 5 4 17 13 39 (Total for Scenario-1-1) (5) (4) (15) (13) (37) 1 0 0 0 1 Table B4 of Annex 3 -2 4. Flooding into Fore Peak due to failure of deck
fittings, etc. (1) (0) (0) (0) (1) 0 1 6 0 7
-3 5. Water ingress due to hatch covers failure or their securing failure (0) (1) (5) (0) (6)
1 1 6 0 8 (Total for Scenarios-1-2 and -1-3) (1) (1) (5) (0) (7) 6 5 23 13 47 (Total for Scenario-1-1 to -1-3)
(6) (5) (20) (13) (44) 0 0 0 0 0 Table B3 of Annex 3 2 6. Structural failure without water ingress in
heavy weather (0) (0) (0) (0) (0) 0 0 0 0 0 Table B6 of Annex 3 3 7. Structural failure during loading operation
(0) (0) (0) (0) (0) 0 0 1 2 3 Table B5 of Annex 3 4 8. Accident due to cargo shift at sea
(0) (0) (1) (2) (3) 0 1 1 1 3 Table B6 of Annex 3 none 9. Water ingress in moderate sea condition or
through piping; then, excluded from the study (0) (1) (1) (1) (3) 6 6 25 16 53 Total (6) (6) (22) (16) (50)
Note: Figures in parenthesis show number of total loss included.
FSA STUDY ON BULK CARRIER SAFETY CONDUCTED BY JAPAN MSC75/5/2 ANNEX 5
Page 6
Figure 2.3 Number of fatalities by accident group and ship type Number of fatalities
Scenario Accident group Cape-size
Pana-max
Handy-size
Small-handy Sum
Note
130 89 261 211 691 1 -1 1. Flooding into cargo holds due to structural failure (130) (89) (257) (211) (687) Table B1 of Annex 3
0 0 6 51 57 2. Presumed water ingress (detail unknown) (0) (0) (6) (51) (57) 130 89 267 262 748 (Sub-total) (130) (89) (263) (262) (744)
0 0 6 31 37 Table B2 of Annex 3 3. Flooding into other compartments due to structural failure (0) (0) (6) (31) (37)
130 89 273 293 785 (Total for Scenario-1-1) (130) (89) (269) (293) (781) 44 0 0 0 44 -2 4. Flooding into Fore Peak due to failure of deck
fittings, etc. (44) (0) (0) (0) (44) Table B4 of Annex 3
0 17 185 0 202 -3 5. Water Ingress due to hatch covers failure or their securing failure (0) (17) (183) (0) (200)
44 17 185 0 246 (Total for Scenarios-1-2 and -1-3) (44) (17) (183) (0) (244) 174 106 458 293 1,031 (Total for Scenario-1-1 to -1-3)
(174) (106) (452) (293) (1,025) 0 0 0 0 0 Table B3 of Annex 3 2 6. Structural failure without water ingress in
heavy weather (0) (0) (0) (0) (0) 0 0 0 0 0 Table B6 of Annex 3 3 7. Structural failure during loading operation
(0) (0) (0) (0) (0) 0 0 20 34 54 Table B5 of Annex 3 4 8. Accident due to cargo shift at sea
(0) (0) (20) (34) (54) 0 4 32 5 41 Table B6 of Annex 3 none 9. Water ingress in moderate sea condition or
through piping; then, excluded from the study (0) (4) (32) (5) (41) 174 110 510 332 1,126 Total (174) (110) (504) (332) (1,120)
Note: Figures in parenthesis show number of fatalities in case of total loss of ship.
Figure 2.1 F-N curves of bulk carrier
Figure 2.2 PLL of bulk carrier
1.0E-05
1.0E-04
1.0E-03
1.0E-02
1 10 100Number of fatalities, N
Freq
uenc
y, f
of N
or
mor
e fa
talit
ies
(per
shi
p-ye
ar)
All BC & All CasualtiesSmall-handy (78-00)Handy-size (78-00)Panamax (78-00)Cape-size (78-00)All_BC(78-00)
0.000
0.005
0.010
0.015
0.020
0.025
Small-h
andyHandy
Panam
ax
Cape-size
All BC
All BC &
All C
asualtie
s
PLL
(fat
ality
per
shi
p ye
ar)
FSA STUDY ON BULK CARRIER SAFETY CONDUCTED BY JAPAN MSC75/5/2 ANNEX 5
Page 7
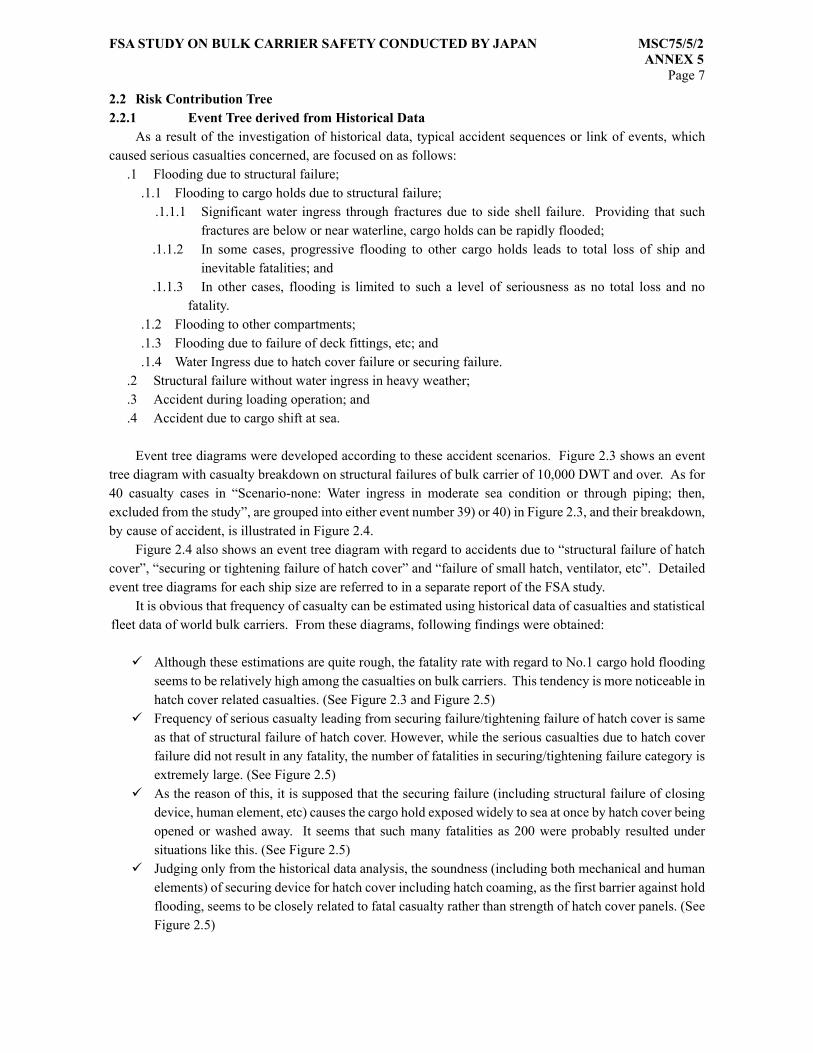
2.2 Risk Contribution Tree 2.2.1 Event Tree derived from Historical Data As a result of the investigation of historical data, typical accident sequences or link of events, which caused serious casualties concerned, are focused on as follows:
.1 Flooding due to structural failure; .1.1 Flooding to cargo holds due to structural failure;
.1.1.1 Significant water ingress through fractures due to side shell failure. Providing that such fractures are below or near waterline, cargo holds can be rapidly flooded;
.1.1.2 In some cases, progressive flooding to other cargo holds leads to total loss of ship and inevitable fatalities; and
.1.1.3 In other cases, flooding is limited to such a level of seriousness as no total loss and no fatality.
.1.2 Flooding to other compartments;
.1.3 Flooding due to failure of deck fittings, etc; and
.1.4 Water Ingress due to hatch cover failure or securing failure. .2 Structural failure without water ingress in heavy weather; .3 Accident during loading operation; and .4 Accident due to cargo shift at sea.
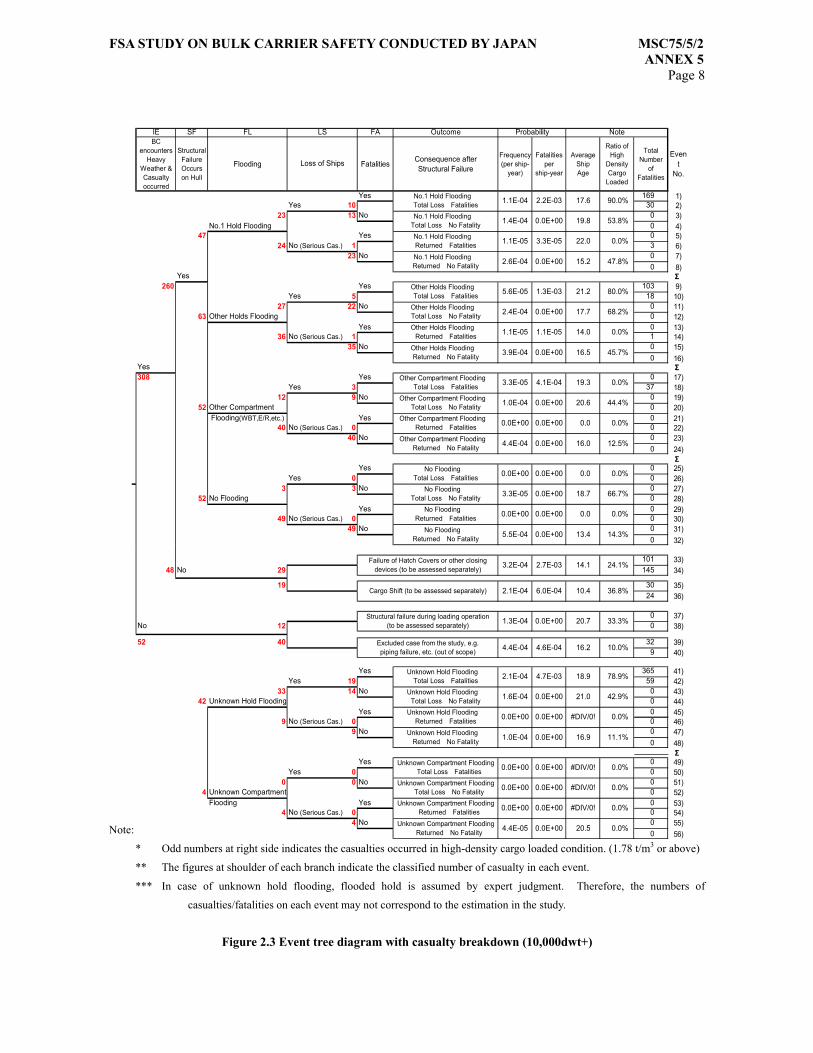
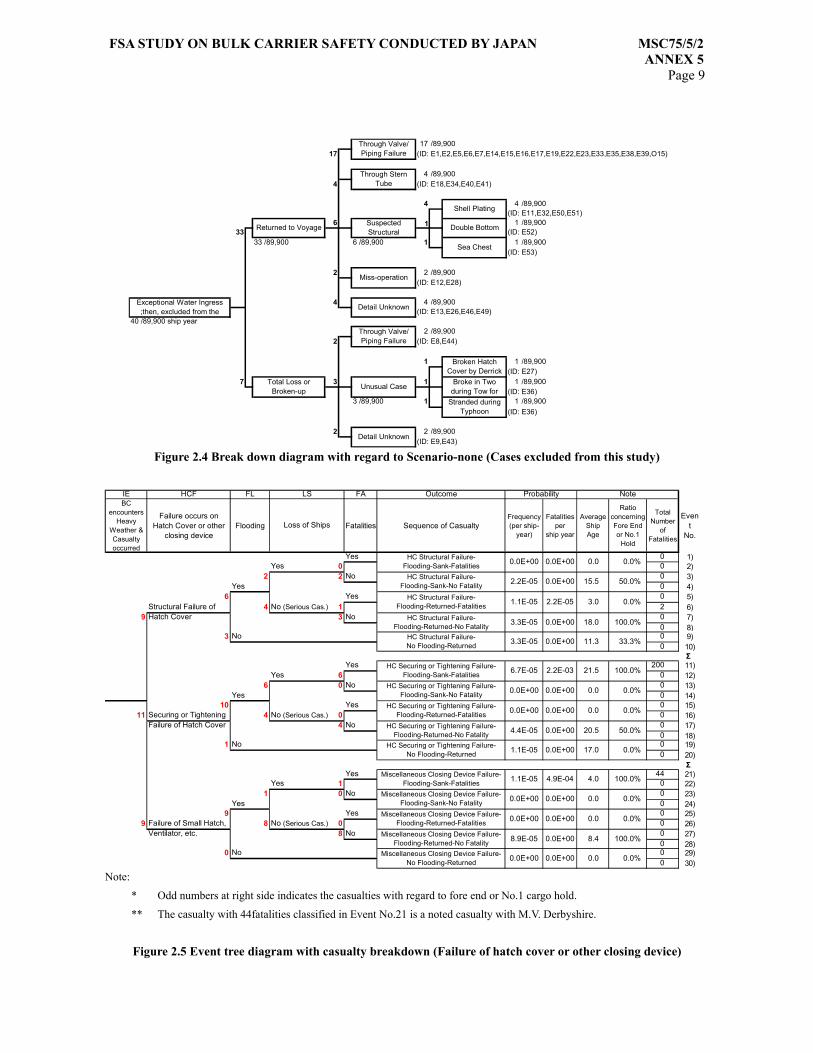
Event tree diagrams were developed according to these accident scenarios. Figure 2.3 shows an event tree diagram with casualty breakdown on structural failures of bulk carrier of 10,000 DWT and over. As for 40 casualty cases in “Scenario-none: Water ingress in moderate sea condition or through piping; then, excluded from the study”, are grouped into either event number 39) or 40) in Figure 2.3, and their breakdown, by cause of accident, is illustrated in Figure 2.4. Figure 2.4 also shows an event tree diagram with regard to accidents due to “structural failure of hatch cover”, “securing or tightening failure of hatch cover” and “failure of small hatch, ventilator, etc”. Detailed event tree diagrams for each ship size are referred to in a separate report of the FSA study. It is obvious that frequency of casualty can be estimated using historical data of casualties and statistical fleet data of world bulk carriers. From these diagrams, following findings were obtained:
Although these estimations are quite rough, the fatality rate with regard to No.1 cargo hold flooding seems to be relatively high among the casualties on bulk carriers. This tendency is more noticeable in hatch cover related casualties. (See Figure 2.3 and Figure 2.5) Frequency of serious casualty leading from securing failure/tightening failure of hatch cover is same
as that of structural failure of hatch cover. However, while the serious casualties due to hatch cover failure did not result in any fatality, the number of fatalities in securing/tightening failure category is extremely large. (See Figure 2.5) As the reason of this, it is supposed that the securing failure (including structural failure of closing
device, human element, etc) causes the cargo hold exposed widely to sea at once by hatch cover being opened or washed away. It seems that such many fatalities as 200 were probably resulted under situations like this. (See Figure 2.5) Judging only from the historical data analysis, the soundness (including both mechanical and human
elements) of securing device for hatch cover including hatch coaming, as the first barrier against hold flooding, seems to be closely related to fatal casualty rather than strength of hatch cover panels. (See Figure 2.5)
FSA STUDY ON BULK CARRIER SAFETY CONDUCTED BY JAPAN MSC75/5/2 ANNEX 5
Page 8
Note:
* Odd numbers at right side indicates the casualties occurred in high-density cargo loaded condition. (1.78 t/m3 or above)
** The figures at shoulder of each branch indicate the classified number of casualty in each event.
*** In case of unknown hold flooding, flooded hold is assumed by expert judgment. Therefore, the numbers of
casualties/fatalities on each event may not correspond to the estimation in the study.
Figure 2.3 Event tree diagram with casualty breakdown (10,000dwt+)
IE SF FL FA OutcomeBC
encountersHeavy
Weather &Casualtyoccurred
StructuralFailureOccurson Hull
Flooding Fatalities Consequence afterStructural Failure
Frequency(per ship-
year)
Fatalitiesper
ship-year
AverageShipAge
Ratio ofHigh
DensityCargo
Loaded
TotalNumber
ofFatalities
Event
No.
Yes 169 1)Yes 10 30 2)
23 13 No 0 3)No.1 Hold Flooding 0 4)
47 Yes 0 5)24 No (Serious Cas.) 1 3 6)
23 No 0 7)0 8)
Yes Σ260 Yes 103 9)
Yes 5 18 10)27 22 No 0 11)
63 Other Holds Flooding 0 12)Yes 0 13)
36 No (Serious Cas.) 1 1 14)35 No 0 15)
0 16)Yes Σ308 Yes 0 17)
Yes 3 37 18)12 9 No 0 19)
52 Other Compartment 0 20) Flooding(WBT,E/R,etc.) Yes 0 21)
40 No (Serious Cas.) 0 0 22)40 No 0 23)
0 24)Σ
Yes 0 25)Yes 0 0 26)
3 3 No 0 27)52 No Flooding 0 28)
Yes 0 29)49 No (Serious Cas.) 0 0 30)
49 No 0 31)0 32)
Note
53.8%
90.0% 17.6
0.0%
47.8%
19.8
22.0
15.2
0.0%
No Flooding�Returned� No Fatality 5.5E-04 0.0E+00 13.4 14.3%
0.0 No Flooding�Returned� Fatalities 0.0E+00 0.0E+00
0.0%
No Flooding�Total Loss� No Fatality 3.3E-05 0.0E+00 18.7 66.7%
0.0 No Flooding�Total Loss� Fatalities 0.0E+00 0.0E+00
0.0%
Other Compartment Flooding�Returned� No Fatality 4.4E-04 0.0E+00 16.0 12.5%
0.0 Other Compartment Flooding�Returned� Fatalities 0.0E+00 0.0E+00
0.0%
Other Compartment Flooding�Total Loss� No Fatality 1.0E-04 0.0E+00 20.6 44.4%
19.3 Other Compartment Flooding�Total Loss� Fatalities 3.3E-05 4.1E-04
0.0%
Other Holds Flooding�Returned� No Fatality 3.9E-04 0.0E+00 16.5 45.7%
14.0 Other Holds Flooding�Returned� Fatalities 1.1E-05 1.1E-05
80.0%
Other Holds Flooding�Total Loss� No Fatality 2.4E-04 0.0E+00 17.7 68.2%
21.2 Other Holds Flooding�Total Loss� Fatalities 5.6E-05 1.3E-03
No.1 Hold Flooding�Returned� No Fatality 2.6E-04 0.0E+00
No.1 Hold Flooding�Returned� Fatalities 1.1E-05 3.3E-05
LS Probability
Loss of Ships
No.1 Hold Flooding�Total Loss� No Fatality 1.4E-04 0.0E+00
No.1 Hold Flooding�Total Loss� Fatalities 1.1E-04 2.2E-03
101 33)48 No 29 145 34)
19 30 35)24 36)
0 37)No 12 0 38)
52 40 32 39)9 40)
Yes 365 41)Yes 19 59 42)
33 14 No 0 43)42 Unknown Hold Flooding 0 44)
Yes 0 45)9 No (Serious Cas.) 0 0 46)
9 No 0 47)0 48)
ΣYes 0 49)
Yes 0 0 50)0 0 No 0 51)
4 Unknown Compartment 0 52)Flooding Yes 0 53)
4 No (Serious Cas.) 0 0 54)4 No 0 55)
0 56)
33.3%
Excluded case from the study, e.g.piping failure, etc. (out of scope) 4.4E-04 4.6E-04 16.2 10.0%
20.7 Structural failure during loading operation(to be assessed separately) 1.3E-04 0.0E+00
24.1%
Cargo Shift (to be assessed separately) 2.1E-04 6.0E-04 10.4 36.8%
14.1 Failure of Hatch Covers or other closingdevices (to be assessed separately) 3.2E-04 2.7E-03
78.9%
Unknown Hold Flooding�Total Loss� No Fatality 1.6E-04 0.0E+00 21.0 42.9%
Unknown Hold Flooding�Total Loss� Fatalities 2.1E-04 4.7E-03 18.9
0.0%
Unknown Hold Flooding�Returned� No Fatality 1.0E-04 0.0E+00 16.9 11.1%
Unknown Hold Flooding�Returned� Fatalities 0.0E+00 0.0E+00 #DIV/0!
0.0%
Unknown Compartment Flooding� Total Loss� No Fatality 0.0E+00 0.0E+00 #DIV/0! 0.0%
Unknown Compartment Flooding� Total Loss� Fatalities 0.0E+00 0.0E+00 #DIV/0!
0.0%
Unknown Compartment Flooding� Returned� No Fatality 4.4E-05 0.0E+00 20.5 0.0%
Unknown Compartment Flooding� Returned� Fatalities 0.0E+00 0.0E+00 #DIV/0!
FSA STUDY ON BULK CARRIER SAFETY CONDUCTED BY JAPAN MSC75/5/2 ANNEX 5
Page 9
Note:
* Odd numbers at right side indicates the casualties with regard to fore end or No.1 cargo hold.
** The casualty with 44fatalities classified in Event No.21 is a noted casualty with M.V. Derbyshire.
Figure 2.5 Event tree diagram with casualty breakdown (Failure of hatch cover or other closing device)
Figure 2.4 Break down diagram with regard to Scenario-none (Cases excluded from this study)
17 /89,90017 (ID: E1,E2,E5,E6,E7,E14,E15,E16,E17,E19,E22,E23,E33,E35,E38,E39,O15)
4 /89,9004 (ID: E18,E34,E40,E41)
4 4 /89,900(ID: E11,E32,E50,E51)
6 1 1 /89,90033 (ID: E52)
33 /89,900 6 /89,900 1 1 /89,900(ID: E53)
2 2 /89,900(ID: E12,E28)
4 4 /89,900(ID: E13,E26,E46,E49)
40 /89,900 ship year2 /89,900
2 (ID: E8,E44)
1 1 /89,900(ID: E27)
7 3 1 1 /89,900(ID: E36)
3 /89,900 1 1 /89,900(ID: E36)
2 2 /89,900(ID: E9,E43)
Through Valve/Piping Failure
Broke in Twoduring Tow for
Stranded duringTyphoon
Detail Unknown
Total Loss orBroken-up
Broken HatchCover by Derrick
Unusual Case
Exceptional Water Ingress;then, excluded from the
Shell Plating
SuspectedStructural Double Bottom
Sea Chest
Returned to Voyage
Through Valve/Piping Failure
Through SternTube
Miss-operation
Detail Unknown
IE HCF FL FA OutcomeBC
encountersHeavy
Weather &Casualtyoccurred
Failure occurs onHatch Cover or other
closing deviceFlooding Fatalities Sequence of Casualty
Frequency(per ship-
year)
Fatalitiesper
ship year
AverageShipAge
RatioconcerningFore Endor No.1
Hold
TotalNumber
ofFatalities
Event
No.
Yes 0 1)Yes 0 0 2)
2 2 No 0 3)Yes 0 4)
6 Yes 0 5)Structural Failure of 4 No (Serious Cas.) 1 2 6)
9 Hatch Cover 3 No 0 7)0 8)
3 No 0 9)0 10)
ΣYes 200 11)
Yes 6 0 12)6 0 No 0 13)
Yes 0 14)10 Yes 0 15)
11 Securing or Tightening 4 No (Serious Cas.) 0 0 16)Failure of Hatch Cover 4 No 0 17)
0 18)1 No 0 19)
0 20)Σ
Yes 44 21)Yes 1 0 22)
1 0 No 0 23)Yes 0 24)
9 Yes 0 25)9 Failure of Small Hatch, 8 No (Serious Cas.) 0 0 26)
Ventilator, etc. 8 No 0 27)0 28)
0 No 0 29)0 30)
Miscellaneous Closing Device Failure-No Flooding-Returned 0.0 0.0%
Miscellaneous Closing Device Failure-Flooding-Returned-Fatalities 0.0 0.0%
Miscellaneous Closing Device Failure-Flooding-Returned-No Fatality 8.4 100.0%
0.0E+00
LS
Loss of Ships
0.0E+00
8.9E-05 0.0E+00
Miscellaneous Closing Device Failure-Flooding-Sank-Fatalities 4.0 100.0%
HC Structural Failure-Flooding-Sank-Fatalities 0.0 0.0%
Miscellaneous Closing Device Failure-Flooding-Sank-No Fatality 0.0 0.0%
1.1E-05 4.9E-04
0.0E+00 0.0E+00
HC Securing or Tightening Failure-Flooding-Returned-No Fatality 20.5 50.0%
HC Securing or Tightening Failure-No Flooding-Returned 17.0 0.0%
4.4E-05 0.0E+00
1.1E-05 0.0E+00
0.0%
HC Securing or Tightening Failure-Flooding-Returned-Fatalities 0.0 0.0%
0.0E+00 0.0E+00
0.0E+00 0.0E+00
33.3%
HC Securing or Tightening Failure-Flooding-Sank-Fatalities 21.5 100.0%
3.3E-05 0.0E+00
6.7E-05 2.2E-03
0.0%
HC Structural Failure-Flooding-Returned-No Fatality 18.0 100.0%
1.1E-05 2.2E-05
3.3E-05 0.0E+00
50.0%
Probability
0.0E+00 0.0E+00
2.2E-05 0.0E+00
Note
0.0E+00 0.0E+00
HC Structural Failure-Flooding-Sank-No Fatality 15.5
HC Structural Failure-Flooding-Returned-Fatalities 3.0
HC Structural Failure-No Flooding-Returned 11.3
HC Securing or Tightening Failure-Flooding-Sank-No Fatality 0.0
FSA STUDY ON BULK CARRIER SAFETY CONDUCTED BY JAPAN MSC75/5/2 ANNEX 5
Page 10
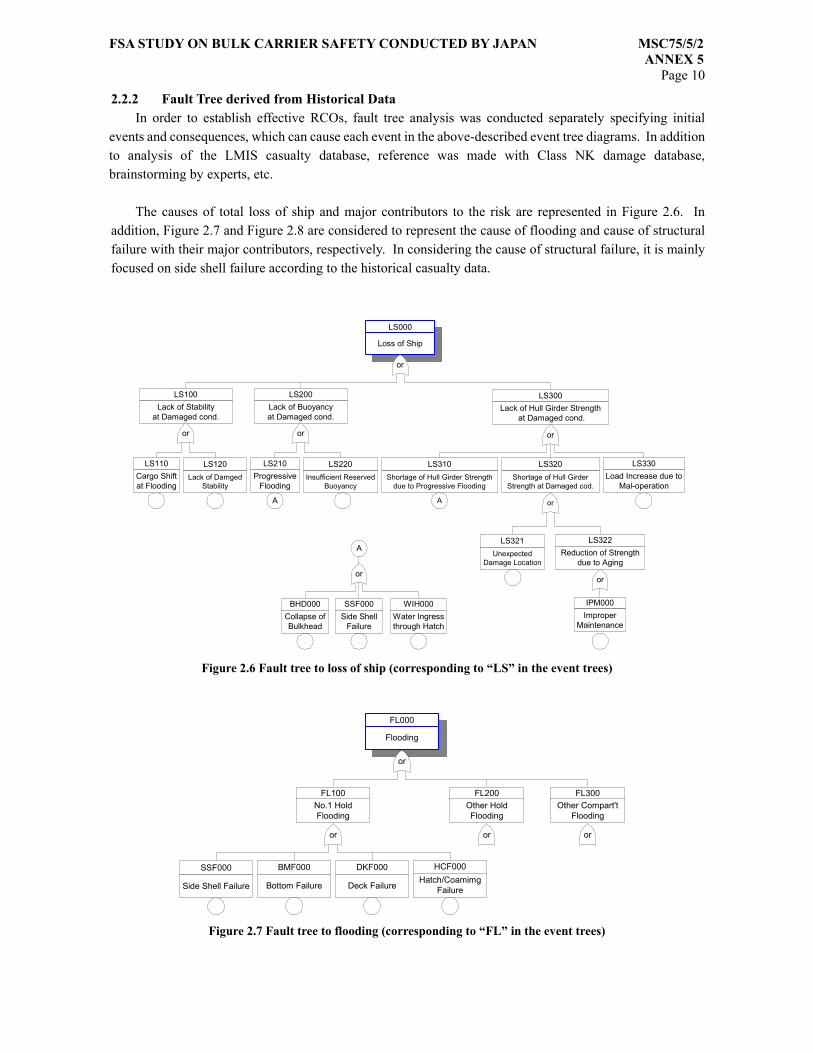
2.2.2 Fault Tree derived from Historical Data In order to establish effective RCOs, fault tree analysis was conducted separately specifying initial events and consequences, which can cause each event in the above-described event tree diagrams. In addition to analysis of the LMIS casualty database, reference was made with Class NK damage database, brainstorming by experts, etc. The causes of total loss of ship and major contributors to the risk are represented in Figure 2.6. In addition, Figure 2.7 and Figure 2.8 are considered to represent the cause of flooding and cause of structural failure with their major contributors, respectively. In considering the cause of structural failure, it is mainly focused on side shell failure according to the historical casualty data.
Figure 2.6 Fault tree to loss of ship (corresponding to “LS” in the event trees)
Figure 2.7 Fault tree to flooding (corresponding to “FL” in the event trees)
LS000LS000
Loss of ShipLoss of Ship
or
LS200Lack of Buoyancyat Damaged cond.
or
LS100Lack of Stability
at Damaged cond.
or
LS110Cargo Shiftat Flooding
LS320Shortage of Hull Girder
Strength at Damaged cod.
or
LS330Load Increase due to
Mal-operation
BHD000Collapse ofBulkhead
SSF000Side Shell
Failure
WIH000Water Ingressthrough Hatch
LS321Unexpected
Damage Location
IPM000Improper
Maintenance
LS220Insufficient Reserved
Buoyancy
LS120Lack of Damged
Stability
LS322Reduction of Strength
due to Aging
or
LS300Lack of Hull Girder Strength
at Damaged cond.
or
LS210Progressive
Flooding
A
LS310Shortage of Hull Girder Strength
due to Progressive Flooding
A
or
A
SSF000
Side Shell Failure
FL000FL000
FloodingFlooding
or
FL100FL100
No.1 HoldFlooding
No.1 HoldFlooding
or
FL200FL200
Other HoldFlooding
Other HoldFlooding
or
FL300FL300
Other Compart'tFlooding
Other Compart'tFlooding
or
DKF000
Deck Failure
BMF000
Bottom Failure
HCF000Hatch/Coamimg
Failure
FSA STUDY ON BULK CARRIER SAFETY CONDUCTED BY JAPAN MSC75/5/2 ANNEX 5
Page 11
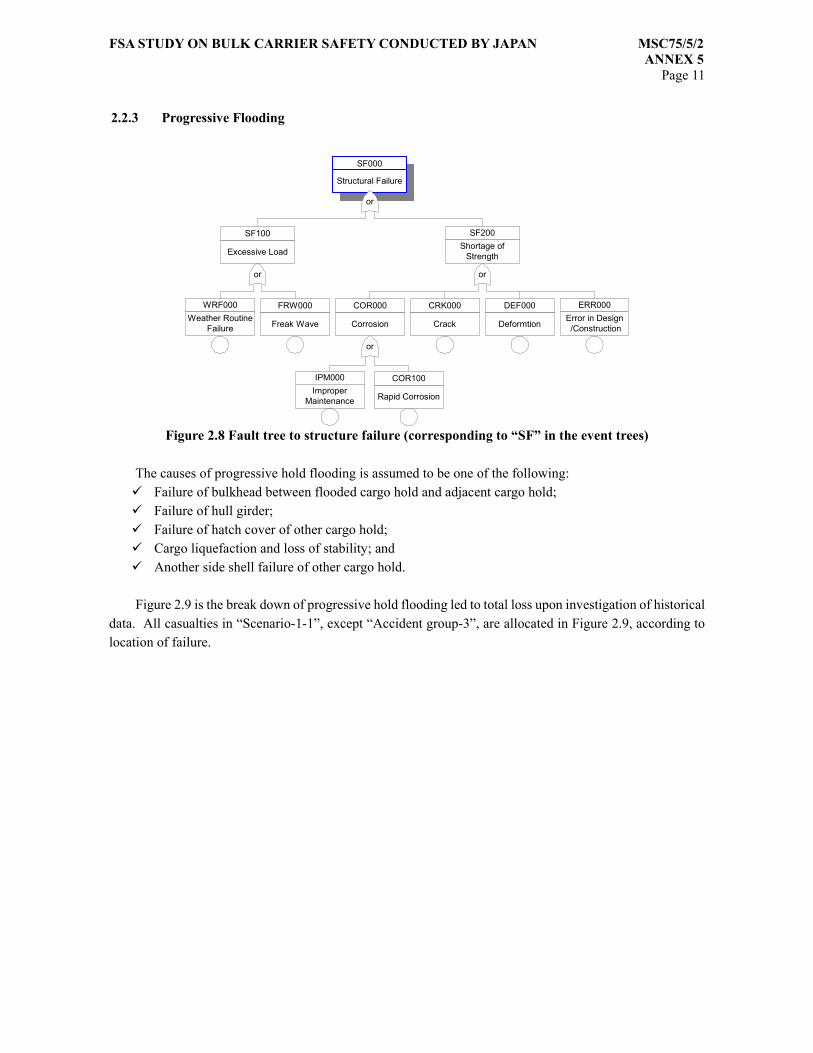
2.2.3 Progressive Flooding
The causes of progressive hold flooding is assumed to be one of the following: Failure of bulkhead between flooded cargo hold and adjacent cargo hold; Failure of hull girder; Failure of hatch cover of other cargo hold; Cargo liquefaction and loss of stability; and Another side shell failure of other cargo hold.
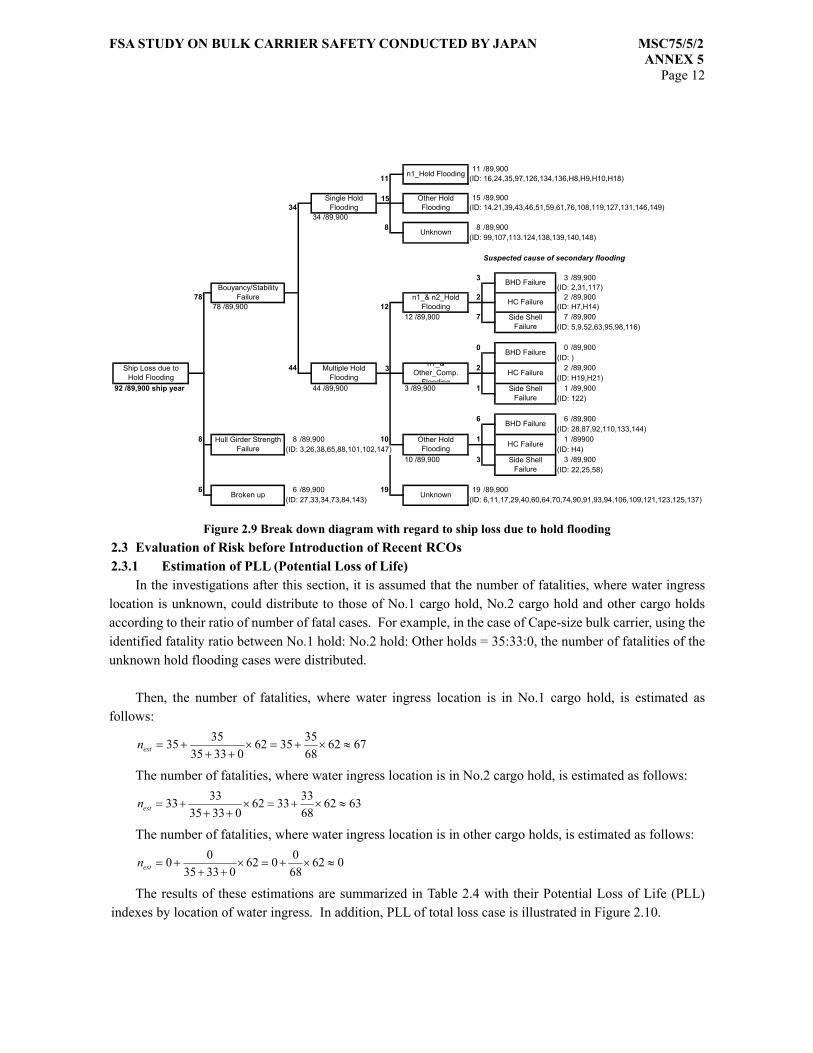
Figure 2.9 is the break down of progressive hold flooding led to total loss upon investigation of historical data. All casualties in “Scenario-1-1”, except “Accident group-3”, are allocated in Figure 2.9, according to location of failure.
Figure 2.8 Fault tree to structure failure (corresponding to “SF” in the event trees)
FRW000
Freak Wave
or
COR000
Corrosion
CRK000
Crack
DEF000
Deformtion
ERR000Error in Design /Construction
IPM000Improper
Maintenance
COR100
Rapid Corrosion
SF200Shortage of
Strength
or
SF100
Excessive Load
or
SF000SF000
Structural FailureStructural Failure
or
WRF000Weather Routine
Failure
FSA STUDY ON BULK CARRIER SAFETY CONDUCTED BY JAPAN MSC75/5/2 ANNEX 5
Page 12
2.3 Evaluation of Risk before Introduction of Recent RCOs 2.3.1 Estimation of PLL (Potential Loss of Life) In the investigations after this section, it is assumed that the number of fatalities, where water ingress location is unknown, could distribute to those of No.1 cargo hold, No.2 cargo hold and other cargo holds according to their ratio of number of fatal cases. For example, in the case of Cape-size bulk carrier, using the identified fatality ratio between No.1 hold: No.2 hold: Other holds = 35:33:0, the number of fatalities of the unknown hold flooding cases were distributed. Then, the number of fatalities, where water ingress location is in No.1 cargo hold, is estimated as follows:
676268353562
033353535 ≈×+=×
+++=estn
The number of fatalities, where water ingress location is in No.2 cargo hold, is estimated as follows:
636268333362
033353333 ≈×+=×
+++=estn
The number of fatalities, where water ingress location is in other cargo holds, is estimated as follows:
062680062
0333500 ≈×+=×
+++=estn
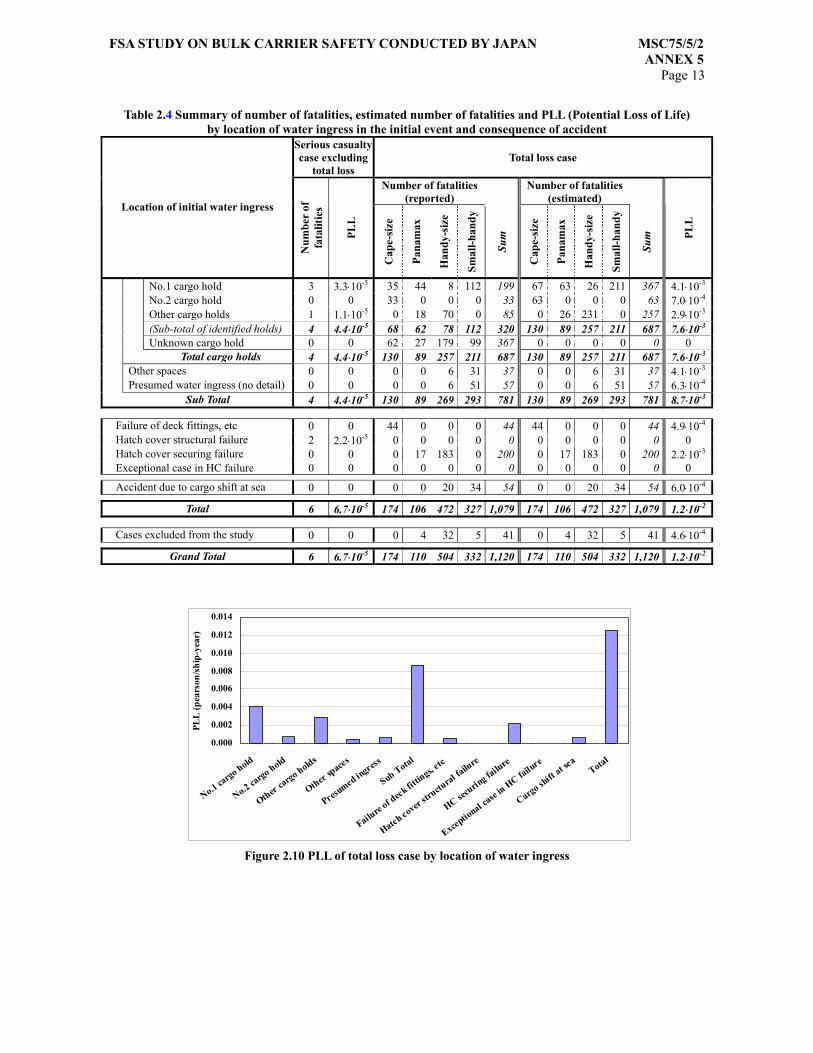
The results of these estimations are summarized in Table 2.4 with their Potential Loss of Life (PLL) indexes by location of water ingress. In addition, PLL of total loss case is illustrated in Figure 2.10.
Figure 2.9 Break down diagram with regard to ship loss due to hold flooding
11 /89,90011 (ID: 16,24,35,97,126,134,136,H8,H9,H10,H18)
15 15 /89,90034 (ID: 14,21,39,43,46,51,59,61,76,108,119,127,131,146,149)
34 /89,9008 8 /89,900
(ID: 99,107,113.124,138,139,140,148)
Suspected cause of secondary flooding
3 3 /89,900(ID: 2,31,117)
78 2 2 /89,90078 /89,900 12 (ID: H7,H14)
12 /89,900 7 7 /89,900(ID: 5,9,52,63,95,98,116)
0 0 /89,900(ID: )
44 3 2 2 /89,900(ID: H19,H21)
92 /89,900 ship year 44 /89,900 3 /89,900 1 1 /89,900(ID: 122)
6 6 /89,900(ID: 28,87,92,110,133,144)
8 8 /89,900 10 1 1 /89900(ID: 3,26,38,65,88,101,102,147) (ID: H4)
10 /89,900 3 3 /89,900(ID: 22,25,58)
6 6 /89,900 19 19 /89,900(ID: 27,33,34,73,84,143) (ID: 6,11,17,29,40,60,64,70,74,90,91,93,94,106,109,121,123,125,137)
Hull Girder StrengthFailure
Broken up
BHD Failure
HC Failure
Side ShellFailure
BHD Failure
HC Failure
Side ShellFailure
Multiple HoldFlooding
Unknown
Ship Loss due toHold Flooding
Side ShellFailure
Bouyancy/StabilityFailure n1_& n2_Hold
Flooding
BHD Failure
HC Failure
n1_&Other_Comp.
Flooding
Other HoldFlooding
n1_Hold Flooding
Single HoldFlooding
Other HoldFlooding
Unknown
FSA STUDY ON BULK CARRIER SAFETY CONDUCTED BY JAPAN MSC75/5/2 ANNEX 5
Page 13
Table 2.4 Summary of number of fatalities, estimated number of fatalities and PLL (Potential Loss of Life) by location of water ingress in the initial event and consequence of accident
Serious casualty case excluding
total loss Total loss case
Number of fatalities (reported)
Number of fatalities (estimated)
Location of initial water ingress
Num
ber
of
fata
litie
s
PLL
Cap
e-si
ze
Pana
max
Han
dy-s
ize
Smal
l-han
dy
Sum
Cap
e-si
ze
Pana
max
Han
dy-s
ize
Smal
l-han
dy
Sum
PLL
No.1 cargo hold 3 3.3⋅10-5 35 44 8 112 199 67 63 26 211 367 4.1⋅10-3 No.2 cargo hold 0 0 33 0 0 0 33 63 0 0 0 63 7.0⋅10-4 Other cargo holds 1 1.1⋅10-5 0 18 70 0 85 0 26 231 0 257 2.9⋅10-3 (Sub-total of identified holds) 4 4.4⋅10-5 68 62 78 112 320 130 89 257 211 687 7.6⋅10-3 Unknown cargo hold 0 0 62 27 179 99 367 0 0 0 0 0 0 Total cargo holds 4 4.4⋅10-5 130 89 257 211 687 130 89 257 211 687 7.6⋅10-3 Other spaces 0 0 0 0 6 31 37 0 0 6 31 37 4.1⋅10-3 Presumed water ingress (no detail) 0 0 0 0 6 51 57 0 0 6 51 57 6.3⋅10-4 Sub Total 4 4.4⋅10-5 130 89 269 293 781 130 89 269 293 781 8.7⋅10-3
Failure of deck fittings, etc 0 0 44 0 0 0 44 44 0 0 0 44 4.9⋅10-4 Hatch cover structural failure 2 2.2⋅10-5 0 0 0 0 0 0 0 0 0 0 0 Hatch cover securing failure 0 0 0 17 183 0 200 0 17 183 0 200 2.2⋅10-3 Exceptional case in HC failure 0 0 0 0 0 0 0 0 0 0 0 0 0 Accident due to cargo shift at sea 0 0 0 0 20 34 54 0 0 20 34 54 6.0⋅10-4
Total 6 6.7⋅10-5 174 106 472 327 1,079 174 106 472 327 1,079 1.2⋅10-2
Cases excluded from the study 0 0 0 4 32 5 41 0 4 32 5 41 4.6⋅10-4
Grand Total 6 6.7⋅10-5 174 110 504 332 1,120 174 110 504 332 1,120 1.2⋅10-2
Figure 2.10 PLL of total loss case by location of water ingress
0.000
0.002
0.004
0.006
0.008
0.010
0.012
0.014
No.1 cargo hold
No.2 cargo hold
Other cargo holds
Other spaces
Presumed ingress
Sub Total
Failure o
f deck fit
tings, e
tc
Hatch cover str
uctural fa
ilure
HC securin
g failure
Exceptional ca
se in HC failu
re
Cargo shift
at sea
Total
PLL
(pea
rson
/shi
p-ye
ar)
FSA STUDY ON BULK CARRIER SAFETY CONDUCTED BY JAPAN MSC75/5/2 ANNEX 5
Page 14
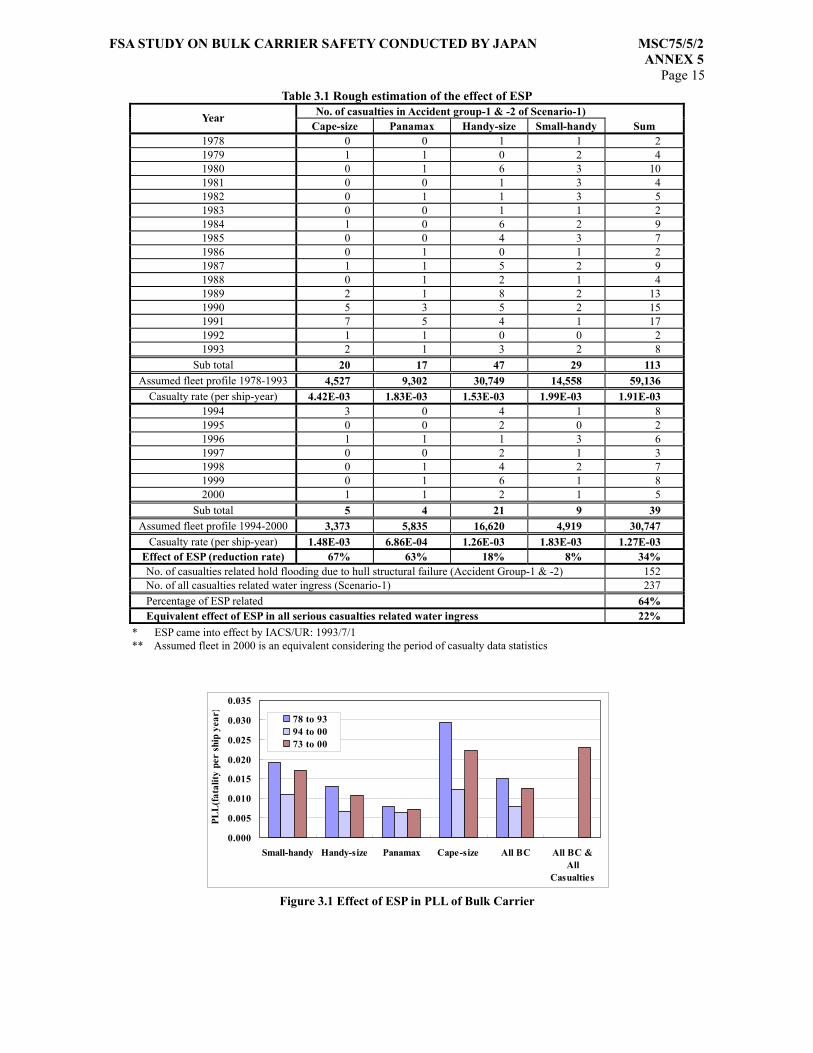
3 Evaluation of Reduced Risk after Introduction of Recent RCOs 3.1 Recently Introduced RCOs Typical examples of recently introduced RCOs are ESP (Enhanced Survey Programs), SOLAS Chapter XII, etc. Following its advanced introductions by several classification societies, ESP came into effect by IACS/UR at July 1st 1993; therefore, the comparatively long period of time, after these introductions, is expected to indicate the effect of ESP in the historical casualty data. On the other hand, as SOLAS Chapter XII came into effect quite recently at July 1st 1999, it is not considered that the effect of SOLAS Chapter XII could be seen in statistical data. 3.2 Estimation of Effect of ESP In order to estimate the effect of ESP, the historical data were revisited. Although ESP has been intended to apply to not only cargo hold structures but ballast tanks, hatch covers, etc, the working group considered that the effect of ESP could typically influence the frequency of side shell structure failure of cargo holds. Then, considering ESP as a risk control option against side shell structure failure, it was assumed that the effect of ESP would be reflected in the risk reduction rate in terms of number of casualties. According to the historical casualty data, most of serious casualties in “Accident group -1 & -2” of “Scenario -1: Flooding to cargo hold due to structural failure” was resulted from failure of side shell structure. In order to see whether the reinforcement of ESP has brought any significant change on the maritime casualty records, effect of ESP is summarized in Table 3.1, which is divided into 2 groups:
1st group is of data from 1978 to 1993; and 2nd group is of data from 1994 to 2000.
As shown in number of casualties in “Accident groups -1 and -2” of “Scenario-1-1”in Table 3.1, total casualty rate of all the bulk carrier groups after 1994 is 0.00127 (number of casualties /ship year), while that before 1993 is 0.00191 (number of casualties /ship year). An estimate of the risk reduction rate by ESP ESPr was calculated using these two figures as follows.
34.000191.0
00127.000191.0≈
−=ESPr
Risk reduction rate derived by the above formula restrictedly represents casualties related to hold flooding due to structural failure such as side shell failure. Hence, overall risk reduction rate all
ESPr as the effect of ESP to all casualties involving water ingress is calculated as follows.
22.023715234.0
237152
≈×=×= ESPall
ESP rr
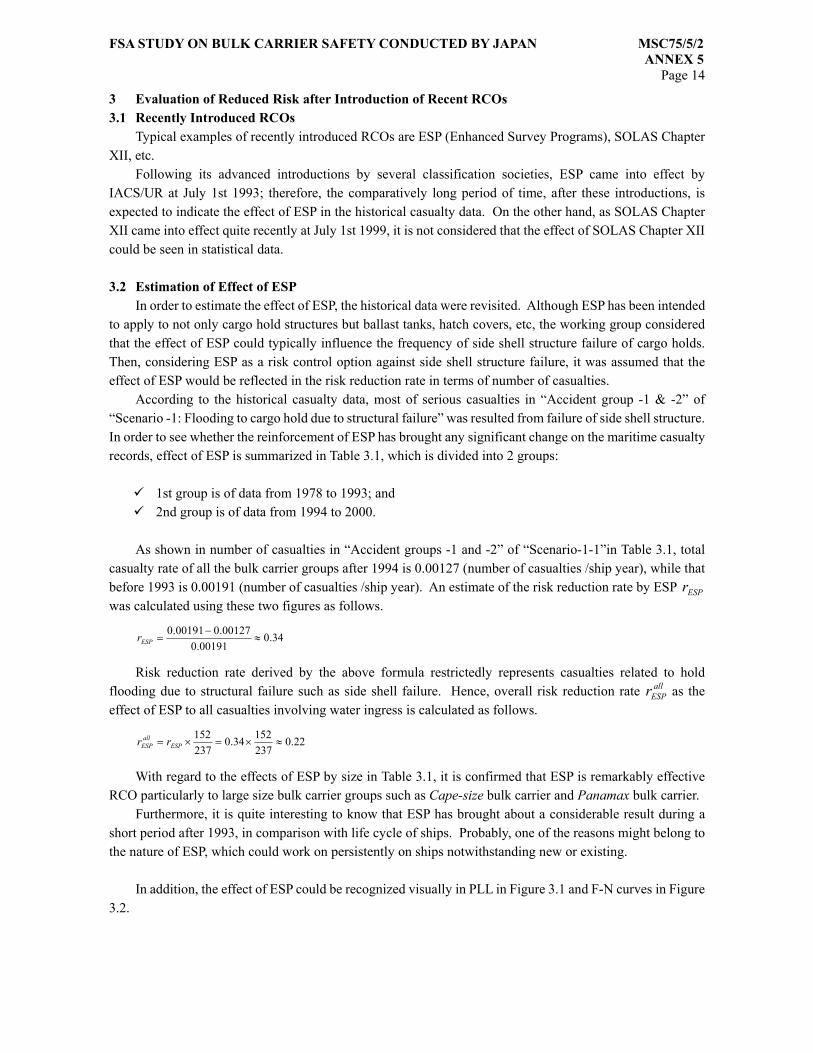
With regard to the effects of ESP by size in Table 3.1, it is confirmed that ESP is remarkably effective RCO particularly to large size bulk carrier groups such as Cape-size bulk carrier and Panamax bulk carrier. Furthermore, it is quite interesting to know that ESP has brought about a considerable result during a short period after 1993, in comparison with life cycle of ships. Probably, one of the reasons might belong to the nature of ESP, which could work on persistently on ships notwithstanding new or existing. In addition, the effect of ESP could be recognized visually in PLL in Figure 3.1 and F-N curves in Figure 3.2.
FSA STUDY ON BULK CARRIER SAFETY CONDUCTED BY JAPAN MSC75/5/2 ANNEX 5
Page 15
Table 3.1 Rough estimation of the effect of ESP No. of casualties in Accident group-1 & -2 of Scenario-1) Year
Cape-size Panamax Handy-size Small-handy Sum 1978 0 0 1 1 2 1979 1 1 0 2 4 1980 0 1 6 3 10 1981 0 0 1 3 4 1982 0 1 1 3 5 1983 0 0 1 1 2 1984 1 0 6 2 9 1985 0 0 4 3 7 1986 0 1 0 1 2 1987 1 1 5 2 9 1988 0 1 2 1 4 1989 2 1 8 2 13 1990 5 3 5 2 15 1991 7 5 4 1 17 1992 1 1 0 0 2 1993 2 1 3 2 8
Sub total 20 17 47 29 113 Assumed fleet profile 1978-1993 4,527 9,302 30,749 14,558 59,136
Casualty rate (per ship-year) 4.42E-03 1.83E-03 1.53E-03 1.99E-03 1.91E-03 1994 3 0 4 1 8 1995 0 0 2 0 2 1996 1 1 1 3 6 1997 0 0 2 1 3 1998 0 1 4 2 7 1999 0 1 6 1 8 2000 1 1 2 1 5
Sub total 5 4 21 9 39 Assumed fleet profile 1994-2000 3,373 5,835 16,620 4,919 30,747
Casualty rate (per ship-year) 1.48E-03 6.86E-04 1.26E-03 1.83E-03 1.27E-03 Effect of ESP (reduction rate) 67% 63% 18% 8% 34% No. of casualties related hold flooding due to hull structural failure (Accident Group-1 & -2) 152 No. of all casualties related water ingress (Scenario-1) 237 Percentage of ESP related 64% Equivalent effect of ESP in all serious casualties related water ingress 22%
* ESP came into effect by IACS/UR: 1993/7/1 ** Assumed fleet in 2000 is an equivalent considering the period of casualty data statistics
Figure 3.1 Effect of ESP in PLL of Bulk Carrier
0.000
0.005
0.010
0.015
0.020
0.025
0.030
0.035
Small-handy Handy-size Panamax Cape-size All BC All BC &All
Casualties
PLL
(fat
ality
per
shi
p ye
ar)
78 to 9394 to 0073 to 00
FSA STUDY ON BULK CARRIER SAFETY CONDUCTED BY JAPAN MSC75/5/2 ANNEX 5
Page 16
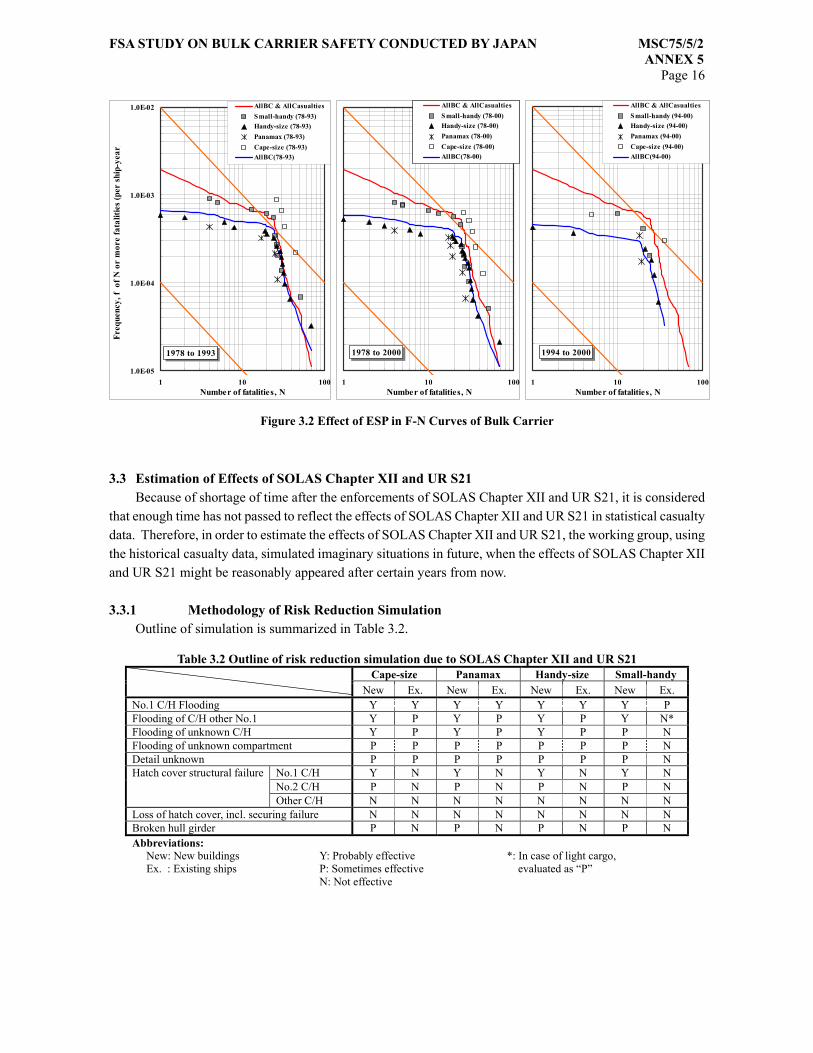
3.3 Estimation of Effects of SOLAS Chapter XII and UR S21 Because of shortage of time after the enforcements of SOLAS Chapter XII and UR S21, it is considered that enough time has not passed to reflect the effects of SOLAS Chapter XII and UR S21 in statistical casualty data. Therefore, in order to estimate the effects of SOLAS Chapter XII and UR S21, the working group, using the historical casualty data, simulated imaginary situations in future, when the effects of SOLAS Chapter XII and UR S21 might be reasonably appeared after certain years from now. 3.3.1 Methodology of Risk Reduction Simulation Outline of simulation is summarized in Table 3.2.
Figure 3.2 Effect of ESP in F-N Curves of Bulk Carrier
Table 3.2 Outline of risk reduction simulation due to SOLAS Chapter XII and UR S21 Cape-size Panamax Handy-size Small-handy
New Ex. New Ex. New Ex. New Ex. No.1 C/H Flooding Y Y Y Y Y Y Y P Flooding of C/H other No.1 Y P Y P Y P Y N* Flooding of unknown C/H Y P Y P Y P P N Flooding of unknown compartment P P P P P P P N Detail unknown P P P P P P P N
No.1 C/H Y N Y N Y N Y N No.2 C/H P N P N P N P N
Hatch cover structural failure
Other C/H N N N N N N N N Loss of hatch cover, incl. securing failure N N N N N N N N Broken hull girder P N P N P N P N Abbreviations:
New: New buildings Ex. : Existing ships
Y: Probably effective P: Sometimes effective N: Not effective
*: In case of light cargo, evaluated as “P”
1.0E-05
1.0E-04
1.0E-03
1.0E-02
1 10 100Number of fatalities, N
Freq
uenc
y, f
of N
or
mor
e fa
talit
ies
(per
shi
p-ye
ar)
AllBC & AllCasualtiesSmall-handy (78-93)Handy-size (78-93)Panamax (78-93)Cape-size (78-93)AllBC(78-93)
1978 to 1993
1 10 100Number of fatalities, N
AllBC & AllCasualtiesSmall-handy (94-00)Handy-size (94-00)Panamax (94-00)Cape-size (94-00)AllBC(94-00)
1994 to 2000
1 10 100Number of fatalities, N
AllBC & AllCasualtiesSmall-handy (78-00)Handy-size (78-00)Panamax (78-00)Cape-size (78-00)AllBC(78-00)
1978 to 2000
FSA STUDY ON BULK CARRIER SAFETY CONDUCTED BY JAPAN MSC75/5/2 ANNEX 5
Page 17
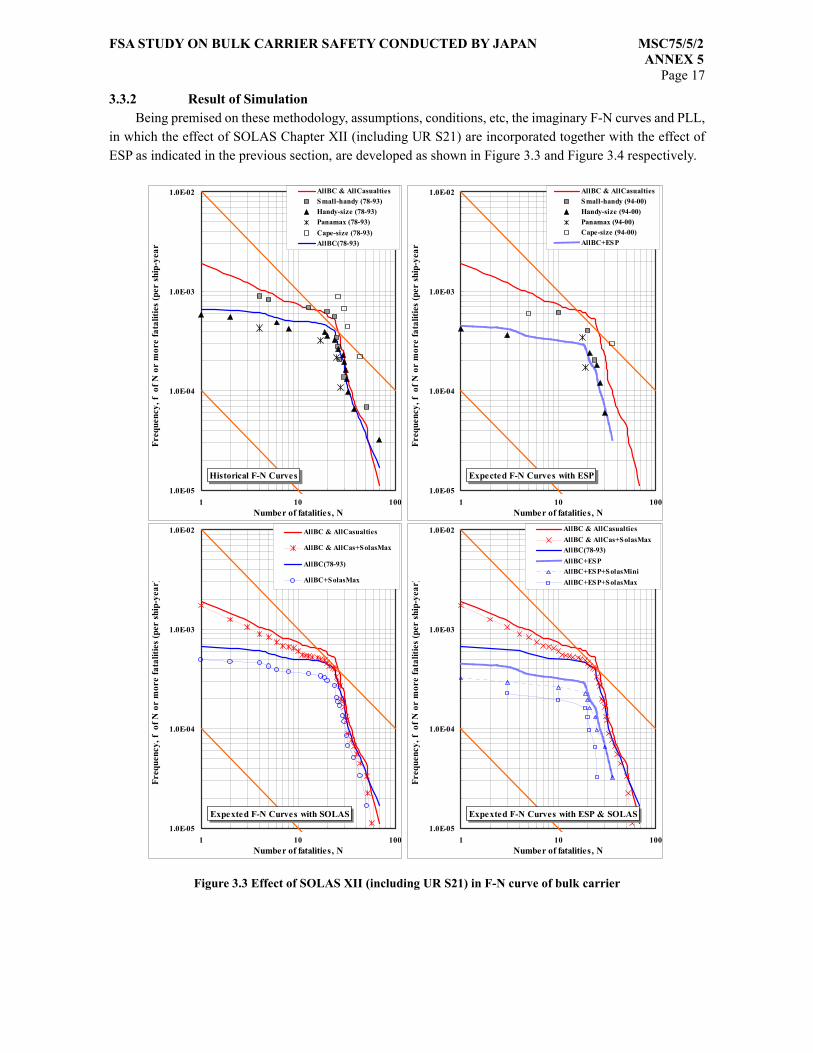
3.3.2 Result of Simulation Being premised on these methodology, assumptions, conditions, etc, the imaginary F-N curves and PLL, in which the effect of SOLAS Chapter XII (including UR S21) are incorporated together with the effect of ESP as indicated in the previous section, are developed as shown in Figure 3.3 and Figure 3.4 respectively.
Figure 3.3 Effect of SOLAS XII (including UR S21) in F-N curve of bulk carrier
1.0E-05
1.0E-04
1.0E-03
1.0E-02
1 10 100Number of fatalities, N
Freq
uenc
y, f
of N
or
mor
e fa
talit
ies
(per
shi
p-ye
ar)
AllBC & AllCasualtiesSmall-handy (78-93)Handy-size (78-93)Panamax (78-93)Cape-size (78-93)AllBC(78-93)
Historical F-N Curves1.0E-05
1.0E-04
1.0E-03
1.0E-02
1 10 100Number of fatalities, N
Freq
uenc
y, f
of N
or
mor
e fa
talit
ies
(per
shi
p-ye
ar)
AllBC & AllCasualtiesSmall-handy (94-00)Handy-size (94-00)Panamax (94-00)Cape-size (94-00)AllBC+ESP
Expected F-N Curves with ESP
1.0E-05
1.0E-04
1.0E-03
1.0E-02
1 10 100Number of fatalities, N
Freq
uenc
y, f
of N
or
mor
e fa
talit
ies
(per
shi
p-ye
ar)
AllBC & AllCasualties
AllBC & AllCas+SolasMax
AllBC(78-93)
AllBC+SolasMax
Expexted F-N Curves with SOLAS1.0E-05
1.0E-04
1.0E-03
1.0E-02
1 10 100Number of fatalities, N
Freq
uenc
y, f
of N
or
mor
e fa
talit
ies
(per
shi
p-ye
ar)
AllBC & AllCasualtiesAllBC & AllCas+SolasMaxAllBC(78-93)AllBC+ESPAllBC+ESP+SolasMiniAllBC+ESP+SolasMax
Expexted F-N Curves with ESP & SOLAS
FSA STUDY ON BULK CARRIER SAFETY CONDUCTED BY JAPAN MSC75/5/2 ANNEX 5
Page 18
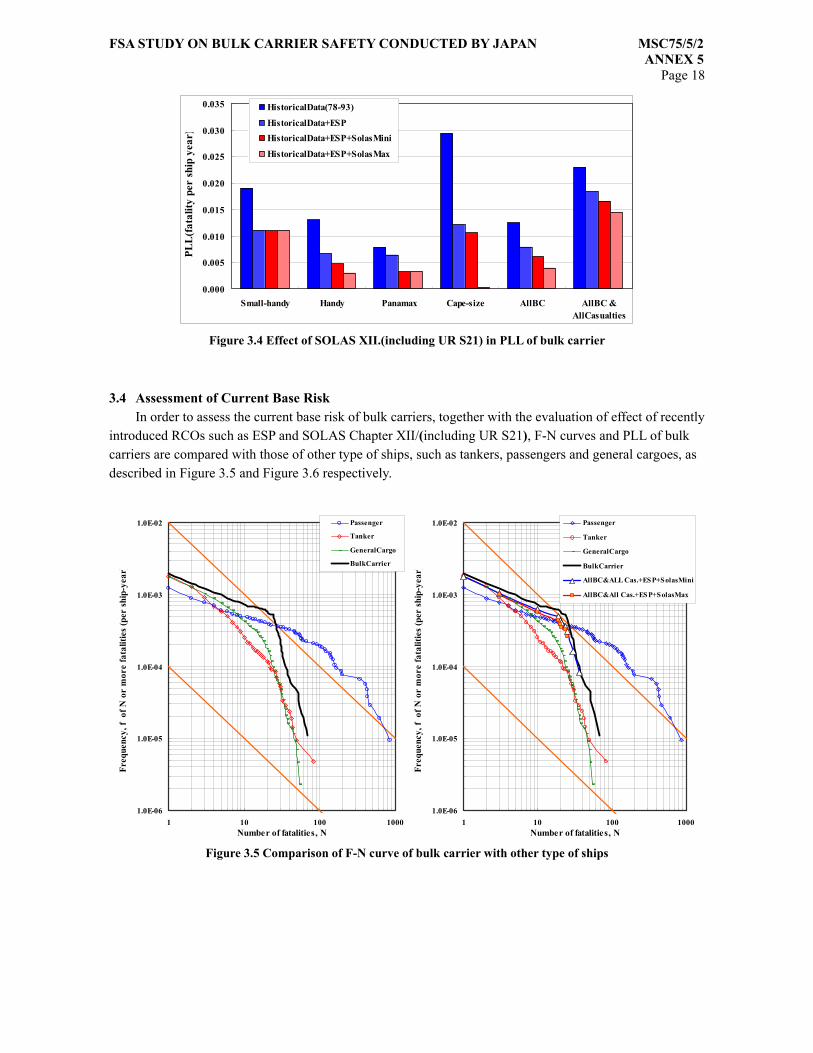
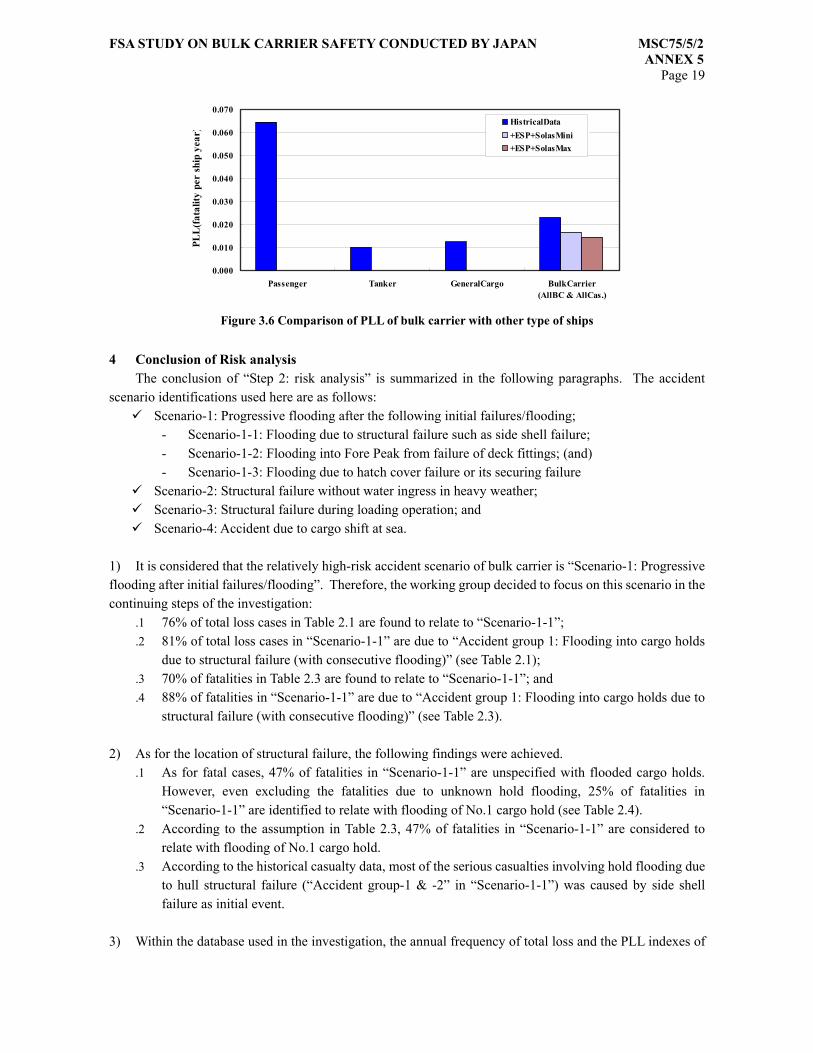
3.4 Assessment of Current Base Risk In order to assess the current base risk of bulk carriers, together with the evaluation of effect of recently introduced RCOs such as ESP and SOLAS Chapter XII/(including UR S21), F-N curves and PLL of bulk carriers are compared with those of other type of ships, such as tankers, passengers and general cargoes, as described in Figure 3.5 and Figure 3.6 respectively.
Figure 3.4 Effect of SOLAS XII.(including UR S21) in PLL of bulk carrier
Figure 3.5 Comparison of F-N curve of bulk carrier with other type of ships
1.0E-06
1.0E-05
1.0E-04
1.0E-03
1.0E-02
1 10 100 1000Number of fatalities, N
Freq
uenc
y, f
of N
or
mor
e fa
talit
ies
(per
shi
p-ye
ar)
Passenger
Tanker
GeneralCargo
BulkCarrier
1.0E-06
1.0E-05
1.0E-04
1.0E-03
1.0E-02
1 10 100 1000Number of fatalities, N
Freq
uenc
y, f
of N
or
mor
e fa
talit
ies
(per
shi
p-ye
ar)
Passenger
Tanker
GeneralCargo
BulkCarrier
AllBC&ALL Cas.+ESP+SolasMini
AllBC&All Cas.+ESP+SolasMax
0.000
0.005
0.010
0.015
0.020
0.025
0.030
0.035
Small-handy Handy Panamax Cape-size AllBC AllBC &AllCasualties
PLL
(fat
ality
per
shi
p ye
ar)
HistoricalData(78-93)
HistoricalData+ESPHistoricalData+ESP+SolasMini
HistoricalData+ESP+SolasMax
FSA STUDY ON BULK CARRIER SAFETY CONDUCTED BY JAPAN MSC75/5/2 ANNEX 5
Page 19
4 Conclusion of Risk analysis The conclusion of “Step 2: risk analysis” is summarized in the following paragraphs. The accident scenario identifications used here are as follows:
Scenario-1: Progressive flooding after the following initial failures/flooding; - Scenario-1-1: Flooding due to structural failure such as side shell failure; - Scenario-1-2: Flooding into Fore Peak from failure of deck fittings; (and) - Scenario-1-3: Flooding due to hatch cover failure or its securing failure
Scenario-2: Structural failure without water ingress in heavy weather; Scenario-3: Structural failure during loading operation; and Scenario-4: Accident due to cargo shift at sea.
1) It is considered that the relatively high-risk accident scenario of bulk carrier is “Scenario-1: Progressive flooding after initial failures/flooding”. Therefore, the working group decided to focus on this scenario in the continuing steps of the investigation:
.1 76% of total loss cases in Table 2.1 are found to relate to “Scenario-1-1”;
.2 81% of total loss cases in “Scenario-1-1” are due to “Accident group 1: Flooding into cargo holds due to structural failure (with consecutive flooding)” (see Table 2.1);
.3 70% of fatalities in Table 2.3 are found to relate to “Scenario-1-1”; and
.4 88% of fatalities in “Scenario-1-1” are due to “Accident group 1: Flooding into cargo holds due to structural failure (with consecutive flooding)” (see Table 2.3).
2) As for the location of structural failure, the following findings were achieved.
.1 As for fatal cases, 47% of fatalities in “Scenario-1-1” are unspecified with flooded cargo holds. However, even excluding the fatalities due to unknown hold flooding, 25% of fatalities in “Scenario-1-1” are identified to relate with flooding of No.1 cargo hold (see Table 2.4).
.2 According to the assumption in Table 2.3, 47% of fatalities in “Scenario-1-1” are considered to relate with flooding of No.1 cargo hold.
.3 According to the historical casualty data, most of the serious casualties involving hold flooding due to hull structural failure (“Accident group-1 & -2” in “Scenario-1-1”) was caused by side shell failure as initial event.
3) Within the database used in the investigation, the annual frequency of total loss and the PLL indexes of
Figure 3.6 Comparison of PLL of bulk carrier with other type of ships
0.000
0.010
0.020
0.030
0.040
0.050
0.060
0.070
Passenger Tanker GeneralCargo BulkCarrier(AllBC & AllCas.)
PLL
(fat
ality
per
shi
p ye
ar)
HistricalData+ESP+SolasMini+ESP+SolasMax
FSA STUDY ON BULK CARRIER SAFETY CONDUCTED BY JAPAN MSC75/5/2 ANNEX 5
Page 20
Cape-size and Small-handy bulk carrier groups indicate relatively high figures. However, these figures are dominated by the accidents before the enforcement of ESP, and, these figures are significantly improved in the historical data after 1994, particularly in the total loss rate of Cape-size bulk carrier group (see Figure 3.1 and 3.2). As for the considerable result, brought about by ESP during a short period after 1993, in comparison with life cycle of ships, it could be considered that one of the reasons might belong to the nature of ESP, which could work on persistently on ships notwithstanding new or existing. 4) According to the simulation of the effects of SOLAS Chapter XII and UR S21, notwithstanding from optimistic views or pessimistic, certain amount of risk reduction might be expected in future. However, taking the following situations into consideration, any proposal of more cost effective RCOs will be expected in order to further improve the overall risk level of bulk carriers:
PLL index of Small-handy bulk carrier group, in comparison with the others, indicate relatively high figure. In addition, considering the circumstances, where this group corresponds to bulk carrier of less than 150 m in length, which is exempted from application of SOLAS Chapter XII, and is still indicating relatively high annual frequency of total loss, proper care must be taken on Small-handy bulk carrier group; It will take considerable years until the risk level of bulk carrier would be substantially reduced by
the effect of SOLAS Chapter XII; Although the effect of SOLAS Chapter XII shows certain amount of potential risk reduction, at the
same time, the uncertainty of this simulation will have to be properly examined in due course; and Therefore, when these current situations are taken into consideration, further investigation would be
needed to confirm whether expected risk levels of bulk carrier could sufficiently be at the same as the current risk levels of other type of ships such as tanker, general cargo, etc (see Figure 3.5 and Figure 3.6).
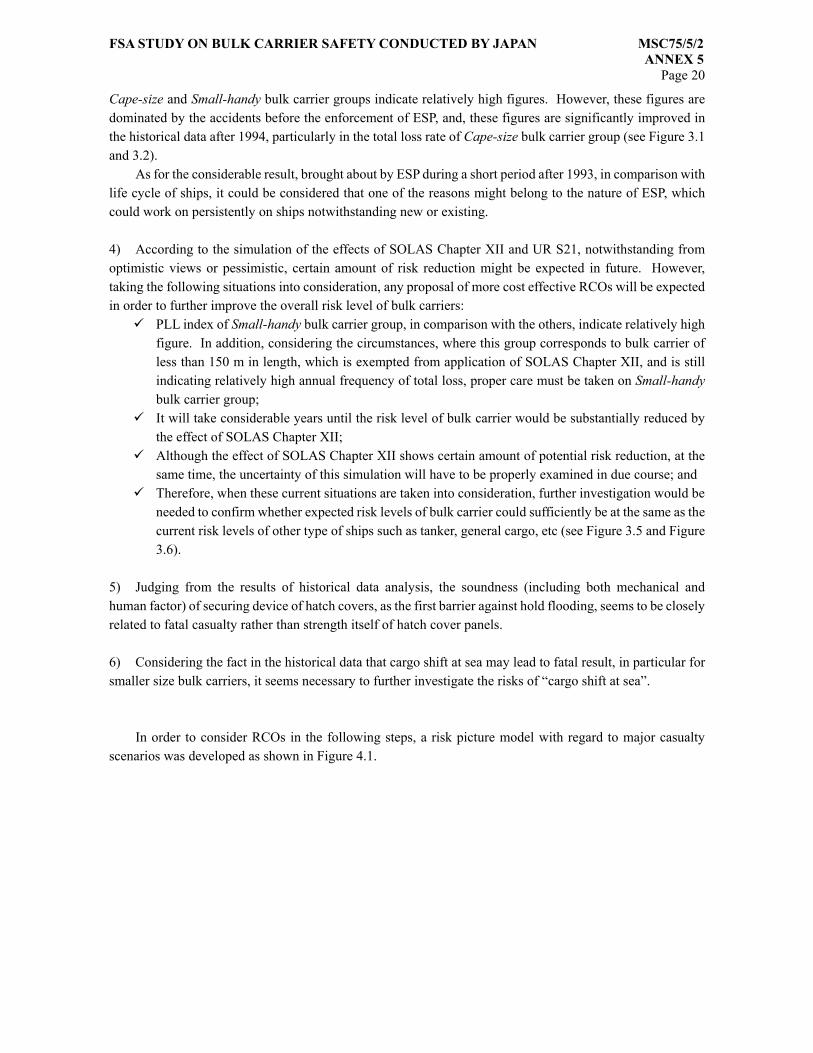
5) Judging from the results of historical data analysis, the soundness (including both mechanical and human factor) of securing device of hatch covers, as the first barrier against hold flooding, seems to be closely related to fatal casualty rather than strength itself of hatch cover panels. 6) Considering the fact in the historical data that cargo shift at sea may lead to fatal result, in particular for smaller size bulk carriers, it seems necessary to further investigate the risks of “cargo shift at sea”. In order to consider RCOs in the following steps, a risk picture model with regard to major casualty scenarios was developed as shown in Figure 4.1.
FSA STUDY ON BULK CARRIER SAFETY CONDUCTED BY JAPAN MSC75/5/2 ANNEX 5
Page 21
Figure 4.1 Model of serious casualty involving hold flooding
Senario 1-1Side Shell Failure
Scenario 1-3Hatch Cover
Failure
Single HoldFlooding
Scenario 1-2Deck Fittings
Failure
Deck Fittings Failure
BHD Failure
Hatch Cover Failure
Not Total Loss
Total Loss
Side Shell Failure
MultiHolds
Flooding Not Total Loss
Total Loss
MSC75/INF.YYJJ Appendix 1
Page 1
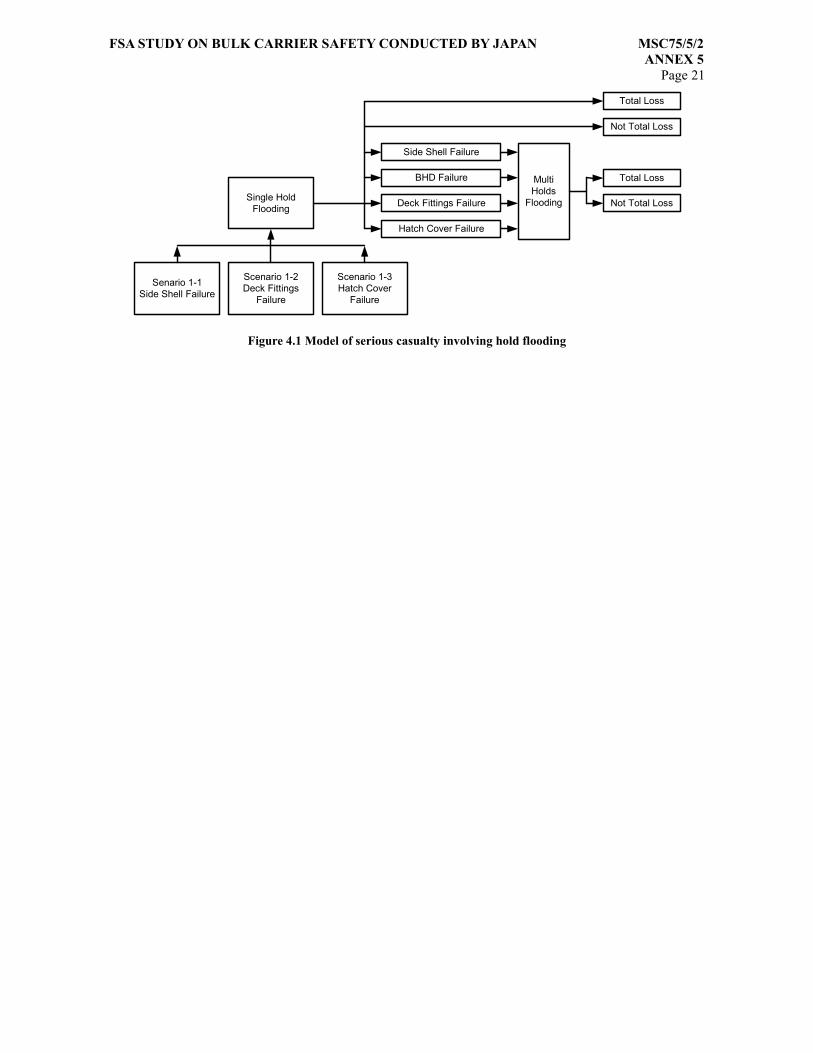
Appendix 1 Identified serious casualties, including total loss, from the LMIS casualty database in the period from 1978 to 2000
Historical Data was corrected from LMIS casualty database, etc. They are summarized in Annex 3 of MSC 75/5/X submitted by Japan. They consist of following seven tables. As an example, a part of Table B1 of the Appendix B of Annex 3 is attached hereunder Table B1 Identified or presumed cases involving cargo hold flooding due to structural failure excluding stranding,
collision, etc Table B2 Identified cases involving other compartment flooding due to structural failure excluding stranding, collision,
etc Table B3 Serious casualty due to structural failure without water ingress Table B4 Identified cases involving water ingress due to hatch cover failure or miscellaneous closing device failure Table B5 Identified cases involving total loss or serious casualty due to cargo shift Table B6 Exceptional cases such casualty during as out of voyage, e.g. valve/piping failure, accident whilst
loading/discharging/ballasting, etc. Table 7 Total loss casualty due to water ingress caused by collision, contact, etc * Note: 1) Description in italic character in Note is referred from the data source other than the LMIS casualty database. 2) Cell and line surrounded by bold frame shows the difference from MSC74/INF.10 and indicates that those cells
or lines, or description in them are either, modified, added, inserted or moved from another table, at this investigation.
Table B1 Identified or presumed cases involving cargo hold flooding due to
structural failure excluding stranding, collision, etc. (Ref. ID with asterisk like 148* indicates the case where involvement of cargo hold flooding is presumed with expert judgment)
Name DWT Date of event Note Total loss
indicator
Number of
fatalities
Age of ship at
casualty
Number of cargo
holds
Ref. ID
# Small-handy Evelpidis Era 10451
(GT) 19780116 No.3 hold flooded & sank
Rock salt loaded 1 0 16 ? 149
Arendal Bay 11848 19991227 No.2 hold flooded Unknown cargo loaded
0 0 25 ? 150
Anderson 12051 19930917 Foundered (detail unknown) Iron loaded
1 24 18 3 148*
Luchana 14524 19860115 Unknown hold flooded Broke in two & sank Iron ore loaded
1 4 22 5 147
William Shakespeare
15328 19960628 No.4 hold flooded & foundered Steel loaded
1 0 18 ? 146
Asia Eeho 15993 19830122 No.1 hold flooded Unknown voyage
0 0 16 4 145
Char Ye 16211 19840810 Nos.4 & 5 holds flooded & foundered Unknown cargo loaded
1 0 8 5 144
World Fuji 16511 19801227 No.3 hold flooded Subsequently broken up Coal loaded
1 0 16 4 143
Apiliotis 16600 19820607 No.5 hold flooded Unknown cargo loaded
0 0 19 5 142
Sincerity 16626 19900309 No.4 hold flooded Unknown voyage
0 0 14 4 141
---