Embed Size (px)
Citation preview
18 Annex 4-1
WORLD HEALTH ORGANIZATION REGIONAL OFFICE FOR EUROPE WELTGESUNDHEITSORGANISATION REGIONALBÜRO FÜR EUROPA
ORGANISATION MONDIALE DE LA SANTÉBUREAU RÉGIONAL DE L'EUROPE
ВСЕМИРНАЯ ОРГАНИЗАЦИЯ ЗДРАВООХРАНЕНИЯЕВРОПЕЙСКОЕ РЕГИОНАЛЬНОЕ БЮРО
EUROPEAN CENTRE FOR ENVIRONMENT AND HEALTH BONN OFFICE
Annex 4-1 Minutes of WHO Meeting
Lisbon, 4-6 June 2003
DEVELOPMENT OF
ENVIRONMENT AND HEALTH INDICATORS FOR
EUROPEAN UNION COUNTRIES
ECOEHIS
Grant Agreement SPC 2002300
Between the European Commission, DG Sanco and the World Health Organization, Regional Office for Europe
© World Health Organization 2004 This project was co-sponsored by the European Commission. The views expressed in this report can in no way be taken to reflect the official opinion of the European Commission or the World Health Organization. The designations employed and the presentation of the material in this report do not imply the expression of any opinion whatsoever concerning the legal status of any country, territory, city or area or of its authorities, or concerning the delimitation of its frontiers or boundaries. The World Health Organization does not warrant that the information contained in this publication is complete and correct and shall not be liable for any damages incurred as a result of its use.
Annex 4-1 18-1
World Health Organization Regional Office for Europe European Centre for Environment and Health
Bonn Office
Housing and Health Indicators
Minutes of the WHO Meeting
4 - 6 June 2003, Lisbon, Portugal
Grant Agreement SPC 2002300 Between the European Commission, DG Sanco
and the World Health Organization, Regional Office for Europe
Abstract This document reports about the discussions and agreements of the first meeting on housing-health indicators in Lisbon, Portugal, from June 4 to 6 2003. The housing-health indicator set is a sub-set topic of the overall Environmental Health indicator set (EHI) developed by the WHO, co-sponsored by the European Commission DG SANCO (SPC 2002300). The meeting reviewed the existing housing and health relationships and proposed a tentative set of indicators to be developed and tested by countries. These minutes were prepared for internal use of the working groups. A final report will be issued at a later stage of this project.
18-2 Annex 4-1
Table of contents
1. Scope and purpose 3
2. Meeting summary 4
3. Participant list 7
4. Annex - Indicator methodology sheet development 9
Scope and Purpose of the meeting The WHO ECEH (Bonn) is developing a system of Environmental Health Indicators based on internationally agreed methodology and comparable data. These Indicators are intended to describe the state of environmental health and so inform decisions, monitor programmes and allow for comparisons nationally and internationally. It was decided that, as housing is complex issue, the development of a set Housing-Health Indicators should be investigated as a sub-project. The aim of the Lisbon meeting was to discuss proposals for Housing-Health Indicators, and to identify and agree around 10 Indicators to be piloted over six months. From these, a set of around four core Housing-Health Indicators will be finalised and adopted. The finalised Indicators will be put forward within the set of Environmental Health Indicators to the Conference for Ministers of the Environment and Health in Budapest in 2004. The meeting was convened as part of the WHO project Development of Environment and Health Indicators for EU countries, co-sponsored by the European Commission DG SANCO (SPC 2002300).
Annex 4-1 18-3
Summary of the Meeting
The Director General of the Ministry of Health of Portugal welcomed the working group. Xavier Bonnefoy outlined the programme for the meeting and the objectives. Dafina Dalbokova gave a review of the Environmental Health Indicators project, and the role of the Housing-Health Indicators within that project. Brigitte Moissonnier presented some of the findings from the analyses of data from the Housing and Health Survey carried out in Ferreira do Alentejo. David Ormandy summarised the main points from the background paper on the Housing-Health Indicators project (circulated previously), including the proposals for consideration by the meeting. He also reminded the meeting that the prime objective of Indicators was to provide a tool for monitoring – measuring changes – not to set any form of standards. Gert Gundersen gave a short resume of his paper discussing the implica-tions of Indicators in the applicant/transition countries. He also added some further considerations, including suggestions for an approach to defining “housing” as an alternative to the WHO definition. This proposed four main elements of housing –
a) Dwelling unit. This element to include – i) objective/technical data, such as number of rooms, floor area,
facilities, structural quality, and quality of materials; ii) subjective/use data, such as temperature conditions.
b) Commonly owned/used parts of building. To include objective/technical data, such as form of ownership, parking facilities etc, and expenditure on maintenance and on utilities (gas, electricity etc).
c) Socio-economic.
To include – i) social issues, such as household characteristics; ii) economic issues, such as amount and breakdown of household
income; iii) cultural issues, including national identity.
d) Environment. To include – i) the general environment, such as air quality, noise etc; ii) the local environment, including traffic safety and noise, play and
recreation facilities and space, and land use.
18-4 Annex 4-1
Maria João Freitas presented a paper on perception aspects of housing, including the immediate environment. The proposed issues which should be considered in the development of Indicators –
e) Spatial use and appropriation – i) time-space issues – mobility issues in residential areas, driving and
walking; time involved in commuting and daily life activities, leisure, health services, work/education.
ii) physical adequacy – spatial functions/use having regard to age, disabilities, family structures etc.
iii) physical pleasure to use – streets, car parking, ratio of green to concrete etc
f) Perceptions –
i) feeling safe, having regard to conditions (equipment, commuting, public lighting, etc), the use (litter, graffiti, fly-posters etc), and management (maintenance performance, accessibility, etc);
ii) feeling “at home”; iii) feeling independent (not constrained to choose and act); iv) feeling empowered (able to participate).
There followed a general discussion on Housing-Health Indicators and issues raised by the presentations. It was explained that the Piloting of the proposed Indicators was to include checking the availability of data, and testing the viability and usefulness of the Indicators. It was agreed that WHO secretariat would prepare a short paper setting out the terms of reference for Piloting which could be copied and used by members of the Working Group when trying to involve others in their countries in the Piloting. The Working Group divided into two sub-groups, one to consider primarily building/structure related Indicators, and the other primarily human / beha-viour related Indicators. Each sub-group discussed the viability and use-fulness of potential Indicators proposed in the background paper, and whether there were any other possible Indicators which should be investigated. The two sub-groups reported back to the full Working Group. A total of fifteen potential Indicators were agreed for further developing and piloting. It was agreed that Fact Sheets would drafted for each of these, and named contacts would be responsible for co-ordinating the drafting (see Annex 2 attached). There was a general discussion on aerosols, VOCs and environmental tobacco smoke. It was proposed that matters which could impact on health fall into one of the following three categories –
v) those solely attributable to the design, construction and/or maintenance of the dwelling and related structures;
vi) those solely attributable to the behaviour of the occupiers; and vii) those which are a combination of the two.
Annex 4-1 18-5
It was further proposed that Housing-Health Indicators should be limited to those matters which fell into (i) and (iii); and that matters in category (ii), while they may be important (such as environmental tobacco smoke and the non-essential use of aerosols), could not be controlled or affected by housing policies and programmes and so should not be included in the Housing-Health Indicator set.
It was acknowledged that it was unfortunate that there were no experts on housing finance present, and that this was a particularly important aspect which should be considered and investigated. Other issues which were felt needed further investigated included Homelessness, Access to Housing (in terms of allocation and affordability) and Sub-Standard Housing. The timetable for the project and for the piloting stage of the preliminary Indicators was suggested and agreed.
18-6 Annex 4-1
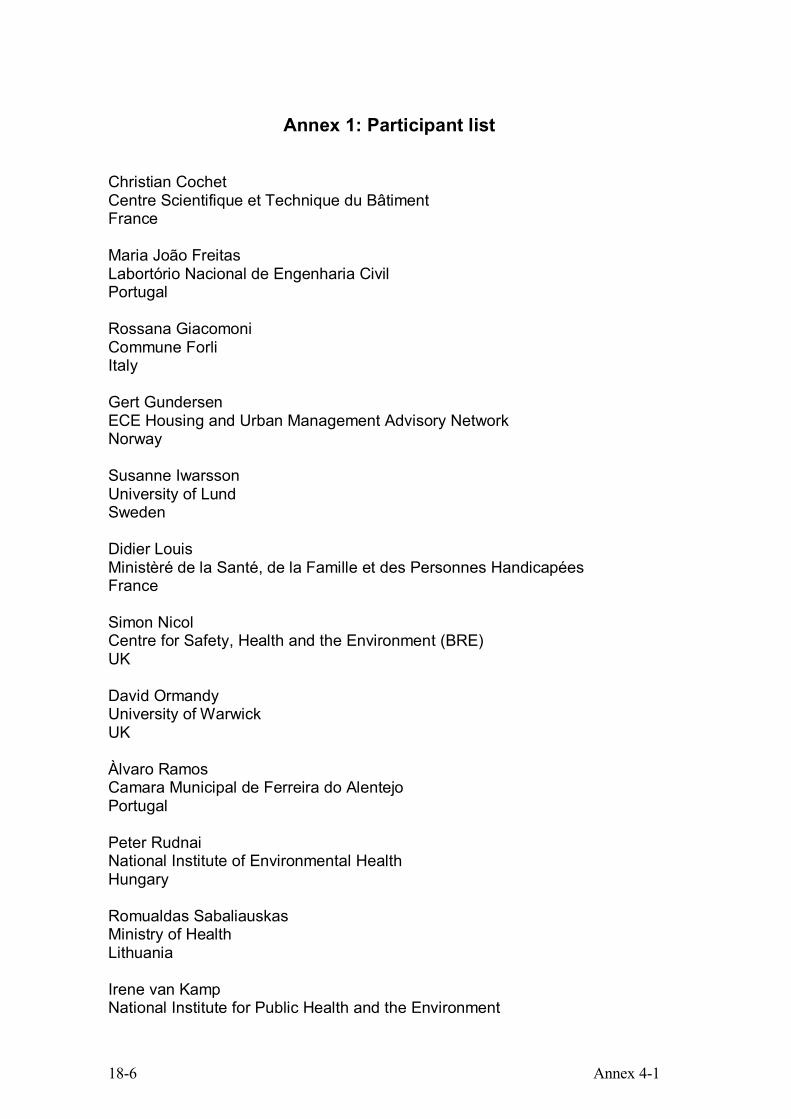
Annex 1: Participant list
Christian Cochet Centre Scientifique et Technique du Bâtiment France Maria João Freitas Labortório Nacional de Engenharia Civil Portugal Rossana Giacomoni Commune Forli Italy Gert Gundersen ECE Housing and Urban Management Advisory Network Norway Susanne Iwarsson University of Lund Sweden Didier Louis Ministèré de la Santé, de la Famille et des Personnes Handicapées France Simon Nicol Centre for Safety, Health and the Environment (BRE) UK David Ormandy University of Warwick UK Àlvaro Ramos Camara Municipal de Ferreira do Alentejo Portugal Peter Rudnai National Institute of Environmental Health Hungary Romualdas Sabaliauskas Ministry of Health Lithuania Irene van Kamp National Institute for Public Health and the Environment
Annex 4-1 18-7
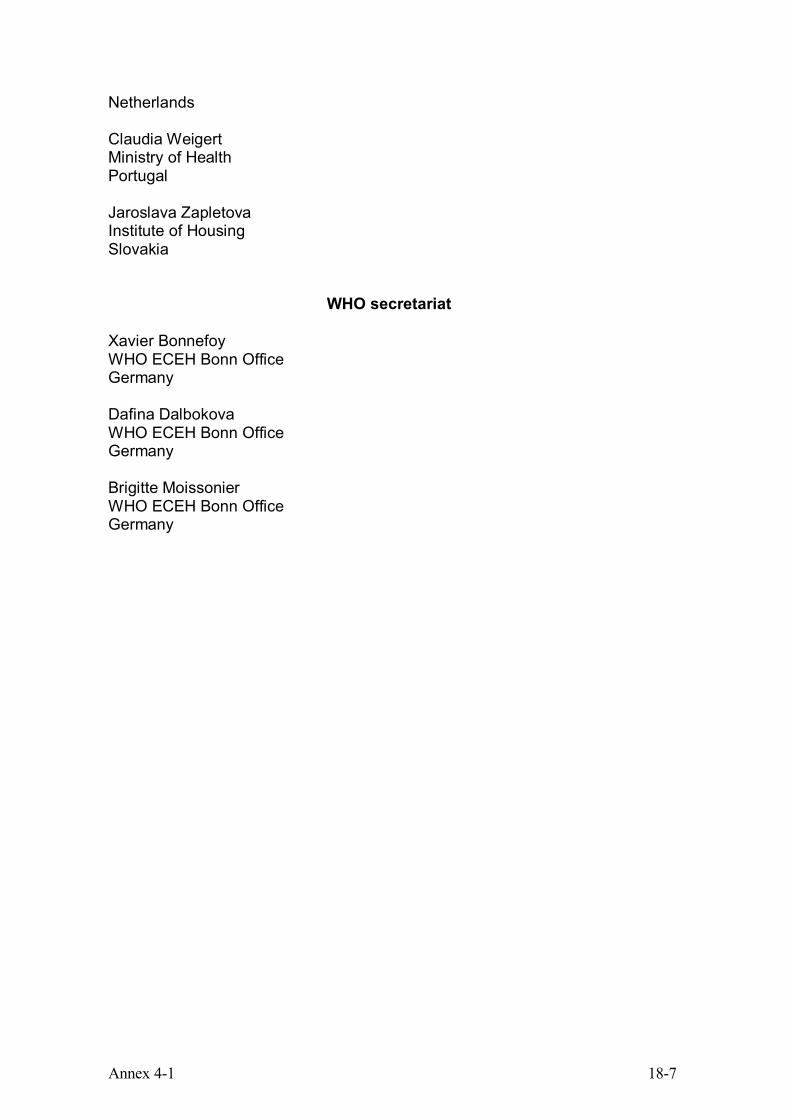
Netherlands Claudia Weigert Ministry of Health Portugal Jaroslava Zapletova Institute of Housing Slovakia
WHO secretariat Xavier Bonnefoy WHO ECEH Bonn Office Germany Dafina Dalbokova WHO ECEH Bonn Office Germany Brigitte Moissonier WHO ECEH Bonn Office Germany
18-8 Annex 4-1
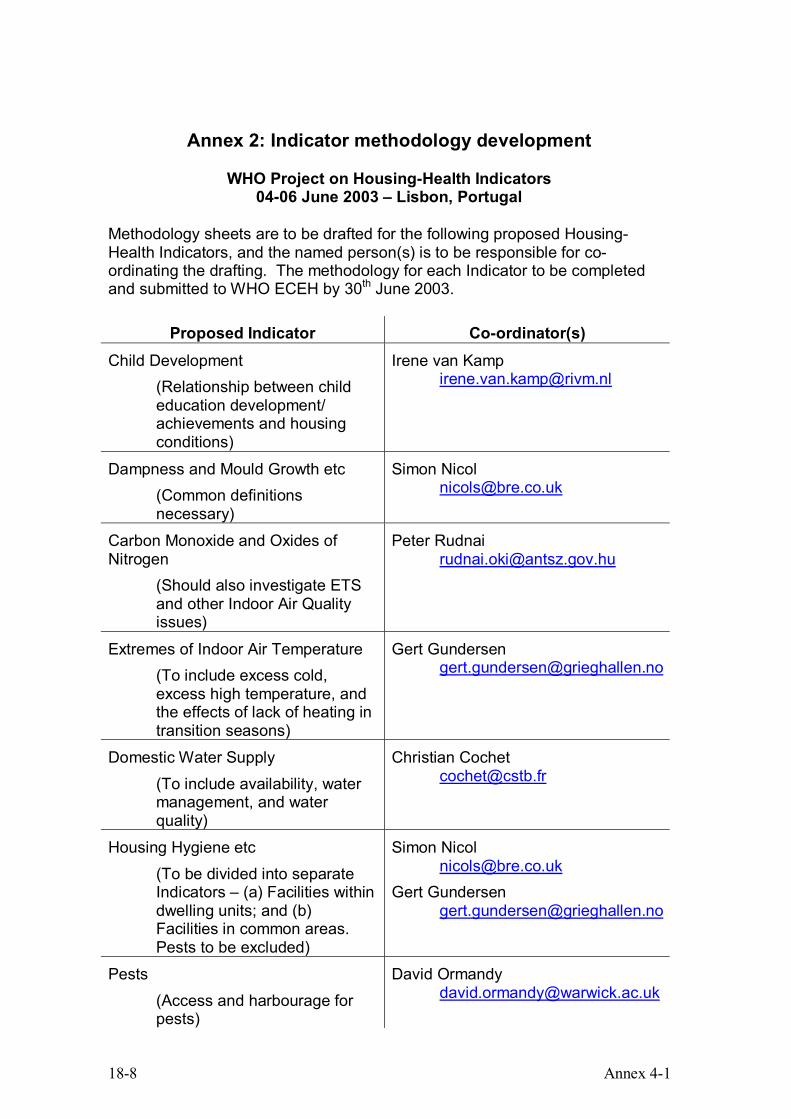
Annex 2: Indicator methodology development
WHO Project on Housing-Health Indicators 04-06 June 2003 – Lisbon, Portugal
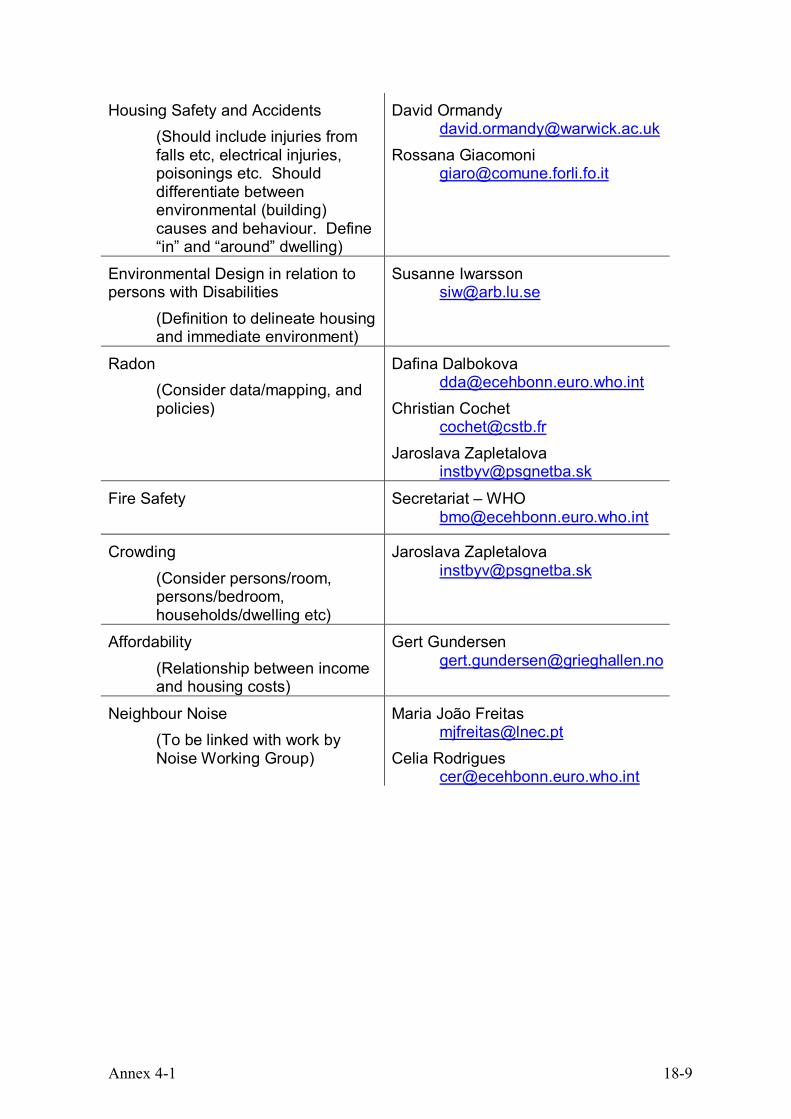
Methodology sheets are to be drafted for the following proposed Housing-Health Indicators, and the named person(s) is to be responsible for co-ordinating the drafting. The methodology for each Indicator to be completed and submitted to WHO ECEH by 30th June 2003.
Proposed Indicator Co-ordinator(s) Child Development
(Relationship between child education development/ achievements and housing conditions)
Irene van Kamp [email protected]
Dampness and Mould Growth etc (Common definitions necessary)
Simon Nicol [email protected]
Carbon Monoxide and Oxides of Nitrogen
(Should also investigate ETS and other Indoor Air Quality issues)
Peter Rudnai [email protected]
Extremes of Indoor Air Temperature (To include excess cold, excess high temperature, and the effects of lack of heating in transition seasons)
Gert Gundersen [email protected]
Domestic Water Supply (To include availability, water management, and water quality)
Christian Cochet [email protected]
Housing Hygiene etc (To be divided into separate Indicators – (a) Facilities within dwelling units; and (b) Facilities in common areas. Pests to be excluded)
Simon Nicol [email protected]
Gert Gundersen [email protected]
Pests (Access and harbourage for pests)
David Ormandy [email protected]
Annex 4-1 18-9
Housing Safety and Accidents (Should include injuries from falls etc, electrical injuries, poisonings etc. Should differentiate between environmental (building) causes and behaviour. Define “in” and “around” dwelling)
David Ormandy [email protected]
Rossana Giacomoni [email protected]
Environmental Design in relation to persons with Disabilities
(Definition to delineate housing and immediate environment)
Susanne Iwarsson [email protected]
Radon (Consider data/mapping, and policies)
Dafina Dalbokova [email protected]
Christian Cochet [email protected]
Jaroslava Zapletalova [email protected]
Fire Safety
Secretariat – WHO [email protected]
Crowding (Consider persons/room, persons/bedroom, households/dwelling etc)
Jaroslava Zapletalova [email protected]
Affordability (Relationship between income and housing costs)
Gert Gundersen [email protected]
Neighbour Noise (To be linked with work by Noise Working Group)
Maria João Freitas [email protected]
Celia Rodrigues [email protected]
18-10 Annex 4-2
WORLD HEALTH ORGANIZATION REGIONAL OFFICE FOR EUROPE WELTGESUNDHEITSORGANISATION REGIONALBÜRO FÜR EUROPA
ORGANISATION MONDIALE DE LA SANTÉBUREAU RÉGIONAL DE L'EUROPE
ВСЕМИРНАЯ ОРГАНИЗАЦИЯ ЗДРАВООХРАНЕНИЯЕВРОПЕЙСКОЕ РЕГИОНАЛЬНОЕ БЮРО
EUROPEAN CENTRE FOR ENVIRONMENT AND HEALTH BONN OFFICE
Annex 4-2 Follow up on the Lisbon Meeting:
Progress Report
DEVELOPMENT OF
ENVIRONMENT AND HEALTH INDICATORS FOR
EUROPEAN UNION COUNTRIES
ECOEHIS
Grant Agreement SPC 2002300
Between the European Commission, DG Sanco and the World Health Organization, Regional Office for Europe
© World Health Organization 2004 This project was co-sponsored by the European Commission. The views expressed in this report can in no way be taken to reflect the official opinion of the European Commission or the World Health Organization. The designations employed and the presentation of the material in this report do not imply the expression of any opinion whatsoever concerning the legal status of any country, territory, city or area or of its authorities, or concerning the delimitation of its frontiers or boundaries. The World Health Organization does not warrant that the information contained in this publication is complete and correct and shall not be liable for any damages incurred as a result of its use.
Annex 4-2 18-11
Grant Agreement SPC 2002300
Between the European Commission, DG Sanco and the World Health Organization, Regional Office for Europe
Progress report, 12.09.2003
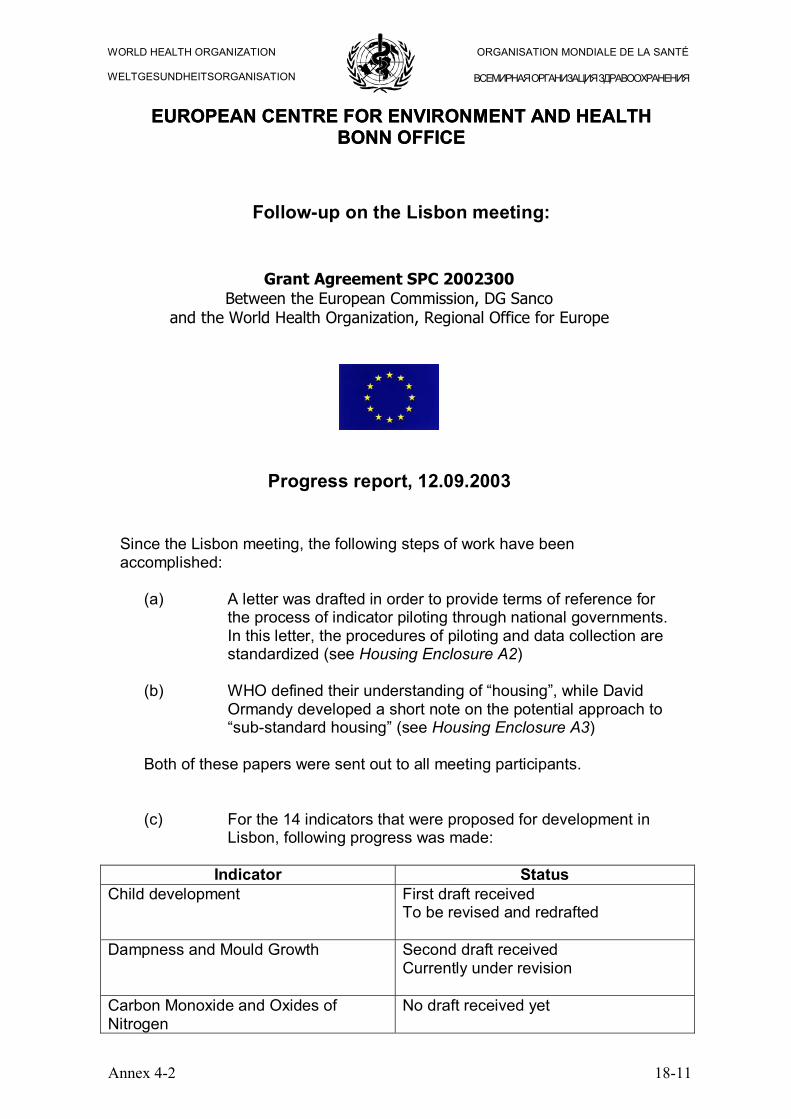
Since the Lisbon meeting, the following steps of work have been accomplished:
(a) A letter was drafted in order to provide terms of reference for
the process of indicator piloting through national governments. In this letter, the procedures of piloting and data collection are standardized (see Housing Enclosure A2)
(b) WHO defined their understanding of “housing”, while David
Ormandy developed a short note on the potential approach to “sub-standard housing” (see Housing Enclosure A3)
Both of these papers were sent out to all meeting participants.
(c) For the 14 indicators that were proposed for development in Lisbon, following progress was made:
Indicator Status
Child development First draft received To be revised and redrafted
Dampness and Mould Growth Second draft received Currently under revision
Carbon Monoxide and Oxides of Nitrogen
No draft received yet
EUROPEAN CENTRE FOR ENVIRONMENT AND HEALTH BONN OFFICE
WORLD HEALTH ORGANIZATION WELTGESUNDHEITSORGANISATION
ORGANISATION MONDIALE DE LA SANTÉ
ВСЕМИРНАЯ ОРГАНИЗАЦИЯ ЗДРАВООХРАНЕНИЯ
EUROPEAN CENTRE FOR ENVIRONMENT AND HEALTH
BONN OFFICE
Follow-up on the Lisbon meeting:
18-12 Annex 4-2
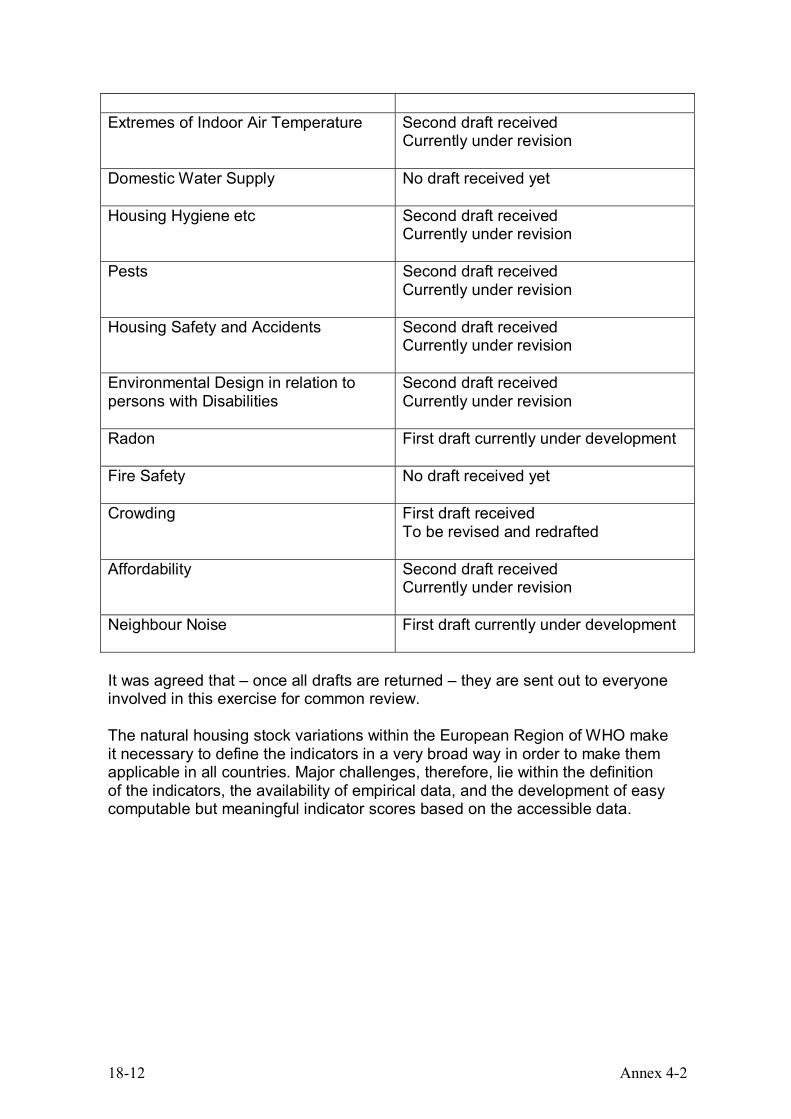
Extremes of Indoor Air Temperature Second draft received
Currently under revision
Domestic Water Supply No draft received yet
Housing Hygiene etc Second draft received Currently under revision
Pests Second draft received Currently under revision
Housing Safety and Accidents Second draft received Currently under revision
Environmental Design in relation to persons with Disabilities
Second draft received Currently under revision
Radon First draft currently under development
Fire Safety No draft received yet
Crowding First draft received To be revised and redrafted
Affordability Second draft received Currently under revision
Neighbour Noise First draft currently under development
It was agreed that – once all drafts are returned – they are sent out to everyone involved in this exercise for common review. The natural housing stock variations within the European Region of WHO make it necessary to define the indicators in a very broad way in order to make them applicable in all countries. Major challenges, therefore, lie within the definition of the indicators, the availability of empirical data, and the development of easy computable but meaningful indicator scores based on the accessible data.
Annex..4-3 18-13
WORLD HEALTH ORGANIZATION REGIONAL OFFICE FOR EUROPE WELTGESUNDHEITSORGANISATION REGIONALBÜRO FÜR EUROPA
ORGANISATION MONDIALE DE LA SANTÉBUREAU RÉGIONAL DE L'EUROPE
ВСЕМИРНАЯ ОРГАНИЗАЦИЯ ЗДРАВООХРАНЕНИЯЕВРОПЕЙСКОЕ РЕГИОНАЛЬНОЕ БЮРО
EUROPEAN CENTRE FOR ENVIRONMENT AND HEALTH BONN OFFICE
Annex 4-3 Follow up on the Lisbon Meeting: Terms of Reference for Piloting
DEVELOPMENT OF
ENVIRONMENT AND HEALTH INDICATORS FOR
EUROPEAN UNION COUNTRIES
ECOEHIS
Grant Agreement SPC 2002300
Between the European Commission, DG Sanco and the World Health Organization, Regional Office for Europe
© World Health Organization 2004 This project was co-sponsored by the European Commission. The views expressed in this report can in no way be taken to reflect the official opinion of the European Commission or the World Health Organization. The designations employed and the presentation of the material in this report do not imply the expression of any opinion whatsoever concerning the legal status of any country, territory, city or area or of its authorities, or concerning the delimitation of its frontiers or boundaries. The World Health Organization does not warrant that the information contained in this publication is complete and correct and shall not be liable for any damages incurred as a result of its use.
18-14 Annex 4-3
Follow-up on the Lisbon meeting:
Grant Agreement SPC 2002300 Between the European Commission, DG Sanco
and the World Health Organization, Regional Office for Europe
Terms of Reference
Piloting Experimental set of Housing-Health Indicators A – Scope and purpose of the work to be performed: The WHO European Centre for Environmental Health Bonn Office is developing a system of Environmental Health Indicators based on internationally agreed methodology and comparable data. These Indicators are intended to describe the state of environmental health and so inform decisions, monitor programmes and allow for comparisons nationally and internationally. Housing is one of the basic necessities, but many housing conditions can have a severe impact on the health of the occupants, particularly the very young and the elderly. As housing is complex issue, a core set of Housing-Health Indicators is being developed. A group of experts met in Lisbon and discussed proposals for Housing-Health Indicators. They have agreed upon a first set of Indicators which have now to be piloted. After this piloting exercise, a set of around four core Housing-Health finalized Indicators will be adopted by the same expert group. Once the Housing-Health Indicators have been adopted at expert level, they will be put forward within the set of Environmental Health Indicators to the Conference for Ministers of the Environment and Health in Budapest in 2004.
B - Content : The major questions that have to be answered during the piloting phase are the following: 1. Are the data needed to calculate or describe the indicator
available? If so, over which period of time are they available? If not readily available –
2. What are the chances of the data becoming available over the next three years?
EUROPEAN CENTRE FOR ENVIRONMENT AND HEALTH BONN OFFICE
WORLD HEALTH ORGANIZATION WELTGESUNDHEITSORGANISATION
ORGANISATION MONDIALE DE LA SANTÉ
ВСЕМИРНАЯ ОРГАНИЗАЦИЯ ЗДРАВООХРАНЕНИЯ
Annex..4-3 18-15
Are there any restrictions on obtaining the data? Are there any costs involved in obtaining the data?
3. If it is possible, use the data to calculate the indicator (for your country), and discuss with colleagues - Does the Indicator work? Does the Indicator need adjustment? Is it understandable? Does it call for Action? If yes which ones? Is it attractive?
4. Is the indicator useful, relevant, available at sub national level (local, regional)?
C - Time frame and follow up activities Once all the comments on each indicator are received by the WHO Secretariat, the results will be consolidated and proposed for discussion to the expert group. The proposed time frame is as follows:
- Month 0* Final indicator sheets for piloting received by WHO Secretariat from experts
- Month 0 + 15 days Piloting commences through partners identified by the WHO co-ordinators in each country
- Month 4 Results of the piloting sent to the WHO Secretariat - Early 2004 Final expert meeting in Madrid to identify core set of
Indicators (tentative date). The WHO co-ordinators are also invited to discuss the possibility of including new Indicators to the existing set for discussion by the expert group at its next meeting. However, so that such proposals will receive enough attention from all the other member of the groups, they should be sent to the WHO Secretariat before the 1st of October 2003. If received by that date, the Secretariat will circulate them to all partners in the piloting exercise for comment and, if possible, piloting. For any additional information that may be needed please contact: Brigitte Moissonier, Housing and Health Technical Officer, European Centre for Environment and Health Bonn Office at: [email protected] David Ormandy, Warwick University at: [email protected] ___________ *Month 0 equals the date when all draft versions for piloting have been received by WHO
18-16 Annex 4-4
WORLD HEALTH ORGANIZATION REGIONAL OFFICE FOR EUROPE WELTGESUNDHEITSORGANISATION REGIONALBÜRO FÜR EUROPA
ORGANISATION MONDIALE DE LA SANTÉBUREAU RÉGIONAL DE L'EUROPE
ВСЕМИРНАЯ ОРГАНИЗАЦИЯ ЗДРАВООХРАНЕНИЯЕВРОПЕЙСКОЕ РЕГИОНАЛЬНОЕ БЮРО
EUROPEAN CENTRE FOR ENVIRONMENT AND HEALTH BONN OFFICE
Annex 4-4 Follow up on the Lisbon Meeting:
Defining Housing and Substandard Housing
DEVELOPMENT OF
ENVIRONMENT AND HEALTH INDICATORS FOR
EUROPEAN UNION COUNTRIES
ECOEHIS
Grant Agreement SPC 2002300
Between the European Commission, DG Sanco and the World Health Organization, Regional Office for Europe
© World Health Organization 2004 This project was co-sponsored by the European Commission. The views expressed in this report can in no way be taken to reflect the official opinion of the European Commission or the World Health Organization. The designations employed and the presentation of the material in this report do not imply the expression of any opinion whatsoever concerning the legal status of any country, territory, city or area or of its authorities, or concerning the delimitation of its frontiers or boundaries. The World Health Organization does not warrant that the information contained in this publication is complete and correct and shall not be liable for any damages incurred as a result of its use.
Annex 4-4 18-17
Follow-up on the Lisbon meeting:
Grant Agreement SPC 2002300 Between the European Commission, DG Sanco
and the World Health Organization, Regional Office for Europe
Defining Housing and Sub-Standard Housing
1. Devising an acceptable and understandable definition of “housing” is not simple. The WHO definition states that – “housing” is the conjunction of
• the house (the physical, material shelter), • the home (the psycho-social meaning of the shelter, and the social
dimension of households), • the immediate housing environment (social, material and
infrastructural aspects of the near neighbourhood) • the community (people living in the same area).
2. To attempt a definition of “sub-standard housing” it is assumed that the
aim is to identify when the physical aspects of housing could have a negative impact on the household and/or the community.
3. Initially, it is proposed to limit the definition to the “house”, and, for clarity,
to use the term “dwelling” – ie, to attempt a definition for “sub-standard dwelling”. A simple definition of a “dwelling” could be –
any form of accommodation which is used for human habitation, or is intended or available for such use.
Such a definition would include any form of construction, whether temporary or permanent, and any type of dwelling – eg, house, apartment etc. Ideally, it should also include any paths, gardens, and outbuildings etc that are associated or for use with, or give access to the dwelling, whether or not they are for the exclusive use of that dwelling or
ORGANISATION MONDIALE DE LA SANTÉ
ВСЕМИРНАЯ ОРГАНИЗАЦИЯ ЗДРАВООХРАНЕНИЯ
EUROPEAN CENTRE FOR ENVIRONMENT AND HEALTH BONN OFFICE
WORLD HEALTH ORGANIZATION WELTGESUNDHEITSORGANISATION
18-18 Annex 4-4
shared with other dwellings. And, if necessary, this extension could be added to the main part of the definition.
4. To determine whether a dwelling is sub-standard it is necessary to define the standard. Any definition of standard should be as clear and precise as possible so that, whoever applies the standard, it will be obvious whether or not it has been met. This is relatively straight-forward for some aspects which are primarily factual and quantitative. For example, stating that there should be a wash hand basin, a supply of hot water, a kitchen, etc. It is less straight-forward, however, for qualitative matters such as the state of repair, the presence of dampness, the air quality, etc. Setting a standard raising other issues. Once set, a specific and clear standard can become out-of-date, but, where it applies to existing housing, politically difficult to revise as housing previously deemed satisfactory may fail to meet the revised standard. There is also a tendency for minimum standards to become the norm – practically and economically, there can be good arguments why a minimum standard need not be exceeded. Setting an inter-nationally useful standard raises additional issues. The design and construction of dwellings in each country will reflect and have been influenced by political, social, cultural, geographic and climatic factors. This means that what is considered a basically satisfactory dwelling in one country could be seen as unacceptable in another. Setting a standard to the lowest common denominator would be a disincentive for countries with housing generally well above that standard.
5. A possible solution, but not one without draw-backs, would be to set health based criteria to be satisfied, and to require countries to define how those criteria should be met. Explanations and guidance could be given for each of the criteria to encourage compliance. This approach would have the benefit of emphasising the health based approach, and, as knowledge on threats to health in the domestic environment increases, allow this to be incorporated. While inter-national comparisons would be faulted, nationally this would be useful. This approach does not, however, provide a clear and precise definition. Although it would be clear which dwellings were grossly unhealthy, it would become less apparent for those close to the borderline. Providing the precision would depend on each country and how it specified how the criteria should be met. An outline suggestion for this approach is as follows – Basic physiological requirements Capability to avoid exposure to excessive low or high indoor temperatures Maintenance of indoor air quality Provision for natural and safe artificial lighting while avoiding glare Protection against excess noise Provision of internal and external amenity and recreation space
Annex 4-4 18-19
Basic psychological requirements Provision for privacy for individuals Provision for family life Provision for maintenance of domestic hygiene Provision for maintenance of personal hygiene
Protection from infection Provision of a supply of safe water, sufficient for domestic purposes Provision of sanitary accommodation A safe means for removal and disposal of sewage and waste water Exclusion of pests from the interior of the dwelling Provision for the safe storage, preparation and cooking of food
Protection from accidental injuries The construction of the structure to be of adequate strength The design and installations to reduce the likelihood of fires, and incorporate fire precautions and means of escape The installations for gas to avoid explosions and poisonings The installations for electricity to avoid shocks and burns Avoidance of features which increase the likelihood of falls and mechanical injuries
18-20 Annex 4-5
1
WORLD HEALTH ORGANIZATION REGIONAL OFFICE FOR EUROPE WELTGESUNDHEITSORGANISATION REGIONALBÜRO FÜR EUROPA
ORGANISATION MONDIALE DE LA SANTÉBUREAU RÉGIONAL DE L'EUROPE
ВСЕМИРНАЯ ОРГАНИЗАЦИЯ ЗДРАВООХРАНЕНИЯЕВРОПЕЙСКОЕ РЕГИОНАЛЬНОЕ БЮРО
EUROPEAN CENTRE FOR ENVIRONMENT AND HEALTH BONN OFFICE
Annex 4-5
Summary of WHO Meeting
Rome, 15 January 2004
DEVELOPMENT
OF ENVIRONMENT AND HEALTH INDICATORS
FOR EUROPEAN UNION COUNTRIES
ECOEHIS
Grant Agreement SPC 2002300 Between the European Commission, DG Sanco
and the World Health Organization, Regional Office for Europe
© World Health Organization 2004 This project was co-sponsored by the European Commission. The views expressed in this report can in no way be taken to reflect the official opinion of the European Commission or the World Health Organization. The designations employed and the presentation of the material in this report do not imply the expression of any opinion whatsoever concerning the legal status of any country, territory, city or area or of its authorities, or concerning the delimitation of its frontiers or boundaries. The World Health Organization does not warrant that the information contained in this publication is complete and correct and shall not be liable for any damages incurred as a result of its use.
Annex 4-5 18-21
2
Development of
Environment and Health Indicators for EU
Countries (ECOEHIS)
WHO technical meeting on
"Housing-Health Indicators”
Results of review and data availability screening in Member States
Rome, Italy, 15-16 January 2004 Summary report
Grant Agreement SPC 2002300 Between the European Commission, DG Sanco
and the World Health Organization, Regional Office for Europe
18-22 Annex 4-5
3
ABSTRACT
At this second meeting on housing and health indicators, held as part of the environmental healthindicator project (ECOEHIS) co-sponsored by EC DG SANCO (SPC 2002300), environment and healthindicators in the housing and health field were agreed for the WHO European Region. The workaccomplished at the meeting was based on the development of a housing and health indicator set at thefirst meeting in Lisbon (June 2003), the drafting and reviewing of indicator templates, and the screening process of available data. The results of the screening process, identifying the implementability of thedeveloped indicators, was at the centre of discussion at the Rome meeting. During the meeting, thegroup reviewed participants’ reports on their own countries’ data on selected housing and healthindicators and their preliminary testing of indicators. A main set of indicators was proposed forsuggestion to the European Commission and the participating countries, covering (a) driving forces for, (b) exposure to and (c) health effects of inadequate housing conditions. In addition, some indicatorscover the policy and action steps to address the identified housing and health challenges.
Keywords HOUSING ENVIRONMENTAL HEALTH INDICATORS EUROPEAN UNION
Address requests about publications of the WHO Regional Office to: • by e-mail [email protected] (for copies of publications)
[email protected] (for permission to reproduce them) [email protected] (for permission to translate them)
• by post Publications WHO Regional Office for Europe Scherfigsvej 8 DK-2100 Copenhagen Ø, Denmark
© World Health Organization 2004
All rights reserved. The Regional Office for Europe of the World Health Organization welcomes requests for permission to reproduce or translate its publications, in part or in full.
The designations employed and the presentation of the material in this publication do not imply the expression of any opinion whatsoever on the part of the World Health Organization concerning the legal status of any country, territory, city or area or of its authorities, or concerning the delimitation of its frontiers or boundaries. Where the designation “country or area” appears in the headings of tables, it covers countries, territories, cities, or areas. Dotted lines on maps represent approximate border lines for which there may not yet be full agreement.
The mention of specific companies or of certain manufacturers’ products does not imply that they are endorsed or recommended by the World Health Organization in preference to others of a similar nature that are not mentioned. Errors and omissions excepted, the names of proprietary products are distinguished by initial capital letters.
The World Health Organization does not warrant that the information contained in this publication is complete and correct and shall not be liable for any damages incurred as a result of its use. The views expressed by authors or editors do not necessarily represent the decisions or the stated policy of the World Health Organization.
Annex 4-5 18-23
4
CONTENTS
Meeting summary ............................................................................................5
Housing and Health Indicators -.......................................................................... Suggested list of indicators for a housing subset to be piloted ............................. within the EHI framework.................................................................................9
Annex 1 - Scope and purpose ......................................................................... 13
Annex 2 - Indicator templates – draft version.................................................. 14
Annex 3 - Participants List .............................................................................. 41
18-24 Annex 4-5
5
Meeting Summary
Report of the 2nd WHO technical meeting on Housing-Health Indicators (Rome, January 15-16 2004)
The second meeting on housing and health indicators was held as part of the environmental health indicator project (ECOEHIS) led by the WHO and co-sponsored by EC DG SANCO (SPC 2002300). This summary is divided into two sections: (a) a short description of the work accomplished prior to the meeting, and (b) the summary of the discussions and the conclusions drawn at the meeting.
Part A: Work steps prior to the meeting
Based on the first WHO technical meeting on housing-health indicators in Lisbon (June 2003), the WHO secretariat has received 17 suggested draft templates for housing-health indicators. These drafts were sent out for peer review within the housing indicator expert group, and selected indicators were reviewed by external experts as well. Based on the comments and recommendations submitted by the reviewers, the experts were asked to update their indicator drafts including the suggestions of the reviewers. In total, review comments were received from eight countries. The final proposals were then sent out to all experts two days prior to the meeting in Rome, during which a selection process for the most relevant and feasible indicators was planned. In addition to the review, WHO asked each expert to “pre-test” his or her proposed indicator, using the available data of a country of their choice. The reviewers were asked to also compute the reviewed indicators, so that it was possible during the Rome meeting to have a first look into the potential results of some of the proposed indicators at country level, and discuss the difficulties arising from the application of the indicator. Next to the testing of the indicators, WHO arranged a preliminary data availability screening in various countries in order to collect information on the availability of the needed data. The basic data needs for the indicators were split up into categories (demographic data, housing stock data, morbidity and mortality data, regulation and other data), and answers were received from Sweden, Germany, Portugal, Hungary, Lithuania, Italy, and Kyrgyzstan. Furthermore, for the UK and Italy it has also been possible to have two local authorities reporting data availability for their municipality. Based on the coordination work of WHO and the contributions of the expert group, the Rome meeting was then using the following documents and information sources for the final discussion and selection of the core set of housing-health indicators:
updated and revised indicator draft sheets comments of reviewers preliminary tests of the indicators on country level data availability review on country level data availability review on local level
Annex 4-5 18-25
6
Part B: Conclusions drawn at the meeting
The 2nd WHO technical meeting on Housing-Health Indicators in Rome (January 15-16 2004) had the major objective to discuss and prioritize the 17 proposed indicator draft sheets, and select a reduced list of housing-health indicators to be suggested for integration into the general Environmental Health Indicator set. The expert group discussed each indicator based on a short presentation of the author and the review comments provided by the other experts. For the individual indicators, following recommendations were made:
1) Extremes of Indoor Air Temperatures The indicator was deemed useful and important. It was suggested to separate the two extremes of cold and heat in order to have a more precise data reporting for the indicator. The data needed for computation was confirmed. Necessary changes were listed and the WHO secretariat committed to updating the draft sheet and distributing it for final review.
2) Radon indicators For Radon, three separate fact sheets were proposed of which two were covering similar data. Radon was deemed as an important indicator although national reporting systems are already installed in most countries. It was agreed that the responsible experts would merge the three Radon indicators into one, focusing on the existence of national policies, guideline values and remediation programs.
3) Housing safety and accidents The housing safety and accidents indicator was discussed controversially, as it was deemed as a very relevant indicator but reviewers were doubtful regarding the data availability. It was agreed that the author would make several amendments to the indicator and reduce the amount / detailedness of data needed for the computation. It was also agreed that the indicator would be restricted to the effects of accidents and home-based injuries, as valid data on housing conditions triggering such accidents was mostly not available.
4) Dampness / mould growth The dampness and mould growth indicator was welcomed by the experts although it was noted that further development was needed regarding the measurement of the required data. It was agreed that this indicator was important enough to ask for the integration of one or two specific questions into national surveys, and to substitute required data by regional or local surveys if necessary. Furthermore, it was added that this indicator would have to be restricted to exposure data. The WHO secretariat committed to making the necessary changes and then provide the draft to the author for approval.
18-26 Annex 4-5
7
5) Accessibility The indicator was discussed extensively as all participants felt that it was strongly needed, but had doubts regarding the availability of data. Based on the discussion with the author and the review comments, it was decided that the indicator was to be changed towards a more pragmatic approach, restricting the indicator to the most important environmental barriers and functional limitations, or using % of elderly residents as a proxy for functional limitations. Also, it was decided to include the policy dimension into the indicator in order to get information on the treatment of this problem in the countries. The WHO secretariat committed to updating the draft sheet and have the changes approved by the author.
6) Affordability The affordability indicator was understood as a relevant pressure indicator, aiming at the identification of households not able to afford housing of adequate standard. It was therefore agreed that this indicator was important, and discussion focused on the measurement of affordability. It was decided that instead of the price level of housing on the market, the construction cost should be used, and that this should be compared to the national defined levels of poverty. Aspects of maintenance and running costs were also discussed, but it was agreed that it would make the computation to complex and should be considered for a later time, possibly leading to the development of a secondary indicator on affordability. The WHO secretariat committed to redrafting this indicator in agreement with the author.
7) Food safety The food safety indicator was deemed to be very detailed and complex, and data availability was doubtful. Also, it was agreed that it was hard to link health data with information on food safety conditions, and keep data collection consistent. It was therefore decided to drop this indicator, and include the provision of cooking facilities and a safe food storage (fridge) into the hygiene indicator.
8) Hygiene and sanitation The indicator on hygiene and sanitation was positively perceived although it was agreed that data availability may be a problem in some countries. The data requirements were therefore reduced, and it was decided that the indicator would need to be updated in the light of the revision of the latest revision of the indicator set on water and sanitation which covered similar areas to some extent. Finally, it was suggested to distinguish between the lack of hygiene equipment, and an inefficient quality of the equipment. The WHO secretariat committed to redrafting this indicator on the basis of the comments made, and adapt the content in relation to the revised water and sanitation indicator set.
9) Fire safety The indicator was accepted in general as it was reasonable and data availability could be demonstrated. Nevertheless, it was decided that it was more suitable to transfer the issue of fire safety in dwellings and related health outcomes into the Housing safety and accidents indicator in order to aggregate all effects of home safety and accidents within on indicator. The author of the housing safety and accidents indicator committed to merging these two indicators, including all comments received regarding the streamlining of the data needs. It was agreed that for fire safety, the issue of fire deaths was to be highlighted.
Annex 4-5 18-27
8
10) Crowding
There was strong agreement from the beginning that such an indicator had to be developed, and the discussion centered mostly on the various approaches for measuring crowding. It was concluded that the number of rooms per person was more appropriate than the floor area, and the meeting therefore agreed that the primary indicator result should be room availability, which could then be further qualified by a secondary indicator result on space availability. The participants also recommended that – to avoid confusions – national definitions of habitable rooms and floor area are to be applied. The WHO secretariat committed to including the proposed changes and get the final approval of the author.
11) Water supply in dwellings As the meeting participants were informed on the recent revision of the water and sanitation indicator set, it was agreed that no separate indicator on water supply was needed. It was decided to merge the question of water supply into the hygiene and sanitation indicator (to be done by WHO secretariat).
12) Pests and infestations The indicator was discussed as a relevant contribution, especially as it was closely related with health risks and exposures. Due to problems with data availability, it was decided to drop the indicator.
13) Crime and fear of crime The indicator was presented with a variety of computations based on an European survey which is regularly undertaken. Due to the data availability, it was agreed that the indicator would be relevant and the suggested definitions and computation methods were accepted. It was discussed whether it was possible to link health data with the data on objective crime rates, but in the end consensus was reached that this indicator would have to be restricted to the exposure to crime and the linked perception of crime. Therefore, it was agreed that the WHO secretariat just had to do some final editing.
14) Noise indicators Two indicators on noise (noise perception in neighbourhoods and noise regulation policies) were suggested but in the discussion it became evident that it would make more sense to include them into the noise indicator set, although the indicators are closely linked to residential noise sources and perception, and regulation approaches for residential neighbourhoods. The noise indicators were therefore dropped from the list of housing-health indicators.
18-28 Annex 4-5
9
Housing –Health indicators
Suggested list of indicators for a housing subset to be piloted within the EHI framework
Draft version prepared by Braubach, M. / Bonnefoy, X. / Ormandy, D.
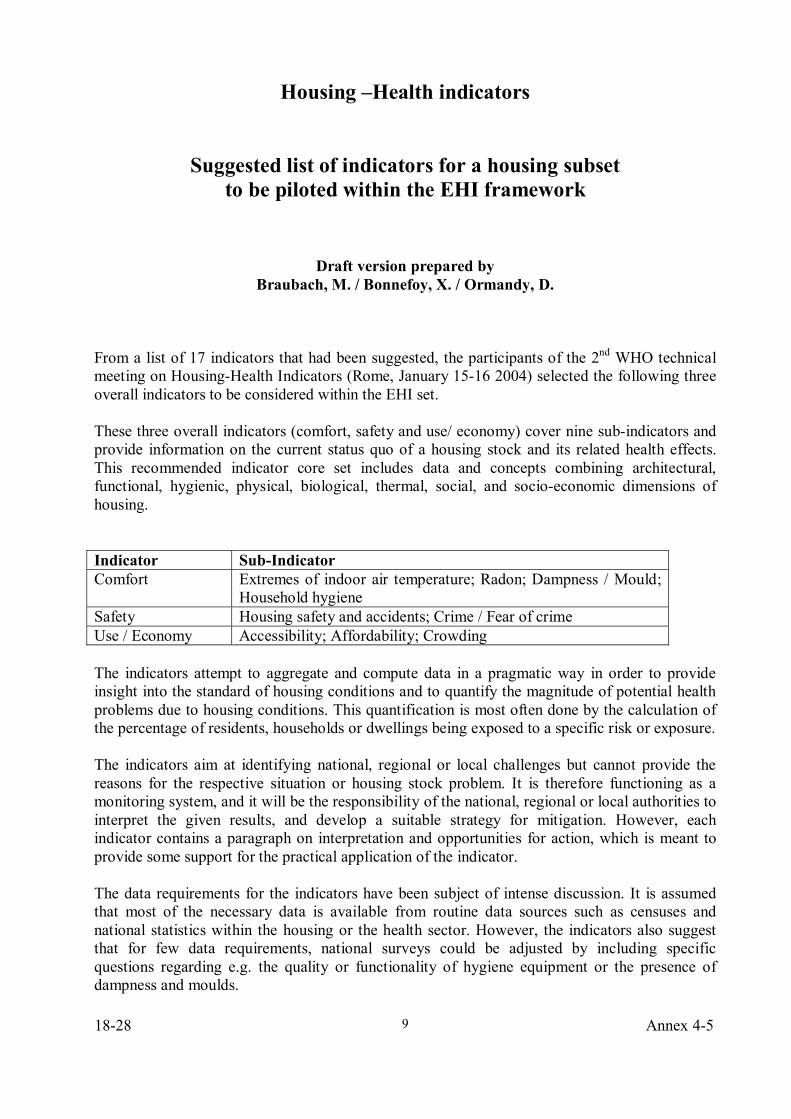
From a list of 17 indicators that had been suggested, the participants of the 2nd WHO technical meeting on Housing-Health Indicators (Rome, January 15-16 2004) selected the following three overall indicators to be considered within the EHI set. These three overall indicators (comfort, safety and use/ economy) cover nine sub-indicators and provide information on the current status quo of a housing stock and its related health effects. This recommended indicator core set includes data and concepts combining architectural, functional, hygienic, physical, biological, thermal, social, and socio-economic dimensions of housing. Indicator Sub-Indicator Comfort Extremes of indoor air temperature; Radon; Dampness / Mould;
Household hygiene Safety Housing safety and accidents; Crime / Fear of crime Use / Economy Accessibility; Affordability; Crowding The indicators attempt to aggregate and compute data in a pragmatic way in order to provide insight into the standard of housing conditions and to quantify the magnitude of potential health problems due to housing conditions. This quantification is most often done by the calculation of the percentage of residents, households or dwellings being exposed to a specific risk or exposure. The indicators aim at identifying national, regional or local challenges but cannot provide the reasons for the respective situation or housing stock problem. It is therefore functioning as a monitoring system, and it will be the responsibility of the national, regional or local authorities to interpret the given results, and develop a suitable strategy for mitigation. However, each indicator contains a paragraph on interpretation and opportunities for action, which is meant to provide some support for the practical application of the indicator. The data requirements for the indicators have been subject of intense discussion. It is assumed that most of the necessary data is available from routine data sources such as censuses and national statistics within the housing or the health sector. However, the indicators also suggest that for few data requirements, national surveys could be adjusted by including specific questions regarding e.g. the quality or functionality of hygiene equipment or the presence of dampness and moulds.
Annex 4-5 18-29
10
Finally, policy elements have been included in some of the indicators. This aims at the identification of national strategies and policies in the context of housing and health, and highlights the wide field of regulation and legal frameworks which can be used for setting minimum standards or providing public support – be it financial or administrative – to guarantee equal access to quality housing. Indicator overview “Comfort”
EXTREMES OF INDOOR AIR TEMPERATURE
This indicator combines data on extreme climate conditions with health data (mortality and hospitalization cases), assuming that housing quality will be an essential element in maintaining acceptable indoor temperature levels. Low insulation quality, inadequate ventilation opportunities and ineffective or expensive heating systems can be relevant factors linking the indoor temperature level, housing conditions and health.
RADON
This indicator aggregates data from in situ Radon measurement and from mitigation work. It combines this quantification of exposure conditions with the existence of national policies on Radon in housing. As radon-prone areas, based on their geology, are the first reason for Radon exposure, the policy context is a most suitable tool for the reduction of residential Radon exposure. The case of use of radon-emitting building materials has been consciously overlooked.
DAMPNESS/MOULD
This indicator uses data on dampness and – on a second level – mould growth and tries to assess the amount of persons / dwellings being exposed. It is based on the quality of the dwelling (low tightness of windows, inadequate design, inefficient ventilation equipment) and can also be affected by an increasing number of residents per dwelling. As it seems difficult to directly link dampness with health effects on household level, this indicator is only dealing with the exposure conditions and does not include health data.
HOUSEHOLD HYGIENE
18-30 Annex 4-5
11
This indicator aggregates data on the presence – and quality – of selected hygiene amenities such as water supply, shower/bath or toilet. It includes data on dwellings, households or persons not being equipped with these amenities, and – if available – data on dwellings, households or persons being equipped with substandard amenities that do not provide efficient service. As it seems difficult to directly link the non-existence or substandard quality of hygiene amenities with health effects on household level, this indicator is only dealing with the exposure conditions and does not include health data.
“Safety”
HOUSING SAFETY AND ACCIDENTS
This indicator deals with the quantity of health effects and death cases as a result of accidents and injuries in and around the private home. This includes (a) the occurrence of burns, injuries and poisonings, and (b) the occurrence of deaths by home accidents, poisonings and – especially – fires. It is assumed that design and quality of housing is a relevant cause of home accidents leading to a wide range of health outcomes. This indicator deals almost exclusively with health data and tries to identify the number of housing-related injuries and deaths, as it seems difficult to access valid data on housing safety conditions per se.
CRIME / FEAR OPF CRIME
This indicator deals with physical and mental health effects related to the occurrence of crime, and more generally fear of crime. It aggregates available data on crime rates within residential areas and distinguishes between crime against persons and objects, and describes the number of persons perceiving subjective fear of crime within their neighbourhood or the number of persons taking precautionary action. As it seems difficult to access data on the health effects of such crime and fear of crime, this indicator is restricted to the exposure level.
“Use / Economy”
ACCESSIBILITY
This indicator focuses on the accessibility of the housing stock and compares the amount of physical environmental barriers with the number of persons with functional limitations. In case the required data on number of people with functional limitations does not exist, it takes the age group of 75 years and over as the main population at risk. The indicator also includes a policy dimension, asking whether national polices on housing adaptation exist and how many dwellings
Annex 4-5 18-31
12
have been adapted in total. This indicator does not use health data as the effect of inadequate housing, but includes health data on functional limitations as a cause for specific housing needs.
AFFORDABILITY
This indicator looks at the financial resources that are required for purchasing a square meter of construction, and combines the cost for a 60 square meter dwelling with the percentage of the population living in absolute or relative poverty. The comparison of the required resources and the poverty level gives insight into the affordability level of housing and can explain the pressure households may face on the housing market. The indicator assumes that low affordability of housing will often lead to inadequate housing conditions for the less affluent part of the population, and be a relevant cause for many housing problems affecting health. The indicator does not include health data in the computation.
CROWDING
This indicator combines data on households and residents with the statistical information on room number and floor area. Using national definitions, it identifies the number of households with less than one room per person and – on a second level – the number of households with less than 14 square meter per person. As it is difficult to obtain data linking the occurrence of crowding with health effects on household level, this indicator is restricted to the identification of exposure to crowding.
18-32 Annex 4-5
13
Annex 1
Scope and purpose WORLD HEALTH ORGANIZATION REGIONAL OFFICE FOR EUROPE WELTGESUNDHEITSORGANISATION REGIONALBÜRO FÜR EUROPA
ORGANISATION MONDIALE DE LA SANTÉBUREAU RÉGIONAL DE L'EUROPE
ВСЕМИРНАЯ ОРГАНИЗАЦИЯ ЗДРАВООХРАНЕНИЯЕВРОПЕЙСКОЕ РЕГИОНАЛЬНОЕ БЮРО
WHO technical meeting on "Housing-Health Indicators” / 5 December 2003 15-16 January 2004 – Rome, Italy
SCOPE AND PURPOSE
The WHO European Centre for Environmental Health Bonn Office is developing a system of Environmental Health Indicators based on internationally agreed methodology and comparable data. These Indicators are intended to describe the state of environmental health and so inform decisions, monitor programmes and allow for comparisons nationally and internationally1. Housing is one of the basic necessities, but many housing conditions can have a severe impact on the health of the occupants, particularly the very young and the elderly. As housing is complex issue, it is intended that the development of a set of core indicators for housing should be investigated. The Meeting in Rome will discuss the indicator drafts proposed for Housing Health Indicators as agreed upon at the first indicator meeting in Lisbon in June 2003. The objective is to identify from the set of 17 proposed indicators a core set of 4-5 housing indicators that will then be piloted and – according to their success – be suggested for integration into the global Environmental Health Indicator set. Background for the meeting are the suggested housing-health indicator drafts, which have already been sent out to all participants of the Lisbon meeting and the Rome meeting for their review. The meeting is being convened as part of the European Union project “Development of Environment and Health Indicators for EU countries”. Once the Housing Health Indicators have been finalised they will be put forward within the set of Environmental Health Indicators to the Conference for Ministers of the Environment and Health in Budapest in 2004.
1 “Environmental health indicators for the WHO European Region. Update of methodology, May 2002” -
http://www.euro.who.int/EHindicators/Indicators/20020319_1
Annex 4-5 18-33
14
Annex 2
Indicator templates – draft version The annex lists the available draft sheets of the indicators (as of January 27th, 2004) in the following order:
Economy / Use indicator
Affordability Crowding Accessibility
Comfort indicator
Extremes of Indoor Air Temperature Dampness and Mould growth Household hygiene Radon (still under preparation, not included)
Safety indicator
Housing safety and accidents Crime / Fear of crime
18-34 Annex 4-5
15
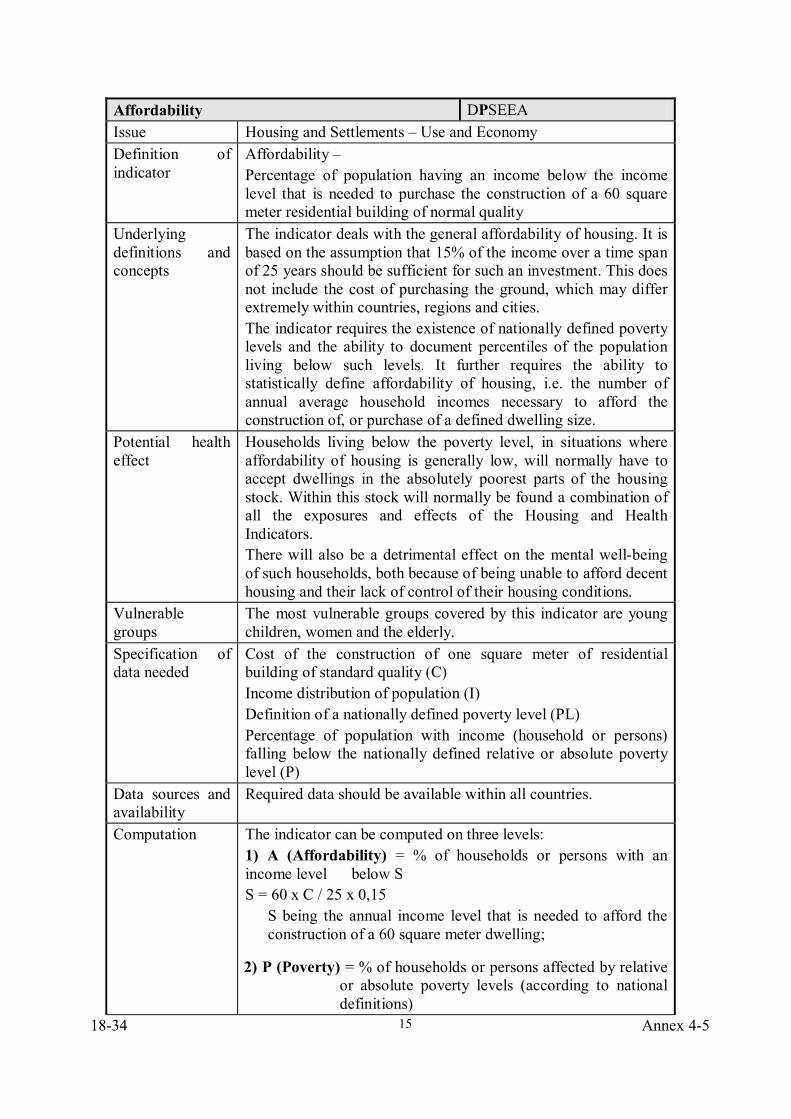
Affordability DPSEEA Issue Housing and Settlements – Use and Economy Definition of indicator
Affordability – Percentage of population having an income below the income level that is needed to purchase the construction of a 60 square meter residential building of normal quality
Underlying definitions and concepts
The indicator deals with the general affordability of housing. It is based on the assumption that 15% of the income over a time span of 25 years should be sufficient for such an investment. This does not include the cost of purchasing the ground, which may differ extremely within countries, regions and cities. The indicator requires the existence of nationally defined poverty levels and the ability to document percentiles of the population living below such levels. It further requires the ability to statistically define affordability of housing, i.e. the number of annual average household incomes necessary to afford the construction of, or purchase of a defined dwelling size.
Potential health effect
Households living below the poverty level, in situations where affordability of housing is generally low, will normally have to accept dwellings in the absolutely poorest parts of the housing stock. Within this stock will normally be found a combination of all the exposures and effects of the Housing and Health Indicators. There will also be a detrimental effect on the mental well-being of such households, both because of being unable to afford decent housing and their lack of control of their housing conditions.
Vulnerable groups
The most vulnerable groups covered by this indicator are young children, women and the elderly.
Specification of data needed
Cost of the construction of one square meter of residential building of standard quality (C) Income distribution of population (I) Definition of a nationally defined poverty level (PL) Percentage of population with income (household or persons) falling below the nationally defined relative or absolute poverty level (P)
Data sources and availability
Required data should be available within all countries.
Computation
The indicator can be computed on three levels: 1) A (Affordability) = % of households or persons with an income level below S S = 60 x C / 25 x 0,15
S being the annual income level that is needed to afford the construction of a 60 square meter dwelling;
2) P (Poverty) = % of households or persons affected by relative or absolute poverty levels (according to national definitions)
Annex 4-5 18-35
16
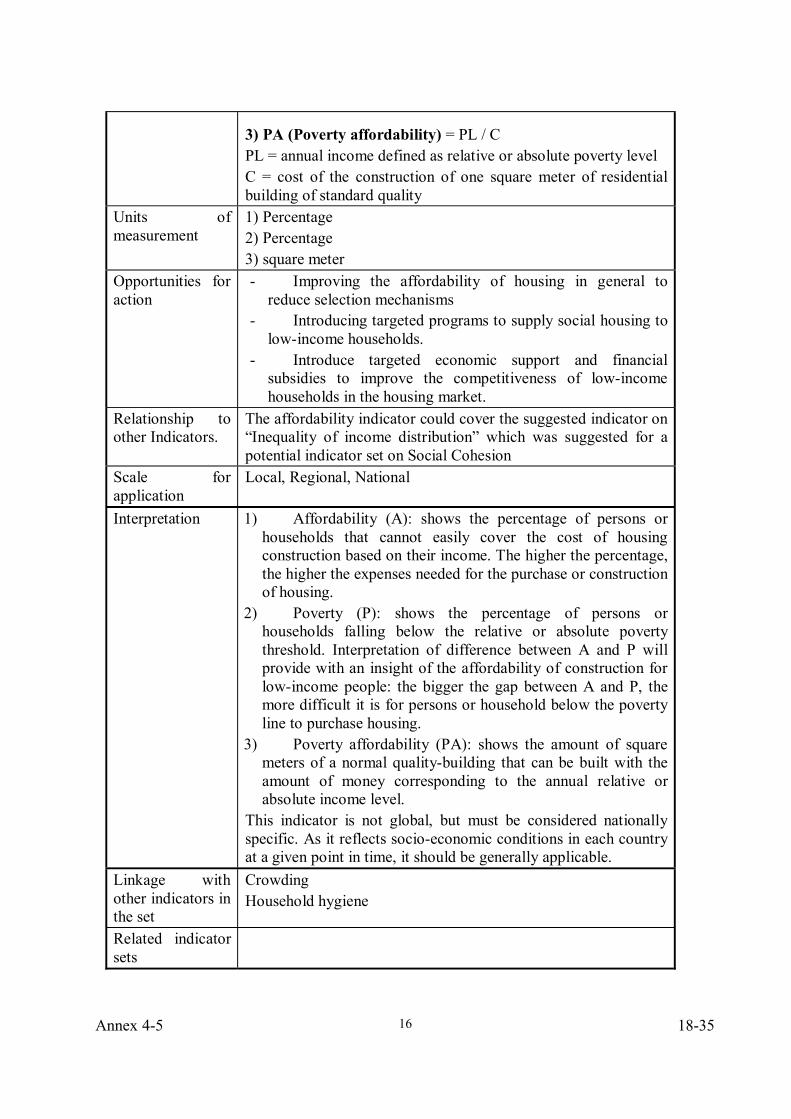
3) PA (Poverty affordability) = PL / C PL = annual income defined as relative or absolute poverty level C = cost of the construction of one square meter of residential building of standard quality
Units of measurement
1) Percentage 2) Percentage 3) square meter
Opportunities for action
- Improving the affordability of housing in general to reduce selection mechanisms
- Introducing targeted programs to supply social housing to low-income households.
- Introduce targeted economic support and financial subsidies to improve the competitiveness of low-income households in the housing market.
Relationship to other Indicators.
The affordability indicator could cover the suggested indicator on “Inequality of income distribution” which was suggested for a potential indicator set on Social Cohesion
Scale for application
Local, Regional, National
Interpretation
1) Affordability (A): shows the percentage of persons or households that cannot easily cover the cost of housing construction based on their income. The higher the percentage, the higher the expenses needed for the purchase or construction of housing.
2) Poverty (P): shows the percentage of persons or households falling below the relative or absolute poverty threshold. Interpretation of difference between A and P will provide with an insight of the affordability of construction for low-income people: the bigger the gap between A and P, the more difficult it is for persons or household below the poverty line to purchase housing.
3) Poverty affordability (PA): shows the amount of square meters of a normal quality-building that can be built with the amount of money corresponding to the annual relative or absolute income level.
This indicator is not global, but must be considered nationally specific. As it reflects socio-economic conditions in each country at a given point in time, it should be generally applicable.
Linkage with other indicators in the set
Crowding Household hygiene
Related indicator sets
18-36 Annex 4-5
17
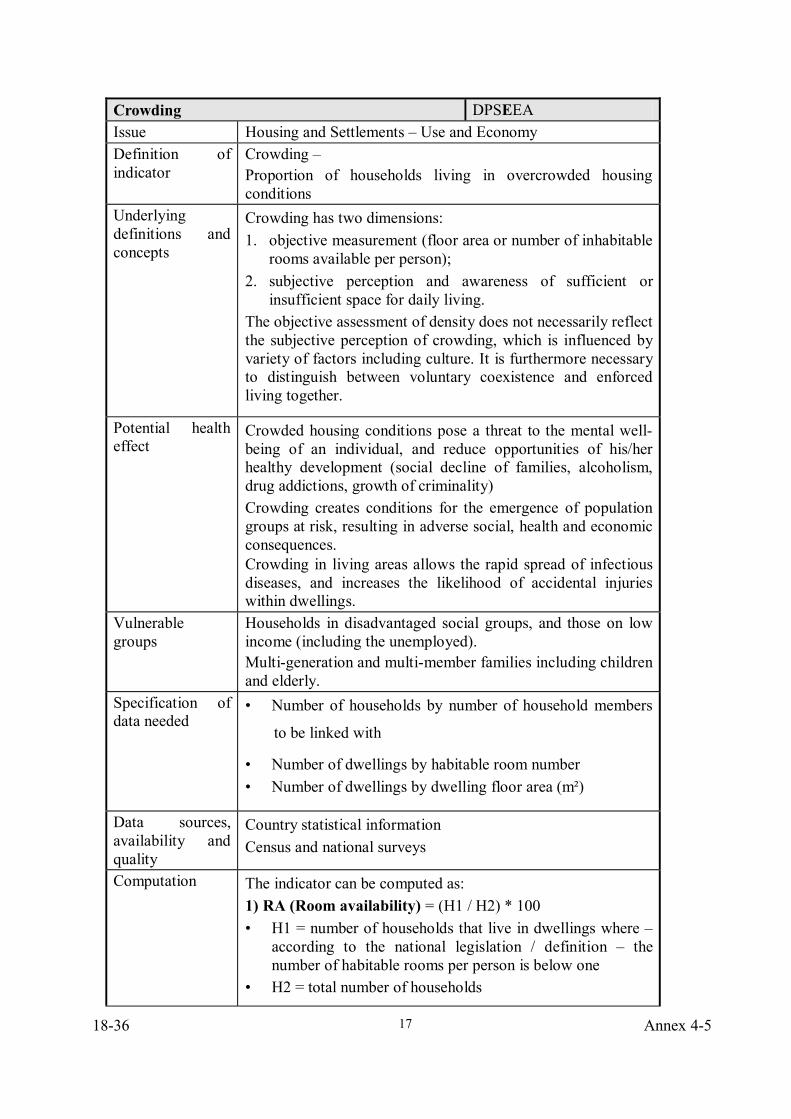
Crowding DPSEEA Issue Housing and Settlements – Use and Economy Definition of indicator
Crowding – Proportion of households living in overcrowded housing conditions
Underlying definitions and concepts
Crowding has two dimensions: 1. objective measurement (floor area or number of inhabitable
rooms available per person); 2. subjective perception and awareness of sufficient or
insufficient space for daily living. The objective assessment of density does not necessarily reflect the subjective perception of crowding, which is influenced by variety of factors including culture. It is furthermore necessary to distinguish between voluntary coexistence and enforced living together.
Potential health effect
Crowded housing conditions pose a threat to the mental well-being of an individual, and reduce opportunities of his/her healthy development (social decline of families, alcoholism, drug addictions, growth of criminality) Crowding creates conditions for the emergence of population groups at risk, resulting in adverse social, health and economic consequences. Crowding in living areas allows the rapid spread of infectious diseases, and increases the likelihood of accidental injuries within dwellings.
Vulnerable groups
Households in disadvantaged social groups, and those on low income (including the unemployed). Multi-generation and multi-member families including children and elderly.
Specification of data needed
• Number of households by number of household members
to be linked with
• Number of dwellings by habitable room number • Number of dwellings by dwelling floor area (m²)
Data sources, availability and quality
Country statistical information Census and national surveys
Computation
The indicator can be computed as: 1) RA (Room availability) = (H1 / H2) * 100 • H1 = number of households that live in dwellings where –
according to the national legislation / definition – the number of habitable rooms per person is below one
• H2 = total number of households
Annex 4-5 18-37
18
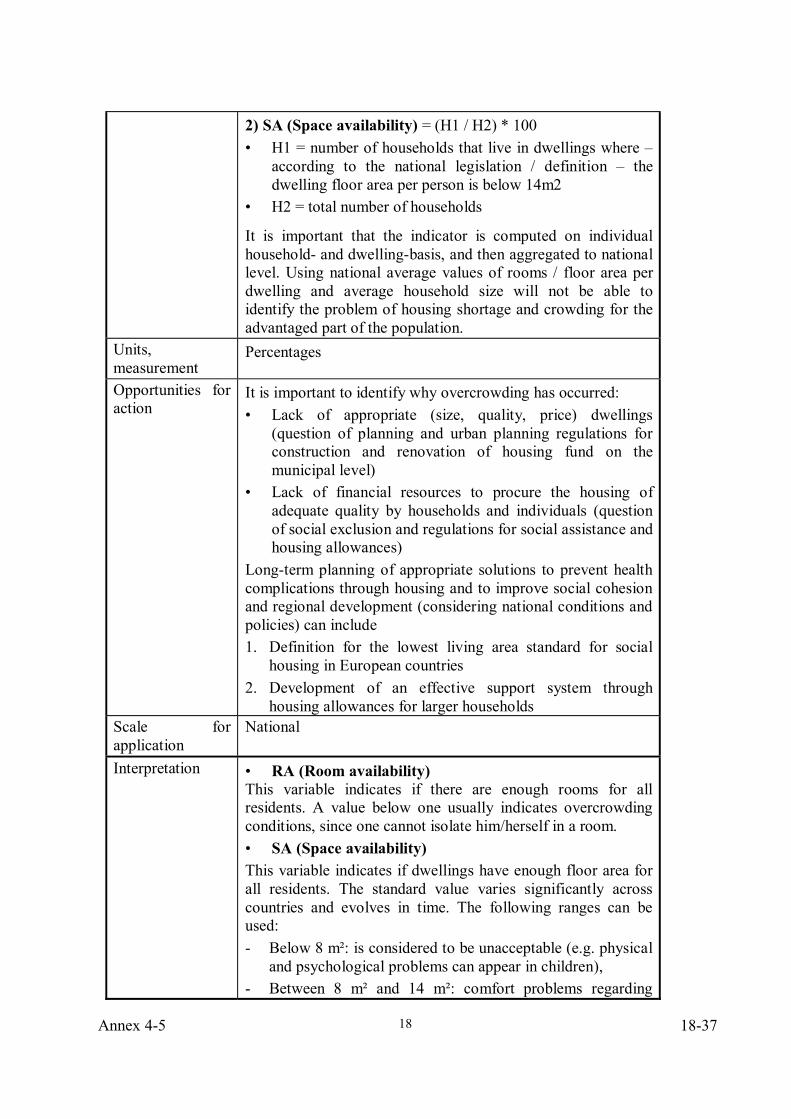
2) SA (Space availability) = (H1 / H2) * 100 • H1 = number of households that live in dwellings where –
according to the national legislation / definition – the dwelling floor area per person is below 14m2
• H2 = total number of households
It is important that the indicator is computed on individual household- and dwelling-basis, and then aggregated to national level. Using national average values of rooms / floor area per dwelling and average household size will not be able to identify the problem of housing shortage and crowding for the advantaged part of the population.
Units, measurement
Percentages
Opportunities for action
It is important to identify why overcrowding has occurred: • Lack of appropriate (size, quality, price) dwellings
(question of planning and urban planning regulations for construction and renovation of housing fund on the municipal level)
• Lack of financial resources to procure the housing of adequate quality by households and individuals (question of social exclusion and regulations for social assistance and housing allowances)
Long-term planning of appropriate solutions to prevent health complications through housing and to improve social cohesion and regional development (considering national conditions and policies) can include 1. Definition for the lowest living area standard for social
housing in European countries 2. Development of an effective support system through
housing allowances for larger households Scale for application
National
Interpretation
• RA (Room availability) This variable indicates if there are enough rooms for all residents. A value below one usually indicates overcrowding conditions, since one cannot isolate him/herself in a room. • SA (Space availability) This variable indicates if dwellings have enough floor area for all residents. The standard value varies significantly across countries and evolves in time. The following ranges can be used: - Below 8 m²: is considered to be unacceptable (e.g. physical
and psychological problems can appear in children), - Between 8 m² and 14 m²: comfort problems regarding
18-38 Annex 4-5
19
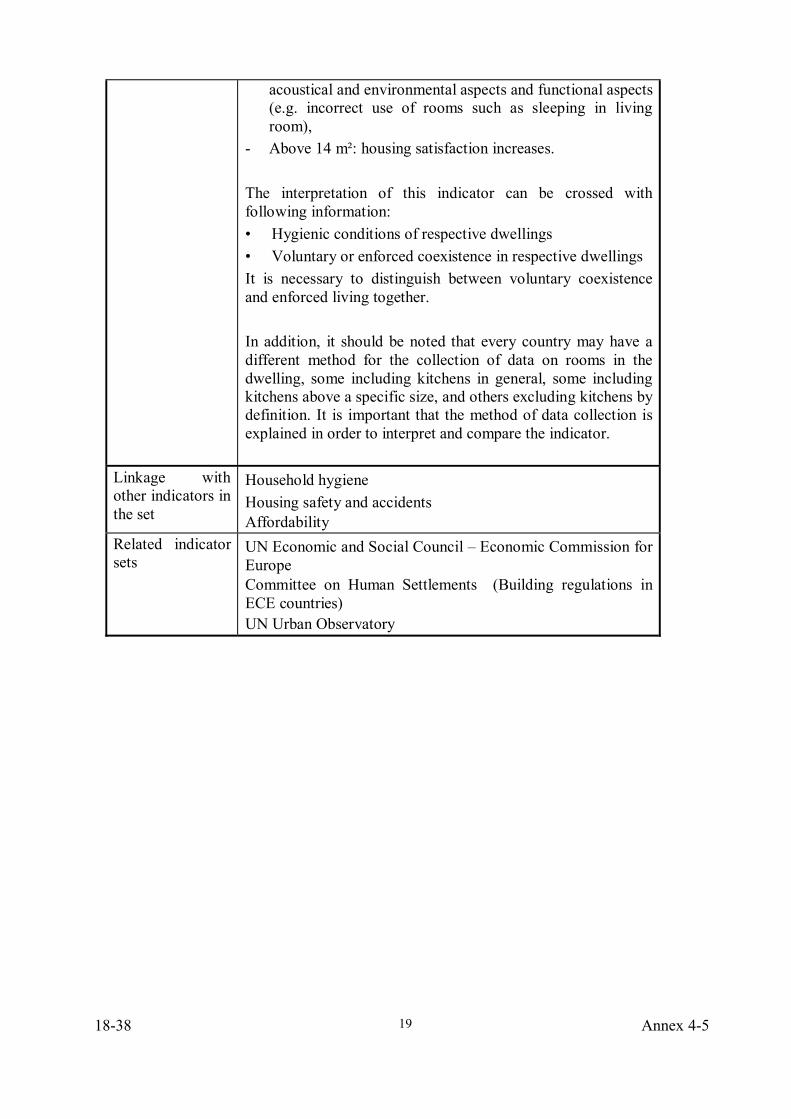
acoustical and environmental aspects and functional aspects (e.g. incorrect use of rooms such as sleeping in living room),
- Above 14 m²: housing satisfaction increases. The interpretation of this indicator can be crossed with following information: • Hygienic conditions of respective dwellings • Voluntary or enforced coexistence in respective dwellings It is necessary to distinguish between voluntary coexistence and enforced living together. In addition, it should be noted that every country may have a different method for the collection of data on rooms in the dwelling, some including kitchens in general, some including kitchens above a specific size, and others excluding kitchens by definition. It is important that the method of data collection is explained in order to interpret and compare the indicator.
Linkage with other indicators in the set
Household hygiene Housing safety and accidents Affordability
Related indicator sets
UN Economic and Social Council – Economic Commission for Europe Committee on Human Settlements (Building regulations in ECE countries) UN Urban Observatory
Annex 4-5 18-39
20
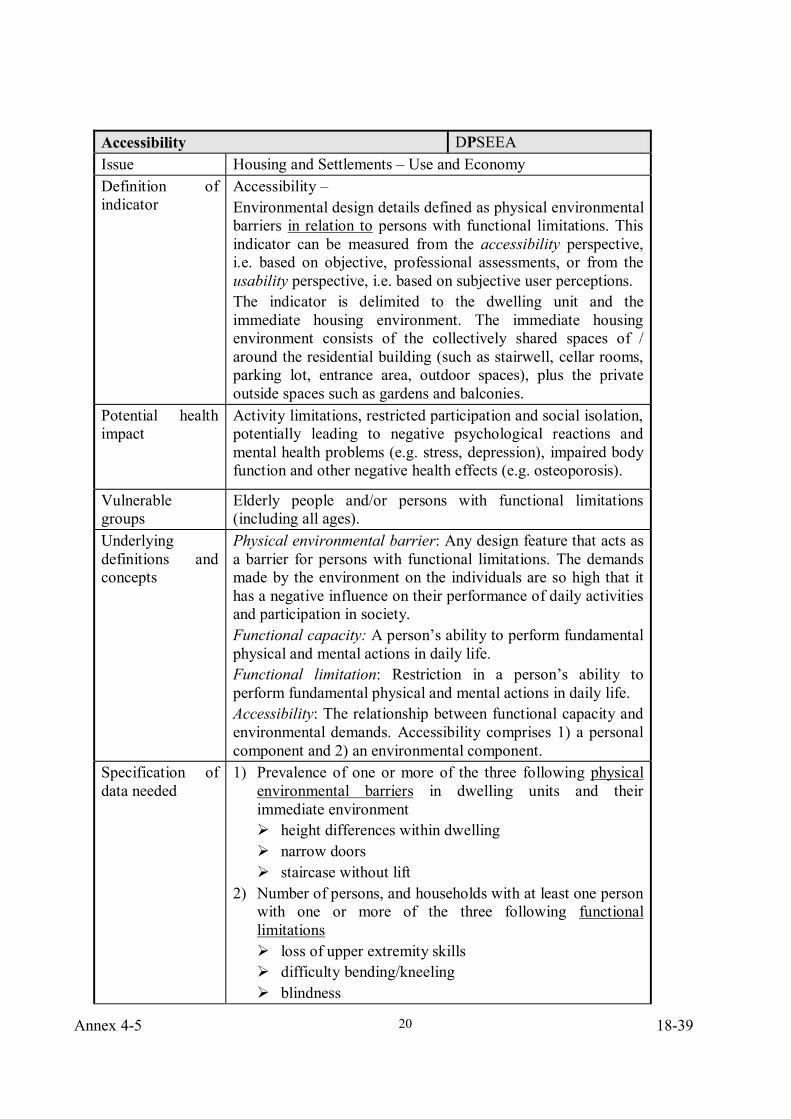
Accessibility DPSEEA Issue Housing and Settlements – Use and Economy Definition of indicator
Accessibility – Environmental design details defined as physical environmental barriers in relation to persons with functional limitations. This indicator can be measured from the accessibility perspective, i.e. based on objective, professional assessments, or from the usability perspective, i.e. based on subjective user perceptions. The indicator is delimited to the dwelling unit and the immediate housing environment. The immediate housing environment consists of the collectively shared spaces of / around the residential building (such as stairwell, cellar rooms, parking lot, entrance area, outdoor spaces), plus the private outside spaces such as gardens and balconies.
Potential health impact
Activity limitations, restricted participation and social isolation, potentially leading to negative psychological reactions and mental health problems (e.g. stress, depression), impaired body function and other negative health effects (e.g. osteoporosis).
Vulnerable groups
Elderly people and/or persons with functional limitations (including all ages).
Underlying definitions and concepts
Physical environmental barrier: Any design feature that acts as a barrier for persons with functional limitations. The demands made by the environment on the individuals are so high that it has a negative influence on their performance of daily activities and participation in society. Functional capacity: A person’s ability to perform fundamental physical and mental actions in daily life. Functional limitation: Restriction in a person’s ability to perform fundamental physical and mental actions in daily life. Accessibility: The relationship between functional capacity and environmental demands. Accessibility comprises 1) a personal component and 2) an environmental component.
Specification of data needed
1) Prevalence of one or more of the three following physical environmental barriers in dwelling units and their immediate environment
height differences within dwelling narrow doors staircase without lift
2) Number of persons, and households with at least one person with one or more of the three following functional limitations
loss of upper extremity skills difficulty bending/kneeling blindness
18-40 Annex 4-5
21
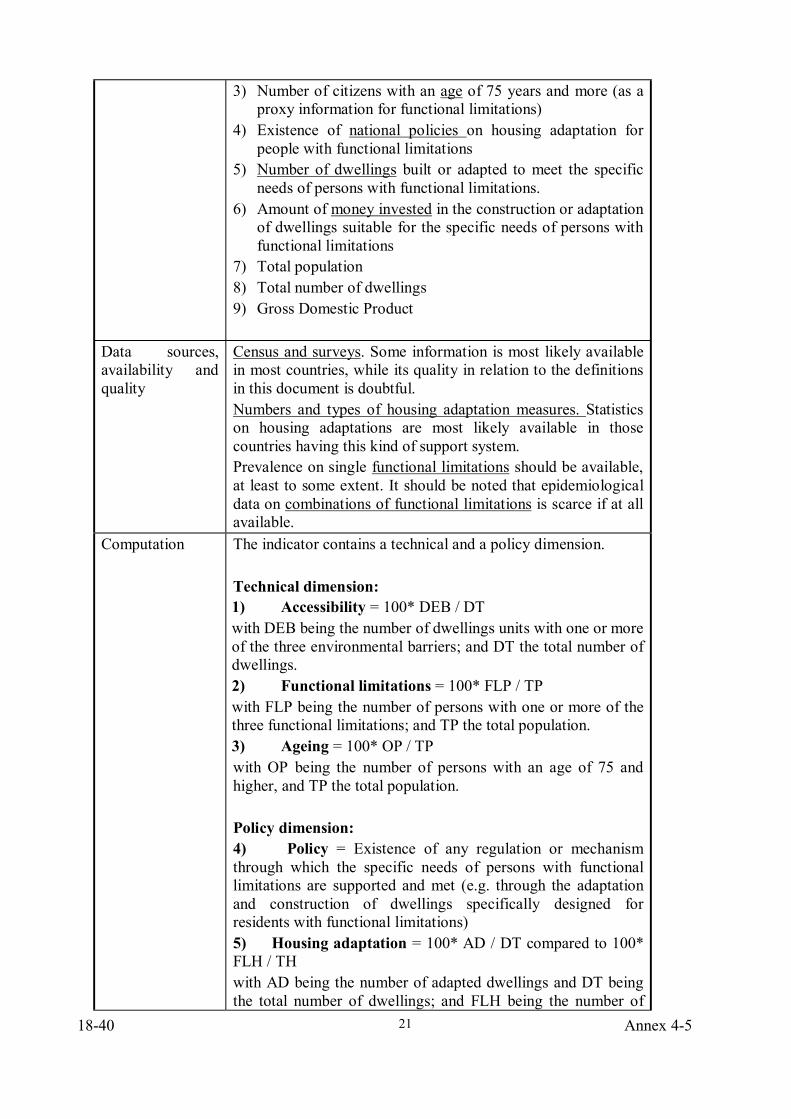
3) Number of citizens with an age of 75 years and more (as a proxy information for functional limitations)
4) Existence of national policies on housing adaptation for people with functional limitations
5) Number of dwellings built or adapted to meet the specific needs of persons with functional limitations.
6) Amount of money invested in the construction or adaptation of dwellings suitable for the specific needs of persons with functional limitations
7) Total population 8) Total number of dwellings 9) Gross Domestic Product
Data sources, availability and quality
Census and surveys. Some information is most likely available in most countries, while its quality in relation to the definitions in this document is doubtful. Numbers and types of housing adaptation measures. Statistics on housing adaptations are most likely available in those countries having this kind of support system. Prevalence on single functional limitations should be available, at least to some extent. It should be noted that epidemiological data on combinations of functional limitations is scarce if at all available.
Computation
The indicator contains a technical and a policy dimension. Technical dimension: 1) Accessibility = 100* DEB / DT with DEB being the number of dwellings units with one or more of the three environmental barriers; and DT the total number of dwellings. 2) Functional limitations = 100* FLP / TP with FLP being the number of persons with one or more of the three functional limitations; and TP the total population. 3) Ageing = 100* OP / TP with OP being the number of persons with an age of 75 and higher, and TP the total population. Policy dimension: 4) Policy = Existence of any regulation or mechanism through which the specific needs of persons with functional limitations are supported and met (e.g. through the adaptation and construction of dwellings specifically designed for residents with functional limitations) 5) Housing adaptation = 100* AD / DT compared to 100* FLH / TH with AD being the number of adapted dwellings and DT being the total number of dwellings; and FLH being the number of
Annex 4-5 18-41
22
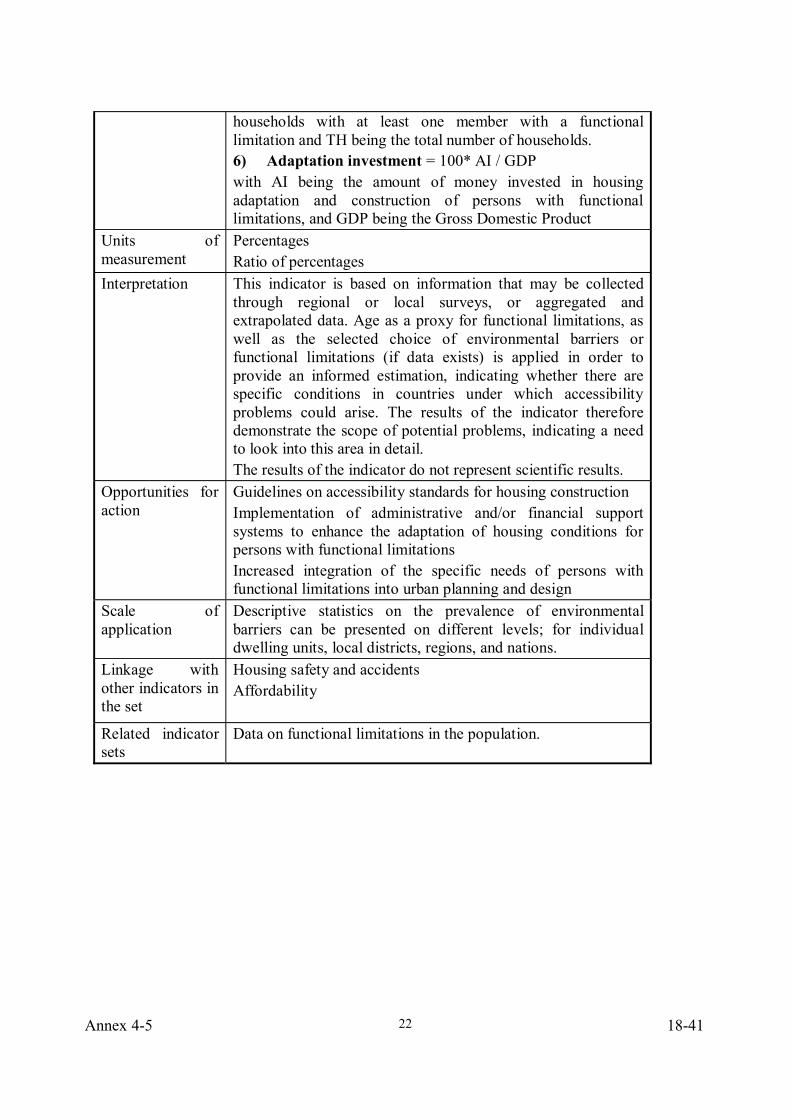
households with at least one member with a functional limitation and TH being the total number of households. 6) Adaptation investment = 100* AI / GDP with AI being the amount of money invested in housing adaptation and construction of persons with functional limitations, and GDP being the Gross Domestic Product
Units of measurement
Percentages Ratio of percentages
Interpretation This indicator is based on information that may be collected through regional or local surveys, or aggregated and extrapolated data. Age as a proxy for functional limitations, as well as the selected choice of environmental barriers or functional limitations (if data exists) is applied in order to provide an informed estimation, indicating whether there are specific conditions in countries under which accessibility problems could arise. The results of the indicator therefore demonstrate the scope of potential problems, indicating a need to look into this area in detail. The results of the indicator do not represent scientific results.
Opportunities for action
Guidelines on accessibility standards for housing construction Implementation of administrative and/or financial support systems to enhance the adaptation of housing conditions for persons with functional limitations Increased integration of the specific needs of persons with functional limitations into urban planning and design
Scale of application
Descriptive statistics on the prevalence of environmental barriers can be presented on different levels; for individual dwelling units, local districts, regions, and nations.
Linkage with other indicators in the set
Housing safety and accidents Affordability
Related indicator sets
Data on functional limitations in the population.
18-42 Annex 4-5
23
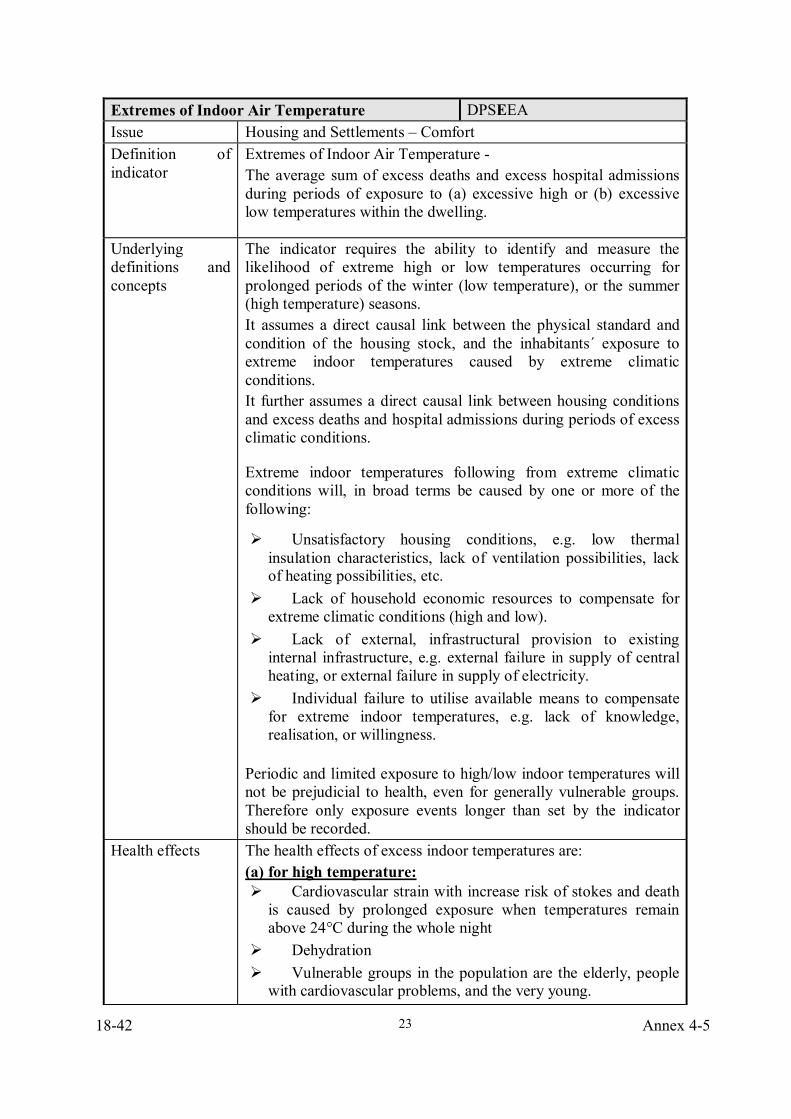
Extremes of Indoor Air Temperature DPSEEA Issue Housing and Settlements – Comfort Definition of indicator
Extremes of Indoor Air Temperature - The average sum of excess deaths and excess hospital admissions during periods of exposure to (a) excessive high or (b) excessive low temperatures within the dwelling.
Underlying definitions and concepts
The indicator requires the ability to identify and measure the likelihood of extreme high or low temperatures occurring for prolonged periods of the winter (low temperature), or the summer (high temperature) seasons. It assumes a direct causal link between the physical standard and condition of the housing stock, and the inhabitants´ exposure to extreme indoor temperatures caused by extreme climatic conditions. It further assumes a direct causal link between housing conditions and excess deaths and hospital admissions during periods of excess climatic conditions.
Extreme indoor temperatures following from extreme climatic conditions will, in broad terms be caused by one or more of the following:
Unsatisfactory housing conditions, e.g. low thermal insulation characteristics, lack of ventilation possibilities, lack of heating possibilities, etc.
Lack of household economic resources to compensate for extreme climatic conditions (high and low).
Lack of external, infrastructural provision to existing internal infrastructure, e.g. external failure in supply of central heating, or external failure in supply of electricity.
Individual failure to utilise available means to compensate for extreme indoor temperatures, e.g. lack of knowledge, realisation, or willingness.
Periodic and limited exposure to high/low indoor temperatures will not be prejudicial to health, even for generally vulnerable groups. Therefore only exposure events longer than set by the indicator should be recorded.
Health effects The health effects of excess indoor temperatures are: (a) for high temperature:
Cardiovascular strain with increase risk of stokes and death is caused by prolonged exposure when temperatures remain above 24°C during the whole night
Dehydration Vulnerable groups in the population are the elderly, people with cardiovascular problems, and the very young.
Annex 4-5 18-43
24
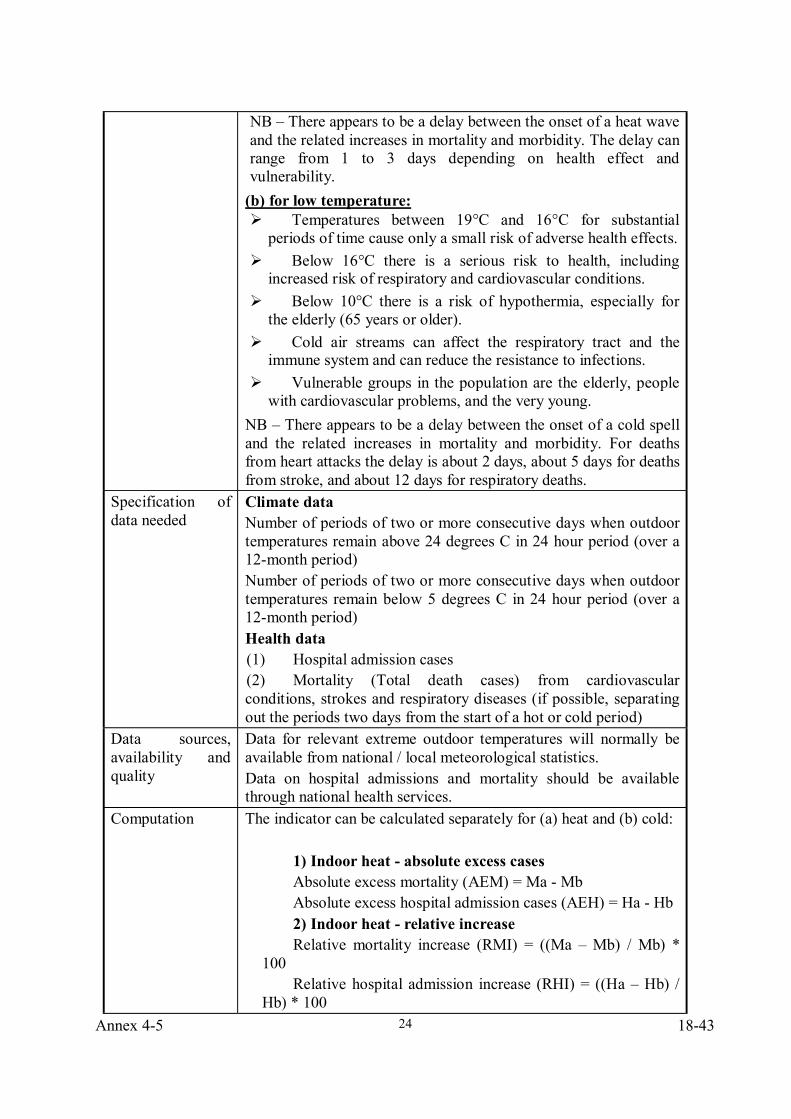
NB – There appears to be a delay between the onset of a heat wave and the related increases in mortality and morbidity. The delay can range from 1 to 3 days depending on health effect and vulnerability.
(b) for low temperature: Temperatures between 19°C and 16°C for substantial periods of time cause only a small risk of adverse health effects.
Below 16°C there is a serious risk to health, including increased risk of respiratory and cardiovascular conditions.
Below 10°C there is a risk of hypothermia, especially for the elderly (65 years or older).
Cold air streams can affect the respiratory tract and the immune system and can reduce the resistance to infections.
Vulnerable groups in the population are the elderly, people with cardiovascular problems, and the very young.
NB – There appears to be a delay between the onset of a cold spell and the related increases in mortality and morbidity. For deaths from heart attacks the delay is about 2 days, about 5 days for deaths from stroke, and about 12 days for respiratory deaths.
Specification of data needed
Climate data Number of periods of two or more consecutive days when outdoor temperatures remain above 24 degrees C in 24 hour period (over a 12-month period) Number of periods of two or more consecutive days when outdoor temperatures remain below 5 degrees C in 24 hour period (over a 12-month period) Health data (1) Hospital admission cases (2) Mortality (Total death cases) from cardiovascular conditions, strokes and respiratory diseases (if possible, separating out the periods two days from the start of a hot or cold period)
Data sources, availability and quality
Data for relevant extreme outdoor temperatures will normally be available from national / local meteorological statistics. Data on hospital admissions and mortality should be available through national health services.
Computation The indicator can be calculated separately for (a) heat and (b) cold:
1) Indoor heat - absolute excess cases Absolute excess mortality (AEM) = Ma - Mb Absolute excess hospital admission cases (AEH) = Ha - Hb 2) Indoor heat - relative increase Relative mortality increase (RMI) = ((Ma – Mb) / Mb) *
100 Relative hospital admission increase (RHI) = ((Ha – Hb) /
Hb) * 100
18-44 Annex 4-5
25
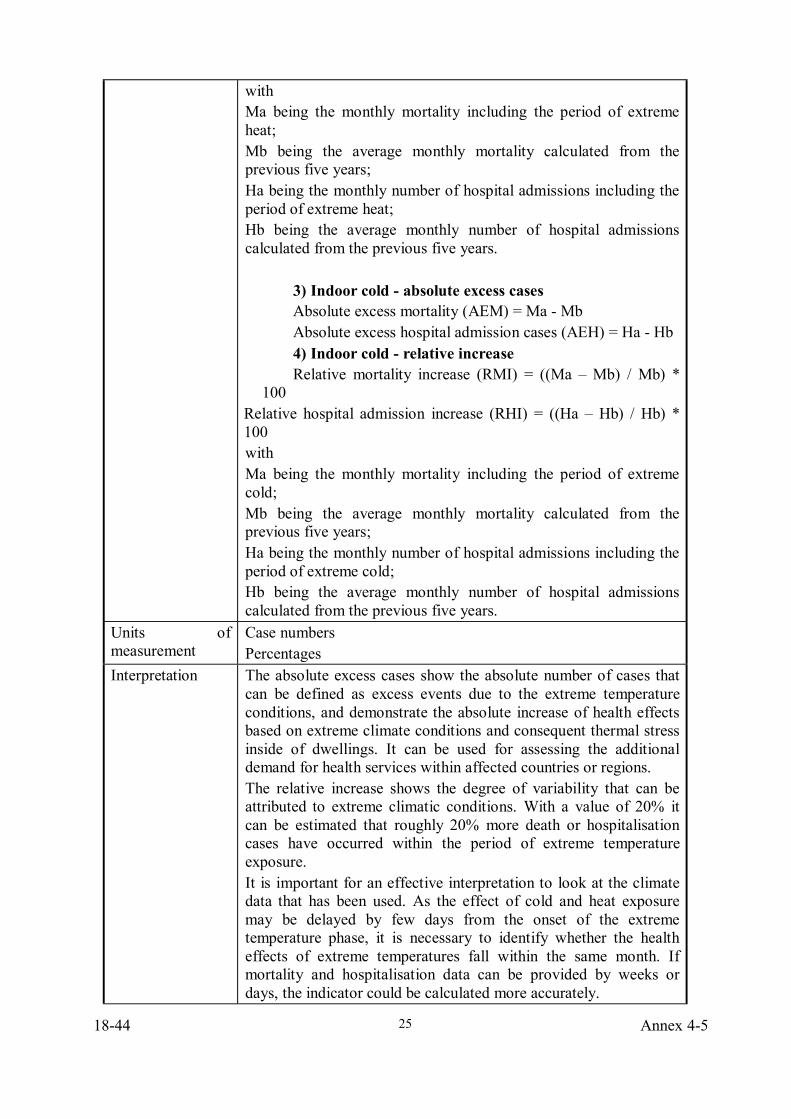
with Ma being the monthly mortality including the period of extreme heat; Mb being the average monthly mortality calculated from the previous five years; Ha being the monthly number of hospital admissions including the period of extreme heat; Hb being the average monthly number of hospital admissions calculated from the previous five years.
3) Indoor cold - absolute excess cases Absolute excess mortality (AEM) = Ma - Mb Absolute excess hospital admission cases (AEH) = Ha - Hb 4) Indoor cold - relative increase Relative mortality increase (RMI) = ((Ma – Mb) / Mb) *
100 Relative hospital admission increase (RHI) = ((Ha – Hb) / Hb) * 100 with Ma being the monthly mortality including the period of extreme cold; Mb being the average monthly mortality calculated from the previous five years; Ha being the monthly number of hospital admissions including the period of extreme cold; Hb being the average monthly number of hospital admissions calculated from the previous five years.
Units of measurement
Case numbers Percentages
Interpretation The absolute excess cases show the absolute number of cases that can be defined as excess events due to the extreme temperature conditions, and demonstrate the absolute increase of health effects based on extreme climate conditions and consequent thermal stress inside of dwellings. It can be used for assessing the additional demand for health services within affected countries or regions. The relative increase shows the degree of variability that can be attributed to extreme climatic conditions. With a value of 20% it can be estimated that roughly 20% more death or hospitalisation cases have occurred within the period of extreme temperature exposure. It is important for an effective interpretation to look at the climate data that has been used. As the effect of cold and heat exposure may be delayed by few days from the onset of the extreme temperature phase, it is necessary to identify whether the health effects of extreme temperatures fall within the same month. If mortality and hospitalisation data can be provided by weeks or days, the indicator could be calculated more accurately.
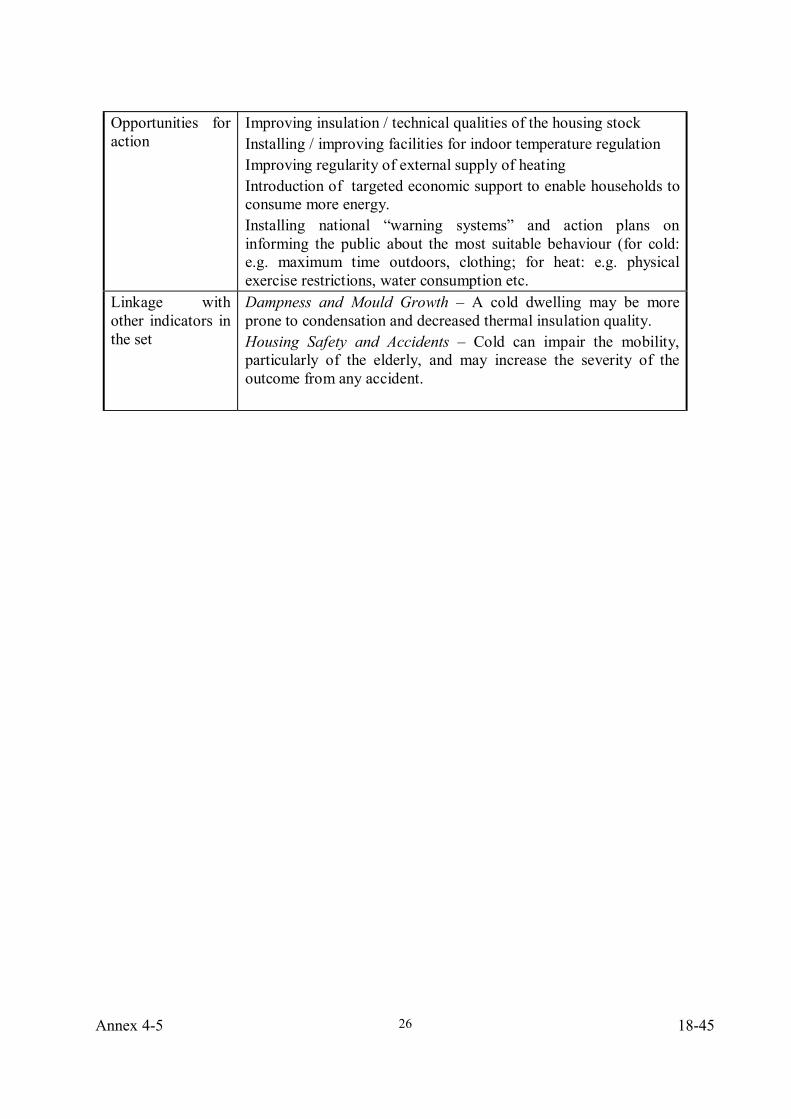
Annex 4-5 18-45
26
Opportunities for action
Improving insulation / technical qualities of the housing stock Installing / improving facilities for indoor temperature regulation Improving regularity of external supply of heating Introduction of targeted economic support to enable households to consume more energy. Installing national “warning systems” and action plans on informing the public about the most suitable behaviour (for cold: e.g. maximum time outdoors, clothing; for heat: e.g. physical exercise restrictions, water consumption etc.
Linkage with other indicators in the set
Dampness and Mould Growth – A cold dwelling may be more prone to condensation and decreased thermal insulation quality. Housing Safety and Accidents – Cold can impair the mobility, particularly of the elderly, and may increase the severity of the outcome from any accident.
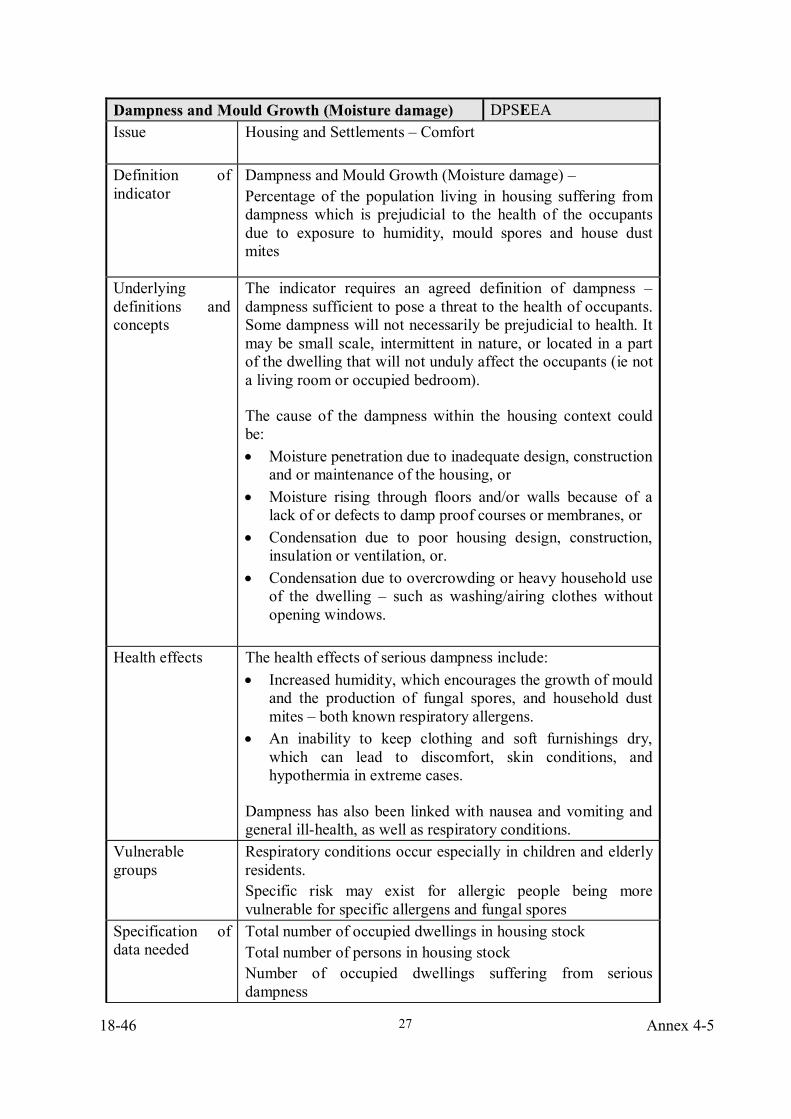
18-46 Annex 4-5
27
Dampness and Mould Growth (Moisture damage) DPSEEA Issue Housing and Settlements – Comfort
Definition of indicator
Dampness and Mould Growth (Moisture damage) – Percentage of the population living in housing suffering from dampness which is prejudicial to the health of the occupants due to exposure to humidity, mould spores and house dust mites
Underlying definitions and concepts
The indicator requires an agreed definition of dampness – dampness sufficient to pose a threat to the health of occupants. Some dampness will not necessarily be prejudicial to health. It may be small scale, intermittent in nature, or located in a part of the dwelling that will not unduly affect the occupants (ie not a living room or occupied bedroom).
The cause of the dampness within the housing context could be: • Moisture penetration due to inadequate design, construction
and or maintenance of the housing, or • Moisture rising through floors and/or walls because of a
lack of or defects to damp proof courses or membranes, or • Condensation due to poor housing design, construction,
insulation or ventilation, or. • Condensation due to overcrowding or heavy household use
of the dwelling – such as washing/airing clothes without opening windows.
Health effects The health effects of serious dampness include:
• Increased humidity, which encourages the growth of mould and the production of fungal spores, and household dust mites – both known respiratory allergens.
• An inability to keep clothing and soft furnishings dry, which can lead to discomfort, skin conditions, and hypothermia in extreme cases.
Dampness has also been linked with nausea and vomiting and general ill-health, as well as respiratory conditions.
Vulnerable groups
Respiratory conditions occur especially in children and elderly residents. Specific risk may exist for allergic people being more vulnerable for specific allergens and fungal spores
Specification of data needed
Total number of occupied dwellings in housing stock Total number of persons in housing stock Number of occupied dwellings suffering from serious dampness
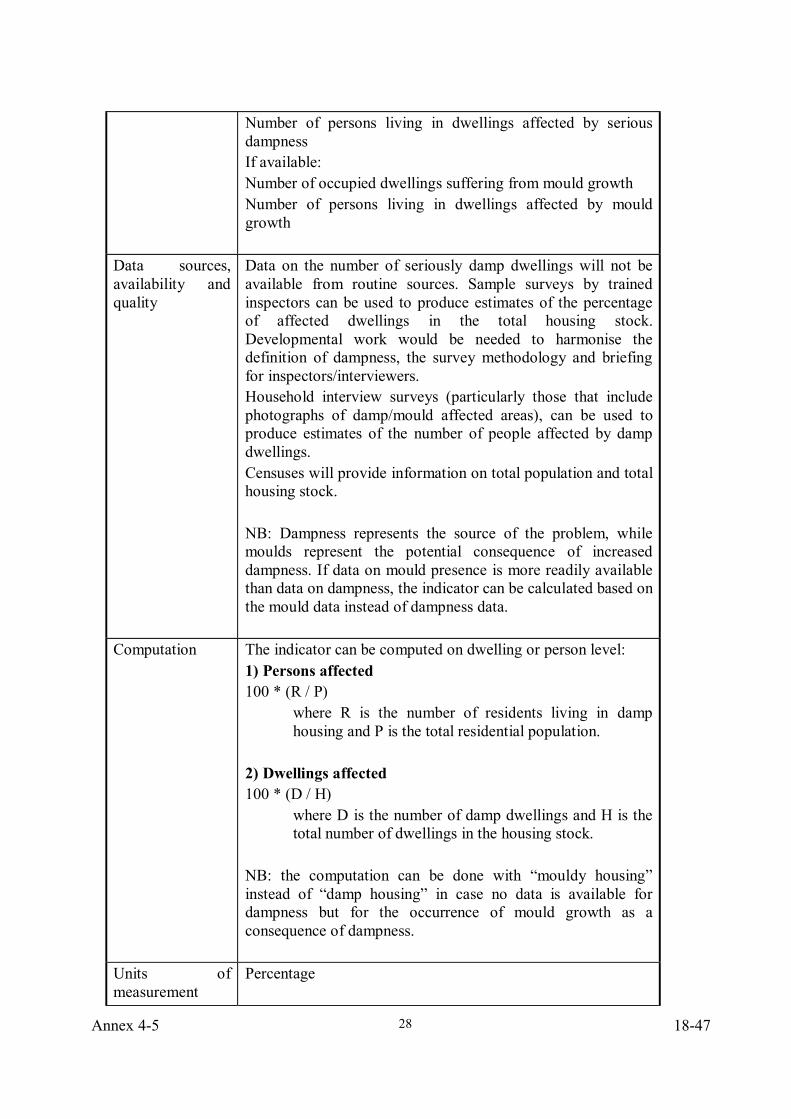
Annex 4-5 18-47
28
Number of persons living in dwellings affected by serious dampness If available: Number of occupied dwellings suffering from mould growth Number of persons living in dwellings affected by mould growth
Data sources, availability and quality
Data on the number of seriously damp dwellings will not be available from routine sources. Sample surveys by trained inspectors can be used to produce estimates of the percentage of affected dwellings in the total housing stock. Developmental work would be needed to harmonise the definition of dampness, the survey methodology and briefing for inspectors/interviewers. Household interview surveys (particularly those that include photographs of damp/mould affected areas), can be used to produce estimates of the number of people affected by damp dwellings. Censuses will provide information on total population and total housing stock. NB: Dampness represents the source of the problem, while moulds represent the potential consequence of increased dampness. If data on mould presence is more readily available than data on dampness, the indicator can be calculated based on the mould data instead of dampness data.
Computation
The indicator can be computed on dwelling or person level: 1) Persons affected 100 * (R / P)
where R is the number of residents living in damp housing and P is the total residential population.
2) Dwellings affected 100 * (D / H)
where D is the number of damp dwellings and H is the total number of dwellings in the housing stock.
NB: the computation can be done with “mouldy housing” instead of “damp housing” in case no data is available for dampness but for the occurrence of mould growth as a consequence of dampness.
Units of measurement
Percentage
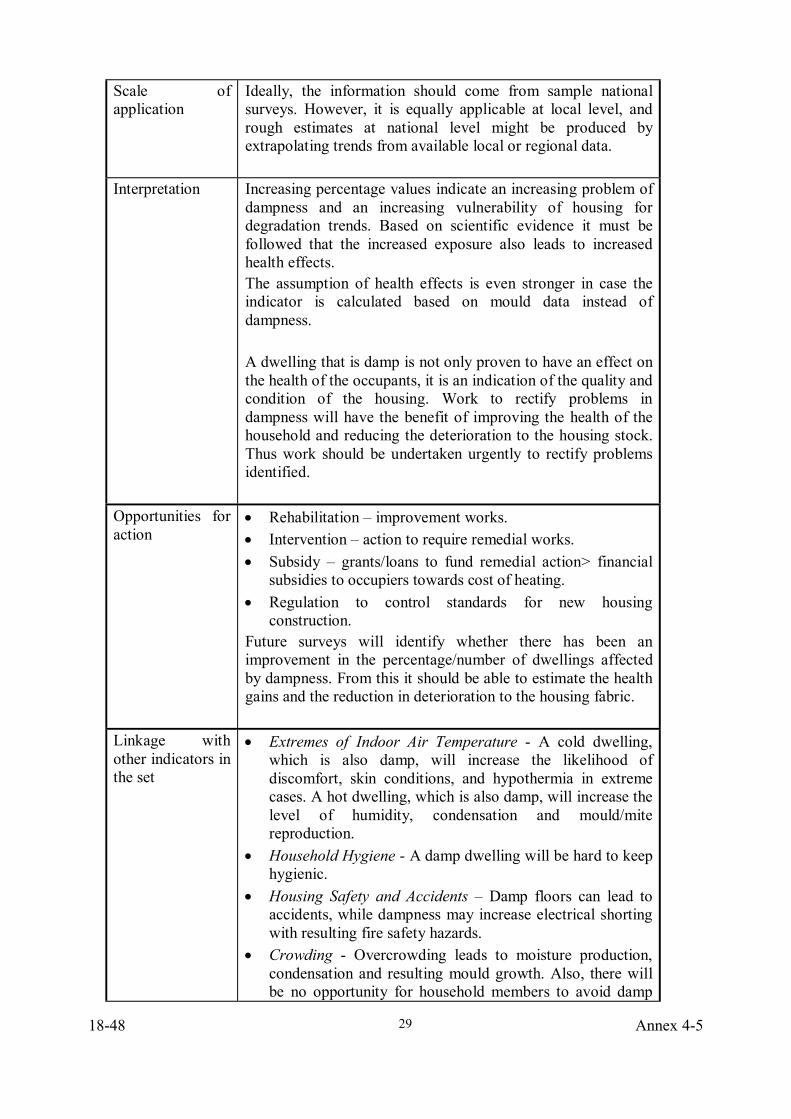
18-48 Annex 4-5
29
Scale of application
Ideally, the information should come from sample national surveys. However, it is equally applicable at local level, and rough estimates at national level might be produced by extrapolating trends from available local or regional data.
Interpretation
Increasing percentage values indicate an increasing problem of dampness and an increasing vulnerability of housing for degradation trends. Based on scientific evidence it must be followed that the increased exposure also leads to increased health effects. The assumption of health effects is even stronger in case the indicator is calculated based on mould data instead of dampness. A dwelling that is damp is not only proven to have an effect on the health of the occupants, it is an indication of the quality and condition of the housing. Work to rectify problems in dampness will have the benefit of improving the health of the household and reducing the deterioration to the housing stock. Thus work should be undertaken urgently to rectify problems identified.
Opportunities for action
• Rehabilitation – improvement works. • Intervention – action to require remedial works. • Subsidy – grants/loans to fund remedial action> financial
subsidies to occupiers towards cost of heating. • Regulation to control standards for new housing
construction. Future surveys will identify whether there has been an improvement in the percentage/number of dwellings affected by dampness. From this it should be able to estimate the health gains and the reduction in deterioration to the housing fabric.
Linkage with other indicators in the set
• Extremes of Indoor Air Temperature - A cold dwelling, which is also damp, will increase the likelihood of discomfort, skin conditions, and hypothermia in extreme cases. A hot dwelling, which is also damp, will increase the level of humidity, condensation and mould/mite reproduction.
• Household Hygiene - A damp dwelling will be hard to keep hygienic.
• Housing Safety and Accidents – Damp floors can lead to accidents, while dampness may increase electrical shorting with resulting fire safety hazards.
• Crowding - Overcrowding leads to moisture production, condensation and resulting mould growth. Also, there will be no opportunity for household members to avoid damp
Annex 4-5 18-49
30
rooms. Related indicator sets
UN Human Settlements Programme: list of key urban indicators and database. UN Economic Commission for Europe Annual Bulletin on Housing and Building Statistics for Europe and North America 1998.
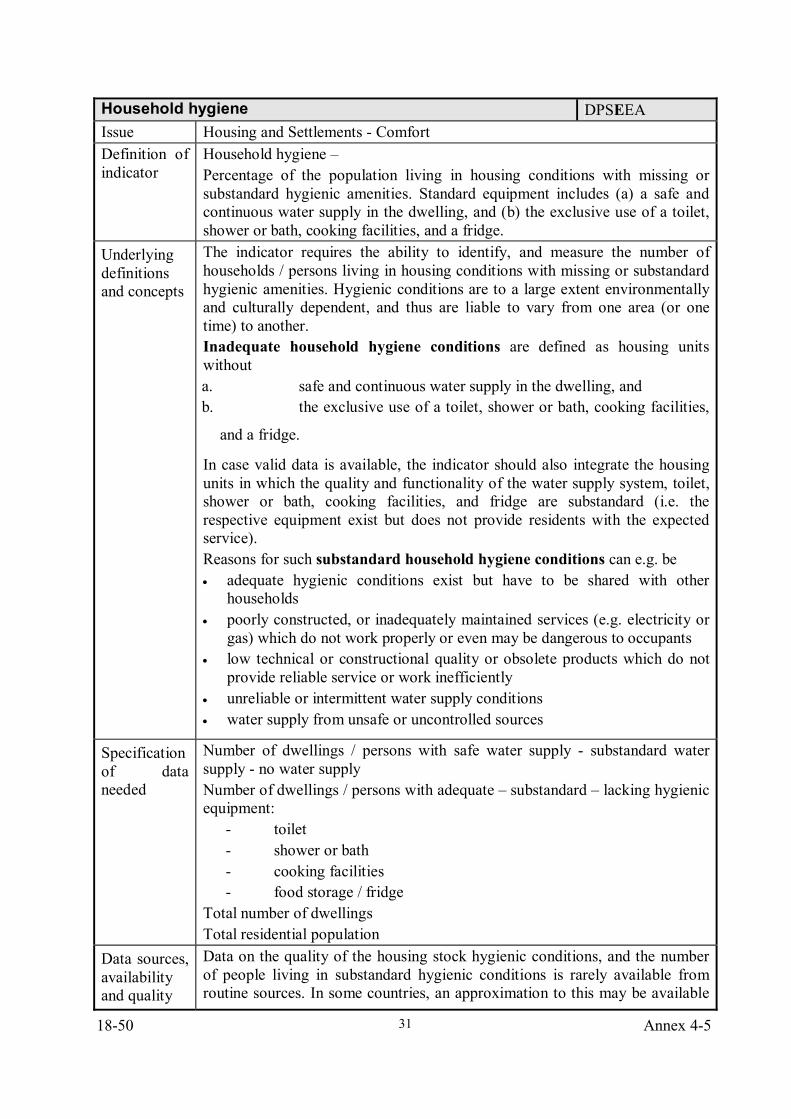
18-50 Annex 4-5
31
Household hygiene DPSEEA Issue Housing and Settlements - Comfort Definition of indicator
Household hygiene – Percentage of the population living in housing conditions with missing or substandard hygienic amenities. Standard equipment includes (a) a safe and continuous water supply in the dwelling, and (b) the exclusive use of a toilet, shower or bath, cooking facilities, and a fridge.
Underlying definitions and concepts
The indicator requires the ability to identify, and measure the number of households / persons living in housing conditions with missing or substandard hygienic amenities. Hygienic conditions are to a large extent environmentally and culturally dependent, and thus are liable to vary from one area (or one time) to another. Inadequate household hygiene conditions are defined as housing units without a. safe and continuous water supply in the dwelling, and b. the exclusive use of a toilet, shower or bath, cooking facilities,
and a fridge.
In case valid data is available, the indicator should also integrate the housing units in which the quality and functionality of the water supply system, toilet, shower or bath, cooking facilities, and fridge are substandard (i.e. the respective equipment exist but does not provide residents with the expected service). Reasons for such substandard household hygiene conditions can e.g. be • adequate hygienic conditions exist but have to be shared with other
households • poorly constructed, or inadequately maintained services (e.g. electricity or
gas) which do not work properly or even may be dangerous to occupants • low technical or constructional quality or obsolete products which do not
provide reliable service or work inefficiently • unreliable or intermittent water supply conditions • water supply from unsafe or uncontrolled sources
Specification of data needed
Number of dwellings / persons with safe water supply - substandard water supply - no water supply Number of dwellings / persons with adequate – substandard – lacking hygienic equipment:
- toilet - shower or bath - cooking facilities - food storage / fridge
Total number of dwellings Total residential population
Data sources, availability and quality
Data on the quality of the housing stock hygienic conditions, and the number of people living in substandard hygienic conditions is rarely available from routine sources. In some countries, an approximation to this may be available
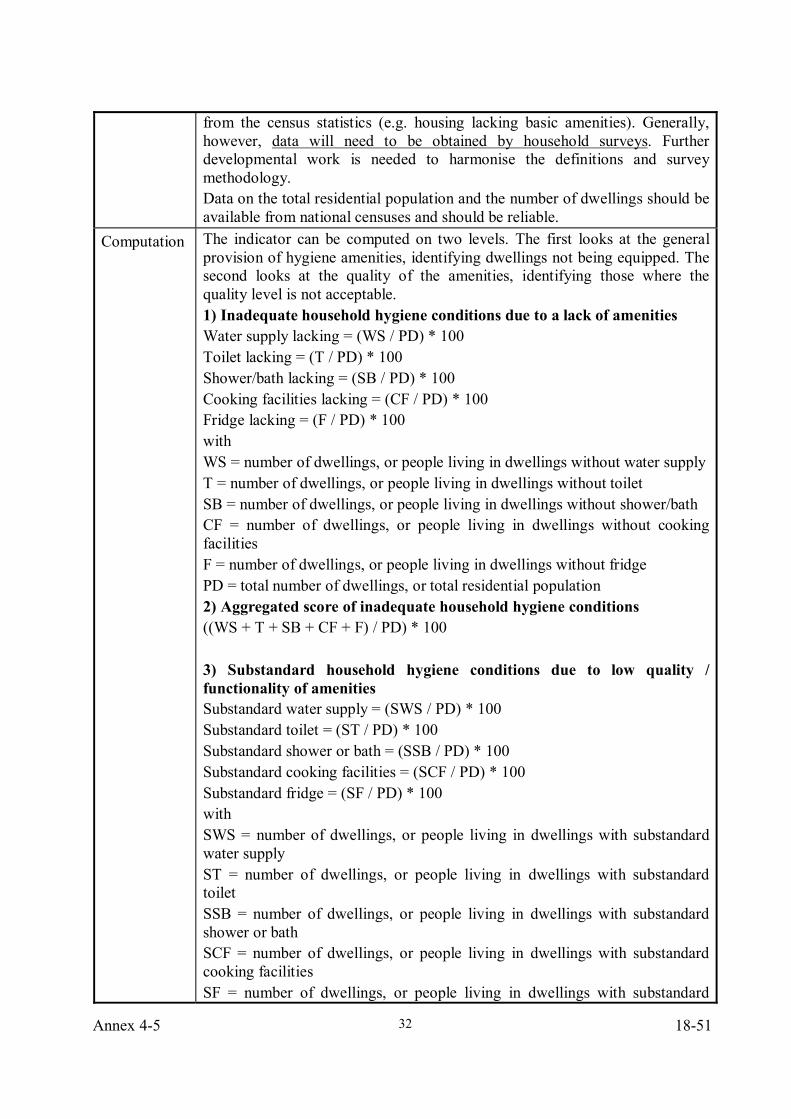
Annex 4-5 18-51
32
from the census statistics (e.g. housing lacking basic amenities). Generally, however, data will need to be obtained by household surveys. Further developmental work is needed to harmonise the definitions and survey methodology. Data on the total residential population and the number of dwellings should be available from national censuses and should be reliable.
Computation The indicator can be computed on two levels. The first looks at the general provision of hygiene amenities, identifying dwellings not being equipped. The second looks at the quality of the amenities, identifying those where the quality level is not acceptable. 1) Inadequate household hygiene conditions due to a lack of amenities Water supply lacking = (WS / PD) * 100 Toilet lacking = (T / PD) * 100 Shower/bath lacking = (SB / PD) * 100 Cooking facilities lacking = (CF / PD) * 100 Fridge lacking = (F / PD) * 100 with WS = number of dwellings, or people living in dwellings without water supply T = number of dwellings, or people living in dwellings without toilet SB = number of dwellings, or people living in dwellings without shower/bath CF = number of dwellings, or people living in dwellings without cooking facilities F = number of dwellings, or people living in dwellings without fridge PD = total number of dwellings, or total residential population 2) Aggregated score of inadequate household hygiene conditions ((WS + T + SB + CF + F) / PD) * 100 3) Substandard household hygiene conditions due to low quality / functionality of amenities Substandard water supply = (SWS / PD) * 100 Substandard toilet = (ST / PD) * 100 Substandard shower or bath = (SSB / PD) * 100 Substandard cooking facilities = (SCF / PD) * 100 Substandard fridge = (SF / PD) * 100 with SWS = number of dwellings, or people living in dwellings with substandard water supply ST = number of dwellings, or people living in dwellings with substandard toilet SSB = number of dwellings, or people living in dwellings with substandard shower or bath SCF = number of dwellings, or people living in dwellings with substandard cooking facilities SF = number of dwellings, or people living in dwellings with substandard
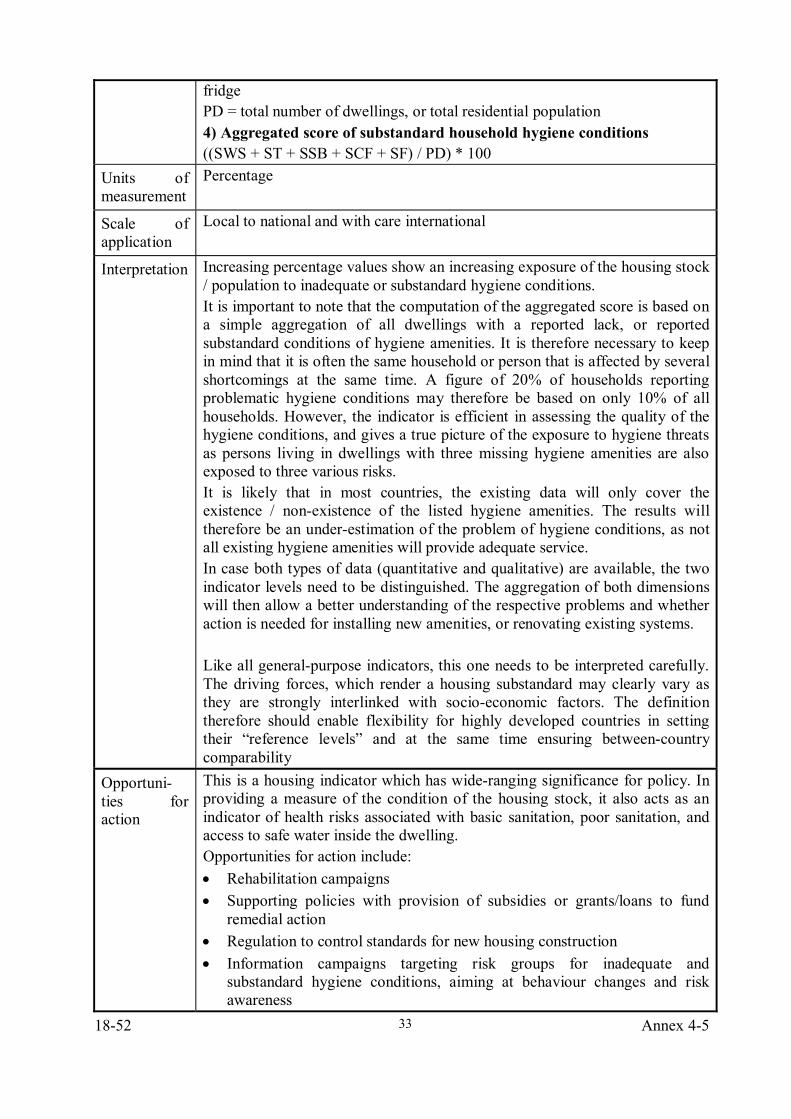
18-52 Annex 4-5
33
fridge PD = total number of dwellings, or total residential population 4) Aggregated score of substandard household hygiene conditions ((SWS + ST + SSB + SCF + SF) / PD) * 100
Units of measurement
Percentage
Scale of application
Local to national and with care international
Interpretation Increasing percentage values show an increasing exposure of the housing stock / population to inadequate or substandard hygiene conditions. It is important to note that the computation of the aggregated score is based on a simple aggregation of all dwellings with a reported lack, or reported substandard conditions of hygiene amenities. It is therefore necessary to keep in mind that it is often the same household or person that is affected by several shortcomings at the same time. A figure of 20% of households reporting problematic hygiene conditions may therefore be based on only 10% of all households. However, the indicator is efficient in assessing the quality of the hygiene conditions, and gives a true picture of the exposure to hygiene threats as persons living in dwellings with three missing hygiene amenities are also exposed to three various risks. It is likely that in most countries, the existing data will only cover the existence / non-existence of the listed hygiene amenities. The results will therefore be an under-estimation of the problem of hygiene conditions, as not all existing hygiene amenities will provide adequate service. In case both types of data (quantitative and qualitative) are available, the two indicator levels need to be distinguished. The aggregation of both dimensions will then allow a better understanding of the respective problems and whether action is needed for installing new amenities, or renovating existing systems. Like all general-purpose indicators, this one needs to be interpreted carefully. The driving forces, which render a housing substandard may clearly vary as they are strongly interlinked with socio-economic factors. The definition therefore should enable flexibility for highly developed countries in setting their “reference levels” and at the same time ensuring between-country comparability
Opportuni-ties for action
This is a housing indicator which has wide-ranging significance for policy. In providing a measure of the condition of the housing stock, it also acts as an indicator of health risks associated with basic sanitation, poor sanitation, and access to safe water inside the dwelling. Opportunities for action include: • Rehabilitation campaigns • Supporting policies with provision of subsidies or grants/loans to fund
remedial action • Regulation to control standards for new housing construction • Information campaigns targeting risk groups for inadequate and
substandard hygiene conditions, aiming at behaviour changes and risk awareness
Annex 4-5 18-53
34
Linkage with the other indicators
Crowding Affordability Diarrhoeal disease in children (WatSan indicator set)
Related web-sites
UN Human Settlements Programme: list of key urban indicators and database http://www.unhabitat.org/guo/index1.asp UN Economic Commission for Europe Annual Bulletin on Housing and Building Statistics for Europe and North America, 1998 http://www.unece.org/env/hs/bulletin/cnt2_e98.htm
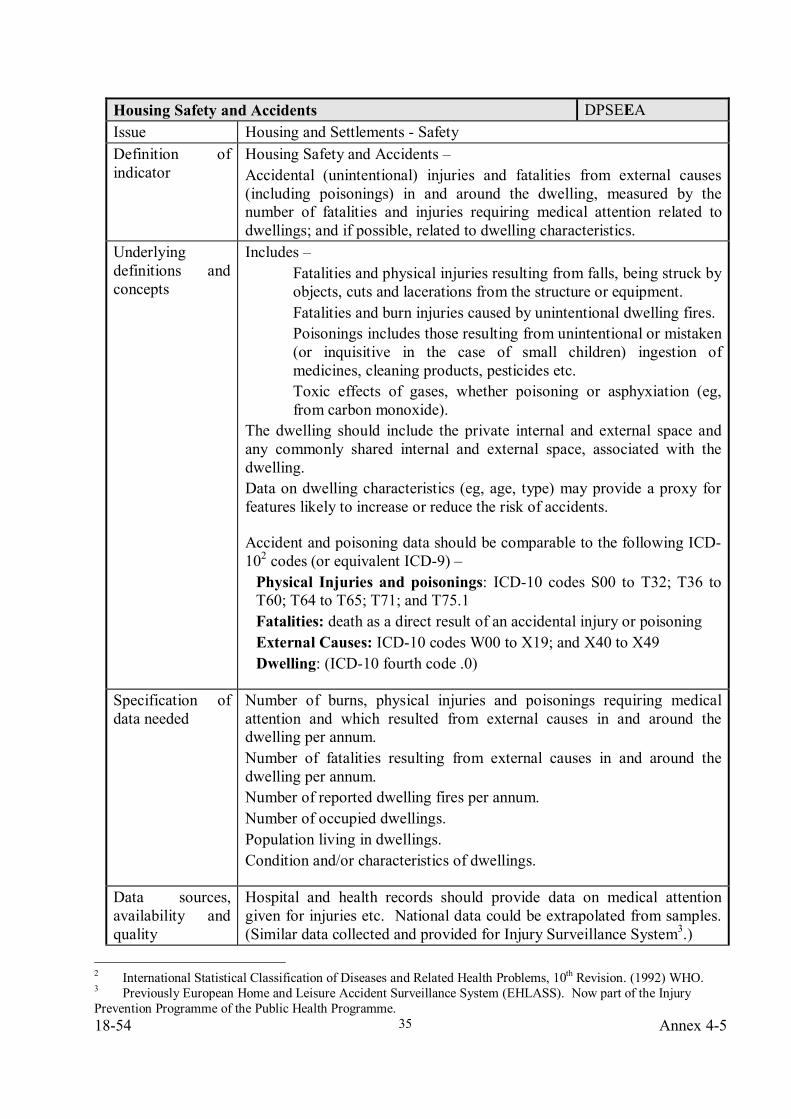
18-54 Annex 4-5
35
Housing Safety and Accidents DPSEEA Issue Housing and Settlements - Safety Definition of indicator
Housing Safety and Accidents – Accidental (unintentional) injuries and fatalities from external causes (including poisonings) in and around the dwelling, measured by the number of fatalities and injuries requiring medical attention related to dwellings; and if possible, related to dwelling characteristics.
Underlying definitions and concepts
Includes – Fatalities and physical injuries resulting from falls, being struck by objects, cuts and lacerations from the structure or equipment. Fatalities and burn injuries caused by unintentional dwelling fires. Poisonings includes those resulting from unintentional or mistaken (or inquisitive in the case of small children) ingestion of medicines, cleaning products, pesticides etc. Toxic effects of gases, whether poisoning or asphyxiation (eg, from carbon monoxide).
The dwelling should include the private internal and external space and any commonly shared internal and external space, associated with the dwelling. Data on dwelling characteristics (eg, age, type) may provide a proxy for features likely to increase or reduce the risk of accidents.
Accident and poisoning data should be comparable to the following ICD-102 codes (or equivalent ICD-9) –
Physical Injuries and poisonings: ICD-10 codes S00 to T32; T36 to T60; T64 to T65; T71; and T75.1 Fatalities: death as a direct result of an accidental injury or poisoning External Causes: ICD-10 codes W00 to X19; and X40 to X49 Dwelling: (ICD-10 fourth code .0)
Specification of data needed
Number of burns, physical injuries and poisonings requiring medical attention and which resulted from external causes in and around the dwelling per annum. Number of fatalities resulting from external causes in and around the dwelling per annum. Number of reported dwelling fires per annum. Number of occupied dwellings. Population living in dwellings. Condition and/or characteristics of dwellings.
Data sources, availability and quality
Hospital and health records should provide data on medical attention given for injuries etc. National data could be extrapolated from samples. (Similar data collected and provided for Injury Surveillance System3.)
2 International Statistical Classification of Diseases and Related Health Problems, 10th Revision. (1992) WHO. 3 Previously European Home and Leisure Accident Surveillance System (EHLASS). Now part of the Injury Prevention Programme of the Public Health Programme.
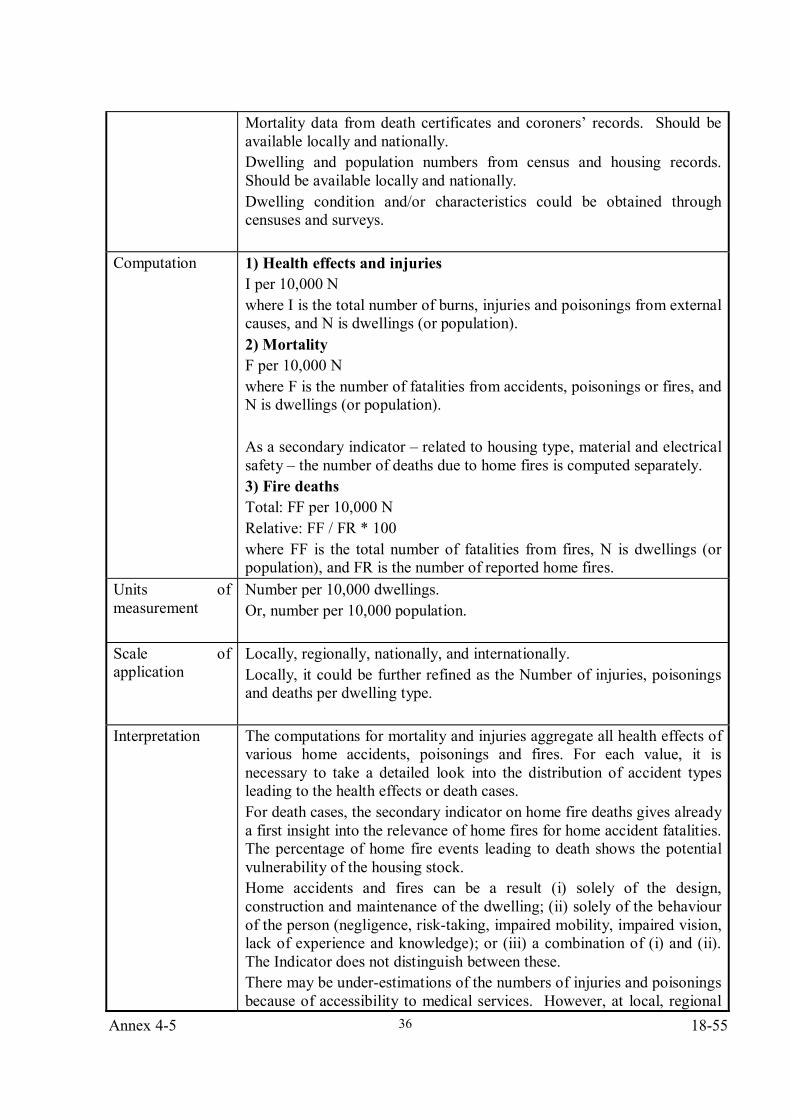
Annex 4-5 18-55
36
Mortality data from death certificates and coroners’ records. Should be available locally and nationally. Dwelling and population numbers from census and housing records. Should be available locally and nationally. Dwelling condition and/or characteristics could be obtained through censuses and surveys.
Computation
1) Health effects and injuries I per 10,000 N where I is the total number of burns, injuries and poisonings from external causes, and N is dwellings (or population). 2) Mortality F per 10,000 N where F is the number of fatalities from accidents, poisonings or fires, and N is dwellings (or population). As a secondary indicator – related to housing type, material and electrical safety – the number of deaths due to home fires is computed separately. 3) Fire deaths Total: FF per 10,000 N Relative: FF / FR * 100 where FF is the total number of fatalities from fires, N is dwellings (or population), and FR is the number of reported home fires.
Units of measurement
Number per 10,000 dwellings. Or, number per 10,000 population.
Scale of application
Locally, regionally, nationally, and internationally. Locally, it could be further refined as the Number of injuries, poisonings and deaths per dwelling type.
Interpretation
The computations for mortality and injuries aggregate all health effects of various home accidents, poisonings and fires. For each value, it is necessary to take a detailed look into the distribution of accident types leading to the health effects or death cases. For death cases, the secondary indicator on home fire deaths gives already a first insight into the relevance of home fires for home accident fatalities. The percentage of home fire events leading to death shows the potential vulnerability of the housing stock. Home accidents and fires can be a result (i) solely of the design, construction and maintenance of the dwelling; (ii) solely of the behaviour of the person (negligence, risk-taking, impaired mobility, impaired vision, lack of experience and knowledge); or (iii) a combination of (i) and (ii). The Indicator does not distinguish between these. There may be under-estimations of the numbers of injuries and poisonings because of accessibility to medical services. However, at local, regional
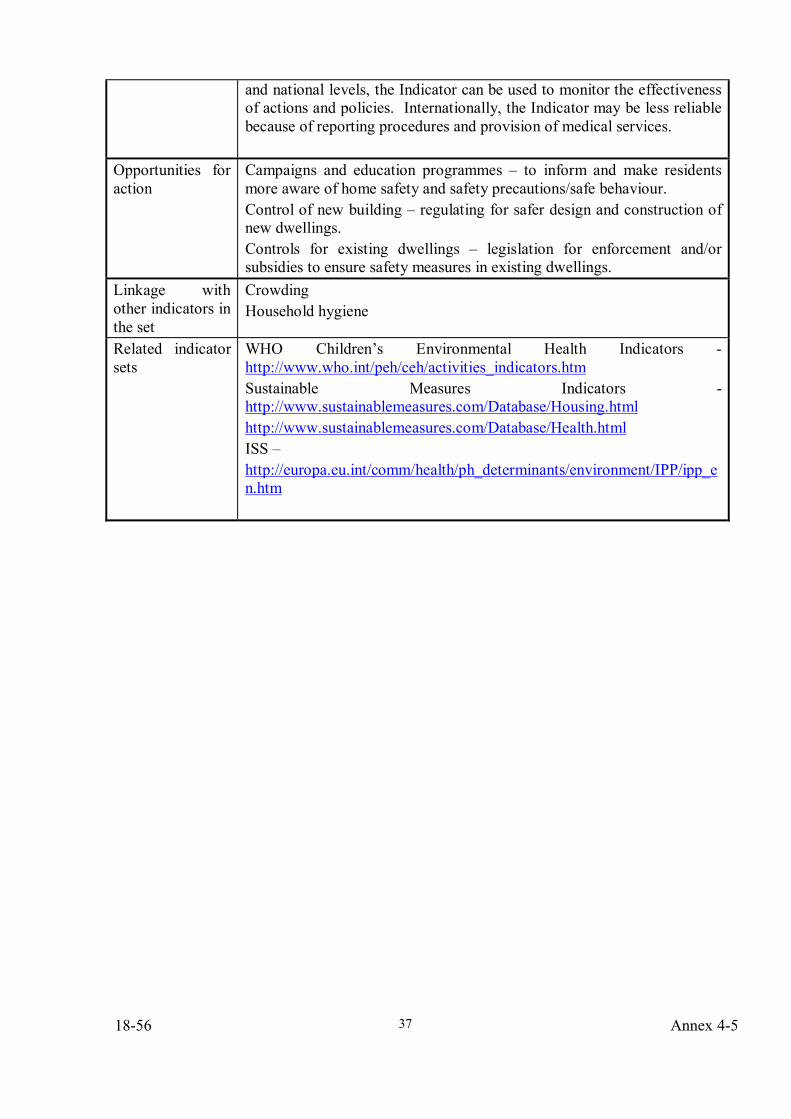
18-56 Annex 4-5
37
and national levels, the Indicator can be used to monitor the effectiveness of actions and policies. Internationally, the Indicator may be less reliable because of reporting procedures and provision of medical services.
Opportunities for action
Campaigns and education programmes – to inform and make residents more aware of home safety and safety precautions/safe behaviour. Control of new building – regulating for safer design and construction of new dwellings. Controls for existing dwellings – legislation for enforcement and/or subsidies to ensure safety measures in existing dwellings.
Linkage with other indicators in the set
Crowding Household hygiene
Related indicator sets
WHO Children’s Environmental Health Indicators - http://www.who.int/peh/ceh/activities_indicators.htm Sustainable Measures Indicators - http://www.sustainablemeasures.com/Database/Housing.html http://www.sustainablemeasures.com/Database/Health.html ISS – http://europa.eu.int/comm/health/ph_determinants/environment/IPP/ipp_en.htm
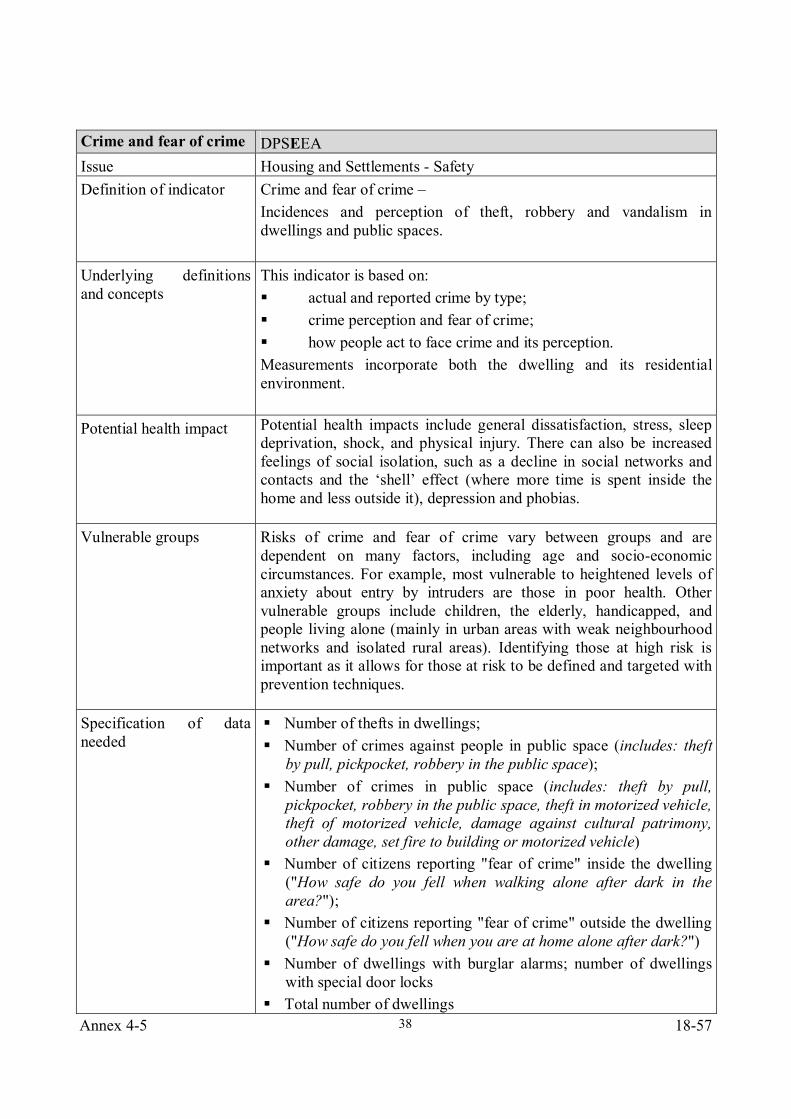
Annex 4-5 18-57
38
Crime and fear of crime DPSEEA Issue Housing and Settlements - Safety Definition of indicator Crime and fear of crime –
Incidences and perception of theft, robbery and vandalism in dwellings and public spaces.
Underlying definitions and concepts
This indicator is based on: actual and reported crime by type; crime perception and fear of crime; how people act to face crime and its perception.
Measurements incorporate both the dwelling and its residential environment.
Potential health impact Potential health impacts include general dissatisfaction, stress, sleep deprivation, shock, and physical injury. There can also be increased feelings of social isolation, such as a decline in social networks and contacts and the ‘shell’ effect (where more time is spent inside the home and less outside it), depression and phobias.
Vulnerable groups Risks of crime and fear of crime vary between groups and are dependent on many factors, including age and socio-economic circumstances. For example, most vulnerable to heightened levels of anxiety about entry by intruders are those in poor health. Other vulnerable groups include children, the elderly, handicapped, and people living alone (mainly in urban areas with weak neighbourhood networks and isolated rural areas). Identifying those at high risk is important as it allows for those at risk to be defined and targeted with prevention techniques.
Specification of data needed
Number of thefts in dwellings; Number of crimes against people in public space (includes: theft
by pull, pickpocket, robbery in the public space); Number of crimes in public space (includes: theft by pull,
pickpocket, robbery in the public space, theft in motorized vehicle, theft of motorized vehicle, damage against cultural patrimony, other damage, set fire to building or motorized vehicle)
Number of citizens reporting "fear of crime" inside the dwelling ("How safe do you fell when walking alone after dark in the area?");
Number of citizens reporting "fear of crime" outside the dwelling ("How safe do you fell when you are at home alone after dark?")
Number of dwellings with burglar alarms; number of dwellings with special door locks
Total number of dwellings
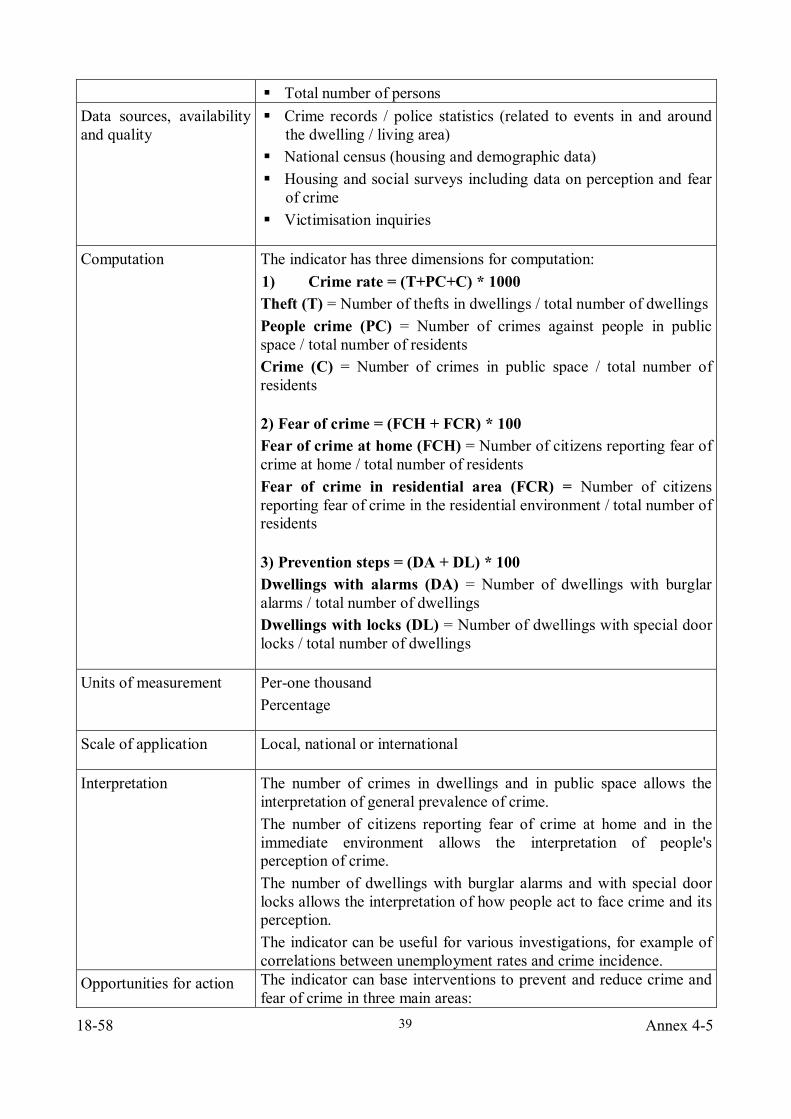
18-58 Annex 4-5
39
Total number of persons Data sources, availability and quality
Crime records / police statistics (related to events in and around the dwelling / living area)
National census (housing and demographic data) Housing and social surveys including data on perception and fear
of crime Victimisation inquiries
Computation The indicator has three dimensions for computation: 1) Crime rate = (T+PC+C) * 1000 Theft (T) = Number of thefts in dwellings / total number of dwellings People crime (PC) = Number of crimes against people in public space / total number of residents Crime (C) = Number of crimes in public space / total number of residents
2) Fear of crime = (FCH + FCR) * 100 Fear of crime at home (FCH) = Number of citizens reporting fear of crime at home / total number of residents Fear of crime in residential area (FCR) = Number of citizens reporting fear of crime in the residential environment / total number of residents
3) Prevention steps = (DA + DL) * 100 Dwellings with alarms (DA) = Number of dwellings with burglar alarms / total number of dwellings Dwellings with locks (DL) = Number of dwellings with special door locks / total number of dwellings
Units of measurement Per-one thousand Percentage
Scale of application Local, national or international
Interpretation The number of crimes in dwellings and in public space allows the interpretation of general prevalence of crime. The number of citizens reporting fear of crime at home and in the immediate environment allows the interpretation of people's perception of crime. The number of dwellings with burglar alarms and with special door locks allows the interpretation of how people act to face crime and its perception. The indicator can be useful for various investigations, for example of correlations between unemployment rates and crime incidence.
Opportunities for action The indicator can base interventions to prevent and reduce crime and fear of crime in three main areas:
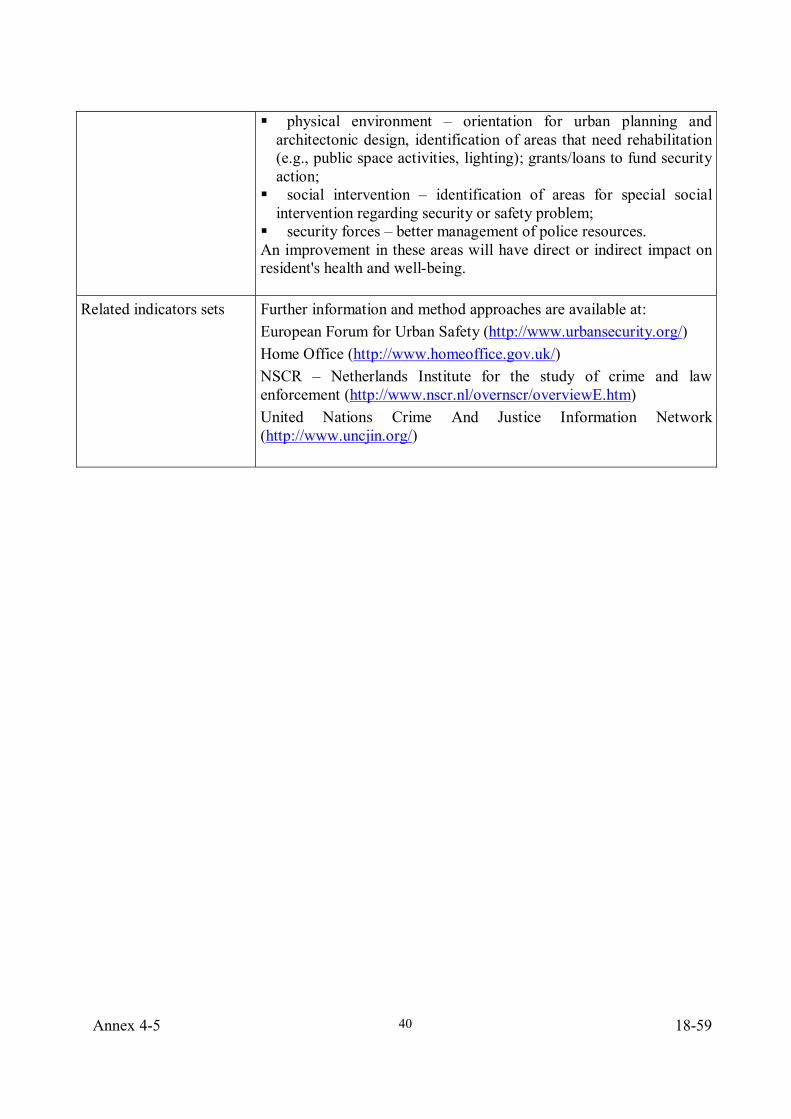
Annex 4-5 18-59
40
physical environment – orientation for urban planning and architectonic design, identification of areas that need rehabilitation (e.g., public space activities, lighting); grants/loans to fund security action;
social intervention – identification of areas for special social intervention regarding security or safety problem;
security forces – better management of police resources. An improvement in these areas will have direct or indirect impact on resident's health and well-being.
Related indicators sets Further information and method approaches are available at: European Forum for Urban Safety (http://www.urbansecurity.org/) Home Office (http://www.homeoffice.gov.uk/) NSCR – Netherlands Institute for the study of crime and law enforcement (http://www.nscr.nl/overnscr/overviewE.htm) United Nations Crime And Justice Information Network (http://www.uncjin.org/)
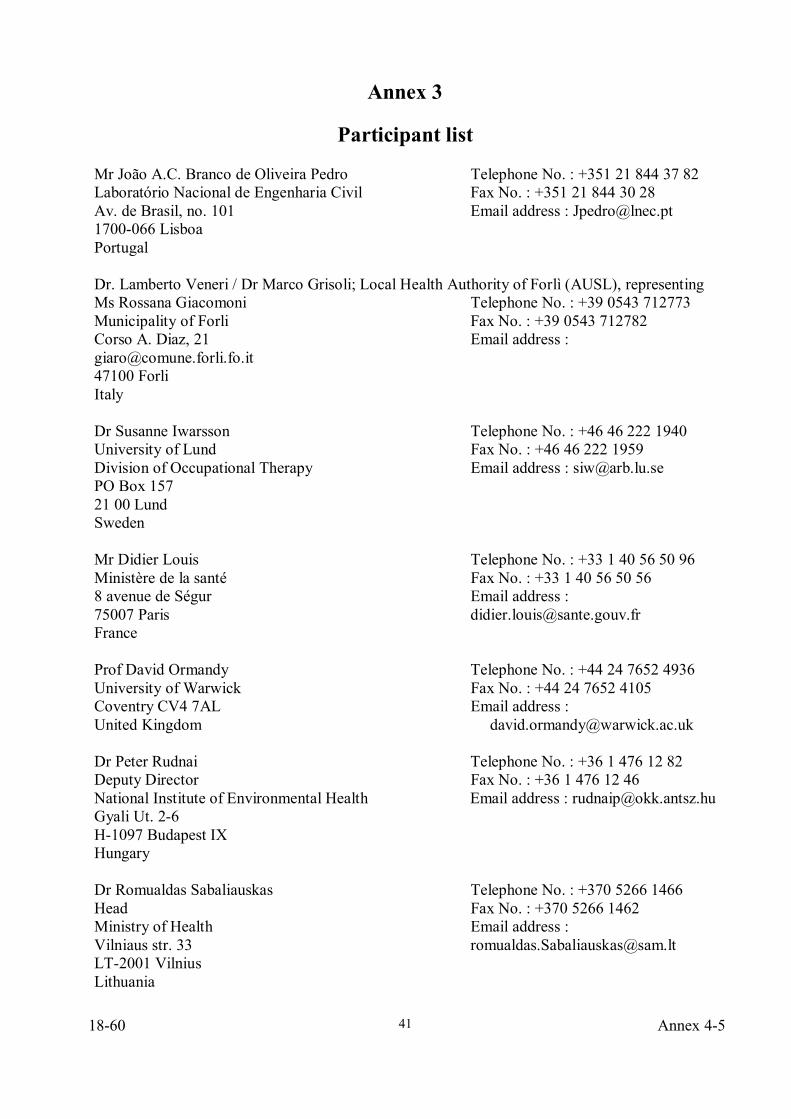
18-60 Annex 4-5
41
Annex 3
Participant list Mr João A.C. Branco de Oliveira Pedro Telephone No. : +351 21 844 37 82 Laboratório Nacional de Engenharia Civil Fax No. : +351 21 844 30 28 Av. de Brasil, no. 101 Email address : [email protected] 1700-066 Lisboa Portugal Dr. Lamberto Veneri / Dr Marco Grisoli; Local Health Authority of Forlì (AUSL), representing Ms Rossana Giacomoni Telephone No. : +39 0543 712773 Municipality of Forli Fax No. : +39 0543 712782 Corso A. Diaz, 21 Email address : [email protected] 47100 Forli Italy Dr Susanne Iwarsson Telephone No. : +46 46 222 1940 University of Lund Fax No. : +46 46 222 1959 Division of Occupational Therapy Email address : [email protected] PO Box 157 21 00 Lund Sweden Mr Didier Louis Telephone No. : +33 1 40 56 50 96 Ministère de la santé Fax No. : +33 1 40 56 50 56 8 avenue de Ségur Email address : 75007 Paris [email protected] France Prof David Ormandy Telephone No. : +44 24 7652 4936 University of Warwick Fax No. : +44 24 7652 4105 Coventry CV4 7AL Email address : United Kingdom [email protected] Dr Peter Rudnai Telephone No. : +36 1 476 12 82 Deputy Director Fax No. : +36 1 476 12 46 National Institute of Environmental Health Email address : [email protected] Gyali Ut. 2-6 H-1097 Budapest IX Hungary Dr Romualdas Sabaliauskas Telephone No. : +370 5266 1466 Head Fax No. : +370 5266 1462 Ministry of Health Email address : Vilniaus str. 33 [email protected] LT-2001 Vilnius Lithuania
Annex 4-5 18-61
42
Dr Irene van Kamp Telephone No. : +31 30 274 3222 National Institute for Public Health and Fax No. : +31 30 274 4407 the Environment (RIVM) Email address : PO Box 1, Mailbox 101 [email protected] 3720 AB Bilthoven Netherlands Mrs Claudia Weigert Telephone No. : +351 218 430 701 Ministry of Health Fax No. : +351 218 430 600 Al. D. Afonso Henriques 45 Email address : 1049-005 Lisbon [email protected] Portugal saude.pt Dr Jaroslava Zapletalova Telephone No. : +421 2 555 75219 Director Fax No. : +421 2 555 74919 Slovak Institute of Housing Email address : [email protected] Presovska 39 821 08 Bratislava Slovakia
World Health Organization Regional Office for Europe Mr Xavier Bonnefoy Telephone No. : +49 2282094101 Regional Adviser WHO European Centre for Environment and Health, Bonn Görresstr. 15 D-53113 Bonn Germany Mr Matthias Braubach Telephone No. : +49 2282094101 Technical Officer WHO European Centre for Environment and Health, Bonn Görresstr. 15 D-53113 Bonn Germany Dr Dafina Dalbokova Telephone No. : +49 2282094101 Environmental Health Information Officer WHO European Centre for Environment and Health, Bonn Görresstr. 15 D-53113 Bonn Germany

This report was produced by a contractor for Health & Consumer Protection Directorate General and represents the views of thecontractor or author. These views have not been adopted or in any way approved by the Commission and do not necessarilyrepresent the view of the Commission or the Directorate General for Health and Consumer Protection. The EuropeanCommission does not guarantee the accuracy of the data included in this study, nor does it accept responsibility for any use madethereof.