Embed Size (px)
Citation preview
Annex 3, Appendix 4
Sensitivity of air sampling methods
SMOPIE Annex 3 Appendix 4 Sensitivity of air sampling methods 1

1 INTRODUCTION As noted in the introduction of WP4, radiation protection in NORM industries implies the assessment of individual annual effective doses as low as1 mSv/year. In practice, it may be necessary to measure exposures below this level because total exposures often comprise contributions from internal as well as external sources. As well as having the required sensitivity, the assessment should also be sufficiently precise to provide confidence in the interpretation of results, and indeed the selection of protection options. The assessment of exposures by air sampling is based on the quantitative analysis of the aerosol deposited on the filtrating medium by either radioanalysis (mainly gross alpha and beta counting) or gravimetry1. The aim of this Appendix is to show how to derive: • the minimum detectable annual dose based on one day air sampling: and • the minimum necessary counting time for gross alpha and beta counting (or the maximum
possible specific activity for gravimetric analysis) to assess with a predefined relative uncertainty a given level of annual individual effective dose.
The variables considered are: • the air sampling duration (sampling time of one week, one day or 1.6 hours); • the background count rates of the alpha and beta counting equipment (or standard error of the
gravimetric analysis); and • the counting time of the samples (1 hour up to 16 hours) The results of the calculations presented in this Appendix pertain to individual radionuclides, chain segments, and the whole U-238 and Th-232 decay series in secular equilibrium. They illustrate how the capacity of the various air sampling strategies to assess (with a 10% relative uncertainty) a level of annual effective dose of 1 mSv depends on sampling time and counting time (for gross alpha and beta counting or aerosol specific activity (for gravimetric analysis). For more details on the calculation methods and results the reader is referred to JP Degrange 04 [1]. 2 BASIC RADIOLOGICAL DATA AND CHARACTERISTICS OF
AIR SAMPLES ANALYSIS METHODS 2.1 Basic radiological data associated with the 238U and 232Th natural
chains Table 1 and Table 2 show the radionuclide composition of the 238U and 232Th natural chains. For each radionuclide, the equilibrium fraction Eqsi (under the secular equilibrium hypothesis) and the ratio R�si (respectively R�si) between the alpha (respectively beta) and total activity is given. In these tables, pure (or almost pure) alpha emitters are presented in yellow, while pure (or almost pure) beta emitters are presented in blue.
1 These are the most commonly used analytical techniques, although other techniques (e.g. x-ray fluorescence) are known to have been used.
SMOPIE Annex 3 Appendix 4 Sensitivity of air sampling methods 2
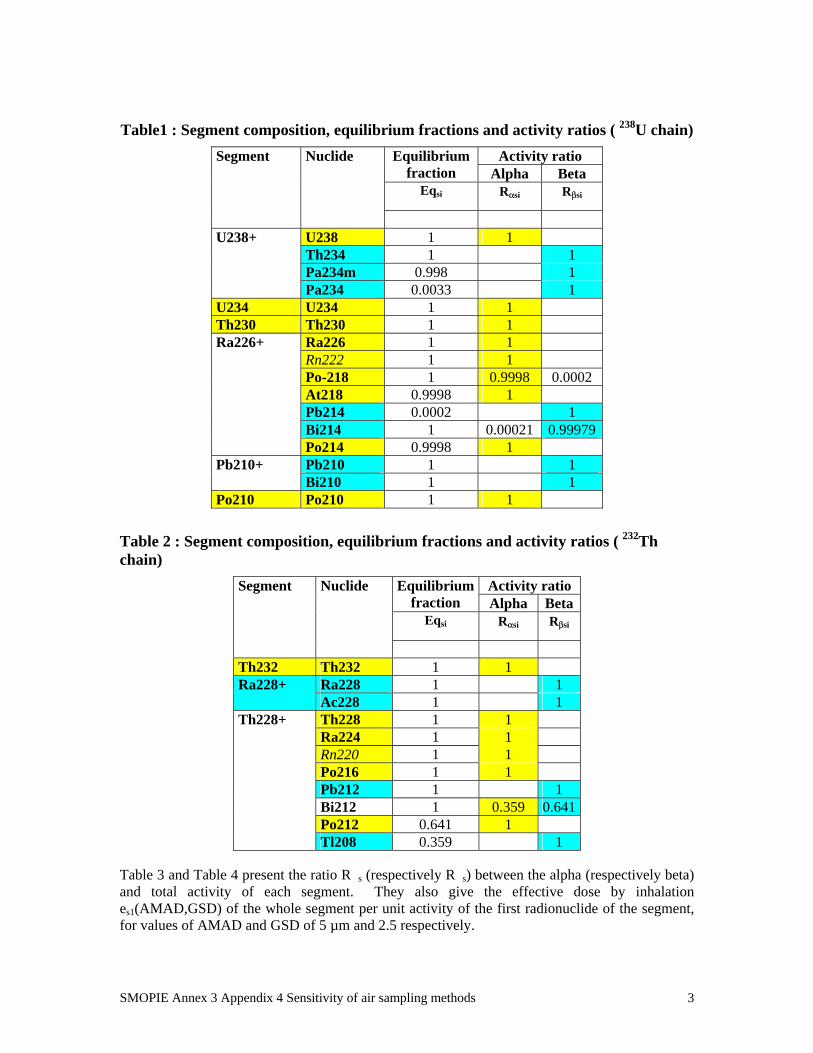
Table1 : Segment composition, equilibrium fractions and activity ratios ( 238U chain) Activity ratio Equilibrium
fraction Alpha Beta Eqsi Rαsi Rβsi
Segment Nuclide
U238 1 1 Th234 1 1 Pa234m 0.998 1
U238+
Pa234 0.0033 1 U234 U234 1 1 Th230 Th230 1 1
Ra226 1 1 Rn222 1 1 Po-218 1 0.9998 0.0002 At218 0.9998 1 Pb214 0.0002 1 Bi214 1 0.00021 0.99979
Ra226+
Po214 0.9998 1 Pb210 1 1 Pb210+ Bi210 1 1
Po210 Po210 1 1
Table 2 : Segment composition, equilibrium fractions and activity ratios ( 232Th chain)
Activity ratio Equilibriumfraction Alpha Beta
Eqsi Rαsi Rβsi
Segment Nuclide
Th232 Th232 1 1
Ra228 1 1 Ra228+ Ac228 1 1 Th228 1 1 Ra224 1 1 Rn220 1 1 Po216 1 1 Pb212 1 1 Bi212 1 0.359 0.641 Po212 0.641 1
Th228+
Tl208 0.359 1 Table 3 and Table 4 present the ratio R�s (respectively R�s) between the alpha (respectively beta) and total activity of each segment. They also give the effective dose by inhalation es1(AMAD,GSD) of the whole segment per unit activity of the first radionuclide of the segment, for values of AMAD and GSD of 5 µm and 2.5 respectively.
SMOPIE Annex 3 Appendix 4 Sensitivity of air sampling methods 3

In these tables, segments purely (or almost purely) constituted of alpha emitters are presented in yellow while those constituted of purely (or almost purely) beta emitters are presented in blue.
Table3 : Activity ratios and effective dose coefficient for each segment ( 238U chain) Activity ratio Effective dose coefficient
by inhalation Alpha Beta es1(AMAD=5µm, GSD=2.5)
Rαs Rβs Fast Moderate Slow
Segment
Sv.Bq-1 Sv.Bq-1 Sv.Bq-1
U238+ 1.00 2.00 5.9E-07 1.7E-06 5.7E-06 U234 1.00 6.5E-07 2.1E-06 6.8E-06 Th230 1.00 1.2E-04 2.8E-05 7.2E-06 Ra226+ 4.00 2.00 4.4E-07 2.2E-06 6.9E-06 Pb210+ 2.00 1.1E-06 7.4E-07 4.3E-06 Po210 1.00 7.3E-07 2.2E-06 2.7E-06
Table4 : Activity ratios and effective dose coefficient for each segment (232Th chain) Activity ratio Effective dose coefficient
by inhalation Alpha Beta es1(AMAD=5µm, GSD=2.5)
Rαs Rβs Fast Moderate Slow
Segment
Sv.Bq-1 Sv.Bq-1 Sv.Bq-1
Th232 1.00 1.3E-04 2.9E-05 1.2E-05 Ra228+ 2.00 1.1E-06 1.7E-06 1.1E-05 Th228+ 5.00 2.00 3.4E-05 2.2E-05 2.5E-05
2.2 Characteristics of the methods considered for air samples analysis Five analysis methods have been considered: gross alpha counting with low and high background levels, and gross beta counting with low and high background levels, as, characterised by their total yield (detection efficiency) Yt and background rate B; and gravimetric analysis (see table 5).
Table5 : Characteristics of the methods considered for air samples analysis Detection efficiency
Background rate
Yt B
Analysis Method
s-1
Low background 0.333 0.001 Gross α counting High background 0.333 0.01
Low background 0.5 0.01 Gross β counting High background 0.5 0.1 Gravimetry 1.0 -
SMOPIE Annex 3 Appendix 4 Sensitivity of air sampling methods 4

2.3 Limits of detection For information on counting statistics, and the concepts of critical level (Lc), Limit of detection (Ld) and Limit of determination (Lq), the reader is referred to [2] – [5]. How these concepts define the three principal analytical regions is illustrated in figure 1.
Figure 1 : The three principal analytical regions
Net signal
Kβ σdKα σ0
Kq σq
Lq
DETECTION : QUANTITATIVE
ANALYSIS
DETECTION : QUALITATIVE
ANALYSIS
UNRELIABLE DETECTION
Ld Lc 0
Figure 1: The three principal analytical regions Figure 2 presents, the variation with counting duration of the limits of detection for the four radiometric analysis methods considered. Table 6 presents the variation with counting duration of the limits of detection for the four considered methods of radioanalysis of air samples as well as the limit of detection for the analysis by gravimetry (k = 1.645).
SMOPIE Annex 3 Appendix 4 Sensitivity of air sampling methods 5

1.E-04
1.E-03
1.E-02
1.E-01
1.E+00
1.E+01
1.E-02 1.E-01 1.E+00 1.E+01 1.E+02
Counting duration Tc (h)
Lim
it of
det
ectio
n Ld
a (B
q)
alpha Y 0,333 ; B 0,001 cpsalpha Y 0,333 ; B 0,01 cpsbeta Y 0,5 ; B 0,01 cpsbeta Y 0,5 ; B 1 cps
Figure 2: Evolution with counting duration of the limits of detection in activity Lda associated with gross alpha and beta radioanalysis (k = 1.645)
Table 6: Limits of detection in activity/mass of the considered analysis methods
Counting duration TC
(h)
Analysis method
Limit of detection
0.06 0.25 1.00 4.00 16.00 32.00 64.00 Low background 6.6E-02 2.4E-02 9.6E-03 4.3E-03 2.0E-03 1.4E-03 9.6E-04 Gross
α counting
Lda α(Bq)
High background
1.3E-01 5.6E-02 2.6E-02 1.2E-02 6.0E-03 4.2E-03 3.0E-03
Low background 8.6E-02 3.7E-02 1.7E-02 8.1E-03 4.0E-03 2.8E-03 2.0E-03 Gross
β counting
Lda β(Bq)
High background
6.4E-01 3.2E-01 1.6E-01 7.8E-02 3.9E-02 2.8E-02 1.9E-02
Gravi- metry
LdG(g)
1.00E-04
In quantitative analysis one is interested in a net value of the signal sufficiently close to the true value, e.g. in a coefficient of variation sufficiently small. The
SMOPIE Annex 3 Appendix 4 Sensitivity of air sampling methods 6

limit of determination Lq is defined as the maximum true value of the net signal above which the standard deviation remains below a predefined value kq. If the true value of the net signal is above the limit of determination Lq the relative uncertainty will be below 1/ kq. The limit of determination is given by the following formula: Lq = kq σq 3 CONVERSION TO EFFECTIVE DOSES 3.1 From airborne activity concentration of the first radionuclide of a
segment The following formula presents the conversion of the airborne activity concentration of the first radionuclide of a segment s of radionuclides Cs1 into the effective dose by inhalation of the whole segment Es: Es = Br . Te . ∑i esi(AMAD, GSD) . Csi = Br . Te . es1(AMAD, GSD) . Cs1 with Es Effective dose by inhalation of segment s (Sv) Br Breathing rate (m3 . h-1) Te Exposure duration (h) esi(AMAD, GSD) Effective dose coefficient for the ith radionuclide of segment s (Sv.Bq-1) Csi Airborne activity concentration of the ith radionuclide of segment s (Bq.m-3) es1(AMAD, GSD) Effective dose coefficient for segment s (effective dose / unit activity of the first radionuclide of segment s) (Sv.Bq-1) Cs1 Airborne activity concentration of the first radionuclide of segment s (Bq.m-3) s Set of radionuclides in a given status of equilibrium where es1(AMAD, GSD) = ∑i Eqsi . esi(AMAD, GSD) and Eqsi = Csi / Cs1 3.2 From activity or mass of one segment on a filter 3.2.1 Alpha and beta counting The following formula shows the determination of the airborne activity concentration of the first radionuclide of a segment/chain on the basis of the total alpha (or beta) activity Aαβs deposited on the filtrating medium: Cs1 = Aαβs / (Rαβs . Rx(AMAD, GSD) . Fr . Ts ) (alpha or beta counting) with Aαβs Total alpha (or beta) activity from segment s deposited on the filter (Bq) Rαβs Ratio between the total alpha (or beta) activity of segment s and the activity of the first radionuclide of segment s Rx(AMAD, GSD) Ratio between the true airborne activity concentration and
SMOPIE Annex 3 Appendix 4 Sensitivity of air sampling methods 7
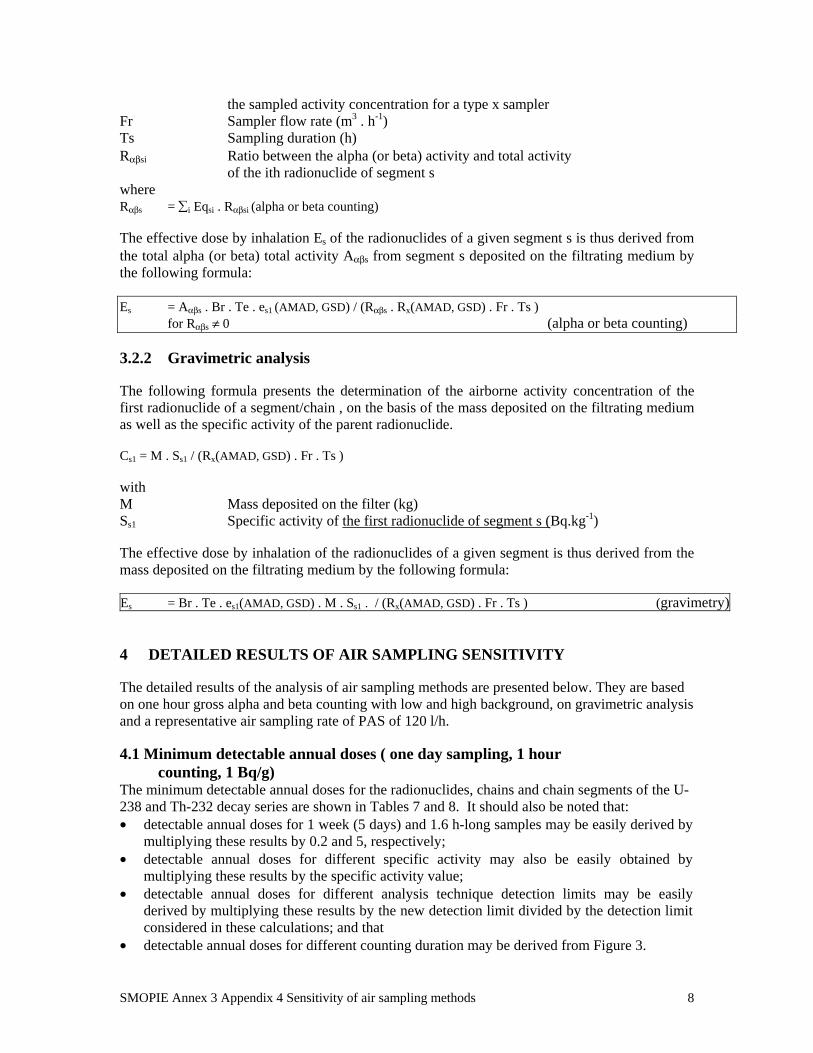
the sampled activity concentration for a type x sampler Fr Sampler flow rate (m3 . h-1) Ts Sampling duration (h) Rαβsi Ratio between the alpha (or beta) activity and total activity of the ith radionuclide of segment s where Rαβs = ∑i Eqsi . Rαβsi (alpha or beta counting) The effective dose by inhalation Es of the radionuclides of a given segment s is thus derived from the total alpha (or beta) total activity Aαβs from segment s deposited on the filtrating medium by the following formula: Es = Aαβs . Br . Te . es1 (AMAD, GSD) / (Rαβs . Rx(AMAD, GSD) . Fr . Ts ) for Rαβs ≠ 0 (alpha or beta counting) 3.2.2 Gravimetric analysis The following formula presents the determination of the airborne activity concentration of the first radionuclide of a segment/chain , on the basis of the mass deposited on the filtrating medium as well as the specific activity of the parent radionuclide. Cs1 = M . Ss1 / (Rx(AMAD, GSD) . Fr . Ts ) with M Mass deposited on the filter (kg) Ss1 Specific activity of the first radionuclide of segment s (Bq.kg-1) The effective dose by inhalation of the radionuclides of a given segment is thus derived from the mass deposited on the filtrating medium by the following formula: Es = Br . Te . es1(AMAD, GSD) . M . Ss1 . / (Rx(AMAD, GSD) . Fr . Ts ) (gravimetry) 4 DETAILED RESULTS OF AIR SAMPLING SENSITIVITY The detailed results of the analysis of air sampling methods are presented below. They are based on one hour gross alpha and beta counting with low and high background, on gravimetric analysis and a representative air sampling rate of PAS of 120 l/h. 4.1 Minimum detectable annual doses ( one day sampling, 1 hour
counting, 1 Bq/g) The minimum detectable annual doses for the radionuclides, chains and chain segments of the U-238 and Th-232 decay series are shown in Tables 7 and 8. It should also be noted that: • detectable annual doses for 1 week (5 days) and 1.6 h-long samples may be easily derived by
multiplying these results by 0.2 and 5, respectively; • detectable annual doses for different specific activity may also be easily obtained by
multiplying these results by the specific activity value; • detectable annual doses for different analysis technique detection limits may be easily
derived by multiplying these results by the new detection limit divided by the detection limit considered in these calculations; and that
• detectable annual doses for different counting duration may be derived from Figure 3.
SMOPIE Annex 3 Appendix 4 Sensitivity of air sampling methods 8

1,E-02
1,E-01
1,E+00
1,E+01
1,E-02 1,E-01 1,E+00 1,E+01 1,E+02 1,E+03
Counting duration T (h)
Ld (c
ps) /
Ld(
cps)
60m
in
B=0.001 cpsB=0.01 cpsB=0.1 cpsB=1 cps
Figure 3: Conversion factor to apply to the detectable doses for a 1 h counting duration to derive the detectable dose for any counting duration.
SMOPIE Annex 3 Appendix 4 Sensitivity of air sampling methods 9

Table 7. Minimum detectable annual dose, Ldad, for nuclides and chain segments of the U-238 decay series (120 l/h sampling rate, 1 h counting, 1 day-long samples)
Minimum detectable annual dose (120 l/h sampling rate, 1 h counting, 1 day-long samples)
Ldad αs * Ldad βs * Ldad Gs ** Alpha Beta Gravimetry
Low Background
High background
Low background
High background
Ss1 = 1Bq/g
Absorp-tion Type
Segment
mSv/year mSv/year mSv/year mSv/year mSv/year U238++ 2.9E-01 7.8E-01 6.9E-01 6.3E+00 2.4E-02 U238+ 1.1E-02 3.0E-02 1.0E-02 9.2E-02 1.2E-04 U234 1.3E-02 3.3E-02 1.3E-04 Th230 2.3E+00 6.0E+00 2.4E-02 Ra226+ 2.1E-03 5.6E-03 7.5E-03 6.9E-02 8.8E-05 Pb210+ 1.9E-02 1.7E-01 2.2E-04
Fast
Po210 1.4E-02 3.7E-02 1.5E-04 U238++ 8.8E-02 2.3E-01 2.1E-01 1.9E+00 7.3E-03 U238+ 3.2E-02 8.5E-02 2.8E-02 2.6E-01 3.3E-04 U234 4.1E-02 1.1E-01 4.2E-04 Th230 5.3E-01 1.4E+00 5.5E-03 Ra226+ 1.1E-02 2.8E-02 3.7E-02 3.4E-01 4.4E-04 Pb210+ 1.3E-02 1.2E-01 1.5E-04
Moderate
Po210 4.2E-02 1.1E-01 4.3E-04 U238++ 8.1E-02 2.2E-01 1.9E-01 1.8E+00 6.7E-03 U238+ 1.1E-01 2.9E-01 9.7E-02 9.0E-01 1.2E-03 U234 1.3E-01 3.5E-01 1.4E-03 Th230 1.4E-01 3.7E-01 1.4E-03 Ra226+ 3.3E-02 8.8E-02 1.2E-01 1.1E+00 1.4E-03 Pb210+ 7.3E-02 6.7E-01 8.5E-04
Slow
Po210 5.2E-02 1.4E-01 5.4E-04 (*) Tc = 1 h (**) Ldad Gs = Ldad’Gs for Ss1 = 1 Bq/g
SMOPIE Annex 3 Appendix 4 Sensitivity of air sampling methods 10

Table 8. Minimum detectable annual dose, Ldad, for nuclides and chain segments of the Th-232 decay series (120 l/h sampling rate, 1 h counting, 1 day-long samples)
Minimum detectable annual dose
(120 l/h sampling rate, 1 h counting, 1 day-long samples) Ldad αs * Ldad βs * Ldad Gs ** Alpha Beta Gravimetry
Low background
High background
Low background
High background
Ss1 = 1Bq/g
Absorp-tion Type
Segment
mSv/year mSv/year mSv/year mSv/year mSv/year Th232++ 5.2E-01 1.4E+00 1.4E+00 1.3E+01 3.3E-02 Th232 2.5E+00 6.5E+00 2.6E-02 Ra228+ 1.9E-02 1.7E-01 2.2E-04
Fast
Th228+ 1.3E-01 3.5E-01 5.8E-01 5.4E+00 6.8E-03 Th232++ 1.7E-01 4.5E-01 4.5E-01 4.2E+00 1.1E-02 Th232 5.6E-01 1.5E+00 5.8E-03 Ra228+ 2.9E-02 2.7E-01 3.4E-04
Moderate
Th228+ 8.5E-02 2.3E-01 3.8E-01 3.5E+00 4.4E-03 Th232++ 1.6E-01 4.1E-01 4.1E-01 3.8E+00 9.7E-03 Th232 2.3E-01 6.1E-01 2.4E-03 Ra228+ 1.9E-01 1.8E+00 2.3E-03
Slow
Th228+ 9.7E-02 2.6E-01 4.3E-01 4.0E+00 5.0E-03 (*) Tc = 1 h (**) Ldad Gs = Ldad’Gs for Ss1 = 1 Bq/g 4.2 Minimum counting time and maximum specific activity for
determining 1 mSv/a with 10% coefficient of variation Minimum counting times and maximum specific activities required for determining exposures of 1 mSv/a with 10% coefficient of variation are provided in Tables 9 and 10 for the U-238 and the Th-232 decay series, respectively. They are based on a sampling time of 1 day (one shift). Note that for 5 day sampling times the minimum counting times and maximum specific activities should be divided by a factor of 5 and for 1.6 hour sampling times multiplied by factor of 5. 4.3 Minimum sampling duration to dertermine 1 mSv/a with a 10%
coefficient of variation Tables 11 and 12 show the minimum sampling times at 120 l/h required to determine an exposure of 1 mSv/a with 10% coefficient of variation. The results are based on an assumed counting time of up to 16 hours. 4.4 Summary of capacities of analytical methods to determine 1 mSv/a
with 10% coefficient of variation The capacities of the analytical methods to determine 1 mSv/a with a 10% coefficient of variation have been summarised in Table 13 and 14 for the U-238 and Th-232 chains respectively. The assumed maximum counting time is 16 hours and the maximum specific activity is < 10 Bq/g.
SMOPIE Annex 3 Appendix 4 Sensitivity of air sampling methods 11
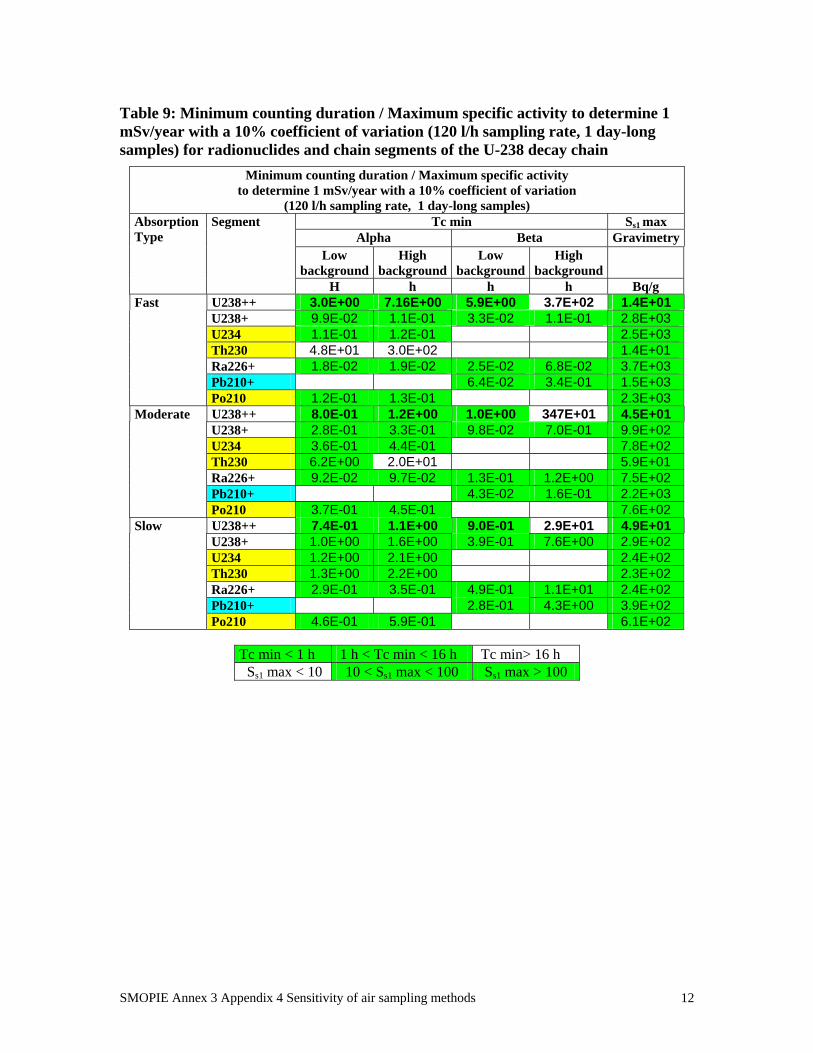
Table 9: Minimum counting duration / Maximum specific activity to determine 1 mSv/year with a 10% coefficient of variation (120 l/h sampling rate, 1 day-long samples) for radionuclides and chain segments of the U-238 decay chain
Minimum counting duration / Maximum specific activity to determine 1 mSv/year with a 10% coefficient of variation
(120 l/h sampling rate, 1 day-long samples) Tc min Ss1 max
Alpha Beta GravimetryLow
backgroundHigh
backgroundLow
backgroundHigh
background
Absorption Type
Segment
H h h h Bq/g U238++ 3.0E+00 7.16E+00 5.9E+00 3.7E+02 1.4E+01 U238+ 9.9E-02 1.1E-01 3.3E-02 1.1E-01 2.8E+03 U234 1.1E-01 1.2E-01 2.5E+03 Th230 4.8E+01 3.0E+02 1.4E+01 Ra226+ 1.8E-02 1.9E-02 2.5E-02 6.8E-02 3.7E+03 Pb210+ 6.4E-02 3.4E-01 1.5E+03
Fast
Po210 1.2E-01 1.3E-01 2.3E+03 U238++ 8.0E-01 1.2E+00 1.0E+00 347E+01 4.5E+01 U238+ 2.8E-01 3.3E-01 9.8E-02 7.0E-01 9.9E+02 U234 3.6E-01 4.4E-01 7.8E+02 Th230 6.2E+00 2.0E+01 5.9E+01 Ra226+ 9.2E-02 9.7E-02 1.3E-01 1.2E+00 7.5E+02 Pb210+ 4.3E-02 1.6E-01 2.2E+03
Moderate
Po210 3.7E-01 4.5E-01 7.6E+02 U238++ 7.4E-01 1.1E+00 9.0E-01 2.9E+01 4.9E+01 U238+ 1.0E+00 1.6E+00 3.9E-01 7.6E+00 2.9E+02 U234 1.2E+00 2.1E+00 2.4E+02 Th230 1.3E+00 2.2E+00 2.3E+02 Ra226+ 2.9E-01 3.5E-01 4.9E-01 1.1E+01 2.4E+02 Pb210+ 2.8E-01 4.3E+00 3.9E+02
Slow
Po210 4.6E-01 5.9E-01 6.1E+02
Tc min < 1 h 1 h < Tc min < 16 h Tc min> 16 h Ss1 max < 10 10 < Ss1 max < 100 Ss1 max > 100
SMOPIE Annex 3 Appendix 4 Sensitivity of air sampling methods 12
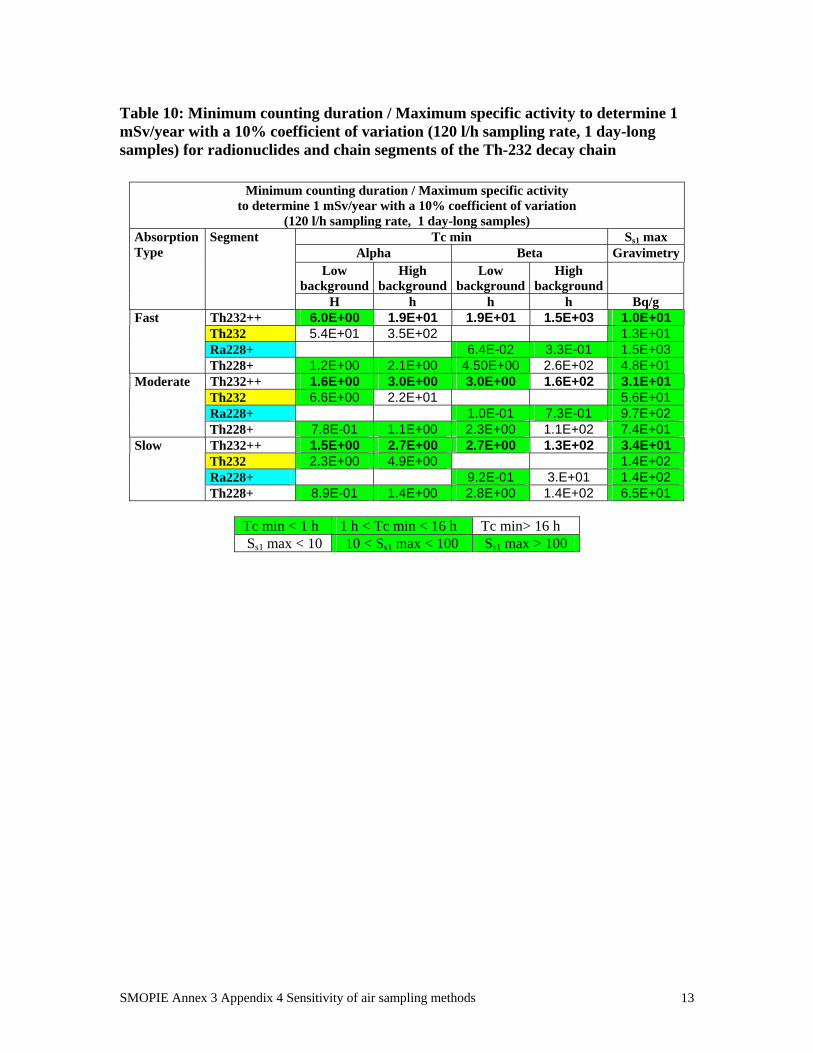
Table 10: Minimum counting duration / Maximum specific activity to determine 1 mSv/year with a 10% coefficient of variation (120 l/h sampling rate, 1 day-long samples) for radionuclides and chain segments of the Th-232 decay chain
Minimum counting duration / Maximum specific activity to determine 1 mSv/year with a 10% coefficient of variation
(120 l/h sampling rate, 1 day-long samples) Tc min Ss1 max
Alpha Beta GravimetryLow
backgroundHigh
backgroundLow
backgroundHigh
background
Absorption Type
Segment
H h h h Bq/g Th232++ 6.0E+00 1.9E+01 1.9E+01 1.5E+03 1.0E+01 Th232 5.4E+01 3.5E+02 1.3E+01 Ra228+ 6.4E-02 3.3E-01 1.5E+03
Fast
Th228+ 1.2E+00 2.1E+00 4.50E+00 2.6E+02 4.8E+01 Th232++ 1.6E+00 3.0E+00 3.0E+00 1.6E+02 3.1E+01 Th232 6.6E+00 2.2E+01 5.6E+01 Ra228+ 1.0E-01 7.3E-01 9.7E+02
Moderate
Th228+ 7.8E-01 1.1E+00 2.3E+00 1.1E+02 7.4E+01 Th232++ 1.5E+00 2.7E+00 2.7E+00 1.3E+02 3.4E+01 Th232 2.3E+00 4.9E+00 1.4E+02 Ra228+ 9.2E-01 3.E+01 1.4E+02
Slow
Th228+ 8.9E-01 1.4E+00 2.8E+00 1.4E+02 6.5E+01
Tc min < 1 h 1 h < Tc min < 16 h Tc min> 16 h Ss1 max < 10 10 < Ss1 max < 100 Ss1 max > 100
SMOPIE Annex 3 Appendix 4 Sensitivity of air sampling methods 13

Table 11: Minimum sampling duration to determine 1 mSv/year with a 10% coefficient of variation (120 l/h) for radionuclides and chain segments of the U-238 decay chain Minimum sampling duration * to determine 1 mSv/year with a 10% coefficient of variation (120 l/h)
Tc min < 16 h Ss1 max > 10 Bq/g
Alpha Beta Gravimetry
Absorption Type
Segment
Low background
High background
Low background
High background
D D D W D U238+ H H H H H U234 H H H Th230 W W D Ra226+ H H H H H Pb210+ H H H
Po210 H H H U238++ H H H W D U238+ H H H H H U234 H H H Th230 D W H Ra226+ H H H D H Pb210+ H H H
Moderate
Po210 H H H U238++ H H H W H U238+ H D H D H U234 H D H Th230 H D H Ra226+ H H H D H Pb210+ H D H
Slow
Po210 H H H
Hourly Daily Weekly < Weekly
(*) H: 1.5 h sampling (1000 samples/year), D: Daily sampling (200 samples/year), W: Weekly sampling (40 samples/year) Bh: Gross beta counting, high background (Min. counting duration < 16h) G: Gravimetry (Max. specific activity > 10Bq/g)
SMOPIE Annex 3 Appendix 4 Sensitivity of air sampling methods 14

Table 12: Minimum sampling duration to determine 1 mSv/year with a 10% coefficient of variation (120 l/h) for radionuclides and chain segments of the Th-232 decay chain
Minimum sampling duration * to detect 1 mSv/year with a 10% coefficient of variation (120 l/h) Tc min < 16 h Ss1 max >
10 Bq/g Alpha Beta Gravimetry
Absorption Type
Segment
Low background
High background
Low background
High background
Th232++ D W W D Th232 W W D Ra228+ H H H
Fast
Th228+ H D D W D Th232++ H D D W D Th232 D W H Ra228+ H H H
Moderate
Th228+ H H D W H Th232++ H D D W D Th232 D D H Ra228+ H W H
Slow
Th228+ H D D W H
Hourly Daily Weekly < Weekly
(*) H: 1.5 h sampling (1000 samples/year), D: Daily sampling (200 samples/year), W: Weekly sampling (40 samples/year) Bh: Gross beta counting, high background (Min. counting duration < 16h) G: Gravimetry (Max. specific activity > 10Bq/g)
SMOPIE Annex 3 Appendix 4 Sensitivity of air sampling methods 15

Table 13 : Capacity of the analysis methods to determine 1 mSv/year with a 10% coefficient of variation (120 l/h sampling rate, hour/day/week-long samples), U-238 chain
Capacity of the analysis methods * to determine 1 mSv/year with a 10% coefficient of variation (120 l/h))
Absorption Type
Segment 1.6 h -long
samples
1 day - long
samples
1 week - long
samples U238++ Ah Bl Ah Bh G U238+ Ah Bh G Ah Bh G Ah Bh G U234 Ah G Ah G Ah G Th230 G Ah G Ra226+ Ah Bh G Ah Bh G Ah Bh G Pb210+ Bh G Bh G Bh G
Fast
Po210 Ah G Ah G Ah G U238++ Ah Bl Ah Bl G Ah Bh G U238+ Ah Bh G Ah Bh G Ah Bh G U234 Ah G Ah G Ah G Th230 G Al G Ah G Ra226+ Ah Bl G Ah Bh G Ah Bh G Pb210+ Bh G Bh G Bh G
Moderate
Po210 Ah G Ah G Ah G U238++ Ah Bl G Ah Bl G Ah Bh G U238+ Al Bl G Ah Bh G Ah Bh G U234 Al G Ah G Ah G Th230 Al G Ah G Ah G Ra226+ Ah Bl G Ah Bh G Ah Bh G Pb210+ Bl G Bh G Bh G
Slow
Po210 Bh G Bh G Bh G Al: Gross alpha counting, low background (Min. counting duration < 16h) Ah: Gross alpha counting, high background (Min. counting duration < 16h) Bl: Gross beta counting, low background (Min. counting duration < 16h) G: Gravimetry (Max. specific act. > 10Bq/g)
SMOPIE Annex 3 Appendix 4 Sensitivity of air sampling methods 16
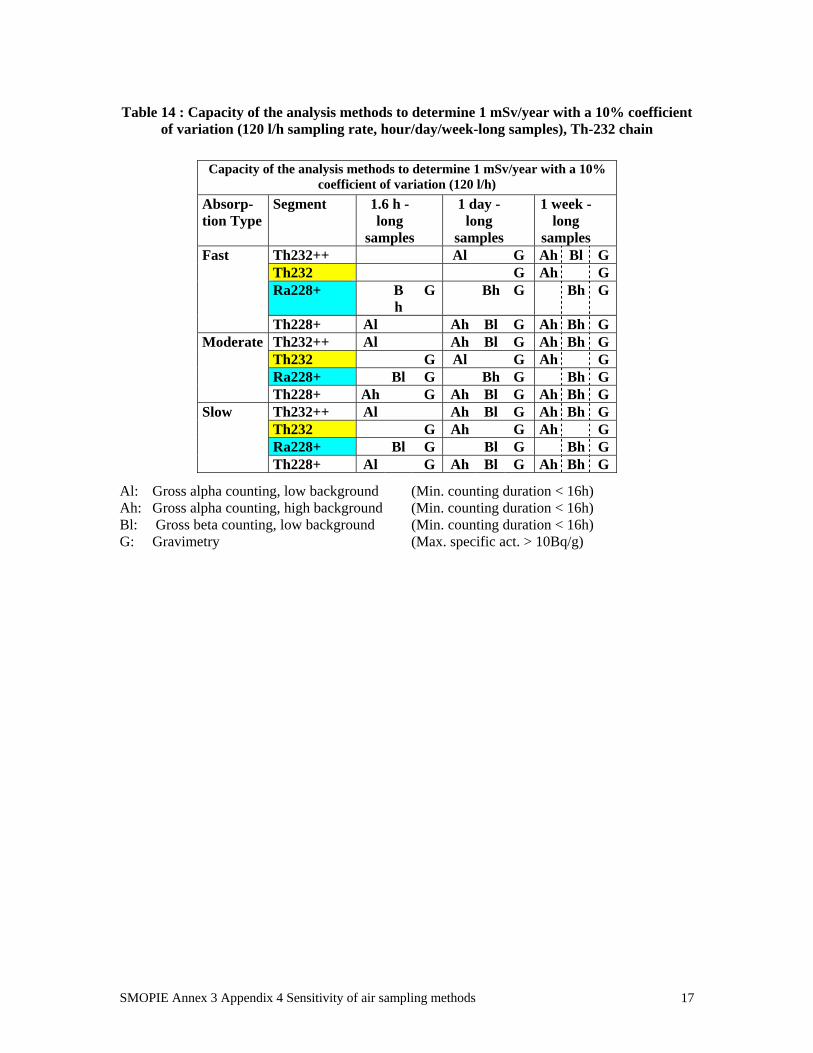
Table 14 : Capacity of the analysis methods to determine 1 mSv/year with a 10% coefficient of variation (120 l/h sampling rate, hour/day/week-long samples), Th-232 chain
Capacity of the analysis methods to determine 1 mSv/year with a 10%
coefficient of variation (120 l/h) Absorp-tion Type
Segment 1.6 h -long
samples
1 day - long
samples
1 week - long
samples Th232++ Al G Ah Bl G Th232 G Ah G Ra228+ B
h G Bh G Bh G
Fast
Th228+ Al Ah Bl G Ah Bh G Th232++ Al Ah Bl G Ah Bh G Th232 G Al G Ah G Ra228+ Bl G Bh G Bh G
Moderate
Th228+ Ah G Ah Bl G Ah Bh G Th232++ Al Ah Bl G Ah Bh G Th232 G Ah G Ah G Ra228+ Bl G Bl G Bh G
Slow
Th228+ Al G Ah Bl G Ah Bh G
Al: Gross alpha counting, low background (Min. counting duration < 16h) Ah: Gross alpha counting, high background (Min. counting duration < 16h) Bl: Gross beta counting, low background (Min. counting duration < 16h) G: Gravimetry (Max. specific act. > 10Bq/g)
SMOPIE Annex 3 Appendix 4 Sensitivity of air sampling methods 17

4 REFERENCES [1] JP Degrange, Exposure by inhalation to NORMs: Sensitivity of Air Sampling Techniques
and Bioassays, CEPN-NTE-04/15, June 2004. [2] L.A. Currie, Limits for quantitative detection and quantitative determination: Application to
radiochemistry, Analytical Chemistry, Vol. 40, N°3, March 1968. [3] J.A. MacLellan, and DJ Strom, Traditional Formulas For Decision Level Are Wrong For
Small Numbers of Counts, in proceedings of the Bioassay Analytical & Environmental Radiochemistry (BAER) Conference, Gaithersburg, 1999 Oct 18-22, 1999.
http://bidug.pnl.gov/presentations/baer1999/BAER99_MacLellanJA_StromDJ.PDF [4] L.A Currie, Lower Limit of Detection: Definition and Elaboration of a Proposed Position for
Radiological Effluent and Environmental Measurements, NUREG/CR-4007, Washington, DC: U.S. Nuclear Regulatory Commission, 1984.
[5] S.H. Fong and J.L. Alvarez, When is a lower limit of detection low enough?,
Health Physics Vol. 72, N° 2 , 1997.
SMOPIE Annex 3 Appendix 4 Sensitivity of air sampling methods 18