Embed Size (px)
Citation preview
Project: BiG>East (EIE/07/214)
Deliverable 2.2 Summary Report of the WP2
Augustin Ofiteru, Mihai Adamescu,
Dan Ionescu
SC Mangus Sol SRL, Romania
With the support of:

1 Introduction This paper presents the results and conclusions of work tasks within WP2 of the BiG>East project in order to implement and develop biogas production in Bulgaria, Croatia, Greece, Latvia, Romania and Slovenia, the participant and also target countries of this project:
Task 2.1. - Biogas installations in Romania
Task 2.2. - Technical review of the utilisation of waste material for biogas production in Romania
Task 2.3. - Estimation of the potential feedstock availability in Eastern Europe
Task 2.4. - Assessment of the agricultural structure
Task 2.5. - Biogas purification and assessment of the natural gas grid
Task 2.7. - Impact of biogas production in Bulgaria, Croatia, Greece, Latvia, Romania and Slovenia
All these results and conclusions provide an general overview about the actual state of technical-economical and material availabilities and opportunities for biogas production in the target countries of the BiG>East project, also considering the main ecological aspects. Furthermore, these studies support the key objective of BiG>East, providing the appropriate information for the biogas experts of Western Europe in order to transfer the knowledge from them to farmers, biogas plant operators and decision makers in Bulgaria, Croatia, Greece, Latvia, Romania, and Slovenia.
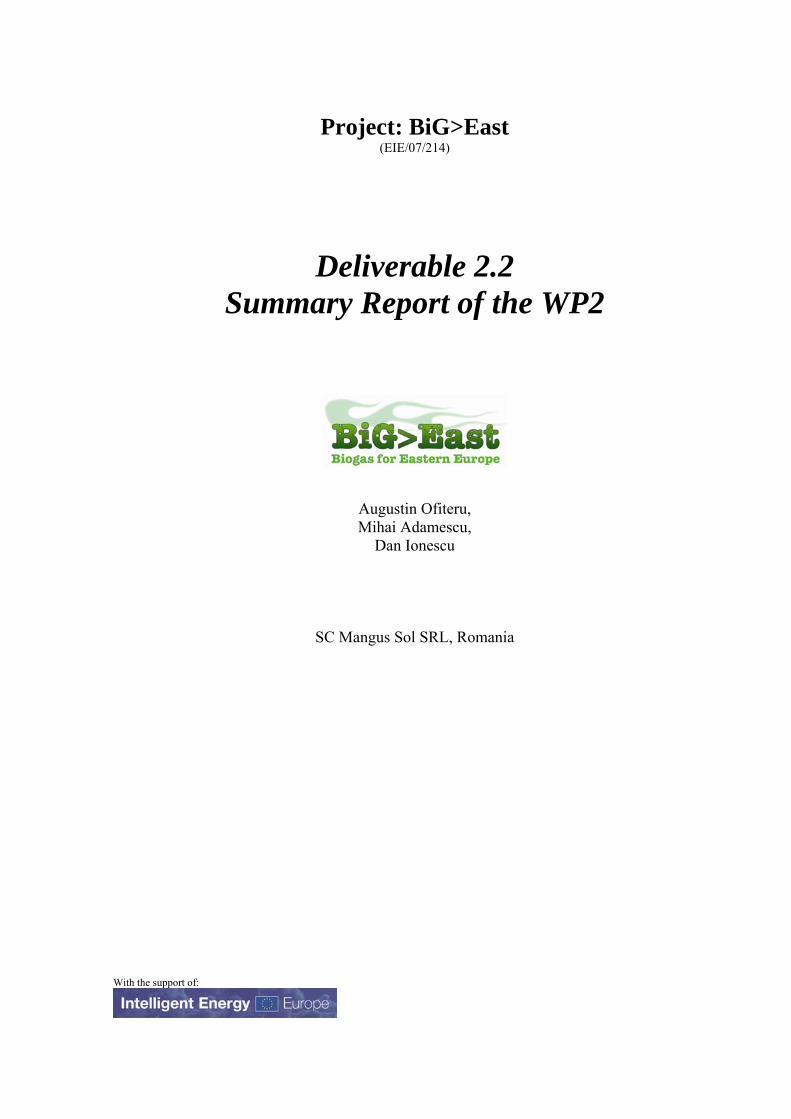
2 Renewable Energies in Romania
With an electricity consumption of 58.49 TWh (2007), Romania has a net excedent of electricity production, based on a huge hydropower system counting for almost 40 % of the total produced energy. This makes from Romania one of the net electricity exporters in the Balkan region.
Comparative distribution of main sources of energy generation in the region
This is especially due to the high investment rate (prior to 1990 in Romania) in the hydro-electrical power generation (especially large facilities). No significant investments in other forms of renewable energy (biomass, wind and solar) were made after 1989. It is expected that the figures describing percentual quota of renewable energy production in Romania to change dramatically if large hydro power plants will be excluded from the statistics.
Dynamics of renewable energy production in Romania
01000200030004000500060007000
1993
1994
1995
1996
1997
1998
1999
2000
2001
2002
2003
2004
1000
toe

3 Current biogas status in Romania
3.1 History of biogas in Romania
During the past six decades, Romania developed a large biogas promotion project, which was designed to cover the essential steps from research stage to pilot plants and implementation to large scale.
The project focused on two main directions:
1. large capacities coupled with water treatment plants 2. development of facilities for use in the farming sector (including small units)
The follow up of the national plan for biogas has passed the next steps (1958-1982):
1. Research for the identification of methanogen bacteria for animal and household waste.
2. Research for obtaining biogas from organic mud. 3. Biogas industrial type facilities developed at waste water treatment plans. Usual
capacity 2,000m3*day-1 4. Almost all major cities have been implemented the developed technology. The total
biogas production capacity from this sector was estimated at 85,000m3 biogas *day-1 (30 million m3 per year).
5. Pilot facilities for animal waste with a capacity of 30 m3*day-1 6. Pilot semi-industrial capacity for biogas production from pig farms with a capacity of
580 m3*day-1 7. Development of small capacities (households) for biogas production. Capacity 5-10
m3 but also 20, 30, 40 and 50 m3*day-1. 8. Anaerobic digestion of biodegradable wastes from pig farms. Typical capacities were
around 7,000-8,000 m3*day-1
The results of the 30 year program was the development of a total of 400 facilities, with a total energy production of 0.18 TWh*year-1.
The main drawback of this project was the fact that the owner was the State, through the state owned companies. After the fall of the regime in 1989, a long process of reorganisation, privatisation and liquidation of those companies occurred, having as result a gradual depreciation and disassemblement of the biogas facilities. Virtually, no plant from the 400 developed still existed in 2008. The information available for these facilities is scarce.
Timid efforts for promotion of biogas were done by NGO’s, private company and State Agency starting with 2006. At the moment, no more than 2 plants, both with a pilot type status exist in Romania: 1) ISPCAIA Bucharest, built in 1980 for animal manure treatment (2 to/day) – it produces 900 m3/day biogas; 2) Tirgu Mures Waste Water Treatment Plant built from October 1997 to May 2001 (construction duration 3.5 years) - it is designed to produce thermal power / electric power (711KWth / 455Kwel) - this installation was made possible due to non reimbursement financial support by the Dutch government (project’s name was “Dutch Drinking Water and Wastewater Project”).
3.2 Future biogas plants in Romania
3.2.1 Biogas plants in construction No biogas plants in construction at the moment (June 2008).
3.2.2 Biogas projects in preparation No biogas plants in preparation at the moment, except the show-cases developed by Mangus, to be described in the frame of WP 6 (June 2008).

4 Waste material for biogas production in Romania
4.1 Waste removal, disposal and recovery
The management of municipal waste is performed in an organised system, by specialised services belonging to the municipalities or to private operators, but this system only covers 95% of all municipal waste generators in the urban areas.
In rural areas, waste management services are not so well organised in many cases (only a limited number of rural settlements being covered), the transport to disposal sites being performed individually by the waste generators.
There are two system used: a) general collection system (no separate collection) – 95% of the municipal waste is disposed on landfills (252 registered municipal waste in 2002, which represent 27% of the total number of waste landfills in Romania); b) pilot projects for separate collection of wastes for material recovery – in 2001 the separate waste represented 2% and in 2002 – 7% of the total municipal waste collected.
From the total wastewater treatment sludge, only 3% of the annual quantity is used in agriculture.
There are a number of projects aiming to develop integrated waste management systems in several counties.
4.2 Appropriate organic wastes
The average percentage of biodegradable organic waste from the household waste is 51 % (data from 2002). The biodegradable organic waste increased quantitatively in 2002 as compared with the 1998 data, from 139 to 179 Kg/inh*year.
For restaurants and hotels wastes a tax was introduced (reaches 12EUR/tone and inhabitant -data from 2002), which includes the collection, the transport and the closing of the existing landfill. Wastes from supermarkets are collected separately and most of them are recycled. For other organic wastes, like from food industry, there are no data available.
Agricultural wastes like pig or cow manure, horse dung or grass cut from local authorities, are treated to become fertilizers.
The promotion of new collections systems is already done in pilot projects. This kind of pilot project has been implemented in different counties (eg.Ramnicu Valcea, Bucharest 2005). A national strategy was developed for a proper management of the waste.

4.3 The interest for co-fermentation
For the moment, Avicola Iasi (Razboieni) announced interest in biogas plant development, and also Copora (Bucharest). Both sites are chicken farms.
Municipal sites like landfills. On a landfill site the organic fraction of the waste could be separated and used in a biogas plant. This safes landfill capacity and reduces methane emissions. There are 11 new landfill sites, opened from 1997 to 2003, managed in an environmental manner.
From a total 9578 (thousands tones) an uncollected quantity is representing almost 20% (1946 thousands tones). The total collected (separated and mixed) is representing 7632 thousands tones, the separated collection representing only 492 tones (ICIM data, 2002).
In Romania, according to official data, the average index of municipal waste generation (calculated depending on the inhabitant number from urban and rural areas, respectively of adequate domestic waste generation indexes) had between 1995-2000 a value of 293kg / inhabitant · year, respectively 0.80kg / inhabitant · day (comparing to other EU countries, these values are about 40% smaller).
The percentage of biodegradable matter in the municipal waste decreased from 72% in 1998 to 61% in 2002, but the quantity of biodegradable matter for each inhabitant and year increased in this interval, because the quantity of municipal waste and city sludge also increased (the average of biodegradable waste production during the last 5 years: 243 kg of biodegradable waste/inh.*year).
The dynamics of biodegradable waste generation (Source: ICIM waste database)
0
1000000
2000000
3000000
4000000
5000000
6000000
7000000
1998 1999 2000 2001 2002
tone
s
86%88%90%92%94%96%98%100%102%104%106%108%
Biodegradable (%) Biodegradable matter (tone/year)
stored/generated 1995 bio stored
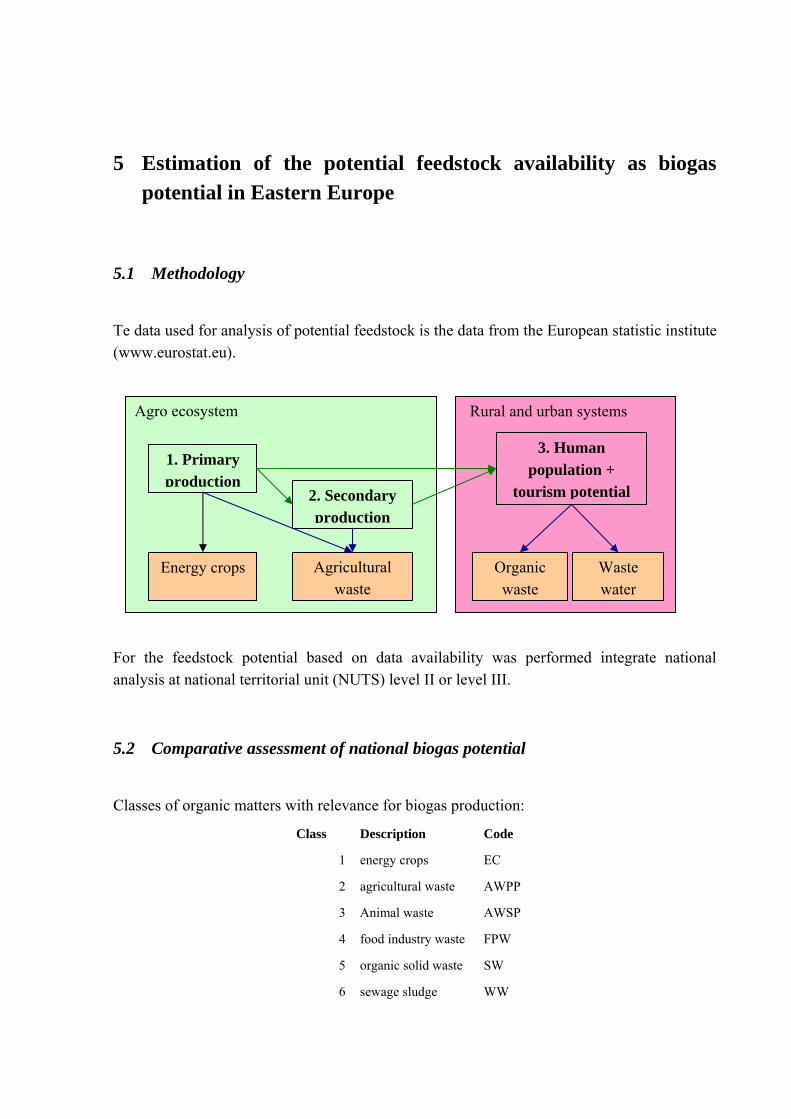
5 Estimation of the potential feedstock availability as biogas potential in Eastern Europe
5.1 Methodology
Te data used for analysis of potential feedstock is the data from the European statistic institute (www.eurostat.eu).
1. Primary production
Agro ecosystem Rural and urban systems
2. Secondary production
Agricultural waste
Organic waste
3. Human population +
tourism potential
Energy crops Waste water
For the feedstock potential based on data availability was performed integrate national analysis at national territorial unit (NUTS) level II or level III.
5.2 Comparative assessment of national biogas potential
Classes of organic matters with relevance for biogas production:
Class Description Code
1 energy crops EC
2 agricultural waste AWPP
3 Animal waste AWSP
4 food industry waste FPW
5 organic solid waste SW
6 sewage sludge WW
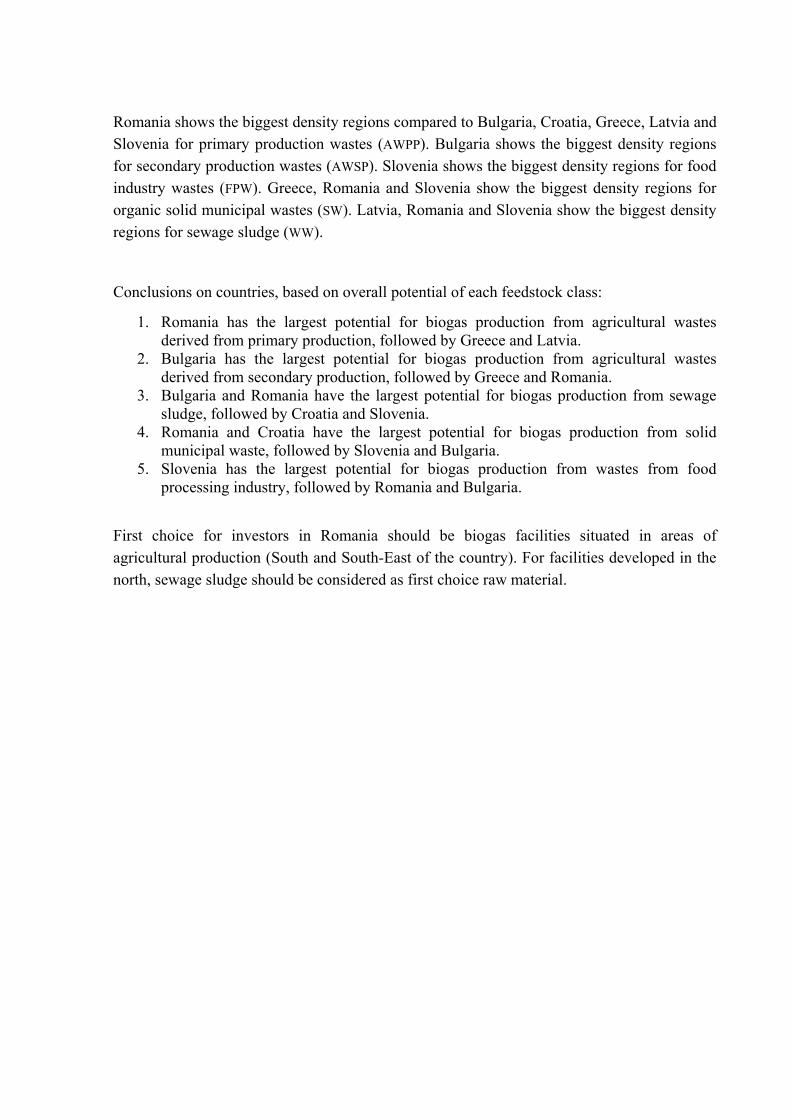
Romania shows the biggest density regions compared to Bulgaria, Croatia, Greece, Latvia and Slovenia for primary production wastes (AWPP). Bulgaria shows the biggest density regions for secondary production wastes (AWSP). Slovenia shows the biggest density regions for food industry wastes (FPW). Greece, Romania and Slovenia show the biggest density regions for organic solid municipal wastes (SW). Latvia, Romania and Slovenia show the biggest density regions for sewage sludge (WW).
Conclusions on countries, based on overall potential of each feedstock class:
1. Romania has the largest potential for biogas production from agricultural wastes derived from primary production, followed by Greece and Latvia.
2. Bulgaria has the largest potential for biogas production from agricultural wastes derived from secondary production, followed by Greece and Romania.
3. Bulgaria and Romania have the largest potential for biogas production from sewage sludge, followed by Croatia and Slovenia.
4. Romania and Croatia have the largest potential for biogas production from solid municipal waste, followed by Slovenia and Bulgaria.
5. Slovenia has the largest potential for biogas production from wastes from food processing industry, followed by Romania and Bulgaria.
First choice for investors in Romania should be biogas facilities situated in areas of agricultural production (South and South-East of the country). For facilities developed in the north, sewage sludge should be considered as first choice raw material.
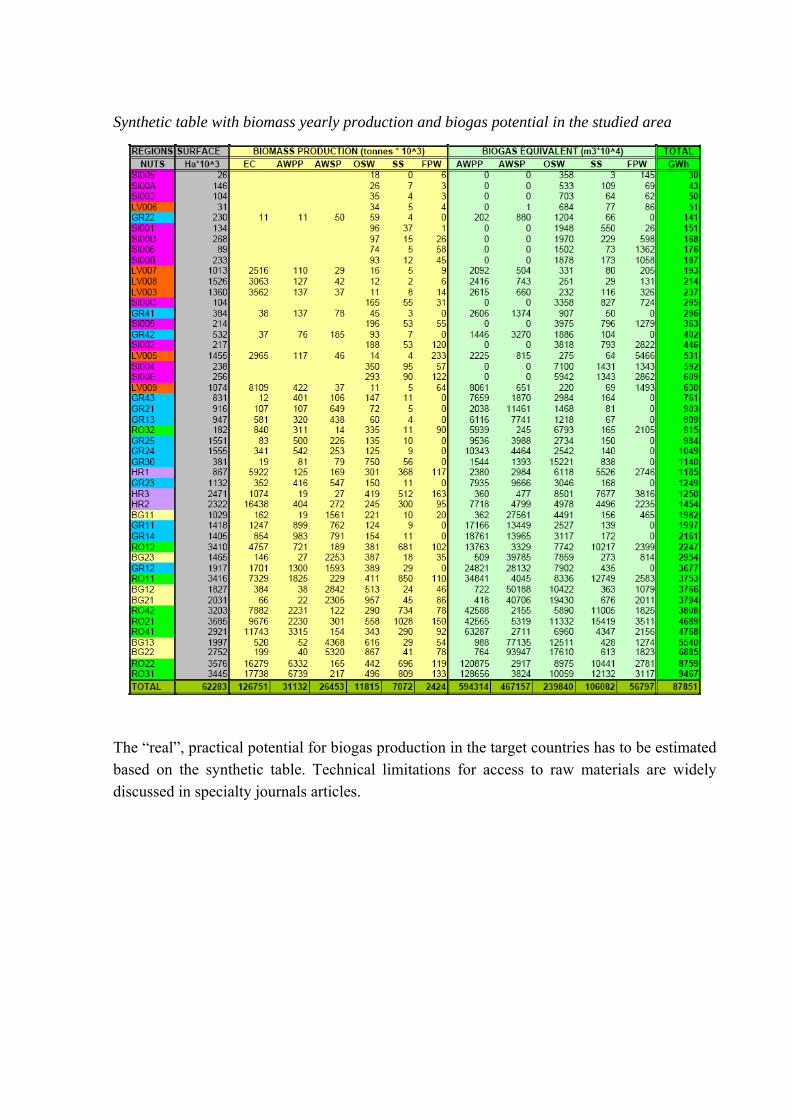
Synthetic table with biomass yearly production and biogas potential in the studied area
The “real”, practical potential for biogas production in the target countries has to be estimated based on the synthetic table. Technical limitations for access to raw materials are widely discussed in specialty journals articles.

6 Assessment of the agricultural structure of eastern European countries
6.1 Total number of holdings
All the target countries (Greece was not included) have still a great fragmentation of the agricultural land and still we could find a lot of farms (agricultural holdings) with smaller farm size.
The fragmentation of the utilised agricultural area in the target European countries (especially in Bulgaria, Latvia, Romania and Slovenia) is obvious when we compare the number of holdings and surface of utilised agricultural area from that region with other like Germany. The farms surfaces are in average over 43 hectares where in the target European countries the farm area is no greater than 7 hectares.
6.2 Total number of holdings with livestock
Once again the number of holdings with livestock is far greater in eastern countries and Romania is a special case. Nevertheless the number of livestock per holding is far less in Easter Europe than for e.g. in Germany.
6.3 Farm types
Greece is different from other countries in the zone as the number of “Specialist permanent crops” is increased compared with farm number for field crops or granivores, as Romania and Bulgaria have. In many of these countries “specialist field crops” are the dominant categories with the exception of Greece where the permanent crops are the dominant class.
6.4 Farms ownership types
Two types of ownerships over the agricultural land are encountered in countries like Slovenia (SI), Latvia (LV) and Bulgaria (BG) – direct ownership and a leased form. In Greece (GR) and Romania (RO) a third ownership form exists represented by association of individual owners with the main aim to increase farm surface and transform the existing farm units in a more efficient structures.

6.5 Comparative analysis of farm size (target countries from Europe)
The target European countries are characterized by a series of structural characteristics and a diversity of organizational structures from farms starting with less then 5 ha up to farms up to 50 ha.
In Romania and Bulgaria the weight of family farms is up to 30 % and in other countries from the Eastern Europe the weight is less but still high by comparison with other EU Member States.
As already discussed the most fragmented agricultural land is to be found in Romania (between 1750 and up to 3870 units less than five hectares) and other countries from the target countries in Europe.
The same is for agricultural holdings with surfaces up to 20 ha that are also characteristic to Romania as well as Bulgaria, Poland and Estonia. This is in fact to say that overall for this area the agricultural farm surface is between 3 and 20 hectares.
In almost all the target countries the farming system is still not strong (well develop efficient structures). In order Latvia and Greece are the countries more organized (with aggregated farms) than the rest of the targeted countries.
From the total countries analyzed only in Bulgaria we could see a concentration of land in holdings with surfaces over 50 hectares at over 80%. In other countries the percentage of farms with surfaces greater than 50 hectares is much lower with Greece that has around 30%, Romania 55%, and Latvia 35%.
6.6 Farm heterogeneity based on the biomass type
6.6.1 Primary production
From the analyzed countries only Greece has a less diverse primary production. Romania, Croatia and Bulgaria are from this point of view more heterogeneous or more fragmented.
6.6.2 Secondary production

Based on the number (and not on production) it could be concluded that in Bulgaria very important role could play the poultry industry (with 23 %) the pig farming (15%) and also the cow and goats farming (with 10 and 15 % respectively). In Greece the poultry could be very important as well as the goat farming (20%). Romania has a great potential of utilizing the pigs farms as well as the poultry farming as sources for biogas production.

7 Natural gas in Romania
7.1 Production and distribution of natural gas
The total gas consumption in Romania was about 17 billions cubic meters in 2006 and only 30 % have been imported the rest was based on internal production.
From the total consumption 20% is utilized as raw material and 80% as fuel. It has to be noted that the import of natural gas (especially from Russian Federation) started in 1979 with almost 2 % from the total consumption increasing up to 29 % in 1996 and more than 32% in 2003. The prognosis for the 2025 is that 77 % will be imported.
Romania will be more and more dependent on the import of natural gas. One strategic objective for the sustainable development and a constant concern of the Ministry of Economy and Trade is the promotion of a more divers import sources of natural gas. This objective is also a pillar in the sustainable development strategy for Romania till 2025.
In 2000 Romania reorganized the stat owed company Romgaz into several smaller companies: Exprogaz and Depogaz with activities in the extraction and respectively in the gas storage, Transgaz with activities in the transport of natural gas on the national territory and Distrigaz Nord and South with distribution to the industrial and household consumers. Later in 2001 Exprogaz and Depogaz merged into Romgaz.
In the production sector the Romgaz is dominating with almost 51,99% followed by Petrom with 46,17 % , Amromco with 1,5 % and Wintershall Mediaş with 0,12 %. (ANRGN report, 2006).
Imports are mainly directed towards Distrigaz Sud (30,59%) and Nord (26,76%). All the imports in Romania are from the Gazprom – Russian Federation.
Romania has also increased the total storage capacity of over 3 billions cubic meters in 8 storage facilities from only 1,3 billions cubic meters in the year 2000.
On short term the import sources are mainly based on the Russian Federation but there are also plans to interconnect the Romanian gas grid with the Hungarian through pipes between Arad and Szeged. With Ucraina linking Cernauti with Siret as a second step. In the same time Romania has as a priority to open a new transport network between Caspian Sea and Meddle East – the Nabucco project.
7.2 Characteristics of the natural gas grid
7.2.1 Gas network
National distribution network has a coverage of about 60 % from the total 3140 localities only 1822 having natural gas distribution systems in place at the end of 2006. The network increased during 2000-2006 with more than 665 localities (more than 4400 km) due to investment effort in this area of about 646 million euro (ANRGN). The natural gas transmission system comprise mainly through Distrigaz North and South 13.830 km of pipelines from the total pipeline length. The total length of the pipelines (without the transportation highways) in Romania is approximated at 28960 km (INSS, 2006).
Natural gas consumption decreased over years from a peak in 1990, up to the values from 2000 (the lowest value 9193681 thousands cubic meters). The gas volume increased with a low tendency up to 2005.
7.2.2 Pressure stage classification
Transportation of gas in Romania is done on the so called transportation highways (pressure over 6 bar) and distribution (middle pressure 6-2 bar and intermediary pressure 2-1 bar and low pressure under 0.05 bar).
7.2.3 Biogas characteristics
No biogas characteristics are required in order to distribute the biogas to the network. This is because there are no technical criteria for biomathane injection to the grid. In the same time we can assume that biogas, in order to be distributed should have the same characteristics as the natural gas. The quality of the natural gas is mentioned in the “technical code for natural gas” and in the SR ISO 13686 quality of natural gas. We can speculate that in order to have access to the natural gas grid the biomethane has to fully comply with the standards of the natural gas.
7.2.4 Gas composition requirements for grid injection
This is reglemented by the “Natural Gas Law”, Law 288/2005 and for the standard by National Regulatory Body for Natural Gases, through “Technical code for the natural gas sector”.
Herein it is stipulated that the minimal technical requirments for grid injection are setted by the national standard SR ISO 13686, pct. 3.6.

8 Overall positive and negative impacts of biogas production and use
Implementation of biogas plants can have a positive impact to environment, reducing GHG emissions, soil and water pollution, and to social-economic development, substituting conventional fuels and providing new sources of energy and income for local population.
8.1 Impacts in Bulgaria
8.1.1 Environmental impacts
Air
In the years 2004–2006, emissions of methane and ammonia from agriculture in Bulgaria increased primarily because of the increasing number of breeding cattle. According to Executive Environment Agency (MOEW) in 2005 and 2006 the share of emissions of methane, emitted by the agricultural sector occupies 18 %.
Total gas emissions in Bulgaria was in 2004 - 70548.4Gg CO2-eq, 2005 - 71455 Gg CO2-eq, 2006 - 71343.6 Gg CO2-eq (source National inventory report, 2008, MOEW)
Water
Unfortunately, Bulgaria is one of the poorest countries in water resources in Europe. The annual average amount of water per resident is around 2,300 – 2,400 m3 and the usable part of it ranges from 800 to 1,000 m3 per resident. Precipitation amount during the warm season (April-September) is less than 300 mm, which is extremely insufficient and could hamper agricultural production in the country.
In municipal wastewater treatment plants (MWWTP) the sewage water of 47 towns and 35.3 % of the country's population is treated. The total amount of non-hazardous sludge generated from MWWTP in 2006 was 147,683 t including 29,987 t dry matter. From the total amount of 147,683 t sludge in 2006, 65,183 t (44 %) were deposited, 60,542 t (41 %) were recovered and 21,956 t (15 %) are temporarily stored. From 41 % recovered sludge, 34 % were used on agricultural land and 7 % were used on disturbed areas (Executive Environment Agency, MOEW).
Soil

Agriculture is the main source of the soil degradation processes in the country. Soil erosion is caused by applying inappropriate cultivation techniques and agricultural practices. The total erosion area in Bulgaria was estimated at 2,010,223 ha for 2006.
Landscape
The forestry sector in Bulgaria is closely related to the agricultural sector. Forestland in Bulgaria covers 3.91 million ha, which represents 34 % of the national territory. In the past 6-8 years, dramatic decline (more than 5 %) in the areas covered by forests is observed in Bulgaria.
Land use
The area with agricultural uses (AAU) in Bulgaria was 5,666,336 ha and occupied 51.1 % of the national territory, and the utilized agricultural area (UAA) is 5,116,220 ha, or 46.3 % of the territory in 2007.
From the analysis can be concluded that Bulgaria has sufficient agricultural and forest area, which is a prerequisite for the development of livestock and crop industry, if land is treated adequate. Climatic conditions of the country are favourable for the development of agriculture.
8.1.2 Social & economic impacts
Rural development
In 2006 an economic growth of 6.3 % of Gross Domestic Product (GDP) was achieved. Negative growth was observed in crop production due to poor harvest of cereals and vegetable, and in livestock-breading.
Substitution of fossil energy for renewable energy
Bulgaria has a diverse energy mix with an average dependency on imported fuels. In 2004, the most important energy sources were solid fuels (36 %), crude oil (22 %) and nuclear energy (22 %), followed by natural gas (13 %). The share of renewables is 5 % of total primary energy supply (TPES).
The Bulgarian energy import dependency is slightly below the EU-27 average. Oil accounts for 45 % of imported energy, whereas gas accounts for 25 %. The Russian Federation is the main oil supplier for Bulgaria and the only supplier for natural gas. The remaining 30 % of total imports are solid fuels. Imported energy has declined by 49 % in the period 1990-2004, mainly due to reduced energy consumption (MEE).
8.2 Impacts in Croatia
8.2.1 Environmental impacts
Air
Total CO2 emissions are little above 24 million tons in Croatia for 2007, out of which little more than 85 % is energy related (57 % stationary energy sources and 28 % mobile energy sources). In 2006, total GHG emissions for Croatia were approximately 30.8 million tons of CO2eq.
In comparison to the electricity output from coal, oil and natural gas, biogas energy (assuming 31 % technology net efficiency, it is possible to generate 60 to 180 GWh of electricity) will lead to a decrease of 10,000 tons of CO2eq/year order of magnitude, depending on the energy source.
Soil
Total consumption of mineral fertilisers in 2006 amounted 365,000 tons which represents steady decrease from 2001 when utilisation of mineral fertilisers peaked with 435,000 t. Legal entities in agriculture (commercial agro-businesses) utilised 31 % of the total quantity or 115,000 t out of which 49,000 t of nitrogen 4,000 t of phosphorous and 10 t of potassium. The same group of consumers utilised active substances in total of 50,000 tons, out of which N 21,000 t, P2O5 12 000 t and K2O 17,000 t in 2006.
8.2.2 Social & economic impacts
Despite its modest contribution as RES at the national level, biogas could represent the first best options for those regions rich in agriculture feedstock.
8.3 Impacts in Greece
8.3.1 Environmental impacts
Air
GHG emissions from Agriculture decreased by 13.86 % between 1990 and 2006, with an average annual rate of decrease of 0.86 %.
The revised Greek National Programme for Climate Change, estimates realistic CO2 savings of 4.5 Mt CO2-eq from the increased use of Renewable. Among others it is estimated that Anaerobic Digestion of pig manure (35 % of the total breeding animals in 2010 and 50 % of the total breeding animals in 2015 respectively) can reduce greenhouse gas emissions by 60,000 t CO2-eq in 2010 and 83,000 t CO2-eq in 2015.
Assuming a total installed capacity of 350 MW produced in biogas plants (replacing other fuels energy), and a mean annual electricity production equal to 1,121,389 ΜWhe/y. This means an indirect yearly CO2 reduction by 729 kt.
Soil and water
Generally in Greece, the Anaerobic Digestion technology is used mainly as a waste treatment method but not accompanied with biogas and energy production (at least not in a wide extent at the moment).
Landscape and land use
Proposals to use the surplus agricultural land for energy crops have open a big discussion, among others, about the negative effects on the agricultural landscape of Greece. Till today it is seemed a more lasting solution the biogas exploitation from manure, residues and waste, sludge and agro-industrial residues and unsuitable plants for other purposes.
8.3.2 Social & economic impacts
With over 56 % of the population in the 27 Member States of the European Union (EU) living in rural areas, which cover 91 % of the territory, rural development is a vitally important policy area.
The new law for RES (law 3468/2006) is dedicated to the promotion of RES and set a tariff of 73 €/MWh (75.82 €/MWh for the year 2007) for biogas plants.
A biogas plant must be adapted to the particular regions and must be accepted from neighbours and the general public.
8.4 Impacts in Latvia
8.4.1 Environmental impacts
Air
In 2006 energy sector has more than 73.5 % share of the total GHG emissions, following the agriculture sector with approximately 17 % of Latvia’s total GHG emissions. Between 1990 and 2000 GHG emissions decreased significantly. The reason for that was crisis in Latvian national economy in the beginning of 1990-ties. In 2006, Latvia’s total GHG emissions showed a decrease of 56 % from the base (1990). However, compared to the total GHG emissions in 2005, emissions have risen by about 4.5 % in 2006.
Soil and water

Results of run-off monitoring implemented in Latvia in 2005 indicated that in several sites nitrate concentrations where higher than the limiting values of EU Nitrate Directive. According to the run-off monitoring results, the highest leaching and run-off losses were observed in areas characterized by high animal density and intensive application of the manure.
Land use
After 1990 there was a rapid decline in agriculture in Latvia resulting to a lot of unused agricultural areas. Almost 40 % of available agricultural land in Latvia is still not used for agricultural production. Biogas production could contribute to more intense use of available agricultural land.
8.4.2 Social & economic impacts
Rural development
Concerning the level of development, there is a big difference among urban and rural territories of Latvia. In case of Latvia when a lot of agricultural land is unused each activity that promotes the use of agricultural land including biogas production will give a positive impact on income of farmers and overall rural development.
Substitute for fossil energy and energy imports
Latvia has a relatively high dependency on fossil fuels end imported energy. According to the National Energy Development Plan for 2007-2016, only 36 % of energy consumption is covered by locally available energy resources. About 29 % of primary energy resources are covered by natural gas that is imported from one supplier – from Russia, ~30 % are imported oil products from CIS and other countries, coal and imported electricity are counting for the rest of ~5 %.
8.5 Impacts in Romania
8.5.1 Environmental impacts
Air
The Kyoto Protocol was signed by Romania in 1999 and ratified in 2001. After 1989 a net decrease of GHG was observed. Anyhow, growing economy and increased development of industrial sectors raised the net amounts in the last 8 years. Tendency is linked with the economic development and it will increase on a yearly base. New means of keeping the GHG emissions within limits must be developed.

Soil and water
One important problem that could be alleviated by the biogas sector is waste management. A large majority of the urban residues is stored in waste dumps. Solid residues from water sewage sludge treatment are seldom also stored in waste dumps.
Land use
The share of biomass in the total energy production of the country is almost 10 %. Currently, biomass is used only for heating purposes, direct burning for cooking and hot water preparation consuming the largest share. About 95 % of the biomass currently used is firewood and agricultural waste, the rest is wood waste from industrial processes.
8.5.2 Social & economic impacts
Substitute for fossil energy and energy imports
Dependency on fossil energy reserves was highly discussed matter. Romania itself depends only in a proportion of 20-30 % of total natural gas consumes on Russian gas. Romania exploits own reserves and those counts for 70-80 % of total consume. A highly developed hydropower infrastructure is supplementing power need, along with a nuclear power station counting for 10 % of the total electricity consume of the country.
Anyhow, there is a clear legislative frame, aiming to increase the quota of alternative energy to 20 % from the total need till 2030. Biogas could be one of the possible ways to reach this target.
8.6 Impacts in Slovenia
8.6.1 Environmental impacts
Air
The total emissions of GHG in 2007, sinks not considered, amounted to 20,709.94 kt CO2 eq., which represents a 1.8 % increase of emissions compared to 1986 base year. In the period 1986-91, a reduction of emissions was recorded due to the economic conditions at that time. In the period 1992-97, a strong increase of emissions was recorded, which was a consequence of increasing economic growth and revival of industrial production. In the second half of that period, the increased emissions were a consequence of “gasoline tourism” (25 % of the total sale of motor fuels in the Republic of Slovenia), since the prices of motor fuels in Slovenia were appreciably lower than in the neighbouring countries.
Soil and water
In comparison with other countries, water quality in Slovenia is among the highest in Europe. One of the reasons is undoubtedly that most of the rivers rise on the territory of Slovenia. But this does not mean that Slovenia has no problems with surface water and groundwater quality.
In Slovenia, alluvial aquifers present 60 % of the drinking water sources, and karst-fractured aquifers present 40 %. Due to populated areas and intensive agricultural production, alluvial aquifers are exposed to greater risks of pollution with nitrates. Monitoring showed that most aquifers where limit values are exceeded are located in lowlands with intensive agriculture. The percentage of rivers and streams in Class IV “very polluted” is in the last years stable (5 %).
Organic matter in soil is an important indicator of the quality of soil. In general, soil in Slovenia is well supplied with organic matter; this is evident from soil map data, which indicate that 86.2 % of agricultural land contains more than 2 % of organic matter and 30.9 % of land, contains more than 4 %.
This relatively good condition of soil is due to the fact that grassland is the prevailing element in the composition of agricultural land and that arable land and permanent crops are relatively abundantly fertilized with livestock manure.
Landscape and land use
During the period 1995-2000, the ratio between forest areas, on the one hand, and agricultural and artificial surfaces land, on the other, was maintained at 1:1.64 in favour of the former.
8.6.2 Social & economic impacts
On the short-term, biomass is the most promising renewable energy resource in Slovenia both in terms of abundance and economic feasibility. This is true especially for woody biomass, however in lesser extent also for biogas production.
Substitute for fossil energy and energy imports
Slovenia has very limited energy resources of its own. The main sources for electrical energy production in Slovenia are fossil fuels and nuclear power, while renewable energy sources (excluding big hydro power plants) represent a very small part.
Thus, the production of biogas as renewable energy source in Slovenia could be a small but nevertheless important step in reducing dependency of the fossil energy imports, enhancing local economy and reducing GHG emissions.


![D2.2: CERBERO Technical Require- ments (Final version) · (Final version) Lead Beneficiary: IBM Workpackage: WP2 Date: Distribution - Confidentiality: [Public] Abstract: This document](https://img.pdfslide.us/doc/110x75/5f3b3d67884c1230ae7bea9d/d22-cerbero-technical-require-ments-final-version-final-version-lead-beneficiary.jpg)