Embed Size (px)
Citation preview
BPfA+20 Annexes
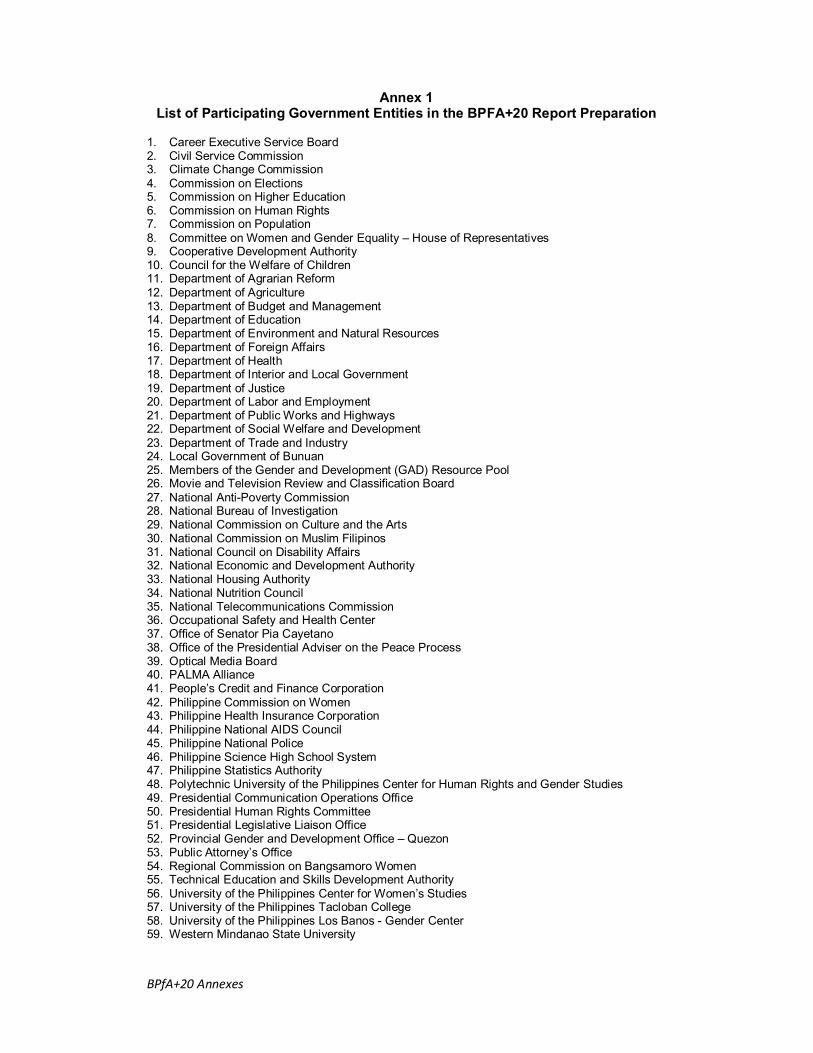
Annex 1 List of Participating Government Entities in the BPFA+20 Report Preparation
1. Career Executive Service Board 2. Civil Service Commission 3. Climate Change Commission 4. Commission on Elections 5. Commission on Higher Education 6. Commission on Human Rights 7. Commission on Population 8. Committee on Women and Gender Equality – House of Representatives 9. Cooperative Development Authority 10. Council for the Welfare of Children 11. Department of Agrarian Reform 12. Department of Agriculture 13. Department of Budget and Management 14. Department of Education 15. Department of Environment and Natural Resources 16. Department of Foreign Affairs 17. Department of Health 18. Department of Interior and Local Government 19. Department of Justice 20. Department of Labor and Employment 21. Department of Public Works and Highways 22. Department of Social Welfare and Development 23. Department of Trade and Industry 24. Local Government of Bunuan 25. Members of the Gender and Development (GAD) Resource Pool 26. Movie and Television Review and Classification Board 27. National Anti-Poverty Commission 28. National Bureau of Investigation 29. National Commission on Culture and the Arts 30. National Commission on Muslim Filipinos 31. National Council on Disability Affairs 32. National Economic and Development Authority 33. National Housing Authority 34. National Nutrition Council 35. National Telecommunications Commission 36. Occupational Safety and Health Center 37. Office of Senator Pia Cayetano 38. Office of the Presidential Adviser on the Peace Process 39. Optical Media Board 40. PALMA Alliance 41. People’s Credit and Finance Corporation 42. Philippine Commission on Women 43. Philippine Health Insurance Corporation 44. Philippine National AIDS Council 45. Philippine National Police 46. Philippine Science High School System 47. Philippine Statistics Authority 48. Polytechnic University of the Philippines Center for Human Rights and Gender Studies 49. Presidential Communication Operations Office 50. Presidential Human Rights Committee 51. Presidential Legislative Liaison Office 52. Provincial Gender and Development Office – Quezon 53. Public Attorney’s Office 54. Regional Commission on Bangsamoro Women 55. Technical Education and Skills Development Authority 56. University of the Philippines Center for Women’s Studies 57. University of the Philippines Tacloban College 58. University of the Philippines Los Banos - Gender Center 59. Western Mindanao State University
BPfA+20 Annexes
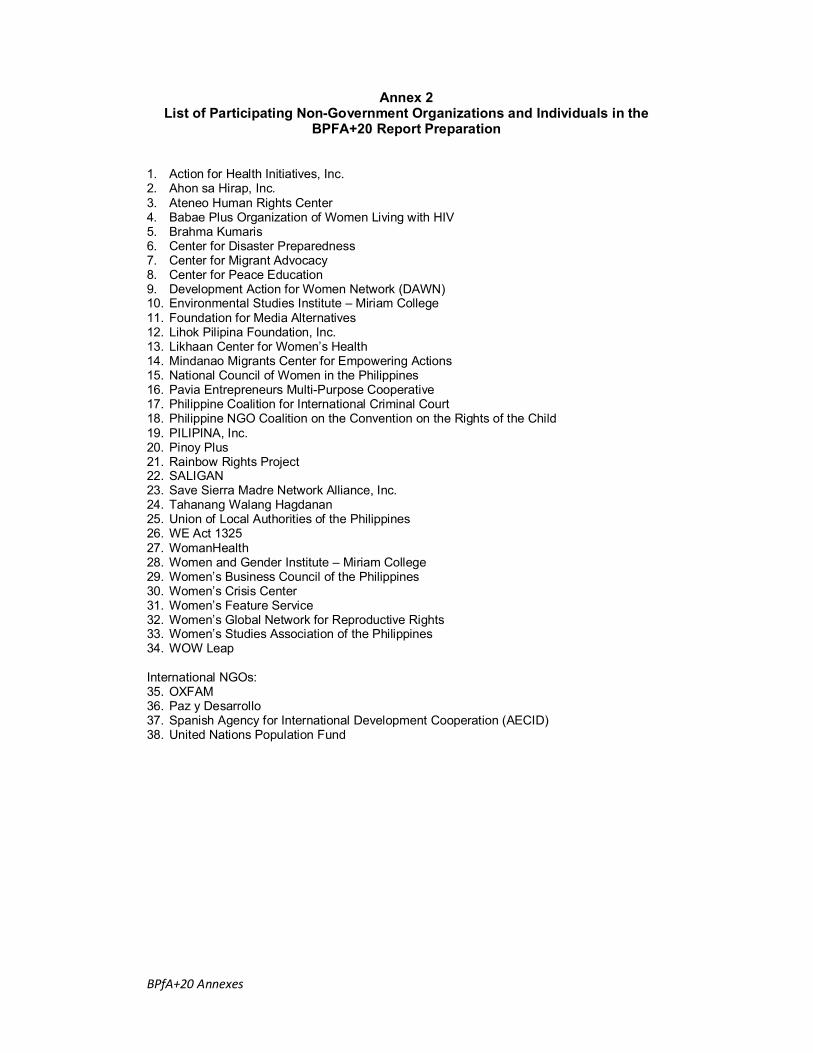
Annex 2 List of Participating Non-Government Organizations and Individuals in the
BPFA+20 Report Preparation
1. Action for Health Initiatives, Inc. 2. Ahon sa Hirap, Inc. 3. Ateneo Human Rights Center 4. Babae Plus Organization of Women Living with HIV 5. Brahma Kumaris 6. Center for Disaster Preparedness 7. Center for Migrant Advocacy 8. Center for Peace Education 9. Development Action for Women Network (DAWN) 10. Environmental Studies Institute – Miriam College 11. Foundation for Media Alternatives 12. Lihok Pilipina Foundation, Inc. 13. Likhaan Center for Women’s Health 14. Mindanao Migrants Center for Empowering Actions 15. National Council of Women in the Philippines 16. Pavia Entrepreneurs Multi-Purpose Cooperative 17. Philippine Coalition for International Criminal Court 18. Philippine NGO Coalition on the Convention on the Rights of the Child 19. PILIPINA, Inc. 20. Pinoy Plus 21. Rainbow Rights Project 22. SALIGAN 23. Save Sierra Madre Network Alliance, Inc. 24. Tahanang Walang Hagdanan 25. Union of Local Authorities of the Philippines 26. WE Act 1325 27. WomanHealth 28. Women and Gender Institute – Miriam College 29. Women’s Business Council of the Philippines 30. Women’s Crisis Center 31. Women’s Feature Service 32. Women’s Global Network for Reproductive Rights 33. Women’s Studies Association of the Philippines 34. WOW Leap International NGOs: 35. OXFAM 36. Paz y Desarrollo 37. Spanish Agency for International Development Cooperation (AECID) 38. United Nations Population Fund
BPfA+20 Annexes
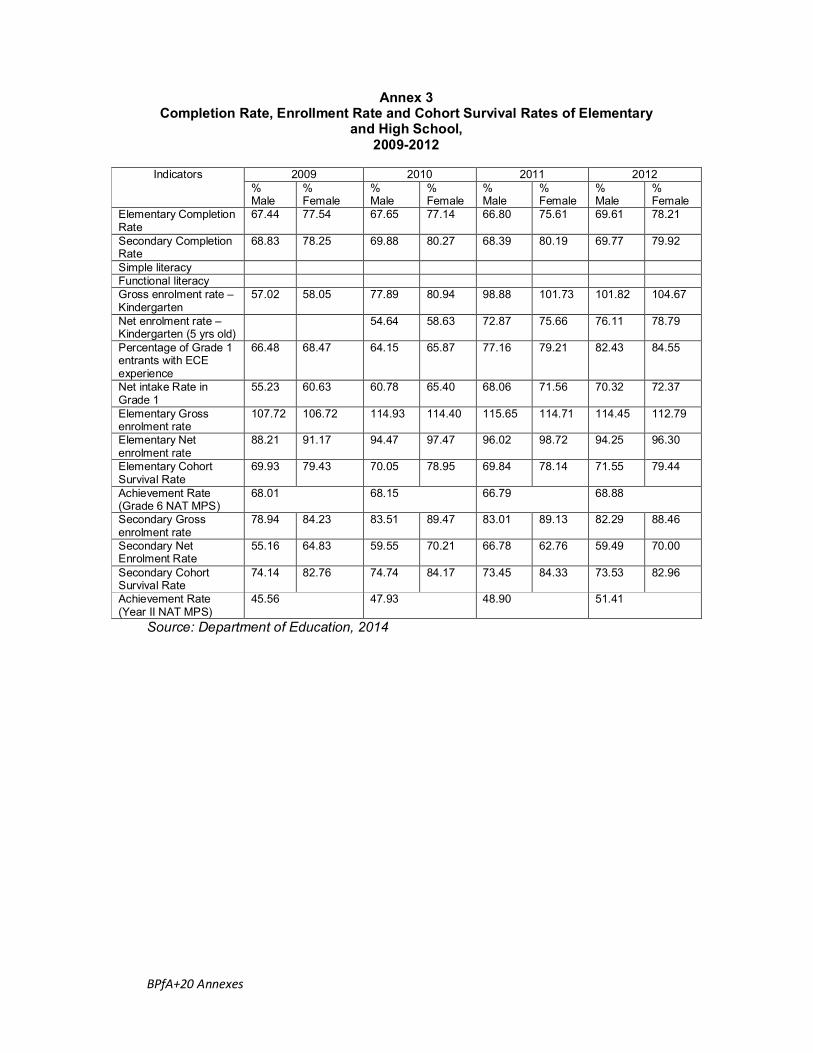
Annex 3 Completion Rate, Enrollment Rate and Cohort Survival Rates of Elementary
and High School, 2009-2012
2009 2010 2011 2012 Indicators
% Male
% Female
% Male
% Female
% Male
% Female
% Male
% Female
Elementary Completion Rate
67.44 77.54 67.65 77.14 66.80 75.61 69.61 78.21
Secondary Completion Rate
68.83 78.25 69.88 80.27 68.39 80.19 69.77 79.92
Simple literacy Functional literacy Gross enrolment rate – Kindergarten
57.02 58.05 77.89 80.94 98.88 101.73 101.82 104.67
Net enrolment rate –Kindergarten (5 yrs old)
54.64 58.63 72.87 75.66 76.11 78.79
Percentage of Grade 1 entrants with ECE experience
66.48 68.47 64.15 65.87 77.16 79.21 82.43 84.55
Net intake Rate in Grade 1
55.23 60.63 60.78 65.40 68.06 71.56 70.32 72.37
Elementary Gross enrolment rate
107.72 106.72 114.93 114.40 115.65 114.71 114.45 112.79
Elementary Net enrolment rate
88.21 91.17 94.47 97.47 96.02 98.72 94.25 96.30
Elementary Cohort Survival Rate
69.93 79.43 70.05 78.95 69.84 78.14 71.55 79.44
Achievement Rate (Grade 6 NAT MPS)
68.01 68.15 66.79 68.88
Secondary Gross enrolment rate
78.94 84.23 83.51 89.47 83.01 89.13 82.29 88.46
Secondary Net Enrolment Rate
55.16 64.83 59.55 70.21 66.78 62.76 59.49 70.00
Secondary Cohort Survival Rate
74.14 82.76 74.74 84.17 73.45 84.33 73.53 82.96
Achievement Rate (Year II NAT MPS)
45.56 47.93 48.90 51.41
Source: Department of Education, 2014
BPfA+20 Annexes
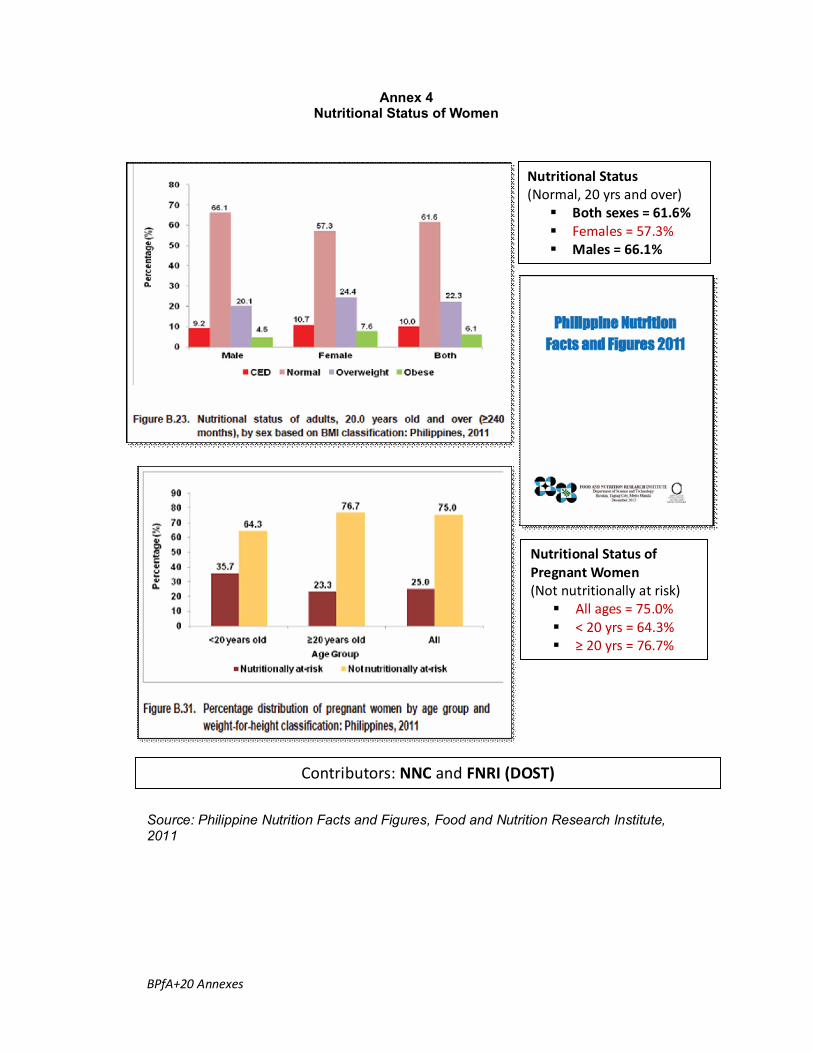
Annex 4 Nutritional Status of Women
Source: Philippine Nutrition Facts and Figures, Food and Nutrition Research Institute, 2011
Nutritional Status (Normal, 20 yrs and over) Both sexes = 61.6% Females = 57.3% Males = 66.1%
Nutritional Status of Pregnant Women (Not nutritionally at risk) All ages = 75.0% < 20 yrs = 64.3% ≥ 20 yrs = 76.7%
Contributors: NNC and FNRI (DOST)
BPfA+20 Annexes
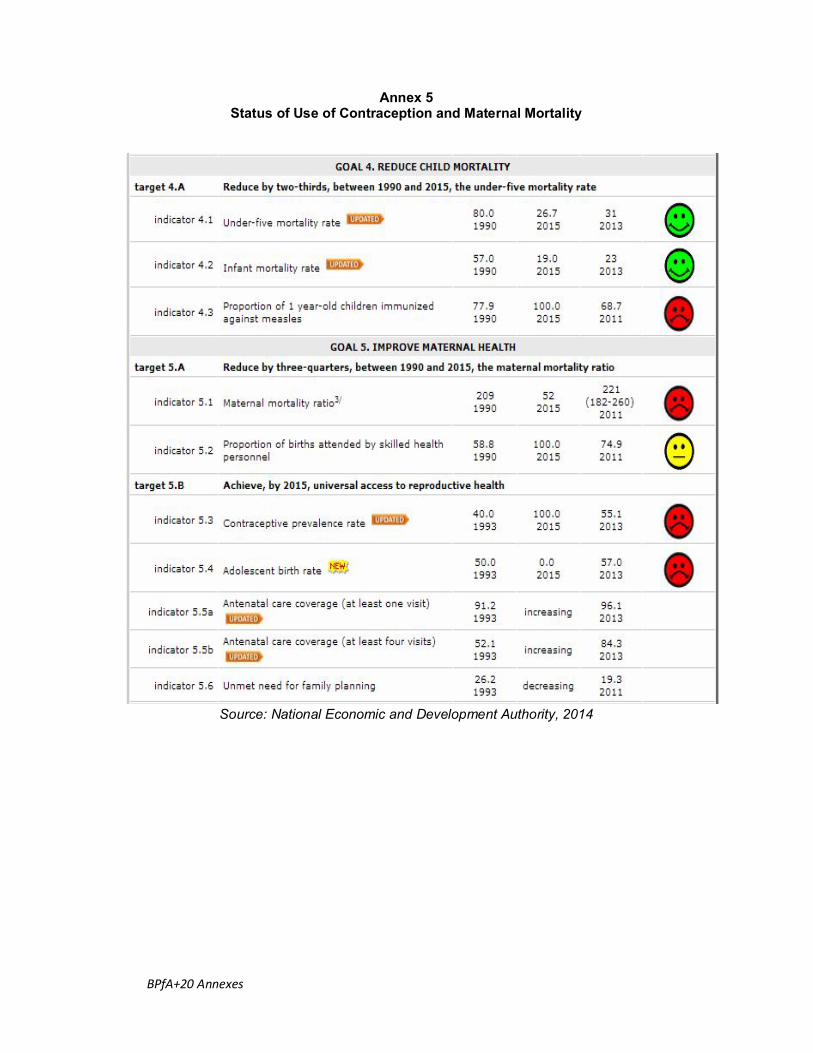
Annex 5 Status of Use of Contraception and Maternal Mortality
Source: National Economic and Development Authority, 2014
BPfA+20 Annexes
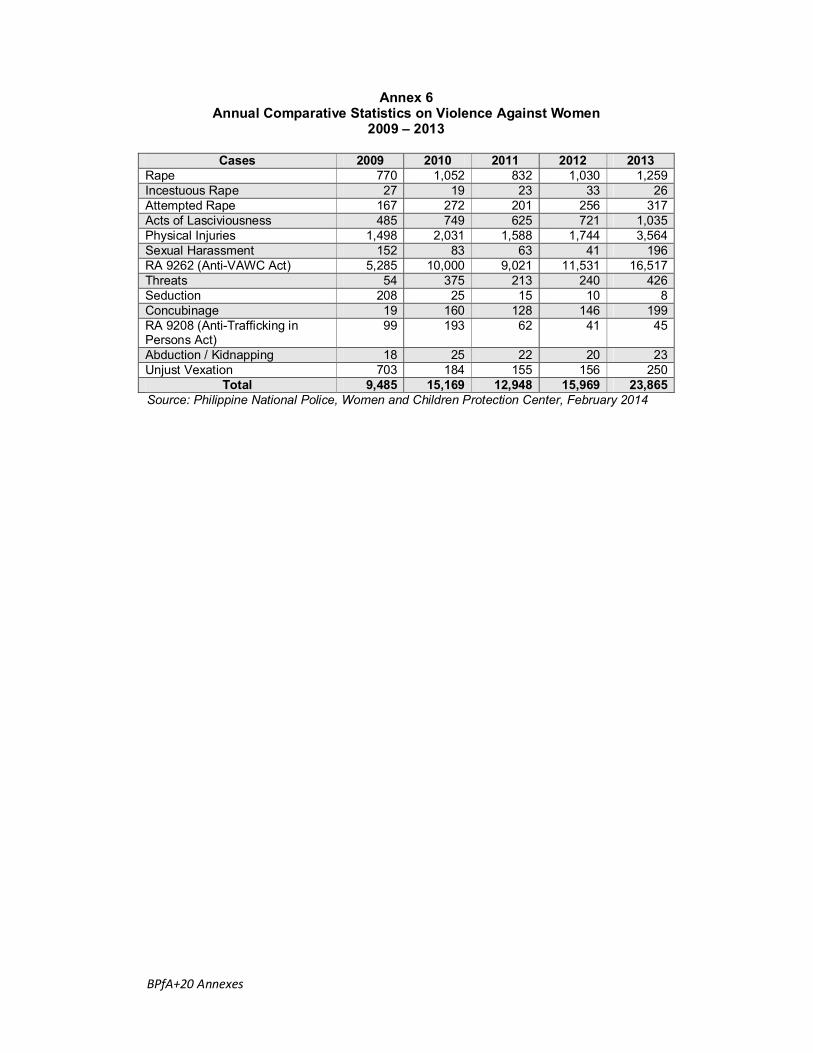
Annex 6 Annual Comparative Statistics on Violence Against Women
2009 – 2013
Cases 2009 2010 2011 2012 2013 Rape 770 1,052 832 1,030 1,259 Incestuous Rape 27 19 23 33 26 Attempted Rape 167 272 201 256 317 Acts of Lasciviousness 485 749 625 721 1,035 Physical Injuries 1,498 2,031 1,588 1,744 3,564 Sexual Harassment 152 83 63 41 196 RA 9262 (Anti-VAWC Act) 5,285 10,000 9,021 11,531 16,517 Threats 54 375 213 240 426 Seduction 208 25 15 10 8 Concubinage 19 160 128 146 199 RA 9208 (Anti-Trafficking in Persons Act)
99 193 62 41 45
Abduction / Kidnapping 18 25 22 20 23 Unjust Vexation 703 184 155 156 250
Total 9,485 15,169 12,948 15,969 23,865 Source: Philippine National Police, Women and Children Protection Center, February 2014
BPfA+20 Annexes
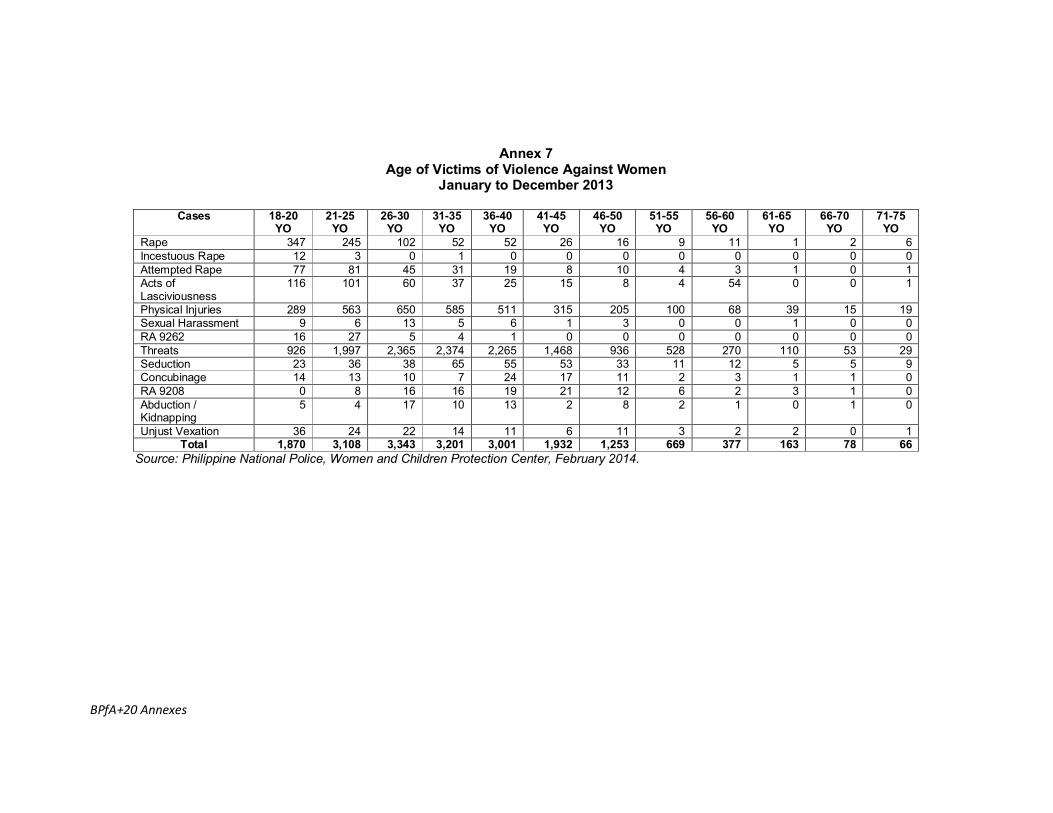
Annex 7 Age of Victims of Violence Against Women
January to December 2013
Cases 18-20 YO
21-25 YO
26-30 YO
31-35 YO
36-40 YO
41-45 YO
46-50 YO
51-55 YO
56-60 YO
61-65 YO
66-70 YO
71-75 YO
Rape 347 245 102 52 52 26 16 9 11 1 2 6 Incestuous Rape 12 3 0 1 0 0 0 0 0 0 0 0 Attempted Rape 77 81 45 31 19 8 10 4 3 1 0 1 Acts of Lasciviousness
116 101 60 37 25 15 8 4 54 0 0 1
Physical Injuries 289 563 650 585 511 315 205 100 68 39 15 19 Sexual Harassment 9 6 13 5 6 1 3 0 0 1 0 0 RA 9262 16 27 5 4 1 0 0 0 0 0 0 0 Threats 926 1,997 2,365 2,374 2,265 1,468 936 528 270 110 53 29 Seduction 23 36 38 65 55 53 33 11 12 5 5 9 Concubinage 14 13 10 7 24 17 11 2 3 1 1 0 RA 9208 0 8 16 16 19 21 12 6 2 3 1 0 Abduction / Kidnapping
5 4 17 10 13 2 8 2 1 0 1 0
Unjust Vexation 36 24 22 14 11 6 11 3 2 2 0 1 Total 1,870 3,108 3,343 3,201 3,001 1,932 1,253 669 377 163 78 66
Source: Philippine National Police, Women and Children Protection Center, February 2014.
BPfA+20 Annexes
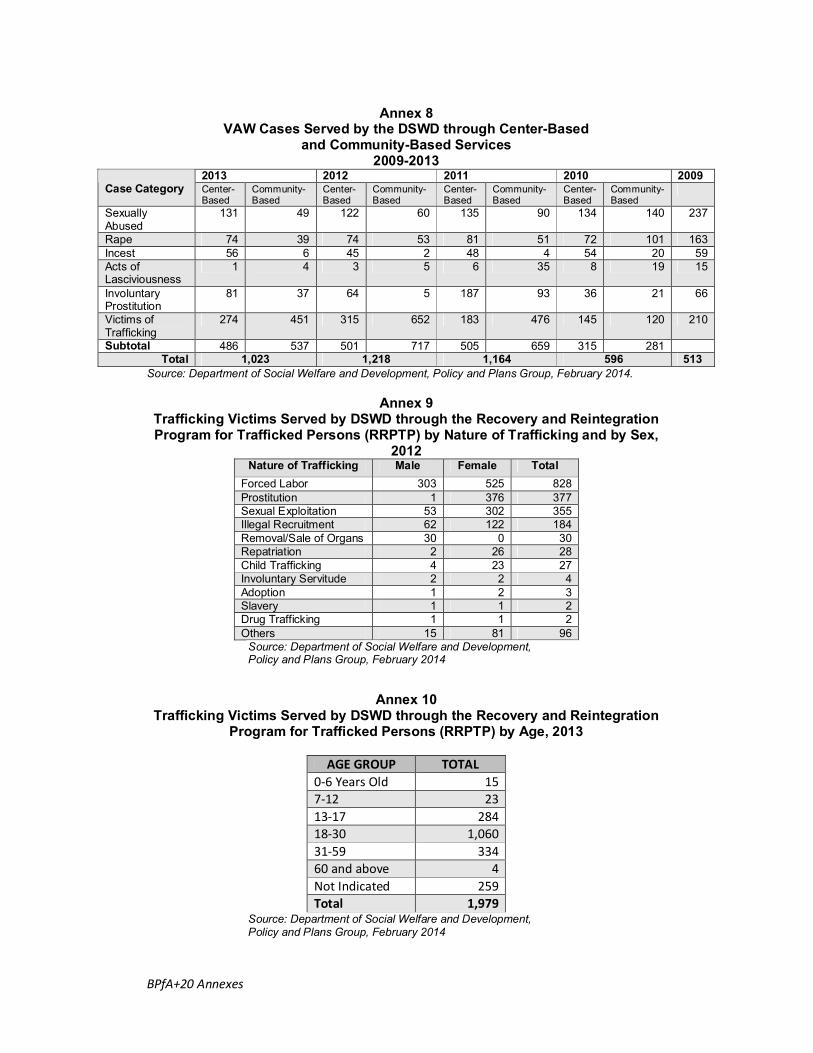
Annex 8
VAW Cases Served by the DSWD through Center-Based and Community-Based Services
2009-2013 2013 2012 2011 2010 2009
Case Category Center-Based
Community-Based
Center-Based
Community-Based
Center-Based
Community-Based
Center-Based
Community-Based
Sexually Abused
131 49 122 60 135 90 134 140 237
Rape 74 39 74 53 81 51 72 101 163 Incest 56 6 45 2 48 4 54 20 59 Acts of Lasciviousness
1 4 3 5 6 35 8 19 15
Involuntary Prostitution
81 37 64 5 187 93 36 21 66
Victims of Trafficking
274 451 315 652 183 476 145 120 210
Subtotal 486 537 501 717 505 659 315 281 Total 1,023 1,218 1,164 596 513
Source: Department of Social Welfare and Development, Policy and Plans Group, February 2014.
Annex 9 Trafficking Victims Served by DSWD through the Recovery and Reintegration Program for Trafficked Persons (RRPTP) by Nature of Trafficking and by Sex,
2012 Nature of Trafficking Male Female Total
Forced Labor 303 525 828 Prostitution 1 376 377 Sexual Exploitation 53 302 355 Illegal Recruitment 62 122 184 Removal/Sale of Organs 30 0 30 Repatriation 2 26 28 Child Trafficking 4 23 27 Involuntary Servitude 2 2 4 Adoption 1 2 3 Slavery 1 1 2 Drug Trafficking 1 1 2 Others 15 81 96
Source: Department of Social Welfare and Development, Policy and Plans Group, February 2014
Annex 10 Trafficking Victims Served by DSWD through the Recovery and Reintegration
Program for Trafficked Persons (RRPTP) by Age, 2013
AGE GROUP TOTAL 0-6 Years Old 15 7-12 23 13-17 284 18-30 1,060 31-59 334 60 and above 4 Not Indicated 259 Total 1,979
Source: Department of Social Welfare and Development, Policy and Plans Group, February 2014
BPfA+20 Annexes
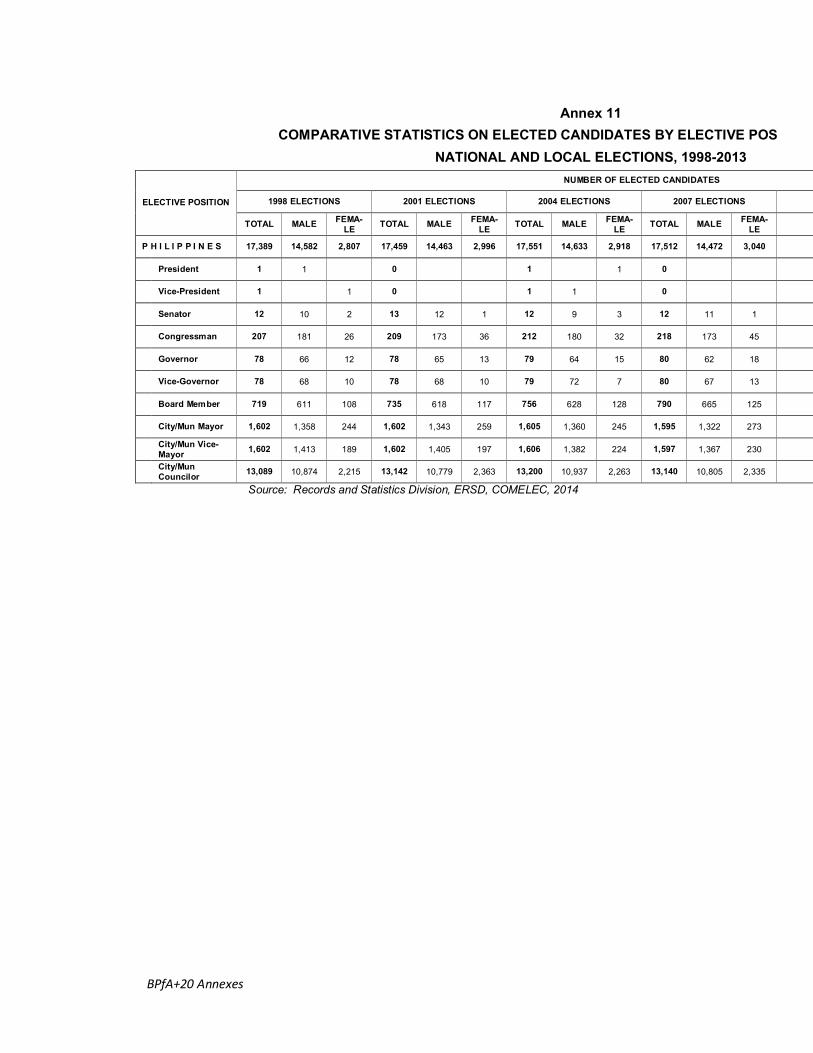
Annex 11
COMPARATIVE STATISTICS ON ELECTED CANDIDATES BY ELECTIVE POSITION, BY GENDERNATIONAL AND LOCAL ELECTIONS, 1998-2013
NUMBER OF ELECTED CANDIDATES
1998 ELECTIONS 2001 ELECTIONS 2004 ELECTIONS 2007 ELECTIONS ELECTIVE POSITION
TOTAL MALE FEMA-LE TOTAL MALE FEMA-
LE TOTAL MALE FEMA- LE TOTAL MALE FEMA-
LE
P H I L I P P I N E S 17,389 14,582 2,807 17,459 14,463 2,996 17,551 14,633 2,918 17,512 14,472 3,040
President 1 1 0 1 1 0
Vice-President 1 1 0 1 1 0
Senator 12 10 2 13 12 1 12 9 3 12 11 1
Congressman 207 181 26 209 173 36 212 180 32 218 173 45
Governor 78 66 12 78 65 13 79 64 15 80 62 18
Vice-Governor 78 68 10 78 68 10 79 72 7 80 67 13
Board Member 719 611 108 735 618 117 756 628 128 790 665 125
City/Mun Mayor 1,602 1,358 244 1,602 1,343 259 1,605 1,360 245 1,595 1,322 273
City/Mun Vice-Mayor 1,602 1,413 189 1,602 1,405 197 1,606 1,382 224 1,597 1,367 230
City/Mun Councilor 13,089 10,874 2,215 13,142 10,779 2,363 13,200 10,937 2,263 13,140 10,805 2,335
Source: Records and Statistics Division, ERSD, COMELEC, 2014
BPfA+20 Annexes
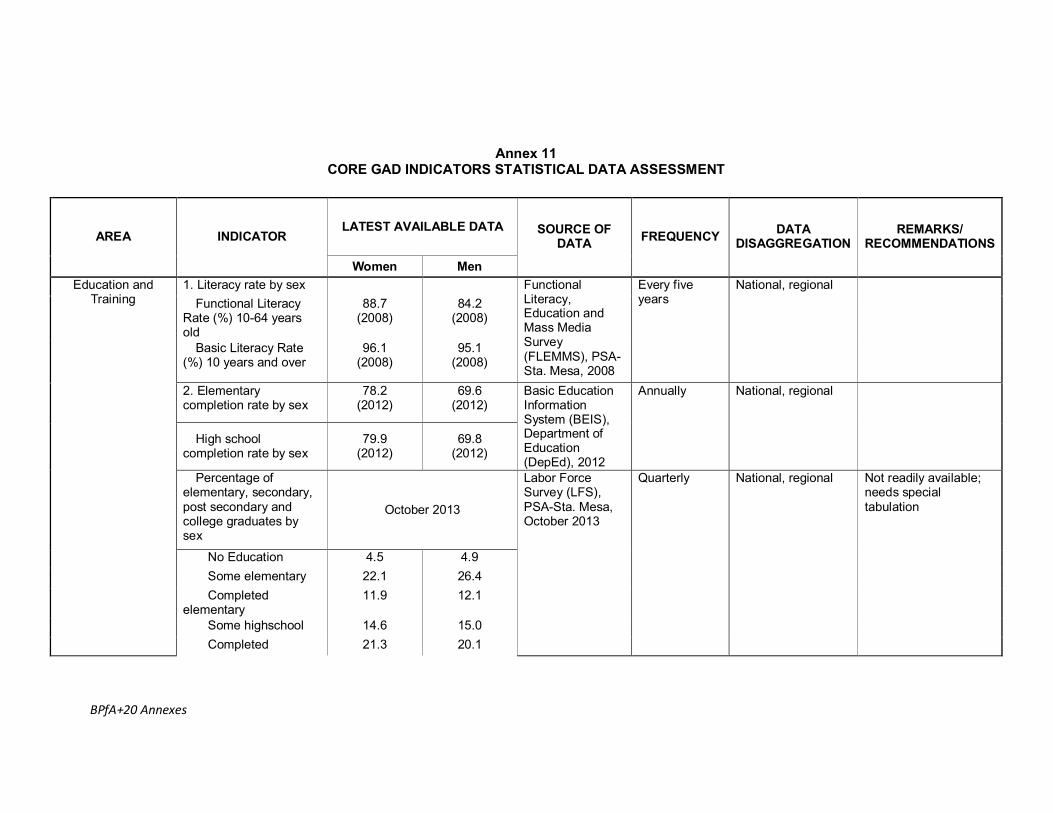
Annex 11 CORE GAD INDICATORS STATISTICAL DATA ASSESSMENT
LATEST AVAILABLE DATA AREA INDICATOR
Women Men
SOURCE OF DATA FREQUENCY DATA
DISAGGREGATION REMARKS/
RECOMMENDATIONS
1. Literacy rate by sex Functional Literacy
Rate (%) 10-64 years old
88.7 (2008)
84.2 (2008)
Basic Literacy Rate (%) 10 years and over
96.1 (2008)
95.1 (2008)
Functional Literacy, Education and Mass Media Survey (FLEMMS), PSA-Sta. Mesa, 2008
Every five years
National, regional
2. Elementary completion rate by sex
78.2 (2012)
69.6 (2012)
High school completion rate by sex
79.9 (2012)
69.8 (2012)
Basic Education Information System (BEIS), Department of Education (DepEd), 2012
Annually National, regional
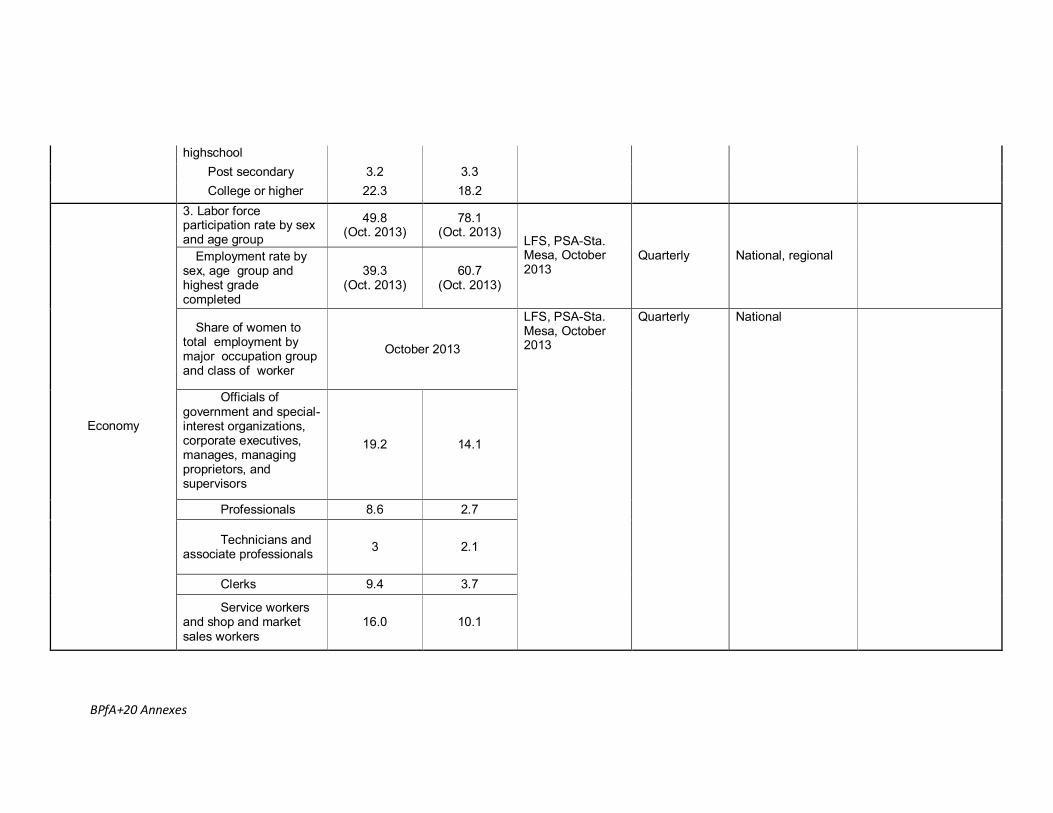
Percentage of elementary, secondary, post secondary and college graduates by sex
October 2013
No Education 4.5 4.9 Some elementary 22.1 26.4 Completed
elementary 11.9 12.1
Some highschool 14.6 15.0
Education and Training
Completed 21.3 20.1
Labor Force Survey (LFS), PSA-Sta. Mesa, October 2013
Quarterly National, regional Not readily available; needs special tabulation
BPfA+20 Annexes
highschool Post secondary 3.2 3.3 College or higher 22.3 18.2
3. Labor force participation rate by sex and age group
49.8 (Oct. 2013)
78.1 (Oct. 2013)
Employment rate by sex, age group and highest grade completed
39.3 (Oct. 2013)
60.7 (Oct. 2013)
LFS, PSA-Sta. Mesa, October 2013
Quarterly National, regional
Share of women to total employment by major occupation group and class of worker
October 2013
Officials of government and special-interest organizations, corporate executives, manages, managing proprietors, and supervisors
19.2 14.1
Professionals 8.6 2.7
Technicians and associate professionals 3 2.1
Clerks 9.4 3.7
Economy
Service workers and shop and market sales workers
16.0 10.1
LFS, PSA-Sta. Mesa, October 2013
Quarterly National
BPfA+20 Annexes
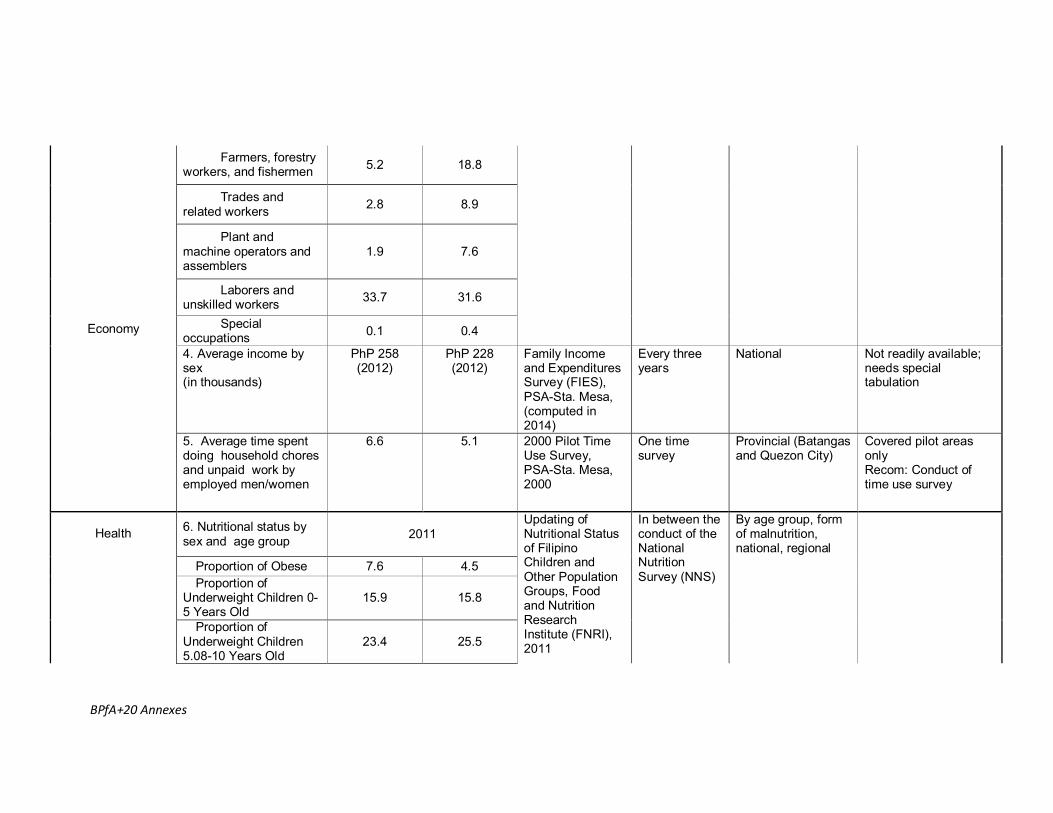
Farmers, forestry workers, and fishermen 5.2 18.8
Trades and related workers 2.8 8.9
Plant and machine operators and assemblers
1.9 7.6
Laborers and unskilled workers 33.7 31.6
Special occupations 0.1 0.4
4. Average income by sex (in thousands)
PhP 258 (2012)
PhP 228 (2012)
Family Income and Expenditures Survey (FIES), PSA-Sta. Mesa, (computed in 2014)
Every three years
National Not readily available; needs special tabulation
Economy
5. Average time spent doing household chores and unpaid work by employed men/women
6.6 5.1 2000 Pilot Time Use Survey, PSA-Sta. Mesa, 2000
One time survey
Provincial (Batangas and Quezon City)
Covered pilot areas only Recom: Conduct of time use survey
6. Nutritional status by sex and age group 2011
Proportion of Obese 7.6 4.5 Proportion of
Underweight Children 0-5 Years Old
15.9 15.8
Health
Proportion of Underweight Children 5.08-10 Years Old
23.4 25.5
Updating of Nutritional Status of Filipino Children and Other Population Groups, Food and Nutrition Research Institute (FNRI), 2011
In between the conduct of the National Nutrition Survey (NNS)
By age group, form of malnutrition, national, regional
BPfA+20 Annexes
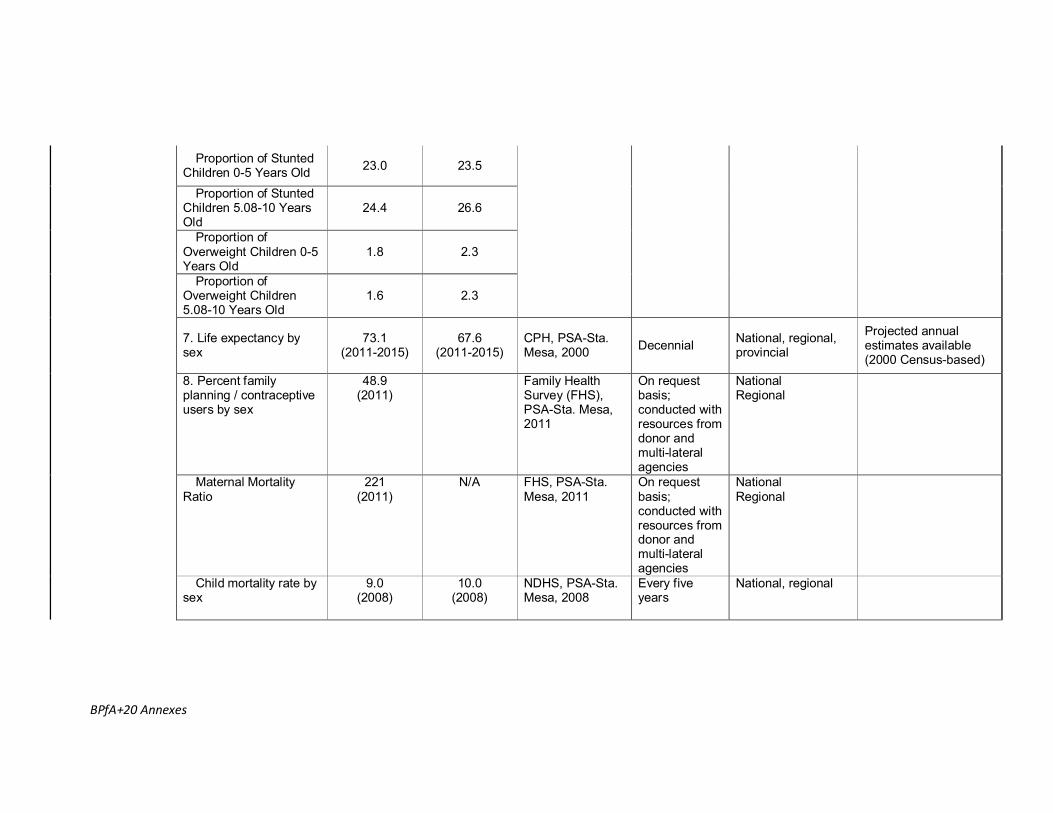
Proportion of Stunted Children 0-5 Years Old 23.0 23.5
Proportion of Stunted Children 5.08-10 Years Old
24.4 26.6
Proportion of Overweight Children 0-5 Years Old
1.8 2.3
Proportion of Overweight Children 5.08-10 Years Old
1.6 2.3
7. Life expectancy by sex
73.1 (2011-2015)
67.6 (2011-2015)
CPH, PSA-Sta. Mesa, 2000 Decennial National, regional,
provincial
Projected annual estimates available (2000 Census-based)
8. Percent family planning / contraceptive users by sex
48.9 (2011)
Family Health Survey (FHS), PSA-Sta. Mesa, 2011
On request basis; conducted with resources from donor and multi-lateral agencies
National Regional
Maternal Mortality Ratio
221 (2011)
N/A FHS, PSA-Sta. Mesa, 2011
On request basis; conducted with resources from donor and multi-lateral agencies
National Regional
Child mortality rate by sex
9.0 (2008)
10.0 (2008)
NDHS, PSA-Sta. Mesa, 2008
Every five years
National, regional
BPfA+20 Annexes
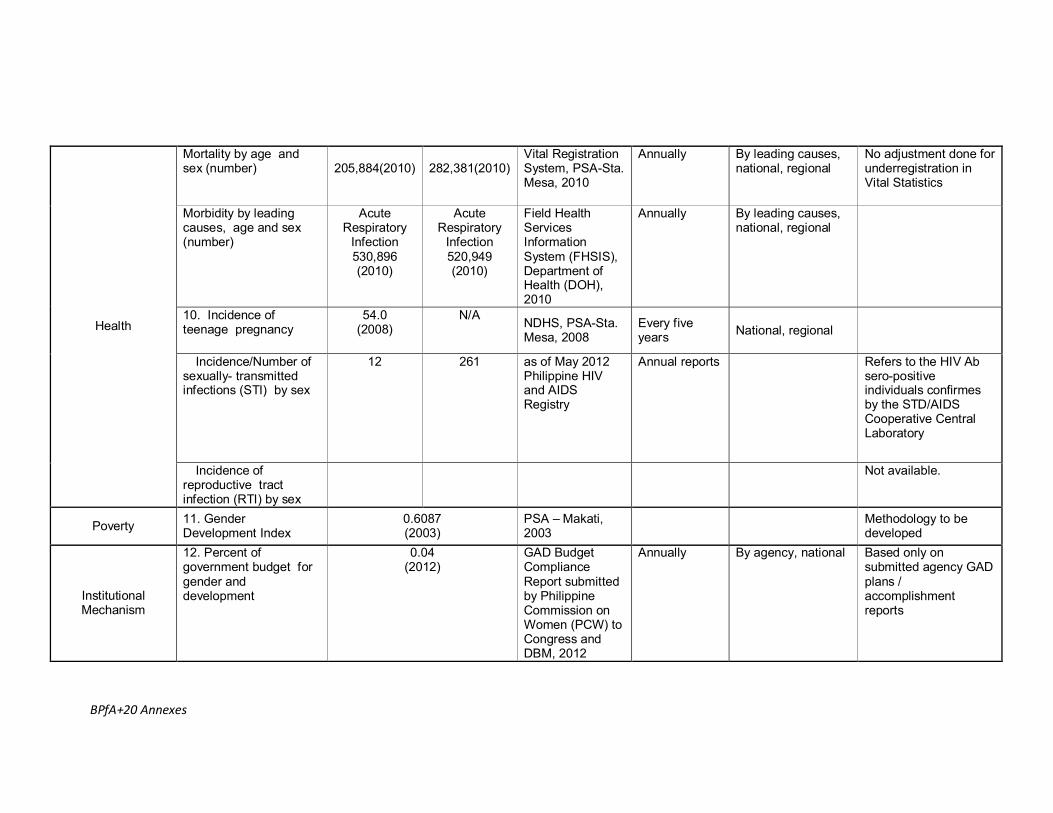
Mortality by age and sex (number)
205,884(2010)
282,381(2010)
Vital Registration System, PSA-Sta. Mesa, 2010
Annually By leading causes, national, regional
No adjustment done for underregistration in Vital Statistics
Morbidity by leading causes, age and sex (number)
Acute Respiratory
Infection 530,896 (2010)
Acute Respiratory
Infection 520,949 (2010)
Field Health Services Information System (FHSIS), Department of Health (DOH), 2010
Annually By leading causes, national, regional
10. Incidence of teenage pregnancy
54.0 (2008)
N/A NDHS, PSA-Sta. Mesa, 2008
Every five years National, regional
Incidence/Number of sexually- transmitted infections (STI) by sex
12 261 as of May 2012 Philippine HIV and AIDS Registry
Annual reports Refers to the HIV Ab sero-positive individuals confirmes by the STD/AIDS Cooperative Central Laboratory
Health
Incidence of reproductive tract infection (RTI) by sex
Not available.
Poverty 11. Gender Development Index
0.6087 (2003)
PSA – Makati, 2003 Methodology to be
developed
Institutional Mechanism
12. Percent of government budget for gender and development
0.04 (2012)
GAD Budget Compliance Report submitted by Philippine Commission on Women (PCW) to Congress and DBM, 2012
Annually By agency, national Based only on submitted agency GAD plans / accomplishment reports
BPfA+20 Annexes
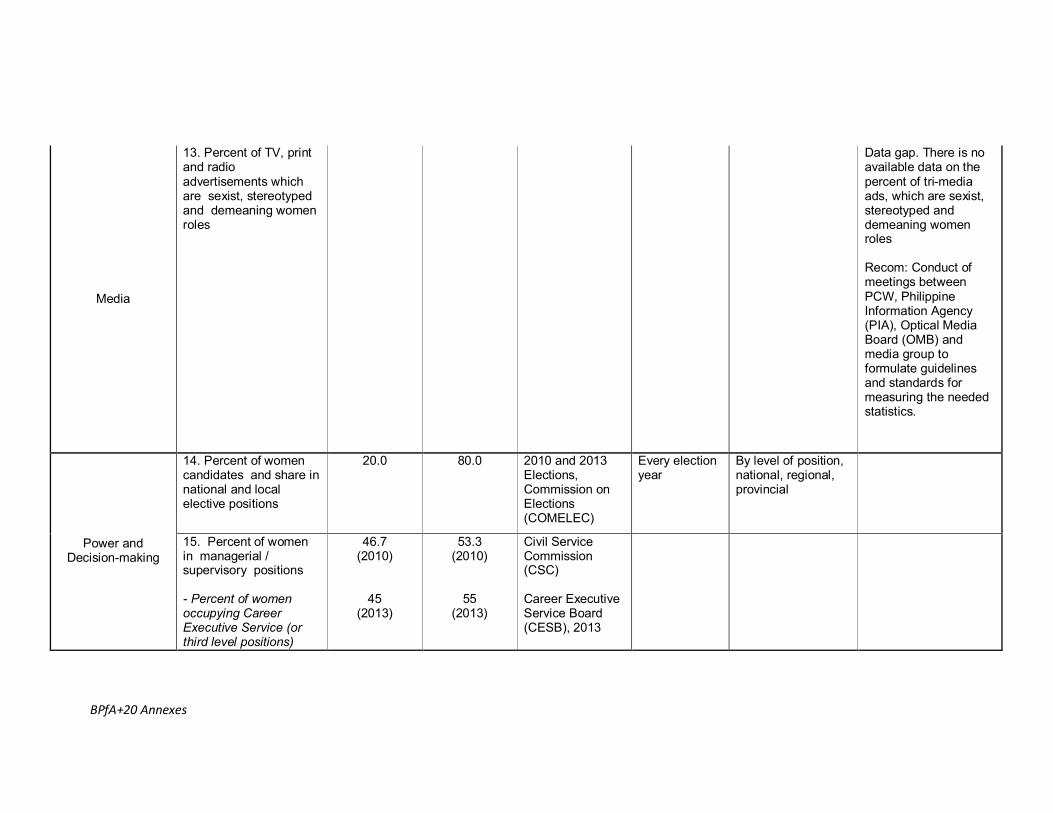
Media
13. Percent of TV, print and radio advertisements which are sexist, stereotyped and demeaning women roles
Data gap. There is no available data on the percent of tri-media ads, which are sexist, stereotyped and demeaning women roles Recom: Conduct of meetings between PCW, Philippine Information Agency (PIA), Optical Media Board (OMB) and media group to formulate guidelines and standards for measuring the needed statistics.
14. Percent of women candidates and share in national and local elective positions
20.0 80.0 2010 and 2013 Elections, Commission on Elections (COMELEC)
Every election year
By level of position, national, regional, provincial
Power and Decision-making
15. Percent of women in managerial / supervisory positions - Percent of women occupying Career Executive Service (or third level positions)
46.7 (2010)
45 (2013)
53.3 (2010)
55 (2013)
Civil Service Commission (CSC) Career Executive Service Board (CESB), 2013
BPfA+20 Annexes
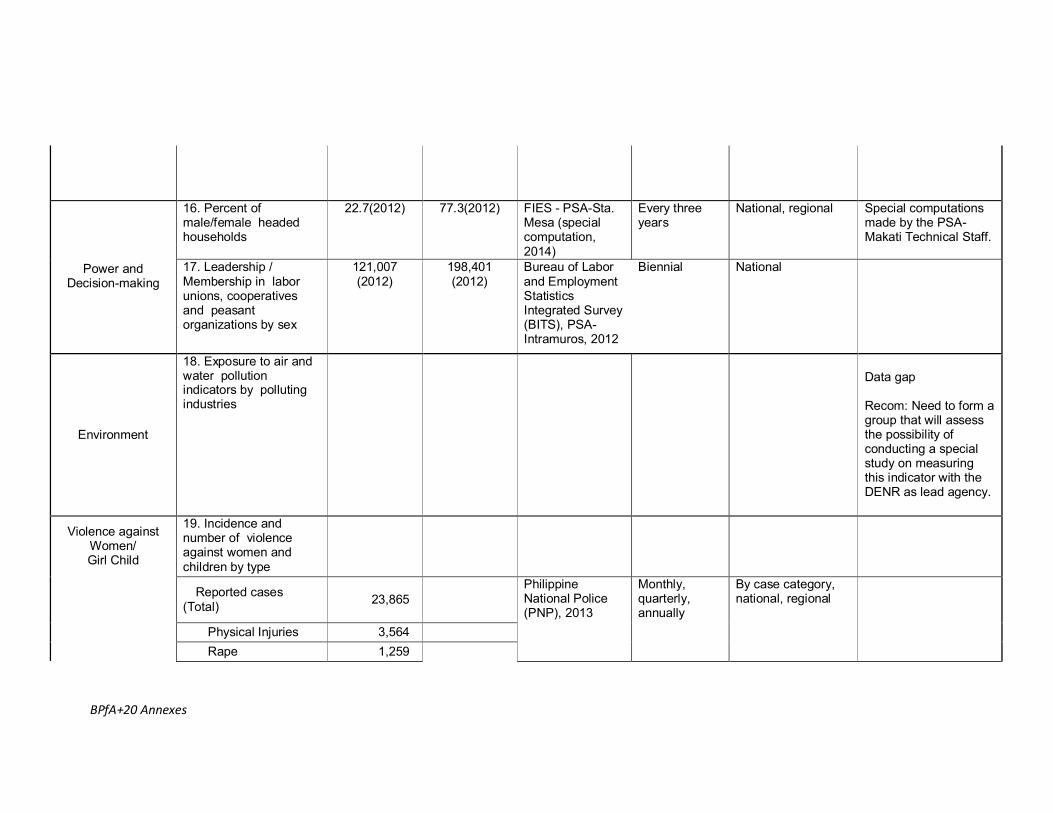
16. Percent of male/female headed households
22.7(2012) 77.3(2012) FIES - PSA-Sta. Mesa (special computation, 2014)
Every three years
National, regional Special computations made by the PSA-Makati Technical Staff.
Power and Decision-making
17. Leadership / Membership in labor unions, cooperatives and peasant organizations by sex
121,007 (2012)
198,401 (2012)
Bureau of Labor and Employment Statistics Integrated Survey (BITS), PSA-Intramuros, 2012
Biennial National
Environment
18. Exposure to air and water pollution indicators by polluting industries
Data gap Recom: Need to form a group that will assess the possibility of conducting a special study on measuring this indicator with the DENR as lead agency.
19. Incidence and number of violence against women and children by type
Reported cases (Total) 23,865
Physical Injuries 3,564
Violence against Women/ Girl Child
Rape 1,259
Philippine National Police (PNP), 2013
Monthly, quarterly, annually
By case category, national, regional
BPfA+20 Annexes
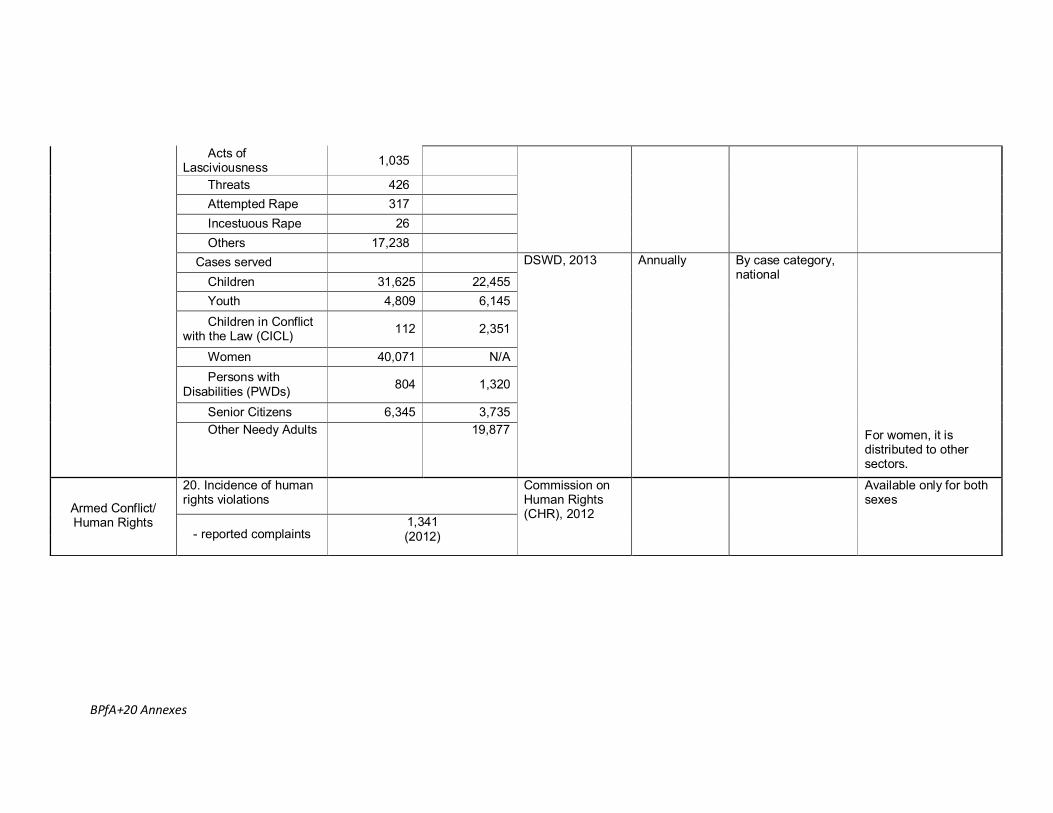
Acts of Lasciviousness 1,035
Threats 426 Attempted Rape 317 Incestuous Rape 26 Others 17,238
Cases served Children 31,625 22,455 Youth 4,809 6,145 Children in Conflict
with the Law (CICL) 112 2,351
Women 40,071 N/A Persons with
Disabilities (PWDs) 804 1,320
Senior Citizens 6,345 3,735 Other Needy Adults 19,877
DSWD, 2013 Annually By case category, national
For women, it is distributed to other sectors.
20. Incidence of human rights violations Armed Conflict/
Human Rights - reported complaints
1,341 (2012)
Commission on Human Rights (CHR), 2012
Available only for both sexes
BPfA+20 Annexes
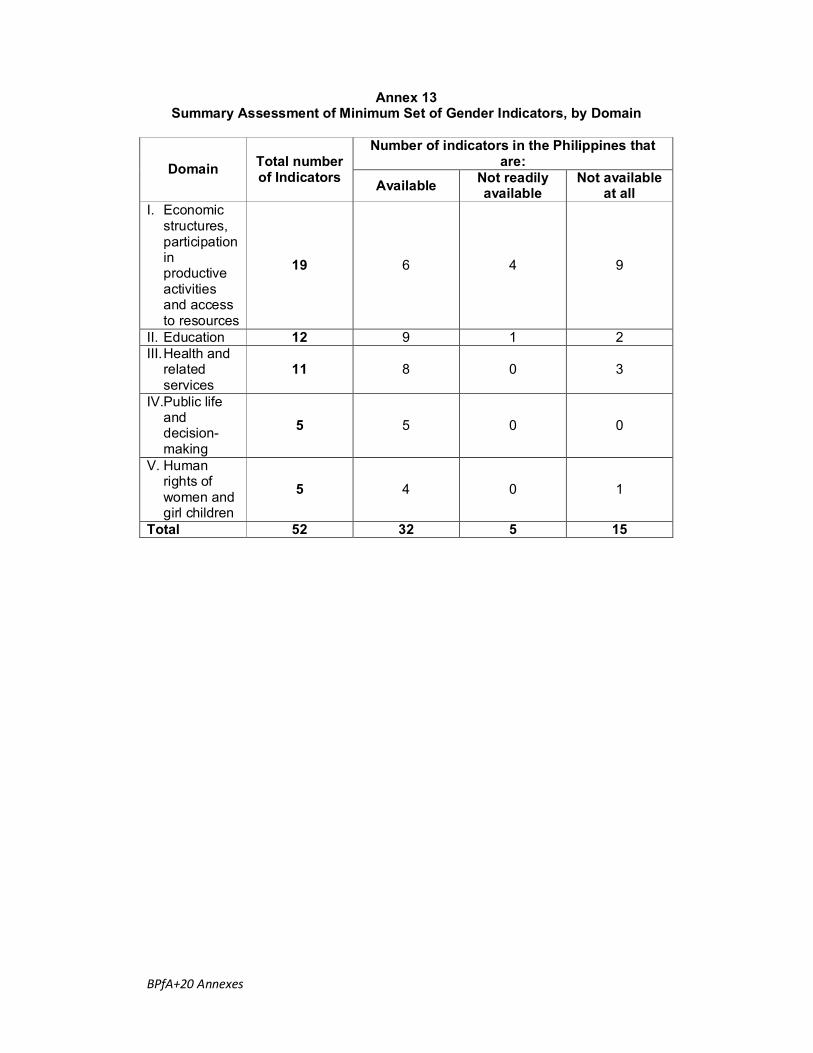
Annex 13 Summary Assessment of Minimum Set of Gender Indicators, by Domain
Number of indicators in the Philippines that
are: Domain Total number of Indicators Available Not readily
available Not available
at all I. Economic
structures, participation in productive activities and access to resources
19 6 4 9
II. Education 12 9 1 2 III. Health and
related services
11 8 0 3
IV.Public life and decision-making
5 5 0 0
V. Human rights of women and girl children
5 4 0 1
Total 52 32 5 15
BPfA+20 Annexes
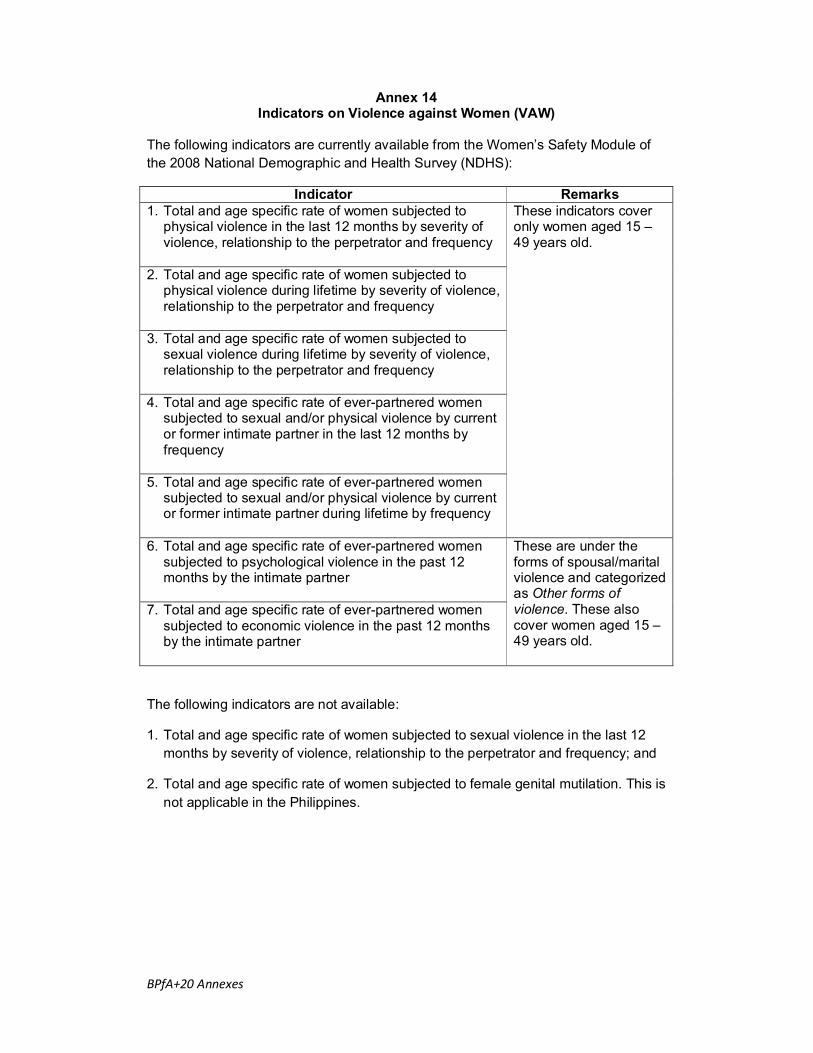
Annex 14 Indicators on Violence against Women (VAW)
The following indicators are currently available from the Women’s Safety Module of the 2008 National Demographic and Health Survey (NDHS):
Indicator Remarks 1. Total and age specific rate of women subjected to
physical violence in the last 12 months by severity of violence, relationship to the perpetrator and frequency
2. Total and age specific rate of women subjected to physical violence during lifetime by severity of violence, relationship to the perpetrator and frequency
3. Total and age specific rate of women subjected to sexual violence during lifetime by severity of violence, relationship to the perpetrator and frequency
4. Total and age specific rate of ever-partnered women subjected to sexual and/or physical violence by current or former intimate partner in the last 12 months by frequency
5. Total and age specific rate of ever-partnered women subjected to sexual and/or physical violence by current or former intimate partner during lifetime by frequency
These indicators cover only women aged 15 – 49 years old.
6. Total and age specific rate of ever-partnered women subjected to psychological violence in the past 12 months by the intimate partner
7. Total and age specific rate of ever-partnered women
subjected to economic violence in the past 12 months by the intimate partner
These are under the forms of spousal/marital violence and categorized as Other forms of violence. These also cover women aged 15 – 49 years old.
The following indicators are not available:
1. Total and age specific rate of women subjected to sexual violence in the last 12 months by severity of violence, relationship to the perpetrator and frequency; and
2. Total and age specific rate of women subjected to female genital mutilation. This is not applicable in the Philippines.