Embed Size (px)
Citation preview

ENVIRONMENTAL & SOCIAL IMPACT ASSESSMENT (ESIA) FOR
PRINOS OFFSHORE DEVELOPMENT PROJECT
ANNEX 07 : OIL SPILL MODELLING REPORT

Aegean Sea: Oil Spill Modelling Assessment
A part of BMT in Energy and Environment
Reference: A.BMT.193W
Client: Energean Oil & Gas
Date: February 2016
Confidential

Intentionally blank page
Aegean Sea: Oil Spill Modelling Assessment
BMT Cordah Limited February 2016
Document Control
Document Title Aegean Sea: Oil Spill Modelling Assessment
Client Energean Oil & Gas
BMT Cordah Document Ref. A.BMT.193
Rev. V2.0
Terms This report is confidential. No part may be cited without the express permission of BMT Cordah Ltd or Energean Oil & Gas. It must not be published or made available in any publicly available form such as a website without written permission. Additionally, to minimise the risk of identity fraud, this page containing signatures must be removed.
Rev. Description Prepared Checked Approved Date
1.0 Draft Issue to Client L Lépissier C Hinton J Ferris 19.02.16
2.0 Final Issue to Client following comments
L Lépissier N MacDonald J Ferris 19.02.16
BMT Cordah Limited
Broadfold House, Broadfold Road
Bridge of Don, Aberdeen
UK, AB23 8EE
Tel: +44(0)1224 414200
Fax: +44(0)1224 414250
Email: [email protected]
Website: www.bmtcordah.com

Aegean Sea: Oil Spill Modelling Assessment
BMT Cordah Limited i February 2016
Contents
1.0 INTRODUCTION ............................................................................................... 1
2.0 MODELLING APPROACH AND DESCRIPTION .............................................. 2
2.1 Modelling Approach .......................................................................................... 2
2.2 Modelling Description ........................................................................................ 2
2.3 Assumptions ..................................................................................................... 2
3.0 MODEL SCENARIOS ....................................................................................... 3
3.1 Oil Type ............................................................................................................ 4
3.2 Meteorological Data .......................................................................................... 4
3.3 Hydrodynamic Data ........................................................................................... 4
3.3.1 Tidal Model ....................................................................................................... 5
4.0 MODEL RESULTS ........................................................................................... 5
4.1 Well Blow-out Results ....................................................................................... 5
4.1.1 Winter scenarios ............................................................................................... 5
4.1.2 Summer scenarios .......................................................................................... 14
4.2 Pipeline Release ............................................................................................. 20
4.2.1 Winter scenarios ............................................................................................. 20
4.2.2 Summer scenarios .......................................................................................... 28
4.3 Loading Buoy .................................................................................................. 34
5.0 DISCUSSION .................................................................................................. 36
6.0 REFERENCES ............................................................................................... 37
APPENDIX A: ................................................................................................................ 38
MODELLING INPUT DATA ............................................................................................ 38

Aegean Sea: Oil Spill Modelling Assessment
BMT Cordah Limited 1 February 2016
1.0 INTRODUCTION
BMT Cordah Ltd (Cordah) was commissioned by Energean Oil & Gas to undertake a
suite of oil spill modelling scenarios in support of a development for a proposed offshore
structure in the North Aegean Sea, approximately, 6 km south of Kavala in water depths
ranging between 30 and 40 m.
In order to gain financing for the proposed development, the banks require that a suite
for 2-Dimensionsal oil spill modelling is undertaken. The suite of simulations, as
developed by Energean Oil & Gas, are intended to replicate the passage of spilt oil under
a likely range of metocean conditions which could be experienced at the site. Thus, a
total of 25 simulations, covering summer and winter conditions, have been assessed and
are presented within this document.
The oil spill assessments have allowed for surface oil releases as a:
Continuous release resulting from a well blow-out at the Lamda platform;
Continuous release from the product pipeline; and
An instantaneous release from an incident at the loading buoy.

Aegean Sea: Oil Spill Modelling Assessment
BMT Cordah Limited 2 February 2016
2.0 MODELLING APPROACH AND DESCRIPTION
The modelling reported in this assessment has been undertaken to provide a high level
indication of the likely trajectories, beaching locations and volumes resulting from a
series of accidental spill events occurring within the Aegean Sea.
This section provides an overview of the modelling approach and a description of the oil
spill model applied within the project.
2.1 Modelling Approach
The modelling approach adopted within this study was selected in-line with a need to
understand key resultant parameters associated with a series of hypothetical accidental
spill events. Further a consideration of the pre-existing environmental characteristics was
also undertaken to guide the approach, specifically the:
Local water depths, documented to be in the range 30 to 40 m at the three different release locations; and
Metocean conditions, an assessment of which indicates that the regular (daily) current speeds are negligible (BMT Argoss, 2015). This is further supported by an assessment of the extreme surface current speeds. For a 1 year return period, extreme current speeds range between 0.10 m/s and 0.54 m/s, originating from the northwest and west, respectively.
2.2 Modelling Description
BMT’s Oil Spill Information System (OSIS) model can simulate the fate and dispersion of
surface oil slicks. OSIS was jointly developed by BMT and AEA Technology plc. (Walker,
1995). OSIS is a particle-tracking model that represents an oil slick as a collection of free
moving particles, which simulate the spreading slick. The weathering model and
associated algorithms within OSIS have been validated against controlled actual spills at
sea and real spill events, supported with laboratory calibration. These models combine
the following parameters to define the fate of oil at sea:
Weathering algorithms that determine physical change in a slick as it spreads.
Transport processes acting on the oil due to the current, wind, waves, diffusion and buoyancy in the ocean surface layer.
Changes due to evaporation, emulsification and natural dispersion of oils.
Prediction of physical properties such as density, viscosity and flash point changes.
OSIS supports several model types, but are generally characterised as either
deterministic (trajectory) or stochastic. Deterministic models allow simulation of a point
source spill scenario under a defined set of metocean parameters. Stochastic models
allow simulation of a point source spill under a specified number of different probable
metocean conditions (wind speed and direction).
2.3 Assumptions
A number of assumptions and limitations have been considered in this study:
The well blow-out and pipeline release scenarios have been modelled as surface
release, however in reality these releases are subsea events. Modelling have been
Aegean Sea: Oil Spill Modelling Assessment
BMT Cordah Limited 3 February 2016
undertaken under deterministic mode, with a fixed wind blowing for pre-specified
durations (hours to days). The simulations should therefore be considered as worst-
case scenarios as it is improbable that wind conditions will remain constant in terms
of wind speed and direction over such time periods.
The volumes of oil beached correspond to emulsified oil. Consequently it should be expected that the volume of oil beached will be greater than the volume of oil released. This is due to the emulsification process. Most oils will absorb droplets of water under the action of waves on the sea surface. The resulting water in oil emulsion can increase the volume of pollutant by up to 5 times and is usually very viscous and more persistent than the original oil (ITOPF, 2012).Considering emulsified oil is more realistic when considering volumes that may need to be responded to during an oil spill incident.
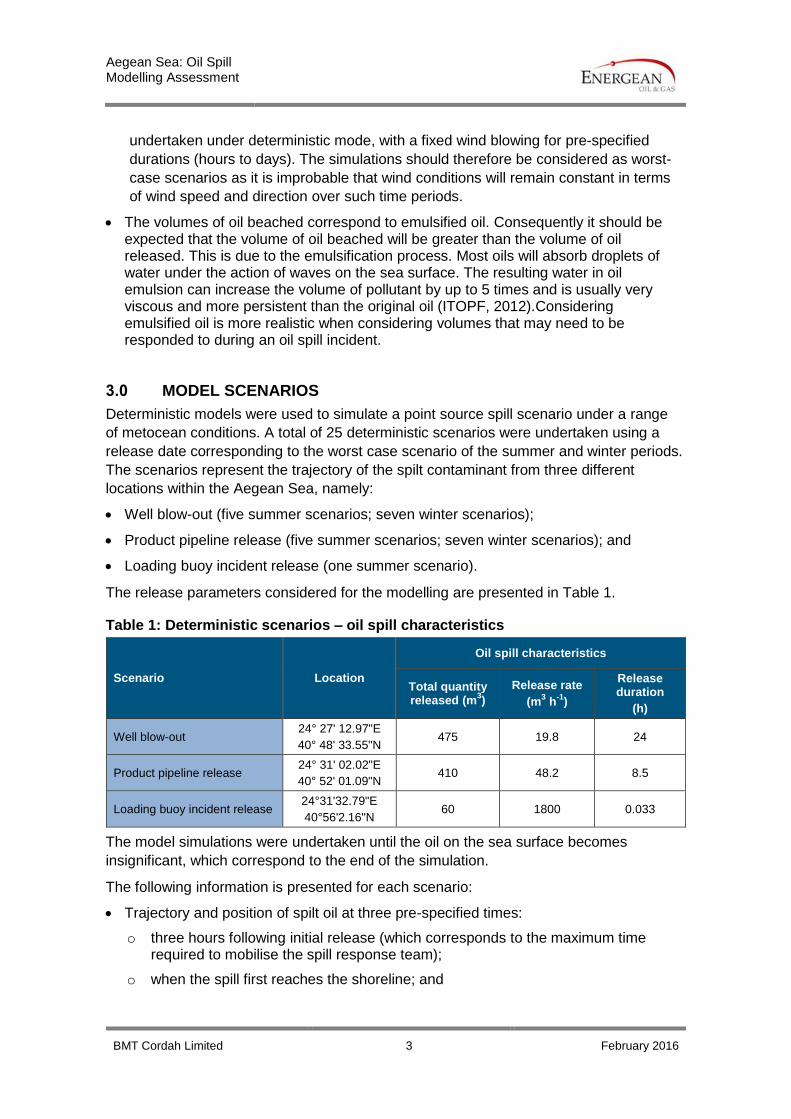
3.0 MODEL SCENARIOS
Deterministic models were used to simulate a point source spill scenario under a range
of metocean conditions. A total of 25 deterministic scenarios were undertaken using a
release date corresponding to the worst case scenario of the summer and winter periods.
The scenarios represent the trajectory of the spilt contaminant from three different
locations within the Aegean Sea, namely:
Well blow-out (five summer scenarios; seven winter scenarios);
Product pipeline release (five summer scenarios; seven winter scenarios); and
Loading buoy incident release (one summer scenario).
The release parameters considered for the modelling are presented in Table 1.
Table 1: Deterministic scenarios – oil spill characteristics
Scenario Location
Oil spill characteristics
Total quantity released (m
3)
Release rate
(m3 h
-1)
Release duration
(h)
Well blow-out 24° 27' 12.97"E
40° 48' 33.55"N 475 19.8 24
Product pipeline release 24° 31' 02.02"E
40° 52' 01.09"N 410 48.2 8.5
Loading buoy incident release 24°31'32.79"E
40°56'2.16"N 60 1800 0.033
The model simulations were undertaken until the oil on the sea surface becomes
insignificant, which correspond to the end of the simulation.
The following information is presented for each scenario:
Trajectory and position of spilt oil at three pre-specified times:
o three hours following initial release (which corresponds to the maximum time required to mobilise the spill response team);
o when the spill first reaches the shoreline; and

Aegean Sea: Oil Spill Modelling Assessment
BMT Cordah Limited 4 February 2016
o when the amount of oil at sea becomes insignificant.
Beaching locations; and
Volumes of beached oil (as emulsified oil).
3.1 Oil Type
The two oil types found at the Lamda Platform and within the pipeline are not available in
the OSIS oil database. Consequently, and in line with best practise, an analogue was
selected based on a best matching of oil characteristics (Table 2).
Table 2: Oil types and characteristics
Oil type Specific gravity
API (O)
Pour point (˚)
Dynamic viscosity
(mPA/S or cP
Wax content
(% wt)
Well blow-out
Epsilon Fluid 0.844 36 <-36 9 3.9
OSIS analogue: Kirkuk 0.844 36 -34 1.15 - 9 -
Product pipeline release/ Loading buoy incident release
Export Fluid: Epsilon +Prinos 0.852 34.5 <-24 8 1.7
OSIS analogue: Basrah Light 0.852 34.6 -30 1.35 - 9 -
3.2 Meteorological Data
For each scenario, specific wind speed and direction were specified by Energean Oil &
Gas for the application in the modelling during winter and summer seasons. Details of
the wind characteristics are summarised in Appendix A.
The average seasonal temperatures at the location of interest are presented in Table 3.
Table 3: Sea and air temperatures used for modelling
Season Month of reference Sea temperature (˚C)* Air temperature (˚C)**
Winter February 12.0 7.5
Summer July 24.0 25.2
*Sea temperatures have been provided by Energean Oil & Gas.
**Air temperatures have been sourced from BMT Argoss, 2015.
3.3 Hydrodynamic Data
Residual and tidal current datasets are combined for oil spill modelling using OSIS. In the
preparation of the datasets the data are interpolated onto a standard time frame (e.g.
one hourly).

Aegean Sea: Oil Spill Modelling Assessment
BMT Cordah Limited 5 February 2016
3.3.1 Tidal Model
Tidal data have been generated by BMT Argoss's own tidal model. BMT Argoss tidal
model provides the water motions associated with the eight most significant harmonic
constituents of tidal oscillation including the principal lunar and solar semi-diurnal
constituents; another 12 constituents are inferred. The global tidal information is based
on the integration of, approximately, 5,000 tidal stations and 15 years of satellite radar
altimeter measurements into depth average global and regional tidal models (the 2DH
model).
The model spatial resolution in the region is 00°01’ x 00°01’. Depth-averaged tidal
currents are scaled to the surface assuming a logarithmic profile although at the study
site the differences through the water column are negligible (BMT Argoss, 2015).
4.0 MODEL RESULTS
This section presents the results of the modelling simulations undertaken for the
following release scenarios:
Well blow-out at the Lamda Platform (winter and summer);
Pipeline release (winter and summer); and
Loading buoy (summer).
For each scenario, images of beaching locations, spill trajectory and position of oil are
presented at three pre-specified times:
Three hours following initial release (which corresponds to the maximum time required to mobilise the spill response team).
When the spill first reaches the shoreline.
When the amount of oil at sea becomes insignificant (which corresponds to the end of the simulation).
The results clearly show the limited lateral movement of the spilt oil from the main trajectory, as determined by the direction of the predominant wind condition. This is a direct consequence of the negligible current speeds experienced within the study area, and as confirmed within the project specific metocean assessment (BMT Argoss, 2015).
4.1 Well Blow-out Results
Deterministic results of the winter and summer seasons for the well blow-out scenarios
are presented in Section 4.1.1 and 4.1.2, respectively.
4.1.1 Winter scenarios
For each winter scenario, images of beaching locations, spill trajectory and position of oil
are presented at three pre-specified times such as:
Figure 1: Well blow-out 1A.
Figure 2: Well blow-out 1B.
Figure 3: Well blow-out 1C.
Figure 4: Well blow-out 1D.

Aegean Sea: Oil Spill Modelling Assessment
BMT Cordah Limited 6 February 2016
Figure 5: Well blow-out 1E.
Figure 6: Well blow-out 1F.
Figure 7: Well blow-out 1G.
For each winter scenario simulation for the well blow-out, the volume of emulsified oil
beached and the associated minimum arrival time to shore are presented in Table 4.
Table 4: Volume of emulsified oil beached and associated minimum arrival time for the Well blow-out winter scenarios
Scenario Beaching volume (m³) Minimum arrival time until
beaching (hours)
Well blow-out 1A 319 32
Well blow-out 1B 546 16
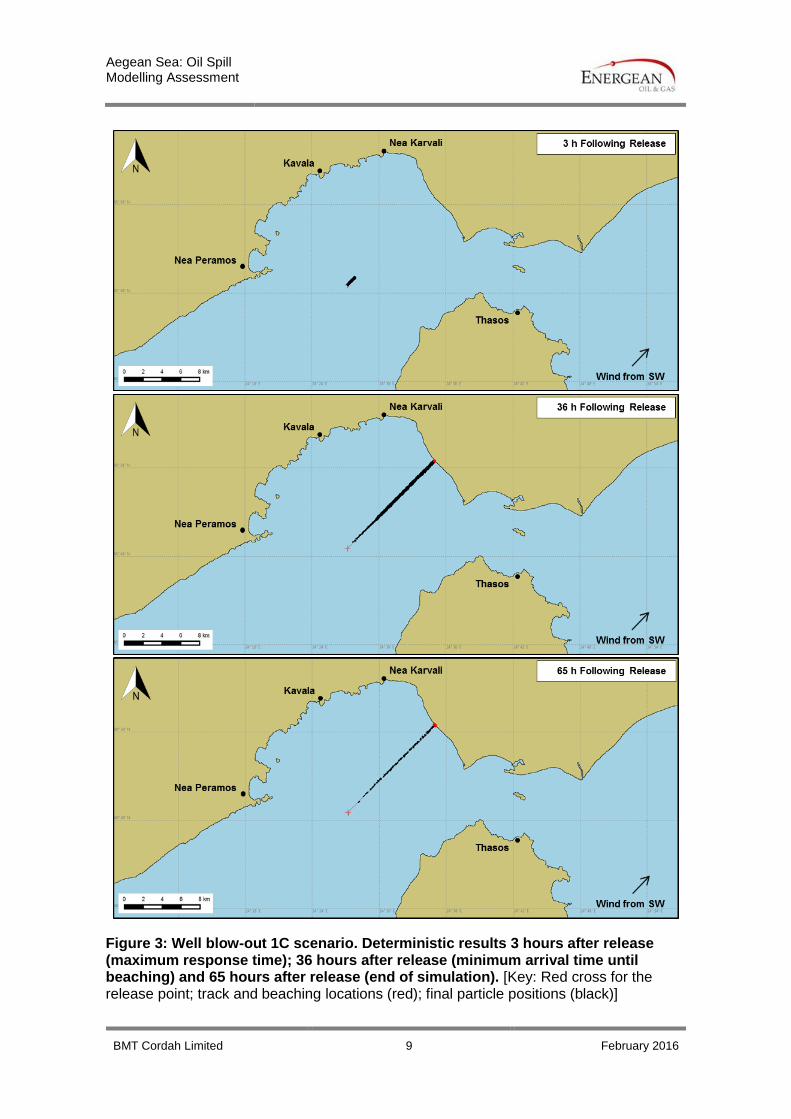
Well blow-out 1C 228 36
Well blow- out 1D 322 28
Well blow-out 1E 214 53
Well blow-out 1F 469 71
Well blow-out 1G 809 34
Aegean Sea: Oil Spill Modelling Assessment
BMT Cordah Limited 7 February 2016
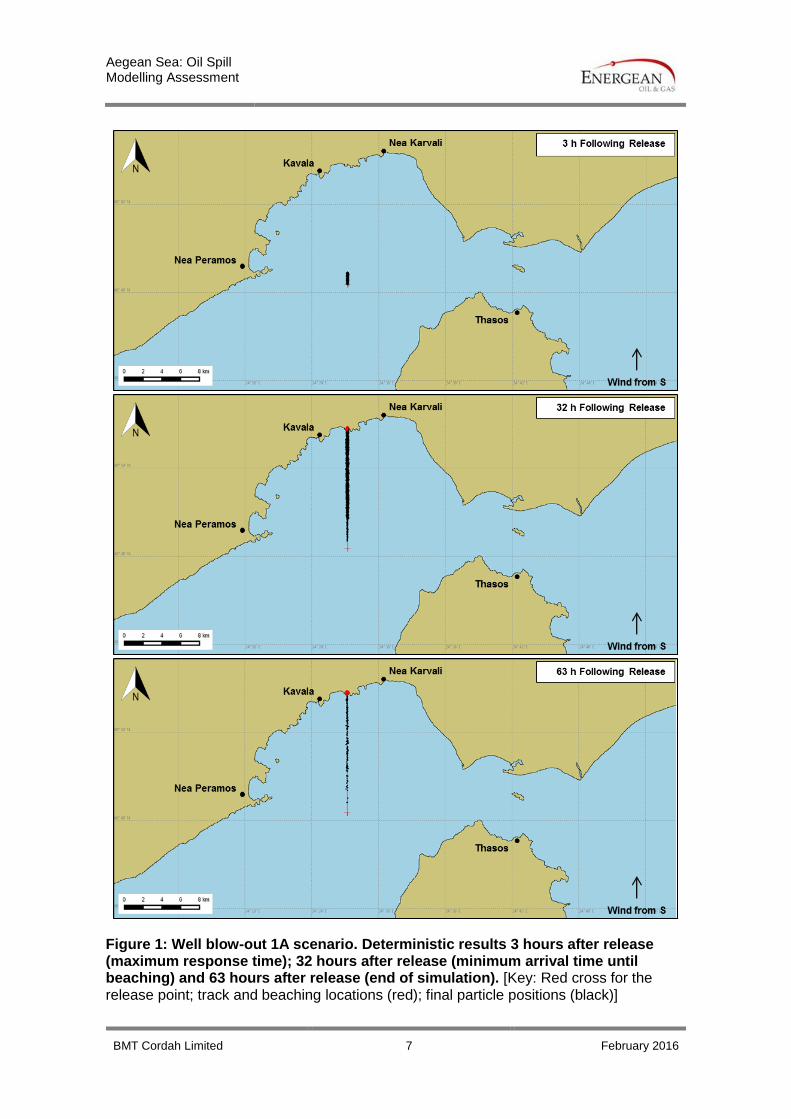
Figure 1: Well blow-out 1A scenario. Deterministic results 3 hours after release (maximum response time); 32 hours after release (minimum arrival time until beaching) and 63 hours after release (end of simulation). [Key: Red cross for the release point; track and beaching locations (red); final particle positions (black)]

Aegean Sea: Oil Spill Modelling Assessment
BMT Cordah Limited 8 February 2016
Figure 2: Well blow-out 1B scenario. Deterministic results 3 hours after release (maximum response time); 16 hours after release (minimum arrival time until beaching) and 64 hours after release (end of simulation). [Key: Red cross for the release point; track and beaching locations (red); final particle positions (black)]
Aegean Sea: Oil Spill Modelling Assessment
BMT Cordah Limited 9 February 2016
Figure 3: Well blow-out 1C scenario. Deterministic results 3 hours after release (maximum response time); 36 hours after release (minimum arrival time until beaching) and 65 hours after release (end of simulation). [Key: Red cross for the release point; track and beaching locations (red); final particle positions (black)]

Aegean Sea: Oil Spill Modelling Assessment
BMT Cordah Limited 10 February 2016
Figure 4: Well blow-out 1D scenario. Deterministic results 3 hours after release (maximum response time); 28 hours after release (minimum arrival time until beaching) and 66 hours after release (end of simulation). [Key: Red cross for the release point; track and beaching locations (red); final particle positions (black)]

Aegean Sea: Oil Spill Modelling Assessment
BMT Cordah Limited 11 February 2016
Figure 5: Well blow-out 1E scenario. Deterministic results 3 hours after release (maximum response time); 53 hours after release (minimum arrival time until beaching) and 83 hours after release (end of simulation). [Key: Red cross for the release point; track and beaching locations (red); final particle positions (black)]

Aegean Sea: Oil Spill Modelling Assessment
BMT Cordah Limited 12 February 2016
Figure 6: Well blow-out 1F scenario. Deterministic results 3 hours after release (maximum response time); 71 hours after release (minimum arrival time until beaching) and 129 hours after release (end of simulation). [Key: Red cross for the release point; track and beaching locations (red); final particle positions (black)]

Aegean Sea: Oil Spill Modelling Assessment
BMT Cordah Limited 13 February 2016
Figure 7: Well blow-out 1G scenario. Deterministic results 3 hours after release (maximum response time); 34 hours after release (minimum arrival time until beaching) and 106 hours after release (end of simulation). [Key: Red cross for the release point; track and beaching locations (red); final particle positions (black)]

Aegean Sea: Oil Spill Modelling Assessment
BMT Cordah Limited 14 February 2016
4.1.2 Summer scenarios
For each summer scenario, images of beaching locations, spill trajectory and position of
oil are presented at three pre-specified times such as:
Figure 8: Well blow-out 2A
Figure 9: Well blow-out 2B
Figure 10: Well blow-out 2C
Figure 11: Well blow-out 2D
Figure 12 Well blow-out 2E
For each summer scenario of the well blow-out, the volume of emulsified oil beached and
the associated minimum arrival time to shore are presented in Table 5.
Table 5: Volume of emulsified oil beached and associated minimum arrival time for the Well blow-out summer scenarios
Scenario Beaching volume (m³) Minimum arrival time until beaching (hours)
Well blow-out 2A 128 56
Well blow-out 2B 237 36
Well blow-out 2C 215 48
Well blow- out 2D 503 111
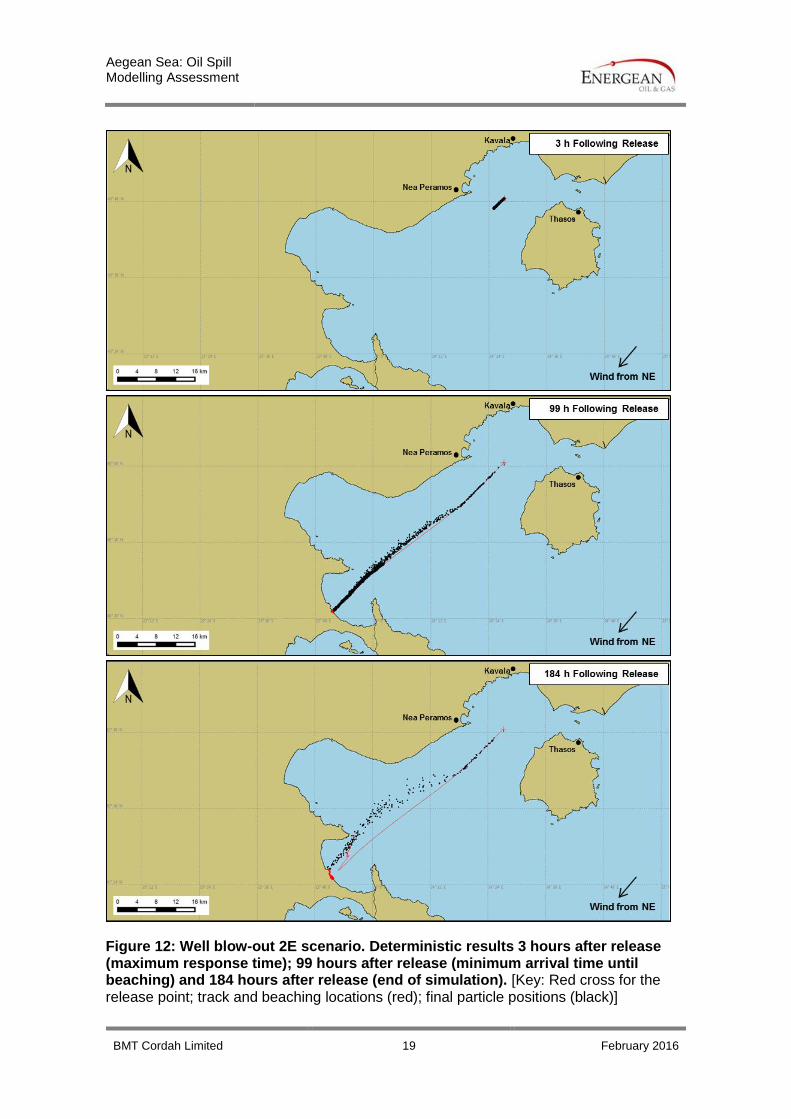
Well blow-out 2E 540 99

Aegean Sea: Oil Spill Modelling Assessment
BMT Cordah Limited 15 February 2016
Figure 8: Well blow-out 2A scenario. Deterministic results 3 hours after release (maximum response time); 56 hours after release (minimum arrival time until beaching) and 85 hours after release (end of simulation). [Key: Red cross for the release point; track and beaching locations (red); final particle positions (black)]

Aegean Sea: Oil Spill Modelling Assessment
BMT Cordah Limited 16 February 2016
Figure 9: Well blow-out 2B scenario. Deterministic results 3 hours after release (maximum response time); 36 hours after release (minimum arrival time until beaching) and 66 hours after release (end of simulation). [Key: Red cross for the release point; track and beaching locations (red); final particle positions (black)]

Aegean Sea: Oil Spill Modelling Assessment
BMT Cordah Limited 17 February 2016
Figure 10: Well blow-out 2C scenario. Deterministic results 3 hours after release (maximum response time); 48 hours after release (minimum arrival time until beaching) and 81 hours after release (end of simulation). [Key: Red cross for the release point; track and beaching locations (red); final particle positions (black)]

Aegean Sea: Oil Spill Modelling Assessment
BMT Cordah Limited 18 February 2016
Figure 11: Well blow-out 2D scenario. Deterministic results 3 hours after release (maximum response time); 111 hours after release (minimum arrival time until beaching) and 183 hours after release (end of simulation). [Key: Red cross for the release point; track and beaching locations (red); final particle positions (black)]
Aegean Sea: Oil Spill Modelling Assessment
BMT Cordah Limited 19 February 2016
Figure 12: Well blow-out 2E scenario. Deterministic results 3 hours after release (maximum response time); 99 hours after release (minimum arrival time until beaching) and 184 hours after release (end of simulation). [Key: Red cross for the release point; track and beaching locations (red); final particle positions (black)]

Aegean Sea: Oil Spill Modelling Assessment
BMT Cordah Limited 20 February 2016
4.2 Pipeline Release
Deterministic results of the winter and summer seasons for the pipeline release
scenarios are presented in Section 4.2.1 and 4.2.2, respectively.
4.2.1 Winter scenarios
For each winter scenario, images of beaching locations, spill trajectory and position of oil
are presented at three pre-specified times such as:
Figure 13: Pipeline release 1A;
Figure 14: Pipeline release 1B;
Figure 15: Pipeline release1C;
Figure 16: Pipeline release 1D;
Figure 17: Pipeline release 1E;
Figure 18: Pipeline release 1G;
Figure 19: Pipeline release 1F.
For each winter scenario of the pipeline release, the volume of emulsified oil beached
and the associated minimum arrival time to shore are presented in Table 6.
Table 6: Volume of emulsified oil beached and associated minimum arrival time for the Pipeline release winter scenarios
Scenario Beaching volume (m³) Minimum arrival time until
beaching (hours)
Pipeline release 1A 291 22
Pipeline release 1B 1,042 7
Pipeline release 1C 257 17
Pipeline release 1D 567 9
Pipelinel release 1E 185 59
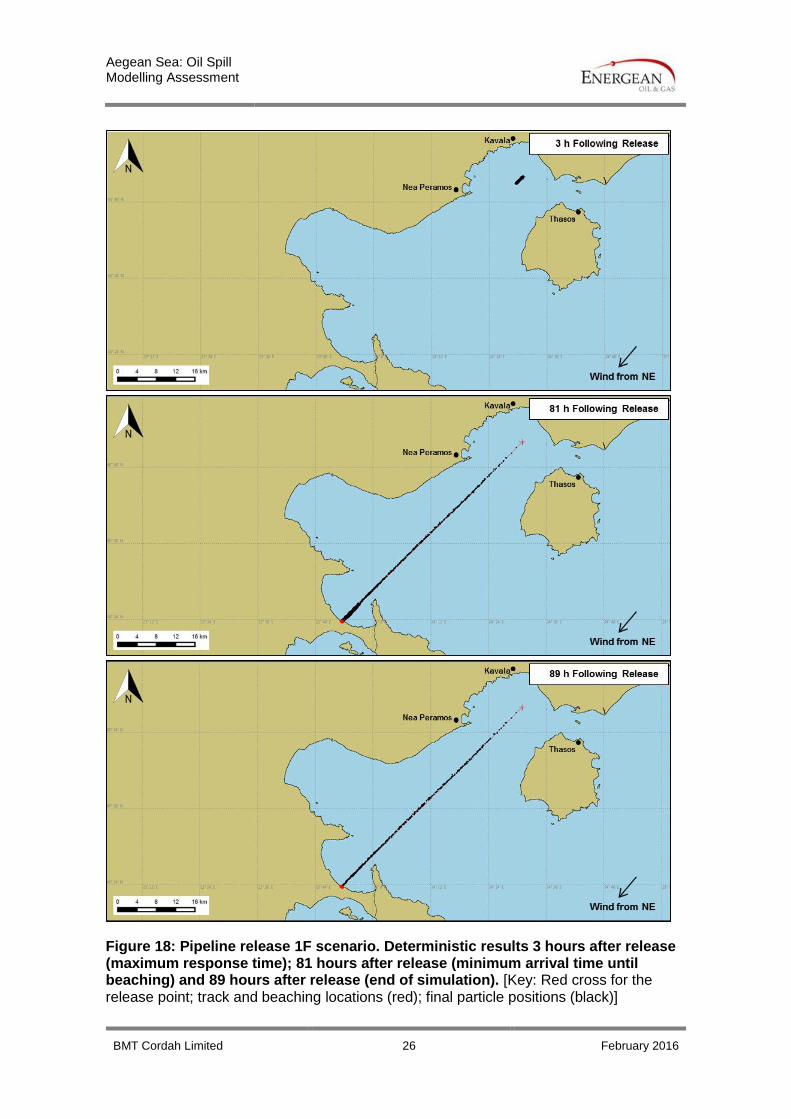
Pipeline release 1F 498 81
Pipeline release 1G 812 38

Aegean Sea: Oil Spill Modelling Assessment
BMT Cordah Limited 21 February 2016
Figure 13: Pipeline release 1A scenario. Deterministic results 3 hours after release (maximum response time); 22 hours after release (minimum arrival time until beaching) and 30 hours after release (end of simulation). [Key: Red cross for the release point; track and beaching locations (red); final particle positions (black)]

Aegean Sea: Oil Spill Modelling Assessment
BMT Cordah Limited 22 February 2016
Figure 14: Pipeline release 1B scenario. Deterministic results 3 hours after release (maximum response time); 7 hours after release (minimum arrival time until beaching) and 30 hours after release (end of simulation). [Key: Red cross for the release point; track and beaching locations (red); final particle positions (black)]

Aegean Sea: Oil Spill Modelling Assessment
BMT Cordah Limited 23 February 2016
Figure 15: Pipeline release 1C scenario. Deterministic results 3 hours after release (maximum response time); 17 hours after release (minimum arrival time until beaching) and 25 hours after release (end of simulation). [Key: Red cross for the release point; track and beaching locations (red); final particle positions (black)]

Aegean Sea: Oil Spill Modelling Assessment
BMT Cordah Limited 24 February 2016
Figure 16: Pipeline release 1D scenario. Deterministic results 3 hours after release (maximum response time); 9 hours after release (minimum arrival time until beaching) and 25 hours after release (end of simulation). [Key: Red cross for the release point; track and beaching locations (red); final particle positions (black)]

Aegean Sea: Oil Spill Modelling Assessment
BMT Cordah Limited 25 February 2016
Figure 17: Pipeline release 1E scenario. Deterministic results 3 hours after release (maximum response time); 59 hours after release (minimum arrival time until beaching) and 67 hours after release (end of simulation). [Key: Red cross for the release point; track and beaching locations (red); final particle positions (black)]
Aegean Sea: Oil Spill Modelling Assessment
BMT Cordah Limited 26 February 2016
Figure 18: Pipeline release 1F scenario. Deterministic results 3 hours after release (maximum response time); 81 hours after release (minimum arrival time until beaching) and 89 hours after release (end of simulation). [Key: Red cross for the release point; track and beaching locations (red); final particle positions (black)]

Aegean Sea: Oil Spill Modelling Assessment
BMT Cordah Limited 27 February 2016
Figure 19: Pipeline release 1G scenario. Deterministic results 3 hours after release (maximum response time); 38 hours after release (minimum arrival time until beaching) and 46 hours after release (end of simulation). [Key: Red cross for the release point; track and beaching locations (red); final particle positions (black)]

Aegean Sea: Oil Spill Modelling Assessment
BMT Cordah Limited 28 February 2016
4.2.2 Summer scenarios
For each summer scenario, images of beaching locations, spill trajectory and position of
oil are presented at three pre-specified times such as:
Figure 20: Pipeline release 2A;
Figure 21: Pipeline release 2B;
Figure 22: Pipeline release 2C;
Figure 23: Pipeline release 2D;
Figure 24: Pipeline release 2E.
For each summer scenario of the pipeline release, the volume of emulsified oil beached
and the associated minimum arrival time to shore are presented in Table 7.
Table 7: Volume of emulsified oil beached and associated minimum arrival time for the Pipeline release summer scenarios
Scenario Beaching volume (m³) Minimum arrival time until
beaching (hours)
Pipeline release 2A 162 38
Pipeline release 2B 246 17
Pipeline release 2C 193 57
Pipeline release 2D 488 126
Pipeline release 2E 562 114

Aegean Sea: Oil Spill Modelling Assessment
BMT Cordah Limited 29 February 2016
Figure 20: Pipeline release 2A scenario. Deterministic results 3 hours after release (maximum response time); 38 hours after release (minimum arrival time until beaching) and 46 hours after release (end of simulation). [Key: Red cross for the release point; track and beaching locations (red); final particle positions (black)]

Aegean Sea: Oil Spill Modelling Assessment
BMT Cordah Limited 30 February 2016
Figure 21: Pipeline release 2B scenario. Deterministic results 3 hours after release (maximum response time); 17 hours after release (minimum arrival time until beaching) and 25 hours after release (end of simulation). [Key: Red cross for the release point; track and beaching locations (red); final particle positions (black)]

Aegean Sea: Oil Spill Modelling Assessment
BMT Cordah Limited 31 February 2016
Figure 22: Pipeline release 2C scenario. Deterministic results 3 hours after release (maximum response time); 57 hours after release (minimum arrival time until beaching) and 65 hours after release (end of simulation). [Key: Red cross for the release point; track and beaching locations (red); final particle positions (black)]

Aegean Sea: Oil Spill Modelling Assessment
BMT Cordah Limited 32 February 2016
Figure 23: Pipeline release 2D scenario. Deterministic results 3 hours after release (maximum response time); 126 hours after release (minimum arrival time until beaching) and 134 hours after release (end of simulation). [Key: Red cross for the release point; track and beaching locations (red); final particle positions (black)]

Aegean Sea: Oil Spill Modelling Assessment
BMT Cordah Limited 33 February 2016
Figure 24: Pipeline release 2E scenario. Deterministic results 3 hours after release (maximum response time); 114 hours after release (minimum arrival time until beaching) and 134 hours after release (end of simulation). [Key: Red cross for the release point; track and beaching locations (red); final particle positions (black)]

Aegean Sea: Oil Spill Modelling Assessment
BMT Cordah Limited 34 February 2016
4.3 Loading Buoy
For the loading buoy scenario, images of beaching locations, spill trajectory and position
of oil are presented at three pre-specified times in Figure 25.
The volume of emulsified oil beached and the associated minimum arrival time to shore
are presented in Table 8.
Table 8: Volume of emulsified oil beached and associated minimum arrival time for the loading buoy scenario
Scenario Beaching volume (m³) Minimum arrival time until
beaching (hours)
Loading Buoy 36 10

Aegean Sea: Oil Spill Modelling Assessment
BMT Cordah Limited 35 February 2016
Figure 25: Loading buoy scenario. Deterministic results 3 hours after release (maximum response time); 10 hours after release (min. arrival time until beaching) and 11 hours after release (end of simulation). [Key: Red cross for the release point; red square: zoom; track and beaching locations (red); final particle positions (black)]
Aegean Sea: Oil Spill Modelling Assessment
BMT Cordah Limited 36 February 2016
5.0 DISCUSSION
Oil spill modelling using the OSIS 2D model has been undertaken for Energean Oil &
Gas. Numerical modelling has been conducted for the following oil release scenarios:
A continuous release resulting from a well blowout at Lamda platform;
A continuous release from the product pipeline; and
An instantaneous release from an incident at the loading buoy.
Modelling has been undertaken under a deterministic mode, with a fixed wind speed and
direction blowing for temporal periods ranging from multiple hours to days. The
deterministic mode should be considered here to represent a worst-case scenario. In
reality wind directions will exhibit greater natural variability over such time periods.
Nevertheless, the deterministic modelling results (images, volume beached and
minimum arrival time of oil to shore) satisfies the high level requirements of this study,
providing indications of the spilt oil trajectories, locations of beached oil and associated
volumes.
The volumes of oil beached correspond to emulsified oil, as would be expected from an
actual hydrocarbon release. Seeing a volume of oil beached greater than the volume of
oil released is to be expected.
Of note is that comparable input parameters may lead to different outputs in terms of
beaching location, beaching volume and arrival time to shore depending upon the tidal
state during the modelling period. Here it should be noted that the characteristics of tidal
currents and wind interact on a non-linear basis. Further, variability in the similar
scenarios under summer and winter conditions can exhibit different results due to the
different sea and air temperatures. Evaporation can be favoured in warmer conditions.
In order to further understand the potential consequences arising from accidental oil spill
events, it is suggested that stochastic modelling for selected targeted scenarios using
time-series of variable wind and current data be undertaken.

Aegean Sea: Oil Spill Modelling Assessment
BMT Cordah Limited 37 February 2016
6.0 REFERENCES
BMT Argoss, 2015. Metocean Criteria – Kavala, Greece. Report prepared for Energean Oil & Gas. Report reference RP_A15183_P1r1
ITOPF, 2012. The International Tanker Owners Pollution Federation Limited. Response to marine Oil Spills. 2nd Edition.
Walker, M. (1995). The oil spill information system (OSIS) and Eurospill models: background documentation. ASMO International Workshop, The Hague, 15-17 November 1995. Modelling of Accidental Spills & Other Calamities at Sea. 13pp.

Aegean Sea: Oil Spill Modelling Assessment
BMT Cordah Limited 38 February 2016
APPENDIX A:
MODELLING INPUT DATA

Aegean Sea: Oil Spill Modelling Assessment
BMT Cordah Limited 39 February 2016
Scenario Location (Lat/Long) Start
Date Oil Type
Sea
Temp
(°C)
Air Temp
(°C)
Wind Characteristics Spill Characteristics
Speed (m/s)
Direction Bearing
(˚)
Total Quantity Released
(m3)
Release
Rate
(m3/hr)
Release
Duration
(hrs)
Well blow-out: Winter scenarios
Well blow-out 1A 24° 27' 12.97"E
40° 48' 33.55"N 01/02
Epsilon Fluid
12 7.5 3.95 From S 180 475 19.8 24
Well blow-out 1B 24° 27' 12.97"E
40° 48' 33.55"N 01/02
Epsilon Fluid
12 7.5 10 for 7.5h then 3.95
From S 180 475 19.8 24
Well blow-out 1C 24° 27' 12.97"E
40° 48' 33.55"N 01/02
Epsilon Fluid
12 7.5 3.38 From SW 225 475 19.8 24
Well blow- out 1D 24° 27' 12.97"E
40° 48' 33.55"N 01/02
Epsilon Fluid
12 7.5 10 for 3.5h then 3.38
From SW 225 475 19.8 24
Well blow-out 1E 24° 27' 12.97"E
40° 48' 33.55"N 01/02
Epsilon Fluid
12 7.5 2.1 From NW 315 475 19.8 24
Well blow-out 1F 24° 27' 12.97"E
40° 48' 33.55"N 01/02
Epsilon Fluid
12 7.5 7.5 From NE 45 475 19.8 24
Well blow-out 1G 24° 27' 12.97"E
40° 48' 33.55"N 01/02
Epsilon Fluid
12 7.5 13 for 48h then 7.52
From NE 45 475 19.8 24

Aegean Sea: Oil Spill Modelling Assessment
BMT Cordah Limited 40 February 2016
Scenario Location (Lat/Long) Start
Date Oil Type
Sea
Temp
(°C)
Air Temp
(°C)
Wind Characteristics Spill Characteristics
Speed (m/s)
Direction Bearing
(˚)
Total Quantity Released
(m3)
Release
Rate
(m3/hr)
Release
Duration
(hrs)
Well blow-out: Summer scenarios
Well blow-out 2A 24° 27' 12.97"E
40° 48' 33.55"N 01/07
Epsilon Fluid
24 25.2 2.7 From S 180 475 19.8 24
Well blow-out 2B 24° 27' 12.97"E
40° 48' 33.55"N 01/07
Epsilon Fluid
24 25.2 3.4 From SW 225 475 19.8 24
Well blow-out 2C 24° 27' 12.97"E
40° 48' 33.55"N 01/07
Epsilon Fluid
24 25.2 2.4 From NW 315 475 19.8 24
Well blow-out 2D 24° 27' 12.97"E
40° 48' 33.55"N 01/07
Epsilon Fluid
24 25.2 5.0 From NE 45 475 19.8 24
Well blow-out 2E 24° 27' 12.97"E
40° 48' 33.55"N 01/07
Epsilon Fluid
24 25.2 10 for 7h then 5.0
From NE 45 475 19.8 24
Aegean Sea: Oil Spill Modelling Assessment
BMT Cordah Limited 41 February 2016
Scenario Location (Lat/Long) Start
Date Oil Type
Sea
Temp
(°C)
Air Temp
(°C)
Wind Characteristics Spill Characteristics
Speed (m/s)
Direction Bearing
(˚)
Total Quantity Released
(m3)
Release
Rate
(m3/hr)
Release
Duration
(hrs)
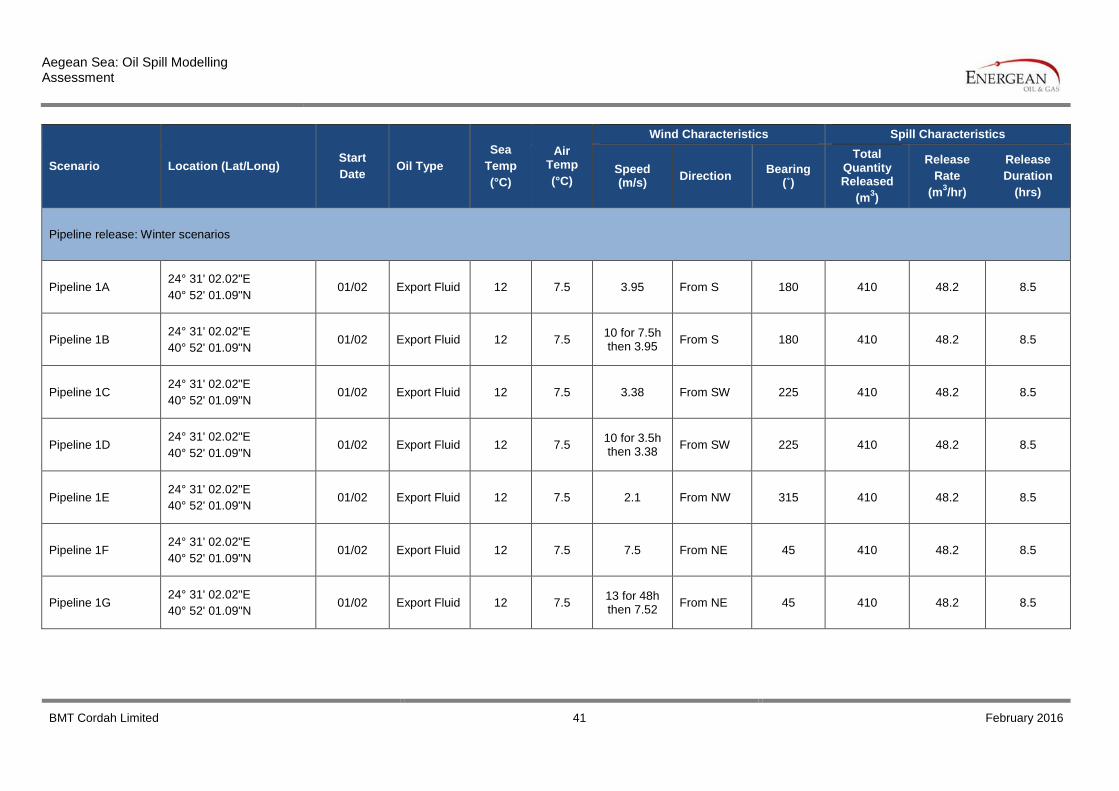
Pipeline release: Winter scenarios
Pipeline 1A 24° 31' 02.02"E
40° 52' 01.09"N 01/02 Export Fluid 12 7.5 3.95 From S 180 410 48.2 8.5
Pipeline 1B 24° 31' 02.02"E
40° 52' 01.09"N 01/02 Export Fluid 12 7.5
10 for 7.5h then 3.95
From S 180 410 48.2 8.5
Pipeline 1C 24° 31' 02.02"E
40° 52' 01.09"N 01/02 Export Fluid 12 7.5 3.38 From SW 225 410 48.2 8.5
Pipeline 1D 24° 31' 02.02"E
40° 52' 01.09"N 01/02 Export Fluid 12 7.5
10 for 3.5h then 3.38
From SW 225 410 48.2 8.5
Pipeline 1E 24° 31' 02.02"E
40° 52' 01.09"N 01/02 Export Fluid 12 7.5 2.1 From NW 315 410 48.2 8.5
Pipeline 1F 24° 31' 02.02"E
40° 52' 01.09"N 01/02 Export Fluid 12 7.5 7.5 From NE 45 410 48.2 8.5
Pipeline 1G 24° 31' 02.02"E
40° 52' 01.09"N 01/02 Export Fluid 12 7.5
13 for 48h then 7.52
From NE 45 410 48.2 8.5

Aegean Sea: Oil Spill Modelling Assessment
BMT Cordah Limited 42 February 2016
Scenario Location (Lat/Long) Start
Date Oil Type
Sea
Temp
(°C)
Air Temp
(°C)
Wind Characteristics Spill Characteristics
Speed (m/s)
Direction Bearing
(˚)
Total Quantity Released
(m3)
Release
Rate
(m3/hr)
Release
Duration
(hrs)
Pipeline release: Summer scenarios
Pipeline 2A 24° 31' 02.02"E
40° 52' 01.09"N 01/07 Export Fluid 24 25.2 2.7 From S 180 410 48.2 8.5
Pipeline 2B 24° 31' 02.02"E
40° 52' 01.09"N 01/07 Export Fluid 24 25.2 3.4 From SW 225 410 48.2 8.5
Pipeline 2C 24° 31' 02.02"E
40° 52' 01.09"N 01/07 Export Fluid 24 25.2 2.4 From NW 315 410 48.2 8.5
Pipeline 2D 24° 31' 02.02"E
40° 52' 01.09"N 01/07 Export Fluid 24 25.2 5.0 From NE 45 410 48.2 8.5
Pipeline 2E 24° 31' 02.02"E
40° 52' 01.09"N 01/07 Export Fluid 24 25.2
10 for 7h then 5.0
From NE 45 410 48.2 8.5

Aegean Sea: Oil Spill Modelling Assessment
BMT Cordah Limited 43 February 2016
Scenario Location (Lat/Long) Start
Date Oil Type
Sea
Temp
(°C)
Air Temp
(°C)
Wind Characteristics Spill Characteristics
Speed (m/s)
Direction Bearing
(˚)
Total Quantity Released
(m3)
Release
Rate
(m3/hr)
Release
Duration
(hrs)
Loading buoy: Summer scenario
Loading buoy 24°31'32.79"E
40°56'2.16"N 01/07 Export Fluid 24 25.2 2.7 From S 180 60 1800 0.033 (2 min)

Aegean Sea: Oil Spill Modelling Assessment
BMT Cordah Limited 44 February 2016