Embed Size (px)
Citation preview

Annalsof WarsawUniversity
of LifeSciences– SGGW
Animal Science No 49Warsaw 2011
Contents
BRZOZOWSKI M., KRYM K. The charac-ter types of the blind guide dogs 5STRZELEC E., NIŻNIKOWSKI R., RÓ-ŻAŃSKI H., KLOCKIEWICZ M., GŁO-WACZ K., CZUB G., DARKOWSKA A., SZYMAŃSKI K., POKROP A. Effect of use of herbal feed additive on coccidian in-vasion level and performance traits in goats
11DZIERŻANOWSKA-GÓRYŃ D., GÓRAL K., GŁOGOWSKI R. The analysis of chin-chilla females reproduction (Chinchilla laniger M.), on the example of Polish bre-eding farm 21
GRUSZCZYŃSKA J., ŁUKASIEWICZ M., GRZEGRZÓŁKA B. Utilization of the se-lected microsatellite sequences in optimizing the mating plan in an experimental fl ock of Ayam Cemani breed 27GRUSZCZYŃSKA J., CZAPLA A. A mole-cular test for the detection of the C295G mu-tation in the T gene responsible for shortened tail and taillessnessin the Pembroke Welsh Corgi 35KLIMASZEWSKI K., HEJDUK L. Ecolo-gical and hydrological aspects of small river catchment management in Nature 2000 site
45

KALETA T., MIELCZARCZYK B. Human – animal relations: the case of two primate species kept at Warsaw Zoo 53KUCZYŃSKA B., PUPPEL K., METERA E., KLIŚ P., GRODZKA A., SAKOWSKI T. Fatty acid composition of milk from Brown Swiss and Holstein-Friesian black and white cows kept in a certifi ed organic farm 61KUCZYŃSKA B., PUPPEL K., METE -RA E., PLEŚNIAK I., GRODZKA A., SAKOWSKI T. Technological usefulness of milk from Brown Swiss and Holstein-Frie-sian black and white cows kept in a certifi ed organic farm 69KUNOWSKA-SLÓSARZ M., MAKOW-SKA A. Effect of breed and season on the boar’s semen characteristics 77KUŹNICKA E., KOŁODZIEJSKA E. The assessment of fattening value of White-head Synthetic Line lambs kept in Ciosny farm in Łódź province 87ŁOPIEŃSKA M., NOWAK Z., CHARON K.M., OLECH W. A comparison of poly-morphism of DQA genes in European bison belonging to two genetic lines: Lowland and Lowland-Caucasian 93MADRAS-MAJEWSKA B., ZAJDEL B., GRYGO M. Section analysis of after born mason bee (Osmia rufa L.) material 103MADRAS-MAJEWSKA B., KAMIŃSKI Z., ZAJDEL B. The survival and the awaking time of the worker bees after carbon dioxide anesthesia and gas treatment with different oxygen and nitrogen concentration 109MADRAS-MAJEWSKA B., ZAJDEL B., BOCZKOWSKA A. The infl uence of nests usage on mason bee (Osmia rufa L.) survival 115MICHALCZUK M., STĘPIŃSKA M., ŁU-KASIEWICZ M. Effect of the initial body weight of Ross 308 chicken broilers on the rate of growth 121NAŁĘCZ-TARWACKA T., ŚWIDERSKI Ł., GRODZKI H. Effect of the age of the fi rst
calving on milk performance and inter--calving period of Polish Holstein-Friesian cows 127PRZYSUCHA T., GRODZKI H., GOŁĘ-BIEWSKI M., SLÓSARZ J. Comparison of body condition score (BCS) and muscularity level results of Charolaise cows 137PRZYSUCHA T., GRODZKI H., GOŁĘ-BIEWSKI M., SLÓSARZ J. Comparison of body condition score (BCS) and muscularity level results of Limousine cows 143PRZYSUCHA T., GRODZKI H., SLÓ-SARZ J., GOŁĘBIEWSKI M. Comparison of body condition score (BCS) and muscu-larity level results of Hereford cows 149RADZIK-RANT A., MAKOWIECKA D., RANT W., ROZBICKA-WIECZOREK A. The coat characteristic of yak maintained in conditions of the Gdańsk zoological garden
155RADZIK-RANT A., ROZBICKA-WIECZO-REK A., CZAUDERNA M., RANT W., KUCZYŃSKA B. The chemical composi-tion and fatty acid profi le in milk of Polish Mountain Sheep and Polish Merino 163RADZIK-RANT A., KUŹNICKA E., RANT W. Indicatory wool production of Żelaźnień-ska strain of Polish Lowland Sheep mainta-ined in semi-open shed and barn 173STRZELEC E., NIŻNIKOWSKI R. SNPs polymorphisms in LGB, CSN3 and GHR genes in fi ve goat breeds kept in Poland 181ZDANOWSKA-SĄSIADEK Ż., SŁOWI-KOWSKA O., MICHALCZUK M., GA-JEWSKA J., KORCZYŃSKI M. Effect of a herbal preparation Prisma Jet on intestinal microfl ora composition and meat quality of broiler chickens 189ŁUKASIEWICZ M., MICHALCZUK M., GŁOGOWSKI R., BALCERAK M., POP-CZYK B. Carcass effi ciency and fatty acid content of farmed pheasants (Phasianus colchicus) meat 199
SERIES EDITORSTadeusz Kaleta
WARSAW UNIVERSITY OF LIFE SCIENCES PRESS
ISSN 1898-8830
PRINT: Agencja Reklamowo-Wydawnicza A. Grzegorczyk, www.grzeg.com.pl
EDITORIAL STAFFJadwiga RydzewskaElżbieta Wojnarowska
In 2007 journal Annals of Warsaw Agricultural University – Animal Science (ISSN 0208-5739) was changed to name to Annals of Warsaw University of Life Sciences – SGGW, Animal Science (ISSN – 1898-8830)


Annals of Warsaw University of Life Sciences – SGGWAnimal Science No 49, 2011: 5–9(Ann. Warsaw Univ. of Life Sc. – SGGW, Anim. Sci. 49, 2011)
The character types of the blind guide dogs
MARIAN BRZOZOWSKI, KATARZYNA KRYMAnimal Breeding and Production Department, Warsaw University of Life Sciences – SGGW
Abstract: The character types of the blind guide dogs. The aim of this study was to determine the character types of the blind guide dogs, in correla-tion with theirs breed, gender and age. The analysis was based on fi nal results of the training prepared by the Polish Association of the Blind. There were no statistical differences when comparing the fi nal examination results (number of points scored) with regard to breed animals’ and their gender. Depen-dence was found between the dogs character types and the correctness of tasks: dogs in sanguine type are the most suitable for specialized training, but in a group of dogs that successfully completed the exam were also choleric dogs – hyperactive and phlegmatic – slow, which are less predisposed to work with man, but through proper training they can work as a guide the blind.
Key words: dog character types, guide dog the blind, dogs training.
INTRODUCTION
Dogs are used in various fields. In each a different type of behaviors is preferred, and each type of behavior suited to the nature of character, classifying it into the appropriate type of activity (work). Cur-rently, dogs are increasingly committed to working in the service of man. (Palmer, 1983; Kuźniewicz and Kuźniewicz, 2003; Ściesiński, 2004). To perform a variety of tasks, the dog must be properly prepared. The importance of the training process is not only to prepare the dog to his future
work but also learn him the appropriate behavior at a work. (Dennison, 2007; Donaldson, 2007). Kind of behavior, and the character type of dog is the basis to allocate it to the appropriate type of work (Coren, 1997). Dogs trained to the needs of the Polish Association of the Blind are matched in terms of physical structure and must have the appropriate mental abilities (Praca zbiorowa, 2009). Guide dog blind man could be any racial or crossbreed dogs when it enters the appropriate training and can be assigned to the person in need (Praca zbiorowa, 2006). Guide dogs must meet certain criteria, both physical and mental (Praca zbiorowa, 2010). Many dog breeds pos-sess such characteristics, include Labra-dors (Milewska-Kuncewicz, 2003) and German Shepherds (Nowicka, 1995).
The aim of this study was to deter-mine the character types, which most often occurs in dogs intended for use as a guide the blind, in correlation to theirs race, gender and age, based on final exam results.
MATERIALS AND METHODS
Materials
The results received by dogs that have completed the final examination success-
6 M. Brzozowski, K. Krym
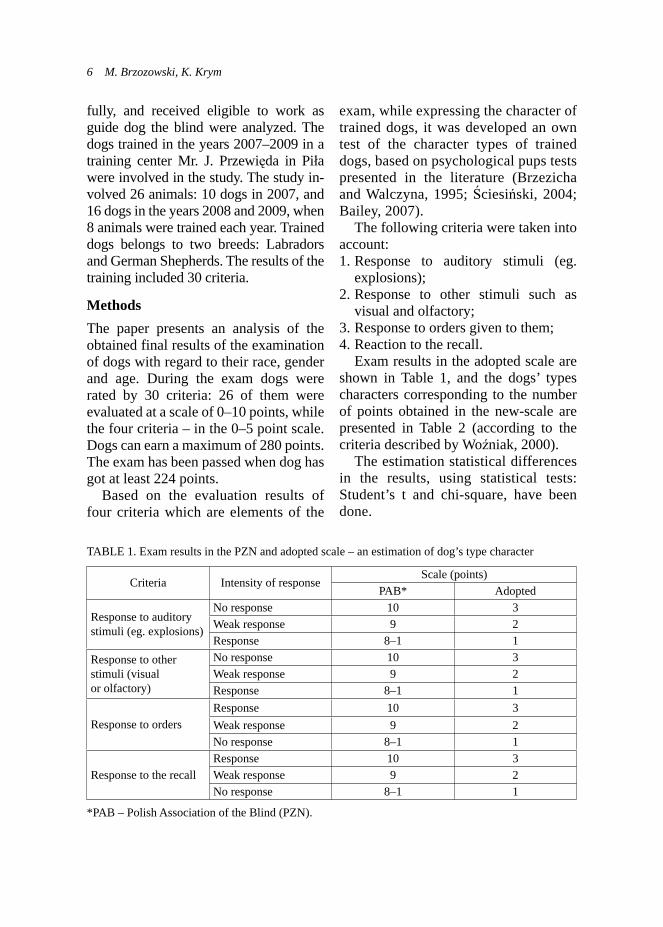
fully, and received eligible to work as guide dog the blind were analyzed. The dogs trained in the years 2007–2009 in a training center Mr. J. Przewięda in Piła were involved in the study. The study in-volved 26 animals: 10 dogs in 2007, and 16 dogs in the years 2008 and 2009, when 8 animals were trained each year. Trained dogs belongs to two breeds: Labradors and German Shepherds. The results of the training included 30 criteria.
MethodsThe paper presents an analysis of the obtained final results of the examination of dogs with regard to their race, gender and age. During the exam dogs were rated by 30 criteria: 26 of them were evaluated at a scale of 0–10 points, while the four criteria – in the 0–5 point scale. Dogs can earn a maximum of 280 points. The exam has been passed when dog has got at least 224 points.
Based on the evaluation results of four criteria which are elements of the
exam, while expressing the character of trained dogs, it was developed an own test of the character types of trained dogs, based on psychological pups tests presented in the literature (Brzezicha and Walczyna, 1995; Ściesiński, 2004; Bailey, 2007).
The following criteria were taken into account:1. Response to auditory stimuli (eg.
explosions); 2. Response to other stimuli such as
visual and olfactory;3. Response to orders given to them;4. Reaction to the recall.
Exam results in the adopted scale are shown in Table 1, and the dogs’ types characters corresponding to the number of points obtained in the new-scale are presented in Table 2 (according to the criteria described by Woźniak, 2000).
The estimation statistical differences in the results, using statistical tests: Student’s t and chi-square, have been done.
TABLE 1. Exam results in the PZN and adopted scale – an estimation of dog’s type character
Criteria Intensity of responseScale (points)
PAB* Adopted
Response to auditory stimuli (eg. explosions)
No response 10 3Weak response 9 2Response 8–1 1
Response to other stimuli (visual or olfactory)
No response 10 3Weak response 9 2Response 8–1 1
Response to ordersResponse 10 3Weak response 9 2No response 8–1 1
Response to the recallResponse 10 3Weak response 9 2No response 8–1 1
*PAB – Polish Association of the Blind (PZN).
The character types of the blind guide dogs 7
RESULTS AND DISCUSSION
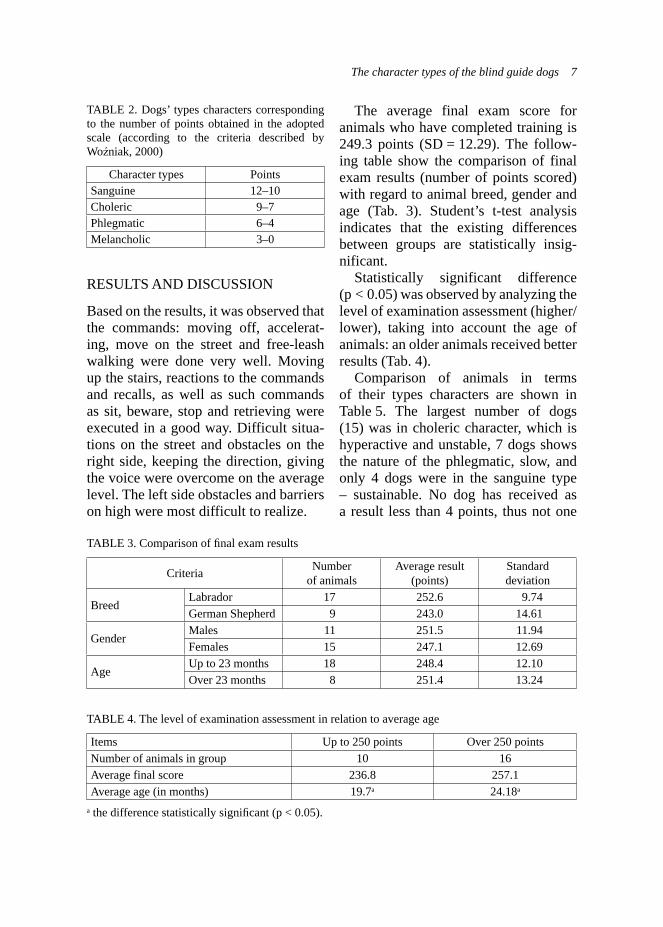
Based on the results, it was observed that the commands: moving off, accelerat-ing, move on the street and free-leash walking were done very well. Moving up the stairs, reactions to the commands and recalls, as well as such commands as sit, beware, stop and retrieving were executed in a good way. Difficult situa-tions on the street and obstacles on the right side, keeping the direction, giving the voice were overcome on the average level. The left side obstacles and barriers on high were most difficult to realize.
TABLE 2. Dogs’ types characters corresponding to the number of points obtained in the adopted scale (according to the criteria described by Woźniak, 2000)
Character types PointsSanguine 12–10 Choleric 9–7 Phlegmatic 6–4 Melancholic 3–0
TABLE 3. Comparison of fi nal exam results
Criteria Numberof animals
Average result (points)
Standarddeviation
BreedLabrador 17 252.6 9.74German Shepherd 9 243.0 14.61
GenderMales 11 251.5 11.94Females 15 247.1 12.69
Age Up to 23 months 18 248.4 12.10Over 23 months 8 251.4 13.24
TABLE 4. The level of examination assessment in relation to average age
Items Up to 250 points Over 250 pointsNumber of animals in group 10 16Average final score 236.8 257.1Average age (in months) 19.7a 24.18a
a the difference statistically signifi cant (p < 0.05).
The average final exam score for animals who have completed training is 249.3 points (SD = 12.29). The follow-ing table show the comparison of final exam results (number of points scored) with regard to animal breed, gender and age (Tab. 3). Student’s t-test analysis indicates that the existing differences between groups are statistically insig-nificant.
Statistically significant difference (p < 0.05) was observed by analyzing the level of examination assessment (higher/lower), taking into account the age of animals: an older animals received better results (Tab. 4).
Comparison of animals in terms of their types characters are shown in Table 5. The largest number of dogs (15) was in choleric character, which is hyperactive and unstable, 7 dogs shows the nature of the phlegmatic, slow, and only 4 dogs were in the sanguine type – sustainable. No dog has received as a result less than 4 points, thus not one

8 M. Brzozowski, K. Krym
demonstrated the melancholic type. Dogs in the type of phlegmatic and choleric qualified as guide dog, because the training process has built with them the appropriate behavior of allowing the pass the final exam (Coren, 1995; Denni-son, 2007; Donaldson, 2007). Performed chi-square test analysis showed that the existing differences between groups are statistically insignificant.
The next table compares the results obtained by certain character types of dogs (Tab. 6). It was found that the high-est score obtained dogs with sanguine type, while the lowest – phlegmatic type dogs. These were the values which differ at a statistically significant level to the population’s average.
CONCLUSIONS
There were no statistical differences when comparing the final examination
results (number of points scored) with regard to breed animals and their gender. Statistically significant difference was observed by analyzing the level of as-sessment examination (higher/lower): an older animals obtained better results. Analysis of the participation of certain types characters of animals regard to their race, gender and age indicates that existing differences between groups are statistically insignificant. It was observed that the highest scores obtained dogs in sanguine type, that are most suitable for specialized training. Theirs results were significantly higher than the average for the population, and the difference was statistically significant (p < 0.05). Dogs of a choleric – hyperactive characters ob-tained results similar to the population’s average, while dogs with a phlegmatic character – slow, obtained final results much lower than the population’s ave-rage (p < 0.01).
TABLE 5. Comparison of animals in terms to their character types
Cryteria Number of animals
Character types Sanguine Choleric Phlegmatic
BreedLabrador 17 3 11 3German Shepherd 9 1 4 4
GenderMales 11 3 5 3Females 15 1 10 4
Age
Up to 23 months 18 2 11 5
Over 23 months 8 2 4 2
TABLE 6. Comparison the results obtained by certain character types of dogs
Population’s average (points)
Character typesSanguine Choleric Phlegmatic
249.3a, B 262.5a 253.4 233.0B
a the difference statistically signifi cant (p < 0.05).B the difference statistically highly signifi cant (p < 0.01).

The character types of the blind guide dogs 9
REFERENCES
BAILEY G., 2008: The perfect puppy. Edit. Ham-lyn.
BRZEZICHA A., WALCZYNA B., 1995: Mój pies i ja. Państwowe Wydawnictwa Rolnicze i Leśne, Warszawa.
COREN S., 1995: The intelligence of dogs. Edit. Bantam.
DENNISON P., 2007: Pozytywne szkolenie psów. Wydawnictwo Rebis, Poznań.
DONALDSON J., 2007: Culture clash. Edit. Ja-mes & Kenneth.
KUŹNIEWICZ J., KUŹNIEWICZ G., 2003: Psy w służbie człowieka. Akademia Rolnicza we Wrocławiu, Wrocław.
MILEWSKA-KUNCEWICZ J., 2003: Golden Retriever. Agencja Wydawnicza MAKO PRESS, Warszawa.
NOWICKA M., 1995: Owczarek niemiecki. Wy-dawnictwo Egros, Warszawa.
PALMER J., 1983: Working dogs. Haynes Publ.PRACA ZBIOROWA, 2006: Regulamin przyzna-
wania psów przewodników i psów towarzy-szących w Polskim Związku Niewidomych. Zarząd Główny Polskiego Związku Niewido-mych, Warszawa.
PRACA ZBIOROWA, 2009: Protokół z egzami-nu wstępnego/końcowego psa przewodnika na 2010 rok. Zarząd Główny Polskiego Związku Niewidomych, Warszawa.
PRACA ZBIOROWA, 2010: Pies przewodnik osoby niewidomej. Centrum Rehabilitacji Biu-ra Zarządu Głównego Polskiego Związku Nie-widomych, Warszawa.
ŚCIESIŃSKI K., 2004: Hodowla psów. Wydaw-nictwo SGGW, Warszawa.
WOŹNIAK J., 2000: Szkolenie psów – porady praktyczne. Wydawnictwo Łowiec Polski, Warszawa.
Streszczenie: Typy charakterów psów prze-wodników niewidomych. Celem badania było określenie rodzaju charakteru psów przewodni-ków niewidomych w korelacji z ich rasą, płcią i wiekiem. Analizę oparto na ostatecznych wy-nikach szkolenia opracowanego przez Polski Związek Niewidomych. Nie zaobserwowano istotnych różnic przy porównaniu wyników egzaminu końcowego (liczba zdobytych punk-tów) w odniesieniu do rasy zwierząt i ich płci. Stwierdzono zależność między różnymi typami charakterów psów: psy w typie sangwinicznym są najbardziej odpowiednie dla szkoleń specja-listycznych, ale w grupie psów, które pomyślnie zaliczyły egzamin były również psy o charak-terze cholerycznym – nadpobudliwe, oraz psy w typie flegmatycznym – powolne, które są mniej predysponowane do pracy z człowiekiem, ale poprzez odpowiednie przeszkolenie mogą pracować jako przewodnicy niewidomych.
MS. received September 2011
Authors’ address:Katedra Szczegółowej Hodowli Zwierząt – SGGWul. Ciszewskiego 802-786 WarszawaPoland


Annals of Warsaw University of Life Sciences – SGGWAnimal Science No 49, 2011: 11–20(Ann. Warsaw Univ. of Life Sc. – SGGW, Anim. Sci. 49, 2011)
Effect of use of herbal feed additive on coccidian invasion level and performance traits in goats
EWA STRZELEC1, ROMAN NIŻNIKOWSKI1, HENRYK RÓŻAŃSKI2, MACIEJ KLOCKIEWICZ3, KRZYSZTOF GŁOWACZ1, GRZEGORZ CZUB1, ALEKSANDRA DARKOWSKA1, KAROL SZYMAŃSKI1,AGNIESZKA POKROP1
1 Division of Sheep and Goat Breeding, Warsaw University of Life Sciences – SGGW2 Faculty of Medicine I, Poznan University of Medical Sciences – PUMS3 Division of Parasitology, Warsaw University of Life Sciences – SGGW
Abstract: Effect of use of herbal feed additive on coccidian invasion level and performance traits in goats. The aim of this study was to investi-gate if use of phytogenic feed additive based of bioactive herbal compounds affected coccidian invasions and production parameters in goats. This research was carried out on a fl ock of adult Boer goats and their offspring owned by the WULS-SGGW’s Sheep and Goat Research Farm in Żelazna. The experimental and control gro-ups were established regarding 14 and 10 does for fecal analysis, respectively as well as 10 and 7 does for milk performance analysis, respecti-vely. Does were at 2–7 lactation and reared 1–2 kids. The addition of herbal feed additive (ADI-COX AP) was applied in feeding of experimental group in doze of 200 g per ton of concentrate. Individual fecal samples were collected directly from the rectum from does (beginning and end of trial time) as well as from kids (end of the experi-ment). The McMaster counting technique and the fl otation method was applied for does and kids respectively. The whole experimental time lasted for approx. 3 months since kidding pick and data regarding milk yield of does and body weights of kids were collected in every 2-weeks period. The results indicated addition of ADICOX AP in preventing of coccidiosis in goats caused several observations regarding experimental group such as: i. advantageous course of lactation curve in
milked goats, ii. higher body weights of kids and higher daily gains during fi rst weeks of rearing, iii. signifi cant lower number of oocytes per gram of faeces in adult goats and iv. decrease of highly infected kids. ADICOX AP demonstrated its high usefulness in prevention of coccidiosis in goats. Moreover, the advantageous trends in production traits, both in adult goats and in kids, gave addi-tional benefi t, which indicated the possibility of use ADICOX AP in standard breeding practice. Additionally this study also indicated the nece-ssity of searching for naturally based feeding so-lutions in animal diets which may be helpful in maintaining parasitic infections and could bring better production yields for breeders.
Key words: goats, phytoncides, feed additive, co-ccidiosis, production performance.
INTRODUCTION
Coccidiosis is a common parasitic dis-ease of the intestinal tracts of animals, which is spread in many farm animal species around the World (Tenter et al., 2002). It is caused by the coccidian pro-tozoa belonging to the genus Eimeria. Coccidiosis is very common in goats and

12 E. Strzelec et al.
its typical symptom is diarrhea, espe-cially in kids. The disease development is affected by several factors regarding environment, management and animal immunity, emphasizing the age of ani-mals especially (Balicka-Ramisz, 1999; Smith and Sherman, 2009). While in fact most of adult goats are vectors and asymptomatic, kids suffer very often from coccidiosis, including death in extreme incidents (Kaba et al., 2007). This characteristic indicates the par-ticular economic losses in goat breeding demonstrated by lower daily gains and lower body weights of young goats.
Prevention of coccidiosis is based on the pharmaceutical coccidiostatic treatments, which are used as the feed additives in animal nutrition (Olejnik et al., 2009). However, their time of use is officially limited by the EU until the end of 2012 (1831/2003/EC regulation, Anon., 2003). This facts caused the need of stimulating the development of alternative products preventing coccidi-osis incidents and one way is to look for the solutions based on the natural active substances.
ADICOX AP (AdiFeed) is the one of such products containing naturally occurring plant ingredients of important biological effects as phytoncides and phytoalexins and may be helpful and efficient to manage coccidiosis in goats and other farm animals as well (Różański and Drymel, 2010). Due to its innovative solution effects of ADICOX AP addition on the level of coccidia infection and some production traits in goats as milk yield and growth development should be also recognized, although such study were presented in a limited number (Rochfort et al., 2008; Cornale et al.,
2011; Ghosh et al., 2011; Malecky et al., 2011; Ringdorfer, 2011).
MATERIAL AND METHODS
Animals. The experiment was carried out in 2010 on Boer goats owned by the Warsaw University of Life Sciences (Poland) and housed at the Sheep and Goat Research Farm in Żelazna. Flock of 24 adult Boer goats was split into experimen-tal (n = 14) and control (n = 10) groups. Classification of does to the proper group took place during 14 days after kidding for each goat. The does were at 2–7 lacta-tion and they were suckled by 1 or 2 kids. The feeding of goats from the experimen-tal group with the addition of ADICOX AP (dose: 200 g per ton of concentrate) started during the 14-days of preparatory phase and was maintained at the same level during the right experimental time, which has started since 15th day after kid-ding and lasted for 3 months. Although the ADICOX AP was designated for the does from the experimental group, their kids might have taken this feed additive unintentionally. Diet regarded follow-ing fodders of the own-farm production as hay, straw and concentrates and goats were fed accordingly to norms (Kowal-ski, 2001). Either goats or kids were kept indoors in barn during the experiment.Fecal samples and their processing. Level of coccidia infection was evalu-ated in adult goats as well as in their kids. Fecal samples were collected directly from the rectum to plastic bags and then stored at 4°C. Fecal samples of does were taken twice during the experi-ment (at the beginning and at the end), whereas the samples from kids were taken once only at the end of experiment.
Effect of use of herbal feed additive on coccidian invasion level... 13
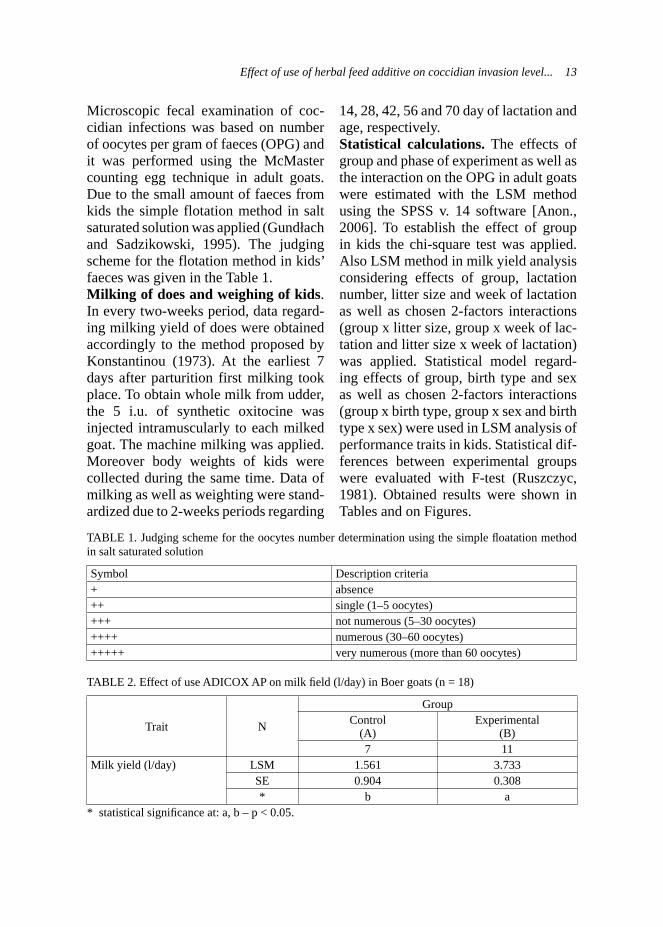
Microscopic fecal examination of coc-cidian infections was based on number of oocytes per gram of faeces (OPG) and it was performed using the McMaster counting egg technique in adult goats. Due to the small amount of faeces from kids the simple flotation method in salt saturated solution was applied (Gundłach and Sadzikowski, 1995). The judging scheme for the flotation method in kids’ faeces was given in the Table 1.Milking of does and weighing of kids. In every two-weeks period, data regard-ing milking yield of does were obtained accordingly to the method proposed by Konstantinou (1973). At the earliest 7 days after parturition first milking took place. To obtain whole milk from udder, the 5 i.u. of synthetic oxitocine was injected intramuscularly to each milked goat. The machine milking was applied. Moreover body weights of kids were collected during the same time. Data of milking as well as weighting were stand-ardized due to 2-weeks periods regarding
14, 28, 42, 56 and 70 day of lactation and age, respectively.Statistical calculations. The effects of group and phase of experiment as well as the interaction on the OPG in adult goats were estimated with the LSM method using the SPSS v. 14 software [Anon., 2006]. To establish the effect of group in kids the chi-square test was applied. Also LSM method in milk yield analysis considering effects of group, lactation number, litter size and week of lactation as well as chosen 2-factors interactions (group x litter size, group x week of lac-tation and litter size x week of lactation) was applied. Statistical model regard-ing effects of group, birth type and sex as well as chosen 2-factors interactions (group x birth type, group x sex and birth type x sex) were used in LSM analysis of performance traits in kids. Statistical dif-ferences between experimental groups were evaluated with F-test (Ruszczyc, 1981). Obtained results were shown in Tables and on Figures.
TABLE 1. Judging scheme for the oocytes number determination using the simple fl oatation method in salt saturated solution
Symbol Description criteria+ absence ++ single (1–5 oocytes) +++ not numerous (5–30 oocytes) ++++ numerous (30–60 oocytes) +++++ very numerous (more than 60 oocytes)
TABLE 2. Effect of use ADICOX AP on milk fi eld (l/day) in Boer goats (n = 18)
Trait N
GroupControl
(A)Experimental
(B)7 11
Milk yield (l/day) LSM 1.561 3.733SE 0.904 0.308* b a
* statistical signifi cance at: a, b – p < 0.05.

14 E. Strzelec et al.
RESULTS AND DISCUSSION
Fecal examination. Significantly lower number of oocytes per gram of faeces was observed in the experimental group in contrary to the control group in adult goats (Fig. 1). Differences within the level of coccidia invasion were also observed between kids accordingly to the group (Fig. 2). Kids from the control group demonstrated higher frequency of infected animals, whereas approx. 33% of kids from the experimental group did not presented any oocytes in faeces. The
kids from the experimental group were not intentionally fed with the ADICOX additive, although they had free access to concentrate feeders like their mothers did.
Very few studies were focused on describing the effect of use of medical treatments on the coccidian menagement in goats (Balicka-Ramisz, 1999). How-ever, it was described by Balicka-Ramisz (1999) that occurrence of oocytes in feaces changes within year and their highest level was presented in March--July and mean value was 1950 OPG
FIGURE 2. Effect of ADICOX AP addition on the coccidian infection level in Boer kids (Χ2(4) = 15.34; p < 0.01; n = 29)
FIGURE 1. Effect of addition of ADICOX AP on the number of oocytes per gram faeces in the adult Boer goats (n = 24, * – p < 0.05)
0
5
10
15
20
25
30
35
40
45
+ ++ +++ ++++ +++++
% control (n = 11)
experimental (n = 18)
3.824 *
3.366 *
0
0.5
1
1.5
2
2.5
3
3.5
4
4.5
control (n = 10) experimental (n = 14)
no o
f ooc
ytes
(log
10)
5325 oocytes
9310 oocytes

Effect of use of herbal feed additive on coccidian invasion level... 15
in adult goats. Own results obtained for kids from control group corresponds indirectly to the high intensity of coccid-ia invasion in kids at 22 500 OPG during period of spring-summer (March-July) reported by Balicka-Ramisz (1999), however different technique was used in own studies.
Summing up, obtained results pre-sented lower number of oocytes per gram of faeces in adult goats as well as important decrease of highly infected
kids in experimental group where the phytogenic feed additive was applied.Production traits – milk yield of does. The milk traits were examined on 18 goats: 7 and 11 goats from the control and experimental group, respectively. Use of ADICOX resulted in higher milk yield in experimental group, which was important for rearing abilities of does from this group (Tab. 3). Trends in milk yield during first stages of lactation in both groups were also studied on raw
TABLE 3. Effect of group on standardized body weights and daily gains in Boer kids (n = 29)
TraitsGroup
Control(A)
Experimental(B)
N 12 17Standardized body weight (kg) at age of:
At birthLSM 3.104 4.213SE 0.338 0.214* B A
14 days LSM 5.507 6.568SE 0.581 0.368
28 daysLSM 8.410 11.026SE 0.755 0.479* B A
42 days LSM 11.854 13.538SE 0.819 0.519
56 days LSM 15.926 15.105SE 1.219 0.773
70 days LSM 16.762 17.825SE 1.686 1.069
Standardized daily gains (kg/day) in periods of:
0–14 days LSM 0.172 0.168SE 0.032 0.020
15–28 daysLSM 0.207 0.318SE 0.044 0.028* b a
29–42 days LSM 0.246 0.179SE 0.052 0.033
43–56 daysLSM 0.291 0.112SE 0.076 0.048* b a
57–70 days LSM 0.060 0.194SE 0.105 0.067
*statistical signifi cance at: A, B – p < 0.01; a, b – p < 0.05

16 E. Strzelec et al.
data. That chart (Fig. 3) presented more beneficial lactation curve for does from the experimental group, although these data presents higher dispersion than the control group.
Milk yield plays a very important role in survival and growth of the young, especially in cattle, sheep and goats as well. It was reported that addition of condensed tannin forages (e.g. L. cor-niculatus) in ewes or supplementation of nicotinic acid in dairy cows could increase milk yield (Rochfort et al., 2008). Other studies described absence of effect of supplementation of garlic and juniper berry in dairy cows (Yang et al., 2006). Such studies on goats are poorly documented. However study of Malecky et al. (2009) indicated that use of monoterpene blend oils in diet expressed absence of effect on milk yield in milk goats. Production traits – body weight and growth performance of kids. Body growth development of kids was exam-ined on the group of 29 kids: 12 and 17
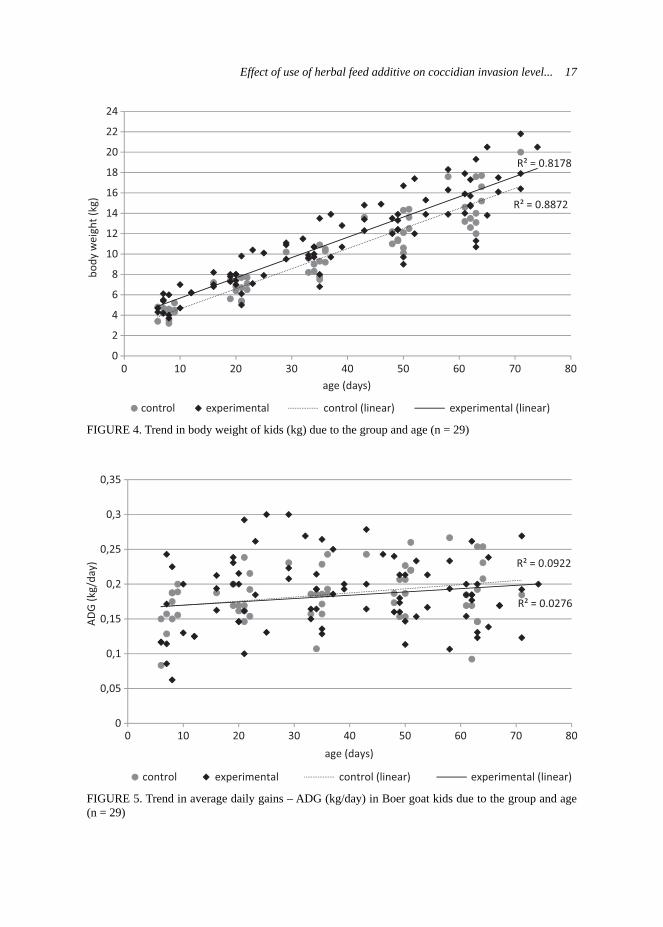
belonging to the control and experimen-tal groups, respectively. The weighing of kids took place at the same time as milk-ing controls of does. Kids from experi-mental groups were statistically heavier (p < 0.01) at birth and at 28th day of age (Tab. 3) than kids from the control group. Generally, kids from the experimental group presented higher body weights during the whole experiment and this trend was demonstrated on the Figure 4. Statistically better results of average daily gains (ADG) were observed in kids from the control group during whole research (Tab. 3), excluding the period of 15–28 day, when the kids from experimental group expressed higher ADG. Analysis of raw data also indicated this trend and it was presented on Figure 5. As it was mentioned previously, the milk yield is strongly correlated with growth develop-ment of the young ruminants (Rochfort et al., 2008), so this was also approved by the own results.
Some studies corresponds also to the herbal additives used in fattening of
FIGURE 3. Trends in milk yields (l/day) during lactation in the Boer goats (n = 18)
R² = 0.3103
R² = 0.0375
0
1
2
3
4
5
6
7
0 10 20 30 40 50 60 70 80
milk
yie
ld (l
/day
)
days of lacta�oncontrol experimentalcontrol (polynomial) experimental (polynomial)
Effect of use of herbal feed additive on coccidian invasion level... 17
FIGURE 4. Trend in body weight of kids (kg) due to the group and age (n = 29)
R² = 0.8872
R² = 0.8178
0
2
4
6
8
10
12
14
16
18
20
22
24
0 10 20 30 40 50 60 70 80
body
wei
ght (
kg)
age (days)
control experimental control (linear) experimental (linear)
FIGURE 5. Trend in average daily gains – ADG (kg/day) in Boer goat kids due to the group and age (n = 29)
R² = 0.0922
R² = 0.0276
0
0,05
0,1
0,15
0,2
0,25
0,3
0,35
0 10 20 30 40 50 60 70 80
AD
G (k
g/da
y)
age (days)
control experimental control (linear) experimental (linear)
18 E. Strzelec et al.
young lambs, calves or finishing bulls. Ringdorfer (2011) reported the absence of effect of use of three types of phy-togenic feed additives on any fattening performance traits as daily gains, dry matter intake or feed conversion in lambs, whereas the statistical (p < 0.001) influ-ence of sex was observed. Better results were observed in cattle. Cornale et al. (2011) reported higher (p < 0.05) daily gains in finishing bulls after supplemen-tation with plant extracts of ginger (Zin-giber officinale) and european stoneseed (Lithospermum officinale), however these results differed due to breed and farm localization. In the study carried out by Ghosh et al. (2011), use of garlic supplementation in feeding of calves in the pre-ruminant stage caused (p < 0.01) higher daily gains, higher feed intake, better quality of feaces and higher costs of feeding.
CONCLUSIONS
Addition of ADICOX AP in preventing of coccidiosis in goats caused several observations due to the experimental group:
1. Significant lower number of oocytes per gram of faeces in adult goats;
2. Decrease of highly infected kids;3. Advantageous course of lactation
curve in milked goats;4. Higher body weights of kids and
higher daily gains during first weeks of rearing.
The ADICOX AP addition demon-strated its high usefulness in prevention of coccidiosis in goats. Moreover, the advantageous trends in production traits, both in adult goats and in kids, gave
additional benefit, which indicated the possibility of use ADICOX AP in stand-ard breeding practice.
Moreover this study also indicated the necessity of researching for naturally based feeding solutions in animal diets which may be helpful in maintaining parasitic infections and bring better pro-duction yields for farmers.
REFERENCES
ANON., 2003: Regulation (EC) No 1831/2003 of the European Parliament and of the Council of 22 September 2003 on additives for use in ani-mal nutrition. OJ L 268, 29–43.
ANON., 2006: Statistical Product and Service Solution base version 14.0 for Windows. SPSS inc. USA. (Manuskrypt).
BALICKA-RAMISZ A., 1999: Studies on coc-cidiosis in goats in Poland. Vet. Parasitol. 81, 347–349.
CORNALE P., TARANTOLA M., LUSSIANA C., TASSONE S., CASTELLINA C, BATTA-GLINI L.M., 2011: Effects of ginger (Zingiber officinale) and european stoneseed (Lhitosper-mum officinale) extracts on performance, meat quality and fatty acid Composition of finishing bulls. Journal of Animal and Veterinary Advan-ces, 10 (9), 1127–1132.
GHOSH S., MEHLA R.K., SIROHI S.K., TO-MAR S.K., 2011. Performance of crossbred calves with dietary supplementation of garlic extract. Journal of Animal Physiology and Ani-mal Nutrition 95, 449–455.
GUNDŁACH J.L., SADZIKOWSKI A.B., 1995: Diagnostyka i zwalczanie inwazji pasożytów zwierząt. WAR Lublin.
KABA J., KLOCKIEWICZ M., OSIŃSKA B., 2007: Kokcydioza u kóz. Życie Weterynaryjne 6, 497–499.
KONSTANTINOU A., 1973: Vergleichende Untersuchungen zur Methodik ueber die Mil-chleistungserfassung bei Fleischschafen sowie ueber die Zusammensetzung der Milch und die Auswirkungen der Milchleistung im Ver-lauf der Laktation auf die Wollfeinheit von Deutchen Schwarzkoepfigen Fleischschafen und Finnkreuzungen. Institut fuer Tierzucht u.
Effect of use of herbal feed additive on coccidian invasion level... 19
Haustiergenetik der Justus Liebig Universitaet Giessen.
KOWALSKI M., 2001: Normy żywienia kóz mlecznych według INRA. w: Normy żywienia bydła, owiec i kóz. Instytut Zootechniki w Kra-kowie, wyd. II, Kraków.
MALECKY M., BROUDISCOU L.P., SCHIDE-LY P., 2009. Effects of two levels of mono-terpene blend on rumen fermentation, terpene and nutrient flows in the duodenum and milk production in dairy goats. Animal Feed Science and Technology 154, 24–35.
OLEJNIK M., SZPRENGIER-JUSZKIEWICZ T., ŻMUDZKI J., 2009: Kokcydiostatyki w żywności pochodzenia zwierzęcego i pa-szach – nowe unormowania prawne. Medycy-na Weterynaryjna 65(12), 807–811.
RINGDORFER F., 2011: Effect of phytogenic feed additives on performance parameters of fattening lambs. Book of Abstracts of the 62nd Annual Meeting of the European Federation of Animal Science Stavanger, Norway, 29 August – 2 September 2011. Book of Abstracts No. 17(2011), 45.
ROCHFORT S., PARKER A.J., DUNSHEA F.R., 2008: Plant bioactives for ruminant health and productivity. Phytochemistry, 69, 299–322.
RUSZCZYC Z., 1981: Metodyka badań zootech-nicznych. PWRiL, Warszawa.
RÓŻAŃSKI H., DRYMEL W., 2010: AdiCox jako źródło fitoaleksyn i fitoncydów. Polskie Drobiarstwo 12, 17–20.
SMITH M.C., SHERMAN D.M., 2009: Goat Me-dicine. Lea & Febiger, 312–319.
TENTER A.M., BARTA J.R., BEVERIDGE I., DUSZYNSKI D.W., MEHLHORN H., MOR-RISON D.A., ANDREW THOMPSON R.C., CONRAD P.A., 2002: The conceptual basis for a new classification of the coccidian. Interna-tional Journal for Parasitology, 32, 595–616.
YANG W.Z., CHAVES A.V., HE M.L., BEN-CHAAR C., MCALISTER T.A., 2006: Effect of monensin and essential oil on feed intake, ruminal fermentation, milk yield and composi-tion of lactating dairy cows. Canadian Journal of Animal Science, 86, 598, Abstr.
Streszczenie: Wpływ stosowania ziołowego dodat-ku paszowego na poziom inwazji kokcydiów oraz na wskaźniki użytkowe u kóz. Celem badawczym było określenie wpływu roślinnych dodatków
paszowych bazujących na bioaktywnych składni-kach na poziom zainfekowania kokcydiami oraz na wskaźniki produkcyjne u kóz. Badania pro-wadzono na stadzie kóz burskich wraz z potom-stwem, będącym w posiadaniu Doświadczalnej Fermy Owiec i Kóz, RZD Żelazna, SGGW. Sta-do kóz podzielono na dwie grupy: doświadczalną i kontrolną, w których uwzględniono odpowiednio w analizie kału 14 i 10 matek, a w analizie cech mlecznych – 10 i 7 matek kozich. Kozy znajdo-wały się w 2–7 laktacji i odchowywały 1–2 koźląt. W żywieniu grupy doświadczalnej zastosowano dodatek roślinnej mieszanki ziołowej (ADOCPX AP) w dawce 200 g/tonę paszy treściwej. Do-świadczenie prowadzono przez 3 kolejne miesią-ce od szczytu wykotów, rejestrując dane co dwa tygodnie: poziom mleczności kóz oraz masy ciała koźląt. W żywieniu kóz użyto pasz pochodzących z gospodarstwa w dawkach wg norm (Kowalski, 2001). Próby kału pobierano indywidualnie bez-pośrednio z odbytu, przy czym u kóz dorosłych próbki pobierano dwa razy (na początku oraz na końcu doświadczenia), a u koźląt tylko przy za-kończeniu doświadczenia. Stopień zainfekowa-nia kóz dorosłych określono metodą McMastera, podczas gdy u koźląt zastosowano metodę flotacji w nasyconym roztworze NaCl. Przeprowadzone badania pozwoliły zauważyć, że zastosowanie preparatu ADICOX AP w profilaktyce kokcydio-zy u kóz spowodowało w grupie doświadczalnej: 1) uzyskanie wyższej produkcji mleka u kóz ma-tek, 2) uzyskanie wyższych mas ciała koźląt oraz wyższych przyrostów masy ciała w trakcie począt-kowego okresu odchowu, 3) istotne zmniejszenie liczby oocyst w 1 g kału u kóz dorosłych, oraz 4) korzystne oddziaływanie na zmniejszenie stop-nia zainfekowania kokcydiami u koźląt. Na pod-stawie przeprowadzonych badań można stwierdzić wysoką przydatność preparatu ADICOX AP w pro-filaktyce kokcydiozy u kóz. Ponadto polepszenie cech produkcyjnych stanowi dodatkowy atut prze-mawiający za wprowadzeniem tego dodatku do standardowego użycia. Niniejsza praca wskazuje także na możliwość poszukiwania takich dodatków paszowych opartych na naturalnych składnikach, które mogłyby zarówno pomóc w opanowaniu in-fekcji pasożytniczych, jak i podnosić wyniki pro-dukcyjne u zwierząt hodowlanych.
MS. received September 2011

20 E. Strzelec et al.
Authors’ addresses:Ewa Strzelec, Roman Niżnikowski, Krzysztof Głowacz, Grzegorz Czub, Aleksandra Dar-kowska, Karol Szymański, Agnieszka PokropWydział Nauk o Zwierzętach – SGGWZakład Hodowli Owiec i Kózul. Ciszewskiego 802-786 WarszawaPolandHenryk RóżańskiUniwersytet Medyczny im. K. Marcinkowskiego w Poznaniu
Collegium MaiusWydział Lekarski 1Katedra Medycyny Społecznejul. Fredry 1061-701 PoznańPolandMaciej KlockiewiczWydział Medycyny Weterynaryjnej – SGGWZakład Parazytologii i Chorób Inwazyjnychul. Ciszewskiego 802-786 WarszawaPoland

Annals of Warsaw University of Life Sciences – SGGWAnimal Science No 49, 2011: 21–26(Ann. Warsaw Univ. of Life Sc. – SGGW, Anim. Sci. 49, 2011)
The analysis of chinchilla females reproduction(Chinchilla laniger M.), on the example of Polish breeding farm
DANUTA DZIERŻANOWSKA-GÓRYŃ1, KATARZYNA GÓRAL2,ROBERT GŁOGOWSKI1
1Department of Animal Breeding, Warsaw University of Life Sciences – SGGW,2Department of Genetics and Animal Breeding, Warsaw University of Life Sciences – SGGW
Abstract: The analysis of chinchilla females reproduction (Chinchilla laniger M.), on the example of breeding farm. Reproduction re-sults of chinchilla females from 1997–2010, were collected on selected Polish breeding farm, and evaluated by means of typical indices. The comparison of monthly births distribution led to conclusion, that pups are born on the farm thro-ughout the year with varying frequency. There was a signifi cant difference between the litter number in winter and summer, although it seems probable that it was not a seasonal tendency but a consequence of maintenance and husbandry. The breeding of chinchillas in optimal environmental conditions likely leads to improved domestica-tion and reproduction.
Key words: chinchilla, reproduction, domesti-cation
INTRODUCTION
Chinchillas are polyestrous herbivores, reaching the sexual maturity in the age of 6 months. Long pregnancy, lasting up to 111 days and small litters cause that breeders aspire to obtain two births per year from female. Good husbandry effects depend, above all, on reproduc-tion results. The size of farm chinchilla litters is currently strongly diversified.
According to the literature, the number of progeny in the litter varies from 1 to 6 (Barabasz, 2001).
Chinchilla’s polyestrous reproduc-tion cycles show seasonality symptoms (Sulik et al., 2001). The reproduction performance of chinchillas depends on the farm environment. At the wild, the duration of chinchilla reproductive cycles relies directly on the season, so pups are usually born in the period most abundant in food. In the highland climate of Andes, the typical reproduction time for chinchillas occurs between April and September, which complies to the period from early spring till summer, in Euro-pean conditions (Gromadzka-Ostrowska, 1998).
There are several reports of chinchil-las reproduction seasonality in Poland, however it is still unclear, if over one hundred years of the reproduction of chinchillas in captivity diminished the seasonality of births in particular periods of the year. The aim of this study was to evaluate the results of chinchilla females reproduction results on the selected breeding farm and to describe the annual schedule of births.
22 D. Dzierżanowska-Góryń, K. Góral, R. Głogowski
MATERIAL AND METHODS
The data was collected for fourteen consecutive years (1997–2010) on the random chinchilla breeding farm, located in central Poland. The farm was established in 1996 on the basis of 4 chinchilla families. In 2002 it gained the status of reproduction farm and since then detailed reproduction records were stored and evaluated.
Animals were housed in two rooms, in polygamy sets of cages (4 females – 1 male) coupled in four levels. Females had individual rooms while the male shared the cage with females, moving through the corridor, having free access to each female. All females had a neck collar, preventing from leaving the cage. Since 2005, animals were housed without bedding, with moved drawers, which appears less labor consuming. A necessary equipment in the cage consists of automatic feeder, the dust bath tub and the teeth wiping stones. Animals were fed with dry pellets with the access to hay. Once a week a mix-ture of herbs, cereals and rosehips was offered. Drinking water was constantly supplied.
Data were processed with one way ANOVA analysis of variance, performed in SPSS Statistics 17 software (SPSS, Poland). The distribution of means was tested with t-test. Differences were con-sidered significant at P < 0.05.
RESULTS AND DISCUSSION
Table 1 presents basic indicators of the reproduction of chinchilla females on the farm from since the beginning of animals mating in 1997. It can be noted, that the
growing experience of the breeder result-ed in improved reproduction results. The total number of progeny increased every year. In 1997, 90 pups were born from 60 females with 74 weaned (82%). Howev-er, in 2000 89 pups were weaned (89%), and in 2006 the percentage of weaned pups reached 95.26% (Tab. 1).
The mortality before weaning ranged from 4.74 to 17.78%. Different authors report mortality rate from 10.4 to 25.1% (Sulik and Barabasz, 1995; Felska et al., 2002; Seremak and Sulik, 2002b). In 1997–1998 weaning index was visibly low (82%). It can be likely explained with the fact, that animals were just pur-chased and the breeder didn’t have the possibility of assessing female’s repro-ductive value. In consecutive years most indicators improved which confirms former notion.
The number of litters and total progeny count showed continuous growth. Conse-quently, the number of infertile females decreased with reduced mortality of young animals. Seremak and Sulik (2003) reported average annual mortality at 19%, with the highest value reaching 25.1% correlated with low number of litters.
In 2002, 4.08 pups per female were born with 3.53 pups weaned. The fol-lowing years show a slight decrease in the number of pups born, however the number of weaned pups was constantly > 3. These are higher values than those reported by Sulik and Barabasz (1995), who reported the fertility of the herd as 2.4 pups born and 2.09 weaned from the female per year. However, there are reports of 3.46 pups born and 3.05 pups weaned from the female per year from females imported from Denmark (Felska and Brzozowski, 2001).

The analysis of chinchilla females reproduction (Chinchilla laniger M.)... 23
TAB
LE 1
. The
repr
oduc
tion
char
acte
ristic
s of c
hinc
hilla
fem
ales
(199
7–20
10)
1997
1998
1999
2000
2001
2002
2003
2004
2005
2006
2007
2008
2009
2010
Num
ber o
f fem
ales
6060
6060
6060
6072
7286
102
102
102
102
Num
ber o
f bor
n pu
ps90
167
211
191
230
245
219
271
268
232
300
326
293
342
Num
ber o
f wea
ned
pups
7413
718
117
119
121
220
225
624
622
127
430
727
831
2
% o
f wea
ned
pups
82.2
282
.04
85.7
889
.53
83.0
486
.53
92.2
494
.46
91.7
995
.26
91.3
394
.17
94.8
891
.23
Aver
age
litte
r siz
e1.
761.
881.
951.
842.
132.
012.
012.
041.
931.
902
1.86
2.09
2.2
Pups
per
fe
mal
ebo
rn1.
502.
783.
523.
183.
834.
083.
653.
763.
723.
222.
943.
192.
873.
35
wea
ned
1.23
2.28
3.02
2.85
3.18
3.53
3.37
3.56
3.42
3.06
2.67
32.
723.
06
Num
ber o
f litt
ers
5189
108
104
108
122
109
133
139
122
150
175
140
155
Num
ber o
f litt
ers f
rom
fem
ale
0.85
1.48
1.8
1.73
1.8
2.03
1.82
1.85
1.93
1.69
1.47
1.72
1.37
1.52
The size of the litter at birth is an essential parameter, influencing the annual reproduction results on the farm. In the present study high values of this index were obtained. During last decade it reached from 1.76 to 2.13, which can be considered satisfying, not differing from the data published in other reports (1.98 – Seremak and Sulik, 2003). Neverthe-less there are reports of 1.81 to 2.36 litter size at birth (Socha and Wrona, 2000). It should be noted, that the potential of chinchilla females reproduction is high. Jarosz and Rżewska (1996) report 4 pups born in the litter. In the estrous phase about 4 follicles develop, so in optimal conditions the size of the litter can be 4.
The number of litters from female grew from 0.85 in 1997 to 2.03 in 2002. This value is the highest on this farm and higher than that reported by other authors. Sulik and Barabasz (1995) mentioned 1.5 litter per year, Felska and Brzozowski (2001) – 1.59 for imported chinchillas. Barabasz et al. (2000) how-ever, reported 1.54–1.9 litters per year on examined farms. 2 litters from the female per year is beneficial and in the accord-ance with the natural annual rhythm of animals. Long pregnancy, low fertility and the numerous litters from females results in poor profitability of breeding of chinchillas. However, three births per year can lead to excessive exhaust of the female organism and cease the reproduc-tion activity.
The second studied aspect was the seasonal pattern of births in chinchilla. Table 2 presents the monthly distribu-tion of births as a % of the total annual number of litters, calculated for years 2002–2010 (the breeding value estima-tion period on the farm). There were sig-

24 D. Dzierżanowska-Góryń, K. Góral, R. Głogowski
nificant differences in all months of the year and among reproduction years. Pups were born every month of the year, with the increased tendency in March, April, July and August. The lowest values were recorded for January.
Results of the analysis of reproduction indices, presented in Table 3 are similar to those, reported by Seremak (2007). The lowest number of litters were observed in January and December, whereas the most of births occurred in March/April and July/August (P < 0.01). Signifi-cantly lower performance (P < 0.05) was observed in October, November and December. However it should be noted, that there were no overall significant decrease observed in reproduction on the farm in the analyzed period. The differ-ences in the number of pups at birth and weaning were not significant (Tab. 3).
Jarosz and Rżewska (1996), described the increased period of chinchillas mating activity in Poland from Novem-ber till May, with the particular inten-sity in January and February. Moreover, animals reared during winter in heated rooms had a distinct seasonal charac-
ter of the reproduction. Nevertheless, females reared in controlled tempera-ture were sexually active through all the year. Gromadzka-Ostrowska (1998) reported chinchilla reproduction time in Poland from November till April with the highest intensity in March. Consider-ing 111 days of pregnancy, the intensive births last from March till August.
However, the high percentage births was also observed in Autumn months but not in a regular pattern (October, 2003; September 2005; November 2008 – Tab. 2). The plausible explanation of the differences in the reproduction can be husbandry and housing conditions on the farm. With the constant light program, atavistic intensification of reproduction due to the elongation of the day tends to disappear.
CONCLUSIONS
We would like to conclude, that the reproduction results on chinchilla farms depend largely on the proper husbandry and housing methods. It seems likely, that there is a distinct mitigation of the
TABLE 2. The percentage of litters (% of the total number of litters)
2002 2003 2004 2005 2006 2007 2008 2009 2010January 4.92 4.59 2.26 6.47 4.10 5.33 3.43 4.29 3.23February 7.38 8.26 7.52 2.88 2.46 8.67 6.86 5.71 6.45March 18.03 11.93 6.77 5.76 13.93 12.67 8.57 13.57 8.39April 7.38 13.76 12.78 9.35 12.30 8.67 10.86 7.86 13.55May 6.56 8.26 10.53 12.95 8.20 8.67 7.43 10.00 6.45June 10.66 6.42 9.02 7.19 7.38 12.67 7.43 6.43 7.74July 12.30 5.50 10.53 6.47 13.93 8.00 9.14 15.00 13.55August 5.74 6.42 9.77 16.55 6.56 12.00 11.43 11.43 8.39September 7.38 8.26 9.02 10.07 9.84 10.00 9.71 6.43 7.74October 6.56 13.76 2.26 7.91 4.92 7.33 8.57 5.71 8.39November 8.20 7.34 9.77 8.63 9.02 2.67 10.86 7.14 6.45December 4.92 5.50 9.77 5.76 7.38 3.33 5.71 6.43 9.68

The analysis of chinchilla females reproduction (Chinchilla laniger M.)... 25
seasonal pattern in chinchillas reproduc-tion activity due to continuous domesti-cation.
REFERENCES
BARABASZ B., 2001: Szynszyle. Hodowla i użytkowanie. PWRiL, Warszawa.
BARABASZ B., FORTUŃSKA D., BIENIEK J., 2000: Ocena intensywności użytkowania roz-płodowego samic szynszyli. Zesz. Nauk. AR Kraków 369(35), 121–133.
GROMADZKA-OSTROWSKA J., 1998: Stu-dia nad fizjologią szynszyli ze szczególnym uwzględnieniem rozrodu i odporności. AR Kraków, zeszyt 238. Rozprawa habilitacyjna.
FELSKA L., BRZOZOWSKI M., 2001: Porów-nanie wyników rozrodu trzech grup genetycz-nych szynszyli. Zeszyty Naukowe PTZ 58: 31–38.
FELSKA L., BRZOZOWSKI M., RZEWUSKA E., 2002: Wyniki rozrodu szynszyli w zależno-ści od poziomu ustawienia klatek i natężenia światła. Zesz. Nauk. PTZ, 64, 97–102.
JAROSZ S., RŻEWSKA E., 1996: Szynszyle, chów i hodowla. PWRiL, Warszawa.
SULIK M., SEREMAK B., BIELIŃSKA A., MIELEŃCZUK G., 2001: Intensywność użyt-kowania rozpłodowego samic szynszyli na wy-branej fermie na Pomorzu Zachodnim. Zesz. Nauk. PTZ, 58,73–80.
SULIK M., BARABASZ B., 1995: Porówna-nie systemów utrzymania rozpłodowego na przykładzie wybranych ferm. Zesz. Nauk. AR w Krakowie 297, 159–165.
SEREMAK B., SULIK M., 2002a: Sezonowa ak-tywność rozrodcza samic szynszyli na wybra-nych fermach. Zesz. Nauk. PTZ, 64, 89–96.
SEREMAK B., SULIK M., 2002b: Charaktery-styka wskaźników użytkowania rozrodcze-go szynszyli na przykładzie wybranej fermy 1997–2000. Acta Scient. Polon., Zootechnica, 1 (1–2), 139–146.
SEREMAK B., SULIK M., 2003: An attempt to determine causes of lowered values of bre-eding indices on a chinchilla farm. Scientifur, 26(3), 75–78.
SEREMAK B., 2007: Wybrane aspekty rozrodu szynszyli (Chinchilla laniger M.) w chowie fer-mowym. AR Szczecin. Rozprawa habilitacyjna.TA
BLE
3. C
ompa
rison
of r
epro
duct
ion
resu
lts
Inde
xJa
nuar
yFe
brua
ryM
arch
Apr
ilM
ayJu
neJu
lyA
ugus
tSe
ptem
ber
Oct
ober
Nov
embe
rD
ecem
ber
15.
9A1.
88.
73.
315
.0B
b4.
714
.8B
b3.
812
.13.
111
.63.
514
.6B
b5.
013
.9B
b5.
812
.12.
810
.0a
4.1
10.8
a4.
09.
0a3.
3
212
.24.
318
.16.
329
.38.
430
.38.
823
.36.
523
.38.
928
.78.
929
.711
.524
.75.
419
.08.
720
.08.
918
.76.
4
311
.74.
216
.25.
226
.47.
628
.37.
822
.06.
121
.18.
425
.77.
927
.410
.423
.34.
918
.48.
118
.28.
817
.66.
8
1 –
the
num
ber o
f litt
ers
2 –
the
num
ber o
f pup
s bor
n3
– th
e nu
mbe
r of p
ups w
eane
dva
lues
are
mea
ns ±
stan
dard
dev
iatio
nva
lues
with
diff
eren
t upp
er c
ase
supe
rscr
ipt l
ette
rs a
re si
gnifi
cant
at P
< 0
.01
valu
es w
ith d
iffer
ent l
ower
cas
e su
pers
crip
t let
ters
are
sign
ifi ca
nt a
t P <
0.0
5

26 D. Dzierżanowska-Góryń, K. Góral, R. Głogowski
SOCHA S., WRONA A., 2000: The analysis of the seasonal character of the chinchilla (Chin-chilla velligera M.) reproduction. Scientifur, 24(4), 49–52.
Streszczenie: Analiza wyników reprodukcyj-nych samic szynszyli (Chinchilla laniger M.) na przykładzie polskiej fermy reprodukcyj-nej. W pracy dokonano analizy ważniejszych wskaźników reprodukcyjnych samic szynszyli zebranych na wybranej fermie reprodukcyjnej w latach 1997–2010. Porównanie rozkładu oce-nianych wartości w poszczególnych miesiącach pozwoliło stwierdzić, że młode rodzą się z róż-nym natężeniem przez cały rok. Liczba miotów uzyskanych w poszczególnych miesiącach roku różniła się istotnie pomiędzy okresem zimo-wym a letnim, jednak wydaje się że zmiany te nie noszą znamion sezonowości, a są wynikiem zróżnicowania warunków utrzymania i obsługi na fermie. Jest zatem prawdopodobne, że chów szynszyli w optymalnych warunkach środowi-skowych spowoduje pogłębienie udomowienia
i dalsze wyrównanie wskaźników reprodukcyj-nych.
MS. received September 2011
Authors’ addresses:Danuta Dzierżanowska-Góryń,Robert GłogowskiKatedra Szczegółowej Hodowli Zwierząt – SGGWZakład Hodowli Zwierząt Futerkowych i Drobnego Inwentarza92-786 Warszawaul. Ciszewskiego 8Polande-mail: [email protected]
Katarzyna GóralKatedra Genetyki i Ogólnej Hodowli Zwierząt – SGGWul. Ciszewskiego 802-786 WarszawaPoland
Annals of Warsaw University of Life Sciences – SGGWAnimal Science No 49, 2011: 27–34(Ann. Warsaw Univ. of Life Sc. – SGGW, Anim. Sci. 49, 2011)
Utilization of the selected microsatellite sequences in optimizing the mating plan in an experimental flock of Ayam Cemani breed
JOANNA GRUSZCZYŃSKA1, MONIKA ŁUKASIEWICZ2,BEATA GRZEGRZÓŁKA11Department of Genetics and Animal Breeding, Warsaw University of Life Sciences – SGGW2Section of Poultry Breeding, Department of Animal Breeding, Warsaw University of Life Sciences – SGGW
Abstract: Utilization of the selected microsatellite sequences in optimizing the mating plan in an expe-rimental fl ock of Ayam Cemani breed. The parental fl ock initially included 2 cocks and 9 hens, that ori-ginated from different breeding farms, and then the following F1 generation included 42 birds (15 hens and 27 cocks). The experimental fl ock of Ayam Ce-mani breed was bred at the Poultry Farm of the Uni-versity of Life Sciences in Wilanów-Obory. Owing to the specifi c character of the experiment, the following microsatellite sequences were selected based on literature data: MCW0145, MCW0184, MCW0210, LEI0071, and ADL0306, all being lin-ked with the body weight of hens (Atzmon et al., 1998; Atzmon et al., 2008; Weissmann et al., 1998; Tatsuda and Fujinaka, 2001). The earlier investiga-tions demonstrated that the microsatellite sequences investigated in chicken of the Ayam Cemani breed were polymorphic (Gruszczyńska and Łukasie-wicz, 2010). Results of molecular analyses enabled determining the genetic distance between all pairs of birds in the fl ock. It was demonstrated that the chosen microsatellite sequences might be success-fully used as genetic markers in the tests concerning chicken origin. The method involving the use of mi-crosatellite sequences in order to determine the ge-netic distance and then to optimize the mating plan turned out to be successful, for in the experimental fl ock the hatchability from set eggs increased to a highly signifi cant extent from 50.1% to 74.1%.
Key words: Ayam Cemani breed, microsatellite sequences, genetic distance, mating plan optimi-zation.
INTRODUCTION
Ayam Cemani is a rare black breed of chickens originating from Indonesia. It was first time imported into Europe in 1998 by a Dutch breeder Jan Steverink. The population of Ayam Cemani in Europe is small, they are usually bred as ornamental chickens.
The choice of polymorphic loci, suit-able for genetic analysis must be preced-ed by many tests on the ground of which the level of heterozygosity (HE > 0.6 and PIC > 0.6), allele frequency, mutation frequency, the possibility of correct geno-typing as well as a risk of committing the errors will be, inter alia, determined. Microsatellite sequences are short tandem repeats (STRs), consisting of two-, three-,and four-nucleotide motives. They are usually located in the non-coding regions of the genome. They are commonly used in the molecular analysis of animal origin. The polymorphic DNA microsatellites are preferred markers in pedigree control in human as well as in many animal species (Freis et al., 1990; Bowling et al., 1997; Jamieson and Taylor, 1997; Schnabel et al., 2000; Fung et al., 2002; Ganai and
28 J. Gruszczyńska, M. Łukasiewicz, B. Grzegrzółka
Yadav, 2005; Wenk et al., 2005; Oliveira et al., 2006; Radko, 2008; Riojas-Valdes et al., 2009). The microsatellite sequences are also used in studies addressing the reconstitution of species, as well as in order to determine the genetic relationship between animals and to perform ma tings that would assure the greatest genetic diversity in a herd and prevent homozy-gosity increase in the population.
MATERIAL AND METHODSAnimal material and molecular analysis
The experimental flock of Ayam Cemani breed was bred at the Poultry Farm of the University of Life Sciences in Wilanów--Obory. Initially, the flock included 2 cocks and 9 hens originating from dif-ferent breeding farms (from 1 German breeder: 1♂ and 5♀, and from 1 Dutch breeder: 1♂ and 4♀). The obtained offspring generation included 42 birds (15 hens and 27 cocks). In the first year of the study, results of the hatchability of the imported birds were not satisfactory, which might have been due to high ho-mozygosity between the birds. Hence, an attempt was made to construct a mating plan for the experimental flock of Ayam Cemani breed, based on the specified genetic diversity. Following the plan, 13 pairs (at the age of 1 year) were mated and kept in separate pens throughout the reproductive period. The eggs obtained were incubated in weekly sets of 60 eggs.
The method used to determine the genetic diversity of the investigated population of birds included 5 microsatel-lite sequences (MCW0145, MCW0184, MCW0210, LEI0071, ADL0306). Owing to the specific character of the experi-
ment, the microsatellite sequences were chosen based on literature data, that in chicken were linked with the body weight (Atzmon et al., 1998; Atzmon et al., 2008; Weissmann et al., 1998; Tatsuda and Fuji-naka, 2001). The earlier research dem-onstrated that microsatellite sequences analyzed in the investigated flock of Ayam Cemani breed were polymorphic (Gruszczyńska and Łukasiewicz, 2010). The values obtained for expected het-erozygosity (HE), observed heterozygos-ity (HO), and Polymorphic Information Content (PIC) confirm the usability of the selected microsatellite sequences as mark-ers being a convenient tool in the genetic diversity analysis of a chicken population (Gruszczyńska and Łukasiewicz, 2010).
Statistical analysis of results
Based on the results of the previous study (Gruszczyńska and Łukasiewicz, 2010): the frequency of alleles and genotypes, expected heterozygosity (HE), observed heterozygosity (HO), Polymorphic In-formation Content (PIC), and the exact test of Hardy-Weinberg equilibrium were calculated with the Cervus 3.03. Programme (Kalinowski et al., 2007). Additional determinations were made for the probability of exclusion (PE) and combined probability of exclusion (CPE) (Wenk et al., 2005) and genetic distance between the individuals (Nei, 1972):1. The a priori probability of exclusion
PE was obtained using the formula by Evett and Weir (1998): PE = (HO)2 [1 – 2 HO (1 – HO)2]
where HO is the observed frequency of heterozygotes in database of the off-spring group (n = 42) and the whole population (n = 53).

Utilization of the selected microsatellite sequences in optimizing... 29
2. The Combined exclusion probability (CPE) was calculated using the for-mula (Jamieson and Taylor., 1997; Wenk et al., 2005):
CPE = 1 – (1 – PE1)(1 – PE2)(1 – PE3)(1 – PE4)(1 – PE5)
3. Nei’s standard genetic distance ena-bling the determination of the genetic diversity between pairs of individuals originating from the common founder population, was computed using the following formula (Nei, 1972):
where fFi and fBi denote frequencies of the i-th allele in respectively F and B population.
2 2ln
Fi Bii
FB
Fi Bii i
f fd
f f
The results achieved were analyzed with the use of a matrix of distances determined between particular males and females based on the frequency of alleles occurring in the 5 analyzed loci.
The values obtained for all combina-tions of pairs enabled optimizing the mating plan. In this way, pairs were made of birds with possibly the highest value of the genetic distance.
RESULTS AND DISCUSSION
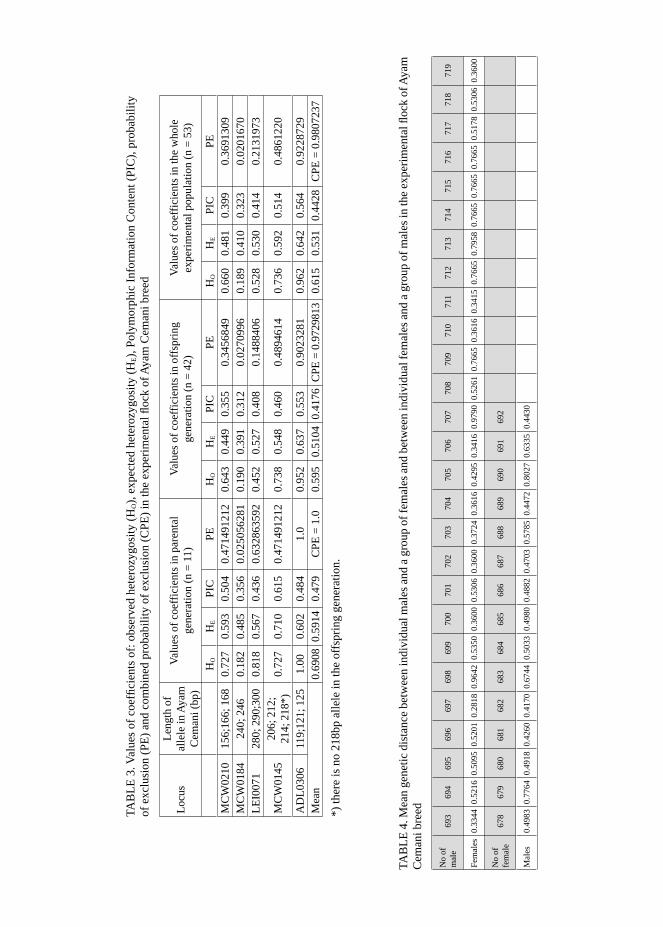
It was found that the number of alleles, varying from 4 to 8, the level of HE and PIC value (above 0.7) and the probabi-lity to identify two individuals with the same genotype 1:2721600 (Tab. 1), as indicated by Crooijmans et al. (1996), Crooijmans et al. (1997), Rosario et al. (2009), Weissmann et al. (1998), Tadano et al. (2007), are sufficiently high to apply the selected microsatellite sequences in checking the origin of the birds derived from the assumed parents. In turn, in the analyzed flock of Ayam Cemani, the probability of finding two birds with the same genotype using these sequences reached 1:6480 (Tab. 1).
Table 2 collates values of the exact test of Hardy-Weinberg equilibrium in terms of the investigated microsatel-lite sequences in the parental and F1
TABLE 1. Number of possible genotypes in a domestic chicken and in the investigated fl ock of Ayam Cemani breed
LocusNumber of alleles in
domestic chicken
Number of possible
genotypes*
Number of alleles in
Ayam Cemani
Number of possible
genotypes*MCW0145 8 a),e) 36 4 10MCW0184 6 b) 21 2 3MCW0210 4 b), d) 10 3 6LEI0071 8 c) 36 3 6ADL0306 4 d) 10 3 6Probability of finding two individuals with the same genotype 1:2721600 1:6480
a) Crooijmans et al., 1996; b) Crooijmans et al., 1997; c) Rosario et al., 2009; d) Weissmann et al., 1998; e) Tadano et al., 2007.* following to the formula: {n!/[2(n – 2)!]}+2, where n – number of alleles.

30 J. Gruszczyńska, M. Łukasiewicz, B. Grzegrzółka
generation as well as for the entire ana-lyzed population of Ayam Cemani breed. It was demonstrated that in the case of the MCW0210 microsatellite sequence the differences in genotypes distribution were significant, whereas in the case of the ADL0306 sequence – highly signifi-cant (Tab. 2).
The computed coefficient of the proba-bility of exclusion (PE) and combined probability of exclusion (CPE), account-ing for 0.973 in the parental group and 0.981 in the offspring group (Tab. 3) of the investigated flock, point to the fea-sibility of applying the selected micro-satellite sequences for origin determina-tion in the experimental flock of Ayam Cemani breed.
Based on the frequency of the selected microsatellite sequences, coefficients of observed heterozygosity (HO), expected heterozygosity (HE) and Polymorphic Information Content (PIC) were com-puted in the analyzed population. The calculated values of HE coefficient were ranging from 0.48 to 0.71 in the paren-tal generation and from 0.39 to 0.64 in the F1 generation (Tab. 3). Values of the PIC were slightly lower than those of the HE. The highest number of homozy-
gotes in both generations was observed for the MCW0184 sequence, i.e.: 82% and 81%, respectively. In terms of the ADL0306 sequence, none homozy-gotes were identified in the parental generation, whereas in the offspring generation they constituted 4.8%. In addition, in the F1 generation, the loss of 218bp allele was observed in the MCW0145 locus.
Due to the fact that the initial number of birds (parental generation) consisted of 11 birds (2 cocks and 9 hens) and that the origin of the offspring generation was not completely identified, all birds in the flock were genotyped. Owing to the fact that based on the results achieved the origin of the birds was still not inexplicit, use was made of the values of a stan dard genetic distance computed for each pair of birds based on the frequency of alleles. The mean genetic distance in the parental generation (11 birds) accounted for 0.4877, whereas in the offspring gene-ration (42 birds) – for 0.5432. Values of the mean genetic distance of particular males with a group of females and that of individual females with a group of males were reported in Table 4. The birds were mated so as the genetic distance between
TABLE 2. Results of the exact test of Hardy-Weinberg equilibrium in terms of the analyzed microsatel-lite sequences in the experimental population of Ayam Cemani breed
Locus MCW0145 MCW0184 MCW0210 LEI0071 ADL0306Parental generation ND ND ND ND NDOffspring generation NS ND ND NS ***The whole investigated population of Ayam Cemani NS ND * NS ***
Exact test of Hardy-Weinberg equilibrium: * signifi cant differences (p ≤ 0.05) ** highly signifi cant differences (p ≤ 0.01)*** extremely signifi cant differences (p ≤ 0.001)NS – not signifi cant.ND – not determined owing to a too few number of groups.
TAB
LE 3
. Val
ues o
f coe
ffi ci
ents
of:
obse
rved
het
eroz
ygos
ity (H
O),
expe
cted
het
eroz
ygos
ity (H
E), P
olym
orph
ic In
form
atio
n C
onte
nt (P
IC),
prob
abili
ty
of e
xclu
sion
(PE)
and
com
bine
d pr
obab
ility
of e
xclu
sion
(CPE
) in
the
expe
rimen
tal fl
ock
of A
yam
Cem
ani b
reed
Locu
sLe
ngth
of
alle
le in
Aya
m
Cem
ani (
bp)
Valu
es o
f coe
ffici
ents
in p
aren
tal
gene
ratio
n (n
= 1
1)Va
lues
of c
oeffi
cien
ts in
offs
prin
g ge
nera
tion
(n =
42)
Valu
es o
f coe
ffici
ents
in th
e w
hole
ex
perim
enta
l pop
ulat
ion
(n =
53)
HO
HE
PIC
PEH
OH
EPI
CPE
HO
HE
PIC
PEM
CW
0210
156;
166;
168
0.72
70.
593
0.50
40.
4714
9121
20.
643
0.44
90.
355
0.34
5684
90.
660
0.48
10.
399
0.36
9130
9M
CW
0184
240;
246
0.18
20.
485
0.35
60.
0250
5628
10.
190
0.39
10.
312
0.02
7099
60.
189
0.41
00.
323
0.02
0167
0LE
I007
128
0; 2
90;3
000.
818
0.56
70.
436
0.63
2863
592
0.45
20.
527
0.40
80.
1488
406
0.52
80.
530
0.41
40.
2131
973
MC
W01
4520
6; 2
12;
214;
218
*)0.
727
0.71
00.
615
0.47
1491
212
0.73
80.
548
0.46
00.
4894
614
0.73
60.
592
0.51
40.
4861
220
AD
L030
611
9;12
1; 1
251.
000.
602
0.48
41.
00.
952
0.63
70.
553
0.90
2328
10.
962
0.64
20.
564
0.92
2872
9M
ean
0.69
080.
5914
0.47
9C
PE =
1.0
0.59
50.
5104
0.41
76CP
E =
0.97
2981
30.
615
0.53
10.
4428
CPE
= 0
.980
7237
*) th
ere
is n
o 21
8bp
alle
le in
the
offs
prin
g ge
nera
tion.
TAB
LE 4
. Mea
n ge
netic
dis
tanc
e be
twee
n in
divi
dual
mal
es a
nd a
gro
up o
f fem
ales
and
bet
wee
n in
divi
dual
fem
ales
and
a g
roup
of m
ales
in th
e ex
perim
enta
l fl o
ck o
f Aya
m
Cem
ani b
reed
No
of
mal
e69
369
469
569
669
769
869
970
070
170
270
370
470
570
670
770
870
971
071
171
271
371
471
571
671
771
871
9
Fem
ales
0.33
440.
5216
0.50
950.
5201
0.28
180.
9642
0.53
500.
3600
0.53
060.
3600
0.37
240.
3616
0.42
950.
3416
0.97
900.
5261
0.76
650.
3616
0.34
150.
7665
0.79
580.
7665
0.76
650.
7665
0.51
780.
5306
0.36
00
No
of
fem
ale
678
679
680
681
682
683
684
685
686
687
688
689
690
691
692
Mal
es0.
4983
0.77
640.
4918
0.42
600.
4170
0.67
440.
5033
0.49
800.
4882
0.47
030.
5785
0.44
720.
8027
0.63
350.
4430
32 J. Gruszczyńska, M. Łukasiewicz, B. Grzegrzółka
the pairs of mated individuals was as high as possible.
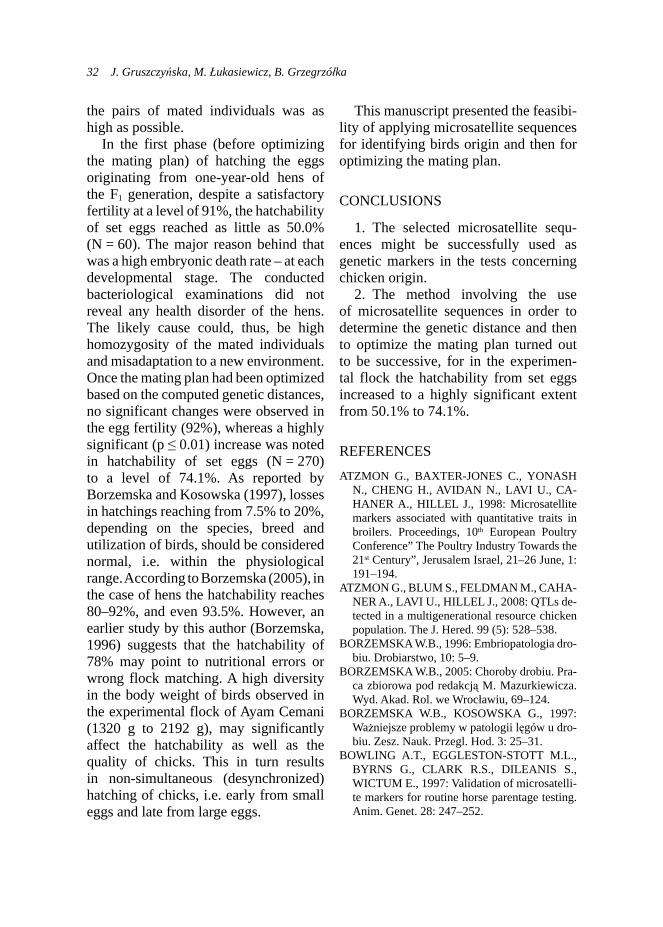
In the first phase (before optimizing the mating plan) of hatching the eggs originating from one-year-old hens of the F1 generation, despite a satisfactory fertility at a level of 91%, the hatchability of set eggs reached as little as 50.0% (N = 60). The major reason behind that was a high embryonic death rate – at each developmental stage. The conducted bacteriological examinations did not reveal any health disorder of the hens. The likely cause could, thus, be high homozygosity of the mated individuals and misadaptation to a new environment. Once the mating plan had been optimized based on the computed genetic distances, no significant changes were observed in the egg fertility (92%), whereas a highly significant (p ≤ 0.01) increase was noted in hatchability of set eggs (N = 270) to a level of 74.1%. As reported by Borzemska and Kosowska (1997), losses in hatchings reaching from 7.5% to 20%, depending on the species, breed and utilization of birds, should be considered normal, i.e. within the physiological range. According to Borzemska (2005), in the case of hens the hatchability reaches 80–92%, and even 93.5%. However, an earlier study by this author (Borzemska, 1996) suggests that the hatchability of 78% may point to nutritional errors or wrong flock matching. A high diversity in the body weight of birds observed in the experimental flock of Ayam Cemani (1320 g to 2192 g), may significantly affect the hatchability as well as the quality of chicks. This in turn results in non-simultaneous (desynchronized) hatching of chicks, i.e. early from small eggs and late from large eggs.
This manuscript presented the feasibi-lity of applying microsatellite sequences for identifying birds origin and then for optimizing the mating plan.
CONCLUSIONS
1. The selected microsatellite sequ-e nces might be successfully used as genetic markers in the tests concerning chicken origin.
2. The method involving the use of microsatellite sequences in order to determine the genetic distance and then to optimize the mating plan turned out to be successive, for in the experimen-tal flock the hatchability from set eggs increased to a highly significant extent from 50.1% to 74.1%.
REFERENCES
ATZMON G., BAXTER-JONES C., YONASH N., CHENG H., AVIDAN N., LAVI U., CA-HANER A., HILLEL J., 1998: Microsatellite markers associated with quantitative traits in broilers. Proceedings, 10th European Poultry Conference” The Poultry Industry Towards the 21st Century”, Jerusalem Israel, 21–26 June, 1: 191–194.
ATZMON G., BLUM S., FELDMAN M., CAHA-NER A., LAVI U., HILLEL J., 2008: QTLs de-tected in a multigenerational resource chicken population. The J. Hered. 99 (5): 528–538.
BORZEMSKA W.B., 1996: Embriopatologia dro-biu. Drobiarstwo, 10: 5–9.
BORZEMSKA W.B., 2005: Choroby drobiu. Pra-ca zbiorowa pod redakcją M. Mazurkiewicza. Wyd. Akad. Rol. we Wrocławiu, 69–124.
BORZEMSKA W.B., KOSOWSKA G., 1997: Ważniejsze problemy w patologii lęgów u dro-biu. Zesz. Nauk. Przegl. Hod. 3: 25–31.
BOWLING A.T., EGGLESTON-STOTT M.L., BYRNS G., CLARK R.S., DILEANIS S., WICTUM E., 1997: Validation of microsatelli-te markers for routine horse parentage testing. Anim. Genet. 28: 247–252.

Utilization of the selected microsatellite sequences in optimizing... 33
CROOIJMANS R.P., DIJKHOF R.J.M., POEL J.J., GROENEN M.A.M., 1997: New microsa-tellite markers in chicken optimized for auto-mate fluorescent genotyping. Anim. Genet. 28: 427–437.
CROOIJMANS R.P., VAN OERS P.A., STRIJK J.A., VAN DER POEL J.J., GROENEN M.A., 1996: Preliminary linkage map of the chicken (Gallus domesticus) genome based on 77 mi-crosatellite markers: 77 new markers mapped. Poultry Sci. 75: 746–754.
EVETT L.W., WEIR B.S., 1998: Interpreting DNA Evidence: Statistical Genetics for Foren-sic Scientists. Sinauer Associates. Inc., Sunder-land. MA.
FREIS R., EGGEN A., STRANZIENGER G., 1990: The bovine genome contains polymor-phic microsatellites. Genomics 8: 403–440.
FUNG W.K., CHUNG Y., WONG D., 2002: Po-wer of exclusion revisited: probability of exc-luding relatives of the true father from paterni-ty. Int J.Legal Med 116: 64–67.
GANAI N.A., YADAV B.R., 2005: Parentage de-termination in three breeds of Indian goat using heterologous microsatellite markers. In: H.P.S. Makkar and G.J. Viljoen (eds.) Applications of Gene-Based Technologies for Improving Animal Production and Health in Developing Countries 613–620.
GRUSZCZYŃSKA J., ŁUKASIEWICZ M., 2010: Microsatellite polymorphism in the stu-dy of genetic diversity of an experimental flock of Ayam Cemani breed, Ann. Warsaw Univ. of Life Sci. – SGGW, Anim. Sci. 47: 39–44.
JAMIESON A., TAYLOR ST.C.S., 1997: Com-parisons of three probability formulae for parentage exclusion. Anim. Genet. 28: 397––400.
KALINOWSKI S.T., TAPER M.L., MARSHALL T.C., 2007: Revising how the computer pro-gram CERVUS accommodates genotyping er-ror increases success in paternity assignment. Mol. Ecol. 16: 1099–1006.
NEI M., 1972: Genetic distance between popula-tions. The American Naturalist. 106: 283–291.
OLIVEIRA S., TRINDADE-FILHO A., MEN-DES C., PAULA K., MAIA F., PAK H., DAL-TON G., 2006: Power of exclusion of 18 au-tosomic STR loci in a Brazilian Middle-West region population sample. International Con-gress Series 1288: 433–435.
RADKO A., 2008: Ocena polimorfizmu marke-rów mikrosatelitarnych DNA wykorzystywa-nych w kontroli rodowodów bydła w Polsce. Wiadomości Zootechniczne, R. XLVI, 4: 3–8.
RIOJAS-VALDES V.M., GOMEZ DE LA FUEN-TE J.C., GARZA-LOZANO J.M., GALLAR-DO-BLANCO D.C., DE TELLITU_SCHUTZ J.N., WONG-GONZALEZ A., DAVALOS-ARANDA G., SALINAS-MELENDEZ J.A., 2009: Exclusion probabilities of 8 DNA mi-crosatellites in 6 cattle breeds from Northeast Mexico. J. of Anim. and Vet. Advences 8(1): 62–66.
ROSARIO M.F., LEDUR M.C., MOURA A.S.A.T., COUTINHO L.L., GARCIA A.A.F., 2009: Genotypic characterization of micro-satellite markers in broiler and layer selected chicken lines and their reciprocal F1s. Sci. Agric. (Piracicaba, Braz.) 66: 150–158.
SCHNABEL R.D., WARD T.J., DERR J.N., 2000: Validation of 15 microsatellites for pa-rentage testing in North American bison, Bison bison and domestic cattle. Anim. Genet. 31: 360–366.
TADANO R., NISHIBORI M., NAGASAKA N., TSUDZUKI M., 2007: Assessing genetic di-versity and population structure for commer-cial chicken lines based on forty microsatellite analyses, Poultry Sci. 86: 2301–2308.
TATSUDA K., FUJINAKA K., 2001: Genetic mapping of the QTL affecting body weight in chickens using a F2 family. Br. Poultry Sci. 42(3): 333–337.
WEISSMANN S., CARMON T., DOUAIRE M., CAHANER A., ZEITLIN G., LAVI U., AVI-DAN N., LECLERCQ B., HILLEL J., 1998: Marker gene frequencies within and between divergently selected lines for high and low abdominal fat in chickens. Proceedings, 10th European Poultry Conference” The Poultry Industry Towards the 21st Century”, Jerusalem Israel, 21–26 June, 1: 280–283.
WENK R.E., GJERTSON D.W., CHIAFARI F.A., HOUTZ T., 2005: The specific power of parentage exclusion in a child’s blood relatives. Transfusion 45: 440–444.
Streszczenie: Wykorzystanie wybranych se-kwencji mikrosatelitarnych w optymalizacji planu kojarzeń doświadczalnego stada kur rasy ayam cemani. Stado rodzicielskie liczyło
34 J. Gruszczyńska, M. Łukasiewicz, B. Grzegrzółka
początkowo 2 koguty i 9 kur, które pochodzi-ły z różnych hodowli, a następne uzyskane po nich pokolenie F1 liczyło 42 ptaki (15 kur i 27 kogutów). Stado doświadczalne pochodziło z fermy drobiu Rolniczego Zakładu Doświad-czalnego SGGW Wilanów-Obory. Ze względu na specyfikę prowadzonego doświadczenia na podstawie literatury wybrano sekwencje mikro-satelitarne: MCW0145, MCW0184, MCW0210, LEI0071, ADL0306, które były u kur związane z masą ciała (Atzmon et al., 1998; Atzmon et al., 2008; Weissmann et al., 1998; Tatsuda and Fu-jinaka, 2001). We wcześniej przeprowadzonych badaniach stwierdzono, że wybrane sekwencje mikrosatelitarne u kur rasy ayam cemani są po-limorficzne (Gruszczyńska and Łukasiewicz, 2010). Na podstawie wyników badań moleku-larnych wyznaczono dystans genetyczny między wszystkimi parami ptaków występujących w sta-dzie. Stwierdzono, iż wybrane sekwencje mogą być z sukcesem wykorzystywane w identyfika-cji pochodzenia u kur. Metoda wykorzystania sekwencji mikrosatelitarnych w celu ustalenia
dystansu genetycznego, a następnie na tej pod-stawie ustalenia planu kojarzeń okazała się traf-na, gdyż w doświadczalnym stadzie wylęgowość z jaj nałożonych wzrosła wysoko istotnie staty-stycznie z 50,1% do 74,1%.
MS. received September 2011
Authors’ addresses:Joanna Gruszczyńska, Beata GrzegrzółkaKatedra Genetyki i Ogólnej Hodowli Zwierząt – SGGWul. Ciszewskiego 802-786 WarszawaPolande-mail: [email protected]
Monika ŁukasiewiczKatedra Szczegółowej Hodowli Zwierząt – SGGWul. Ciszewskiego 802-786 WarszawaPoland

Annals of Warsaw University of Life Sciences – SGGWAnimal Science No 49, 2011: 35–43(Ann. Warsaw Univ. of Life Sc. – SGGW, Anim. Sci. 49, 2011)
A molecular test for the detection of the C295G mutationin the T gene responsible for shortened tail and taillessnessin the Pembroke Welsh Corgi
JOANNA GRUSZCZYŃSKA, AGATA CZAPLADepartment of Genetics and Animal Breeding, Warsaw University of Life Sciences – SGGW
Abstract: A molecular test for the detection of the C295G mutation in the T gene responsible for shortened tail and taillessness in the Pembroke Welsh Corgi. A ban on cutting tail in dogs has been introduced in many countries. In order to exhibit on an offi cial pedigree show a tailless or short-ta-iled dog, it’s owner must provide a statement con-fi rming that the short tail is natural characteristic of his dog. The aim of this paper was to design a test to diagnose a C295G dominant mutation in T gene which is responsible for short-tail phenotype in 17 dog breeds. This mutation creates a BstE-II restriction site. The molecular test designed is based on genomic DNA analysis. A fragment of T gene is amplifi ed in polymerase chain reaction (PCR). Then, the PCR product is treated with restriction enzyme BstEII, and the analysis of re-striction fragments is carried out in polyacrylami-de gel. A genotype of 30 Polish Pembroke Welsh Corgi regarding T gene has been determined. Wi-thin the studied group of dogs, 10 heterozygotes and 20 recessive homozygotes have been found. No dominant homozygotes have been present.
Key words: Canis familiaris, Pembroke Welsh Corgi, short-tail, taillessness, T-box gene.
INTRODUCTION
The T gene belongs to the family ofT-box genes and occurs in many species of animals, both vertebrates and inver-tebrates. This is a large family of genes
encoding transcription factors expressed during the embryonic development. Most of the T proteins act as transcrip-tion activators, only few of them are repressors. The T protein activates genes specific to the mesoderm and is involved in the development of structures derived from the posterior mesoderm, including notochord. The first discovered gene be-longing to a T-box gene family is known as Brachyury or T (for tail) gene, which is responsible for the short tail in mice (Kavka and Green, 1997; Papaioannou and Silver, 1998).
In many species the short tail can be conditioned by the presence of mutations in the T gene. T/Brachyury gene at the stage of the embryonic development is involved in the process of differentiation of axial structures, such as notochord and neural tube. Therefore, taillessness and short-tail phenotype induced by the mutation of this gene is associated with the presence of a number of other defects revealing mainly in homozygotes during the embryonic development. Abnormali-ties in the embryonic development are usually the cause of necrobiosis of these embryos. So in homozygotes the T gene mutation is lethal (DeForest and Basrur,

36 J. Gruszczyńska, A. Czapla
1979; Adalsteinsson, 1980; Robinson, 1993). Heterozygotes for the T gene either do not demonstrate any genetic defects, or have a shortened or lack of tail. For example, heterozygous mice for the T gene mutation, are short tailed or taillessness, and in addition they have spinal congenital defects. However, the dominant homozygotes decay around the 11th day of pregnancy, and foetuses have no tail and the posterior mesoderm derived structures (Showell et al., 2004). In humans, the T gene mutation is not yet associated with any disease. Con-trary, in cats, shortened tail, or tailless is linked to the existence of dominant gene M (Manx), which yet have not been sequenced. The M gene mutation, responsible for the lack of tail in cats also determines other defects. In het-erozygotes an urinay and faecal inconti-nence and abnormal hindlimb action are observed (Robinson, 1993).
The T gene mutation causing tailless-ness or shortened tail occurs in 17 breeds belonging to two groups of dogs: sheep-dogs and hunting dogs (Hytönen et al., 2009). This mutation was also found in the Pembroke Welsh Corgi. In this breed it is inherited in a dominant manner and in heterozygotes it causes bobtail pheno-type, while, dominant homozygotes die during embryonic life or shortly after birth (Indrebø et al., 2008).
Knowledge of the genotype for the T gene is essential in the case of pure-bred, pedigree dogs that will be used for breeding, because an increasing number of countries is prohibiting cutting tails. Molecular test based on the analysis of the genomic DNA allows unambiguous determination of the origin of the short tail.
MATERIAL AND METHODS
Biological material and the isolation of the genomic DNAThe whole blood was collected into K3EDTA tubes from 30 Pembroke Welsh Corgi born in 1998–2007 and bred in Poland. Out of the 30 dogs from which the blood samples were collected: 20 had a normal tail length, or docked, 6 – short tail, and 4 – no tail. The full pedigree data for each dog were also available, as well as description of parents’ tail length. The genomic DNA was isolated from blood using standard phenol-chlo-roform extraction. The presence and the purity of isolated DNA was checked on a Nanodrop 2000 spectrophotometer (THERMO SCIENTIFIC) and in a 1% agarose gel.
PCR reaction conditionsPolymerase chain reaction (PCR) was performed using the following pairs of primers: 5’-GAAGAGCCTGCAGTAC-CGAGT-3 ‘in exon 1 and 5’-CACTCTC-CGTTCACGTACTTCC-3’ in exon 2 of the T gene (Indrebø et al., 2008). The reaction mixture entered: 1 ng DNA, reaction buffer (SIGMA-ALDRICH, USA) 1 × concentrated, 2.5 mM MgCl2, 200 μM/μl dNTP mix (POLGEN, Poland), 5 pmol primers, 1 U/μl Taq DNA polymerase (SIGMA-ALDRICH, USA). The reaction was carried out under the following conditions: initial denaturation at 95°C for 3 min, 35 cycles of 95°C for 30 s, 61°C for 30 s, 72°C for 45 s, final synthesis at 72°C for 10 min. The PCR product was analysed by the electrophoresis in native 12% poly-acrylamide gel. The electrophoresis was carried out in a vertical electrophoresis
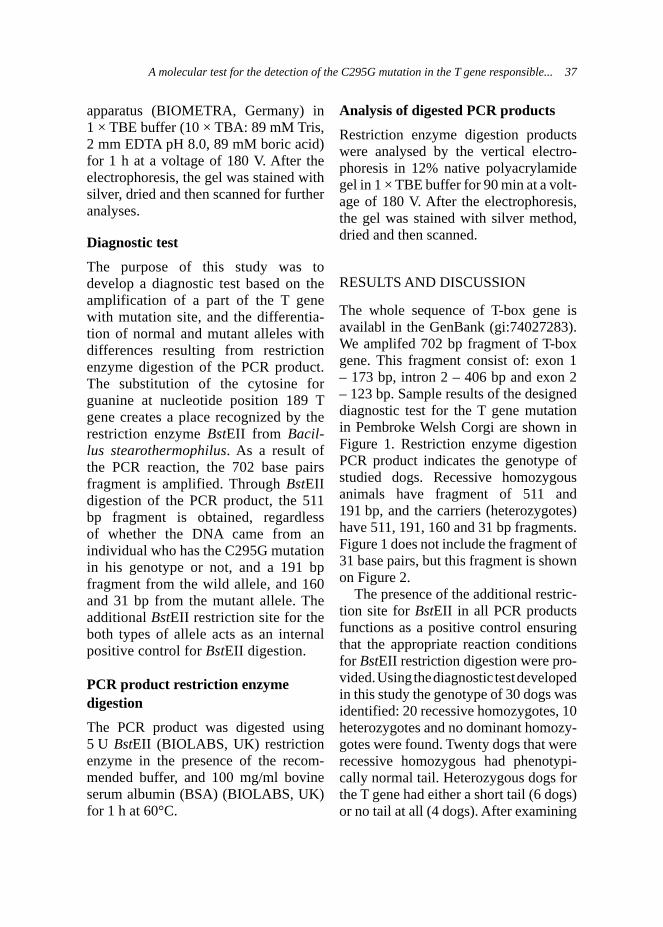
A molecular test for the detection of the C295G mutation in the T gene responsible... 37
apparatus (BIOMETRA, Germany) in 1 × TBE buffer (10 × TBA: 89 mM Tris, 2 mm EDTA pH 8.0, 89 mM boric acid) for 1 h at a voltage of 180 V. After the electrophoresis, the gel was stained with silver, dried and then scanned for further analyses.
Diagnostic test
The purpose of this study was to develop a diagnostic test based on the amplification of a part of the T gene with mutation site, and the differentia-tion of normal and mutant alleles with differences resulting from restriction enzyme digestion of the PCR product. The substitution of the cytosine for guanine at nucleotide position 189 T gene creates a place recognized by the restriction enzyme BstEII from Bacil-lus stearothermophilus. As a result of the PCR reaction, the 702 base pairs fragment is amplified. Through BstEII digestion of the PCR product, the 511 bp fragment is obtained, regardless of whether the DNA came from an individual who has the C295G mutation in his genotype or not, and a 191 bp fragment from the wild allele, and 160 and 31 bp from the mutant allele. The additional BstEII restriction site for the both types of allele acts as an internal positive control for BstEII digestion.
PCR product restriction enzyme digestion
The PCR product was digested using 5 U BstEII (BIOLABS, UK) restriction enzyme in the presence of the recom-mended buffer, and 100 mg/ml bovine serum albumin (BSA) (BIOLABS, UK) for 1 h at 60°C.
Analysis of digested PCR products
Restriction enzyme digestion products were analysed by the vertical electro-phoresis in 12% native polyacrylamide gel in 1 × TBE buffer for 90 min at a volt-age of 180 V. After the electrophoresis, the gel was stained with silver method, dried and then scanned.
RESULTS AND DISCUSSION
The whole sequence of T-box gene is availabl in the GenBank (gi:74027283). We amplifed 702 bp fragment of T-box gene. This fragment consist of: exon 1 – 173 bp, intron 2 – 406 bp and exon 2 – 123 bp. Sample results of the designed diagnostic test for the T gene mutation in Pembroke Welsh Corgi are shown in Figure 1. Restriction enzyme digestion PCR product indicates the genotype of studied dogs. Recessive homozygous animals have fragment of 511 and 191 bp, and the carriers (heterozygotes) have 511, 191, 160 and 31 bp fragments. Figure 1 does not include the fragment of 31 base pairs, but this fragment is shown on Figure 2.
The presence of the additional restric-tion site for BstEII in all PCR products functions as a positive control ensuring that the appropriate reaction conditions for BstEII restriction digestion were pro-vided. Using the diagnostic test developed in this study the genotype of 30 dogs was identified: 20 recessive homozygotes, 10 heterozygotes and no dominant homozy-gotes were found. Twenty dogs that were recessive homozygous had phenotypi-cally normal tail. Heterozygous dogs for the T gene had either a short tail (6 dogs) or no tail at all (4 dogs). After examining

38 J. Gruszczyńska, A. Czapla
511 bp
191 bp160 bp
881 bp
692 bp501/489 bp404 bp331 bp
241 bp
190 bp
147 bp
111/110 bp
the pedigrees of tested dogs, it was found that for all individuals that were hetero-zygous one of the parents had phenotype of short tail.
British breed standard for the Pem-broke Welsh Corgi of April 2004 (http://www.fci.be/uploaded_files/039A2003_en.doc) defines the tail of this breed as a short, and therefore the preferred tail
is a naturally short tail. It was a common practice in many European countries, to cut off tails of dogs that were born with long tails.
Only after the European Conven-tion for the Protection of Pet Animals came into the force, (http://conventions.coe.int/Treaty/EN/Treaties/Html/125.htm, Strasbourg, 1987) most countries
FIGURE 1. Electrophoretic separation of BstEII restriction enzyme digestion fragments in native 12 % polyacrylamide gel. M – pUC Mix Marker 8; A – recessive homozygote (511 and 191 bp fragments are visible); B – heterozygote (511, 191 and 160 bp fragments are visible, 31 bp fragment not shown). Arrows marks restriction fragment lengths
FIGURE 2. Principle of the diagnostic test for detection the C295G mutation of the T gene in Pembroke Welsh Corgi. The length of restriction fragments are given in the last row. Thick arrows showing the site of mutation
DNA sequence
PCR product
Mutant alleleNormal allele
PCR
BstEII
PCR
BstEII
191 bp 511 bp 160 bp 31 bp 511 bp
restriction enzymedigestion product

A molecular test for the detection of the C295G mutation in the T gene responsible... 39
introduced a ban on cutting tails. Dogs with their tails docked can not par-ticipate in official shows. The owner of a dog with bobtail (short tail or no tail) needs to present a certificate from a vet-erinarian to confirm the natural origin of a short tail in his dog. In breeds in which a mutation of the T gene was identified, a veterinary observation can be now replaced by a simple genetic test that unambiguously identifies the origin of taillessness (Hytönen et al., 2009).
Canine T-box gene has been cloned by Haworth et al. (Haworth et al., 2001). It is located in the chromosome 1q23. As a result of the analysis of DNA sequences of the T gene C295G muta-tion was found in exon 1. Substitution of cytosine for guanine (C > G) leads to changes in ATC codon for isoleucine at codon ATG for methionine. After the transcription the mRNA is the codon AUG, which is recognized by the ribosome, as the translation start site (Haworth et al., 2001).
C295G mutation is also known as Ile63Met or C189G mutation (Hytönen et al., 2009). Substitution of cytosine for guanine creates a place recognized by the BstEII restriction enzyme from Bacillus stearothermophilus.
Haworth et al. compared the canine T gene sequence to the T gene in other spe-cies (Haworth et al., 2001). It was found that the isoleucine at 63 amino acid position is conservative in the T protein from Drosophila to tunicates to man. The location of this isoleucine in the highly conserved region of T domain may indi-cate that the substitution of isoleucine for methionine at this position changes the ability of mutant T protein to DNA binding (Papapetrou et al., 1997).
In this paper, primers published by Indrebø et al. were used for the polymer-ase chain reaction (Indrebø et al., 2008). As a result of the PCR reaction, DNA segment with a length of 702 bp was obtained, which consists of a fragment of exon 1, intron 2 and a part of exon 2.
Haworth et al. (2001) applied two starters – both in exon 1 and an ampli-fied fragment length of 317 bp to the PCR reaction exon 1 of the T gene with a mutation site (Haworth et al., 2001). Also Hytönen et al. (Hytönen et al., 2009) applied the same pair of prim-ers that Haworth et al. (Haworth et al., 2001), and primers designed by them-selves within exon 1 of the T gene.
C295G mutation in the designed DNA test was identified by the analysis of the length of restriction fragments generated in BstEII digestion of the PCR product. After the electrophoresis of restriction fragments in polyakrylamide gel, the gel was stained with silver method. Polyacry-lamide gels are characterized by a higher resolution than agarose gels. By contrast, the method of silver staining of DNA fragments is more sensitive to ethidium bromide staining. Indrebø et al. analysed the sequenced PCR product (Indrebø et al. 2008). By contrast, Haworth et al. and Hytönen et al. subjected the PCR product to both BstEII enzyme digestion and sequencing (Haworth et al., 2001; Hytönen et al., 2009).
Among the dogs studied by Haworth et al. in order to analyse T gene muta-tions, there was no dominant homozygote even in the litter from mating two short tailed dogs (Haworth et al., 2001). All the dogs with a shortened tail were car-riers of the C295G mutation. This may mean that the T gene mutation is lethal

40 J. Gruszczyńska, A. Czapla
in homozygous animals (Haworth et al., 2001). Also mice heterozygous for the T gene mutation have short tail or no tail and it is associated with skeletal defects. Moreover, mice homozygous for the T gene mutation exhibit severe malforma-tions, and fetuses survive to the 10.5 day of the gestation (Meisler, 1997). While in the fish Danio rerio carrying the mutation in the ntl gene, homologous to the mouse T gene, there were no visible phenotypic changes that would be asso-ciated with shortening of the tail. The ntl gene phenotypic effect in homozygous fish is similar to the phenotypic effect of gene Brachyury in homozygous mice (Schulte-Merker et al., 1992, Schulte--Merker et al., 1994).
Indrebø et al. examined 19 naturally short tailed Pembroke Welsh Corgi het-erozygous for the T gene mutation in order to determine their suitability for congenital spine (Indrebø et al., 2008). All dogs were subjected to a radiologi-cal examination. The results showed no spinal congenital defects connected with the T gene mutation, which means that the only phenotypic effect of the C295G mutation observed in the carriers of the Pembroke Welsh Corgi is short tail or tailless.
Indrebø et al. reported also two Pem-broke Welsh Corgi puppies, which were dominant homozygous for the T gene mutations (Indrebø et al., 2008). One of them survived only a few seconds after birth, and the second was euthanized. Both puppies were radiographically and genetically tested and submitted to an autopsy. In addition to the lack of tail and anorectal atresia, they showed a series of spinal defects, for example: shortened cervical, thoracic and lumbar vertebral
bodies, and no sacral or caudal verte-brae, scoliosis of thoracic and lumbar spine and kyphosis of the thoracic spine (Indrebø et al., 2008).
There are no other reports of homo-zygous puppies born or stillborn fetuses, which suggests that in most cases, the homozygotes for the C295G mutation is lethal even in an early fetal develop-ment (Haworth et al., 2001; Indrebø et al., 2008). Until now there was only one report of homozygous puppies born alive. Thus, it appears that there is a possibility for these puppies to be born and be able to survive for a short period of time. The reasons for such phenotypic differences in dogs with the same genotype regard-ing T gene, have not been explained yet. Natural variability in the length of the tail in dogs of Pembroke Welsh Corgi with short tails indicates that there may be differences in the sequences of other genes directly interacting with the T gene (Indrebø et al., 2008). It was dem-onstrated that the genes belonging to a family of genes with a T-box and their cofactors may have complex interactions (Packham and Brook, 2003).
After crossing a short tailed with a long tailed dog it can be expected that about 50% of litter are short tailed (hetero-zygous). In the same time, when crossing two short tailed dogs there is a possibility of getting homozygous dominant pupies for the C295G mutation. However, the probability of obtaining homozygotes in the progeny is relatively low. Indeed, in the past, such crossing was conducted in many countries, but so far there has been no information about puppies with con-genital defects indicating the presence of the T gene mutations in homozygous genotype. Nevertheless, mating of dogs

A molecular test for the detection of the C295G mutation in the T gene responsible... 41
with genotypes that could cause an increased presence of hereditary defects should be prohibited by law (Indrebø et al., 2008).
Hytönen et al. examined 23 breeds of dogs and demonstrated the presence of the C295G mutation in all short tailed dogs belonging to 17 breeds (Hytönen et al., 2009) . In the remaining 6 breeds, neither mutation Ile63Met, nor any other T gene mutations were detected. 9 breeds of dogs, which phenotypes do not exhibit natural taillessness were also studied. The results show that the T gene mutation is not present in all breeds of dogs, in which short tailed phenotype is observed. Thus, there must be some other genetic factor that determines the length of the tail in dogs (Hytönen et al., 2009). The possi-ble second mutation affecting this trait might explain while some of T gene heterozygous dogs had short tail while others had no tail at all. All tested dogs with short tails were heterozygous for the C295G mutation, and all dogs with long tails were not carriers of this mutation. This indicates full penetra-tion of the T gene and its lethality in the homozygous configuration. The T gene lethality was further confirmed by statistical analysis, based on com-parison of the litter size of two mating groups (long tailed × long tailed and short tailed × short tailed) of Swe dish Vallhund. When two parents were short tailed a 29 percentage decrease in the litter size was observed. This litter size reduction is likely due to the lethality of the embryos in the uterus, which is consistent with the expected 25-percent decrease in the litter size when crossing two heterozygous par-
ents As expected 1/4 of all puppies should inherit a mutation from both parents and became lethal homozygous (Hytönen et al., 2009).
Seventeen breeds of dogs, in which the presence of the Ile63Met mutation was detected, belong to two groups of dogs (sheepdog and hunting dogs). This may suggest an ancestral origin of the T gene mutation. To determine the pattern of inheritance and the reasons for tail-lessness in other breeds of dogs further research are needed (Hytönen et al., 2009).
In the present study the genotype of 30 dogs for the T gene C295G mutation in Pembroke Welsh Corgi was determined. Ten dogs proved to be the carriers of the mutation and the other 20 showed no presence of the T gene mutation. As in the previous studies conducted by other authors (Haworth et al., 2001; Indrebø et al., 2008; Hytönen et al., 2009), all heter-ozygous dogs were short tailed (6 dogs) or taillessness (4). In turn, all dogs without the C295G mutation were born with a long tail. There were no dominant homozygotes for this mutation, because they died during embryonic or perinatal period, as shown by the work of other authors (Haworth et al., 2001; Indrebø et al., 2008; Hytönen et al., 2009).
Using the designed diagnostic test allows to determine the T gene muta-tion carriers that are responsible for taillessness or short tailed phenotype in Pembroke Welsh Corgi. This is impor-tant because tail docking is prohibited in many countries. If a dog is to take part in pedigree shows a certificate to ascertain a natural short tail will be required; such certificate can be based now on objective molecular analysis.

42 J. Gruszczyńska, A. Czapla
Acknowledgements
We would like to thank all breeders from Welsh Corgi Club in Lublin of Polish Kennel Club for permission to collect blood samples.
REFERENCES
ADALSTEINSSON S., 1980: Establishment of Equilibrium for the Dominant Lethal Gene for Manx Taillessness in Cats. Theoretical and Ap-plied Genetics 58 (2): 49–53.
DEFOREST M.E., BASRUR P.K., 1979 – Mal-formations and the Manx Syndrome in Cats. The Canadian Veterinary Journal 20, 304–314.
HAWORTH K., PUTT W., CATTANACH B., BREEN M., BINNS M., LINGAAS F., EDWARDS Y.H., 2001: Canine homolog of the T-box transcription factor T; failure of the protein to bind to its DNA target leads to a short-tail phenotype. Mammalian Genome 12: 212–218.
HYTÖNEN M.K., GRALL A., HÉDAN B., DRÉANO S., SEGUIN S.J., DELATTRE D., THOMAS A., GALIBERT F., PAULIN L., LOHI H., SAINIO K., ANDRÉ C., 2009: An-cestral T-box Mutation Is Present in Many, but Not All, Short-Tailed Dog Breeds. Journal of Heredity 100 (2): 236–240.
INDREBØ A., LANGELAND M., JUUL H..M, SKOGMO H.K., RENGMARK A.H., LINGA-AS F., 2008: A study of inherited short tail and taillessness In Pembroke Welsh corgi. Journal of Small Animal Practice 49 (5): 220–224.
KAVKA A.I., GREEN J.B.A., 1997: Tales of tails: Brachyury and the T-box genes. Biochimica et Biophysica Acta 1333 (2): F73–F84.
MEISLER M.H., 1997: Mutation watch: Mouse brachyury (T), the T-box gene family, and human disease. Mammalian Genome 8 (11): 799–800.
PACKHAM E.A., BROOK J.D., 2003: T-box gene in human disorders. Human Molecular Genetics 12 (1): R37–R44.
PAPAIOANNAOU V.E., SILVER L.M., 1998: The T-box gene family. BioEssays 20 (1): 9––19.
PAPAPETROU C., EDWARDS Y.H., SOWDEN J.C., 1997: The T transcription factor functions
as a dimer and exhibits a common human po-lymorphism Gly-177-Asp in the conserved DNA-binding domain. The Federation of Eu-ropean Biochemical Societies Letters 409 (2): 201–206.
ROBINSON R., 1993: Expressivity of the Manx Gene in Cats. Journal of Heredity 84(3): 170––172.
SCHULTE-MERKER S., EEDEN VAN F.J.M., HALPERN M.E., KIMMEL C.B., NÜSSLE-IN-VOLHARD C., 1994: No tail (ntl) is the ze-brafish homologue of the mouse T (Brachyury) gene. Development 120: 1009–1015.
SCHULTE-MERKER S., HO R.K., HERRMANN B.G., NÜSSLEIN-VOLHARD C., 1992: The protein product of the zebrafish homologue of the mouse T gene is expressed in nuclei of the germ ring and the notochord of the early em-bryo. Development 116: 1021–1032.
SHOWELL C., BINDER O., CONLON F.L., 2004: T-box Genes in Early Embryogenesis Developmental Dynamics 229 (1): 201–218.
European Convention for the Protection of Pet Animals Strasbourg, 13 XI 1987, http://conven-tions.coe.int/Treaty/EN/Treaties/Html/125.htm
FCI – Standard Welsh Corgi (Pembroke) No39/28.11.2003/GB, http://www.fci.be/uplo-aded_files/039A2003_en.doc
Streszczenie: Molekularny test wykrywania mutacji C295G w genie T odpowiedzialnego za krótkoogoniastość i bezogoniastość u pembro-ke welsh corgi. Gen T należy do dużej rodziny genów z motywem T, która koduje czynniki transkrypcyjne, ulegające ekspresji podczas rozwoju zarodkowego. Białko T aktywuje geny specyficzne dla mezodermy i jest zaangażowa-ne w proces rozwoju struktur wywodzących się z tylnej części mezodermy, m.in. struny grzbie-towej. Mutację genu T warunkującą krótko-ogoniastość i bezogoniastość zidentyfikowano u 17 ras psów (Hytönen i wsp., 2008). U psów rasy pembroke welsh corgi jest ona dziedziczo-na w sposób autosomalny dominujący i u he-terozygot warunkuje fenotyp o skróconym lub szczątkowym ogonie. Homozygoty dominujące giną w okresie płodowym lub zaraz po urodzeniu (Indrebø i wsp., 2007). Obecnie w wielu krajach prawnie zabroniono cięcia ogonów u psów. Aby pies bez ogona lub też z ogonem szczątkowym mógł uczestniczyć w oficjalnych pokazach lub

A molecular test for the detection of the C295G mutation in the T gene responsible... 43
wystawie psów rasowych, jego właściciel musi mieć zaświadczenie, potwierdzające „natural-ność” krótkiego ogona u psa. Celem niniejszych badań było zaproponowanie testu diagnostycz-nego, identyfikującego mutację C295G w genie T oraz identyfikacja w polskiej populacji psów rasy pembroke welsh corgi heterozygot mutacji genu T warunkującego krótkoogoniastość i bez-ogoniastość. W tym celu wykorzystano enzym restrykcyjny BstEII, który tnie sekwencję w 191 pozycji nukleotydowej w eksonie 1 genu T. W wyniku mutacji powstaje dodatkowe miejsce restrykcyjne w pozycji 160. Spośród 30 przeba-danych psów zidentyfikowano 20 homozygot recesywnych i 10 heterozygot. Psy heterozygo-tyczne pod względem genu T miały fenotypowo
ogon krótki (6 psów) lub szczątkowy (4 psy). Zmienność długości ogona u krótkoogoniastych psów rasy pembroke welsh corgi wskazuje na istnienie być może różnic w sekwencjach innych genów, bezpośrednio oddziałujących z genem T.
MS. received August 2011
Authors’ address:Katedra Genetyki i Ogólnej Hodowli Zwierząt – SGGWul. Ciszewskiego 802-786 WarszawaPolande-mail: [email protected]

Annals of Warsaw University of Life Sciences – SGGWAnimal Science No 49, 2011: 45–51(Ann. Warsaw Univ. of Life Sc. – SGGW, Anim. Sci. 49, 2011)
Ecological and hydrological aspects of small river catchment management in Nature 2000 site
KRZYSZTOF KLIMASZEWSKI1, LESZEK HEJDUK2
1Department of Animal Environment Biology, Warsaw University of Life Sciences – SGGW 2Department Hydraulic Engineering and Environmental Restoration, Warsaw University of Life Sciences – SGGW
Abstract: Ecological and hydrological aspects of small river catchment management in Nature 2000 site. ‘Water Framework Directive’ stres-ses the maintaining of good ecological status of water ecosystems as well as holistic approach to water resources management. The aim of the study was to determine the possibilities of joint management measures of ecological and hydro-logical management of two small lowland river catchments: Zagożdżonka and Zwoleńka rivers, located in central Poland. Both are natural rivers, with lots of meanders and abounding biodiversi-ty of extensive agriculture and forest areas. The fi eld investigations were carried out to describe the habitat preferences of amphibians in two analyzed river catchments and to record the hy-drological values of the catchments. During con-sidered period the hydrological condition were above average (more wet) in a sense of rainfall and runoff. During the whole observation period nine amphibian species were recorded: Rana esculenta complex, R. temporaria, R. arvalis, Bufo bufo, Hyla arborea, Pelobates fuscus, Tri-turus vulgaris, Bombina bombina and Triturus cristatus. The most important species occurring in investigated catchments, listed in II Annex to Habitat Directive that require protection in-side Natura 2000 sites are Triturus cristatus and Bombina bombina.
Key words: amphibians, catchment management, Zwoleńka River, Zagożdżonka River.
INTRODUCTION
Water management became an impor-tant task for EU Member States since December 2000 when “Framework for Community Action in the Field of Water Policy” was established (European Commission, 2000). The main objective raised by this document (called also ‘Water Framework Directive’ – WFD) is for all surface waters, artificial and heav-ily modified waters and groundwaters to achieve good water status by 2015. It also aims to promote sustainable water use (sufficient provision of drinking water and water for other economic require-ments) and focus on mitigation of the effects of floods and droughts. It stresses the maintaining of good ecological status of water ecosystems, which means that only a slight departure from the biological values that may be expected in conditions of minimal anthropogenic impact will be allowed. Achievement of ecological objectives should consider an integrated approach to three basic com-ponents: water quality, water quantity, and physical structure which interact with each other (Logan, 2001).
46 K. Klimaszewski, L. Hejduk
This strong focus on the ecological aspects of freshwater is something new in Poland for water management authori-ties of different stages as well as scien-tists dealing with water managements. Holistic approach to water management and protection of the aquatic environ-ment suggests organization based on catchment areas. Although wider units may be of great value for this activities (Moog et al., 2004), it is confirmed by other authors that regional level of plan-ning and implementing measures also plays an important role in achieving the directive’s regulations (Braukmann and Pinter, 1997; Verdonschot, 2000; Dorge and Windolf, 2005).
The first step for planning manage-ment measures for such unit is the analy-sis of actual situation (condition) of the water body. The next steps should con-sider: definition of main threats, quanti-tative assessment of deficits, determina-tion of potential measures together with analysis and selection of conservation and/or restoration scenarios. After the implementation of measures the proper monitoring of results soul be conducted (Kolisch et al., 2000).
The aim of this study is to present the combination of ecological and hydro-logical analysis of two small lowland river catchments to determine the joint management measures.
STUDY AREA AND METHODS
The research was conducted within two catchements: Zagożdżonka and Zwoleńka rivers. They are located in central Poland (South-Mazovian Lowland) about 100 km south of Warsaw and both are the left bank inflows of the Vistula river. The
length of the Zagożdżonka river is 39.9 km and the size of the whole catchment is 568.5 km2. The size of the subcatch-ment till Płachty Stare gauge is 82.4 km2. The absolute relief of the watershed to Płachty Stare gauging point is 37 m (maximum and minimum elevation 185 and 148 m a.s.l. respectively). The mean slopes of the main channels are in the range of 2.0–3.5%. The existing valleys are narrow and shallow. The dominant soils are loamy soils and about 10% are pleats. The 50–70% of watershed is under cultivation. In streams valleys the pasture are dominant. The main crops are rye, wheat-rye and oat together with potato. The forest cover about 40% of catchment to Płachty Stare gauging point. The subcatchment till Płatchy Stare gauge is controlled in a sense of rainfall and runoff since 1963 (Hejduk et al., 2010). The average rainfall (years 1963–2008) for this area is estimated for 606 mm and runoff for 107 mm (Banasik, 2009). The measured rainfall in hydrological years 2009 and 2010 shows values above the average (661 mm and 808 mm respectively) what can describe those years as wets. The runoff for hydrological year 2009 was 66.6 mm and for 2010 was 119.8.
The Zwoleńka is a natural river, with lots of meanders and abounding biodi-versity. It’s length is 34.1 km and the catchment size is 230.2 km2. The average flow in 2002 was estimated for 1.09 m3/s for a whole catchment. Zwoleńka is a neighbor catchment of Zagożdżonka (Fig. 1) so the rainfall in both catchments can be estimate as comparable. Most of the research was done in the middle part of the Zwoleńka river close to Siekierka gauge (186.8 km2), however there is no

Ecological and hydrological aspects of small river catchment management... 47
long time hydrological observation for this gauge, so the runoff was calculated based on empirical equation estimated on the basis of semi-simultaneous flow measurements and peak hydrograph records. The runoff for year hydrologi-cal 2009 was 75.8 mm and for 2010 was 114.5 mm.
The dominant soil are loamy soils and sand. In the valley there is also peat. The main crops are rye and mixtures of corn and oat. The Zwoleńka valley is Natura 2000 site (PLH140006). In this area there are two nature reserves Borowiec and Ługi Helenowskie. There are about 80 species of birds and 19 species of mammals. According to Habitats Dire-ctive the most valuable species of verte-brates occurring in this site are: european weatherfish Misgurnus fossilis, european pond turtle Emys orbicularis, fire bel-lied toad Bombina bombina, marsh har-rier Circus aeruginosus, corncrake Crex
crex, black tern Chlidonias niger, king-fisher Alcedo atthis, european beaver Castor fiber. There are also 3 species of inverterbrates from II Annex of Habi-tats Directive: narrow-mouthed whorl snail Vertigo angustior, green snaketail Ophiogomphus Cecilia, yellow-spotted whiteface Leucorrhinia pectoralis. All those species are strictly connected with wetlands or slowly floating river valleys. The main purpose of establishing Natura 2000 was the preservation of lowland hay meadows (code 6510) covering 20% of site surface, natural eutrophic lakes (code 3150) covering 10% of the surface and Alluvial forests with Alnus glutinosa and Fraxinus excelsior (code 91E0) cov-ering 8% of the site.
During two spring seasons 2009 and 2010 the field investigations were carried out to describe the habitat preferences of amphibians in two analyzed river catch-ments. This group of animals due to its
FIGURE 1. Schematic location of Zagożdżonka and Zwoleńka catchments and transects
48 K. Klimaszewski, L. Hejduk
two-staged life cycle, needs two kinds of habitats to fulfill their life requirements: aquatic and terrestrial, so threats to either habitat can affect their populations. They seem to be a very fragile indicator of environmental processes also because as an adult form they are predators. The small river catchment with its habitat variety can be a good example of how such dual threats influence amphib-ians. The species composition has been recorded for different examples of water bodies (river, wetlands, peatbogs) and ter-restrial surroundings (forests, meadows, fields, etc.). 16 transect for Zagożdżonka river and 5 sites for Zwoleńka river were designated as representative for different habitats. Each transect was 100m long and covered terrestrial habitat next to water. The amphibians occurrence was recorded by the use of direct observa-tions of adults, larvae and eggs, netting and vocal recordings. Each transect or site was visited at least three times (one time at dark). The field observations were carried out from the begging of April to the end of June 2009 (Zagożdżonka) and the same part of year 2010 for Zwoleńka river, to cover the higher breeding activ-ity of amphibians.
RESULTS
During the whole observation period nine amphibian species were recorded: Rana esculenta complex, R. temporaria, R. ar-valis, Bufo bufo, Hyla arborea, Pelobates fuscus, Triturus vulgaris, Bombina bom-bina and Triturus cristatus. The detailed results of this investigation are presented in paper Klimaszewski et al. 2009. For each species the habitats needs were assessed (Tab. 1). As an addition to this
comparison we can divide amphibians according to dispersal power: Triturus species have extremely low dispersal power (few hundred meters), whilst all frogs and toads can travel much longer distances (more than 1 km).
Two years research period is too short for estimation of river regime and for prediction of species in relation to hydrological condition. During con-sidered period the hydrological condi-tion were above average (more wet) in a sense of rainfall and runoff. It is dif-ficult to make a long term relation based only on this data specially where there is no information about species observa-tion during dry periods. One of the most important period from species point of view is a breeding activity time – from begi nning of April to the end of June. In case of Zagożdżonka river, based on long term research, is possible to esti-mate the monthly distribution of rainfall and runoff (Fig. 2).
Periods from April to June are the months with relatively high average runoff during April and low average rainfall in the same months. The high flows during springtime are often caused by snowmelt or rain on snow situations. On the other hand, the height rainfall and runoff can occur during other months. This kind of situation were measured in May and September 2010 (Fig. 2).
As the river valley areas are the most preferable habitats during breeding and post-breeding time (Tab. 1), the deter-mination of flood range can have the important influence on land manage-ment and species protection. The small ponds are important due to two-stage life cycle of amphibians, so the research

Ecological and hydrological aspects of small river catchment management... 49
TABLE 1. Habitat preferences of amphibian species recorded in Zagożdżonka and Zwolenka river catchments (“–“ – of no importance for species, “+” – possible to use, “++” – suitable, “+++” – most preferable)
Rana
esc
ulen
ta
com
plex
Rana
te
mpo
rari
a
Rana
arv
alis
Bufo
buf
o
Hyl
a ar
bore
a
Tritu
rus
vulg
aris
Tritu
rus
cris
tatu
s
Bom
bina
bo
mbi
na
Pelo
bate
s fu
scus
Breeding habitatsRiver (with slowly running water) – + + + – – – – –River valley (meadows withSeasonally filled water bodies) + +++ +++ +++ + ++ + – +
Small ponds with dense water vegetation) ++ ++ ++ ++ +++ +++ +++ ++ ++
Big shallow water bodies (in peatbogs) +++ ++ ++ ++ +++ ++ + ++ +Post-breeding habitats
Water bodies and surroundings +++ + + + + ++ +++ +++ +River valleys (meadows) + +++ +++ +++ ++ +++ ++ + ++Arable fields – + + ++ – – – – +Wastelands with shrub and bushes – ++ ++ +++ + ++ +++ – +++Forests – +++ +++ +++ ++ ++ ++ – +
FIGURE 2. Monthly distribution of rainfall and runoff during investigation period and long term ave-rages for Płachty Stare gauge
0
50
100
150
200
250
XI XII I II III IV V VI VII VIII IX X
rain
fall
(mm
)
0
10
20
30
40
50
60
70
80
Months
runo
ff (m
m)
20092010Average (63-10)
50 K. Klimaszewski, L. Hejduk
for determination of condition of drying such ponds can be an important issue for protected species management to fulfill habitat directive requirements.
CONCLUSIONS
1. Management of the catchment should consider preservation of all habitats used by amphibians. First – the condition of water bodies cannot be changed, second – the water flow in the rivers should allow existence of seasonal, small water bodies.
2. The most important species occur-ring in investigated catchments, listed in II Annex to Habitat Directive that require protection inside Natura 2000 sites are Triturus cristatus and Bombina bombina.
3. As the investigations has been car-ried during wet years it is important to conduct them during dry years to avoid the influence of specific condition on estimation of species occurrence.
AcknowledgementThe paper has been prepared with financial support by a grant from Iceland, Liechtenstein and Norway through the EEA Financial Mechanism and the Norwegian Financial Mechanism and Resource for Sciences (2008–2011), and by Polish Ministry of Sciences and Higher Education. The support provided by these organizations is gratefully acknowledged.
REFERENCESACHLEITNER S., TOFFOL S., ENGEL-
HARD C., RAUCH W., 2005: The European Water Framework Directive: Water Quality Classification and Implications to Engineering
Planning. Environmental Management. Vol: 35, Issue: 4. Springer-Verlag.
BANASIK K., 2009: Czasy opóźnień odpływu wezbraniowego i fali rumowiska z małych zlewni rolniczych. Projekt badawczy Specjal-ny MNISW nr. COST 21/2005. Maszynopis.
BRAUKMANN U., PINTER I., 1997: Concept for an integrated ecological evaluation of run-ning waters. Acta Hydrochim. Hydrobiol., 25: 113–127.
DORGE J., WINDOLF J., 2005: Implementation of the water framework directive – can we use models as a tool in integrated river basin mana-gement Intl. J. River Basin Management Vol. 1, No 2, pp. 165–171.
EUROPEAN COMMISSION, 2000: DIRECTI-VE 2000/60/EC. Establishing a framework for community action in the field of water policy. European Commission PE-CONS 3639/1/100 Rev. 1, Luxembourg.
GOETHALS P.L.M., DE PAUW N., 2001: De-velopment of a concept for integrated ecolo-gical river assessment in Flanders. (Belgium). J. Limnol. 60: 7–16.
HEJDUK L., BANASIK K., HEJDUK A., 2010: Monitoring ilości i jakości wody w małej zlewni. Hydrologia w inżynierii i gospodarce wodnej. T. 1 (pod red. Beniamina Więzika, Monografie) Polska Akademia Nauk. Komitet Inżynierii Środowiska, nr 68.
KLIMASZEWSKI K., JAROSIŃSKA P., RO-MAŃSKI B., 2009: The habitat preferences of amphibians in the catchment area of the Za-gożdżonka River. Ann. Warsaw Agricult. Univ. – SGGW, Anim. Sci. No 63.
KOLISCH G., LONDONG J., RENNER J., 2000:Integrated and sustainable river basin manage-ment by German river associations. Water, 10: 38–41.
LOGAN P., 2001: Ecological quality assessment of rivers and integrated catchment management in England and Wales. In: Ravera O. (ed.), Scientific and legal aspects of biological moni-toring in Freshwater. J. Limnol. 60 (Suppl. 1): 25–32.
MOOG O., SCHMIDT-KLOIBER A., OFEN-BÖCK T., GERRITSEN J., 2004: Does the ecoregion approach support the typological demands of the EU `Water Framework Direc-tive’? Hydrobiologia, Volume 516, Number 1, pp. 21–33(13). Springer.
Ecological and hydrological aspects of small river catchment management... 51
VERDONSCHOT P.F.M., 2000: Integrated eco-logical assessment methods as a basis for susta-inable catchment management. Hydrobiologia, Vol. 422–423, No 0, pp. 389–412
Streszczenie: Ekologiczne i hydrologiczne aspek-ty gospodarowania w małej zlewni na obszarze Natura 2000. W pracy przedstawiono wyniki ba-dań dla dwóch zlewni (Zagożdżonki i Zwoleńki) o dominującym rolniczym zagospodarowaniu, w granicach których wyznaczone zostały obszary Natura 2000. Przeprowadzono badania występo-wania różnych gatunków płazów w latach 2009 i 2010. Ta grupa zwierząt, ze względu na dwu-stopniowe cykle życia, potrzebuje dwóch rodza-jów siedlisk – wodnego i lądowego, więc zagro-żenia dla tych siedlisk mogą mieć wpływ na ich populacji. Dodatkowo, na podstawie badań hy-drologicznych, ustalono okresy, których warunki hydrologiczne mogą mieć wpływ na cykl życio-wy płazów. Praca jest wynikiem połączenia badań ekologicznych i hydrologicznych dla uzyskania
wspólnych działań gospodarowania zlewniami w aspekcie ekologicznym.
MS. received September 2011
Autors’ addresses:Krzysztof KlimaszewskiZakład ZoologiiKatedra Biologii Środowiska ZwierzątWydział Nauk o Zwierzętach – SGGWul. Ciszewskiego 802-786 WarszawaPolandLeszek HejdukZakład Inżynierii RzecznejKatedra Inżynierii WodnejWydział Budownictwa i Inżynierii Środowiska – SGGWul. Nowoursynowska 15902-787 WarszawaPoland


Annals of Warsaw University of Life Sciences – SGGWAnimal Science No 49, 2011: 53–59(Ann. Warsaw Univ. of Life Sc. – SGGW, Anim. Sci. 49, 2011)
Human – animal relations: the case of two primate species keptat Warsaw Zoo
TADEUSZ KALETA, BEATA MIELCZARCZYKDepartment of Genetics and Animal Breeding, Warsaw University of Life Sciences – SGGW
Abstract: Human – animal relations: the case of two primate species kept at Warsaw Zoo. In this work authors tried to compare in visitors of War-saw Zoo attraction of two primate species: the tufted capuchin monkey (Cebus paella) and the hamadryas baboon (Papio hamadryas). The other aim was to estimate the effect of visitors on ani-mal activity. Number, sex and age of visitors was determined. Special scales to measure the whole monkey group activity were also elaborated. The exhibit of hamadryas baboon attracted more vi-sitors than capuchin monkey and greater number of behaviour acts directed to animals was also recorded there. Pointing at animals and laughter turned out to be the most frequent behaviour types of visitors. The sex of visitors had more pronoun-ced effect on the their behaviour that an age. The effect of visitor number on the activity of whole group of monkeys was signifi cant in both prima-tes. This study should be supplemented by the de-tailed observation of primate behaviour.
Key words: Zoo, visitors, behaviour, hamadryas baboon, tufted capuchin monkey.
INTRODUCTION
The relationship between the visitors presence and behaviour and animals behaviour at zoological garden is well-known fact (Hosey et al., 2009). Animals evoke various reactions in humans and stimulate them to express opinions on animals and on an exposition. But op-
posite is also true. Presence and behavior of visitors can influence animal activity. These facts were established partly as an results of observations of captive primates. For example previous study of author (Kaleta et al., 2004) carried out at Warsaw Zoo showed that chimpanzee (Pan troglodytes) agonistic and begging behaviour were to some degree evoked by visitor verbal and non-verbal signals. The non-verbal signals embraced point-ing at animals, throwing food items and objects, waving hands, clap and attempt to come close to the cage. Verbal signals were either addressed to animals or re-marks concerning opinions on enclosure, characteristics of chimpanzees etc. On the other hand, chimpanzee used various begging signals to obtain food items from visitors.
The main aim of this study was to com-pare the effect of visitors on the behaviour of two primate species quite popular in zoological gardens: hamadryas baboon (Papio hamadryas) and tufted capuchin monkey (Cebus apella). The other aim was to show hypothethical relationship between visitor behaviour and character-istic such as an age and sex.
The mode of life of monkey species studied is different. Hamadryas baboon
54 T. Kaleta, B. Mielczarczyk
is an animal of open often semi – arid plains, which usually live in one-male and rather numerous group. Capuchin monkey is adapted to life in tropical forest. The group of this species com-prises several individuals of both sexes. The feeding of both species involves wide array of plant and animal food (Napier and Napier, 1985).
At Warsaw Zoo both species were kept under standard conditions. Hamadryas baboons occupied old-fashioned “mod-ernist” exhibit made of artificial rock with the moat as a barrier between an animal and visitor. In the case of tufted capuchins they lived in double inner ad outdoor enclosure. Outdoor enclosure has been recently renewed by using glass panels which partially replaced the wire. As regards furnishing baboon exhibit was rather barren with small number “trees” whereas in capuchin enclosure there were many enrichment items usu-ally used in monkeys at zoos (boughts, ropes etc.).
MATERIAL AND METHODS
In sum, the group of hamadryas baboons comprised of 44 individuals: 25 males, 15 females and 4 youngs of indetermi-nate sex. There was some fluctuation in number of baboons during the observation period. In the case of hamadryas baboon exhibited at Warsaw Zoo knowledge concerning age of animals was limited. The oldest female was 34 years old, and an age of many other individual (females and males) was around 10 years old. The age of the oldest male was indeterminate, probably equal to the oldest female.
The group of tufted capuchins com-prised of 15 individuals: 2 males,
11 females and 2 young monkeys of indeterminate sex. The oldest female was 26 years old, the youngest – one year old. From two males first was 16 years old, the second – very young (was born previous year). The number of capuchin monkeys also fluctuated during the observation period.
The observations were carried out between the May and September of 2010. Observer tried to select the days and hours with potentially the highest level of visitors presence at the Warsaw Zoo (e.g. weekends, sunny days). In total there were 66 hours of ad libidum obser-vations divided equally into the observa-tion of baboon and capuchin exhibits. Prior to recorded observation there was one hour pilot observation. The schedule of observations was shown in Table 1.
During the study period observer has occupied determined place near the exhibit which enabling him the best pos-sible view of animals and approaching visitors. The observation simultaneously focused on the visitors and animals. Number of visitors near the exposition was counted every 10 minutes. Verbal and non-verbal reactions of visitors were also recorded. The classification of visitors gestures is based on the previ-ous study on chimpanzee (Kaleta et al., 2004). In the case of the visitor behavior his/her sex and age was determined.
In the case of animal behaviour it was need to elaborate the system of recording the whole group activity. It is shown in Table 2. Taking into account differences between species behavior (ascertained in the pilot observation) two independ-ent ordinal scales were used. In the case of baboon the animals could not hide in shelter during daily activity. Therefore,

Human – animal relations: the case of two primate species kept at Warsaw Zoo 55
TABLE 1. The observation schedule
DayHours of capuchin
observation
Hours of baboon
observationDay
Hours of capuchin
observation
Hours of baboon
observation02.05.2010 1205–1315 1330–1430 01.08.2010 1240–1340 1400–1500
23.05.2010 1220–1320 13.45–1445 07.08.2010 1230–1330 1430–1530
29.05.2010 1135–1235 1310–1410 14.08.2010 1430–1530 12101410
30.05.2010 1125–1225 1245–1345 15.08.2010 1435–1635 1315–1415
06.06.2010 1230–1330 1345– 1445 21.08.2010 1205–1405 1420–1520
12.06.2010 1115–1215 1220–1320 22.08.2010 1200–1330 14001530
13.06.2010 1330–1430 1215–1315 28.08.2010 1240–1410 1420–1520
26.06.2010 1120–1220 1235–1325 29.08.2010 1200–1330 1350–1520
27.06.2010 1530–1630 1405–1505 04.09.2010 1135–1305 1325–1455
03.07.2010 1700–1800 1540–1640 05.09.2010 1235–1335 1400–1600
10.07.2010 1335–1435 1500–1600 11.09.2010 1140–1240 1035–1135
11.07.2010 1430–1530 1535–1635 12.09.2010 1100–1300 1330–1500
17.07.2010 1330–1430 1435–1535 25.09.2010 1225–1325 1340–1540
18.07.2010 1235–1335 1120–1220
31.07.2010 1020–1120 1240–1340
TABLE 2. Scales used in primate reaction classifi cation
Hamadryas baboon Tufted capuchinActivity/Behaviour Points Activity/Behaviour Points
No animal in outdoor encloure 0
Resting and basking of the whole group 1 Presence of up to 3 individuals, low level of activity 1
Low level of activity: mutual grooming, looking around, looking for food items in moat, washing food
2 Same number, high level of activity 2
Walking, climbing, wading and waiting for food 3 Presence of 5 or 6 individuals, high level
of activity 3
Playing, running, copulations, receiving food items from visitors 4 At least half of a group visible, high
level of activity physical and/or vocal 4
High level of arousal, conflicts over female, agonistic displays, vocalization 5
the score “0” was excluded in this case. On the other hand, the behaviour and activity level was more varied in baboon than in the capuchin. Hence, the “5” score was granted in this case.
Concerning the analysis of results of observation two questions seems to be the most important:
(1) Have the age and sex of visitors effect on the visitors behaviour (particu-larly gestures)?
(2) Have the visitors effect on the ani-mals activity and behaviour?
The following statistical methods were used to test above-mentioned ques-tions: chi-square test in the case of (1)

56 T. Kaleta, B. Mielczarczyk
and Spearman correlation in the case of (2) question.
RESULTS AND DISCUSSION
After little training it was possible to determine the number of visitors looking at primate exhibits quite efficiently. The total number of visitors recorded over the study period was over 2000 persons. However, the exact number of persons is hard to determine due to the fact that the same persons could be counted twice or more for example when they stayed longer near the exhibit or returned to it. Nevertheless, markedly greater number of visitors of hamadryas baboon exhibit than the capuchin exhibit was recorded. Mean number of visitors of baboon ex-hibit in 10 minutes period was approxi-mately twice as in the case of capuchin. The groups of visitors were balanced as regards an age and sex (Tab. 3).
The total number of gestures and other types of behaviour (GOB) performed by visitors is shown in Table 4. Their predominance in the case of hamadryas baboon exhibit was clear consequence of difference in number of visitors shown above. However, it is interesting that behaviour of visitors was more frequent in adults than children and this differ-ence was more visible near the baboon exhibit. Moreover, women were more prone to non-verbal reactions than men.
The analysis of behaviours performed by visitors (Tab. 5) showed that the nearly all previously assumed behaviour categories were present in the studied group. Pointing at animals gesture was observed far more frequently than others. Important were also laugh (in children) and placing child on the rail separating exhibit (apparently to enable them to have a better view). The last behaviour
TABLE 3. The number, sex and age of visitors
Total number of visitors during the whole observation periodTCE*HBE**
7 47514 083
The mean number of visitors in 10 min period (33 observations)TCEHBE
22.642.7
% of adultsTCEHBE
66.762.0
% of male adultsTCEHBE
47.048.0
% of boysTCEHBE
48.049.0
* TCE – Tuft capuchin exhibit** HBE – Hamadryas baboon exhibit
TABLE 4. Total number of behaviour performed by visitors of various sex and age
Total number of gestures and other behaviours (GOB) recorded
7 330
% of GOB recorded in the whole groupTCEHBE
39.061.0
% of GOB recorded in adultsTCEHBE
26.041.0
% of GOB recorded in childrenTCEHBE
12.020.0
% of GOB recorded in menTCEHBE
12.019.0
% of GOB recorded in boysTCEHBE
6.010.0
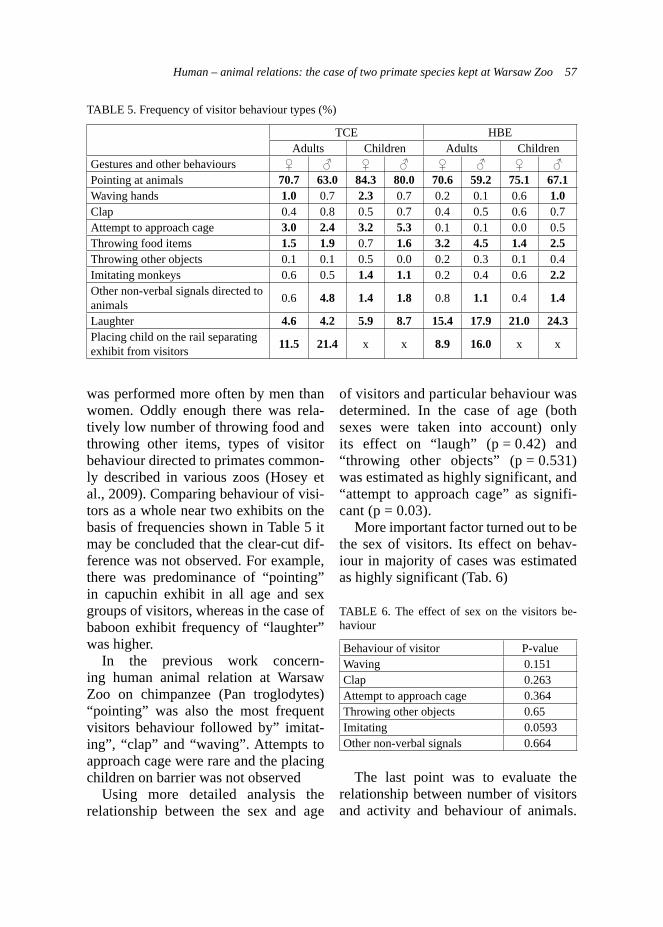
Human – animal relations: the case of two primate species kept at Warsaw Zoo 57
was performed more often by men than women. Oddly enough there was rela-tively low number of throwing food and throwing other items, types of visitor behaviour directed to primates common-ly described in various zoos (Hosey et al., 2009). Comparing behaviour of visi-tors as a whole near two exhibits on the basis of frequencies shown in Table 5 it may be concluded that the clear-cut dif-ference was not observed. For example, there was predominance of “pointing” in capuchin exhibit in all age and sex groups of visitors, whereas in the case of baboon exhibit frequency of “laughter” was higher.
In the previous work concern-ing human animal relation at Warsaw Zoo on chimpanzee (Pan troglodytes) “pointing” was also the most frequent visitors behaviour followed by” imitat-ing”, “clap” and “waving”. Attempts to approach cage were rare and the placing children on barrier was not observed
Using more detailed analysis the relationship between the sex and age
of visitors and particular behaviour was determined. In the case of age (both sexes were taken into account) only its effect on “laugh” (p = 0.42) and “throwing other objects” (p = 0.531) was estimated as highly significant, and “attempt to approach cage” as signifi-cant (p = 0.03).
More important factor turned out to be the sex of visitors. Its effect on behav-iour in majority of cases was estimated as highly significant (Tab. 6)
TABLE 6. The effect of sex on the visitors be-haviour
Behaviour of visitor P-valueWaving 0.151Clap 0.263Attempt to approach cage 0.364Throwing other objects 0.65Imitating 0.0593Other non-verbal signals 0.664
The last point was to evaluate the relationship between number of visitors and activity and behaviour of animals.
TABLE 5. Frequency of visitor behaviour types (%)
TCE HBEAdults Children Adults Children
Gestures and other behaviours ♀ ♂ ♀ ♂ ♀ ♂ ♀ ♂Pointing at animals 70.7 63.0 84.3 80.0 70.6 59.2 75.1 67.1Waving hands 1.0 0.7 2.3 0.7 0.2 0.1 0.6 1.0Clap 0.4 0.8 0.5 0.7 0.4 0.5 0.6 0.7Attempt to approach cage 3.0 2.4 3.2 5.3 0.1 0.1 0.0 0.5Throwing food items 1.5 1.9 0.7 1.6 3.2 4.5 1.4 2.5Throwing other objects 0.1 0.1 0.5 0.0 0.2 0.3 0.1 0.4Imitating monkeys 0.6 0.5 1.4 1.1 0.2 0.4 0.6 2.2Other non-verbal signals directed to animals 0.6 4.8 1.4 1.8 0.8 1.1 0.4 1.4
Laughter 4.6 4.2 5.9 8.7 15.4 17.9 21.0 24.3Placing child on the rail separating exhibit from visitors 11.5 21.4 x x 8.9 16.0 x x
58 T. Kaleta, B. Mielczarczyk
Correlation coefficients yielded were 0.38 and 0.45 for tufted capuchin mon-keys and the hamadryad baboon accord-ingly. Both correlations were significant (p < 0.05). To comment these findings shortly, more visitors meant in the case of capuchin also more specimens in an out-door enclosure. The hamadyas baboon showed in this time high level of motor activity, more conflicts and agonistic dis-plays. Both, capuchins ad baboons when “met” visitors jumped and run excitedly (especially baboons) as if they clearly expected the food items provided by visitors. However, according to method authors did not prepare detailed analysis of primate behaviour (particularly signs of abnormal behaviour) only used it to score the activity.
There are some works concerning effect of zoo visitor on primates behav-iour. In fact, “most of the studies on zoo visitor effect have been done on pri-mates” (Hosey et al., 2009). However, these studies focused rather on qualita-tive analysis of animal behaviour and showed bad effect of visitors presence on animals (Hosey, 2000). In the present study authors emphasized only positive correlation between number of visitors and level of primates activity and dif-ference between two primates in this respect.
It should be emphasized that neither hamadryas baboon, nor capuchin monkey did show begging reaction directed to visitors. This behaviour is commonly observed in apes and bears.
CONCLUSIONS
1. Observations carried out at Warsaw Zoo showed that hamadryas baboon
attracted more visitors than tufted capuchin monkeys in the same period. The reason is probably far larger group of baboons with more complex social life. The hamadyas baboons were also forced to stay “on display” and had no access to indoor enclosure as capuchins did.
2. Visitors did not only prefer hamad-ryas baboon but showed also greater number of behaviour acts directed to observed animals.
3. “Pointing at animal” and “laugh” turned out to be the most important types of visitor behaviour.
4. Measured in the context of behav-iour differentiation the effect of visitor sex on behaviour was greater than an age.
5. In both primates, there was signifi-cant effect of visitors presence on animal activity. Only the effect on the whole group of monkeys was studied. The effect of visitors on particular behaviour types (especially abnormal behaviour) is left to be done.
REFERENCES
HOSEY G., 2000: Zoo animals and their human audiences: what is the visitor effect? Animal Welfare 9, 343–357.
HOSEY G., MELFI W., PANKHURST S., 2009: Zoo Animals. Behaviour, Management and Welfare. Oxford University Press, Oxford, New York.
KALETA T., TUMIALIS D., MAŁODOBRA M., 2004: The introductory study concerning human-animal relations in Warsaw Zoological Garden – the case of chimpanzee (Pan troglo-dytes). Annals of Warsaw Agricultural Univer-sity-Animal Science 42, 3–7.
NAPIER J., NAPIER P., 1985: The natural histo-ry of the primates. The MIT Press, Cambridge (Mass).
Human – animal relations: the case of two primate species kept at Warsaw Zoo 59
Streszczenie: Relecje ludzie – zwierzęta: przypa-dek dwóch naczelnych gatunków. W pracy autorzy starali się porównać popularność u zwiedzających dwóch gatunków naczelnych w ZOO Warszawa: kapucynki czubatej (Cebus paella) i pawiana płaszczowego (Papio hamadryas). Innym celem było oszacowanie wpływu liczby zwiedzających na aktywność zwierząt. Określano liczbę, płeć i wiek zwiedzających. Opracowano także skalę do mierzenia aktywności całej grupy małp. Wy-bieg pawianów płaszczowych przyciągał więcej widzów, niż ekspozycja kapucynek i odnotowano tam również większą liczbę zachowań zwiedza-jących, kierowanych do zwierząt. Wskazywanie ręką na zwierzęta i śmiech okazały się być naj-częściej występującymi zachowaniami zwiedza-
jących. Płeć zwiedzających miała większy wpływ na ich zachowanie się niż wiek. Wpływ liczby zwiedzających na aktywność całej grupy małp był istotny u obu gatunków naczelnych. Badanie to powinno być uzupełnione szczegółowymi ob-serwacjami zachowania się zwierząt.
MS. received August 2011
Authors’ address:Katedra Genetyki i Ogólnej Hodowli Zwierząt – SGGW02-786 Warszawaul. Ciszewskiego 8Poland


Annals of Warsaw University of Life Sciences – SGGWAnimal Science No 49, 2011: 61–67(Ann. Warsaw Univ. of Life Sc. – SGGW, Anim. Sci. 49, 2011)
Fatty acid composition of milk from Brown Swiss and Holstein--Friesian black and white cows kept in a certified organic farm
BEATA KUCZYŃSKA1, KAMILA PUPPEL1, EWA METERA2, PIOTR KLIŚ1,ANNA GRODZKA1, TOMASZ SAKOWSKI2
1 Department of Animal Breeding, Faculty of Animal Science, Warsaw University of Life Sciences – SGGW2 Animal Science Department, Institute of Genetics and Animal Breeding, Polish Academy of Science, Jastrzębiec
Abstract: Fatty acid composition of milk from Brown Swiss and Holstein-Friesian black and white cows kept in a certifi ed organic farm. The objective of the present study was to evaluate the fatty acid composition of cows milk, kept in a cer-tifi ed organic farm, independent of breed and se-ason of nutrition. In the selected dairy farm, cows of two different breeds, i.e. Brown Swiss (BS) and Holstein-Friesian black and white (HF) between 45th–100th day of lactation, were managed under the same environment conditions. There were hi-ghly signifi cant effects of the season on the SFA content in milk, where in SFA content were higher in the winter season compared with the summer season. The studies showed a signifi cant infl uen-ce of the season on the level of: BA, TVA, LA, CLA9, CLA10, EPA, DPA, DHA. Milk from BS cows was characterized by higher concentration of SFA, BA, AA, EPA and DPA during summer season of feeding. However, milk from HF cows was characterized higher concentration of MUFA, PUFA, OA, LA, TVA and CLA and lover of SFA. In the winter season milk from BS cows was characterized by a higher concentration of SFA, MUFA, BA, TVA and CLA compared with milk of HF breed. Finally, milk from HF breed in orga-nic system during summer and winter season was characterized much higher nutritional value.
Key words: milk quality, organic milk, CLA, fatty acid.
INTRODUCTION
Fatty acids (FA) found in cows milk can be divided into: SFA (saturated fatty acid) and UFA (unsaturated fatty acid). Functional properties of FA are associ-ated with: chain length, saturation and position of the first double bond (n-3, n-6, n-9). Pro health properties have fol-lowing fatty acids: BA (C4:0), OA (18:1 cis-9), LA (C18:2), LNA (C18:3), CLA (C18:2 cis-9, trans-11), TVA (C18:1 trans 11), AA (C20:4), EPA (C20:5) and DHA (C 22:6). There are multiple potential isomers of CLA, but the cis-9, trans-11 (CLA9) and trans-10, cis-12 (CLA10) isomers are thought to be active as potential antioxidant, anticar-cinogenic, immune-modulating agents and also may normalized glucose level in blood (McGuire and McGuire, 2000). The uniqueness of these effects was recognized in the National Academy of Science report Carcinogens and Anticar-cinogens in the Human Diet, which stated that CLA is the only fatty acid shown unequivocally to inhibit carcinogenesis in experimental animals (NRC, 1996).

62 B. Kuczyńska et al.
Many factors affect the FA composi-tion of bovine milk, including: breed (White et al., 2001), season of feeding, stage of lactation, age of cows (Nałęcz-Tarwacka, 2006), access to fresh grass (Nałęcz-Tarwacka and Grodzki, 2005), system of production (Metera et al., 2010) and supplementation (Puppel, 2011). However, the effect of dairy nutri-tion on milk fat composition is much stronger than the effects of other agro-nomic factors. For example, increasing fresh forage intake (Nałęcz-Tarwacka and Grodzki, 2005), or the use of fish oil and linseeds supplements (Puppel, 2011) have been shown to reduces the content of SFA and increases the content of OA, LA, LNA, TVA, EPA, DHA and CLA9. In contrast, feeding conserved forage reduces the concentrations of CLA and ALA, and increases SFA concentra-tions in milk fat (Elgersma et al., 2003). Research has also suggested that fatty acid composition of milk by cows under organic management differ from those produced by cows under conventional management (Ellis et al., 2006; Collomb et al., 2008; Metera et al., 2010).
There were no reference in the litera-ture about fatty acid composition of milk from Brown Swiss and Holstein-Friesian cows kept in a certified organic farm in Poland. This is a new solution and makes it possible to analyze changes occurring in content selected fatty acid in cows milk caused by the organic system.
MATERIALS AND METHODS
The study was conducted in a certified organic farm. In the farm, dairy cows of two different breeds: Brown Swiss (BS) and Holstein-Friesian (HF) were
TABLE 1. Components of the treatments in ex-periment
CompositionTreatment
Summer season
Winter season
Ingredient (kg/d)Hay meadow 8.68 –Yellow lupine and pea 0.50 –Oats and field pea 2.00 –Forage grass with red clover 50.00 –
spelled 1 1.00 –spelled 2 1.00 –Corn meal – 1.00Oats with field pea meal – 4.00Rye meal – 2.00Grass silage with red clover – 23.50
Grass hay with red clover – 6.50
JPM 18.37 17.21BTJE 1381.90 1370.70BTJN 1950.70 1734.60
kept. Fifteen BS and fifteen HF lactating primiparous, between 45th–100th day of lactation, were chosen to the experiment. The cows of the both breeds in the farm were kept under the same environmental conditions in a free stall dairy barn.
In the surveyed farm in the feeding of cows used the following feed. In the summer season: hay meadow; yellow lupine, pea; oats and field pea; forage grass with red clover and spelled. But in the winter season: corn meal; oats with field pea meal, rye meal, grass silage with red clover and grass hay with red clover (Tab. 1).
Sampling
Representative milk samples were col-lected from each cow during evening milking by means of a milk meter. Milk
Fatty acid composition of milk from Brown Swiss and Holstein-Friesian black... 63
were placed in sterile bottles, preserved Mlekostat CC. After milking samples were immediately submitted to the Cattle Breeding Division (Milk Testing Laboratory of Warsaw University of Life Sciences) for compositional analysis.
Fatty acid analyses
For examination faty acid composition, extraction of fat was performed accord-ing to Röse-Gottlieb procedure (AOAC, 1990) at a room temperature. Fatty acid methylation was performed according to the transesterification method by Kramer et al. (1997). The identification with fatty acid standards and quantitative determination of individual fatty acids in crude fat was conducted in Hewlett Packard 6890 GC with HP Chem soft-ware, a flame-ionization detector CP-Sil 88 (100 m length, 0.25 mm in diameter and 0.25 μm thick). The helium carrier gas was maintained at a linear velocity of 25 cm/s.
The separation was performed at pre-programmed temperature: 130°C for 1 min; 130–170°C at 6.5°C/min; 170––215°C at 2.75°/min; 215°C for 12 min, 215–230°C at 20°C/min and 230°C for 3 min. Other parameters were: split sample injector (40:1); injector tempera-ture 220°C; and detector temperature, 240°C.
Statistical analyses
The data obtained were analyzed statisti-cally using a multi-factor analysis of variance (least squares) by means of the SPSS 12.0 packet software. Only inter-actions between factors whose influence was statistically significant (P ≤ 0.001, P ≤ 0.01 or P ≤ 0.05) were considered in
the study. The level of significance was determined after performing preliminary statistical analyses.
The model used was:
Y ijk = μ + Ai + Bj + (Ai * Bj ) + eijk
Where: Yijk = dependent variable, μ – general mean, Ai – breed effect (i = 1 – 2), Bj – season of the feeding (j = 1 – 2), (Ai · Bj) – fixed interaction effect between breed and season of the feeding.
RESULTS AND DISCUSSION
Table 2 shows the changes in the contents of fatty acids independent of breed and season of nutrition. Studies demonstrated a statistically higher content of each group of fatty acids in the summer season i.e.: SFA, PUFA, n-3, n-6 and n-3/n-6. Only significant interaction season*breed for n-3/n-6 was recorded. Milk from dairy cows grazing on pasture was character-ized by a favorable concentration of all groups of fatty acids compared with the winter season.
There were significant effects (Tab. 2; P ≤ 0.001) of the season on the SFA con-tent in milk, wherein SFA concentrations were higher in the winter season com-pared with the summer season. Study has shown, that grazing of both grass and red clover swards were associated with a significantly lower SFA content in milk compared with no grazing. In the case of SFA, favorable (lower) level obtained in the milk of HF cows, and it was in the range from 58.48 to 69.12 g/100 g of fat. Ellis et al. (2006) has been shown that increased SFA level is recorded, when white clover silage, red-clover silage, or

64 B. Kuczyńska et al.
grass silage were fed compared with no silage feeding. Lover SFA content in milk is advantageous from the point of view of the consumer’s health, but it does not apply to butyric acid (BA) level which has health-promoting properties (Parodi, 1999; Chilliard et al., 2001). The BA level was higher in milk of BS cows both in the summer and winter season of feed-ing and ranged from 2.23 to 1.88 g/100 g of fat respectively. Kelsey et al. (2003) also reported higher level of BA in milk of BS compared to HF breed.
The studies showed a significant influ-ence of the season on the level of: BA,
TVA, LA, CLA9, CLA10, EPA, DPA, DHA. Study has been demonstrated a significant effect of breed only in the case of CLA10. The statistical interaction season * breed has been demonstrated also for CLA10.
There were no significant effects of the season and breed on the monounsatu-rated fatty acid (MUFA) content in cows milk. The concentration of MUFA was higher in the winter season compared with the summer season in milk of BS cows, but in the case of HF cows higher concentration of MUFA in the summer season was recorded. There were highly
TABLE 2. Fatty acid of cows milk depending the season of feeding, and race in organic farm (g/100 g of fat)
ParametersSignificant
SeasonSummer feeding Winter feeding
BS HF BS HFseason breed season*
breed LSM SE LSM SE LSM SE LSM SESFA *** NS NS 61.60 3.941 58.48 4.300 69.14 2.049 69.12 2.914BA *** NS NS 2.239 0.353 2.097 0.416 1.885 0.127 1.842 0.205BCFA *** NS NS 4.77 0.616 5.05 0.617 5.45 0.497 5.38 0.510MUFA NS NS NS 21.31 4.858 22.38 5.286 21.87 2.073 21.72 2.720TVA *** NS NS 3.324 1.797 4.281 2.030 1.208 0.256 1.043 0.365OA NS NS NS 14.394 2.768 14.424 2.342 16.652 2.329 16.719 2.283PUFA *** NS NS 4.89 0.788 5.45 1.364 3.48 0.351 3.53 0.399LA *** NS NS 1.952 0.241 2.090 0.442 1.445 0.138 1.498 0.156CLA9(cis-9, trans-11)
*** NS NS 1.594 0.760 1.998 0.859 0.698 0.108 0.629 0.154
CLA10 (trans-10, cis-12)
*** *** *** 0.144 0.037 0.276 0.055 0.105 0.016 0.095 0.021
AA * NS NS 0.114 0.031 0.106 0.042 0.084 0.025 0.098 0.020EPA *** NS NS 0.095 0.017 0.092 0.032 0.107 0.012 0.119 0.016DPA *** NS NS 0.051 0.011 0.050 0.029 0.161 0.031 0.173 0.038DHA *** NS NS 0.019 0.005 0.019 0.006 0.032 0.006 0.033 0.007n-3:n-6 *** NS * 1.97 0.333 2.28 0.512 1.34 0.148 1.32 0.131
LSM – least square mean; SE – standard error of the mean;NS – no signifi cant, *P ≤ 0,05; **P ≤ 0,01; ***P ≤ 0,001

Fatty acid composition of milk from Brown Swiss and Holstein-Friesian black... 65
significant effects (Tab. 2; P ≤ 0.001) of the season on the trans-vaccenic acid (TVA) concentration in milk of both breed of cows. Higher concentration of TVA was recorded in the summer feed-ing season. Summarize grazing had a sig-nificant effect on the level of this acids in the cows milk. Ellis et al. (2006) shown also, that grazing grass or white clover is associated with increased vaccenic acid concentration in cows milk. Research has also shown higher concentration of TVA in milk of HF cows in the summer season, but in the winter season higher concentration of this acid was recorded in BS cows milk.
There were highly significant effects of the season on the concentration of polyunsaturated fatty acids (PUFA) in the cows milk (Tab. 2; P ≤ 0.001). The concentration of PUFA was higher in the summer season compared with the winter season in both breed of cows. The concentration of PUFA was higher in the milk of HF cows, both in the summer and winter season. The milk from BS cows was characterized by higher concentration of AA, EPA and DPA during summer season. However, milk from HF cows was characterized by a higher concentration of LA during this season.
There were highly significant effects of the season on the concentration of CLA in cows milk in both breed. A seasonal effect was seen with increased CLA con-centration during summer season. Graz-ing forage with red-clover was associ-ated with higher concentrations of CLA in milk. The results of many works indi-cate that the content of daily ratio, espe-cially grazing on pasture, has the greatest
impact on the level of CLA9 (Ellis et al., 2006; Nałęcz-Tarwacka, 2006). The CLA content was higher in the milk of HF cows in the summer season, compared with milk of BS cows (1.99 g/100 g of fat vs. 1.594 g/100 g of fat). But in the winter season concentration of rumenic acid were at similar level and ranged from 0.62 g/100 g of fat (for HF) to 0.69 g/100 g of fat (for BS). Kelsey et al. (2003) show the level 4.4 mg/g of fatty acid for HF and 4.1 mg/g of fatty acid for BS breed. Lawless et al. (1999) reported that breed had only a small effect on the CLA content in milk.
BS milk has got a lover ratio ofn-3/n-6 in the summer season (P ≤ 0.001) compared to HF cows milk. The ratio of n-3/n-6 was higher in the milk of HF cows − 2.28, in the summer season. But in the winter trends were different, a higher ratio of n-3/n-6 has been dem-onstrated in HF breed − 1.34.
CONCLUSIONS
The milk from BS cows was character-ized by higher concentration of SFA, BA, AA, EPA and DPA during summer season of nutrition. But milk from HF cows was characterized by a higher concentration of MUFA, PUFA, OA, LA, TVA and CLA and lover of SFA (which is advan-tageous from the point of view of the consumer’s health). In the winter season milk from BS cows was characterized by a higher concentration of SFA, MUFA, BA, TVA and CLA compared with milk of HF breed. Finally, milk from HF breed in organic system during summer and winter season was characterized much higher nutritional value.
66 B. Kuczyńska et al.
Acknowledgement
Research was realized within the project “BIOFOOD – innovative, func-tional products of animal origin” no. POIG.01.01.02-014-090/09 co-financed by the European Union from the Euro-pean Regional Development Fund within the Innovative Economy Operational Program 2007–2013.
REFERENCES
COLLOMB M., BISIG W., BÜTIKOFER U., SIEBER R., BREGY M., ETTER L., 2008: Fatty acid composition of mountain milk from Switzerland: Comparison of organic and in-tegrated farming systems. Int. Dairy J. 18: 976–982.
CHILLIARD Y., FERLAY A., DOREAU M., 2001: Effect of different types of forages, ani-mal fat or marine oils in cow’s diet on milk fat secretion and composition, especially conju-gated linoleic acid (CLA) and polyunsaturated fatty acids. Livest. Prod. Sci. 70: 31–48.
ELLIS K.A., INNOCENT G., GROVE-WHITE D., CRIPPS P., MCLEAN W.G., HOWARD C.V., MIHM M., 2006: Comparing the fatty acid composition of organic and con-ventional milk. J. Dairy Sci. 89: 1938–1950.
ELGERSMA A., ELLEN G., VAN DER HORST H., MUUSE B.G., BOER H., TAM-MINGA S., 2003: Comparison of the fatty acid composition of fresh and ensiled perennial rye-grass (Lolium perenne L.), affected by cultivar and regrowth interval. Anim. Feed Sci. Tech-nol. 108: 191–205.
KELSEY J.A., CORL B.A., COLLIER R.J., BAUMAN D.E., 2003: The effect of breed, parity, and stage of lactation on conjugated li-noleic acid (CLA) in milk fat from dairy cows. J. Dairy Sci. 86: 2588–2597.
KRAMER J.K.G., PARODI P.W., JENSEN R.G., MOSSOBA M.M., YURAWECZ M.P., AD-LOF R.O., 1998: Rumenic acid: a proposed common name for the major conjugated lino-leic acid isomer found in natural products. Li-pids 33: 835.
LAWLESS F., STANTON C., L’ESCORP P., DE-VERY R., DILLON P.,. MURPHY J.J., 1999: Influence of breed on bovine milk cis-9, trans-11 conjugated linoleic acid content. Livest. Prod. Sci. 62: 43–49.
McGUIRE M.A., Mc GUIRE M.K., 1999: Con-jugated linoleic acid (CLA): A ruminant fatty acid with beneficial effects on human health. Proc. Am. Soc. Anim. Sci. http://www.asas.org/jas/symposia/proceedings/0938.pdf.
METERA E., SAKOWSKI T., SŁONIEWSKI K., REMBIAŁKOWSKA E., KUCZYŃSKA B., 2010: Wpływ systemu produkcji na zawartość substancji bioaktywnych w mleku krów – przegląd piśmiennictwa. Przegl. Hod. 2: 1−4.
NAŁĘCZ-TARWACKA T., 2006: Wpływ wybranych czynników na zawartość funkc-jonalnych składników tłuszczu mleka krów. Rozprawa habilitacyjna – Rozprawy Naukowe i Monografie, Wydawnictwo SGGW.
NAŁĘCZ-TARWACKA T., GRODZKI H., 2005: Influence of early spring feeding on fatty acid levels of cow’s milk. Pol. J. Food Nutr. Sci. 1: 67–70.
NRC, 1996: Carcinogens and Anticarcinogens in the Human Diet. National Academy Press, Washington DC.
PARODI P.W., 1999: Conjugated linoleic acid and other anticarcinogenic agents of bovine milk fat. J. Dairy Sci. 82, 6: 1339–1349.
PUPPEL K., 2011: The influence of fish oil and linseed supplementation on the fat and the pro-tein fraction content of cow’s milk. Doctoral Thesis, Warsaw University of Life Sciences.
WHITE S.L., BERTRAND J.A., WADE M.R., WASHBURN S.P., GREEN J.T., JENKINS T.C., 2001: Comparison of fatty acid content of milk from Jersey and Holstein cows consum-ing pasture or a total mixed ration. J. Dairy Sci. 84: 2295–2301.
Streszczenie: Zawartość kwasów tłuszczowych mleka krów rasy Brown Swiss i Holszyńsko-Fryzyj-skiej odmiany czarno-białej utrzymywanych w cer-tyfikowanym gospodarstwie ekologicznym. Celem prezentowanej pracy było określenie wpływu wy-branych czynników, takich jak: sezon żywienia czy rasa, na kształtowanie się zmian w zawartości poszczególnych kwasów tłuszczowych. Badania przeprowadzono w certyfikowanym gospodar-
Fatty acid composition of milk from Brown Swiss and Holstein-Friesian black... 67
stwie ekologicznym, w którym utrzymywane są krowy dwóch ras: Brown Swiss (BS) i Holszyń-sko-Fryzyjskiej odmiany czarno-białej (HF). Gru-pę badawczą stanowiło 30 krów (15 BS i 15 HF). Mleko do analiz pobierane było 2-krotnie od każdej krowy: w sezonie letnim (gdzie podstawę żywienia stanowiło pastwisko) oraz w sezonie zimowym. Badania wykazały istotny wpływ sezonu żywienia na poziom następujących kwasów tłuszczowych: BA, TVA, LA, CLA9, CLA10, EPA, DPA, DHA. W sezonie letnim, mleko pochodzące od krów rasy BS charakteryzowało się wyższą zawartością: SFA, BA, AA, EPA i DPA. Natomiast mleko pozyskane od krów rasy HF wyróżniało się wyższą koncen-tracją: MUFA, PUFA, OA, LA, TVA i CLA oraz niższym poziomem SFA. W sezonie zimowym w mleku krów rasy BS wykazano wyższą koncen-trację SFA, MUFA, BA, TVA i CLA w porównaniu do mleka krów rasy HF. Podsumowując, mleko po-chodzące od krów rasy HF zarówno w sezonie let-nim, jak i zimowym charakteryzowało się znacznie wyższą wartością odżywczą.
MS. received August 2011
Authors’ addresses:Beata Kuczyńska, Kamila Puppel,Anna Grodzka, Piotr KliśKatedra Szczegółowej Hodowli Zwierząt,Zakład Hodowli Bydła,Wydział Nauk o Zwierzętach – SGGWul. Ciszewskiego 802-786 Warsaw Polandtel.: 048 225936540; fax: 048 22 593 65 38e-mail: beata_kuczyń[email protected]
Ewa Metera, Tomasz SakowskiInstytut Genetyki i Hodowli Zwierząt Polskiej Akademii NaukJastrzębiecul. Postępu 105-552 Wólka KosowskaPoland

Annals of Warsaw University of Life Sciences – SGGWAnimal Science No 49, 2011: 69–76(Ann. Warsaw Univ. of Life Sc. – SGGW, Anim. Sci. 49, 2011)
Technological usefulness of milk from Brown Swiss and Holstein--Friesian black and white cows kept in a certified organic farm
BEATA KUCZYŃSKA1, KAMILA PUPPEL1, EWA METERA2,IZABELA PIEŚNIAK1, ANNA GRODZKA1, TOMASZ SAKOWSKI2
1 Department of Animal Breeding, Faculty of Animal Science, Warsaw University of Life Sciences – SGGW
2 Animal Science Department, Institute of Genetics and Animal Breeding, Polish Academy of Science, Jastrzębiec
Abstract: Technological usefulness of milk from Brown Swiss and Holstein-Friesian black and white cows kept in a certifi ed organic farm. The objective of the present study was to evaluate the chemical composition and technological useful-ness of cows milk kept in a certifi ed organic farm. In the selected dairy farm, cows of two different breeds, i.e. (BS) and Holstein-Friesian (HF) be-tween 45th–100th day of lactation, were managed under the same environment conditions. Results showed that in the summer and winter season milk yield, percentages of protein and fat, and also so-matic cell score (SCC) were higher in milk of BS breed. However, protein to fat ratio, percentages of lactose and concentration of urea were higher in milk of HF breed. Only protein to fat ratio was higher in milk of BS breed during winter season. Milk from BS cows was characterized by a better usefulness of technological parameters, mainly lower coagulability time against the rennet and a higher of casein and beta-lactoglobulin content, which indicates that it is a better raw material for processors.
Key words: milk quality, organic milk, technolo-gical properties.
INTRODUCTION
Organic farming is a way of farming also known as biological, organic or
alternative. Depends on such farm management to the methods of both crop and livestock were friendly to the environment. In our country, as opposed to organic plant production, the animal equivalent of only enters the path of development. Organic milk accounts for less than 0.22% of all organic prod-ucts chosen by consumers. Currently in Poland there are about 7700 certified farms where it is held about 14 000 dairy cows from which milk is harvested for human consumption (Kuczyńska and Puppel, 2010). The production of organic foods do not use of agricultural, veterinary and food chemicals, which results in the so-called high primary biological quality of manufactured products. Therefore, first ask yourself how organic pasture is differs from the conventional pasture? Reply to this question is very simple: a kind of in-tensity of fertilization. Organic pasture based on the maximum use of natural habitat productive capacity, while sup-porting only farm fertilizers. Although it occurs, however much lower yield per hectare, nutritional value resulting from

70 B. Kuczyńska et al.
a large variety of plant species growing cancel out the differences. Nutritional qualities of organic pasture due to large amounts of plant species found in the sward, which directly translates to both the quality and nutritional value of feed.
Recent studies have pointed out signif-icant differences in the chemical compo-sition and an improved nutritional qual-ity of milk and dairy products obtained by organic with respect to conventional farming systems (Borell and Sorensen, 2004; Olivo et al., 2005; Bloksma et al. 2008; Metera et al., 2010).
Quality and quantity of milk heavily depends upon two main group of factors: genetic and environmental. Considering environmental ones nutrition is the most important determinant of milk chemical composition, followed by production system, health status, as well as effect of herd and labour (Nałęcz-Tarwacka, 2006; Puppel, 2011). Within genetic factors breed of the cow seems to have substantial influence on milk compounds (Barłowska, 2007).
Technological quality of milk depends on its chemical composition, especially on casein and beta-lactoglobulin content and coagulability time against the rennet (Barłowska et al., 2006).
There were no reference in the lit-erature about chemical composition and technological usefulness of milk from Brown Swiss and Holstein-Friesian cows kept in a certified organic farm in Poland. This is a new solution and makes it possible to analyze changes occurring in chemical composition and techno-logical usefulness caused by the organic system.
TABLE 1. Components of the treatments in expe-riment
CompositionTreatment
Summer season
Winter season
Ingredient (kg/d)Hay meadow 8.68 –Yellow lupine and pea 0.50 –Oats and field pea 2.00 –Forage grass with red clover 50.00 –spelled 1 1.00 –spelled 2 1.00 –Corn meal – 1.00Oats with field pea meal – 4.00Rye meal – 2.00Grass silage with red clover – 23.50Grass hay with red clover – 6.50
JPM 18.37 17.21BTJE 1381.90 1370.70BTJN 1950.70 1734.60
MATERIALS AND METHODS
The study was conducted in a certified organic farm – Juchowo Sp. z o. o. In the farm, dairy cows of two different breeds: Brown Swiss (BS) and Holstein-Friesian (HF) were kept. Fifteen BS and fifteen HF lactating primiparous, between 45th –100th day of lactation, were chosen to the experiment. The cows of the both breeds in the farm were kept under the same environmental conditions in a free stall dairy barn.
In the surveyed farm in the feeding of cows used the following feed: in the summer season: hay meadow; yellow lupine, pea; oats and field pea; forage grass with red clover and spelled. But in the winter season: corn meal; oats with field pea meal, rye meal, grass silage with red clover and grass hay with red clover (Tab. 1).

Technological usefulness of milk from Brown Swiss and Holstein-Friesian black... 71
SamplingRepresentative milk samples were col-lected from each cow during evening milking by means of a milk meter. Milk were placed in sterile bottles, preserved Mlekostat CC. After milking samples were immediately submitted to the Cattle Breeding Division (Milk Testing Laboratory of Warsaw University of Life Sciences) for compositional analysis.
Milk analysesBasic parameters of the milk were de-termined by automated infrared analysis with a MilkoScan FT – 120 instrument (Foss Electric). The samples were heated up to 40°C in a water bath, the number of pump strokes was set to 22, and the pipette shake was set to 5.
Evaluation of hygienic status of the milk was based on somatic cell count on Somacount – 150 (Bentley).β-lactoglobulin (B-LG) was examined
on HPLC – Agilent 1100 series. In the investigations on the development of the method for separation and identification of whey proteins’ components, the fol-lowing parameters were checked using literature data (Kuczyńska et al., 2011).
Coagulability time against the rennet was examined by Shern method (Jur-czak, 2003).
Statistical analysesThe data obtained were analyzed statisti-cally using a multi-factor analysis of variance (least squares) by means of the SPSS 12.0 packet software. Only inter-actions between factors whose influence was statistically significant (P ≤ 0.001, P ≤ 0.01 or P ≤ 0.05) were considered in
the study. The level of significance was determined after performing preliminary statistical analyses.
The model used was:
Y ijk = μ + Ai + Bj + (Ai * Bj ) + eijk
Where: Yijk = dependent variable, μ – general mean, Ai – breed effect (i = 1 – 2), Bj – season of the feeding (j = 1 – 2), (Ai · Bj) – fixed interaction effect between breed and season of the feeding.
RESULTS AND DISCUSSION
The milk performance of cows accord-ing to the study of breed and the season of nutrition dose is presented in the Table 2. Milk yield from BS cows was higher by 2.25 kg/d from HF cows, in the summer season. In winter, a slightly higher milk yield was recorded in HF breed, by 0.72 kg/day from the BS. Study demonstrated statistically significant differences in relation to the daily milk yield between seasons of the nutrition. Barłowska (2007) showed milk yield for the BS breed from 24.15 to 28.40 and from 31.95 to 37.75 for HF breed. While Kelsey et al. (2003) 38.0 kg/d and 31.5 kg/d respectively. Neja et al. (2010) give the value of annual production for the national population of HF – 7041 kg, and for BS – 6350 kg. Milk yield is consequently less in organic production system (Borell and Sorensen, 2004), which is also reflected in this studies.
A few years ago in the manufacturing industry the largest role in milk paid to the fat content. Currently intensively in production of dairy products and the
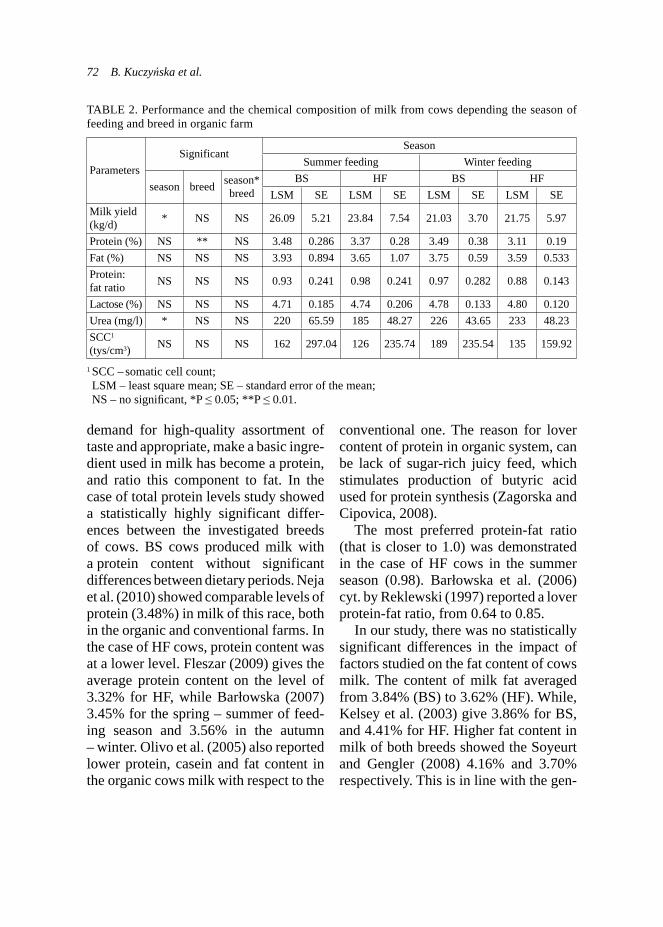
72 B. Kuczyńska et al.
demand for high-quality assortment of taste and appropriate, make a basic ingre-dient used in milk has become a protein, and ratio this component to fat. In the case of total protein levels study showed a statistically highly significant differ-ences between the investigated breeds of cows. BS cows produced milk with a protein content without significant differences between dietary periods. Neja et al. (2010) showed comparable levels of protein (3.48%) in milk of this race, both in the organic and conventional farms. In the case of HF cows, protein content was at a lower level. Fleszar (2009) gives the average protein content on the level of 3.32% for HF, while Barłowska (2007) 3.45% for the spring – summer of feed-ing season and 3.56% in the autumn – winter. Olivo et al. (2005) also reported lower protein, casein and fat content in the organic cows milk with respect to the
conventional one. The reason for lover content of protein in organic system, can be lack of sugar-rich juicy feed, which stimulates production of butyric acid used for protein synthesis (Zagorska and Cipovica, 2008).
The most preferred protein-fat ratio (that is closer to 1.0) was demonstrated in the case of HF cows in the summer season (0.98). Barłowska et al. (2006) cyt. by Reklewski (1997) reported a lover protein-fat ratio, from 0.64 to 0.85.
In our study, there was no statistically significant differences in the impact of factors studied on the fat content of cows milk. The content of milk fat averaged from 3.84% (BS) to 3.62% (HF). While, Kelsey et al. (2003) give 3.86% for BS, and 4.41% for HF. Higher fat content in milk of both breeds showed the Soyeurt and Gengler (2008) 4.16% and 3.70% respectively. This is in line with the gen-
TABLE 2. Performance and the chemical composition of milk from cows depending the season of feeding and breed in organic farm
ParametersSignificant
SeasonSummer feeding Winter feeding
BS HF BS HFseason breed season*
breed LSM SE LSM SE LSM SE LSM SEMilk yield (kg/d) * NS NS 26.09 5.21 23.84 7.54 21.03 3.70 21.75 5.97
Protein (%) NS ** NS 3.48 0.286 3.37 0.28 3.49 0.38 3.11 0.19Fat (%) NS NS NS 3.93 0.894 3.65 1.07 3.75 0.59 3.59 0.533Protein:fat ratio NS NS NS 0.93 0.241 0.98 0.241 0.97 0.282 0.88 0.143
Lactose (%) NS NS NS 4.71 0.185 4.74 0.206 4.78 0.133 4.80 0.120Urea (mg/l) * NS NS 220 65.59 185 48.27 226 43.65 233 48.23SCC1
(tys/cm3) NS NS NS 162 297.04 126 235.74 189 235.54 135 159.92
1 SCC – somatic cell count;LSM – least square mean; SE – standard error of the mean;NS – no signifi cant, *P ≤ 0.05; **P ≤ 0.01.
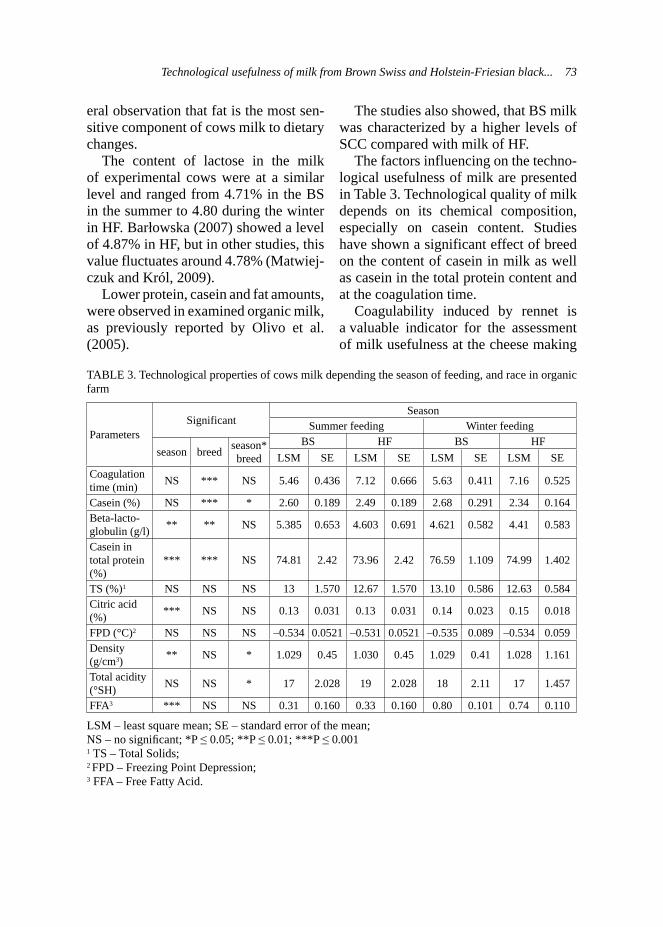
Technological usefulness of milk from Brown Swiss and Holstein-Friesian black... 73
eral observation that fat is the most sen-sitive component of cows milk to dietary changes.
The content of lactose in the milk of experimental cows were at a similar level and ranged from 4.71% in the BS in the summer to 4.80 during the winter in HF. Barłowska (2007) showed a level of 4.87% in HF, but in other studies, this value fluctuates around 4.78% (Matwiej-czuk and Król, 2009).
Lower protein, casein and fat amounts, were observed in examined organic milk, as previously reported by Olivo et al. (2005).
The studies also showed, that BS milk was characterized by a higher levels of SCC compared with milk of HF.
The factors influencing on the techno-logical usefulness of milk are presented in Table 3. Technological quality of milk depends on its chemical composition, especially on casein content. Studies have shown a significant effect of breed on the content of casein in milk as well as casein in the total protein content and at the coagulation time.
Coagulability induced by rennet is a valuable indicator for the assessment of milk usefulness at the cheese making
TABLE 3. Technological properties of cows milk depending the season of feeding, and race in organic farm
ParametersSignificant
SeasonSummer feeding Winter feeding
BS HF BS HFseason breed season*
breed LSM SE LSM SE LSM SE LSM SECoagulation time (min) NS *** NS 5.46 0.436 7.12 0.666 5.63 0.411 7.16 0.525
Casein (%) NS *** * 2.60 0.189 2.49 0.189 2.68 0.291 2.34 0.164Beta-lacto-globulin (g/l) ** ** NS 5.385 0.653 4.603 0.691 4.621 0.582 4.41 0.583
Casein in total protein (%)
*** *** NS 74.81 2.42 73.96 2.42 76.59 1.109 74.99 1.402
TS (%)1 NS NS NS 13 1.570 12.67 1.570 13.10 0.586 12.63 0.584Citric acid (%) *** NS NS 0.13 0.031 0.13 0.031 0.14 0.023 0.15 0.018
FPD (°C)2 NS NS NS –0.534 0.0521 –0.531 0.0521 –0.535 0.089 –0.534 0.059Density (g/cm3) ** NS * 1.029 0.45 1.030 0.45 1.029 0.41 1.028 1.161
Total acidity (°SH) NS NS * 17 2.028 19 2.028 18 2.11 17 1.457
FFA3 *** NS NS 0.31 0.160 0.33 0.160 0.80 0.101 0.74 0.110
LSM – least square mean; SE – standard error of the mean;NS – no signifi cant; *P ≤ 0.05; **P ≤ 0.01; ***P ≤ 0.0011 TS – Total Solids;2 FPD – Freezing Point Depression;3 FFA – Free Fatty Acid.

74 B. Kuczyńska et al.
process. Milk BS cows was character-ized by a higher protein content (Tab. 2) and its coagulation time was signifi-cantly shorter compared to the milk of HF cows. The studies showed the level of 5.46 min. for BS and 7.12 for HF in the summer season, and 5.63 min. for BS and 7.16 for HF in the winter season. This is confirmed by the study of De Marchi et al. (2007). Budsławski (1973) claims that milk whose coagulation time is 4–10 min is recognized appropriate and suitable for cheese making.
Quantity, quality and types of proteins in milk influence the yield and techno-logical and health-beneficial properties of milk. The value of milk proteins is more than twice as valuable as milk fat. The amount of proteins produced by cows strongly depends upon many fac-tors including: cows’ diet, health, stage of lactation, breed and part of the year (Puppel, 2011). Milk is synthesized in mammary secretary epithelial cells and contains 2 major protein groups: casein’s (insoluble) and whey proteins (soluble). The major milk proteins are αS1-CN, αS2-CN, β-CN, κ-CN, α-LA, and β-LG.
In our study, there were statistically sig-nificant differences in the impact of factors studied on the beta-lactoglobulin (B-LG) content. The highest level was recorded in BS breed – 5.385 g/l during summer season, the lowest level was recorded in HF breed during winter season.
Casein’s, are important for cheese yield, milk coagulation time, and curd firmness (Wedholm et al., 2006). The studies showed the level from 2.60 to 2.68% for BS and from 2.49 to 2.34% for HF. Also in the case of casein, study showed higher levels of this component in the milk of BS cows. Flow of cheese
from milk with a low content of casein is less suitable, because it creates a struc-ture of a clot. The optimal ratio of fat to casein in milk, allowing to get the best cheddar cheese is 1:0.7.
Urea levels in milk should be on a lev-el from 150 to 300 mg/l (Lach, 2003). The concentration of this component in milk is closely related to both the amount and type of feed included in the ration. The high level of urea in milk during pasture feeding season can be tolerated and even economically justified. In the analyzed milk showed a significant rela-tionship between winter feeding season and urea content in milk of both breeds. In the studies of Litwińczuk et al. (2006) differences between the two seasons in the content of urea in HF breed was at the level 20 mg/l, while in our study it was the level 48 mg/l.
The study also showed a significant effect of feeding season on the FFA con-tent in milk of cows.
Density of milk was at the level 1.029 for BS cows and 1.029–1.030 g/cm3 for HF cows. Proteins, carbohydrates and minerals increase, but fat reduces the density of milk . The density of raw milk varies under the influence of the lactation period, the breed of cows and their health.
Freezing point is a temperature which milk passes from the liquid state to solid. It depends on the concentration of lactose and soluble salt content. Also depend upon the acidity of milk. The freezing point in the milk of BS cows was at the higher level and ranged from –0.534 to – 0.535°C.
The quality of raw milk is very important, the milk may have at least 5 types of undesirable traits, what caught be a problems in its processing into cheese. These include the follow-
Technological usefulness of milk from Brown Swiss and Holstein-Friesian black... 75
ing: the high content of bacteria, affects the formation of defects in texture and appearance of the cheese. High somatic cells count reduces clotting time of milk. Additionally, antibiotics, sulfona-mides may cause inhibition effects on microorganisms introduced with the acid. Therefore, that in organic system chemicals are eliminated in production, the possibility of their penetration into milk is equal to zero. What is a proof, that the milk of cows from organic farms is a better product for processing.
CONCLUSIONS
In conlussion the milk from BS cows was characterized by a better usefulness of technological parameters, mainly lower coagulability time against the rennet and a higher of casein and beta-lactoglobulin content, which indicates that it is a better raw material for production of fermented milk products or cheese.
Acknowledgement
Research was realized within the project “BIOFOOD – innovative, func-tional products of animal origin” no. POIG.01.01.02-014-090/09 co-financed by the European Union from the Euro-pean Regional Development Fund within the Innovative Economy Operational Program 2007–2013.
REFERENCES
BARŁOWSKA J., 2007: Wartość odżywcza i przydatnośc technologiczna mleka krów 7 ras użytkowanych w Polsce. Rozprawy naukowe Akademii Rolniczej w Lublinie.
BARŁOWSKA J., LITWIŃCZUK Z., KRÓL J., TOPYŁA B., 2006: Technological usefulness
of milk of cows of six breeds maintained in po-land relative to a lactation phase. Pol. J. Food Nutr. Sci. 15: 56, 17–21.
BLOKSMA J., ADRIAANSEN-TENNEKES R., HUBER M., VAN DE VIJVER L.P.L, BAARS T., DE WIT J., 2008: Comparison of organic and conventional raw milk quality in the Ne-therlands. Biolog. Agr. Hort. 26: 69−83.
BORELL E., SØRENSEN J.T., 2004: Organic li-vestock production in Europe: aims, rules and trends with special emphasis on animal health and welfare. Liv. Prod. Sci. 90: 3–9.
BUDSŁAWSKI J., 1973: Consumable milk. WPLiS, Warszawa.
DE MARCHI M., DAL ZOTT R., CASSANDRO M., BITTANTE G., 2007: Milk coagulation ability of five dairy cattel breeds. J. Dairy Sci. 90: 3986–3992.
FLESZAR J., 2009: Ilościowa i jakościowa wy-dajność produkcji mleka w gospodarstwie eko-logicznym. J. Res. Aplicat. Agricul. Engin. 54: 75–78.
JURCZAK M.E., 2003: Mleko produkcja, badanie, przerób. Wydawnictwo SGGW, Warszawa.
KELSEY J.A., CORL B.A., COLLIER R.J., BAUMAN D.E., 2003: The effect of breed, pa-rity, and stage of lactation conjugated linoleic acid (CLA) in milk fat from dairy cows. Am. Dairy Sci. Assos. 86: 2588–2597.
KUCZYŃSKA B., GOŁĘBIEWSKI M., PUP-PEL K., BRZOZOWSKI P., 2011: Comparison of fat and protein fractions of milk constituents of Montbeliarde and Polish Holstein – Friesian cows originated from the selected farm in Po-land. Acta Vet. Brno (in print).
KUCZYŃSKA B., PUPPEL K., 2010: Mleko ekologiczne – niezastąpione źródło bioaktyw-nych składników. Przegl. Mleczarski 9, 4–9.
LACH Z., 2003: Narzędzia do oceny prawidło-wego zarządzania stadem krów mlecznych. Przegl. Hod. 6: 8–11.
LITWIŃCZUK A., BARŁOWSKA J.K., RÓL L., SAWICKA W., 2006: Porównanie składu chemicznego i zawartości mocznika w mleku krów czarno-białych i simentalskich z okresy żywienia letniego i zimowego. Annales UMCS Lublin 10: 67–72.
MATWIEJCZUK A., KRÓL L., 2009: Profil kwasów tłuszczowych w mlku krów różnych ras w okresie wiosenno-letnim. Przegl. Hod., 7: 3–6.

76 B. Kuczyńska et al.
METERA E., SAKOWSKI T., SŁONIEWSKI K., REMBIAŁKOWSKA E., KUCZYŃSKA B., 2010: Wpływ systemu produkcji na zawartość substancji bioaktywnych w mleku krów – prze-gląd piśmiennictwa. Przegl. Hod. 2: 1−4.
NAŁĘCZ-TARWACKA T., 2006: Wpływ wybra-nych czynników na zawartość funkcjonalnych składników tłuszczu mleka krów. Rozprawa Habilitacyjna – Rozprawy Naukowe i Mono-grafie, Wydawnictwo SGGW.
NEJA W., SAWA A., BOGUCKI M., 2010: Zmia-ny wydajności i składu mleka krów krajowej populacji aktywnej. Przegl. Hod. 5: 4–7.
OLIVO C.J., BECK L.I., MOSSATE GABBI A., SANTINI CHARĂO P., SOBCZAK M.F., GO-MESUBERTY L.F., DÜRR J.W., ARAÚJO FILHO R., 2005: Composition and somatic cell count of milk in conventional and agro-ecolo-gical farms: a comparative study in Depressăo Central, Rio Grande do Sul state, Brazil. Liv. Res. Rural Dev. 17, 6: http://www.cipav.org.co/lrrd/lrrd17/6/oliv17072.htm.
PUPPEL K., 2011: The influence of fish oil and linseed supplementation on the fat and the pro-tein fraction content of cow’s milk. Doctoral Thesis, Warsaw University of Life Sciences – SGGW.
SOYEURT H., GENGLER N., 2008: Genetic va-riability of fatty acids in bovine milk. Biotech. Agron. Soc. Envir. 12: 203–210.
WEDHOLM A., HALLEN E., LARSEN L.B., LINDMARK-MÅNSSON H., KARLSSON A.H., ALLMERE T., 2006: Comparison of milk protein composition in a Swedish and a Danish dairy herd using reversedphase HPLC. Acta Agric. Scand. Sec. t. A, Animal Sci. 56: 8–15.
ZAGORSKA J., CIPROVICA I., 2008: The che-mical composition of organic and conventional milk in Latvia. Foodbalt 10–14.
Streszczenie: Przydatność technologiczna mleka krów rasy Brown Swiss i Holszyńsko-Fryzyjskiej odmiany czarno-białej utrzymywanych w certy-fikowanym gospodarstwie ekologicznym. Celem prezentowanej pracy było określenie wpływu wy-branych czynników, takich jak: system produk-
cji, sezon żywienia czy rasa – na kształtowanie się zmian w zawartości podstawowego składu chemicznego mleka, jak również jego przydat-ności technologicznej. Badania przeprowadzono w certyfikowanym gospodarstwie ekologicznym, w którym utrzymywane są krowy dwóch ras: Brown Swiss (BS) i Holszyńsko-Fryzyjskiej od-miany czarno-białej. Grupę badawczą stanowiło 30 krów (15 BS i 15 HF). Mleko do analiz po-bierane było 2-krotnie od każdej krowy: w sezo-nie letnim (gdzie podstawę żywienia stanowiło pastwisko) oraz w sezonie zimowym. Badania wykazały, że w trakcie sezonu letniego, krowy rasy BS charakteryzowały się wyższą wydajno-ścią, ale też mleko od nich pobrane wyróżniało się wyższym poziomem białka oraz tłuszczu. Natomiast wyższy poziom laktozy, mocznika, a także korzystniejszy stosunek – białko: tłuszcz – wykazano w mleku krów HF. Mleko krów rasy BS charakteryzowało się lepszymi parametrami przydatności technologicznej: krótszym czasem koagulacji oraz wyższym poziomem kazeiny i be-ta-laktoglobuliny.
MS. received August 2011
Authors’ addresses:
Beata Kuczyńska, Kamila Puppel,Anna Grodzka, Izabela PieśniakKatedra Szczegółowej Hodowli Zwierząt,Zakład Hodowli Bydła,Wydział Nauk o Zwierzętach – SGGWul. Ciszewskiego 802-786 WarszawaPolandtel: 048 225936540; fax: 048 22 593 65 38e-mail: beata_kuczyń[email protected]
Ewa Metera, Tomasz SakowskiInstytut Genetyki i Hodowli ZwierzątPolskiej Akademii NaukJastrzębiec, ul. Postępu 105-552 Wólka KosowskaPoland
Annals of Warsaw University of Life Sciences – SGGWAnimal Science No 49, 2011: 77–86(Ann. Warsaw Univ. of Life Sc. – SGGW, Anim. Sci. 49, 2011)
Effect of breed and season on the boar’s semen characteristics
MAŁGORZATA KUNOWSKA-SLÓSARZ, ANNA MAKOWSKA Department of Animal Breeding, Warsaw University of Life Sciences – SGGW
Abstract: Effect of breed and season on the bo-ar’s semen charakteristics. The investigation was carried out on 6627 boars ejaculates collected from the following breeds: Polish Large White, Polish Landrace, Pietrain, Duroc × Pietrain. Ejaculates were obtained in 2003–2008 in Breeding Centre for Animal Reproduction in Łowicz. The aim of this study was to assess the impact of boars breed and season on some characteristics of ejaculates: volume, sperm concentration, % of live sperm in the ejaculate. Among the four studied breeds, the largest volume of ejaculate was found in Pietrain, when the smallest one in Duroc × Pietrain. The concentration of spermatozoa in ejaculates was the highest in Durock × Pietrain and the lowest in Pie-train breed. The lowest % of live spermatozoa in the ejaculate was observed for PL. The parameters of ejaculates was also infl uenced by the month of collection. The largest volume of ejaculate was fo-und at autumn-winter season. In these months the concentration of spermatozoa was the lowest. The highest concentration of sperm and a high % of live spermatozoa were noticed in ejaculates collected during the late winter and spring time. It was pro-oved that the season and breed has an effect on the volume, sperm concentration and the ratio of live sperm in ejaculates obtained from AI boars.
Key words: boar, semen, breed, season.
INTRODUCTION
Insemination of sows with boar’s semen coming from Station of Sow Insemina-tion improve herd of pigs in terms of im-portant traits from an economic point of
view, in particular, must characteristics and production health and traits. This can be achieved only when for insemination were used ejaculates of boars with high performance features, with the highest breeding value, and better production predisposition.
Pigs are considered a species devoid of seasonality of reproduction. Selection led to the fact that sows are poliestral, and sexual activity of boars is observed throughout the year. However, as shown by numerous studies, sperm production by males depends on many factors, both genetic (Kondracki, 2003) and envi-ronmental (Kunavongkrit and Prateep, 1995), what can significantly affects the quality and quantity of obtained sperm.
The aim of this study was to analyze the influence of breed and season of semen collection on the volume, sperm concentration and percentage of sperma-tozoa with proper mobility in boars eja-culates used in artificial insemination.
MATERIAL AND METHODS
The study was conducted on 6627 ejacu-lates collected from 95 boars, including 22 boars of Polish Large White breed, 48 Polish Landrace, 9 Pietrain and 16 Duroc

78 M. Kunowska-Slósarz, A. Makowska
× Pietrain hybrids, used in 2003–2008 at the Station of Sow Insemination in Zielkowice. Semen was collected by manual method. Obtained ejaculates was evaluated according to quantitative and qualitative methodology used in the Polish Stations of Sow Insemination in accordance to the National Animal Breeding Centre. The following param-eters were evaluated: • volume of ejaculate (ml);• concentration of spermatozoa in the
ejaculate (thous./mm3);• percentage of live sperm in the ejacu-
late (showing progressive motion).The data were divided into 12 sub-
groups, including ejaculates collected in different months of the year (Tab. 1).
The values of the characteristics of ejaculates were statistically verified according to breed group.
Performed multivariate analysis of variance with least squares method using SPSS 14.0. according to the following statistical model:
Yijk = μ + ai + bj + abij + eijk
Where: Yijk – value of trait, μ – the aver-age of the trait, ai – effect of boars breed, bj – effect of month of the year, abij – breed × month interaction, Eijk – error.
The significance of differences was estimated with Fischer test.
RESULTS
The data contained in Table 2 show the diversity of boars sperm parameters of different breeds.
The largest volume characterised ejaculates collected from Pietrain boars, whose average volume was 270.36 ml and differed significantly (P ≤ 0.01) from ejaculates breed Duroc × Pietrain (mean 231.75 ml) and Polish Large White (mean 255.25 ml). In presented study, the small-est volume of semen showed a Duroc × × Pietrain breed (average 231.75 ml), and thus highly significantly differed from the average volume of the ejaculates of the other breeds.
The concentration of spermatozoa of all tested breeds was an average of 446.86 thous./mm3 (Tab. 2). Pietrain boars had the lowest concentration of spermatozoa (mean 406.53 thous./mm3) in semen, and this value differed significantly (P ≤ 0.01) from the average concentra-tion of spermatozoa in ejaculates of other studied breeds. Boars Duroc × Pietrain (average 475.13 thous./mm3) characte-rized the highest concentration of sperm in the ejaculate and significantly differed (P ≤ 0.01) from the values obtained in Polish Landrace (435.26 thous./mm3) and Pietrain (406.53 thous./mm3) breeds.
The average level of sperm motility was 78.76% (Tab. 2).
TABLE 1. Number of ejaculates collected from boars of various breeds in different months of the year
Breed 1 2 3 4 5 6 7 8 9 10 11 12 ∑Duroc × × Pietrain 148 138 160 162 179 168 206 177 161 160 140 140 1939
PL 217 234 257 264 260 244 230 203 210 223 231 272 2845Pietrain 46 44 54 48 47 50 57 54 45 47 43 46 581PLW 110 100 125 127 133 112 106 90 82 92 90 95 1262∑ 521 516 596 601 619 574 599 524 498 522 504 553 6627

Effect of breed and season on the boar’s semen characteristics 79
The smallest percentage of sperm moving with an advancing motion showed a Polish Landrace breed (aver-age 77.58%) and significantly differed (P ≤ 0.01) from the other breeds (Tab. 2). The greatest value of this trait was observed in the Duroc × Pietrain breed (79.34%).
In Table 3 the parameters of ejaculates in the particular months was summa-rized. The volume of all studied ejacu-lates averaged 256.18 ml. The largest volume characterised by ejaculates collected in November (mean 295.23 ml) and the lowest in April (average 225.35 ml). Month of semen collection significantly influenced the volume of ejaculate received (P ≤ 0.05).
The results at presented research show that the highest concentration of sperma-tozoa were characterised by ejaculates collected in winter and spring season: in February (average 475.59 thous./mm3) – winter, in March (average 468.95 thous./mm3), April (average 477.36 thous./mm3) – spring (Tab. 3). Mean values of this trait obtained in February and April differ significantly (P ≤ 0.05) from concentration of spermatozoa in semen recorded in the remaining months
of the year. The lowest average con-centration (420.48 thous./mm3) were observed in October (autumn). In the summer and autumn season, the smallest concentrations of sperm in the ejaculate were noticed and were statistically sig-nificantly different from concentrations in spring and winter.
In presented studies one can observe the relationship between the volume and concentration of spermatozoa in semen. The highest volume was found in ejacu-lates collected in the autumn months, and thus the concentration of sperm in these months was the lowest. The largest con-centration of spermatozoa in ejaculates was in the spring months and the same volume of ejaculates at that time were the smallest (Tab. 3).
The percentage of live sperm in the ejaculate showing the correct move-ment, on average was steady at 78.76% (Tab. 3). The highest percentage of live sperm was found from January to May (winter and spring season), and in August and September (late summer). The lowest values of this feature coin-cided with the period from October to December (autumn season), and in June and July (summer). November (autumn
TABLE 2. Ejaculate characteristics depending on the breed
Traitvolume concentraction % of sperm moving
LSM SE LSM SE LSM SEBreed total 256.18 1.23 446.86 1.62 78.76 0.09Duroc × Pietrain 231.75AB 1.74 475.13A 2.31 79.34A 0.12PL 267.38AC 1.52 435.26AB 2.01 77.58ABC 0.11Pietrain 270.36B 3.38 406.53AC 4.46 78.95B 0.24PLW 255.25BC 2.70 470.51BC 3.56 79.15C 0.19
A, B, C are different at P ≤ 0.01;LSM – least square mean;SE – error.
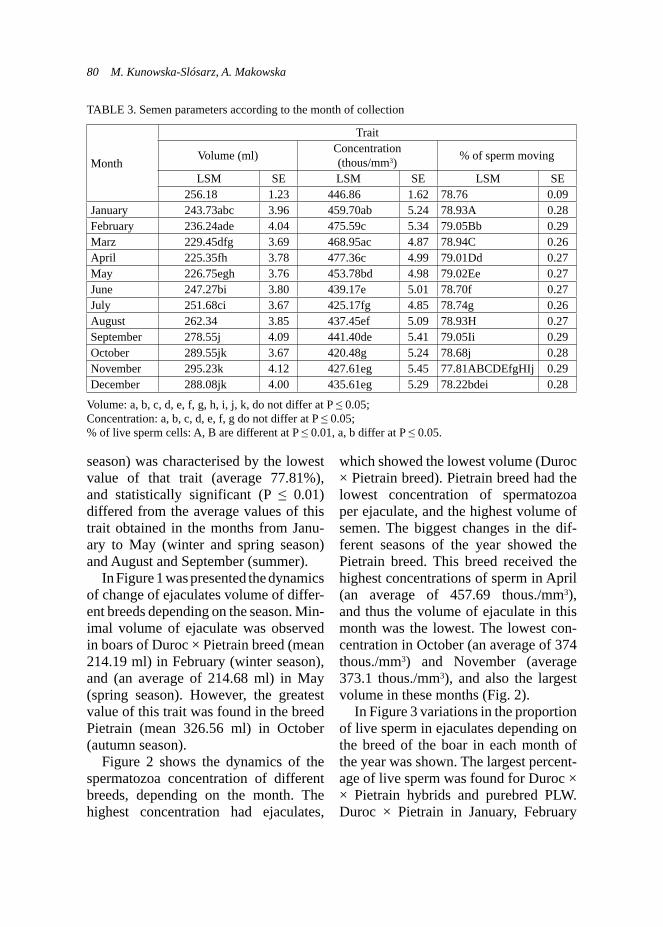
80 M. Kunowska-Slósarz, A. Makowska
season) was characterised by the lowest value of that trait (average 77.81%), and statistically significant (P ≤ 0.01) di ffered from the average values of this trait obtained in the months from Janu-ary to May (winter and spring season) and August and September (summer).
In Figure 1 was presented the dynamics of change of ejaculates volume of differ-ent breeds depending on the season. Min-imal volume of ejaculate was observed in boars of Duroc × Pietrain breed (mean 214.19 ml) in February (winter season), and (an average of 214.68 ml) in May (spring season). However, the greatest value of this trait was found in the breed Pietrain (mean 326.56 ml) in October (autumn season).
Figure 2 shows the dynamics of the spermatozoa concentration of different breeds, depending on the month. The highest concentration had ejaculates,
which showed the lowest volume (Duroc × Pietrain breed). Pietrain breed had the lowest concentration of spermatozoa per ejaculate, and the highest volume of semen. The biggest changes in the dif-ferent seasons of the year showed the Pietrain breed. This breed received the highest concentrations of sperm in April (an average of 457.69 thous./mm3), and thus the volume of ejaculate in this month was the lowest. The lowest con-centration in October (an average of 374 thous./mm3) and November (average 373.1 thous./mm3), and also the largest volume in these months (Fig. 2).
In Figure 3 variations in the proportion of live sperm in ejaculates depending on the breed of the boar in each month of the year was shown. The largest percent-age of live sperm was found for Duroc × × Pietrain hybrids and purebred PLW. Duroc × Pietrain in January, February
TABLE 3. Semen parameters according to the month of collection
Month
Trait
Volume (ml) Concentration (thous/mm3) % of sperm moving
LSM SE LSM SE LSM SE256.18 1.23 446.86 1.62 78.76 0.09
January 243.73abc 3.96 459.70ab 5.24 78.93A 0.28February 236.24ade 4.04 475.59c 5.34 79.05Bb 0.29Marz 229.45dfg 3.69 468.95ac 4.87 78.94C 0.26April 225.35fh 3.78 477.36c 4.99 79.01Dd 0.27May 226.75egh 3.76 453.78bd 4.98 79.02Ee 0.27June 247.27bi 3.80 439.17e 5.01 78.70f 0.27July 251.68ci 3.67 425.17fg 4.85 78.74g 0.26August 262.34 3.85 437.45ef 5.09 78.93H 0.27September 278.55j 4.09 441.40de 5.41 79.05Ii 0.29October 289.55jk 3.67 420.48g 5.24 78.68j 0.28November 295.23k 4.12 427.61eg 5.45 77.81ABCDEfgHIj 0.29December 288.08jk 4.00 435.61eg 5.29 78.22bdei 0.28
Volume: a, b, c, d, e, f, g, h, i, j, k, do not differ at P ≤ 0.05;Concentration: a, b, c, d, e, f, g do not differ at P ≤ 0.05;% of live sperm cells: A, B are different at P ≤ 0.01, a, b differ at P ≤ 0.05.

Effect of breed and season on the boar’s semen characteristics 81
FIGURE 1. Changes in volume of ejaculate depending on the season and breed
Duroc × PietrainPLPietrainPLWEj
acul
ate
volu
me
(ml)
I II III IV V VI VII VIII IX X XI XIImonth
350
300
250
200
150
100
50
0
FIGURE 2. Changes in concentration of spermatozoa, depending on the month of sperm collection and breed
Duroc × Pietrain
PLPietrain
PLW
I II III IV V VI VII VIII IX X XI XIImonth
600
500
400
300
200
100
0Sper
mat
ozoa
con
cent
ratio
n th
ous/
mm
3
FIGURE 3. Changes in sperm motility in boars ejaculates depending on the month
Duroc × PietrainPLPietrainPLW
I II III IV V VI VII VIII IX X XI XIImonth
81
80
79
78
77
76
75
74
% o
f spe
rmat
ozoa
with
pro
per m
otili
ty

82 M. Kunowska-Slósarz, A. Makowska
and August, September showed greater motility of spermatozoa, while from Sep-tember to November was characterised by a significant decrease in sperm motil-ity, as well as breeds PLW, PL, Pietrain. The biggest changes in sperm motility were seen in July (an increase for Polish Landrace and the decline for PLW).
DISCUSSION
Breed and sperm parameters
Obtained results suggest that the breed of boar has a substantial effect on semen volume, sperm concentration and % of live spermatozoa in the ejaculate.
The average ejaculate volume of an adult boar is estimated as around 200–250 ml. The volume of ejaculate of the boar range from 100 to 1000 ml. Effect of breed on the volume of the boar ejaculate also showed in their study of Gączarzewicz et al. (2000), Udała et al (2005), Kondracki (2003), Dubiel (1987).
The analysis of literature data shows that hybrids characterized the better semen parameters than the purebred boars. In Gączarzewicz et al. (2000) observed that the boars of Polish Large White breed, Pietrain, Hampshire, Duroc ejaculates obtained lower volume than hybrids. Ones thus, these studies sug-gest that purebred boars had worse the quantitative parameters of semen than hybrids, which is not consistant with presented results. However, the results by Wysokińska et al. (2008) confirm the results obrained by authors. These authors also showed that the volume of ejaculates of purebreds (Duroc breed is an exception) exceeds the amount of
volume of semen obtained from Duroc × Pietrain hybrids.
The concentration of spermatozoa (sperm density) is estimated based on the number of sperm per its volume (1 mm3). Normally, the volume of ejaculate is closely related to its concentration. There is a correlation between the volume and concentration of spermatozoa in the ejaculate. The volume is inversely pro-portional to the concentration of sper-matozoa. The larger volume of ejaculate means the lower concentration of sperm and vice versa. The average number of sperm in 1 ml of ejaculate varies from 150 × 106 to 600 × 106 (Strzeżek, 1999).
As indicated by literature data and own research the level of concentration of sper-matozoa depends on the boar’s breed. In studies of Kondracki (2003), the hybrids Duroc × Pietrain showed an intermediate concentration 559.97 thous./mm3 then the purebreeds (Duroc and Pietrain), but it was closer to the Duroc breed. The concentration of spermatozoa of the Pietrain breed was an average of 445.12 thous./mm3 and differed significantly (P ≤ 0.01) by over 140 thous./mm3 the concentration of the breed Duroc boars 588.17 thous./mm3. Paternal heterosis resulted as an example: Duroc × Pietrain generally characterised the better semen quality parameters, a stronger libido, and larger testes than Pietrain breed. These studies confirm the results achieved in our study, where in Pietrain and Duroc hybrids was the highest concentration of spermatozoa in contrast to the much lower values of this trait in the other purebreeds. In studies Milewska (2007) the highest concentration of sperm cells can be observed in boars of the Pietrain breed (388 thous./mm3), but statistically

Effect of breed and season on the boar’s semen characteristics 83
significant differences between the races was not observed. Among the hybrids the highest concentration showed Duroc × Pietrain boars average of 356 thous./mm3, which also confirms the results obtained in our study. Research by Szostak (2003) confirms significant differences in sperm concentration between ejaculates of dif-ferent breeds, and indicate a correlation between the volume and concentration of spermatozoa in the ejaculate.The highest concentration had ejaculates, which showed the smallest volume. In our research, this relationship was also observed in boars of the Pietrain breed, which were characterised by a large volume of semen, but a small concentra-tion of spermatozoa, while in the hybrids ejaculates were of low volume, but with a high concentration of spermatozoa.
Also Milewska et al. (2003) in the study showed differences in sperm con-centration in tested ejaculates of boars. The highest concentration in ejaculate showed boars of PLW breed (365 thous./mm3), Pietrain (358 thous./mm3), and hybrid 990 × Pietrain (348 thous./mm3). This results highly significant (P ≤ 0.01) differed from the concentration of Duroc boars ejaculates (190 thous./mm3) and significantly (P ≤ 0.05) from Hampshire boars (287 thous./mm3) and Hampshire × Pietrain hybrids (267 thous./mm3). The authors of these studies confirm the sig-nificant influence of boar breed on sper-matozoa concentration in the ejaculate (Milewska et al., 2003).
Assessment of sperm motility (% of live sperm in the ejaculate) is one of the most important sperm parameters. The percentage of motile sperm, ejaculate volume, sperm concentration, and – on the basis of these three parameters, labo-
ratory staff assess whether the semen meets the minimum criteria for suitabil-ity for artificial insemination. (Brucka-Jastrzębska et al., 2008; Gasiński, 1999).
Brucka-Jastrzębska et al. (2008) in the studies comparing the sperm parameters of different breeds showed the better semen parameters of hybrids in relation to purebreds ones. The largest percentage of live sperm per ejaculate were in hybrids Pietrain × Duroc, Duroc × Pietrain. Also, the results of Kondracki et al. (2003) in hybrids Duroc × Pietrain, and purebreeds Duroc and Pietrain, the sperm motility characteristics, show that the hybrids are better than purebreeds. This was caused by heterosis effect on the sperm motility. Duroc breed was characterised by a sperm motility of higher than about 0.53% of the Pietrain breed. Sperm motility of hybrids was higher about 3.31% from Duroc and about 3.84 from Pietrain, which was statistically significant (P ≤ 0.01). In con-clusion ejaculates of different breeds may differ significantly by semen parameters, including percentage of motile spermato-zoa, which also confirmed in our research, where the greatest percentage of motile sperm were characterized by ejaculates collected from hybrids Duroc × Pietrain.
Season of the year and sperm parameters
Seasonality exploitation of boars influences the number and quality of collected semen. In our study, the most quantitatively ejaculates were collected in autumn and winter. Similar results ie, significantly higher volumes of ejacu-lates of boars in the fall and winter season have shown in studies by Pokrywka and Ruda (2004), Wysokińska et al. (2005),
84 M. Kunowska-Slósarz, A. Makowska
Kondracki et al. (1997). Influence of season on semen volume obtained is explained by the authors according to the length of light, ambient temperature, seasonal variations in male sexual activ-ity. Shorter days and lower temperature in autumn-winter season, had a beneficial effect on the quantity of sperm produced (the process of spermatogenesis). During the summer the authors have received ejaculates from boars with less favorable characteristics, since in this period, boars have a weaker libido and reduced sperm production. In our study, the smallest volume was obtained during the spring (III–VI), which can be explained by reduced male sexual activity during this period.
The time of year had also significantly effect on the concentration of sperma-tozoa (Szostak, 2003; Bronicka and Dembiński, 1999; Kondracki et al., 1997; Milewska, 2003; Sławeta and Strzeżek, 1984; Wysokińska et al., 2005). The analysis made by Kondracki et al. (1997) shows that the highest concentration of sperm were characterised by ejaculates collected from August to November (autumn season) above 470 thous./mm3, and the lowest concentration in a month: January, February, March (winter season) below 420 thous./mm3. Research of Sławeta and Strzeżek (1984) also showed the highest concentration of sperm in the autumn season (an average of 472.67 thous./mm3), and the lowest in winter (average of 340.51 thous./mm3). Accor-ding to Bronicka and Dembiński (1999), ejaculates collected in the autumn season has the highest concentration of sperm as a result of restoring the functionality of testis after the summer. Low libido in the summer is manifested as a result of sea-
sonal changes in the behavior of sexually active boar. Autumn season positively affects the process of spermatogenesis, as a result of lower ambient temperature. Also Szostak (2003) in his study received the largest concentration in the autumn season (430.61 thous./mm3) and spring (415.82 thous./mm3) and the lowest in winter (403.27 thous./mm3). Presented results differ from those obtained in above mentioned studies. The highest concentrations of sperm were obtained in the winter-spring season. At the same time presented research confirms the negative correlation between the volume and concentration of spermatozoa. The highest volume had ejaculates of the autumn months and therefore the con-centration of sperm in these months was the lowest. The largest concentration of spermatozoa in ejaculates was in the spring months and the same volume of ejaculates at the time were the smallest.
Live sperm motility in the ejaculate is another parameter dependent on envi-ronmental factors. The highest percent-age of live sperm was found in the winter and spring season and late summer. The lowest values of this feature for the season coincided with the autumn and summer. Similar results were obtained by Kondracki et al. (1997), from August to November (the end of summer, the season of autumn) the percentage of sperm with progressive movement was much smaller. The highest percentage of live sperm was from January to April (winter, early spring). In the summer time, there is a reduction of sperm motil-ity, due to greater ambient temperature, which in turn leads to disturbances in the process of spermatogenesis. Influence of season on the % of live spermatozoa

Effect of breed and season on the boar’s semen characteristics 85
in the ejaculate were confirmed also in studies by other authors Pokrywka and Ruda (2004) but Wysokińska et al. (2005) have shown no significant impact seasons on sperm motility.
CONCLUSION
Based on the results concluded that season and breed has an effect on volume, sperm concentration and sperm live in ejaculates obtained from boars semen used for insemination.
REFERENCES
BRONICKA A., DEMBIŃSKI Z., 1999: Aktualne kryteria oceny oraz uwarunkowania jakości na-sienia knura. Medycyna Wet. 55 (7), 436–439.
BRUCKA-JASTRZĘBSKA E., BIAŁEK M., BRZEZIŃSKA M., KAŃCZUGA D., DREW-NOWSKI W., LISIECKI L., 2008: Parametry ejakulatu w zależności od rasy świń. Medycy-na Wet. 64 (10), 1248–1251.
DUBIEL A., 1987: Wpływ wieku oraz leków układu adrenergicznego na odruchy płciowe i właściwości nasienia knurów wybranych ras. Zesz. Probl. Post. Nauk Roln. 340, 121–140.
GASIŃSKI M., 1999. Zasady postępowania z na-sieniem knura. Trzoda chlewna 4: 24–26.
GĄCZARZEWICZ D., UDAŁA J., LASOTA B., BŁASZCZYK B., 2000: Kształtowanie się wybranych wskaźników oceny jakościowej i biochemicznej nasienia knurów eksploato-wanych w zakładzie unasienniania zwierząt. Zesz. Nauk. Chów Hod. Trzody Chlewnej 48 (1), 93–101.
KONDRACKI S., 2003: Wykorzystanie insemi-nacji w chowie świń. Hodowca Trzody Chlew-nej 2, 32–35.
KONDRACKI S., ANTOLIK A., ZWIERZ B., 1997: Cechy nasienia knura w zależności od pory roku. Rocz. Nauk. Zoot. T. 24, z. 3, 67–76.
KONDRACKI S., WYSOKIŃSKA A., KOWAL-CZYK Z., 2003: Wpływ krzyżowania ras duroc i pietrain na cechy ejakulatów knurów mieszańców dwurasowych. Zeszyty Naukowe Przeglądu Hodowlanego 68 z. 2, 105–112.
KUNAVONGKRIT A., PRATEEP P., 1995: Influ-ence of ambitne temperature on reproductive efficiency in pigs: (1) boar semen quality. Pig J. 35, 43–47.
MILEWSKA W., 2007: Ocena przyżyciowa knu-rów rasy hampshire i pietrain oraz mieszańców dwurazowych, a efekt użytkowania rozpłodo-wego w stacjach unasienniania loch. Medycy-na Wet. 63 (6), 708–711.
MILEWSKA W., ELJASIAK J., TYMIŃSKI K., 2003: Długość użytkowania przyczyny brako-wania oraz jakość nasienia knurów insemina-cyjnych. Zeszyty Naukowe Przeglądu Hodow-lanego 68 z. 2, 123–130.
POKRYWKA K., RUDA M., 2004: Wpływ se-zonu eksploatacji na wybrane wskaźniki ilo-ściowe i jakościowe nasienia knurów rozpo-czynających użytkowanie w różnym wieku. Zeszyty Naukowe Przeglądu Hodowlanego 72 z. 2, 85–92.
SŁAWETA R., STRZEŻEK J., 1984: Pora roku a właściwości biologiczne konserwowanego nasienia knura. Medycyna Wet. 40(10), 619–622.
STRZEŻEK J., 1999: Andrologia. Wyd. Platan, Kraków, 201–215.
SZOSTAK B., 2003: Wpływ genotypu, wieku knura i sezonu eksploatacji na wybrane cechy ejakulatów. Zeszyty Naukowe Przeglądu Ho-dowlanego 68 z. 2, 147–152.
UDAŁA J., GĄCZARZEWICZ D., LASOTA B., BŁASZCZYK B., SEREMAK B., STANKIE-WICZ T., 2005: Charakterystyka zmian budo-wy morfologicznej plemników knurów użyt-kowanych w inseminacji. Folia Univ. Agric. Stetin. Zootechnika 243 (47), 161–172.
WYSOKIŃSKA A., KONDRACKI S., BA-NASZEWSKA D., 2005: Wpływ pory roku na cechy fizyczne ejakulatu knurów mieszańców duroc x pietrain i hampshire × pietrain oraz ra-sowych knurów ras duroc, hampshire i pietrain. Roczniki Naukowe Polskiego Towarzystwa Zootechnicznego, t. 1, nr 3, 533–541.
Streszczenie: Wpływ sezonu oraz rasy knura na wybrane cechy nasienia. Badania przeprowadzono na 6627 ejakulatach pobranych od knurów nastę-pujących ras: wielka biała polska, polska biała zwi-słoucha, pietrain, duroc × pietrain. Dane o ejakula-tach pobieranych w latach 2003–2008 pochodziły z Mazowieckiego Centrum Hodowli i Rozrodu
86 M. Kunowska-Slósarz, A. Makowska
Zwierząt w Łowiczu. Celem badań była ocena wpływu rasy knura i pory roku na niektóre cechy nasienia: objętość, koncentrację plemników oraz procent plemników żywych w ejakulacie. Spośród czterech badanych ras największą objętość ejaku-latu stwierdzono u rasy pietrain, najmniejszą zaś u duroc × pietrain. Koncentracja plemników w na-sieniu była najwyższa u duroc × pietrain i najniż-sza u pietrain. Najniższy procent żywych plemni-ków w ejakulacie zaobserwowano u pbz. Miesiąc, w którym pobierano nasienie od knurów, również wpłynął na parametry ejakulatów. Największe ob-jętości ejakulatów uzyskiwano w sezonie jesien-no-zimowym. W tych miesiącach również kon-centracja plemników była najmniejsza. Najwyższą koncentrację plemników w nasieniu i wysoki pro-
cent plemników żywych zanotowano podczas póź-nej zimy i wiosny. Podsumowując, można stwier-dzić, że sezon pobrania nasienia i rasa knura mają wpływ na objętość, koncentrację plemników i od-setek plemników żywych w ejakulatach uzyskiwa-nych od samców używanych do inseminacji.
MS. received August 2011
Authors’ address:Katedra Szczegółowej Hodowli Zwierząt – SGGWul. Ciszewskiego 802-786 WarszawaPolande-mail: [email protected]
Annals of Warsaw University of Life Sciences – SGGWAnimal Science No 49, 2011: 87–92(Ann. Warsaw Univ. of Life Sc. – SGGW, Anim. Sci. 49, 2011)
The assessment of fattening value of White-head Synthetic Line lambs kept in Ciosny farm in Łódź province
EWA KUŹNICKA, EWELINA KOŁODZIEJSKADepartment of Animal Breeding, Warsaw University of Life Science – SGGW
Abstract: The assessment of fattening value of White-head Synthetic Line lambs kept in Ciosny farm in Łódź province. The observation was car-ried out on 277 lambs born and reared on private farm Ciosny during 6 successive years. The infl u-ence of sex, birth type, and ewe’s lambing num-ber on birth weight, body weight at 28th, 56th and 70th day of life was evaluated. The ram lambs obtained higher daily gains in comparison with ewe lambs. The lack of differences on daily gains between singles and twins in 28th day of life sug-gested good milk performance of theirs mothers. The highly statistically lightest birth weight was delivered by fi rst time lambing ewe. Obtained results confi rmed good fattening performance of ram lambs as well as ewe lambs of White-head Synthetic Line.
Key words: sheep, synthetic line, fattening.
INTRODUCTION
In the realities of market economy of our country, the profits from sheep produc-tion are obtained mainly from the selling slaughter’s lambs. The lack of domestic market for lambs’ meat and mutton and in the same time opportunities to export, led to regard slaughter lambs as the main sheep product. The quality of meat is an increasing importance to consumers in Europe and has gained preference over
quantity. To produce young lean lambs’ meat farmers needs the synthetic lines, which are an early maturing, have good meat performance and can be used for commercial crossbreeding with ewes of local breeds. The White-head Synthetic Line is meat line created in Poland. The aim of this study was estimation the fat-tening value of these synthetic line kept in private farm situated in central Poland.
MATERIAL AND METHODS
The observations were carried out in private farm situated in Łódź province. Based on breeding records, the fattening value of 277 White-head Synthetic Line lambs born and reared during 6 succes-sive years was evaluated. The mothers were between 2nd and 5th year of age and nursed single or twin litters. The number of animals in each investigated group shows Table 1.
The ewes were fed according to stand-ards with farm produced fodder like: grass hay, corn grain, rapeseed meal, red carrot. Throughout the rearing the lambs were with mothers and milk was their basic food. From 2nd week of age, they were given additional concentrate (oats, barley, soybean meal) and grass hay ad libitum.
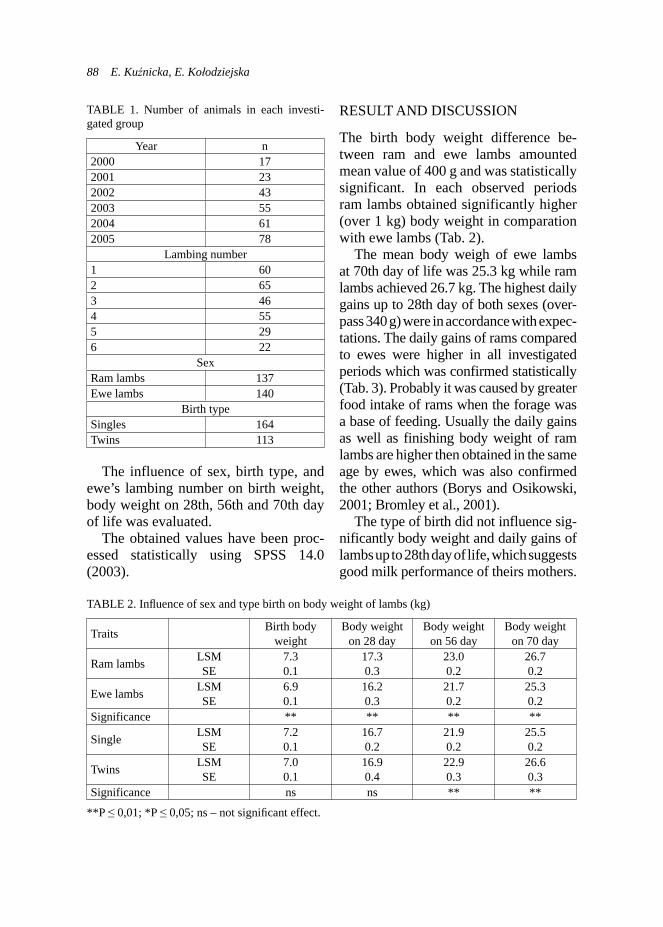
88 E. Kuźnicka, E. Kołodziejska
RESULT AND DISCUSSION
The birth body weight difference be-tween ram and ewe lambs amounted mean value of 400 g and was statistically significant. In each observed periods ram lambs obtained significantly higher (over 1 kg) body weight in comparation with ewe lambs (Tab. 2).
The mean body weigh of ewe lambs at 70th day of life was 25.3 kg while ram lambs achieved 26.7 kg. The highest daily gains up to 28th day of both sexes (over-pass 340 g) were in accordance with expec-tations. The daily gains of rams compared to ewes were higher in all investigated periods which was confirmed statistically (Tab. 3). Probably it was caused by greater food intake of rams when the forage was a base of feeding. Usually the daily gains as well as finishing body weight of ram lambs are higher then obtained in the same age by ewes, which was also confirmed the other authors (Borys and Osikowski, 2001; Bromley et al., 2001).
The type of birth did not influence sig-nificantly body weight and daily gains of lambs up to 28th day of life, which suggests good milk performance of theirs mothers.
TABLE 1. Number of animals in each investi-gated group
Year n2000 172001 232002 432003 552004 612005 78
Lambing number1 602 653 464 555 296 22
SexRam lambs 137Ewe lambs 140
Birth type Singles 164Twins 113
TABLE 2. Infl uence of sex and type birth on body weight of lambs (kg)
Traits Birth body weight
Body weight on 28 day
Body weight on 56 day
Body weight on 70 day
Ram lambs LSMSE
7.30.1
17.30.3
23.00.2
26.70.2
Ewe lambs LSMSE
6.90.1
16.20.3
21.70.2
25.30.2
Significance ** ** ** **
Single LSMSE
7.20.1
16.70.2
21.90.2
25.50.2
Twins LSMSE
7.00.1
16.90.4
22.90.3
26.60.3
Significance ns ns ** **
**P ≤ 0,01; *P ≤ 0,05; ns – not signifi cant effect.
The influence of sex, birth type, and ewe’s lambing number on birth weight, body weight on 28th, 56th and 70th day of life was evaluated.
The obtained values have been proc-essed statistically using SPSS 14.0 (2003).

The assessment of fattening value of White-head Synthetic Line lambs... 89
When lambs were older the forage intake increased and the compensatory growth of twins took place. The differences in growth rate between singles and twins have been confirmed statistically in peri-ods between 1st–56th and 1st–70th day as well as 28th–56th and 28th–70th day. The twin’s body weight at 56th and 70th day of life was higher then singles (Tabs 2, 3). The other authors affirmed higher growth rate of singles (Stanisz et al., 1999; Yilmaz et al., 2007). The difference of discussed results in presented study may be caused
probably by similar birth body weight of singles and twins (Tab. 2). It was also confirmed by not statistically significant correlation between birth type and body weight and daily gains (Tab. 5).
The influence of ewe’s lambing number on birth and rearing body weight of their lambs was examined. Results showed, that progeny of the mothers after third parturition were significantly heavier at 28th (p ≤ 0.01), 56th (p ≤ 0.05) and 70th (p ≤ 0.05) day of life than ewe’s which were lambed first time (Tab. 4). The dif-
TABLE 3. Infl uence of sex and type birth on daily gains of lambs (kg)
Trails Daily gains1–28 days
Daily gains1–56 days
Daily gains1–70 days
Daily gains28–56 days
Daily gains28–70 days
Daily gains56–70 days
Ram lambs LSMSE
0.3710.012
0.2860.004
0.2810.004
0.2030.007
0.2230.005
0.2630.006
Ewe lambs LSMSE
0.3440.012
0.2690.004
0.2660.004
0.1970.007
0.2160.005
0.2550.006
Significance * ** ** ns ns ns
Singles LSMSE
0.3550.110
0.2690.003
0.2660.003
0.1860.006
0.2090.004
0.2540.005
Twins LSMSE
0.3600.170
0.2860.005
0.2810.006
0.2140.010
0.2310.007
0.2640.009
Significance ns ** * * ** ns
**P ≤ 0,01; *P ≤ 0,05; ns – not signifi cant effect.
TABLE 4. Infl uence of ewe’s lambing number on body weight of lambs (kg)
Ewe’s lambing number
Birth body weight
Body weight on 28 day
Body weight on 56 day
Body weight on 70 day
1 LSM 7.1 15.7 C 21.6 c 25.0 cSE 0.2 0.5 0.4 0.5
2 LSM 7.0 16.8 22.2 25.7SE 0.1 0.3 0.2 0.3
3 LSM 6.7 18.1 A 22.8 a 26.7 aSE 0.2 0.4 0.3 0.3
4 LSM 7.2 16.8 22.4 26.0SE 0.1 0.3 0.2 0.3
5 LSM 7.3 16.8 22.8 26.5SE 0.2 0.5 0.3 0.4
6 LSM 7.4 16.6 22.7 26.3SE 0.2 0.6 0.4 0.5
A, B, C – P ≤ 0,01; a, b, c – P ≤ 0,05; ns – not signifi cant effect.
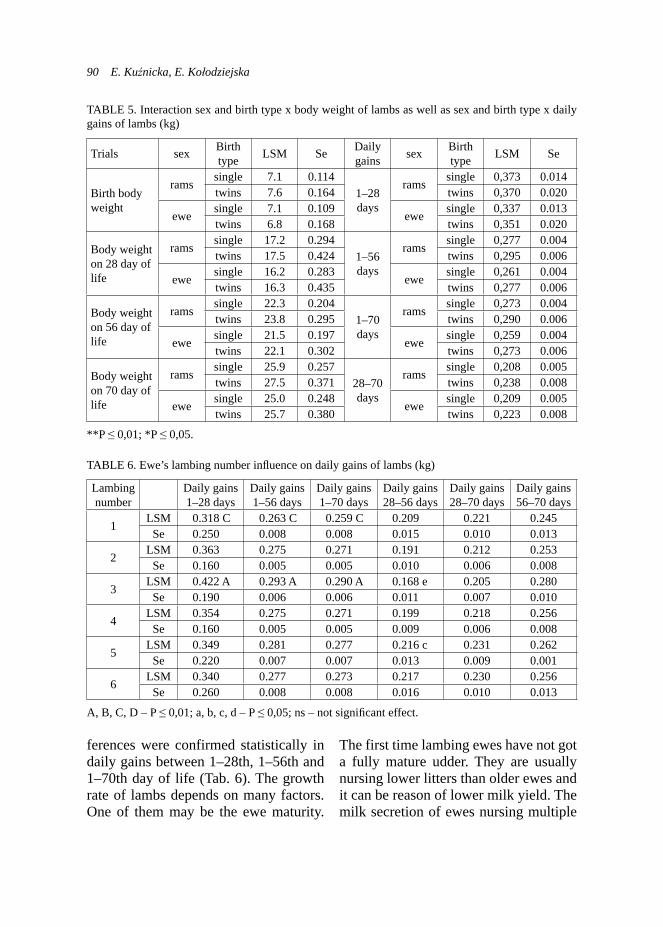
90 E. Kuźnicka, E. Kołodziejska
TABLE 5. Interaction sex and birth type x body weight of lambs as well as sex and birth type x daily gains of lambs (kg)
Trials sex Birth type LSM Se Daily
gains sex Birth type LSM Se
Birth body weight
ramssingle 7.1 0.114
1–28 days
ramssingle 0,373 0.014
twins 7.6 0.164 twins 0,370 0.020
ewesingle 7.1 0.109
ewesingle 0,337 0.013
twins 6.8 0.168 twins 0,351 0.020
Body weight on 28 day of life
ramssingle 17.2 0.294
1–56 days
ramssingle 0,277 0.004
twins 17.5 0.424 twins 0,295 0.006
ewesingle 16.2 0.283
ewesingle 0,261 0.004
twins 16.3 0.435 twins 0,277 0.006
Body weight on 56 day of life
ramssingle 22.3 0.204
1–70 days
ramssingle 0,273 0.004
twins 23.8 0.295 twins 0,290 0.006
ewesingle 21.5 0.197
ewesingle 0,259 0.004
twins 22.1 0.302 twins 0,273 0.006
Body weight on 70 day of life
ramssingle 25.9 0.257
28–70 days
ramssingle 0,208 0.005
twins 27.5 0.371 twins 0,238 0.008
ewesingle 25.0 0.248
ewesingle 0,209 0.005
twins 25.7 0.380 twins 0,223 0.008
**P ≤ 0,01; *P ≤ 0,05.
TABLE 6. Ewe’s lambing number infl uence on daily gains of lambs (kg)
Lambing number
Daily gains1–28 days
Daily gains1–56 days
Daily gains1–70 days
Daily gains28–56 days
Daily gains28–70 days
Daily gains56–70 days
1LSM 0.318 C 0.263 C 0.259 C 0.209 0.221 0.245
Se 0.250 0.008 0.008 0.015 0.010 0.013
2LSM 0.363 0.275 0.271 0.191 0.212 0.253
Se 0.160 0.005 0.005 0.010 0.006 0.008
3LSM 0.422 A 0.293 A 0.290 A 0.168 e 0.205 0.280
Se 0.190 0.006 0.006 0.011 0.007 0.010
4LSM 0.354 0.275 0.271 0.199 0.218 0.256
Se 0.160 0.005 0.005 0.009 0.006 0.008
5LSM 0.349 0.281 0.277 0.216 c 0.231 0.262
Se 0.220 0.007 0.007 0.013 0.009 0.001
6LSM 0.340 0.277 0.273 0.217 0.230 0.256
Se 0.260 0.008 0.008 0.016 0.010 0.013
A, B, C, D – P ≤ 0,01; a, b, c, d – P ≤ 0,05; ns – not signifi cant effect.
ferences were confirmed statistically in daily gains between 1–28th, 1–56th and 1–70th day of life (Tab. 6). The growth rate of lambs depends on many factors. One of them may be the ewe maturity.
The first time lambing ewes have not got a fully mature udder. They are usually nursing lower litters than older ewes and it can be reason of lower milk yield. The milk secretion of ewes nursing multiple
The assessment of fattening value of White-head Synthetic Line lambs... 91
litters may rise from 20 to 40% (Bromley et al., 2001). The findings of Gruszecki et al., 2002 and Ayestaran et al., 2004 confirmed the effect of lambing number on milk amount, showing increased yield from the first to the third lactations. Up to 28th day of lamb’s life the milk is their basic food so the daily gains in that fat-tening period mostly depends of the milk productivity of their mothers, that’s why the biggest differences in body weight of lambs was noted at that period. In older lambs the differences of body weight were lower however statistically con-firmed.
The differences between body weight and daily gains of lambs in analyzed years reached 20%. The effect of year of investigation is known to be a sig-nificant source of variation, which has been attributed to factors such as fodder availability, changes in feeding method or differences in weather condi-tions during crucial production stages (Gruszecki et al., 2002; Niedziółka and Pieniak-Lędzion, 2005; Kuźnicka and Rant, 2008).
CONCLUSIONS
The ram lambs obtained higher daily gains in comparison with ewe lambs. The lack of differences on daily gains between singles and twins in 28th day of life suggested good milk perform-ance of theirs mothers. The highly statistically lightest birth weight was delivered by first time lambing ewe. Obtained results confirmed good fattening performance of ram lambs as well as ewe lambs of White-head Synthetic Line.
REFERENCES
AYESTARAN O., ALFONSO L., PEREZ DE ALBENIZ J.I., 2004: Milk production by Assaf sheep. Albeitar, 78, 26–28.
BENSON M.E., HENRY M.J., CARDELLINO R.A., 1999: Comparison of weigh–suckle–we-igh and machine milking for measuring ewe milk production. Journal of Animal Science, 77, 9, 2330–2335.
BORYS B., OSIKOWSKI M., 2001: Wpływ me-tody żywienia jagniąt mieszańców merynosa z rasami plennymi i mięsną na wartość tuczną i rzeźną przy tuczu do wyższych standardów wagowych (30–40 kg). Roczniki Naukowe Zootechniki, 28, 1, 119–135.
BROMLEY C.M., VAN VLECK L.D., SNOW-DER G.D., 2001: Genetic correlations for litter weight weaned with growth, prolificacy, and wool traits in Columbia, Polypy, Rambuillet, and Targhee sheep. Journal of Animal Science, 79, 2, 339–345.
GRUSZECKI T., SZYMANOWSKA A., LIPEC-KA C., MARKIEWICZ J., 2002: Produkcyj-ność owiec utrzymywanych w warunkach chowu ekstensywnego. II. Obserwacje nad mlecznością maciorek. Annales Universittatis Mariae Curie-Skłodowska, Lublin – Polonia, XX, 27, 193–197.
GUT A., KOZAL E., ŚLUSARZ P., 1995: Zna-czenie syntetycznych linii w programach ho-dowli owiec w kraju, Wydawnictwo Akademii Rolniczej, Poznań, 9–17.
KUŹNICKA E., RANT W., 2008: Comparison of ewe milk production and lamb growth in Żelaźnieńska Sheep kept in a barn or under overhead shelter. Ann. Anim. Sci, Vol. 8, No 2 (2008), 175–183.
NIEDZIÓŁKA R., PIENIAK-LENDZION K., 2005: Charakterystyka produkcyjności owiec rasy berrichone du cher w latach 1999–2002. LXX Zjazd PTZ, Wrocław, 125.
RZEPECKI R., 1996: Intensywna produkcja ja-gniąt, Fundacja Programów Pomocy dla Rol-nictwa, Instytut Zootechniki, 185.
STANISZ M., GUT A., WAŻNA E., 1999: War-tość opasowa i rzeźna jagniąt syntetycznej linii w typie owcy Berrichon du cher. Prace Komisji Nauk Rolniczych i Komisji Nauk Leśnych, 87, 179–185.

92 E. Kuźnicka, E. Kołodziejska
YILMAZ O., DENK H., BAYRAM D., 2007: Ef-fects of lambing season, sex and birth type on growth performance in Norduz lambs. Small Ruminant Research, 68, 336–339.
Streszczenie: Ocena przydatności do tuczu ja-gniąt białogłowej linii mięsnej utrzymywanej w gospodarstwie Ciosny w województwie łódz-kim. Na podstawie dokumentacji hodowlanej do-konano oceny użytkowości mięsnej 277 jagniąt urodzonych i odchowywanych w prywatnym gospodarstwie, w sześciu kolejnych latach. Przy użyciu pakietu statystycznego SPSS wersja 12.0 zostały oszacowane następujące parametry: masa ciała przy urodzeniu oraz w 28, 56 i 70 dniu ży-cia jagniąt, wpływ płci, typu urodzenia, numeru wykotu matki i roku wykotu na tempo wzrostu jagniąt. Stwierdzono, że jagnięta tryczki uzyskały
istotnie wyższe przyrosty dzienne oraz masę cia-ła w porównaniu z jagniętami maciorkami. Brak różnic w przyrostach dziennych między jedyna-kami i bliźniętami w okresie od urodzenia do 28 dnia wskazuje na dobrą mleczność matek. Wyso-ko istotnie niższą masę ciała jagniąt zanotowano u pierwiastek. Uzyskane wyniki potwierdzają przydatność do tuczu jagniąt białogłowej linii syntetycznej zarówno tryczków, jak i maciorek.
MS. received August 2011
Authors’ address:Katedra Szczegółowej Hodowli Zwierząt – SGGWul. Ciszewskiego 802-786 WarszawaPoland

Annals of Warsaw University of Life Sciences – SGGWAnimal Science No 49, 2011: 93–102(Ann. Warsaw Univ. of Life Sc. – SGGW, Anim. Sci. 49, 2011)
A comparison of polymorphism of DQA genes in European bison belonging to two genetic lines: Lowland and Lowland-Caucasian
MAGDALENA ŁOPIEŃSKA, ZUZANNA NOWAK, KRYSTYNA M. CHARON, WANDA OLECHDepartment of Genetics and Animal Breeding, Warsaw University of Life Sciences – SGGW
Abstract: A comparison of polymorphism of DQA genes in European bison belonging to two genetic lines: Lowland and Lowland-Caucasian. The currently living population of European bison (Bison bonasus) is divided into two genetic lines: Lowland line (LB) and Lowland-Caucasian line (LC). In order to compare the genetic diversity in two above mentioned lines the polymorphism of the major histocompatibility complex (MHC) DQA1 and DQA2 genes was analyzed. MHC genes are highly polymorphic and can therefo-re be used to asses genetic diversity in different species including endangered ones. The genetic polymorphism of exon 2 DQA1 and DQA2 genes was examined in 200 individuals of Lowland line and 56 individuals of Lowland-Caucasian line. The SSCP analysis revealed two alleles and two genotypes of exon 2 DQA1 gene and three alleles and four genotypes of exon 2 DQA2 gene. Frequ-ency of genotypes of exon 2 DQA2 gene was si-gnifi cantly different (chi-square test p ≤ 0.05) be-tween two genetic lines of European bison. Four haplotype confi gurations of DQA genes – DQA1, DQA2, DQA1/DQA2 and DQA1/DQA2_2 were observed. DQA1 haplotype confi guration was ob-served only in individuals belonging to LC and DQA1/DQA2_2 only in European bison from LB. Differences of frequency of haplotypes in two ge-netic lines were highly signifi cant (chi-square test p ≤ 0.01).
Key words: European bison, Bison bonasus, poly-morphism, SSCP, DQA, MHC.
INTRODUCTION
Historically, the European bison was distributed through western, central and south-eastern Europe. In the beginning of twentieth century, free-ranging popula-tions became extinct. Only 54 (29 males and 25 females) individuals with docu-mented pedigrees survived in zoological gardens and reserves. The currently living population of European bison de-scended from only 12 founders (Olech, 2009) and is divided into two genetic lines: a Lowland (Białowieża) line and a Lowland-Caucasian line. The Lowland line i.e. pure lowland subspecies (Bison bonasus bonasus), originates from only 7 founders (4 males and 3 females). The gene pool of the Lowland-Caucasian line contains genes from all 12 founders including male “Kaukasus” originating from subspecies caucasicus (Bison bo-nasus caucasicus) (Slatis, 1960; Olech, 1987; 2003).
The species went through an extreme bottleneck and consequently, currently living populations of European bison are highly inbred. Previous studies using various markers: allozyme (Hartl and Pucek, 1994), blood groups (Sipko et al.,

94 M. Łopieńska et al.
1995), mitochondrial DNA (Tiedemann et al., 1998; Burzyńska et al., 1999) mic-rosatellites (Gralak et al., 2004; Nowak and Olech, 2008), and highly polymor-phic MHC genes (Udina et al., 1994a; 1994b; Udina and Shaikhaiev, 1998; Łopieńska et al., 2003; Radwan et al., 2007) confirmed low genetic diversity in both genetic lines of European bison.
Studies of Major Histocompatibility Complex (MHC) genes in European bison are conducted based on existing knowledge about equivalent region in cattle. The bovine Major Histocompat-ibility Complex (MHC) called Bovine Lymphocyte Antigens (BoLA) is locat-ed on the short arm of chromosome 23 (BTA23) and contains three classes I, II and III (Andersson and Davies, 1994). Class III products have a wide range of activities from cell cytotoxicity (tumor necrosis factor TNF-α and TNF-β) to enzymatic activity (21β-hydroxylase) (Andersson and Davies, 1994). The product of class III genes is also Heat Shock Protein (HSP70) (McShane et al., 2001). The genes of class I and class II encode cell-surface glycoproteins whose function is to recognize, bind in their antigen binding groove, and present antigenic peptides to T lymphocytes. The antigen binding groove is encoded by the second exon of the gene which demonstrates high polymorphism and this determines the capability of MHC products to bind to a wide range of pep-tides (Sharif et al., 1998). MHC genes are extremely polymorphic in cattle and other vertebrates.
The BoLA class II is divided by gene inversion event into two regions desig-nated IIa and IIb. The IIa region contains genes DOA, DMA, DMB, DYA, DYB.
In IIb region are situated DRA, DRB, DQA and DQB genes which encode MHC class II molecules (Ballingall et al., 2004; Takeshima and Aida, 2006). A feature unique in cattle and sheep is certain variability in the number of DQ loci in their haplotypes. Each cattle class II haplotype expresses a single DR product and one or more DQ products due to duplication of the DQ genes and this duplication occurs in about half haplotypes (Ellis and Ballingall, 1999; Lewin et al., 1999; Russell, 2000). Cattle haplotypes carry either a single DQA1 locus, or single DQA1 locus together with a single DQA2 locus or two DQA2 loci (Gelhaus et al., 1999). All DQA loci in cattle and sheep are polymorphic with approximately 50 different alleles identi-fied in both species (http://www.projects.roslin.ac.uk/bola, www.ncbi.nlm.nih.gov). Highly polymorphic genes of MHC are used as markers for cattle and other many species (Lewin et al., 1999) and also can be used to asses diversity in endangered species (Haig, 1998).
The aim of this study was to per-form the first examination of variabil-ity in DQA loci in European bison and compare genetic diversity in exon 2 of DQA1 and DQA2 gene in two genetic lines: Lowland line and Lowland-Cau-casian line.
MATERIALS AND METHODS
Samples (whole blood, liver and kidney tissue and hair roots) were collected from 200 European bison belonging to Lowland line (LB) and 56 from Low-land-Caucasian line (LC) came from free-ranging and captive herds from Poland and other European countries.
A comparison of polymorphism of DQA genes in European bison... 95
DNA isolation
The total DNA was extracted from whole blood using the standard phenol-chloro-phorm extraction protocol (Sambrook et al., 1989), from soft tissues by treatment with proteinase K and precipitation by sodium chloride (http://www.genomics.liv.ac.uk), and from hair roots using the Chelex 100 (Sigma) method (Walsh et al., 1991).
Amplification
Exon 2 DQA1 gene
Exon 2 of DQA1 gene was amplified by PCR method with primers described by Snibson et al. (1998) primer Forvard, and Zhou and Hickford (2004) primer Revers.
Amplification was carried out in 15 μl total volumes. The reaction mixture con-sisted of optimized concentrations of: 1xREDtaqPCRBuffer (Sigma), MgCl2
(Polgen), dNTPs (Polgen), 8 pmol of each primers, 0.5 unit REDtaq DNA polymerase (Sigma), 100 ng DNA tem-plate and sterile water. The amplification profile consisted of 2 min at 94°C initial denaturation, followed by 30 cycles of 30 s at 94°C, 40 s at 58°C and 45 s at 72°C, with a final extension of 5 min at 72°C.
Exon 2 DQA2 gene
Exon 2 of DQA2 gene was amplified with polymerase chain reaction (PCR) using primers described by Scott et al. (1991). Amplification was carried out in 15 μl total volumes. The reaction mixture consisted of optimized concentrations of: 1xREDtaqPCRBuffer (Sigma), MgCl2
(Polgen), dNTPs (Polgen), 8 pmol of each
primers, 0.5 unit REDtaq DNA polymer-ase (Sigma), 100 ng DNA template and sterile water. The amplification profile consisted of 2 min at 94°C initial dena-turation, followed by 30 cycles of 30 s at 94°C, 40 s at 56°C and 45 s at 72°C, with a final extension of 5 min. at 72°C.
The PCR product was visualized in ethidium bromide stained with 1.5% agarose gels.
PCR-SSCP analysis
The amplified product of each sample was analyzed by Single Strand Confor-mation Polimorphism (SSCP) technique. PCR product was mixed with loading dye (Bromophenol blue, Xylene, For-mamid, EDTA), denaturated at 90°C for 5 min and cooled on ice. Then product was resolved on 12% nondenaturing polyacrylamide gel. Electrophoresis was carried out on DCodeTM Universal Muta-tion Detection System (BioRad) at con-stant conditions: 240 min. at 35 W, 10°C in 1XTBE buffer. Gels were stained with silver nitrate (AgNO3) (Sambrook et al., 1989).
Cloning and sequencing
PCR products corresponding to dif-ferent SSCP patterns were cloned and sequenced. Chosen PCR product was purified with QIAquick Gel Extraction (Qiagen) and cloned using pGEM™-TEasy vector (Promega). Purified PCR product was cloned into vector pGEM™-TEasy (Promega). Component cells of Escherichia coli JM109 (Promega) were transformed with recombinant plasmid and selected by ampicilin-blue/white screening. After growing in Louria-Bertani liquid

96 M. Łopieńska et al.
medium the positive clones (white) were preparated with Wizard®PlusMinipreps DNA Purification System (Promega) and sequencing in a reaction total volume 27 μl using Thermo Sequenase Cy5 Terminator Cycle Sequencing Kit (Amersham Bioscience). Nucleotide sequences were detected in automated sequenced ALFexpress II (Amersham Pharmacia Biotech).
Statistical and sequence analysis
The Popgen32 program (http://cc.oulu.fi/~jaspi/popgen/popdown.htm) was used to estimate the statistical param-eters such as frequencies of genotypes and haplotypes.
Potential differences between two genetic lines of European bison were eval-uated using chi-square test. The BLAST algorithm was used for the comparison of sequences obtained with homolo-gous sequences from NCBI GenBank (http//:www.ncbi.nlm.nih.gov/BLAST). A phylogenetic tree showing relation-ships was constructed from the matrix of sequences similarities calculated with the UPGMA method using MEGA pro-gram (Kumar et al., 2004).
RESULTS AND DISCUSSION
In PCR reaction used were primers described previously for amplification of exon 2 DQA1 gene (Snibson et al., 1998; Zhou and Hickford, 2004) and exon 2 DQA2 gene (Scott et al., 1991) in sheep. The European bison belongs to the family Bovidae so primers used for amplification of exon 2 of DQA1 and DQA2 genes in sheep, could be applied for amplification equivalent region in
European bison. The previous compari-son analysis of the nucleotide sequence of exon 2 ovine DQA1 and DQA2 genes with equivalent fragments of cattle showed that the ovine sequences are more similar to their bovine counterparts then to each other (Snibson et al., 1998).
The second exon of DQA1 gene was successfully amplified by PCR reaction in 85 from 200 examined European bison belonging to Lowland line (LB) and in 39 from 56 in Lowland-Caucasian line (LC). The amplified fragment was 253 bp long. These primers did not amplified the analyzed fragment in 115 from LB and in 17 from LC.
The second exon of DQA2 gene was successfully amplified by PCR reaction in all animals from LB. In 12 animals belonging to LB amplified fragment of 282 bp was obtained and in 186 animals from this line product was 253 bp long.
Among European bison from LC PCR product 253 bp long was obtained in 43 from 56 examined, in the other 13 ani-mals exon 2 DQA2 gene did not ampli-fied.
On the basis of generated results, four different haplotypes were marked No1 (DQA1), No2 (DQA2), No3 (DQA1/DQA2) and No4 (DQA1/DQA2_2) in examined individuals. No4 haplotype occurred in animals with longer (282 bp) amplified fragment of exon 2 DQA2 gene. No1 haplotype was observed only in individuals from LC, and No4 hap-lotype was occurred only in LB line. Frequency of different haplotypes in two investigated genetic lines of European bison describes Table 1. Differences of frequency of haplotypes in two genetic lines were highly significant (chi-square test p ≤ 0.01).
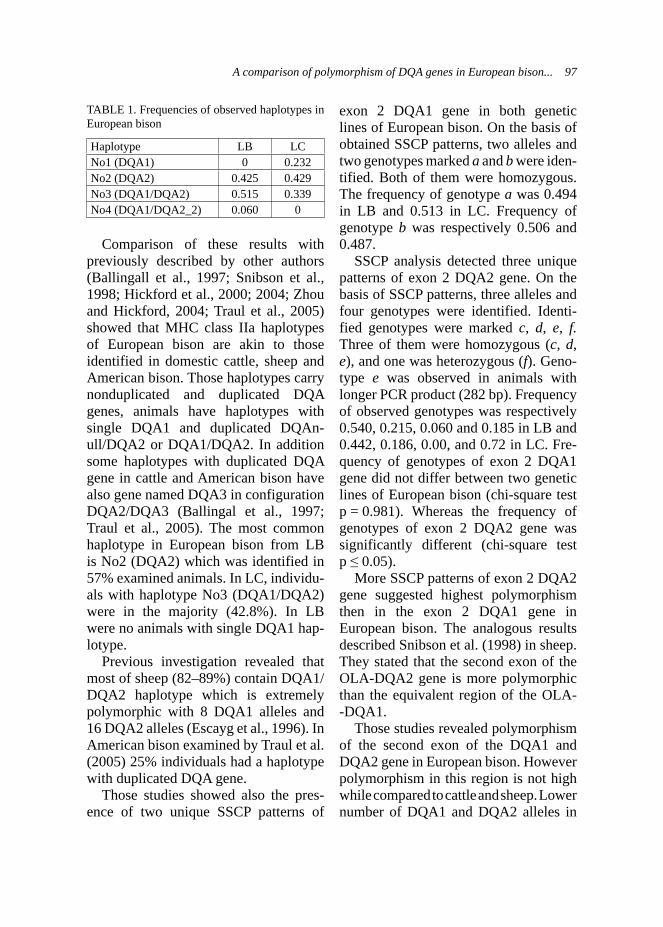
A comparison of polymorphism of DQA genes in European bison... 97
Comparison of these results with previously described by other authors (Ballingall et al., 1997; Snibson et al., 1998; Hickford et al., 2000; 2004; Zhou and Hickford, 2004; Traul et al., 2005) showed that MHC class IIa haplotypes of European bison are akin to those identified in domestic cattle, sheep and American bison. Those haplotypes carry nonduplicated and duplicated DQA genes, animals have haplotypes with single DQA1 and duplicated DQAn-ull/DQA2 or DQA1/DQA2. In addition some haplotypes with duplicated DQA gene in cattle and American bison have also gene named DQA3 in configuration DQA2/DQA3 (Ballingal et al., 1997; Traul et al., 2005). The most common haplotype in European bison from LB is No2 (DQA2) which was identified in 57% examined animals. In LC, individu-als with haplotype No3 (DQA1/DQA2) were in the majority (42.8%). In LB were no animals with single DQA1 hap-lotype.
Previous investigation revealed that most of sheep (82–89%) contain DQA1/DQA2 haplotype which is extremely polymorphic with 8 DQA1 alleles and 16 DQA2 alleles (Escayg et al., 1996). In American bison examined by Traul et al. (2005) 25% individuals had a haplotype with duplicated DQA gene.
Those studies showed also the pres-ence of two unique SSCP patterns of
exon 2 DQA1 gene in both genetic lines of European bison. On the basis of obtained SSCP patterns, two alleles and two genotypes marked a and b were iden-tified. Both of them were homozygous. The frequency of genotype a was 0.494 in LB and 0.513 in LC. Frequency of genotype b was respectively 0.506 and 0.487.
SSCP analysis detected three unique patterns of exon 2 DQA2 gene. On the basis of SSCP patterns, three alleles and four genotypes were identified. Identi-fied genotypes were marked c, d, e, f. Three of them were homozygous (c, d, e), and one was heterozygous (f). Geno-type e was observed in animals with longer PCR product (282 bp). Frequency of observed genotypes was respectively 0.540, 0.215, 0.060 and 0.185 in LB and 0.442, 0.186, 0.00, and 0.72 in LC. Fre-quency of genotypes of exon 2 DQA1 gene did not differ between two genetic lines of European bison (chi-square test p = 0.981). Whereas the frequency of genotypes of exon 2 DQA2 gene was significantly different (chi-square test p ≤ 0.05).
More SSCP patterns of exon 2 DQA2 gene suggested highest polymorphism then in the exon 2 DQA1 gene in European bison. The analogous results described Snibson et al. (1998) in sheep. They stated that the second exon of the OLA-DQA2 gene is more polymorphic than the equivalent region of the OLA--DQA1.
Those studies revealed polymorphism of the second exon of the DQA1 and DQA2 gene in European bison. However polymorphism in this region is not high while compared to cattle and sheep. Lower number of DQA1 and DQA2 alleles in
TABLE 1. Frequencies of observed haplotypes in European bison
Haplotype LB LCNo1 (DQA1) 0 0.232No2 (DQA2) 0.425 0.429No3 (DQA1/DQA2) 0.515 0.339No4 (DQA1/DQA2_2) 0.060 0
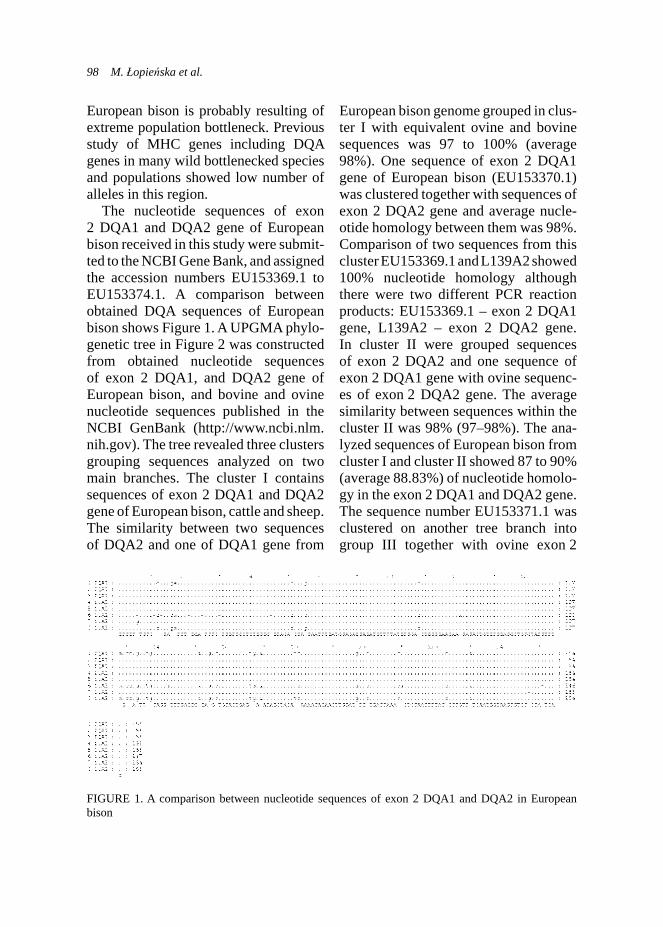
98 M. Łopieńska et al.
European bison is probably resulting of extreme population bottleneck. Previous study of MHC genes including DQA genes in many wild bottlenecked species and populations showed low number of alleles in this region.
The nucleotide sequences of exon 2 DQA1 and DQA2 gene of European bison received in this study were submit-ted to the NCBI Gene Bank, and assigned the accession numbers EU153369.1 to EU153374.1. A comparison between obtained DQA sequences of European bison shows Figure 1. A UPGMA phylo-genetic tree in Figure 2 was constructed from obtained nucleotide sequences of exon 2 DQA1, and DQA2 gene of European bison, and bovine and ovine nucleotide sequences published in the NCBI GenBank (http://www.ncbi.nlm.nih.gov). The tree revealed three clusters grouping sequences analyzed on two main branches. The cluster I contains sequences of exon 2 DQA1 and DQA2 gene of European bison, cattle and sheep. The similarity between two sequences of DQA2 and one of DQA1 gene from
European bison genome grouped in clus-ter I with equivalent ovine and bovine sequences was 97 to 100% (average 98%). One sequence of exon 2 DQA1 gene of European bison (EU153370.1) was clustered together with sequences of exon 2 DQA2 gene and average nucle-otide homology between them was 98%. Comparison of two sequences from this cluster EU153369.1 and L139A2 showed 100% nucleotide homology although there were two different PCR reaction products: EU153369.1 – exon 2 DQA1 gene, L139A2 – exon 2 DQA2 gene. In cluster II were grouped sequences of exon 2 DQA2 and one sequence of exon 2 DQA1 gene with ovine sequenc-es of exon 2 DQA2 gene. The average similarity between sequences within the cluster II was 98% (97–98%). The ana-lyzed sequences of European bison from cluster I and cluster II showed 87 to 90% (average 88.83%) of nucleotide homolo-gy in the exon 2 DQA1 and DQA2 gene. The sequence number EU153371.1 was clustered on another tree branch into group III together with ovine exon 2
FIGURE 1. A comparison between nucleotide sequences of exon 2 DQA1 and DQA2 in European bison
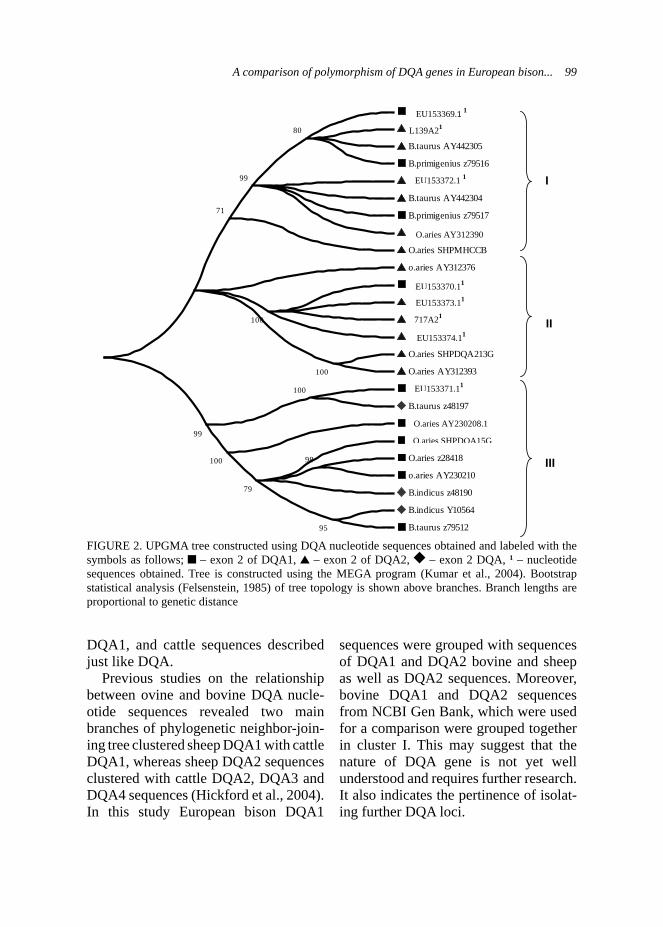
A comparison of polymorphism of DQA genes in European bison... 99
DQA1, and cattle sequences described just like DQA.
Previous studies on the relationship between ovine and bovine DQA nucle-otide sequences revealed two main branches of phylogenetic neighbor-join-ing tree clustered sheep DQA1 with cattle DQA1, whereas sheep DQA2 sequences clustered with cattle DQA2, DQA3 and DQA4 sequences (Hickford et al., 2004). In this study European bison DQA1
sequences were grouped with sequences of DQA1 and DQA2 bovine and sheep as well as DQA2 sequences. Moreover, bovine DQA1 and DQA2 sequences from NCBI Gen Bank, which were used for a comparison were grouped together in cluster I. This may suggest that the nature of DQA gene is not yet well understood and requires further research. It also indicates the pertinence of isolat-ing further DQA loci.
FIGURE 2. UPGMA tree constructed using DQA nucleotide sequences obtained and labeled with the symbols as follows; – exon 2 of DQA1, – exon 2 of DQA2, – exon 2 DQA, 1 – nucleotide sequences obtained. Tree is constructed using the MEGA program (Kumar et al., 2004). Bootstrap statistical analysis (Felsenstein, 1985) of tree topology is shown above branches. Branch lengths are proportional to genetic distance
636A1
L139A2
B.taurus AY442305
B.primigenius z79516
719A2
B.taurus AY442304
B.primigenius z79517
O.ariesA2
O.aries SHPMHCCB
o.aries AY312376
706A1
740A2
717A22
705A2
O.aries SHPDQA213G
O.aries AY312393
717A1
B.taurus z48197
O.ariesA12
O.ariesA11
O.aries z28418
o.aries AY230210
B.indicus z48190
B.indicus Y10564
B.taurus z79512
100
100
95
100
98
80
99
79
100
71
99
I
II
III
EU153370.11
EU153369.1 1
L139A21
EU153372.1 1
O.aries AY312390
EU153373.11
717A21
EU153374.11
EU153371.11
O.aries AY230208.1
O.aries SHPDQA15G
100 M. Łopieńska et al.
REFERENCES
ANDERSSON L., DAVIES C.J., 1994: The major histocompatibility complex. In: B.M.L. God-deeris, W.I. Morrison, eds.: Cell-Mediated Im-munity in Ruminants, 37–57, CRC Press, Boca Raton 1994.
BALLINGALL K.T., LUYAI A., McKEEVER D.J., 1997: Analysis of genetic diversity at the DQA loci in African cattle: evidence for a BoLA-DQA3 locus. Immunogenetics, 46: 237–244.
BALLINGALL K.T., ELLIS S.A., MACHUGH N.D., ARCHIBALD S.D., McKEEVER D.J., 2004: The DY genes of the cattle MHC: ex-pression and comparative analysis of an unu-sual class II MHC gene pair. Immunogenetics, 55: 748–755.
BURZYŃSKA B., OLECH W., TOPCZEWSKI J., 1999: Phylogeny and genetic variation of the European bison Bison bonasus based on mitochondrial DNA D-loop sequences. Acta Theriologica, 44 (3): 253–262.
ELLIS S.A., BALLINGALL K.T., 1999: Cattle MHC: evolution in action? Immunological Re-views, 167: 159–168.
ESCAYG A.P., HICKFORD J.G.H., MONT-GOMERY G.W., DODDS K.G., BULLOCK D.W., 1996: Polymorphism at the ovine major histocompatibility complex class II loci. Ani-mal Genetics, 27: 305–312.
FELENSTEIN J., 1985: Confidence limits on phylogenies: an approach using the bootstrap. Evolution 39: 783–791.
GELHAUS A., FORESTER B., WIPPERN CH., HORSTMAN R.D., 1999: Evidence for an ad-ditional cattle DQA locus, BoLA-DQA5. Im-munogenetics, 49: 321–327.
GRALAK B., KRASIŃSKA M., NIEMCZEW-SKI C., KRASIŃSKI Z.A., ŻURKOWSKI M., 2004: Polymorphism of bovine microsatellite DNA sequences in the lowland European bi-son. Acta Theriologica, 49 (4): 449–456.
HAIG S.M., (1998): Molecular contribution to conservation. Ecology, 79: 413–425.
HARTL G.B., PUCEK Z., 1994: Genetic Deple-tion in the European Bison (Bison bonasus) and the Significance of Electrophoretic Het-erozygosity for Conservation. Conservation Biology, 8 (1): 167–174.
HICKFORD J.G.H., RIDGWAY H.J., ESCAYG A.P., 2000: Evolution of the ovine MHC DQA region. Animal Genetics, 31: 200–205
HICKFORD J.G.H., ZHOU H., SLOW S., FANG Q., 2004: Diversity of the ovine DQA2 gene. Journal of Animal Science 82: 1553––1563.
KUMAR S., TAMURA K., NEI M., 2004: MEGA 3: Integrated software for Molecular Evolutionary Genetics Analysis and Sequence Alignment. Briefings in Bioinformatics 5: 150–163.
LEWIN H.A., RUSSEL G.C., GLASS E.J., 1999: Comparative organization and function of the major histocompatibility complex of domes-ticated cattle. Immunological Reviews, 167: 145–158.
ŁOPIEŃSKA M., NOWAK Z., CHARON K.M., OLECH W., 2003: Estimation of polymorphism In chosen region of MHC In two genetic lines of European bison (Bison bonasus L.). Applied Science Reports, Cattle Production and Breed-ing, Polish Society of Animal Production, 68 (1): 17–24.
McSHANE R.D., GALLAGER Jr. D.S., NEWKIRK H., TAYLOR J.F., BURZLAFF J.D., DAVIS S.K., SKOW L.C., 2001: Physi-cal localization and order of genes in the class I region of the bovine MHC. Animal Genetics, 32: 235–239.
NOWAK Z., OLECH W., 2008: Zmieność mik-rosatelitarna w obrębie chromosomów płci u żubrów. European Bison Conservation Newsletter Vol. 1, 72–78.
OLECH W., 1987: Analysis of inbreeding in Eu-ropean bison. Acta Theriologica 32: 373–387.
OLECH W., 2003: The influence of individual and maternal inbreeding on calf survival in the European bison (Wpływ inbredu osobniczego i inbredu matki na przeżywalność cieląt żubra (Bison bonasus)). Treatises and monographs, Warsaw University of Life Sciences, pp. 78.
OLECH W., 2009: The changes of founders’ number and their contribution to the Euro-pean bison population during 80 years of spe-cies’ restitution European Bison Conservation Newsletter Vol. 2, 54–60.
RADWAN J., KAWAŁKO A., WÓJCIK M., BA-BIK W., 2007: MHC-DRB3 variation in a free-

A comparison of polymorphism of DQA genes in European bison... 101
living population of the European bison, Bison bonasus. Molecular Ecology 16: 531–540.
RUSSEL G.C., 2000: Sequence duplication at the 3’ end of BoLA-DQB genes suggests mul-tiple allelic lineages. Immunogenetics, 52: 101–106.
SAMBROOK J., FRITSCH E.F., MANIATIS T., 1989: Molecular cloning: a laboratory manu-al. Second edition. Cold Spring Harbor Labo-ratory Press, Cold Spring Harbor, New York, USA.
SCOTT P.C., GOGOLIN-EWENS K.J., ADAMS T.E., BRANDON M.R., 1991: Nucleotide se-quence, polymorphism, and evolution of ovine MHC class II DQA genes. Immunogenetics, 34 (2): 67–79.
SHARIF S., MALLARD B.A., WILKIE B.N, SARGEANT J.M., SCOTT H.M., DEKKERS J.C.M., LESLIE K.E., 1998: Associations of the bovine major histocompatibility complex DRB3 (BoLA-DRB3) alleles with occurrence of disease and milk somatic cell score in Ca-nadian dairy cattle. Animal Genetics, 29: 185––193.
SIPKO T.P., RAUTIAN G.S., UDINA I.G., UKAHANOV S.V., BERENDIAEVA Z.I., 1995: Изучение полиморфизма групп крови у зубров (Bison bonasus). Genetica 31 (1): 93–100.
SLATIS H.M., 1960: An analysis of inbreeding in the European bison. Genetics, 45: 275–287.
SNIBSON K.J., MADDOX J.F., FABB S.A., BRANDON M.R., 1998: Allelic variation of ovine MHC class II DQA1 and DQA 2 genes. Animal Genetics, 29: 356–362.
TAKESHIMA S-N., AIDA Y., 2006: Structure, function and disease susceptibility of the bo-vine major histocompatibility complex. Ani-mal Science Journal, 77: 138–150.
TIEDEMANN R., NADLINGER K., PUCEK Z., 1998: Mitochondrial DNA-RFLP analysis re-veals low levels of genetic variation in Euro-pean bison (Bison bonasus). Acta Theriologica, Suppl. 5: 83–87.
TRAUL D.L., BHUSHAN B., ELDRIDGE J.A., CRAWFORD T.B., Li H., DAVIES CHJ., 2005: Characterization of Bison bison major histocompatibility complex class IIa haplo-types. Immunogenetics, 57: 845–854.
UDINA I.G., SOKOLOVA S.S., SIPKO T.P., SULIMOVA G.E., 1994a: Сравнительная характеристика полиморфизма ДНК локусов DQB и DRB главного комплекса гистосовместимости у представителей семейства BOVIDAE. Genetica, 30 (3): 356––360.
UDINA I.G., SIPKO T.P., RAUTIAN G.S., BADAGUEVA Y.N., SULIMOVA G.E., 1994b: The study of DNA-polymorphism of European bison by PCR-analysis of kappa-casein gene and loci DQB and DRB of the major histocom-patibility complex. 5th WCGALP/FAO Sympo-sium: 145–150.
UDINA I.G., SHAIKHAEV O., 1998: Restric-tion fragment length polymorphism (RFLP) of exon 2 of Mhc-DRB3 gene in European bi-son Bison bonasus. Acta Theriologica, Suppl. 5: 75–82.
WALSH P.S., METZGER D.A., HIGUCHI R., 1991: Chelex 100 as a Medium for Simple Extraction of DNA for PCR-Based Typing from Forensic Material. BioTechiques, 10 (4): 506–513.
ZHOU H., HICKFORD J.G.H., 2004: Allelic polymorphism in the ovine DQA1 gene. Jour-nal of Animal Science, 82: 8–16.
http://www.projects.roslin.ac.uk/bolahttp://www.genomics.liv.ac.ukhttp://www.ncbi.nlm.nih.gov/http://www.ncbi.nlm.nih.gov/BLAST/http://cc.oulu.fi/~jaspi/popgen/popdown.htm
Streszczenie: Porównanie polimorfizmu genów DQA u żubrów należących do dwóch linii ge-netycznych: Białowieskiej i Białowiesko-kauka-skiej. Obecnie żyjąca populacja żubrów została podzielona na dwie linie genetyczne: białowie-ską (LB) i białowiesko-kaukaską (LC). W celu porównania zmienności genetycznej u żubrów należących do dwóch linii genetycznych ba-dano polimorfizm genów DQA należących do głównego kompleksu zgodności tkankowej (MHC). Geny MHC cechuje wysoki polimor-fizm i w związku z tym mogą być one wykorzy-stywane do szacowania zmienności genetycznej różnych gatunków, w tym zagrożonych wygi-nięciem. Analiza polimorfizmu eksonu 2 genów DQA1 i DQA2 objęła 200 żubrów należących

102 M. Łopieńska et al.
do linii białowieskiej i 56 z białowiesko-kau-kaskiej. Analiza SSCP ujawniła występowanie dwóch alleli i dwóch genotypów eksonu 2 genu DQA1 oraz trzech alleli i czterech genotypów ekso nu 2 genu DQA2. Frekwencje genotypów eksonu 2 genu DQA2 różniły się istotnie (test chi-kwadrat p ≤ 0,05) pomiędzy dwoma liniami genetycznymi żubrów. Zaobserwowano wystę-powanie czterech haplotypów DQA – DQA1, DQA2, DQA1/DQA2 i DQA1/DQA2_2. Haplo-typ DQA1 był obecny jednie u osobników z LC a DQA1/DQA2_2 tylko u żubrów z LB. Analiza częstości występowania zidentyfikowanych ha-
plotypów w dwóch liniach genetycznych żubrów wykazała wysoko istotne statystyczne różnice (test chi-kwadrat p ≤ 0,01).
MS. received November 2011
Authors’ address:Katedra Genetyki i Ogólnej Hodowli Zwierząt – SGGWul. Ciszewskiego 802-786 WarszawaPoland

Annals of Warsaw University of Life Sciences – SGGWAnimal Science No 49, 2011: 103–108(Ann. Warsaw Univ. of Life Sc. – SGGW, Anim. Sci. 49, 2011)
Section analysis of after born mason bee (Osmia rufa L.) material
BEATA MADRAS-MAJEWSKA, BARBARA ZAJDEL, MAGDALENA GRYGOBee Division, Warsaw University of Life Sciences – SGGW
Abstract: Section analysis of after born mason bee (Osmia rufa L.) material. Experiment was performed at Apiculture Division, Warsaw Uni-versity of Life Sciences – SGGW in 2005/2006 season. The aim of this study was to analyze the quality of mason bee pupae (Osmia rufa L.) ori-ginating from annual and biennial slots. Obtained cocoons were classifi ed. Cocoons were divided into groups of healthy cocoons, empty cocoons, broken and infected. It was also examined and identifi ed the presence of parasites praying on the mason bee cocoons. Research shows that in two-year old slots is more than 10 times less healthy cocoons and three times more damaged cocoons in comparison to the annual sockets. Species di-versity of parasites in the biennial nests is wider than in the annuals. In annual material it was fo-und only one parasite belonging to the species Cacoxenus indagator whereas biennial material contained species: Cacoxenus indagator, Girau-diella inclusa, Trichodes apiarius and Sapyga qu-iquepunctata. Research shows that the mason bee slots should be used once. Repeated use of slots increases the degree of infestation with parasites which reduces reproductive performance.
Key words: cocoons, mason bees, Osmia rufa L., nest parasites.
INTRODUCTION
Mason bee (Osmia rufa L.) belongs to the wild bees, which are increasingly used for pollination of plants in agriculture and horticulture. This bee is widespread
throughout the country. It visit more than 150 plant species (Teper, 2004). In the course of the evolution this insect has developed many of the characteristics that determine their adaptation to life under certain environmental conditions. A very important feature is the ability of that bees living under various climatic conditions, mode of reproduction, the use of different types of food base and a strategy of defense against parasites. An important factor limiting the number of mason bees is parasitism. (Wójtowski, 1971; Wójtowski and Wilkaniec, 1969; Bohart, 1955; Linsley, 1958; Medler, 1958; Stephen, 1958; 1962). The largest group of animals which parasites on mason bees are insects (Wójtowski and Szymaś, 1973). They inhabit a socket trap prepared for breeding bees. They destroy nests and cocoons. Associ-ated parasites are most often common in places with high concentration of bee populations. Every year due to excessive density of bees increases the number of parasitic insects. Improper handling and lack of knowledge can cause inva-sive diseases emergence (eg caused by mites), parasitic species associated to mason bees were grouped into different categories: kleptoparasits, parasitoids, nest destroyers, predators, kleptobionts
104 B. Madras-Majewska, B. Zajdel, M. Grygo
and incidental nest residents (Krunič et al., 2005).
In breeding spreading of mason bee diseases is possible in several ways:
by the contact of bees with flow-ers, where previously were infected insects,
by using apiary equipment and tools not being disinfected,
by reuse the old nests (the stems of plants or not sterilized artificial pack-ets) (Flaga, 2002).Krunič et al. (1995) and Stanisavljevič
(1996) found that the most frequently occurring and highly restrictive limiting population of mason bee is Hymenoptera Cacoxenus indagator Loew. and mite Chaetodactylus osmiae Dufour.
The disease caused by mites Cha-etodactylus osmiae affects both adult bees and brood (Flaga, 2002). Infection occurs most often while bees sit on the flowers. Females carry pollen with mites from the flowers to nest cells. Young females infected by mites have reduced reproductive ability. In Pisa area (Italy), a major parasite of mason bee is Anthrax anthrax Schrank. (Felicili, 2000).
To limit the number of parasites tin boxes used in the following years as slots place should be treated with a high temperature and 0.07% of endosulfanol solution. However the cane tubes should be burnt (Krunič et al., 2001).
MATERIALS AND METHODS
The work was performed at Apiculture Division of Warsaw University of Life Science – SGGW in 2005 and 2006. Research material were mason bee co-coons gained from annual and biennial trap slots. Observations were conducted
in perennial field of SGGW. In this place at the end of March 2005 was issued the slot material – annual traps (1028 cane tubes), biennial traps (1102 cane tubes) and 1400 cocoons of mason bee. This material was placed in two boxes hung at a height of two meters on the south wall of the outbuilding. Bees have been kept in this place from spring to early autumn. In the winter boxes with bees were moved to cool place (1–4°C). In the first week of April 2006 selection of co-coons was carried out. Reed socket were opened using a scalpel and then cocoons were removed from inside. Cocoons were segregated.
They were divided into 4 groups: full-shaped (ie, healthy), empty, damaged, infected.During the selection the following
parameters were evaluated:1. Appearance of the cocoon:
– Correct,– Damaged, strucked with parasites,– Damaged from other unidentified
causes.2. Developmental stages (divided into
pupae);3. The presence of parasites (larvae,
pupae, imago):– Large – Diptera (Cacoxenus inda-
gator Loew.; Giraudiella inclusa Frauenfeld.); Coleoptera (Trichodes apiarius L.),
– Small – Hymenoptera (Sapyga sp.).
During each assessment it was deter-mined the number and percentage of healthy and infected cocoons, and the percentage of cocoons infested with par-asites. In the evaluation there were also
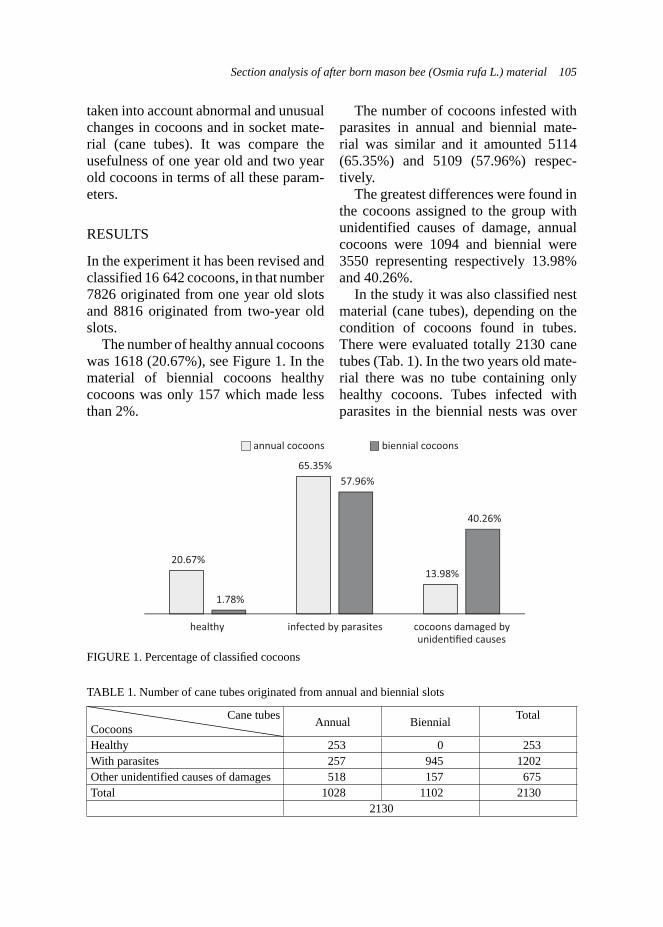
Section analysis of after born mason bee (Osmia rufa L.) material 105
taken into account abnormal and unusual changes in cocoons and in socket mate-rial (cane tubes). It was compare the usefulness of one year old and two year old cocoons in terms of all these param-eters.
RESULTS
In the experiment it has been revised and classified 16 642 cocoons, in that number 7826 originated from one year old slots and 8816 originated from two-year old slots.
The number of healthy annual cocoons was 1618 (20.67%), see Figure 1. In the material of biennial cocoons healthy cocoons was only 157 which made less than 2%.
The number of cocoons infested with parasites in annual and biennial mate-rial was similar and it amounted 5114 (65.35%) and 5109 (57.96%) respec-tively.
The greatest differences were found in the cocoons assigned to the group with unidentified causes of damage, annual cocoons were 1094 and biennial were 3550 representing respectively 13.98% and 40.26%.
In the study it was also classified nest material (cane tubes), depending on the condition of cocoons found in tubes. There were evaluated totally 2130 cane tubes (Tab. 1). In the two years old mate-rial there was no tube containing only healthy cocoons. Tubes infected with parasites in the biennial nests was over
FIGURE 1. Percentage of classifi ed cocoons
TABLE 1. Number of cane tubes originated from annual and biennial slots
Cane tubesCocoons Annual Biennial Total
Healthy 253 0 253With parasites 257 945 1202Other unidentified causes of damages 518 157 675Total 1028 1102 2130
2130
20.67%
65.35%
13.98%
1.78%
57.96%
40.26%
healthy infected by parasites cocoons damaged by uniden�fied causes
annual cocoons biennial cocoons

106 B. Madras-Majewska, B. Zajdel, M. Grygo
three times more than in the one-year slots. In biennial nest material was sig-nificantly less cocoons with damages of unidentified cause in comparison to the one year old slots. There were respec-tively 158 and 518 cocoons.
The parasite contamination level of the annual cocoons was similar to the contamination level of biennial parasite cocoons. The main and the only parasite that was present in the cocoons from annual nests was Cacoxenus indaga-tor (100%). In biennial material was found presence of four types of parasites Cacoxenus indagator (52.2%), Giraud-iella inclusa (10.03%), Trichodes apia-rus (28.67%) and Sapyga quiquepunc-tata Fabricius (8.83%) (Fig. 2).
DISCUSION
In recent years, due to the low profit-ability of beekeeping and the continuing phenomenon of bees dying decreased number of honey bee colonies. Therefore, the solitary bees are increasingly used to pollinate crops, garden and trees in orchards. Mason bees breeding, among
other, affects the quality and yield of onion (Wilkaniec et al., 2004; Wilkaniec et al., 2005; Biliński and Teper, 2004) and alfalfa (Wilkaniec et al., 2004). These authors found in their study that on the effectiveness of bee pollination the female mass of mason bees has a positive effect. The presence of nest parasites not only limits the number of bees that can emergence from cocoons, but also negatively impacts their indi-vidual development.
This study confirms the presence of one of the most common parasites found in socket material of mason bee which is Cacoxenus indagator. His presence also found Krunič et al. (1995) and Stanisavljević (1996) in their studies. The use of biennial nesting material did not affect the growth of the parasite inva-sion. The level of contamination with Cacoxenus indagator of the annual and biennial material was at similar level. In the socket material used twice in the second year there were appeared three other species of parasites: Giraudiella inclusa, Trichodes apiarus L. and Sapyga quiquepunctata. Their presence affected
0%
20%
40%
60%
80%
100%
120%
Cacoxenus indagator
Giraudiella inclusa
Trichodes apiarus Sapyga quiquepunctata
annual cocoons
biennial cocoons
FIGURE 2. Percentage distribution of identifi ed parasites in annual and biennial material

Section analysis of after born mason bee (Osmia rufa L.) material 107
very negatively for rearing mason bees. The number of healthy cocoons fell from 20% to less than 2% in such a situation it can be expected that in subsequent years without replacement of nesting material parasites could completely destroy the cocoons of mason bees. Therefore, one of the most important elements of rear-ing the bees is the use of a annual nesting material. Nest material used once should be destroyed such as burned (Krunič et al., 2001). In this way, we can limit the occurrence of the quantity and number of parasites species.
CONCLUSIONS
1. Healthy cocoons occurred only in the group of annual cocoons.
2. In both groups of cocoons, annual and biennial, were cocoons contaminated by parasites, and damaged by unidenti-fied causes.
3. Sockets cane should be used once. Reuse slots increases the number of nest parasites species, and thereby reduces the number of healthy cocoons.
REFERENCES
BILIŃSKI M., TEPER D., 2004: Chów i wyko-rzystanie murarki ogrodowej (Osmia rufa L.), (Hymenoptera, Megachilidae) do zapylania sa-dów. J. Apic. Scien. 48 (2): 69–74.
BOHART G.E., 1955: Alkali bee vs. Drainage. Farm and Home Science. Utah. Agr. Exp. Sta. 16: 24, 39–40.
FELICILI A., 2000: Le osmie, In: Api e impol-linazione (Pincauti M., Ed) – Giunta Regionale Toscana, Firence, 159–188.
FLAGA S., 2002: Pszczoła Murarka ogrodowa. Kraków, 9–12; 31–35.
KRUNIČ M., PINZAUTI A., FELICIOLI A., STANISAVLLJEVIČ L.J., 1995: Further ob-servations on Osmia cornuta Latr. And Osmia
rufa L. as alternative fruit pollinators, domes-tications and utilization. – Archives Biological Sciences Belgrade, 47 (1–2): 59–66.
KRUNIČ M., STANISAVLLJEVIČ L.J., BRAJKOVIČ M., TOMNOVIČ Z., RADO-VIČ I., 2001: Ecological studies of Osmia cornuta (Latr.) (Hymenoptera, Megachilidae) populations in Yugoslavia with special atten-tion to their diapause. Acta Horticulturae, 561: 297–301.
KRUNIČ M., FELICIOLI A., PINZAUTI M., Stanisavlljevič L.J., 2005: The accompanying fauna Osmia cornuta and Osmia rufa andeffec-tive measures of protection, bulletin of insec-tology 58 (2): 141–152.
LINSLEY G.E., 1958: The ecologyof Solitary bees. Hilgardia 27 (19): 543–599.
MEDLER J.T., 1958: Parasitism of bees in trap-nests by Leucospis affinis Saz. (Hym. Leucos-pidae). Ent. News 69: 21–24.
STANISAVLJEVIĆ L.J., 1996: The impast of ac-companying fauna of the populations of newly domesticated solitary bees Osmia cornuta (Latr.) and Osmia rufa L. (Hymenoptera, Meg-achilidae). Master Thesis, Faculty of Biology, University of Belgrade, p. 112.
STEPHEN W.P., 1958: Nomia melanderi in Or-egon Ent. Soc. Bull. 15(3): 3.
STEPHEN W.P., 1962: Propagation of the leaf cutter bees for alf alfa seed production. Stat. Bull. Ore. Agric. Exp. Stat. 586: 1–16.
TEPER D., 2004: Dzika pszczoła. Murarka ogro-dowa. Pasieka 3/2004, nr 3 (7): 52–54.
WILKANIEC Z., GIEJDASZ K., FLISZKIEW-IECZ M., 2004: The influence of food Mount consumer during the larval development imago of the red mason bee (Osmia rufa L., Megachi-lidae) J. Apic. Scien. 48 (1): 29–36.
WÓJTOWSKI F., 1971: Bioekologiczne i tech-niczne problemy hodowli praktycznego użyt-kowania pszczół samotnic. Wiad. Ekol. 17 (1): 53–59.
WÓJTOWSKI F., SZYMAŚ B., 1973: Entomo-fauna pasożytnicza i towarzysząca pszczołom samotniczym (Apidea solitariae) w pułapkach gniazdowych. Roczniki AR w Poznaniu, 171.
WÓJTOWSKI F., WILKANIEC Z., 1969: Próby hodowli pszczół miesiarek i murarek (Hym. Apoidea, Megachilidae) w pułapkach gniaz-dowych. Roczniki WSR w Poznaniu, 42: 153––165.

108 B. Madras-Majewska, B. Zajdel, M. Grygo
Streszczenie: Analiza sekcyjna materiału powy-lęgowego pszczoły murarki ogrodowej (Osmia rufa L.). Doświadczenie wykonano w Pracowni Hodowli Owadów Użytkowych SGGW w War-szawie, w sezonie 2005/2006. Celem pracy było dokonanie analizy jakości poczwarek murar-ki ogrodowej (Osmia rufa L.) pochodzących z gniazd jednorocznych i dwuletnich. Uzyskane kokony poddano klasyfikacji. Wyróżniono gru-py kokonów zdrowych, pustych, uszkodzonych i chorych. Zbadano i określono również obec-ność pasożytów na kokonach murarki. Z badań wynika, że w gniazdach dwuletnich jest ponad 10 razy mniej zdrowych kokonów i 3 razy więcej kokonów uszkodzonych, w porównaniu z gniaz-dami jednorocznymi. Zróżnicowanie gatunkowe pasożytów w gniazdach dwuletnich jest większe niż w jednorocznych. W materiale jednorocznym stwierdzono jedynie obecność pasożyta należące-go do gatunku Cacoxenus indagator, natomiast
w materiale dwuletnim stwierdzono obecność czterech gatunków pasożytów: Cacoxenus inda-gator, Gaudiella inclesa, Trichodes apiarius L. i Sapyga quiquepunctata. Fab. Badania dowodzą, że gniazda dla murarki ogrodowej powinny być wykorzystywane jednokrotnie. Wielokrotne wy-korzystywanie gniazd zwiększa stopień zarażenia pasożytami, co wpływa na obniżenie wyników reprodukcyjnych.
MS. received September 2011
Authors’ address:Pracownia Hodowli Owadów Użytkowych – SGGWul. Nowoursynowska 16602-787 WarszawaPolande-mail: [email protected]
Annals of Warsaw University of Life Sciences – SGGWAnimal Science No 49, 2011: 109–113(Ann. Warsaw Univ. of Life Sc. – SGGW, Anim. Sci. 49, 2011)
The survival and the awaking time of the worker beesafter carbon dioxide anesthesia and gas treatment with different oxygen and nitrogen concentration
BEATA MADRAS-MAJEWSKA, ZBIGNIEW KAMIŃSKI, BARBARA ZAJDELBee Division, Warsaw University of Life Sciences – SGGW
Abstract: The survival and the awaking time of the worker bees after carbon dioxide anesthesia and gas treatment with different oxygen and nitrogen concentration. The experiment was performed at the Apiculture Division of Warsaw University of Life Sciences in 2009. The aim of this study was to investigate the bees awaking time and to check the-ir survival rate during their waking up with the ap-plication of gas mixtures of different concentration of oxygen and nitrogen. In the experiment were examined 2000 worker bees (Apis mellifera L.). All bees were subjected anesthesia with carbon dioxide and awaken by air containing various proportions of oxygen and nitrogen. 241 bees were divided into 5 groups. The control group was awaken from ane-sthesia with the carbon dioxide in the atmosphe-ric air. Experimental group were awaken in the air containing 50% of O2 and 50% of N2, 40% of O2 and 60% of N2, 30% of O2 and 70% of N2, 15% of O2 and 85% of N2. There was no repeatability of results between all examined groups in the fi rst ab-dominal movements, individual walking bees and in all the bees awaking. Survival rate of groups of bees awaken in a mixture of 40% oxygen and 60% nitrogen was signifi cantly higher in comparison to other groups. This experience was a prelude to further research on queen bees in order to accele-rate the awakening from carbon dioxide anesthe-sia during insemination, and accelerate lying eggs.
Key words: honey bee, oxygen, nitrogen, carbon dioxide, survival rate.
INTRODUCTION
The first attempts to use carbon dioxide to anesthesia queen bees took Laidlaw in 1944. Jasiński (1998) found that before CO2 began to be used for anesthesia in bees chloroform and ether were com-monly used, substances far more harmful to humans. CO2 anesthesia is used most often during the insemination of queen bees but also to anesthetize worker bees during wedding hives colonization for the better acceptation after queen bee addition (Wilkaniec and Maciejewska, 1995). After applying anesthesia with CO2 during insemination queen bees were worse accepted by bees, as well as queen bees less frequent made flights from the hive and they often wandered (Wilde and Sobiechowski, 1992). Those authors also observed that queens after anesthesia with CO2 begun lying eggs later and often incorrectly. Skowronek (1982) observed the development of the adjacent bodies (corpora allata) in worker bees after anesthesia with CO2. He has found that in young bees (aged 10 days) increased activity of these structures, whereas in older bees, the effect was

110 B. Madras-Majewska, Z. Kamiński, B. Zajdel
the opposite (which was associated with a loss of ability to collect pollen, total or nearly total loss of production of wax). CO2 narcosis also has a negative impact on the life span of bees (Austin, 1955). According to Chuda-Mickiewicz et al. (2002) carbon dioxide has a positive effect on the drones. This gas helps to complete the process of moving sperm from the testicles to the seminal vesicles and thus accelerates the maturation of drones.
According Konopacka (1989) simi-lar effect to the carbon dioxide has a nitrous oxide (N2O). After application of N2O for anesthesia she found that the latency period (time from start of anesthesia to lying eggs by queen bees) and the number of sperm in the seminal reservoirs in queen bees was similar to that when using CO2 narcosis. Accord-ing to Skowronek et al. (1973) use of anesthesia with both: CO2 and N2O causes earlier initiation of lying eggs by the queen bee and increases the attrac-tiveness of queens for the worker bees. The negative effects of worker bees anesthesia in pure nitrogen and NO3 observed Ribbands (1954) and Simp-son (1954). According to the authors use such a anesthetic reduced the flight activity of worker bees.
The aim of the experiment was to investigate the length of time of waking the bees and to check their survival after the application of different concentra-tions of oxygen and nitrogen in their wake. The results of this study provide a basis for future experiments on queen bees in order to accelerate the awaken-ing from anesthesia with carbon dioxide during insemination and accelerate their lying eggs initiation.
MATERIALS AND METHODS
Experiments were conducted in July and August 2009 in the experimental apiary of Apiculture Division at Warsaw Univer-sity of Life Sciences. 2000 worker bees at the age of 1–3 days were examined. In order to obtain the appropriate age of bee workers brood on emergence was insulated in isolators with a metal mesh in four maternal colonies. After this time the young bees were placed in 20 cages – 100 worker bees in each of them. Bees were kept in wooden cages at dimensions: height 17 cm, width 11 cm and depth of 6 cm. Each cage had two vents in the side walls, a closed plate opening through which bees were placed and food in the form of honey-sugar dough was given, and one hole at the bottom of the cage, which way the dead bees were removed. Front of the cage was glass, which enabled obser-vation. On the cage drinker in the form of a syringe was placed. Inside the cage was a piece of honeycomb and utensil with honey-sugar dough. Tin such prepared cages bees were subjected to 3 minute of carbon dioxide anesthesia, and then wake up for 1 minute at various concentrations of oxygen and nitrogen (atmospheric air, 50% O2 and 50% N2, 40% O2 and 60% N2, 30% O2 and 70% N2, 15% O2 and 85% N2). Then the bees were observed and the time of successive stages of their recovery was recorded. After anesthesia bees were kept in cages at room temperature. Daily reported number of dead bees. Observa-tion ended on the last dead bee in cage.
RESULTS AND DISCUSSION
Worker bees in the experiment were divided into five groups:

The survival and the awaking time of the worker bees after carbon dioxide anesthesia... 111
a) control group (awaken in the air);b) 50% O2 i 50% N2;c) 40% O2 i 60% N2;d) 30% O2 i 70% N2;e) 15% O2 i 85% N2.Four rounds (four repetitions for each of these groups) was done. The research based on the observation of two factors:1. Recovery time for bees euthanized
with carbon dioxide, which was mea-sured in three stages. Time was mea-sured from the moment of completion of treatment appropriate for the group – a mixture of oxygen and nitrogen to:– first reflexes of abdomen,– first steps of individual bees,– the wake of all the bees.
2. The survival of worker beesIn the first movements of the abdo-
men there was no repeatability of results. In each of the four rounds of the study
the first abdomen movements duration significantly differed within groups. Results averaging would not be a good reflection of the influence of test condi-tions (groups) on the time of recovery. In terms of single individuals walking time and all the bees awaking results were not repeatable. Some bees were observed moving in the time interval 4–12 minu-tes in the individual rounds. However, all the bees awake time interval was observed in 8–18 min. It can therefore conclude that the results are not affected by external conditions occurred during each round (Fig. 1).
The highest average survival rate was observed in the group anesthe-tize with gas mixture in a ratio of 40% oxygen and 60% of nitrogen and it was almost 18 days. In the next two groups awa king in a mixture of 30% oxygen and 70% nitrogen and 15% oxygen and
FIGURE 1. Recovery time of the bees in a mixture of different concentrations of oxygen and nitrogen
0
2
4
6
8
10
12
14
16
18
20
I II III IV I II III IV I II III IV I II III IV I II III IV
control 50%:50% 40%:60% 30%:70% 15%:85%
group
first reflexesof abdomen
first stepsof individual bees
bees awaken(all the bees are walking)
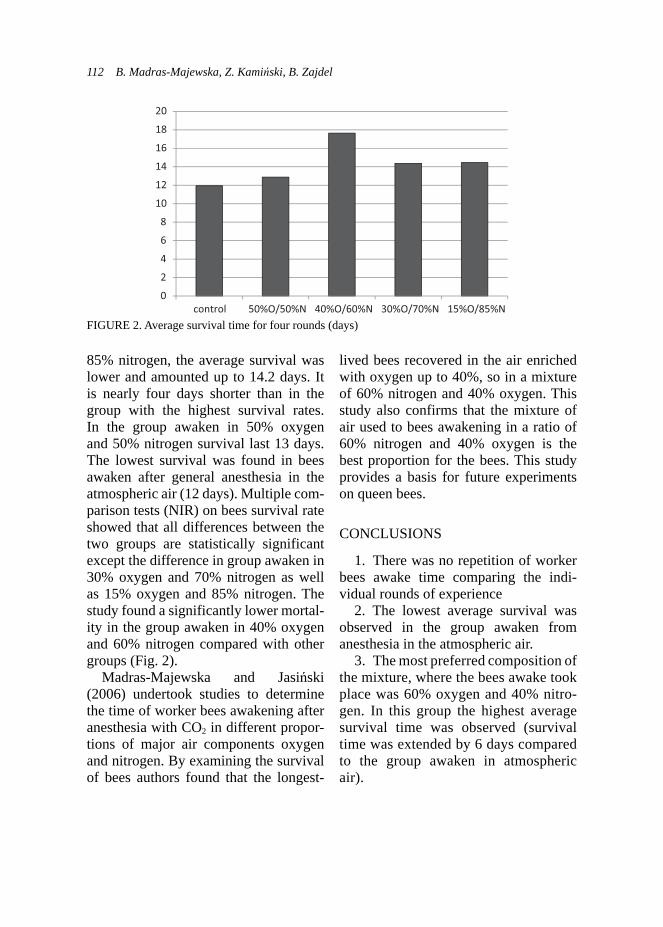
112 B. Madras-Majewska, Z. Kamiński, B. Zajdel
85% nitrogen, the average survival was lower and amounted up to 14.2 days. It is nearly four days shorter than in the group with the highest survival rates. In the group awaken in 50% oxygen and 50% nitrogen survival last 13 days. The lowest survival was found in bees awaken after general anesthesia in the atmospheric air (12 days). Multiple com-parison tests (NIR) on bees survival rate showed that all differences between the two groups are statistically significant except the difference in group awaken in 30% oxygen and 70% nitrogen as well as 15% oxygen and 85% nitrogen. The study found a significantly lower mortal-ity in the group awaken in 40% oxygen and 60% nitrogen compared with other groups (Fig. 2).
Madras-Majewska and Jasiński (2006) undertook studies to determine the time of worker bees awakening after anesthesia with CO2 in different propor-tions of major air components oxygen and nitrogen. By examining the survival of bees authors found that the longest-
lived bees recovered in the air enriched with oxygen up to 40%, so in a mixture of 60% nitrogen and 40% oxygen. This study also confirms that the mixture of air used to bees awakening in a ratio of 60% nitrogen and 40% oxygen is the best proportion for the bees. This study provides a basis for future experiments on queen bees.
CONCLUSIONS
1. There was no repetition of worker bees awake time comparing the indi-vidual rounds of experience
2. The lowest average survival was observed in the group awaken from anesthesia in the atmospheric air.
3. The most preferred composition of the mixture, where the bees awake took place was 60% oxygen and 40% nitro-gen. In this group the highest average survival time was observed (survival time was extended by 6 days compared to the group awaken in atmospheric air).
FIGURE 2. Average survival time for four rounds (days)
0
2
4
6
8
10
12
14
16
18
20
control 50%O/50%N 40%O/60%N 30%O/70%N 15%O/85%N

The survival and the awaking time of the worker bees after carbon dioxide anesthesia... 113
REFERENCESAUSTIN G.H., 1955: Effect of carbon dioxide
anesthesia on bee behavior and expectation on life. Bee World. 36: 45–47.
CHUDA-MICKIEWICZ B., PRABUCKI J., SAMBORSKI J., PERUŻYŃSKI G., 2002: Wpływ dwutlenku węgla na dojrzewanie i war-tość rozrodczą trutni. Pszczel. Zesz. Nauk. 34: 16.
JASIŃSKI Z., 1998: Naturalny i kontrolowany dobór u pszczół. Pszczelnictwo. Praca zbioro-wa. Wyd. Promocyjne „Albatros” Szczecin.
KONOPACKA Z., 1989: Czynniki wpływają-ce na wyniki sztucznego unasieniania matek pszczelich i ich jakość. Rozprawa habilitacyj-na. Puławy.
LAIDLAW H.H., 1944: Artificial insemination of the queen bee Apis mellifera L. Morpho-logical basis and results. J. Morph. 74, 3: 429–465.
MADRAS-MAJEWSKA B., JASIŃSKI Z., 2006: Badanie wpływu różnych stężeń głównych składników powietrza tlenu i azotu na wybu-dzanie pszczół robotnic. Nauk. Konf. Pszczel. Puławy.
RIBBANDS C.R., 1954: Nitrous oxide anesthesia does not encourage re-orientation of honey-bees. Bee World. 35, 5: 91–95.
SKOWRONEK W., JAYCOX E.R., GYUNN G., 1973: Wpływ usypiania matek pszczelich na ich atrakcyjność dla pszczół robotnic. Pszczel. Zesz. Nauk. 17: 11–15.
SKOWRONEK W., 1982: Wpływ dwutlenku wę-gla na pszczoły. Prace Instytutu Sadownictwa i Kwiaciarstwa. Seria D, nr 13. Monografie i Rozprawy. Puławy.
SIMPSON J., 1954: Effects some anesthetics on honeybees: nitrous oxide, carbon dioxide, am-monium nitrate smoker Fusem. Bee World 35, 8: 149–155.
Statistical Product and Service Solution base ver-sion 17.0 for Windows. SPSS inc. USA 2009
WILDE J., SOBIECHOWSKI K., 1992: Wpływ traktowania dwutlenkiem węgla na behawio-ryzm unasieniania matek pszczelich. XXIX Nauk. Konf. Puławy. s. 44–45.
WILKANIEC Z., MACIEJEWSKA M., 1995: – Przeżywalność robotnic pszczoły miodnej (Apis mellifera L.) usypianych różnymi spo-sobami w badaniach laboratoryjnych. Pszczel. Zesz. Nauk. 1: 7–10.
Streszczenie: Przeżywalność i czas wybudzania pszczół robotnic po anastezji dwutlenkiem węgla i traktowanych mieszaniną gazową o różnych stężeniach tlenu i azotu. Doświadczenie zostało wykonane w Pracowni Hodowli Owadów Użyt-kowych SGGW w 2009 roku. Celem pracy było zbadanie czasu wybudzania się pszczół oraz sprawdzenie ich przeżywalności po zastosowaniu różnych mieszanin gazów tlenu i azotu do ich wy-budzania. W doświadczeniu zbadano 2000 pszczół robotnic (Apis mellifera L.). Wszystkie pszczoły poddane narkozie z dwutlenku węgla były wybu-dzane w powietrzu zawierającym różne proporcje tlenu i azotu. Stworzono 5 grup. Grupa kontrolna wybudzana była z narkozy dwutlenku węgla w po-wietrzu atmosferycznym. Grupy doświadczalne wybudzane były w powietrzu zawierającym 50% O2 i 50% N2, 40% O2 i 60% N2, 30% O2 i 70% N2, 15% O2 i 85% N2. Nie stwierdzono powtarzal-ności wyników pomiędzy wszystkim badanymi grupami w zakresie pierwszych ruchów odwło-kowych, pojedynczych chodzących osobników oraz wybudzenia się wszystkich pszczół. Przeży-walność grupy pszczół wybudzanej w mieszani-nie 40% tlenu i 60% azotu była istotnie wyższa w porównaniu z pozostałymi grupami. Niniejsze doświadczenie było wstępem do dalszych badań, prowadzonych na matkach, w celu przyspieszenia wybudzania z narkozy dwutlenku węgla w czasie inseminacji oraz przyspieszenia ich czerwienia.
MS. received September 2011
Authors’ address:Pracownia Hodowli Owadów Użytkowych – SGGWul. Nowoursynowska 16602-787 WarszawaPolande-mail: [email protected]

Annals of Warsaw University of Life Sciences – SGGWAnimal Science No 49, 2011: 115–119(Ann. Warsaw Univ. of Life Sc. – SGGW, Anim. Sci. 49, 2011)
The influence of nests usage on mason bee (Osmia rufa L.)survival
BEATA MADRAS-MAJEWSKA, BARBARA ZAJDEL,ALEKSANDRA BOCZKOWSKABee Division, Warsaw University of Life Sciences – SGGW
Abstract: The infl uence of nests usage on mason bee (Osmia rufa L.) survival. The research was performed at Apiculture Division of Warsaw Uni-versity of Life Sciences – SGGW in 2004–2006. Main observations were carried in February and in March 2006. The aim of this study was to pre-sent the differences in mason bee (Osmia rufa L.) survival resulting from the nests usage. After opening all the tubes it was found that in annual nest quite healthy cocoons was 1618 (21%) and the loss of 6208 (79%). In the biennial nest pro-fi t was only 157 cocoons (2.5%) and the loss of up to 6075 cocoons (97.5%). Taking into account the number of healthy cocoons (profi t) as well as representing a loss in both types of nests it can be noted that in the annual nest it could received more than 15 cocoons from the female. However, in the biennial nest, which can be expected more numerous population, it was achieved in one year only 11 cocoons from the female.
Key words: mason bees, Osmia rufa L., cocoons, nests.
INTRODUCTION
Mason bee has a high rate of reproduction and a wide food preferences. Tendency to artificial nests occupation, short period of adult forms emergence from cocoons, the ability to create clusters and colonies, as well as low workload are one of the ad-
vantages which does mason bee attractive as for a breeding species (Flaga, 2002).
Mason bee has developed several forms of protection of its species. One of them is a linear type of nest-building and appropriate gender distribution in each cell of cane tube. Fertilized eggs from which females are hatched, are placed in the further parts of the nest, and in cells located more outside are deposited unfer-tilized eggs. Males are more exposed to insect-eating birds or martens. Females inside the nests have bigger chances of survival (Flaga, 2002).
Another way of passive protection is to build by mason bees empty first cell in the nest tube. This is typical behavior of bees of the Osmia genus. Many Aculeata species build empty cells in a variable position and number (Krombein, 1967; Linsley, 1958; Stephen, 1969). Tactic of leaving the first cell empty or even the entire tube is designed to mislead the parasites, because the plug of larval cells does not differ from the closing caps of the blank cells (or the whole tube). An empty cell is present in more than 80% of nest traps (Balfour-Browne, 1925; Bayer-Helms, 1933; Brechtel, 1986, Jacob-Remacle, 1976).
116 B. Madras-Majewska, B. Zajdel, A. Boczkowska
In terms of nesting material selection mason bees are very plastic. They can inhabit the holes from knots in a tree, hollow brick slots, holes in the bricks, space between the planks and in the straw covering the roofs. Wilkaniec and Giejdasz (2001) found that mason bee can also nest in the paper tubes, plastic straws for drinking and in shrinkable insulating covers. According to their study, only the tube of cane were settled at 100%.
The most important task of rearing mason bee is to get as many popula-tions for pollination of crops as possible (Wilkaniec et al., 2004). Suitable nesting material selection can affect the repro-ductive performance of these insects.
MATERIALS AND METHODS
The study was performed at the Apicul-ture Division of Warsaw University of Life Science – SGGW. The experience lasted from March 2004 till April 2006. Research material was mason bee co-coons risen in annual and biennial cane nest traps. In March 2004, 1200 cocoons of mason bee were brought from the In-stitute of Arboriculture and Floriculture in Puławy, which after hatching colo-nized previously prepared cane nest tube. These tubes were used for two seasons (from spring to autumn 2004 and from spring to autumn 2005) without the se-lection of cocoons and cane tubes. Nests were built of closely bind the common cane stalks, tied in bundles and loaded in the plastic cover. An average package consisted of 60–80 tubes of 18–20 cm in length and diameter of 6–8 mm. In 2004 it was prepared nest made of 1028 tubes and in 2005 made of 1102 cane tubes. So
constructed nests was placed in special boxes. These boxes have been suspended at the height of 2 m on the outer wall of the building and an additional safety net covered them as the protection from birds. In the spring of 2005 from ISiK (IAF) in Puławy brought another 1200 cocoons, and bees after emergence colo-nized prepared for them new common reed stalks used that time only one season (from spring 2005 to autumn 2005). All the research material of two experimental years (cocoons used one season and used for two seasons) in October 2005 was transferred to a cool place (1–4°C) for overwintering. In April 2006 selection of cocoons was performed. Cocoons were removed from the tubes using a scalpel and gently cutting the tube along its axis so not to damage the inside of the cocoons. After opening nests cocoons were sorted for profit (healthy cocoons, normal) and loss (mechanically damaged cocoons, dead larvae of bees and tubes that have not been settled). The material was assessed taking into account the fol-lowing parameters for the appearance of cocoons: normal (healthy) and damaged (infected).
RESULTS
After opening all the tubes it was found that in annual nest quite healthy cocoons was 1618 (21%) and the loss of 6208 (79%). In the biennial nest profit was only 157 cocoons (2.5%) and the loss of up to 6075 cocoons (97.5%) (Tab. 1). The loss consisted of empty cells, infected, moldy and mechanically damaged cocoons and also dead larvae of mason bee.
In the one-year old material, where the amount of all losses of cocoons was
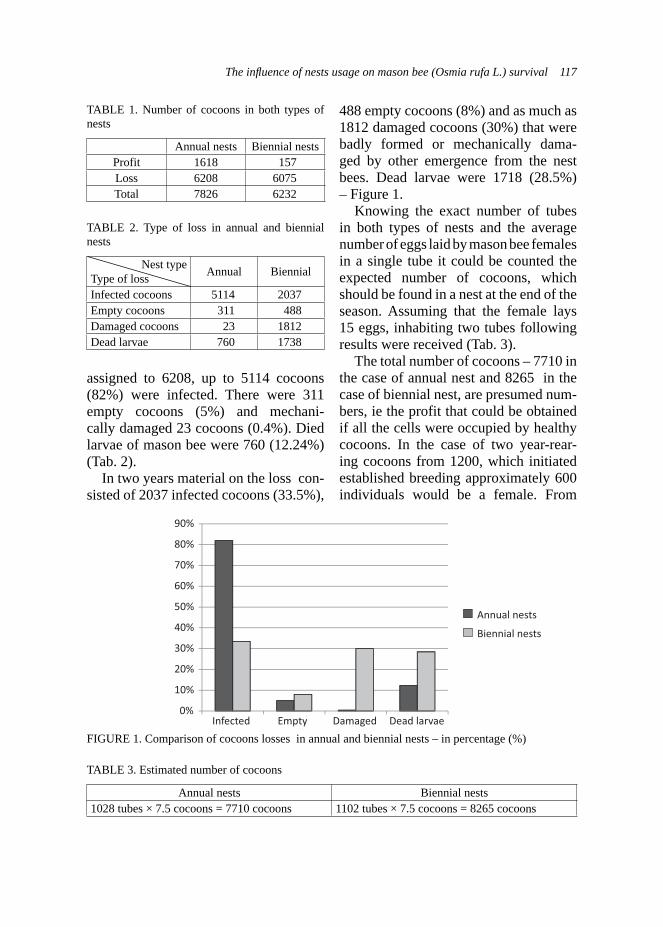
The infl uence of nests usage on mason bee (Osmia rufa L.) survival 117
assigned to 6208, up to 5114 cocoons (82%) were infected. There were 311 empty cocoons (5%) and mechani-cally damaged 23 cocoons (0.4%). Died larvae of mason bee were 760 (12.24%) (Tab. 2).
In two years material on the loss con-sisted of 2037 infected cocoons (33.5%),
TABLE 1. Number of cocoons in both types of nests
Annual nests Biennial nestsProfit 1618 157 Loss 6208 6075 Total 7826 6232
TABLE 2. Type of loss in annual and biennial nests
Nest typeType of loss Annual Biennial
Infected cocoons 5114 2037Empty cocoons 311 488Damaged cocoons 23 1812Dead larvae 760 1738
488 empty cocoons (8%) and as much as 1812 damaged cocoons (30%) that were badly formed or mechanically dama-ged by other emergence from the nest bees. Dead larvae were 1718 (28.5%) – Figure 1.
Knowing the exact number of tubes in both types of nests and the average number of eggs laid by mason bee females in a single tube it could be counted the expected number of cocoons, which should be found in a nest at the end of the season. Assuming that the female lays 15 eggs, inhabiting two tubes following results were received (Tab. 3).
The total number of cocoons – 7710 in the case of annual nest and 8265 in the case of biennial nest, are presumed num-bers, ie the profit that could be obtained if all the cells were occupied by healthy cocoons. In the case of two year-rear-ing cocoons from 1200, which initiated established breeding approximately 600 individuals would be a female. From
0%
10%
20%
30%
40%
50%
60%
70%
80%
90%
Infected Empty Damaged Dead larvae
Annual nests
Biennial nests
FIGURE 1. Comparison of cocoons losses in annual and biennial nests – in percentage (%)
TABLE 3. Estimated number of cocoons
Annual nests Biennial nests1028 tubes × 7.5 cocoons = 7710 cocoons 1102 tubes × 7.5 cocoons = 8265 cocoons
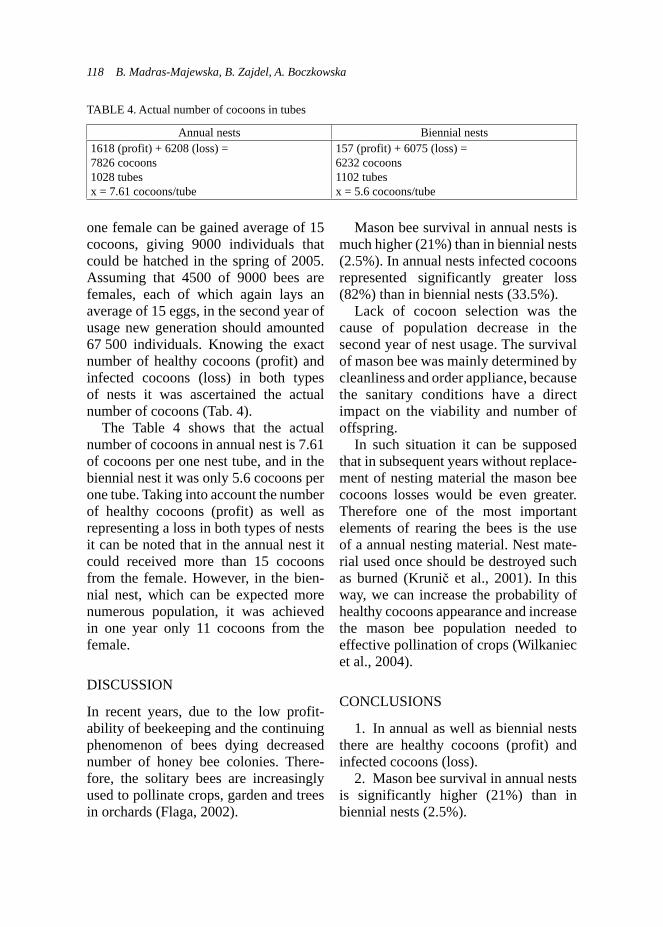
118 B. Madras-Majewska, B. Zajdel, A. Boczkowska
one female can be gained average of 15 cocoons, giving 9000 individuals that could be hatched in the spring of 2005. Assuming that 4500 of 9000 bees are females, each of which again lays an average of 15 eggs, in the second year of usage new generation should amounted 67 500 individuals. Knowing the exact number of healthy cocoons (profit) and infected cocoons (loss) in both types of nests it was ascertained the actual number of cocoons (Tab. 4).
The Table 4 shows that the actual number of cocoons in annual nest is 7.61 of cocoons per one nest tube, and in the biennial nest it was only 5.6 cocoons per one tube. Taking into account the number of healthy cocoons (profit) as well as representing a loss in both types of nests it can be noted that in the annual nest it could received more than 15 cocoons from the female. However, in the bien-nial nest, which can be expected more numerous population, it was achieved in one year only 11 cocoons from the female.
DISCUSSION
In recent years, due to the low profit-ability of beekeeping and the continuing phenomenon of bees dying decreased number of honey bee colonies. There-fore, the solitary bees are increasingly used to pollinate crops, garden and trees in orchards (Flaga, 2002).
Mason bee survival in annual nests is much higher (21%) than in biennial nests (2.5%). In annual nests infected cocoons represented significantly greater loss (82%) than in biennial nests (33.5%).
Lack of cocoon selection was the cause of population decrease in the second year of nest usage. The survival of mason bee was mainly determined by cleanliness and order appliance, because the sanitary conditions have a direct impact on the viability and number of offspring.
In such situation it can be supposed that in subsequent years without replace-ment of nesting material the mason bee cocoons losses would be even greater. Therefore one of the most important elements of rearing the bees is the use of a annual nesting material. Nest mate-rial used once should be destroyed such as burned (Krunič et al., 2001). In this way, we can increase the probability of healthy cocoons appearance and increase the mason bee population needed to effective pollination of crops (Wilkaniec et al., 2004).
CONCLUSIONS
1. In annual as well as biennial nests there are healthy cocoons (profit) and infected cocoons (loss).
2. Mason bee survival in annual nests is significantly higher (21%) than in biennial nests (2.5%).
TABLE 4. Actual number of cocoons in tubes
Annual nests Biennial nests1618 (profit) + 6208 (loss) = 7826 cocoons1028 tubesx = 7.61 cocoons/tube
157 (profit) + 6075 (loss) = 6232 cocoons1102 tubesx = 5.6 cocoons/tube
The infl uence of nests usage on mason bee (Osmia rufa L.) survival 119
3. In annual nests infected cocoons represented significantly greater loss (82%) than in biennial nests (33.5%).
4. Lack of cocoon selection was the cause of population decrease in the second year of nest usage.
5. The survival of mason bee was mainly determined by cleanliness and order appliance, because the sanitary conditions have a direct impact on the viability and number of offspring.
REFERENCES
BALFOUR-BROWNE F., 1925: Concerning the Habitats of Insects, Univ. Press, Cambridge.
BAYER-HELMS F., 1933: Untersuchungen zum Fortpflanzungsverhalten solitär lebender Wildbienen an den Beispilen Osmia rufa Und Megachile versicolor. Diplomarbeit, Göttin-gen.
BRECHTEL F., 1986: Die Stechimmenfauna des Bienienwaldes Und seiner Randbereiche (Süd-fplaz) unter besonder Berücksichtiggung der Ökologie kunstnestbewohnender Arten, Polli-chia, Bad Durkheim.
FLAGA S., 2002: Pszczoła Murarka ogrodowa. Kraków, 9–12; 31–35.
JACOB-REMACLE A., 1976: Une operations ni-choirs artificiels pour Hymenoptéres dans trios jardins de Liége, Bull. Ann. Soc. R. Entomol. Belgique.
KROMBEIN K.V., 1967: Trap-nesting Wasp a and Bees: Life History, Nest and Associates, Smithonian Press, Washington.
KRUNIČ M., STANISAVLLJEVIČ L.J., BRAJ-KOVIČ M., TOMNOVIČ Z., RADOVIČ I., 2001: Ecological studies of Osmia cornuta (Latr.) (Hymenoptera, Megachilidae) popu-lations in Yugoslavia with special attention to their diapause. – Acta Horticulturae, 561: 297–301.
LINSLEY G.E., 1958: The ecologyof Solitary bees. Hilgardia 27 (19): 543–599.
STEPHEN W. P., BOHART G.E., TORCHO P.F., 1969: The Biology and External Morphology
of Bees. Oregon St.Univ. Agric. Exp. Stat., Co-rvallis, Oregon.
WILKANIEC Z., GIEJDASZ K., FLISZKIE-WIECZ M., 2004: The influence of food Mount consumer during the larval development imago of the red mason bee (Osmia rufa L.,Megachi-lidae) J. Apic. Scien. 48 (1): 29–36.
WILKANIEC Z., GIEJDASZ K., 2001: Wpływ średnicy rurek gniazdowych na wielkość oprzędów i płeć pokolenia potomnego pszczo-ły murarki ogrodowej Osmia rufa L. AR. im A. Cieszkowskiego w Poznaniu. 119–120.
Streszczenie: Wpływ sposobu użytkowania gniazd na przeżywalność murarki ogrodowej (Osmia rufa L). Pracę wykonano w Pracowni Hodowli Owadów Użytkowych SGGW w Warszawie w la-tach 2004–2006. Główne obserwacje prowadzo-no w lutym i marcu roku 2006. Celem pracy było przedstawienie różnic w przeżywalności murarki ogrodowej (Osmia rufa L.) wynikającej ze spo-sobu użytkowania gniazd. Po otwarciu wszyst-kich badanych rurek stwierdzono, że w gnieździe jednorocznym kokonów całkiem zdrowych było 1618 sztuk (21%), a strata wynosiła 6208 sztuk (79%). W gnieździe dwuletnim zysk wynosił je-dynie 157 kokonów (2,5%), a strata aż 6075 sztuk (97,5%). Na stratę składały się komórki puste, kokony chore i spleśniałe, uszkodzone mecha-nicznie oraz martwe larwy murarki. Biorąc pod uwagę liczbę kokonów zdrowych (zysk), jak i sta-nowiących stratę w obu typach gniazd, zauważyć można, że w gnieździe jednorocznym można było uzyskać wiecej niż 15 sztuk kokonów od jednej samicy. Natomiast w gnieździe dwuletnim, w któ-rym spodziewać się można liczniejszej populacji, uzyskano zaledwie 11 kokonów od samicy w jed-nym roku.
MS. received September 2011
Authors’ address:Pracownia Hodowli Owadów Użytkowych – SGGWul. Nowoursynowska 16602-787 WarszawaPolande-mail: [email protected]


Annals of Warsaw University of Life Sciences – SGGWAnimal Science No 49, 2011: 121–125(Ann. Warsaw Univ. of Life Sc. – SGGW, Anim. Sci. 49, 2011)
Effect of the initial body weight of Ross 308 chicken broilerson the rate of growth
MONIKA MICHALCZUK, MAŁGORZATA STĘPIŃSKA, MONIKA ŁUKASIEWICZFaculty of Animal Science, Warsaw University of Life Sciences – SGGW
Abstract: Effect of the initial body weight of Ross 308 chicken broilers on the rate of growth. The re-sults of broilers’ rearing are greatly dependent on the quality of chicks which is affected by age and health state of reproduction stock, weight of hat-ching egg and body weight of the hatched chicks. The aim of the conducted experiment was to com-pare the effect of body weight of the chicks on their first day of life on the growth rate of chickens and their body weight on 42 day of rearing. The studies were conducted on 728 Ross 308 chicks. The birds were kept on a litter, in compartment, being at random divided into 8 cubicles. One-day chicks were marked with chick marks. The birds were individually weighed each week, i.e. on 1, 8, 15, 22, 29, 36 and 42 day of life. For statistical calculations, the collected data were divided into three groups, 91 pcs in each group. Body weight of one-day chick was taken as criterion: group 1 – lower than, or equal to 39 g; group 2 – within interval of 40–42 g; group 3 – higher than 42 g.On the ground of the conducted studies it may be concluded that Ross 308 chicken broilers with body weight higher than 40 g should be selected for rearing because smaller chicks, in spite of the highest growth rate, reach lower body weight on 42 day of life as compared to heavier chickens.
Key words: Ross 308 broilers, body weight, growth rate.
INTRODUCTION
The results of broilers’ rearing are great-ly dependent on the quality of chicks
which is affected by age and health state of reproduction stock, weight of hatch-ing egg and body weight of the hatched chicks (Meijerhof, 2005; Mendes et al., 2007; Wolanski et al., 2007). Visual score, Tona or Pascar score and day-old chick weight are commonly used for measuring chick quality (Tona et al., 2003; Tona et al., 2005; Meijerhof 2006). Chick weight is the most widely used indicator for day-old chick quality assessment (Decuypere et al., 2002). The length of the chicken is also related with the size of the egg, as is body weight, but to a lesser extent. The total length increases about 5% (from 19 to 20 cm) for breeders from 25 to 60 weeks of age. Length at 18 days can also be used as an indicator for the efficiency of an in-ovo injection process, as it is correlated with the place where the vaccine is adminis-trated (allantios, amnion, breast muscle or neck) (Meijerhof, 2005). However, recent research (Joseph et al., 2006) has shown that differences for hatch weight among treatments are largely explained by variations in residual yolk mass. Ob-jective definition of chick quality needs probably a combination of several fac-tors such as day old chick weight, chick
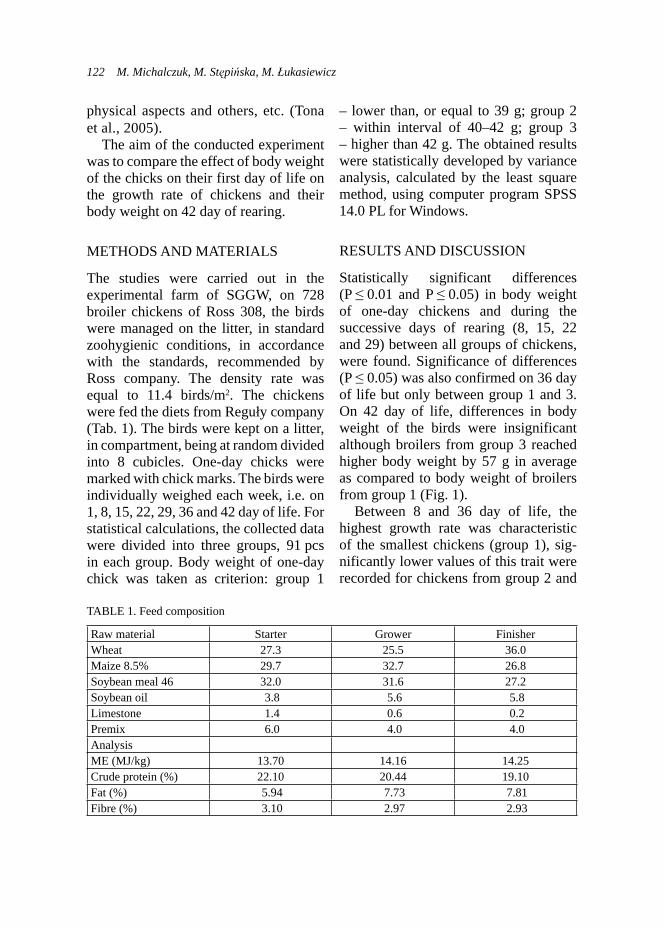
122 M. Michalczuk, M. Stępińska, M. Łukasiewicz
physical aspects and others, etc. (Tona et al., 2005).
The aim of the conducted experiment was to compare the effect of body weight of the chicks on their first day of life on the growth rate of chickens and their body weight on 42 day of rearing.
METHODS AND MATERIALS
The studies were carried out in the experimental farm of SGGW, on 728 broiler chickens of Ross 308, the birds were managed on the litter, in standard zoohygienic conditions, in accordance with the standards, recommended by Ross company. The density rate was equal to 11.4 birds/m2. The chickens were fed the diets from Reguły company (Tab. 1). The birds were kept on a litter, in compartment, being at random divided into 8 cubicles. One-day chicks were marked with chick marks. The birds were individually weighed each week, i.e. on 1, 8, 15, 22, 29, 36 and 42 day of life. For statistical calculations, the collected data were divided into three groups, 91 pcs in each group. Body weight of one-day chick was taken as criterion: group 1
– lower than, or equal to 39 g; group 2 – within interval of 40–42 g; group 3 – higher than 42 g. The obtained results were statistically developed by variance analysis, calculated by the least square method, using computer program SPSS 14.0 PL for Windows.
RESULTS AND DISCUSSION
Statistically significant differences (P ≤ 0.01 and P ≤ 0.05) in body weight of one-day chickens and during the successive days of rearing (8, 15, 22 and 29) between all groups of chickens, were found. Significance of differences (P ≤ 0.05) was also confirmed on 36 day of life but only between group 1 and 3. On 42 day of life, differences in body weight of the birds were insignificant although broilers from group 3 reached higher body weight by 57 g in average as compared to body weight of broilers from group 1 (Fig. 1).
Between 8 and 36 day of life, the highest growth rate was characteristic of the smallest chickens (group 1), sig-nificantly lower values of this trait were recorded for chickens from group 2 and
TABLE 1. Feed composition
Raw material Starter Grower FinisherWheat 27.3 25.5 36.0Maize 8.5% 29.7 32.7 26.8Soybean meal 46 32.0 31.6 27.2Soybean oil 3.8 5.6 5.8Limestone 1.4 0.6 0.2Premix 6.0 4.0 4.0AnalysisME (MJ/kg) 13.70 14.16 14.25Crude protein (%) 22.10 20.44 19.10Fat (%) 5.94 7.73 7.81Fibre (%) 3.10 2.97 2.93

Effect of the initial body weight of Ross 308 chicken broilers on the rate of growth 123
the lowest values were demonstrated for group 3. Differences in growth rate between group 2 and 3 were significant on 22 day of observations. On 42 day of life, the growth rate was the same for all groups (Fig. 2).
Tona et al. (2005) suggested that though there are still some unknown fac-tors that can be involved in chick quality definition, quantitative (weight or length) and qualitative assessment of day-old chick quality are relevant and related to
FIGURE 1. Body weight of broiler chickens (g)
FIGURE 2. Growth rate of broiler chickens (%)
C B A C B ABc Bb A
Ba b Aa
B b Aa
b a
0
500
1000
1500
2000
2500
3000
g
days1
1
8 15 29 36 4222
2 3A, B, C – Means with the different subscripts differ signifi cantly at P ≤ 0.01a, b, c – Means with the different subscripts differ signifi cantly at P ≤ 0.05
A
A
A
A
A
B
A
B
Ba
B
B
B
B
Bb
0
20
40
60
80
100
120
140
days
%
1 2 3
8 15 22 29 36 42
A, B, C – Means with the different subscripts differ signifi cantly at P ≤ 0.01a, b, c – Means with the different subscripts differ signifi cantly at P ≤ 0.05

124 M. Michalczuk, M. Stępińska, M. Łukasiewicz
performance. In this study no significant difference (p > 0.05) was observed in the body weight of the day-old chicks from the different sources. Though body weight is an easy and highly objective measure-ment, the value is relative. Day-old chick weight is highly correlated with egg weight but does not give good indication for chick development (Meijerhof, 2005). This is because chick weight contains the real chick weight so the amount of egg that is transformed into the chick tissue and remaining yolk residue. Embryos use the fat in the yolk as fuel for their develop-ment and therefore the deviation between real chick weight (without remaining yolk sac) and yolk residue is an indicator for development. If a lot of yolk is left over, then less should be considered lower. However, this does not show in day-old chicks weight (Meijerhof, 2005).
Tona (2000) and Tona et al. (2005) established the correlations between sev-eral of the qualitative parameters that been included in determining chick quality. Interestingly, most parameters are highly correlated with the conditions of the navel area, amount of retracted yolk and chick activity indicating that these parameters alone may be sufficient for sorting day-old chicks into quality groups.
CONCLUSION
On the ground of the conducted studies it may be concluded that Ross 308 chicken broilers with body weight higher than 40 g should be selected for rearing because smaller chicks, in spite of the highest growth rate, reach lower body weight on 42 day of life as compared to heavier chickens.
REFERENCES
DECUYPERE E., TONA K., BAMELIS F., CAR-EGHI C., KEMPS B., DE KETELAERE B., DE BAERDEMAKER J., BRUGGEMAN V., 2002: Broiler breeders and egg factors inter-acting with incubation conditions for optimal hatchability and chick quality. Arch. Geflügelk Special Issue 66, 56–57.
GEIDAM Y.A., KUMSHE H.A., BUKAR-KOLO M.Y., GULANI I.A., MARGIMARI Z.N., 2008: Quality assessment of layer day-old chicks supplied to Maiduguri, North-Eastern Nigeria. Asian Journal of Animal and Veteri-nary Advances 3 (1): 24–29.
JOSEPH N.S., LOURENS A., MORAN JR E.T., 2006: The effects of suboptimal eggshell tem-perature during incubation on broiler chick quality. Poult. Sci 85, 932–938.
MEIJERHOF R., 2005: Defining and measuring quality in day old broilers. Int. Hatch. Prac. 19, 7.
MEIJERHOF R., 2006: Chick size matters. World Poult. 22, 30–31.
MENDES M., DINCER E., ARSLAN E., 2007: Profile analysis and growth curve for body mass index of broiler chickens reared under different feed resfrictions in early age. Arch. Tierz. 50, 403–411.
SPSS 2006. SPSS, 14.0 for Windows user’s guide, 2006, by SPSS Ins. USA.
TONA K., BAMELIS F., DE KETELAERE B., BRUGGEMAN V., MORAES V.M.B., BUYSE J., ONAGBESAN O., DECUY-PERE E., 2003: Effects of egg storage time on spread of hatch, chick quality and juvenile growth. Poult. Sci. 82, 736–741.
TONA K., BRUGGEMAN V., ONAGBESAN O., BAMELIS F., GBEASSOR M., MERTENS K., DECUYPERE E., 2005: Day-old chick quality: relationship to hatching egg quality, adequate incubation practice and prediction of broiler performance. Avian Poult. Biology Rev. 16, 109–119.
WOLAŃSKI N.J., RENEMA R.A., ROBINSON F.E., CARNEY V.L., FANCHER B.L., 2007: Relationship among egg characteristics, chick measurements and early growth traits in ten broiler breeder strains. Poult. Sci. 86, 1784––1792.
Effect of the initial body weight of Ross 308 chicken broilers on the rate of growth 125
Streszczenie: Wpływ początkowej masy ciała kurcząt brojlerów kurzych Ross 308 na tempo wzrostu. Wyniki odchowu brojlerów w dużej mierze zależą od jakości piskląt, na którą mają wpływ: wiek i stan zdrowotny stada reproduk-cyjnego, masa jaja wylęgowego oraz masa ciała wyklutych piskląt. Celem przeprowadzonego do-świadczenia było porównanie wpływu masy ciała piskląt w pierwszym dniu życia na tempo wzrostu kurcząt oraz ich masę ciała w 42 dniu odchowu. Badania przeprowadzono na 728 kurczętach Ross 308. Ptaki utrzymywano na ściółce, w pomiesz-czeniu podzielonym losowo na 8 przedziałów. Jednodniowe pisklęta zaznaczono znaczkami pi-sklęcymi. Kurczęta były co tydzień indywidual-nie ważone, tj. w 1, 8, 15, 22, 29, 36 i 42 dniu życia. Do obliczeń statystycznych zebrane dane podzielono na trzy grupy, liczące po 91 sztuk. Jako kryterium podziału przyjęto masę ciała jed-
nodniowego pisklęcia: grupa 1 – niższa lub równa 39 g; grupa 2 – w przedziale od 40 do 42 g; grupa 3 – większa niż 42 g. Na podstawie uzyskanych wyników stwierdzono, że do odchowu kurcząt brojlerów Ross 308 należy wybierać pisklęta o masie ciała większej niż 40 g, ponieważ mniej-sze pisklęta, mimo najszybszego tempa wzrostu, osiągają niższą masę ciała w 42. dniu w porówna-niu z pisklętami cięższymi (o 57 g).
MS. received September 2011
Authors’ address:Katedra Szczegółowej Hodowli Zwierząt – SGGWul. Ciszewskiego 802-786 [email protected]

Annals of Warsaw University of Life Sciences – SGGWAnimal Science No 49, 2011: 127–136(Ann. Warsaw Univ. of Life Sc. – SGGW, Anim. Sci. 49, 2011)
Effect of the age of the first calving on milk performanceand inter-calving period of Polish Holstein-Friesian cows
TERESA NAŁĘCZ-TARWACKA, ŁUKASZ ŚWIDERSKI, HENRYK GRODZKIDepartment of Animal Breeding, Warsaw University of Life Sciences – SGGW
Abstract: Effect of the age of the fi rst calving on milk performance and inter-calving period of Po-lish Holstein-Friesian cows. The aim of the work was to determine the effect of the age of the fi rst calving on milk performance in the 1st, 2nd and 3rd lactation, the sum of yield of milk, fat and pro-tein for three complete lactations and the amount of the mentioned components as calculated per one day of life. The age of the fi rst calving had a signifi cant infl uence on milk yield only in the fi rst lactation. The percentage fat content did not differ signifi cantly between the groups of the age of calving whereas the studied factor affected si-gnifi cantly the protein content in milk of the cows after the second and third calving. The obtained results indicate that the most favorable economi-cally mating of heifers takes place until the 27th month of life as such animals give the greatest qu-antities of milk, fat and protein, as calculated per one day of life.
Key words: age of the fi rst calving, milk perfor-mance, milk, fat and protein amount as calculated per one day of life.
INTRODUCTION
The period of heifer rearing has a great effect on the later productivity of dairy cows, and the abbreviation of the men-tioned period causes the improvement of production profitability. Most of the stud-ies suggest abbreviation of the rearing period; the other ones indicate the higher
productivity of animals, being calved at the later age. According to Wilson (2006) and Plate-Church (2006), a heifer which does not become pregnant until the 15th month of life, brings losses in the quan-tity of ca. 100 USD per month. In the opinion of Heinrich (1993), the rearing of the heifers constitutes 15–20% of all costs in cattle breeding. Many research-ers (Mourits et al., 1997; Gardner et al., 1988; Lin et al., 1988; Meyer et al., 2005 and Harel et al., 2006) stated that it was justifiable to lower the age of calving even to 22 months. It does not cause big losses in productivity and, simultane-ously, lowers the costs of nutrition. The authors suggest, however, that such early commencement of performance is pos-sible only with the correctly conducted rearing so as the heifers reach the appro-priate body weight and height in sacrum at such a young age. Powell (1985), Nilforooshan and Edriss (2004) and Harel et al. (2006) express the opinion that about half of the heifers in the USA are calved at the age of 23–27 months. In the countries where cattle breeding and milk production is found on a high level, we may observe lowering of the age of the first parturition. Also, in Poland there is a small decline of the age of the first
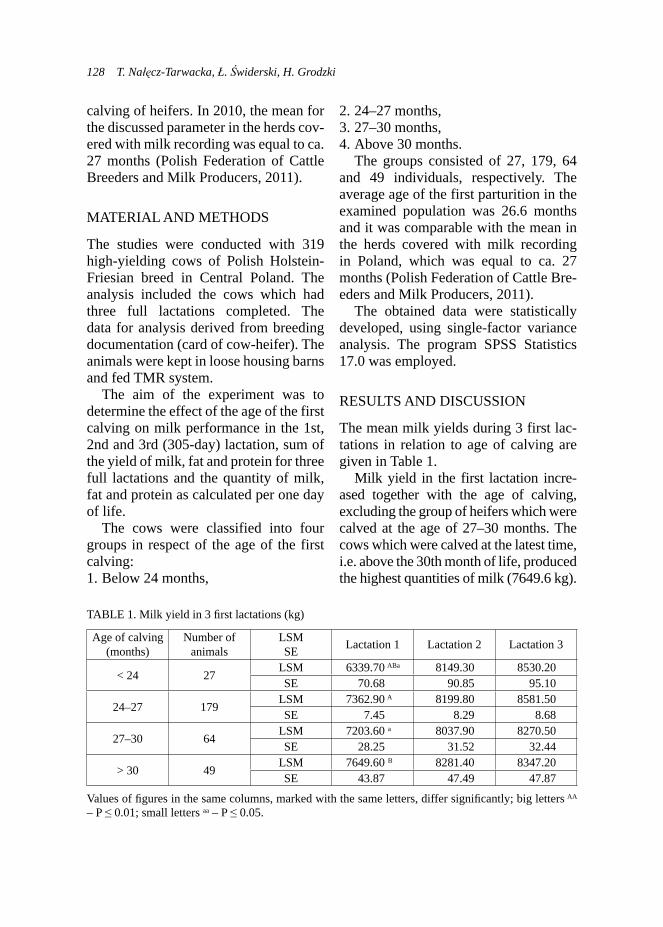
128 T. Nałęcz-Tarwacka, Ł. Świderski, H. Grodzki
calving of heifers. In 2010, the mean for the discussed parameter in the herds cov-ered with milk recording was equal to ca. 27 months (Polish Federation of Cattle Breeders and Milk Producers, 2011).
MATERIAL AND METHODS
The studies were conducted with 319 high-yielding cows of Polish Holstein-Friesian breed in Central Poland. The analysis included the cows which had three full lactations completed. The data for analysis derived from breeding documentation (card of cow-heifer). The animals were kept in loose housing barns and fed TMR system.
The aim of the experiment was to determine the effect of the age of the first calving on milk performance in the 1st, 2nd and 3rd (305-day) lactation, sum of the yield of milk, fat and protein for three full lactations and the quantity of milk, fat and protein as calculated per one day of life.
The cows were classified into four groups in respect of the age of the first calving:1. Below 24 months,
2. 24–27 months,3. 27–30 months,4. Above 30 months.
The groups consisted of 27, 179, 64 and 49 individuals, respectively. The average age of the first parturition in the examined population was 26.6 months and it was comparable with the mean in the herds covered with milk recording in Poland, which was equal to ca. 27 months (Polish Federation of Cattle Bre-eders and Milk Producers, 2011).
The obtained data were statistically developed, using single-factor variance analysis. The program SPSS Statistics 17.0 was employed.
RESULTS AND DISCUSSION
The mean milk yields during 3 first lac-tations in relation to age of calving are given in Table 1.
Milk yield in the first lactation incre-ased together with the age of calving, excluding the group of heifers which were calved at the age of 27–30 months. The cows which were calved at the latest time, i.e. above the 30th month of life, produced the highest quantities of milk (7649.6 kg).
TABLE 1. Milk yield in 3 fi rst lactations (kg)
Age of calving (months)
Number of animals
LSMSE Lactation 1 Lactation 2 Lactation 3
< 24 27LSM 6339.70 ABa 8149.30 8530.20SE 70.68 90.85 95.10
24–27 179LSM 7362.90 A 8199.80 8581.50SE 7.45 8.29 8.68
27–30 64LSM 7203.60 a 8037.90 8270.50SE 28.25 31.52 32.44
> 30 49LSM 7649.60 B 8281.40 8347.20SE 43.87 47.49 47.87
Values of fi gures in the same columns, marked with the same letters, differ signifi cantly; big letters AA – P ≤ 0.01; small letters aa – P ≤ 0.05.
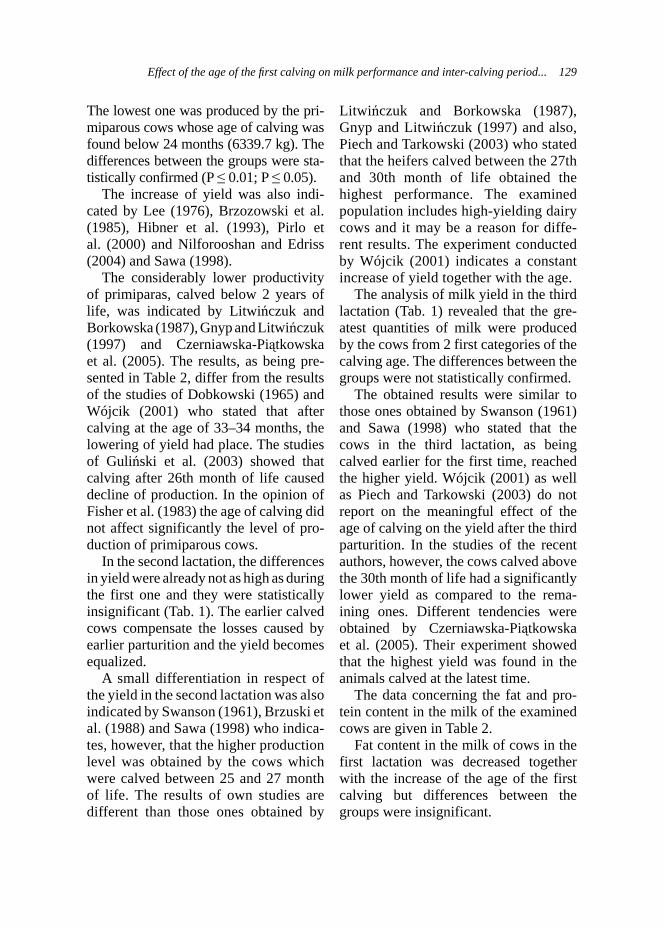
Effect of the age of the fi rst calving on milk performance and inter-calving period... 129
The lowest one was produced by the pri-miparous cows whose age of calving was found below 24 months (6339.7 kg). The differences between the groups were sta-tistically confirmed (P ≤ 0.01; P ≤ 0.05).
The increase of yield was also indi-cated by Lee (1976), Brzozowski et al. (1985), Hibner et al. (1993), Pirlo et al. (2000) and Nilforooshan and Edriss (2004) and Sawa (1998).
The considerably lower productivity of primiparas, calved below 2 years of life, was indicated by Litwińczuk and Borkowska (1987), Gnyp and Litwińczuk (1997) and Czerniawska-Piątkowska et al. (2005). The results, as being pre-sented in Table 2, differ from the results of the studies of Dobkowski (1965) and Wójcik (2001) who stated that after calving at the age of 33–34 months, the lowering of yield had place. The studies of Guliński et al. (2003) showed that calving after 26th month of life caused decline of production. In the opinion of Fisher et al. (1983) the age of calving did not affect significantly the level of pro-duction of primiparous cows.
In the second lactation, the differences in yield were already not as high as during the first one and they were statistically insignificant (Tab. 1). The earlier calved cows compensate the losses caused by earlier parturition and the yield becomes equalized.
A small differentiation in respect of the yield in the second lactation was also indicated by Swanson (1961), Brzuski et al. (1988) and Sawa (1998) who indica-tes, however, that the higher production level was obtained by the cows which were calved between 25 and 27 month of life. The results of own studies are different than those ones obtained by
Litwińczuk and Borkowska (1987), Gnyp and Litwińczuk (1997) and also, Piech and Tarkowski (2003) who stated that the heifers calved between the 27th and 30th month of life obtained the highest performance. The examined population includes high-yielding dairy cows and it may be a reason for diffe-rent results. The experiment condu cted by Wójcik (2001) indicates a constant increase of yield together with the age.
The analysis of milk yield in the third lactation (Tab. 1) revealed that the gre-atest quantities of milk were produced by the cows from 2 first categories of the calving age. The differences between the groups were not statistically confirmed.
The obtained results were similar to those ones obtained by Swanson (1961) and Sawa (1998) who stated that the cows in the third lactation, as being calved earlier for the first time, reached the higher yield. Wójcik (2001) as well as Piech and Tarkowski (2003) do not report on the meaningful effect of the age of calving on the yield after the third parturition. In the studies of the recent authors, however, the cows calved above the 30th month of life had a significantly lower yield as compared to the rema-ining ones. Different tendencies were obtained by Czerniawska-Piątkowska et al. (2005). Their experiment showed that the highest yield was found in the animals calved at the latest time.
The data concerning the fat and pro-tein content in the milk of the examined cows are given in Table 2.
Fat content in the milk of cows in the first lactation was decreased together with the increase of the age of the first calving but differences between the groups were insignificant.
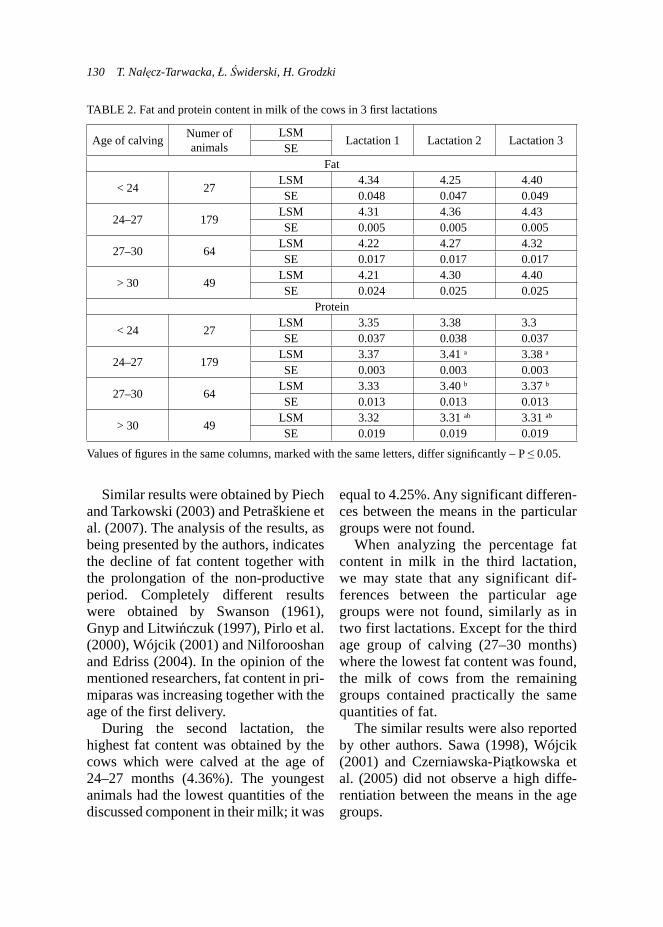
130 T. Nałęcz-Tarwacka, Ł. Świderski, H. Grodzki
Similar results were obtained by Piech and Tarkowski (2003) and Petraškiene et al. (2007). The analysis of the results, as being presented by the authors, indicates the decline of fat content together with the prolongation of the non-productive period. Completely different results were obtained by Swanson (1961), Gnyp and Litwińczuk (1997), Pirlo et al. (2000), Wójcik (2001) and Nilforooshan and Edriss (2004). In the opinion of the mentioned researchers, fat content in pri-miparas was increasing together with the age of the first delivery.
During the second lactation, the highest fat content was obtained by the cows which were calved at the age of 24–27 months (4.36%). The youngest animals had the lowest quantities of the discussed component in their milk; it was
equal to 4.25%. Any significant differen-ces between the means in the particular groups were not found.
When analyzing the percentage fat content in milk in the third lactation, we may state that any significant dif-ferences between the particular age groups were not found, similarly as in two first lactations. Except for the third age group of calving (27–30 months) where the lowest fat content was found, the milk of cows from the remaining groups contained practically the same quantities of fat.
The similar results were also reported by other authors. Sawa (1998), Wójcik (2001) and Czerniawska-Piątkowska et al. (2005) did not observe a high diffe-rentiation between the means in the age groups.
TABLE 2. Fat and protein content in milk of the cows in 3 fi rst lactations
Age of calving Numer of animals
LSM Lactation 1 Lactation 2 Lactation 3
SEFat
< 24 27LSM 4.34 4.25 4.40SE 0.048 0.047 0.049
24–27 179LSM 4.31 4.36 4.43SE 0.005 0.005 0.005
27–30 64LSM 4.22 4.27 4.32SE 0.017 0.017 0.017
> 30 49LSM 4.21 4.30 4.40SE 0.024 0.025 0.025
Protein
< 24 27LSM 3.35 3.38 3.3SE 0.037 0.038 0.037
24–27 179LSM 3.37 3.41 a 3.38 a
SE 0.003 0.003 0.003
27–30 64LSM 3.33 3.40 b 3.37 b
SE 0.013 0.013 0.013
> 30 49LSM 3.32 3.31 ab 3.31 ab
SE 0.019 0.019 0.019
Values of fi gures in the same columns, marked with the same letters, differ signifi cantly – P ≤ 0.05.
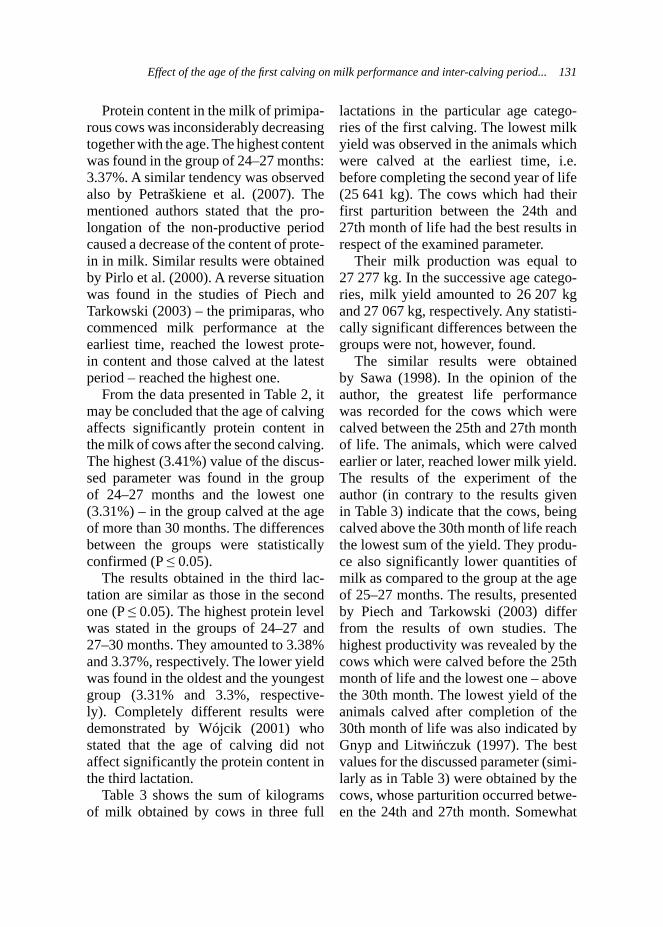
Effect of the age of the fi rst calving on milk performance and inter-calving period... 131
Protein content in the milk of primipa-rous cows was inconsiderably decreasing together with the age. The highest content was found in the group of 24–27 months: 3.37%. A similar tendency was observed also by Petraškiene et al. (2007). The mentioned authors stated that the pro-longation of the non-productive period caused a decrease of the content of prote-in in milk. Similar results were obtained by Pirlo et al. (2000). A reverse situation was found in the studies of Piech and Tarkowski (2003) – the primiparas, who commenced milk performance at the earliest time, reached the lowest prote-in content and those calved at the latest period – reached the highest one.
From the data presented in Table 2, it may be concluded that the age of calving affects significantly protein content in the milk of cows after the second calving. The highest (3.41%) value of the discus-sed parameter was found in the group of 24–27 months and the lowest one (3.31%) – in the group calved at the age of more than 30 months. The differences between the groups were statistically confirmed (P ≤ 0.05).
The results obtained in the third lac-tation are similar as those in the second one (P ≤ 0.05). The highest protein level was stated in the groups of 24–27 and 27–30 months. They amounted to 3.38% and 3.37%, respectively. The lower yield was found in the oldest and the youngest group (3.31% and 3.3%, respective-ly). Completely different results were demonstrated by Wójcik (2001) who stated that the age of calving did not affect significantly the protein content in the third lactation.
Table 3 shows the sum of kilograms of milk obtained by cows in three full
lactations in the particular age catego-ries of the first calving. The lowest milk yield was observed in the animals which were calved at the earliest time, i.e. before completing the second year of life (25 641 kg). The cows which had their first parturition between the 24th and 27th month of life had the best results in respect of the examined parameter.
Their milk production was equal to 27 277 kg. In the successive age catego-ries, milk yield amounted to 26 207 kg and 27 067 kg, respectively. Any statisti-cally significant differences between the groups were not, however, found.
The similar results were obtained by Sawa (1998). In the opinion of the author, the greatest life performance was recorded for the cows which were calved between the 25th and 27th month of life. The animals, which were calved earlier or later, reached lower milk yield. The results of the experiment of the author (in contrary to the results given in Table 3) indicate that the cows, being calved above the 30th month of life reach the lowest sum of the yield. They produ-ce also significantly lower quantities of milk as compared to the group at the age of 25–27 months. The results, presented by Piech and Tarkowski (2003) differ from the results of own studies. The highest productivity was revealed by the cows which were calved before the 25th month of life and the lowest one – above the 30th month. The lowest yield of the animals calved after completion of the 30th month of life was also indicated by Gnyp and Litwińczuk (1997). The best values for the discussed parameter (simi-larly as in Table 3) were obtained by the cows, whose parturition occurred betwe-en the 24th and 27th month. Somewhat
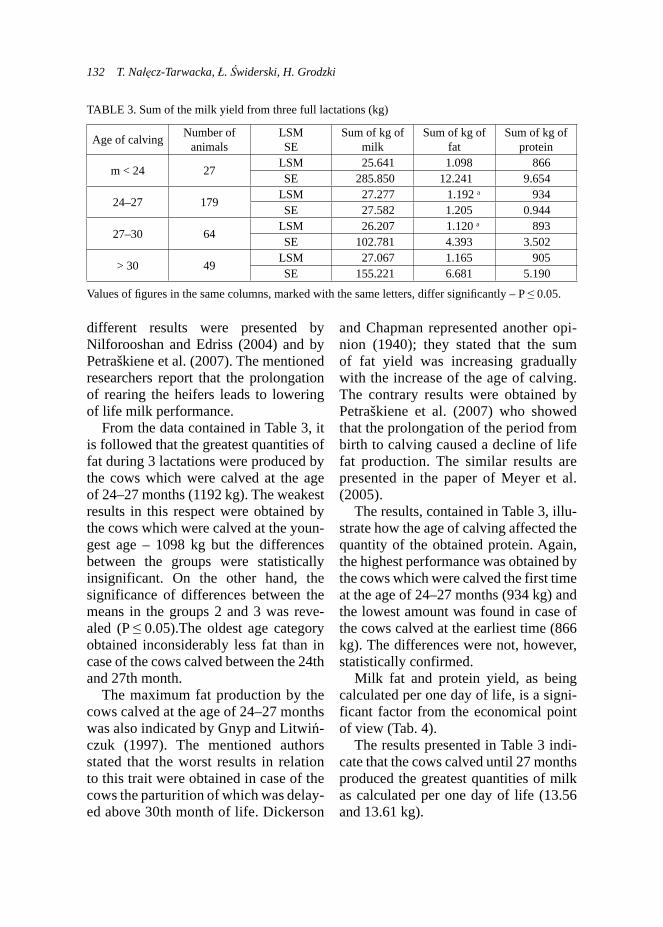
132 T. Nałęcz-Tarwacka, Ł. Świderski, H. Grodzki
different results were presented by Nilforooshan and Edriss (2004) and by Petraškiene et al. (2007). The mentioned researchers report that the prolongation of rearing the heifers leads to lowering of life milk performance.
From the data contained in Table 3, it is followed that the greatest quantities of fat during 3 lactations were produced by the cows which were calved at the age of 24–27 months (1192 kg). The weakest results in this respect were obtained by the cows which were calved at the youn-gest age – 1098 kg but the differences between the groups were statistically insignificant. On the other hand, the significance of differences between the means in the groups 2 and 3 was reve-aled (P ≤ 0.05).The oldest age category obtained inconsiderably less fat than in case of the cows calved between the 24th and 27th month.
The maximum fat production by the cows calved at the age of 24–27 months was also indicated by Gnyp and Litwiń-czuk (1997). The mentioned authors stated that the worst results in relation to this trait were obtained in case of the cows the parturition of which was delay-ed above 30th month of life. Dickerson
and Chapman represented another opi-nion (1940); they stated that the sum of fat yield was increasing gradually with the increase of the age of calving. The contrary results were obtained by Petraškiene et al. (2007) who showed that the prolongation of the period from birth to calving caused a decline of life fat production. The similar results are presented in the paper of Meyer et al. (2005).
The results, contained in Table 3, illu-strate how the age of calving affected the quantity of the obtained protein. Again, the highest performance was obtained by the cows which were calved the first time at the age of 24–27 months (934 kg) and the lowest amount was found in case of the cows calved at the earliest time (866 kg). The differences were not, however, statistically confirmed.
Milk fat and protein yield, as being calculated per one day of life, is a signi-ficant factor from the economical point of view (Tab. 4).
The results presented in Table 3 indi-cate that the cows calved until 27 months produced the greatest quantities of milk as calculated per one day of life (13.56 and 13.61 kg).
TABLE 3. Sum of the milk yield from three full lactations (kg)
Age of calving Number of animals
LSMSE
Sum of kg of milk
Sum of kg of fat
Sum of kg of protein
m < 24 27LSM 25.641 1.098 866SE 285.850 12.241 9.654
24–27 179LSM 27.277 1.192 a 934SE 27.582 1.205 0.944
27–30 64LSM 26.207 1.120 a 893SE 102.781 4.393 3.502
> 30 49LSM 27.067 1.165 905SE 155.221 6.681 5.190
Values of fi gures in the same columns, marked with the same letters, differ signifi cantly – P ≤ 0.05.

Effect of the age of the fi rst calving on milk performance and inter-calving period... 133
Similar results were also obtained by Gnyp and Litwińczuk (1997). They stated that the cows in the groups below 24 and 24–27 months had identical pro-duction and the means for these groups were significantly higher as compared to later-calved cows. Similar results were presented by Gnyp et al. (2006). They indicated that the cows, which were calved before 2 years of life, produced inconsiderably greater quantities of milk. The mentioned authors report also that production of the animals which had their parturition before the 27th month of life was significantly higher as compared to the later-calved ones. Also, Lin et al.
(1988) stated that earlier calving caused increase of production as calculated per one day of life.
The results, contained in Table 4 indi-cate that production of fat as well as of protein was found on the highest level in cows which were calved the first time before the 27th month of life. The diffe-rences between the groups were statisti-cally significant (P ≤ 0.01; (P ≤ 0.05).
In Table 5, the mean inter-calving period for the cows, covered with the studies, is given.
The results, contained in Table 5 indi-cate that in all groups the inter-calving period was higher than the optimal one.
TABLE 4. Cow performance as calculated per one day of life (kg/day)
Age of calving Number of animals
LSMSE Milk yield Fat yield Protein yield
< 24 27LSM 13.560 a 0.580 a 0.460 a
SE 0.151 0.006 0.005
24–27 179LSM 13.610 B,C 0.590 B,C 0.470 B,C
SE 0.014 0.001 0.000
27–30 64LSM 12.770 C 0.550 C 0.440 C
SE 0.050 0.002 0.002
> 30 49LSM 12.480 Ba 0.540 Ba 0.420 Ba
SE 0.072 0.003 0.002
Values in the same columns, marked with the same letters differ signifi cantly – big letters AA P ≤ 0.01; small letters aa P ≤ 0.05.
TABLE 5. The mean inter-calving period (days)
Age of calving Number of animals LSMSE Inter-calving period
< 24 27LSM 429SE 4.783
24–27 179LSM 436 a
SE 0.441
27–30 64LSM 418 a
SE 1.639
> 30 49LSM 422SE 2.420
Values in the same columns, marked with the same letters differ signifi cantly P ≤ 0.05.

134 T. Nałęcz-Tarwacka, Ł. Świderski, H. Grodzki
The best (the shortest) period betwe-en the parturition was found for the cows which were the first time calved between the 27th and 30th month of life (418 days). On the other hand, the weakest results were obtained for the cows which were the best in respect of production (24–27 months) – 436 days. The differences between the groups were statistically significant (P ≤ 0.05). In relation to the mentioned parameter, the youngest cows obtained inconsi-derably higher value as compared to the oldest animals (429 and 422 days, respectively).
Dickerson and Chapman (1940) stated that the cows being calved before the 25th month of life had the highest value of inter-calving period. The best results in this respect were demonstrated by the cows which were calved between the 26th and 30th month of life. Dif-ferent results were obtained by Gnyp and Litwińczuk (1997). In the opinion of the mentioned authors, the group calved at the age of 24–27 months was the best one and the group which was calved at the age of 27–30 months was the weakest one. The studies of Szulc and Radzik (1977) showed that the inter-calving period was maintained on the constant level (excluding the cows which were calved before the 29th month of life). A considerable increase of the length of the examined parame-ter together with the delay of the first parturition was indicated in the studies of Hibner (1982). The mentioned author states that the younger animals have the better fertility. The differences between the results obtained in own studies and those ones, presented by other authors may result from the fact that the exami-
ned population consists of high-yielding dairy cows.
CONCLUSIONS
The age of the first calving affected significantly the milk yield only during the first lactation.
The greatest quantities of milk were produced by the cows which were calved at the latest period, i.e. above the 30th month of life. During the successive lactations, any significant differences in productivity of different age groups were not found and the cows calved as youn-ger animals compensated their losses connected with the younger age at par-turition and produced a similar and even higher milk quantity.
The highest total milk yield for the first 3 lactations was obtained by the cows, calved for the first time at the age of 24–27 months but except for fat yield; the differences between the mentioned group and the remaining ones were insi-gnificant. This fact indicates the justness of the universally practiced recommen-dation for the breeders that the optimum age of calving for Polish HF heifers is the age of 24–27 months.
The percentage fat content did not differ significantly between the age groups of calving. On the other hand, the age of calving affected significantly protein content in milk of the cows in the second and third lactation. Signifi-cant differences in milk, fat and protein production as calculated per one day of life were found. The best results in this respect were stated for the cows calved until the 27th month of life. Delaying of the first parturition caused the decline of the discussed indicators.

Effect of the age of the fi rst calving on milk performance and inter-calving period... 135
REFERENCES
BRZOZOWSKI P., MISZTAL I., RUDZIŃSKI F., 1985: Zależność pomiędzy sezonem i wiekiem pierwszego ocielenia a produkcyjnością pier-wiastek w hodowli zarodowej. Zesz. Probl. Post. Nauk Rol., 300, 91–95.
BRZUSKI P., SZAREK J., PARZELSKI S., 1988: Wpływ czynników środowiskowych na wydaj-ność krów rasy ncb i mieszańców ncbxhf. Acta Agr. et Silv., Zootechnika, 27, 3–14.
CZERNIAWSKA-PIĄTKOWSKA E., KAMIE-NIECKI H., WÓJCIK J., RZEWUCKA E., SZEWCZUK M., PILARCZYK R., 2005: Wpływ wieku pierwszego ocielenia na pro-dukcyjność krów czarno-białych z różnym udziałem genów rasy holsztyńsko-fryzyjskiej. Folia Univ. Stetin. Zootechnica, 243 (47), 25–32.
DICKERSON G.E., CHAPMAN A.B., 1940: Butterfat production, reproduction, growth and longevity in relation to age at first calving. J. Anim. Sci., 1940, 76–81.
DOBKOWSKI A., 1965: Wydajność mleka w pierwszej laktacji w zależności od wieku i cię-żaru przy pierwszym zacieleniu. Prz. Hod., 5, 21–22.
FISHER L.J., HALL J.W., JONES S.E., 1982: Weight and age at calving and weight change related to first lactation milk yield. J. Dairy Sci., 66, 2167–2172.
GARDNER R.W., SMITH L.W., PARK R.L., 1988: Feeding and management of dairy he-ifers for optimal lifetime productivity. J. Dairy Sci., 71, 996–999.
GNYP J., JANKOWSKI P., PIECH M., 2006: Wpływ wieku krów w dniu pierwszego wy-cielenia na ich późniejszą wydajność mleczna, płodność i zdrowotność. LXXI Zjazd PTZ, Streszczenia, Z. 1, s. 1.
GNYP J., LITWIŃCZUK Z., 1997: Efektywność użytkowania krów w zależności od wieku przy pierwszym wycieleniu. Med. Weter., 53 (7), 415–418.
GULIŃSKI P., GIERSZ B., NIEDZIAŁEK G., MŁYNEK K., 2003: Kształtowanie się wieku pierwszego wycielenia i jego znaczenie dla użytkowości mlecznej pierwiastek utrzymy-wanych w gospodarstwach wschodniego Ma-zowsza w latach 1977–2000. Acta Sci. Pol., Zootechnica, 2 (2), 21–40.
HAREL E., NORMAN H.D., WRIGHT J.R., 2006: Trends in Calving Ages and Calving In-tervals for Dairy Cattle Breeds in the United States. J. Dairy Sci., 89, 365–370.
HEINRICH A.J., 1993: Raising dairy replace-ment to meet the need of the 21st century. J. Dairy Sci., 76, 3179–3187.
HIBNER A., 1982: Zależność między wiekiem przy pierwszym wycieleniu a długością ży-cia i użytkowania oraz płodnością krów. Prz. Hod. 7, 44–46.
HIBNER A., ZIEMIŃSKI R., SAKOWSKI T., 1993: Próba określenia optymalnego terminu rozpoczęcia użytkowania mlecznego krów – mieszańców F1 (cbxhf). Pr. Mater. Zootech., 44, 71–75.
LEE A.J., 1976: Relationship between milk yield and age at calving in first lactation. J. Dairy Sci., 59, 1794–1801.
LIN C.Y., MCALLISTER A.J., BATRA T.R., LEE A.J., 1988: Effects of early and late breeding of heifers on multiple lactation per-formance of dairy cows. J. Dairy Sci., 71, 2735–2743.
LITWIŃCZUK Z., BORKOWSKA D., 1987: Wpływ wieku pierwszego wycielenia na pro-dukcyjność, płodność oraz długość użytkowa-nia krów. Zesz. Probl. Post. Nauk Rol., 332, 242–245.
MEYER M.J., EVERETT R.W., VanAmburgh M.E., 2000: Reduced age at first calving: Ef-fects on lifetime production, longevity and profitability. http://ag.arizona.edu/extension/dairy/az_nm_newsletter/2005/july.pdf.
MOURITS, M.C.M., DIJKHUIZEN A.A,, HU-RINE R.B.M., GALLIGAN D.T., 1997: Tech-nical and economic models to support heifer management decisions: basic concepts. J. Da-iry Sci., 80, 1406–1415.
NILFOROOSHAN M.A., EDRISS M.A., 2004: Effect of age at first calving on some produc-tive and longevity traits in Iranian Holsteins of the Isfahan Province. J. Dairy Sci., 87, 2130–2135.
PETRAŠKIENĖ R., GIRSKIENĖ B., PALEC-KAITIS M., 2007: Influence of age at first ca-lving on production traits in lithuanian black-and-white cattle population. Veterinarija Ir Zootechnika, T. 40 (62), 67–72.
PIECH M., TARKOWSKI J., 2003: Wpływ wie-ku pierwszego ocielenia na produkcyjność

136 T. Nałęcz-Tarwacka, Ł. Świderski, H. Grodzki
krów czarno białych z różnym udziałem ge-nów rasy holsztyńsko-fryzyjskiej. Zesz Zesz. Nauk. Prz. Hod., 68 z. 1, 153–160.
PIRLO G., MIGLIOR F., SPERONI M., 2000: Effect of age at first calving on production traits and on difference between milk yield returns and rearing costs in Italian Holsteins. J. Dairy Sci., 83, 603–608.
PLATE-CHURCH A., 2006: Determining Opti-mal Age at First Calving. http://genex.crinet.com/page638/DeterminingOptimalAgeAtFir-stCalving.
POLSKA FEDERACJA HODOWCÓW BYDŁA I PRODUCENTÓW MLEKA, 2011: Wyniki oceny wartości użytkowej krów mlecznych. http://www.pfhb.pl.
POWELL R.L.,1985: Trend of age at first ca-lving. J. Dairy Sci., 68, 768–772.
SAWA A., 1998: Genetyczne i środowiskowe uwarunkowania użytkowości krów w po-szczególnych okresach życia. Rozprawy Aka-demia techniczno-Rolnicza w Bydgoszczy, nr 88, 31–35.
SWANSON E.W., 1961: Milk production and growth of identical twin heifers calving for the first time at two and three years of age. J. Dairy Sci., 44, 2027–2034.
SZULC T., RADZIK W., 1977: Wpływ wieku pierwszego wycielenia na wartość niektórych cech użytkowych krów. Prz. Hod., 19, 16–18.
WILSON R., 2006: Age at first calving: The dollars and sense. http://genex.crinet.com/page438/AgeAtFirstCalvingTheDollarsAndSense.
WÓJCIK P., 2001: Wpływ wieku pierwszego za-cielenia na produkcyjność krów rasy czarno-białej. Rocz. Nauk. Zoot., T. 28, z. 1, 189–198.
Streszczenie: Wpływ wieku pierwszego ocielenia na użytkowość mleczną i okres międzyocieleniowy krów rasy polskiej holsztyńsko-fryzyjskiej. Celem pracy było określenie wpływu wieku pierwszego wycielenia na: użytkowość mleczną w 1., 2. i 3. laktacji; sumę wydajności mleka, tłuszczu i białka za trzy pełne laktacje oraz ilość tych składników w przeliczeniu na 1 dzień życia. Wiek pierwszego ocielenia istotnie wpływał na wydajność mleka tylko w pierwszej laktacji. Procentowa zawartość tłuszczu nie różniła się istotnie między grupami wieku wycielenia, natomiast badany czynnik wpływał istotnie na zawartość białka w mleku krów po drugim i trzecim wycieleniu. Otrzyma-ne wyniki wskazują, że najkorzystniejsze, pod względem ekonomicznym, jest takie krycie ja-łówek, aby ocielenie nastąpiło do 27. miesiąca życia, gdyż od takich zwierząt uzyskuje się naj-więcej mleka, tłuszczu i białka w przeliczeniu na jeden dzień życia.
MS. received September 2011
Author’s address:Katedra Szczegółowej Hodowli Zwierząt – SGGWul. Ciszewskiego 802-786 WarszawaPoland

Annals of Warsaw University of Life Sciences – SGGWAnimal Science No 49, 2011: 137–141(Ann. Warsaw Univ. of Life Sc. – SGGW, Anim. Sci. 49, 2011)
Comparison of body condition score (BCS) and muscularity level results of Charolaise cows
TOMASZ PRZYSUCHA, HENRYK GRODZKI, MARCIN GOŁĘBIEWSKI, JAN SLÓSARZ Department of Animal Breeding, Warsaw University of Life Sciences – SGGW
Abstract: Comparison of body conditions score (BCS) and muscularity level results of Charolaise cows. The aim of the study was to calculate the correlation between body condition score (BCS) and musculature score of Charolaise cows. All the correlation coeffi cients of BCS measured in the particular body parts were high (from 0.861 to 0.898) and statistically signifi cant (P ≤ 0.01). All the above mentioned coeffi cients examined on the front of neck appearance were not signifi cant in comparison to those examined on the other parts of body. The dependence between BCS in the particular parts of body and the fi nal BCS result was proved (P ≤ 0.01). The highest correlation coeffi cient (r = 0.898) was fund for the fi nal BCS examined in the ischiadic tubers. All of the ob-tained correlation coeffi cients between cow BCS and cow muscularity were high (p ≤ 0.01). The high est correlation coeffi cient (r = 0.501) between BCS and the fi nal musculature score was noticed for BCS measured at shoulder. All of the obtained correlation coeffi cients between the particular no-tes for cow musculature were high and statistical-ly signifi cant (p ≤ 0.01). The highest correlation (r = 0.978) was observed between rump convexi-ty and the fi nal musculature grade.
Key words: beef cattle, BCS, musculature score.
INTRODUCTION
The most important factors detemining beef cattle herd economy are the number
of good quality calves born each year and feeding costs of breeding herd. The number of calves born depends on fertil-ity results influenced by calving course depending on many factors, among which BCS and muscularity score are ones of the most important. Cow BCS is caused mainly by health status, mainte-nance system including feeding quality etc. (Selk et al., 1986; Jasiorowski et al., 1996; Dickerson, 1978). There are not enough papers (especially by Polish authors) concerning influence of BCS and muscularity level in the beef herds.
The aim of presented study was to determine correlation coefficients between BCS and muscularity examina-tion of Charolaise beef cattle breed. BCS scale is mainly used to estimate energetic reserves of cow organism. The level of muscularity development (muscles width and profiles) is used for commercial assessment of slaughter quality. Since both above mentioned investigations are done at the same body parts, it would be worth to know the correlations between them. Higher than usually obtained coef-ficients could indicate, that the overfed cows are unjustly classified as the best muscular ones, whereas in practice the
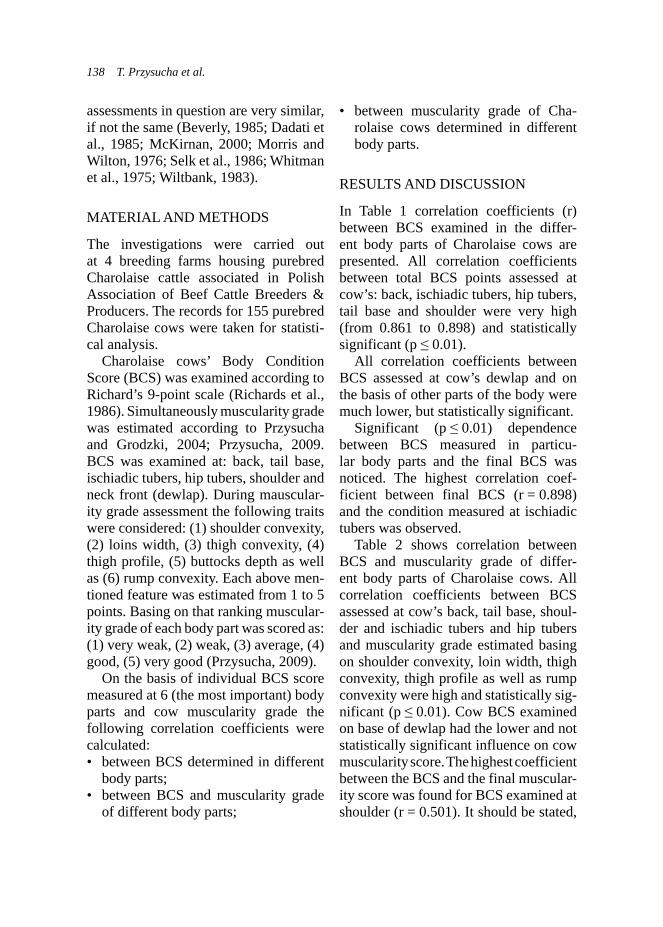
138 T. Przysucha et al.
assessments in question are very similar, if not the same (Beverly, 1985; Dadati et al., 1985; McKirnan, 2000; Morris and Wilton, 1976; Selk et al., 1986; Whitman et al., 1975; Wiltbank, 1983).
MATERIAL AND METHODS
The investigations were carried out at 4 breeding farms housing purebred Charolaise cattle associated in Polish Association of Beef Cattle Breeders & Producers. The records for 155 purebred Charolaise cows were taken for statisti-cal analysis.
Charolaise cows’ Body Condition Score (BCS) was examined according to Richard’s 9-point scale (Richards et al., 1986). Simultaneously muscularity grade was estimated according to Przysucha and Grodzki, 2004; Przysucha, 2009. BCS was examined at: back, tail base, ischiadic tubers, hip tubers, shoulder and neck front (dewlap). During mauscular-ity grade assessment the following traits were considered: (1) shoulder convexity, (2) loins width, (3) thigh convexity, (4) thigh profile, (5) buttocks depth as well as (6) rump convexity. Each above men-tioned feature was estimated from 1 to 5 points. Basing on that ranking muscular-ity grade of each body part was scored as: (1) very weak, (2) weak, (3) average, (4) good, (5) very good (Przysucha, 2009).
On the basis of individual BCS score measured at 6 (the most important) body parts and cow muscularity grade the following correlation coefficients were calculated:• between BCS determined in different
body parts;• between BCS and muscularity grade
of different body parts;
• between muscularity grade of Cha-rolaise cows determined in different body parts.
RESULTS AND DISCUSSION
In Table 1 correlation coefficients (r) between BCS examined in the differ-ent body parts of Charolaise cows are presented. All correlation coefficients between total BCS points assessed at cow’s: back, ischiadic tubers, hip tubers, tail base and shoulder were very high (from 0.861 to 0.898) and statistically significant (p ≤ 0.01).
All correlation coefficients between BCS assessed at cow’s dewlap and on the basis of other parts of the body were much lower, but statistically significant.
Significant (p ≤ 0.01) dependence between BCS measured in particu-lar body parts and the final BCS was noticed. The highest correlation coef-ficient between final BCS (r = 0.898) and the condition measured at ischiadic tubers was observed.
Table 2 shows correlation between BCS and muscularity grade of differ-ent body parts of Charolaise cows. All correlation coefficients between BCS assessed at cow’s back, tail base, shoul-der and ischiadic tubers and hip tubers and muscularity grade estimated basing on shoulder convexity, loin width, thigh convexity, thigh profile as well as rump convexity were high and statistically sig-nificant (p ≤ 0.01). Cow BCS examined on base of dewlap had the lower and not statistically significant influence on cow muscularity score. The highest coefficient between the BCS and the final muscular-ity score was found for BCS examined at shoulder (r = 0.501). It should be stated,
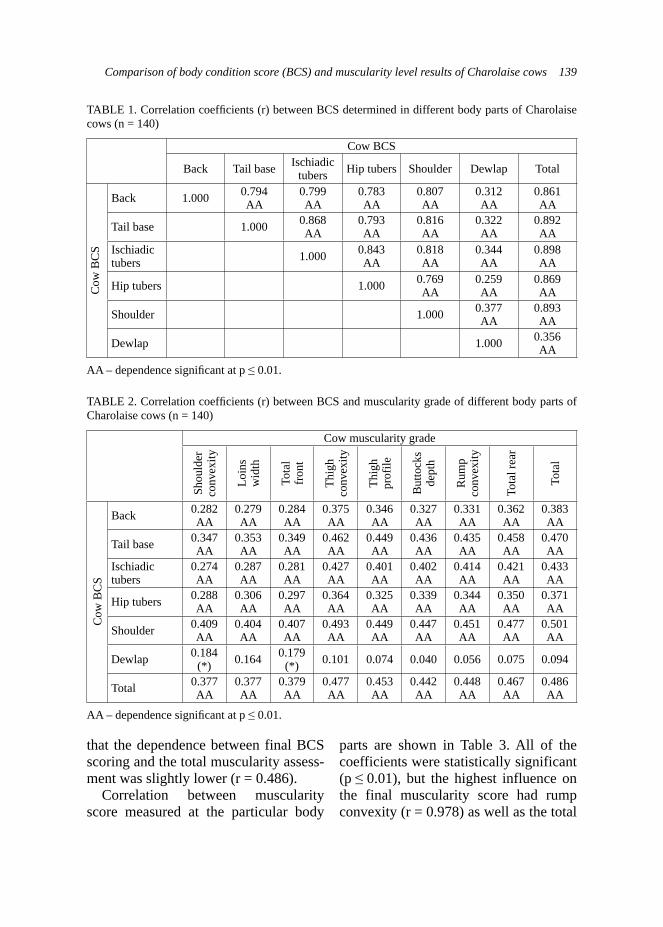
Comparison of body condition score (BCS) and muscularity level results of Charolaise cows 139
TABLE 1. Correlation coeffi cients (r) between BCS determined in different body parts of Charolaise cows (n = 140)
Cow BCS
Back Tail base Ischiadic tubers Hip tubers Shoulder Dewlap Total
Cow
BC
S
Back 1.000 0.794AA
0.799AA
0.783AA
0.807AA
0.312AA
0.861AA
Tail base 1.000 0.868AA
0.793AA
0.816AA
0.322AA
0.892AA
Ischiadic tubers 1.000 0.843
AA0.818AA
0.344AA
0.898AA
Hip tubers 1.000 0.769AA
0.259AA
0.869AA
Shoulder 1.000 0.377AA
0.893AA
Dewlap 1.000 0.356AA
AA – dependence signifi cant at p ≤ 0.01.
TABLE 2. Correlation coeffi cients (r) between BCS and muscularity grade of different body parts of Charolaise cows (n = 140)
Cow muscularity grade
Shou
lder
co
nvex
ity
Loin
s w
idth
Tota
l fr
ont
Thig
h co
nvex
ity
Thig
h pr
ofile
But
tock
s de
pth
Rum
p co
nvex
ity
Tota
l rea
r
Tota
l
Cow
BC
S
Back 0.282AA
0.279AA
0.284AA
0.375AA
0.346AA
0.327AA
0.331AA
0.362AA
0.383AA
Tail base 0.347AA
0.353AA
0.349AA
0.462AA
0.449AA
0.436AA
0.435AA
0.458AA
0.470AA
Ischiadic tubers
0.274AA
0.287AA
0.281AA
0.427AA
0.401AA
0.402AA
0.414AA
0.421AA
0.433AA
Hip tubers 0.288AA
0.306AA
0.297AA
0.364AA
0.325AA
0.339AA
0.344AA
0.350AA
0.371AA
Shoulder 0.409AA
0.404AA
0.407AA
0.493AA
0.449AA
0.447AA
0.451AA
0.477AA
0.501AA
Dewlap 0.184(*) 0.164 0.179
(*) 0.101 0.074 0.040 0.056 0.075 0.094
Total 0.377AA
0.377AA
0.379AA
0.477AA
0.453AA
0.442AA
0.448AA
0.467AA
0.486AA
AA – dependence signifi cant at p ≤ 0.01.
that the dependence between final BCS scoring and the total muscularity assess-ment was slightly lower (r = 0.486).
Correlation between muscularity score measured at the particular body
parts are shown in Table 3. All of the coefficients were statistically significant (p ≤ 0.01), but the highest influence on the final muscularity score had rump convexity (r = 0.978) as well as the total

140 T. Przysucha et al.
note for total rear (thigh convexity, thigh profile, buttocks depth, rump convexity) (r > 0.970).
CONCLUSIONS
− All the correlation coefficients of BCS measured in the particular body parts were high (from 0.861 to 0.898) and statistically significant (P ≤ 0.01).
− All the above mentioned coefficients examined on the front of neck (dewlap) appearance were much lower and not significant.
− The dependence between BCS in the particular parts of body and the final BCS result was proved (P ≤ 0.01).
− The highest correlation coefficient (r = 0.898) was found for the final BCS examined in the ischiadic tubers.
− All of the obtained correlation coef-ficients between cow BCS and cow muscularity were high (p ≤ 0.01).
− The highest correlation (r = 0.501) was observed between shoulder and the final musculature grade.
REFERENCES
BEVERLY J.R., 1985: Reproduction In beef cat-tle as related to nutrition and body condition. Kentacky roundup of reproductive efficiency in beef cattle, p. 1–2.
DADATI F.B., KENNEDY B.W., BURNSIDE E.B., 1985: Relationships between conforma-tion and reproduction in Holstein cows: type and calving performance. J. Dairy Sci. 68, 2639–2646.
DICKERSON G.E., 1978. Animal size and efficien-cy: basic concepts. Anim. Prod. 27, 367–379.
JASIOROWSKI H., KIJAK Z., POCZYNAJ-ŁO S., WAJDA S., 1996: Program rozwoju
TABLE 3. Correlation coeffi cients (r) between muscularity grade of Charolaise cows determined in different body parts (n = 140)
Cow muscularity grade
Shou
lder
co
nvex
ity
Loin
s w
idth
Tota
l fr
ont
Thig
h co
nvex
ity
Thig
h pr
ofile
But
tock
s de
pth
Rum
p co
nvex
ity
Tota
l rea
r
Tota
l
Cow
mus
cula
rity
grad
e
Shoulder convexity 1.000 0.977
AA0.997AA
0.622AA
0.638AA
0.606AA
0.609AA
0.635AA
0.620AA
Loins width 1.000 0.986AA
0.649AA
0.638AA
0.634AA
0.637AA
0.649AA
0.635AA
Total front 1.000 0.632AA
0.642AA
0.616AA
0.619AA
0.642AA
0.642AA
Thigh convexity 1.000 0.926
AA0.919AA
0.928AA
0.968AA
0.940AA
Thigh profile 1.000 0.958AA
0.949AA
0.981AA
0.965AA
Buttocks depth 1.000 0.990
AA0.979AA
0.978AA
Rump convexity 1.000 0.978
AA0.978AA
Total rear 1.000 0.970AA
AA – dependence signifi cant at p ≤ 0.01.
Comparison of body condition score (BCS) and muscularity level results of Charolaise cows 141
hodowli bydła mięsnego w Polsce, Fundacja „Rozwój SGGW”, 5–67.
McKIRNAN B., 2000: Frame scoring of beef cat-tle. Agfact A2.3.4. Department of Primary In-dustries, State of New South Wales, Australia.
MORRIS C.A., WILTON J.W., 1976: The influen-ce of body size on the biological efficiency of cows: A review. Can. Anim. Sci. 56: 613–647.
PRZYSUCHA T., 2009: Osobnicze uwarunkowa-nia przebiegu ocieleń krów oraz umięśnienia i żywotności cieląt pochodzących po buha-jach rasy piemontese użytkowanych w Polsce i we Włoszech. Rozprawa habilitacyjna. Wyd. SGGW, 1–136.
PRZYSUCHA T., GRODZKI H., 2004: Przydat-ność różnych ras bydła mięsnego do chowu w czystości rasy i krzyżowania towarowego. Mat. Konf. „Hodowla i produkcja bydła mię-snego”. Międzynarodowe Targi Poznańskie POLAGRA FARM, Poznań, 63–73.
RICHARDS M.W., SPITZER J.C., WARNER M.B., 1986: Effect of varying levels of postpar-tum nutrition and body condition at calving on subsequent reproductive performance in beef cattle. J. Anim. Sci. 62: 300–306.
SELK G.E., WETTEMANN R.P., LUSBY K.S., RASBY R.J., 1986: The importance of body condition at calving on reproduction in beef cows. OSO Agric. Exp. Sta. Publ. 118: 3163––3169.
WHITMAN R.W., REMMENGA E.E., WILT-BANK J.N., 1975: Weight change, condition and beef cow reproduction. J. Anim. Sci. 41: 387.
WILTBANK J.N., 1983: Maintenance of high level of reproductive performance in beef cow herd. Vet. Clin. N. Am. Large Anim. Proc. 5: 41–57.
Streszczenie: Porównanie wyników oceny kon-dycji (BCS) i oceny stopnia umięśnienia krów rasy Charolaise. Celem pracy było określenie
korelacji między wynikami oceny kondycji, a wynikami oceny stopnia umięśnienia krów mięsnej rasy charolaise. Wszystkie współczyn-niki korelacji między ocenami kondycji mierzo-nej w różnych partiach ciała były wysokie (od 0,861 do 0,898) i statystycznie istotne (p ≤ 0,01). Wszystkie współczynniki korelacji między oce-ną kondycji określanej wyglądem podgardla, a określanej na podstawie innych partii ciała były znacznie niższe, ale istotne. Stwierdzono istotną (p ≤ 0,01) zależność między ocenami kondycji w poszczególnych partiach ciała (poza podgar-dlem), a ostateczną (zbiorczą) oceną kondycji krowy. Najwyższy współczynnik korelacji z oce-ną ostateczną kondycji (r = 0,898) odnotowano dla kondycji ocenianej w guzach kulszowych. Wszystkie współczynniki korelacji między kon-dycją krowy ocenianą w różnych partiach ciała a stopniem umięśnienia krowy ocenianym na podstawie wypukłości barku, szerokości lędźwi, wypukłości i profilu uda oraz wypukłości zadu były wysokie i statystycznie istotne (p ≤ 0,01). Najwyższy współczynnik korelacji między oce-ną kondycji, a ostateczną oceną stopnia umię-śnienia odnotowano dla kondycji ocenianej na barku zwierzęcia (r = 0,501). Wszystkie współ-czynniki korelacji między szczegółowymi oce-nami stopnia umięśnienia krowy były wysokie i statystycznie istotne (p ≤ 0,01). Najwyższą ko-relację z ostateczną oceną stopnia umięśnienia miała ocena wypukłości zadu (r = 0,978).
MS. received August 2011
Authors’ address:Katedra Szczegółowej Hodowli Zwierząt – SGGWul. Ciszewskiego 802-786 WarszawaPolande-mail: [email protected]

Annals of Warsaw University of Life Sciences – SGGWAnimal Science No 49, 2011: 143–147(Ann. Warsaw Univ. of Life Sc. – SGGW, Anim. Sci. 49, 2011)
Comparison of body condition score (BCS) and muscularity level results of Limousine cows
TOMASZ PRZYSUCHA, HENRYK GRODZKI, MARCIN GOŁĘBIEWSKI, JAN SLÓSARZ Department of Animal Breeding, Warsaw University of Life Sciences – SGGW
Abstract: Comparison of body conditions score (BCS) and muscularity level results of Limousin cows. The aim of the study was to calculate the correlation between body condition score (BCS) and musculature score of Limousine cows. All the correlation coeffi cients of BCS measured in the particular body parts were high (from 0.742 to 0.884) and statistically signifi cant (P ≤ 0.01). All the above mentioned coeffi cients examined on the front of neck appearance were not signifi cant in comparison to those examined on the other parts of body. The dependence between BCS in the particu-lar parts of body (except front of the neck) and the fi nal BCS result was proved (P ≤ 0.01). The highest correlation coeffi cient (r = 0.920) was fund for the fi nal BCS examined in the ischiadic tubers. All of the obtained correlation coeffi cients between cow BCS and cow muscularity were high (p ≤ 0.01). The highest correlation coeffi cient (r = 0.631) be-tween BCS and the fi nal musculature score was noticed for BCS measured at the ischiadic tubers. All of the obtained correlation coeffi cients between the particular notes for cow musculature were high and statistically signifi cant (p ≤ 0.01). The highest correlation (r = 0.967) was observed between rump profi le and the fi nal musculature grade.
Key words: beef cattle, BCS, musculature score.
INTRODUCTION
The most important factors detemining beef cattle herd economy are the number
of good quality calves born each year and feeding costs of breeding herd. The number of calves born depends on fertil-ity results influenced by calving course depending on many factors, among which BCS and muscularity score are ones of the most important. Cow BCS is caused mainly by health status, mainte-nance system including feeding quality etc. (Selk et al., 1986; Jasiorowski et al., 1996; Dickerson, 1978). There are not enough papers (especially by Polish authors) concerning influence of BCS and muscularity level in the beef herds.
The aim of presented study was to determine correlation coefficients between BCS and muscularity examina-tion of Limousine beef cattle breed. BCS scale is mainly used to estimate energetic reserves of cow organism. The level of muscularity development (muscles width and profiles) is used for commercial assessment of slaughter quality. Since both above mentioned investigations are done at the same body parts, it would be worth to know the correlations between them. Higher than usually obtained coef-ficients could indicate, that the overfed cows are unjustly classified as the best muscular ones, whereas in practice the
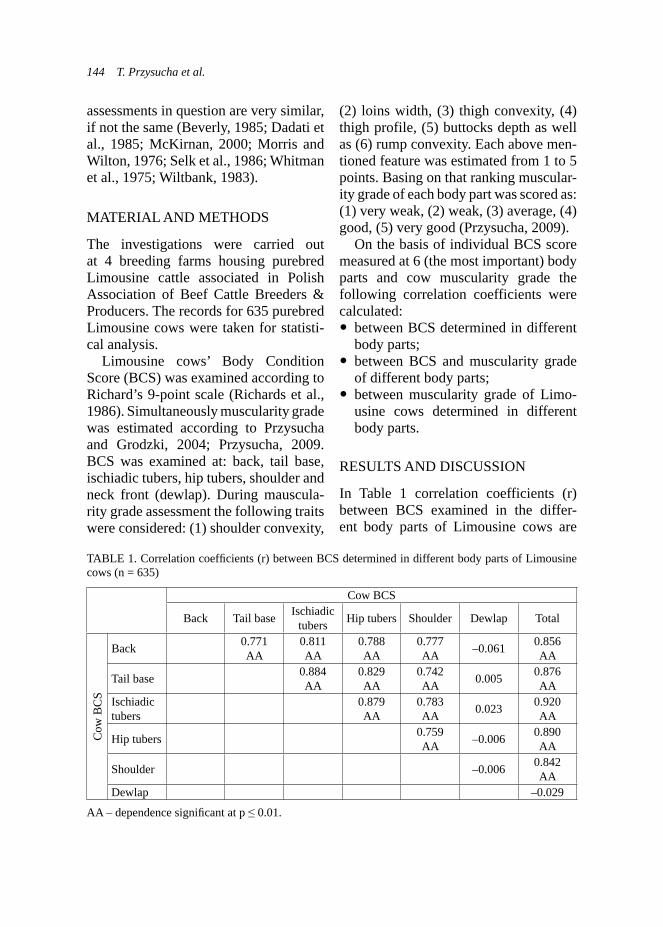
144 T. Przysucha et al.
assessments in question are very similar, if not the same (Beverly, 1985; Dadati et al., 1985; McKirnan, 2000; Morris and Wilton, 1976; Selk et al., 1986; Whitman et al., 1975; Wiltbank, 1983).
MATERIAL AND METHODS
The investigations were carried out at 4 breeding farms housing purebred Limousine cattle associated in Polish Association of Beef Cattle Breeders & Producers. The records for 635 purebred Limousine cows were taken for statisti-cal analysis.
Limousine cows’ Body Condition Score (BCS) was examined according to Richard’s 9-point scale (Richards et al., 1986). Simultaneously muscularity grade was estimated according to Przysucha and Grodzki, 2004; Przysucha, 2009. BCS was examined at: back, tail base, ischiadic tubers, hip tubers, shoulder and neck front (dewlap). During mauscula-rity grade assessment the following traits were considered: (1) shoulder convexity,
(2) loins width, (3) thigh convexity, (4) thigh profile, (5) buttocks depth as well as (6) rump convexity. Each above men-tioned feature was estimated from 1 to 5 points. Basing on that ranking muscular-ity grade of each body part was scored as: (1) very weak, (2) weak, (3) average, (4) good, (5) very good (Przysucha, 2009).
On the basis of individual BCS score measured at 6 (the most important) body parts and cow muscularity grade the following correlation coefficients were calculated:
between BCS determined in different body parts;
between BCS and muscularity grade of different body parts;
between muscularity grade of Limo-usine cows determined in different body parts.
RESULTS AND DISCUSSION
In Table 1 correlation coefficients (r) between BCS examined in the differ-ent body parts of Limousine cows are
TABLE 1. Correlation coeffi cients (r) between BCS determined in different body parts of Limousine cows (n = 635)
Cow BCS
Back Tail base Ischiadic tubers Hip tubers Shoulder Dewlap Total
Cow
BC
S
Back 0.771AA
0.811AA
0.788AA
0.777AA –0.061 0.856
AA
Tail base 0.884AA
0.829AA
0.742AA 0.005 0.876
AAIschiadic tubers
0.879AA
0.783AA 0.023 0.920
AA
Hip tubers 0.759AA –0.006 0.890
AA
Shoulder –0.006 0.842AA
Dewlap –0.029
AA – dependence signifi cant at p ≤ 0.01.

Comparison of body condition score (BCS) and muscularity level results of Limousine cows 145
presented. All correlation coefficients between BCS assessed at cow’s back, ischiadic tubers, hip tubers, tail base and shoulder were very high (from 0.742 to 0.884) and statistically significant (p ≤ 0.01).
All correlation coefficients between BCS assessed at cow’s dewlap and on the basis of other parts of the body were much lower and statistically not signifi-cant.
Significant (p ≤ 0.01) dependence between BCS measured in particu-lar body parts and the final BCS was noticed. The highest correlation coef-ficient between final BCS (r = 0.920) and the condition measured at ischiadic tubers was observed.
Table 2 shows correlation between BCS and muscularity grade of differ-ent body parts of Limousine cows. All correlation coefficients between BCS
assessed at cow’s back, tail base, shoul-der and ischiadic tubers and hip tubers and muscularity grade estimated basing on shoulder convexity, loin width, thigh convexity, thigh profile as well as rump convexity were high and statistically sig-nificant (p ≤ 0.01). Cow BCS examined on base of dewlap had the lower and not statistically significant influence on cow muscularity score. The highest coef-ficient between the BCS and the final muscularity score was found for BCS examined at ischiadic tubers(r = 0.631). It should be stated, that the dependence between BCS and the total muscularity assessment was even higher (r = 0.648).
Correlation between muscularity score measured at the particular body parts are shown in Table 3. All of the coefficients were statistically significant (p ≤ 0.01), but the highest influence on the final muscularity score had thigh
TABLE 2. Correlation coeffi cients (r) between BCS and muscularity grade of different body parts of Limousine cows (n = 635)
Cow muscularity grade
Shou
lder
co
nvex
ity
Loin
s w
idth
Tota
l fr
ont
Thig
h co
nvex
ity
Thig
h pr
ofile
But
tock
s de
pth
Rum
p co
nvex
ity
Tota
l rea
r
Tota
l
Cow
BC
S
Back 0.458AA
0.455AA
0.460AA
0.559AA
0.559AA
0.554AA
0.556AA
0.566AA
0.578AA
Tail base 0.443AA
0.452AA
0.448AA
0.610AA
0.597AA
0.589AA
0.596AA
0.609AA
0.614AA
Ischiadic tubers
0.452AA
0.458AA
0.457AA
0.625AA
0.611AA
0.614AA
0.621AA
0.627AA
0.631AA
Hip tubers
0.443AA
0.445AA
0.446AA
0.581AA
0.584AA
0.570AA
0.571AA
0.590AA
0.592AA
Shoulder 0.481AA
0.481AA
0.484AA
0.561AA
0.561AA
0.549AA
0.552AA
0.568AA
0.586AA
Dewlap 0.104AA –0.069 –0.097 0.04 –0.027 –0.007 0.009 –0.002 –0.030
Total 0.488AA
0.486AA
0.491AA
0.630AA
0.625AA
0.618AA
0.621AA
0.637AA
0.648AA
AA – dependence signifi cant at p ≤ 0.01.

146 T. Przysucha et al.
profile (r = 0.967) as well as the total note for total rear (thigh convexity, thigh profile, buttocks depth, rump convexity) (r = 0.979).
CONCLUSIONS
− All the correlation coefficients of BCS measured in the particular body parts were high (from 0.742 to 0.884) and statistically significant (P ≤ 0.01).
− All the above mentioned coefficients examined on the front of neck (dewlap) appearance were not significant .
− The dependence between BCS in the particular parts of body and the final BCS result was proved (P ≤ 0.01).
− The highest correlation coefficient (r = 0.920) was found for the final BCS examined in the ischiadic tubers.
− All of the obtained correlation coef-ficients between cow BCS and cow muscularity were high (p ≤ 0.01).
− The highest correlation (r = 0.967) was observed between thigh profile and the final musculature grade.
REFERENCES
BEVERLY J.R., 1985: Reproduction In beef cat-tle as related to nutrition and body condition. Kentacky roundup of reproductive efficiency in beef cattle, p. 1–2.
DADATI F.B., KENNEDY B.W., BURNSIDE E.B., 1985: Relationships between conforma-tion and reproduction in Holstein cows: type and calving performance. J. Dairy Sci. 68, 2639–2646.
DICKERSON G.E., 1978: Animal size and effic-iency: basic concepts. Anim. Prod. 27, 367–379.
JASIOROWSKI H., KIJAK Z., POCZYNAJ-ŁO S., WAJDA S., 1996: Program rozwoju
TABLE 3. Correlation coeffi cients (r) between muscularity grade of Limousine cows determined in different body parts (n = 635)
Cow muscularity grade
Shou
lder
co
nvex
ity
Loin
s w
idth
Tota
l fr
ont
Thig
h co
nvex
ity
Thig
h pr
ofile
But
tock
s de
pth
Rum
p co
nvex
ity
Tota
l rea
r
Tota
l
Cow
mus
cula
rity
grad
e
Shoulder convexity
0.962AA
0.998AA
0.606AA
0.618AA
0.597AA
0.578AA
0.620AA
0.736AA
Loins width 0.976AA
0.624AA
0.620AA
0.603AA
0.598AA
0.626AA
0.736AA
Total front 0.614AA
0.623AA
0.602AA
0.586AA
0.625AA
0.741AA
Thigh convexity
0.944AA
0.949AA
0.954AA
0.977AA
0.959AA
Thigh profile 0.972AA
0.967AA
0.987AA
0.967AA
Buttocks depth
0.984AA
0.982AA
0.961AA
Rump convexity
0.981AA
0.958AA
Total rear 0.979AA
AA – dependence signifi cant at p ≤ 0.01.
Comparison of body condition score (BCS) and muscularity level results of Limousine cows 147
hodowli bydła mięsnego w Polsce, Fundacja “Rozwój SGGW”, 5–67.
McKIRNAN B., 2000: Frame scoring of beef cattle. Agfact A2.3.4. Department of Primary Industries, State of New South Wales, Australia.
MORRIS C.A., WILTON J.W., 1976: The influ-ence of body size on the biological efficiency of cows: A review. Can. Anim. Sci. 56: 613–647
PRZYSUCHA T., 2009: Osobnicze uwarunkowa-nia przebiegu ocieleń krów oraz umięśnienia i żywotności cieląt pochodzących po buha-jach rasy piemontese użytkowanych w Polsce i we Włoszech. Rozprawa habilitacyjna. Wyd. SGGW, 1–136.
PRZYSUCHA T., GRODZKI H., 2004: Przydat-ność różnych ras bydła mięsnego do chowu w czystości rasy i krzyżowania towarowego. Mat. Konf. „Hodowla i produkcja bydła mię-snego”. Międzynarodowe Targi Poznańskie POLAGRA FARM, Poznań, 63–73.
RICHARDS M.W., SPITZER J.C., WARNER M.B., 1986: Effect of varying levels of postpar-tum nutrition and body condition at calving on subsequent reproductive performance in beef cattle. J. Anim. Sci. 62: 300–306.
SELK G.E., WETTEMANN R.P., LUSBY K.S., RASBY R.J., 1986: The importance of body condition at calving on reproduction in beef cows. OSO Agric. Exp. Sta. Publ. 118: 3163––3169.
WHITMAN R.W., REMMENGA E.E., WILT-BANK J.N., 1975: Weight change, condition and beef cow reproduction. J. Anim. Sci. 41: 387.
WILTBANK J.N., 1983: Maintenance of high level of reproductive performance in beef cow herd. Vet. Clin. N. Am. Large Anim. Proc. 5: 41–57.
Streszczenie: Porównanie wyników oceny kon-dycji (BCS) i oceny stopnia umięśnienia krów rasy Limousin. Celem pracy było określenie ko-
relacji między wynikami oceny kondycji a wy-nikami oceny stopnia umięśnienia krów mięsnej rasy limousin. Wszystkie współczynniki korela-cji między ocenami kondycji mierzonej w róż-nych partiach ciała były wysokie (od 0,742 do 0,884) i statystycznie istotne (p ≤ 0,01). Wszyst-kie współczynniki korelacji między oceną kon-dycji określanej wyglądem podgardla, a okre-ślanej na podstawie innych partii ciała, były bliskie zeru i nieistotne. Stwierdzono istotną (p ≤ 0,01) zależność między ocenami kondycji w poszczególnych partiach ciała (poza podgar-dlem) a ostateczną (zbiorczą) oceną kondycji krowy. Najwyższy współczynnik korelacji z oce-ną ostateczną kondycji (r = 0,920) odnotowano dla kondycji ocenianej w guzach kulszowych. Wszystkie współczynniki korelacji między kon-dycją krowy ocenianą w różnych partiach ciała a stopniem umięśnienia krowy ocenianym na podstawie wypukłości barku, szerokości lędźwi, wypukłości i profilu uda oraz wypukłości zadu były wysokie i statystycznie istotne (p ≤ 0,01). Najwyższy współczynnik korelacji między oce-ną kondycji a ostateczną oceną stopnia umię-śnienia odnotowano dla kondycji ocenianej w guzach kulszowych (r = 0,631). Wszystkie współczynniki korelacji między szczegółowymi ocenami stopnia umięśnienia krowy były wyso-kie i statystycznie istotne (p ≤ 0,01). Najwyższą korelację z ostateczną oceną stopnia umięśnienia miała ocena profilu uda (r = 0,967).
MS. received August 2011
Authors’ address:Katedra Szczegółowej Hodowli Zwierząt – SGGWul. Ciszewskiego 802-786 WarszawaPolande-mail: [email protected]

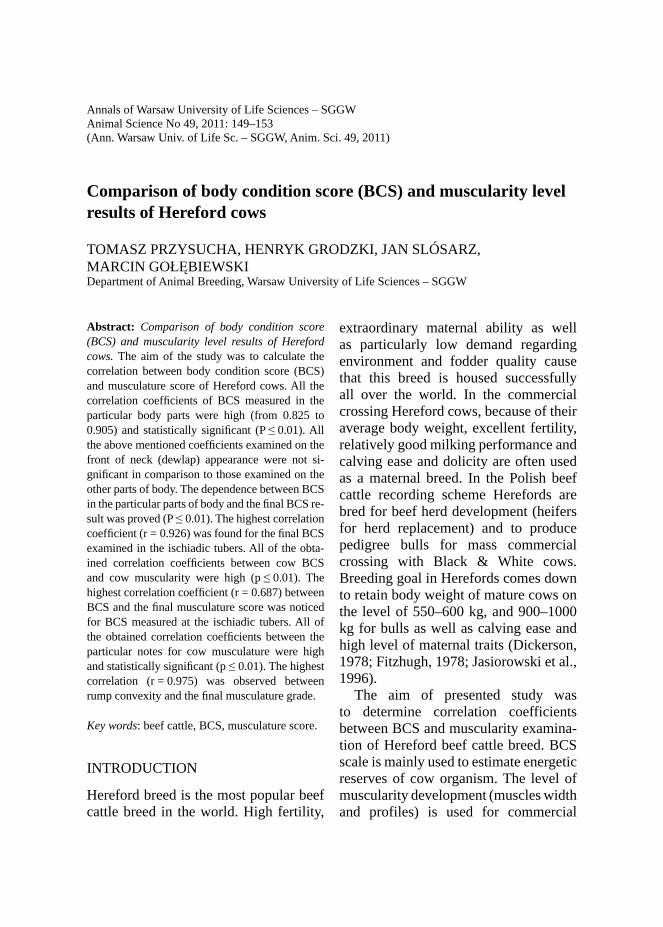
Annals of Warsaw University of Life Sciences – SGGWAnimal Science No 49, 2011: 149–153(Ann. Warsaw Univ. of Life Sc. – SGGW, Anim. Sci. 49, 2011)
Comparison of body condition score (BCS) and muscularity level results of Hereford cows
TOMASZ PRZYSUCHA, HENRYK GRODZKI, JAN SLÓSARZ,MARCIN GOŁĘBIEWSKIDepartment of Animal Breeding, Warsaw University of Life Sciences – SGGW
Abstract: Comparison of body condition score (BCS) and muscularity level results of Hereford cows. The aim of the study was to calculate the correlation between body condition score (BCS) and musculature score of Hereford cows. All the correlation coeffi cients of BCS measured in the particular body parts were high (from 0.825 to 0.905) and statistically signifi cant (P ≤ 0.01). All the above mentioned coeffi cients examined on the front of neck (dewlap) appearance were not si-gnifi cant in comparison to those examined on the other parts of body. The dependence between BCS in the particular parts of body and the fi nal BCS re-sult was proved (P ≤ 0.01). The highest correlation coeffi cient (r = 0.926) was found for the fi nal BCS examined in the ischiadic tubers. All of the obta-ined correlation coeffi cients between cow BCS and cow muscularity were high (p ≤ 0.01). The highest correlation coeffi cient (r = 0.687) between BCS and the fi nal musculature score was noticed for BCS measured at the ischiadic tubers. All of the obtained correlation coeffi cients between the particular notes for cow musculature were high and statistically signifi cant (p ≤ 0.01). The highest correlation (r = 0.975) was observed between rump convexity and the fi nal musculature grade.
Key words: beef cattle, BCS, musculature score.
INTRODUCTION
Hereford breed is the most popular beef cattle breed in the world. High fertility,
extraordinary maternal ability as well as particularly low demand regarding environment and fodder quality cause that this breed is housed successfully all over the world. In the commercial crossing Hereford cows, because of their average body weight, excellent fertility, relatively good milking performance and calving ease and dolicity are often used as a maternal breed. In the Polish beef cattle recording scheme Herefords are bred for beef herd development (heifers for herd replacement) and to produce pedigree bulls for mass commercial crossing with Black & White cows. Breeding goal in Herefords comes down to retain body weight of mature cows on the level of 550–600 kg, and 900–1000 kg for bulls as well as calving ease and high level of maternal traits (Dickerson, 1978; Fitzhugh, 1978; Jasiorowski et al., 1996).
The aim of presented study was to determine correlation coefficients between BCS and muscularity examina-tion of Hereford beef cattle breed. BCS scale is mainly used to estimate energetic reserves of cow organism. The level of muscularity development (muscles width and profiles) is used for commercial

150 T. Przysucha et al.
assessment of slaughter quality. Since both above mentioned investigations are done at the same body parts, it would be worth to know the correlations between them. Higher than usually obtained coe-fficients could indicate, that the overfed cows are unjustly classified as the best muscular ones, whereas in practice the assessments in question are very similar, if not the same (Beverly, 1985; Dadati et al., 1985; McKirnan, 2000; Morris and Wilton, 1976; 1977; Selk et al., 1986; Whitman et al., 1975; Wiltbank, 1983).
MATERIAL AND METHODS
The investigations were carried out at 3 breeding farms housing purebred Her-eford cattle associated in Polish Associa-tion of Beef Cattle Breeders & Producers. The records for 635 purebred Hereford cows were taken for statistical analysis. Hereford cows’ Body Condition Score (BCS) was examined according to Rich-ard’s 9-point scale (Richards et al., 1986). Simultaneously muscularity grade was estimated according to Przysucha, 1998; Przysucha et al., 2002; Przysucha, 2009. BCS was examined at: back, tail base, ischiadic tubers, hip tubers, shoulder and neck front (dewlap). During muscularity grade assessment the following traits were considered: (1) shoulder convexity, (2) loins width, (3) thigh convexity, (4) thigh profile, (5) buttocks depth as well as (6) rump convexity. Each above mentioned feature was estimated from 1 to 5 points. Basing on that ranking muscularity grade of each body part was scored as: (1) very weak, (2) weak, (3) average, (4) good, (5) very good (Przysucha, 2009).
On the basis of individual BCS score measured at 6 (the most important) body
parts and cow muscularity grade the following correlation coefficients were calculated:
between BCS determined in different body parts;
between BCS and muscularity grade of different body parts;
between muscularity grade of Her-eford cows determined in different body parts.
RESULTS AND DISCUSSION
In Table 1 correlation coefficients (r) between BCS examined in the different body parts of Hereford cows are present-ed. All correlation coefficients between BCS assessed at cow’s back, ischiadic tubers, hip tubers, tail base and shoulder were very high (from 0.742 to 0.884) and statistically significant (p ≤ 0.01).
All correlation coefficients between BCS assessed at cow’s dewlap and on the basis of other parts of the body were much lower, but statistically significant.
Significant (p ≤ 0.01) dependence between BCS measured in particu-lar body parts and the final BCS was noticed. The highest correlation coef-ficient between final BCS (r = 0.926) and the condition measured at ischiadic tubers was observed.
Table 2 shows correlation between BCS and muscularity grade of differ-ent body parts of Hereford cows. All correlation coefficients between BCS assessed at cow’s back, tail base, shoul-der and ischiadic tubers and hip tubers and muscularity grade estimated basing on shoulder convexity, loin width, thigh convexity, thigh profile as well as rump convexity were high and statisti-cally significant (p ≤ 0.01). Cow BCS
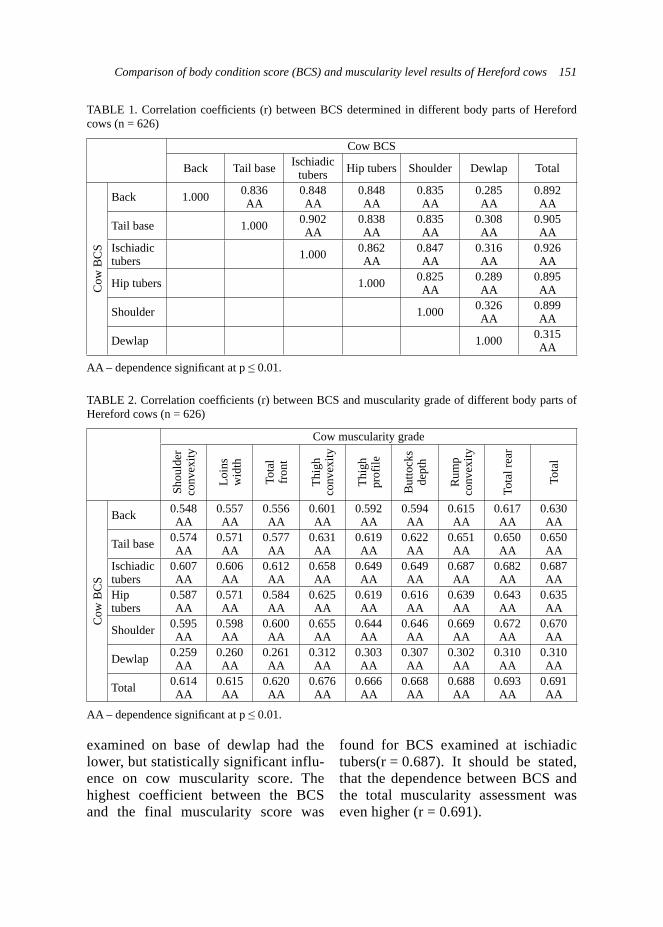
Comparison of body condition score (BCS) and muscularity level results of Hereford cows 151
TABLE 1. Correlation coeffi cients (r) between BCS determined in different body parts of Hereford cows (n = 626)
Cow BCS
Back Tail base Ischiadic tubers Hip tubers Shoulder Dewlap Total
Cow
BC
S
Back 1.000 0.836AA
0.848AA
0.848AA
0.835AA
0.285AA
0.892AA
Tail base 1.000 0.902AA
0.838AA
0.835AA
0.308AA
0.905AA
Ischiadic tubers 1.000 0.862
AA0.847AA
0.316AA
0.926AA
Hip tubers 1.000 0.825AA
0.289AA
0.895AA
Shoulder 1.000 0.326AA
0.899AA
Dewlap 1.000 0.315AA
AA – dependence signifi cant at p ≤ 0.01.
TABLE 2. Correlation coeffi cients (r) between BCS and muscularity grade of different body parts of Hereford cows (n = 626)
Cow muscularity grade
Shou
lder
co
nvex
ity
Loin
s w
idth
Tota
l fr
ont
Thig
h co
nvex
ity
Thig
h pr
ofile
But
tock
s de
pth
Rum
p co
nvex
ity
Tota
l rea
r
Tota
l
Cow
BC
S
Back 0.548AA
0.557AA
0.556AA
0.601AA
0.592AA
0.594AA
0.615AA
0.617AA
0.630AA
Tail base 0.574AA
0.571AA
0.577AA
0.631AA
0.619AA
0.622AA
0.651AA
0.650AA
0.650AA
Ischiadic tubers
0.607AA
0.606AA
0.612AA
0.658AA
0.649AA
0.649AA
0.687AA
0.682AA
0.687AA
Hip tubers
0.587AA
0.571AA
0.584AA
0.625AA
0.619AA
0.616AA
0.639AA
0.643AA
0.635AA
Shoulder 0.595AA
0.598AA
0.600AA
0.655AA
0.644AA
0.646AA
0.669AA
0.672AA
0.670AA
Dewlap 0.259AA
0.260AA
0.261AA
0.312AA
0.303AA
0.307AA
0.302AA
0.310AA
0.310AA
Total 0.614AA
0.615AA
0.620AA
0.676AA
0.666AA
0.668AA
0.688AA
0.693AA
0.691AA
AA – dependence signifi cant at p ≤ 0.01.
examined on base of dewlap had the lower, but statistically significant influ-ence on cow muscularity score. The highest coefficient between the BCS and the final muscularity score was
found for BCS examined at ischiadic tubers(r = 0.687). It should be stated, that the dependence between BCS and the total muscularity assessment was even higher (r = 0.691).

152 T. Przysucha et al.
Correlation between muscularity score measured at the particular body parts are shown in Table 3. All of the coefficients were statistically significant (p ≤ 0.01), but the highest influence on the final muscularity score had rump convexity (r = 0.980) as well as the total note for total rear (thigh convexity, thigh profile, but-tocks depth, rump convexity) (r = 0.975).
CONCLUSIONS
− All the correlation coefficients of BCS measured in the particular body parts were high (from 0.892 to 0.905) and statistically significant (P ≤ 0.01).
− All the above mentioned coeffi-cients examined on the front of neck (dewlap) appearance were not signifi-cant in comparison to those examined on the other parts of body.
− The dependence between BCS in the particular parts of body and the final BCS result was proved (P ≤ 0.01).
− The highest correlation coefficient (r = 0.926) was found for the final BCS examined in the ischiadic tubers.
− All of the obtained correlation coef-ficients between cow BCS and cow muscularity were high (p ≤ 0.01).
− The highest correlation (r = 0.975) was observed between rump convex-ity and the final musculature grade.
REFERENCES
BEVERLY J.R., 1985: Reproduction In beef cat-tle as related to nutrition and body condition. Kentacky roundup of reproductive efficiency in beef cattle, p. 1–2.
DADATI F.B., KENNEDY B.W., BURNSIDE E.B., 1985: Relationships between conforma-tion and reproduction in Holstein cows: type
TABLE 3. Correlation coeffi cients (r) between muscularity grade of Hereford cows determined in dif-ferent body parts (n = 626)
Cow muscularity grade
Shou
lder
conv
exity
Loin
s w
idth
Tota
lfr
ont
Thig
h co
nvex
ity
Thig
h pr
ofile
But
tock
s de
pth
Rum
p co
nvex
ity
Tota
lre
ar
Tota
l
Cow
mus
cula
rity
grad
e
Shoulder convexity 1.000 0.951
AA0.990AA
0.825AA
0.842AA
0.837AA
0.795AA
0.827AA
0.870AA
Loins width 1.000 0.983
AA0.834AA
0.843AA
0.839AA
0.822AA
0.841AA
0.843AA
Total front 1.000 0.837
AA0.851AA
0.846AA
0.812AA
0.840AA
0.834AA
Thigh convexity 1.000 0.978
AA0.979AA
0.930AA
0.975AA
0.971AA
Thigh profile 1.000 0.992
AA0.925AA
0.975AA
0.970AA
Buttocks depth 1.000 0.929
AA0.976AA
0.969AA
Rump convexity 1.000 0.980
AA0.980AA
Total rear 1.000 0.975AA
AA – dependence signifi cant at p ≤ 0.01.
Comparison of body condition score (BCS) and muscularity level results of Hereford cows 153
and calving performance. J. Dairy Sci. 68, 2639–2646.
DICKERSON G.E., 1978: Animal size and effi-ciency: basic concepts. Anim. Prod. 27, 367––379.
FITZHUGH H.A., 1978: Animal size and effi-ciency, with special reference to the breeding female. Anim. Prod. 27, 393–401.
JASIOROWSKI H., KIJAK Z., POCZYNAJ-ŁO S., WAJDA S., 1996: Program rozwoju hodowli bydła mięsnego w Polsce, Fundacja „Rozwój SGGW”, 5–67.
McKIRNAN B., 2000: Frame scoring of beef cat-tle. Agfact A2.3.4. Department of Primary In-dustries, State of New South Wales, Australia.
MORRIS C.A., WILTON J.W., 1976: The influ-ence of body size on the biological efficiency of cows: A review. Can. Anim. Sci. 56: 613–647.
MORRIS C.A., WILTON J.W., 1977: The influence of body size on the economic efficiency of cows. A review. Anim. Breed. Abstr. 45, 39–153.
PRZYSUCHA T., 1998: Hodowla rodzimych ras bydła mięsnego we Włoszech. Wyd. SGGW, Warszawa.
PRZYSUCHA T., 2009: Osobnicze uwarunkowa-nia przebiegu ocieleń krów oraz umięśnienia i żywotności cieląt pochodzących po buha-jach rasy piemontese użytkowanych w Polsce i we Włoszech. Rozprawa habilitacyjna. Wyd. SGGW, 1–136.
PRZYSUCHA T., GRODZKI H., FAROPPA V., STOPYRA R., ZDZIARSKI K., 2002: Wzorce oceny umięśnienia cieląt pochodzących z krzy-żowania krów czarno-białych z buhajami wło-skiej rasy piemontese. Przegląd Hodowlany 2, 12–14.
RICHARDS M.W., SPITZER J.C., WARNER M.B., 1986: Effect of varying levels of postpar-tum nutrition and body condition at calving on subsequent reproductive performance in beef cattle. J. Anim. Sci. 62: 300–306.
SELK G.E., WETTEMANN R.P., LUSBY K.S., RASBY R.J., 1986: The importance of body condition at calving on reproduction in beef cows. OSO Agric. Exp. Sta. Publ. 118: 3163––3169.
WHITMAN R.W., REMMENGA E.E., WILT-BANK J.N., 1975: Weight change, condition and beef cow reproduction. J. Anim. Sci. 41: 387.
WILTBANK J.N., 1983: Maintenance of high level of reproductive performance in beef cow herd. Vet. Clin. N. Am. Large Anim. Proc. 5: 41–57.
Streszczenie: Porównanie wyników oceny kon-dycji (BCS) i oceny stopnia umięśnienia krów rasy hereford. Celem pracy było określenie ko-relacji między wynikami oceny kondycji, a wy-nikami oceny stopnia umięśnienia krów mięsnej rasy hereford. Wszystkie współczynniki korela-cji między ocenami kondycji mierzonej w róż-nych partiach ciała były wysokie (od 0,892 do 0,905) i statystycznie istotne (p ≤ 0,01). Wszyst-kie współczynniki korelacji między oceną kon-dycji określanej wyglądem podgardla, a okre-ślanej na podstawie innych partii ciała były znacznie niższe, ale istotne. Stwierdzono istotną (p ≤ 0,01) zależność między ocenami kondycji w poszczególnych partiach ciała (poza podgar-dlem), a ostateczną (zbiorczą) oceną kondycji krowy. Najwyższy współczynnik korelacji z oce-ną ostateczną kondycji (r = 0,926) odnotowano dla kondycji ocenianej w guzach kulszowych. Współczynniki korelacji między kondycją krowy ocenianą w różnych partiach ciała, a stopniem umięśnienia krowy ocenianym na podstawie wy-pukłości barku, szerokości lędźwi, wypukłości i profilu uda oraz wypukłości zadu były wyso-kie i statystycznie istotne (p ≤ 0,01). Najwyższy współczynnik korelacji między oceną kondycji, a ostateczną oceną stopnia umięśnienia odnoto-wano dla kondycji ocenianej w guzach kulszo-wych (r = 0,687). Wszystkie współczynniki ko-relacji między szczegółowymi ocenami stopnia umięśnienia krowy były wysokie i statystycznie istotne (p ≤ 0,01). Najwyższą korelację z osta-teczną oceną stopnia umięśnienia miała ocena wypukłości zadu (r = 0,980).
MS. received August 2011
Authors’ address:Katedra Szczegółowej Hodowli Zwierząt – SGGWul. Ciszewskiego 802-786 WarszawaPolande-mail: [email protected]

Annals of Warsaw University of Life Sciences – SGGWAnimal Science No 49, 2011: 155–161(Ann. Warsaw Univ. of Life Sc. – SGGW, Anim. Sci. 49, 2011)
The coat characteristic of yak maintained in conditionsof the Gdańsk zoological garden
AURELIA RADZIK-RANT, DOROTA MAKOWIECKA, WITOLD RANT,AGNIESZKA ROZBICKA-WIECZOREKDepartament od Sheep and Goat Breeding, Warsaw University of Life Scence – SGGW
Abstract: The coat characteristic of yak mainta-ined in conditions of the Gdańsk zoological gar-den. The investigation concerned the analysis of chosen coat features of yak maintained in totally different environment than they naturally exists. The study has been carried out on all adult yak in-dividuals (4 females and 4 males) kept in Gdańsk zoological garden The coat samples have been ta-ken in autumn form middle of the left side of ani-mal to determine the proportion of hair fractions, length and fi bre thickness within fraction, fi bre surface features and cross section. The fractions were separated based on the length of the fi bre wi-thin sample. Proportion of fraction was calculated from the fi bre number within it. Fibre diameter of each fraction has been measured using micropro-jection method. The fraction length was determi-nated measuring fi bre bunches with accuracy to 0.5 cm. The scales on the fi bre surface as well as shape of cross-section were observed using scan-ning microscope. Two fi bre fractions were deter-minated: coarse hair (25%) and mid-type fi bres (75%). The down fi bres has not been found. The diameter of coarse hair and mid-type fraction ave-raged out 58.21 μm and 36.52 μm respectively. The coarse hair thickness in males was greater than in females (P < 0.01). Fibres belonging to mid-type fraction were characterized by clear sca-les and more regular, circular shape. In coarse hair disappearance of scales, medullation and eliptical cross section has been recorded. The coarse hair fraction was much longer than mid-type fi bres (P ≤ 0.01). There was not statistical difference in fraction length depending on sex of animals.
Key words: yak, environment, coarse hair, mid-type fi bres, fi bre thickness, fi bre length.
INTRODUCTION
The yak (Peophagus grunniens or Bos grunniens) are found on the plateau of western China in alpine and subalpine regions, at altitudes from 2000 to 5000 m with a cold, semi-humid climate. The greatest density of the yak appears in Qinghai-Tibetan Plateau (Miller, 1990).
The population of those animals in Chinese territories is estimated to exceed 13 million. The majority of them are do-mesticated. As wild animals they occur in Tibetan highland. About 1-milion yaks exists in other Asiatic countries (Wiener et al., 2003). However, they are also present in North America in zoological parks and in many European countries in zoological gardens.
The yak are very good adopted to extreme environmental conditions like: very low temperature, high altitude with low oxygen content of the air, high solar radiation and cyclical nutrition with short growing season for herbage. The compact conformation, large lungs, heart and rumen relative to yak body size
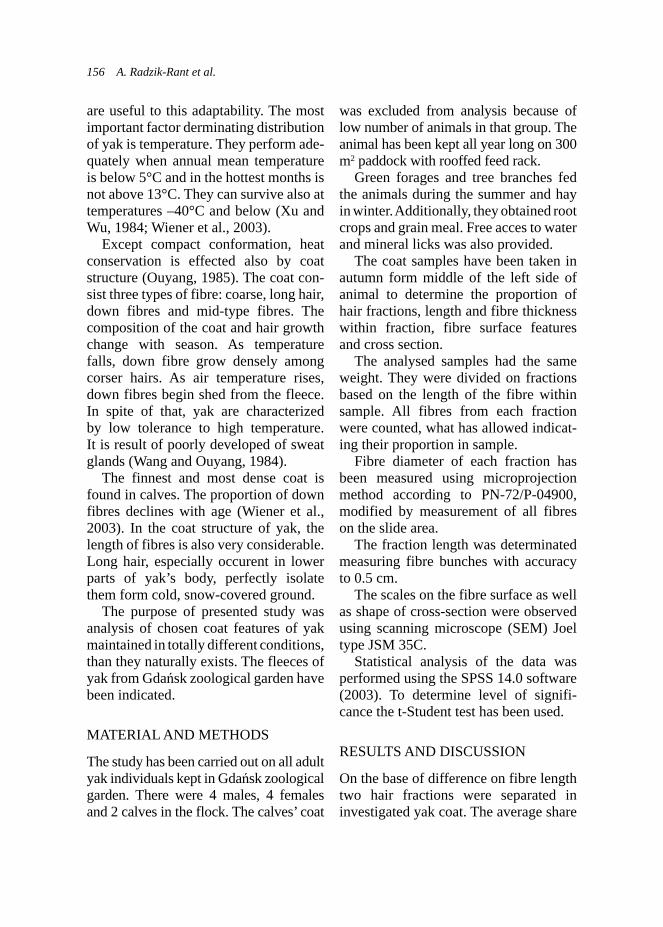
156 A. Radzik-Rant et al.
are useful to this adaptability. The most important factor derminating distribution of yak is temperature. They perform ade-quately when annual mean temperature is below 5°C and in the hottest months is not above 13°C. They can survive also at temperatures –40°C and below (Xu and Wu, 1984; Wiener et al., 2003).
Except compact conformation, heat conservation is effected also by coat structure (Ouyang, 1985). The coat con-sist three types of fibre: coarse, long hair, down fibres and mid-type fibres. The composition of the coat and hair growth change with season. As temperature falls, down fibre grow densely among corser hairs. As air temperature rises, down fibres begin shed from the fleece. In spite of that, yak are characterized by low tolerance to high temperature. It is result of poorly developed of sweat glands (Wang and Ouyang, 1984).
The finnest and most dense coat is found in calves. The proportion of down fibres declines with age (Wiener et al., 2003). In the coat structure of yak, the length of fibres is also very considerable. Long hair, especially occurent in lower parts of yak’s body, perfectly isolate them form cold, snow-covered ground.
The purpose of presented study was analysis of chosen coat features of yak maintained in totally different conditions, than they naturally exists. The fleeces of yak from Gdańsk zoological garden have been indicated.
MATERIAL AND METHODS
The study has been carried out on all adult yak individuals kept in Gdańsk zoological garden. There were 4 males, 4 females and 2 calves in the flock. The calves’ coat
was excluded from analysis because of low number of animals in that group. The animal has been kept all year long on 300 m2 paddock with rooffed feed rack.
Green forages and tree branches fed the animals during the summer and hay in winter. Additionally, they obtained root crops and grain meal. Free acces to water and mineral licks was also provided.
The coat samples have been taken in autumn form middle of the left side of animal to determine the proportion of hair fractions, length and fibre thickness within fraction, fibre surface features and cross section.
The analysed samples had the same weight. They were divided on fractions based on the length of the fibre within sample. All fibres from each fraction were counted, what has allowed indicat-ing their proportion in sample.
Fibre diameter of each fraction has been measured using microprojection method according to PN-72/P-04900, modified by measurement of all fibres on the slide area.
The fraction length was determinated measuring fibre bunches with accuracy to 0.5 cm.
The scales on the fibre surface as well as shape of cross-section were observed using scanning microscope (SEM) Joel type JSM 35C.
Statistical analysis of the data was performed using the SPSS 14.0 software (2003). To determine level of signifi-cance the t-Student test has been used.
RESULTS AND DISCUSSION
On the base of difference on fibre length two hair fractions were separated in investigated yak coat. The average share
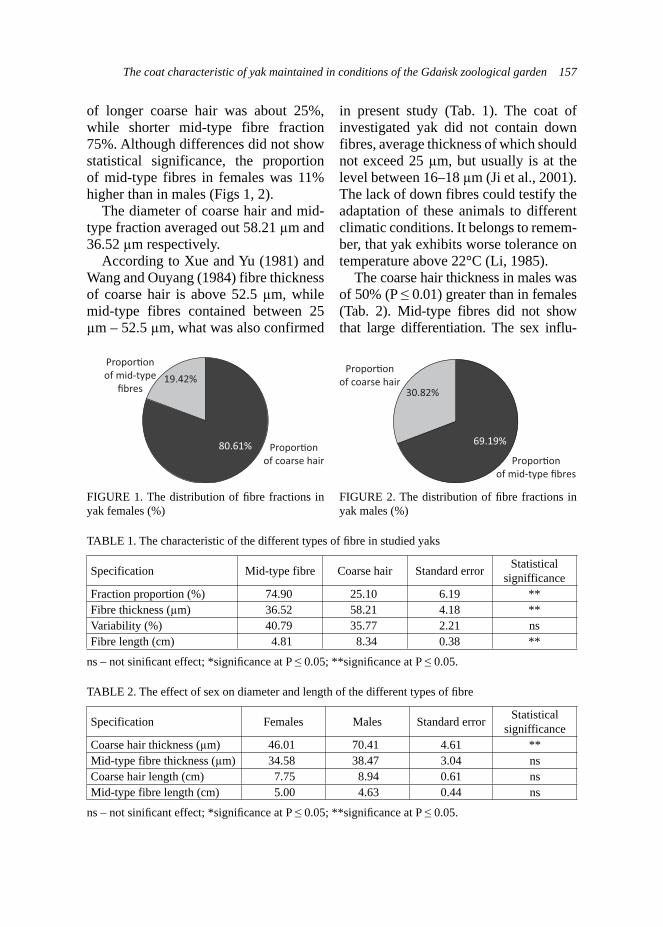
The coat characteristic of yak maintained in conditions of the Gdańsk zoological garden 157
of longer coarse hair was about 25%, while shorter mid-type fibre fraction 75%. Although differences did not show statistical significance, the proportion of mid-type fibres in females was 11% higher than in males (Figs 1, 2).
The diameter of coarse hair and mid-type fraction averaged out 58.21 μm and 36.52 μm respectively.
According to Xue and Yu (1981) and Wang and Ouyang (1984) fibre thickness of coarse hair is above 52.5 μm, while mid-type fibres contained between 25 μm – 52.5 μm, what was also confirmed
80.61%
19.42%
Propor�onof mid-type
fibres
Propor�onof coarse hair
FIGURE 1. The distribution of fi bre fractions in yak females (%)
69.19%
30.82%
Propor�onof mid-type fibres
Propor�onof coarse hair
FIGURE 2. The distribution of fi bre fractions in yak males (%)
in present study (Tab. 1). The coat of investigated yak did not contain down fibres, average thickness of which should not exceed 25 μm, but usually is at the level between 16–18 μm (Ji et al., 2001). The lack of down fibres could testify the adaptation of these animals to different climatic conditions. It belongs to remem-ber, that yak exhibits worse tolerance on temperature above 22°C (Li, 1985).
The coarse hair thickness in males was of 50% (P ≤ 0.01) greater than in females (Tab. 2). Mid-type fibres did not show that large differentiation. The sex influ-
TABLE 1. The characteristic of the different types of fi bre in studied yaks
Specification Mid-type fibre Coarse hair Standard error Statistical signifficance
Fraction proportion (%) 74.90 25.10 6.19 **Fibre thickness (μm) 36.52 58.21 4.18 **Variability (%) 40.79 35.77 2.21 nsFibre length (cm) 4.81 8.34 0.38 **
ns – not sinifi cant effect; *signifi cance at P ≤ 0.05; **signifi cance at P ≤ 0.05.
TABLE 2. The effect of sex on diameter and length of the different types of fi bre
Specification Females Males Standard error Statistical signifficance
Coarse hair thickness (μm) 46.01 70.41 4.61 **Mid-type fibre thickness (μm) 34.58 38.47 3.04 nsCoarse hair length (cm) 7.75 8.94 0.61 nsMid-type fibre length (cm) 5.00 4.63 0.44 ns
ns – not sinifi cant effect; *signifi cance at P ≤ 0.05; **signifi cance at P ≤ 0.05.

158 A. Radzik-Rant et al.
ence on this trait has been confirmed also by Zhang (1977) and Xue and Yu (1981).
The variability of fibre thickness was similar in both seperated fractions. But mid-type fibres had worse equalization in
comparison to coarse hair (Tab. 1). It indi-cates the dificulty in proper separation of fibres, what demonstrate dispersion curve of fibre thickness (Figs 3, 4). If not diff-erence in length between fractions mid-
coarse hair
mid-type fibres
0
2
4
6
8
10
12
14
16
11 13 15 17 19 21 23 25 27 29 31 33 35 37 39 41 43 45 47 49 51 53 55 57 59 61 63 65 67 69 71 73 75 77 79 81Diameter (microns)
%
FIGURE 3. Variation in fi bre diameter within studied fractions
coarse hair
mid-type fibres
0
2
4
6
8
10
12
13 15 17 19 2321 25 27 29 31 33 35 37 39 41 43 45 47 49 51 53 55 57 59 61 63 65 67 69 71 73 75 77 79 81 83 85 87 89 91Diameter (microns)
%
FIGURE 4. Variation in fi bre diameter within studied fractions

The coat characteristic of yak maintained in conditions of the Gdańsk zoological garden 159
PHOTOGRAPH 1. The scale on the surface of the mid-type fi bre (phot. D. Makowiecka)
PHOTOGRAPH 2. The scale on the surface of the coarse hair (phot. D. Makowiecka)
PHOTOTOGRAPH 3. Cross-section of mid-type of fi bres (phot. D. Makowiecka)
PHOTOGRAPH 4. Cross-section of coarse hair with medulla (phot. D. Makowiecka)
-type fibres, based only on their thickness, could be included to coarse hair as well.
However, appurtenance of fibres to mid-type fraction was verifed by analysis of fibres surface and their cross section. Fibres belonging to that fraction were characterized by clear, regular scales, occurrent on whole its length. While the surface image of coarse hair showed unclear acutance and disappearance of scales (Phot. 1, 2). It is in accordance with Wang (1984), which considered that the angle between scale and hair shaft in
yak is very small so that scale virtually sticks to the shaft, what gives poor felt-ing qualities of yak hair.
The analysis of cross section of inves-tigated fractions indicates more regular, circular shape of mid-type fibres and eliptical of coarse hair. The presence of medulla was stated also only in corse hair fraction (Phot. 3, 4). The occurance of medullation in thickest fibres was confirmed by Wang (1984) in investiga-tions on the ultramicroscopic structure of the yak coat.
160 A. Radzik-Rant et al.
The coarse hair fraction was about 57% longer than mid-type fibres (P ≤ 0.01), (Tab. 1). There was not statistical differ-ence in fraction length depending on sex of animals (Tab. 2).
The differences in hair length are mainly related to fibre type and body parts. According to Zhang (1989) the length of coarse hair varying from 8.9 cm to 21.1 cm and mid-type fibres from 5.3 to 13 cm, with the longest in both cases on the belly and the shortest on the shoulder. The similar dependences con-cern down fraction also, but it has not been found of studied yak coat.
CONCLUSIONS
1. In the coat of yak maintained in Gdańsk zoological garden the coarse hair (25%) and mid-type fibre (75%) frac-tions has been separate. The occurrence of down fraction has not been stated.
2. The average thickness of coarse hair fraction reached 58.21 μm, while mid-type fibres 36.52 μm. Coarse hair fraction was significantly thicker in males. The diameter of mid-type fibre was similar in both sexes.
3. The appurtenence to coarse or mid-type fraction was confirmed by surface and cross section analysis of fibres. Coarse hair showed medullation and dis-appearance of scales.
4. The coarse hair were almost twice as much longer than mid-type fibres.
REFERENCES
JI Q., PU Q., DALVA Y., CIREN D., DAWA Q., 2001: Studies on wool-producing performan-ce and main physical traits of underwool of 3 main groups of yak in Tibet. Cinese Journal of Animal Science 37(4), 29–30.
LI S., 1985: The observation on yak’s heat resi-stance. Journal of China Yak, 1: 10–13.
MILLER D.J., 1990: Grassland of the Tibetan Platau. Rangelands 12, 159–163.
NORMA PN-72/P-04900, Metody badań surow-ców włókienniczych. Wełna.
OUYANG X., WANG Q., 1984: An observation on adoptation of calf yak. A research on utili-zation and exploitation in the northwestern part of Sichuan province. Sichuan National Publi-shing House, 159–161.
OUYANG X., 1985: Studies on the cold resistan-ce of yak. Journal of Southwest Nationalities Collage (Animal Husbandry and Veterinary Science Edition) 4, 28–34.
WANG J., 1984: Observation on the ultramocro-scopic structure of the hair fibre of yak. Journal of Southwest Nationalities Collage (Animal Husbandry and Veterinary Science Edition) 4, 9–14.
WANG J., OUYANG X., 1984: Physical features of yak hair. Jurnal of Southwest Nationalities Collage (Animal Husbandry and Veterinary Science Edition) 1, 25–29.
WIENER G., JIANLIN H., RUIJUN L., 2003: The yak. FAO Regional Office for Asia and the Pacific.
XU R., WU Z., 1984: A test report about physio-logic indices of yaks in Dari Area. Journal of China Yak 1, 1–5.
XUE J., YU Z., 1981: The property and utiliza-tion of yak’s down hair. Journal of China Yak 1, 1–5.
ZHANG R., 1977: The hair quality of white yak on Zhuaxixiulong grassland of Tianzhu coun-try. Journal of Gansu Agriculture University 2, 42–47.
ZHANG R., 1989: China: the yak. Gansu Scienti-fic and Technology Press, Lonzhu, China, 386.
Streszczenie: Charakterystyka okrywy włosowej jaków utrzymywanych w warunkach gdańskiego ogrodu zoologicznego. Badania dotyczyły ana-lizy wybranych cech okrywy włosowej jaków utrzymywanych w środowisku zupełnie odmien-nym od naturalnych warunków ich bytowania. Badaniami objęto wszystkie osobniki dorosłe (4 samice i 4 samce) stada jaków utrzymywa-nych w gdańskim ZOO. Próby okrywy pobrano jesienią ze środka boku. Posłużyły one do okre-ślenia udziału frakcji włosów, grubości i długości

The coat characteristic of yak maintained in conditions of the Gdańsk zoological garden 161
w obrębie frakcji oraz cech powierzchni włosów i ich przekrojów. Frakcje włókien wydzielono na podstawie różnic w długości. Udział frakcji wyznaczono z ilości włókien w jej obrębie. Gru-bość włókien określono metodą mikroprojek-cyjną. Długość frakcji mierzono z dokładnością do 0,5 cm. Powierzchnię włosów oraz przekroje poprzeczne analizowano na podstawie obrazów ze skaningowego mikroskopu elektronowego. Wyodrębniono dwie frakcje włosów: zewnętrzną (25%) i pośrednią (75%). W okrywie badanych jaków nie znaleziono frakcji puchowej. Grubość frakcji zewnętrznej i pośredniej wynosiła od-powiednio 58,21 i 36,52. Zarejestrowano róż-nice w grubości frakcji zewnętrznej (P < 0,01) pomiędzy samcami i samicami. Włókna frak-cji pośredniej charakteryzowały się wyraźnym
ołuskowaniem i bardziej regularnymi przekro-jami poprzecznymi. We włóknach grubych za-rejestrowano zanik ołuskowania i występowanie rdzenia, a przekrój poprzeczny był eliptyczny. Włókna frakcji zewnętrznej były znacznie dłuż-sze niż frakcji pośredniej. Nie stwierdzono istot-nych różnic długości włókien w obrębie frakcji pomiędzy samicami i samcami.
MS. received June 2011
Authors’ address:Katedra Szczegółowej Hodowli Zwierząt – SGGWul. Ciszewskiego 802-786 WarszawaPoland

Annals of Warsaw University of Life Sciences – SGGWAnimal Science No 49, 2011: 163–172(Ann. Warsaw Univ. of Life Sc. – SGGW, Anim. Sci. 49, 2011)
The chemical composition and fatty acid profile in milk of Polish Mountain Sheep and Polish Merino
AURELIA RADZIK-RANT1, AGNIESZKA ROZBICKA-WIECZOREK1,2,MARIAN CZAUDERNA2, WITOLD RANT1, BEATA KUCZYŃSKA1
1Department of Animal Breeding, Warsaw University of Life Sciences – SGGW, 2 Polish Academy of Sciences, The Kielanowski Institute of Animal Physiology and Nutrition
Abstract: The chemical composition and fatty acid profi le in milk of Polish Mountain Sheep and Polish Merino. The chemical composition and fat-ty acid profi le of milk of Polish Mountain Sheep (PMS) and Polish Merino (PM) were investigated. The study was carried out on 20 suckling PMS ewes from the fl ock of Podhale region and on 20 PM ewes from the fl ock located in central part of Poland. The animals were fed winter diet. The milk samples have been collected from ewes at the age of 3–4 years and in the 4th week of lactation. Milk chemical composition of PMS and PM ewes was similar. The differences in fatty acids profi le in both tested breeds have been observed. In milk of PMS the portion of medium chain fatty acids (MCFA) was higher (P ≤ 0.01) than PM ewes. In the group of long chain fatty acids (LCFA), the C18:0, C18:1 c7 (P ≤ 0.01), C18:1 c9 (P ≤ 0.05) content was hi-gher for PM, but C18:3, C20:4, C20:3, C20:5 and C22:5 portion (P ≤ 0.01) was greater for PMS. The milk of Polish Mountain Sheep was characterized by higher proportion of PUFA n-3, lower n-6/n-3 ratio (P ≤ 0.01) as well as higher content (P ≤ 0.01) of conjugated linoleic acid c9, t11.
Key words: sheep, milk, chemical composition, fatty acids.
INTRODUCTION
Milk is one of the product rich in nutrita-tive components and biologically active
substances, thus play an important role in human nutrition. An anticarcinogenic and antiantherogenic property has been attributed to the conjugated linoleic acid C18:2 c9, t11 isomer and linolenic acid (C18:3 c9, c12, c15) is also of interest in cardiovascular problems. Other fatty acids (FA) have been related to human health because of their monounsaturated and polyunsaturated nature (Collomb et al., 2006; Mesa et al., 2007).
Milk from sheep is widely used in the Mediterranean and Balkan regions for making hard and soft cheese, yoghurt and other dairy products. In Poland the only one breed, Polish Mountain Sheep is milked. The milk from this breed is used to produce “oszczypek” cheese, which is protected by PDO, but it slould be also pointed out, that the second very importand product obtained from this sheep are slaughter lambs. At present, the lamb meat from “Podhale” is registered as a regional product. This lambs are obliged to slaughter up to 16 kg of body weight and till then stay with their dams and have to be produce only in the Podhale region.
The Polish Merino is the most numer-ous dual-purpose breed in Poland.
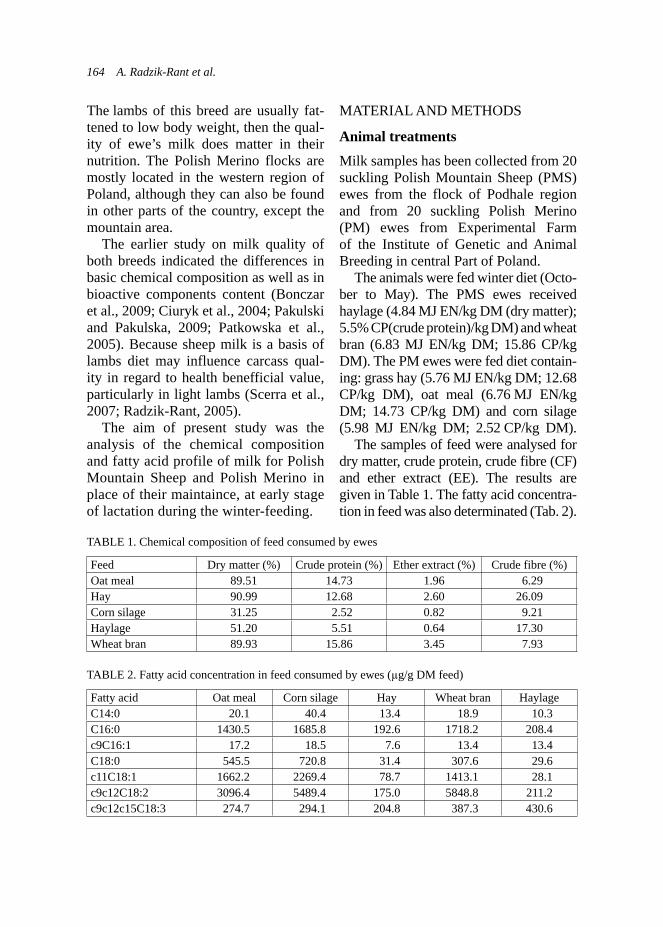
164 A. Radzik-Rant et al.
The lambs of this breed are usually fat-tened to low body weight, then the qual-ity of ewe’s milk does matter in their nutrition. The Polish Merino flocks are mostly located in the western region of Poland, although they can also be found in other parts of the country, except the mountain area.
The earlier study on milk quality of both breeds indicated the differences in basic chemical composition as well as in bioactive components content (Bonczar et al., 2009; Ciuryk et al., 2004; Pakulski and Pakulska, 2009; Patkowska et al., 2005). Because sheep milk is a basis of lambs diet may influence carcass qual-ity in regard to health benefficial value, particularly in light lambs (Scerra et al., 2007; Radzik-Rant, 2005).
The aim of present study was the analysis of the chemical composition and fatty acid profile of milk for Polish Mountain Sheep and Polish Merino in place of their maintaince, at early stage of lactation during the winter-feeding.
MATERIAL AND METHODS
Animal treatments
Milk samples has been collected from 20 suckling Polish Mountain Sheep (PMS) ewes from the flock of Podhale region and from 20 suckling Polish Merino (PM) ewes from Experimental Farm of the Institute of Genetic and Animal Breeding in central Part of Poland.
The animals were fed winter diet (Octo-ber to May). The PMS ewes received haylage (4.84 MJ EN/kg DM (dry matter); 5.5% CP(crude protein)/kg DM) and wheat bran (6.83 MJ EN/kg DM; 15.86 CP/kg DM). The PM ewes were fed diet contain-ing: grass hay (5.76 MJ EN/kg DM; 12.68 CP/kg DM), oat meal (6.76 MJ EN/kg DM; 14.73 CP/kg DM) and corn silage (5.98 MJ EN/kg DM; 2.52 CP/kg DM).
The samples of feed were analysed for dry matter, crude protein, crude fibre (CF) and ether extract (EE). The results are given in Table 1. The fatty acid concentra-tion in feed was also determinated (Tab. 2).
TABLE 2. Fatty acid concentration in feed consumed by ewes (μg/g DM feed)
Fatty acid Oat meal Corn silage Hay Wheat bran HaylageC14:0 20.1 40.4 13.4 18.9 10.3C16:0 1430.5 1685.8 192.6 1718.2 208.4c9C16:1 17.2 18.5 7.6 13.4 13.4C18:0 545.5 720.8 31.4 307.6 29.6c11C18:1 1662.2 2269.4 78.7 1413.1 28.1c9c12C18:2 3096.4 5489.4 175.0 5848.8 211.2c9c12c15C18:3 274.7 294.1 204.8 387.3 430.6
TABLE 1. Chemical composition of feed consumed by ewes
Feed Dry matter (%) Crude protein (%) Ether extract (%) Crude fibre (%)Oat meal 89.51 14.73 1.96 6.29Hay 90.99 12.68 2.60 26.09Corn silage 31.25 2.52 0.82 9.21Haylage 51.20 5.51 0.64 17.30Wheat bran 89.93 15.86 3.45 7.93
The chemical composition and fatty acid profi le in milk of Polish Mountain Sheep... 165
All sampled sheep were at the age of 3–4 years and in the 4th week of lacta-tion. Two hour before milk collection, the lambs were separated from their dams, than ewes were hand milked and 100 ml samples for further analysis have been taken. Each milk sample was divided in two parts, one for chemical analysis, the second for fatty acid deter-mination.
Milk and feed composition
Each milk sample was analysed for fat, protein, lactose, total solids (TS) with IR spectrometry using Milkoscan FT-120.
Chemical composition of fodder were analysed according to procedure AOAC (1990).
Fatty acid analysis in milk and feed samples
Milk fat was extracted according to the Rose-Gottlieb method and fatty acid methyl esters were prepared by the trans estrification method (AOAC, 1990). Separation and quantification of the methyl esters were carried out using a gas chromatograph Hewlett Packard 5890, equipped with capillary column DD-23 (length 60 m, internal diameter 0.25 mm, film thickness 0.25 μm). Operation conditions were: helium flow 20 cm/s; a FID detector at 240°C; a split-splitless injector at 220°C. The temperature program of column was: 1 min at 130°C, a increase to 210°C at 10°C/min; held at this temperature for 25 min, than increased to 230°C at 2.5°C/min and held for 18 min at 230°C. The identification of fatty acids was condacted based on retention time
relatively to palmitic acid (16:0). For all acids and their isomers quantitive analysis by external calibration was performed using standards of choosen acids (Sigma and Supleco). Results are expressed as g/100 g estrificated FA.
The feed samples to analysis of fatty acids were prepared according to Cza-uderna et al. (2009). Gas chromatograph analysis was performed using Hewlett Packard 6890N, equipped with capillary column CP7489 (100 m, i.d. 0.25 mm, film thickness 0.2 μm). The temperature program of column was: 4 min at 70°C, a increase to 150°C at 12°C/min; held at this temperature for 6 min, to 168°C at 8°C/min; held for 27 min; to 190°C at 0.75°C; held for 10 min; to 210°C at 1.8°C/min; held for 15 min; to 234°C at 6°C/min; held for 4 min and to 136°C at 6°C/min and held for 24 min.
FAME identification was validated based on electron impationization spectra of FAME and compared with authentic FAME standards and NIST 2007 refe rence mass spectra library.
The data of fatty acid composition was processed to compute the con-tent of short-chain fatty acids (SCFA; C4:0-C10:0), medium-chain fatty acids (MCFA; C12:0-C16:1), long-chain fatty acids (LCFA; C17:0-C22:6), saturated fatty acids (SFA) monoun-saturated fatty acids (MUFA) and polyunsaturated fatty acids (PUFA). Moreover the ratio of rumenic acid (CLA) to vaccenic acid (TVA) and C14:1/C14:0 (∆9 desaturase activity index) were calculated. Finally, the atherogenicity index was estimated as follows: (C12:0+4xC14:0+C16:0)/(MUFA+PUFA) (Marino et al., 2008).

166 A. Radzik-Rant et al.
Statistical analysisStatistical treatment of the data of chemical composition of milk and fatty acid composition of milk was performed using the SPSS 14.0 software (2003) based on a linear model that included the effect of breed. All effects were tested against residual mi- squares to determine level of significance.
RESULTS AND DISCUSSION
The milk chemical composition is shown in Table 3. The milk of Polish Merino ewes were characterized by higher fat, protein, lactose, total solids content than milk of Polish Mountain Sheep, although significant differences were observed only in TS (P ≤ 0,05).
The fat content in milk of PM was higher (7.82% vs. 4.80%) compared to results obtained for this breed in second month of lactation by Ciuryk et. al. (2004) but was similar to merino sheep in Italy (Pulina et al., 2005). Wherease, Pakulski and Pakulska (2009) for coloured Polish Merino strain obtained higher portion of milk fat. According to Wohlt et al. (1981) in milk of Dorset ewes, the breed that like Polish Merino has not been improved for milk yield and quality, fat content was much higher (12.6%). The fat content in milk of Polish Mountain
Sheep did not differ from dairy sheep breeds maintained in Mediterranean and Balkan regions (Pulina et al., 2005; Addis et al., 2005; Ploumi et al., 1988; Mihaylova et al., 2005).
The milk protein content of PMS and PM ewes (4.36% and 4.72% respec-tively) was lower in relation to Italian dairy breeds and crossbred sheep (Tsigai × Blackhead Plaren) (Pulina et al., 2005; Mihaylova et al., 2005). Bonczar et al. (2009) Konieczny (2009); and Molik et al. (2008) also reported higher average milk protein content for PMS ewes but in the differet stage of lactatiom and during pasture period.
Compered to present study the higher portion of lactose in milk of Polish Moun-tain Sheep was reported by Konieczny (2009), while Molik et al. (2008) regis-trated lower content of this componet.
In Tables 4 and 5, the results of milk fatty acid composition in both studied sheep breeds are summarized. The dif-ferences in short-chain fatty acids (C4:0-C10:0) portion in milk fat between analysed breeds were not statistically significant. The proportion of SCFA in milk of PM and PMS ewes was 9.44 and 9.03 g/100 g respectively (Tab. 5). The similar results were obtained during the grazing period in milk of Tsigai (9.21 g/100 g) by Gerchev and Michay-
TABLE 3. Least square means (LSM) and their standard errors (SE) for milk chemical composition of Polish Merino and Polish Mountain Sheep
ItemPolish Merino Polish Mountain Sheep
P valueLSM SE LSM SE
Fat (%) 7.82 0.38 7.04 0.31 0.12Protein (%) 4.72 0.15 4.36 0.12 0.08Lactose (%) 5.13 0.05 5.01 0.04 0.06Total solids (%) 18.24 0.42 16.98 0.35 0.03

The chemical composition and fatty acid profi le in milk of Polish Mountain Sheep... 167
TABLE 4. Concentration of the individual fatty acids of the milk fat of studied sheep breeds (g/100 g of total fatty acid methylesters)
Fatty acids Polish Merino Polish Mountain Sheep SE Statistical
significanceLSM LSMC4:0 1.98 1.81 0.09 NSC6:0 1.48 1.24 0.11 NSC8:0 1.49 1.48 0.12 NSC10:0 4.50 4.51 0.40 NSC10:1 0.10 0.19 0.05 NSC12:0 2.81 2.84 0.27 NSC12:1 0.11 0.11 0.01 NSC14:0 7.74 9.30 0.48 *C14:1 0.36 0.44 0.03 NSC15:0 0.87 1.29 0.07 **C15:1 0.30 0.27 0.02 NSC16:0 22.37 25.56 0.33 **C16:1 0.34 0.28 0.03 NSC16:1_izo 0.79 0.78 0.05 NSC17:0 1.07 1.35 0.03 **C17:1 0.47 0.56 0.03 *C18:0 14.64 10.97 0.46 **C18:1 t11 1.77 2.11 0.14 NSC18:1 c9 28.59 23.26 1.42 *C18:1 c7 0.55 0.40 0.02 **C18:2 n-6 2.30 2.11 0.09 NSC18:3 n-6 0.21 0.21 0.02 NSC18:3 n-3 0.49 2.06 0.05 **C18:2 c9, t11 (CLA) 0.56 0.90 0.05 **
C20:1 0.07 0.12 0.01 **C20:4 n-6 0.12 0.22 0.02 **C20:3 n-3 0.07 0.17 0.01 **C20:5 n-3 0.05 0.12 0.01 **C22:5 n-3 0.07 0.14 0.01 **C22:6 n-3 0.03 0.04 0.01 NS
LSM – least square mean; SE: standard error; NS: not signifi cant effect; *P ≤ 0.05. **P ≤ 0.01.
lova (2009). Atti et al. (2006) reported higher value of those acids (12.5%) for Scilo-Serde ewes, which received feed-lot diet. Almost twice as much garter portion of SCFA has been determined in other study for PMS and for dairy sheep in Mediterranean area. The dif-
ferences concerned, especially of C4:0, C6:0 as well as C10:0 (Bonczar et al., 2009; De La Fuente et al., 2009; Addis et al., 2005; Carta et al., 2008). The portion of SCFA was also higher (about 17 g/100 g) in milk of coloured Polish Merino (Pakulski and Pakulska, 2009).
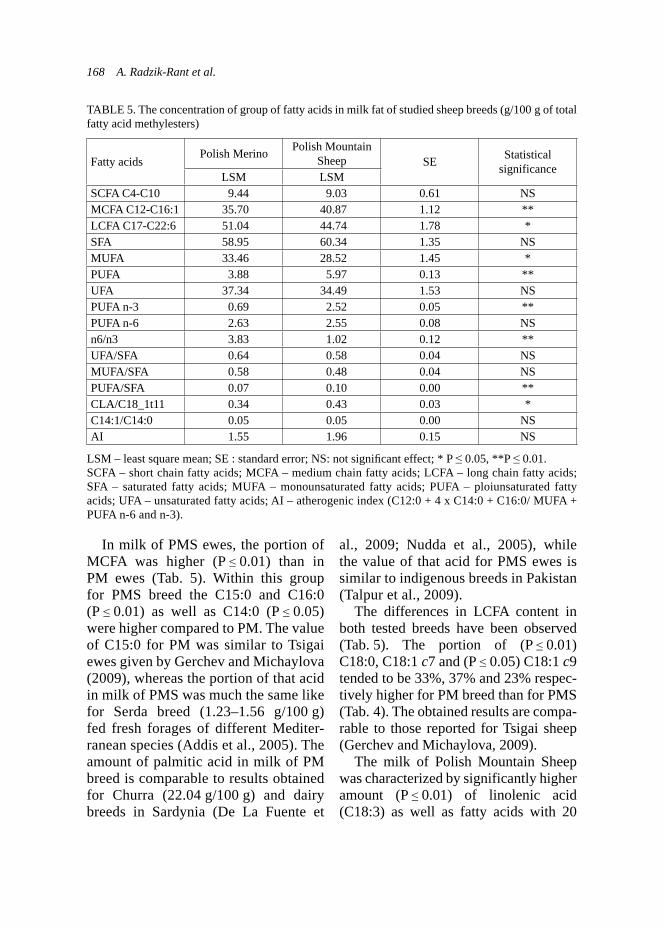
168 A. Radzik-Rant et al.
In milk of PMS ewes, the portion of MCFA was higher (P ≤ 0.01) than in PM ewes (Tab. 5). Within this group for PMS breed the C15:0 and C16:0 (P ≤ 0.01) as well as C14:0 (P ≤ 0.05) were higher compared to PM. The value of C15:0 for PM was similar to Tsigai ewes given by Gerchev and Michaylova (2009), whereas the portion of that acid in milk of PMS was much the same like for Serda breed (1.23–1.56 g/100 g) fed fresh forages of different Mediter-ranean species (Addis et al., 2005). The amount of palmitic acid in milk of PM breed is comparable to results obtained for Churra (22.04 g/100 g) and dairy breeds in Sardynia (De La Fuente et
al., 2009; Nudda et al., 2005), while the value of that acid for PMS ewes is similar to indigenous breeds in Pakistan (Talpur et al., 2009).
The differences in LCFA content in both tested breeds have been observed (Tab. 5). The portion of (P ≤ 0.01) C18:0, C18:1 c7 and (P ≤ 0.05) C18:1 c9 tended to be 33%, 37% and 23% respec-tively higher for PM breed than for PMS (Tab. 4). The obtained results are compa-rable to those reported for Tsigai sheep (Gerchev and Michaylova, 2009).
The milk of Polish Mountain Sheep was characterized by significantly higher amount (P ≤ 0.01) of linolenic acid (C18:3) as well as fatty acids with 20
TABLE 5. The concentration of group of fatty acids in milk fat of studied sheep breeds (g/100 g of total fatty acid methylesters)
Fatty acidsPolish Merino Polish Mountain
Sheep SE Statistical significance
LSM LSMSCFA C4-C10 9.44 9.03 0.61 NSMCFA C12-C16:1 35.70 40.87 1.12 **LCFA C17-C22:6 51.04 44.74 1.78 *SFA 58.95 60.34 1.35 NSMUFA 33.46 28.52 1.45 *PUFA 3.88 5.97 0.13 **UFA 37.34 34.49 1.53 NSPUFA n-3 0.69 2.52 0.05 **PUFA n-6 2.63 2.55 0.08 NSn6/n3 3.83 1.02 0.12 **UFA/SFA 0.64 0.58 0.04 NSMUFA/SFA 0.58 0.48 0.04 NSPUFA/SFA 0.07 0.10 0.00 **CLA/C18_1t11 0.34 0.43 0.03 *C14:1/C14:0 0.05 0.05 0.00 NSAI 1.55 1.96 0.15 NS
LSM – least square mean; SE : standard error; NS: not signifi cant effect; * P ≤ 0.05, **P ≤ 0.01.SCFA – short chain fatty acids; MCFA – medium chain fatty acids; LCFA – long chain fatty acids; SFA – saturated fatty acids; MUFA – monounsaturated fatty acids; PUFA – ploiunsaturated fatty acids; UFA – unsaturated fatty acids; AI – atherogenic index (C12:0 + 4 x C14:0 + C16:0/ MUFA + PUFA n-6 and n-3).
The chemical composition and fatty acid profi le in milk of Polish Mountain Sheep... 169
carbon atoms in chain like C20:4, C20:3, C20:5 (EPA) and C22:5 (DPA) (Tab. 4).
The content of C18:2, which belong to LCFA in milk of PM as well as PMS was higher comperd to results obtained by Bonczar et al. (2009) and Patkowska-Sokoła et al. (2005). The similar value of linolenic acid, ranged between 1.62–2.98 g/100 g has obtained by Addis et al. (2005) for Sarda ewes. Other reported milked sheep breeds had lower amount of that acid than recorded in presented study for PMS (De La Fuente et al., 2009; Nudda et al., 2005).
Long-chain fatty acids with 16 or more carbon atoms are sourced either in the diet or because of body fat mobi-lization. In particular, the milk fat con-tent of C18:0 (stearic acid) and C18:1 (oleic acid) are usually associated with the mobilization of fat depots (Chiliard et al., 2003). The high concentration of those fatty acids in PM milk could be related to the higher intensity of body fat mobilization than for Polish Mountain Sheep. Linoleic and linolenic acids are of dietary origin and are not synthesized by ruminant tissue, and their concentra-tion in milk is dependent on the amount that flows out of the rumen. The higher content of linolenic acid (C18:3) in milk of PMS may be due to higher concen-tration of that acid in the diet. In spite of, that both breeds received winter diet, in case of PMS ewes were fed haylage and wheat bran, which contain higher amount of C18:3 than hay and corn silage (Tab. 2).
The larger portion of C20 fatty acids like C20:5 and C22:5 could be as a con-sequence of grater amount of C18:3 as a precursor to their endogenous synthe-sis in mammary gland (Rymer et al.,
2003). The higher concentration of those acids in PMS milk resulted, that the por-tion of PUFA, particularly PUFA n-3 was higher (P ≤ 0.01) than in the milk of Polish Merino (Tab. 5). The n-6/n-3 ratio was also higher (P ≤ 0.01) for that breed (Tab. 5).
The higher PUFA content in milk of coloured Polish Merino than in milk of studied PM ewes has been reported by Pakulski ana Pakulska (2009). Whereas Patkowska et al. (2005) analizing milk of PMS during the grazing period otained lower portion of PUFA compered to results for this breed in presented study.
The PUFA have beneficial effect on human physiology and health. The pres-ence of those acids in the diet reduces risk and even mortality caused by car-diovascular disease at humans (Singer et al., 1990). The essential n-3 FA are most desirable because metabolized from them eicosanoides, in contrast to eicisanoides from n-6 FA counteract many threaten-ing diseases (Grimble, 1998). Thus, low-ering n-6/n-3 ratio in human diet is very advisable.
The milk fat of PMS was character-ized by 60% higher (P ≤ 0.01) conjugated linoleic acid c9, t11 (CLA) content, than milk of Polish Merino ewes (Tab. 4). The greater proportion of vaccenic acid (2.11 vs. 1.77) was also observed for that breed, although the differences were not statistically significant. The ∆9 desatu-rase activity index expressed as a CLA/TVA ratio was higher (P < 0.05) for PMS than for PM (Tab. 5).
The CLA is produced as an interme-diate during the rumen biohydrogena-tion of linoleic acid that leads to C18:1 t11 (vaccenic acid; TVA) and finally to stearic acid (C18:0). During rumen

170 A. Radzik-Rant et al.
biohydrogenation of linolenic acid, TVA but not CLA is formed (Bauman et al., 2000). The major portion of CLA (from 64 to 98%) in milk fat is produced in the mammary gland by ∆9 desaturase from TVA (Corl et al., 2001). The higher con-tent of c9, t11 CLA in milk of PMS could be related with higher activity of ∆9 desaturase enzyme in mammary gland.
The similar value for CLA c9, t11 content as for PMS has been reported by Patkowska-Sokoła et al. (2005) for Polish Mountain Sheep during grazing period (0.9% ot total FA) and De La Fuente et al. (2009) for Churra breed (0.89 g/100 g), but greater portion of that isomer observed by Bonczar et al. (2009) for PMS ewes (1.40%) and Gerchev and Michaylova (2009) for Tsigai sheep (1.35 g/100 g). The content of CLA in the milk of PMS was twice as much higher in comparison with typical dairy sheep breeds like Awassi (0.46%), Lacoune (0.44%), Friesland (0.35%) and Chios (0.46%) (Tsiplakau et al., 2006). With reference to PM milk higher portion of CLA has been reported by Pakulski and Pakulska (2009) for its colored strain.
The atherogenicity index (AI) charac-terizes the atherogenicity of dietary fat. The fat with high value of this index is assumed more detrimental to the human health. Although, the differences between studied breeds in relation to AI were not significant, the higher value (1.96 vs. 1.55) was found in milk of Polish Moun-tain Sheep (Tab. 5).
CONCLUSIONS
In relation to chemical composition, the milk of Polish Mountain Sheep and Polish Merino ewes was similar.
The milk fatty acid profile of the PMS was more profitable for human health and as a feed for lambs than in PM sheep, which have never been improved for milk performance. These differences could be caused by genotype and differ-ent fodder used during winter-feeding.
The milk of Polish Mountain Sheep, meintained in typical for this breed envi-ronmental conditions, was characterized by higher proportion of polyunsaturated fatty acids, particularly n-3 and lower n-6/n-3 ratio. The content of CLA, very important bioactive component of milk fat, was more favorable for this breed, but atherogenicity index was worse than in PM.
REFERENCESADDIS M., CABIDDU H., PINNA G., DECON-
DIA M., PIREDDA G., PIRISI A., MOLLE G., 2005: Milk and cheese fatty acid composition in sheep fed Mediterranean forages with refer-ence to conjugated linoleic acid cis-9, trans-11. Journal of Dairy Science 88, 3443–3454.
AOAC (Association of Official Analytical Chem-ists) 1990: Food Composition Additives Natu-ral Contaminants. 2. 4 Oils and Fats: 965.
ATTI N., ROUISSI H., OTHMANE M.H., 2006: Milk production, milk fatty acid composition and conjugated linoleic acid (CLA) content in dairy ewes raised on feedlot or grazing pasture. Livestock Science 104, 121–127.
BAUMAN D.E., BAUMGARD L.H., CORL B.A., GRINARI J.M., 2000: Biosynthesis of conjugated linoleic acids in ruminants. Pro-ceedings American Society of Animal Science Online. Available: http://www.asas.org/jas/symposia/proceedings/0937.pdf.
BONCZAR G., REGUŁA-SARDAT A., PUST-KOWICZ H., ŻEBROWSKA A., 2009: Wpływ substytucji mleka owczego mlekiem krowim na właściwości bundzu. Żywność, Nauka, Technologia, Jakość 5, 96–106.
CARTA A., CASU S., USAI M.G., ADDIS M., FIORI M., FRAGHI A., MIARI S., MURA L., PIREDDA G., SCHIBLER L., SECHI T.,

The chemical composition and fatty acid profi le in milk of Polish Mountain Sheep... 171
ELSEN J.M., BARILLET F., 2008: Investiga-ting genetic component of fatty acid content in sheep milk. Small Ruminant Research 79, 22–28.
CHILIARD Y., FERLAY A., ROUEL J., LAM-BERET G., 2003: A review of nutritional and physiological factors affecting goat milk syn-thesis and lipolisys. Journal Dairy Science 86, 1751–1770.
CIURYK S., MOLIK E., KACZOR U., BON-CZAR G., 2004: Chemical composition of colostrum and milk of Polish Merino sheep lambing at different times. Archives of Animal Breeding, Special Issue 47, 129–134.
COLLOMB M., SCHMID A., SIEBER R., WECHSLER D., RYHANEN E., 2006: Con-jugated linoleic acids in milk fat: Variation and physiological effects. International Dairy Jour-nal 16, 1347–1361.
CORL B.A., BAUMGARD L.H., DWER D.A., GRINARI J.M., PHILIPS B.S., BAUMAN D.E., 2001: The role of delta (9)- desaturase in the production of cis-9, trans-11 CLA. Journal of Nutrition Biochemistry 12, 622–630.
CZAUDERMA M., KOWALCZYK J., KRA-JEWSKA K.A., ROZBICKA A.J., MICHAL-SKI J.P., 2009: Dietary selenite and conjugated linoleic acid isomers influence fatty acid con-centration in the liver and femoral muscles of rats. Journal of Animal and Feed Science 18, 564–581.
DE LA FUENTE L.F., BARBOSA E., CARRIE-DO J.A., GONZALO C., ARENAS R., FRES-NO J.M., SAN PRIMITIVO F., 2009: Factor in-fluencing variation of fatty acid content in ovine milk. Journal Dairy Science 92, 3791–3799.
GERCHEV G., MICHAYLOVA G., 2009: Varia-tion in fatty acid composition of milk from Tsi-gai sheep in the region of central Balkan moun-tains. Biotechnology of Animal Husbandry 25, 945–952.
GRIMBLE J.R.F., 1998: Modulation of inflam-matory aspects of immune function by nutri-ents. Nutrition Research 18, 1297–1317.
KONIECZNY M., 2009: Wpływa fazy laktacji na skład chemiczny i parametry fizykochemiczne mleka polskiej owcy górskiej utrzymywanej w warunkach chowu ekologicznego. Roczniki Naukowe Zootechniki 36 (1), 25–30.
MARINO R., ALBENZIO M., ANNICCHI-ARICO G., CAROPRESE M., MUSCIO A.,
SANTILLO A., SEVI A., 2008: Influence of genotype and slaughtering age on meat from Altamurana and Trimeticcio lambs. Small Ru-minant Research 78, 144–151.
MESA M.D., AQUILEVA G.M., GIL A., 2007:Efectos saludables de los lipidos n la dieta. Ali-mentary Nutrition Salutary 14, 12–26.
MICHAYLOVA G., JAHREIS G., ODIAKO-VA T., KAFEDJIEV V., 2005: Fatty acid pro-file of milk from sheep raised on mountain pastures. Biotechnology of Animal Husbandry 21, 93–96.
MOLIK E., MURAWSKI M., BONCZAR G., WIERZCHOŚ E., 2008: Effect of genotype on yield and chemical composition of sheep milk. Animal Science Papers and Reports 3, 211–218.
NUDDA A., MCGUIRE M.A., BATTACONE G., PULINA G., 2005: Seasonal variation in conju-gated linoleic acid and vaccenic acid in milk fat of sheep and its transfer to cheese and ricotta. Journal Dairy Science 88, 1311–1319.
PAKULSKI T., PAKULSKA E., 2009: Skład frakcji tłuszczowej w serach z mleka mery-nosów barwnych w zależności od technologii ich produkcji. Roczniki Naukowe PTZ 5 (2), 167–176.
PATKOWSKA-SOKOŁA B., RAMADANI S., BODKOWSKI R., 2005: Skład chemiczny mleka polskiej owcy górskiej i owcy fryzyj-skiej z okresu żywienia pastwiskowego. Rocz-niki Naukowe Zootechniki (suppl.) 21, 73–75.
PLOUMI K., BELIBASALEI S., TRIANTA-PHY LLIDIS G., 1998: Some factors affecting daily milk yield and composition in a flock of Chios ewes. Small Ruminant Research 28, 98–92.
PULINA G., MACCIOTTO N., NUDDA A., 2005: Milk composition and feeding in the Italian dairy sheep. Italalian Journal of Animal Science 4 (suppl.), 5–14.
RADZIK-RANT A., 2005: Modyfikowanie za-wartości kwasów tłuszczowych w tkance mięśniowej jagniąt poprzez wzbogacanie die-ty olejami różnego pochodzenia. Monografie i Rozprawy. Warszawa.
RYMER C., GIVENS D.J., WHOLE K.W.J., 2003: Dietary strategies for increasing docosa-hexa-enoic acid (DHA) and eicosapentaenoic (EPA) concentration in bovine milk. http://www.nutritionandfoodsciences.
172 A. Radzik-Rant et al.
SCERRA M., CAPARRA P., FOTI., GALO-FARO V., SINATRA M.C., SCERRA V., 2007: Influence of ewe feeding systems on fatty acid composition of suckling. Meat Science 76, 390–394.
SINGER P., WIRTH M., BERGER J., 1990: A possible contribution of decrease in free fatty acids to low trigliceride levels after diets sup-plemented with n-6 and n-3 polyunsaturated fatty acids. Atheriosclerosis 83, 167–175.
TALPUR F.M., BHANGER M.J., MEMON N.N., 2009: Milk fatty acid composition of indig-enous goat and ewe breeds from Sinh Paki-stan. Journal Food Composition Analysis 22, 59–64.
TSIPLAKOU E., MOUNTZORIS K.C., ZER VAS G., 2006: The effect of breed, stage of lactation and parity on sheep milk fat CLA content under the same feeding practices. Livestock Science 105, 162–167.
WOHLT J.E., KLEYN D.H., VANDERNOOT G.W., SELFRIDGE D.J., NOVOTNEG C.A., 1981: Effect of stage of lactation, age of ewe sibling status, and sex of lamb on gross and minor constituents of Dorset ewe milk. Journal Dairy Science 64, 2175–2184.
Streszczenie: Skład chemiczny i profil kwasów tłuszczowych w mleku polskiej owcy górskiej i me-rynosa polskiego. Oznaczano skład chemiczny i profil kwasów tłuszczowych w mleku polskiej owcy górskiej (POG) i merynosa polskiego (MP). Badania prowadzono na 20 karmiących macior-kach POG, pochodzących ze stada w rejonie Pod-hala, i 20 maciorkach MP z Polski centralnej. Pró-by mleka pobierano od maciorek w wieku 3–4 lat,
w czwartym tygodniu laktacji. Był to okres żywie-nia zimowego. Skład chemiczny mleka POG i MP kształtował się na podobnym poziomie. U obu ba-danych ras obserwowano różnice w profilu kwasów tłuszczowych. W mleku POG udział kwasów tłusz-czowych średniołańcuchowych (MCFA) był więk-szy (P ≤ 0,01) niż u maciorek MP. W grupie dłu-gołańcuchowych kwasów tłuszczowych (LCFA), zawartość kwasów C18:0, C18:1 c7 (P ≤ 0,01), C18:1 c9 (P ≤ 0,05) była większa u MP, ale udział C18:3, C20:4, C20:3, C20:5 i C22:5 (P ≤ 0,01) był większy u POG. Mleko polskiej owcy górskiej charakteryzowało się większym udziałem PUFAn-3, niższym stosunkiem n-6/n-3 (P ≤ 0,01), jak również większą zawartością skoniugowanego kwasu linolowego c9, t11.
MS. received June 2011
Authors’ address:Aurelia Radzik-Rant, Agnieszka Rozbicka--Wieczorek, Witold Rant, Beata KuczyńskaKatedra Szczegółowej Hodowli Zwierząt – SGGWul. Ciszewskiego 802-786 WarszawaPoland
Agnieszka Rozbicka-Wieczorek,Marian CzaudernaInstytut Fizjologii i Żywienia Zwierzątim. Jana Kielanowskiego Polskiej Akademii Nauk w Jabłonnieul. Instytucka 305-110 JabłonnaPoland

Annals of Warsaw University of Life Sciences – SGGWAnimal Science No 49, 2011: 173–179(Ann. Warsaw Univ. of Life Sc. – SGGW, Anim. Sci. 49, 2011)
Indicatory wool production of Żelaźnieńska strainof Polish Lowland Sheep maintained in semi-open shed and barn
AURELIA RADZIK-RANT, EWA KUŹNICKA, WITOLD RANTDepartment of Animal Breeding, Warsaw University of Life Science – SGGW
Abstract: Indicatory wool production of Żelaź-nieńska strain of Polish Lowland Sheep main-tained in semi-open shed and barn. The aim of this study was determination of sheep maintenance in semi-open shed on indicatory wool production. During 5 months period (September–January) one group of ewes was kept in shelter (10 ani-mals) while the second in barn (10 animals). Wool samples, two from each ewe, were taken before shearing out of earlier prepared area (10 × 10 cm) on the left mid side. One sample from area of 4 cm2 has been used to determine indicatory wool production, the second one to assay fi bre length and thickness. The statistical differences in indicatory greasy and clean wool production has not been found between investigated groups. Al-though, the tendency to about 11% greater clean wool production has been observed in ewes kept in shelter, while these from barn produced 8% more of greasy wool. The wool from sheep kept in shelter was less than 1 μm thicker and about 8% longer and resulted in higher amount of clean wool. Higher greasy wool production in the group of ewes from barn was caused by higher, but not confi rmed statistically, amount of other fl eece components (sweat, fat, water, vegetable matter). The results of investigations showed tendency to higher clean wool production in ewes maintained in semi-open shed.
Key words: sheep, semi-open shed, indicatory wool production.
INTRODUCTION
The comprehensive purpose of sheep is related to their high environmental adaptability. In the past centuries most of sheep in Poland represented the dual purpose, wool and meat type; however, starting from the 1990’s, meat produc-tion is the main goal in sheep husbandry in our country because of the higher profitability of this production (Radzik--Rant et al., 2000). That profitability also drives the natural demands for improv-ing the efficiency of the sheep growing process which are often counterbalanced by the contemporary requirements of ecological conformance. Consequently, sheep growing has become a complex endeavour with its own bag of issues related to foraging, herd structuring, and housing. The new tendency in livestock production is to change management systems from intensive to semi-exten-sive and extensive which is connect with maintenance of animals in semi-open sheds. Nowadays, we see recently various attempts at eco-inspired diversification, e.g., utilize sheep for landscape conser-vation. Sheep’s milk is a processed and
174 A. Radzik-Rant, E. Kuźnicka, W. Rant
sold as dairy products (PDO) that protect regional cultural tradition. Sheep’s also produced wool which, all in all, will never be completely phased out by syn-thetic fibres.
In addition to genetic and biological factors, wool production is also affected by various attributes of the sheep’s envi-ronment. Obviously, the quantity and quality of forage is not without an impact: they can affect the fibre thickness – within the genetic bounds (Rayder, 1984). Many studies demonstrate a correlation of wool growth (both quantitative and qualita-tive) with seasonal changes like day length and temperature (Lincoln, 1990; Pearson et al., 1996; Choy et al., 1997). Changes in wool production also occur in response to thermal stress, a sudden decrease or increase of temperature for an unadoptable animals (Thwaites, 1967, Skoczylas, 1978).
The wool yield can be measured as the total fleece weight retrieved from a sheep after some specific growth inter-val, or, especially in research, through indicatory production taken from a pre-determined area (Schinckel, 1958).
The goal of present work was to inves-tigate the impact of housing the sheep in semi-open shed for indicatory wool production and for the basic qualitative characteristics of the produced wool.
MATERIALS AND METHODS
The study was carried out with 20 low-land sheep of the Żelaźnieńska strain selected from the herd at RZD Żelazna. The ewes under study were divided into two groups, 10 ewes each; group I was kept in a semi-open shed while group II was kept in barn. The average outdoor
temperature, taken weekly at 6 a.m. was +4.6°C. The maximum temperature, +17.3°C, was noted in September, and the minimum temperature of –5.1°C was recorded in January. Temperature in the barn was maintained according to the norm for ewes and it never dropped below +8°C (Dziennik Ustaw 167, 2003).
The goal of mothers ewe selection procedure was to bring the two groups as close as possible in terms of the rel-evant characteristics of their members. The selected ewes were between 2 and 4 years old going through the same series of physiological periods: preparation for mating, then mating, and the subsequent 4-month pregnancy. Taking into account the age and the ovulation rate evaluated by laparoscopy, ewes were divided into two groups, such that either group con-tained ewes with a similar distribution of age and the diagnosed count of ovarian follicles.
The ewes were fed according to stand-ards for a ewe in the respective physi-ological stage, identically in both groups. Green forage was used as the basis in the period of preparation for mating and the subsequent mating. The exact proportions were: green forage – 4.5 kg, concentrate (triticale, barley, oat) – 0.2 kg, and carrot – 2 kg (daily, per animal); within the first three months of pregnancy: concentrate (same as above) – 0.2 kg, carrot – 2 kg, and straw – 1 kg; in the fourth month of pregnancy: concentrate rapeseed meel, triticale, barley, oat) – 0.65 kg, carrot – 2 kg, straw – 1 kg.
During the preparation for mating (in the beginning of September), all the ewes had been prepared for the test by having shaved off a 10 × 10 cm area on the left-mid side. At the end of January,
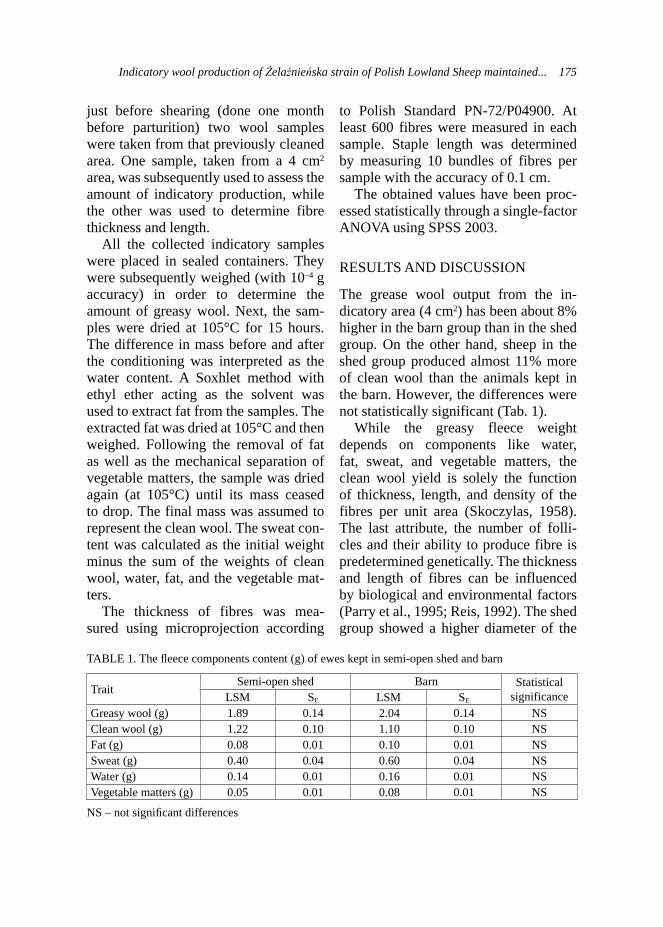
Indicatory wool production of Żelaźnieńska strain of Polish Lowland Sheep maintained... 175
just before shearing (done one month before parturition) two wool samples were taken from that previously cleaned area. One sample, taken from a 4 cm2 area, was subsequently used to assess the amount of indicatory production, while the other was used to determine fibre thickness and length.
All the collected indicatory samples were placed in sealed containers. They were subsequently weighed (with 10–4 g accuracy) in order to determine the amount of greasy wool. Next, the sam-ples were dried at 105°C for 15 hours. The difference in mass before and after the conditioning was interpreted as the water content. A Soxhlet method with ethyl ether acting as the solvent was used to extract fat from the samples. The extracted fat was dried at 105°C and then weighed. Following the removal of fat as well as the mechanical separation of vegetable matters, the sample was dried again (at 105°C) until its mass ceased to drop. The final mass was assumed to represent the clean wool. The sweat con-tent was calculated as the initial weight minus the sum of the weights of clean wool, water, fat, and the vegetable mat-ters.
The thickness of fibres was mea-sured using microprojection according
to Polish Standard PN-72/P04900. At least 600 fibres were measured in each sample. Staple length was determined by measuring 10 bundles of fibres per sample with the accuracy of 0.1 cm.
The obtained values have been proc-essed statistically through a single-factor ANOVA using SPSS 2003.
RESULTS AND DISCUSSION
The grease wool output from the in-dicatory area (4 cm2) has been about 8% higher in the barn group than in the shed group. On the other hand, sheep in the shed group produced almost 11% more of clean wool than the animals kept in the barn. However, the differences were not statistically significant (Tab. 1).
While the greasy fleece weight depends on components like water, fat, sweat, and vegetable matters, the clean wool yield is solely the function of thickness, length, and density of the fibres per unit area (Skoczylas, 1958). The last attribute, the number of folli-cles and their ability to produce fibre is predetermined genetically. The thickness and length of fibres can be influenced by biological and environmental factors (Parry et al., 1995; Reis, 1992). The shed group showed a higher diameter of the
TABLE 1. The fl eece components content (g) of ewes kept in semi-open shed and barn
TraitSemi-open shed Barn Statistical
significanceLSM SE LSM SE
Greasy wool (g) 1.89 0.14 2.04 0.14 NSClean wool (g) 1.22 0.10 1.10 0.10 NSFat (g) 0.08 0.01 0.10 0.01 NSSweat (g) 0.40 0.04 0.60 0.04 NSWater (g) 0.14 0.01 0.16 0.01 NSVegetable matters (g) 0.05 0.01 0.08 0.01 NS
NS – not signifi cant differences

176 A. Radzik-Rant, E. Kuźnicka, W. Rant
fibre (by slightly less than 1 μm) than the animals kept in the barn. This differ-ence has not been confirmed statistically (Fig. 1). Relating the obtained thickness values to the nominal thickness accord-ing to Polish Standard PN-84/P-80053, the most of samples for the barn group was 31 μm, and for the shed group 33 μm (Fig. 2). The variability of thick-ness in both groups was fairly similar, as witnessed by the shape of the distribu-tion curves and the variation coefficients (Figs 1 and 3).
The statistically significant differ-ence in the fiber length between the two groups of ewes has not been found. Sim-ilar to the thickness, the fibers appeared to be slightly longer in the shed group: the difference in the 5th month growth was about 8% (Fig. 4). This slight ten-dency towards longer and thicker fibers in the shed group may be attributed to the impact of the day length, but mostly to the temperature. Numerous studies have proved that the prolactin level positively correlates with the increasing
FIGURE 1. Fibre diameter (μm) of ewes maintained in semi-open shed and barn
33.10
17.05
32.44
17.48
0.00
10.00
20.00
30.00
40.00
fibre diameter (µm) variation coefficient (%)
Semi-open shed Barn
FIGURE 2. The variation of fi bre thickness in ewe’s wool maintained in semi-open shed and barn (nominal thickness 31 μm)
0
2
4
6
8
10
12
14
16
13 15 17 19 21 23 25 27 31 33 35 37 39 43 45 47 51 53 55
thickness (µm)
(%)
Barn Semi-open shed

Indicatory wool production of Żelaźnieńska strain of Polish Lowland Sheep maintained... 177
FIGURE 3. The share of nominal thickness in the wool of ewes kept in semi-open shed and barn
0
5
10
15
20
25
30
35
27 28 29 31 33 35 37 40nominal thickness (µm)
(%)
Semi-open shed Barn
FIGURE 4. Fibre length (cm) of ewes maintained in semi-open shed and barn
3.963.64
0
1
2
3
4
5
fibre length (cm)
Semi-open shed Barn
day length and temperature. The pro-lactin level, in turn, is likely to affect the activity of follicles (Lincoln, 1990; Choy et al., 1997; Pearson et al., 1996). According to Pearson et al. (1996), the follicle activity can be stimulated by both an increase in the prolactin level, occurring mostly in the spring, and its decrease in the fall, as the day becomes shorter and the temperature drops. The changing prolactin levels mostly affect
rustic sheep in which an elevated folli-cle activity expresses into an increase of fibre length, wool weight, and molting, as well as the winter or summer coat growth (Santiago-Moreno et al., 2004; Lincoln, 1990). Notably, the uniform fleece is affected to a much lesser extent by the fluctuations in prolactin levels triggered by the changes in temperature and day length. Nonetheless, as shown by Lincoln (1990), some stimulation of
178 A. Radzik-Rant, E. Kuźnicka, W. Rant
wool production due to decreasing tem-perature (and decreasing prolactin level) can be also noted among improved breeds. A study by Gebbie et al. (1999) of the impact of day length and temper-ature on the coat of goats suggests that the reduction of prolactin level in the fall (triggering an increase in the length and thickness of hair) is caused prima-rily by the temperature drop rather than the reduced day length. Thus, one can suppose that the increase in fibre length and thickness observed in shed group, and expressed into a larger indicatory wool output (notwithstanding its lack of statistical significance), was caused by the lower temperature under the shed than in the barn. The larger weight of greasy wool per unit of indicatory area noted among the barn ewes was due to the larger contribution of non-wool components rather than a larger yield of clean wool. The fleece of ewes from that group was found to contain a larger amount of fat, sweat, water, and veg-etable matters, although the difference with respect to the other group was not statistically significant (Tab. 1). The higher production of sweat (by 50%) and fat (by 25%) among the barn ewes could be caused by the increased secre-tion of the sweat and fat glands resulting from their specific environmental fac-tors. An increased content of sweat and fat in the fleece of sheep kept in barns was observed by Hapanowicz (1991). In addition to sweat and fat a higher con-tent of water (by 14%) and vegetable matters (by 60%) have also been noted in presented study. The latter can be explained by the fact that a higher fat content in fleece facilitates retention of these matters (Skoczylas, 1978).
CONCLUSIONS
To sum up, it can be concluded that pre-sented study showed a tendency towards a higher indicatory wool production in sheep kept in semi-open shelters than in those kept in closed barns. It seems that semi-open shelters facilitate an advanta-geous activity of follicles.
REFERENCES
CHOY V.J., NIXON A.J., PEARSON A.J., 1997: Distribution of prolactin receptor immunore-activity in ovine skin and changes during the wool follicle growth cycle. Journal of Endocri-nology, 155, 265–275.
Dziennik Ustaw nr 167 poz. 1629 – Rozporządze-nie Ministra Rolnictwa i Rozwoju Wsi z dnia 2 września 2003 r. w sprawie minimalnych wa-runków utrzymania poszczególnych gatunków zwierząt gospodarskich
GEBBIE F.E., FORSYTH I.A., ARENDT J., 1999: Effects of maintaining solstice light and tempe-rature on reproductive activity, coat growth, pla-sma prolactin and melatonin in goats. Journal of Reproduction and Fertility. 116, 25–33.
HAPANOWICZ J., 1991: Wpływ jakości tłusz-czopotu na parametry włókna wełnianego, Ma-teriały Konferencyjne. Metlan 91, 49–54, IW, Gdynia.
LINCOLN G.A., 1990: Correlation with changes in horns and pelage, but not reproduction, of seasonal cycles in the secretion of prolactin in rams of wild, feral and domesticated breeds of sheep. Journal of Reproduction and Fertility, 90, 285–296.
Norma PN-72/P-04900: Metody badań surowców włókienniczych, wełna.
Norma PN-84/P-80053: Surowce włókiennicze, wełna owcza potna.
PARRY A.L., NIXON A.J., CRAVEN A.J., 1995: The microanatomy, cell replication and keratin gene expression of hair follicles during a pho-toperiod-induced growth cycle in sheep. Acta Anatomy (Basel), 154, 283–299.
PEARSON A.J., PARRY A.L., ASHBY M.G., CHOY V.J., WILDERMOTH J.E., CRAVEN A.J., 1996: Inhibitory effect of increased pho-
Indicatory wool production of Żelaźnieńska strain of Polish Lowland Sheep maintained... 179
toperiod on wool follicle growth. Journal of Endocrynology, 148, 157–166.
RADZIK-RANT A., SZTYCH D., NIŻNIKOW-SKI R., 2000: Produkcja , obrót i jakość wełny w Polsce. Przegląd Hodowlany. 3, 21–25.
REIS P.J., 1992: Variations in the strength of wool fibres – a review. Australian Journal of Agri-cultural Research. 43, 1337–1351.
RYDER M.L., 1984: Uzyskanie pożądanych wła-ściwości wełny w czasie jej wzrostu. Biuletyn Informacyjny, 1, 8–27, IW w Gdyni.
SANTIAGO-MORENO J., LOPEZ-SEBASTIAN A., del CAMP A., GONZALEZ-BULNES A., PICAZZO R., GOMEZ-BRUNET A., 2004: Effect of constant- relase metonin implants and prolonged exposure to a long day photopheriod on prolactin secretion and hair growth in mu-flon (ovis gmelini musimon). Domestic Animal Endocrynology, 26, 303–314.
SCHINCKEL P.G., 1958: Follicle density and wool production. Australian Journal of Agri-cultural Research. Vol. 8, 5, 68–76.
SKOCZYLAS A., 1978: Biologia owczego runa. PWN, Warszawa.
SPSS 2003: User’s quide 12.0. SPSS Inc.THWAITES C.J., 1967: Prolonged heat stress and
wool growth in sheep. International Journal of Biometeorology. Vol 11, 3, 297–300.
Streszczenie: Wskaźnikowa produkcja wełny u maciorek nizinnych odmiany żelaźnieńskiej utrzymywanych w różnych pomieszczeniach. Ce-lem niniejszych badań było określenie wpływu utrzymywania owiec w pomieszczeniach pół-otwartych na wskaźnikową produkcję wełny.
Przez okres ok. 5 miesięcy (wrzesień–styczeń) maciorki utrzymywane były w wiacie i w owczar-ni, po 10 zwierząt w każdej grupie. Próby weł-ny, po dwie od każdej maciorki, pobrano przed strzyżą z wcześniej przygotowanego miejsca (10 × 10 cm) na lewym boku. Jedna próba z po-wierzchni 4 cm2 posłużyła do określenia wskaź-nikowej produkcji wełny, druga do oznaczenia grubości i długości. Nie wykazano statystycznie istotnych różnic odnośnie wskaźnikowej produk-cji wełny potnej i czystej pomiędzy badanymi grupami owiec. Aczkolwiek zaobserwowano ten-dencję do większej o ok. 11% produkcji czystego włókna u maciorek utrzymywanych pod wiatą, natomiast maciorki w owczarni produkowały o 8% więcej wełny potnej. Owce w wiacie posia-dały wełnę niespełna o 1 μm grubszą i o ok. 8% dłuższą, co w rezultacie dało wyższą ilość czyste-go włókna. Zwiększona produkcja wełny potnej w grupie maciorek z owczarni spowodowana była większym, chociaż niepotwierdzonym statystycz-nie, udziałem pozostałych składników runa (potu, tłuszczu, wody i zanieczyszczeń). Przeprowadzo-ne badania wskazują na tendencję do lepszej pro-dukcji czystego włókna u owiec utrzymywanych w pomieszczeniach półotwartych.
MS. received August 2011
Authors’ address:Katedra Szczegółowej Hodowli Zwierząt – SGGWul. Ciszewskiego 802-786 WarszawaPoland

Annals of Warsaw University of Life Sciences – SGGWAnimal Science No 49, 2011: 181–188(Ann. Warsaw Univ. of Life Sc. – SGGW, Anim. Sci. 49, 2011)
SNPs polymorphisms in LGB, CSN3 and GHR genes in five goat breeds kept in Poland
EWA STRZELEC, ROMAN NIŻNIKOWSKIDivision of Sheep and Goat Breeding, Warsaw University of Life Sciences – SGGW
Abstract: SNPs polymorphisms in LGB, CSN3 and GHR genes in fi ve goat breeds kept in Poland. The aim of the study was to establish the frequ-encies of SNPs polymorphisms in β-lactoglobu-lin (LGB), κ-casein (CSN3) and growth hormone receptor (GHR) genes in fi ve goat breeds kept in Poland. Blood samples from 24 farms possessing 27 goat fl ocks of the Alpine (A), Polish Fawn Im-proved (PFI), Saanen (S), Polish White Improved (PWI) and Boer (B) goat breeds were collected and used for genomic DNA extraction (219 sam-ples in total; 32–49 samples per breed) due to the procedure proposed by the ECONOGENE con-sortium (2002). Researched SNPs were identifi ed due to the KASPar® technology (KBioscience, UK 2007). Genotypes and alleles frequencies were obtained and moreover the differences be-tween breeds were estimated by the Chi-square test in SPSS 14.0 PL software. The results expres-sed the highest frequencies of “g:g” homozygots and “g” allele in LGB in milk breeds (PWI, PFI, S and A). Due to the CSN3 gene the high frequ-encies of “a:a” homozygots and “a” allele were observed in the Saanen, Polish White Improved and Boer goats. No “g” allele was presented in the B goat in CSN3 gene. The results showed three self-distinguishing groups of goat breeds: the co-lored (A and PFI), the white (S and PWI) and the meat (B) goats. The Boer goat (B) presented the signifi cant genetic difference from the other milk breeds in all examined genes.
Key words: goat, breeds, β-lactoglobulin, κ-case-in, growth hormone receptor.
INTRODUCTION
Studies on polymorphisms of genes in small ruminants, including goats, have been carried out for many years all over the world (Cappuccio et al., 2006; Econogene, 2002; Strzelec, 2008). They were focused e.g. on the attempts to establish important polymorphisms in genes that might be applied as genetic markers for production traits (QTL) (Kurył and Żukowski, 1997; Ge et al., 2003), as well as being helpful to explain evolution and domestication processes of species (Luikart et al., 2001; Martin et al., 1999; Maj and Zwierzchowski, 2006; Pidancier et al., 2006). Moreover, this knowledge could help to explain the origin of breeds and relations between them, as well as their genetic similarity (Lenstra and the Econogene, 2005). The application of molecular genetics tools in the researches on the genomes of do-mestic animals would allow to evaluate and protect their biodiversity (Słota et al., 2007).
Goat breeding in Poland has a short tradition and the population structure of goat breeds has been established recently. Breeding interests have been focused on milk production in Poland,
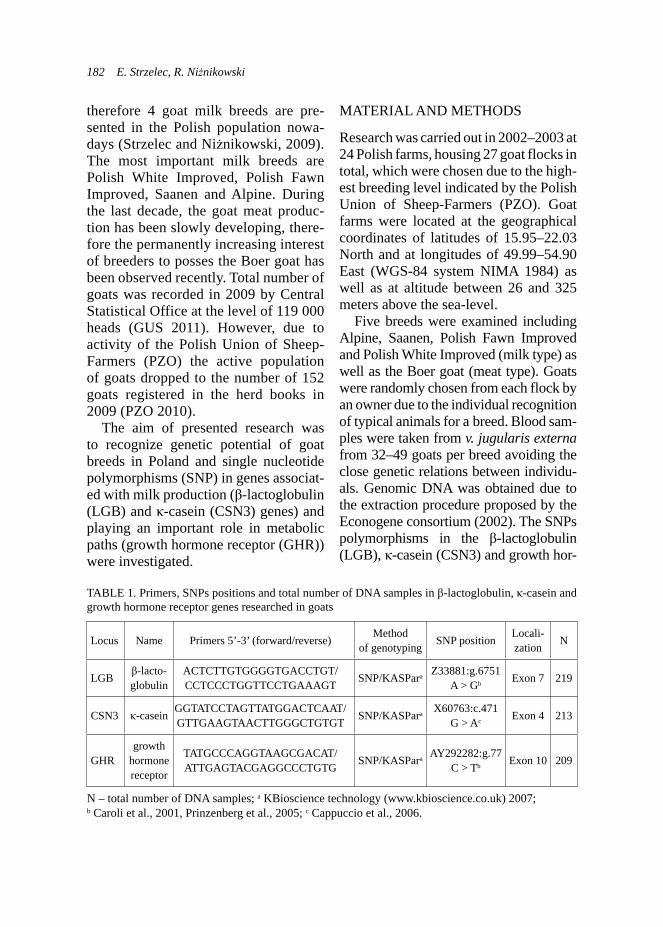
182 E. Strzelec, R. Niżnikowski
therefore 4 goat milk breeds are pre-sented in the Polish population nowa-days (Strzelec and Niżnikowski, 2009). The most important milk breeds are Polish White Improved, Polish Fawn Improved, Saanen and Alpine. During the last decade, the goat meat produc-tion has been slowly developing, there-fore the permanently increasing interest of breeders to posses the Boer goat has been observed recently. Total number of goats was recorded in 2009 by Central Statistical Office at the level of 119 000 heads (GUS 2011). However, due to activity of the Polish Union of Sheep-Farmers (PZO) the active population of goats dropped to the number of 152 goats registered in the herd books in 2009 (PZO 2010).
The aim of presented research was to recognize genetic potential of goat breeds in Poland and single nucleotide polymorphisms (SNP) in genes associat-ed with milk production (β-lactoglobulin (LGB) and κ-casein (CSN3) genes) and playing an important role in metabolic paths (growth hormone receptor (GHR)) were investigated.
MATERIAL AND METHODS
Research was carried out in 2002–2003 at 24 Polish farms, housing 27 goat flocks in total, which were chosen due to the high-est breeding level indicated by the Polish Union of Sheep-Farmers (PZO). Goat farms were located at the geographical coordinates of latitudes of 15.95–22.03 North and at longitudes of 49.99–54.90 East (WGS-84 system NIMA 1984) as well as at altitude between 26 and 325 meters above the sea-level.
Five breeds were examined including Alpine, Saanen, Polish Fawn Improved and Polish White Improved (milk type) as well as the Boer goat (meat type). Goats were randomly chosen from each flock by an owner due to the individual recognition of typical animals for a breed. Blood sam-ples were taken from v. jugularis externa from 32–49 goats per breed avoiding the close genetic relations between individu-als. Genomic DNA was obtained due to the extraction procedure proposed by the Econogene consortium (2002). The SNPs polymorphisms in the β-lactoglobulin (LGB), κ-casein (CSN3) and growth hor-
TABLE 1. Primers, SNPs positions and total number of DNA samples in β-lactoglobulin, κ-casein and growth hormone receptor genes researched in goats
Locus Name Primers 5’-3’ (forward/reverse) Methodof genotyping SNP position Locali-
zation N
LGB β-lacto-globulin
ACTCTTGTGGGGTGACCTGT/CCTCCCTGGTTCCTGAAAGT SNP/KASPara Z33881:g.6751
A > Gb Exon 7 219
CSN3 κ-casein GGTATCCTAGTTATGGACTCAAT/GTTGAAGTAACTTGGGCTGTGT SNP/KASPara X60763:c.471
G > Ac Exon 4 213
GHRgrowth
hormone receptor
TATGCCCAGGTAAGCGACAT/ATTGAGTACGAGGCCCTGTG SNP/KASPara AY292282:g.77
C > Tb Exon 10 209
N – total number of DNA samples; a KBioscience technology (www.kbioscience.co.uk) 2007; b Caroli et al., 2001, Prinzenberg et al., 2005; c Cappuccio et al., 2006.

SNPs polymorphisms in LGB, CSN3 and GHR genes in fi ve goat breeds kept in Poland 183
mone receptor (GHR) genes were identi-fied due to the KASPar technology by the KBioscience Laboratory, UK (www.kbio-science.co.uk 2007). The primers, SNPs positions as well as the total number of DNA samples per gene were described in Table 1. Results were analyzed by Chi-Square for significance using Statis-tical Package for Social Science (SPSS) 14.0PL for Windows (2006).
RESULTS AND DISCUSSION
LGB – the β-lactoglobulin geneStatistical differences in both cases of frequencies of genotypes (Fig. 1) as
well as frequencies of alleles (Fig. 2) in LGB gene between goat breeds were ob-served (p < 0.001). The lowest observed hetorozigosity of LGB was reported in Alpine goat, and then in Polish Fawn Improved goat, and moreover only “g:g” homozygots were presented in these two breeds. Analogous heterosigosity level was observed in goat breeds of Polish White Improved and Boer. Similar pat-tern of both LGB genotype and allele frequencies was observed in Saanen and Polish White Improved goats. Within the LGB gene, the observed heterozygosity occurred to be higher in Saanen, Polish White Improved and Boer goats compar-
11.11 12.50
35.42
8.16
36.11
21.05
39.58
39.5891.84
52.78
78.95
47.92
25.00
0%10%20%30%40%50%60%70%80%90%
100%
Alpine(n = 49)
Saanen(n = 36)
PolishFawn
Improved(n = 38)
PolishWhite
Improved(n = 48)
Boer(n = 48)
g:g
a:g [Ho]
a:a
χ2(8) = 66.314; p < 0.001
FIGURE 1. Frequencies of β-lactoglobulin (LGB) genotypes in fi ve Polish goat breeds
FIGURE 2. Frequencies of β-lactoglobulin (LGB) alleles in fi ve Polish goat breeds
4.08
29.1710.53
32.29
55.21
95.92
70.8389.47
67.71
44.79
0%
10%
20%
30%
40%
50%
60%
70%
80%
90%
100%
Alpine(n = 49)
Saanen(n = 36)
Polish FawnImproved(n = 38)
PolishWhite
Improved(n = 48)
Boer (n = 48)
g
a
χ2(4) = 77.376; p < 0.001

184 E. Strzelec, R. Niżnikowski
ing to the corresponding values (25.10%) reported by Cappuccio et al. (2006) in this gene in goats in general. The highest frequency of “g” allele were presented by goats of Alpine and Polish Fawn Improved, that may be explained by the using of the Alpine and German Noble Fawn goats in breeding schemes of Polish Fawn Improved goat and improving of its milk productivity in the past. Generally, the observed heterozigosity in LGB gene in whole examined goat breeds did not exceeded 40%, and the lowest genetic
variability was observed in goats of Alpine and Polish Fawn Improved.
CSN3 – the κ-casein geneStatistically approved differences in both frequencies of genotypes (Fig. 3) as well as frequencies of alleles (Fig. 4) between goat breeds were observed (p < 0.001). The total lack of heterozigosity in Boer goats was presented and the “a:a” ho-mozygots were only reported. The high-est heterozigosity was observed in goats of Alpine and Polish Fawn Improved,
31.25
78.13
44.74
72.92
100.00
56.25
21.88
50.00
22.92
12.505.26 4.17
0%
10%
20%
30%
40%
50%
60%
70%
80%
90%
100%
Alpine(n = 48)
Saanen(n = 32)
Polish FawnImproved(n = 38)
Polish WhiteImproved(n = 48)
Boer(n = 47)
g:g
a:g [Ho]
a:a
χ2(8) = 62.536; p < 0.001
FIGURE 3. Frequencies of κ-casein (CSN3) genotypes in fi ve Polish goat breeds
59.38
89.06
69.7484.38
100.00
40.63
10.94
30.2615.63
0%
10%
20%
30%
40%
50%
60%
70%
80%
90%
100%
Alpine(n = 48)
Saanen(n = 32)
Polish FawnImproved(n = 38)
Polish WhiteImproved(n = 48)
Boer(n = 47)
g
a
χ2(4) = 59.066; p < 0.001
FIGURE 4. Frequencies of κ-casein (CSN3) alleles in fi ve Polish goat breeds
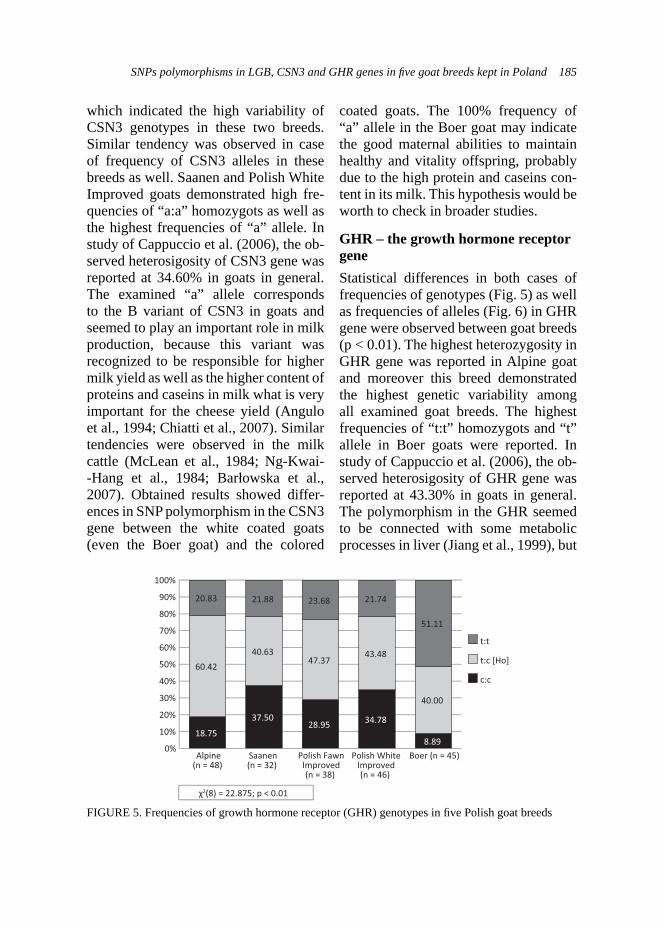
SNPs polymorphisms in LGB, CSN3 and GHR genes in fi ve goat breeds kept in Poland 185
which indicated the high variability of CSN3 genotypes in these two breeds. Similar tendency was observed in case of frequency of CSN3 alleles in these breeds as well. Saanen and Polish White Improved goats demonstrated high fre-quencies of “a:a” homozygots as well as the highest frequencies of “a” allele. In study of Cappuccio et al. (2006), the ob-served heterosigosity of CSN3 gene was reported at 34.60% in goats in general. The examined “a” allele corresponds to the B variant of CSN3 in goats and seemed to play an important role in milk production, because this variant was recognized to be responsible for higher milk yield as well as the higher content of proteins and caseins in milk what is very important for the cheese yield (Angulo et al., 1994; Chiatti et al., 2007). Similar tendencies were observed in the milk cattle (McLean et al., 1984; Ng-Kwai--Hang et al., 1984; Barłowska et al., 2007). Obtained results showed differ-ences in SNP polymorphism in the CSN3 gene between the white coated goats (even the Boer goat) and the colored
coated goats. The 100% frequency of “a” allele in the Boer goat may indicate the good maternal abilities to maintain healthy and vitality offspring, probably due to the high protein and caseins con-tent in its milk. This hypothesis would be worth to check in broader studies.
GHR – the growth hormone receptor geneStatistical differences in both cases of frequencies of genotypes (Fig. 5) as well as frequencies of alleles (Fig. 6) in GHR gene were observed between goat breeds (p < 0.01). The highest heterozygosity in GHR gene was reported in Alpine goat and moreover this breed demonstrated the highest genetic variability among all examined goat breeds. The highest frequencies of “t:t” homozygots and “t” allele in Boer goats were reported. In study of Cappuccio et al. (2006), the ob-served heterosigosity of GHR gene was reported at 43.30% in goats in general. The polymorphism in the GHR seemed to be connected with some metabolic processes in liver (Jiang et al., 1999), but
FIGURE 5. Frequencies of growth hormone receptor (GHR) genotypes in fi ve Polish goat breeds
18.75
37.5028.95 34.78
8.89
60.42
40.6347.37
43.48
40.00
20.83 21.88 23.68 21.74
51.11
0%
10%
20%
30%
40%
50%
60%
70%
80%
90%
100%
Alpine(n = 48)
Saanen(n = 32)
Polish FawnImproved(n = 38)
Polish WhiteImproved(n = 46)
Boer (n = 45)
t:t
t:c [Ho]
c:c
χ2(8) = 22.875; p < 0.01
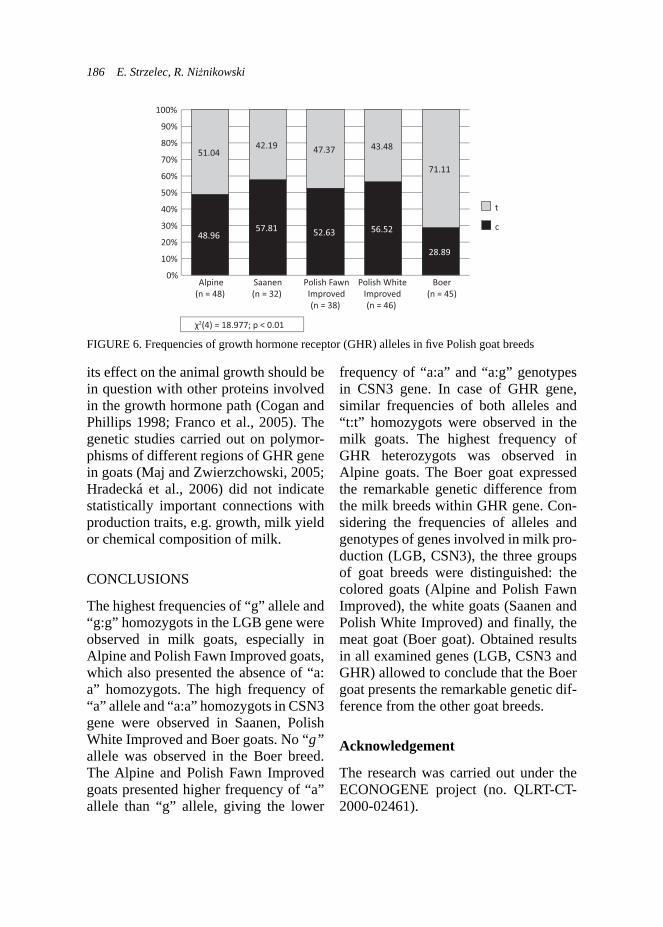
186 E. Strzelec, R. Niżnikowski
its effect on the animal growth should be in question with other proteins involved in the growth hormone path (Cogan and Phillips 1998; Franco et al., 2005). The genetic studies carried out on polymor-phisms of different regions of GHR gene in goats (Maj and Zwierzchowski, 2005; Hradecká et al., 2006) did not indicate statistically important connections with production traits, e.g. growth, milk yield or chemical composition of milk.
CONCLUSIONS
The highest frequencies of “g” allele and “g:g” homozygots in the LGB gene were observed in milk goats, especially in Alpine and Polish Fawn Improved goats, which also presented the absence of “a:a” homozygots. The high frequency of “a” allele and “a:a” homozygots in CSN3 gene were observed in Saanen, Polish White Improved and Boer goats. No “g” allele was observed in the Boer breed. The Alpine and Polish Fawn Improved goats presented higher frequency of “a” allele than “g” allele, giving the lower
frequency of “a:a” and “a:g” genotypes in CSN3 gene. In case of GHR gene, similar frequencies of both alleles and “t:t” homozygots were observed in the milk goats. The highest frequency of GHR heterozygots was observed in Alpine goats. The Boer goat expressed the remarkable genetic difference from the milk breeds within GHR gene. Con-sidering the frequencies of alleles and genotypes of genes involved in milk pro-duction (LGB, CSN3), the three groups of goat breeds were distinguished: the colored goats (Alpine and Polish Fawn Improved), the white goats (Saanen and Polish White Improved) and finally, the meat goat (Boer goat). Obtained results in all examined genes (LGB, CSN3 and GHR) allowed to conclude that the Boer goat presents the remarkable genetic dif-ference from the other goat breeds.
Acknowledgement
The research was carried out under the ECONOGENE project (no. QLRT-CT-2000-02461).
FIGURE 6. Frequencies of growth hormone receptor (GHR) alleles in fi ve Polish goat breeds
48.9657.81 52.63 56.52
28.89
51.0442.19 47.37 43.48
71.11
0%
10%
20%
30%
40%
50%
60%
70%
80%
90%
100%
Alpine(n = 48)
Saanen(n = 32)
Polish FawnImproved(n = 38)
Polish WhiteImproved(n = 46)
Boer(n = 45)
t
c
χ2(4) = 18.977; p < 0.01
SNPs polymorphisms in LGB, CSN3 and GHR genes in fi ve goat breeds kept in Poland 187
REFERENCES
ANGULO C., DIAZ CARRILLO E., MUNOZ A., ALONSO A., JIMENEZ I., SERRADILLA J.M., 1994: Effect of electrophoretic goat’sκ-casein polymorphism on milk yield and main components yield. V. World Congress on Gene-tics Applied to Livestock Production, Guelph, 19, 333–336.
BARŁOWSKA J., LITWIŃCZUK Z., KĘDZIER-SKA-MATYSEK M., LITWIŃCZUK A., 2007: Polymorphism of caprine milk alphas1-casein to performance of four goat breeds. Pol. J. Vet. Sci. 10 (3), 159–164.
CAPPUCCIO I., PARISET L., AJMONE-MAR-SAN P., DUNNER S., CORTES O., ER-HARDT G., LÜHKEN G., GUTSCHER K., JOOST S., NIJMAN I.J., LENSTRA J.A., ENGLAND P.R., ZUNDEL S., OBEXER-RUFF G., BEJA-PEREIRA A., VALENTI-NI A., THE ECONOGENE CONSORTIUM, 2006: Allele frequencies and diversity para-meters of 27 single nucleotide polymorphi-sms within and cross goat breeds. Mol. Ecol. Notes 6, 992–997.
CAROLI A., JANN O., BUDELLI E., BOLLA P., JAGER S., ERHARDT G., 2001: Genetic po-lymorphism of goat [kappa]-casein (CSN3) in different breeds and characterisation at DNA level. Anim. Genet. 32 (4), 226–230.
CHIATTI F., CHESSA S., BOLLA P., CIGNALI-NO G., CAROLI A., PAGNACCO G., 2007: Effect of κ-casein polymorphism on milk com-position in the orobica goat. J. Dairy Sci., 90 (4), 1962–1966.
COGAN J.D., PHILLIPS J.A., 1998: Growth di-sorders caused by genetic defects in the growth hormone pathway. Adv. Pediatr. 45, 337–361.
ECONOGENE, 2002, from www.econogene.eu FRANCO M.M., ANTUNES R.C., SILVA H.D.,
GOULARDT L.R., 2005: Association of PIT1, GH and GHRH polymorphisms with perfor-mance and carcass traits in Landrace pigs. J. Appl. Genet. 46 (2), 195–200.
GE W., DAVIS M.E., HINES H.C., IRVIN K.M., SIMMEN R.C.M., 2003: Association of sin-gle nucleotide polymorphisms in the growth hormone and growth hormone receptor genes with blood serum insulin-like growth factor I concentration and growth traits in Angus cattle. J. Anim. Sci. 81, 641–648.
GUS, 2011. Bank danych regionalnych, www.stat.gov.pl
HRADECKÁ E., ŘEHOUT V., ČITEK J., 2006: The polymorphism of growth hormone recep-tor gene in Holstein and Czech pied bulls. Acta fytotechnica at zootechnica – Mimoradne či-slo, 224–227.
JIANG H., OKAMURA C.S., LUCY M.C., 1999: Isolation and characterisation of a novel pro-moter for the bovine growth hormone receptor gene. J. Biol. Chem. 274 (12), 7893–7900.
KASPar® TECHNOLOGY KBioscience, 2007: from www.kbioscience.co.uk.
KURYŁ J., ŻUKOWSKI M., 1997: Genetic mar-kers in domestic farm animals (Polish) In Ani-mals biotechnology (in Polish) (eds. Zwierz-chowski L.), PWN, Warsaw.
LENSTRA J.A., ECONOGENE CONSORTIUM, 2005: Evolutionary and demographic history of sheep and goats suggested by nuclear, mtD-NA and Y-chromosome markers. International workshop, 5–7 March 2005, Turin, Italy: „The role of biotechnology for the characterisation and conservation of crop, forestry, animals and fishery genetic recourses”, Villa Gualino, Tu-rin, Italy, 97–100.
LUIKART G., GIELLY L., EXCOFFIER L., VI-GNE J.D., BOUVET J., TABERLET P., 2001: Multiple maternal origins and weak phyloge-nic structure in domestic goats. PNAS. 98 (10), 5927–5932.
MAJ A., ZWIERZCHOWSKI L., 2005: A LINE-1 element insertion in the 5’-noncoding region of caprine growth hormone receptor gene. Bio-chem. Genet. 43, 465–470.
MAJ A., ZWIERZCHOWSKI L., 2006: Molecu-lar evolution of coding and non-coding sequ-ences of the growth hormone receptor (GHR) gene in the family Bovidae. Folia biologica (Kraków), vol. 54, no 1–2, 31–36.
MARTIN P., OLLIVIER-BOUSQUET M., GRO-SCLAUDE F., 1999: Genetic polymorphism of caseins: a tool to investigate casein micelle organization. Int. Dairy J. 9, 163–171.
McLEAN D.M., GRAHAM E.R.B., PONZONI R.W., MCKENZIE H.A., 1984: Effects of milk protein genetic variants on milk field and com-position. J. Dairy Res. 51, 531–546.
NG-KWAI-HANG K.F., HAYES J.F., MOXLEY J.E., MONARDES H.G., 1984: Association of genetic variants of casein and milk serum pro-
188 E. Strzelec, R. Niżnikowski
teins with milk, fat and protein production by dairy cattle. J. Dairy Sci. 67, 835–840.
NIMA TECHNICAL REPORT TR8350.2 (1984) Department of Defence World Geodetic Sys-tem 1984, Its Definition and Relationships With Local Geodetic Systems, Third Edition, National Geospatial-Intelligence Agency.
PIDANCIER N., JORDAN S., LUIKART G., TABERLET P., 2006: Evolutionary history of the genus Capra (Mammalia, Artiodactyla): Discordance between mitochondria DNA and Y-chromosome phylogenies. Mol Phylogenet and Evol 40, 739–749.
PRINZENBERG E.M., GUTCHER K., CHESSA S., CAROLI A., ERHARDT G., 2005: Caprine κ-casein (CSN3) polymorphism: new develop-ment in molecular knowledge. J. Dairy Sci. 88, 1490–1498.
PZO, 2010. Hodowla owiec i kóz w Polsce w 2009 roku. Warszawa, 63–70.
SŁOTA E., REJDUCH B., BUGNO M., RY-CHLIK T., ZĄBEK T., 2007: Characterization of animal genetic resources using molecular genetics methods. An. Animal Sci., Suppl. 1, 33–42.
SPSS 14.0PL for Windows, v. 14.0.1 (2006).STRZELEC E., 2008: Polimorfizm wybranych
genów u ras kóz utrzymywanych w różnych warunkach środowiskowych. Rozprawa dok-torska. SGGW w Warszawie, (maszynopis).
STRZELEC E., NIŻNIKOWSKI R., 2009. Po-chodzenie, znaczenie hodowlane oraz charak-terystyka populacji kóz na świecie i w Polsce. Przeg. Hod., 4, 7–12.
Streszczenie: Polimorfizm SNP w genach LGB, CSN3 i GHR u pięciu ras kóz utrzymywanych w Polsce*. Celem badań było ustalenie frekwen-cji polimorfizmów SNP w genach β-laktoglobu-liny (LGB), κ-kazeiny (CSN3) oraz receptora hormonu wzrostu (GHR) u pięciu ras kóz utrzy-mywanych w Polsce. Z 24 gospodarstw mających
w posiadaniu łącznie 27 stad pobrano próby krwi od kóz ras: alpejskiej (A), polskiej barwnej uszla-chetnionej (PFI), saaneńskiej (S), polskiej białej uszlachetnionej (PWI) oraz od burskiej (B). Łącz-nie pobrano 219 prób krwi po 32–49 prób w ra-sie i następnie wyekstrahowano DNA genomowe wg procedury ekstrakcji zaproponowanej przez konsorcju ECONOGENE (2002). Poszczególne polimorfizmy SNP zostały określone za pomocą technologii KASPar® (KBioscience UK, 2007). Uzyskane wyniki posłużyły do określenia fre-kwencji genotypów i alleli w obrębie badanych genów. Wyniki zostały poddane analizie staty-stycznej za pomocą testu chi-kwadrat w progra-mie SPSS v.14 (2006). Otrzymane wyniki wska-zały najwyższą frekwencję homozygot „g:g” oraz allelu „g” w genie LGB u mleczych ras kóz (A, PFI, S oraz PWI). W przypadku genu CSN3 naj-wyższą frekwencją homozygot „a:a”, a także al-lelu „a” odznaczały się kozy ras saaneńskiej, pol-skiej białej uszlachetnionej oraz burskiej. W genie CSN3 nie odnotowano wystąpienia allelu „g” u kóz rasy burskiej. Podsumowując, uzyskane wyniki pozwoliły wskazać trzy samowyodrębnia-jące się grupy rasowe kóz: barwne kozy mleczne (A i PFI), białe kozy mleczne (S i PWI) oraz kozę mięsną (B). Ponadto kozy rasy burskiej wykaza-ły znaczącą odrębność genetyczną w stosunku do pozostałych ras kóz w obrębie badanych genów.
* Badania zrealizowano w ramach projektu ECONO-GENE (no. QLRT-CT-2000-02461).
MS. received June 2011
Authors’ address:Katedra Szczegółowej Hodowli Zwierząt – SGGWZakład Hodowli Owiec i Kózul. Ciszewskiego 802-786 WarszawaPoland

Annals of Warsaw University of Life Sciences – SGGWAnimal Science No 49, 2011: 189–197(Ann. Warsaw Univ. of Life Sc. – SGGW, Anim. Sci. 49, 2011)
Effect of a herbal preparation Prisma Jet on intestinal microflora composition and meat quality of broiler chickens
ŻANETA ZDANOWSKA-SĄSIADEK1, OLGA SŁOWIKOWSKA1,MONIKA MICHALCZUK1, JULITA GAJEWSKA2, MARCIN KORCZYŃSKI3
1Faculty of Animal Science, Warsaw University of Life Science – SGGW²Faculty of Agriculture and Biology, Warsaw University of Life Science – SGGW3Evialis Polska Sp. z o.o.
Abstract: Effect of a herbal preparation Prisma Jet on intestinal microfl ora composition and meat quality of broiler chickens. The experiment was conducted with 38,000 ROSS 308 chickens kept in two buildings of a poultry production farm. The chickens from the experimental group were receiving and addition of a herbal prepara-tion Prisma Jet to a feed mixture. On day 42, the chickens were slaughtered and samples of their intestines were collected for microfl ora compo-sition analyses and these of meat for qualitative analyses. Determinations were carried out for the counts of lactic acid bacilli Lactobacillus spp., bacteria of the family Enterobacteriaceae sp., mesophilic heterotrophs as well as yeast and fi lamentous fungi in digesta of the small inte-stine and blind gut (cecum) of the chickens. In turn, breast and leg muscles were determined for the chemical composition, physicochemical pro-perties and fatty acid profi le in the intramuscular and abdominal fat. The study demonstrated that the Prisma Jet preparation evoked a decrease in the total bacterial count in the small intestine and an increase in the count of benefi cial inte-stinal microfl ora in the cecum. The preparation was also shown to improve meat quality, which was indicated by more favorable physicochemi-cal parameters and fatty acid profi le.
Key words: broiler chickens, phytobiotics, intesti-nal microfl ora, meat quality.
INTRODUCTION
The intensification of poultry produc-tion involves a higher stock density per area unit, more intensive feeding and the shortening of the rearing period of chickens. Such procedures may, how-ever, evoke difficulties in maintaining appropriate animal husbandry conditions or in keeping a good health status of the flock. A frequent cause of those prob-lems are disorders of the gastrointestinal system. What is more, poor zoohygienic conditions, including among others a high concentration of such toxic gases as ammonia or hydrogen sulfide, may contribute to the deterioration of the end product, which is poultry meat.
In the case of animals the gastroin-testinal tract is a site linking directly the external environment with the body. Its objective is on the one hand to isolate the body from pathogenic microorganisms and on the other hand to be the site for the absorption of indispensable nutrients. The proper functioning of the gastrointestinal tract (GIT) is possible owing to specific microflora – bacteria, fungi, moulds and
190 Ż. Zdanowska-Sąsiadek et al.
protozoa, that constitute a specific bio-film. Bacteria of the genera Lactobacil-lus, Bifidobacterium and Streptococcus, naturally occurring in the GIT, belong to the most desirable ones and serve an important function in providing the appropriate conditions (low pH, nutrients) for the growth of other positive microorga-nisms as well as prevent the colonization of pathogenic microflora – Clostridium perfringens, Salmonella, Staphylococcus or Escherichia coli bacteria (Gajewska et al., 2002). In order to assure the growth of positive microflora of the digestive tract many feed producing companies offer specific preparations the goal of which is to model or enhance the colonization of positive bacteria. The most commonly applied preparations of this type include: probiotics, prebiotics, acidifying and plant preparations. The latter, used mainly in the form of extracts or essential oils, prove successful in poultry production and, importantly, are characterized by the highest relative efficacy to antibiotic growth stimulants (Grela and Semeniuk, 2006). In addition, herbal plants are naturally a rich source of, among others, polyunsaturated fatty acids (including linolenic acid), whose presence in animal feeding enables simple and inexpensive modification of fatty acid profile of the intramuscular fat, which in turn imprvoes the health-promoting properties of meat. Plant preparations, by affecting the gas-trointestinal tract of birds, additionally improve digestion and thus feed conve-rsion. As a result, smaller quantities of detrimental compounds are excreted from their bodies, which greatly improves zoohygienic conditions in a poultry house, and physicochemical characteristics of the end product, i.e. poultry meat.
The reported study was aimed at deter-mining the effect of a herbal preparation Prisma Jet on the composition of gas-trointestinal microflora and meat quality of broiler chickens.
MATERIAL AND METHODS
The experiment was conducted at a commercial farm of slaughter poultry located in the Mazowieckie Province. Numbers of chickens in flocks account-ed for 18 000 and 20 000 in building I and II, respectively. The experimental material were ROSS 308 type broiler chickens kept on litter under standard conditions, following standard recom-mendations for poultry rearing. A factor differentiating those two groups was the addition of a Prisma Jet preparation (stimulating appetite and growth) to starter, grower and finisher type feed mixtures. Chickens from the control group (I) were fed a mixture without the addition of Prisma Jet preparation, whereas those from the experimental group (II) were administered Prisma Jet preparation with a feed mixture, at a dose of 1 kg/t of starter and grower, and 2 kg/t of finisher mixture. The Prisma Jet preparation contains natural active substances originating from plants of the poppy family (Papaveraceae Juss.), including: tetterwort (Chelidonium maius (majus) L.), bloodroot (Sangui-naria canadensis L.), plume poppy (Macleaya cordata L.), and Kelway’s coral plume (Macleaya microcarpa L.). Its major active substances are alkaloids (3%) and derivatives of benzophen-anthridine: chelidonine, sanguinarine, chelerythrine (constituting 90% of the active substances).

Effect of a herbal preparation Prisma Jet on intestinal microfl ora composition... 191
The chickens were fed starter (0–14 day), grower (15–35 day) and finisher (35–42 day) type feed mixtures accord-ing to the feeding program for broilers elaborated by the poultry production farm. The composition of feed mixtures administered to the chickens over the rearing period was presented in Table 1.
Once rearing had been completed (day 42), 6 cocks and 6 hens with body weight approximating the mean body weight in the group were selected from each group for slaughter. Their intestines were sampled for quantitative and quali-tative microbiological analyses of small intestine and cecum digesta. Determina-tions were carried out for counts of the following microorganisms: lactic acid bacilli Lactobacillus spp., bacteria of the Enterobacteriaceae sp. family (obliga-torily harmful bacteria – Salmonella sp. and Shigella sp., and potentially harmful bacteria – Escherichia coli, Proteus sp. and Klebsiella pneumoniae), groups of mesophilic heterotrophs (Pseudomonas (P. aureofaciens, P. fluorescens, P. putida, P. stutzeri, P. paucimobilis), Achromobacter, Acinetobacter (A. junii, A. lwoffi), Bacillus, Cellulomonas, Commomonas (C. acidovorans), Clostri-dium, Flavobacterium (F. multivorum), Staphylococcus), as well as yeast and filamentous fungi. The analyses were conducted at the Department of Agricul-tural Microbiology, Warsaw University of Life Sciences. Chicken carcasses were
cooled at a temperature of 4°C, then 48 h after the slaughter, breast and thigh mus-cles were determined for: pH – acc. to Polish Standard PN-77/A-82058, water absorbability – acc. to Polish Standard PN-73/A-82110, free drip (free drip of juice from muscle tissue was computed from the difference between meat mass
on the 24th and 48th hour of storage in foil bags at a temperature of 4°C), and for proximate chemical composition (dry matter and ash) – acc. to Polish Standard PN-73/A-82110. In addition, intramus-cular fat and abdominal fat of the chick-ens were assayed for fatty acid profile acc. to Polish Standard PN-En ISO 5509, 2001. Results obtained were elaborated statistically with the analysis of variance counted with the least squares method using a statistical software SPSS 14.0 PL for Windows.
RESULTS AND DISCUSSION
Neither yeast nor filamentous fungi were detected in digesta of the small intestine and cecum in both groups. A negative result was also reached in the test for the presence of the Salmonella sp. genus bacteria. In the control group, despite no addition of the stimulant, counts of all analyzed microorganisms in the small intestine digesta were higher when com-pared with the experimental group. The group of control birds was characterized by a significantly (P ≤ 0.01) higher count
TABLE 1. Basic composition of mixtures from analysis (%)
Dry matter Crude ash Crude protein Crude fat Crude fiberStarter 86.04 4.91 20.96 5.00 3.22Grower 87.61 4.97 18.49 7.33 4.28Finisher 87.61 4.97 18.49 7.33 4.28
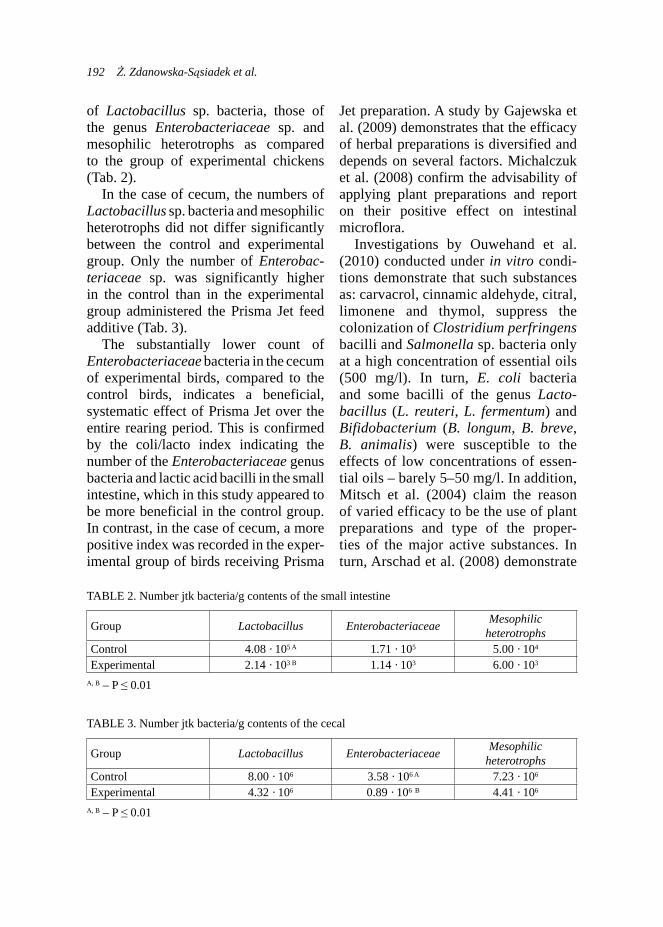
192 Ż. Zdanowska-Sąsiadek et al.
of Lactobacillus sp. bacteria, those of the genus Enterobacteriaceae sp. and mesophilic heterotrophs as compared to the group of experimental chickens (Tab. 2).
In the case of cecum, the numbers of Lactobacillus sp. bacteria and mesophilic heterotrophs did not differ significantly between the control and experimental group. Only the number of Enterobac-teriaceae sp. was significantly higher in the control than in the experimental group administered the Prisma Jet feed additive (Tab. 3).
The substantially lower count of Enterobacteriaceae bacteria in the cecum of experimental birds, compared to the control birds, indicates a beneficial, systematic effect of Prisma Jet over the entire rearing period. This is confirmed by the coli/lacto index indicating the number of the Enterobacteriaceae genus bacteria and lactic acid bacilli in the small intestine, which in this study appeared to be more beneficial in the control group. In contrast, in the case of cecum, a more positive index was recorded in the exper-imental group of birds receiving Prisma
Jet preparation. A study by Gajewska et al. (2009) demonstrates that the efficacy of herbal preparations is diversified and depends on several factors. Michalczuk et al. (2008) confirm the advisability of applying plant preparations and report on their positive effect on intestinal microflora.
Investigations by Ouwehand et al. (2010) conducted under in vitro condi-tions demonstrate that such substances as: carvacrol, cinnamic aldehyde, citral, limonene and thymol, suppress the colonization of Clostridium perfringens bacilli and Salmonella sp. bacteria only at a high concentration of essential oils (500 mg/l). In turn, E. coli bacteria and some bacilli of the genus Lacto-bacillus (L. reuteri, L. fermentum) and Bifidobacterium (B. longum, B. breve, B. animalis) were susceptible to the effects of low concentrations of essen-tial oils – barely 5–50 mg/l. In addition, Mitsch et al. (2004) claim the reason of varied efficacy to be the use of plant preparations and type of the proper-ties of the major active substances. In turn, Arschad et al. (2008) demonstrate
TABLE 2. Number jtk bacteria/g contents of the small intestine
Group Lactobacillus Enterobacteriaceae Mesophilic heterotrophs
Control 4.08 · 105 A 1.71 · 105 5.00 · 104
Experimental 2.14 · 103 B 1.14 · 103 6.00 · 103
A, B – P ≤ 0.01
TABLE 3. Number jtk bacteria/g contents of the cecal
Group Lactobacillus Enterobacteriaceae Mesophilic heterotrophs
Control 8.00 · 106 3.58 · 106 A 7.23 · 106 Experimental 4.32 · 106 0.89 · 106 B 4.41 · 106
A, B – P ≤ 0.01
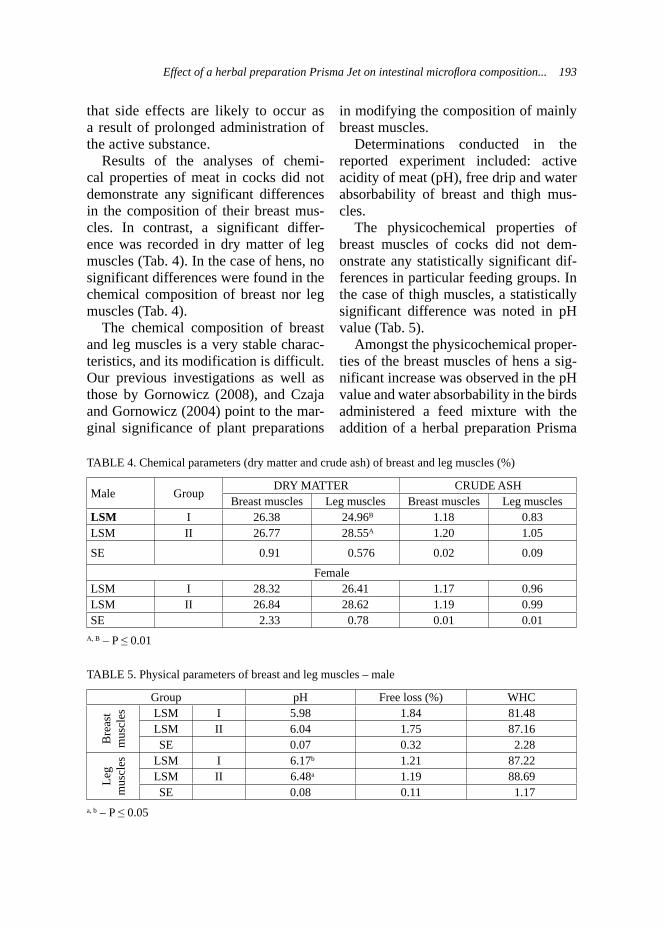
Effect of a herbal preparation Prisma Jet on intestinal microfl ora composition... 193
that side effects are likely to occur as a result of prolonged administration of the active substance.
Results of the analyses of chemi-cal properties of meat in cocks did not demonstrate any significant differences in the composition of their breast mus-cles. In contrast, a significant differ-ence was recorded in dry matter of leg muscles (Tab. 4). In the case of hens, no significant differences were found in the chemical composition of breast nor leg muscles (Tab. 4).
The chemical composition of breast and leg muscles is a very stable charac-teristics, and its modification is difficult. Our previous investigations as well as those by Gornowicz (2008), and Czaja and Gornowicz (2004) point to the mar-ginal significance of plant preparations
in modifying the composition of mainly breast muscles.
Determinations conducted in the reported experiment included: active acidity of meat (pH), free drip and water absorbability of breast and thigh mus-cles.
The physicochemical properties of breast muscles of cocks did not dem-onstrate any statistically significant dif-ferences in particular feeding groups. In the case of thigh muscles, a statistically significant difference was noted in pH value (Tab. 5).
Amongst the physicochemical proper-ties of the breast muscles of hens a sig-nificant increase was observed in the pH value and water absorbability in the birds administered a feed mixture with the addition of a herbal preparation Prisma
TABLE 4. Chemical parameters (dry matter and crude ash) of breast and leg muscles (%)
Male GroupDRY MATTER CRUDE ASH
Breast muscles Leg muscles Breast muscles Leg musclesLSM I 26.38 24.96B 1.18 0.83LSM II 26.77 28.55A 1.20 1.05
SE 0.91 0.576 0.02 0.09
FemaleLSM I 28.32 26.41 1.17 0.96LSM II 26.84 28.62 1.19 0.99SE 2.33 0.78 0.01 0.01
A, B – P ≤ 0.01
TABLE 5. Physical parameters of breast and leg muscles – male
Group pH Free loss (%) WHC
Bre
ast
mus
cles LSM I 5.98 1.84 81.48
LSM II 6.04 1.75 87.16SE 0.07 0.32 2.28
Leg
mus
cles LSM I 6.17b 1.21 87.22
LSM II 6.48a 1.19 88.69SE 0.08 0.11 1.17
a, b – P ≤ 0.05

194 Ż. Zdanowska-Sąsiadek et al.
Jet. In contrast, no significant differen-ces were found in respective properties of the thigh muscles (Tab. 6).
Pietrzak et al. (2009) as well as Fiłonik and Niemiec (2002) emphasize that leg muscles are characterized by a lower pH value than the breast muscles. In addi-tion, Pietrzak et al. (2009) demonstrated a high stability of the discussed parame-ter in both breast and leg muscles. How-ever, investigations by Kim et al. (2009) and Gornowicz (2008) do not confirm that tendency, for those authors reported a decreased pH value in both breast and leg muscles after herbal additives admi-nistration to birds.
A parameter correlated with the pH value is water absorbability. Its value is higher in the muscles with a reported higher value of pH (Połtowicz, 2000). Higher water absorbability may, thus, be expected in leg muscles. This was confirmed by results of this experiment as well as by findings of Pietrzak et al. (2009) and Gornowicz (2008).
Contemporarily, investigations ad -d ressing the quality of broiler chick-ens meat tend to, among other things, achieve an improvement in the nutritive value through decreasing the total con-tent of fat and cholesterol and through incre asing the contribution of polyun-saturated fatty acids coupled with reach-
ing the most beneficial ratio of n-3 to n-6 fatty acids in poultry meat.
Those characteristics may be improved most of all through the modification of animal feeding and through the appli-cation of feed additives affecting lipid composition in meat (Pikul, 2009).
The herbal preparation administered to the chickens from group II affected, to a great extent, modifications of the fatty acid profile in bothintramuscular and abdominal fat (Tabs 7 and 8).
Analyses demonstrated a decrease in the content of saturated fatty acids (SFA) in the intramuscular fat of breast muscles and in the abdominal fat which was additionally characterized by a higher contribution of polyunsaturat-ed fatty acids. Both groups of the birds were also shown to be characterized by an increased contribution of n-3 PUFA acids and by the improved n-6: n-3 ratio. All those differences turned out statistically significant.
The Prisma Jet preparation evoked a significant effect on the fatty acid profile assayed in the intramuscular and abdominal fat of hens. Analyses demonstrated a lower contribution of saturated fatty acids in the intramuscu-lar fat of their breast muscles, a higher contribution of monounsaturated fatty acids in their abdominal fat, as well as
TABLE 6. Physical parameters of breast and leg muscles – female
Group pH Free loss (%) WHC
Bre
ast
mus
cles LSM I 5.87b 1.82 73.32A
LSM II 6.08a 1.71 87.34B
SE 0.06 0.15 2.15
Leg
mus
cles LSM I 6.29 1.44 89.60
LSM II 6.54 1.41 89.14SE 0.08 0.25 2.11
A, B – P ≤ 0.01; a, b – P ≤ 0.05

Effect of a herbal preparation Prisma Jet on intestinal microfl ora composition... 195
TABLE 7. Fatty acid composition (% of total fat) of breast, leg muscles and abdominal fat – male
Group SFA MUFA PUFA n-6 n-3 n-6: n-3
Bre
ast
mus
cles LSM I 25.018 A 36.230 36.061 32.093 3.968 b 8.097 a
LSM II 22.956 B 36.201 36.984 32.730 4.254 a 7.695 b
SE 0.381 0.474 0.698 0.647 0.091 0.094
Leg
mus
cles LSM I 23.594 35.824 37.233 33.511 3.722 B 9.007 A
LSM II 22.581 35.949 36.735 32.419 4.316 A 7.521 B
SE 0.476 0.717 0.867 0.790 0.110 0.076
Abd
o-m
inal
fa
t
LSM I 24.753 A 37.196 34.495 B 30.987 b 3.508 B 8.844 A
LSM II 22.690 B 36.756 36.680 A 32.462 a 4.218 A 7.701 B
SE 0.270 0.371 0.466 0.409 0.063 0.113A, B – P ≤ 0.01; a, b – P ≤ 0.05
TABLE 8. Fatty acid composition (% of total fat) of breast, leg muscles and abdominal fat – female
Group SFA MUFA PUFA n-6 n-3 n-6: n-3
Bre
ast
mus
cles LSM I 22,906 a 34,769 38,612 34,498 a 4,114 8,396 a
LSM II 21,936 b 36,458 37,455 33,288 b 4,167 7,990 b
SE 0,243 0,365 00,458 00,363 0,051 0,119
Leg
mus
cles LSM I 22,127 36,529 36,664 32,890 3,774 a 8,716 A
LSM II 21,804 36,622 36,770 32,654 4,116 b 7,935 B
SE 0,435 0,407 00,702 00,639 0,082 0,041
Abd
o-m
inal
fa
t
LSM I 21,939 36,549 B 37,715 a 33,848 A 3,867 B 8,632 A
LSM II 21,867 37,778 A 36,249 b 32,214 B 4,035 A 7,862 B
SE 0,300 0,134 00,360 00,330 0,038 0,055A, B – P ≤ 0.01; a, b – P ≤ 0.05
an increase in the level of n-6 PUFA in the intramuscular fat of breast muscles and in the abdominal fat, and that of n-3 PUFA in the intramuscular fat of thigh muscles and in abdominal fat. Both groups of the birds were characterized by a lower n-6: n-3 ratio. All those dif-ferences were statistically significant.
Maślanko and Pisarski (2009) inves-tigated the effect of particular medicinal plants (hop, lime, dropsy plant, mint and nettle) on the fatty acid profile of the abdominal fat in chickens. The greatest effect on the reduction of the n-6: n-3 ratio was found by those authors in the case of dried dropsy plant addition to the feed mixture.
In turn, Zuidhof et al. (2009) observed an improvement in the fatty acid profile (an increase in PUFA and a decrease in SFA level, and a lower n-6: n-3 ratio) after the addition of 17% of linseed to a standard feed mixture for poultry. The administration of a lower dose (10%) affected the fatty acid profile only to a negligible extent.
The greatest impact on the improve-ment of the investigated parameters was noted by Lopez-Ferrer et al. (2001), who were applying fish oil as a feed additive. Results achieved in their study demon-strate a significant increase in the con-tent of polyunsaturated fatty acids in fat of thigh muscles and a decrease in the

196 Ż. Zdanowska-Sąsiadek et al.
n-6: n-3 ratio. Simultaneously, many authors (Bou et al., 2004; Lopez-Ferrer et al., 2001) emphasize the negative impact of a too high addition of fish oil to feed mixtures for broiler chickens on the sensory attributes of their meat (taste and aroma).
Results of this study enable stating the positive effect of plant preparations on the composition of intestinal microflora and meat quality of broiler chickens.
REFERENCESARSCHAD N., NEUBAUER C., HASNAIN S.,
HESS M., 2008: Peganum harmala can mini-mize Escherichia coli infection in poultry, but long-term feeding may induce side effects. Po-ultry Science, 87 (2): 240–249.
BOU R., GUARDIOLA F., TRES A., BARRO-ETA A.C., CODONY R., 2004: Effect of Die-tary fish oil, α-tocopheryl acetate and zinc sup-plementation on the composition and consumer acceptability of chicken meat. Poult. Sci., 82, 282–292.
CZAJA L., GORNOWICZ E., 2004: Wpływ udziału mieszanki ziół w paszy kurcząt broj-lerów na wodochłonność i skład chemiczny mięśni. Rocz. Nauk. Zoot. 31, 77–86.
FIŁONIK A., NIEMIEC J., 2002: Wpływ zasto-sowanych stymulatorów wzrostu na wyniki produkcyjne, poziom lipidów i właściwości fizykochemiczne mięsa. Rocz. Nauk. Zoot., Supl., 16, 305–310.
GAJEWSKA J., BUCKA J., ŻABIK A., RIEDEL J., MICHALCZUK M., 2009: Wpływ natural-nych preparatów roślinnych na stan mikroflory jelitowej brojlerów kurzych. Ochrona Środo-wiska i Zasobów Naturalnych, 41: 302–309.
GAJEWSKA J., NIEMIEC J., ROKOSZ-BURLA-GA H., 2002: Effect of addition of „Greenline” preparations to feed mixtures for broilers on the composition of their intestinal microflora. Acta Microbiologica Polonica, 51, 1: 71–78.
GORNOWICZ E., 2008: Wpływ wybranych czynników odchowu kurcząt brojlerów na kształtowanie się cech jakościowych tuszek i mięsa. Rocz. Nauk. Zoot. Monografie i Roz-prawy, Kraków 6–13; 26–33.
GRELA E.R., SEMENIUK W., 2006: Konse-kwencje wycofania antybiotykowych stymula-torów wzrostu z żywienia zwierząt. Med. Wet., 62 (5), 502–507.
KIM Y.J., JIN S.K., YANG H.S., 2009: Effect of dietary garlic bulb and husk on the physicoche-mical properties of chicken meat. Poult. Sci., 88, 398–405.
LOPEZ-FERRER S., BAUCELLS M.D., BAR-ROETA A.C., GRASHORN M.A., 2001: n-3 enrichment of chicken meat. 1. Use of very long-chain fatty acids in chicken diets and their influence on meat quality: fish oil. Poult. Sci., 80, 741–752.
MAŚLANKO W., PISARSKI R.K., 2009: The ef-fect of herbs on the share of abdominal fat and its fatty acid profile in broiler chickens. Anna-les Uniwersytet Marii Curie-Skłodowskiej, 27 (3), 28–34.
MICHALCZUK M., GAJEWSKA J., GÓR-SKA A., NIEMIEC J., ROKOSZ-BURLAGA H., 2008: Efektywność preparatu roślinnego i kwasu 3-hydroksy-3-metylomasłowego w ży-wieniu kurcząt brojlerów. Roczniki naukowe Polskiego Towarzystwa Zootechnicznego, t. 4, 2: 65–72.
MITSCH P., ZITTERL-EGLSEER K., KOH-LER B., GABLER C., LOSA R., ZIMPER-NIK I., 2004: The effect of two different blends of essential oil components on the proliferation of Clostridium perfringens in the intestines of broiler chickens. Poultry Science, 83 (4): 669–675.
OUWEHAND A.C., TIIHONEN K., KETTU-NEN H., PEURANEN S., SCHULZE H., RAUTONEN N., 2010: In vitro effects of es-sential oils on potential pathogens and benefi-cial members of the normal microbiota. Vetari-narni Medicina, 55 (2): 71–78.
PIETRZAK D., MROCZEK J., GARBACZEW-SKA A., FLOROWSKI T., RIEDEL J., 2009: Wpływ wybranych dodatków do paszy o działaniu przeciwbakteryjnym na jakość mięsa i tłuszczu kurcząt. Med. Wet. 65 (4), 268–271.
PIKUL J., 2009: Lipidy mięsa drobiowego [w:] Przetwórstwo mięsa drobiu – podstawy biolo-giczne i technologiczne. Praca zbiorowa pod redakcją Smolińskiej T., Kopcia W., Wydaw-nictwo Uniwersytetu Przyrodniczego we Wro-cławiu 153–159.

Effect of a herbal preparation Prisma Jet on intestinal microfl ora composition... 197
POŁTOWICZ K., 2000: Wpływ początkowego poziomu pH mięśni piersiowych na wybrane wskaźniki jakości mięsa kurcząt brojlerów należących do trzech genotypów. Rocz. Nauk. Zoot., Supl. 98, 161–165.
SPSS 2006: SPSS, 14.0 for Windows user’s gu-ide, 2006, by SPSS Ins. USA.
ZUIDHOF M.J., BETTI M., KORVER D.R., HERNANDEZ F.I.L., SCHNEIDER B.L., CARNEY V.L., RENEMA R.A., 2009: Ome-ga-3-enriched broiler meat: 1. Optimization of a production system. Poult. Sci., 88, 1108––1120.
Streszczenie: Wpływ ziołowego preparatu Pri-sma Jet na skład mikroflory jelit i jakość mięsa kurcząt brojlerów. Badania przeprowadzono na 38 000 kurczętach ROSS 308 utrzymywanych w dwóch budynkach na fermie produkcyjnej. Kurczęta z grupy doświadczalnej otrzymywały w paszy dodatek ziołowego preparatu Prisma Jet w paszy. W 42 dniu kurczęta ubito i pobrano pró-by jelit do zbadania składu mikroflory oraz mięsa do analiz jakościowych. Oznaczono liczebność pałeczek kwasu mlekowego Lactobacillus spp., bakterii z rodziny Enterobacteriaceae sp., grupy mezofilnych heterotroficznych bakterii oraz droż-dży i grzybów strzępkowych w treści jelita cien-kiego i ślepego kurcząt. W mięśniach piersiowych i nóg określono skład chemiczny, właściwości fizykochemiczne oraz profil kwasów tłuszczo-wych w tłuszczu śródmięśniowym i sadełkowym.
Stwierdzono, że preparat Prisma Jet spowodował spadek ogólnej liczebności bakterii w jelicie cien-kim i wzrost liczebności pożytecznych bakterii jelitowych w jelicie ślepym. Wykazano również wpływ preparatu na poprawę jakości mięsa – ko-rzystniejsze wskaźniki fizykochemiczne i profil kwasów tłuszczowych.
MS. received June 2011
Authors’ address:Żaneta Zdanowska-Sąsiadek,Olga Słowikowska, Monika MichalczukKatedra Szczegółowej Hodowli Zwierząt – SGGWCiszewskiego 802–786 [email protected]
Julita GajewskaSamodzielny Zakład Biologii Mikroorganizmów – SGGWul. Nowoursynowska 15902-776 WarszawaPoland
Marcin KorczyńskiEVIALIS Polska Sp. z o.o.ul. Modlińska 19003-119 WarszawaPoland


Annals of Warsaw University of Life Sciences – SGGWAnimal Science No 49, 2011: 199–203(Ann. Warsaw Univ. of Life Sc. – SGGW, Anim. Sci. 49, 2011)
Carcass efficiency and fatty acid content of farmed pheasants (Phasianus colchicus) meat
MONIKA ŁUKASIEWICZ1, MONIKA MICHALCZUK1,ROBERT GŁOGOWSKI1, MAREK BALCERAK2, BARTŁOMIEJ POPCZYK3
1Department of Animal Science, Warsaw University of Life Sciences – SGGW2Department of Animal Nutrition and Feed Sciences, Warsaw University of Life Sciences – SGGW3Department of Animal Environment Biology, Warsaw University of Life Sciences – SGGW
Abstract: Carcass effi ciency and fatty acid content of farmed pheasants meat (Phasianus colchicus) meat. 30 (15 ♂ and 15 ♀) carcasses of 16-weeks-old farmed pheasants were examined for meat pro-perties and the content of fatty acids. All carcasses were dissected and 70g samples of meat tissue were taken from breast and thigh muscles. The thi-ghs of males were signifi cantly greater than those in females, but the perirenal fat depots were larger in females. There was a signifi cant difference in the mass of the heart between sexes. The content of fatty acids differed signifi cantly in male and fema-le muscles. The muscle tissues of males contained more mono- and polyunsaturated but not the satu-rated fatty acids, than those of female pheasants.
Key words: pheasant, meat effi ciency, fatty acids.
INTRODUCTION
The meat of pheasant (Phasianus colchicus) is one of the most valued by consumers. There were several intro-ductions of varying pheasant species in Poland, therefore the availability of its meat is rather high. There are two main sources of pheasant’s meat: hunting and farming (Tucak et al., 2008; Hofbauer et al., 2010). Scientific reports confirm, that releases of pheasants for hunting
purposes has a positive outcome for vege-tation structure and bird communities (Draycott et al., 2008).
Markets demand pheasant’s meat due to its high nutritive value, the content of high-quality protein and low fatness, considering the growing interest in healthy animal products (Kuźniacka et al., 2007). Recently, pet food producers showed an interest for new ingredients of high quality, including meats of quail, ostrich and pheasant (Rojas et al., 2011).
Kuźniacka et al. (2010) reported that there were no significant differences in meat properties from two most popular varieties of pheasants: Mongolian and common. Many authors compare the biological value of meat obtained from hunted pheasants and those reared in cap-tivity, indicating that the natural nutrition pattern is more favored for high protein and low fat content (Tucak et al., 2004; 2008; Hofbauer et al., 2010). Nuernberg et al. (2011) noted that both, hunted and farmed pheasants accumulate more intra-muscular fat in thigh than in breast mus-cles, however their general fatness is still lower than in black coot and wild duck.
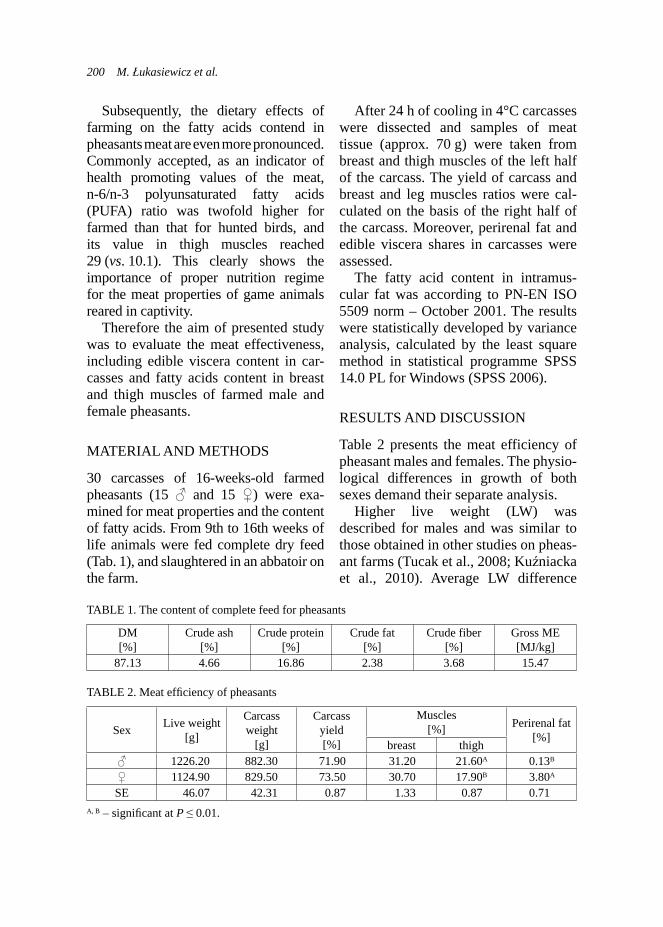
200 M. Łukasiewicz et al.
Subsequently, the dietary effects of farming on the fatty acids contend in pheasants meat are even more pronounced. Commonly accepted, as an indicator of health promoting values of the meat,n-6/n-3 polyunsaturated fatty acids (PUFA) ratio was twofold higher for farmed than that for hunted birds, and its value in thigh muscles reached 29 (vs. 10.1). This clearly shows the importance of proper nutrition regime for the meat properties of game animals reared in captivity.
Therefore the aim of presented study was to evaluate the meat effectiveness, including edible viscera content in car-casses and fatty acids content in breast and thigh muscles of farmed male and female pheasants.
MATERIAL AND METHODS
30 carcasses of 16-weeks-old farmed pheasants (15 ♂ and 15 ♀) were exa-mined for meat properties and the content of fatty acids. From 9th to 16th weeks of life animals were fed complete dry feed (Tab. 1), and slaughtered in an abbatoir on the farm.
After 24 h of cooling in 4°C carcasses were dissected and samples of meat tissue (approx. 70 g) were taken from breast and thigh muscles of the left half of the carcass. The yield of carcass and breast and leg muscles ratios were cal-culated on the basis of the right half of the carcass. Moreover, perirenal fat and edible viscera shares in carcasses were assessed.
The fatty acid content in intramus-cular fat was according to PN-EN ISO 5509 norm – October 2001. The results were statistically developed by variance analysis, calculated by the least square method in statistical programme SPSS 14.0 PL for Windows (SPSS 2006).
RESULTS AND DISCUSSION
Table 2 presents the meat efficiency of pheasant males and females. The physio-logical differences in growth of both sexes demand their separate analysis.
Higher live weight (LW) was described for males and was similar to those obtained in other studies on pheas-ant farms (Tucak et al., 2008; Kuźniacka et al., 2010). Average LW difference
TABLE 1. The content of complete feed for pheasants
DM[%]
Crude ash[%]
Crude protein[%]
Crude fat[%]
Crude fiber[%]
Gross ME[MJ/kg]
87.13 4.66 16.86 2.38 3.68 15.47
TABLE 2. Meat effi ciency of pheasants
Sex Live weight[g]
Carcass weight
[g]
Carcass yield[%]
Muscles[%] Perirenal fat
[%]breast thigh
♂ 1226.20 882.30 71.90 31.20 21.60A 0.13B
♀ 1124.90 829.50 73.50 30.70 17.90B 3.80A
SE 46.07 42.31 0.87 1.33 0.87 0.71A, B – signifi cant at P ≤ 0.01.

Carcass effi ciency and fatty acid content of farmed pheasants (Phasianus colchicus) meat 201
between male and female pheasant was 101 g (Tab. 2).
The carcass yield (CY) was slightly higher in females than that in males which is similar to results of the study on chicken (Szałkowska and Meller, 1998). But compared to other studied on pheas-ants, the dressing efficiency is similar which may indicate that 16 weeks of age is an optimal moment for slaugter (Adamski and Kuźniacka, 2006).
There were no major differences in the share of breast muscles in carcasses of both sexes in our study. Tucak et al. (2004) reported lower values for farmed pheasants, but due to lacking nutritional value of feed in that paper, it is hard to determine if it was the effect of feed-ing. In the recent study, Kuźniacka et al. (2010) report significantly higher share of breast muscles in female carcass.
Interestingly, we noted significantly lower share of thigh muscles in females than that in males (Tab. 2). The content of perirenal fat in females was also significantly higher than that in male carcasses (P < 0.01). This may indicate that female carcasses are less favored in terms of consumer demands for healthy meat (Nuernberg et al., 2011).
Concerning the share of edible viscera in carcasses, there were significant dif-ference (P ≤ 0.01) in the heart weight between male and female pheasants (Tab. 3).
TABLE 3. Edible viscera share in carcasses of pheasants [%]
Sex Stomach Heart Liver♂ 2.74 0.81A 2.25♀ 2.42 0.52B 1.90SE 0.15 0.04 0.16
A, B – signifi cant at P ≤ 0.01.
The content of fatty acids in meat and fat tissues of poultry corresponds mainly to the species and may vary according to diet composition (Hargis and Van Elswyk, 1993; Pikul, 1996).
Current recommendations for incre-ased consumption of PUFA and monoun-saturated fatty acids (MUFA) base on the results of long term clinical studies (Massaro et al., 2010; Gillingham et al. 2011). Therefore, the meat markets demand high quality animal products with valued fatty acids profile.
The content of saturated fatty acids (SFA) was similar in both muscle sam-ples. Nuernberg et al. (2011) report three-fold higher SFA content in thigh muscles of 28-weeks-old farmed pheasants. This may be the consequence of the increased de novo synthesis and deposition of SFA in thigh intramuscular fat of older birds and confirm the notion that the optimal slaughter time for farmed pheasants is between 16th to 20th weeks of age.
The monoenoic fatty acids level was higher in females than that in males, but the deposition of polyenoic fatty acids was greater in males, regardless of the muscle location (Tab. 4). Similar results were reported for chicken (Pietrzak et al., 2006). Poultry lipids have more valued content than that of other animal fats. It contains 60–70% of PUFA. MUFA (approx. 45–50%), like oleic acid, are desired for dietetic reasons. According to Pikul (1996), the fatty acid profile of poultry intramuscular fat depends on various reasons, with the emphasis on the content of offered feed. Birds can synthe-size saturated and monoenoic fatty acids from non-lipid feeds, which are mainly palmitic with stearic and palmitooleic with oleic acids respectively. However

202 M. Łukasiewicz et al.
polyenoic acids, like linoleic (n-6) and linolenic (n-3), are not synthesized by animals and have to be supplied in diets.
In our study the PUFA content was significantly higher in males than that in females. The PUFA n-3 were prefer-entially deposited in male breast mus-cles. The difference was significant at P < 0.01.
The n-6/n-3 PUFA ratio values, obtained in present study were generally lower than those reported by Nuernberg et al. (2011) for farmed pheasants. With comparable tendency for higher n-6/n-3 ratio in females (5.72 and 9.04 vs 10.5 and 29.0 respectively in breast and thigh muscles) regardless of sex, it seems prob-able that there were other environmental factors responsible for such major disad-vantageous differences. Further studies are needed to clarify these observations.
CONCLUSION
Farming of pheasants is considered diminishing regarding the nutritional values of meat (Nuernberg et al., 2011). The deliberate selection of components in complete feed production process seems advisable. However, low volume
of current consumers demands in most of east european countries may be the most limiting factor for the improvement of the nutritional value of pheasants meat.
REFERENCES
ADAMSKI M., KUŹNIACKA J., 2006: The ef-fect of age and sex on slaughter traits of phe-asants (Phasianus colchicus L.). Anim. Sci. Pap. Rep. 24, 11–18.
DRAYCOTT R.A.H., HOODLESS A.H., SAGE R.B., 2008: Effects of pheasant management on vegetation and birds in lowland woodlands. J. Appl. Ecol. 45, 334–341.
GILLINGHAM L.G., HARRIS-JANZ S., JONES P.J.H., 2011: Dietary monounsaturated fatty acids are protective against metabolic syndro-me and cardiovascular disease risk factors. Li-pids 46, 209–228.
HARGIS P.S., VAN ELSWYK M., 1993: Mani-pulating the fatty acid composition of poultry meat and eggs for the health conscious consu-mer. Word’s Poult. Sci. J. 49, 251–264.
HOFBAUER P., SMULDERS F.J.M., VODNAN-SKY M., PAULSEN P., EL-GHAREEB W.R., 2010: A note on meat quality traits of pheasants (Phasianus colchicus). Eur. J. Wildl. Res. 56, 809–813.
KUŹNIACKA J., ADAMSKI M., BERNACKI Z., 2007: Effect of age and sex of pheasants (Phasianus colchicus L.) on selected physical properties and chemical composition of meat. Ann. Anim. Sci. 7(1), 45–53.
TABLE 4. Fatty acid content in the meat of pheasants (g/100 g)
Sex SFA MUFA PUFA PUFA n-3 PUFA n-6 PUFAn-6/n-3
breast♂ 32.44 29.27B 26.01A 6.18A 25.45A 4.12B
♀ 33.51 37.22A 23.73B 4.06B 23.25B 5.72A
SE 00.49 00.49 00.32 0.13 00.31 0.24thigh
♂ 32.41a 36.40B 26.26A 4.07A 26.05A 6.42B
♀ 30.72b 40.72A 22.98B 2.54B 22.81B 9.04A
SE 00.49 00.49 00.32 0.13 00.31 0.24a, b – signifi cant at P ≤ 0.05; A, B – signifi cant at P ≤ 0.01.

Carcass effi ciency and fatty acid content of farmed pheasants (Phasianus colchicus) meat 203
KUŹNIACKA J., ADAMSKI M., JAROSZEW-SKA A., 2010: Meat traits of pheasants from different origin and at different age. Fle-ischwirtschaft Int. 6, 75–77.
MASSARO M., SCODITTI E., CARLUCCIO M.A., DE CATERINA R., 2008: Basic mecha-nisms behind the effects of n-3 fatty acids on cardiovascular disease. Prostagl. Leukotr. & Ess. Fatty Acids 79, 109–115.
NUERNBERG K., SLAMECKA J., MOJTO J., GASPARIK J., NUERNBERG G., 2011: Mu-scle fat composition of pheasants (Phasianus colchicus), wild ducks (Anas platyrhychos) and black coots (Fulica atra). Eur. J. Wildl. Res., 57, 795–803.
PIETRZAK D., MROCZEK J., ADAMCZAK L., WOJDA Ł., NIEMIEC J., 2006: The effect of an increased supplement B-group vitamins on the composition and properties of chicken meat and fat. Animal Science, Supplement (1), 156–157.
PIKUL J., 1996: Lipidy mięsa drobiu. Gosp. Mię-sna 48(7), 8–34.
POLISH STANDARD PN-ISO 5509 (2001). Ani-mal and vegetable fats and oils – Preparation of methyl esters of fatty acids (in Polish).
ROJAS M., GONZÁLEZ I., DE LA CRUZ S., HERNÁNDEZ P.E., GARCÍA T., MAR-TÍN R., 2011: Application of species-specific polymerase chain reaction assays to verify the labeling of quail (Coturnix coturnix), pheasant (Phasianus colchicus) and ostrich (Struthio ca-melus) in pet foods. Anim. Feed Sci. Technol. 169, 128–133.
SPSS (2006) SPSS 14.0 for Windows user’s guide by SPSS Ins USA.
SZAŁKOWSKA H., MELLER Z., 1998: Wpływ wieku, genotypu i płci na wartość rzeźną kurcząt brojlerów. Materiały konferencji na-ukowej: Agrobiznes w Regionie południowo-wschodniej Polski. Produkcja zwierzęca i prze-twórstwo, 53.
TUCAK Z., ŠKRIVANKO M., POSAVČEVIĆ Š., PERIŠKIĆ M., BOŠKOVIĆ I., JUMIĆ V., 2008: The influence of keeping pheasants in captivity vs. nature on the biological value of meat and its use in human nutrition. Coll. An-tropol. 32, 959–962.
TUCAK Z., ŠKRIVANKO M., KRZNARIĆ M., M., POSAVČEVIĆ Š., 2004: Indicators of bio-logical value of the pheasant meat originated from natural and controlled breeding. Acta Agric. Slov., supl. 1, 87–91.
Streszczenie: Parametry rzeźne i zawartość kwa-sów tłuszczowych w mięsie bażantów (Phasianus colchicus) pochodzących z hodowli zamkniętej. 30 tuszek pozyskanych od 16-tygodniowych ba-żantów (15 ♂ i 15 ♀) poddano ocenie pod kątem paramentów rzeźnych oraz oznaczono zawartość kwasów tłuszczowych w tłuszczu śródmięśnio-wym. Dokonano dysekcji wszystkich tuszek oraz pobrano próbki (około 70 g) mięśni piersiowych i udowych. Masa mięśni udowych była istotnie wyższa u samców niż u samic, odwrotnie niż masa tłuszczu sadełkowego. Zaznaczyły się istot-ne różnice w masie serca między płciami. Zawar-tość kwasów tłuszczowych była istotnie różna u samców niż u samic. Stwierdzono obecność większego stężenia jedno- i wielonienasyconych kwasów tłuszczowych u samców, natomiast wię-cej nasyconych kwasów tłuszczowych zawierały tkanki samic bażantów.
MS. received June 2011
Authors’ addresses:Monika Łukasiewicz, Monika Michalczuk,Robert GłogowskiKatedra Szczegółowej Hodowli Zwierząt – SGGWul. Ciszewskiego 802-786 WarszawaPoland
Marek BalcerakKatedra Żywienia Zwierząt i Gospodarki Paszo-wej – SGGWul. Ciszewskiego 802-786 WarszawaPoland
Bartłomiej Popczyk Katedra Biologii Środowiska Zwierząt – SGGWul. Ciszewskiego 802-786 WarszawaPoland