Embed Size (px)
Citation preview
1
Prenatal and Early-life Fructose, Fructose-containing Beverages, and Mid-Childhood Asthma
Authors: *Lakiea S. Wright, MD, MAT, MPHa,b; *Sheryl L. Rifas-Shiman, MPHc; Emily Oken, MD, MPHc; Augusto A Litonjua, MD, MPHd,e; and Diane R. Gold, MD, MPHd,e
*These authors contributed equally to the work and are both first authors
a. Division of Rheumatology, Immunology, and Allergy, Department of Medicine, Brighamand Women’s Hospital and Harvard Medical School, Boston, MA
b. Division of Immunology, Boston Children’s Hospital and Harvard Medical School,Boston, MA
c. Division of Chronic Disease Research Across the Lifecourse, Harvard Medical Schooland Harvard Pilgrim Health Care Institute, Boston, MA
d. Channing Division of Network Medicine, Department of Medicine, Brigham andWomen’s Hospital and Harvard Medical School, Boston, MA
e. Division of Pulmonary and Critical Care, Department of Medicine, Brigham andWomen’s Hospital and Harvard Medical School, Boston, MA
Corresponding Author: Sheryl L. Rifas-Shiman, MPH Division of Chronic Disease Research Across the Lifecourse Harvard Medical School and Harvard Pilgrim Health Care Institute 401 Park Drive, Suite 401 Boston, MA 02215 Phone: 617-867-4824 Fax: 617-867-4858 Email: [email protected]
Author contributions: LW and SRS contributed equally to the work and are both first authors. LW, SRS, EO, and DG contributed substantially to the conception or design of the work; SRS analyzed the data; LW and SRS drafted the work; EO, AL, and DG revised it critically for important intellectual content. All authors contributed to the interpretation of the data, revised the manuscript, and approved the final manuscript.
Sources of support: This study was supported by the National Institutes of Health (R01 HD034568, R01 AI102960, K24 HD069408, P30 DK092924, UG3OD023286, and F32HL124919-01). This publication was supported in part by United States Environmental Protection Agency (USEPA) Grant RD-83479801. Its contents are solely the responsibility of the grantee and do not necessarily represent the official views of the US EPA. Furthermore, the USEPA does not endorse the purchase of any commercial products or services mentioned in the paper.
Running head: Prenatal and early-life fructose intake and child asthma
Descriptor number: 6.03 Diet, Obesity and Lung Disease
Annals
of th
e Ameri
can T
horac
ic Soc
iety
Copyri
ght ©
2017
Ameri
can T
horac
icSoc
iety
2
Manuscript word count: 3422 At a Glance Commentary:
Scientific Knowledge on the Subject
Many studies have found links between obesity and asthma. Recent studies suggest that in
addition to influencing asthma through increasing the risk of obesity, sugar sweetened beverages
and high fructose intake may influence the risk of asthma at least in part through distinct
mechanisms.
What This Study Adds to the Field
In a US pre-birth cohort, higher maternal intake of sugar sweetened beverages and child total
fructose dietary intake were associated with greater odds of current asthma in mid-childhood.
Different sources of dietary fructose intake at different periods (in utero and early life) may
influence childhood asthma development partly through mechanisms independent of maternal or
child adiposity.
This article has an online data supplement, which is accessible from this issue's table of content
online at www.atsjournals.org
Ann
als of
the A
merica
n Tho
racic
Societ
y
Copyri
ght ©
2017
Ameri
can T
horac
ic Soc
iety
1
Abstract 1
Background: Cross-sectional studies have linked intake of high fructose corn syrup sweetened 2
beverages with asthma in school children. 3
Objective: To examine associations of maternal prenatal and early childhood intake of sugar 4
sweetened beverages and fructose with current asthma in mid-childhood (median 7.7years). 5
Methods: We assessed maternal pregnancy (1st and 2nd trimester average) and child (median 6
3.3years) intake of sugar sweetened beverages and total fructose using food frequency 7
questionnaires in 1068 mother-child pairs from Project Viva, a prospective pre-birth cohort. In a 8
multivariable analysis, we examined associations of quartiles of maternal and child sugar 9
sweetened beverage, juice, and total fructose intake with child current asthma in mid-childhood, 10
assessed by questionnaire as ever doctor-diagnosed asthma plus taking asthma medications or 11
reporting wheezing in the past 12months. 12
Results: Higher maternal pregnancy sugar sweetened beverage consumption (mean 0.6 13
servings/day; range 0-5) was associated with younger maternal age, non-white race/ethnicity, 14
lower education and income, and higher pre-pregnancy BMI. Adjusting for pre-pregnancy BMI 15
and other covariates, comparing quartile 4 v. quartile 1, higher maternal pregnancy intake of 16
sugar sweetened beverages (OR 1.70; 95%CI 1.08, 2.67) and total fructose (OR 1.58; 0.98, 2.53) 17
were associated with greater odds of mid-childhood current asthma (prevalence=19%). Higher 18
early childhood fructose intake (quartile 4 v. quartile 1) was also associated with mid-childhood 19
current asthma in models adjusted for maternal sugar sweetened beverages (OR 1.79; 1.07, 2.97) 20
and after additional adjustment for mid-childhood BMI z-score (OR 1.77; 1.06, 2.95). 21
Conclusion: Higher sugar sweetened beverage and fructose intake during pregnancy and in 22
early childhood was associated with childhood asthma development independent of adiposity. 23
Annals
of th
e Ameri
can T
horac
ic Soc
iety
Copyri
ght ©
2017
Ameri
can T
horac
ic Soc
iety
2
24
Abstract word count: 250 25
26
Annals
of th
e Ameri
can T
horac
ic Soc
iety
Copyri
ght ©
2017
Ameri
can T
horac
ic Soc
iety
3
The rise in childhood asthma prevalence in the United States occurring from the early 1980’s 27
onward is likely multifactorial, with both poor nutrition and excess adiposity hypothesized to be 28
among the important contributors.1 2-5 Concurrent with the rise in asthma has been increased 29
caloric intake from added sugars, most notably in sugar sweetened beverages, which has been 30
linked to the obesity epidemic.6-9 Fructose, often in the form of high fructose corn syrup, is 31
commonly added as a sweetener to sugar sweetened beverages (e.g. fruit drinks and soda).10-13 32
Natural sources of dietary fructose include fruits and their juices.10 33
Many studies have found links between obesity or overweight and asthma, though the biologic 34
mechanisms of these associations and their implications for asthma therapy are still imperfectly 35
understood.14 Recent studies suggest that in addition to influencing asthma through increasing 36
the risk of obesity, high fructose intake may influence the risk of lung diseases at least in part 37
through distinct mechanisms. Independent of elevated body mass index (BMI), high intakes of 38
sugar sweetened beverages and fruit juices were cross-sectionally associated with higher asthma 39
rates in 2 to 9 year-old children as well as with a higher prevalence of chronic obstructive 40
pulmonary disease in adults in the 2003-2006 National Health and Nutrition Examination Survey 41
(NHANES). In addition to their adiposity-related inflammatory potential,15,16,17-21 beverages 42
containing excess free fructose may have specific effects on the gut that may have downstream 43
influences on the lung. Specifically, it has been hypothesized that excess free fructose increases 44
intestinal formation and absorption of advanced glycation end products, which may interact with 45
the receptor of advanced glycation end products, a potential mediator of 22-26 obstructive lung 46
disease development. 47
Few groups have studied longitudinal associations of early life exposure to fructose and its 48
beverage sources with asthma risk. Independently of sugar intake in early childhood, higher 49
Annals
of th
e Ameri
can T
horac
ic Soc
iety
Copyri
ght ©
2017
Ameri
can T
horac
ic Soc
iety
4
maternal intake of free sugar during pregnancy was associated with increased risk of atopy and 50
atopic asthma by age 7-9 years in the Avon Longitudinal Study of Parents and Children.27 We 51
hypothesized that during critical periods of lung and immune growth and development, higher 52
maternal prenatal and early childhood intake of fructose and its beverage sources would be 53
associated with increased asthma in mid-childhood, and that those associations would, in part, be 54
independent of adiposity in the mother or child. 55
METHODS 56
Study design and subjects 57
Between 1999 and 2002 we recruited women into Project Viva in early pregnancy from eight 58
obstetric offices of Atrius Harvard Vanguard Medical Associates, a multi-specialty group 59
practice in eastern Massachusetts.22 Details of recruitment and retention are published.22 Of the 60
2128 women who delivered a live singleton infant, we excluded from this analysis 195 with no 61
maternal pregnancy or early childhood exposure data and 865 with no mid-childhood outcome 62
data. Thus, our sample size for analysis was 1068 mother-child pairs. Compared with the 1068 63
participants in this analysis, the 1060 non-participants were somewhat less likely to have college-64
educated mothers (58% v. 71%) and to have annual household income exceeding $70,000 (54% 65
v. 62%), and mean maternal age was slightly lower (31.1 v. 32.5 y). Maternal pre-pregnancy 66
BMI (mean 25.2 v. 24.6 kg/m2) and intake of pregnancy sugar-sweetened beverages (mean 0.7 v. 67
0.6 servings/day), however, were similar. 68
69
After obtaining written informed consent, we performed in-person study visits with participating 70
mothers at the end of the 1st and 2nd trimesters of pregnancy and with mothers and children 71
Annals
of th
e Ameri
can T
horac
ic Soc
iety
Copyri
ght ©
2017
Ameri
can T
horac
ic Soc
iety
5
during the first few days after delivery. We conducted in-persons visit with mothers and children 72
in early childhood (median 3.3 y) and mid-childhood (median 7.7 y). The institutional review 73
board of Harvard Pilgrim Health Care approved this study protocol. 74
Maternal prenatal and child dietary assessment of sugar sweetened beverage and fructose 75
intake 76
We obtained data on consumption of beverages during pregnancy from semi-quantitative food 77
frequency questionnaires (FFQ) that expectant mothers completed after the first and second 78
research visits, at mean (SD) gestational ages of 11.9 (3.5) and 29.2 (2.6) weeks. Each of the two 79
FFQs was slightly modified for use in pregnancy from a commonly used adult FFQ from which 80
sugar sweetened beverage intake predicted a number of cardiometabolic outcomes.28-32 81
Participants endorsed categories of frequency of beverage consumption from “never/less than 1 82
per month” to a maximum of “2 or more glasses per day” for some fruit juices, “4 or more cans 83
per day” for soda, and “6 or more glasses per day” for water. The time referent for the 1st 84
trimester FFQ was “during this pregnancy,” that is, from the woman’s last menstrual period until 85
she completed the FFQ. For the 2nd trimester FFQ, the time referent was the previous 3 months. 86
The FFQ included 3 questions on regular (sugary) soda intake, 3 questions on sugar-free soda, 5 87
questions on fruit juice, and 1 question on fruit drinks. We defined sugar-sweetened beverages as 88
regular soda and fruit drinks. 89
We also assessed the children’s dietary intakes using an 88-item semi-quantitative child FFQ 90
previously validated among preschool-aged children, which was completed by the mothers in 91
early childhood (median 3.3 years).33 Participants endorsed categories of frequency of beverage 92
consumption from “never” to a maximum of “5 or more times per day.” The time referent was 93
Annals
of th
e Ameri
can T
horac
ic Soc
iety
Copyri
ght ©
2017
Ameri
can T
horac
ic Soc
iety
6
“during the past month.” The FFQ included 1 question on regular (sugary) soda intake, 1 94
questions on sugar-free soda, 2 questions on fruit juice (orange juice and other 100% juice), 1 95
question on fruit drinks, and 1 question on hot chocolate. We defined sugar-sweetened 96
beverages as regular soda and fruit drinks. 97
Using the Harvard nutrition composition database (derived from the US Department of 98
Agriculture and supplemented with information from manufacturers), we computed fructose 99
intake by multiplying the frequency response of each item (foods and beverages) on the FFQ by 100
the fructose content based on average serving size.34 101
Mid-childhood outcome – current asthma 102
On the mid-childhood questionnaire (median 7.7 years), we used asthma questions from the 103
International Study of Asthma and Allergies in Childhood.27 The main outcome was current 104
asthma in mid-childhood, defined as mother’s affirmative response to the child ever having a 105
doctor-diagnosis of asthma, plus either report of wheezing or asthma medication use in the past 106
12 months, based on the mid-childhood questionnaire. The comparison group had no asthma 107
diagnosis ever, and no wheezing or asthma medication use in the past 12 months. 108
109
In a supplementary analysis, we examined mid-childhood blood levels of high sensitivity C-110
reactive protein (hsCRP), interleukin 6 (IL-6), and tumor necrosis factor receptor 2 (TNFR2) 111
among 562 participants. We used an immunoturbidimetric high-sensitivity assay on a Hitachi 112
911 analyzer to determine hsCRP concentrations (Roche Diagnostics). We measured plasma IL-113
6 by enzyme-linked immunosorbent assay and we measured TNFR2 by ELISA (R&D). 114
115
Annals
of th
e Ameri
can T
horac
ic Soc
iety
Copyri
ght ©
2017
Ameri
can T
horac
ic Soc
iety
7
Covariates 116
Using data from interviews and mailed questionnaires, we obtained information on maternal and 117
child socio-demographics including maternal age, race/ethnicity, education, pregnancy smoking 118
status, and household income and child sex and race/ethnicity. At the mid-childhood visit, 119
trained research staff measured each child’s height to the nearest 0.1 cm with a calibrated 120
stadiometer (Shorr Productions, Olney, MD) and weight to the nearest 0.1 kg with a calibrated 121
scale (Tanita model TBF-300A, Tanita Corporation of America, Inc., Arlington Heights, IL). We 122
calculated age- and sex-specific body mass index (BMI, kg/m2) z-scores using US national 123
reference data.35 124
Statistical analysis 125
We used multivariable logistic regression models to examine associations of maternal pregnancy 126
and early childhood sugar sweetened beverage, juice, and total fructose intake (by quartiles) with 127
current asthma in mid-childhood. We also examined exposures as continuous variables. To 128
assess the shape of the exposure-outcome associations, we fit generalized additive models with 129
penalized splines for continuous exposures. Associations were similar for 1st and 2nd trimester 130
maternal diet, so we averaged the two trimesters for analyses of prenatal dietary exposures. We 131
built multivariable logistic regression models in which we adjusted for maternal education, 132
smoking during pregnancy, and pre-pregnancy BMI; household income; and child sex, 133
race/ethnicity, and exact age at the time of the mid-childhood assessment. We further adjusted 134
models with early childhood exposures for mother’s pregnancy sugar sweetened beverage intake. 135
Adding other potentially confounding variables, including parental asthma and maternal 136
gestational weight gain, diet quality score, and vitamin D intake, did not materially change the 137
Annals
of th
e Ameri
can T
horac
ic Soc
iety
Copyri
ght ©
2017
Ameri
can T
horac
ic Soc
iety
8
observed associations, so we did not include them in our final models. In subsequent models, we 138
also adjusted for mid-childhood BMI z-score, a potential mediator. We also implemented 139
mediation analysis via the mediation macro developed by VanderWeele36 to examine the extent 140
to which the exposure – outcome associations were mediated through BMI z-score (indirect 141
effect). 142
As a supplementary analysis, we used multivariable linear regression models, with the same 143
exposures and covariates, and log transformed hsCRP, IL-6, and TNFR2 as continuous 144
outcomes. 145
To increase sample size and reduce bias due to missing data, we imputed missing covariates. 146
Using a chained equation multiple imputation method (PROC MI in SAS), we generated 50 147
imputed data sets including all Project Viva participants with live births (n = 2,128). The 148
imputation model included all exposures, outcomes, and covariates under study, as well as 149
additional potential predictors. In final analytic models, we combined imputed data sets using 150
PROC MIANALYZE in SAS. Participants with missing exposure or outcome data for a given 151
exposure–outcome analysis were excluded from that analysis. We conducted all analyses using 152
SAS version 9.4 (SAS Institute, Cary NC) and R Version 3.1.3 (R Foundation for Statistical 153
Computing, Vienna, Austria). 154
RESULTS 155
Mean (SD) maternal age at enrollment was 32.5 (5.0) years and pre-pregnancy BMI was 24.6 156
(5.1) kg/m2; 10% smoked during pregnancy, 71% were ≥college graduates, and 62% had 157
household incomes >$70,000 per year. 51% of the children were female and 32% were non-158
Annals
of th
e Ameri
can T
horac
ic Soc
iety
Copyri
ght ©
2017
Ameri
can T
horac
ic Soc
iety
9
white. At mid-childhood, 19% of children had current asthma, 12% were obese (BMI ≥95th 159
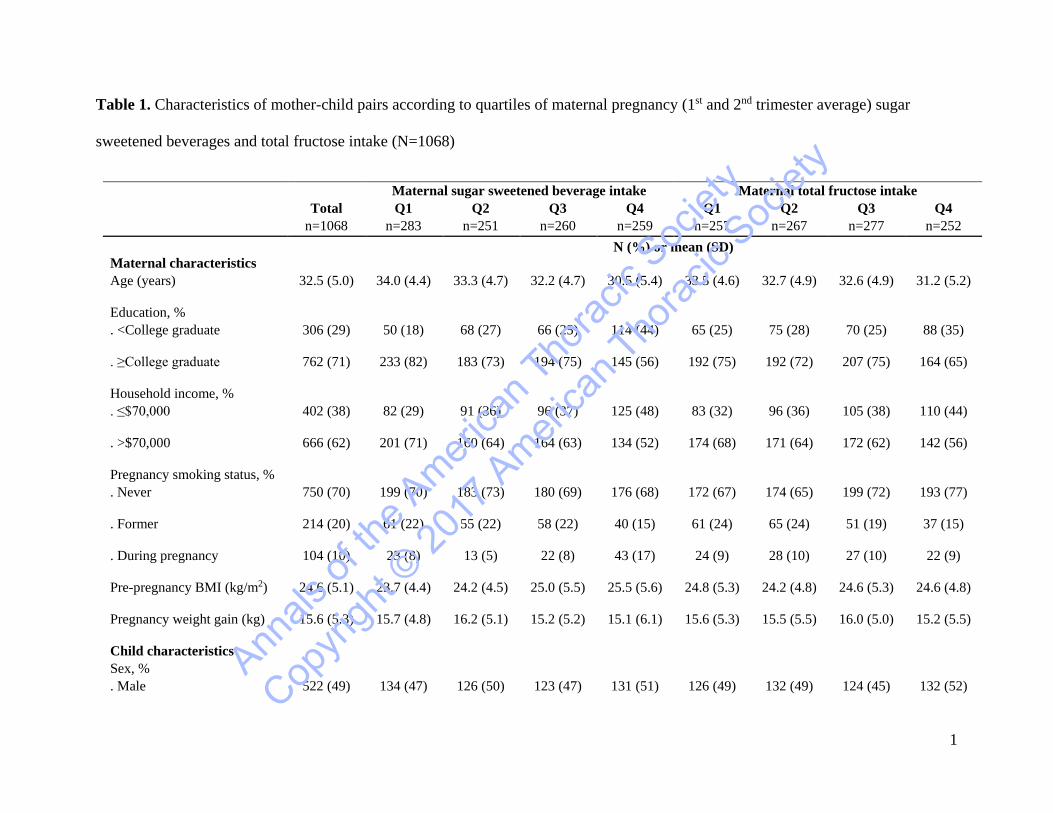
percentile for age and sex), and mean (SD) BMI z-score was 0.37 (0.99). (Table 1) 160
Correlates of higher pregnancy sugar sweetened beverage intake included younger maternal age, 161
higher pre-pregnancy BMI, and smoking during pregnancy as well as indicators of 162
disadvantage/lower SES including lower education and household income. Higher pregnancy 163
sugar sweetened beverage intake was also correlated with child current asthma (15% in quartile 164
(Q) 1 v. 27% in Q4) and BMI z-score (mean 0.30 units in Q1 v. 0.50 in Q4) in mid-childhood. 165
Associations were similar for pregnancy fructose intake. (Table 1) 166
Mothers consumed mean (SD) 32.5 (10.2) grams/day of fructose in pregnancy and children 167
consumed 27.8 (11.6) grams/day in early childhood. As illustrated in Supplementary Figure 1, 168
the largest source of fructose-rich beverage intake was citrus juice for moms (0.8 [0.7] 169
serving/day, range 0-4.4) and non-citrus juice for children (1.1 [1.1] servings/day, range 0-5.0). 170
Mothers reported more sugar sweetened beverage intake in the form of soda and punch (0.6 [0.8] 171
serving/day, range 0-5.1) compared to children (0.2 [0.5] serving/day, range 0-5.1). 172
173
In logistic regression models adjusted for socio-demographic variables and maternal pre-174
pregnancy BMI, comparing quartile 4 v. quartile 1, higher pregnancy intake of sugar sweetened 175
beverages (OR 1.70; 95% CI, 1.08, 2.67) and total fructose (OR 1.58; 95% CI, 0.98, 2.53) were 176
associated with greater odds of mid-childhood current asthma (Table 2). Associations of quartile 177
2 and quartile 3 v. quartile 1 were null with effect estimates close to 1.0. Covariate-adjusted 178
spline models suggested that most of the studied exposure – current asthma associations were 179
fairly linear (Figure 1A and 1B). 180
Annals
of th
e Ameri
can T
horac
ic Soc
iety
Copyri
ght ©
2017
Ameri
can T
horac
ic Soc
iety
10
In models adjusted for maternal sugar sweetened beverages, comparing quartile 4 v. quartile 1, 181
higher early childhood intake of total fructose (OR 1.79 95% CI, 1.07, 2.97) was associated with 182
greater odds of mid-childhood current asthma. These results were almost the same after 183
additionally adjusting for mid-childhood BMI z-score (OR 1.77; 95% CI, 1.06, 2.95). Results for 184
early childhood sugar sweetened beverages were null before (OR 1.19; 95% CI 0.73, 1.93) and 185
after (OR 1.20, 95% CI 0.74, 1.94) adjusting for mid-childhood BMI z-score. (Table 2) As 186
shown in Table 2, ORs for early childhood fructose and current asthma were 1.51, 1.38, and 1.79 187
for quartiles 2, 3, and 4 v. quartile 1, respectively. The results from the Vanderweele mediation 188
macro36 confirmed that the exposure – outcome associations were not mediated through mid-189
childhood BMI z-score (ORs for the indirect effect were close to 1.0 and the CIs crossed 1.0). 190
191
In Supplementary Table 1 we show associations of maternal pregnancy and early childhood 192
intake of sugar sweetened beverages, juice, and total fructose with hsCRP, IL-6, and TNFR2 193
levels (log transformed) in mid-childhood. In multivariable linear regression models, comparing 194
quartile 4 v. quartile 1, higher early childhood intake of sugar sweetened beverages was 195
associated with higher levels of log transformed hsCRP before (β 0.35 95% CI, -0.05, 0.74) and 196
after (β 0.36 95% CI, -0.01, 0.74) adjusting for mid-childhood BMI z-score, although CIs were 197
wide and crossed 0. All other associations were null. (Supplementary Table 1) We also examined 198
associations of maternal prenatal and child fructose intake with mid-childhood plasma leptin and 199
adiponectin, but both were null. 200
DISCUSSION 201
Higher intake of fructose containing beverages or total nutrient fructose in the prenatal 202
and early childhood periods was associated with greater odds of later childhood asthma in our 203
Annals
of th
e Ameri
can T
horac
ic Soc
iety
Copyri
ght ©
2017
Ameri
can T
horac
ic Soc
iety
11
pre-birth cohort. While sugar sweetened beverages as well as juices were significant sources of 204
fructose for the mothers, the primary source of fructose in early childhood was fruit juice. The 205
American Academy of Pediatrics recommends consumption of no more than 4 to 6 ounces 206
(approximately one to two servings) per day of fruit juice for children 1 to 6 years old.37 In the 207
highest quartile of fruit juice consumption in our cohort, children were drinking a mean of 3.9 208
servings (range 3 to 10 servings) per day. 209
In addition to assessing the influence of sugar sweetened beverage intake on asthma, we 210
focused on dietary fructose intake because (1) it is a major contributor to total sugar intake,10 (2) 211
for many pregnant women and most small children, sugar sweetened beverages may not be the 212
primary contributor to total fructose or sugar intake and, (3) there is biologic evidence that 213
fructose may have specific airway effects (see below). 214
Higher intake of sugar sweetened beverages and fructose may influence asthma either 215
through increasing adiposity, and adiposity related pulmonary restriction and inflammation, or 216
through adiposity-independent mechanisms.16 In a mouse model, Singh and colleagues found that 217
high-fat or high-fructose-diet led to reduced nitric oxide related bronchodilation and increased 218
oxo-nitrosative stress without evidence for inflammatory cell infiltrate or goblet cell metaplasia, 219
supporting the hypothesis that high-fructose diet could influence asthma through adiposity-220
independent mechanisms.26 Mediation analyses suggested that child BMI did not mediate the 221
associations of prenatal or early childhood consumption of fructose with mid-childhood risk of 222
asthma. 223
Murine model studies support the hypothesis that there are direct as well as adiposity-224
mediated inflammatory effects of sugars, including fructose, on the airways as well as other 225
Annals
of th
e Ameri
can T
horac
ic Soc
iety
Copyri
ght ©
2017
Ameri
can T
horac
ic Soc
iety
12
target organs.17-21, 38, 39 In a short overnight study of C57BL/6 mice, Kierstein and colleagues39 226
suggested a direct effect of high sugar consumption, which increased susceptibility to allergic 227
airway inflammation and activation of the innate immune system in part through impairment of 228
carbohydrate recognition surfactant protein D (SP-D) which is immunoprotective and prevents 229
pulmonary inflammation.39 Dietary fructose has also been specifically and directly implicated in 230
upregulation of lung inflammation23 through the influences of excess free fructose on the 231
receptor of advanced glycation end products in the lung.40 This evidence is stronger, however for 232
inflammation related to COPD than for asthma. 233
That is not to discount potential obesity-mediated effects. A short-term rodent model 234
study of combined diet and pollution exposure conducted by Sun and colleagues16 suggested an 235
adiposity-mediated effect of fructose. Rats fed a high fructose diet and exposed to ozone had 236
higher macrophage infiltrates in adipose tissue with upregulation of proinflammatory genes and 237
downregulation of anti-inflammatory genes. 238
We further pursued evidence for the biologic plausibility that the association we found 239
between intake of sugar sweetened beverages/fructose and asthma could relate to upregulation of 240
adiposity-related innate cytokines and biomarkers of inflammation. We examined, but did not 241
find associations of maternal prenatal or early childhood intake of sugar sweetened beverages, 242
juice, and total fructose with peripheral blood levels of hsCRP, IL-6, and TNFR2 measured in 243
the children at the mid-childhood visit. As the inflammatory influences of fructose may have 244
occur in the lung compartment, but not systemically or may have occurred at an earlier point in 245
time not captured by our measurements, the absence of association prior intake of fructose with 246
these systemic markers years later does not exclude the possibility that fructose had caused 247
innate cytokine/adipokine-mediated inflammation specific to the airways.39 248
Annals
of th
e Ameri
can T
horac
ic Soc
iety
Copyri
ght ©
2017
Ameri
can T
horac
ic Soc
iety
13
A strength of Project Viva is our longitudinal study design, which included collection of 249
detailed dietary data both during pregnancy and early childhood. These are life-stages critical for 250
immune and lung development, and therefore for the early origins of asthma.41, 42 In contrast with 251
our longitudinal study design, most previous studies of associations of sources of fructose intake 252
with asthma have been cross-sectional, focused on older children and adults, and focused on soda 253
or sugar sweetened beverages without comprehensive dietary data on other sources of fructose, 254
including juice or fruit consumption. In a nationally representative sample of 15,960 US high 255
school students, Park et. al43 found that participants who consumed more soda (2 or more 256
servings per day) had greater odds of asthma compared to those who reported no soda intake 257
(adjusted OR 1.28; 95% CI, 1.02, 1.62) and this association was independent of obesity.43 In an 258
Australian study of people 16 years of age and older, Shi et. al 44 reported that higher sugar 259
sweetened beverage consumption (reported intake of ½ liter or more daily) was associated with 260
greater odds of asthma compared to those who did not report sugar sweetened beverage 261
consumption (adjusted OR 1.26; 95% CI, 1.01, 1.58). DeChristopher et. al23 conducted a more 262
comprehensive cross-sectional evaluation of associations of fructose containing beverages with 263
asthma in children 2-9 years of age evaluated in NHANES during 2003-2006. Higher excess 264
free fructose beverage intake [apple juice and sugar sweetened beverages (non-diet soft drinks 265
and fruit drinks)] was associated with greater odds of asthma. After controlling for other 266
beverage intake, higher apple juice intake by itself (≥5 times per week compared to ≤1 time per 267
month was also associated with higher asthma prevalence.23 268
One of the few longitudinal studies of maternal sugar sweetened beverage ingestion and 269
childhood asthma risk was conducted by Maslova and colleagues45. In adjusted analyses, this 270
study of 60,466 Danish mother-child pairs did not find associations of maternal prenatal sugar 271
Annals
of th
e Ameri
can T
horac
ic Soc
iety
Copyri
ght ©
2017
Ameri
can T
horac
ic Soc
iety
14
sweetened beverage intake with childhood asthma at age 7 years (OR 1.07; 95% CI 0.90, 1.28). 272
The null findings of this study may have been limited by the low consumption of sugar 273
sweetened beverages.45 Our study include a relatively wide range of sugar sweetened beverage 274
consumption and BMI. In addition, the relatively large sample size allowed us to evaluate 275
independent associations of prenatal and early childhood intake of sugar sweetened beverages, 276
juice, and total fructose intake with mid-childhood asthma. 277
While there is diversity in income and socioeconomic status in Project Viva, a limitation 278
of our cohort is that it is relatively advantaged. Our results may not be generalizable to more 279
socio-economically disadvantaged populations. Loss to follow-up, although regrettable, is 280
common in cohort studies in early life. We observed some differences in baseline covariates 281
between participants and those lost to follow-up, but we did not observe differences in maternal 282
sugar sweetened beverage intake. Furthermore, sugar sweetened beverage intake was self-283
reported, and there may have been inaccuracy in assessment because of recall, social desirability, 284
or other biases. Nevertheless, we anticipate that ranking was preserved within the cohort as 285
relative disadvantage (lower income, less education) was associated with higher sugar sweetened 286
beverage intake. Higher parental and child intake of sugar sweetened beverage intake, including 287
intake of sweetened juices,46 has been described as a contributor to the higher prevalence of 288
obesity in disadvantaged populations.6 Policy discussions are ongoing at the national as well as 289
local Boston level as to how to reduce total sugary drink intake, in part by increasing access to 290
affordable healthier choices of drinks.1, 47 These discussions include consideration of the harms 291
and benefits of fruit juice, which contains both sugars that may be obesogenic as well as 292
antioxidants and other healthy components.48, 49 1, 47 293
Annals
of th
e Ameri
can T
horac
ic Soc
iety
Copyri
ght ©
2017
Ameri
can T
horac
ic Soc
iety
15
In conclusion, in our cohort, maternal prenatal sugar sweetened beverage intake and early 294
childhood total fructose intake were associated with asthma in mid-childhood. Our findings 295
contribute to the literature that should be considered when developing recommendations 296
regarding consumption and availability of these drinks during pregnancy and early childhood. 297
Further evaluation of potential mechanisms for influences total fructose with asthma 298
development is warranted, including further assessment of effects of fructose and fructose 299
metabolites on airway inflammation or hyper-reactivity that may be independent of obesity. 300
Annals
of th
e Ameri
can T
horac
ic Soc
iety
Copyri
ght ©
2017
Ameri
can T
horac
ic Soc
iety
1
REFERENCES
1. Akinbami LJ, Moorman JE, Bailey C, Zahran HS, King M, Johnson CA, et al. Trends in asthma prevalence, health care use, and mortality in the United States, 2001-2010. NCHS data brief. 2012(94):1-8. 2. Akinbami LJ, Moorman JE, Garbe PL, Sondik EJ. Status of childhood asthma in the United States, 1980-2007. Pediatrics. 2009;123 Suppl 3:S131-45. 3. Platts-Mills TA. The allergy epidemics: 1870-2010. J Allergy Clin Immunol. 2015;136(1):3-13. 4. Stukus DR. Obesity and asthma: the chicken or the egg? J Allergy Clin Immunol. 2015;135(4):894-5. 5. Weinmayr G, Forastiere F, Buchele G, Jaensch A, Strachan DP, Nagel G. Overweight/obesity and respiratory and allergic disease in children: international study of asthma and allergies in childhood (ISAAC) phase two. PLoS One. 2014;9(12):e113996. 6. Ogden CL, Carroll MD, Kit BK, Flegal KM. Prevalence of childhood and adult obesity in the United States, 2011-2012. JAMA. 2014;311(8):806-14. 7. Swinburn B, Sacks G, Ravussin E. Increased food energy supply is more than sufficient to explain the US epidemic of obesity. Am J Clin Nutr. 2009;90(6):1453-6. 8. Wang YC, Bleich SN, Gortmaker SL. Increasing caloric contribution from sugar-sweetened beverages and 100% fruit juices among US children and adolescents, 1988-2004. Pediatrics. 2008;121(6):e1604-14. 9. Munoz-Pareja M, Guallar-Castillon P, Mesas AE, Lopez-Garcia E, Rodriguez-Artalejo F. Obesity-related eating behaviors are associated with higher food energy density and higher consumption of sugary and alcoholic beverages: a cross-sectional study. PLoS One. 2013;8(10):e77137. 10. Park YK, Yetley EA. Intakes and food sources of fructose in the United States. Am J Clin Nutr. 1993;58(5 Suppl):737S-47S. 11. Bray GA, Popkin BM. Calorie-sweetened beverages and fructose: what have we learned 10 years later. Pediatr Obes. 2013;8(4):242-8. 12. Bray GA. Energy and fructose from beverages sweetened with sugar or high-fructose corn syrup pose a health risk for some people. Adv Nutr. 2013;4(2):220-5. 13. Guthrie JF, Morton JF. Food sources of added sweeteners in the diets of Americans. J Am Diet Assoc. 2000;100(1):43-51, quiz 49-50. 14. Litonjua AA, Gold DR. Asthma and obesity: common early-life influences in the inception of disease. J Allergy Clin Immunol. 2008;121(5):1075-84; quiz 85-6. 15. Singh GM, Micha R, Khatibzadeh S, Lim S, Ezzati M, Mozaffarian D. Estimated Global, Regional, and National Disease Burdens Related to Sugar-Sweetened Beverage Consumption in 2010. Circulation. 2015. 16. Sun L, Liu C, Xu X, Ying Z, Maiseyeu A, Wang A, et al. Ambient fine particulate matter and ozone exposures induce inflammation in epicardial and perirenal adipose tissues in rats fed a high fructose diet. Part Fibre Toxicol. 2013;10:43. 17. Basaranoglu M, Basaranoglu G, Sabuncu T, Senturk H. Fructose as a key player in the development of fatty liver disease. World J Gastroenterol. 2013;19(8):1166-72. 18. Choi HK, Willett W, Curhan G. Fructose-rich beverages and risk of gout in women. JAMA. 2010;304(20):2270-8.
Annals
of th
e Ameri
can T
horac
ic Soc
iety
Copyri
ght ©
2017
Ameri
can T
horac
ic Soc
iety
2
19. Cohen L, Curhan G, Forman J. Association of sweetened beverage intake with incident hypertension. J Gen Intern Med. 2012;27(9):1127-34. 20. de Koning L, Malik VS, Kellogg MD, Rimm EB, Willett WC, Hu FB. Sweetened beverage consumption, incident coronary heart disease, and biomarkers of risk in men. Circulation. 2012;125(14):1735-41, S1. 21. de Koning L, Malik VS, Rimm EB, Willett WC, Hu FB. Sugar-sweetened and artificially sweetened beverage consumption and risk of type 2 diabetes in men. Am J Clin Nutr. 2011;93(6):1321-7. 22. DeChristopher LR. Excess free fructose and childhood asthma. European journal of clinical nutrition. 2015;69(12):1371. 23. DeChristopher LR, Uribarri J, Tucker KL. Intakes of apple juice, fruit drinks and soda are associated with prevalent asthma in US children aged 2-9 years. Public Health Nutr. 2015:1-8. 24. DeChristopher LR, Uribarri J, Tucker KL. Intake of high fructose corn syrup sweetened soft drinks is associated with prevalent chronic bronchitis in U.S. Adults, ages 20-55 y. Nutrition journal. 2015;14:107. 25. DeChristopher LR, Uribarri J, Tucker KL. The link between soda intake and asthma: science points to the high-fructose corn syrup, not the preservatives: a commentary. Nutrition & diabetes. 2016;6(11):e234. 26. Singh VP, Aggarwal R, Singh S, Banik A, Ahmad T, Patnaik BR, et al. Metabolic Syndrome Is Associated with Increased Oxo-Nitrative Stress and Asthma-Like Changes in Lungs. PLoS One. 2015;10(6):e0129850. 27. Bedard A, Northstone K, Henderson AJ, Shaheen SO. Maternal intake of sugar during pregnancy and childhood respiratory and atopic outcomes. The European respiratory journal. 2017;50(1). 28. Chen L, Hu FB, Yeung E, Willett W, Zhang C. Prospective study of pre-gravid sugar-sweetened beverage consumption and the risk of gestational diabetes mellitus. Diabetes care. 2009;32(12):2236-41. 29. Fawzi WW, Rifas-Shiman SL, Rich-Edwards JW, Willett WC, Gillman MW. Calibration of a semi-quantitative food frequency questionnaire in early pregnancy. Annals of epidemiology. 2004;14(10):754-62. 30. Malik VS, Pan A, Willett WC, Hu FB. Sugar-sweetened beverages and weight gain in children and adults: a systematic review and meta-analysis. Am J Clin Nutr. 2013;98(4):1084-102. 31. Malik VS, Popkin BM, Bray GA, Despres JP, Willett WC, Hu FB. Sugar-sweetened beverages and risk of metabolic syndrome and type 2 diabetes: a meta-analysis. Diabetes care. 2010;33(11):2477-83. 32. Malik VS, Willett WC, Hu FB. Sugar-sweetened beverages and BMI in children and adolescents: reanalyses of a meta-analysis. Am J Clin Nutr. 2009;89(1):438-9; author reply 9-40. 33. Blum RE, Wei EK, Rockett HR, Langeliers JD, Leppert J, Gardner JD, et al. Validation of a food frequency questionnaire in Native American and Caucasian children 1 to 5 years of age. Maternal and child health journal. 1999;3(3):167-72. 34. United States Department of Agriculture. Agricultural research service. 2003. USDA national nutrient database for standard reference, release 16. http://Www.nal.usda.gov/fnic/foodcomp. Accessed May 1, 2017. 35. Kuczmarski RJ, Ogden CL, Grummer-Strawn LM, Flegal KM, Guo SS, Wei R, et al. CDC growth charts: United States. Advance data. 2000(314):1-27.
Annals
of th
e Ameri
can T
horac
ic Soc
iety
Copyri
ght ©
2017
Ameri
can T
horac
ic Soc
iety
3
36. Valeri L, Vanderweele TJ. Mediation analysis allowing for exposure-mediator interactions and causal interpretation: theoretical assumptions and implementation with SAS and SPSS macros. Psychological methods. 2013;18(2):137-50. 37. American Academy of Pediatrics: The use and misuse of fruit juice in pediatrics. Pediatrics. 2001;107(5):1210-3. 38. Sun L, Liu C, Xu X, Ying Z, Maiseyeu A, Wang A, et al. Ambient fine particulate matter and ozone exposures induce inflammation in epicardial and perirenal adipose tissues in rats fed a high fructose diet. Part Fibre Toxicol. 2013;10(1):43. 39. Kierstein S, Krytska K, Kierstein G, Hortobágyi L, Zhu X, Haczku A. Sugar Consumption Increases Susceptibility to Allergic Airway Inflammation and Activates the Innate Immune System in the Lung. Journal of Allergy and Clinical Immunology.121(2):S196. 40. Yonchuk JG, Silverman EK, Bowler RP, Agusti A, Lomas DA, Miller BE, et al. Circulating soluble receptor for advanced glycation end products (sRAGE) as a biomarker of emphysema and the RAGE axis in the lung. American journal of respiratory and critical care medicine. 2015;192(7):785-92. 41. Gluckman PD, Hanson MA, Cooper C, Thornburg KL. Effect of in utero and early-life conditions on adult health and disease. N Engl J Med. 2008;359(1):61-73. 42. Shi W, Bellusci S, Warburton D. Lung development and adult lung diseases. Chest. 2007;132(2):651-6. 43. Park S, Blanck HM, Sherry B, Jones SE, Pan L. Regular-soda intake independent of weight status is associated with asthma among US high school students. J Acad Nutr Diet. 2013;113(1):106-11. 44. Shi Z, Dal Grande E, Taylor AW, Gill TK, Adams R, Wittert GA. Association between soft drink consumption and asthma and chronic obstructive pulmonary disease among adults in Australia. Respirology. 2012;17(2):363-9. 45. Maslova E, Strom M, Olsen SF, Halldorsson TI. Consumption of artificially-sweetened soft drinks in pregnancy and risk of child asthma and allergic rhinitis. PLoS One. 2013;8(2):e57261. 46. Ogden CL, Kit BK, Carroll MD, Park S. Consumption of sugar drinks in the United States, 2005-2008. NCHS data brief. 2011(71):1-8. 47. Akinbami LJ, Moorman JE, Simon AE, Schoendorf KC. Trends in racial disparities for asthma outcomes among children 0 to 17 years, 2001-2010. J Allergy Clin Immunol. 2014;134(3):547-53 e5. 48. Han YY, Forno E, Holguin F, Celedon JC. Diet and asthma: an update. Curr Opin Allergy Clin Immunol. 2015;15(4):369-74. 49. Kim JH, Ellwood PE, Asher MI. Diet and asthma: looking back, moving forward. Respir Res. 2009;10:49.
Annals
of th
e Ameri
can T
horac
ic Soc
iety
Copyri
ght ©
2017
Ameri
can T
horac
ic Soc
iety
1
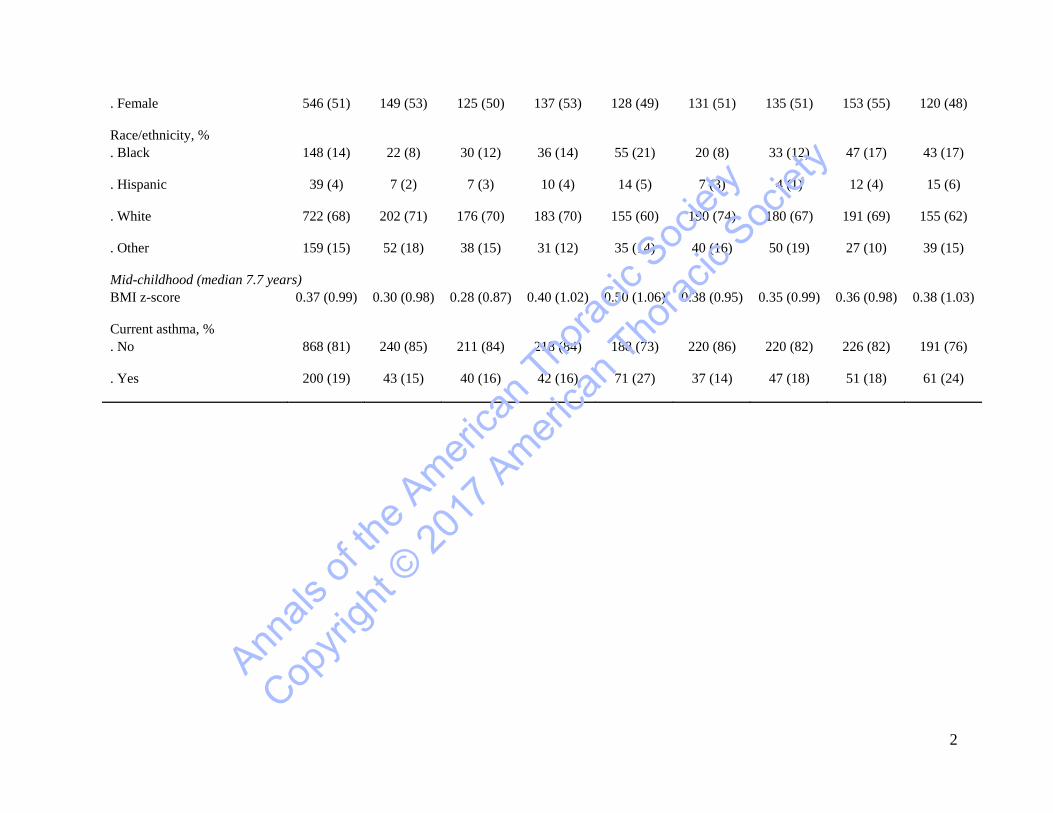
Table 1. Characteristics of mother-child pairs according to quartiles of maternal pregnancy (1st and 2nd trimester average) sugar
sweetened beverages and total fructose intake (N=1068)
Maternal sugar sweetened beverage intake Maternal total fructose intake Total Q1 Q2 Q3 Q4 Q1 Q2 Q3 Q4
n=1068 n=283 n=251 n=260 n=259 n=257 n=267 n=277 n=252 N (%) or mean (SD)
Maternal characteristics Age (years) 32.5 (5.0) 34.0 (4.4) 33.3 (4.7) 32.2 (4.7) 30.5 (5.4) 33.5 (4.6) 32.7 (4.9) 32.6 (4.9) 31.2 (5.2)
Education, %
. <College graduate 306 (29) 50 (18) 68 (27) 66 (25) 114 (44) 65 (25) 75 (28) 70 (25) 88 (35)
. ≥College graduate 762 (71) 233 (82) 183 (73) 194 (75) 145 (56) 192 (75) 192 (72) 207 (75) 164 (65)
Household income, %
. ≤$70,000 402 (38) 82 (29) 91 (36) 96 (37) 125 (48) 83 (32) 96 (36) 105 (38) 110 (44)
. >$70,000 666 (62) 201 (71) 160 (64) 164 (63) 134 (52) 174 (68) 171 (64) 172 (62) 142 (56)
Pregnancy smoking status, %
. Never 750 (70) 199 (70) 183 (73) 180 (69) 176 (68) 172 (67) 174 (65) 199 (72) 193 (77)
. Former 214 (20) 61 (22) 55 (22) 58 (22) 40 (15) 61 (24) 65 (24) 51 (19) 37 (15)
. During pregnancy 104 (10) 23 (8) 13 (5) 22 (8) 43 (17) 24 (9) 28 (10) 27 (10) 22 (9)
Pre-pregnancy BMI (kg/m2) 24.6 (5.1) 23.7 (4.4) 24.2 (4.5) 25.0 (5.5) 25.5 (5.6) 24.8 (5.3) 24.2 (4.8) 24.6 (5.3) 24.6 (4.8)
Pregnancy weight gain (kg) 15.6 (5.3) 15.7 (4.8) 16.2 (5.1) 15.2 (5.2) 15.1 (6.1) 15.6 (5.3) 15.5 (5.5) 16.0 (5.0) 15.2 (5.5)
Child characteristics Sex, %
. Male 522 (49) 134 (47) 126 (50) 123 (47) 131 (51) 126 (49) 132 (49) 124 (45) 132 (52) Ann
als of
the A
merica
n Tho
racic
Societ
y
Copyri
ght ©
2017
Ameri
can T
horac
ic Soc
iety
2
. Female 546 (51) 149 (53) 125 (50) 137 (53) 128 (49) 131 (51) 135 (51) 153 (55) 120 (48)
Race/ethnicity, %
. Black 148 (14) 22 (8) 30 (12) 36 (14) 55 (21) 20 (8) 33 (12) 47 (17) 43 (17)
. Hispanic 39 (4) 7 (2) 7 (3) 10 (4) 14 (5) 7 (3) 4 (1) 12 (4) 15 (6)
. White 722 (68) 202 (71) 176 (70) 183 (70) 155 (60) 190 (74) 180 (67) 191 (69) 155 (62)
. Other 159 (15) 52 (18) 38 (15) 31 (12) 35 (14) 40 (16) 50 (19) 27 (10) 39 (15)
Mid-childhood (median 7.7 years) BMI z-score 0.37 (0.99) 0.30 (0.98) 0.28 (0.87) 0.40 (1.02) 0.50 (1.06) 0.38 (0.95) 0.35 (0.99) 0.36 (0.98) 0.38 (1.03)
Current asthma, %
. No 868 (81) 240 (85) 211 (84) 218 (84) 188 (73) 220 (86) 220 (82) 226 (82) 191 (76)
. Yes 200 (19) 43 (15) 40 (16) 42 (16) 71 (27) 37 (14) 47 (18) 51 (18) 61 (24)
Annals
of th
e Ameri
can T
horac
ic Soc
iety
Copyri
ght ©
2017
Ameri
can T
horac
ic Soc
iety
1
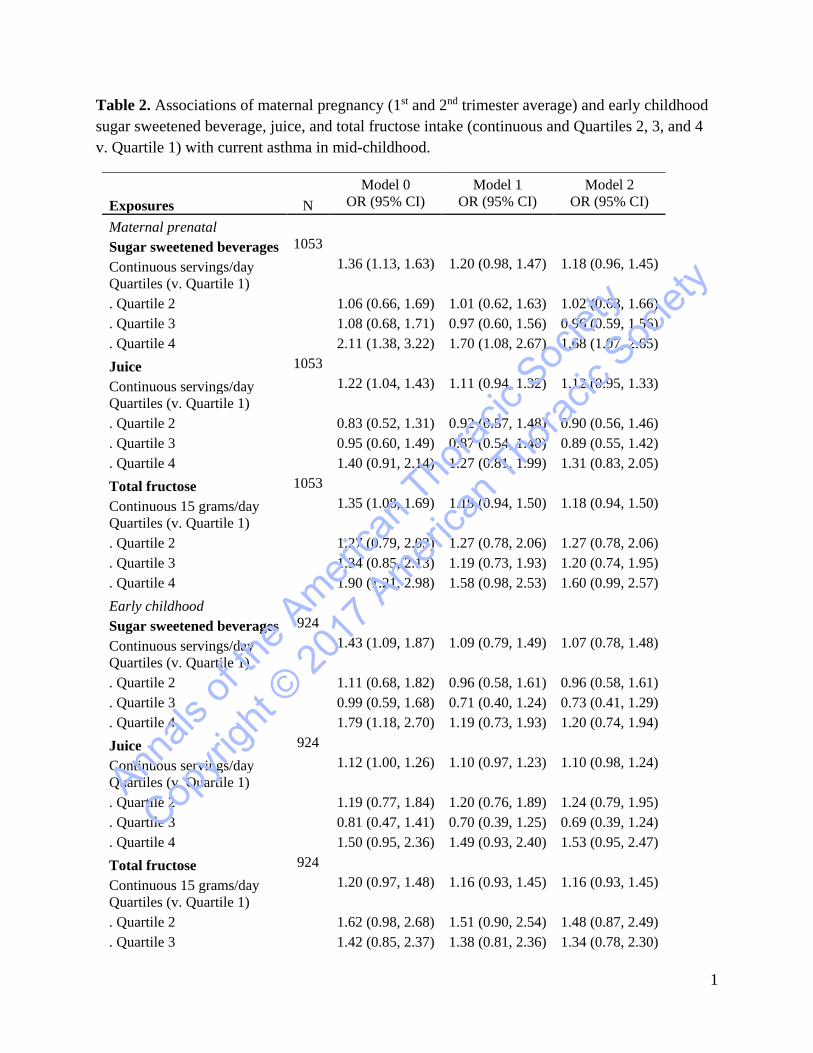
Table 2. Associations of maternal pregnancy (1st and 2nd trimester average) and early childhood sugar sweetened beverage, juice, and total fructose intake (continuous and Quartiles 2, 3, and 4 v. Quartile 1) with current asthma in mid-childhood.
Model 0 Model 1 Model 2 Exposures N OR (95% CI) OR (95% CI) OR (95% CI)
Maternal prenatal Sugar sweetened beverages 1053
Continuous servings/day
1.36 (1.13, 1.63) 1.20 (0.98, 1.47) 1.18 (0.96, 1.45) Quartiles (v. Quartile 1)
. Quartile 2 1.06 (0.66, 1.69) 1.01 (0.62, 1.63) 1.02 (0.63, 1.66)
. Quartile 3 1.08 (0.68, 1.71) 0.97 (0.60, 1.56) 0.96 (0.59, 1.56)
. Quartile 4 2.11 (1.38, 3.22) 1.70 (1.08, 2.67) 1.68 (1.07, 2.65) Juice 1053 Continuous servings/day
1.22 (1.04, 1.43) 1.11 (0.94, 1.32) 1.12 (0.95, 1.33)
Quartiles (v. Quartile 1)
. Quartile 2 0.83 (0.52, 1.31) 0.92 (0.57, 1.48) 0.90 (0.56, 1.46) . Quartile 3 0.95 (0.60, 1.49) 0.87 (0.54, 1.40) 0.89 (0.55, 1.42) . Quartile 4 1.40 (0.91, 2.14) 1.27 (0.81, 1.99) 1.31 (0.83, 2.05) Total fructose 1053
Continuous 15 grams/day
1.35 (1.08, 1.69) 1.19 (0.94, 1.50) 1.18 (0.94, 1.50) Quartiles (v. Quartile 1)
. Quartile 2 1.27 (0.79, 2.03) 1.27 (0.78, 2.06) 1.27 (0.78, 2.06)
. Quartile 3 1.34 (0.85, 2.13) 1.19 (0.73, 1.93) 1.20 (0.74, 1.95)
. Quartile 4 1.90 (1.21, 2.98) 1.58 (0.98, 2.53) 1.60 (0.99, 2.57) Early childhood
Sugar sweetened beverages 924
Continuous servings/day
1.43 (1.09, 1.87) 1.09 (0.79, 1.49) 1.07 (0.78, 1.48) Quartiles (v. Quartile 1)
. Quartile 2 1.11 (0.68, 1.82) 0.96 (0.58, 1.61) 0.96 (0.58, 1.61)
. Quartile 3 0.99 (0.59, 1.68) 0.71 (0.40, 1.24) 0.73 (0.41, 1.29)
. Quartile 4 1.79 (1.18, 2.70) 1.19 (0.73, 1.93) 1.20 (0.74, 1.94) Juice 924
Continuous servings/day
1.12 (1.00, 1.26) 1.10 (0.97, 1.23) 1.10 (0.98, 1.24) Quartiles (v. Quartile 1)
. Quartile 2 1.19 (0.77, 1.84) 1.20 (0.76, 1.89) 1.24 (0.79, 1.95)
. Quartile 3 0.81 (0.47, 1.41) 0.70 (0.39, 1.25) 0.69 (0.39, 1.24)
. Quartile 4 1.50 (0.95, 2.36) 1.49 (0.93, 2.40) 1.53 (0.95, 2.47) Total fructose 924
Continuous 15 grams/day
1.20 (0.97, 1.48) 1.16 (0.93, 1.45) 1.16 (0.93, 1.45) Quartiles (v. Quartile 1)
. Quartile 2 1.62 (0.98, 2.68) 1.51 (0.90, 2.54) 1.48 (0.87, 2.49)
. Quartile 3 1.42 (0.85, 2.37) 1.38 (0.81, 2.36) 1.34 (0.78, 2.30)
Annals
of th
e Ameri
can T
horac
ic Soc
iety
Copyri
ght ©
2017
Ameri
can T
horac
ic Soc
iety
2
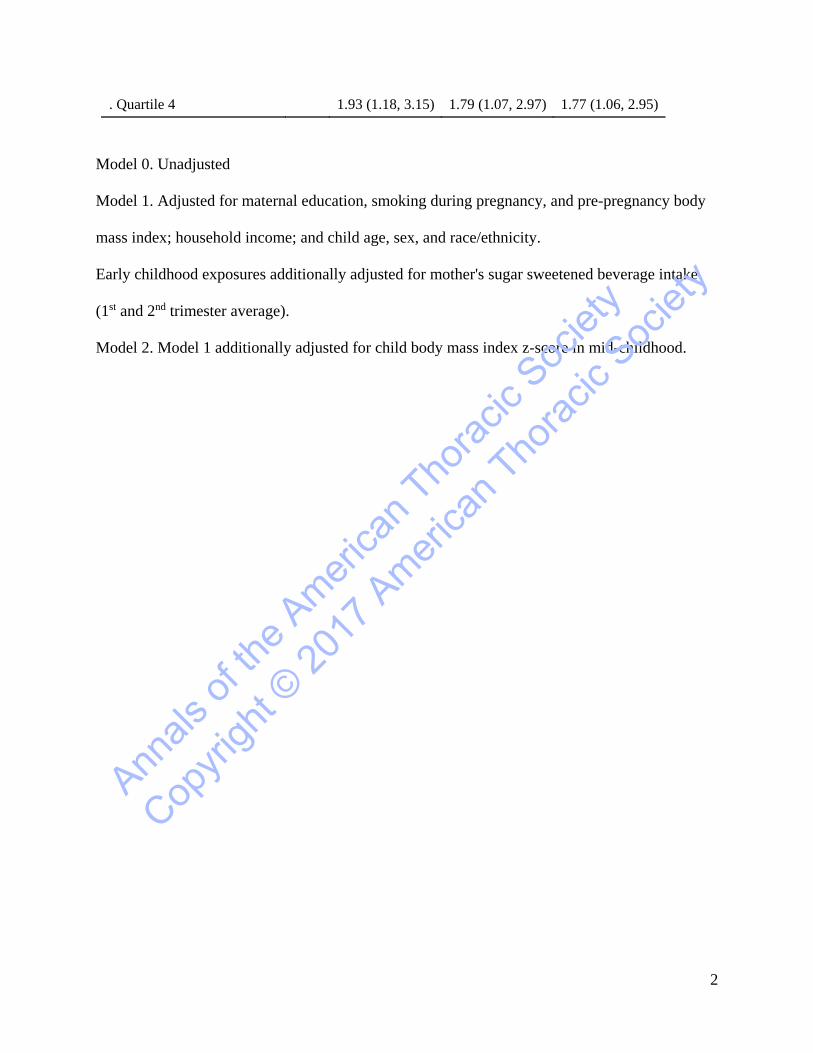
. Quartile 4 1.93 (1.18, 3.15) 1.79 (1.07, 2.97) 1.77 (1.06, 2.95)
Model 0. Unadjusted
Model 1. Adjusted for maternal education, smoking during pregnancy, and pre-pregnancy body
mass index; household income; and child age, sex, and race/ethnicity.
Early childhood exposures additionally adjusted for mother's sugar sweetened beverage intake
(1st and 2nd trimester average).
Model 2. Model 1 additionally adjusted for child body mass index z-score in mid-childhood.
Annals
of th
e Ameri
can T
horac
ic Soc
iety
Copyri
ght ©
2017
Ameri
can T
horac
ic Soc
iety
3
Figure 1. General additive models (splines) illustrating associations of maternal pregnancy and
early childhood sugar sweetened beverage, juice, and total fructose intake with current asthma in
mid-childhood (log-scale odds ratios and 95% CIs).
Figure 1 footnote. Adjusted for maternal education, smoking during pregnancy, and pre-
pregnancy body mass index; household income; and child age, sex, and race/ethnicity. Early
childhood exposures additionally adjusted for mother's sugar sweetened beverage intake (1st and
2nd trimester average).
Annals
of th
e Ameri
can T
horac
ic Soc
iety
Copyri
ght ©
2017
Ameri
can T
horac
ic Soc
iety