Embed Size (px)
Citation preview
1
ANNUAL REPORT
BANK OF
BOTSWANA
2012

3
BANK OF BOTSWANA ANNUAL REPORT 2012

4
BANK OF BOTSWANA ANNUAL REPORT 2012
Board MeMBersas at December 31, 2012
Prof P Collier
G K Cunliffe
Linah K MohohloGovernor and Chairman
C S Botlhole-Mmopi
Dr J Sentsho
Prof H Siphambe
S Sekwakwa
R N Matthews
5
BANK OF BOTSWANA ANNUAL REPORT 2012
BOARD MEMBERSas at December 31, 2012
Linah K MohohloGovernor and Chairman
S Sekwakwa
G K Cunliffe
C S Botlhole-Mmopi
Prof H Siphambe
Dr J Sentsho
R N Matthews
Prof P Collier
6
BANK OF BOTSWANA ANNUAL REPORT 2012
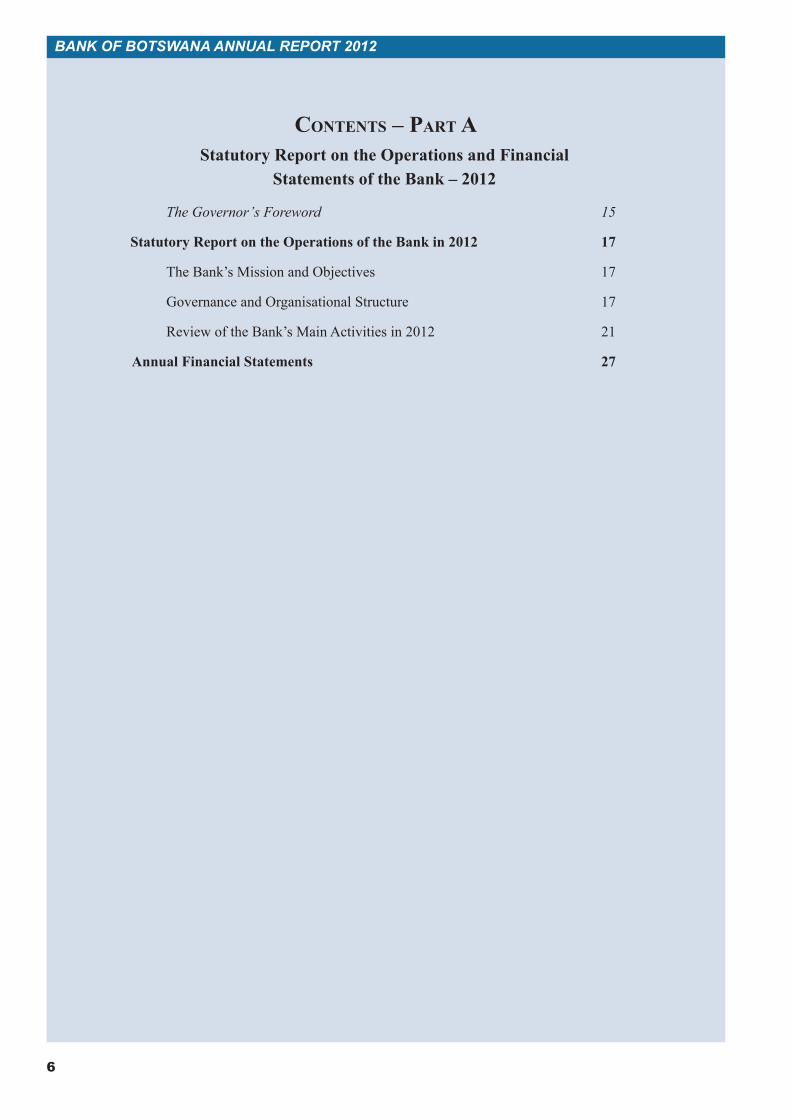
CONTENTS – PART A
The Governor’s Foreword 15
Statutory Report on the Operations of the Bank in 2012 17
The Bank’s Mission and Objectives 17
Governance and Organisational Structure 17
Review of the Bank’s Main Activities in 2012 21
Annual Financial Statements 27
Statutory Report on the Operations and Financial Statements of the Bank – 2012
7
BANK OF BOTSWANA ANNUAL REPORT 2012
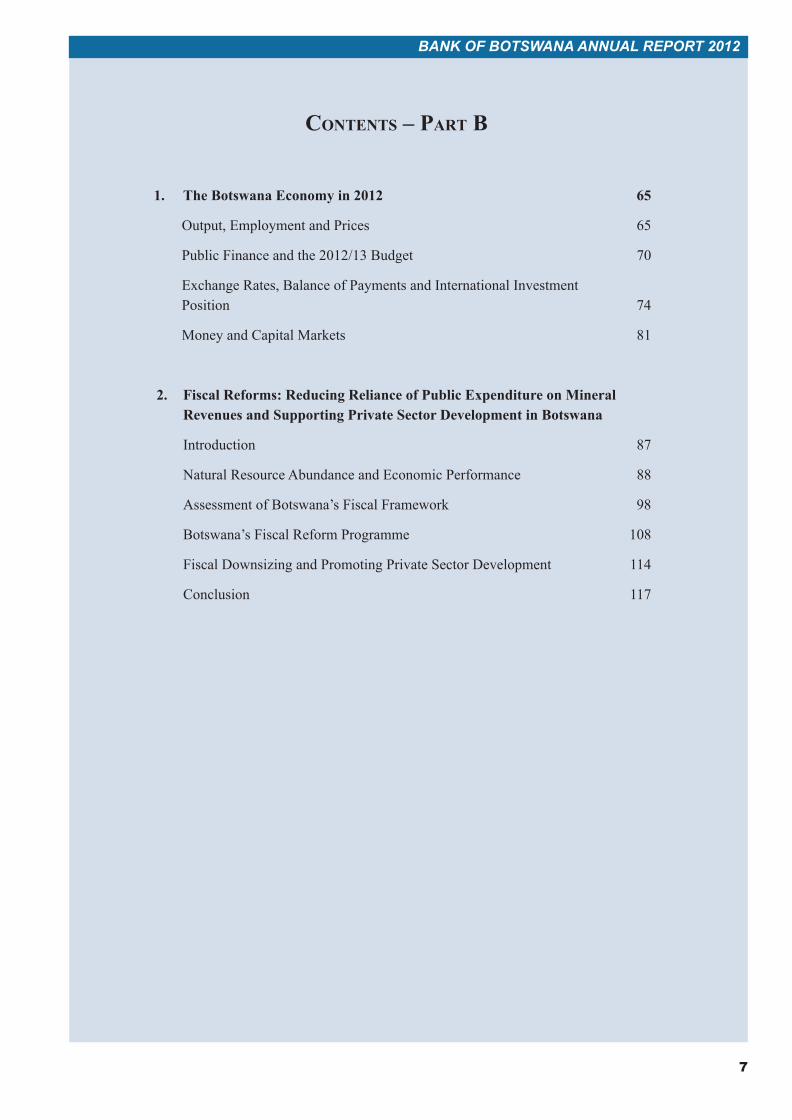
CONTENTS – PART B
1. The Botswana Economy in 2012 65
Output, Employment and Prices 65
Public Finance and the 2012/13 Budget 70
Exchange Rates, Balance of Payments and International Investment Position 74
Money and Capital Markets 81
2. Fiscal Reforms: Reducing Reliance of Public Expenditure on Mineral Revenues and Supporting Private Sector Development in Botswana
Introduction 87
Natural Resource Abundance and Economic Performance 88
Assessment of Botswana’s Fiscal Framework 98
Botswana’s Fiscal Reform Programme 108
Fiscal Downsizing and Promoting Private Sector Development 114
Conclusion 117
8
BANK OF BOTSWANA ANNUAL REPORT 2012
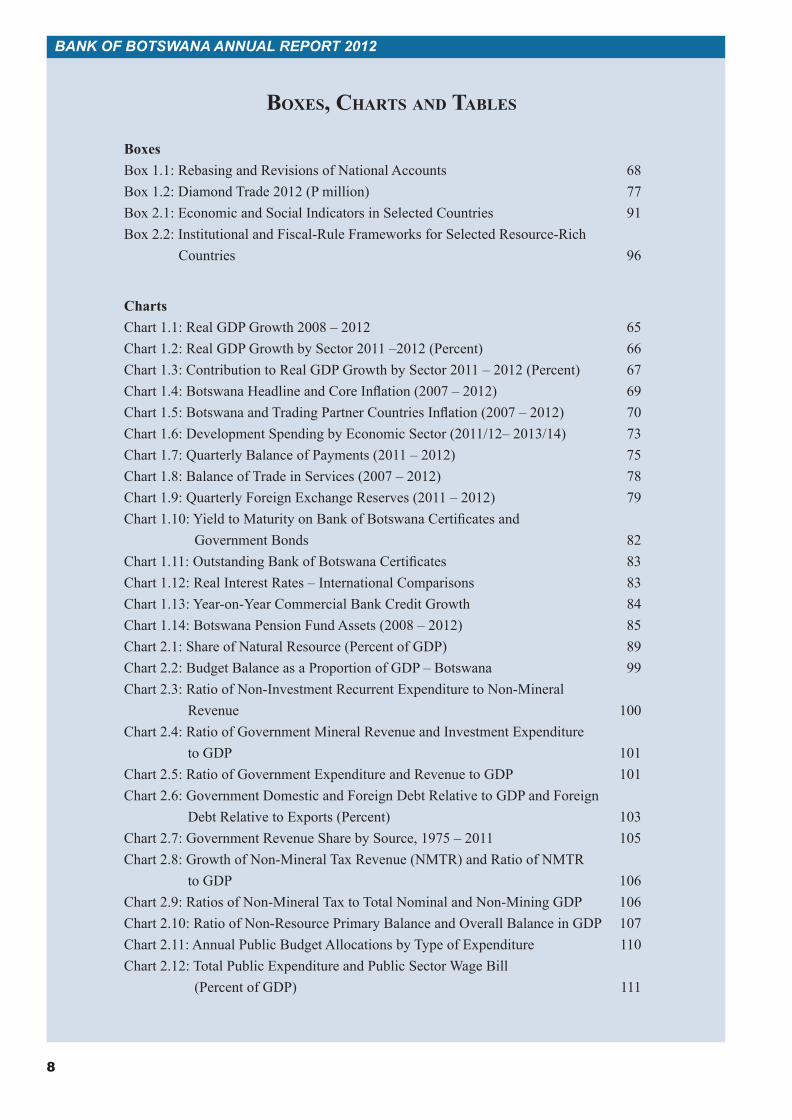
BOXES, CHARTS AND TABLES
BoxesBox 1.1: Rebasing and Revisions of National Accounts 68Box 1.2: Diamond Trade 2012 (P million) 77Box 2.1: Economic and Social Indicators in Selected Countries 91Box 2.2: Institutional and Fiscal-Rule Frameworks for Selected Resource-Rich
Countries 96
ChartsChart 1.1: Real GDP Growth 2008 – 2012 65Chart 1.2: Real GDP Growth by Sector 2011 –2012 (Percent) 66Chart 1.3: Contribution to Real GDP Growth by Sector 2011 – 2012 (Percent) 67Chart 1.4: Botswana Headline and Core Inflation (2007 – 2012) 69Chart 1.5: Botswana and Trading Partner Countries Inflation (2007 – 2012) 70Chart 1.6: Development Spending by Economic Sector (2011/12– 2013/14) 73Chart 1.7: Quarterly Balance of Payments (2011 – 2012) 75Chart 1.8: Balance of Trade in Services (2007 – 2012) 78Chart 1.9: Quarterly Foreign Exchange Reserves (2011 – 2012) 79Chart 1.10: Yield to Maturity on Bank of Botswana Certificates and
Government Bonds 82Chart 1.11: Outstanding Bank of Botswana Certificates 83Chart 1.12: Real Interest Rates – International Comparisons 83Chart 1.13: Year-on-Year Commercial Bank Credit Growth 84Chart 1.14: Botswana Pension Fund Assets (2008 – 2012) 85Chart 2.1: Share of Natural Resource (Percent of GDP) 89Chart 2.2: Budget Balance as a Proportion of GDP – Botswana 99Chart 2.3: Ratio of Non-Investment Recurrent Expenditure to Non-Mineral
Revenue 100Chart 2.4: Ratio of Government Mineral Revenue and Investment Expenditure
to GDP 101Chart 2.5: Ratio of Government Expenditure and Revenue to GDP 101Chart 2.6: Government Domestic and Foreign Debt Relative to GDP and Foreign
Debt Relative to Exports (Percent) 103Chart 2.7: Government Revenue Share by Source, 1975 – 2011 105Chart 2.8: Growth of Non-Mineral Tax Revenue (NMTR) and Ratio of NMTR
to GDP 106Chart 2.9: Ratios of Non-Mineral Tax to Total Nominal and Non-Mining GDP 106Chart 2.10: Ratio of Non-Resource Primary Balance and Overall Balance in GDP 107Chart 2.11: Annual Public Budget Allocations by Type of Expenditure 110Chart 2.12: Total Public Expenditure and Public Sector Wage Bill
(Percent of GDP) 111
9
BANK OF BOTSWANA ANNUAL REPORT 2012
Chart 2.13: General Government Expenditure and Wage Bill, 2011 (Percent of GDP) 111
FiguresFigure 2.1: Decision Tree to Determine Fiscal Framework Priorities 97
TablesTable 1.1: Global Growth Estimates 2012 – 2014 (Percent) 67Table 1.2: Government Budget 2011/12 – 2013/14 (P million) 71Table 1.3: Government Budget 2008/09 – 2013/14 72Table 1.4: Government Debt and Guarantees for 2011/12 – 2012/13 (P million) 74Table 1.5: Pula Exchange Rates against Selected Currencies 75Table 1.6: Balance of Payments 2008 – 2012 (P million) 76Table 1.7: Exports 2011 – 2012 (P million) 77 Table 1.8: Imports 2011 – 2012 (P million) 78Table 1.9: Levels of Foreign Investment in Botswana by Industry 2011 (P million) 80Table 1.10: Levels of Foreign Investment in Botswana by Country 2011 (P million) 80Table 2.1: GDP and Current Account Balance for Mineral-rich and Mineral-poor
Countries 2000 – 2011 89Table 2.2: Fiscal Balances for Various Resource-Rich Countries 98Table 2.3: Growth Rates for Selected Indicators (Percent) 102Table 2.4: Tax Effort for Selected Countries (Ratio of Total Tax to Nominal GDP) 106Table 2.5: Government Budget for 2009/10 – 2014/15 (P million) 110
10
BANK OF BOTSWANA ANNUAL REPORT 2012
ABBREVIATIONS USED IN THE REPORT
AACB Association of African Central Banks
AC Audit Committee
BAB Banker’s Association of Botswana
BEAC Business and Economic Advisory Council
BIS Bank of International Settlements
BITC Botswana Investment and Trade Centre
BMC Botswana Meat Commission
BoBCs Bank of Botswana Certificates
BTC Botswana Telecommunications Corporation
BURS Botswana Unified Revenue Service
CCBG Committee for Central Bank Governors
CEDA Citizen Entrepreneurial Development Agency
CITS Cheque Imaging Truncation System
CMC Cash Management Centre
CPI Consumer Price Index
CSD Central Securities Depository
DDF Domestic Development Fund
DTCB Diamond Trading Company Botswana
ECH Electronic Clearing House
EDD Economic Diversification Drive
EFT Electronic Funds Transfers
ESOP Employee Stock Option Plan
FAP Financial Assistance Policy
FCAs Foreign Currency Accounts
FDI Foreign Direct Investment
FRL Fiscal Responsibility Legislation
GDP Gross Domestic Product
GPF Government Petroleum Fund
HIPC Heavily Indebted Poor Countries
IFRS International Financial Reporting Standards
IIP International Investment Position
IMF International Monetary Fund
LEA Local Enterprises Authority
MFDP Ministry of Finance and Development Planning
NDBC National Doing Business Committee
NDP National Development Plan
11
BANK OF BOTSWANA ANNUAL REPORT 2012
NEER Nominal Effective Exchange Rate
NRPB Non-Resource Primary Balance
NSO National Strategy Office
OMO Open Market Operations
PDI Power Distance Index
PDSF Public Debt Service Fund
PEEPA Public Enterprises Evaluation and Privatisation Agency
PEFA Public Enterprises Financial Accountability
PFM Public Finance Management
PIH Permanent Income Hypothesis
REER Real Effective Exchange Rate
REMCO Remuneration Committee
PRGF Poverty Reduction Growth Facility
RSF Revenue Stabilisation Fund
S&P Standard & Poor’s
SACU Southern African Customs Union
SADC Southern African Development Community
SBI Sustainable Budget Index
SDR Special Drawing Rights
SMMEs Small, Micro, and Medium Sized Enterprises
UNDP United Nations Development Programme
USD United States Dollar
VAT Value Added Tax

Part a
Statutory rePort on the oPerationS and
Financial StatementS oF the Bank For 2012
Bank oF BotSwana
14
BANK OF BOTSWANA ANNUAL REPORT 2012
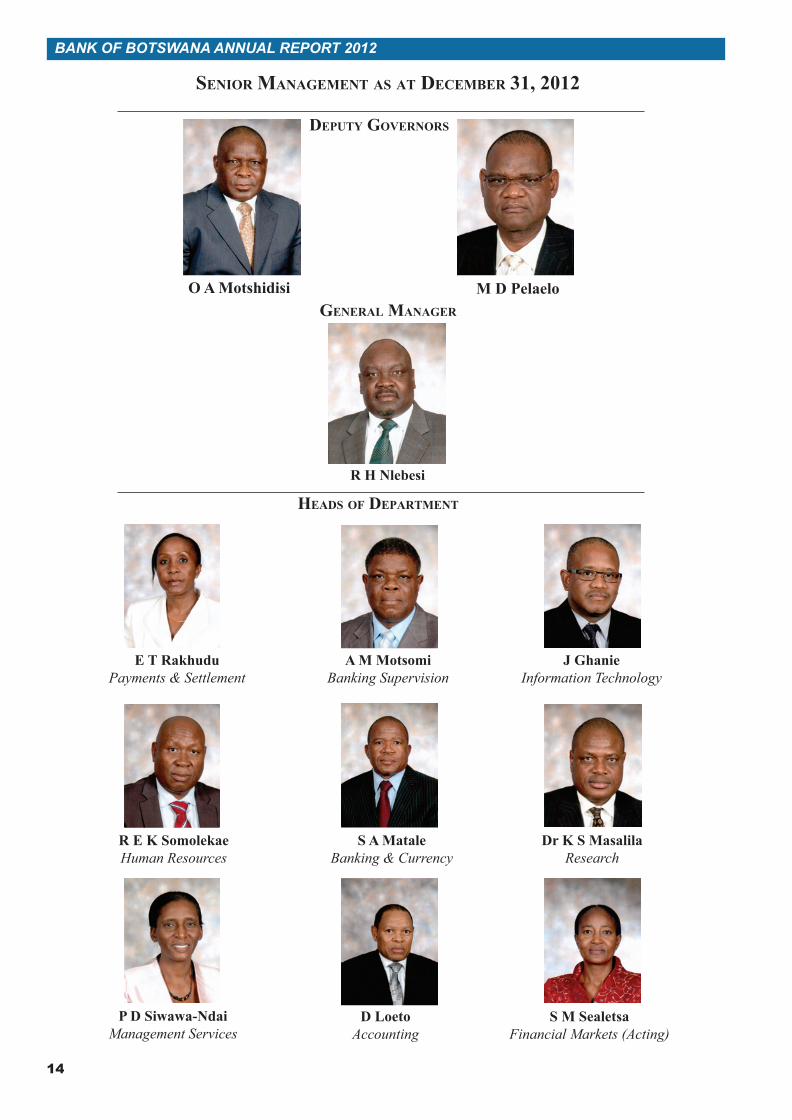
headS oF dePartment
M D PelaeloO A Motshidisi
dePuty GovernorS
General manaGer
R H Nlebesi
Senior manaGement aS at decemBer 31, 2012
S M SealetsaFinancial Markets (Acting)
A M MotsomiBanking Supervision
S A MataleBanking & Currency
J GhanieInformation Technology
R E K SomolekaeHuman Resources
D LoetoAccounting
E T RakhuduPayments & Settlement
Dr K S MasalilaResearch
P D Siwawa-NdaiManagement Services
15
PART A: STATUTORy REPORT ON ThE OPERATiONS ANd FiNANciAL STATEmENTS OF ThE BANK, 2012
Statutory rePort on oPerationS and Financial StatementS oF the Bank - 2012
Governor’S Foreword This Annual Report for 2012 is published in accordance with Section 68(1) of the Bank of Botswana Act (CAP 55:01). The Report outlines economic and financial developments for 2012 from global and domestic perspectives; it also highlights major operational achievements, the accomplishment of which was derived from dedicated Board guidance and support of Senior Management and all staff of the Bank.
The economic and financial developments provided the background to the Bank’s formulation/implementation of monetary and exchange rate policies. The 2012 Annual Report theme topic, Fiscal Reforms: Reducing Reliance of Public Expenditure on Mineral Revenues and Supporting Private Sector Development in Botswana, highlights the Government’s efforts to align fiscal policy with prospective changes in revenue sources, rationalise expenditure and enhance the role of the private sector in the economy.
In the course of 2012, the Bank’s monetary and other policies were conducted against the backdrop of a sluggish global economic recovery beset by high public debt, higher unemployment in major industrial countries and lower overall inflation. Emerging markets and developing economies led the global economic growth, although they were undermined by trade links with developed economies, which registered much weaker economic growth. Similarly, the domestic economy was affected by the contraction of mining production due to a slack in demand for mineral exports; in contrast, the non-mining sector was buoyant.
The moderating effect of lower global inflation and fiscal consolidation on domestic price developments was counteracted by the impact of increased administered prices and higher cost of food. Nevertheless, inflation fell from 9.2 percent in December 2011 to 7.4 percent at year-end, but still exceeded the medium-term objective range of 3 - 6 percent. In a bid not to undermine economic growth, the Bank Rate was unchanged at 9.5 percent. There was also the 23.6 percent increase in credit, compared to the 26.4 percent growth rate of the previous year. The foreign exchange reserves fell slightly from P60.3 billion at the end of 2011 to P59.3 billion at the end of December 2012 (equivalent to 14 months of import cover). The reduction in the level of reserves was due to low export demand (especially for minerals), lower international commodity prices and higher imports. Export competitiveness continued to be supported by an overall 1.3 percent depreciation of the nominal effective exchange rate (NEER) which partly offset the appreciation of the real effective exchange rate (REER). The residual appreciation of the REER by 1.9 percent was expected to be absorbed by gains in productivity, quality improvement and delivery efficiency.
The banking sector expanded its activities, and remained soundly managed and profitable. The combined sector’s financial position grew by 12.4 percent to P58.2 billion, within which the market share of smaller banks increased.
The efficiency of the Bank’s operations and procedures was enhanced and security of the information and communication systems was reinforced. Among other projects, the Bank’s Cash Management Centre was near completion at year-end. Skills development and staff welfare issues continued to be addressed, in some respects in line with the evolving labour laws.
In fulfilment of statutory obligations, the Bank’s 2011 Annual Report on the Operations and Audited Financial Statements and the 2011 Banking Supervision Report were submitted to the Minister of Finance and
16
BANK OF BOTSWANA ANNUAL REPORT 2012
Development Planning on March 31, 2012 and June 30, 2012, respectively. The monthly Botswana Financial Statistics Bulletin and the biannual Business Expectations Survey were also published.
External relations strengthened further during the year. Activities included economic briefings for a variety of stakeholders and consultations with relevant international institutions, as well as attendance of the meetings of the Association of African Central Banks, Committee of SADC Central Bank Governors, International Monetary Fund, World Bank and Bank for International Settlements.
It is my expectation that stakeholders and the general readership will find the information and economic analyses as well as the theme topic of this Report to be informative and useful.
Linah K. MohohloGOVERNOR
17
PART A: STATUTORy REPORT ON ThE OPERATiONS ANd FiNANciAL STATEmENTS OF ThE BANK, 2012
Statutory rePort on oPerationS and Financial StatementS oF the Bank – 2012
the Bank’S miSSion and oBjectiveS
As provided in Section 4 (1) of the Bank of Botswana Act, the Bank’s mission and primary objectives are:
• to promote and maintain monetary stability, which primarily requires the maintenance of low, predictable and sustainable level of inflation;
• to ensure that the overall financial system is safe and sound;
• to regulate and oversee the payments system and ensure that it is secure and efficient; and
• in so far as it would not be inconsistent with monetary stability, to promote the orderly, balanced and sustainable economic development of the country.
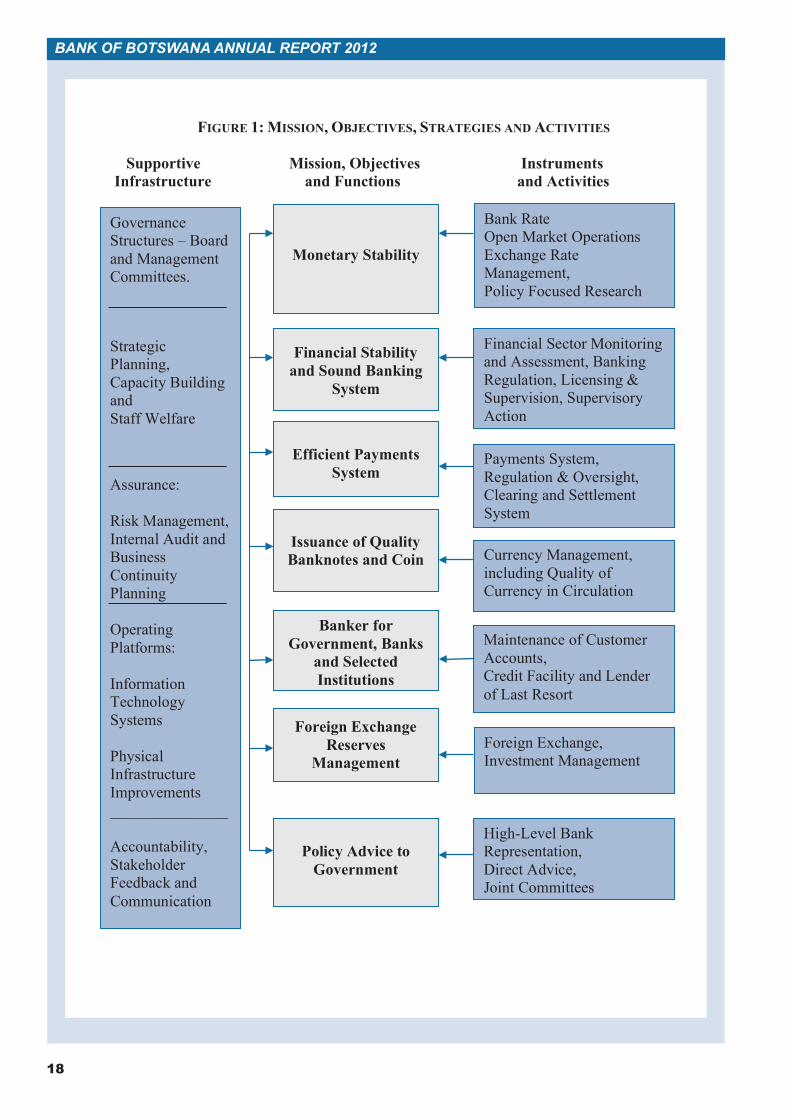
Figure 1 depicts the strategies, activities and supportive infrastructure that is used to achieve the Bank’s mission and objectives. The first of which is monetary stability, which is attained through the formulation and implementation of the Bank’s monetary policy framework; the financial system is continuously assessed for stability and resilience against shocks and other risks; commercial banks are supervised and regulated to foster operational safety and soundness of individual banks as well as the broader financial sector; oversight, regulation and currency management entrench confidence in the payments and settlement system, in addition to mitigating against systemic risks. The Bank also provides efficient banking services to the Government, commercial banks and selected public institutions; the management of foreign exchange reserves enables the country to meet international financial obligations and preservation of value of accumulated surpluses; and the Bank provides advice to the Government on macroeconomic and financial policy matters.
The governance structure affords coordination and synergy between policy-oriented activities and supportive corporate services, including human resource management and development, use of efficiency-enhancing technology, risk mitigation, as well as enforcement of a code of conduct and institutional values.
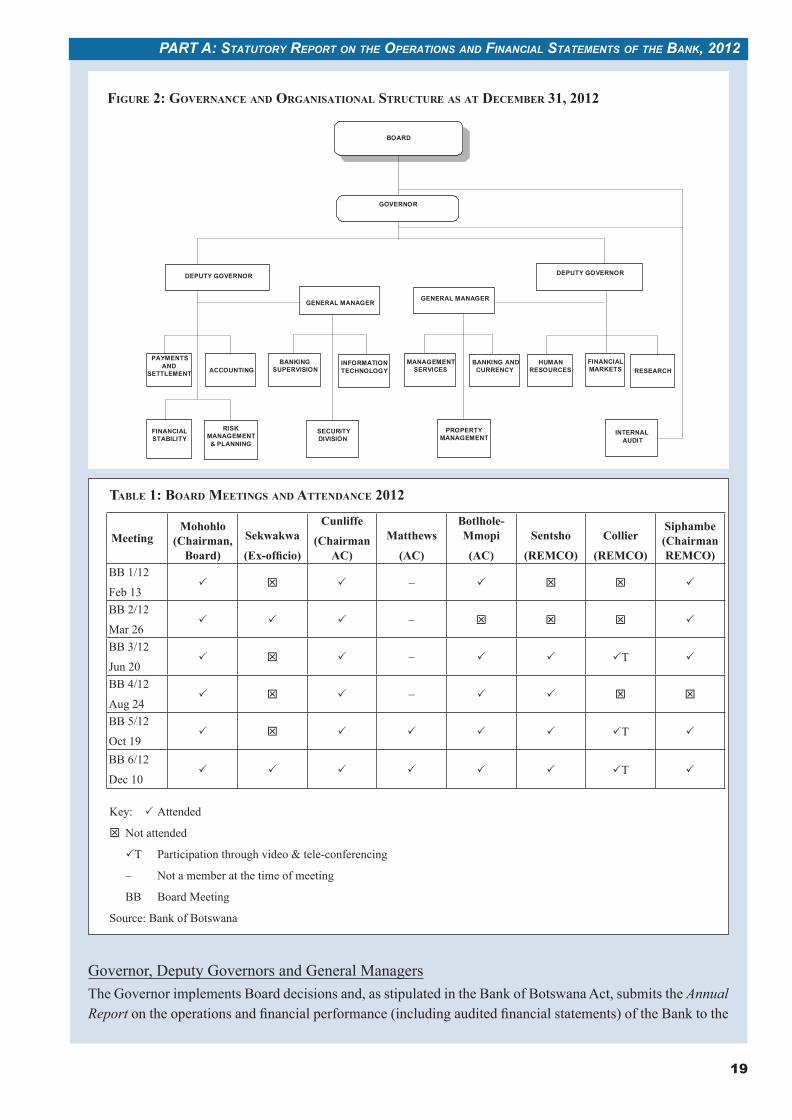
Governance and orGaniSational Structure The Board is at the apex of the governance structure of the Bank and has two Committees, Audit Committee (AC) and Remuneration Committee (REMCO) that are chaired by non-Executive Board Members. The Governor chairs the Board and is Chief Executive Officer of the Bank; oversees nine Departments and five Divisions, supported by two Deputy Governors and two General Managers (Figure 2).
Board Functions, Membership and AppointmentsThe Board is responsible for oversight of the Bank’s general policy direction and operations in accordance with the Bank of Botswana Act and Bye-Laws. Six Board meetings, with the minimum legally required by the Act being four, were held during the year (Table 1). The Board of the Bank comprises the Governor (Chairman), Permanent Secretary of the Ministry of Finance and Development Planning (ex-officio) and seven other members (in their individual capacity) with various and relevant backgrounds. As at year-end, the Board had one vacancy. The two Committees of the Board, viz, REMCO and AC, are constituted by non-executive Board members. The Committees consider issues pertaining to their respective mandates and make recommendations to the Board. The Governor and two Deputy Governors (who are not Board members) are appointed by the President, while the Minister of Finance and Development Planning appoints Board members, two of whom may be public officers.
18
BANK OF BOTSWANA ANNUAL REPORT 2012
FiGure 1: miSSion, oBjectiveS, StrateGieS and activitieS
FIGURE 1: MISSION, OBJECTIVES, STRATEGIES AND ACTIVITIES Supportive Mission, Objectives Instruments Infrastructure and Functions and Activities
Financial Sector Monitoring and Assessment, Banking Regulation, Licensing & Supervision, Supervisory Action
Efficient Payments System
Payments System, Regulation & Oversight, Clearing and Settlement System
Currency Management, including Quality of Currency in Circulation
Monetary Stability
Financial Stability and Sound Banking
System
Issuance of Quality Banknotes and Coin
Banker for Government, Banks
and Selected Institutions
Foreign Exchange, Investment Management
Foreign Exchange Reserves
Management
Bank Rate Open Market Operations Exchange Rate Management, Policy Focused Research
Governance Structures – Board and Management Committees. Strategic Planning, Capacity Building and Staff Welfare Assurance: Risk Management, Internal Audit and Business Continuity Planning Operating Platforms: Information Technology Systems Physical Infrastructure Improvements _______________ Accountability, Stakeholder Feedback and Communication
High-Level Bank Representation, Direct Advice, Joint Committees
Policy Advice to
Government
Maintenance of Customer Accounts, Credit Facility and Lender of Last Resort
19
PART A: STATUTORy REPORT ON ThE OPERATiONS ANd FiNANciAL STATEmENTS OF ThE BANK, 2012
Governor, Deputy Governors and General ManagersThe Governor implements Board decisions and, as stipulated in the Bank of Botswana Act, submits the Annual Report on the operations and financial performance (including audited financial statements) of the Bank to the
FiGure 2: Governance and orGaniSational Structure aS at decemBer 31, 2012
FiGure 2: Governance and orGaniSational Structure aS at decemBer 31, 2012
MeetingMohohlo
(Chairman, Board)
Sekwakwa
(Ex-officio)
Cunliffe
(Chairman AC)
Matthews
(AC)
Botlhole-Mmopi
(AC)
Sentsho
(REMCO)
Collier
(REMCO)
Siphambe (Chairman REMCO)
BB 1/12
Feb 13P T P – P T T P
BB 2/12
Mar 26P P P – T T T P
BB 3/12
Jun 20P T P – P P PT P
BB 4/12
Aug 24P T P – P P T T
BB 5/12
Oct 19P T P P P P PT P
BB 6/12
Dec 10P P P P P P PT P
taBle 1: Board meetinGS and attendance 2012
Key: P Attended
T Not attended
PT Participation through video & tele-conferencing
– Not a member at the time of meeting
BB Board Meeting
Source: Bank of Botswana
FIGURE 2: GOVERNANCE AND ORGANISATIONAL STRUCTURE AS AT DECEMBER 31, 2012
BOARD
INTERNAL AUDIT
PAYMENTS AND
SETTLEMENT ACCOUNTING
DEPUTY GOVERNOR DEPUTY GOVERNOR
Position .
Post . DFID 1 1 AC 5 5
DDFID 1 1 CA 2 2 PBE 3 3 PA 1 1 SBE 6 6 Sec 5 4 BE 26 24 CA 2 2
3
Sum including Trainees 52 49
FINANCIAL MARKETS
SECURITY DIVISION
GOVERNOR
RESEARCH
PROPERTY MANAGEMENT
BANKING AND
CURRENCY BANKING
SUPERVISION HUMAN RESOURCES
GENERAL MANAGER
INFORMATION TECHNOLOGY
MANAGEMENT SERVICES
FINANCIAL STABILITY
RISK MANAGEMENT & PLANNING
GENERAL MANAGER
20
BANK OF BOTSWANA ANNUAL REPORT 2012
Minister of Finance and Development Planning within three months at end of the financial year.1 In turn, the Minister presents the Annual Report to Parliament within 30 days following receipt of the Report. The Banking Supervision Annual Report is submitted to the Minister by the end of June each year. The Governor represents the Bank at relevant local, regional and international meetings, and is the country’s representative on the Board of Governors of the International Monetary Fund (IMF).
Executive CommitteeThe Executive Committee, which is chaired by the Governor, includes Deputy Governors, General Managers and Heads of Department. Senior advisors may be co-opted as members. The Committee meets once a week to monitor and review the implementation of the Bank’s operations and policies; it also coordinates the annual, medium and long-term work programmes approved by the Board in order to create implementation synergies.
Departments and DivisionsFive policy Departments fulfil the Bank’s core mandate, while the other four provide auxiliary support and corporate services. The Financial Stability Division’s responsibility complements the primary mandate of the Bank, while the other four Divisions strengthen delivery of support services.
The Research Department undertakes data collection, macroeconomic analysis, forecasting and policy review in support of the Bank’s conduct of monetary policy, implementation of the exchange rate policy and provides advice to the Government. Production and dissemination of the Bank’s Annual Report and other publications are also the responsibility of the Research Department. The Banking Supervision Department regulates and supervises banks and other financial institutions2 that fall under the Bank’s purview and produces the Banking Supervision Annual Report. The oversight and regulation of payments and settlement transactions, including service providers, is carried out by the Payments and Settlement Department. Management of foreign exchange reserves, open market operations and other money and capital market activities, including government bond issuance, are carried out by the Financial Markets Department; while the Banking and Currency Department provides banking services to the Government, commercial banks and selected institutions and is a repository for the country’s financial relations with the IMF. The Department is also responsible for the custody and issuance of the national currency.
The Financial Stability Division monitors the financial sector and evaluates emerging risks and other developments emanating from the macroeconomic environment, conducts macro-prudential assessment, tracks performance of money and capital markets and facilitates coordination with other relevant external entities to ensure stability of the financial sector as a whole.
The Human Resources Department is responsible for staff recruitment, training, remuneration and welfare. The functions of the Management Services Department include Board Secretariat and corporate services, communications and public relations, public education, records management and protocol, while the Information Technology Department ensures that the Bank’s information technology systems and infrastructure are robust and effective in meeting the needs of the Bank. The Accounting Department manages the Bank’s finances including production of monthly and annual financial statements of the Bank, in accordance with the Bank of Botswana Act and International Financial Reporting Standards (IFRS).
The other support services are undertaken through the specialised activities of four Divisions, viz., Risk Management and Planning, Internal Audit, Security and Property Management. The Risk Management and
1 The financial year of the Bank is the calendar year (January – December), and the Annual Report is submitted to the Minister by the end of March every year.
2 In addition to supervision of the 13 licensed commercial banks, the Bank has been delegated responsibility for supervising the Botswana Building Society, Botswana Savings Bank and the National Development Bank.
21
PART A: STATUTORy REPORT ON ThE OPERATiONS ANd FiNANciAL STATEmENTS OF ThE BANK, 2012
Planning Division coordinates strategic planning and the formulation and implementation of risk and business continuity management, while the Internal Audit Division independently and objectively ensures that the Bank’s operations are sound and comply with established internal controls and governance structures, in line with the Bank of Botswana Act and international best practice. The Security Division has the primary responsibility of proactively managing all safety and security related risks within the Bank and all its facilities. The Property Management Division is responsible for procurement, custody and maintenance of immovable and movable assets, including the Bank’s real estate and related equipment.
review oF the Bank’S main activitieS in 2012
Monetary Policy, Money and Capital Market Activities and Exchange Rate Policy
Monetary PolicyThe 2012 Monetary Policy Statement and Mid-Term Review maintained the medium-term inflation objective of 3 - 6 percent. Although inflation was above the upper end of the medium-term objective range during 2012 on account of transitory factors, the medium-term outlook was positive. In the circumstances, the Bank Rate was unchanged at 9.5 percent throughout the year. The positive outlook for inflation was also reflected in stabilised inflation expectations in the September 2012 biannual Business Expectations Survey, although they were somewhat above the medium-term objective range of 3 - 6 percent.
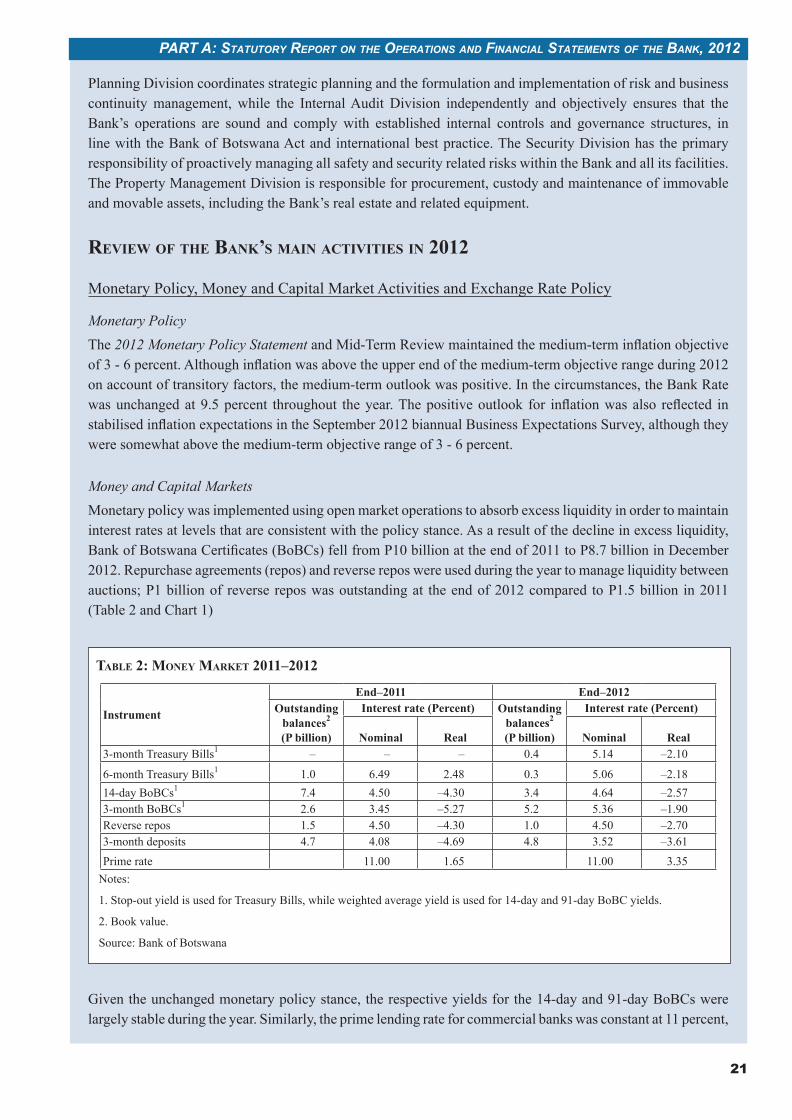
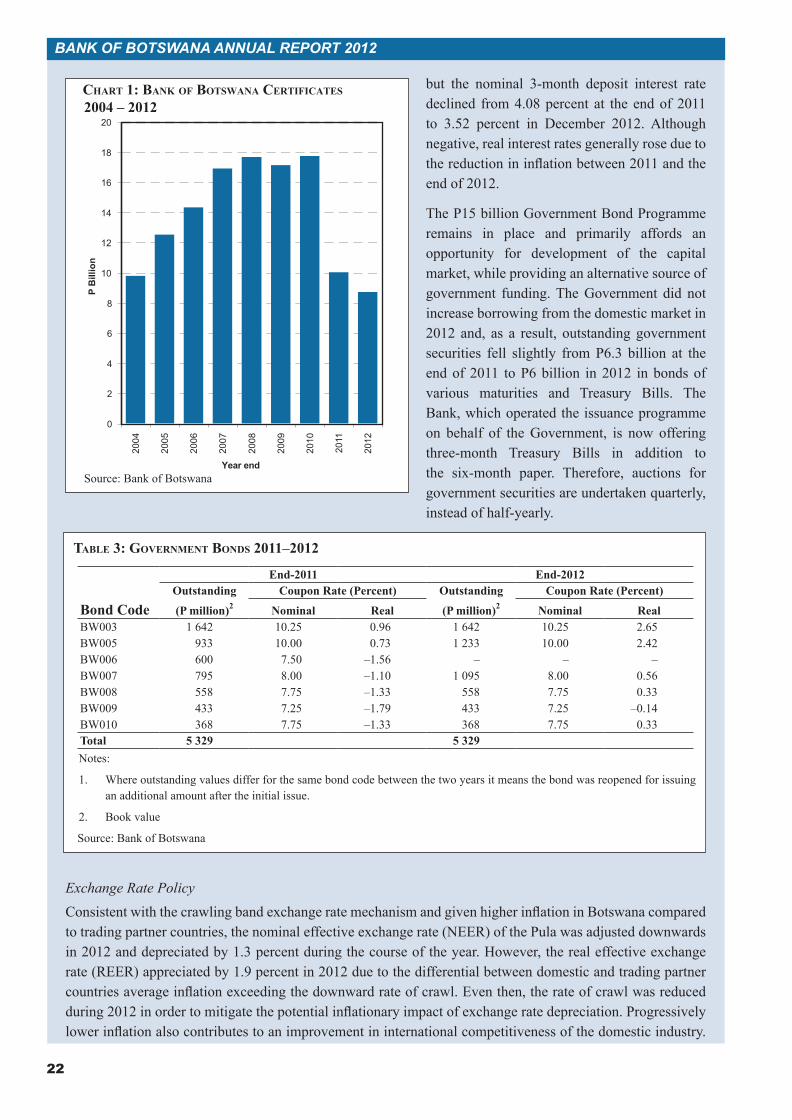
Money and Capital MarketsMonetary policy was implemented using open market operations to absorb excess liquidity in order to maintain interest rates at levels that are consistent with the policy stance. As a result of the decline in excess liquidity, Bank of Botswana Certificates (BoBCs) fell from P10 billion at the end of 2011 to P8.7 billion in December 2012. Repurchase agreements (repos) and reverse repos were used during the year to manage liquidity between auctions; P1 billion of reverse repos was outstanding at the end of 2012 compared to P1.5 billion in 2011 (Table 2 and Chart 1)
Given the unchanged monetary policy stance, the respective yields for the 14-day and 91-day BoBCs were largely stable during the year. Similarly, the prime lending rate for commercial banks was constant at 11 percent,
taBle 2: money market 2011–2012
Instrument
End–2011 End–2012Outstanding
balances2 (P billion)
Interest rate (Percent) Outstanding balances2 (P billion)
Interest rate (Percent)
Nominal Real Nominal Real3-month Treasury Bills1 – – – 0.4 5.14 –2.10
6-month Treasury Bills1 1.0 6.49 2.48 0.3 5.06 –2.1814-day BoBCs1 7.4 4.50 –4.30 3.4 4.64 –2.573-month BoBCs1 2.6 3.45 –5.27 5.2 5.36 –1.90Reverse repos 1.5 4.50 –4.30 1.0 4.50 –2.703-month deposits 4.7 4.08 –4.69 4.8 3.52 –3.61
Prime rate 11.00 1.65 11.00 3.35Notes:
1. Stop-out yield is used for Treasury Bills, while weighted average yield is used for 14-day and 91-day BoBC yields.
2. Book value.
Source: Bank of Botswana
22
BANK OF BOTSWANA ANNUAL REPORT 2012
but the nominal 3-month deposit interest rate declined from 4.08 percent at the end of 2011 to 3.52 percent in December 2012. Although negative, real interest rates generally rose due to the reduction in inflation between 2011 and the end of 2012.
The P15 billion Government Bond Programme remains in place and primarily affords an opportunity for development of the capital market, while providing an alternative source of government funding. The Government did not increase borrowing from the domestic market in 2012 and, as a result, outstanding government securities fell slightly from P6.3 billion at the end of 2011 to P6 billion in 2012 in bonds of various maturities and Treasury Bills. The Bank, which operated the issuance programme on behalf of the Government, is now offering three-month Treasury Bills in addition to the six-month paper. Therefore, auctions for government securities are undertaken quarterly, instead of half-yearly.
taBle 3: Government BondS 2011–2012
Bond Code
End-2011 End-2012Outstanding
(P million)2
Coupon Rate (Percent) Outstanding
(P million)2
Coupon Rate (Percent)
Nominal Real Nominal RealBW003 1 642 10.25 0.96 1 642 10.25 2.65BW005 933 10.00 0.73 1 233 10.00 2.42BW006 600 7.50 –1.56 – – –BW007 795 8.00 –1.10 1 095 8.00 0.56BW008 558 7.75 –1.33 558 7.75 0.33BW009 433 7.25 –1.79 433 7.25 –0.14BW010 368 7.75 –1.33 368 7.75 0.33Total 5 329 5 329Notes:
1. Where outstanding values differ for the same bond code between the two years it means the bond was reopened for issuing an additional amount after the initial issue.
2. Book value
Source: Bank of Botswana
Exchange Rate PolicyConsistent with the crawling band exchange rate mechanism and given higher inflation in Botswana compared to trading partner countries, the nominal effective exchange rate (NEER) of the Pula was adjusted downwards in 2012 and depreciated by 1.3 percent during the course of the year. However, the real effective exchange rate (REER) appreciated by 1.9 percent in 2012 due to the differential between domestic and trading partner countries average inflation exceeding the downward rate of crawl. Even then, the rate of crawl was reduced during 2012 in order to mitigate the potential inflationary impact of exchange rate depreciation. Progressively lower inflation also contributes to an improvement in international competitiveness of the domestic industry.
chart 1: Bank oF BotSwana certiFicateS 2004 – 2012
Source: Bank of Botswana
0
2
4
6
8
10
12
14
16
18
2020
04
2005
2006
2007
2008
2009
2010
2011
2012
P B
illio
n
Year end
23
PART A: STATUTORy REPORT ON ThE OPERATiONS ANd FiNANciAL STATEmENTS OF ThE BANK, 2012
The Government has disclosed the rate of crawl of the Pula and the weights of the Pula basket. For 2013, the rate of crawl is –0.16 percent, and the Pula basket weights are 55 percent South African rand and 45 percent Special Drawing Rights (SDR). The enhanced transparency engendered by the disclosure of Pula exchange rate parameters helps to reduce uncertainty surrounding exchange rate policy and enriches information used in making financial decisions by economic agents.
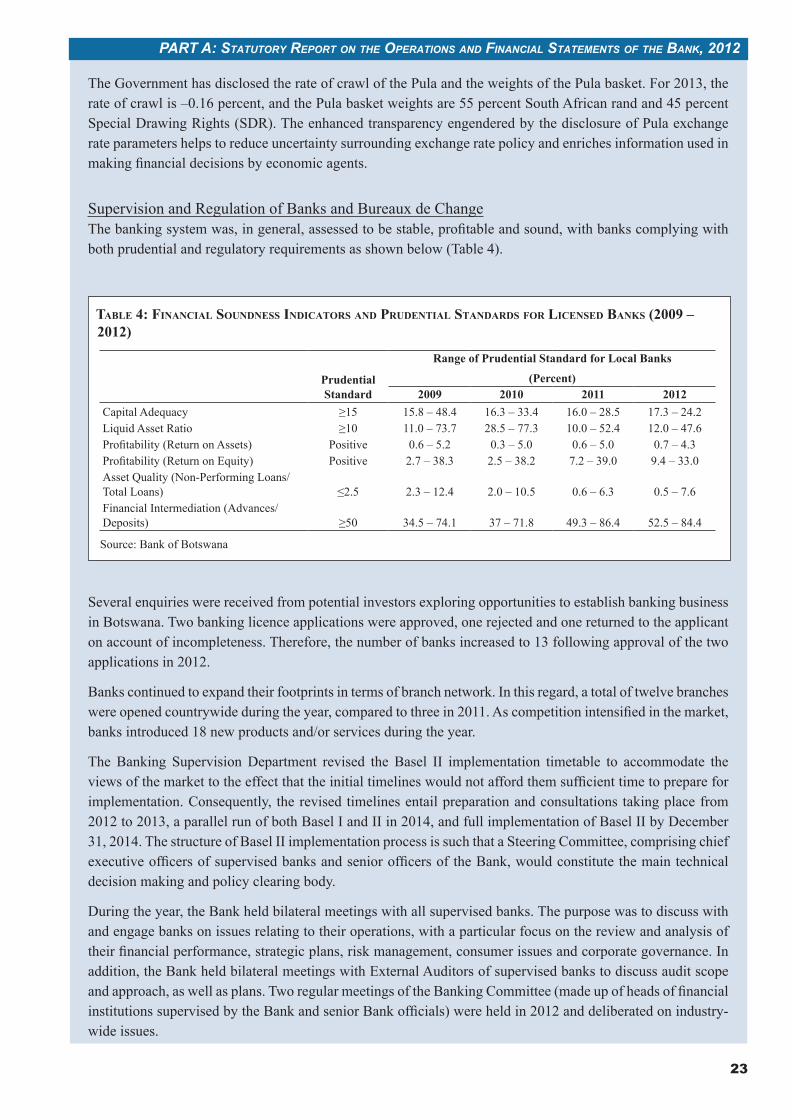
Supervision and Regulation of Banks and Bureaux de ChangeThe banking system was, in general, assessed to be stable, profitable and sound, with banks complying with both prudential and regulatory requirements as shown below (Table 4).
taBle 4: Financial SoundneSS indicatorS and Prudential StandardS For licenSed BankS (2009 – 2012)
Prudential Standard
Range of Prudential Standard for Local Banks
(Percent)2009 2010 2011 2012
Capital Adequacy ≥15 15.8 – 48.4 16.3 – 33.4 16.0 – 28.5 17.3 – 24.2Liquid Asset Ratio ≥10 11.0 – 73.7 28.5 – 77.3 10.0 – 52.4 12.0 – 47.6Profitability (Return on Assets) Positive 0.6 – 5.2 0.3 – 5.0 0.6 – 5.0 0.7 – 4.3Profitability (Return on Equity) Positive 2.7 – 38.3 2.5 – 38.2 7.2 – 39.0 9.4 – 33.0Asset Quality (Non-Performing Loans/Total Loans) ≤2.5 2.3 – 12.4 2.0 – 10.5 0.6 – 6.3 0.5 – 7.6Financial Intermediation (Advances/Deposits) ≥50 34.5 – 74.1 37 – 71.8 49.3 – 86.4 52.5 – 84.4
Source: Bank of Botswana
Several enquiries were received from potential investors exploring opportunities to establish banking business in Botswana. Two banking licence applications were approved, one rejected and one returned to the applicant on account of incompleteness. Therefore, the number of banks increased to 13 following approval of the two applications in 2012.
Banks continued to expand their footprints in terms of branch network. In this regard, a total of twelve branches were opened countrywide during the year, compared to three in 2011. As competition intensified in the market, banks introduced 18 new products and/or services during the year.
The Banking Supervision Department revised the Basel II implementation timetable to accommodate the views of the market to the effect that the initial timelines would not afford them sufficient time to prepare for implementation. Consequently, the revised timelines entail preparation and consultations taking place from 2012 to 2013, a parallel run of both Basel I and II in 2014, and full implementation of Basel II by December 31, 2014. The structure of Basel II implementation process is such that a Steering Committee, comprising chief executive officers of supervised banks and senior officers of the Bank, would constitute the main technical decision making and policy clearing body.
During the year, the Bank held bilateral meetings with all supervised banks. The purpose was to discuss with and engage banks on issues relating to their operations, with a particular focus on the review and analysis of their financial performance, strategic plans, risk management, consumer issues and corporate governance. In addition, the Bank held bilateral meetings with External Auditors of supervised banks to discuss audit scope and approach, as well as plans. Two regular meetings of the Banking Committee (made up of heads of financial institutions supervised by the Bank and senior Bank officials) were held in 2012 and deliberated on industry-wide issues.
24
BANK OF BOTSWANA ANNUAL REPORT 2012
Six bureaux de change licences were revoked, five were voluntarily surrendered, while four new licences were issued during the year. The net effect of the changes was a reduction in the number of operational bureaux de change to 61 in 2012, compared to 68 in 2011.
chart 2a: net iSSuance oF BanknoteS By denomination (million) 2011 – 2012
chart 2B: net iSSuance oF BanknoteS By denomination (Percent) 2011 – 2012
chart 2c: net iSSuance oF coin By denomi-nation (million) 2011 – 2012
chart 2d: net iSSuance oF coin By denomi-nation (Percent) 2011 – 2012
Source: Bank of Botswana
0
1
2
3
4
5
6
7
P200 P100 P50 P20 P10
Mill
ion
2011 2012
0
5
10
15
20
25
P200 P100 P50 P20 P10
Perc
ent
2011 2012
0
20
40
60
80
100
120
140
160
180
P5 P2 P1 50t 25t 10t 5t
Mill
ion
2011 2012
0
10
20
30
40
50
60
P5 P2 P1 50t 25t 10t 5t
Perc
ent
2011 2012
25
PART A: STATUTORy REPORT ON ThE OPERATiONS ANd FiNANciAL STATEmENTS OF ThE BANK, 2012
Abandoned funds continued to be administered in accordance with Section 39 of the Banking Act (CAP 46.04). As at December 31, 2012, the abandoned funds balances amounted to P8.2 million; this compares with P9.8 million for 2011.
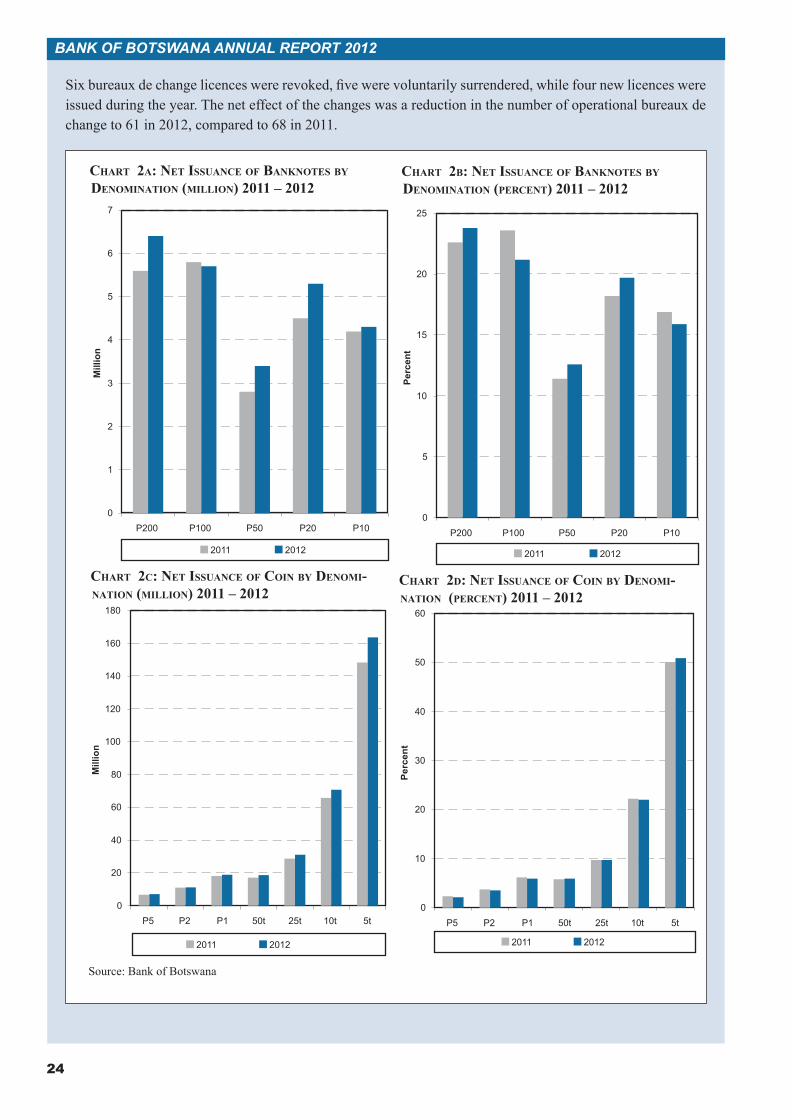
Currency Operations and IssuesCurrency operations are being moved to a newly completed, purpose-built and modern Cash Management Centre (CMC). The new operating environment will improve security and efficiency of cash processing and contribute to enhanced quality of currency in circulation. The volume of banknotes in circulation rose by 9.3 percent, mainly due to net issuance of P200 banknotes, followed by P20 and P50 banknotes, respectively (Charts 2a and 2b). Similarly, the net issuance of all coin denominations rose by 8.5 percent in 2012 compared to 6.3 percent in 2011 (Charts 2c and 2d). The highest increase was in the net issuance of 5 thebe coin followed by 50 thebe coin.
Payments and SettlementThe Botswana National Payments System has continued to evolve with the expansion of electronic payments, which has the benefits of efficiency, speed and safety. In this regard, relevant systems, such as the Electronic Clearing House (ECH), Botswana Interbank Settlement System (BISS) and the Central Securities Depository (CSD), were subject to continuous monitoring by the Bank to ensure that they met the important public policy objectives and standards of safety, efficiency, stability and integrity.
The Bank initiated the Cheque Imaging and Truncation System (CITS) in collaboration with the banking industry and through the Bankers Association of Botswana (BAB), to obviate the need for physical exchange of cheques. Once introduced, CITS will reduce the cheque clearing cycle from four to two days. Following cessation of retail banking at the Bank in 2011, there was an increase in electronic payments by the Government. The Office of the Accountant General and Botswana Unified Revenue Service will be availed access to BISS to send and receive time-sensitive payments. When fully operational, the linkage will allow tax-payers country-wide to expeditiously pay tax and receive reimbursements.
The Bank’s regular inspection of the ECH and voucher processing centres of the clearing banks revealed that all systemically important payment systems were stable and operating within efficient and safe environment.
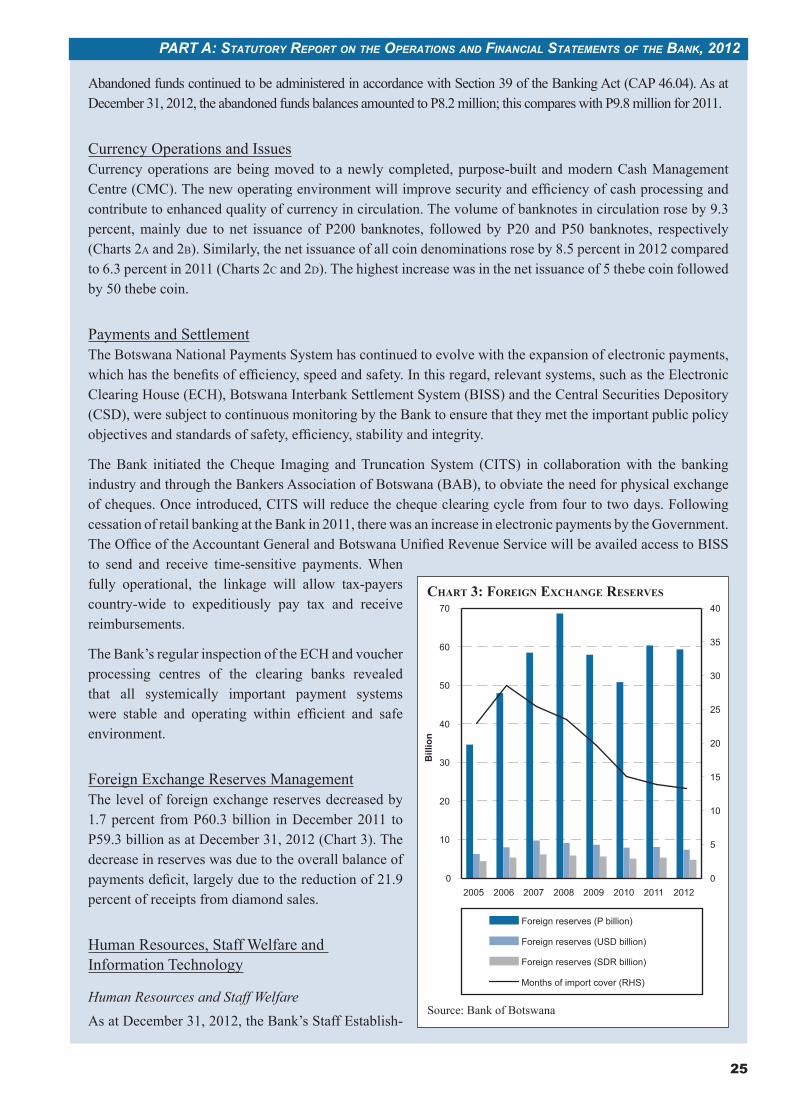
Foreign Exchange Reserves ManagementThe level of foreign exchange reserves decreased by 1.7 percent from P60.3 billion in December 2011 to P59.3 billion as at December 31, 2012 (Chart 3). The decrease in reserves was due to the overall balance of payments deficit, largely due to the reduction of 21.9 percent of receipts from diamond sales.
Human Resources, Staff Welfare and Information Technology
Human Resources and Staff WelfareAs at December 31, 2012, the Bank’s Staff Establish-
0
10
20
30
40
50
60
70
2005 2006 2007 2008 2009 2010 2011 2012
Bill
ion
0
5
10
15
20
25
30
35
40
Foreign reserves (P billion)
Foreign reserves (USD billion)
Foreign reserves (SDR billion)
Months of import cover (RHS)
Source: Bank of Botswana
chart 3: ForeiGn exchanGe reServeS
26
BANK OF BOTSWANA ANNUAL REPORT 2012
ment was 582, while the vacancy rate stood at 12.37 percent. Staff continued to benefit from both short- and long-term training under the Bank’s staff development programme.
Staff Pension FundThe Bank of Botswana Defined Contribution Staff Pension Fund declared a return of 22.96 percent and 22.40 percent for active members and deferred members, respectively, in the year ended September 2012. This was an improvement from the 20.12 percent and 19.57 percent for active and deferred members, respectively, declared in 2011.
Information TechnologyA disaster recovery system was set up in 2012 to reduce the downtime of information technology mission critical systems, such as those for accounting, payments and messaging. The system facilitates continuous and selective information back-up internally and at the Disaster Recovery Site and, therefore, provides timely res-toration of processes following any disruption of primary operations. In addition, the security of the IT systems was strengthened following independent assessment of threats by an external party.
Advisory Services, External Relations and Communication
Advisory ServicesThe Bank continued to provide advisory services to the Government during the year through, among others, membership of relevant ad hoc committees of the Ministry of Finance and Development Planning (MFDP)/Bank of Botswana Working Group. Notably, the Bank contributed to development and publication of the 2012 – 2016 Botswana Financial Sector Development Strategy in collaboration with MFDP, the Non-Bank Finan-cial Institutions Regulatory Authority (NBFIRA) and the World Bank.
External RelationsExternal relations activities during the year included participation at relevant regional and international meet-ings, as well as hosting of consultation, surveillance and technical assistance missions. At regional level, the Bank was represented at meetings of the Southern African Development Community (SADC) Committee of Central Bank Governors (CCBG), and the Association of African Central Banks (AACB). Internationally, the Bank hosted the IMF Article IV Consultation Mission, participated at meetings hosted by the Bank for Inter-national Settlements (BIS), and took part in the Joint World Bank/IMF Annual Meetings.
Publications, Communications and Public EducationIn accordance with statutory requirements, the 2011 Annual Report on the Bank’s Operations and Financial Statements and the 2011 Banking Supervision Report were submitted to the Minister of Finance and Develop-ment Planning by March 31, 2012 and June 30, 2012, respectively; these were subsequently published. The monthly Botswana Financial Statistics Bulletin was also published.
In fulfilment of accountability and in pursuit of the public outreach programme, the Bank conducted economic briefings following the publication of the 2011 Annual Report. Among the key stakeholders briefed were the Cabinet, heads/representatives of diplomatic missions, heads of public and private sector corporations, senior government officials and media/press representatives. Other public relations activities included participation at exhibitions and career fairs.
27
PART A: STATUTORy REPORT ON ThE OPERATiONS ANd FiNANciAL STATEmENTS OF ThE BANK, 2012
annual Financial StatementS
2012
Bank oF BotSwana
CONTENTS Page
Statement of Responsibility of the Board and Approval of Annual Financial Statements 29
Independent Auditor’s Report 30
Statement of Financial Position 31
Statement of Profit or Loss and Other Comprehensive Income 32
Statement of Distribution 33
Statement of Cash Flows 33
Statement of Changes in Shareholder’s Funds 34
Significant Accounting Policies 36
Notes to the Annual Financial Statements 44
29
PART A: STATUTORy REPORT ON ThE OPERATiONS ANd FiNANciAL STATEmENTS OF ThE BANK, 2012
Statement oF reSPonSiBility oF the Board and aPProval oF Financial StatementS
The members of the Board are responsible for the preparation and fair presentation of the annual financial statements of the Bank, comprising the Statement of Financial Position at December 31, 2012, Statement of Profit or Loss and Other Comprehensive Income, Statement of Distribution, Statement of Cash Flows and Statement of Changes in Shareholder’s Funds for the year then ended, and the notes to the financial statements which include a summary of significant accounting policies and other explanatory notes, in accordance with International Financial Reporting Standards, and in the manner required by the Bank of Botswana Act (CAP 55:01).
The members are also responsible for such internal control as the members determine is necessary to enable the preparation of financial statements that are free from material misstatement, whether due to fraud or error, and for maintaining adequate accounting records and an effective system of risk management.
The members have made an assessment of the ability of the Bank to continue as a going concern and have no reason to believe that the Bank will not be a going concern in the year ahead.
The auditor is responsible for reporting on whether the annual financial statements are fairly presented in accordance with the applicable financial reporting framework.
Approval of Annual Financial Statements
The annual financial statements of the Bank, as identified in the first paragraph, were approved by the Board on March 27, 2013 and signed on behalf of the Board by:
Linah K Mohohlo Gordon K Cunliffe
Governor Board Member
(Audit Committee Chairman)
30
BANK OF BOTSWANA ANNUAL REPORT 2012
31 to 62.
31
PART A: STATUTORy REPORT ON ThE OPERATiONS ANd FiNANciAL STATEmENTS OF ThE BANK, 2012
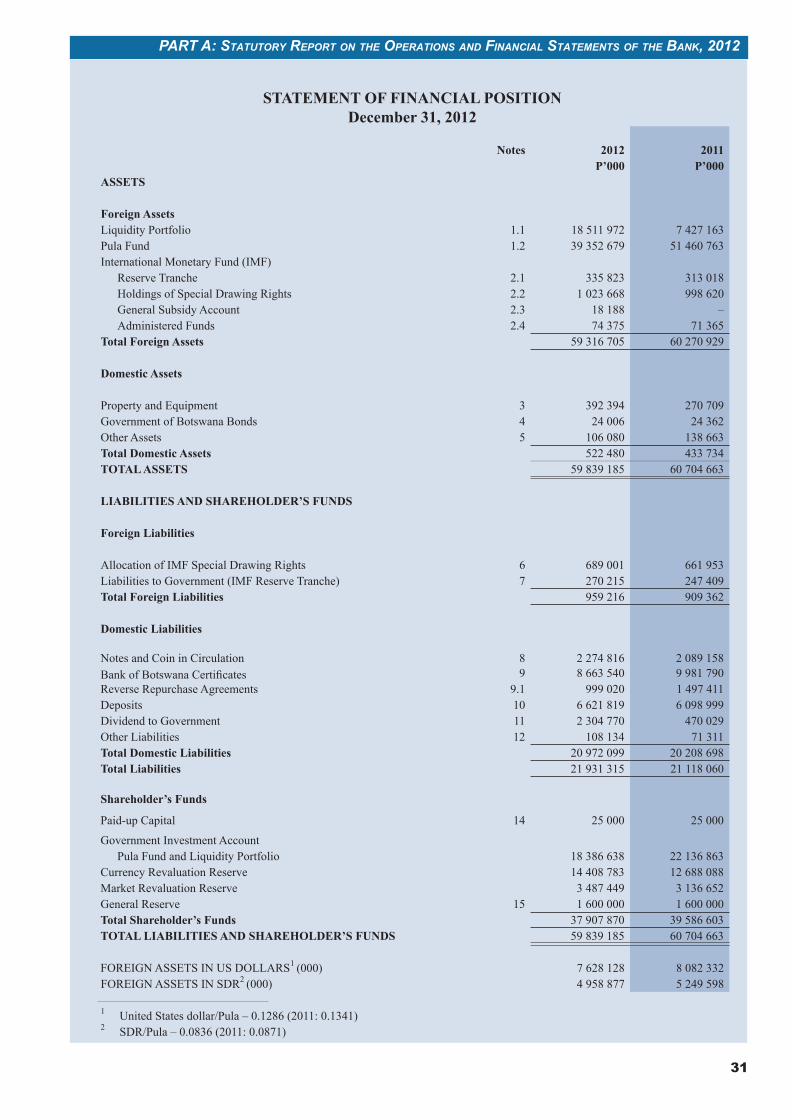
STATEMENT OF FINANCIAL POSITIONDecember 31, 2012
Notes 2012 2011P’000 P’000
ASSETS
Foreign AssetsLiquidity Portfolio 1.1 18 511 972 7 427 163Pula Fund 1.2 39 352 679 51 460 763International Monetary Fund (IMF)
Reserve Tranche 2.1 335 823 313 018Holdings of Special Drawing Rights 2.2 1 023 668 998 620General Subsidy Account 2.3 18 188 –Administered Funds 2.4 74 375 71 365
Total Foreign Assets 59 316 705 60 270 929
Domestic Assets
Property and Equipment 3 392 394 270 709Government of Botswana Bonds 4 24 006 24 362Other Assets 5 106 080 138 663Total Domestic Assets 522 480 433 734TOTAL ASSETS 59 839 185 60 704 663
LIABILITIES AND SHAREHOLDER’S FUNDS
Foreign Liabilities
Allocation of IMF Special Drawing Rights 6 689 001 661 953Liabilities to Government (IMF Reserve Tranche) 7 270 215 247 409Total Foreign Liabilities 959 216 909 362
Domestic Liabilities
Notes and Coin in Circulation 8 2 274 816 2 089 158Bank of Botswana CertificatesReverse Repurchase Agreements
99.1
8 663 540999 020
9 981 7901 497 411
Deposits 10 6 621 819 6 098 999Dividend to Government 11 2 304 770 470 029Other Liabilities 12 108 134 71 311Total Domestic Liabilities 20 972 099 20 208 698Total Liabilities 21 931 315 21 118 060
Shareholder’s Funds
Paid-up Capital 14 25 000 25 000
Government Investment Account Pula Fund and Liquidity Portfolio 18 386 638 22 136 863
Currency Revaluation Reserve 14 408 783 12 688 088Market Revaluation Reserve 3 487 449 3 136 652General Reserve 15 1 600 000 1 600 000Total Shareholder’s Funds 37 907 870 39 586 603TOTAL LIABILITIES AND SHAREHOLDER’S FUNDS 59 839 185 60 704 663
FOREIGN ASSETS IN US DOLLARS1 (000) 7 628 128 8 082 332FOREIGN ASSETS IN SDR2 (000) 4 958 877 5 249 598
1 United States dollar/Pula – 0.1286 (2011: 0.1341)2 SDR/Pula – 0.0836 (2011: 0.0871)
32
BANK OF BOTSWANA ANNUAL REPORT 2012
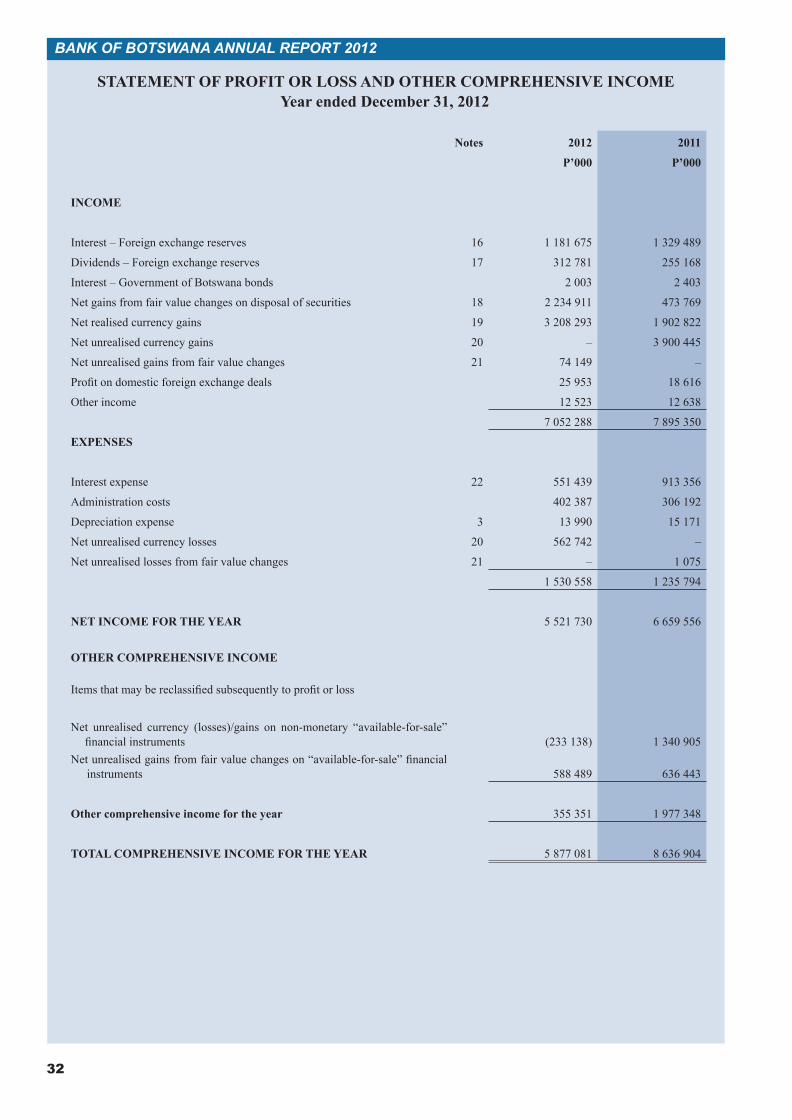
STATEMENT OF PROFIT OR LOSS AND OTHER COMPREHENSIVE INCOMEYear ended December 31, 2012
Notes 2012 2011
P’000 P’000
INCOME
Interest – Foreign exchange reserves 16 1 181 675 1 329 489
Dividends – Foreign exchange reserves 17 312 781 255 168
Interest – Government of Botswana bonds 2 003 2 403
Net gains from fair value changes on disposal of securities 18 2 234 911 473 769
Net realised currency gains 19 3 208 293 1 902 822
Net unrealised currency gains 20 – 3 900 445
Net unrealised gains from fair value changes 21 74 149 –
Profit on domestic foreign exchange deals 25 953 18 616
Other income 12 523 12 638
7 052 288 7 895 350
EXPENSES
Interest expense 22 551 439 913 356
Administration costs 402 387 306 192
Depreciation expense 3 13 990 15 171
Net unrealised currency losses 20 562 742 –
Net unrealised losses from fair value changes 21 – 1 075
1 530 558 1 235 794
NET INCOME FOR THE YEAR 5 521 730 6 659 556
OTHER COMPREHENSIVE INCOME
Items that may be reclassified subsequently to profit or loss
Net unrealised currency (losses)/gains on non-monetary “available-for-sale” financial instruments (233 138) 1 340 905
Net unrealised gains from fair value changes on “available-for-sale” financial instruments 588 489 636 443
Other comprehensive income for the year 355 351 1 977 348
TOTAL COMPREHENSIVE INCOME FOR THE YEAR 5 877 081 8 636 904
33
PART A: STATUTORy REPORT ON ThE OPERATiONS ANd FiNANciAL STATEmENTS OF ThE BANK, 2012
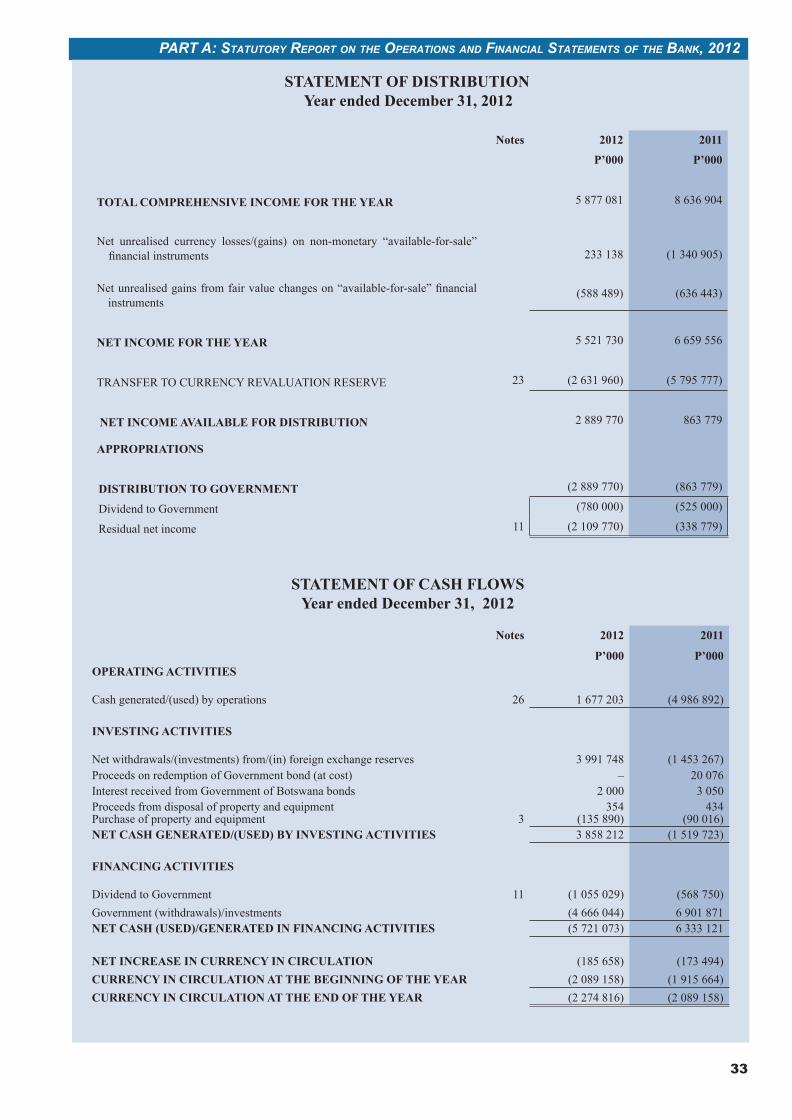
STATEMENT OF DISTRIBUTIONYear ended December 31, 2012
Notes 2012 2011
P’000 P’000
TOTAL COMPREHENSIVE INCOME FOR THE YEAR 5 877 081 8 636 904
Net unrealised currency losses/(gains) on non-monetary “available-for-sale” financial instruments 233 138 (1 340 905)
Net unrealised gains from fair value changes on “available-for-sale” financial instruments
(588 489) (636 443)
NET INCOME FOR THE YEAR 5 521 730 6 659 556
TRANSFER TO CURRENCY REVALUATION RESERVE 23 (2 631 960) (5 795 777)
NET INCOME AVAILABLE FOR DISTRIBUTION 2 889 770 863 779
APPROPRIATIONS
DISTRIBUTION TO GOVERNMENT (2 889 770) (863 779)
Dividend to Government (780 000) (525 000)
Residual net income 11 (2 109 770) (338 779)
STATEMENT OF CASH FLOWSYear ended December 31, 2012
Notes 2012 2011
P’000 P’000OPERATING ACTIVITIES
Cash generated/(used) by operations 26 1 677 203 (4 986 892)
INVESTING ACTIVITIES
Net withdrawals/(investments) from/(in) foreign exchange reservesProceeds on redemption of Government bond (at cost)
3 991 748–
(1 453 267)20 076
Interest received from Government of Botswana bonds 2 000 3 050Proceeds from disposal of property and equipment 354 434Purchase of property and equipment 3 (135 890) (90 016)NET CASH GENERATED/(USED) BY INVESTING ACTIVITIES 3 858 212 (1 519 723)
FINANCING ACTIVITIES
Dividend to Government 11 (1 055 029) (568 750)Government (withdrawals)/investments (4 666 044) 6 901 871NET CASH (USED)/GENERATED IN FINANCING ACTIVITIES (5 721 073) 6 333 121
NET INCREASE IN CURRENCY IN CIRCULATION (185 658) (173 494)CURRENCY IN CIRCULATION AT THE BEGINNING OF THE YEAR (2 089 158) (1 915 664)CURRENCY IN CIRCULATION AT THE END OF THE YEAR (2 274 816) (2 089 158)
34
BANK OF BOTSWANA ANNUAL REPORT 2012
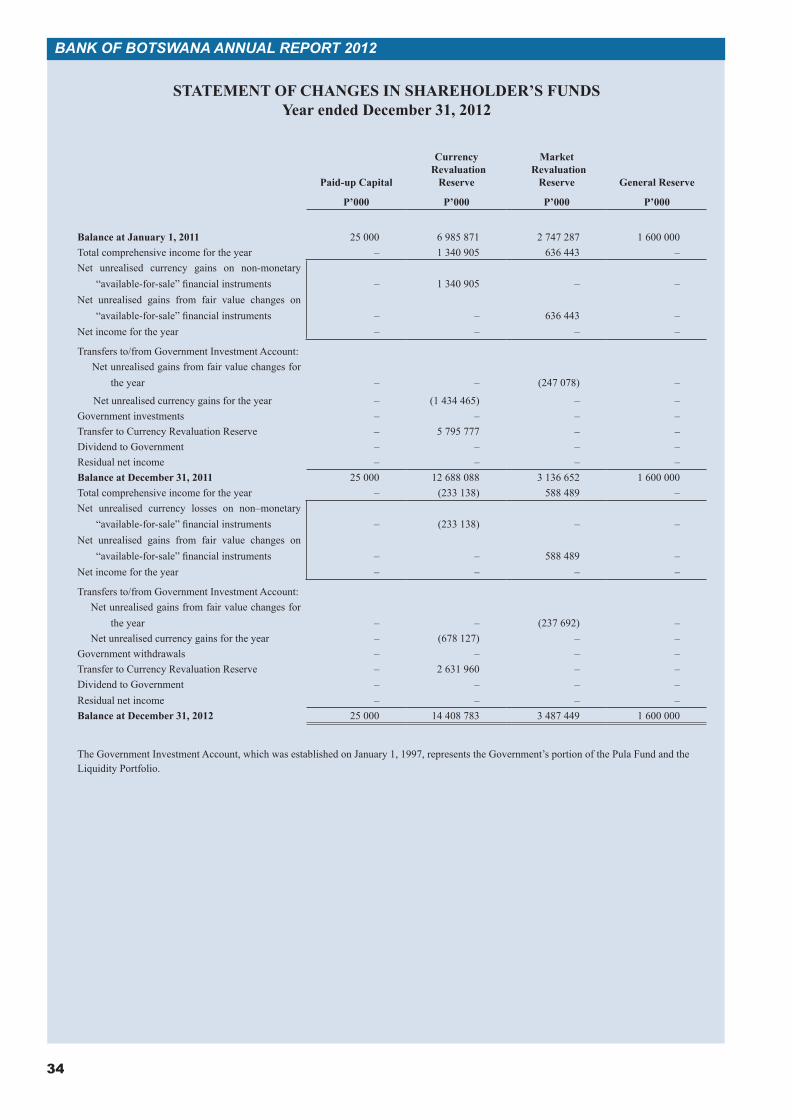
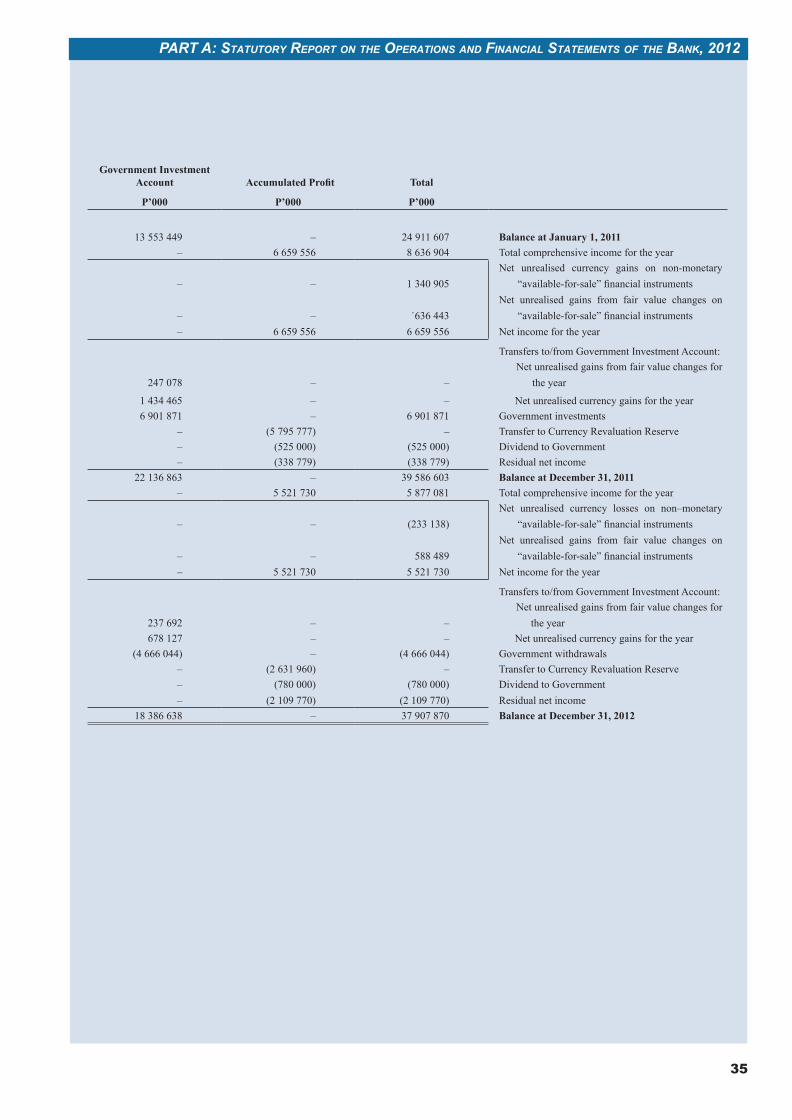
STATEMENT OF CHANGES IN SHAREHOLDER’S FUNDSYear ended December 31, 2012
Paid-up Capital
CurrencyRevaluation
Reserve
MarketRevaluation
Reserve General ReserveGovernment Investment
Account Accumulated Profit Total
P’000 P’000 P’000 P’000 P’000 P’000 P’000
Balance at January 1, 2011 25 000 6 985 871 2 747 287 1 600 000 13 553 449 – 24 911 607 Balance at January 1, 2011Total comprehensive income for the year – 1 340 905 636 443 – – 6 659 556 8 636 904 Total comprehensive income for the yearNet unrealised currency gains on non-monetary
“available-for-sale” financial instruments Net unrealised gains from fair value changes on
“available-for-sale” financial instrumentsNet income for the year
–
––
1 340 905
––
–
636 443–
–
––
–
––
–
–6 659 556
1 340 905
˙636 4436 659 556
Net unrealised currency gains on non-monetary “available-for-sale” financial instruments
Net unrealised gains from fair value changes on “available-for-sale” financial instruments
Net income for the year
Transfers to/from Government Investment Account: Transfers to/from Government Investment Account:Net unrealised gains from fair value changes for
the year – – (247 078) – 247 078 – –Net unrealised gains from fair value changes for
the year
Net unrealised currency gains for the year – (1 434 465) – – 1 434 465 – – Net unrealised currency gains for the yearGovernment investments – – – – 6 901 871 – 6 901 871 Government investmentsTransfer to Currency Revaluation Reserve – 5 795 777 – – – (5 795 777) – Transfer to Currency Revaluation ReserveDividend to Government – – – – – (525 000) (525 000) Dividend to Government Residual net income – – – – – (338 779) (338 779) Residual net income Balance at December 31, 2011 25 000 12 688 088 3 136 652 1 600 000 22 136 863 – 39 586 603 Balance at December 31, 2011Total comprehensive income for the year – (233 138) 588 489 – – 5 521 730 5 877 081 Total comprehensive income for the yearNet unrealised currency losses on non–monetary
“available-for-sale” financial instruments Net unrealised gains from fair value changes on
“available-for-sale” financial instruments Net income for the year
–
––
(233 138)
––
–
588 489–
–
––
–
––
–
–5 521 730
(233 138)
588 4895 521 730
Net unrealised currency losses on non–monetary “available-for-sale” financial instruments
Net unrealised gains from fair value changes on “available-for-sale” financial instruments
Net income for the year
Transfers to/from Government Investment Account: Transfers to/from Government Investment Account:Net unrealised gains from fair value changes for
the year – – (237 692) – 237 692 – –Net unrealised gains from fair value changes for
the year Net unrealised currency gains for the year – (678 127) – – 678 127 – – Net unrealised currency gains for the year
Government withdrawals – – – – (4 666 044) – (4 666 044) Government withdrawalsTransfer to Currency Revaluation Reserve – 2 631 960 – – – (2 631 960) – Transfer to Currency Revaluation ReserveDividend to Government Residual net income
––
––
––
––
––
(780 000)(2 109 770)
(780 000)(2 109 770)
Dividend to Government Residual net income
Balance at December 31, 2012 25 000 14 408 783 3 487 449 1 600 000 18 386 638 – 37 907 870 Balance at December 31, 2012
The Government Investment Account, which was established on January 1, 1997, represents the Government’s portion of the Pula Fund and the Liquidity Portfolio.
35
PART A: STATUTORy REPORT ON ThE OPERATiONS ANd FiNANciAL STATEmENTS OF ThE BANK, 2012
STATEMENT OF CHANGES IN SHAREHOLDER’S FUNDSYear ended December 31, 2012
Paid-up Capital
CurrencyRevaluation
Reserve
MarketRevaluation
Reserve General ReserveGovernment Investment
Account Accumulated Profit Total
P’000 P’000 P’000 P’000 P’000 P’000 P’000
Balance at January 1, 2011 25 000 6 985 871 2 747 287 1 600 000 13 553 449 – 24 911 607 Balance at January 1, 2011Total comprehensive income for the year – 1 340 905 636 443 – – 6 659 556 8 636 904 Total comprehensive income for the yearNet unrealised currency gains on non-monetary
“available-for-sale” financial instruments Net unrealised gains from fair value changes on
“available-for-sale” financial instrumentsNet income for the year
–
––
1 340 905
––
–
636 443–
–
––
–
––
–
–6 659 556
1 340 905
˙636 4436 659 556
Net unrealised currency gains on non-monetary “available-for-sale” financial instruments
Net unrealised gains from fair value changes on “available-for-sale” financial instruments
Net income for the year
Transfers to/from Government Investment Account: Transfers to/from Government Investment Account:Net unrealised gains from fair value changes for
the year – – (247 078) – 247 078 – –Net unrealised gains from fair value changes for
the year
Net unrealised currency gains for the year – (1 434 465) – – 1 434 465 – – Net unrealised currency gains for the yearGovernment investments – – – – 6 901 871 – 6 901 871 Government investmentsTransfer to Currency Revaluation Reserve – 5 795 777 – – – (5 795 777) – Transfer to Currency Revaluation ReserveDividend to Government – – – – – (525 000) (525 000) Dividend to Government Residual net income – – – – – (338 779) (338 779) Residual net income Balance at December 31, 2011 25 000 12 688 088 3 136 652 1 600 000 22 136 863 – 39 586 603 Balance at December 31, 2011Total comprehensive income for the year – (233 138) 588 489 – – 5 521 730 5 877 081 Total comprehensive income for the yearNet unrealised currency losses on non–monetary
“available-for-sale” financial instruments Net unrealised gains from fair value changes on
“available-for-sale” financial instruments Net income for the year
–
––
(233 138)
––
–
588 489–
–
––
–
––
–
–5 521 730
(233 138)
588 4895 521 730
Net unrealised currency losses on non–monetary “available-for-sale” financial instruments
Net unrealised gains from fair value changes on “available-for-sale” financial instruments
Net income for the year
Transfers to/from Government Investment Account: Transfers to/from Government Investment Account:Net unrealised gains from fair value changes for
the year – – (237 692) – 237 692 – –Net unrealised gains from fair value changes for
the year Net unrealised currency gains for the year – (678 127) – – 678 127 – – Net unrealised currency gains for the year
Government withdrawals – – – – (4 666 044) – (4 666 044) Government withdrawalsTransfer to Currency Revaluation Reserve – 2 631 960 – – – (2 631 960) – Transfer to Currency Revaluation ReserveDividend to Government Residual net income
––
––
––
––
––
(780 000)(2 109 770)
(780 000)(2 109 770)
Dividend to Government Residual net income
Balance at December 31, 2012 25 000 14 408 783 3 487 449 1 600 000 18 386 638 – 37 907 870 Balance at December 31, 2012
The Government Investment Account, which was established on January 1, 1997, represents the Government’s portion of the Pula Fund and the Liquidity Portfolio.
36
BANK OF BOTSWANA ANNUAL REPORT 2012
SIGNIFICANT ACCOUNTING POLICIESDecember 31, 2012
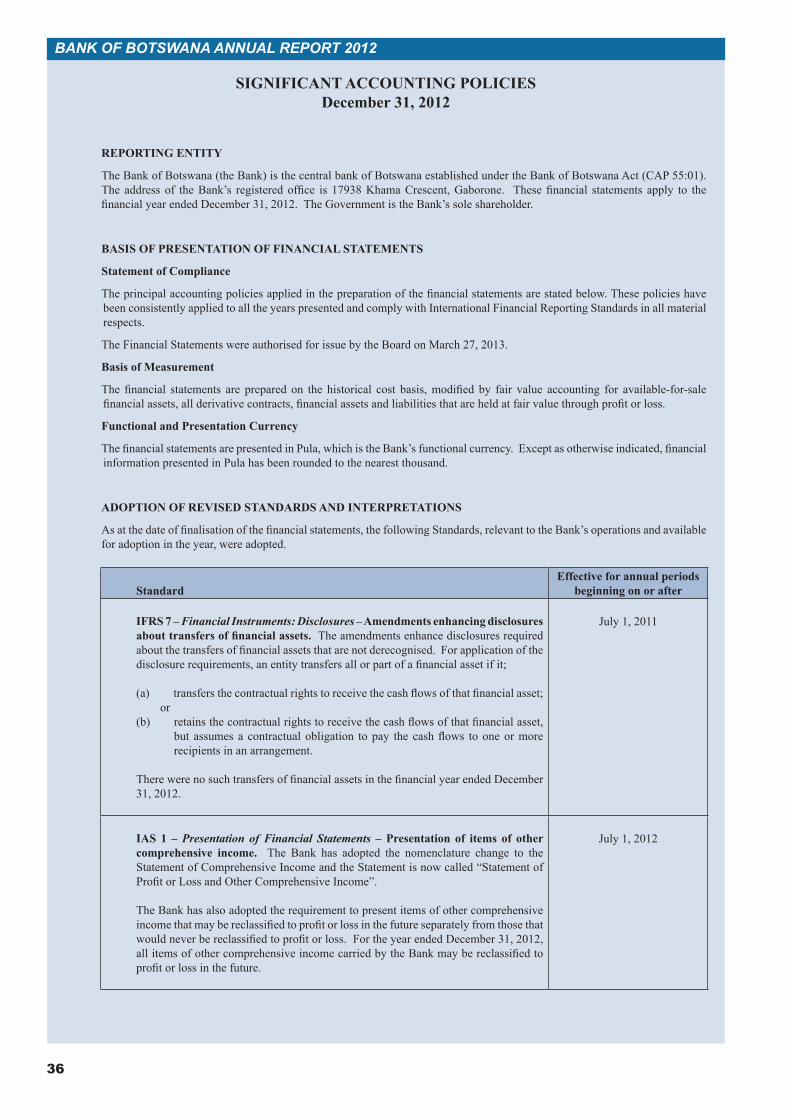
REPORTING ENTITY
The Bank of Botswana (the Bank) is the central bank of Botswana established under the Bank of Botswana Act (CAP 55:01). The address of the Bank’s registered office is 17938 Khama Crescent, Gaborone. These financial statements apply to the financial year ended December 31, 2012. The Government is the Bank’s sole shareholder.
BASIS OF PRESENTATION OF FINANCIAL STATEMENTS
Statement of Compliance
The principal accounting policies applied in the preparation of the financial statements are stated below. These policies have been consistently applied to all the years presented and comply with International Financial Reporting Standards in all material respects.
The Financial Statements were authorised for issue by the Board on March 27, 2013.
Basis of Measurement
The financial statements are prepared on the historical cost basis, modified by fair value accounting for available-for-sale financial assets, all derivative contracts, financial assets and liabilities that are held at fair value through profit or loss.
Functional and Presentation Currency
The financial statements are presented in Pula, which is the Bank’s functional currency. Except as otherwise indicated, financial information presented in Pula has been rounded to the nearest thousand.
ADOPTION OF REVISED STANDARDS AND INTERPRETATIONS
As at the date of finalisation of the financial statements, the following Standards, relevant to the Bank’s operations and available for adoption in the year, were adopted.
StandardEffective for annual periods
beginning on or after
IFRS 7 – Financial Instruments: Disclosures – Amendments enhancing disclosures about transfers of financial assets. The amendments enhance disclosures required about the transfers of financial assets that are not derecognised. For application of the disclosure requirements, an entity transfers all or part of a financial asset if it;
(a) transfers the contractual rights to receive the cash flows of that financial asset; or
(b) retains the contractual rights to receive the cash flows of that financial asset, but assumes a contractual obligation to pay the cash flows to one or more recipients in an arrangement.
There were no such transfers of financial assets in the financial year ended December 31, 2012.
July 1, 2011
IAS 1 – Presentation of Financial Statements – Presentation of items of other comprehensive income. The Bank has adopted the nomenclature change to the Statement of Comprehensive Income and the Statement is now called “Statement of Profit or Loss and Other Comprehensive Income”.
The Bank has also adopted the requirement to present items of other comprehensive income that may be reclassified to profit or loss in the future separately from those that would never be reclassified to profit or loss. For the year ended December 31, 2012, all items of other comprehensive income carried by the Bank may be reclassified to profit or loss in the future.
July 1, 2012
37
PART A: STATUTORy REPORT ON ThE OPERATiONS ANd FiNANciAL STATEmENTS OF ThE BANK, 2012
SIGNIFICANT ACCOUNTING POLICIES (Continued)December 31, 2012
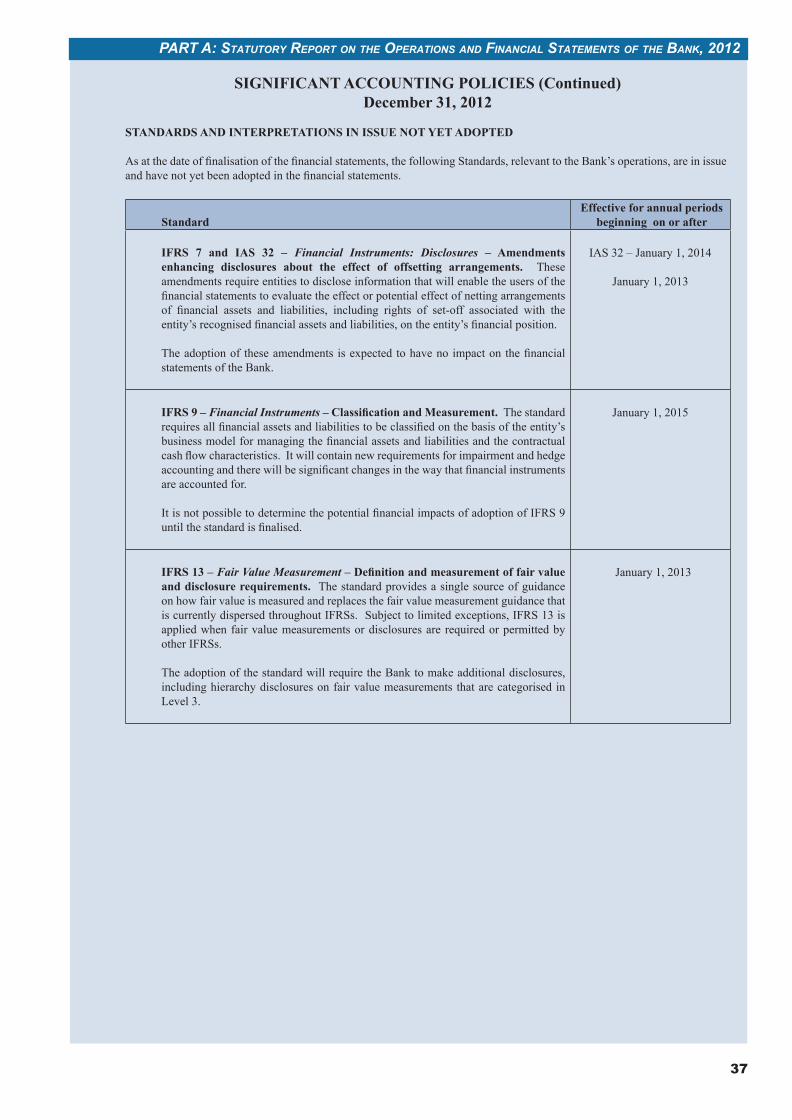
STANDARDS AND INTERPRETATIONS IN ISSUE NOT YET ADOPTED
As at the date of finalisation of the financial statements, the following Standards, relevant to the Bank’s operations, are in issue and have not yet been adopted in the financial statements.
StandardEffective for annual periods
beginning on or after
IFRS 7 and IAS 32 – Financial Instruments: Disclosures – Amendments enhancing disclosures about the effect of offsetting arrangements. These amendments require entities to disclose information that will enable the users of the financial statements to evaluate the effect or potential effect of netting arrangements of financial assets and liabilities, including rights of set-off associated with the entity’s recognised financial assets and liabilities, on the entity’s financial position.
The adoption of these amendments is expected to have no impact on the financial statements of the Bank.
IAS 32 – January 1, 2014
January 1, 2013
IFRS 9 – Financial Instruments – Classification and Measurement. The standard requires all financial assets and liabilities to be classified on the basis of the entity’s business model for managing the financial assets and liabilities and the contractual cash flow characteristics. It will contain new requirements for impairment and hedge accounting and there will be significant changes in the way that financial instruments are accounted for.
It is not possible to determine the potential financial impacts of adoption of IFRS 9 until the standard is finalised.
January 1, 2015
IFRS 13 – Fair Value Measurement – Definition and measurement of fair value and disclosure requirements. The standard provides a single source of guidance on how fair value is measured and replaces the fair value measurement guidance that is currently dispersed throughout IFRSs. Subject to limited exceptions, IFRS 13 is applied when fair value measurements or disclosures are required or permitted by other IFRSs.
The adoption of the standard will require the Bank to make additional disclosures, including hierarchy disclosures on fair value measurements that are categorised in Level 3.
January 1, 2013
38
BANK OF BOTSWANA ANNUAL REPORT 2012
SIGNIFICANT ACCOUNTING POLICIES (Continued)
December 31, 2012
FINANCIAL INSTRUMENTS
General
Financial instruments carried on the Statement of Financial Position include all assets and liabilities, including derivative instruments, but exclude property and equipment, prepayments, VAT receivables, sundry receivables and sundry receipts.
Financial Assets
Financial assets are classified into the following specified categories: financial assets “at fair value through profit or loss” (FVTPL) (including held for trading), “available-for-sale” and “loans and receivables”. The classification depends on the nature and purpose of the financial assets and is determined at the time of initial recognition as detailed below.
Financial assets are stated at fair value or amortised cost. A financial asset is measured initially at fair value plus, for an item not at fair value through profit or loss, transactions costs that are directly attributable to its acquisition.
Loans and receivables are carried at amortised cost less impairment losses.
Available-for-sale financial assets and financial assets through profit or loss are subsequently carried at fair value, excluding transaction costs.
The fair values of quoted investments in active markets are based on current bid prices. In other cases, the Bank establishes fair value by using appropriate valuation techniques.
Realised and unrealised gains and losses arising from changes in the fair value of financial assets at fair value through profit or loss are included in profit or loss in the year in which they arise. These realised and unrealised gains and losses exclude interest and dividends.
Realised gains and losses arising from changes in the fair value of available-for-sale financial assets are recognised in profit or loss. Unrealised gains and losses from fair value changes are recognised in other comprehensive income.
Interest income on all assets is calculated using the effective interest method and is recognised in profit or loss.
Dividends on available-for-sale equity instruments are recognised in profit or loss when the right to receive payment is established.
Short-term Investments (Liquidity Portfolio)
The Bank has designated the Liquidity Portfolio as a fund in which money market instruments and bonds are invested to facilitate payments for regular transactions.
Securities invested in this portfolio are measured “at fair value through profit or loss” and are classified as held for trading. They are initially recognised at fair value and are subsequently remeasured at fair value based on bid prices. All related realised and unrealised gains and losses are recognised in profit or loss.
All purchases and sales of investment securities in the portfolio are recognised at trade date, which is the date the Bank commits to purchase or sell the investments.
Long-term Investments (Pula Fund)
This is a long-term fund intended to maximise returns and is invested in foreign financial instruments. These investments, which may be sold in response to needs for liquidity, changes in interest rates, exchange rates, etc., are classified as “available-for-sale”, except for derivatives. These securities are initially recognised at fair value (which includes transaction costs) and are subsequently remeasured at fair value, based on bid prices.
All realised currency gains/losses are recognised in profit or loss. Unrealised currency gains/losses on monetary items are also recognised in profit or loss. The unrealised currency gains/losses on non-monetary items are recognised in other comprehensive income. However, in line with the Bank’s policy, all currency gains/losses for this fund are not distributable and are, therefore, appropriated to the Currency Revaluation Reserve.
39
PART A: STATUTORy REPORT ON ThE OPERATiONS ANd FiNANciAL STATEmENTS OF ThE BANK, 2012
SIGNIFICANT ACCOUNTING POLICIES (Continued)December 31, 2012
FINANCIAL INSTRUMENTS (Continued)
Realised fair value changes are recognised in profit or loss. Unrealised fair value changes are recognised in other comprehensive income. Unrealised gains and losses arising from fair value changes of the instruments classified as “available-for-sale” are undistributable as per the Bank’s policy and are appropriated to the Market Revaluation Reserve. When these instruments are disposed of or impaired, the related accumulated fair value or impairment adjustments are included in profit or loss as gains or losses from investment securities.
All purchases and sales of investment securities in the portfolio are recognised at trade date, which is the date the Bank commits to purchase or sell the investments.
Government of Botswana Bonds
The Bank acquires Government of Botswana bonds for purposes of facilitating orderly trading in the local bond market. The bonds, which may be sold in response to the need to intervene in the market, are classified as “available-for-sale” securities.
The bonds are initially recognised at fair value and are subsequently remeasured at fair value, based on bid prices. All unrealised gains and losses arising from changes in the fair value are recognised in the Market Revaluation Reserve. When these instruments are disposed of or impaired, the related accumulated fair value adjustments are included in profit or loss as gains or losses from Government of Botswana bonds.
All purchases and sales of bonds are recognised at trade date, which is the date that the Bank commits itself to purchase or sell the bonds.
Derivative Financial Instruments
The Bank uses a variety of derivative financial instruments to manage its exposure to interest rate and foreign exchange risk, including interest rate futures, foreign exchange forward contracts, cross-currency swaps and options.
Derivative financial instruments are initially recognised at fair value (including transaction costs) and are subsequently remeasured at fair value, based on bid prices for assets held or liabilities to be issued, and ask/offer prices for assets to be acquired or liabilities held. The resulting gain or loss is recognised in the profit or loss.
Loans and Receivables
Other receivables that have fixed or determinable payments that are not quoted in an active market are classified as “loans and receivables”. Loans and receivables are measured at amortised cost using the effective interest method, less any impairment. Interest income is recognised by applying the effective interest rate, except for short-term receivables when the recognition of interest would be immaterial.
Impairment of Financial Assets
Financial assets other than loans and receivables are carried at fair value. “Loans and receivables” are assessed for any evidence of impairment at each Statement of Financial Position date. Financial assets are impaired when there is objective evidence that as a result of one or more events that have occurred after the initial recognition of the financial asset, the estimated future cash flows of the investment have been adversely impacted. For financial assets carried at amortised cost, the amount of the impairment is the difference between the asset’s carrying amount and the present value of estimated future cash flows, discounted at the original effective interest rate. In respect of “available-for-sale” equity securities, any increase in fair value subsequent to an impairment loss is recognised directly in other comprehensive income.
Financial Liabilities
All the Bank’s financial liabilities are classified as other financial liabilities at amortised cost. Financial liabilities are initially recognised at fair value and subsequently measured at amortised cost using the effective interest rate method.
Bank of Botswana Certificates
As one of the primary tools for maintaining monetary stability in the economy, the Bank of Botswana issues its own paper, Bank of Botswana Certificates (BoBCs), to absorb excess liquidity in the market and thereby influence short term interest rates. BoBCs are issued at a discount to counterparties. They are classified as “other financial liabilities”.
40
BANK OF BOTSWANA ANNUAL REPORT 2012
SIGNIFICANT ACCOUNTING POLICIES (Continued)December 31, 2012
FINANCIAL INSTRUMENTS (Continued)
The Bank’s liability in respect of BoBCs is stated at offer prices on auction date, adjusted for movements in matured and unmatured discount recognised in profit or loss.
Other Financial Liabilities
Other financial liabilities are initially measured at fair value, net of transaction costs.
Other financial liabilities are subsequently measured at amortised cost using the effective interest rate method, with interest expense recognised on the effective yield basis. The effective interest method is a method of calculating the amortised cost of a financial liability and of allocating interest expense over the relevant period. The effective interest rate is the rate that exactly discounts future cash payments through the expected life of the financial liability, or where appropriate, a shorter period.
CREDIT FACILITY
Under the Credit Facility, the Bank provides emergency and intermittent funding to solvent financial institutions, intended to bridge intra-day and overnight liquidity shortages. The advances are secured by Government of Botswana bonds and Bank of Botswana Certificates (BoBCs), valued at fair value prices on the date of the transaction. Only high quality, marketable and freely transferable paper with a minimum amount of risk is acceptable as collateral at the discretion of the Bank. Government bonds and Government guaranteed securities of any maturity and other eligible paper with a remaining maturity of 184 days or less are also acceptable as security. The Bank has the right to call for additional collateral, should the value of the security decline during the tenure of the facility. Interest earned on the advances is credited to profit or loss, while advances outstanding as at the Statement of Financial Position date are recorded under “other assets”.
SECURITIES LENDING PROGRAMME
The Bank takes part in a Securities Lending Programme. Where securities are lent, the Bank holds collateral in the form of cash or other securities. The securities lent continue to be recorded in the Bank’s Statement of Financial Position.
The Bank’s global custodian administers the Securities Lending Programme and monitors the securities lent and related collateral against requirements agreed by the Bank.
The Bank records income from lending securities as it accrues.
REPURCHASE AND REVERSE REPURCHASE AGREEMENTS
This facility is one of the mechanisms designed to deal with short-term liquidity fluctuations in the domestic money market. It is available to primary counterparties who are solvent institutions licensed and supervised by the Bank.
The term of a repurchase agreement and reverse repurchase agreement can vary from overnight to one month, depending on the liquidity conditions in the domestic market.
Interest earned by the Bank on repurchase agreements and interest paid by the Bank on reverse repurchase agreements is recognised in profit or loss.
FOREIGN CURRENCIES
All transactions denominated in foreign currencies are translated to Pula at the mid exchange rate at the transaction date.
Where amounts denominated in one foreign currency are sold in order to buy another foreign denominated currency such that neither profit nor loss is realised on the transaction, mid exchange rates are used.
All assets and liabilities denominated in foreign currencies are translated to Pula using the bid and offer rates of exchange, respectively, at the close of the financial year. Foreign currency differences arising on translation are recognised in profit or loss, except for unrealised exchange differences arising on translation of non-monetary “available-for-sale” financial instruments, which are recognised in other comprehensive income. However, all gains and losses relating to disposals whose proceeds are reinvested in foreign assets, and all the unrealised gains/losses arising on financial instruments are not considered distributable in terms of Bank policy; they are appropriated to the Currency Revaluation Reserve.
41
PART A: STATUTORy REPORT ON ThE OPERATiONS ANd FiNANciAL STATEmENTS OF ThE BANK, 2012
SIGNIFICANT ACCOUNTING POLICIES (Continued)December 31, 2012
FINANCIAL INSTRUMENTS (Continued)
ASSETS, LIABILITIES AND RECOGNITION OF PROVISIONS
Assets
Assets are recognised when the Bank obtains control of a resource as a result of past events, and from which future economic benefits are expected to flow to the Bank.
Contingent Assets
The Bank discloses a contingent asset arising from past events where it is probable that economic benefits will flow from it, but this will only be confirmed by the occurrence or non-occurrence of one or more uncertain future events outside the control of the Bank.
Liabilities and Provisions
The Bank recognises liabilities (including provisions) when:
(a) it has a present legal obligation resulting from past events; (b) it is probable that an outflow of resources embodying economic benefits will be required to settle this obligation; and(c) a reliable estimate of the amount of the obligation can be made.
Derecognition of Assets and LiabilitiesThe Bank derecognises a financial asset when it loses control over the contractual rights that comprise the asset and transfers substantially all the risks and benefits associated with the asset. This arises when the rights are realised, expire or are surrendered. A financial liability is derecognised when it is legally discharged.
INCOME AND EXPENSE RECOGNITION
Interest income and expense are recognised in profit or loss on an accrual basis. Dividend income is recognised in profit or loss when the right to receive payment is established.
OFFSETTING FINANCIAL INSTRUMENTS
The Bank offsets financial assets and liabilities and reports the net balance in the Statement of Financial Position where:
(a) there is a legally enforceable right to set off;(b) there is an intention to settle on a net basis or to realise the asset and settle the liability simultaneously;(c) the maturity date for the financial assets and liability is the same; and(d) the financial asset and liability are denominated in the same currency.
GENERAL RESERVE
Under Section 7(1) of the Bank of Botswana Act, (CAP 55:01), the Bank of Botswana is required to establish and maintain a General Reserve sufficient to ensure the sustainability of future operations of the Bank. The Bank may transfer to the General Reserve funds from other reserves, which it maintains, for the purposes of maintaining the required level of the General Reserve.
CURRENCY REVALUATION RESERVE
Any changes in the valuation, in terms of Pula, of the Bank’s assets and liabilities in holdings of Special Drawing Rights and foreign currencies as a result of any change in the values of exchange rates of Special Drawing Rights or foreign currencies and in realised currency gains reinvested in foreign assets are transferred to the Currency Revaluation Reserve.
The proportion directly attributable to the Government Investment Account is transferred to such investment account.
MARKET REVALUATION RESERVE
Any changes in the value of the Bank’s long-term investments as a result of any change in the fair values of such investments are transferred to the Market Revaluation Reserve.The proportion directly attributable to the Government Investment Account is transferred to such investment account.
42
BANK OF BOTSWANA ANNUAL REPORT 2012
SIGNIFICANT ACCOUNTING POLICIES (Continued)December 31, 2012
PROPERTY AND EQUIPMENT
Property and equipment are stated at cost less related accumulated depreciation and any accumulated impairment losses.
Land and buildings are valued on a fair value basis every two years, and the recoverable (revalued) amounts disclosed by way of a note to the Financial Statements, providing that revalued amounts are in excess of the carrying amounts. Where the carrying amounts are more than the revalued amounts, an impairment loss is recognised in profit or loss.
At each Statement of Financial Position date, the Bank reviews the carrying amounts of its tangible and intangible assets to determine whether there is any indication that those assets have suffered an impairment loss. If any such indication exists, the recoverable amount of the asset is estimated in order to determine the extent of the impairment loss (if any).
Any impairment loss is recognised immediately in profit or loss.
Where an impairment loss subsequently reverses, the carrying amount of the asset is increased to the revised estimate of its recoverable amount, but so that the increased carrying amount does not exceed the carrying amount that would have been determined had no impairment loss been recognised for the asset in prior years.
Depreciation
Depreciation is charged so as to write-off the cost of assets less residual values, other than land and buildings under construction, over their estimated useful lives, using the straight-line method. The estimated useful lives, residual values and depreciation methods are reviewed at each year end, with the effect of any changes in estimate accounted for on a prospective basis.
The annual depreciation rates used in the calculation of depreciation are as follows:
PercentBuildings 2.5 – 6Furniture, fixtures and equipment 5 – 25Computer hardware 25Computer software 20Motor vehicles 20 – 25
A gain or loss arising on disposal or retirement of an item of property and equipment is determined as the difference between the net sales proceeds and the carrying amount of the asset and is recognised in profit or loss.
RETIREMENT BENEFITS
Pension benefits are provided for employees through the Bank of Botswana Defined Contribution Staff Pension Fund, which is governed in terms of the Pension and Provident Funds Act (CAP 27:03). The contribution per pensionable employee is at the rate of 21.5 percent of pensionable salary, which comprises 16 percent and 1.5 percent payable by the Bank as its contribution to the Fund and for administration costs of the Fund, respectively, and a 4 percent contribution by each pensionable employee. Other than the contributions made, the Bank has no commitments or obligations to this Fund. Obligations for contributions to the pension fund are recognised in profit or loss in the periods during which services are rendered by employees.
SHORT-TERM EMPLOYEE BENEFITS
Short-term employee benefits obligations are measured on an undiscounted basis and are expensed as the related service is provided.
FINANCE LEASES
The Bank classifies leases of land, property and equipment where it assumes substantially all the benefits and risks of ownership as finance leases. Upon initial recognition the leased asset is measured at an amount equal to the lower of its fair value and the present value of the minimum lease payments. The Bank allocates each lease payment between the liability and finance charges to achieve a constant periodic rate of interest on the finance balances outstanding for each period. The interest element of the finance charges is charged to profit or loss over the lease period. The land, property and equipment acquired under finance leases are depreciated over the shorter of the lease period and the useful lives of the assets, on the basis consistent with similar property and equipment.
RELATED PARTY TRANSACTIONS
The Bank enters into various transactions with other wholly owned or partly owned Government institutions and its key management personnel (related parties). All related party transactions are entered into at arm’s length in the ordinary course of business. The transactions with key management personnel are staff benefits provided for in the General Conditions of Service of the Bank.

43
PART A: STATUTORy REPORT ON ThE OPERATiONS ANd FiNANciAL STATEmENTS OF ThE BANK, 2012
SIGNIFICANT ACCOUNTING POLICIES (Continued)December 31, 2012
SIGNIFICANT ACCOUNTING ESTIMATES AND JUDGEMENTS IN APPLYING ACCOUNTING POLICIES
The Bank makes estimates and assumptions that affect the reported amounts of assets and liabilities within the next financial year. Estimates and judgements are continually evaluated and are based on historical experience and other factors, including expectations of future events that are believed to be reasonable under the circumstances.
Useful Lives of Property and Equipment
Management reviews the estimated useful lives of property and equipment at the end of each annual reporting period. In this financial year, no change was made to the useful lives, hence the depreciation rates provided are similar with the prior year.
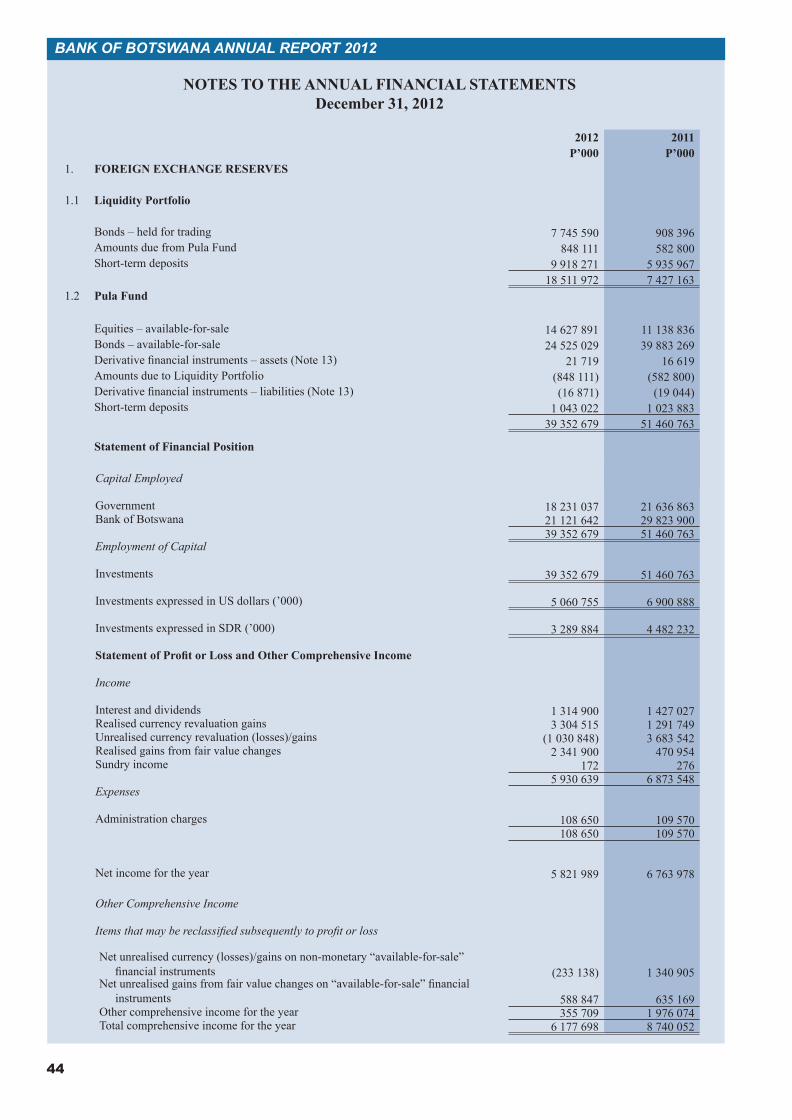
44
BANK OF BOTSWANA ANNUAL REPORT 2012
NOTES TO THE ANNUAL FINANCIAL STATEMENTSDecember 31, 2012
2012 2011P’000 P’000
1. FOREIGN EXCHANGE RESERVES
1.1 Liquidity Portfolio
Bonds – held for trading 7 745 590 908 396Amounts due from Pula Fund 848 111 582 800Short-term deposits 9 918 271 5 935 967
18 511 972 7 427 1631.2 Pula Fund
Equities – available-for-sale 14 627 891 11 138 836Bonds – available-for-sale 24 525 029 39 883 269Derivative financial instruments – assets (Note 13) 21 719 16 619Amounts due to Liquidity Portfolio (848 111) (582 800)Derivative financial instruments – liabilities (Note 13) (16 871) (19 044)Short-term deposits 1 043 022 1 023 883
39 352 679 51 460 763
Statement of Financial Position
Capital Employed
Government 18 231 037 21 636 863Bank of Botswana 21 121 642 29 823 900
39 352 679 51 460 763Employment of Capital
Investments 39 352 679 51 460 763
Investments expressed in US dollars (’000) 5 060 755 6 900 888
Investments expressed in SDR (’000) 3 289 884 4 482 232
Statement of Profit or Loss and Other Comprehensive Income
Income
Interest and dividends 1 314 900 1 427 027Realised currency revaluation gains 3 304 515 1 291 749Unrealised currency revaluation (losses)/gains (1 030 848) 3 683 542Realised gains from fair value changes 2 341 900 470 954Sundry income 172 276
5 930 639 6 873 548Expenses
Administration charges 108 650 109 570108 650 109 570
Net income for the year 5 821 989 6 763 978
Other Comprehensive Income
Items that may be reclassified subsequently to profit or loss
Net unrealised currency (losses)/gains on non-monetary “available-for-sale” financial instruments (233 138) 1 340 905
Net unrealised gains from fair value changes on “available-for-sale” financial instruments 588 847 635 169
Other comprehensive income for the year 355 709 1 976 074Total comprehensive income for the year 6 177 698 8 740 052
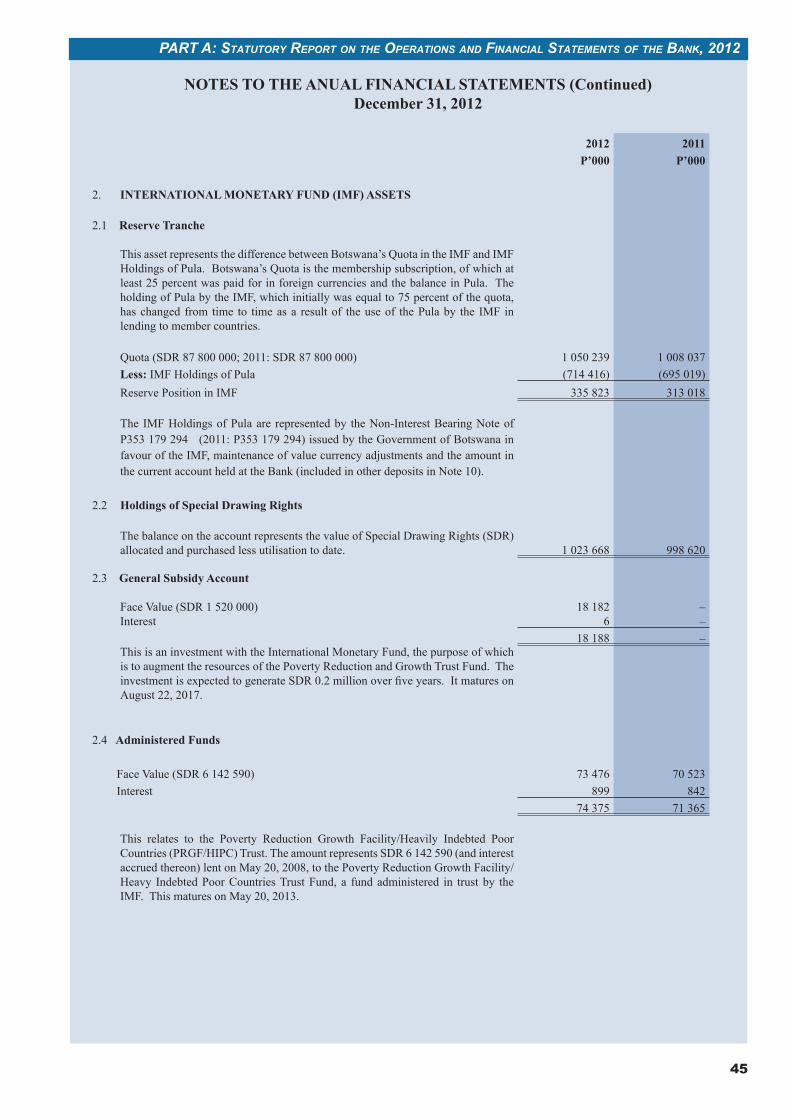
45
PART A: STATUTORy REPORT ON ThE OPERATiONS ANd FiNANciAL STATEmENTS OF ThE BANK, 2012
NOTES TO THE ANUAL FINANCIAL STATEMENTS (Continued)December 31, 2012
2012 2011P’000 P’000
2. INTERNATIONAL MONETARY FUND (IMF) ASSETS
2.1 Reserve Tranche
This asset represents the difference between Botswana’s Quota in the IMF and IMF Holdings of Pula. Botswana’s Quota is the membership subscription, of which at least 25 percent was paid for in foreign currencies and the balance in Pula. The holding of Pula by the IMF, which initially was equal to 75 percent of the quota, has changed from time to time as a result of the use of the Pula by the IMF in lending to member countries.
Quota (SDR 87 800 000; 2011: SDR 87 800 000) 1 050 239 1 008 037Less: IMF Holdings of Pula (714 416) (695 019)Reserve Position in IMF 335 823 313 018
The IMF Holdings of Pula are represented by the Non-Interest Bearing Note of P353 179 294 (2011: P353 179 294) issued by the Government of Botswana in favour of the IMF, maintenance of value currency adjustments and the amount in the current account held at the Bank (included in other deposits in Note 10).
2.2 Holdings of Special Drawing Rights
The balance on the account represents the value of Special Drawing Rights (SDR) allocated and purchased less utilisation to date. 1 023 668 998 620
2.3 General Subsidy Account
Face Value (SDR 1 520 000) Interest
18 1826
––
18 188 – This is an investment with the International Monetary Fund, the purpose of which
is to augment the resources of the Poverty Reduction and Growth Trust Fund. The investment is expected to generate SDR 0.2 million over five years. It matures on August 22, 2017.
2.4 Administered Funds
Face Value (SDR 6 142 590) 73 476 70 523 Interest 899 842
74 375 71 365
This relates to the Poverty Reduction Growth Facility/Heavily Indebted Poor Countries (PRGF/HIPC) Trust. The amount represents SDR 6 142 590 (and interest accrued thereon) lent on May 20, 2008, to the Poverty Reduction Growth Facility/Heavy Indebted Poor Countries Trust Fund, a fund administered in trust by the IMF. This matures on May 20, 2013.
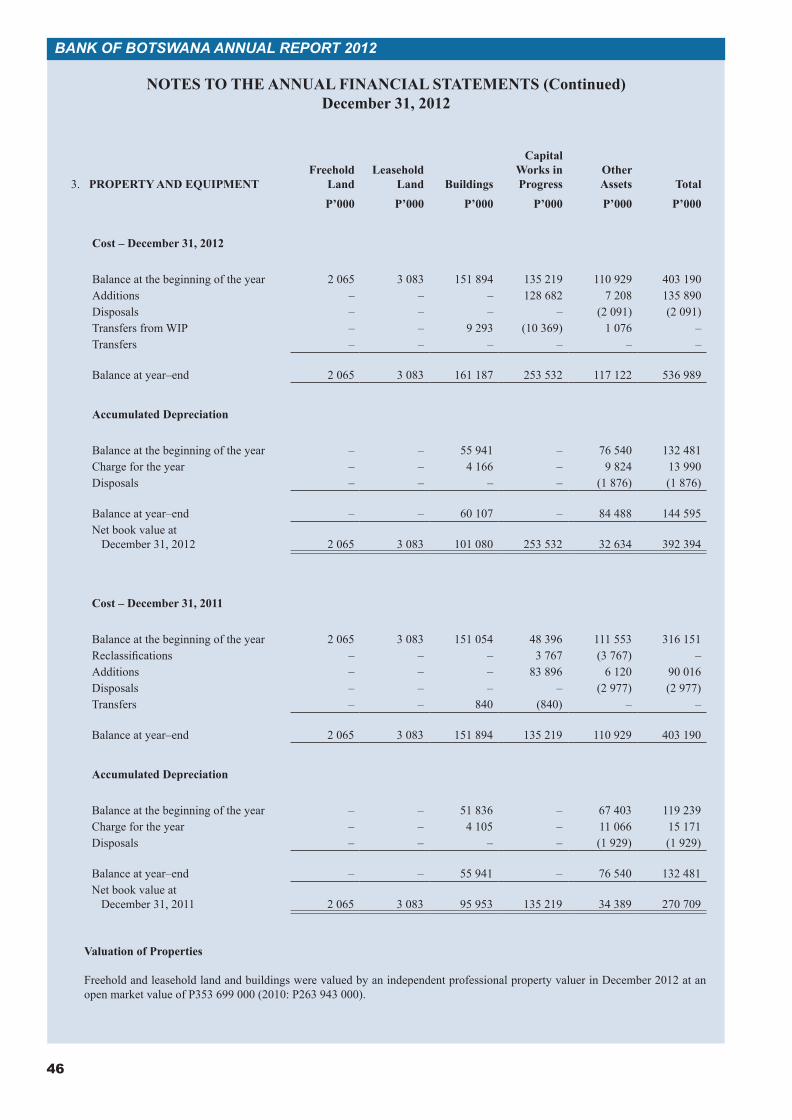
46
BANK OF BOTSWANA ANNUAL REPORT 2012
NOTES TO THE ANNUAL FINANCIAL STATEMENTS (Continued)December 31, 2012
3. PROPERTY AND EQUIPMENTFreehold
LandLeasehold
Land Buildings
Capital Works in Progress
Other Assets Total
P’000 P’000 P’000 P’000 P’000 P’000
Cost – December 31, 2012
Balance at the beginning of the year 2 065 3 083 151 894 135 219 110 929 403 190Additions – – – 128 682 7 208 135 890Disposals – – – – (2 091) (2 091)Transfers from WIP – – 9 293 (10 369) 1 076 –Transfers – – – – – –
Balance at year–end 2 065 3 083 161 187 253 532 117 122 536 989
Accumulated Depreciation
Balance at the beginning of the year – – 55 941 – 76 540 132 481Charge for the year – – 4 166 – 9 824 13 990Disposals – – – – (1 876) (1 876)
Balance at year–end – – 60 107 – 84 488 144 595Net book value at
December 31, 2012 2 065 3 083 101 080 253 532 32 634 392 394
Cost – December 31, 2011
Balance at the beginning of the year 2 065 3 083 151 054 48 396 111 553 316 151Reclassifications – – – 3 767 (3 767) –Additions – – – 83 896 6 120 90 016Disposals – – – – (2 977) (2 977)Transfers – – 840 (840) – –
Balance at year–end 2 065 3 083 151 894 135 219 110 929 403 190
Accumulated Depreciation
Balance at the beginning of the year – – 51 836 – 67 403 119 239Charge for the year – – 4 105 – 11 066 15 171Disposals – – – – (1 929) (1 929)
Balance at year–end – – 55 941 – 76 540 132 481Net book value at
December 31, 2011 2 065 3 083 95 953 135 219 34 389 270 709
Valuation of Properties
Freehold and leasehold land and buildings were valued by an independent professional property valuer in December 2012 at an open market value of P353 699 000 (2010: P263 943 000).
NOTES TO THE ANNUAL FINANCIAL STATEMENTS (Continued)December 31, 2011
3. PROPERTY AND EQUIPMENTFreehold
LandLeasehold
Land Buildings
Capital Works in Progress
Other Assets Total
P’000 P’000 P’000 P’000 P’000 P’000
Cost – December 31, 2011
Balance at the beginning of the year 2 065 3 083 151 054 48 396 111 553 316 151Reclassifications – – – 3 767 (3 767) –Additions – – – 83 896 6 120 90 016Disposals – – – – (2 977) (2 977)Transfers – – 840 (840) – –
Balance at year–end 2 065 3 083 151 894 135 219 110 929 403 190
Accumulated Depreciation
Balance at the beginning of the year – – 51 836 – 67 403 119 239Charge for the year – – 4 105 – 11 066 15 171Disposals – – – – (1 929) (1 929)
Balance at year–end – – 55 941 – 76 540 132 481
Net book value at December 31, 2011 2 065 3 083 95 953 135 219 34 389 270 709
Cost – December 31, 2010
Balance at the beginning of the year 780 4 368 151 309 10 571 100 728 267 756Reclassifications 1 285 (1 285) – – – –Additions – – – 42 456 10 014 52 470Disposals – – (315) – (3 760) (4 075)Transfers – – 60 (4 631) 4 571 –
Balance at year–end 2 065 3 083 151 054 48 396 111 553 316 151
Accumulated Depreciation
Balance at the beginning of the year – – 47 771 – 59 203 106 974Charge for the year – – 4 084 – 11 313 15 397Disposals – – (19) – (3 113) (3 132)
Balance at year–end – – 51 836 – 67 403 119 239
Net book value at December 31, 2010 2 065 3 083 99 218 48 396 44 150 196 912
Revaluation of Properties
Freehold and leasehold land and buildings were valued by an independent professional property valuer in December 2010 at an open market value of P263 943 000 (2008: P179 460 000).
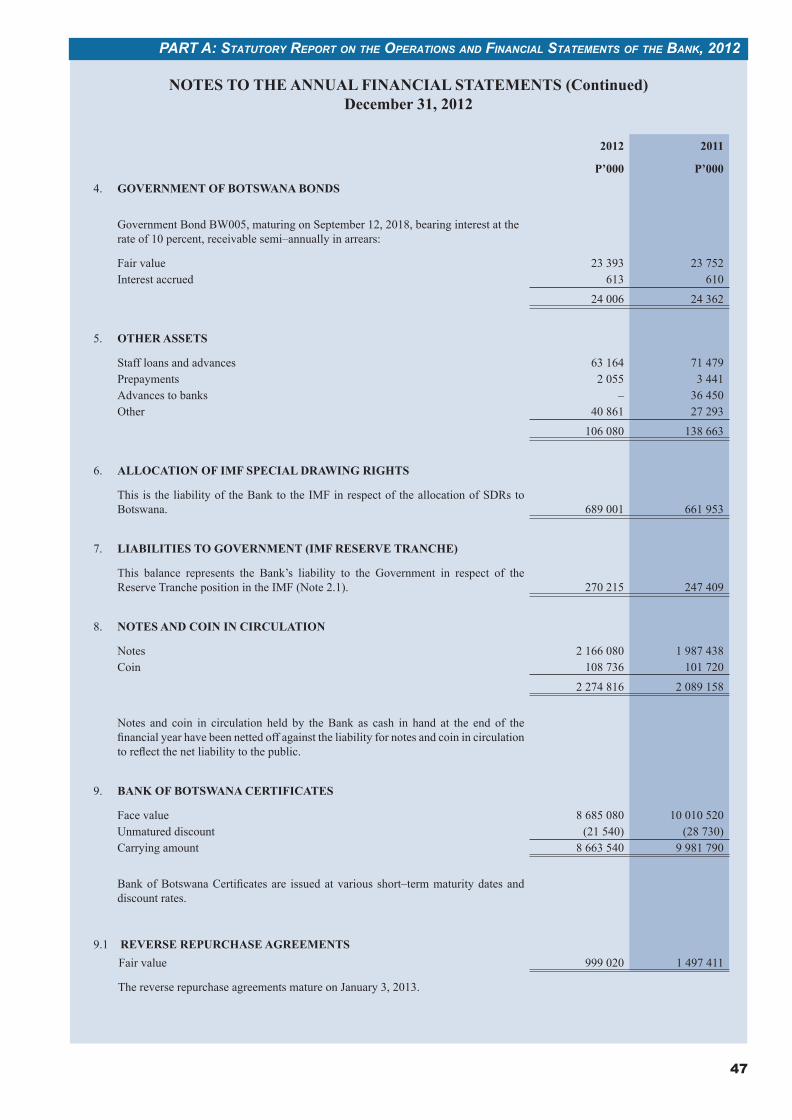
47
PART A: STATUTORy REPORT ON ThE OPERATiONS ANd FiNANciAL STATEmENTS OF ThE BANK, 2012
NOTES TO THE ANNUAL FINANCIAL STATEMENTS (Continued)December 31, 2012
2012 2011
P’000 P’0004. GOVERNMENT OF BOTSWANA BONDS
Government Bond BW005, maturing on September 12, 2018, bearing interest at the rate of 10 percent, receivable semi–annually in arrears:
Fair value 23 393 23 752Interest accrued 613 610
24 006 24 362
5. OTHER ASSETS
Staff loans and advances 63 164 71 479Prepayments 2 055 3 441Advances to banks – 36 450Other 40 861 27 293
106 080 138 663
6. ALLOCATION OF IMF SPECIAL DRAWING RIGHTS
This is the liability of the Bank to the IMF in respect of the allocation of SDRs to Botswana. 689 001 661 953
7. LIABILITIES TO GOVERNMENT (IMF RESERVE TRANCHE)
This balance represents the Bank’s liability to the Government in respect of the Reserve Tranche position in the IMF (Note 2.1). 270 215 247 409
8. NOTES AND COIN IN CIRCULATION
Notes 2 166 080 1 987 438Coin 108 736 101 720
2 274 816 2 089 158
Notes and coin in circulation held by the Bank as cash in hand at the end of the financial year have been netted off against the liability for notes and coin in circulation to reflect the net liability to the public.
9. BANK OF BOTSWANA CERTIFICATES
Face value 8 685 080 10 010 520Unmatured discount (21 540) (28 730)Carrying amount 8 663 540 9 981 790
Bank of Botswana Certificates are issued at various short–term maturity dates and discount rates.
9.1 REVERSE REPURCHASE AGREEMENTSFair value 999 020 1 497 411
The reverse repurchase agreements mature on January 3, 2013.
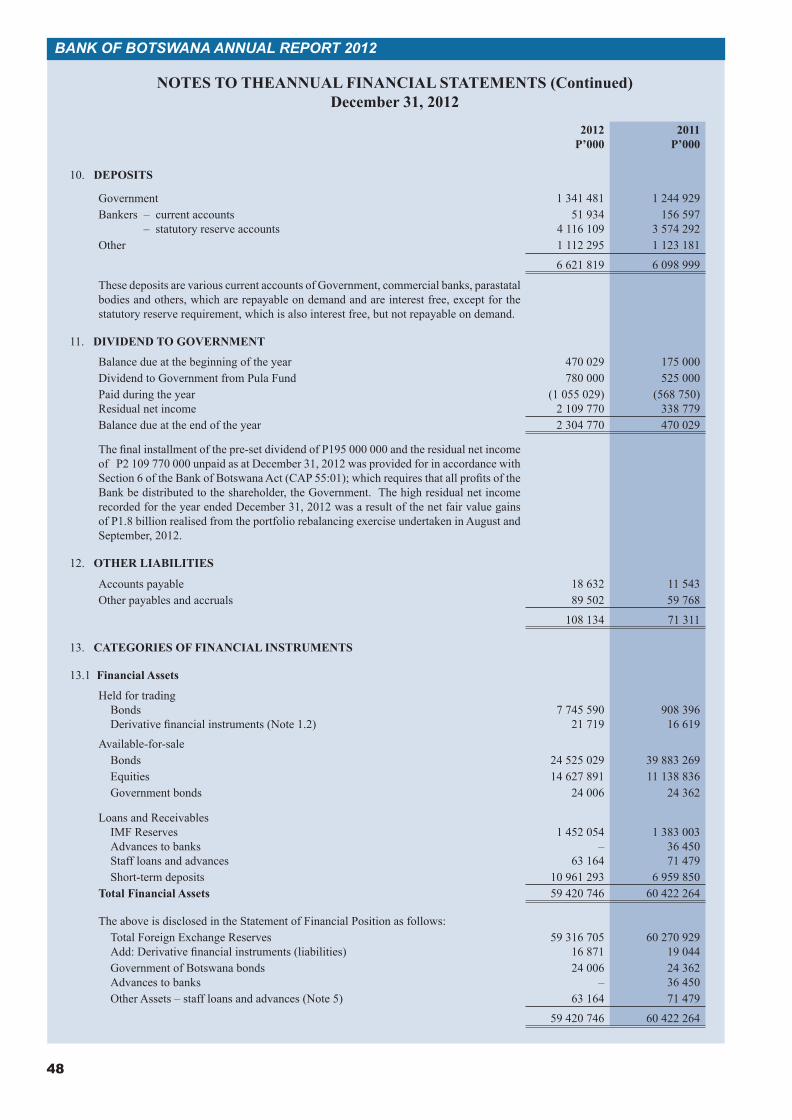
48
BANK OF BOTSWANA ANNUAL REPORT 2012
NOTES TO THEANNUAL FINANCIAL STATEMENTS (Continued)December 31, 2012
2012P’000
2011P’000
10. DEPOSITS
Government 1 341 481 1 244 929Bankers – current accounts
– statutory reserve accounts51 934
4 116 109156 597
3 574 292Other 1 112 295 1 123 181
6 621 819 6 098 999
These deposits are various current accounts of Government, commercial banks, parastatal bodies and others, which are repayable on demand and are interest free, except for the statutory reserve requirement, which is also interest free, but not repayable on demand.
11. DIVIDEND TO GOVERNMENT
Balance due at the beginning of the year 470 029 175 000Dividend to Government from Pula Fund 780 000 525 000Paid during the yearResidual net income
(1 055 029)2 109 770
(568 750)338 779
Balance due at the end of the year 2 304 770 470 029
The final installment of the pre-set dividend of P195 000 000 and the residual net income of P2 109 770 000 unpaid as at December 31, 2012 was provided for in accordance with Section 6 of the Bank of Botswana Act (CAP 55:01); which requires that all profits of the Bank be distributed to the shareholder, the Government. The high residual net income recorded for the year ended December 31, 2012 was a result of the net fair value gains of P1.8 billion realised from the portfolio rebalancing exercise undertaken in August and September, 2012.
12. OTHER LIABILITIES
Accounts payable 18 632 11 543Other payables and accruals 89 502 59 768
108 134 71 311
13. CATEGORIES OF FINANCIAL INSTRUMENTS
13.1 Financial Assets
Held for tradingBondsDerivative financial instruments (Note 1.2)
7 745 59021 719
908 39616 619
Available-for-saleBonds 24 525 029 39 883 269Equities 14 627 891 11 138 836Government bonds 24 006 24 362
Loans and ReceivablesIMF ReservesAdvances to banksStaff loans and advances
1 452 054–
63 164
1 383 00336 45071 479
Short-term deposits 10 961 293 6 959 850Total Financial Assets 59 420 746 60 422 264
The above is disclosed in the Statement of Financial Position as follows:Total Foreign Exchange ReservesAdd: Derivative financial instruments (liabilities)
59 316 70516 871
60 270 92919 044
Government of Botswana bondsAdvances to banks
24 006–
24 36236 450
Other Assets – staff loans and advances (Note 5) 63 164 71 479
59 420 746 60 422 264
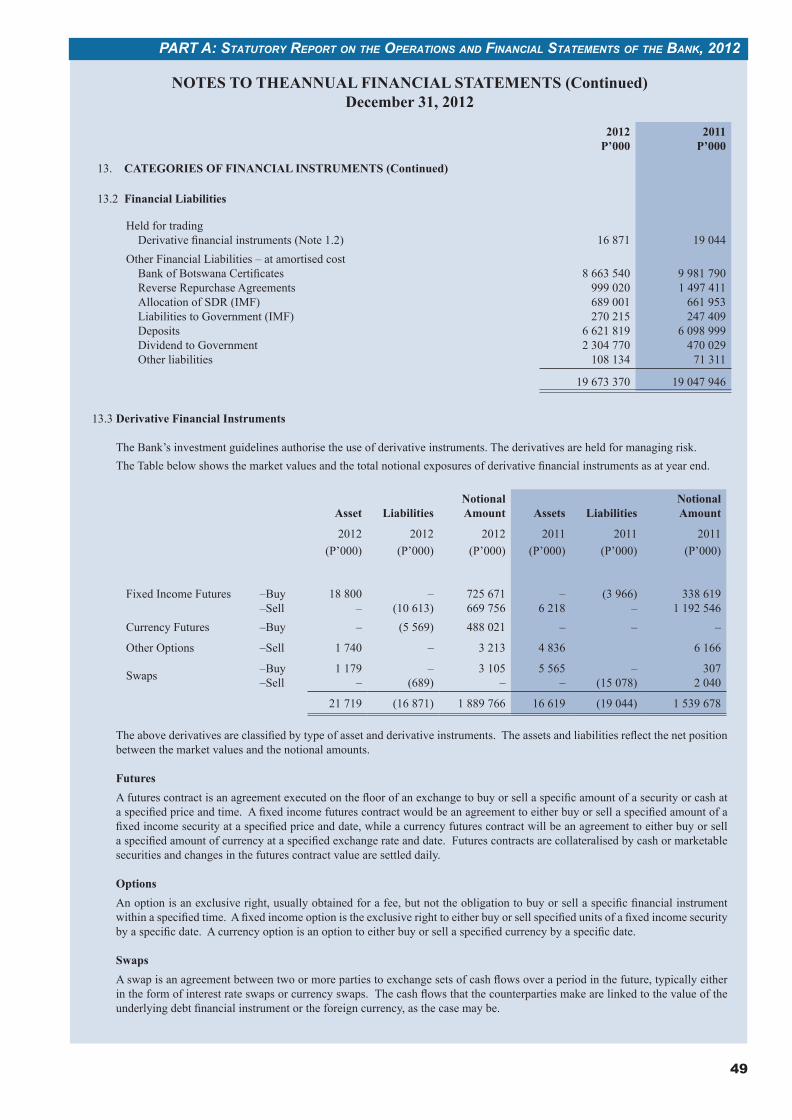
49
PART A: STATUTORy REPORT ON ThE OPERATiONS ANd FiNANciAL STATEmENTS OF ThE BANK, 2012
NOTES TO THEANNUAL FINANCIAL STATEMENTS (Continued)December 31, 2012
2012P’000
2011P’000
13. CATEGORIES OF FINANCIAL INSTRUMENTS (Continued)
13.2 Financial Liabilities
Held for tradingDerivative financial instruments (Note 1.2) 16 871 19 044
Other Financial Liabilities – at amortised costBank of Botswana CertificatesReverse Repurchase AgreementsAllocation of SDR (IMF)Liabilities to Government (IMF)DepositsDividend to GovernmentOther liabilities
8 663 540999 020689 001270 215
6 621 8192 304 770
108 134
9 981 7901 497 411
661 953247 409
6 098 999470 029
71 311
19 673 370 19 047 946
13.3 Derivative Financial Instruments
The Bank’s investment guidelines authorise the use of derivative instruments. The derivatives are held for managing risk.The Table below shows the market values and the total notional exposures of derivative financial instruments as at year end.
Asset LiabilitiesNotional Amount Assets Liabilities
Notional Amount
2012 2012 2012 2011 2011 2011(P’000) (P’000) (P’000) (P’000) (P’000) (P’000)
Fixed Income Futures –Buy–Sell
18 800–
–(10 613)
725 671669 756
–6 218
(3 966)–
338 6191 192 546
Currency Futures –Buy – (5 569) 488 021 – – –
Other Options –Sell 1 740 – 3 213 4 836 6 166
Swaps –Buy–Sell
1 179–
–(689)
3 105–
5 565–
–(15 078)
3072 040
21 719 (16 871) 1 889 766 16 619 (19 044) 1 539 678
The above derivatives are classified by type of asset and derivative instruments. The assets and liabilities reflect the net position between the market values and the notional amounts.
FuturesA futures contract is an agreement executed on the floor of an exchange to buy or sell a specific amount of a security or cash at a specified price and time. A fixed income futures contract would be an agreement to either buy or sell a specified amount of a fixed income security at a specified price and date, while a currency futures contract will be an agreement to either buy or sell a specified amount of currency at a specified exchange rate and date. Futures contracts are collateralised by cash or marketable securities and changes in the futures contract value are settled daily.
OptionsAn option is an exclusive right, usually obtained for a fee, but not the obligation to buy or sell a specific financial instrument within a specified time. A fixed income option is the exclusive right to either buy or sell specified units of a fixed income security by a specific date. A currency option is an option to either buy or sell a specified currency by a specific date.
SwapsA swap is an agreement between two or more parties to exchange sets of cash flows over a period in the future, typically either in the form of interest rate swaps or currency swaps. The cash flows that the counterparties make are linked to the value of the underlying debt financial instrument or the foreign currency, as the case may be.
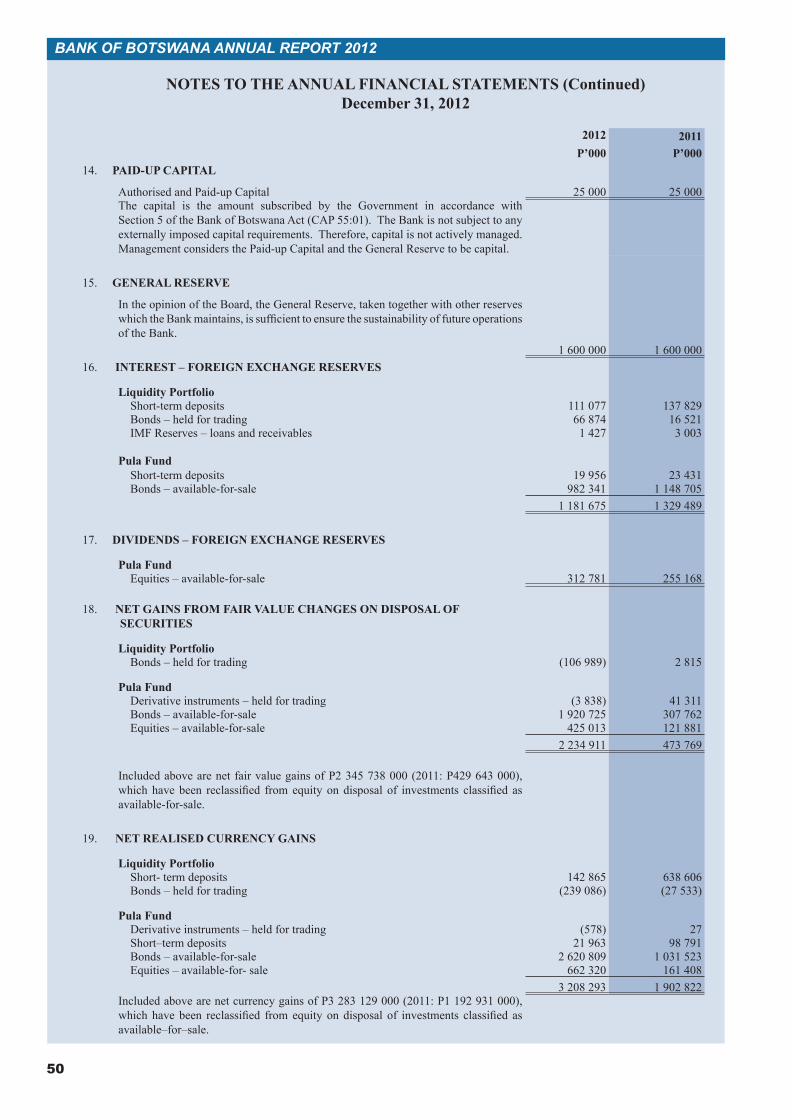
50
BANK OF BOTSWANA ANNUAL REPORT 2012
NOTES TO THE ANNUAL FINANCIAL STATEMENTS (Continued)December 31, 2012
2012P’000
2011P’000
14. PAID-UP CAPITAL
Authorised and Paid-up Capital 25 000 25 000The capital is the amount subscribed by the Government in accordance with Section 5 of the Bank of Botswana Act (CAP 55:01). The Bank is not subject to any externally imposed capital requirements. Therefore, capital is not actively managed. Management considers the Paid-up Capital and the General Reserve to be capital.
15. GENERAL RESERVE
In the opinion of the Board, the General Reserve, taken together with other reserves which the Bank maintains, is sufficient to ensure the sustainability of future operations of the Bank.
1 600 000 1 600 00016. INTEREST – FOREIGN EXCHANGE RESERVES
Liquidity PortfolioShort-term deposits 111 077 137 829Bonds – held for trading 66 874 16 521IMF Reserves – loans and receivables 1 427 3 003
Pula Fund Short-term deposits 19 956 23 431Bonds – available-for-sale 982 341 1 148 705
1 181 675 1 329 489
17. DIVIDENDS – FOREIGN EXCHANGE RESERVES
Pula FundEquities – available-for-sale 312 781 255 168
18. NET GAINS FROM FAIR VALUE CHANGES ON DISPOSAL OF SECURITIES
Liquidity PortfolioBonds – held for trading (106 989) 2 815
Pula FundDerivative instruments – held for trading (3 838) 41 311Bonds – available-for-sale 1 920 725 307 762Equities – available-for-sale 425 013 121 881
2 234 911 473 769
Included above are net fair value gains of P2 345 738 000 (2011: P429 643 000), which have been reclassified from equity on disposal of investments classified as available-for-sale.
19. NET REALISED CURRENCY GAINS
Liquidity PortfolioShort- term deposits 142 865 638 606Bonds – held for trading (239 086) (27 533)
Pula Fund Derivative instruments – held for trading (578) 27Short–term deposits 21 963 98 791Bonds – available-for-sale 2 620 809 1 031 523Equities – available-for- sale 662 320 161 408
3 208 293 1 902 822Included above are net currency gains of P3 283 129 000 (2011: P1 192 931 000), which have been reclassified from equity on disposal of investments classified as available–for–sale.
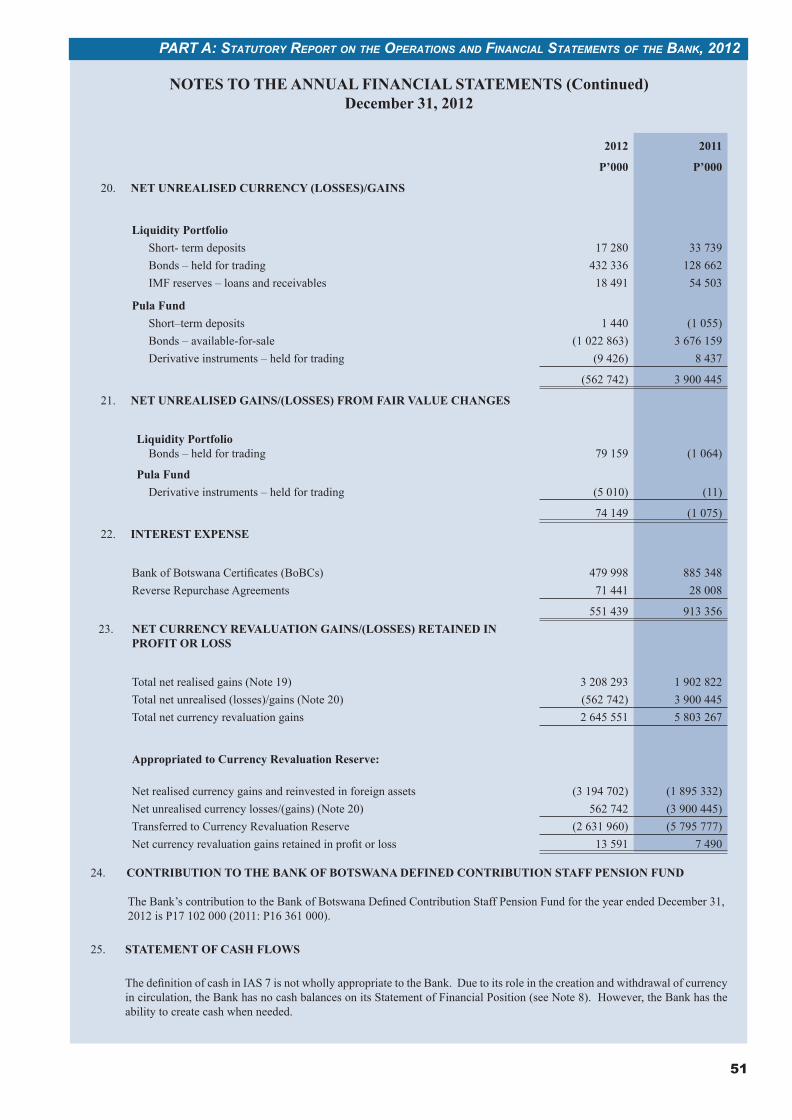
51
PART A: STATUTORy REPORT ON ThE OPERATiONS ANd FiNANciAL STATEmENTS OF ThE BANK, 2012
NOTES TO THE ANNUAL FINANCIAL STATEMENTS (Continued)December 31, 2012
2012 2011
P’000 P’000
20. NET UNREALISED CURRENCY (LOSSES)/GAINS
Liquidity PortfolioShort- term deposits 17 280 33 739Bonds – held for trading 432 336 128 662IMF reserves – loans and receivables 18 491 54 503
Pula FundShort–term deposits 1 440 (1 055)Bonds – available-for-sale (1 022 863) 3 676 159Derivative instruments – held for trading (9 426) 8 437
(562 742) 3 900 445
21. NET UNREALISED GAINS/(LOSSES) FROM FAIR VALUE CHANGES
Liquidity PortfolioBonds – held for trading 79 159 (1 064)
Pula FundDerivative instruments – held for trading (5 010) (11)
74 149 (1 075)
22. INTEREST EXPENSE
Bank of Botswana Certificates (BoBCs) 479 998 885 348Reverse Repurchase Agreements 71 441 28 008
551 439 913 35623. NET CURRENCY REVALUATION GAINS/(LOSSES) RETAINED IN
PROFIT OR LOSS
Total net realised gains (Note 19) 3 208 293 1 902 822Total net unrealised (losses)/gains (Note 20) (562 742) 3 900 445Total net currency revaluation gains 2 645 551 5 803 267
Appropriated to Currency Revaluation Reserve:
Net realised currency gains and reinvested in foreign assets (3 194 702) (1 895 332)Net unrealised currency losses/(gains) (Note 20) 562 742 (3 900 445)Transferred to Currency Revaluation Reserve (2 631 960) (5 795 777)Net currency revaluation gains retained in profit or loss 13 591 7 490
24. CONTRIBUTION TO THE BANK OF BOTSWANA DEFINED CONTRIBUTION STAFF PENSION FUND
The Bank’s contribution to the Bank of Botswana Defined Contribution Staff Pension Fund for the year ended December 31, 2012 is P17 102 000 (2011: P16 361 000).
25. STATEMENT OF CASH FLOWS
The definition of cash in IAS 7 is not wholly appropriate to the Bank. Due to its role in the creation and withdrawal of currency in circulation, the Bank has no cash balances on its Statement of Financial Position (see Note 8). However, the Bank has the ability to create cash when needed.
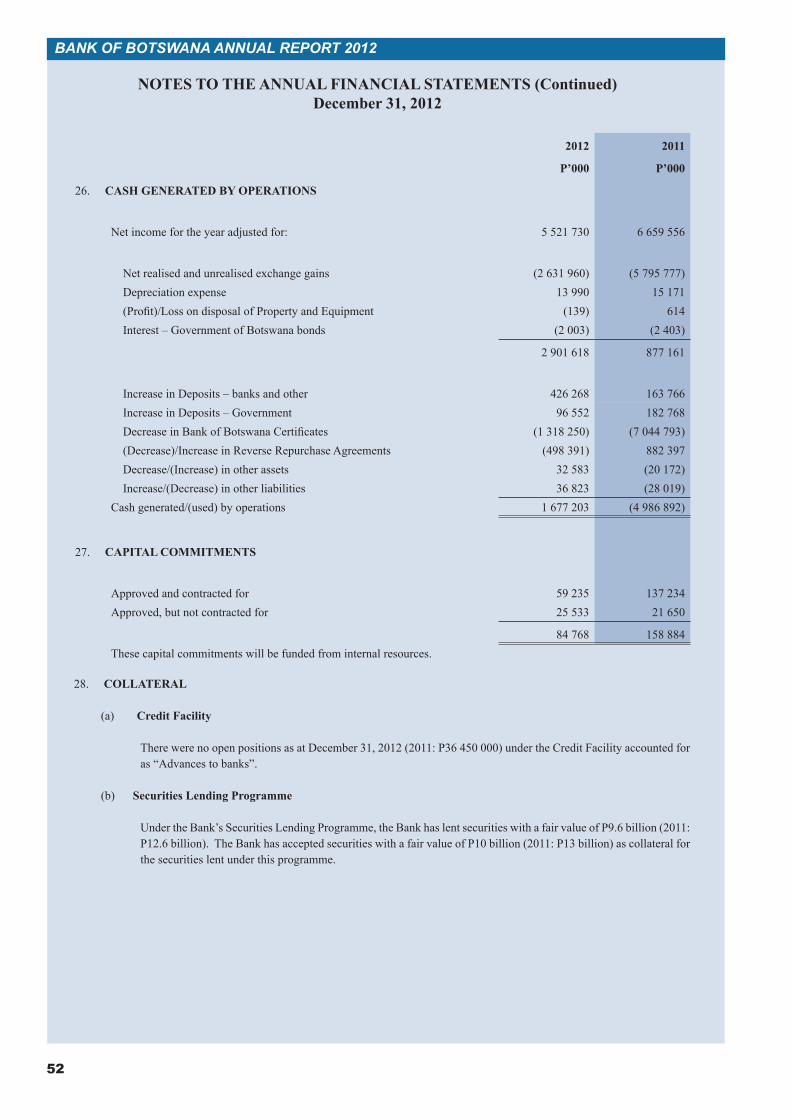
52
BANK OF BOTSWANA ANNUAL REPORT 2012
NOTES TO THE ANNUAL FINANCIAL STATEMENTS (Continued)December 31, 2012
2012 2011
P’000 P’000
26. CASH GENERATED BY OPERATIONS
Net income for the year adjusted for: 5 521 730 6 659 556
Net realised and unrealised exchange gains (2 631 960) (5 795 777)Depreciation expense 13 990 15 171(Profit)/Loss on disposal of Property and Equipment (139) 614Interest – Government of Botswana bonds (2 003) (2 403)
2 901 618 877 161
Increase in Deposits – banks and other 426 268 163 766Increase in Deposits – Government 96 552 182 768Decrease in Bank of Botswana Certificates (1 318 250) (7 044 793)(Decrease)/Increase in Reverse Repurchase Agreements (498 391) 882 397Decrease/(Increase) in other assets 32 583 (20 172)Increase/(Decrease) in other liabilities 36 823 (28 019)
Cash generated/(used) by operations 1 677 203 (4 986 892)
27. CAPITAL COMMITMENTS
Approved and contracted for 59 235 137 234Approved, but not contracted for 25 533 21 650
84 768 158 884These capital commitments will be funded from internal resources.
28. COLLATERAL
(a) Credit Facility
There were no open positions as at December 31, 2012 (2011: P36 450 000) under the Credit Facility accounted for as “Advances to banks”.
(b) Securities Lending Programme
Under the Bank’s Securities Lending Programme, the Bank has lent securities with a fair value of P9.6 billion (2011: P12.6 billion). The Bank has accepted securities with a fair value of P10 billion (2011: P13 billion) as collateral for the securities lent under this programme.
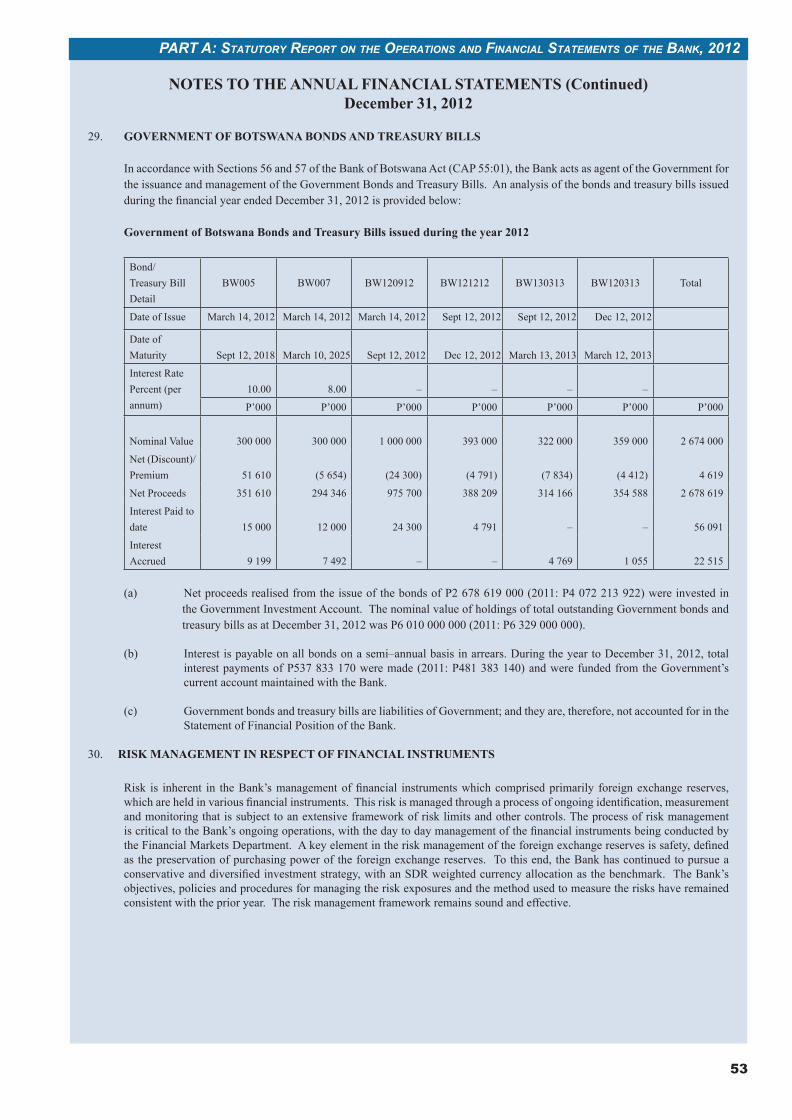
53
PART A: STATUTORy REPORT ON ThE OPERATiONS ANd FiNANciAL STATEmENTS OF ThE BANK, 2012
NOTES TO THE ANNUAL FINANCIAL STATEMENTS (Continued)December 31, 2012
29. GOVERNMENT OF BOTSWANA BONDS AND TREASURY BILLS
In accordance with Sections 56 and 57 of the Bank of Botswana Act (CAP 55:01), the Bank acts as agent of the Government for the issuance and management of the Government Bonds and Treasury Bills. An analysis of the bonds and treasury bills issued during the financial year ended December 31, 2012 is provided below:
Government of Botswana Bonds and Treasury Bills issued during the year 2012
Bond/Treasury Bill Detail
BW005 BW007 BW120912 BW121212 BW130313 BW120313 Total
Date of Issue March 14, 2012 March 14, 2012 March 14, 2012 Sept 12, 2012 Sept 12, 2012 Dec 12, 2012
Date of Maturity Sept 12, 2018 March 10, 2025 Sept 12, 2012 Dec 12, 2012 March 13, 2013 March 12, 2013
Interest Rate Percent (per annum)
10.00 8.00 – – – –
P’000 P’000 P’000 P’000 P’000 P’000 P’000
Nominal Value 300 000 300 000 1 000 000 393 000 322 000 359 000 2 674 000
Net (Discount)/Premium 51 610 (5 654) (24 300) (4 791) (7 834) (4 412) 4 619
Net Proceeds 351 610 294 346 975 700 388 209 314 166 354 588 2 678 619
Interest Paid to date 15 000 12 000 24 300 4 791 – – 56 091
Interest Accrued 9 199 7 492 – – 4 769 1 055 22 515
(a) Net proceeds realised from the issue of the bonds of P2 678 619 000 (2011: P4 072 213 922) were invested in the Government Investment Account. The nominal value of holdings of total outstanding Government bonds and treasury bills as at December 31, 2012 was P6 010 000 000 (2011: P6 329 000 000).
(b) Interest is payable on all bonds on a semi–annual basis in arrears. During the year to December 31, 2012, total interest payments of P537 833 170 were made (2011: P481 383 140) and were funded from the Government’s current account maintained with the Bank.
(c) Government bonds and treasury bills are liabilities of Government; and they are, therefore, not accounted for in the Statement of Financial Position of the Bank.
30. RISK MANAGEMENT IN RESPECT OF FINANCIAL INSTRUMENTS
Risk is inherent in the Bank’s management of financial instruments which comprised primarily foreign exchange reserves, which are held in various financial instruments. This risk is managed through a process of ongoing identification, measurement and monitoring that is subject to an extensive framework of risk limits and other controls. The process of risk management is critical to the Bank’s ongoing operations, with the day to day management of the financial instruments being conducted by the Financial Markets Department. A key element in the risk management of the foreign exchange reserves is safety, defined as the preservation of purchasing power of the foreign exchange reserves. To this end, the Bank has continued to pursue a conservative and diversified investment strategy, with an SDR weighted currency allocation as the benchmark. The Bank’s objectives, policies and procedures for managing the risk exposures and the method used to measure the risks have remained consistent with the prior year. The risk management framework remains sound and effective.
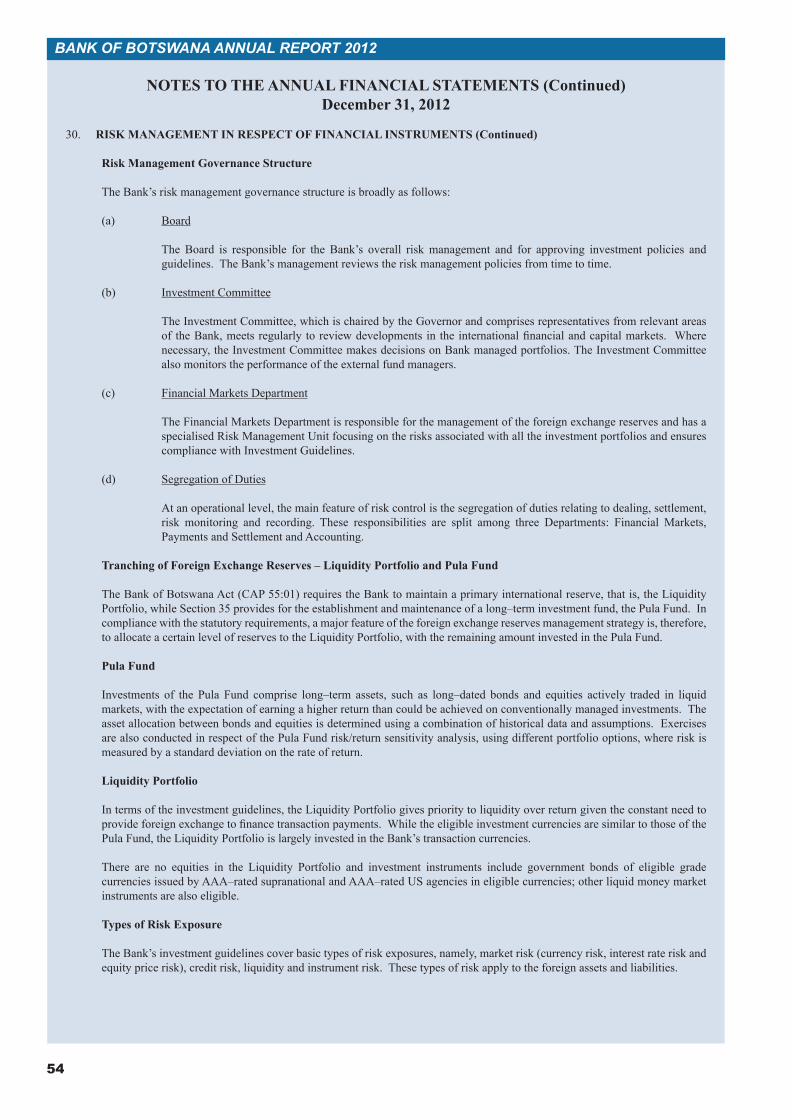
54
BANK OF BOTSWANA ANNUAL REPORT 2012
NOTES TO THE ANNUAL FINANCIAL STATEMENTS (Continued)December 31, 2012
30. RISK MANAGEMENT IN RESPECT OF FINANCIAL INSTRUMENTS (Continued)
Risk Management Governance Structure
The Bank’s risk management governance structure is broadly as follows:
(a) Board
The Board is responsible for the Bank’s overall risk management and for approving investment policies and guidelines. The Bank’s management reviews the risk management policies from time to time.
(b) Investment Committee
The Investment Committee, which is chaired by the Governor and comprises representatives from relevant areas of the Bank, meets regularly to review developments in the international financial and capital markets. Where necessary, the Investment Committee makes decisions on Bank managed portfolios. The Investment Committee also monitors the performance of the external fund managers.
(c) Financial Markets Department
The Financial Markets Department is responsible for the management of the foreign exchange reserves and has a specialised Risk Management Unit focusing on the risks associated with all the investment portfolios and ensures compliance with Investment Guidelines.
(d) Segregation of Duties
At an operational level, the main feature of risk control is the segregation of duties relating to dealing, settlement, risk monitoring and recording. These responsibilities are split among three Departments: Financial Markets, Payments and Settlement and Accounting.
Tranching of Foreign Exchange Reserves – Liquidity Portfolio and Pula Fund
The Bank of Botswana Act (CAP 55:01) requires the Bank to maintain a primary international reserve, that is, the Liquidity Portfolio, while Section 35 provides for the establishment and maintenance of a long–term investment fund, the Pula Fund. In compliance with the statutory requirements, a major feature of the foreign exchange reserves management strategy is, therefore, to allocate a certain level of reserves to the Liquidity Portfolio, with the remaining amount invested in the Pula Fund.
Pula Fund
Investments of the Pula Fund comprise long–term assets, such as long–dated bonds and equities actively traded in liquid markets, with the expectation of earning a higher return than could be achieved on conventionally managed investments. The asset allocation between bonds and equities is determined using a combination of historical data and assumptions. Exercises are also conducted in respect of the Pula Fund risk/return sensitivity analysis, using different portfolio options, where risk is measured by a standard deviation on the rate of return.
Liquidity Portfolio
In terms of the investment guidelines, the Liquidity Portfolio gives priority to liquidity over return given the constant need to provide foreign exchange to finance transaction payments. While the eligible investment currencies are similar to those of the Pula Fund, the Liquidity Portfolio is largely invested in the Bank’s transaction currencies.
There are no equities in the Liquidity Portfolio and investment instruments include government bonds of eligible grade currencies issued by AAA–rated supranational and AAA–rated US agencies in eligible currencies; other liquid money market instruments are also eligible.
Types of Risk Exposure
The Bank’s investment guidelines cover basic types of risk exposures, namely, market risk (currency risk, interest rate risk and equity price risk), credit risk, liquidity and instrument risk. These types of risk apply to the foreign assets and liabilities.
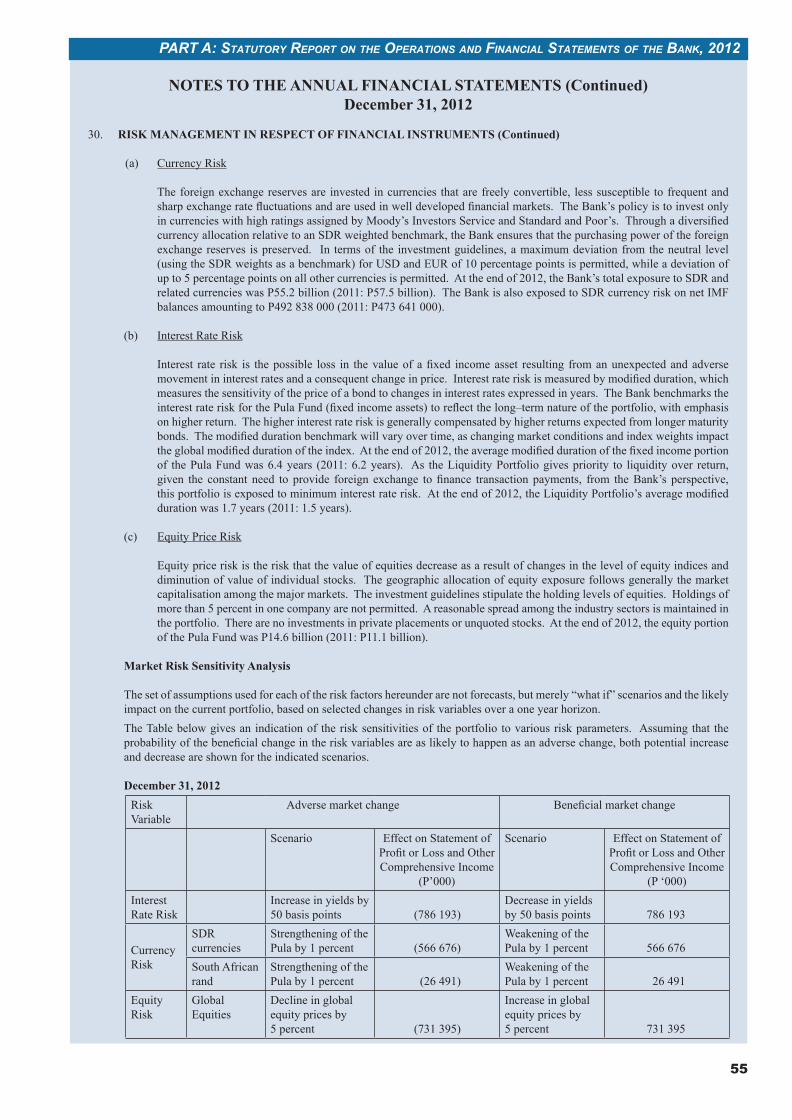
55
PART A: STATUTORy REPORT ON ThE OPERATiONS ANd FiNANciAL STATEmENTS OF ThE BANK, 2012
NOTES TO THE ANNUAL FINANCIAL STATEMENTS (Continued)December 31, 2012
30. RISK MANAGEMENT IN RESPECT OF FINANCIAL INSTRUMENTS (Continued)
(a) Currency Risk
The foreign exchange reserves are invested in currencies that are freely convertible, less susceptible to frequent and sharp exchange rate fluctuations and are used in well developed financial markets. The Bank’s policy is to invest only in currencies with high ratings assigned by Moody’s Investors Service and Standard and Poor’s. Through a diversified currency allocation relative to an SDR weighted benchmark, the Bank ensures that the purchasing power of the foreign exchange reserves is preserved. In terms of the investment guidelines, a maximum deviation from the neutral level (using the SDR weights as a benchmark) for USD and EUR of 10 percentage points is permitted, while a deviation of up to 5 percentage points on all other currencies is permitted. At the end of 2012, the Bank’s total exposure to SDR and related currencies was P55.2 billion (2011: P57.5 billion). The Bank is also exposed to SDR currency risk on net IMF balances amounting to P492 838 000 (2011: P473 641 000).
(b) Interest Rate Risk
Interest rate risk is the possible loss in the value of a fixed income asset resulting from an unexpected and adverse movement in interest rates and a consequent change in price. Interest rate risk is measured by modified duration, which measures the sensitivity of the price of a bond to changes in interest rates expressed in years. The Bank benchmarks the interest rate risk for the Pula Fund (fixed income assets) to reflect the long–term nature of the portfolio, with emphasis on higher return. The higher interest rate risk is generally compensated by higher returns expected from longer maturity bonds. The modified duration benchmark will vary over time, as changing market conditions and index weights impact the global modified duration of the index. At the end of 2012, the average modified duration of the fixed income portion of the Pula Fund was 6.4 years (2011: 6.2 years). As the Liquidity Portfolio gives priority to liquidity over return, given the constant need to provide foreign exchange to finance transaction payments, from the Bank’s perspective, this portfolio is exposed to minimum interest rate risk. At the end of 2012, the Liquidity Portfolio’s average modified duration was 1.7 years (2011: 1.5 years).
(c) Equity Price Risk
Equity price risk is the risk that the value of equities decrease as a result of changes in the level of equity indices and diminution of value of individual stocks. The geographic allocation of equity exposure follows generally the market capitalisation among the major markets. The investment guidelines stipulate the holding levels of equities. Holdings of more than 5 percent in one company are not permitted. A reasonable spread among the industry sectors is maintained in the portfolio. There are no investments in private placements or unquoted stocks. At the end of 2012, the equity portion of the Pula Fund was P14.6 billion (2011: P11.1 billion).
Market Risk Sensitivity Analysis
The set of assumptions used for each of the risk factors hereunder are not forecasts, but merely “what if” scenarios and the likely impact on the current portfolio, based on selected changes in risk variables over a one year horizon.The Table below gives an indication of the risk sensitivities of the portfolio to various risk parameters. Assuming that the probability of the beneficial change in the risk variables are as likely to happen as an adverse change, both potential increase and decrease are shown for the indicated scenarios.
December 31, 2012Risk Variable
Adverse market change Beneficial market change
Scenario Effect on Statement of Profit or Loss and Other Comprehensive Income
(P’000)
Scenario Effect on Statement of Profit or Loss and Other Comprehensive Income
(P ‘000)Interest Rate Risk
Increase in yields by 50 basis points (786 193)
Decrease in yields by 50 basis points 786 193
Currency Risk
SDR currencies
Strengthening of the Pula by 1 percent (566 676)
Weakening of the Pula by 1 percent 566 676
South African rand
Strengthening of the Pula by 1 percent (26 491)
Weakening of the Pula by 1 percent 26 491
Equity Risk
Global Equities
Decline in global equity prices by 5 percent (731 395)
Increase in global equity prices by 5 percent 731 395
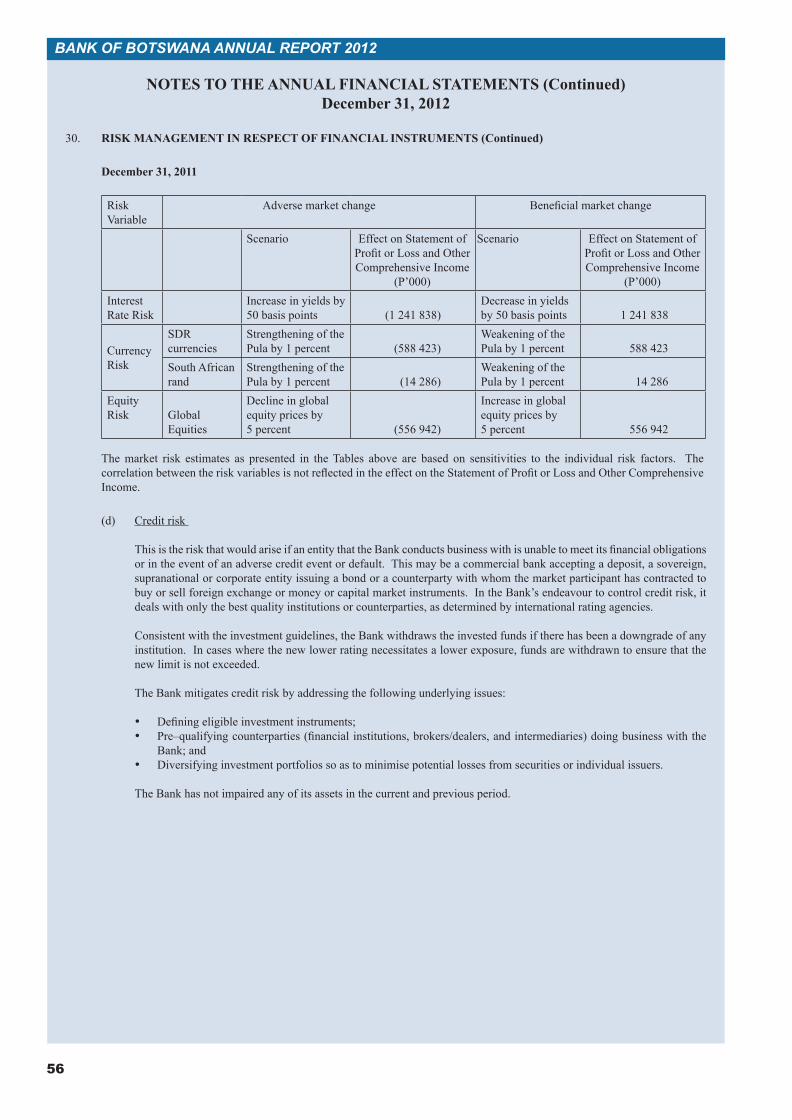
56
BANK OF BOTSWANA ANNUAL REPORT 2012
NOTES TO THE ANNUAL FINANCIAL STATEMENTS (Continued)December 31, 2012
30. RISK MANAGEMENT IN RESPECT OF FINANCIAL INSTRUMENTS (Continued)
December 31, 2011
Risk Variable
Adverse market change Beneficial market change
Scenario Effect on Statement of Profit or Loss and Other Comprehensive Income
(P’000)
Scenario Effect on Statement of Profit or Loss and Other Comprehensive Income
(P’000)Interest Rate Risk
Increase in yields by 50 basis points (1 241 838)
Decrease in yields by 50 basis points 1 241 838
Currency Risk
SDR currencies
Strengthening of the Pula by 1 percent (588 423)
Weakening of the Pula by 1 percent 588 423
South African rand
Strengthening of the Pula by 1 percent (14 286)
Weakening of the Pula by 1 percent 14 286
Equity Risk Global
Equities
Decline in global equity prices by 5 percent (556 942)
Increase in global equity prices by 5 percent 556 942
The market risk estimates as presented in the Tables above are based on sensitivities to the individual risk factors. The correlation between the risk variables is not reflected in the effect on the Statement of Profit or Loss and Other Comprehensive Income.
(d) Credit risk
This is the risk that would arise if an entity that the Bank conducts business with is unable to meet its financial obligations or in the event of an adverse credit event or default. This may be a commercial bank accepting a deposit, a sovereign, supranational or corporate entity issuing a bond or a counterparty with whom the market participant has contracted to buy or sell foreign exchange or money or capital market instruments. In the Bank’s endeavour to control credit risk, it deals with only the best quality institutions or counterparties, as determined by international rating agencies.
Consistent with the investment guidelines, the Bank withdraws the invested funds if there has been a downgrade of any institution. In cases where the new lower rating necessitates a lower exposure, funds are withdrawn to ensure that the new limit is not exceeded.
The Bank mitigates credit risk by addressing the following underlying issues:
• Defining eligible investment instruments;• Pre–qualifying counterparties (financial institutions, brokers/dealers, and intermediaries) doing business with the
Bank; and• Diversifying investment portfolios so as to minimise potential losses from securities or individual issuers.
The Bank has not impaired any of its assets in the current and previous period.
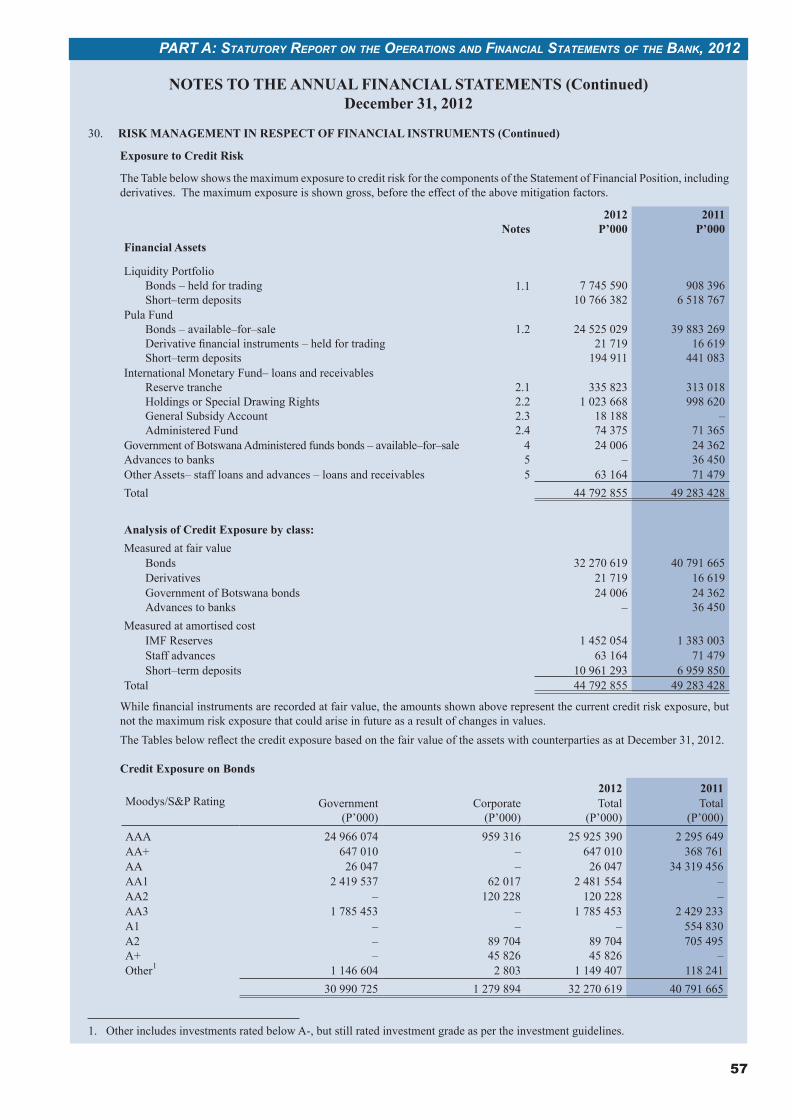
57
PART A: STATUTORy REPORT ON ThE OPERATiONS ANd FiNANciAL STATEmENTS OF ThE BANK, 2012
NOTES TO THE ANNUAL FINANCIAL STATEMENTS (Continued)December 31, 2012
30. RISK MANAGEMENT IN RESPECT OF FINANCIAL INSTRUMENTS (Continued)
Exposure to Credit Risk
The Table below shows the maximum exposure to credit risk for the components of the Statement of Financial Position, including derivatives. The maximum exposure is shown gross, before the effect of the above mitigation factors.
Notes2012
P’0002011
P’000Financial Assets
Liquidity PortfolioBonds – held for trading Short–term deposits
1.1 7 745 59010 766 382
908 3966 518 767
Pula FundBonds – available–for–saleDerivative financial instruments – held for tradingShort–term deposits
1.2 24 525 02921 719
194 911
39 883 26916 619
441 083International Monetary Fund– loans and receivables
Reserve trancheHoldings or Special Drawing RightsGeneral Subsidy AccountAdministered Fund
2.12.22.32.4
335 8231 023 668
18 18874 375
313 018998 620
–71 365
Government of Botswana Administered funds bonds – available–for–saleAdvances to banks
45
24 006–
24 36236 450
Other Assets– staff loans and advances – loans and receivables 5 63 164 71 479Total 44 792 855 49 283 428
Analysis of Credit Exposure by class:Measured at fair value
Bonds 32 270 619 40 791 665Derivatives 21 719 16 619Government of Botswana bondsAdvances to banks
24 006–
24 36236 450
Measured at amortised costIMF Reserves 1 452 054 1 383 003Staff advances 63 164 71 479Short–term deposits 10 961 293 6 959 850
Total 44 792 855 49 283 428
While financial instruments are recorded at fair value, the amounts shown above represent the current credit risk exposure, but not the maximum risk exposure that could arise in future as a result of changes in values. The Tables below reflect the credit exposure based on the fair value of the assets with counterparties as at December 31, 2012.
Credit Exposure on Bonds
Moodys/S&P Rating2012 2011
Government(P’000)
Corporate(P’000)
Total(P’000)
Total(P’000)
AAA 24 966 074 959 316 25 925 390 2 295 649AA+ 647 010 – 647 010 368 761AA 26 047 – 26 047 34 319 456AA1 2 419 537 62 017 2 481 554 –AA2 – 120 228 120 228 –AA3 1 785 453 – 1 785 453 2 429 233A1 – – – 554 830A2A+
––
89 70445 826
89 70445 826
705 495–
Other1 1 146 604 2 803 1 149 407 118 24130 990 725 1 279 894 32 270 619 40 791 665
1. Other includes investments rated below A-, but still rated investment grade as per the investment guidelines.
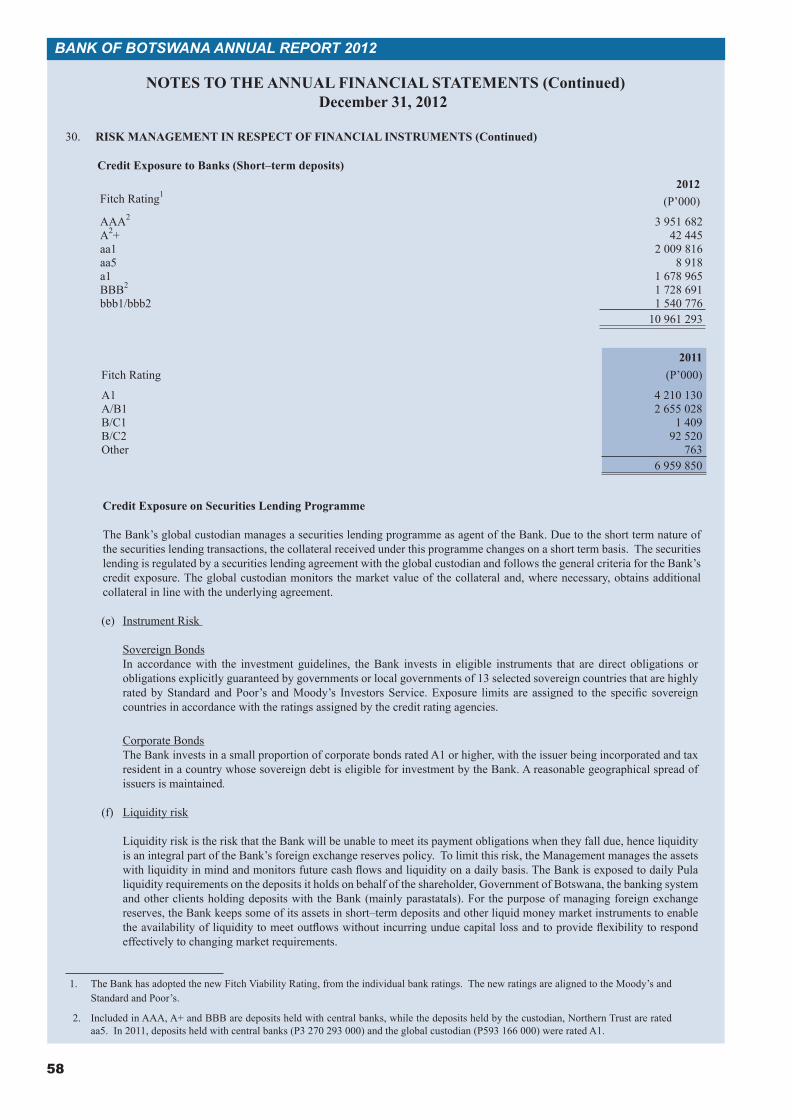
58
BANK OF BOTSWANA ANNUAL REPORT 2012
(2 1 Included in A1 for 2011 is P593 166 000 held by the global custodian, The Northern Trust Company, P3 270 293 000 held by central banks and the residual for banks rated A1. In 2010, the corresponding figures are P5 501 065 000 for the global custodian and P887 829 000 for central banks.
NOTES TO THE ANNUAL FINANCIAL STATEMENTS (Continued)December 31, 2012
30. RISK MANAGEMENT IN RESPECT OF FINANCIAL INSTRUMENTS (Continued)
Credit Exposure to Banks (Short–term deposits) 2012
Fitch Rating1(P’000)
AAA2 3 951 682A2+ 42 445aa1 2 009 816aa5 8 918a1 1 678 965BBB2 1 728 691bbb1/bbb2 1 540 776
10 961 293
Credit Exposure on Securities Lending Programme
The Bank’s global custodian manages a securities lending programme as agent of the Bank. Due to the short term nature of the securities lending transactions, the collateral received under this programme changes on a short term basis. The securities lending is regulated by a securities lending agreement with the global custodian and follows the general criteria for the Bank’s credit exposure. The global custodian monitors the market value of the collateral and, where necessary, obtains additional collateral in line with the underlying agreement.
(e) Instrument Risk
Sovereign BondsIn accordance with the investment guidelines, the Bank invests in eligible instruments that are direct obligations or obligations explicitly guaranteed by governments or local governments of 13 selected sovereign countries that are highly rated by Standard and Poor’s and Moody’s Investors Service. Exposure limits are assigned to the specific sovereign countries in accordance with the ratings assigned by the credit rating agencies.
Corporate BondsThe Bank invests in a small proportion of corporate bonds rated A1 or higher, with the issuer being incorporated and tax resident in a country whose sovereign debt is eligible for investment by the Bank. A reasonable geographical spread of issuers is maintained.
(f) Liquidity risk
Liquidity risk is the risk that the Bank will be unable to meet its payment obligations when they fall due, hence liquidity is an integral part of the Bank’s foreign exchange reserves policy. To limit this risk, the Management manages the assets with liquidity in mind and monitors future cash flows and liquidity on a daily basis. The Bank is exposed to daily Pula liquidity requirements on the deposits it holds on behalf of the shareholder, Government of Botswana, the banking system and other clients holding deposits with the Bank (mainly parastatals). For the purpose of managing foreign exchange reserves, the Bank keeps some of its assets in short–term deposits and other liquid money market instruments to enable the availability of liquidity to meet outflows without incurring undue capital loss and to provide flexibility to respond effectively to changing market requirements.
1. The Bank has adopted the new Fitch Viability Rating, from the individual bank ratings. The new ratings are aligned to the Moody’s and Standard and Poor’s.
2. Included in AAA, A+ and BBB are deposits held with central banks, while the deposits held by the custodian, Northern Trust are rated aa5. In 2011, deposits held with central banks (P3 270 293 000) and the global custodian (P593 166 000) were rated A1.
2011Fitch Rating (P’000)
A1 4 210 130A/B1 2 655 028B/C1 1 409B/C2 92 520Other 763
6 959 850
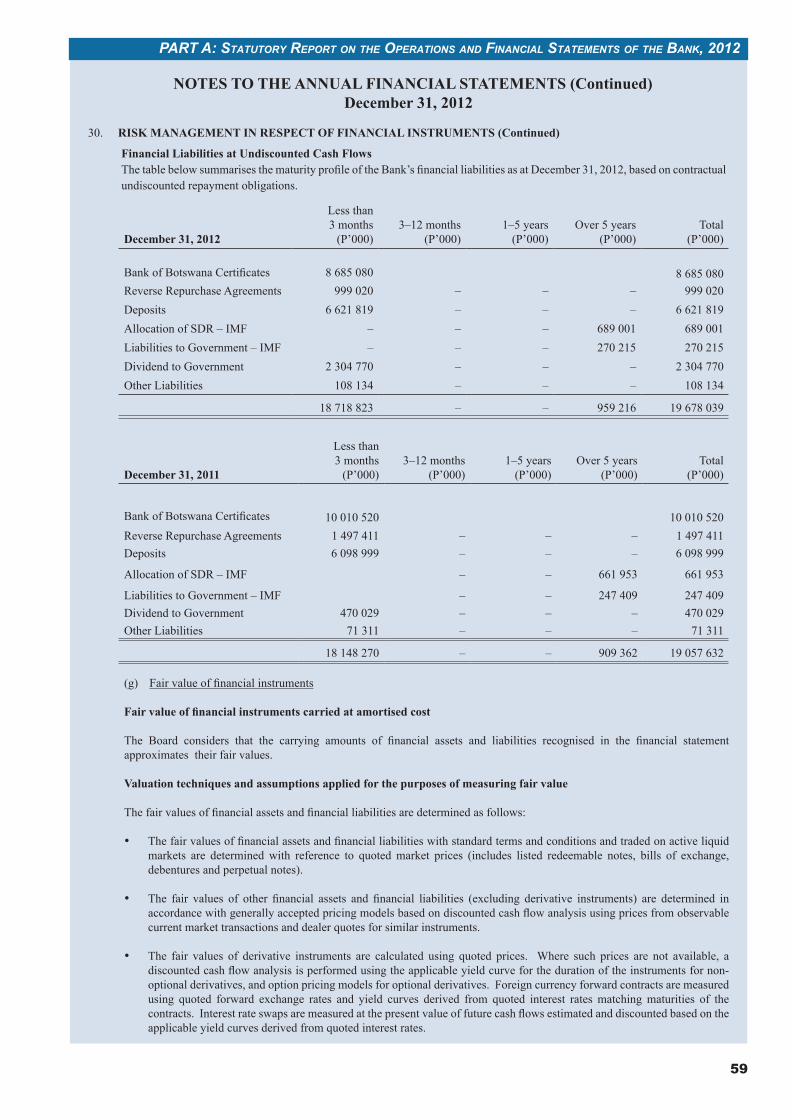
59
PART A: STATUTORy REPORT ON ThE OPERATiONS ANd FiNANciAL STATEmENTS OF ThE BANK, 2012
(2 1 Included in A1 for 2011 is P593 166 000 held by the global custodian, The Northern Trust Company, P3 270 293 000 held by central banks and the residual for banks rated A1. In 2010, the corresponding figures are P5 501 065 000 for the global custodian and P887 829 000 for central banks.
2 Overnight positions with clearing banks.
NOTES TO THE ANNUAL FINANCIAL STATEMENTS (Continued)December 31, 2012
30. RISK MANAGEMENT IN RESPECT OF FINANCIAL INSTRUMENTS (Continued)
Financial Liabilities at Undiscounted Cash FlowsThe table below summarises the maturity profile of the Bank’s financial liabilities as at December 31, 2012, based on contractual undiscounted repayment obligations.
December 31, 2012
Less than 3 months
(P’000)3–12 months
(P’000)1–5 years
(P’000)Over 5 years
(P’000)Total
(P’000)
Bank of Botswana CertificatesReverse Repurchase Agreements
8 685 080999 020 – – –
8 685 080999 020
Deposits 6 621 819 – – – 6 621 819Allocation of SDR – IMF – – – 689 001 689 001Liabilities to Government – IMF – – – 270 215 270 215Dividend to Government 2 304 770 – – – 2 304 770Other Liabilities 108 134 – – – 108 134
18 718 823 – – 959 216 19 678 039
December 31, 2011
Less than 3 months
(P’000)3–12 months
(P’000)1–5 years
(P’000)Over 5 years
(P’000)Total
(P’000)
Bank of Botswana Certificates
Reverse Repurchase Agreements10 010 520
1 497 411 – – –10 010 520
1 497 411Deposits 6 098 999 – – – 6 098 999
Allocation of SDR – IMF – – 661 953 661 953
Liabilities to Government – IMF – – 247 409 247 409Dividend to Government 470 029 – – – 470 029Other Liabilities 71 311 – – – 71 311
18 148 270 – – 909 362 19 057 632
(g) Fair value of financial instruments
Fair value of financial instruments carried at amortised cost
The Board considers that the carrying amounts of financial assets and liabilities recognised in the financial statement approximates their fair values.
Valuation techniques and assumptions applied for the purposes of measuring fair value
The fair values of financial assets and financial liabilities are determined as follows:
• The fair values of financial assets and financial liabilities with standard terms and conditions and traded on active liquid markets are determined with reference to quoted market prices (includes listed redeemable notes, bills of exchange, debentures and perpetual notes).
• The fair values of other financial assets and financial liabilities (excluding derivative instruments) are determined in accordance with generally accepted pricing models based on discounted cash flow analysis using prices from observable current market transactions and dealer quotes for similar instruments.
• The fair values of derivative instruments are calculated using quoted prices. Where such prices are not available, a discounted cash flow analysis is performed using the applicable yield curve for the duration of the instruments for non-optional derivatives, and option pricing models for optional derivatives. Foreign currency forward contracts are measured using quoted forward exchange rates and yield curves derived from quoted interest rates matching maturities of the contracts. Interest rate swaps are measured at the present value of future cash flows estimated and discounted based on the applicable yield curves derived from quoted interest rates.
Loans and ReceivablesIMF ReservesAdvances to banksStaff loans and advances
1 383 00336 45071 479
1 127 298-
79 362Short-term deposits 6 959 850 7 011 525
Total Financial Assets 60 422 264 50 994 065
The above is disclosed in the Statement of Financial Position as follows:Total Foreign Exchange ReservesAdd: Derivative financial instruments (liabilities)
60 270 92919 044
50 846 97223 921
Government of Botswana bondsAdvances to banks
24 36236 450
43 810-
Other Assets – staff loans and advances (Note 5) 71 479 79 362
60 422 264 50 994 065
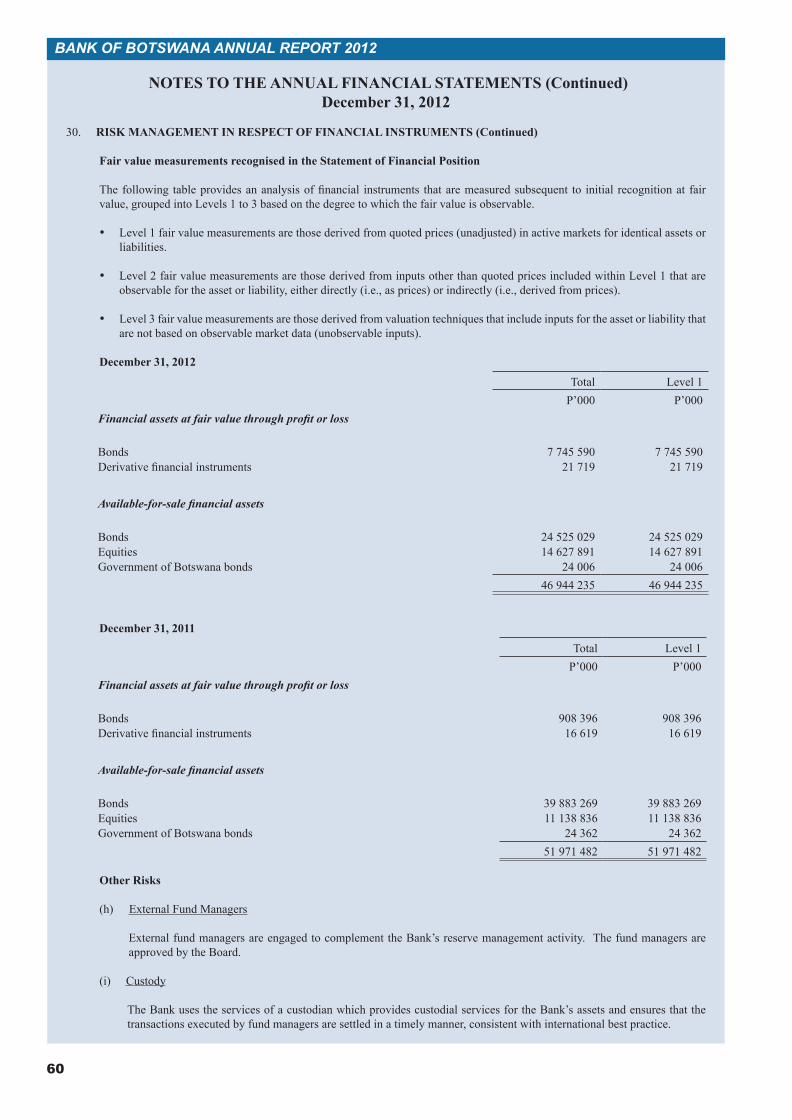
60
BANK OF BOTSWANA ANNUAL REPORT 2012
NOTES TO THE ANNUAL FINANCIAL STATEMENTS (Continued)December 31, 2012
30. RISK MANAGEMENT IN RESPECT OF FINANCIAL INSTRUMENTS (Continued)
Fair value measurements recognised in the Statement of Financial Position
The following table provides an analysis of financial instruments that are measured subsequent to initial recognition at fair value, grouped into Levels 1 to 3 based on the degree to which the fair value is observable.
• Level 1 fair value measurements are those derived from quoted prices (unadjusted) in active markets for identical assets or liabilities.
• Level 2 fair value measurements are those derived from inputs other than quoted prices included within Level 1 that are observable for the asset or liability, either directly (i.e., as prices) or indirectly (i.e., derived from prices).
• Level 3 fair value measurements are those derived from valuation techniques that include inputs for the asset or liability that are not based on observable market data (unobservable inputs).
December 31, 2012
Total Level 1P’000 P’000
Financial assets at fair value through profit or loss
Bonds 7 745 590 7 745 590Derivative financial instruments 21 719 21 719
Available-for-sale financial assets
Bonds 24 525 029 24 525 029Equities 14 627 891 14 627 891Government of Botswana bonds 24 006 24 006
46 944 235 46 944 235
December 31, 2011
Total Level 1P’000 P’000
Financial assets at fair value through profit or loss
Bonds 908 396 908 396Derivative financial instruments 16 619 16 619
Available-for-sale financial assets
Bonds 39 883 269 39 883 269Equities 11 138 836 11 138 836Government of Botswana bonds 24 362 24 362
51 971 482 51 971 482
Other Risks
(h) External Fund Managers
External fund managers are engaged to complement the Bank’s reserve management activity. The fund managers are approved by the Board.
(i) Custody
The Bank uses the services of a custodian which provides custodial services for the Bank’s assets and ensures that the transactions executed by fund managers are settled in a timely manner, consistent with international best practice.
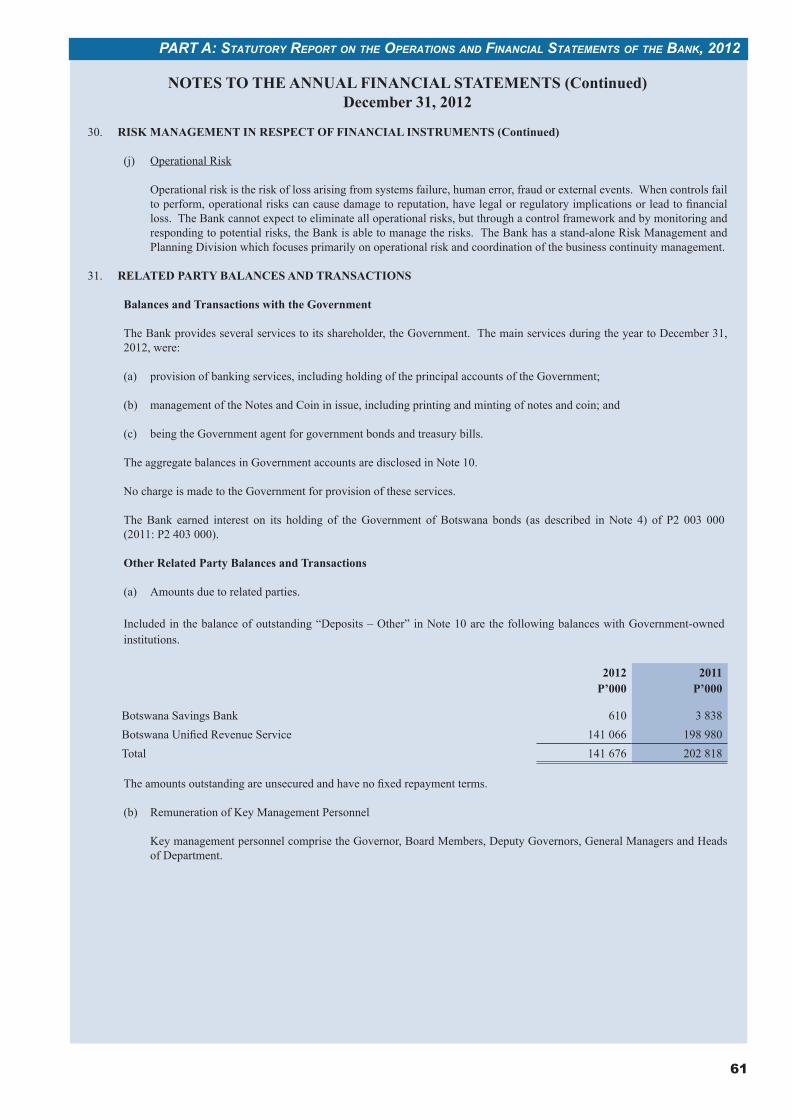
61
PART A: STATUTORy REPORT ON ThE OPERATiONS ANd FiNANciAL STATEmENTS OF ThE BANK, 2012
NOTES TO THE ANNUAL FINANCIAL STATEMENTS (Continued)December 31, 2012
30. RISK MANAGEMENT IN RESPECT OF FINANCIAL INSTRUMENTS (Continued)
(j) Operational Risk
Operational risk is the risk of loss arising from systems failure, human error, fraud or external events. When controls fail to perform, operational risks can cause damage to reputation, have legal or regulatory implications or lead to financial loss. The Bank cannot expect to eliminate all operational risks, but through a control framework and by monitoring and responding to potential risks, the Bank is able to manage the risks. The Bank has a stand-alone Risk Management and Planning Division which focuses primarily on operational risk and coordination of the business continuity management.
31. RELATED PARTY BALANCES AND TRANSACTIONS
Balances and Transactions with the Government
The Bank provides several services to its shareholder, the Government. The main services during the year to December 31, 2012, were:
(a) provision of banking services, including holding of the principal accounts of the Government;
(b) management of the Notes and Coin in issue, including printing and minting of notes and coin; and
(c) being the Government agent for government bonds and treasury bills.
The aggregate balances in Government accounts are disclosed in Note 10.
No charge is made to the Government for provision of these services.
The Bank earned interest on its holding of the Government of Botswana bonds (as described in Note 4) of P2 003 000 (2011: P2 403 000).
Other Related Party Balances and Transactions
(a) Amounts due to related parties.
Included in the balance of outstanding “Deposits – Other” in Note 10 are the following balances with Government-owned institutions.
2012P’000
2011P’000
Botswana Savings Bank 610 3 838Botswana Unified Revenue Service 141 066 198 980Total 141 676 202 818
The amounts outstanding are unsecured and have no fixed repayment terms.
(b) Remuneration of Key Management Personnel
Key management personnel comprise the Governor, Board Members, Deputy Governors, General Managers and Heads of Department.
NOTES TO THE ANNUAL FINANCIAL STATEMENTS (Continued)December 31, 2011
2011P’000
2010P’000
Derivative financial instruments (Note 1.2) 19 044 23 921
Bank of Botswana CertificatesReverse Repurchase AgreementsAllocation of SDR (IMF)Liabilities to Government (IMF)DepositsDividend to GovernmentOther liabilities
9 981 7901 497 411
661 953247 409
6 098 999470 029
71 311
17 026 583615 014575 118135 404
5 752 465175 00099 330
19 047 946 24 402 835
Assets LiabilitiesNotional Amount Assets Liabilities
Notional Amount
2011 2011 2011 2010 2010 2010
(P’000) (P’000) (P’000) (P’000) (P’000) (P’000)
–Buy–Sell
–6 218
(3 966)–
338 6191 192 546
–5 087
(17 259)–
594 663384 504
–Buy – – – – (980) 981–Sell 4 836 6 166 (3 009) 9 923
–Buy–Sell
5 565–
–(15 078)
3072 040
––
–(2 673)
–173 159
16 619 (19 044) 1 539 678 5 087 (23 921) 1 163 230
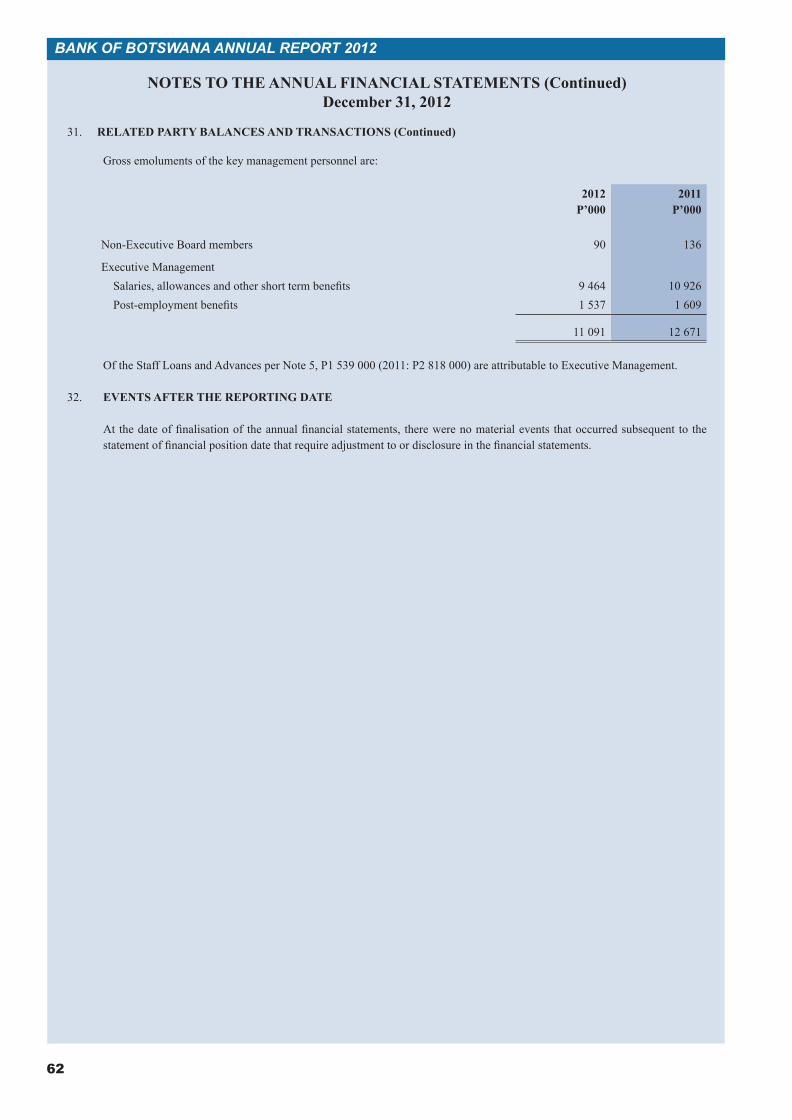
62
BANK OF BOTSWANA ANNUAL REPORT 2012
NOTES TO THE ANNUAL FINANCIAL STATEMENTS (Continued)December 31, 2012
31. RELATED PARTY BALANCES AND TRANSACTIONS (Continued)
Gross emoluments of the key management personnel are:
2012P’000
2011P’000
Non-Executive Board members 90 136
Executive Management Salaries, allowances and other short term benefits 9 464 10 926Post-employment benefits 1 537 1 609
11 091 12 671
Of the Staff Loans and Advances per Note 5, P1 539 000 (2011: P2 818 000) are attributable to Executive Management.
32. EVENTS AFTER THE REPORTING DATE
At the date of finalisation of the annual financial statements, there were no material events that occurred subsequent to the statement of financial position date that require adjustment to or disclosure in the financial statements.
PART B
THE BOTSWANA ECONOMY IN 2012AND THEME CHAPTER
BANK OF BOTSWANA

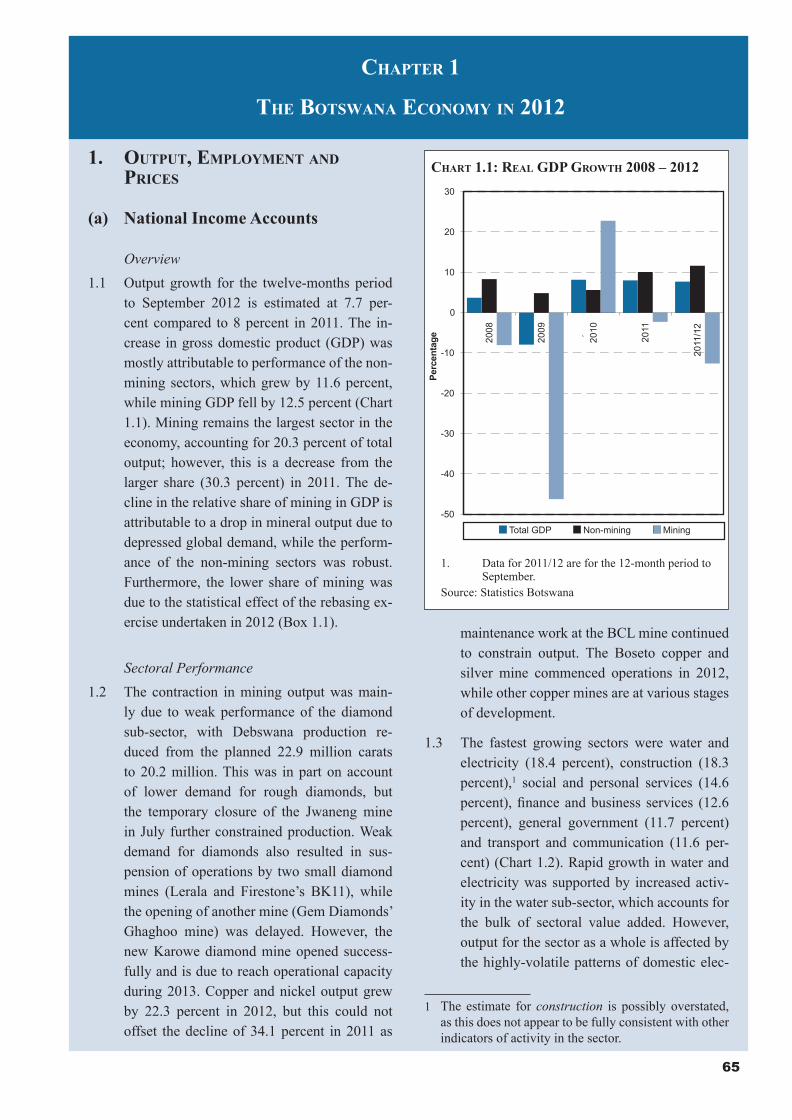
65
maintenance work at the BCL mine continued to constrain output. The Boseto copper and silver mine commenced operations in 2012, while other copper mines are at various stages of development.
1.3 The fastest growing sectors were water and electricity (18.4 percent), construction (18.3 percent),1 social and personal services (14.6 percent), finance and business services (12.6 percent), general government (11.7 percent) and transport and communication (11.6 per-cent) (Chart 1.2). Rapid growth in water and electricity was supported by increased activ-ity in the water sub-sector, which accounts for the bulk of sectoral value added. However, output for the sector as a whole is affected by the highly-volatile patterns of domestic elec-
1 The estimate for construction is possibly overstated, as this does not appear to be fully consistent with other indicators of activity in the sector.
CHAPTER 1
THE BOTSWANA ECONOMY IN 2012
CHART 1.1: REAL GDP GROWTH 2008 – 2012
1. Data for 2011/12 are for the 12-month period to September.
Source: Statistics Botswana
1. OUTPUT, EMPLOYMENT AND PRICES
(a) National Income Accounts
Overview1.1 Output growth for the twelve-months period
to September 2012 is estimated at 7.7 per-cent compared to 8 percent in 2011. The in-crease in gross domestic product (GDP) was mostly attributable to performance of the non-mining sectors, which grew by 11.6 percent, while mining GDP fell by 12.5 percent (Chart 1.1). Mining remains the largest sector in the economy, accounting for 20.3 percent of total output; however, this is a decrease from the larger share (30.3 percent) in 2011. The de-cline in the relative share of mining in GDP is attributable to a drop in mineral output due to depressed global demand, while the perform-ance of the non-mining sectors was robust. Furthermore, the lower share of mining was due to the statistical effect of the rebasing ex-ercise undertaken in 2012 (Box 1.1).
Sectoral Performance1.2 The contraction in mining output was main-
ly due to weak performance of the diamond sub-sector, with Debswana production re-duced from the planned 22.9 million carats to 20.2 million. This was in part on account of lower demand for rough diamonds, but the temporary closure of the Jwaneng mine in July further constrained production. Weak demand for diamonds also resulted in sus-pension of operations by two small diamond mines (Lerala and Firestone’s BK11), while the opening of another mine (Gem Diamonds’ Ghaghoo mine) was delayed. However, the new Karowe diamond mine opened success-fully and is due to reach operational capacity during 2013. Copper and nickel output grew by 22.3 percent in 2012, but this could not offset the decline of 34.1 percent in 2011 as
-50
-40
-30
-20
-10
0
10
20
30
2008
2009
2010
2011
2011
/12
Total GDP Non-mining Mining
`
Perc
enta
ge
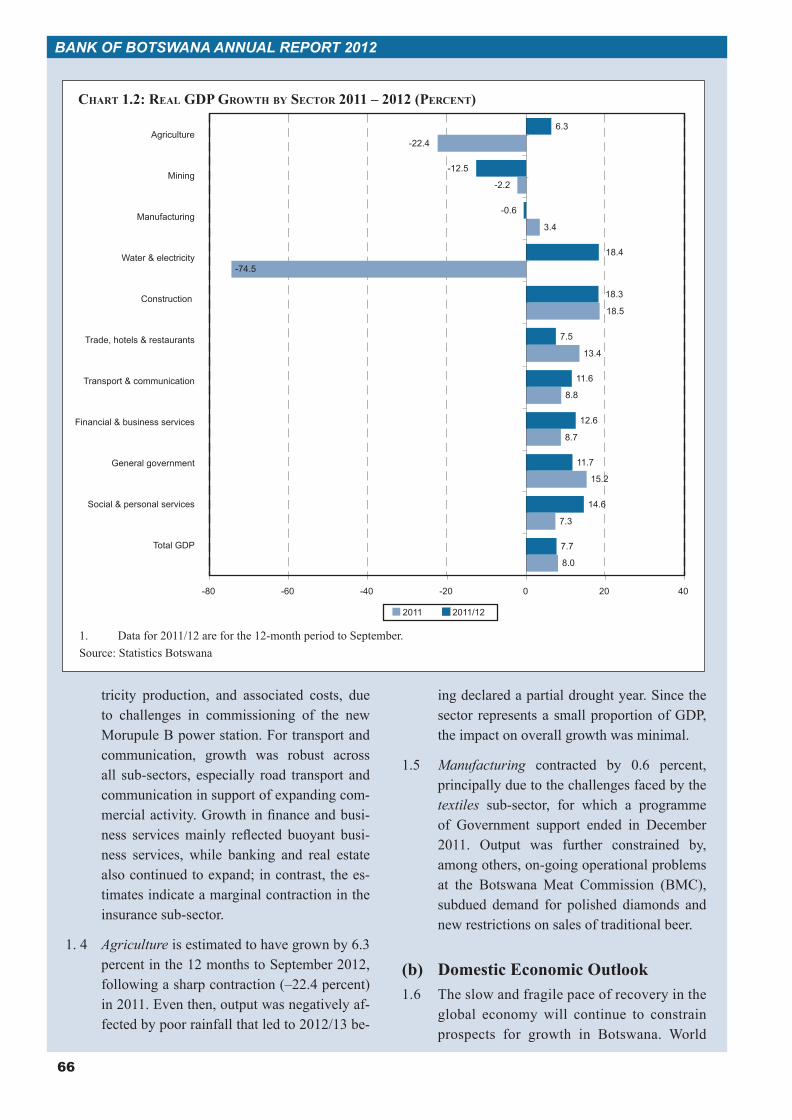
66
BANK OF BOTSWANA ANNUAL REPORT 2012
tricity production, and associated costs, due to challenges in commissioning of the new Morupule B power station. For transport and communication, growth was robust across all sub-sectors, especially road transport and communication in support of expanding com-mercial activity. Growth in finance and busi-ness services mainly reflected buoyant busi-ness services, while banking and real estate also continued to expand; in contrast, the es-timates indicate a marginal contraction in the insurance sub-sector.
1. 4 Agriculture is estimated to have grown by 6.3 percent in the 12 months to September 2012, following a sharp contraction (–22.4 percent) in 2011. Even then, output was negatively af-fected by poor rainfall that led to 2012/13 be-
ing declared a partial drought year. Since the sector represents a small proportion of GDP, the impact on overall growth was minimal.
1.5 Manufacturing contracted by 0.6 percent, principally due to the challenges faced by the textiles sub-sector, for which a programme of Government support ended in December 2011. Output was further constrained by, among others, on-going operational problems at the Botswana Meat Commission (BMC), subdued demand for polished diamonds and new restrictions on sales of traditional beer.
(b) Domestic Economic Outlook 1.6 The slow and fragile pace of recovery in the
global economy will continue to constrain prospects for growth in Botswana. World
1. Data for 2011/12 are for the 12-month period to September.Source: Statistics Botswana
CHART 1.2: REAL GDP GROWTH BY SECTOR 2011 – 2012 (PERCENT)
8.0
7.3
15.2
8.7
8.8
13.4
18.5
3.4
-2.2
-22.4
7.7
14.6
11.7
12.6
11.6
7.5
18.3
18.4
-0.6
-12.5
6.3
-80 -60 -40 -20 0 20 40
Total GDP
Social & personal services
General government
Financial & business services
Transport & communication
Trade, hotels & restaurants
Construction
Water & electricity
Manufacturing
Mining
Agriculture
2011 2011/12
-74.5
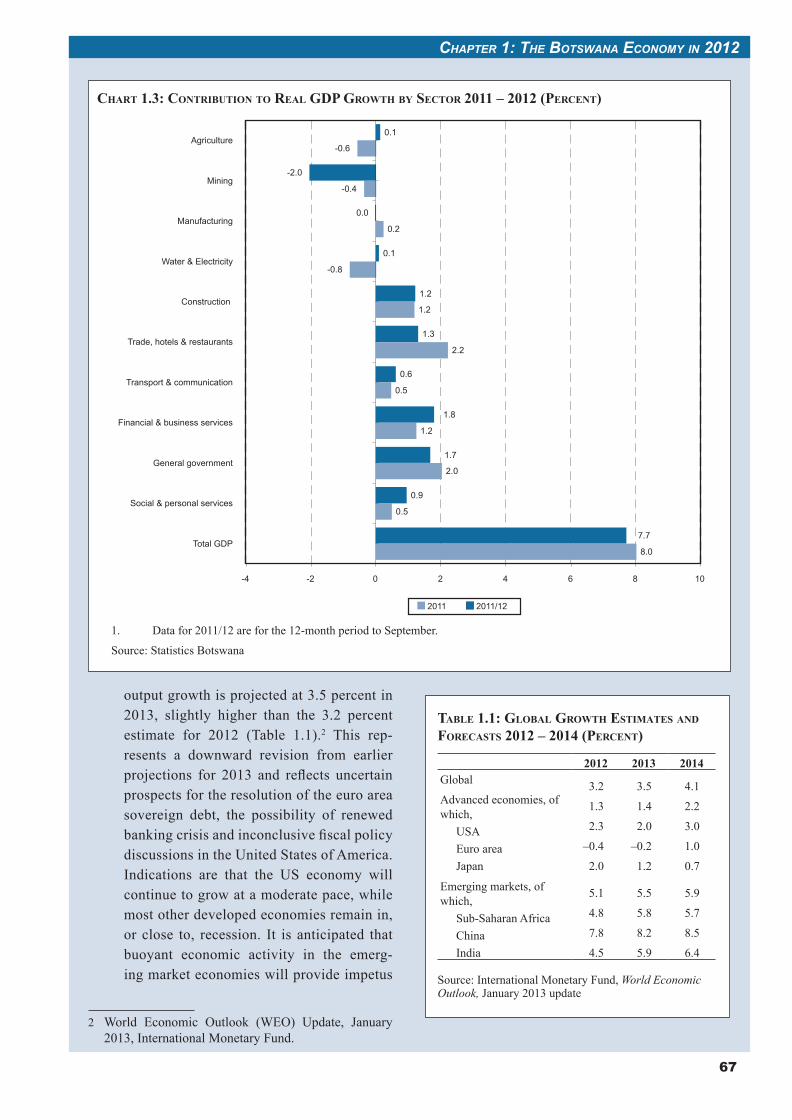
67
CHAPTER 1: THE BOTSWANA ECONOMY IN 2012
output growth is projected at 3.5 percent in 2013, slightly higher than the 3.2 percent estimate for 2012 (Table 1.1).2 This rep-resents a downward revision from earlier projections for 2013 and reflects uncertain prospects for the resolution of the euro area sovereign debt, the possibility of renewed banking crisis and inconclusive fiscal policy discussions in the United States of America. Indications are that the US economy will continue to grow at a moderate pace, while most other developed economies remain in, or close to, recession. It is anticipated that buoyant economic activity in the emerg-ing market economies will provide impetus
2 World Economic Outlook (WEO) Update, January 2013, International Monetary Fund.
CHART 1.3: CONTRIBUTION TO REAL GDP GROWTH BY SECTOR 2011 – 2012 (PERCENT)
1. Data for 2011/12 are for the 12-month period to September.
Source: Statistics Botswana
TABLE 1.1: GLOBAL GROWTH ESTIMATES AND FORECASTS 2012 – 2014 (PERCENT)
2012 2013 2014Global
Advanced economies, of which,
USAEuro areaJapan
3.2
1.3
2.3
–0.4
2.0
3.5
1.4
2.0
–0.2
1.2
4.1
2.2
3.0
1.0
0.7
Emerging markets, of which,
Sub-Saharan AfricaChinaIndia
5.1
4.8
7.8
4.5
5.5
5.8
8.2
5.9
5.9
5.7
8.5
6.4
Source: International Monetary Fund, World Economic Outlook, January 2013 update
8.0
0.5
2.0
1.2
0.5
2.2
1.2
-0.8
0.2
-0.4
-0.6
7.7
0.9
1.7
1.8
0.6
1.3
1.2
0.1
0.0
-2.0
0.1
-4 -2 0 2 4 6 8 10
Total GDP
Social & personal services
General government
Financial & business services
Transport & communication
Trade, hotels & restaurants
Construction
Water & Electricity
Manufacturing
Mining
Agriculture
2011 2011/12
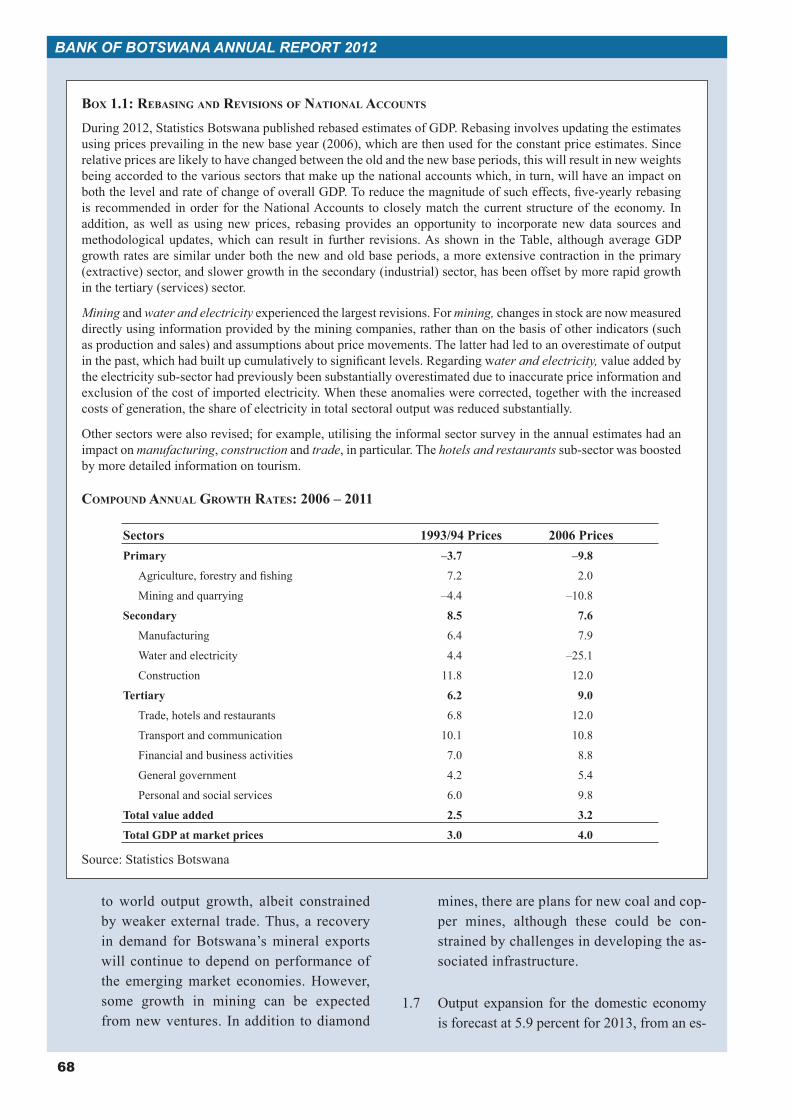
68
BANK OF BOTSWANA ANNUAL REPORT 2012
to world output growth, albeit constrained by weaker external trade. Thus, a recovery in demand for Botswana’s mineral exports will continue to depend on performance of the emerging market economies. However, some growth in mining can be expected from new ventures. In addition to diamond
mines, there are plans for new coal and cop-per mines, although these could be con-strained by challenges in developing the as-sociated infrastructure.
1.7 Output expansion for the domestic economy is forecast at 5.9 percent for 2013, from an es-
BOX 1.1: REBASING AND REVISIONS OF NATIONAL ACCOUNTS
During 2012, Statistics Botswana published rebased estimates of GDP. Rebasing involves updating the estimates using prices prevailing in the new base year (2006), which are then used for the constant price estimates. Since relative prices are likely to have changed between the old and the new base periods, this will result in new weights being accorded to the various sectors that make up the national accounts which, in turn, will have an impact on both the level and rate of change of overall GDP. To reduce the magnitude of such effects, five-yearly rebasing is recommended in order for the National Accounts to closely match the current structure of the economy. In addition, as well as using new prices, rebasing provides an opportunity to incorporate new data sources and methodological updates, which can result in further revisions. As shown in the Table, although average GDP growth rates are similar under both the new and old base periods, a more extensive contraction in the primary (extractive) sector, and slower growth in the secondary (industrial) sector, has been offset by more rapid growth in the tertiary (services) sector.
Mining and water and electricity experienced the largest revisions. For mining, changes in stock are now measured directly using information provided by the mining companies, rather than on the basis of other indicators (such as production and sales) and assumptions about price movements. The latter had led to an overestimate of output in the past, which had built up cumulatively to significant levels. Regarding water and electricity, value added by the electricity sub-sector had previously been substantially overestimated due to inaccurate price information and exclusion of the cost of imported electricity. When these anomalies were corrected, together with the increased costs of generation, the share of electricity in total sectoral output was reduced substantially.
Other sectors were also revised; for example, utilising the informal sector survey in the annual estimates had an impact on manufacturing, construction and trade, in particular. The hotels and restaurants sub-sector was boosted by more detailed information on tourism.
COMPOUND ANNUAL GROWTH RATES: 2006 – 2011
Source: Statistics Botswana
Sectors 1993/94 Prices 2006 PricesPrimary –3.7 –9.8
Agriculture, forestry and fishing 7.2 2.0
Mining and quarrying –4.4 –10.8
Secondary 8.5 7.6
Manufacturing 6.4 7.9
Water and electricity 4.4 –25.1
Construction 11.8 12.0
Tertiary 6.2 9.0
Trade, hotels and restaurants 6.8 12.0
Transport and communication 10.1 10.8
Financial and business activities 7.0 8.8
General government 4.2 5.4
Personal and social services 6.0 9.8
Total value added 2.5 3.2
Total GDP at market prices 3.0 4.0
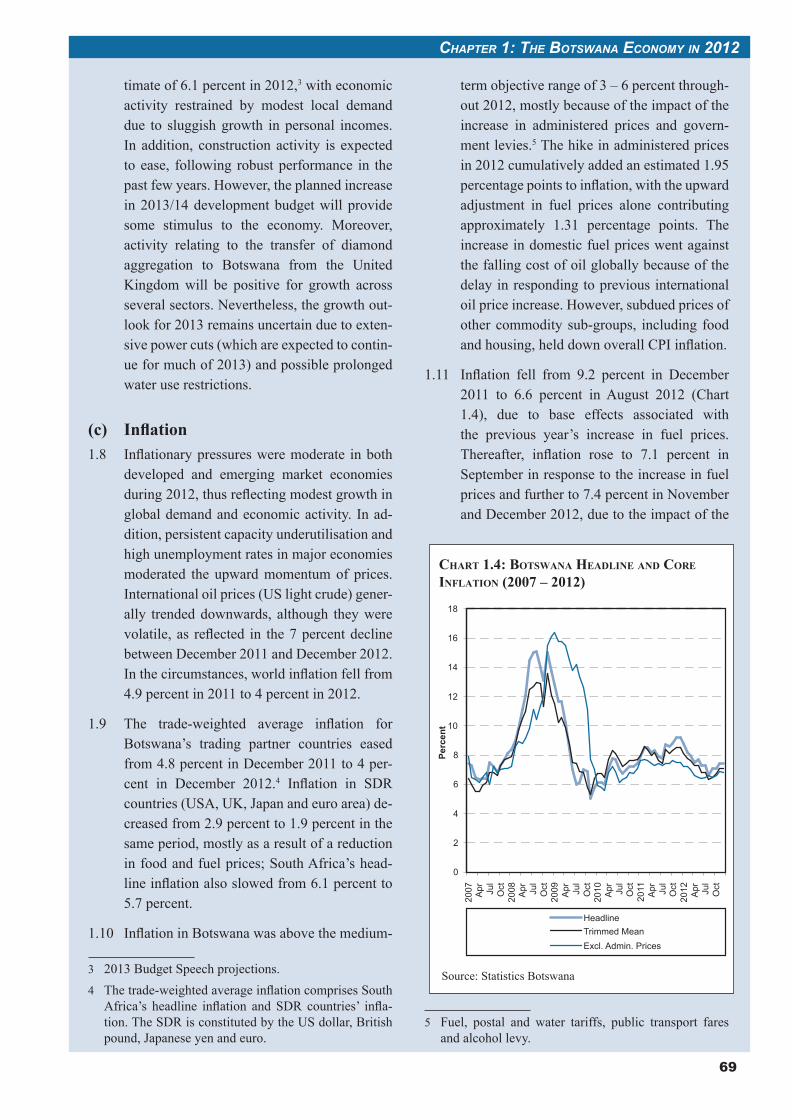
69
Chapter 1: the Botswana eConomy in 2012
timate of 6.1 percent in 2012,3 with economic activity restrained by modest local demand due to sluggish growth in personal incomes. In addition, construction activity is expected to ease, following robust performance in the past few years. However, the planned increase in 2013/14 development budget will provide some stimulus to the economy. Moreover, activity relating to the transfer of diamond aggregation to Botswana from the United Kingdom will be positive for growth across several sectors. Nevertheless, the growth out-look for 2013 remains uncertain due to exten-sive power cuts (which are expected to contin-ue for much of 2013) and possible prolonged water use restrictions.
(c) Inflation1.8 Inflationarypressuresweremoderate inboth
developed and emerging market economies during2012,thusreflectingmodestgrowthinglobal demand and economic activity. In ad-dition, persistent capacity underutilisation and high unemployment rates in major economies moderated the upward momentum of prices. International oil prices (US light crude) gener-ally trended downwards, although they were volatile,as reflected in the7percentdeclinebetween December 2011 and December 2012. Inthecircumstances,worldinflationfellfrom4.9 percent in 2011 to 4 percent in 2012.
1.9 The trade-weighted average inflation forBotswana’s trading partner countries eased from 4.8 percent in December 2011 to 4 per-cent in December 2012.4 Inflation in SDRcountries (USA, UK, Japan and euro area) de-creased from 2.9 percent to 1.9 percent in the same period, mostly as a result of a reduction in food and fuel prices; South Africa’s head-lineinflationalsoslowedfrom6.1percentto5.7percent.
1.10 InflationinBotswanawasabovethemedium-
3 2013 Budget Speech projections.4 Thetrade-weightedaverageinflationcomprisesSouth
Africa’s headline inflation andSDR countries’ infla-tion.TheSDRisconstitutedbytheUSdollar,Britishpound, Japanese yen and euro.
term objective range of 3 – 6 percent through-out 2012, mostly because of the impact of the increase in administered prices and govern-ment levies.5 The hike in administered prices in 2012 cumulatively added an estimated 1.95 percentagepointstoinflation,withtheupwardadjustment in fuel prices alone contributing approximately 1.31 percentage points. The increase in domestic fuel prices went against the falling cost of oil globally because of the delay in responding to previous international oil price increase. However, subdued prices of other commodity sub-groups, including food andhousing,helddownoverallCPIinflation.
1.11 Inflation fell from 9.2 percent in December2011 to 6.6 percent in August 2012 (Chart 1.4), due to base effects associated with the previous year’s increase in fuel prices. Thereafter, inflation rose to 7.1 percent inSeptember in response to the increase in fuel pricesandfurtherto7.4percentinNovemberand December 2012, due to the impact of the
5 Fuel, postal and water tariffs, public transport fares and alcohol levy.
Chart 1.4: Botswana headline and Core inflation (2007 – 2012)
Source: Statistics Botswana
0
2
4
6
8
10
12
14
16
18
2007 Apr Ju
lO
ct20
08 Apr Ju
lO
ct20
09 Apr Ju
lO
ct20
10 Apr Ju
lO
ct20
11 Apr Ju
lO
ct20
12 Apr Ju
lO
ct
Perc
ent
HeadlineTrimmed MeanExcl. Admin. Prices
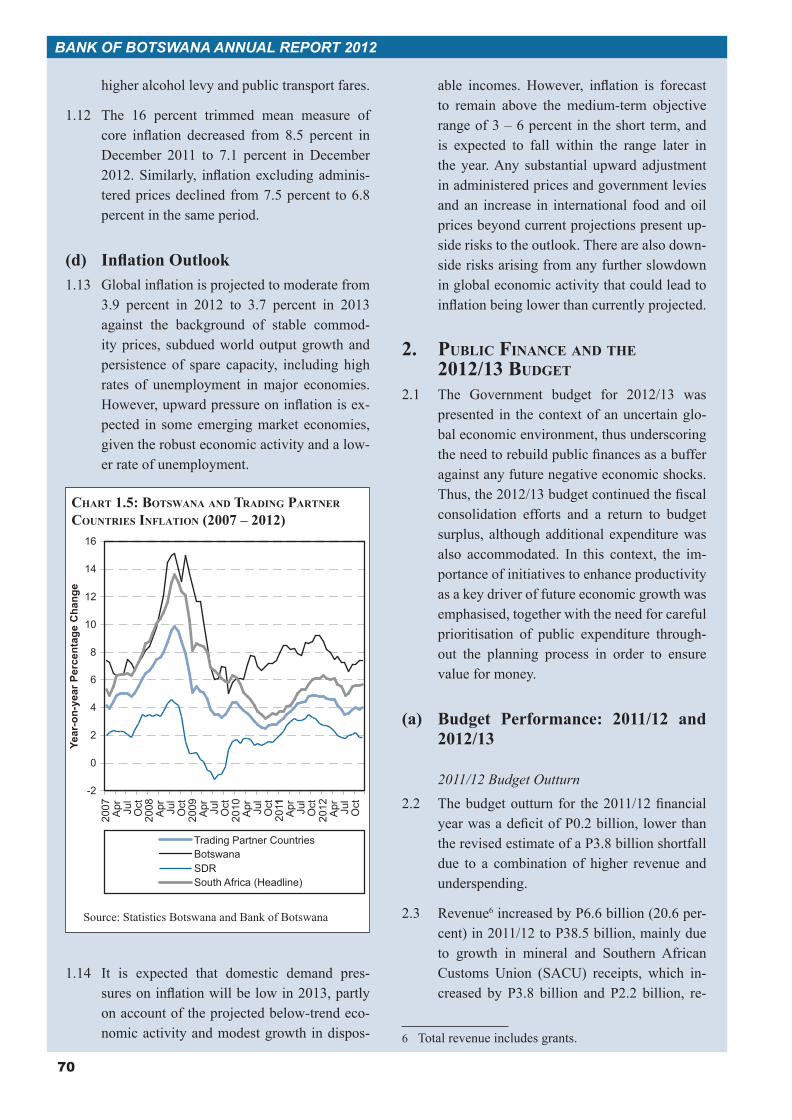
70
BANK OF BOTSWANA ANNUAL REPORT 2012
higher alcohol levy and public transport fares.
1.12 The 16 percent trimmed mean measure of core inflation decreased from 8.5 percent in December 2011 to 7.1 percent in December 2012. Similarly, inflation excluding adminis-tered prices declined from 7.5 percent to 6.8 percent in the same period.
1.13 Global inflation is projected to moderate from 3.9 percent in 2012 to 3.7 percent in 2013 against the background of stable commod-ity prices, subdued world output growth and persistence of spare capacity, including high rates of unemployment in major economies. However, upward pressure on inflation is ex-pected in some emerging market economies, given the robust economic activity and a low-er rate of unemployment.
1.14 It is expected that domestic demand pres-sures on inflation will be low in 2013, partly on account of the projected below-trend eco-nomic activity and modest growth in dispos-
able incomes. However, inflation is forecast to remain above the medium-term objective range of 3 – 6 percent in the short term, and is expected to fall within the range later in the year. Any substantial upward adjustment in administered prices and government levies and an increase in international food and oil prices beyond current projections present up-side risks to the outlook. There are also down-side risks arising from any further slowdown in global economic activity that could lead to inflation being lower than currently projected.
2. PUBLIC FINANCE AND THE 2012/13 BUDGET
2.1 The Government budget for 2012/13 was presented in the context of an uncertain glo-bal economic environment, thus underscoring the need to rebuild public finances as a buffer against any future negative economic shocks. Thus, the 2012/13 budget continued the fiscal consolidation efforts and a return to budget surplus, although additional expenditure was also accommodated. In this context, the im-portance of initiatives to enhance productivity as a key driver of future economic growth was emphasised, together with the need for careful prioritisation of public expenditure through-out the planning process in order to ensure value for money.
(a) Budget Performance: 2011/12 and 2012/13
2011/12 Budget Outturn2.2 The budget outturn for the 2011/12 financial
year was a deficit of P0.2 billion, lower than the revised estimate of a P3.8 billion shortfall due to a combination of higher revenue and underspending.
2.3 Revenue6 increased by P6.6 billion (20.6 per-cent) in 2011/12 to P38.5 billion, mainly due to growth in mineral and Southern African Customs Union (SACU) receipts, which in-creased by P3.8 billion and P2.2 billion, re-
6 Total revenue includes grants.
CHART 1.5: BOTSWANA AND TRADING PARTNER COUNTRIES INFLATION (2007 – 2012)
Source: Statistics Botswana and Bank of Botswana
-2
0
2
4
6
8
10
12
14
16
2007 Apr Ju
lO
ct20
08 Apr Ju
lO
ct20
09 Apr Ju
lO
ct20
10 Apr Ju
lO
ct20
11A
pr Jul
Oct
2012 Apr Ju
lO
ct
Year
-on-
year
Per
cent
age
Cha
nge
Trading Partner CountriesBotswanaSDRSouth Africa (Headline)
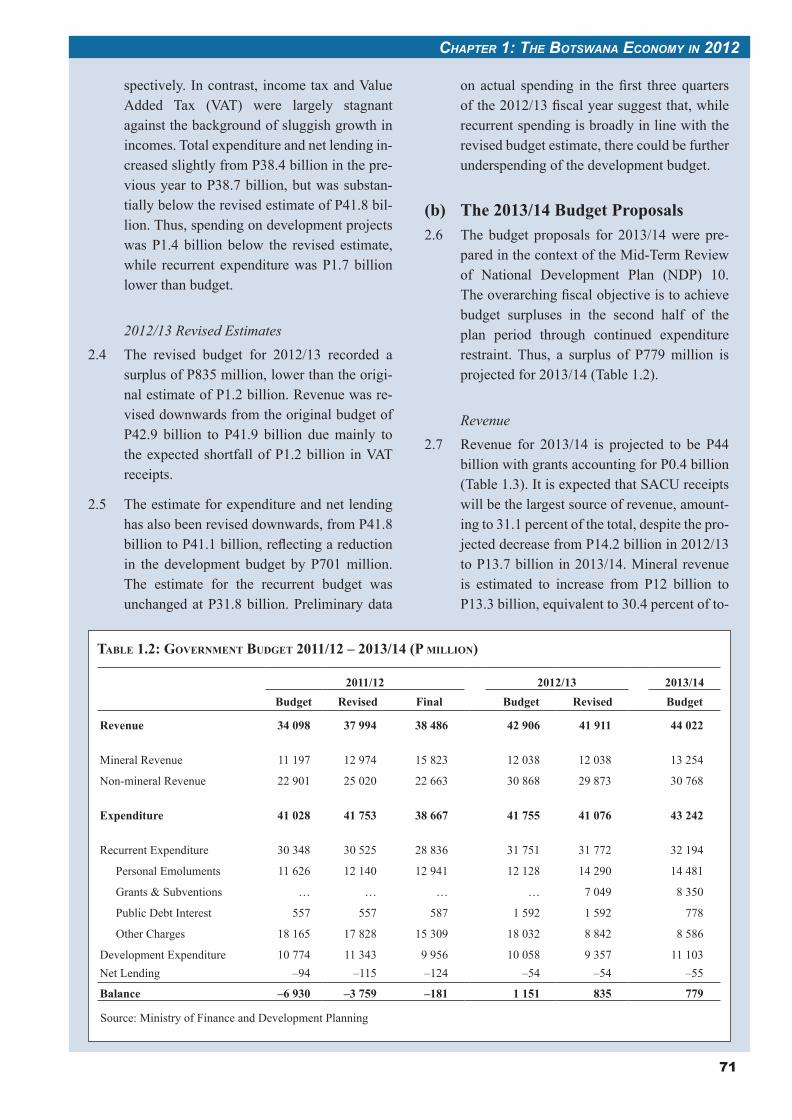
71
CHAPTER 1: THE BOTSWANA ECONOMY IN 2012
spectively. In contrast, income tax and Value Added Tax (VAT) were largely stagnant against the background of sluggish growth in incomes. Total expenditure and net lending in-creased slightly from P38.4 billion in the pre-vious year to P38.7 billion, but was substan-tially below the revised estimate of P41.8 bil-lion. Thus, spending on development projects was P1.4 billion below the revised estimate, while recurrent expenditure was P1.7 billion lower than budget.
2012/13 Revised Estimates2.4 The revised budget for 2012/13 recorded a
surplus of P835 million, lower than the origi-nal estimate of P1.2 billion. Revenue was re-vised downwards from the original budget of P42.9 billion to P41.9 billion due mainly to the expected shortfall of P1.2 billion in VAT receipts.
2.5 The estimate for expenditure and net lending has also been revised downwards, from P41.8 billion to P41.1 billion, reflecting a reduction in the development budget by P701 million. The estimate for the recurrent budget was unchanged at P31.8 billion. Preliminary data
on actual spending in the first three quarters of the 2012/13 fiscal year suggest that, while recurrent spending is broadly in line with the revised budget estimate, there could be further underspending of the development budget.
(b) The 2013/14 Budget Proposals2.6 The budget proposals for 2013/14 were pre-
pared in the context of the Mid-Term Review of National Development Plan (NDP) 10. The overarching fiscal objective is to achieve budget surpluses in the second half of the plan period through continued expenditure restraint. Thus, a surplus of P779 million is projected for 2013/14 (Table 1.2).
Revenue2.7 Revenue for 2013/14 is projected to be P44
billion with grants accounting for P0.4 billion (Table 1.3). It is expected that SACU receipts will be the largest source of revenue, amount-ing to 31.1 percent of the total, despite the pro-jected decrease from P14.2 billion in 2012/13 to P13.7 billion in 2013/14. Mineral revenue is estimated to increase from P12 billion to P13.3 billion, equivalent to 30.4 percent of to-
TABLE 1.2: GOVERNMENT BUDGET 2011/12 – 2013/14 (P MILLION)
2011/12 2012/13 2013/14 Budget Revised Final Budget Revised Budget
Revenue 34 098 37 994 38 486 42 906 41 911 44 022
Mineral Revenue 11 197 12 974 15 823 12 038 12 038 13 254
Non-mineral Revenue 22 901 25 020 22 663 30 868 29 873 30 768
Expenditure 41 028 41 753 38 667 41 755 41 076 43 242
Recurrent Expenditure 30 348 30 525 28 836 31 751 31 772 32 194
Personal Emoluments 11 626 12 140 12 941 12 128 14 290 14 481
Grants & Subventions … … … … 7 049 8 350
Public Debt Interest 557 557 587 1 592 1 592 778
Other Charges 18 165 17 828 15 309 18 032 8 842 8 586
Development Expenditure 10 774 11 343 9 956 10 058 9 357 11 103Net Lending –94 –115 –124 –54 –54 –55
Balance –6 930 –3 759 –181 1 151 835 779
Source: Ministry of Finance and Development Planning
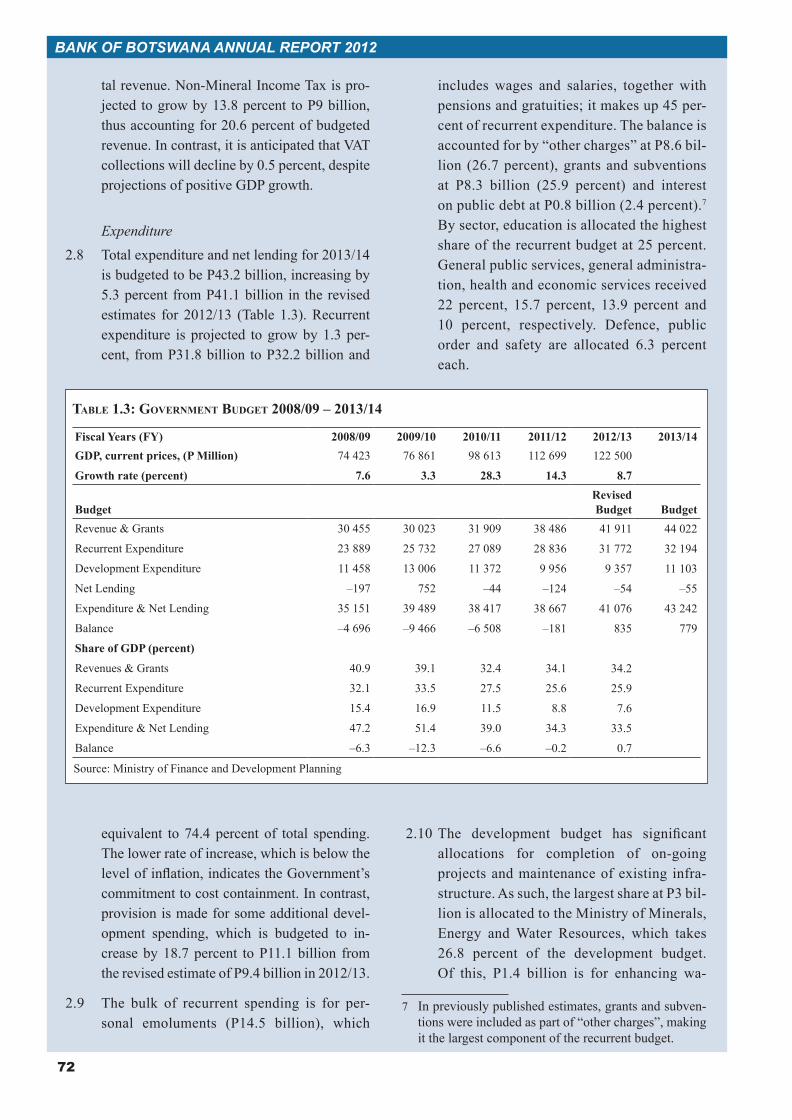
72
BANK OF BOTSWANA ANNUAL REPORT 2012
tal revenue. Non-Mineral Income Tax is pro-jected to grow by 13.8 percent to P9 billion, thus accounting for 20.6 percent of budgeted revenue. In contrast, it is anticipated that VAT collections will decline by 0.5 percent, despite projections of positive GDP growth.
Expenditure2.8 Total expenditure and net lending for 2013/14
is budgeted to be P43.2 billion, increasing by 5.3 percent from P41.1 billion in the revised estimates for 2012/13 (Table 1.3). Recurrent expenditure is projected to grow by 1.3 per-cent, from P31.8 billion to P32.2 billion and
equivalent to 74.4 percent of total spending. The lower rate of increase, which is below the level of inflation, indicates the Government’s commitment to cost containment. In contrast, provision is made for some additional devel-opment spending, which is budgeted to in-crease by 18.7 percent to P11.1 billion from the revised estimate of P9.4 billion in 2012/13.
2.9 The bulk of recurrent spending is for per-sonal emoluments (P14.5 billion), which
includes wages and salaries, together with pensions and gratuities; it makes up 45 per-cent of recurrent expenditure. The balance is accounted for by “other charges” at P8.6 bil-lion (26.7 percent), grants and subventions at P8.3 billion (25.9 percent) and interest on public debt at P0.8 billion (2.4 percent).7 By sector, education is allocated the highest share of the recurrent budget at 25 percent. General public services, general administra-tion, health and economic services received 22 percent, 15.7 percent, 13.9 percent and 10 percent, respectively. Defence, public order and safety are allocated 6.3 percent each.
2.10 The development budget has significant allocations for completion of on-going projects and maintenance of existing infra-structure. As such, the largest share at P3 bil-lion is allocated to the Ministry of Minerals, Energy and Water Resources, which takes 26.8 percent of the development budget. Of this, P1.4 billion is for enhancing wa-
7 In previously published estimates, grants and subven-tions were included as part of “other charges”, making it the largest component of the recurrent budget.
TABLE 1.3: GOVERNMENT BUDGET 2008/09 – 2013/14
Fiscal Years (FY) 2008/09 2009/10 2010/11 2011/12 2012/13 2013/14GDP, current prices, (P Million)
Growth rate (percent)
74 423
7.6
76 861
3.3
98 613
28.3
112 699
14.3
122 500
8.7
BudgetRevised Budget Budget
Revenue & Grants
Recurrent Expenditure
Development Expenditure
Net Lending
Expenditure & Net Lending
Balance
Share of GDP (percent)
Revenues & Grants
Recurrent Expenditure
Development Expenditure
Expenditure & Net Lending
Balance
30 455
23 889
11 458
–197
35 151
–4 696
40.9
32.1
15.4
47.2
–6.3
30 023
25 732
13 006
752
39 489
–9 466
39.1
33.5
16.9
51.4
–12.3
31 909
27 089
11 372
–44
38 417
–6 508
32.4
27.5
11.5
39.0
–6.6
38 486
28 836
9 956
–124
38 667
–181
34.1
25.6
8.8
34.3
–0.2
41 911
31 772
9 357
–54
41 076
835
34.2
25.9
7.6
33.5
0.7
44 022
32 194
11 103
–55
43 242
779
Source: Ministry of Finance and Development Planning
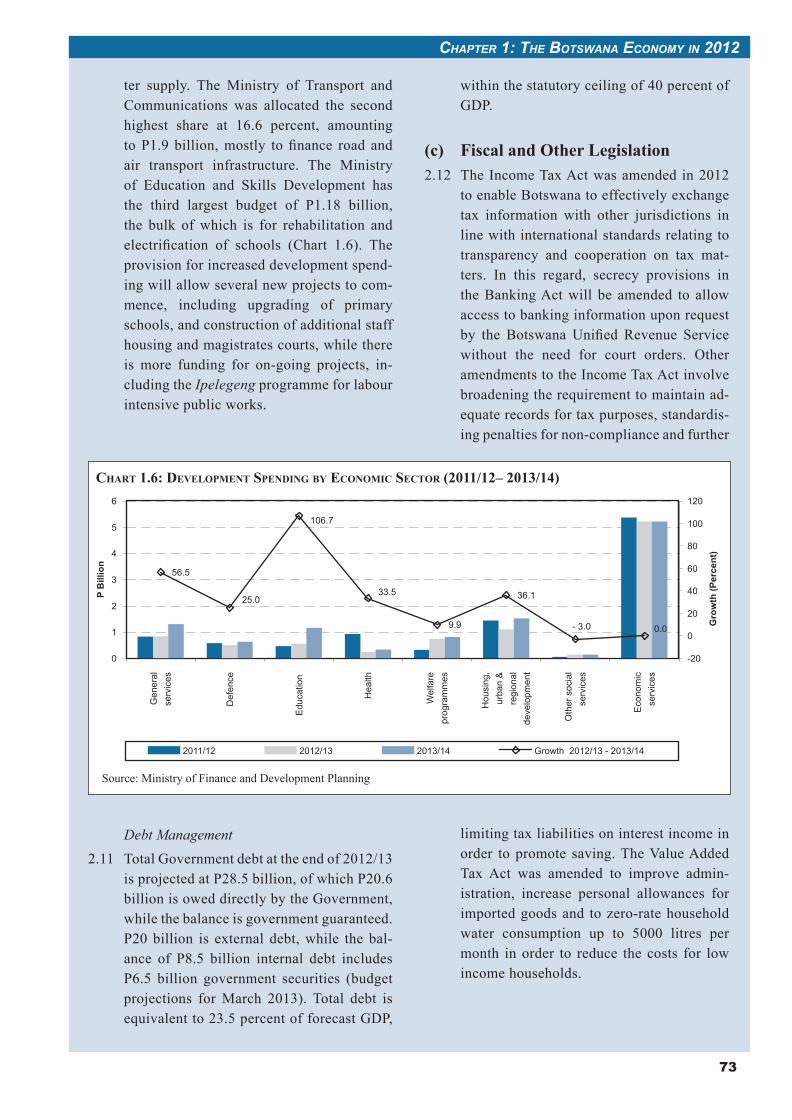
73
CHAPTER 1: THE BOTSWANA ECONOMY IN 2012
ter supply. The Ministry of Transport and Communications was allocated the second highest share at 16.6 percent, amounting to P1.9 billion, mostly to finance road and air transport infrastructure. The Ministry of Education and Skills Development has the third largest budget of P1.18 billion, the bulk of which is for rehabilitation and electrification of schools (Chart 1.6). The provision for increased development spend-ing will allow several new projects to com-mence, including upgrading of primary schools, and construction of additional staff housing and magistrates courts, while there is more funding for on-going projects, in-cluding the Ipelegeng programme for labour intensive public works.
Debt Management2.11 Total Government debt at the end of 2012/13
is projected at P28.5 billion, of which P20.6 billion is owed directly by the Government, while the balance is government guaranteed. P20 billion is external debt, while the bal-ance of P8.5 billion internal debt includes P6.5 billion government securities (budget projections for March 2013). Total debt is equivalent to 23.5 percent of forecast GDP,
within the statutory ceiling of 40 percent of GDP.
(c) Fiscal and Other Legislation2.12 The Income Tax Act was amended in 2012
to enable Botswana to effectively exchange tax information with other jurisdictions in line with international standards relating to transparency and cooperation on tax mat-ters. In this regard, secrecy provisions in the Banking Act will be amended to allow access to banking information upon request by the Botswana Unified Revenue Service without the need for court orders. Other amendments to the Income Tax Act involve broadening the requirement to maintain ad-equate records for tax purposes, standardis-ing penalties for non-compliance and further
limiting tax liabilities on interest income in order to promote saving. The Value Added Tax Act was amended to improve admin-istration, increase personal allowances for imported goods and to zero-rate household water consumption up to 5000 litres per month in order to reduce the costs for low income households.
CHART 1.6: DEVELOPMENT SPENDING BY ECONOMIC SECTOR (2011/12– 2013/14)
Source: Ministry of Finance and Development Planning
56.5
9.9
36.1
- 3.0
106.7
0.0
33.5 25.0
0
1
2
3
4
5
6
Gen
eral
serv
ices
Def
ence
Edu
catio
n
Hea
lth
Wel
fare
prog
ram
mes
Hou
sing
,ur
ban
&re
gion
alde
velo
pmen
t
Oth
er s
ocia
lse
rvic
es
Eco
nom
icse
rvic
es
P B
illio
n
-20
0
20
40
60
80
100
120
Gro
wth
(Per
cent
)
2011/12 2012/13 2013/14 Growth 2012/13 - 2013/14
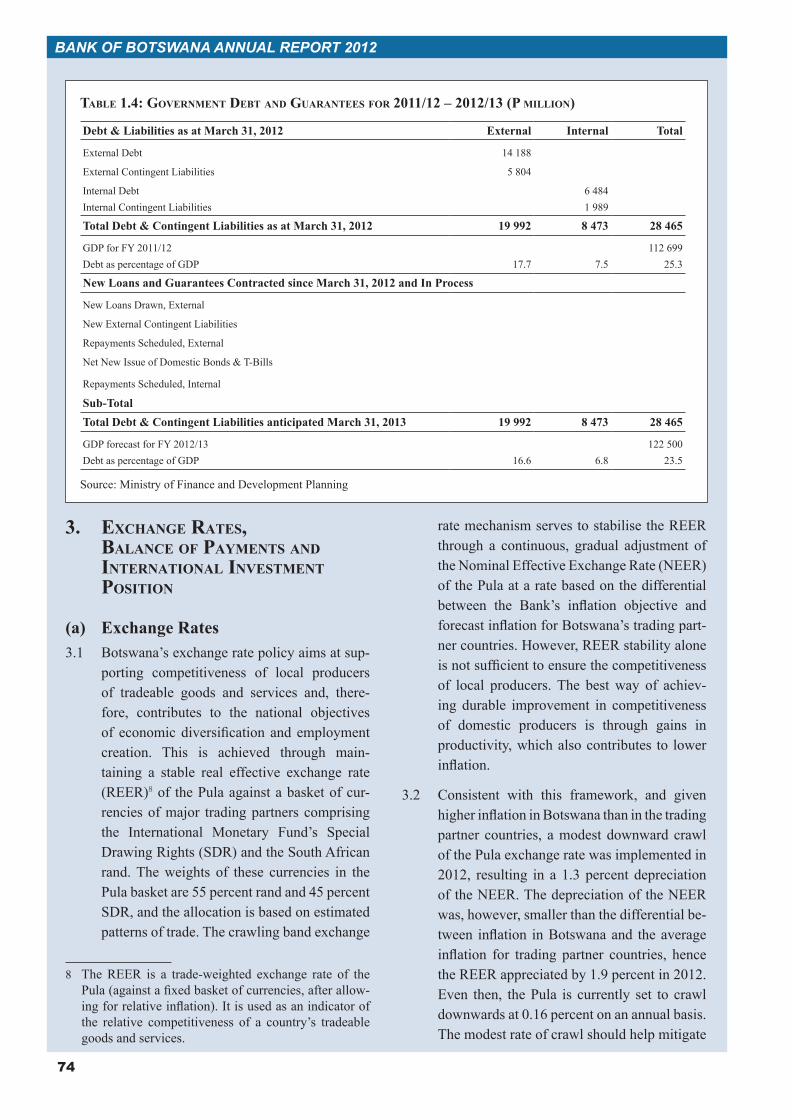
74
BanK oF Botswana annUaL report 2012
3. exChange rates, BalanCe of Payments and international investment Position
(a) ExchangeRates3.1 Botswana’s exchange rate policy aims at sup-
porting competitiveness of local producers of tradeable goods and services and, there-fore, contributes to the national objectives of economicdiversificationandemploymentcreation. This is achieved through main-taining a stable real effective exchange rate (REER)8 of the Pula against a basket of cur-rencies of major trading partners comprising the International Monetary Fund’s Special DrawingRights(SDR)andtheSouthAfricanrand. The weights of these currencies in the Pula basket are 55 percent rand and 45 percent SDR,andtheallocationisbasedonestimatedpatterns of trade. The crawling band exchange
8 TheREER is a trade-weighted exchange rate of thePula(againstafixedbasketofcurrencies,afterallow-ingforrelativeinflation).Itisusedasanindicatorofthe relative competitiveness of a country’s tradeable goods and services.
ratemechanismservestostabilisetheREERthrough a continuous, gradual adjustment of theNominalEffectiveExchangeRate(NEER)of the Pula at a rate based on the differential between the Bank’s inflation objective andforecastinflationforBotswana’stradingpart-nercountries.However,REERstabilityaloneisnotsufficienttoensurethecompetitivenessof local producers. The best way of achiev-ing durable improvement in competitiveness of domestic producers is through gains in productivity, which also contributes to lower inflation.
3.2 Consistent with this framework, and given higherinflationinBotswanathaninthetradingpartner countries, a modest downward crawl of the Pula exchange rate was implemented in 2012, resulting in a 1.3 percent depreciation oftheNEER.ThedepreciationoftheNEERwas, however, smaller than the differential be-tween inflation inBotswanaand theaverageinflation for trading partner countries, hencetheREERappreciatedby1.9percentin2012.Even then, thePula is currently set to crawldownwards at 0.16 percent on an annual basis. The modest rate of crawl should help mitigate
taBle 1.4: government deBt and guarantees for 2011/12 – 2012/13 (P million)
Debt&LiabilitiesasatMarch31,2012 External Internal Total
ExternalDebt 14 188 ExternalContingentLiabilities 5 804 Internal Debt 6 484 InternalContingentLiabilities 1 989 TotalDebt&ContingentLiabilitiesasatMarch31,2012 19992 8473 28465
GDP for FY 2011/12 112 699Debt as percentage of GDP 17.7 7.5 25.3
NewLoansandGuaranteesContractedsinceMarch31,2012andInProcess
NewLoansDrawn,External NewExternalContingentLiabilities RepaymentsScheduled,External Net New Issue of Domestic Bonds & T-Bills
RepaymentsScheduled,Internal Sub-Total TotalDebt&ContingentLiabilitiesanticipatedMarch31,2013 19992 8473 28465
GDP forecast for FY 2012/13 122 500Debt as percentage of GDP 16.6 6.8 23.5
Source: Ministry of Finance and Development Planning
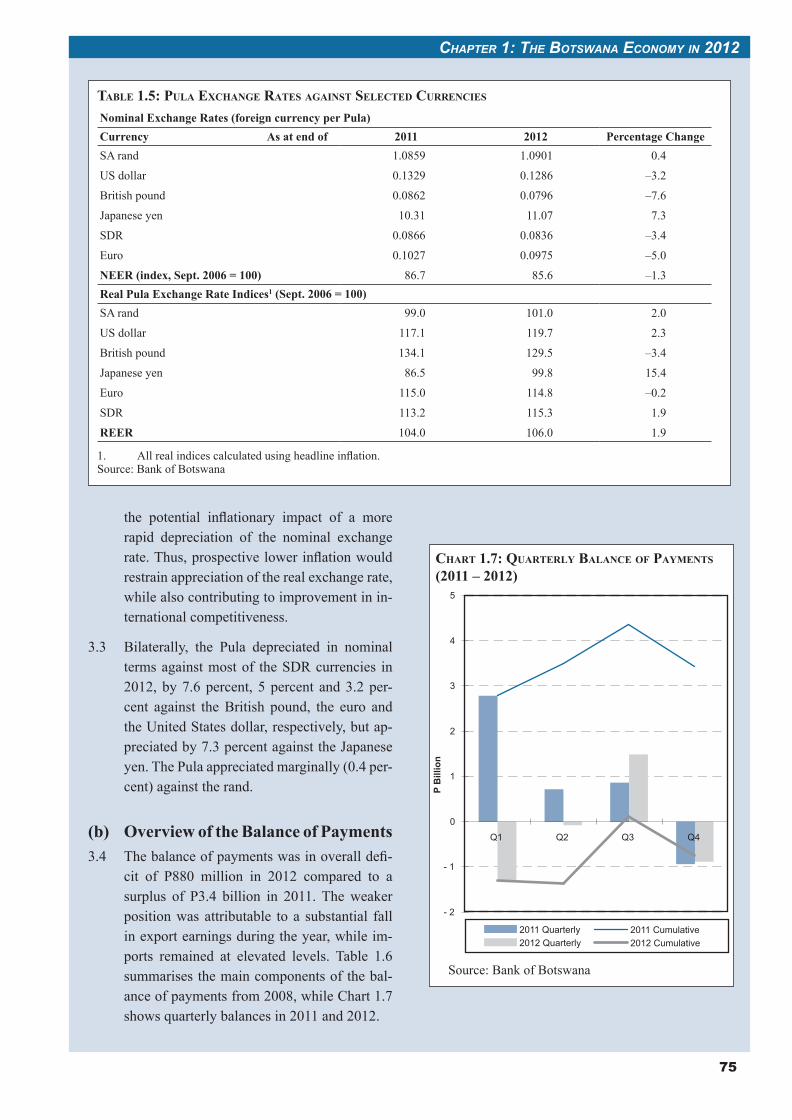
75
CHAPTER 1: THE BOTSWANA ECONOMY IN 2012
the potential inflationary impact of a more rapid depreciation of the nominal exchange rate. Thus, prospective lower inflation would restrain appreciation of the real exchange rate, while also contributing to improvement in in-ternational competitiveness.
3.3 Bilaterally, the Pula depreciated in nominal terms against most of the SDR currencies in 2012, by 7.6 percent, 5 percent and 3.2 per-cent against the British pound, the euro and the United States dollar, respectively, but ap-preciated by 7.3 percent against the Japanese yen. The Pula appreciated marginally (0.4 per-cent) against the rand.
(b) Overview of the Balance of Payments3.4 The balance of payments was in overall defi-
cit of P880 million in 2012 compared to a surplus of P3.4 billion in 2011. The weaker position was attributable to a substantial fall in export earnings during the year, while im-ports remained at elevated levels. Table 1.6 summarises the main components of the bal-ance of payments from 2008, while Chart 1.7 shows quarterly balances in 2011 and 2012.
TABLE 1.5: PULA EXCHANGE RATES AGAINST SELECTED CURRENCIES
Nominal Exchange Rates (foreign currency per Pula)Currency As at end of 2011 2012 Percentage ChangeSA rand
US dollar
British pound
Japanese yen
SDR
Euro
NEER (index, Sept. 2006 = 100)
1.0859
0.1329
0.0862
10.31
0.0866
0.1027
86.7
1.0901
0.1286
0.0796
11.07
0.0836
0.0975
85.6
0.4
–3.2
–7.6
7.3
–3.4
–5.0
–1.3Real Pula Exchange Rate Indices1 (Sept. 2006 = 100)SA rand
US dollar
British pound
Japanese yen
Euro
SDR
REER
99.0
117.1
134.1
86.5
115.0
113.2
104.0
101.0
119.7
129.5
99.8
114.8
115.3
106.0
2.0
2.3
–3.4
15.4
–0.2
1.9
1.9
1. All real indices calculated using headline inflation.Source: Bank of Botswana
CHART 1.7: QUARTERLY BALANCE OF PAYMENTS (2011 – 2012)
Source: Bank of Botswana
- 2
- 1
0
1
2
3
4
5
Q1 Q2 Q3 Q4
P B
illio
n
2011 Quarterly2012 Quarterly
2011 Cumulative2012 Cumulative
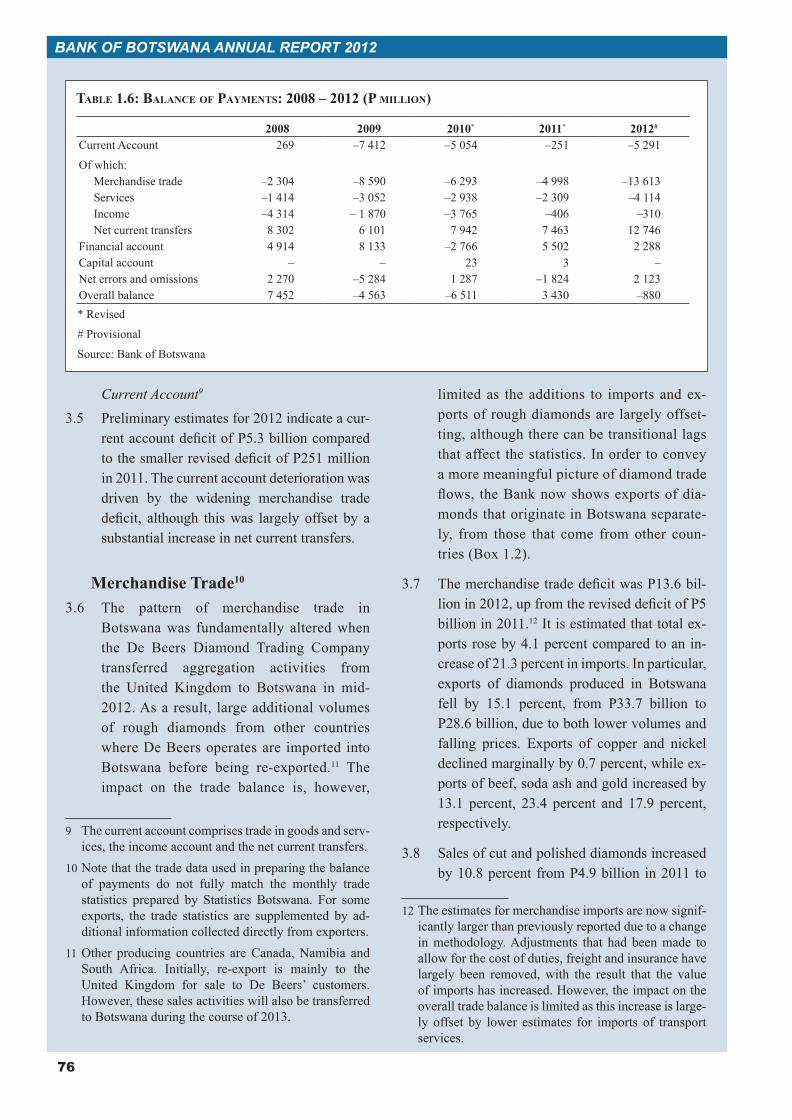
76
BANK OF BOTSWANA ANNUAL REPORT 2012
Current Account9
3.5 Preliminary estimates for 2012 indicate a cur-rent account deficit of P5.3 billion compared to the smaller revised deficit of P251 million in 2011. The current account deterioration was driven by the widening merchandise trade deficit, although this was largely offset by a substantial increase in net current transfers.
Merchandise Trade10
3.6 The pattern of merchandise trade in Botswana was fundamentally altered when the De Beers Diamond Trading Company transferred aggregation activities from the United Kingdom to Botswana in mid-2012. As a result, large additional volumes of rough diamonds from other countries where De Beers operates are imported into Botswana before being re-exported.11 The impact on the trade balance is, however,
9 The current account comprises trade in goods and serv-ices, the income account and the net current transfers.
10 Note that the trade data used in preparing the balance of payments do not fully match the monthly trade statistics prepared by Statistics Botswana. For some exports, the trade statistics are supplemented by ad-ditional information collected directly from exporters.
11 Other producing countries are Canada, Namibia and South Africa. Initially, re-export is mainly to the United Kingdom for sale to De Beers’ customers. However, these sales activities will also be transferred to Botswana during the course of 2013.
limited as the additions to imports and ex-ports of rough diamonds are largely offset-ting, although there can be transitional lags that affect the statistics. In order to convey a more meaningful picture of diamond trade flows, the Bank now shows exports of dia-monds that originate in Botswana separate-ly, from those that come from other coun-tries (Box 1.2).
3.7 The merchandise trade deficit was P13.6 bil-lion in 2012, up from the revised deficit of P5 billion in 2011.12 It is estimated that total ex-ports rose by 4.1 percent compared to an in-crease of 21.3 percent in imports. In particular, exports of diamonds produced in Botswana fell by 15.1 percent, from P33.7 billion to P28.6 billion, due to both lower volumes and falling prices. Exports of copper and nickel declined marginally by 0.7 percent, while ex-ports of beef, soda ash and gold increased by 13.1 percent, 23.4 percent and 17.9 percent, respectively.
3.8 Sales of cut and polished diamonds increased by 10.8 percent from P4.9 billion in 2011 to
12 The estimates for merchandise imports are now signif-icantly larger than previously reported due to a change in methodology. Adjustments that had been made to allow for the cost of duties, freight and insurance have largely been removed, with the result that the value of imports has increased. However, the impact on the overall trade balance is limited as this increase is large-ly offset by lower estimates for imports of transport services.
TABLE 1.6: BALANCE OF PAYMENTS: 2008 – 2012 (P MILLION)
2008 2009 2010* 2011* 2012#
Current Account 269 –7 412 –5 054 –251 –5 291
Of which: Merchandise trade –2 304 –8 590 –6 293 –4 998 –13 613 Services –1 414 –3 052 –2 938 –2 309 –4 114 Income –4 314 – 1 870 –3 765 –406 –310 Net current transfers 8 302 6 101 7 942 7 463 12 746
Financial account 4 914 8 133 –2 766 5 502 2 288Capital account – – 23 3 –Net errors and omissions 2 270 –5 284 1 287 –1 824 2 123Overall balance 7 452 –4 563 –6 511 3 430 –880* Revised
# Provisional
Source: Bank of Botswana
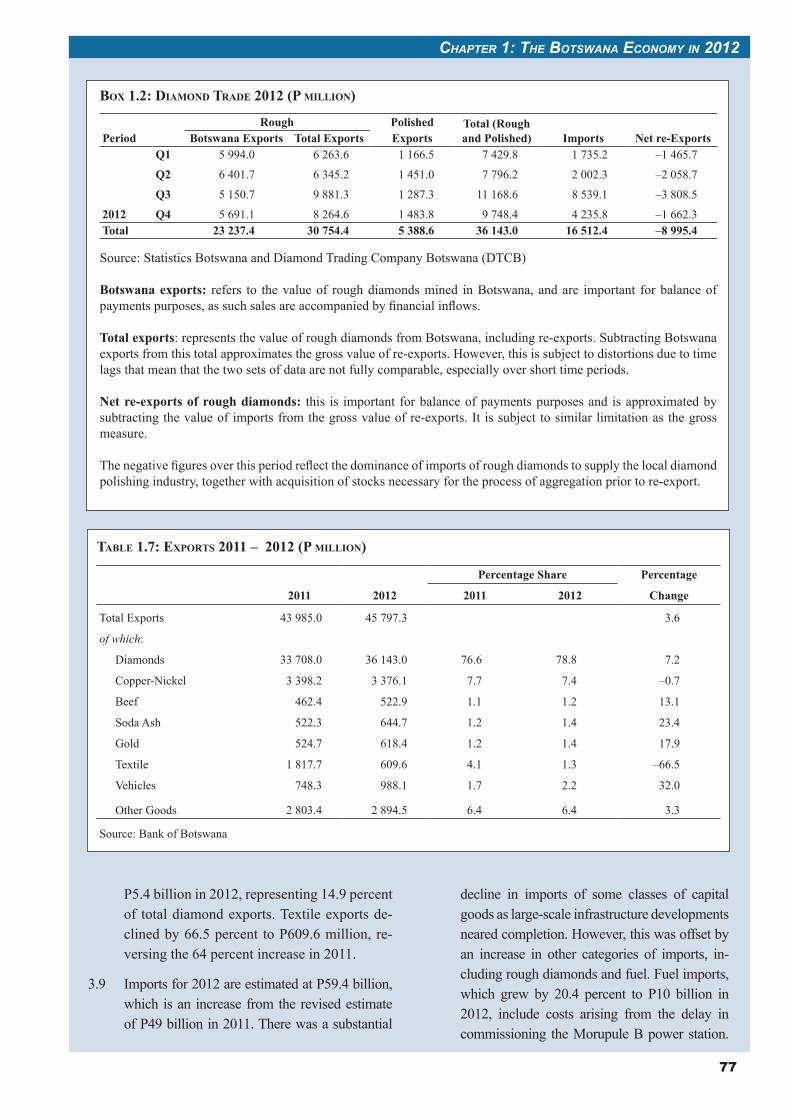
77
CHAPTER 1: THE BOTSWANA ECONOMY IN 2012
P5.4 billion in 2012, representing 14.9 percent of total diamond exports. Textile exports de-clined by 66.5 percent to P609.6 million, re-versing the 64 percent increase in 2011.
3.9 Imports for 2012 are estimated at P59.4 billion, which is an increase from the revised estimate of P49 billion in 2011. There was a substantial
decline in imports of some classes of capital goods as large-scale infrastructure developments neared completion. However, this was offset by an increase in other categories of imports, in-cluding rough diamonds and fuel. Fuel imports, which grew by 20.4 percent to P10 billion in 2012, include costs arising from the delay in commissioning the Morupule B power station.
BOX 1.2: DIAMOND TRADE 2012 (P MILLION)
Rough Polished Total (Rough and Polished)Period Botswana Exports Total Exports Exports Imports Net re-Exports
2012
Q1
Q2
Q3
Q4
5 994.0
6 401.7
5 150.7
5 691.1
6 263.6
6 345.2
9 881.3
8 264.6
1 166.5
1 451.0
1 287.3
1 483.8
7 429.8
7 796.2
11 168.6
9 748.4
1 735.2
2 002.3
8 539.1
4 235.8
–1 465.7
–2 058.7
–3 808.5
–1 662.3Total 23 237.4 30 754.4 5 388.6 36 143.0 16 512.4 –8 995.4
Source: Statistics Botswana and Diamond Trading Company Botswana (DTCB)
Botswana exports: refers to the value of rough diamonds mined in Botswana, and are important for balance of payments purposes, as such sales are accompanied by financial inflows.
Total exports: represents the value of rough diamonds from Botswana, including re-exports. Subtracting Botswana exports from this total approximates the gross value of re-exports. However, this is subject to distortions due to time lags that mean that the two sets of data are not fully comparable, especially over short time periods.
Net re-exports of rough diamonds: this is important for balance of payments purposes and is approximated by subtracting the value of imports from the gross value of re-exports. It is subject to similar limitation as the gross measure.
The negative figures over this period reflect the dominance of imports of rough diamonds to supply the local diamond polishing industry, together with acquisition of stocks necessary for the process of aggregation prior to re-export.
TABLE 1.7: EXPORTS 2011 – 2012 (P MILLION)
2011 2012
Percentage Share Percentage
2011 2012 Change
Total Exports 43 985.0 45 797.3 3.6
of which:
Diamonds 33 708.0 36 143.0 76.6 78.8 7.2
Copper-Nickel 3 398.2 3 376.1 7.7 7.4 –0.7
Beef 462.4 522.9 1.1 1.2 13.1
Soda Ash 522.3 644.7 1.2 1.4 23.4
Gold 524.7 618.4 1.2 1.4 17.9
Textile 1 817.7 609.6 4.1 1.3 –66.5
Vehicles 748.3 988.1 1.7 2.2 32.0
Other Goods 2 803.4 2 894.5 6.4 6.4 3.3
Source: Bank of Botswana
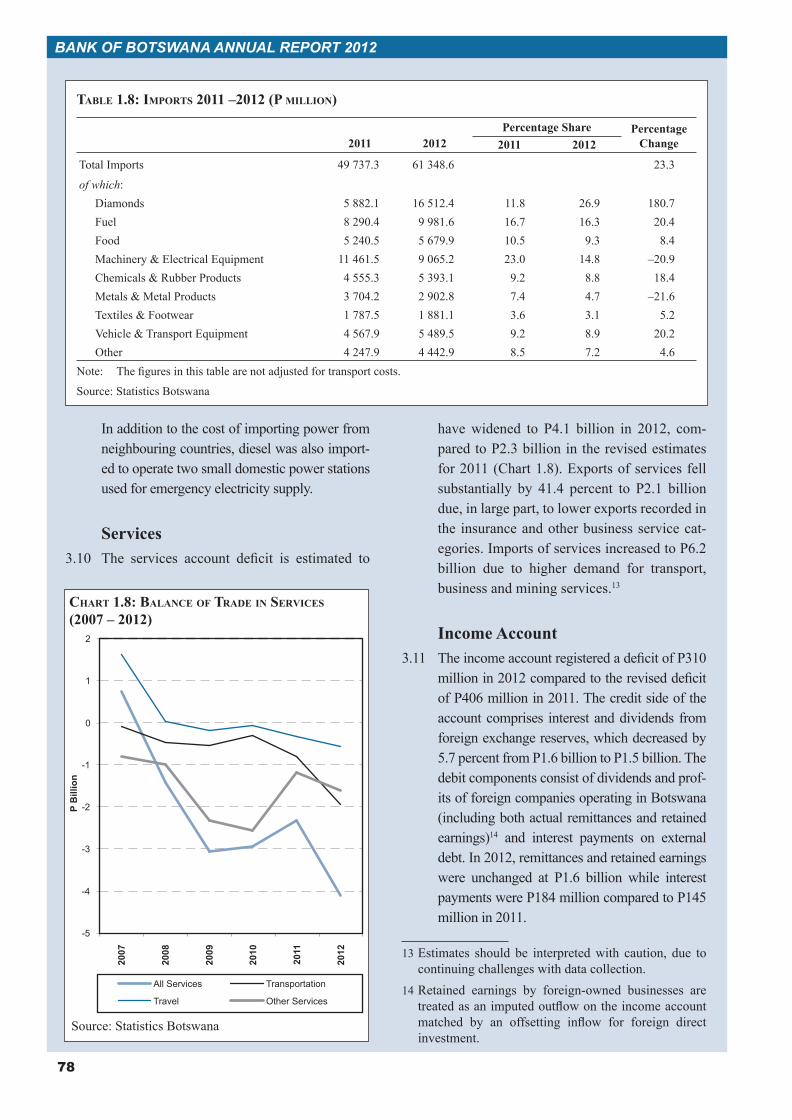
78
BANK OF BOTSWANA ANNUAL REPORT 2012
In addition to the cost of importing power from neighbouring countries, diesel was also import-ed to operate two small domestic power stations used for emergency electricity supply.
Services3.10 The services account deficit is estimated to
have widened to P4.1 billion in 2012, com-pared to P2.3 billion in the revised estimates for 2011 (Chart 1.8). Exports of services fell substantially by 41.4 percent to P2.1 billion due, in large part, to lower exports recorded in the insurance and other business service cat-egories. Imports of services increased to P6.2 billion due to higher demand for transport, business and mining services.13
Income Account3.11 The income account registered a deficit of P310
million in 2012 compared to the revised deficit of P406 million in 2011. The credit side of the account comprises interest and dividends from foreign exchange reserves, which decreased by 5.7 percent from P1.6 billion to P1.5 billion. The debit components consist of dividends and prof-its of foreign companies operating in Botswana (including both actual remittances and retained earnings)14 and interest payments on external debt. In 2012, remittances and retained earnings were unchanged at P1.6 billion while interest payments were P184 million compared to P145 million in 2011.
13 Estimates should be interpreted with caution, due to continuing challenges with data collection.
14 Retained earnings by foreign-owned businesses are treated as an imputed outflow on the income account matched by an offsetting inflow for foreign direct investment.
TABLE 1.8: IMPORTS 2011 –2012 (P MILLION)
2011 2012Percentage Share Percentage
Change2011 2012
Total Imports 49 737.3 61 348.6 23.3
of which: Diamonds 5 882.1 16 512.4 11.8 26.9 180.7Fuel 8 290.4 9 981.6 16.7 16.3 20.4Food 5 240.5 5 679.9 10.5 9.3 8.4Machinery & Electrical Equipment 11 461.5 9 065.2 23.0 14.8 –20.9Chemicals & Rubber Products 4 555.3 5 393.1 9.2 8.8 18.4Metals & Metal Products 3 704.2 2 902.8 7.4 4.7 –21.6Textiles & Footwear 1 787.5 1 881.1 3.6 3.1 5.2Vehicle & Transport Equipment 4 567.9 5 489.5 9.2 8.9 20.2Other 4 247.9 4 442.9 8.5 7.2 4.6
Note: The figures in this table are not adjusted for transport costs.
Source: Statistics Botswana
CHART 1.8: BALANCE OF TRADE IN SERVICES (2007 – 2012)
Source: Statistics Botswana
-5
-4
-3
-2
-1
0
1
2
2007
2008
2009
2010
2011
2012
P B
illio
n
All Services Transportation
Travel Other Services
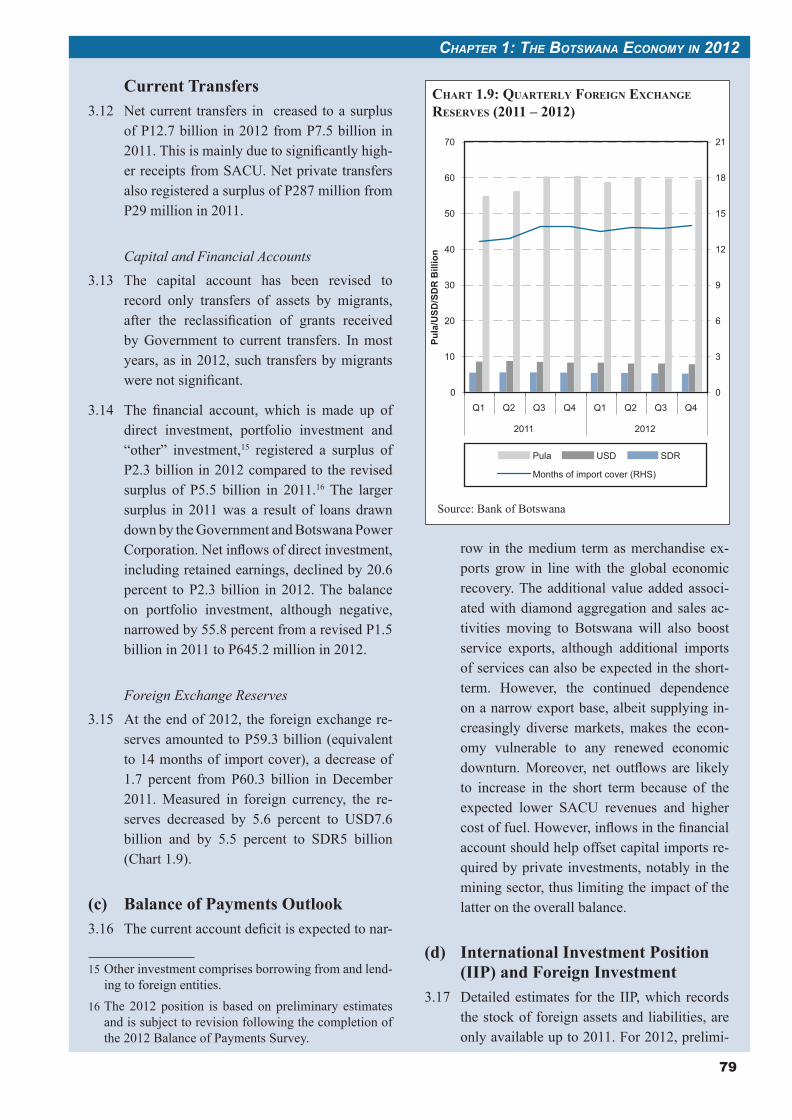
79
CHAPTER 1: THE BOTSWANA ECONOMY IN 2012
Current Transfers3.12 Net current transfers in creased to a surplus
of P12.7 billion in 2012 from P7.5 billion in 2011. This is mainly due to significantly high-er receipts from SACU. Net private transfers also registered a surplus of P287 million from P29 million in 2011.
Capital and Financial Accounts3.13 The capital account has been revised to
record only transfers of assets by migrants, after the reclassification of grants received by Government to current transfers. In most years, as in 2012, such transfers by migrants were not significant.
3.14 The financial account, which is made up of direct investment, portfolio investment and “other” investment,15 registered a surplus of P2.3 billion in 2012 compared to the revised surplus of P5.5 billion in 2011.16 The larger surplus in 2011 was a result of loans drawn down by the Government and Botswana Power Corporation. Net inflows of direct investment, including retained earnings, declined by 20.6 percent to P2.3 billion in 2012. The balance on portfolio investment, although negative, narrowed by 55.8 percent from a revised P1.5 billion in 2011 to P645.2 million in 2012.
Foreign Exchange Reserves3.15 At the end of 2012, the foreign exchange re-
serves amounted to P59.3 billion (equivalent to 14 months of import cover), a decrease of 1.7 percent from P60.3 billion in December 2011. Measured in foreign currency, the re-serves decreased by 5.6 percent to USD7.6 billion and by 5.5 percent to SDR5 billion (Chart 1.9).
(c) Balance of Payments Outlook3.16 The current account deficit is expected to nar-
15 Other investment comprises borrowing from and lend-ing to foreign entities.
16 The 2012 position is based on preliminary estimates and is subject to revision following the completion of the 2012 Balance of Payments Survey.
row in the medium term as merchandise ex-ports grow in line with the global economic recovery. The additional value added associ-ated with diamond aggregation and sales ac-tivities moving to Botswana will also boost service exports, although additional imports of services can also be expected in the short-term. However, the continued dependence on a narrow export base, albeit supplying in-creasingly diverse markets, makes the econ-omy vulnerable to any renewed economic downturn. Moreover, net outflows are likely to increase in the short term because of the expected lower SACU revenues and higher cost of fuel. However, inflows in the financial account should help offset capital imports re-quired by private investments, notably in the mining sector, thus limiting the impact of the latter on the overall balance.
(d) International Investment Position (IIP) and Foreign Investment
3.17 Detailed estimates for the IIP, which records the stock of foreign assets and liabilities, are only available up to 2011. For 2012, prelimi-
CHART 1.9: QUARTERLY FOREIGN EXCHANGE RESERVES (2011 – 2012)
Source: Bank of Botswana
0
10
20
30
40
50
60
70
Q1 Q2 Q3 Q4 Q1 Q2 Q3 Q4
2011 2012Pu
la/U
SD/S
DR
Bill
ion
0
3
6
9
12
15
18
21
SDRUSDPula
Months of import cover (RHS)
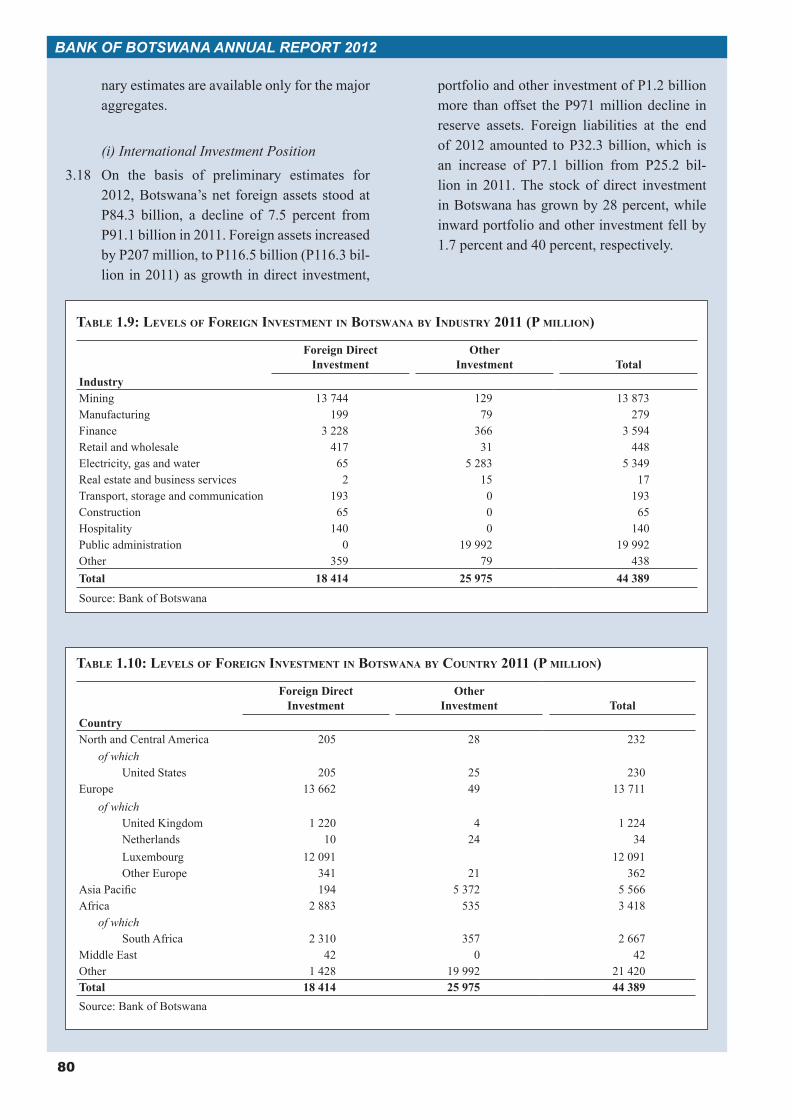
80
BANK OF BOTSWANA ANNUAL REPORT 2012
nary estimates are available only for the major aggregates.
(i) International Investment Position3.18 On the basis of preliminary estimates for
2012, Botswana’s net foreign assets stood at P84.3 billion, a decline of 7.5 percent from P91.1 billion in 2011. Foreign assets increased by P207 million, to P116.5 billion (P116.3 bil-lion in 2011) as growth in direct investment,
portfolio and other investment of P1.2 billion more than offset the P971 million decline in reserve assets. Foreign liabilities at the end of 2012 amounted to P32.3 billion, which is an increase of P7.1 billion from P25.2 bil-lion in 2011. The stock of direct investment in Botswana has grown by 28 percent, while inward portfolio and other investment fell by 1.7 percent and 40 percent, respectively.
TABLE 1.9: LEVELS OF FOREIGN INVESTMENT IN BOTSWANA BY INDUSTRY 2011 (P MILLION)
Foreign Direct Investment
Other Investment Total
Industry Mining 13 744 129 13 873Manufacturing 199 79 279Finance 3 228 366 3 594Retail and wholesale 417 31 448Electricity, gas and water 65 5 283 5 349Real estate and business services 2 15 17Transport, storage and communication 193 0 193Construction 65 0 65Hospitality 140 0 140Public administration 0 19 992 19 992Other 359 79 438Total 18 414 25 975 44 389
Source: Bank of Botswana
TABLE 1.10: LEVELS OF FOREIGN INVESTMENT IN BOTSWANA BY COUNTRY 2011 (P MILLION)
Foreign Direct Investment
Other Investment Total
Country North and Central America 205 28 232
of whichUnited States 205 25 230
Europe 13 662 49 13 711of which
United Kingdom 1 220 4 1 224Netherlands 10 24 34Luxembourg 12 091 12 091Other Europe 341 21 362
Asia Pacific 194 5 372 5 566Africa 2 883 535 3 418
of whichSouth Africa 2 310 357 2 667
Middle East 42 0 42Other 1 428 19 992 21 420Total 18 414 25 975 44 389Source: Bank of Botswana
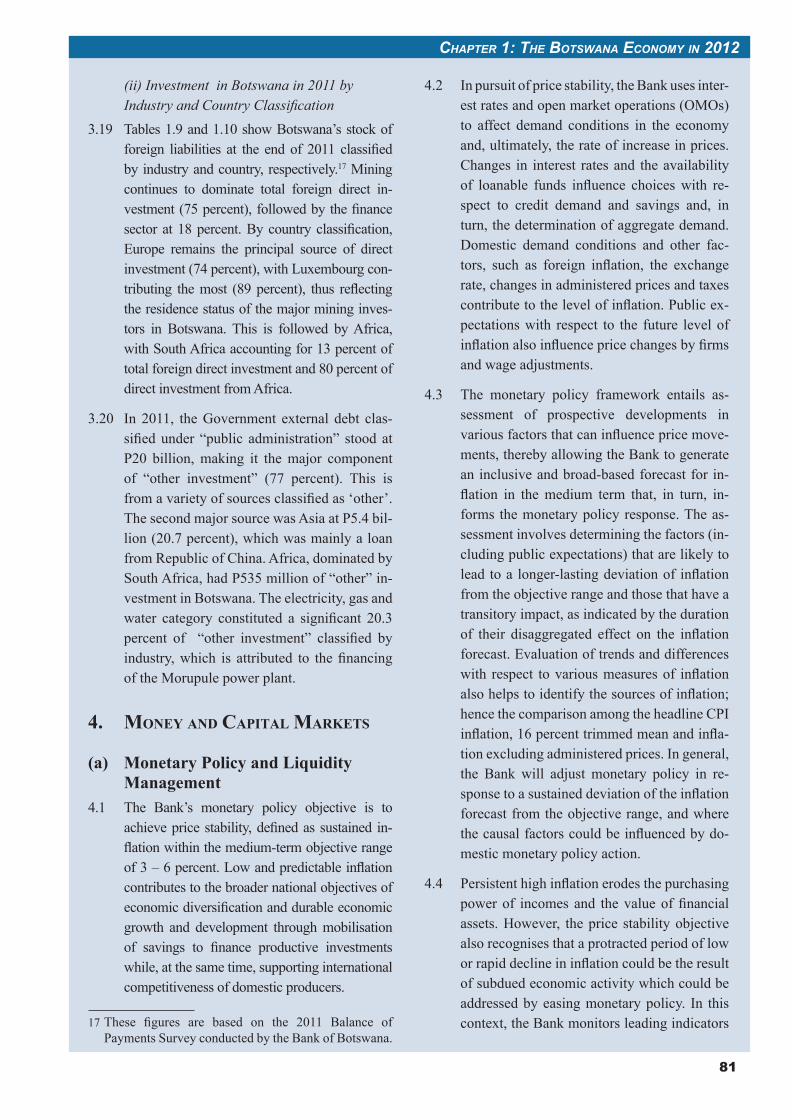
81
CHAPTER 1: THE BOTSWANA ECONOMY IN 2012
(ii) Investment in Botswana in 2011 by
3.19 Tables 1.9 and 1.10 show Botswana’s stock of foreign liabilities at the end of 2011 classified by industry and country, respectively.17 Mining continues to dominate total foreign direct in-vestment (75 percent), followed by the finance sector at 18 percent. By country classification, Europe remains the principal source of direct investment (74 percent), with Luxembourg con-tributing the most (89 percent), thus reflecting the residence status of the major mining inves-tors in Botswana. This is followed by Africa, with South Africa accounting for 13 percent of total foreign direct investment and 80 percent of direct investment from Africa.
3.20 In 2011, the Government external debt clas-sified under “public administration” stood at P20 billion, making it the major component of “other investment” (77 percent). This is from a variety of sources classified as ‘other’.The second major source was Asia at P5.4 bil-lion (20.7 percent), which was mainly a loan from Republic of China. Africa, dominated by South Africa, had P535 million of “other” in-vestment in Botswana. The electricity, gas and water category constituted a significant 20.3 percent of “other investment” classified by industry, which is attributed to the financing of the Morupule power plant.
4. MONEY AND CAPITAL MARKETS
(a) Monetary Policy and Liquidity Management
4.1 The Bank’s monetary policy objective is to achieve price stability, defined as sustained in-flation within the medium-term objective range of 3 – 6 percent. Low and predictable inflation contributes to the broader national objectives of economic diversification and durable economic growth and development through mobilisation of savings to finance productive investments while, at the same time, supporting international competitiveness of domestic producers.
17 These figures are based on the 2011 Balance of Payments Survey conducted by the Bank of Botswana.
4.2 In pursuit of price stability, the Bank uses inter-est rates and open market operations (OMOs) to affect demand conditions in the economy and, ultimately, the rate of increase in prices. Changes in interest rates and the availability of loanable funds influence choices with re-spect to credit demand and savings and, in turn, the determination of aggregate demand. Domestic demand conditions and other fac-tors, such as foreign inflation, the exchange rate, changes in administered prices and taxes contribute to the level of inflation. Public ex-pectations with respect to the future level of inflation also influence price changes by firms and wage adjustments.
4.3 The monetary policy framework entails as-sessment of prospective developments in various factors that can influence price move-ments, thereby allowing the Bank to generate an inclusive and broad-based forecast for in-flation in the medium term that, in turn, in-forms the monetary policy response. The as-sessment involves determining the factors (in-cluding public expectations) that are likely to lead to a longer-lasting deviation of inflation from the objective range and those that have a transitory impact, as indicated by the duration of their disaggregated effect on the inflation forecast. Evaluation of trends and differences with respect to various measures of inflation also helps to identify the sources of inflation; hence the comparison among the headline CPI inflation, 16 percent trimmed mean and infla-tion excluding administered prices. In general, the Bank will adjust monetary policy in re-sponse to a sustained deviation of the inflation forecast from the objective range, and where the causal factors could be influenced by do-mestic monetary policy action.
4.4 Persistent high inflation erodes the purchasing power of incomes and the value of financial assets. However, the price stability objective also recognises that a protracted period of low or rapid decline in inflation could be the result of subdued economic activity which could be addressed by easing monetary policy. In this context, the Bank monitors leading indicators
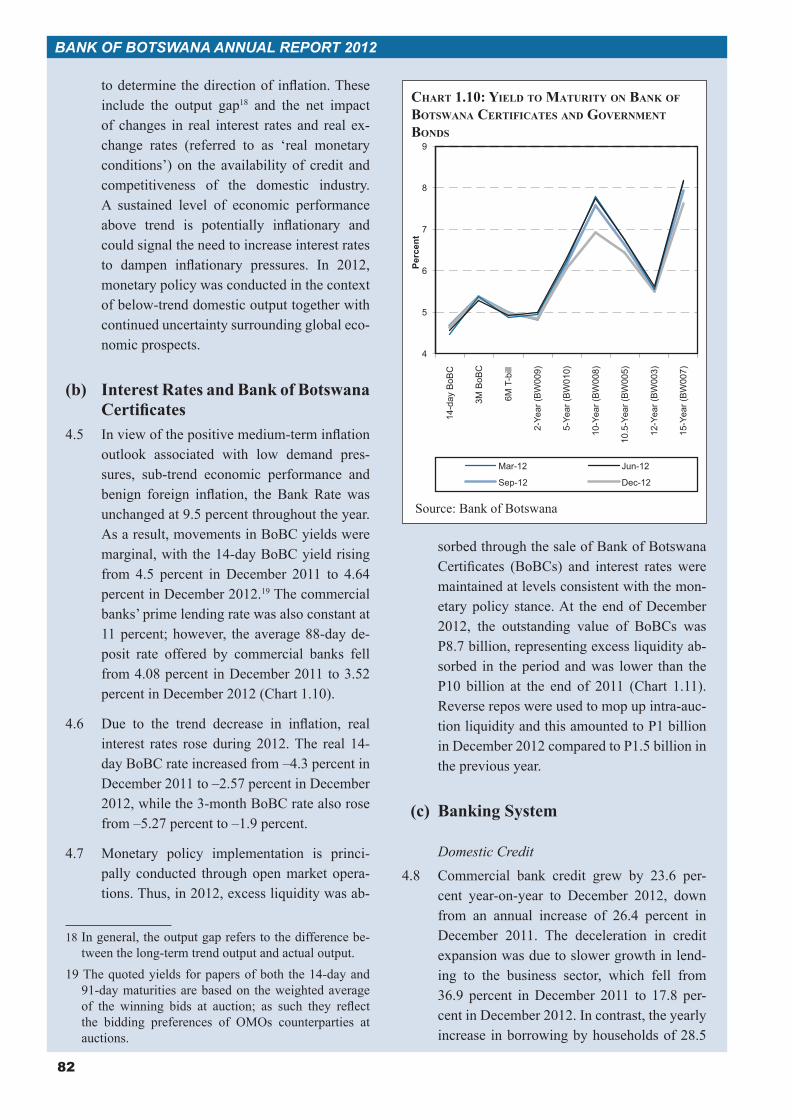
82
BanK oF Botswana annUaL report 2012
todeterminethedirectionofinflation.Theseinclude the output gap18 and the net impact of changes in real interest rates and real ex-change rates (referred to as ‘real monetary conditions’) on the availability of credit and competitiveness of the domestic industry. A sustained level of economic performance above trend is potentially inflationary andcould signal the need to increase interest rates to dampen inflationary pressures. In 2012,monetary policy was conducted in the context of below-trend domestic output together with continued uncertainty surrounding global eco-nomic prospects.
(b) InterestRatesandBankofBotswanaCertificates
4.5 Inviewofthepositivemedium-terminflationoutlook associated with low demand pres-sures, sub-trend economic performance and benign foreign inflation, the Bank Ratewasunchanged at 9.5 percent throughout the year. As a result, movements in BoBC yields were marginal, with the 14-day BoBC yield rising from 4.5 percent in December 2011 to 4.64 percent in December 2012.19 The commercial banks’ prime lending rate was also constant at 11 percent; however, the average 88-day de-posit rate offered by commercial banks fell from 4.08 percent in December 2011 to 3.52 percent in December 2012 (Chart 1.10).
4.6 Due to the trend decrease in inflation, realinterest rates rose during 2012. The real 14-day BoBC rate increased from –4.3 percent in December2011to–2.57percentinDecember2012, while the 3-month BoBC rate also rose from–5.27percentto–1.9percent.
4.7 Monetary policy implementation is princi-pally conducted through open market opera-tions. Thus, in 2012, excess liquidity was ab-
18 In general, the output gap refers to the difference be-tween the long-term trend output and actual output.
19 The quoted yields for papers of both the 14-day and 91-day maturities are based on the weighted average of the winning bids at auction; as such they reflectthe bidding preferences of OMOs counterparties at auctions.
sorbed through the sale of Bank of Botswana Certificates (BoBCs) and interest ratesweremaintained at levels consistent with the mon-etary policy stance. At the end of December 2012, the outstanding value of BoBCs was P8.7billion,representingexcessliquidityab-sorbed in the period and was lower than the P10 billion at the end of 2011 (Chart 1.11). Reversereposwereusedtomopupintra-auc-tion liquidity and this amounted to P1 billion in December 2012 compared to P1.5 billion in the previous year.
(c) BankingSystem
Domestic Credit4.8 Commercial bank credit grew by 23.6 per-
cent year-on-year to December 2012, down from an annual increase of 26.4 percent in December 2011. The deceleration in credit expansion was due to slower growth in lend-ing to the business sector, which fell from 36.9 percent inDecember 2011 to 17.8 per-cent in December 2012. In contrast, the yearly increase in borrowing by households of 28.5
Chart 1.10: yield to maturity on Bank of Botswana CertifiCates and government Bonds
Chart 1.10: Yield to Maturity on Bank of Botswana Certificates and Government Bonds
4
5
6
7
8
9
14-d
ay B
oBC
3M B
oBC
6M T
-bill
2-Ye
ar (B
W00
9)
5-Ye
ar (B
W01
0)
10-Y
ear (
BW
008)
10.5
-Yea
r (B
W00
5)
12-Y
ear (
BW
003)
15-Y
ear (
BW
007)
Perc
ent
Mar-12 Jun-12Sep-12 Dec-12
Source: Bank of Botswana
4
5
6
7
8
9
14-d
ay B
oBC
3M B
oBC
6MT-
bill
2-Ye
ar (B
W00
9)
5-Ye
ar (B
W01
0)
10-Y
ear (
BW
008)
10.5
-Yea
r (B
W00
5)
12-Y
ear (
BW
003)
15-Y
ear (
BW
007)
Perc
ent
Mar-12 Jun-12
Sep-12 Dec-12
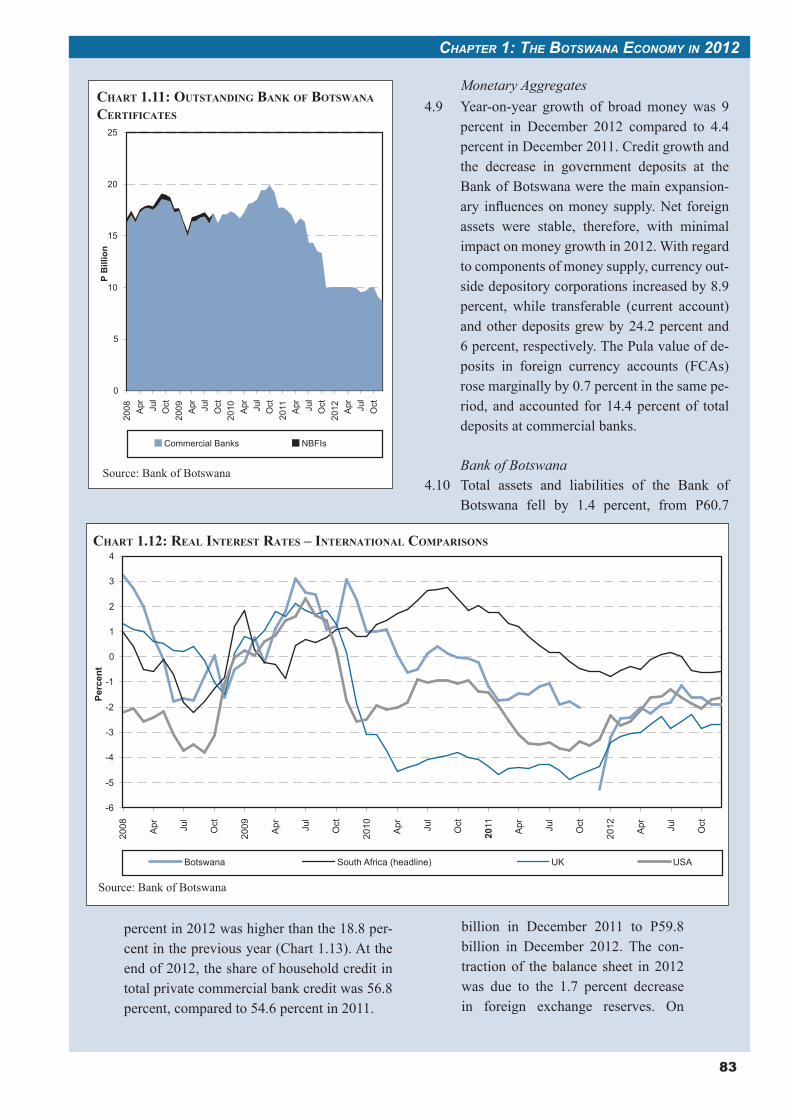
83
CHAPTER 1: THE BOTSWANA ECONOMY IN 2012
percent in 2012 was higher than the 18.8 per-cent in the previous year (Chart 1.13). At the end of 2012, the share of household credit in total private commercial bank credit was 56.8 percent, compared to 54.6 percent in 2011.
Monetary Aggregates4.9 Year-on-year growth of broad money was 9
percent in December 2012 compared to 4.4 percent in December 2011. Credit growth and the decrease in government deposits at the Bank of Botswana were the main expansion-ary influences on money supply. Net foreign assets were stable, therefore, with minimal impact on money growth in 2012. With regard to components of money supply, currency out-side depository corporations increased by 8.9 percent, while transferable (current account) and other deposits grew by 24.2 percent and 6 percent, respectively. The Pula value of de-posits in foreign currency accounts (FCAs) rose marginally by 0.7 percent in the same pe-riod, and accounted for 14.4 percent of total deposits at commercial banks.
Bank of Botswana4.10 Total assets and liabilities of the Bank of
Botswana fell by 1.4 percent, from P60.7
CHART 1.11: OUTSTANDING BANK OF BOTSWANA CERTIFICATES
Source: Bank of Botswana
CHART 1.12: REAL INTEREST RATES – INTERNATIONAL COMPARISONS
Source: Bank of Botswana
billion in December 2011 to P59.8 billion in December 2012. The con-traction of the balance sheet in 2012 was due to the 1.7 percent decrease in foreign exchange reserves. On
0
5
10
15
20
2520
08 Apr Ju
lO
ct20
09 Apr Ju
lO
ct20
10 Apr Ju
lO
ct20
11 Apr Ju
lO
ct20
12 Apr Ju
lO
ct
P B
illio
n
Commercial Banks NBFIs
-6
-5
-4
-3
-2
-1
0
1
2
3
4
2008 Apr Ju
l
Oct
2009 Apr Ju
l
Oct
2010 Apr Ju
l
Oct
2011 Apr Ju
l
Oct
2012 Apr Ju
l
Oct
Perc
ent
Botswana South Africa (headline) UK USA
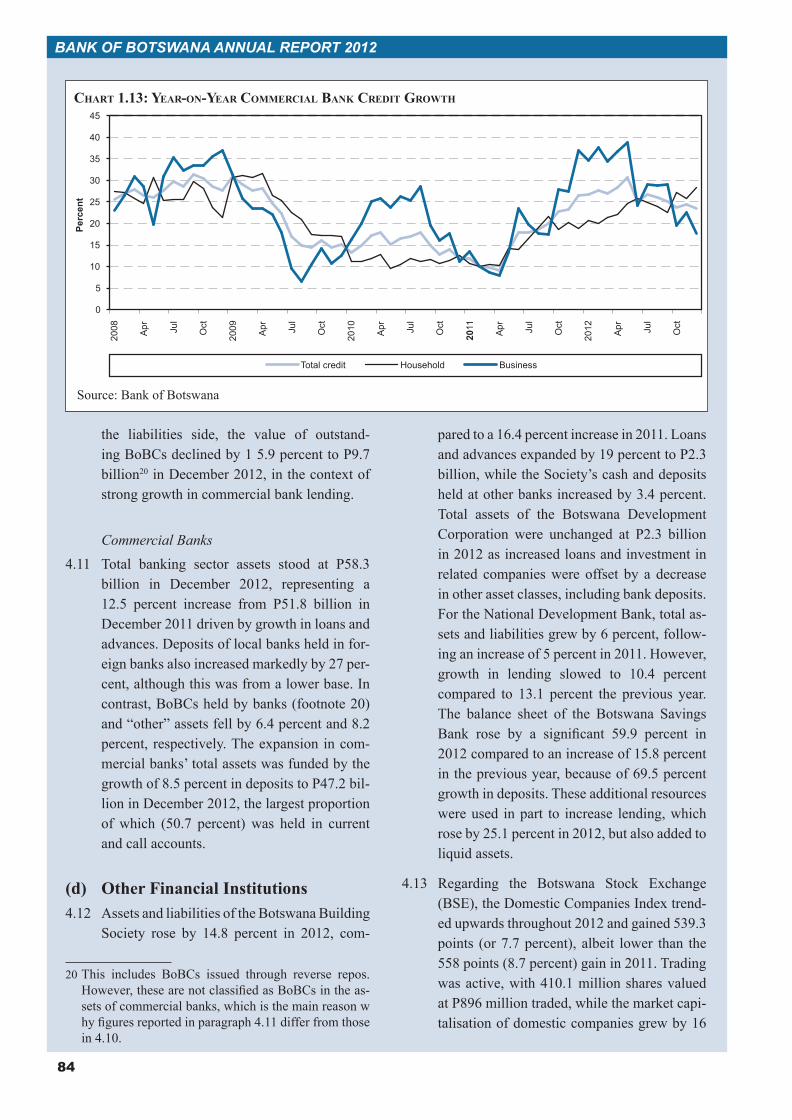
84
BANK OF BOTSWANA ANNUAL REPORT 2012
the liabilities side, the value of outstand-ing BoBCs declined by 1 5.9 percent to P9.7 billion20 in December 2012, in the context of strong growth in commercial bank lending.
Commercial Banks4.11 Total banking sector assets stood at P58.3
billion in December 2012, representing a 12.5 percent increase from P51.8 billion in December 2011 driven by growth in loans and advances. Deposits of local banks held in for-eign banks also increased markedly by 27 per-cent, although this was from a lower base. In contrast, BoBCs held by banks (footnote 20) and “other” assets fell by 6.4 percent and 8.2 percent, respectively. The expansion in com-mercial banks’ total assets was funded by the growth of 8.5 percent in deposits to P47.2 bil-lion in December 2012, the largest proportion of which (50.7 percent) was held in current and call accounts.
(d) Other Financial Institutions4.12 Assets and liabilities of the Botswana Building
Society rose by 14.8 percent in 2012, com-
20 This includes BoBCs issued through reverse repos. However, these are not classified as BoBCs in the as-sets of commercial banks, which is the main reason w hy figures reported in paragraph 4.11 differ from those in 4.10.
pared to a 16.4 percent increase in 2011. Loans and advances expanded by 19 percent to P2.3 billion, while the Society’s cash and deposits held at other banks increased by 3.4 percent. Total assets of the Botswana Development Corporation were unchanged at P2.3 billion in 2012 as increased loans and investment in related companies were offset by a decrease in other asset classes, including bank deposits. For the National Development Bank, total as-sets and liabilities grew by 6 percent, follow-ing an increase of 5 percent in 2011. However, growth in lending slowed to 10.4 percent compared to 13.1 percent the previous year. The balance sheet of the Botswana Savings Bank rose by a significant 59.9 percent in 2012 compared to an increase of 15.8 percent in the previous year, because of 69.5 percent growth in deposits. These additional resources were used in part to increase lending, which rose by 25.1 percent in 2012, but also added to liquid assets.
4.13 Regarding the Botswana Stock Exchange (BSE), the Domestic Companies Index trend-ed upwards throughout 2012 and gained 539.3 points (or 7.7 percent), albeit lower than the 558 points (8.7 percent) gain in 2011. Trading was active, with 410.1 million shares valued at P896 million traded, while the market capi-talisation of domestic companies grew by 16
CHART 1.13: YEAR-ON-YEAR COMMERCIAL BANK CREDIT GROWTH
Source: Bank of Botswana
0
5
10
15
20
25
30
35
40
4520
08 Apr Ju
l
Oct
2009 Apr Ju
l
Oct
2010 Apr Ju
l
Oct
2011 Apr Ju
l
Oct
2012 Apr Ju
l
Oct
Perc
ent
Total credit Household Business
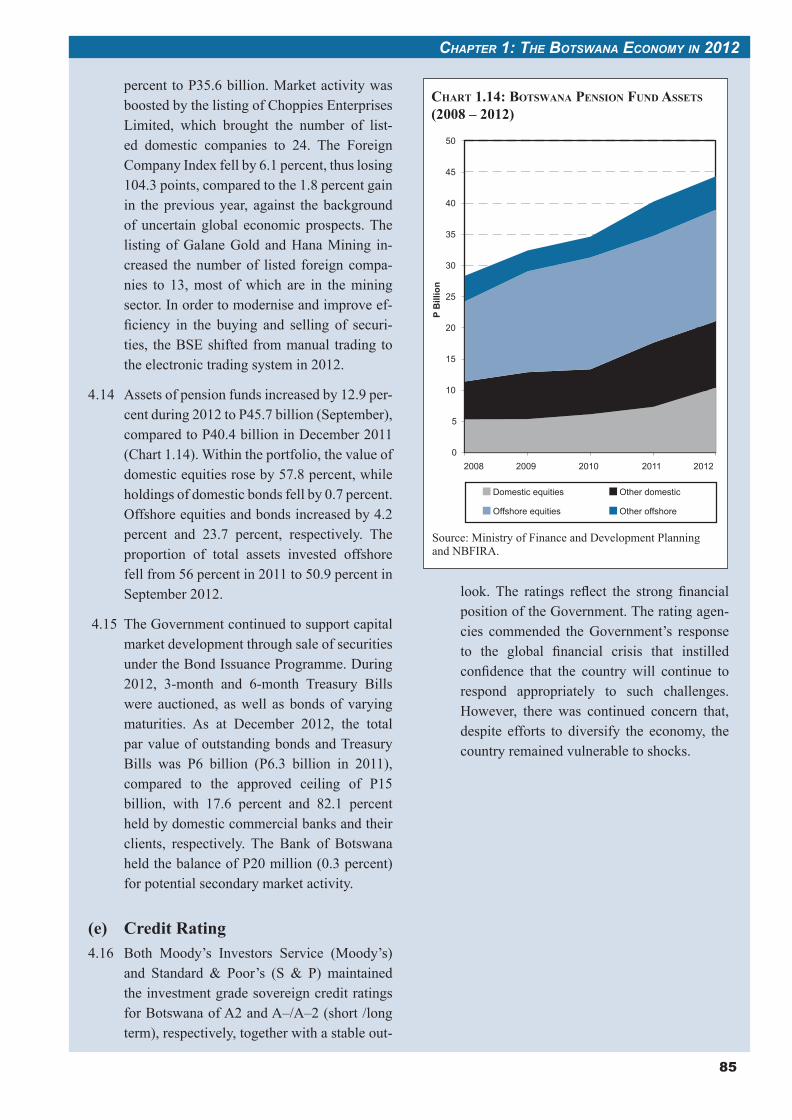
85
CHAPTER 1: THE BOTSWANA ECONOMY IN 2012
percent to P35.6 billion. Market activity was boosted by the listing of Choppies Enterprises Limited, which brought the number of list-ed domestic companies to 24. The Foreign Company Index fell by 6.1 percent, thus losing 104.3 points, compared to the 1.8 percent gain in the previous year, against the background of uncertain global economic prospects. The listing of Galane Gold and Hana Mining in-creased the number of listed foreign compa-nies to 13, most of which are in the mining sector. In order to modernise and improve ef-ficiency in the buying and selling of securi-ties, the BSE shifted from manual trading to the electronic trading system in 2012.
4.14 Assets of pension funds increased by 12.9 per-cent during 2012 to P45.7 billion (September), compared to P40.4 billion in December 2011 (Chart 1.14). Within the portfolio, the value of domestic equities rose by 57.8 percent, while holdings of domestic bonds fell by 0.7 percent. Offshore equities and bonds increased by 4.2 percent and 23.7 percent, respectively. The proportion of total assets invested offshore fell from 56 percent in 2011 to 50.9 percent in September 2012.
4.15 The Government continued to support capital market development through sale of securities under the Bond Issuance Programme. During 2012, 3-month and 6-month Treasury Bills were auctioned, as well as bonds of varying maturities. As at December 2012, the total par value of outstanding bonds and Treasury Bills was P6 billion (P6.3 billion in 2011), compared to the approved ceiling of P15 billion, with 17.6 percent and 82.1 percent held by domestic commercial banks and their clients, respectively. The Bank of Botswana held the balance of P20 million (0.3 percent) for potential secondary market activity.
(e) Credit Rating4.16 Both Moody’s Investors Service (Moody’s)
and Standard & Poor’s (S & P) maintained the investment grade sovereign credit ratings for Botswana of A2 and A–/A–2 (short /long term), respectively, together with a stable out-
look. The ratings reflect the strong financial position of the Government. The rating agen-cies commended the Government’s response to the global financial crisis that instilled confidence that the country will continue to respond appropriately to such challenges. However, there was continued concern that, despite efforts to diversify the economy, the country remained vulnerable to shocks.
CHART 1.14: BOTSWANA PENSION FUND ASSETS (2008 – 2012)
Source: Ministry of Finance and Development Planning and NBFIRA.
0
5
10
15
20
25
30
35
40
45
50
2008 2009 2010 2011 2012
P B
illio
n
Domestic equities Other domestic
Offshore equities Other offshore

87
CHAPTER 2
FISCAL REFORMS: REDUCING RELIANCE OF PUBLIC EXPENDITURE ON MINERAL REVENUES AND SUPPORTING PRIVATE SECTOR
DEVELOPMENT IN BOTSWANA
1.3 Apart from the expected decline in diamond revenues, the country’s fiscal position has been adversely affected by the recent global eco-nomic and financial crisis; a development that has led to a reduction in foreign exchange re-serves, an increase in public debt and a cumu-lative budget deficit of P18.2 billion over the period from April 2009 to March 2012 which is, however, much less than the P32.3 bil-lion that was projected at the start of National Development Plan (NDP) 10. While there is noticeable economic recovery, fears that the global economic crisis will continue to erode long-term world growth prospects and under-mine the potential earnings from commodity exports remain. Therefore, there is need to re-align fiscal policy, in recognition of the dimin-ishing role of diamond revenues, as an anchor for public spending. This provides a basis for reviewing the linkage of public expenditure to exhaustible mineral revenues. Even in the ab-sence of these adverse developments, attain-ment of fiscal sustainability and the allocation of revenue from natural resource exploitation require appropriate management and monitor-ing mechanisms. Thus, what is necessary are reliable and timely indicators to assess the fis-cal stance and its sustainability; this includes the ability to produce long-term revenue fore-casts, an entrenched commitment to fiscal rules that anchor policy and an enabling insti-tutional setup.
1.4 For resource-rich countries, the importance of focusing on the non-resource primary bal-ance22 has been highlighted (IMF Article IV
22 A non-resource primary balance refers to government net borrowing or net lending (computed from non-re-source revenues), excluding interest payments on con-solidated government liabilities. Thus, it is possible for a country to achieve a zero non-resource primary balance while running a budget deficit as a result of interest payments on past debt. By excluding interest
1. INTRODUCTION
1.1 The theme chapter assesses the policy ap-proaches that could inform Botswana’s strat-egy for long-term fiscal stability and sustain-ability, in view of the forecast decline in the relative importance of mineral revenues in financing government expenditure and the potential fall in SACU receipts. Concurrently, there is need to recognise the desire to limit the size of government in favour of enhanced private sector contribution to inclusive eco-nomic growth.
1.2 Since independence in 1966, Botswana has managed to achieve robust economic growth, graduating from being one of the least devel-oped countries to middle-income status in the late 1980s. The country has been recognised as one of the top performing economies in Africa with relatively high per capita income and, since 2001, it has held the highest sov-ereign credit rating in Africa. Although sound macroeconomic policies, political stabil-ity and good governance are cited as having contributed to this impressive performance, the sustained good economic performance is attributable to the successful exploitation of non-renewable natural resources, particularly diamonds. However, going forward, it is an-ticipated that diamond revenues will decline significantly as a result of resource deple-tion and higher extraction costs.21 In addition, possible structural changes in the Southern African Customs Union (SACU) and trade facilitating reduction of tariffs could result in lower receipts from this source.
21 National Development Plan (NDP) 10 anticipates a 65 percent decrease in diamond revenues by the end of NDP 11 in 2022 and complete depletion by 2029, assuming there are no significant new mining discoveries.
88
BANK OF BOTSWANA ANNUAL REPORT 2012
Reports on Botswana). This approach is con-sidered suitable for countries facing short-lived resource endowments as a source of revenues, which is the case for Botswana. The fiscal rules applicable to non-resource revenues address several challenges, such as macroeconomic volatility, lack of investment in non-resource sectors, and the weakening of economic and political institutions. The ap-proach stresses diversifying the tax base in order to moderate revenue volatility, while encouraging greater public awareness of fiscal constraints. However, the focus on the non-resource primary balance may overly limit the optimal utilisation of mineral revenues, in-cluding support for domestic economic activ-ity, especially when the resource endowment is more durable. In such circumstances, there could be scope to allocate revenues derived from natural resources to finance the develop-ment of infrastructure and to support on-going economic activity in order to build capital for future growth.
1.5 In addressing the issues highlighted above, Section 2 surveys economic performance of resource rich countries; this is followed by a review of Botswana’s fiscal framework in Section 3, including fiscal rules, as well as composition and trends in government reve-nue and expenditure. Key aspects of the coun-try’s fiscal reform programme are presented in Section 4, while Section 5 examines initia-tives to improve private sector contribution in the economy as part of a strategy to reduce the relative size of government in the economy. Section 6 concludes the chapter.
2. NATURAL RESOURCE ABUNDANCE AND ECONOMIC PERFORMANCE
2.1 It is usually postulated that revenue accruing from profitable exploitation of natural resourc-es potentially enables promotion of economic and social development, through reducing in-frastructure gaps and increasing the stock of
payments, the primary balance excludes the impact of past deficits on the fiscal position.
human capital. However, the ultimate benefit depends crucially on maximising rents from the exploitation of such resources, their de-ployment and the prevailing macroeconomic and governance environment; hence, the vast-ly differing performance across countries, and over time, for economies endowed with lucra-tive natural resources. Indeed, several studies find that, in general, resource-rich countries experience slower growth and weaker social indicators than the relatively resource-poor nations (Table 2.1; Box 2.1), thus showing what is commonly referred to as ‘resource curse’. This describes a situation where eco-nomic performance is undermined rather than boosted by availability of natural resources. In the circumstances, the resource engenders social tensions, governance problems and economic distortions that hamper economic growth.
2.2 However, there are outstanding examples of countries that have been successful in har-nessing returns from natural resources, in terms of raising living standards and sustain-able growth. Even then, there are cases where the dominance and dependence on the natu-ral resource sector has been persistent (Chart 2.1), with minimal progress in economic di-versification, in this way suggesting weak prospects for long-term economic perform-ance post depletion of natural resource. Below is a brief description of factors that could fuel the resource curse and persistence of a mono-culture economy.
Dutch Disease2.3 ‘Dutch Disease’23 refers to a situation where
persistent dominance of the profitable natural resource sector results in the contraction of ac-tivity in other sectors and this could be propa-gated through three channels:
23 The term “Dutch Disease” originates from the eco-nomic experience in the Netherlands in the 1960s that resulted from discovery of substantial natural gas de-posits in the North Sea. The newfound wealth caused the Dutch currency to appreciate, thus making exports and import substitutes of all non-oil products less competitive.
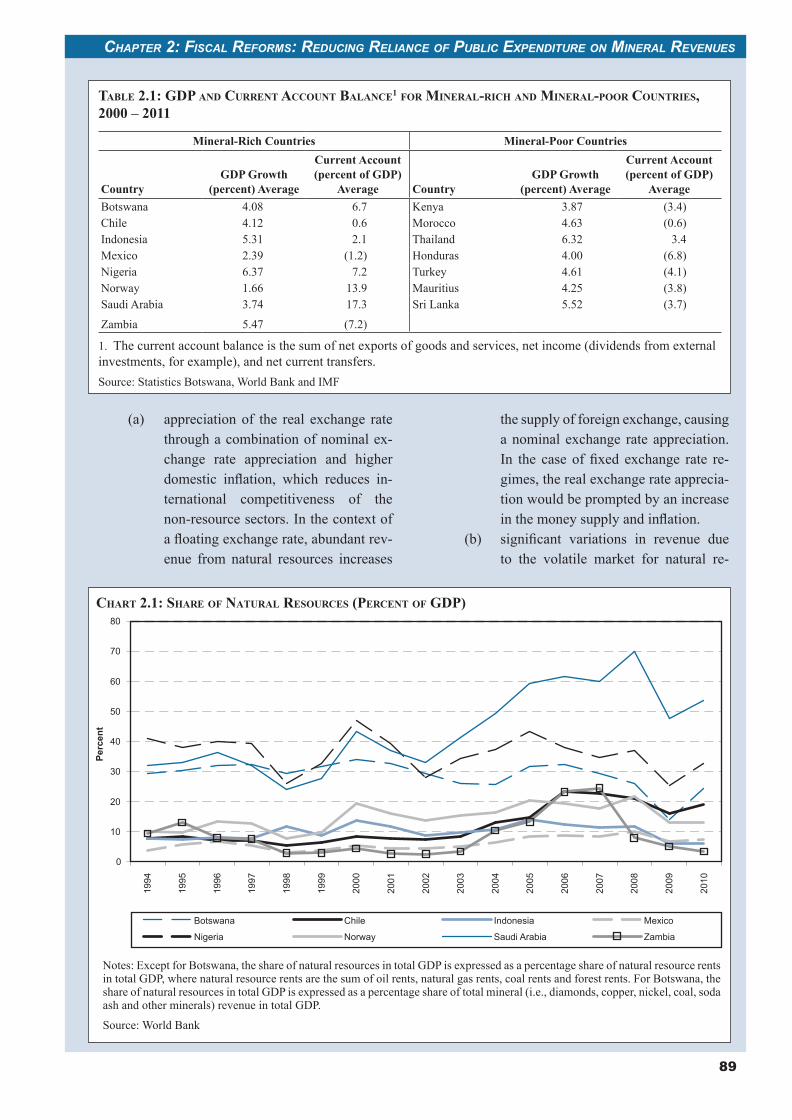
89
CHAPTER 2: FISCAL REFORMS: REDUCING RELIANCE OF PUBLIC EXPENDITURE ON MINERAL REVENUES
(a) appreciation of the real exchange rate through a combination of nominal ex-change rate appreciation and higher domestic inflation, which reduces in-ternational competitiveness of the non-resource sectors. In the context of a floating exchange rate, abundant rev-enue from natural resources increases
the supply of foreign exchange, causing a nominal exchange rate appreciation. In the case of fixed exchange rate re-gimes, the real exchange rate apprecia-tion would be prompted by an increase in the money supply and inflation.
(b) significant variations in revenue due to the volatile market for natural re-
TABLE 2.1: GDP AND CURRENT ACCOUNT BALANCE1 FOR MINERAL-RICH AND MINERAL-POOR COUNTRIES, 2000 – 2011
Mineral-Rich Countries Mineral-Poor Countries
CountryGDP Growth
(percent) Average
Current Account (percent of GDP)
Average CountryGDP Growth
(percent) Average
Current Account (percent of GDP)
Average Botswana 4.08 6.7 Kenya 3.87 (3.4)Chile 4.12 0.6 Morocco 4.63 (0.6)Indonesia 5.31 2.1 Thailand 6.32 3.4Mexico 2.39 (1.2) Honduras 4.00 (6.8)Nigeria 6.37 7.2 Turkey 4.61 (4.1)Norway 1.66 13.9 Mauritius 4.25 (3.8)Saudi Arabia 3.74 17.3 Sri Lanka 5.52 (3.7)
Zambia 5.47 (7.2)
1. The current account balance is the sum of net exports of goods and services, net income (dividends from external investments, for example), and net current transfers.Source: Statistics Botswana, World Bank and IMF
CHART 2.1: SHARE OF NATURAL RESOURCES (PERCENT OF GDP)
Notes: Except for Botswana, the share of natural resources in total GDP is expressed as a percentage share of natural resource rents in total GDP, where natural resource rents are the sum of oil rents, natural gas rents, coal rents and forest rents. For Botswana, the share of natural resources in total GDP is expressed as a percentage share of total mineral (i.e., diamonds, copper, nickel, coal, soda ash and other minerals) revenue in total GDP.
Source: World Bank
0
10
20
30
40
50
60
70
80
1994
1995
1996
1997
1998
1999
2000
2001
2002
2003
2004
2005
2006
2007
2008
2009
2010
Perc
ent
Botswana Chile Indonesia Mexico
Nigeria Norway Saudi Arabia Zambia
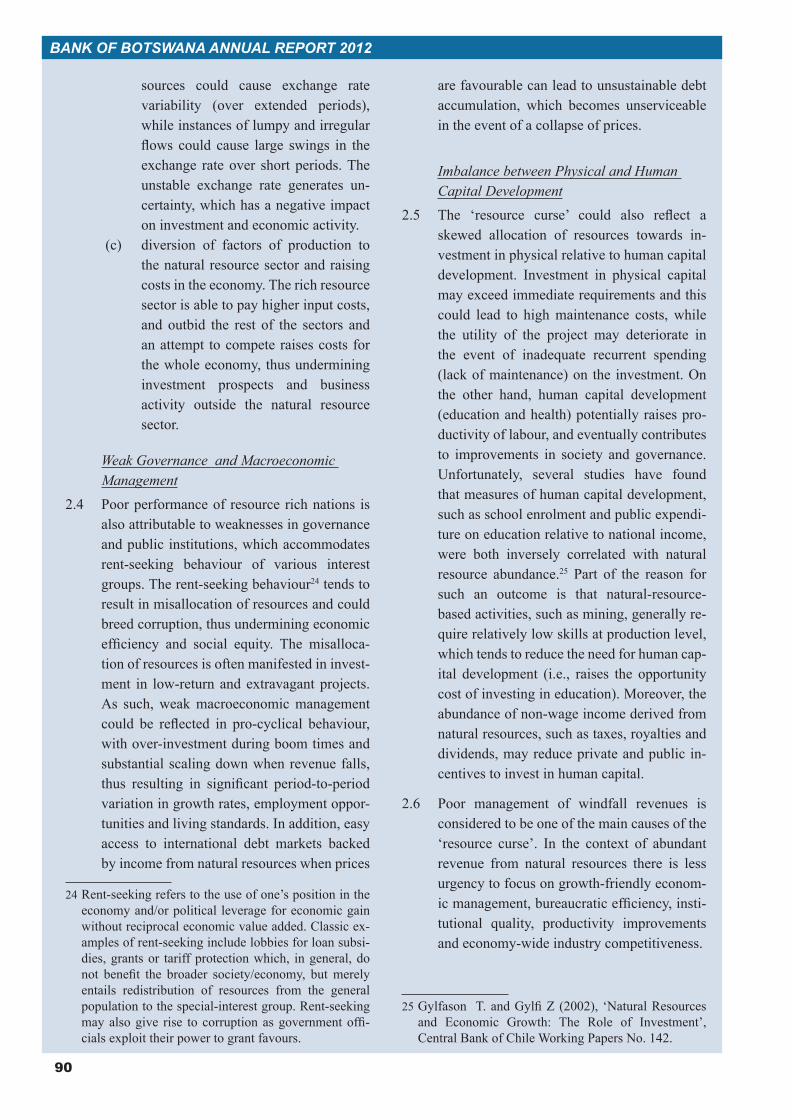
90
BANK OF BOTSWANA ANNUAL REPORT 2012
sources could cause exchange rate variability (over extended periods), while instances of lumpy and irregular flows could cause large swings in the exchange rate over short periods. The unstable exchange rate generates un-certainty, which has a negative impact on investment and economic activity.
(c) diversion of factors of production to the natural resource sector and raising costs in the economy. The rich resource sector is able to pay higher input costs, and outbid the rest of the sectors and an attempt to compete raises costs for the whole economy, thus undermining investment prospects and business activity outside the natural resource sector.
Weak Governance and Macroeconomic Management
2.4 Poor performance of resource rich nations is also attributable to weaknesses in governance and public institutions, which accommodates rent-seeking behaviour of various interest groups. The rent-seeking behaviour24 tends to result in misallocation of resources and could breed corruption, thus undermining economic efficiency and social equity. The misalloca-tion of resources is often manifested in invest-ment in low-return and extravagant projects. As such, weak macroeconomic management could be reflected in pro-cyclical behaviour, with over-investment during boom times and substantial scaling down when revenue falls, thus resulting in significant period-to-period variation in growth rates, employment oppor-tunities and living standards. In addition, easy access to international debt markets backed by income from natural resources when prices
24 Rent-seeking refers to the use of one’s position in the economy and/or political leverage for economic gain without reciprocal economic value added. Classic ex-amples of rent-seeking include lobbies for loan subsi-dies, grants or tariff protection which, in general, do not benefit the broader society/economy, but merely entails redistribution of resources from the general population to the special-interest group. Rent-seeking may also give rise to corruption as government offi-cials exploit their power to grant favours.
are favourable can lead to unsustainable debt accumulation, which becomes unserviceable in the event of a collapse of prices.
Imbalance between Physical and Human Capital Development
2.5 The ‘resource curse’ could also reflect a skewed allocation of resources towards in-vestment in physical relative to human capital development. Investment in physical capital may exceed immediate requirements and this could lead to high maintenance costs, while the utility of the project may deteriorate in the event of inadequate recurrent spending (lack of maintenance) on the investment. On the other hand, human capital development (education and health) potentially raises pro-ductivity of labour, and eventually contributes to improvements in society and governance. Unfortunately, several studies have found that measures of human capital development, such as school enrolment and public expendi-ture on education relative to national income, were both inversely correlated with natural resource abundance.25 Part of the reason for such an outcome is that natural-resource-based activities, such as mining, generally re-quire relatively low skills at production level, which tends to reduce the need for human cap-ital development (i.e., raises the opportunity cost of investing in education). Moreover, the abundance of non-wage income derived from natural resources, such as taxes, royalties and dividends, may reduce private and public in-centives to invest in human capital.
2.6 Poor management of windfall revenues is considered to be one of the main causes of the ‘resource curse’. In the context of abundant revenue from natural resources there is less urgency to focus on growth-friendly econom-ic management, bureaucratic efficiency, insti-tutional quality, productivity improvements and economy-wide industry competitiveness.
25 Gylfason T. and Gylfi Z (2002), ‘Natural Resources and Economic Growth: The Role of Investment’, Central Bank of Chile Working Papers No. 142.
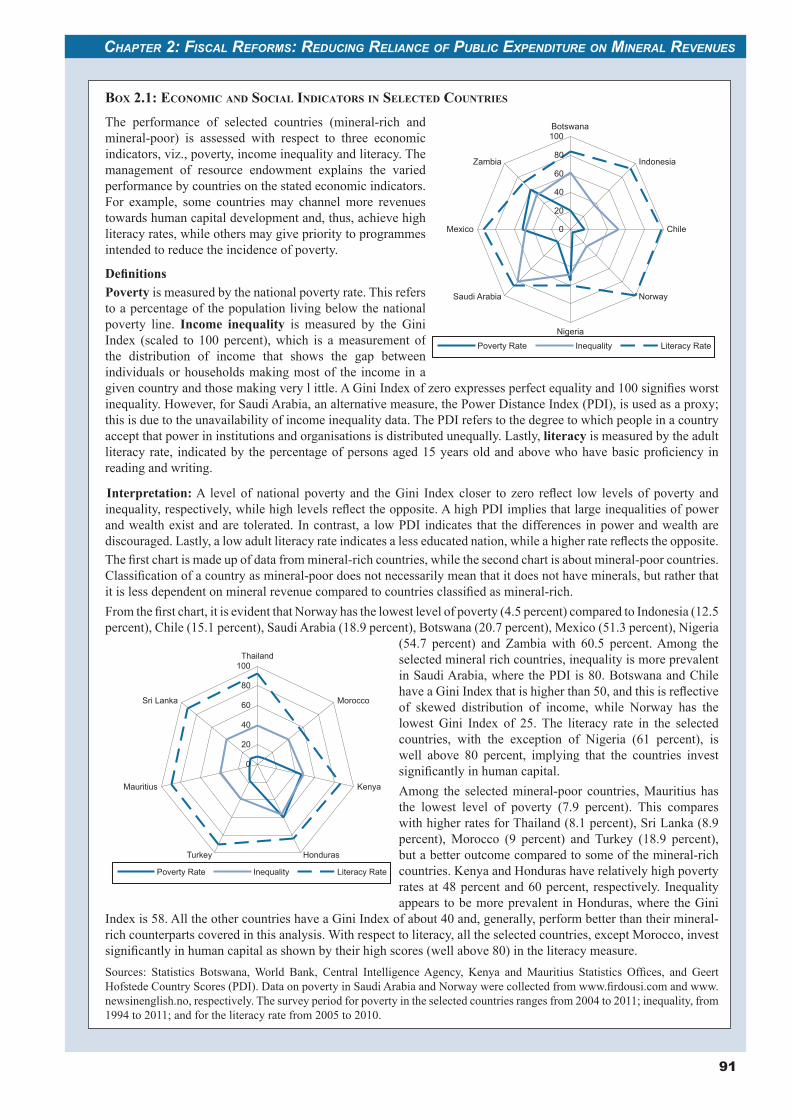
91
CHAPTER 2: FISCAL REFORMS: REDUCING RELIANCE OF PUBLIC EXPENDITURE ON MINERAL REVENUES
BOX 2.1: ECONOMIC AND SOCIAL INDICATORS IN SELECTED COUNTRIES
The performance of selected countries (mineral-rich and mineral-poor) is assessed with respect to three economic indicators, viz., poverty, income inequality and literacy. The management of resource endowment explains the varied performance by countries on the stated economic indicators. For example, some countries may channel more revenues towards human capital development and, thus, achieve high literacy rates, while others may give priority to programmes intended to reduce the incidence of poverty.
Poverty is measured by the national poverty rate. This refers to a percentage of the population living below the national poverty line. Income inequality is measured by the Gini Index (scaled to 100 percent), which is a measurement of the distribution of income that shows the gap between individuals or households making most of the income in a given country and those making very l ittle. A Gini Index of zero expresses perfect equality and 100 signifies worst inequality. However, for Saudi Arabia, an alternative measure, the Power Distance Index (PDI), is used as a proxy; this is due to the unavailability of income inequality data. The PDI refers to the degree to which people in a country accept that power in institutions and organisations is distributed unequally. Lastly, literacy is measured by the adult literacy rate, indicated by the percentage of persons aged 15 years old and above who have basic proficiency in reading and writing.
Interpretation: A level of national poverty and the Gini Index closer to zero reflect low levels of poverty and inequality, respectively, while high levels reflect the opposite. A high PDI implies that large inequalities of power and wealth exist and are tolerated. In contrast, a low PDI indicates that the differences in power and wealth are discouraged. Lastly, a low adult literacy rate indicates a less educated nation, while a higher rate reflects the opposite.The first chart is made up of data from mineral-rich countries, while the second chart is about mineral-poor countries. Classification of a country as mineral-poor does not necessarily mean that it does not have minerals, but rather that it is less dependent on mineral revenue compared to countries classified as mineral-rich. From the first chart, it is evident that Norway has the lowest level of poverty (4.5 percent) compared to Indonesia (12.5 percent), Chile (15.1 percent), Saudi Arabia (18.9 percent), Botswana (20.7 percent), Mexico (51.3 percent), Nigeria
(54.7 percent) and Zambia with 60.5 percent. Among the selected mineral rich countries, inequality is more prevalent in Saudi Arabia, where the PDI is 80. Botswana and Chile have a Gini Index that is higher than 50, and this is reflective of skewed distribution of income, while Norway has the lowest Gini Index of 25. The literacy rate in the selected countries, with the exception of Nigeria (61 percent), is well above 80 percent, implying that the countries invest significantly in human capital.Among the selected mineral-poor countries, Mauritius has the lowest level of poverty (7.9 percent). This compares with higher rates for Thailand (8.1 percent), Sri Lanka (8.9 percent), Morocco (9 percent) and Turkey (18.9 percent), but a better outcome compared to some of the mineral-rich countries. Kenya and Honduras have relatively high poverty rates at 48 percent and 60 percent, respectively. Inequality appears to be more prevalent in Honduras, where the Gini
Index is 58. All the other countries have a Gini Index of about 40 and, generally, perform better than their mineral-rich counterparts covered in this analysis. With respect to literacy, all the selected countries, except Morocco, invest significantly in human capital as shown by their high scores (well above 80) in the literacy measure.Sources: Statistics Botswana, World Bank, Central Intelligence Agency, Kenya and Mauritius Statistics Offices, and Geert Hofstede Country Scores (PDI). Data on poverty in Saudi Arabia and Norway were collected from www.firdousi.com and www.newsinenglish.no, respectively. The survey period for poverty in the selected countries ranges from 2004 to 2011; inequality, from 1994 to 2011; and for the literacy rate from 2005 to 2010.
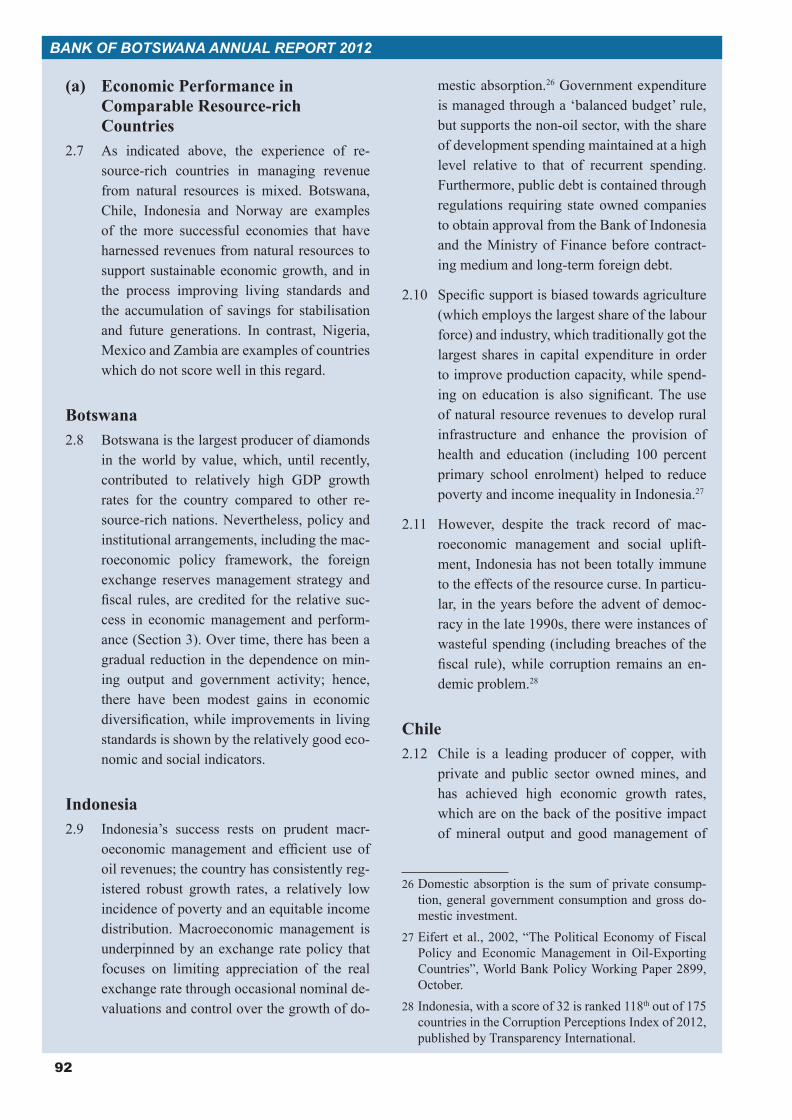
92
BANK OF BOTSWANA ANNUAL REPORT 2012
(a) Economic Performance in Comparable Resource-rich Countries
2.7 As indicated above, the experience of re-source-rich countries in managing revenue from natural resources is mixed. Botswana, Chile, Indonesia and Norway are examples of the more successful economies that have harnessed revenues from natural resources to support sustainable economic growth, and in the process improving living standards and the accumulation of savings for stabilisation and future generations. In contrast, Nigeria, Mexico and Zambia are examples of countries which do not score well in this regard.
Botswana2.8 Botswana is the largest producer of diamonds
in the world by value, which, until recently, contributed to relatively high GDP growth rates for the country compared to other re-source-rich nations. Nevertheless, policy and institutional arrangements, including the mac-roeconomic policy framework, the foreign exchange reserves management strategy and fiscal rules, are credited for the relative suc-cess in economic management and perform-ance (Section 3). Over time, there has been a gradual reduction in the dependence on min-ing output and government activity; hence, there have been modest gains in economic diversification, while improvements in living standards is shown by the relatively good eco-nomic and social indicators.
Indonesia2.9 Indonesia’s success rests on prudent macr-
oeconomic management and efficient use of oil revenues; the country has consistently reg-istered robust growth rates, a relatively low incidence of poverty and an equitable income distribution. Macroeconomic management is underpinned by an exchange rate policy that focuses on limiting appreciation of the real exchange rate through occasional nominal de-valuations and control over the growth of do-
mestic absorption.26 Government expenditure is managed through a ‘balanced budget’ rule, but supports the non-oil sector, with the share of development spending maintained at a high level relative to that of recurrent spending. Furthermore, public debt is contained through regulations requiring state owned companies to obtain approval from the Bank of Indonesia and the Ministry of Finance before contract-ing medium and long-term foreign debt.
2.10 Specific support is biased towards agriculture (which employs the largest share of the labour force) and industry, which traditionally got the largest shares in capital expenditure in order to improve production capacity, while spend-ing on education is also significant. The use of natural resource revenues to develop rural infrastructure and enhance the provision of health and education (including 100 percent primary school enrolment) helped to reduce poverty and income inequality in Indonesia.27
2.11 However, despite the track record of mac-roeconomic management and social uplift-ment, Indonesia has not been totally immune to the effects of the resource curse. In particu-lar, in the years before the advent of democ-racy in the late 1990s, there were instances of wasteful spending (including breaches of the fiscal rule), while corruption remains an en-demic problem.28
Chile2.12 Chile is a leading producer of copper, with
private and public sector owned mines, and has achieved high economic growth rates, which are on the back of the positive impact of mineral output and good management of
26 Domestic absorption is the sum of private consump-tion, general government consumption and gross do-mestic investment.
27 Eifert et al., 2002, “The Political Economy of Fiscal Policy and Economic Management in Oil-Exporting Countries”, World Bank Policy Working Paper 2899, October.
28 Indonesia, with a score of 32 is ranked 118th out of 175 countries in the Corruption Perceptions Index of 2012, published by Transparency International.
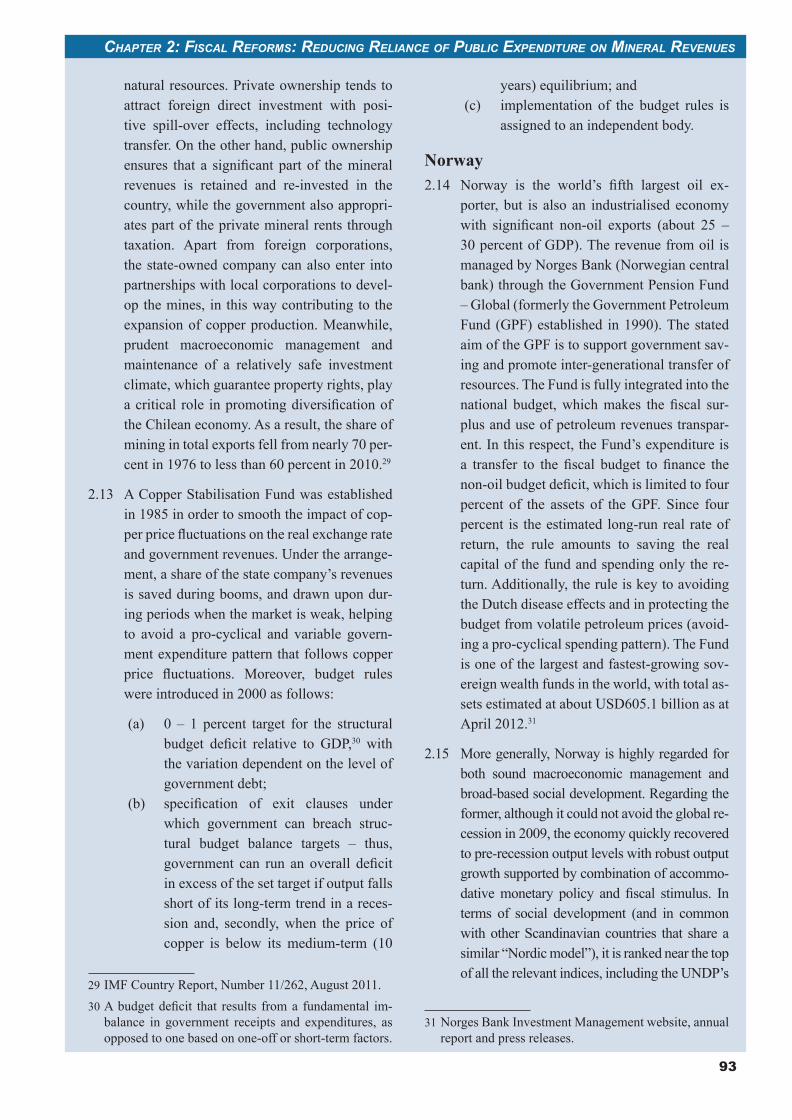
93
CHAPTER 2: FISCAL REFORMS: REDUCING RELIANCE OF PUBLIC EXPENDITURE ON MINERAL REVENUES
natural resources. Private ownership tends to attract foreign direct investment with posi-tive spill-over effects, including technology transfer. On the other hand, public ownership ensures that a significant part of the mineral revenues is retained and re-invested in the country, while the government also appropri-ates part of the private mineral rents through taxation. Apart from foreign corporations, the state-owned company can also enter into partnerships with local corporations to devel-op the mines, in this way contributing to the expansion of copper production. Meanwhile, prudent macroeconomic management and maintenance of a relatively safe investment climate, which guarantee property rights, play a critical role in promoting diversification of the Chilean economy. As a result, the share of mining in total exports fell from nearly 70 per-cent in 1976 to less than 60 percent in 2010.29
2.13 A Copper Stabilisation Fund was established in 1985 in order to smooth the impact of cop-per price fluctuations on the real exchange rate and government revenues. Under the arrange-ment, a share of the state company’s revenues is saved during booms, and drawn upon dur-ing periods when the market is weak, helping to avoid a pro-cyclical and variable govern-ment expenditure pattern that follows copper price fluctuations. Moreover, budget rules were introduced in 2000 as follows:
(a) 0 – 1 percent target for the structural budget deficit relative to GDP,30 with the variation dependent on the level of government debt;
(b) specification of exit clauses under which government can breach struc-tural budget balance targets – thus, government can run an overall deficit in excess of the set target if output falls short of its long-term trend in a reces-sion and, secondly, when the price of copper is below its medium-term (10
29 IMF Country Report, Number 11/262, August 2011.30 A budget deficit that results from a fundamental im-
balance in government receipts and expenditures, as opposed to one based on one-off or short-term factors.
years) equilibrium; and(c) implementation of the budget rules is
assigned to an independent body.
Norway2.14 Norway is the world’s fifth largest oil ex-
porter, but is also an industrialised economy with significant non-oil exports (about 25 – 30 percent of GDP). The revenue from oil is managed by Norges Bank (Norwegian central bank) through the Government Pension Fund – Global (formerly the Government Petroleum Fund (GPF) established in 1990). The stated aim of the GPF is to support government sav-ing and promote inter-generational transfer of resources. The Fund is fully integrated into the national budget, which makes the fiscal sur-plus and use of petroleum revenues transpar-ent. In this respect, the Fund’s expenditure is a transfer to the fiscal budget to finance the non-oil budget deficit, which is limited to four percent of the assets of the GPF. Since four percent is the estimated long-run real rate of return, the rule amounts to saving the real capital of the fund and spending only the re-turn. Additionally, the rule is key to avoiding the Dutch disease effects and in protecting the budget from volatile petroleum prices (avoid-ing a pro-cyclical spending pattern). The Fund is one of the largest and fastest-growing sov-ereign wealth funds in the world, with total as-sets estimated at about USD605.1 billion as at April 2012.31
2.15 More generally, Norway is highly regarded for both sound macroeconomic management and broad-based social development. Regarding the former, although it could not avoid the global re-cession in 2009, the economy quickly recovered to pre-recession output levels with robust output growth supported by combination of accommo-dative monetary policy and fiscal stimulus. In terms of social development (and in common with other Scandinavian countries that share a similar “Nordic model”), it is ranked near the top of all the relevant indices, including the UNDP’s
31 Norges Bank Investment Management website, annual report and press releases.
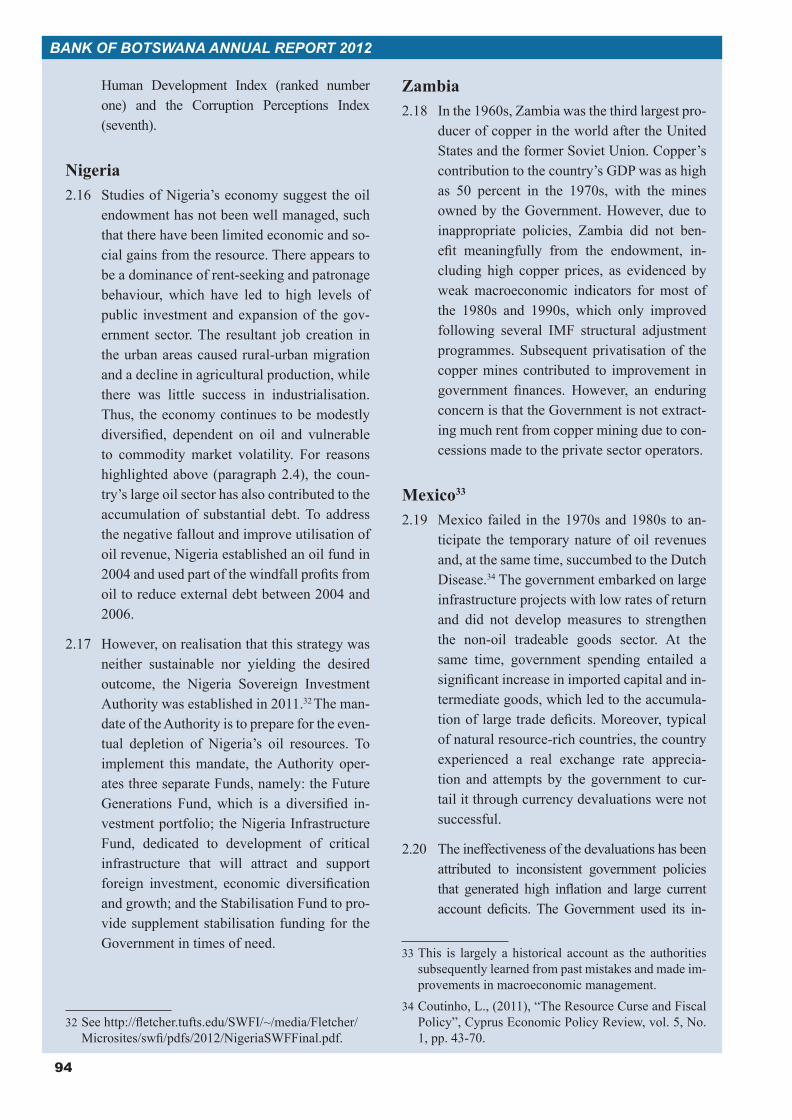
94
BANK OF BOTSWANA ANNUAL REPORT 2012
Human Development Index (ranked number one) and the Corruption Perceptions Index (seventh).
Nigeria2.16 Studies of Nigeria’s economy suggest the oil
endowment has not been well managed, such that there have been limited economic and so-cial gains from the resource. There appears to be a dominance of rent-seeking and patronage behaviour, which have led to high levels of public investment and expansion of the gov-ernment sector. The resultant job creation in the urban areas caused rural-urban migration and a decline in agricultural production, while there was little success in industrialisation. Thus, the economy continues to be modestly diversified, dependent on oil and vulnerable to commodity market volatility. For reasons highlighted above (paragraph 2.4), the coun-try’s large oil sector has also contributed to the accumulation of substantial debt. To address the negative fallout and improve utilisation of oil revenue, Nigeria established an oil fund in 2004 and used part of the windfall profits from oil to reduce external debt between 2004 and 2006.
2.17 However, on realisation that this strategy was neither sustainable nor yielding the desired outcome, the Nigeria Sovereign Investment Authority was established in 2011.32 The man-date of the Authority is to prepare for the even-tual depletion of Nigeria’s oil resources. To implement this mandate, the Authority oper-ates three separate Funds, namely: the Future Generations Fund, which is a diversified in-vestment portfolio; the Nigeria Infrastructure Fund, dedicated to development of critical infrastructure that will attract and support foreign investment, economic diversification and growth; and the Stabilisation Fund to pro-vide supplement stabilisation funding for the Government in times of need.
32 See http://fletcher.tufts.edu/SWFI/~/media/Fletcher/Microsites/swfi/pdfs/2012/NigeriaSWFFinal.pdf.
Zambia2.18 In the 1960s, Zambia was the third largest pro-
ducer of copper in the world after the United States and the former Soviet Union. Copper’s contribution to the country’s GDP was as high as 50 percent in the 1970s, with the mines owned by the Government. However, due to inappropriate policies, Zambia did not ben-efit meaningfully from the endowment, in-cluding high copper prices, as evidenced by weak macroeconomic indicators for most of the 1980s and 1990s, which only improved following several IMF structural adjustment programmes. Subsequent privatisation of the copper mines contributed to improvement in government finances. However, an enduring concern is that the Government is not extract-ing much rent from copper mining due to con-cessions made to the private sector operators.
Mexico33
2.19 Mexico failed in the 1970s and 1980s to an-ticipate the temporary nature of oil revenues and, at the same time, succumbed to the Dutch Disease.34 The government embarked on large infrastructure projects with low rates of return and did not develop measures to strengthen the non-oil tradeable goods sector. At the same time, government spending entailed a significant increase in imported capital and in-termediate goods, which led to the accumula-tion of large trade deficits. Moreover, typical of natural resource-rich countries, the country experienced a real exchange rate apprecia-tion and attempts by the government to cur-tail it through currency devaluations were not successful.
2.20 The ineffectiveness of the devaluations has been attributed to inconsistent government policies that generated high inflation and large current account deficits. The Government used its in-
33 This is largely a historical account as the authorities subsequently learned from past mistakes and made im-provements in macroeconomic management.
34 Coutinho, L., (2011), “The Resource Curse and Fiscal Policy”, Cyprus Economic Policy Review, vol. 5, No. 1, pp. 43-70.
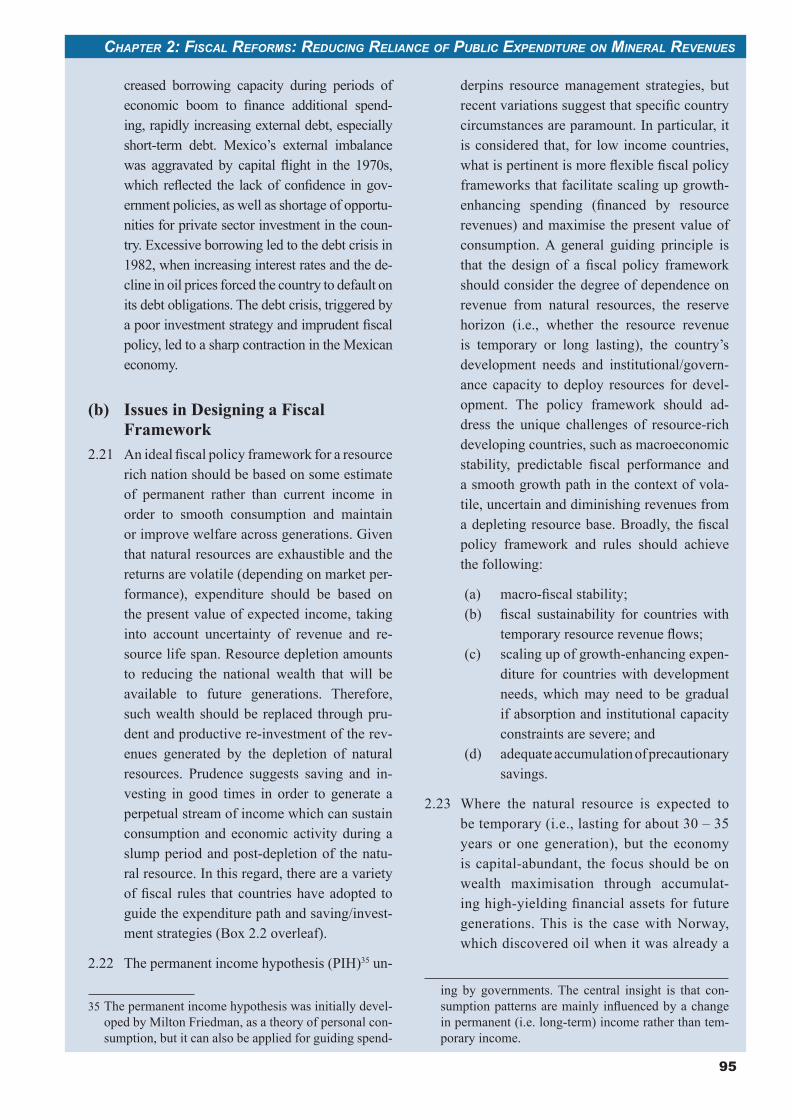
95
CHAPTER 2: FISCAL REFORMS: REDUCING RELIANCE OF PUBLIC EXPENDITURE ON MINERAL REVENUES
creased borrowing capacity during periods of economic boom to finance additional spend-ing, rapidly increasing external debt, especially short-term debt. Mexico’s external imbalance was aggravated by capital flight in the 1970s, which reflected the lack of confidence in gov-ernment policies, as well as shortage of opportu-nities for private sector investment in the coun-try. Excessive borrowing led to the debt crisis in 1982, when increasing interest rates and the de-cline in oil prices forced the country to default on its debt obligations. The debt crisis, triggered by a poor investment strategy and imprudent fiscal policy, led to a sharp contraction in the Mexican economy.
(b) Issues in Designing a Fiscal Framework
2.21 An ideal fiscal policy framework for a resource rich nation should be based on some estimate of permanent rather than current income in order to smooth consumption and maintain or improve welfare across generations. Given that natural resources are exhaustible and the returns are volatile (depending on market per-formance), expenditure should be based on the present value of expected income, taking into account uncertainty of revenue and re-source life span. Resource depletion amounts to reducing the national wealth that will be available to future generations. Therefore, such wealth should be replaced through pru-dent and productive re-investment of the rev-enues generated by the depletion of natural resources. Prudence suggests saving and in-vesting in good times in order to generate a perpetual stream of income which can sustain consumption and economic activity during a slump period and post-depletion of the natu-ral resource. In this regard, there are a variety of fiscal rules that countries have adopted to guide the expenditure path and saving/invest-ment strategies (Box 2.2 overleaf).
2.22 The permanent income hypothesis (PIH)35 un-
35 The permanent income hypothesis was initially devel-oped by Milton Friedman, as a theory of personal con-sumption, but it can also be applied for guiding spend-
derpins resource management strategies, but recent variations suggest that specific country circumstances are paramount. In particular, it is considered that, for low income countries, what is pertinent is more flexible fiscal policy frameworks that facilitate scaling up growth-enhancing spending (financed by resource revenues) and maximise the present value of consumption. A general guiding principle is that the design of a fiscal policy framework should consider the degree of dependence on revenue from natural resources, the reserve horizon (i.e., whether the resource revenue is temporary or long lasting), the country’s development needs and institutional/govern-ance capacity to deploy resources for devel-opment. The policy framework should ad-dress the unique challenges of resource-rich developing countries, such as macroeconomic stability, predictable fiscal performance and a smooth growth path in the context of vola-tile, uncertain and diminishing revenues from a depleting resource base. Broadly, the fiscal policy framework and rules should achieve the following:
(a) macro-fiscal stability;(b) fiscal sustainability for countries with
temporary resource revenue flows;(c) scaling up of growth-enhancing expen-
diture for countries with development needs, which may need to be gradual if absorption and institutional capacity constraints are severe; and
(d) adequate accumulation of precautionary savings.
2.23 Where the natural resource is expected to be temporary (i.e., lasting for about 30 – 35 years or one generation), but the economy is capital-abundant, the focus should be on wealth maximisation through accumulat-ing high-yielding financial assets for future generations. This is the case with Norway, which discovered oil when it was already a
ing by governments. The central insight is that con-sumption patterns are mainly influenced by a change in permanent (i.e. long-term) income rather than tem-porary income.
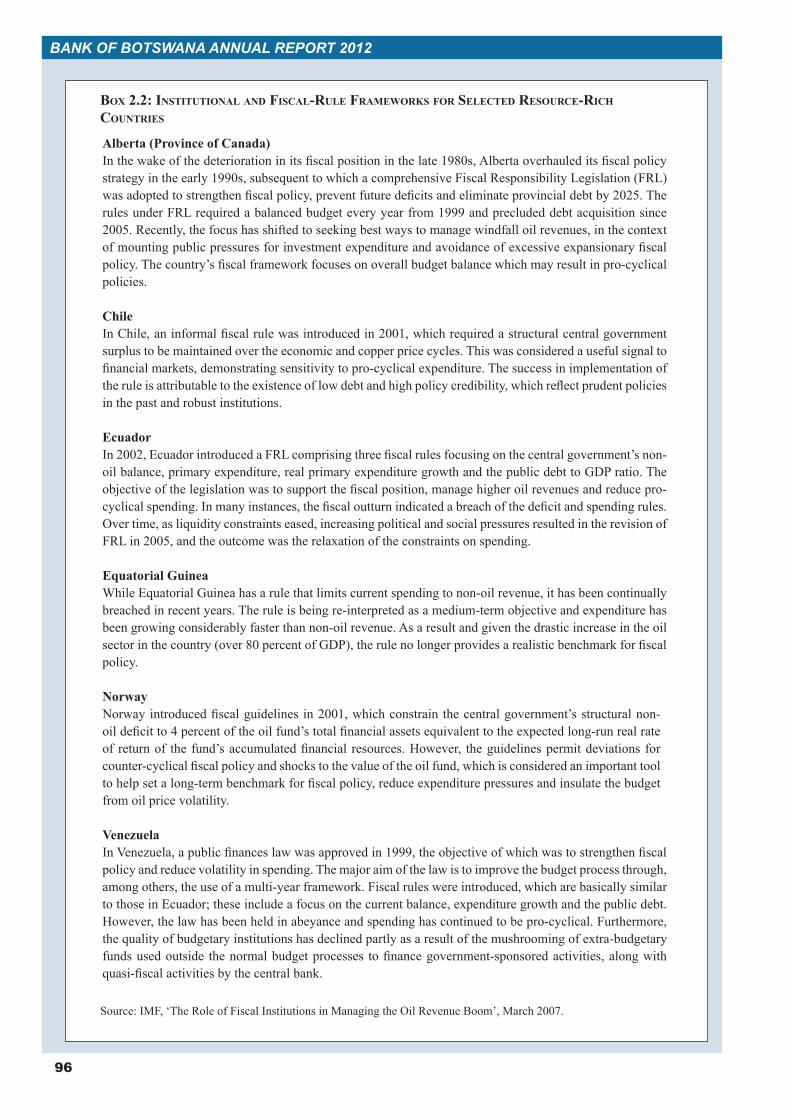
96
BANK OF BOTSWANA ANNUAL REPORT 2012
BOX 2.2: INSTITUTIONAL AND FISCAL-RULE FRAMEWORKS FOR SELECTED RESOURCE-RICH COUNTRIES
Alberta (Province of Canada)In the wake of the deterioration in its fiscal position in the late 1980s, Alberta overhauled its fiscal policy strategy in the early 1990s, subsequent to which a comprehensive Fiscal Responsibility Legislation (FRL) was adopted to strengthen fiscal policy, prevent future deficits and eliminate provincial debt by 2025. The rules under FRL required a balanced budget every year from 1999 and precluded debt acquisition since 2005. Recently, the focus has shifted to seeking best ways to manage windfall oil revenues, in the context of mounting public pressures for investment expenditure and avoidance of excessive expansionary fiscal policy. The country’s fiscal framework focuses on overall budget balance which may result in pro-cyclical policies.
ChileIn Chile, an informal fiscal rule was introduced in 2001, which required a structural central government surplus to be maintained over the economic and copper price cycles. This was considered a useful signal to financial markets, demonstrating sensitivity to pro-cyclical expenditure. The success in implementation of the rule is attributable to the existence of low debt and high policy credibility, which reflect prudent policies in the past and robust institutions.
Ecuador In 2002, Ecuador introduced a FRL comprising three fiscal rules focusing on the central government’s non-oil balance, primary expenditure, real primary expenditure growth and the public debt to GDP ratio. The objective of the legislation was to support the fiscal position, manage higher oil revenues and reduce pro-cyclical spending. In many instances, the fiscal outturn indicated a breach of the deficit and spending rules. Over time, as liquidity constraints eased, increasing political and social pressures resulted in the revision of FRL in 2005, and the outcome was the relaxation of the constraints on spending.
Equatorial GuineaWhile Equatorial Guinea has a rule that limits current spending to non-oil revenue, it has been continually breached in recent years. The rule is being re-interpreted as a medium-term objective and expenditure has been growing considerably faster than non-oil revenue. As a result and given the drastic increase in the oil sector in the country (over 80 percent of GDP), the rule no longer provides a realistic benchmark for fiscal policy.
NorwayNorway introduced fiscal guidelines in 2001, which constrain the central government’s structural non-oil deficit to 4 percent of the oil fund’s total financial assets equivalent to the expected long-run real rate of return of the fund’s accumulated financial resources. However, the guidelines permit deviations for counter-cyclical fiscal policy and shocks to the value of the oil fund, which is considered an important tool to help set a long-term benchmark for fiscal policy, reduce expenditure pressures and insulate the budget from oil price volatility.
VenezuelaIn Venezuela, a public finances law was approved in 1999, the objective of which was to strengthen fiscal policy and reduce volatility in spending. The major aim of the law is to improve the budget process through, among others, the use of a multi-year framework. Fiscal rules were introduced, which are basically similar to those in Ecuador; these include a focus on the current balance, expenditure growth and the public debt. However, the law has been held in abeyance and spending has continued to be pro-cyclical. Furthermore, the quality of budgetary institutions has declined partly as a result of the mushrooming of extra-budgetary funds used outside the normal budget processes to finance government-sponsored activities, along with quasi-fiscal activities by the central bank.
Source: IMF, ‘The Role of Fiscal Institutions in Managing the Oil Revenue Boom’, March 2007.
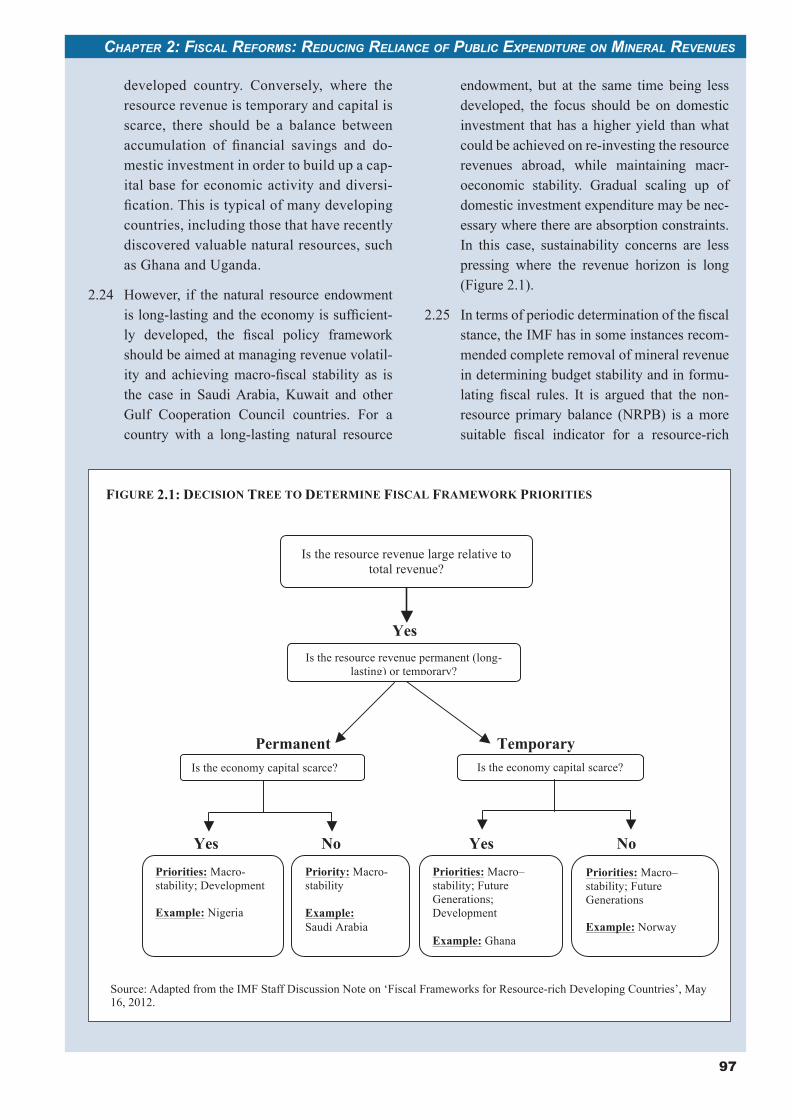
97
CHAPTER 2: FISCAL REFORMS: REDUCING RELIANCE OF PUBLIC EXPENDITURE ON MINERAL REVENUES
developed country. Conversely, where the resource revenue is temporary and capital is scarce, there should be a balance between accumulation of financial savings and do-mestic investment in order to build up a cap-ital base for economic activity and diversi-fication. This is typical of many developing countries, including those that have recently discovered valuable natural resources, such as Ghana and Uganda.
2.24 However, if the natural resource endowment is long-lasting and the economy is sufficient-ly developed, the fiscal policy framework should be aimed at managing revenue volatil-ity and achieving macro-fiscal stability as is the case in Saudi Arabia, Kuwait and other Gulf Cooperation Council countries. For a country with a long-lasting natural resource
endowment, but at the same time being less developed, the focus should be on domestic investment that has a higher yield than what could be achieved on re-investing the resource revenues abroad, while maintaining macr-oeconomic stability. Gradual scaling up of domestic investment expenditure may be nec-essary where there are absorption constraints. In this case, sustainability concerns are less pressing where the revenue horizon is long (Figure 2.1).
2.25 In terms of periodic determination of the fiscal stance, the IMF has in some instances recom-mended complete removal of mineral revenue in determining budget stability and in formu-lating fiscal rules. It is argued that the non-resource primary balance (NRPB) is a more suitable fiscal indicator for a resource-rich
Source: Adapted from the IMF Staff Discussion Note on ‘Fiscal Frameworks for Resource-rich Developing Countries’, May 16, 2012.
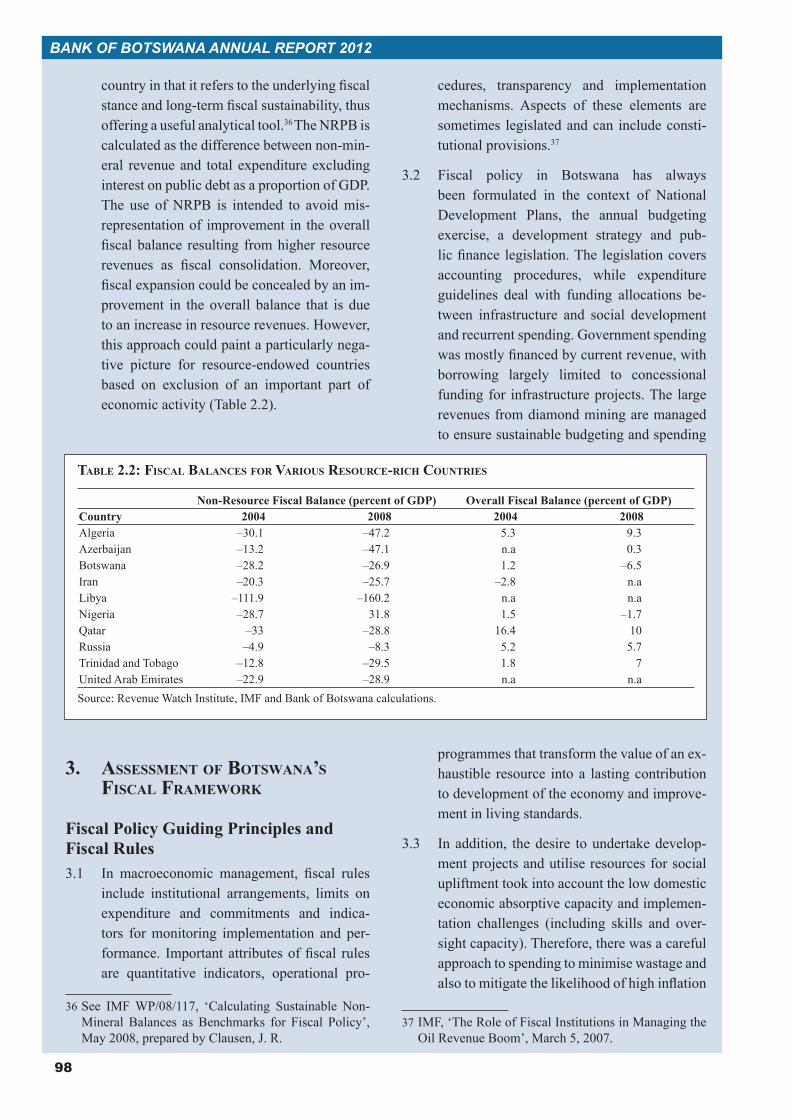
98
BANK OF BOTSWANA ANNUAL REPORT 2012
country in that it refers to the underlying fiscal stance and long-term fiscal sustainability, thus offering a useful analytical tool.36 The NRPB is calculated as the difference between non-min-eral revenue and total expenditure excluding interest on public debt as a proportion of GDP. The use of NRPB is intended to avoid mis-representation of improvement in the overall fiscal balance resulting from higher resource revenues as fiscal consolidation. Moreover, fiscal expansion could be concealed by an im-provement in the overall balance that is due to an increase in resource revenues. However, this approach could paint a particularly nega-tive picture for resource-endowed countries based on exclusion of an important part of economic activity (Table 2.2).
3. ASSESSMENT OF BOTSWANA’S FISCAL FRAMEWORK
Fiscal Policy Guiding Principles and Fiscal Rules3.1 In macroeconomic management, fiscal rules
include institutional arrangements, limits on expenditure and commitments and indica-tors for monitoring implementation and per-formance. Important attributes of fiscal rules are quantitative indicators, operational pro-
36 See IMF WP/08/117, ‘Calculating Sustainable Non-Mineral Balances as Benchmarks for Fiscal Policy’, May 2008, prepared by Clausen, J. R.
cedures, transparency and implementation mechanisms. Aspects of these elements are sometimes legislated and can include consti-tutional provisions.37
3.2 Fiscal policy in Botswana has always been formulated in the context of National Development Plans, the annual budgeting exercise, a development strategy and pub-lic finance legislation. The legislation covers accounting procedures, while expenditure guidelines deal with funding allocations be-tween infrastructure and social development and recurrent spending. Government spending was mostly financed by current revenue, with borrowing largely limited to concessional funding for infrastructure projects. The large revenues from diamond mining are managed to ensure sustainable budgeting and spending
programmes that transform the value of an ex-haustible resource into a lasting contribution to development of the economy and improve-ment in living standards.
3.3 In addition, the desire to undertake develop-ment projects and utilise resources for social upliftment took into account the low domestic economic absorptive capacity and implemen-tation challenges (including skills and over-sight capacity). Therefore, there was a careful approach to spending to minimise wastage and also to mitigate the likelihood of high inflation
37 IMF, ‘The Role of Fiscal Institutions in Managing the Oil Revenue Boom’, March 5, 2007.
TABLE 2.2: FISCAL BALANCES FOR VARIOUS RESOURCE-RICH COUNTRIES
Non-Resource Fiscal Balance (percent of GDP) Overall Fiscal Balance (percent of GDP)Country 2004 2008 2004 2008Algeria –30.1 –47.2 5.3 9.3Azerbaijan –13.2 –47.1 n.a 0.3Botswana –28.2 –26.9 1.2 –6.5Iran –20.3 –25.7 –2.8 n.aLibya –111.9 –160.2 n.a n.aNigeria –28.7 31.8 1.5 –1.7Qatar –33 –28.8 16.4 10Russia –4.9 –8.3 5.2 5.7Trinidad and Tobago –12.8 –29.5 1.8 7United Arab Emirates –22.9 –28.9 n.a n.aSource: Revenue Watch Institute, IMF and Bank of Botswana calculations.
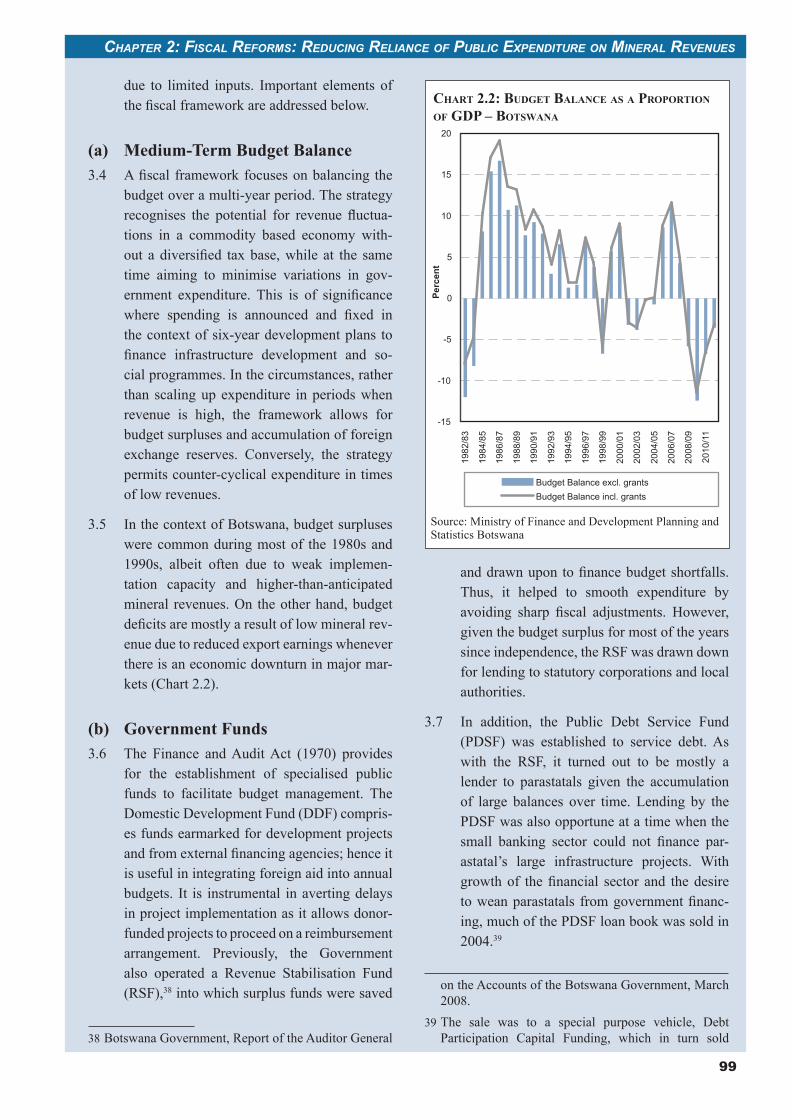
99
CHAPTER 2: FISCAL REFORMS: REDUCING RELIANCE OF PUBLIC EXPENDITURE ON MINERAL REVENUES
due to limited inputs. Important elements of the fiscal framework are addressed below.
(a) Medium-Term Budget Balance3.4 A fiscal framework focuses on balancing the
budget over a multi-year period. The strategy recognises the potential for revenue fluctua-tions in a commodity based economy with-out a diversified tax base, while at the same time aiming to minimise variations in gov-ernment expenditure. This is of significance where spending is announced and fixed in the context of six-year development plans to finance infrastructure development and so-cial programmes. In the circumstances, rather than scaling up expenditure in periods when revenue is high, the framework allows for budget surpluses and accumulation of foreign exchange reserves. Conversely, the strategy permits counter-cyclical expenditure in times of low revenues.
3.5 In the context of Botswana, budget surpluses were common during most of the 1980s and 1990s, albeit often due to weak implemen-tation capacity and higher-than-anticipated mineral revenues. On the other hand, budget deficits are mostly a result of low mineral rev-enue due to reduced export earnings whenever there is an economic downturn in major mar-kets (Chart 2.2).
(b) Government Funds3.6 The Finance and Audit Act (1970) provides
for the establishment of specialised public funds to facilitate budget management. The Domestic Development Fund (DDF) compris-es funds earmarked for development projects and from external financing agencies; hence it is useful in integrating foreign aid into annual budgets. It is instrumental in averting delays in project implementation as it allows donor-funded projects to proceed on a reimbursement arrangement. Previously, the Government also operated a Revenue Stabilisation Fund (RSF),38 into which surplus funds were saved
38 Botswana Government, Report of the Auditor General
and drawn upon to finance budget shortfalls. Thus, it helped to smooth expenditure by avoiding sharp fiscal adjustments. However, given the budget surplus for most of the years since independence, the RSF was drawn down for lending to statutory corporations and local authorities.
3.7 In addition, the Public Debt Service Fund (PDSF) was established to service debt. As with the RSF, it turned out to be mostly a lender to parastatals given the accumulation of large balances over time. Lending by the PDSF was also opportune at a time when the small banking sector could not finance par-astatal’s large infrastructure projects. With growth of the financial sector and the desire to wean parastatals from government financ-ing, much of the PDSF loan book was sold in 2004.39
on the Accounts of the Botswana Government, March 2008.
39 The sale was to a special purpose vehicle, Debt Participation Capital Funding, which in turn sold
CHART 2.2: BUDGET BALANCE AS A PROPORTION OF GDP – BOTSWANA
Source: Ministry of Finance and Development Planning and Statistics Botswana
-15
-10
-5
0
5
10
15
20
1982
/83
1984
/85
1986
/87
1988
/89
1990
/91
1992
/93
1994
/95
1996
/97
1998
/99
2000
/01
2002
/03
2004
/05
2006
/07
2008
/09
2010
/11
Budget Balance excl. grantsBudget Balance incl. grants
Perc
ent
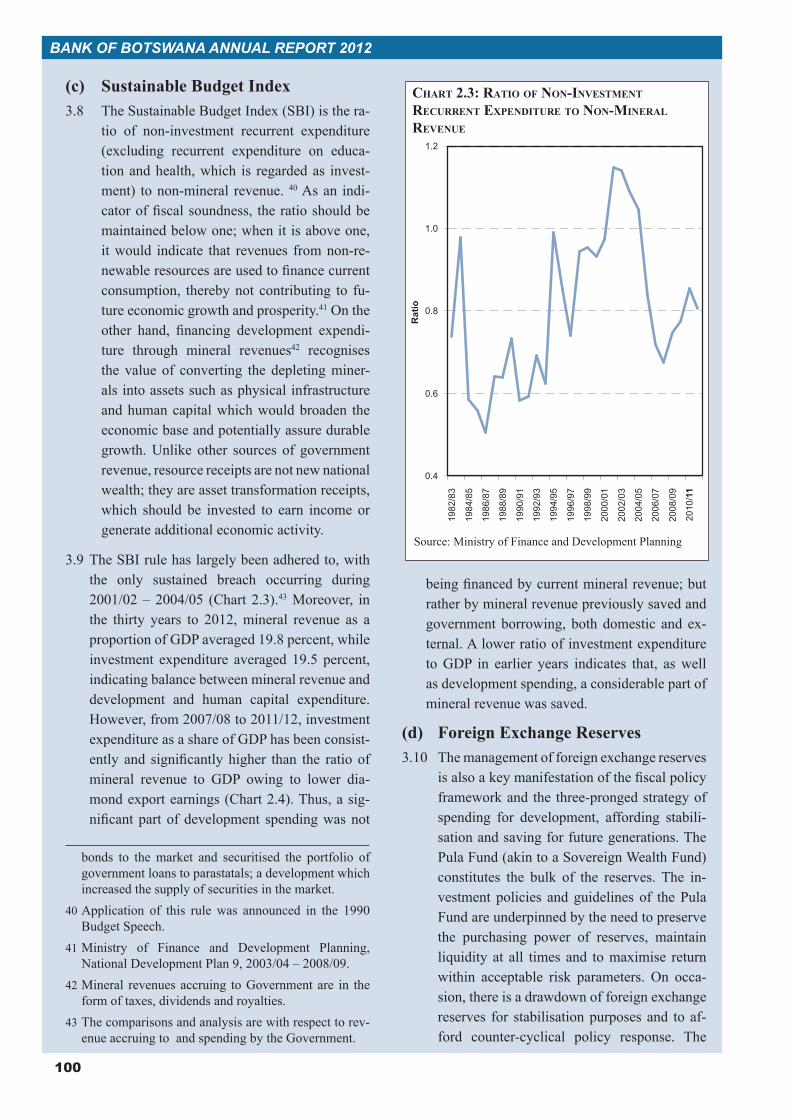
100
BANK OF BOTSWANA ANNUAL REPORT 2012
(c) Sustainable Budget Index3.8 The Sustainable Budget Index (SBI) is the ra-
tio of non-investment recurrent expenditure (excluding recurrent expenditure on educa-tion and health, which is regarded as invest-ment) to non-mineral revenue. 40 As an indi-cator of fiscal soundness, the ratio should be maintained below one; when it is above one, it would indicate that revenues from non-re-newable resources are used to finance current consumption, thereby not contributing to fu-ture economic growth and prosperity.41 On the other hand, financing development expendi-ture through mineral revenues42 recognises the value of converting the depleting miner-als into assets such as physical infrastructure and human capital which would broaden the economic base and potentially assure durable growth. Unlike other sources of government revenue, resource receipts are not new national wealth; they are asset transformation receipts, which should be invested to earn income or generate additional economic activity.
3.9 The SBI rule has largely been adhered to, with the only sustained breach occurring during 2001/02 – 2004/05 (Chart 2.3).43 Moreover, in the thirty years to 2012, mineral revenue as a proportion of GDP averaged 19.8 percent, while investment expenditure averaged 19.5 percent, indicating balance between mineral revenue and development and human capital expenditure. However, from 2007/08 to 2011/12, investment expenditure as a share of GDP has been consist-ently and significantly higher than the ratio of mineral revenue to GDP owing to lower dia-mond export earnings (Chart 2.4). Thus, a sig-nificant part of development spending was not
bonds to the market and securitised the portfolio of government loans to parastatals; a development which increased the supply of securities in the market.
40 Application of this rule was announced in the 1990 Budget Speech.
41 Ministry of Finance and Development Planning, National Development Plan 9, 2003/04 – 2008/09.
42 Mineral revenues accruing to Government are in the form of taxes, dividends and royalties.
43 The comparisons and analysis are with respect to rev-enue accruing to and spending by the Government.
being financed by current mineral revenue; but rather by mineral revenue previously saved and government borrowing, both domestic and ex-ternal. A lower ratio of investment expenditure to GDP in earlier years indicates that, as well as development spending, a considerable part of mineral revenue was saved.
(d) Foreign Exchange Reserves3.10 The management of foreign exchange reserves
is also a key manifestation of the fiscal policy framework and the three-pronged strategy of spending for development, affording stabili-sation and saving for future generations. The Pula Fund (akin to a Sovereign Wealth Fund) constitutes the bulk of the reserves. The in-vestment policies and guidelines of the Pula Fund are underpinned by the need to preserve the purchasing power of reserves, maintain liquidity at all times and to maximise return within acceptable risk parameters. On occa-sion, there is a drawdown of foreign exchange reserves for stabilisation purposes and to af-ford counter-cyclical policy response. The
CHART 2.3: RATIO OF NON-INVESTMENT RECURRENT EXPENDITURE TO NON-MINERAL REVENUE
Source: Ministry of Finance and Development Planning
0.4
0.6
0.8
1.0
1.2
1982
/83
1984
/85
1986
/87
1988
/89
1990
/91
1992
/93
1994
/95
1996
/97
1998
/99
2000
/01
2002
/03
2004
/05
2006
/07
2008
/09
2010
/11
Rat
io
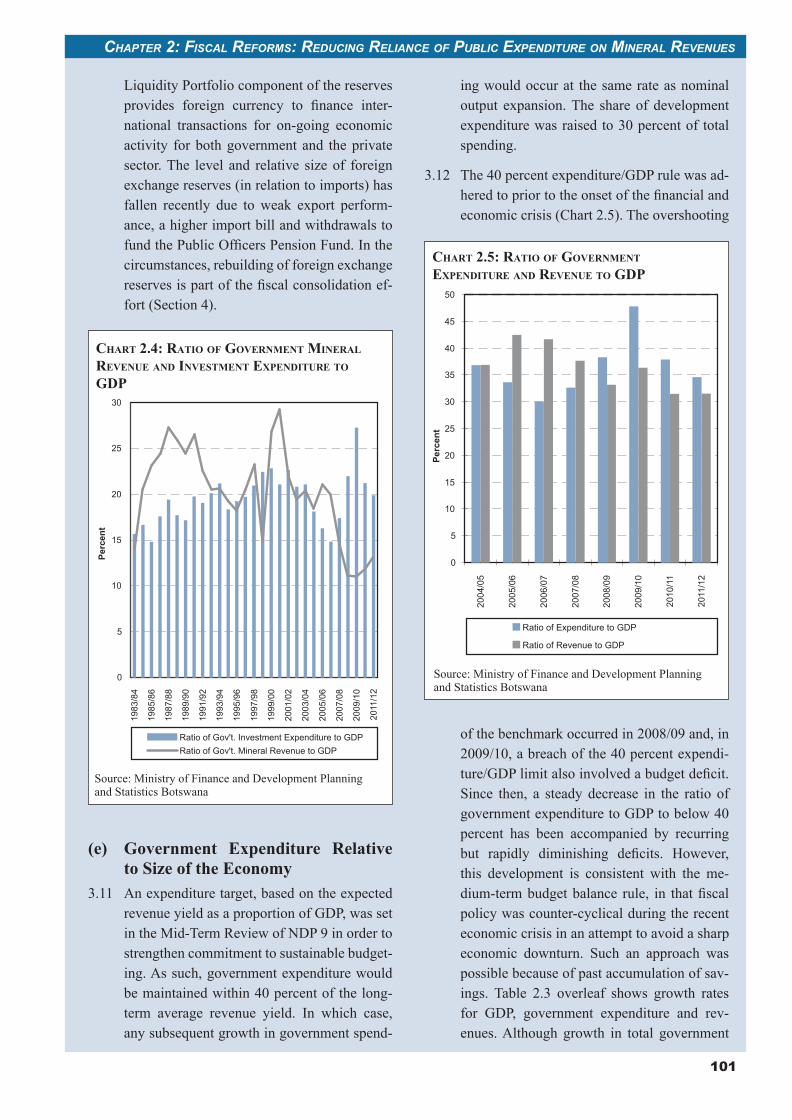
101
CHAPTER 2: FISCAL REFORMS: REDUCING RELIANCE OF PUBLIC EXPENDITURE ON MINERAL REVENUES
Liquidity Portfolio component of the reserves provides foreign currency to finance inter-national transactions for on-going economic activity for both government and the private sector. The level and relative size of foreign exchange reserves (in relation to imports) has fallen recently due to weak export perform-ance, a higher import bill and withdrawals to fund the Public Officers Pension Fund. In the circumstances, rebuilding of foreign exchange reserves is part of the fiscal consolidation ef-fort (Section 4).
(e) Government Expenditure Relative to Size of the Economy
3.11 An expenditure target, based on the expected revenue yield as a proportion of GDP, was set in the Mid-Term Review of NDP 9 in order to strengthen commitment to sustainable budget-ing. As such, government expenditure would be maintained within 40 percent of the long-term average revenue yield. In which case, any subsequent growth in government spend-
ing would occur at the same rate as nominal output expansion. The share of development expenditure was raised to 30 percent of total spending.
3.12 The 40 percent expenditure/GDP rule was ad-hered to prior to the onset of the financial and economic crisis (Chart 2.5). The overshooting
of the benchmark occurred in 2008/09 and, in 2009/10, a breach of the 40 percent expendi-ture/GDP limit also involved a budget deficit. Since then, a steady decrease in the ratio of government expenditure to GDP to below 40 percent has been accompanied by recurring but rapidly diminishing deficits. However, this development is consistent with the me-dium-term budget balance rule, in that fiscal policy was counter-cyclical during the recent economic crisis in an attempt to avoid a sharp economic downturn. Such an approach was possible because of past accumulation of sav-ings. Table 2.3 overleaf shows growth rates for GDP, government expenditure and rev-enues. Although growth in total government
CHART 2.4: RATIO OF GOVERNMENT MINERAL REVENUE AND INVESTMENT EXPENDITURE TO GDP
Source: Ministry of Finance and Development Planning and Statistics Botswana
CHART 2.5: RATIO OF GOVERNMENT EXPENDITURE AND REVENUE TO GDP
Source: Ministry of Finance and Development Planning and Statistics Botswana
0
5
10
15
20
25
30
1983
/84
1985
/86
1987
/88
1989
/90
1991
/92
1993
/94
1995
/96
1997
/98
1999
/00
2001
/02
2003
/04
2005
/06
2007
/08
2009
/10
2011
/12
Perc
ent
Ratio of Gov't. Investment Expenditure to GDPRatio of Gov't. Mineral Revenue to GDP
0
5
10
15
20
25
30
35
40
45
50
2004
/05
2005
/06
2006
/07
2007
/08
2008
/09
2009
/10
2010
/11
2011
/12
Perc
ent
Ratio of Expenditure to GDP
Ratio of Revenue to GDP
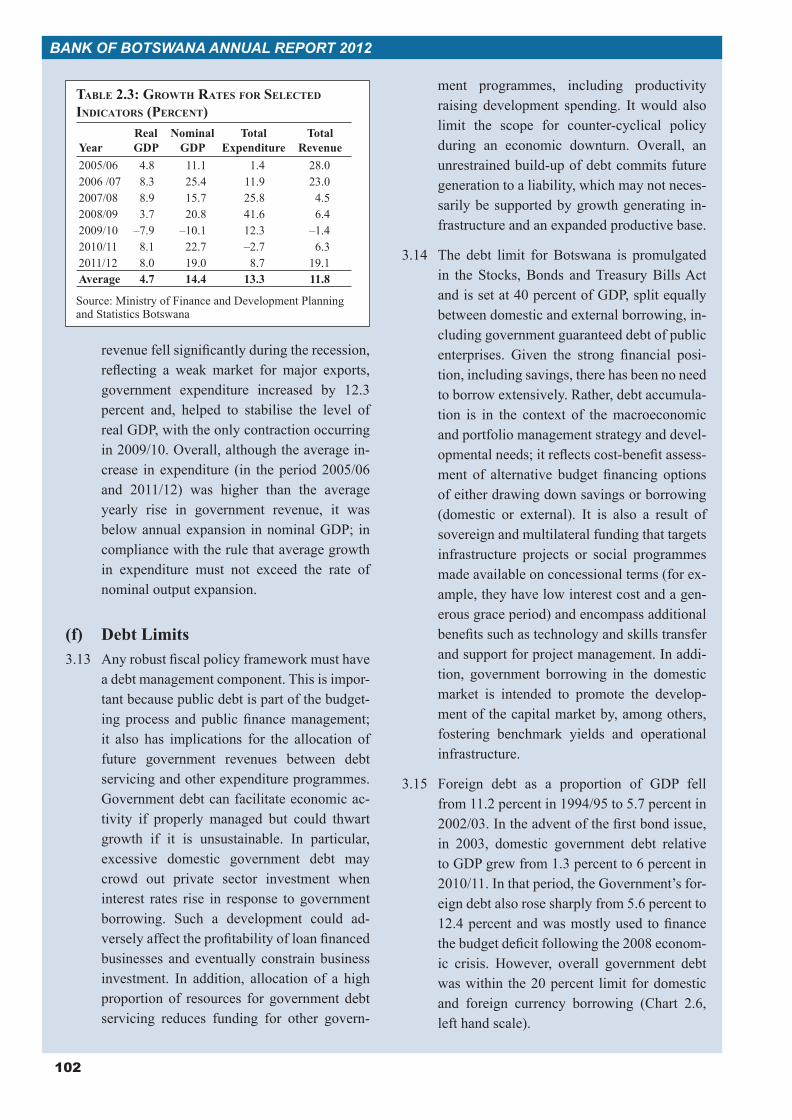
102
BANK OF BOTSWANA ANNUAL REPORT 2012
revenue fell significantly during the recession, reflecting a weak market for major exports, government expenditure increased by 12.3 percent and, helped to stabilise the level of real GDP, with the only contraction occurring in 2009/10. Overall, although the average in-crease in expenditure (in the period 2005/06 and 2011/12) was higher than the average yearly rise in government revenue, it was below annual expansion in nominal GDP; in compliance with the rule that average growth in expenditure must not exceed the rate of nominal output expansion.
(f) Debt Limits3.13 Any robust fiscal policy framework must have
a debt management component. This is impor-tant because public debt is part of the budget-ing process and public finance management; it also has implications for the allocation of future government revenues between debt servicing and other expenditure programmes. Government debt can facilitate economic ac-tivity if properly managed but could thwart growth if it is unsustainable. In particular, excessive domestic government debt may crowd out private sector investment when interest rates rise in response to government borrowing. Such a development could ad-versely affect the profitability of loan financed businesses and eventually constrain business investment. In addition, allocation of a high proportion of resources for government debt servicing reduces funding for other govern-
ment programmes, including productivity raising development spending. It would also limit the scope for counter-cyclical policy during an economic downturn. Overall, an unrestrained build-up of debt commits future generation to a liability, which may not neces-sarily be supported by growth generating in-frastructure and an expanded productive base.
3.14 The debt limit for Botswana is promulgated in the Stocks, Bonds and Treasury Bills Act and is set at 40 percent of GDP, split equally between domestic and external borrowing, in-cluding government guaranteed debt of public enterprises. Given the strong financial posi-tion, including savings, there has been no need to borrow extensively. Rather, debt accumula-tion is in the context of the macroeconomic and portfolio management strategy and devel-opmental needs; it reflects cost-benefit assess-ment of alternative budget financing options of either drawing down savings or borrowing (domestic or external). It is also a result of sovereign and multilateral funding that targets infrastructure projects or social programmes made available on concessional terms (for ex-ample, they have low interest cost and a gen-erous grace period) and encompass additional benefits such as technology and skills transfer and support for project management. In addi-tion, government borrowing in the domestic market is intended to promote the develop-ment of the capital market by, among others, fostering benchmark yields and operational infrastructure.
3.15 Foreign debt as a proportion of GDP fell from 11.2 percent in 1994/95 to 5.7 percent in 2002/03. In the advent of the first bond issue, in 2003, domestic government debt relative to GDP grew from 1.3 percent to 6 percent in 2010/11. In that period, the Government’s for-eign debt also rose sharply from 5.6 percent to 12.4 percent and was mostly used to finance the budget deficit following the 2008 econom-ic crisis. However, overall government debt was within the 20 percent limit for domestic and foreign currency borrowing (Chart 2.6, left hand scale).
TABLE 2.3: GROWTH RATES FOR SELECTED INDICATORS (PERCENT)
YearReal GDP
Nominal GDP
Total Expenditure
Total Revenue
2005/06 4.8 11.1 1.4 28.02006 /07 8.3 25.4 11.9 23.02007/08 8.9 15.7 25.8 4.52008/09 3.7 20.8 41.6 6.42009/10 –7.9 –10.1 12.3 –1.42010/11 8.1 22.7 –2.7 6.32011/12 8.0 19.0 8.7 19.1Average 4.7 14.4 13.3 11.8
Source: Ministry of Finance and Development Planning and Statistics Botswana
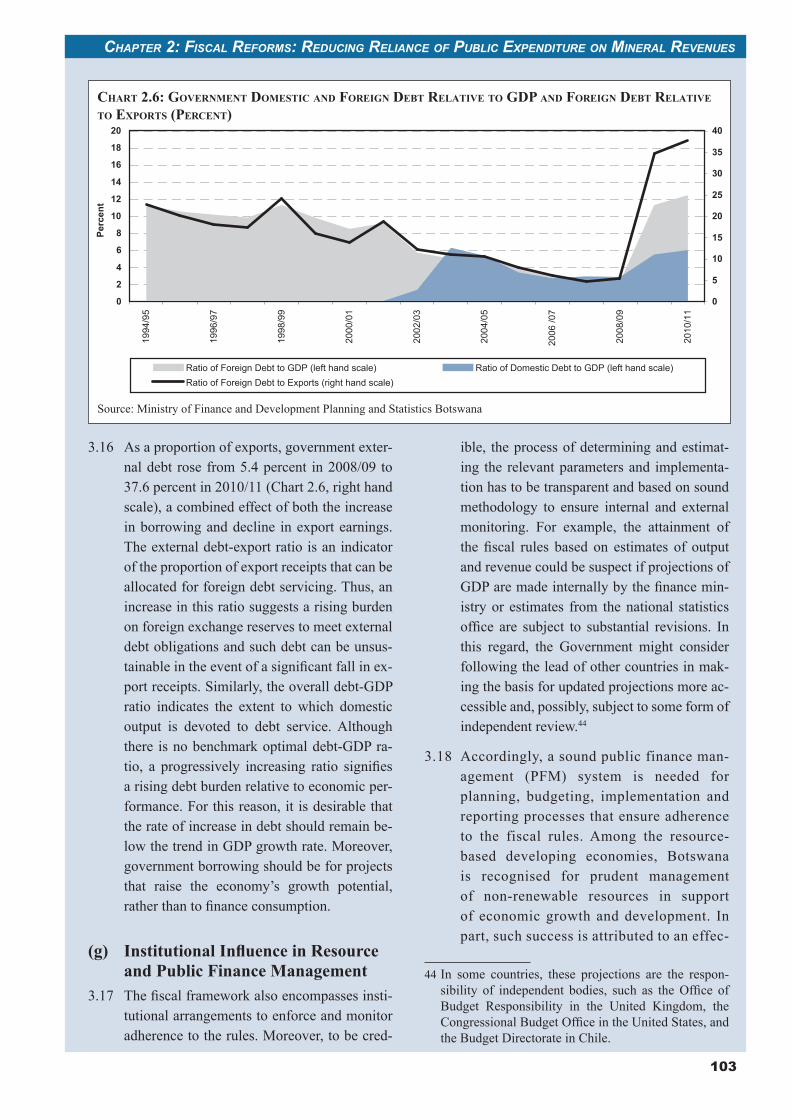
103
CHAPTER 2: FISCAL REFORMS: REDUCING RELIANCE OF PUBLIC EXPENDITURE ON MINERAL REVENUES
3.16 As a proportion of exports, government exter-nal debt rose from 5.4 percent in 2008/09 to 37.6 percent in 2010/11 (Chart 2.6, right hand scale), a combined effect of both the increase in borrowing and decline in export earnings. The external debt-export ratio is an indicator of the proportion of export receipts that can be allocated for foreign debt servicing. Thus, an increase in this ratio suggests a rising burden on foreign exchange reserves to meet external debt obligations and such debt can be unsus-tainable in the event of a significant fall in ex-port receipts. Similarly, the overall debt-GDP ratio indicates the extent to which domestic output is devoted to debt service. Although there is no benchmark optimal debt-GDP ra-tio, a progressively increasing ratio signifies a rising debt burden relative to economic per-formance. For this reason, it is desirable that the rate of increase in debt should remain be-low the trend in GDP growth rate. Moreover, government borrowing should be for projects that raise the economy’s growth potential, rather than to finance consumption.
and Public Finance Management3.17 The fiscal framework also encompasses insti-
tutional arrangements to enforce and monitor adherence to the rules. Moreover, to be cred-
ible, the process of determining and estimat-ing the relevant parameters and implementa-tion has to be transparent and based on sound methodology to ensure internal and external monitoring. For example, the attainment of the fiscal rules based on estimates of output and revenue could be suspect if projections of GDP are made internally by the finance min-istry or estimates from the national statistics office are subject to substantial revisions. In this regard, the Government might consider following the lead of other countries in mak-ing the basis for updated projections more ac-cessible and, possibly, subject to some form of independent review.44
3.18 Accordingly, a sound public finance man-agement (PFM) system is needed for planning, budgeting, implementation and reporting processes that ensure adherence to the fiscal rules. Among the resource-based developing economies, Botswana is recognised for prudent management of non-renewable resources in support of economic growth and development. In part, such success is attributed to an effec-
44 In some countries, these projections are the respon-sibility of independent bodies, such as the Office of Budget Responsibility in the United Kingdom, the Congressional Budget Office in the United States, and the Budget Directorate in Chile.
CHART 2.6: GOVERNMENT DOMESTIC AND FOREIGN DEBT RELATIVE TO GDP AND FOREIGN DEBT RELATIVE TO EXPORTS (PERCENT)
Source: Ministry of Finance and Development Planning and Statistics Botswana
0
2
4
6
8
10
12
14
16
18
2019
94/9
5
1996
/97
1998
/99
2000
/01
2002
/03
2004
/05
2006
/07
2008
/09
2010
/11
Perc
ent
0
5
10
15
20
25
30
35
40
Ratio of Foreign Debt to GDP (left hand scale) Ratio of Domestic Debt to GDP (left hand scale)Ratio of Foreign Debt to Exports (right hand scale)
104
BANK OF BOTSWANA ANNUAL REPORT 2012
tive institutional framework and a well-established PFM system.
3.19 The Consolidated Fund, provided for in the constitution, is the formal repository of all re-sources raised by the Government; and with-drawals from the Fund have to be approved in accordance with stipulated procedures.45 Parliament approves the expenditure budget and any post-budget supplementary expendi-ture. The revenue and expenditure projec-tions (including downstream commitments such as the recurrent budget implications of development expenditure) are published in the National Development Plans (NDPs) and subsequently updated in the Plans’ Mid-Term Reviews, while there is a legal restriction that, if a project is not in the Plan, it cannot be im-plemented. Any emergency, such as drought or the outbreak of cattle disease, should be formally declared in order to trigger result-ant spending. Moreover, publication of the Auditor General’s report and follow up ac-tion by the Parliamentary Public Accounts Committee is a requirement.46
(h) Tax and Other Revenues3.20 Any meaningful expenditure plans need to be
supported by efforts to raise corresponding revenue and tax represents the single largest source of government revenue. Therefore, there is need for a tax administration and structure that optimises revenue collection and generate receipts that are larger than the expenses incurred in pursuing taxes.
3.21 NDP 9 highlights some of the essential fea-tures of a tax system for Botswana. Key as-pects include a balance between government revenue needs and the pursuit of social justice, equitable income distribution, and maintain-
45 Attorney General’s Chambers, ‘Regulatory and Institutional Framework for Public Debt Management in Botswana’, a paper presented by Stephen B. Tiroyakgosi at the MEFMI/UNITAR Workshop on the Legal Aspects of Public Debt Management in August 2001 in Lesotho.
46 Ministry of Finance and Development Planning, Mid-Term Review of NDP 9, 2003/04 – 2008/09.
ing an environment that is conducive for eco-nomic activity. The tax system has to also be simple, transparent and fairly applied. There is, furthermore, a desire by the Government to broaden the tax base, which would allow reduction in tax rates without loss in yields, and to achieve a balance between direct and indirect taxes.47
3.22 Initiatives to broaden the tax base and improve revenue collection stem from the realisation that no other single revenue source can match the size of receipts from the mining sector over the past forty years. Moreover, there is recognition that mineral revenue growth has plateaued and prospects for higher receipts from the Southern African Customs Union (SACU) are diminishing. Diamond mining is expected to become more costly as extraction goes deeper into the ground. This will, inevi-tably, result in reduced profitability, dividends and mineral tax revenues, while the revision of the SACU revenue sharing formula, along with trade liberalisation, points to prospects of lower receipts in the future.
3.23 Chart 2.7 shows sources of government rev-enue for the period 1975 – 2011. Mineral-based revenues (including taxes, royalties and dividends) consistently represent the largest source of income; it averages more than 40 percent of total government revenue. Such a share underscores the persistent reliance of the economy on the mining sector (even when its relative share in output is falling) and the country’s vulnerability to external economic conditions.
3.24 The next highest contributor to government revenue is customs and excise from SACU. Botswana receives quarterly payments from the common revenue pool. Collection into the pool is made up of customs duties on im-ports from non-member countries and duties levied on excisable goods produced within the Union. These are distributed through the Revenue Sharing Formula that takes into ac-
47 Ministry of Finance and Development Planning, National Development Plan (NDP) 5, 1979-85.
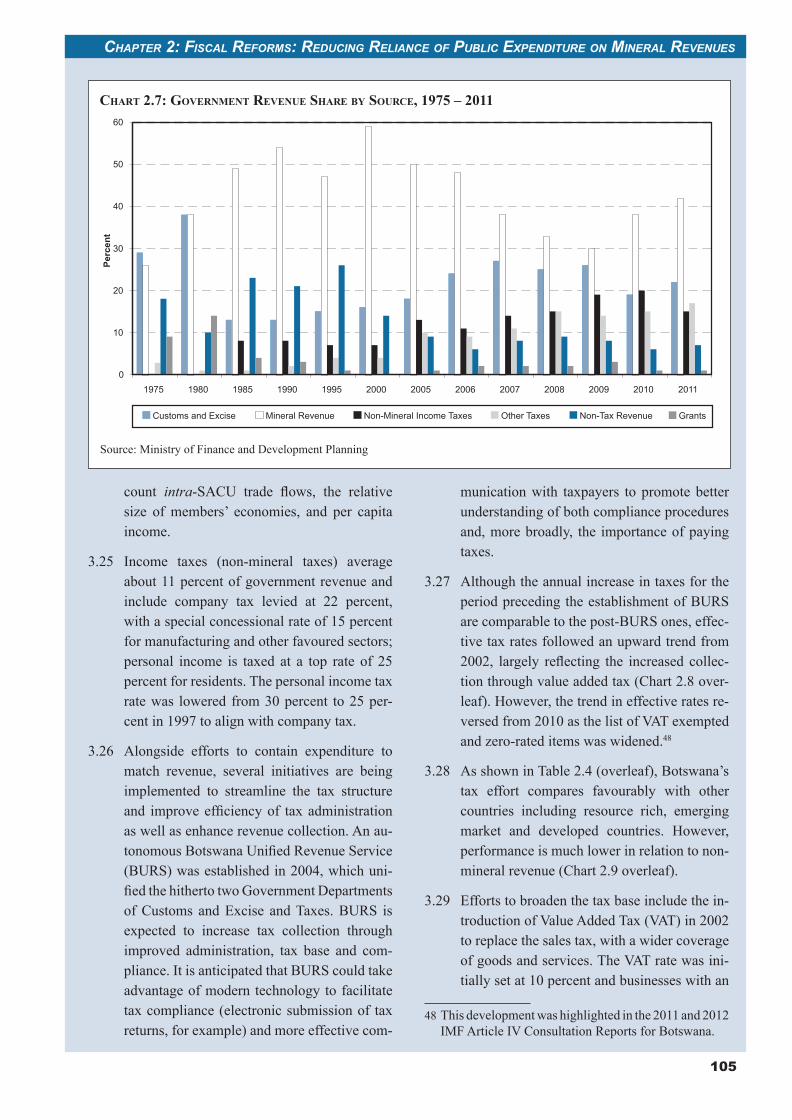
105
CHAPTER 2: FISCAL REFORMS: REDUCING RELIANCE OF PUBLIC EXPENDITURE ON MINERAL REVENUES
count intra-SACU trade flows, the relative size of members’ economies, and per capita income.
3.25 Income taxes (non-mineral taxes) average about 11 percent of government revenue and include company tax levied at 22 percent, with a special concessional rate of 15 percent for manufacturing and other favoured sectors; personal income is taxed at a top rate of 25 percent for residents. The personal income tax rate was lowered from 30 percent to 25 per-cent in 1997 to align with company tax.
3.26 Alongside efforts to contain expenditure to match revenue, several initiatives are being implemented to streamline the tax structure and improve efficiency of tax administration as well as enhance revenue collection. An au-tonomous Botswana Unified Revenue Service (BURS) was established in 2004, which uni-fied the hitherto two Government Departments of Customs and Excise and Taxes. BURS is expected to increase tax collection through improved administration, tax base and com-pliance. It is anticipated that BURS could take advantage of modern technology to facilitate tax compliance (electronic submission of tax returns, for example) and more effective com-
munication with taxpayers to promote better understanding of both compliance procedures and, more broadly, the importance of paying taxes.
3.27 Although the annual increase in taxes for the period preceding the establishment of BURS are comparable to the post-BURS ones, effec-tive tax rates followed an upward trend from 2002, largely reflecting the increased collec-tion through value added tax (Chart 2.8 over-leaf). However, the trend in effective rates re-versed from 2010 as the list of VAT exempted and zero-rated items was widened.48
3.28 As shown in Table 2.4 (overleaf), Botswana’s tax effort compares favourably with other countries including resource rich, emerging market and developed countries. However, performance is much lower in relation to non-mineral revenue (Chart 2.9 overleaf).
3.29 Efforts to broaden the tax base include the in-troduction of Value Added Tax (VAT) in 2002 to replace the sales tax, with a wider coverage of goods and services. The VAT rate was ini-tially set at 10 percent and businesses with an
48 This development was highlighted in the 2011 and 2012 IMF Article IV Consultation Reports for Botswana.
Source: Ministry of Finance and Development Planning
CHART 2.7: GOVERNMENT REVENUE SHARE BY SOURCE, 1975 – 2011
0
10
20
30
40
50
60
1975 1980 1985 1990 1995 2000 2005 2006 2007 2008 2009 2010 2011
Perc
ent
Customs and Excise Mineral Revenue Non-Mineral Income Taxes Other Taxes Non-Tax Revenue Grants
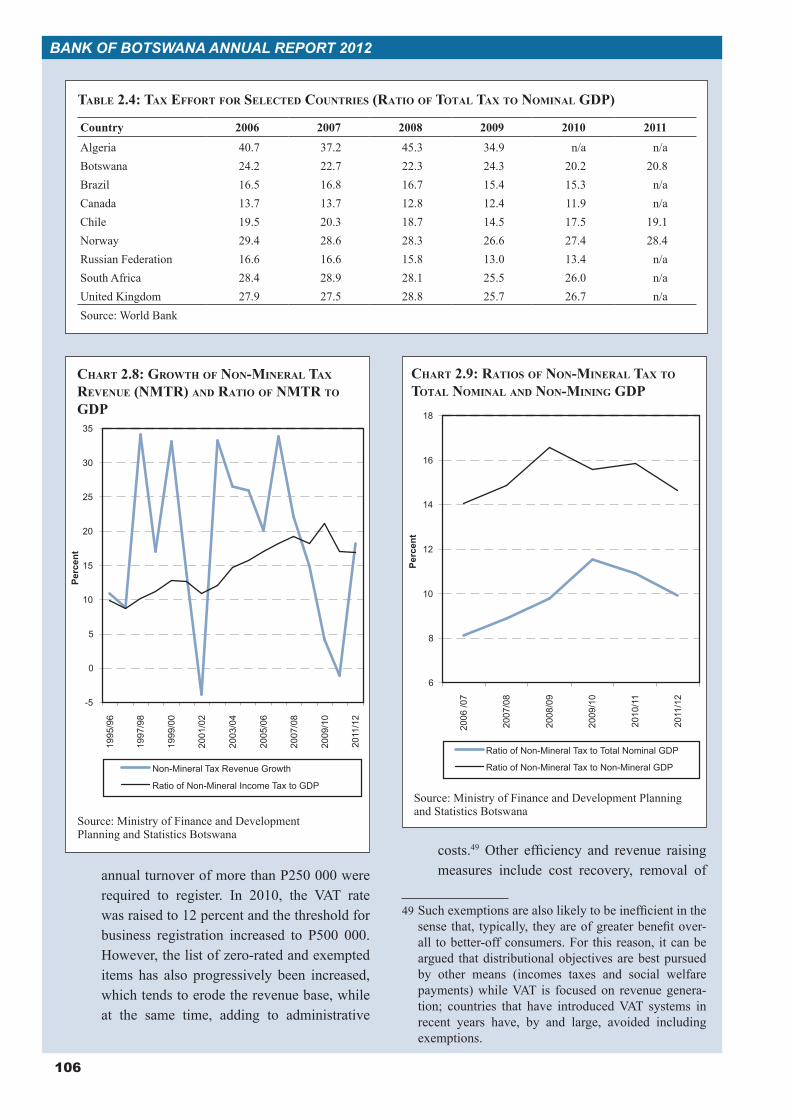
106
BANK OF BOTSWANA ANNUAL REPORT 2012
annual turnover of more than P250 000 were required to register. In 2010, the VAT rate was raised to 12 percent and the threshold for business registration increased to P500 000. However, the list of zero-rated and exempted items has also progressively been increased, which tends to erode the revenue base, while at the same time, adding to administrative
costs.49 Other efficiency and revenue raising measures include cost recovery, removal of
49 Such exemptions are also likely to be inefficient in the sense that, typically, they are of greater benefit over-all to better-off consumers. For this reason, it can be argued that distributional objectives are best pursued by other means (incomes taxes and social welfare payments) while VAT is focused on revenue genera-tion; countries that have introduced VAT systems in recent years have, by and large, avoided including exemptions.
TABLE 2.4: TAX EFFORT FOR SELECTED COUNTRIES (RATIO OF TOTAL TAX TO NOMINAL GDP)
Country 2006 2007 2008 2009 2010 2011
Algeria 40.7 37.2 45.3 34.9 n/a n/aBotswana 24.2 22.7 22.3 24.3 20.2 20.8Brazil 16.5 16.8 16.7 15.4 15.3 n/aCanada 13.7 13.7 12.8 12.4 11.9 n/aChile 19.5 20.3 18.7 14.5 17.5 19.1Norway 29.4 28.6 28.3 26.6 27.4 28.4Russian Federation 16.6 16.6 15.8 13.0 13.4 n/aSouth Africa 28.4 28.9 28.1 25.5 26.0 n/aUnited Kingdom 27.9 27.5 28.8 25.7 26.7 n/aSource: World Bank
CHART 2.9: RATIOS OF NON-MINERAL TAX TO TOTAL NOMINAL AND NON-MINING GDP
Source: Ministry of Finance and Development Planning and Statistics Botswana
CHART 2.8: GROWTH OF NON-MINERAL TAX REVENUE (NMTR) AND RATIO OF NMTR TO GDP
Source: Ministry of Finance and Development Planning and Statistics Botswana
-5
0
5
10
15
20
25
30
35
1995
/96
1997
/98
1999
/00
2001
/02
2003
/04
2005
/06
2007
/08
2009
/10
2011
/12
Perc
ent
Non-Mineral Tax Revenue Growth
Ratio of Non-Mineral Income Tax to GDP
6
8
10
12
14
16
18
2006
/07
2007
/08
2008
/09
2009
/10
2010
/11
2011
/12
Perc
ent
Ratio of Non-Mineral Tax to Total Nominal GDP
Ratio of Non-Mineral Tax to Non-Mineral GDP
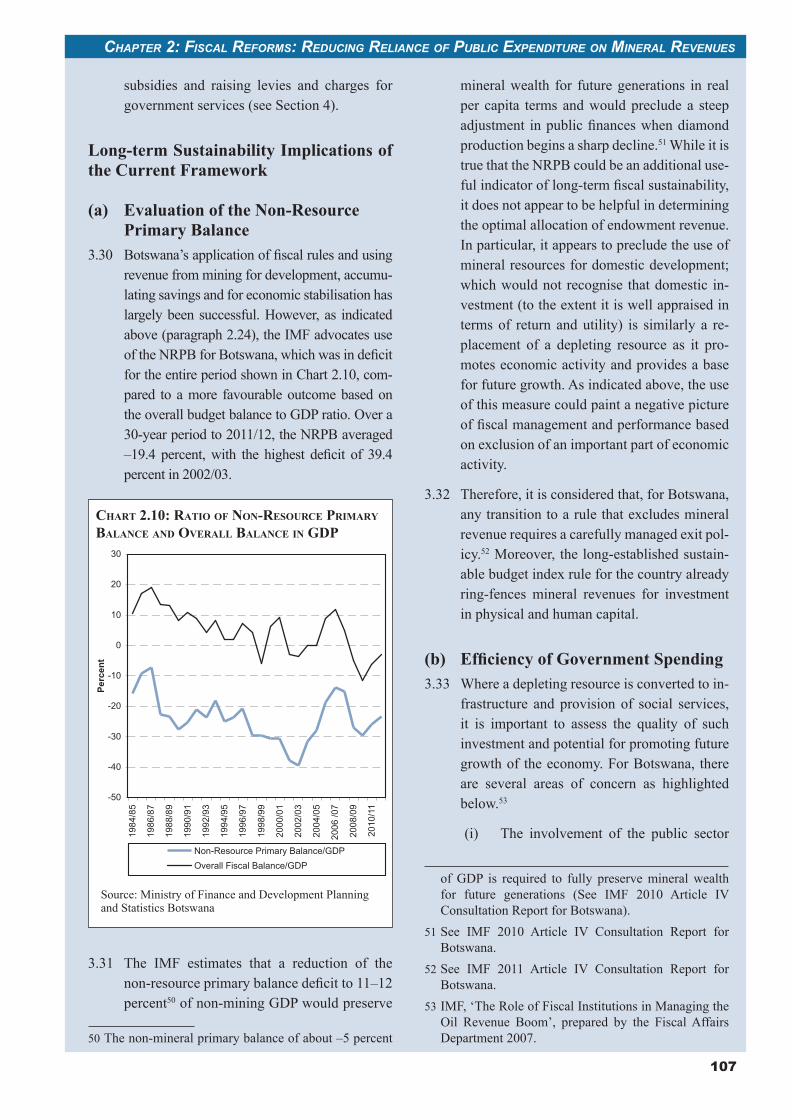
107
CHAPTER 2: FISCAL REFORMS: REDUCING RELIANCE OF PUBLIC EXPENDITURE ON MINERAL REVENUES
subsidies and raising levies and charges for government services (see Section 4).
Long-term Sustainability Implications of the Current Framework
(a) Evaluation of the Non-Resource Primary Balance
3.30 Botswana’s application of fiscal rules and using revenue from mining for development, accumu-lating savings and for economic stabilisation has largely been successful. However, as indicated above (paragraph 2.24), the IMF advocates use of the NRPB for Botswana, which was in deficit for the entire period shown in Chart 2.10, com-pared to a more favourable outcome based on the overall budget balance to GDP ratio. Over a 30-year period to 2011/12, the NRPB averaged –19.4 percent, with the highest deficit of 39.4 percent in 2002/03.
3.31 The IMF estimates that a reduction of the non-resource primary balance deficit to 11–12 percent50 of non-mining GDP would preserve
50 The non-mineral primary balance of about –5 percent
mineral wealth for future generations in real per capita terms and would preclude a steep adjustment in public finances when diamond production begins a sharp decline.51 While it is true that the NRPB could be an additional use-ful indicator of long-term fiscal sustainability, it does not appear to be helpful in determining the optimal allocation of endowment revenue. In particular, it appears to preclude the use of mineral resources for domestic development; which would not recognise that domestic in-vestment (to the extent it is well appraised in terms of return and utility) is similarly a re-placement of a depleting resource as it pro-motes economic activity and provides a base for future growth. As indicated above, the use of this measure could paint a negative picture of fiscal management and performance based on exclusion of an important part of economic activity.
3.32 Therefore, it is considered that, for Botswana, any transition to a rule that excludes mineral revenue requires a carefully managed exit pol-icy.52 Moreover, the long-established sustain-able budget index rule for the country already ring-fences mineral revenues for investment in physical and human capital.
3.33 Where a depleting resource is converted to in-frastructure and provision of social services, it is important to assess the quality of such investment and potential for promoting future growth of the economy. For Botswana, there are several areas of concern as highlighted below.53
(i) The involvement of the public sector
of GDP is required to fully preserve mineral wealth for future generations (See IMF 2010 Article IV Consultation Report for Botswana).
51 See IMF 2010 Article IV Consultation Report for Botswana.
52 See IMF 2011 Article IV Consultation Report for Botswana.
53 IMF, ‘The Role of Fiscal Institutions in Managing the Oil Revenue Boom’, prepared by the Fiscal Affairs Department 2007.
CHART 2.10: RATIO OF NON-RESOURCE PRIMARY BALANCE AND OVERALL BALANCE IN GDP
Source: Ministry of Finance and Development Planning and Statistics Botswana
-50
-40
-30
-20
-10
0
10
20
30
1984
/85
1986
/87
1988
/89
1990
/91
1992
/93
1994
/95
1996
/97
1998
/99
2000
/01
2002
/03
2004
/05
2006
/07
2008
/09
2010
/11
Perc
ent
Non-Resource Primary Balance/GDPOverall Fiscal Balance/GDP
108
BANK OF BOTSWANA ANNUAL REPORT 2012
in a wide range of investments beyond provision of core public goods requires careful evaluation of benefits and re-turns and minimisation of wastage; for example, with respect to the construc-tion of office buildings and support of agricultural programmes. In addition, the combination of deferred mainte-nance and a loose definition of invest-ment potentially weakens the qual-ity and efficiency of public investment spending.54
(ii) Weak project appraisal and manage-ment was addressed in the 2012 Budget Speech, where it was indicated that project implementation, management and overall cost continue to be a chal-lenge in Government. It was further pointed out that, while in the earlier periods, this problem mainly reflected shortage of skilled manpower, recent failure is attributed to delays in com-mencement and completion of proj-ects, over-specification of designs and change in scope of on-going projects resulting in cost overruns.55 A further concern is that, the recurrent implica-tions of development spending, such as costs of operation and maintenance, and manpower provision, are not properly accounted for, especially in the context of changing project specifications.
(iii) There is need to improve on follow-up evaluation to establish whether the anticipated benefits of spending are be-ing realised, given that total spending on a project or sector is an imperfect
54 For example, the observation that, while Botswana has had a record of success in managing resource rev-enues, it did not completely escape wasteful expendi-tures, particularly in the areas of defence, community and social services, and agriculture, the expansion of which now yields dwindling benefits by Coutinho, L. (2011) ‘The Resource Curse and Fiscal Policy’ in Cyprus Policy Review, Vol. 5, No.1, pp. 43 – 70 (2011) 1450-4561.
55 Ministry of Finance and Development Planning, Budget Speech delivered by Honourable O.K. Matambo to the National Assembly on 1st February 2012.
indicator of the value of the underly-ing investment. For example, spend-ing on education (about 25 percent of total government expenditure) does not appear justified by the quality of out-put. Compared to other middle income countries, per capita spending on edu-cation in Botswana is higher, although the quality in terms of value to the economy is no better (IMF, Article IV Reports, 2011 and 2012). Another area where more rigorous evaluation is re-quired is the impact of agricultural as-sistance programmes.
(iv) In terms of the relatively high public sector wage bill, comparison with oth-er countries should be tempered with the consideration that Botswana is a sparsely populated large country, such that the provision of infrastructure and social and extension services necessi-tates som e duplication of facilities.
(v) Multiple public funds (and special proj-ects) established either to complement raising of revenue or to pre-fund future commitments often lose their original objectives. This practice impedes ef-ficiency in resource allocation through the normal budgetary process, and has undesirable potential to undermine fis-cal consistency, coordination, transpar-ency and accountability in government spending.
4. BOTSWANA’S FISCAL REFORM PROGRAMME
4.1 A continuous reform of the fiscal policy frame-work is necessary to address weaknesses and to adapt to changing circumstances. In particular, the inevitable depletion of diamond resources, most recently forecast to occur by 202956 neces-sitates examination of the medium to long-term balance between government expenditure and
56 Basdevant, O. “Are Diamonds Forever? Using the Permanent Income Hypothesis to Analyse Botswana’s Reliance on Diamond Revenue”, IMF Working Paper WP/08/80. It is noted, however, that if production from the mines is kept below potential, say in response to weak demand, the life of the mines would be extended.
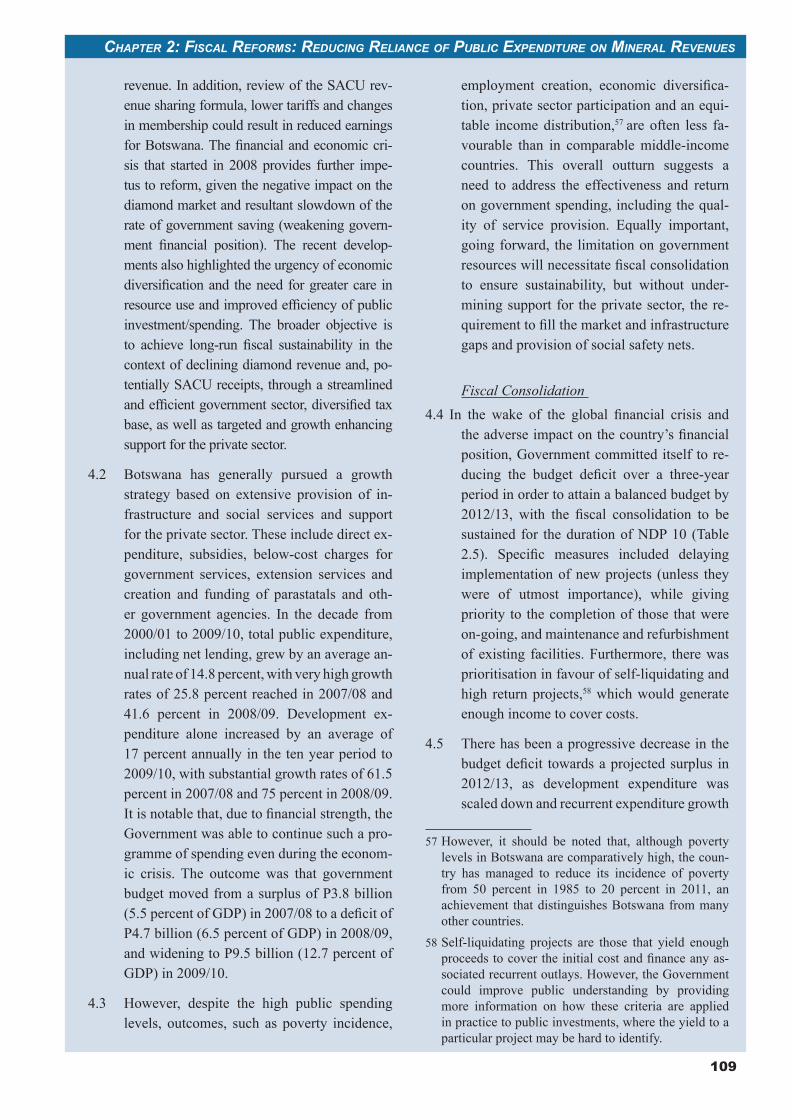
109
CHAPTER 2: FISCAL REFORMS: REDUCING RELIANCE OF PUBLIC EXPENDITURE ON MINERAL REVENUES
revenue. In addition, review of the SACU rev-enue sharing formula, lower tariffs and changes in membership could result in reduced earnings for Botswana. The financial and economic cri-sis that started in 2008 provides further impe-tus to reform, given the negative impact on the diamond market and resultant slowdown of the rate of government saving (weakening govern-ment financial position). The recent develop-ments also highlighted the urgency of economic diversification and the need for greater care in resource use and improved efficiency of public investment/spending. The broader objective is to achieve long-run fiscal sustainability in the context of declining diamond revenue and, po-tentially SACU receipts, through a streamlined and efficient government sector, diversified tax base, as well as targeted and growth enhancing support for the private sector.
4.2 Botswana has generally pursued a growth strategy based on extensive provision of in-frastructure and social services and support for the private sector. These include direct ex-penditure, subsidies, below-cost charges for government services, extension services and creation and funding of parastatals and oth-er government agencies. In the decade from 2000/01 to 2009/10, total public expenditure, including net lending, grew by an average an-nual rate of 14.8 percent, with very high growth rates of 25.8 percent reached in 2007/08 and 41.6 percent in 2008/09. Development ex-penditure alone increased by an average of 17 percent annually in the ten year period to 2009/10, with substantial growth rates of 61.5 percent in 2007/08 and 75 percent in 2008/09. It is notable that, due to financial strength, the Government was able to continue such a pro-gramme of spending even during the econom-ic crisis. The outcome was that government budget moved from a surplus of P3.8 billion (5.5 percent of GDP) in 2007/08 to a deficit of P4.7 billion (6.5 percent of GDP) in 2008/09, and widening to P9.5 billion (12.7 percent of GDP) in 2009/10.
4.3 However, despite the high public spending levels, outcomes, such as poverty incidence,
employment creation, economic diversifica-tion, private sector participation and an equi-table income distribution,57 are often less fa-vourable than in comparable middle-income countries. This overall outturn suggests a need to address the effectiveness and return on government spending, including the qual-ity of service provision. Equally important, going forward, the limitation on government resources will necessitate fiscal consolidation to ensure sustainability, but without under-mining support for the private sector, the re-quirement to fill the market and infrastructure gaps and provision of social safety nets.
Fiscal Consolidation 4.4 In the wake of the global financial crisis and
the adverse impact on the country’s financial position, Government committed itself to re-ducing the budget deficit over a three-year period in order to attain a balanced budget by 2012/13, with the fiscal consolidation to be sustained for the duration of NDP 10 (Table 2.5). Specific measures included delaying implementation of new projects (unless they were of utmost importance), while giving priority to the completion of those that were on-going, and maintenance and refurbishment of existing facilities. Furthermore, there was prioritisation in favour of self-liquidating and high return projects,58 which would generate enough income to cover costs.
4.5 There has been a progressive decrease in the budget deficit towards a projected surplus in 2012/13, as development expenditure was scaled down and recurrent expenditure growth
57 However, it should be noted that, although poverty levels in Botswana are comparatively high, the coun-try has managed to reduce its incidence of poverty from 50 percent in 1985 to 20 percent in 2011, an achievement that distinguishes Botswana from many other countries.
58 Self-liquidating projects are those that yield enough proceeds to cover the initial cost and finance any as-sociated recurrent outlays. However, the Government could improve public understanding by providing more information on how these criteria are applied in practice to public investments, where the yield to a particular project may be hard to identify.
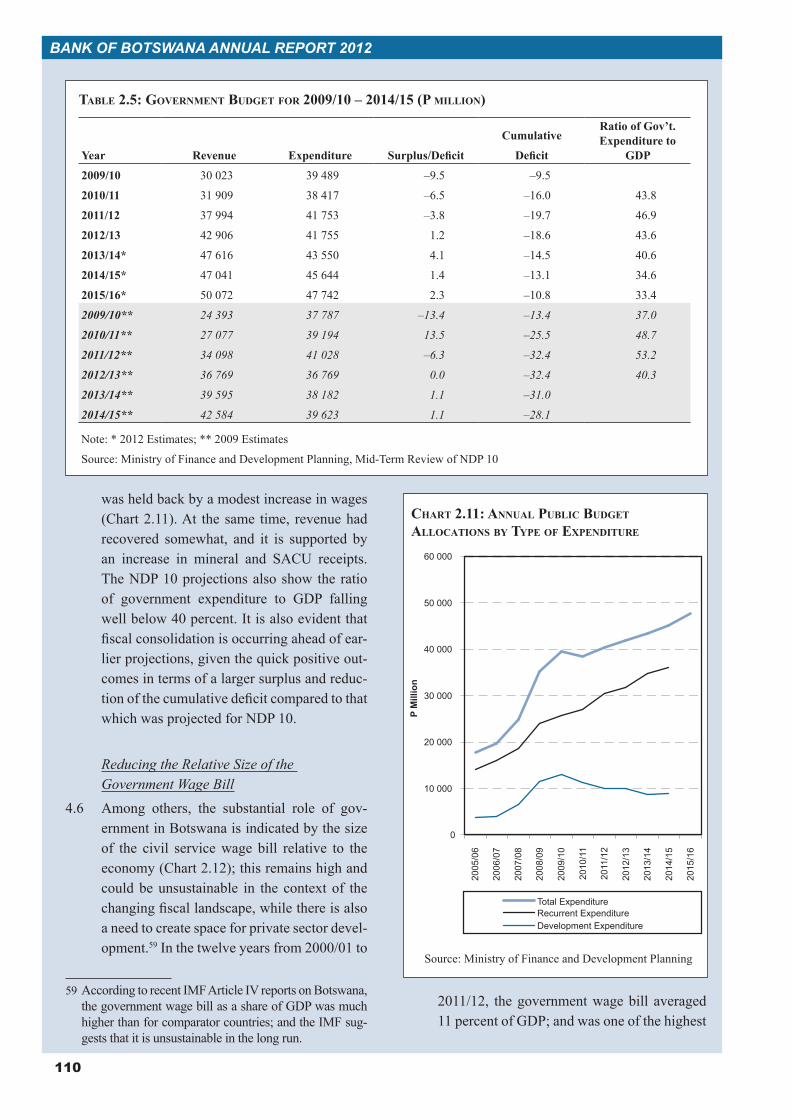
110
BANK OF BOTSWANA ANNUAL REPORT 2012
TABLE 2.5: GOVERNMENT BUDGET FOR 2009/10 – 2014/15 (P MILLION)
Year Revenue Expenditure
CumulativeRatio of Gov’t. Expenditure to
GDP
2009/10 30 023 39 489 –9.5 –9.5
2010/11 31 909 38 417 –6.5 –16.0 43.8
2011/12 37 994 41 753 –3.8 –19.7 46.9
2012/13 42 906 41 755 1.2 –18.6 43.6
2013/14* 47 616 43 550 4.1 –14.5 40.6
2014/15* 47 041 45 644 1.4 –13.1 34.6
2015/16* 50 072 47 742 2.3 –10.8 33.4
2009/10** 24 393 37 787 –13.4 –13.4 37.0
2010/11** 27 077 39 194 13.5 –25.5 48.7
2011/12** 34 098 41 028 –6.3 –32.4 53.2
2012/13** 36 769 36 769 0.0 –32.4 40.3
2013/14** 39 595 38 182 1.1 –31.0
2014/15** 42 584 39 623 1.1 –28.1
Note: * 2012 Estimates; ** 2009 Estimates
Source: Ministry of Finance and Development Planning, Mid-Term Review of NDP 10
was held back by a modest increase in wages (Chart 2.11). At the same time, revenue had recovered somewhat, and it is supported by an increase in mineral and SACU receipts. The NDP 10 projections also show the ratio of government expenditure to GDP falling well below 40 percent. It is also evident that fiscal consolidation is occurring ahead of ear-lier projections, given the quick positive out-comes in terms of a larger surplus and reduc-tion of the cumulative deficit compared to that which was projected for NDP 10.
Reducing the Relative Size of the Government Wage Bill
4.6 Among others, the substantial role of gov-ernment in Botswana is indicated by the size of the civil service wage bill relative to the economy (Chart 2.12); this remains high and could be unsustainable in the context of the changing fiscal landscape, while there is also a need to create space for private sector devel-opment.59 In the twelve years from 2000/01 to
59 According to recent IMF Article IV reports on Botswana, the government wage bill as a share of GDP was much higher than for comparator countries; and the IMF sug-gests that it is unsustainable in the long run.
2011/12, the government wage bill averaged 11 percent of GDP; and was one of the highest
CHART 2.11: ANNUAL PUBLIC BUDGET ALLOCATIONS BY TYPE OF EXPENDITURE
Source: Ministry of Finance and Development Planning
0
10 000
20 000
30 000
40 000
50 000
60 000
2005
/06
2006
/07
2007
/08
2008
/09
2009
/10
2010
/11
2011
/12
2012
/13
2013
/14
2014
/15
2015
/16
P M
illio
n
Total ExpenditureRecurrent ExpenditureDevelopment Expenditure
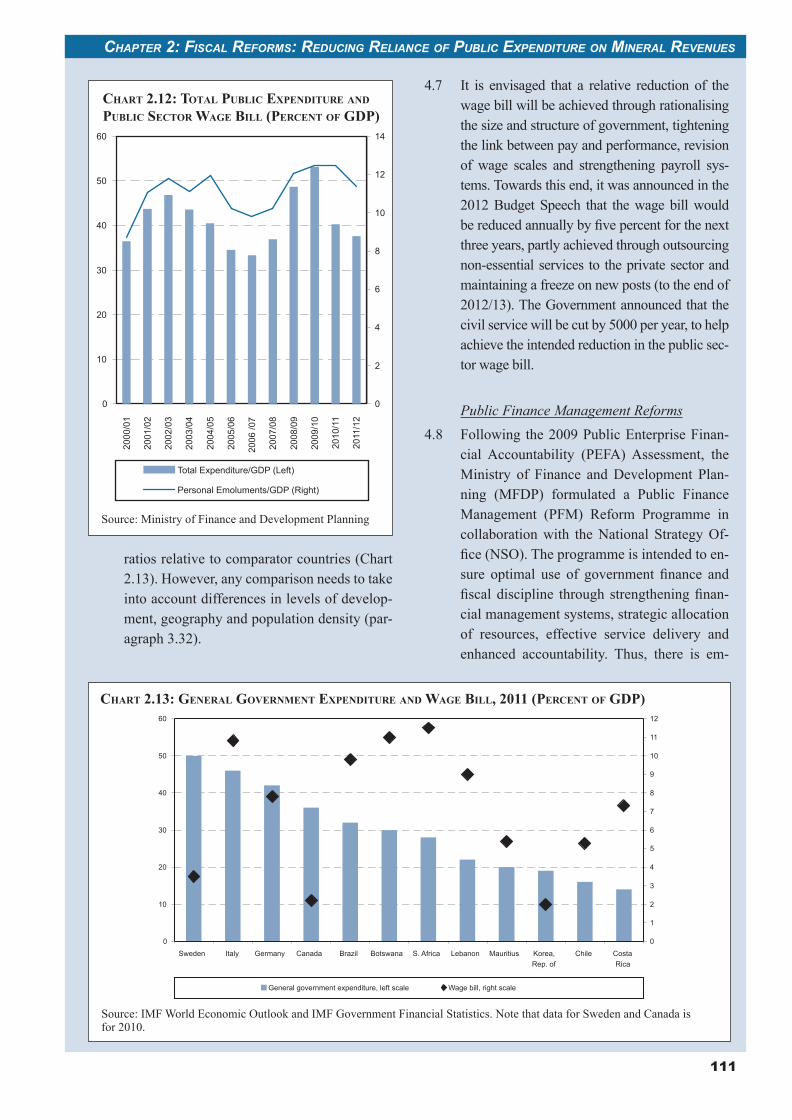
111
CHAPTER 2: FISCAL REFORMS: REDUCING RELIANCE OF PUBLIC EXPENDITURE ON MINERAL REVENUES
ratios relative to comparator countries (Chart 2.13). However, any comparison needs to take into account differences in levels of develop-ment, geography and population density (par-agraph 3.32).
CHART 2.12: TOTAL PUBLIC EXPENDITURE AND PUBLIC SECTOR WAGE BILL (PERCENT OF GDP)
Source: Ministry of Finance and Development Planning
4.7 It is envisaged that a relative reduction of the wage bill will be achieved through rationalising the size and structure of government, tightening the link between pay and performance, revision of wage scales and strengthening payroll sys-tems. Towards this end, it was announced in the 2012 Budget Speech that the wage bill would be reduced annually by five percent for the next three years, partly achieved through outsourcing non-essential services to the private sector and maintaining a freeze on new posts (to the end of 2012/13). The Government announced that the civil service will be cut by 5000 per year, to help achieve the intended reduction in the public sec-tor wage bill.
Public Finance Management Reforms4.8 Following the 2009 Public Enterprise Finan-
cial Accountability (PEFA) Assessment, the Ministry of Finance and Development Plan-ning (MFDP) formulated a Public Finance Management (PFM) Reform Programme in collaboration with the National Strategy Of-fice (NSO). The programme is intended to en-sure optimal use of government finance and fiscal discipline through strengthening finan-cial management systems, strategic allocation of resources, effective service delivery and enhanced accountability. Thus, there is em-
CHART 2.13: GENERAL GOVERNMENT EXPENDITURE AND WAGE BILL, 2011 (PERCENT OF GDP)
0
10
20
30
40
50
6020
00/0
1
2001
/02
2002
/03
2003
/04
2004
/05
2005
/06
2006
/07
2007
/08
2008
/09
2009
/10
2010
/11
2011
/12
0
2
4
6
8
10
12
14
Total Expenditure/GDP (Left)
Personal Emoluments/GDP (Right)
Source: IMF World Economic Outlook and IMF Government Financial Statistics. Note that data for Sweden and Canada is for 2010.
0
10
20
30
40
50
60
Sweden Italy Germany Canada Brazil Botswana S. Africa Lebanon Mauritius Korea,Rep. of
Chile CostaRica
0
1
2
3
4
5
6
7
8
9
10
11
12
General government expenditure, left scale Wage bill, right scale
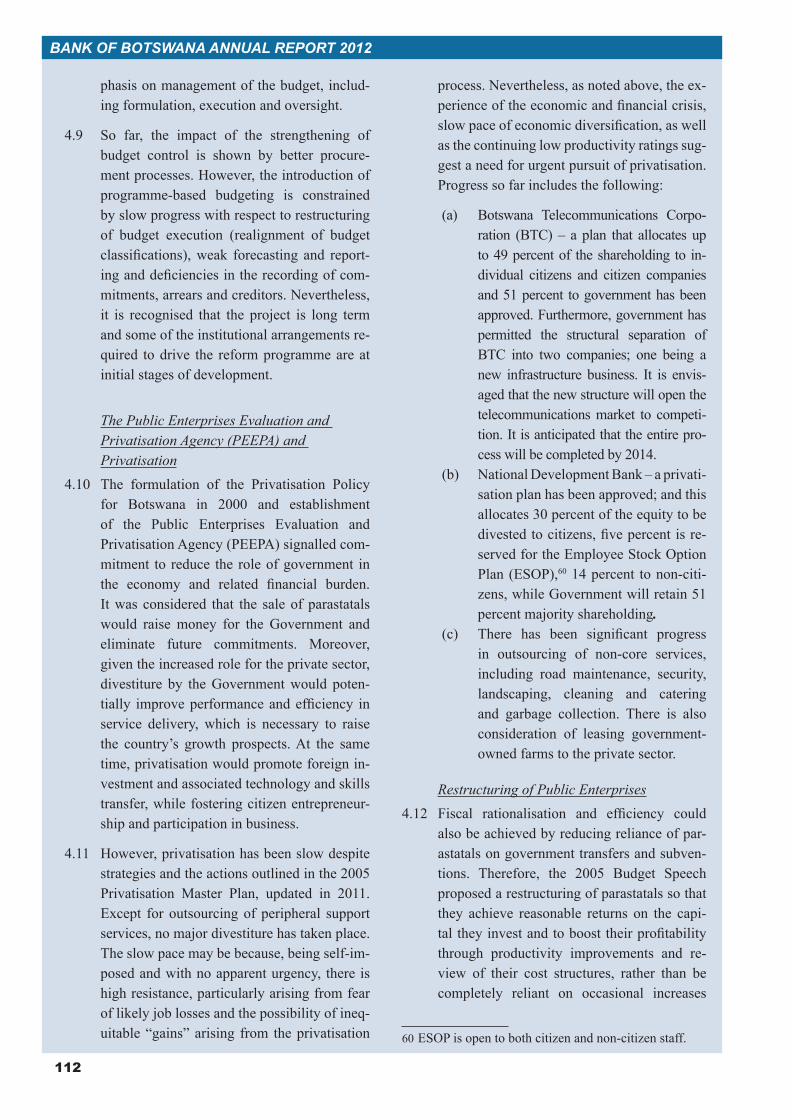
112
BANK OF BOTSWANA ANNUAL REPORT 2012
phasis on management of the budget, includ-ing formulation, execution and oversight.
4.9 So far, the impact of the strengthening of budget control is shown by better procure-ment processes. However, the introduction of programme-based budgeting is constrained by slow progress with respect to restructuring of budget execution (realignment of budget classifications), weak forecasting and report-ing and deficiencies in the recording of com-mitments, arrears and creditors. Nevertheless, it is recognised that the project is long term and some of the institutional arrangements re-quired to drive the reform programme are at initial stages of development.
The Public Enterprises Evaluation and Privatisation Agency (PEEPA) and Privatisation
4.10 The formulation of the Privatisation Policy for Botswana in 2000 and establishment of the Public Enterprises Evaluation and Privatisation Agency (PEEPA) signalled com-mitment to reduce the role of government in the economy and related financial burden. It was considered that the sale of parastatals would raise money for the Government and eliminate future commitments. Moreover, given the increased role for the private sector, divestiture by the Government would poten-tially improve performance and efficiency in service delivery, which is necessary to raise the country’s growth prospects. At the same time, privatisation would promote foreign in-vestment and associated technology and skills transfer, while fostering citizen entrepreneur-ship and participation in business.
4.11 However, privatisation has been slow despite strategies and the actions outlined in the 2005 Privatisation Master Plan, updated in 2011. Except for outsourcing of peripheral support services, no major divestiture has taken place. The slow pace may be because, being self-im-posed and with no apparent urgency, there is high resistance, particularly arising from fear of likely job losses and the possibility of ineq-uitable “gains” arising from the privatisation
process. Nevertheless, as noted above, the ex-perience of the economic and financial crisis, slow pace of economic diversification, as well as the continuing low productivity ratings sug-gest a need for urgent pursuit of privatisation. Progress so far includes the following:
(a) Botswana Telecommunications Corpo-ration (BTC) – a plan that allocates up to 49 percent of the shareholding to in-dividual citizens and citizen companies and 51 percent to government has been approved. Furthermore, government has permitted the structural separation of BTC into two companies; one being a new infrastructure business. It is envis-aged that the new structure will open the telecommunications market to competi-tion. It is anticipated that the entire pro-cess will be completed by 2014.
(b) National Development Bank – a privati-sation plan has been approved; and this allocates 30 percent of the equity to be divested to citizens, five percent is re-served for the Employee Stock Option Plan (ESOP),60 14 percent to non-citi-zens, while Government will retain 51 percent majority shareholding.
(c) There has been significant progress in outsourcing of non-core services, including road maintenance, security, landscaping, cleaning and catering and garbage collection. There is also consideration of leasing government-owned farms to the private sector.
Restructuring of Public Enterprises4.12 Fiscal rationalisation and efficiency could
also be achieved by reducing reliance of par-astatals on government transfers and subven-tions. Therefore, the 2005 Budget Speech proposed a restructuring of parastatals so that they achieve reasonable returns on the capi-tal they invest and to boost their profitability through productivity improvements and re-view of their cost structures, rather than be completely reliant on occasional increases
60 ESOP is open to both citizen and non-citizen staff.
113
CHAPTER 2: FISCAL REFORMS: REDUCING RELIANCE OF PUBLIC EXPENDITURE ON MINERAL REVENUES
in tariffs. At the same time, parastatals were required to improve service delivery and ful-fil specific developmental roles to fill gaps in areas which are not attractive to the private sector. Examples of restructuring include the following:
(a) commercialisation of public institu-tions, whereby functions are accounted for on a full-cost basis, instead of con-sidering direct costs only, thus trans-forming state-owned enterprises into business units.
(b) recapitalisation, which involves conversion of debt owed to govern-ment into equity, in order to have a balanced debt-equity mix and poten-tially promote commercial viability of the business; a recognition that a high debt level attracts costly interest payments, which could erode earn-ings and capacity to self-finance. In turn, the Government requires para-statals that do not pay taxes to pay a dividend of 25 percent of their profit. However, there continues to be a net transfer of funds to parastatals from the Government.61
(c) following a review and report on the “Rationalisation of Certain Parastatals and Public Entities”, several mergers of parastatals and government agencies was considered. The objective was to avert the duplication of administration costs across entities carrying out related activities that could be combined to achieve synergy. Progress so far has been the merger of the Botswana Export Development and Investment Authority and the International Financial Services Centre in April 2012 to form the Botswana Investment and Trade Centre (BITC). Other public enterprises to be combined are Botswana Postal Services and Botswana Savings Bank, while the merger between the Botswana Technology Centre with the
61 This estimate excludes payments by Bank of Botswana.
Rural Industries Innovation Centre is on-going.
Broadening the Non-Mineral Revenue Base4.13 Review of the fiscal framework also requires a
holistic assessment of the tax system, includ-ing the balance between direct and indirect taxes and the costs and benefits of preferen-tial tax treatment in the form of lower rates or exemptions. Taxes are the primary source of government revenue and effective admin-istration and maximisation of collections is crucial to sustaining the expenditure pro-gramme. However, the 2009 Botswana Public Expenditure and Financial Accountability Assessment Report indicated that effective-ness of tax collection in the country is very low62 despite the relatively low tax rate re-gime. Therefore, there is room to improve on collection of non-mineral taxes as an integral part of the fiscal consolidation strategy. This will cover scope for additional taxpayers and reduce tax incentives and exemptions (espe-cially in a moderate tax environment), thus raising the tax base.
4.14 Generous and widespread tax exemptions weaken the tax collection effort, because when tax systems are seen as unfair or open to nego-tiation, voluntary compliance is undermined, while the costs of administration increase. Moreover, entrepreneurs’ efforts are increas-ingly diverted into securing favourable tax treatment rather than growing their business-es. Indeed, there is little evidence to suggest that incentives lead to any significant lasting economic benefits to the economy compared to a tax regime of uniformly applicable rates. In general, businesses are likely to appreciate an environment which is characterised by cer-tainty and a tax regime that yields sufficient revenues to ensure the provision of public in-frastructure that supports their operations and economic activity broadly. It is also impor-
62 Effectiveness of tax collection scored “D+” in this as-sessment, while ‘transparency of tax payer obligations and liabilities’ and the ‘effectiveness of measures for taxpayer registration and tax assessment’ were both rated “B”.
114
BANK OF BOTSWANA ANNUAL REPORT 2012
tant that changes to tax rates are announced well in advance and, if necessary, introduced incrementally to allow taxpayers time to plan appropriately.
Cost Sharing and Recovery Measures4.15 It is recognised that the provision of public
services comes at a cost, which can be cov-ered through (higher) taxes, which is opaque, or through more transparent direct payment for the service provided, albeit often on a sub-sidised basis involving cost sharing and par-tial cost recovery. In addition to transparency, paying for public services, could engender an increase in productivity and efficiency as users have an incentive to demand value for money.63 More generally, cost recovery helps to ensure sustainability of service provision (that is not dependent on pooled resources). To underscore the importance of this avenue of revenue collection and reducing the cost to Government, a Cost Recovery Unit was established in the Ministry of Finance and Development Planning and has responsibility for reviewing charges and levies for govern-ment services. Continuous monitoring and as-sessment is important in order to re-evaluate the case for subsidies and to minimise erosion of value recovered due to inflation.
4.16 Variations of cost recovery exist across the spectrum of government services; for exam-ple, in areas such as education, health, agri-culture, road usage and business registration. However, in most instances these are provided at below cost. Even then, weak monitoring and enforcement sometimes undermines the cost recovery effort. In such cases, in the ab-sence of a decision to raise charges to mean-ingful levels, it might be more cost effective to drop the levy altogether, allowing the costs to be covered by general taxation, thus, saving
63 For example, if local authority funding (which is cur-rently dominated by grants from central government) was more dependent on property taxes, there could be greater accountability over provisions of local serv-ices. Also, the various levies related to motor vehicles, are generally low and out of line with international norms for road usage charges.
on the administration expenses. It is also clear that, although provided by parastatals, some elements of energy and water reticulation and public housing are subsidised. For example, connections for electricity have been stand-ardised at P5000 from the previous situation where clients paid the full cost of connect-ing to the grid. Going forward, it should also be possible for means testing for some of the government support, albeit taking account of the administration effort that in some instanc-es can be costly (reducing the saving and/or potential revenue).
5. FISCAL DOWNSIZING AND PROMOTING PRIVATE SECTOR DEVELOPMENT
5.1 A reduction in the size of government relative to the economy implies a shift in the balance of economic activity away from the public sector to the private sector, achieved through a successful private sector development strat-egy, supported by initiatives to diversify the economy. The Government has long recog-nised the need for economic diversification, both within and outside mining, in order to create jobs, widen economic opportunities and generate sources of growth that would help raise living standards and improve in-come distribution. The success in negotiat-ing the relocation of De Beers’ aggregation of diamonds to Botswana, associated ben-eficiation and downstream activities should promote private sector growth and diversifi-cation. More generally, various interventions to improve viability and participation of the private sector in the economy are in place and include the provision of infrastructure and fi-nance, promotion of both domestic and exter-nal markets and business skills development supported by a variety of institutions.64 Some of the significant initiatives to promote private sector development and economic diversifica-tion are outlined below.
64 In addition to the short write up below, extensive dis-cussion of the role and performance of these institu-tions is covered in previous Bank of Botswana Annual Reports.
115
CHAPTER 2: FISCAL REFORMS: REDUCING RELIANCE OF PUBLIC EXPENDITURE ON MINERAL REVENUES
Business and Economic Advisory Council
5.2 The creation of the Business and Economic Advisory Council (BEAC) in 2005 added impetus to the pursuit of economic di-versification and sustainable growth. An important output of the BEAC was pub-lication of the “Botswana Excellence – A Strategy for Economic Diversification and Sustainable Growth”, which outlined initi-atives to tackle the primary challenge of di-versifying the economy for sustained eco-nomic growth, in the post mineral era. The resulting “Action Plan” detailed projects that would drive the economic diversifica-tion and sustainable growth strategy.65 The implementation plan also involved crea-tion of the Government Implementation Coordination Office (renamed the National Strategy Office) in 2007, with a mandate to monitor and evaluate the implementation of actions and projects emanating from the strategy, as well as other government poli-cies, programmes and projects. While the coordination efforts of the NSO are lauda-ble, taking the lead in formulating national policies and strategies will, however, need to be supported by expertise across sev-eral disciplines, which has to be built up over time. Otherwise, it suffices at this stage for NSO to focus on ensuring timely implementation and coordination of pro-grammes and monitoring performance.
5.3 The Economic Diversification Drive (EDD) initiative, introduced in 2010, has the short-run aim of exploiting the Government’s purchasing power to stimulate domestic production and consumption though local procurement of goods and services, particu-larly in the context of an outsourcing strat-egy. It is expected that, with the benefit of experience and (initially) a stable market, local businesses could grow to be globally
65 The two documents were approved by Cabinet in December 2006 and November 2008, respectively.
competitive enterprises and contribute to eco-nomic diversification as the relative size of the public sector is reduced.
Financial Sector Development Strategy5.4 The Financial Sector Development Strategy
(2012 – 2016) provides scope for enhanced private sector participation in the econ-omy in place of the extensive role for the Government. In particular, the proposals for enhancing access to finance would support outsourcing and rationalisation efforts by the Government, alongside a general contri-bution to economic activity, diversification and growth of the private sector. The focus on improvement of capital markets is also relevant in advocating for private sector and commercial bank financing of govern-ment infrastructure and investment by par-astatals. Similarly, it is possible to achieve efficiency and improvement in quality if some aspects of education (for example, tertiary) could be funded through the bank-ing system. Overall, implementation of the strategy will, to a reasonable extent, allevi-ate government outlays for development and provision of social services and funding of infrastructure development by parastatals.
Hubs66
5.5 Six hubs or sector clusters were established in 2008 in order to promote economic diver-sification and sustainable growth. The hubs are intended to coordinate the involvement of both the private sector and government and al-location of resources in key areas and sectors. Thus, a successful programme of the hubs is, in the long run, envisaged to transform Botswana into a diversified knowledge-based, innovative and investor friendly economy that complements, rather than being dependent on the mining sector. Tangible efforts so far in-clude launch of the country’s first dedicated Science and Technology Park for the innova-tion hub.
66 Adapted from Botswana Government website.
116
BANK OF BOTSWANA ANNUAL REPORT 2012
Hub Objective
Innovation Creating or attracting technology-driven, knowl-edge intensive businesses, research institutes and advanced training organisations.
Education Regional centre of excellence and to attract the best institutions and students from other countries.
Health Identifies strategic initiatives and innovations to drive transformation and service delivery im-provement within the health sector.
Diamond Creation of a competitive and sustainable dia-mond industry in Botswana, as well as to gener-ate employment oppor tunities and transfer of relevant diamond skills to citizens.
Agriculture Driving force for the commercialisation and diversification of the sector and to develop an environment that will encourage, facilitate and support the viability and sustainability of the industry.
Transport Identify and coordinate key projects and policy interventions required in the transport sector in order to develop Botswana as a transport hub within the SADC region.
National Doing Business Committee5.6 As well as reducing the relative size of gov-
ernment, it is important to maintain a condu-cive environment for innovation and business development. While macroeconomic policies and performance have generally been support-ive of private sector development, a number of micro factors and administrative requirements have been found to be a constraint. The symp-toms of this malady is the low rankings in the international competitiveness indices. In re-sponse, a National Doing Business Committee (NDBC) was set up in 2011 for the purpose of reforming the domestic business climate and improving global competitiveness. The Committee has made progress in driving im-plementation of necessary reforms, notably the enactment of e-legislation and the review of immigration procedures and labour laws to attract skilled expatriate labour to Botswana, especially in the context of relocation of the Diamond Trading Centre from London to Gaborone. Nonetheless, international indices ranking remain disappointingly low, indicat-ing the need for further progress in the area of “ease of doing business”.
The Competition Authority 5.7 The Competition Authority was established
under the Competition Act of 2009 to moni-tor, control and prohibit anti-competitive trade or business practices in the economy. Competition policy is a key aspect of econom-ic management as it promotes market princi-ples, such as easing barriers to market entry by new firms and can alleviate entrenchment of inefficient business practices and persistence of high costs in the economy. Through laws that promote fair competition and regulation of anti-competitive practices such as price-fixing and bid-rigging, the competition policy helps promote innovation and investment. Thus, the Authority regulates mergers and acquisitions, assesses vertical and horizontal agreements and monitors and controls acts of monopolisa-tion or abuse of market power. The Authority can, however, make exemptions where ac-tions, that might appear to be monopolistic or anti-competitive, are in the best interest of the public or result in superior outcomes than oth-erwise. Between March and September 2012, the Competition Authority had investigated 39 cases covering mergers and acquisitions, anti-competitive behaviour involving conniving to manipulate tender prices and abuse of market dominance.
Citizen Entrepreneurial Development Agency5.8 The Citizen Entrepreneurial Development
Agency (CEDA) was established in 2001, with the objective of providing low cost fi-nance and business skills development in or-der to promote citizen owned enterprises. It was expected that CEDA will help address constraints to citizen participation and viabil-ity of businesses, which persisted despite the existence of citizen empowerment schemes such as the Financial Assistance Policy (FAP).67 Therefore, CEDA provide a channel
67 The Financial Assistance Policy, a grant scheme, op-erated from 1982 to 2001 and aimed at easing the financial constraint to citizen, non-citizen and joint venture businesses across a range of sectors. However, for a variety of reasons, including weak management and monitoring and abuse, the performance of FAP
117
CHAPTER 2: FISCAL REFORMS: REDUCING RELIANCE OF PUBLIC EXPENDITURE ON MINERAL REVENUES
through which some of the existing empower-ment schemes would be consolidated.
The Local Enterprise Authority5.9 Local Enterprises Authority (LEA) was estab-
lished in 2004 to promote and facilitate entre-preneurship and enterprise development in the local industry through various targeted inter-ventions. Key to the vision of LEA is support to Small, Micro and Medium Size Enterprises (SMMEs) through training, mentoring, busi-ness plan formulation, market access facilita-tion, technology adoption and adaptation and linking with financial institutions to facilitate funding of enterprises. As such, LEA is set up as a one-stop shop providing development and support services to the needs of the domestic SMME industry, with the ultimate goal of nur-turing excellence and sustainability.
Property Rights5.10 The assurance of legal right to property con-
tributes to a favourable climate fostering pri-vate sector investment, as it protects the le-gitimacy and value of transactions, assets and liabilities. The legal right to property, which entails usage, transfer, trade and restraining unauthorised use by others, is vital to promot-ing private sector development and attracting foreign investment. In this regard, it is impor-tant that the legal coverage extends to intellec-tual property, relevant in the fields of innova-tion/invention, science, technology, literature and the arts. Thus, the Industrial Property Act of 2010 has aligned Botswana property rights law with international standards and includes procedures for registering patents, trademarks and copyrights.
6. CONCLUSION
6.1 The Botswana economy has recovered from the global recession of 2009 with the result that public finances have improved signifi-cantly and quicker than had initially been an-
deteriorated, there was a low success rate of busi-nesses supported by the scheme, which led to it being discontinued.
ticipated. However, the recent economic and financial crises have underscored the need to further strengthen the fiscal framework and management of public finances. This is essen-tial in view of the continuing fragility of the global economy and, looking further ahead, the anticipated depletion of the diamond re-source that is currently expected within the next two decades. The expected trend decline in revenues from SACU reinforces further the case for reforms to improve expenditure con-trols, broaden the revenue base and innova-tions in tax administration.
6.2 As highlighted in Section 2, for a number of resource endowed countries, the fiscal man-agement challenges are developmental, while it is also important to overcome the so-called “Dutch Disease” or broadly “resource curse”. In this regard, successful use of natural re-sources requires appropriate macroeconomic and social policies that promote inclusive economic growth and institutions that support good governance. Overall, a lasting contribu-tion of the resource endowment to prosperity requires careful balance between current con-sumption, spending on development and sav-ing for future generations.
6.3 The review of the conduct of fiscal policy in Botswana indicates that a strong foundation for effective management, based on an early com-mitment by the post-independence government to budgetary self-reliance, was put in place prior to the period when the country’s mineral wealth became apparent. Aspects of sound macroeco-nomic management and fiscal prudence are laid out in the series of NDPs, complemented by statutory measures, including the establishment of the consolidated and associated special funds. As mineral receipts became increasingly impor-tant, fiscal management was strengthened by fis-cal rules, particularly the sustainable budget in-dex to ensure that natural resource revenue was used for productive investment rather than for consumption. Also essential to this process was effective investment of the resulting surpluses in the form of foreign exchange reserves by the central bank.
118
BANK OF BOTSWANA ANNUAL REPORT 2012
6.4 While this successful track record augurs well for the future course of the country’s devel-opment, the challenges of fiscal policy imple-mentation remain. For example, while the SBI provides a robust framework at the macro level, it has been undermined by less-effective micro controls that have allowed low-return investments to proceed without sufficient scrutiny and costs have escalated through slippages in project management. At the same time, chronic under-spending at the aggre-gate level is a clear sign that implementation capacity had been over-extended. Moreover, the effectiveness of fiscal rules can quickly be undermined if they are not implemented in a transparent manner. With regard to revenues, the long-standing reliance on receipts from minerals and SACU has progressively drawn attention to the need to reform the tax system. This is both at the policy level, where there is need to review the benefits of widespread tax exemptions, and in tax collection procedures, as the tax effort is largely stagnant, if not fall-ing. In such circumstances, it is opportune to taking advantage of the latest technologies to encourage compliance and promote consulta-tion and dialogue with taxpayers.
6.5 In view of these and other challenges, the Government has embarked on a comprehen-sive programme of reforms to the manage-ment of public finances. The reviews include a re-balancing of government expenditure to focus on core activities and high return invest-ments (in either economic or social terms), together with more robust and efficient man-agement processes. Both these elements are necessary, and it is important that reforms are not just implemented at the superficial level of creating new structures and associated man-agement processes. These must be accompa-nied by a willingness to go ahead with critical decisions, for example, with respect to con-trolling the public sector wage bill, closing tax loopholes and privatisation.
6.6 It is also important that the management of public finances is viewed not in isolation but as complementary, or even subordinate, to the
broader process of economic development, with a particular emphasis on encouraging the private sector to play a greater role. In this re-gard, several initiatives have been launched in recent years and it is important that policy is effectively coordinated so that it is not under-mined by competing objectives or captured by special interest groups. It is also important to recognise the extent to which the Government can support the private sector not just through special support programmes but by the effec-tive provision of government services (mak-ing payment of taxes more straightforward and convenient, for example) and the removal of unnecessary regulations that continue to impede trade and commercial activity.