Embed Size (px)
Citation preview

1
Can market actors help monitor European banks?1
Anissa NAOUAR2
Université Paris X NANTERRE ECONOMIX
This version: JUIN29, 2007
Abstract In order to contribute to the debate on the potential use of the signals arising from financial markets as complement to the information available to supervisors, the paper focuses on the use of timely idiosyncratic equity market information to the monitoring of large European banks. I examine this question by conducting two sets of event studies. First, I address the question of whether financial market variables can timely anticipate changes of a constructed Financial Situation Rating (FSRating) of audited banks and then whether rating agencies can add information and help monitor European banks during the period 1990-2006. The first findings suggest that cumulative average abnormal returns anticipate the “stand alone” rating change of audited banks some quarter in advance. Thus, supervisors can derive useful monitoring information from these equity market signals but must carefully interpret excessive positive abnormal returns. The second specification, based on actions announced by rating agencies, show that positives actions are anticipated many days before the announcement date since they are associated with good information that are rapidly revealed to the market. “Watch” announcements lead to significant price variations, with prices rising in response to positive “watch” announcements, but not falling to negative “watch” announcements. Stock prices react very differently to rating downgrades. Shareholders are able to anticipate downgrades but still insensible to expected downgrades. Moreover, they anticipate very late the unexpected downgrades with small negative abnormal returns. Finally, the rating agencies’ expertise has a substantial importance since market prices react immediately after an unexpected downgrade. I conclude that rating agencies are able to collect and interpret efficiently bad news not already revealed to the public.
1 Thanks to Professor O.de Bandt for comments on an earlier draft, but all errors are mine. 2 Contact address : [email protected]

2
I- Introduction Financial markets play an unprecedented role in the financial system. On the one hand, financial markets are a driving force behind the increasing complexity of banks. They offer a large choice of sophisticated instruments to manage, diversify and even, sometimes, conceal risk. On the other hand, there is an increasing debate on the potential use of the signals arising from financial markets as a complement to the information available to supervisors. In this respect, markets may facilitate the tasks of supervisors in two ways. The debt holders can impose direct discipline on banking organisations by asking for high prices for the financing of risky activities. Thus, the appropriate pricing of risk may discourage banks from taking on risk profiles. Investors, when they timely and accurately evaluate changes in a firm’s condition and incorporate these assessments promptly into the firm’s security prices, indirectly discipline banks and these prices presumably could give supervisors an alternative reliable assessment of the bank condition. I focus on the contribution of timely equity market information to the supervisory monitoring of European banks. I believe that the equity claims of an organization’s owners have a number of advantages as a source of this type of information. First, as compared with other types of bank-related claims, markets for common shares are fairly liquid, and of greater depth and breadth than the debt markets so, the quality of the price signals is reasonably high. Second, on the choice of debt versus equity signals, interpreting debt spreads can be problematic. If the market’s perception is that uninsured debt holders might be protected, the signal from banking-related debt spreads also would be damped and perceived existence of “too big to fail” policies weakens the incentives of bond market participants to monitor banks. Third, most large banks have traded equity than have traded subordinated debt, and the most risky organisations are generally more reluctant to issue new debt bonds and than are automatically excluded of the sample. This problem creates a selectivity bias3 since the sample is no more representative.
Thus, even though equity investor’s preferences may not be as closely aligned with those of the supervisors (equity investors may prefer more risk than supervisors) and differences in incentives between debt holders and equity holders in theory,4 these should not be significant factors in considering the potential contribution of equity market information. Indeed, large stock returns (either positive or negative) could give supervisors an early warning of changes in the economic environment that are relevant to a bank conditions. I examine this possibility by conducting 2 event models to examine whether equity market variables anticipate bank distress and than lead the supervisory process. The bank distress is approached by using two risk proxies. The first one is based on the downgrades on Financial Situation Rating (FSRating) produced by banking supervisors which I tried to construct using data from FITCH-IBCA.5 The second specification is based on the negative actions 3 Heckman (1979) is the first to propose a two step econometric estimation as a solution to this technical problem. The paper of Covitz et al. (2004a) illustrates in this respect a comment of Stiroh (2004): “In other words, quantities also matter, particularly if they are zero.” 4 Equity claims present some complications because shareholders benefit if the issuer does well but have limited downside risk should losses occur, given the legal limits on their liability. Shareholders’ limited liability is a particularly prominent issue in banking. 5 Note that Market participants are not actively trying to guess what supervisory ratings will be, nor do they officially learn the outcomes of supervisory inspections. Than, equity market variables can not directly anticipate the supervisory ratings. That is why we have choose to use the source of potential supervisory evaluation rather than the supervisory actions themselves which are strictly confidential. Moreover, the potential for exam findings can be partially reflected in bank’s

3
announced by rating agencies. Thus, the two event studies examine whether bank equity based variables behave abnormally relative to a standard benchmark. More precisely, the paper focuses on idiosyncratic variation in equity market variables that might be useful to regulators if they timely anticipate the bank risk. The paper proceeds as follows: In section 2, I study the possibility of equity private sector use in the supervisory monitoring models. I begin by presenting the FSRating construction and describing the data and the estimation method used in this respect. I conduct than, an event study that test whether equity market measures anticipate changes in FSRatings. To my knowledge, such an event study regarding supervisory assessments is the first one performed in an European context. In section 3, I examine the additional role of rating’s agencies in market monitoring of bank soundness, by conducting a second event study. I also provide a description of the data and the estimation method used in this study. In section 4, I analyse all the results. I present my conclusions in the section 5.
II-Can Equity private sector help the supervisory monitoring models? In the preliminary study, I try to demonstrate if the information based on stock prices or on judgmental assessments of market actors (shareholders) outperform backward looking information contained in balance sheet data. In this case, supervisory ratings must be correlated with variables that market actors care about, such as risk and expected return. This correlation could arise if the conditions that lead to good supervisory ratings (the FSRating) are consistent with those that lead to changes in stock price. In other words, if market actors anticipate the changes in the bank performance such as the bank condition and future profitability, they would probably help the future supervisory treatment and hence changes in supervisory ratings.6The FSRating is defined by four components that currently determine the CAMEL7 type supervisory ratings. These components measures take values from 1 to 5. First, the Capital Adequacy, by constructing a capital rating to each bank in the sample at each year. This rating depends on the level of the tier 1 ratio accordingly to the Prompt corrective Action adequacy status (PCA).8The PCA capital adequacy status measure depends on whether the bank is considered well-capitalised, adequately capitalised, undercapitalized, significantly capitalised and critically capitalised, under the PCA guidelines. Second, the Asset quality by constructing an asset quality rating to each bank at each year. This rating depends on thresholds taken by the Impaired Loans / Gross Loans and the Loans loss reserves/ impaired loans ratios. Third, the earning situation by constructing an earning rating to each bank at each year. This rating depends on thresholds taken by the Cost to Income and the ROAE ratios. Fourth, the liquidity situation by constructing a liquidity rating to each bank at each year. This rating depends on thresholds taken by the liquid assets/ deposits &ST findings ratio.
accounting data in the quarter prior to the assignment of the rating that comes after the adjustments when accounting measures should more accurately reflect the true condition of the bank. 6 Actually, the implementation of a Prompt Corrective Action (PCA) is largely debated in Europe. Beyond, the institutional restrains across countries, a potential weakness of a PCA is its reliance on book value capital adequacy measured using historic costs as required by generally accepted accounting principles which are oriented toward backward-looking valuations. IFRS accounting methods should improve the situation in the near future. 7 Note that I don’t take into account the management quality of the sample banks since almost all European large banks are considered well managed. Thus the introduction of a management note will not widely influence the global FSRating. 8 This measure is of particular interest since it is the measure currently being used to trigger PCA.

4
All the thresholds fixed are extracted from the Fitch standards for large banks and from “the expert’s statements” as provided by the Bankscope database distributed by Fitch-IBCA. The tables 1 and 2 below summarize all the components thresholds used for the FSRating construction. Table 1
Table 2
ASSET QUALITY EARNING SITUATION RATING Very good 1
Impaired loans/ Gross Loans ratio < 5
Loans loss res/ impaired loans ratio> 100
Cost to income ratio <50 R0AE ratio > 15
Good
2
5< Impaired loans/ Gross Loans ratio<10 70<Loans loss res/ impaired loans ratio< 100
50<Cost to income ratio<65 10< ROAE ratio < 15
Satisfying
3
10< Impaired loans/ Gross Loans ratio< 15
50<Loans loss res/ impaired loans ratio< 70
65<Cost to income ratio<75 5<ROAE ratio <10
Bad
4
15< Impaired loans/ Gross Loans ratio< 25 25<Loans loss res/ impaired loans ratio< 50
75<Cost to income ratio< 100 0<ROAE ratio <5
Very bad
5
Impaired loans/ Gross Loans ratio> 25 Loans loss res/impaired loans ratio< 25
Cost to income ratio> 100 ROAE ratio <0

5
The global bank rating is then the sum of the four ratings. I chose to give a twice bigger weight to a capital degradation as compared to a capital improvement because almost European banks are adequately capitalised and the advantage of using the capital adequacy measure changes is that regardless of the source of the problem, the consequences must ultimately appear in the bank capital account if it is of a magnitude to threaten the bank’s viability. Thus each bank has at each year end a cardinal FSRating9 such that:
20
4
1it
ii
it
raFSRating
∑== where itr is the rating of each bank accounting component i at time t
and ia is the weighing of each component. It equals 2 for the capital adequacy rating. The table below summarizes the different ratings classes fixed in the study:
Rating class 5/20 to 8/20 9/20 to 12/20 13/20 to 16/20 17/20 to 19/20 20/20 FSRating 1 2 3 4 5
It’s important to distinguish between a “strong” movement and a “small” movement. That is why; I decide to define a “strong” movement the one that yields in an inter-class change and a “small” one in case of intra-class change of a satisfactory threshold.
II-1 Data, descriptive statistics and estimation method The sample consists of 303 actions composed of 159 movements and 144 confirmations. The actions involve initially a total of 98 banks and span the period from 1998 to 2004.
9 We can also construct a score rather than a rating for the financial situation of banks. In this case we will have
( ) ( ) ( ) ( ) )(205
205
205
205, 44332211
4
1xHxHxHxHtxHaz iiit +++==∑ where tz is a risk indicator.
The Thresholds defining the iH functions are associated to the “expert’s statements” and not necessary associated to clearly defined percentiles.
CAPITAL ADEQUACY Tier 1 ratio/ total capital ratio
LIQUIDITY Liquid assets/ dep &ST findings ratio (LIQR)
Well-capitalised Tier 1 6% ratio or greater Total capital ratio 12% or greater
1 Very good liquidity LIQR >50
Adequately Capitalised
(4%<Tier 1< 6%) From 8% to 12%
2 Adequate liquidity 25<LIQR<50
Undercapitalised (Tier 1<4%)
6%<total capital ratio <8%
3 Insufficient liquidity 10<LIQR<25
Significantly undercapitalised (Tier 1<3%) Total capital
ratio < 6%
4 Bad liquidity 5<LIQR<10
Critically under-capitalised (Tangible equity to total assets that is equal
to or less than 2%) Total capital ratio < 4%
5 Critical liquidity LIQR<5

6
Table 3 Number of banks Countries
FSRating changes
LTRating changes
Market Index
ITALIE 17 20 MIB 30 FRANCE 10 10 CAC40 GERMANY 7 10 DAX 30 SPAIN 8 6 MADRID GENERAL SE UNITED KINGDOM 12 11 FT100 NETHERLANDS 5 3 AEX INDEX PORTUGAL 5 3 DJTM PRG GREECE 6 6 ATEX COMPOSITE AUSTRIA 4 4 DS (General Index) BELGIIUM 3 3 BEL 20 SUIZERLAND 8 3 DJTM SWISS IRLAND 3 3 DJTM IRD FINLANDE 3 3 DJTM FLDS TOTAL 91 85
I eliminate 7 banks that not experience any rating change during the studied period. As indicated in table 3, the final sample consists thus in 91 large banks. I also restricted the sample to banks assignments when equity market data and balance sheet data are available in the same time for the estimation window. These restrictions result in a reduction from the original sample size of 98 banks to 75 banks in the year 1998 changes.10
The distribution of events across countries is summarized in the table 4 of the annex. The ratings movements consist in 87 upgrades and 72 downgrades during the fixed period. Note that almost 38% of the upgrades are over the second threshold and then classified as unsatisfactory or of “small” amelioration, and almost 35% of the downgrades are below the second threshold.
“Event” date is determined as that of auditors’ examination date approximated by the end of the accounting exercise as the date of inspection—date of which the regulators meet with the bank’s management-- is not disclosed publicly.11 Thus, the timely convention used in the event study is critical; if investors receive information about a change in the bank risk before the event window begins, the event study will miss the stock market signal. To guard against this possibility, I choose a large event window that begins one year (accounting year term) before the date chosen for the FSRating evaluation. Moreover, the fact that we restrict the analysis to assignments separated by at least on calendar year guards also against contamination of the event windows from prior off-site monitoring and on-site inspections. The contamination of the estimated parameters of the two factor model is also mitigated by my use of a long estimation window (2 years)12.
To run the model, I use monthly stock returns and standards methods like Campbell et al (1997) and Krainer and Lopez (2003). Equity market signals can only be interpreted as significant or abnormal. Thus, as is the case for all event studies, the hypotheses tested are in
10 This results because we have chosen an event window of 1 year and a long estimation window of two years. Market data were not available for the 1995 year. 11 Moreover, this choice is motivated by the fact that the off-site reviews depend on quarterly accounting data that may not be audited and then may not reflect the changing risk profile of the institution. 12 For the same reasons, Krainer and Lopez have used a wider estimation window of 5 years prior to the beginning of the event window.

7
fact joint hypotheses of whether market participants anticipate an event and whether the pricing model is correct. To the purpose of this study, I use return data to investigate whether equity markets anticipate the FSRating changes.13 The impact of changes on market value is appreciated by the deviation between the bond return observed in each market and the return anticipated by a market model (normal return) in the pre and post–event. These changes were subdivided also in “satisfactory” and “unsatisfactory” threshold. The event window begins 12 months prior to the exit date and ends 3 months after. I use a two factor model of bank stock return.14
Estimation Window Event window
M -36 M-13 M-12 D0 M+3 Following Kho et al (2000) and Krainet and Lopez (2003), I use the changes in a short term interest rate of the total OECD countries, since I examine a panel of European countries that can be influenced not only by their own interest rate changes but also by others OECD countries.15 Besides, I integrate the growth of the monthly industry production of industrialised countries to control and synthesize all the financial, political and social factors that can affect a country performance. As a proxy for this variable, I choose the monthly G7 industrial production index. See Box 1 in the annex for further details. I estimate for each bank (event)16over the whole sample:
itticmtiit MRR εββα +++= 21 (1) Where itR is the monthly return for the bank i at time t, cmtR is the overall market return for the same period in the country c and tM is a matrix of macroeconomic variables. These indicators meant to control for shocks that impact banks in systematic way.
itε is assumed to be an independent normal error term. The model is estimated by the OLS method with Newey-west correction,17 using monthly return for the two years prior to the beginning of the event window. I next pick the residual itε and, in the event window, I compute for each event i abnormal returns using the estimated coefficients from (1).
ticmtiitit MRRAR 21ˆˆˆ ββα −−−= (2)
For t= -12,…,0,……+3 . 13Like Krainer and Lopez (2003), we use monthly data to more closely approximate the quarterly frequency of the bank off-site monitoring. Berger and Davies (1998) use daily stocks returns to conduct their BHC event study. 14 Note that in the literature, two factor models are by far the most common specification used for event studies, and almost all of these models incorporate the overall market return as factor. The second factor capture generally changes in the interest rate environment. Kwan (1991) used holding period returns on short-term and long term constant maturity Treasury bonds as the second factor, and Hirtle (1997) used the percentage change in yield on a 10-year treasury security. 15 This control variable can also reflect the local inflation anticipations revision. 16 For reasons of convenience, I don’t use a specific designation for the event and confound the event to the bank in the first equation. 17 The test of Newey-west is an extension of the white correction method that simultaneously corrects for the heterosedasticity and serial correlation in OLS regression.

8
iiet 21ˆˆ,ˆ ββα are the estimated coefficients from (1).
I anticipate negative (positive) abnormal returns if the markets actors could anticipate the FSRating degradation (amelioration) and negative (positive) abnormal returns if they react to a negative (positive) FSRating deterioration (amelioration). The cumulative abnormal return of equity for any event i at any time period 21 ττ to in the event period is such that:
∑=
=2
1
12,
τ
τττ
ttii ARCAR
Using the abnormal return obtained in (2), I follow the previous literature and calculate the average abnormal return (AAR) for the entire event window across events by type. And to determine the global effect of any equity return for any time period 21 ττ to , I sum across time the tAAR and obtain the cumulative average abnormal return (CAAR).
∑=
=n
iitt AR
nAAR
1
1 Where n represents the number of events by type
∑=
=2
1
21 ,
τ
τττ
ttAARCAAR
In order to evaluate the statistical significance of the average abnormal returns in the event window, I use the standard deviation of the average abnormal return and the standard deviation of the cumulative average abnormal return, in the estimation window, which is denoted by18:
( ) [ ]2,1
213
36
,231 ττσ ∈∀
−= ∑
−
−=
tARAAARt
tAAR , and ∑−
−==
13
36241
ttAARARA
Under the assumption of i.i.d normally distributed abnormal returns, the ratio of the average
abnormal return to the standard deviation AAR
tt
AARZ
σ=,1 is distributed as a Student’s t with
(n-1) degrees of freedom. I test the tZ ,1 significance by comparing its estimated value with the value of tabulated t student. Similarly, a test can be run for the cumulative average abnormal returns, by calculating
CAAR
tt
CAARZ
σ=,2 where ( )112 +−= ττσ CAAR AARσ
distributed as a Student’s t with ( n-1) degrees of freedom.
III- Can actions of rating agencies add value to market monitoring of bank soundness?
18 More generally, ( )
−
−= ∑
−−
−−=
1 2
11 nà
mnà
t
tttAAR ARAAAR
Tσ and ∑
−−
−−=
=mnà
mnà
t
tttAAR
TARA 1

9
The traditional role of rating agencies has been to assist investors in evaluating the debt securities of particular corporations and thus to assess the issuer’s creditworthiness. Recognizing the capacity of private credit rating agencies to evaluate the creditworthiness of a broad range of issuers, regulatory agencies in the United States have made increasing use of ratings in supervisory settings. In Europe, changes to the regulatory framework proposed by the Basel Comity on Banking Supervision emphasizes the importance of the ratings assigned by rating agencies as a basis for risk weights in the calculation of the regulatory capital standards. Thus, motivated by the recent proposals, I try in this second step to examine the information content of changes in ratings for a sample of European banks.19
For this purpose, I run an event study to identify the abnormal returns in stocks prices before and after an announcement of a rating agency action.20 I concentrated on the long term debt rating of S&P and Fitch IBCA.21 While the rating direction (decrease or increase) is generally the same for the two rating agencies, a number of similar changes are announced at different but relatively close dates. In this case, an announcement by an agency during the estimation period or the event window could pollute the announcement real impact analysis. For this reason, I take into account the event date as the firstly announcement date by the rating agencies. Although, market actors may react differently to different degrees of rating movement, I remark that rating’s actions assigned by the two agencies S&P and Fitch IBCA are in most times of the same magnitude and a small degree. For these reasons, I decide to not devise here the sample of rating’s events into “strong” and “small” events. In addition, to outright changes in ratings, we consider the information contained in the “credit watch list”. Companies are added to the credit watch list, if the rating agency believes that a rating change is likely. This information is supplemented by the expected direction of the change. There may be “negative watch”, “positive watch” or “developing”. The credit watch would indicate “developing” if a rating change of unknown direction is expected.22 However, “credit watch” announcements could also pollute the analysis since they may occur during the event window before a rating action or during the estimating window. Thus, I use credit «watch» announcements in two ways. First, I examine abnormal returns around credit “watch” announcements, testing whether they contain market relevant information. Second, I use them as a mean of distinguishing between expected (contaminated) and unexpected (pure) data. Concerning the information content of changes in ratings, there are two alternative views of the information about default risk in the ratings produced by rating agencies. One view is that the rating agencies have access to publicly available information only and that the agencies generally lag the market in producing information. According to this view, ratings should not affect market prices, if capital markets are efficient in semi-strong form. Proponents of this view argue that rating agencies move slowly and that ratings are often inflexible suggesting their poor ability to predict default. An alternative view is that the rating agencies are
19 In my knowledge, few studies have tried to test the impact of ratings agencies actions on the pricing of equity for European countries by the use of event studies (C.f Goyeau, Sauviat and Tarazi (2000) and Gropp and Richards (2001)). 20 The market variables are generally specified into a number of categories reflecting different aspects of equity market valuations; these categories can be price volatility, abnormal returns, volatility of returns, capitalization and share turnover… 21 Note that rating agencies distinguish between short term debt (maturity less than 1 year) and long term debt senior (maturity over 1 year). The first rating reflects specially the illiquidity risk of the issuer but the later reflects mainly the financial structure and the ability of the issuer to generate sufficient future cash-flows to meet their liabilities. It seems therefore more close to the shareholders concerns. 22 Hand et al (1992) were the first to stress the importance to considerer the information contained in the « credit watch list ».

10
specialists at obtaining and processing information, and thereby generate information on default risk that was not previously publicly known. I argue that a rating downgrade would be expected to have a negative impact on the post announcement stock prices and none significant abnormal returns at the pre-announcement date if the ratings agency possesses new negative information about the firm’s statement. However, it is interesting to mention that a downgrade should be good news for stockholders if it reflects the anticipation that the firm will take actions that transfer wealth from bondholders to stockholders. Particularly, one would expect a positive reaction and high stock value if the bond was downgraded in response to an anticipated increase in leverage and then in risk.23 As for the “credit watches”, I expect that a ratings change that is preceded by such announcement should be largely anticipated and hence, should be associated with high negative abnormal returns and not necessarily be associated with a reaction in market prices. III-1 Data, Descriptive statistics and estimation method My sampling procedure yielded a total of 341 actions composed of 182 movements and 159 confirmations (including outlooks).24 The actions involve initially a total of 105 large banks and span a relatively large period from 1990 to 2006. However, the number of banks was reduced to 85 because some banks did not experience any ratings change during the fixed period and I am interested particularly in ratings movements. Moreover, I have eliminated the German savings banks sector as they enjoy a full government guarantee and also all entirely public European banks. In consequence, the total sample experienced in this study is composed of 182 events. The Table 5 of the annex provides information on the distribution of all events over countries. In the total, the simple consists of 60 upgrades (about 33% of the total sample) and 63 downgrades (about 35% of the total sample) including respectively 6 contaminated by positive «watch» announcements and 19 contaminated by negative watches. In other words, 10% of the upgrades are expected (preceded by positive watches) and somewhat higher proportion about 30% of the downgrades are expected (preceded by negative watches). The rating «watch» announcements represent a total of 59 (about 32% of the total sample) composed of 17 positive «watch» announcements and 42 negative watches. As one can note, the rating agencies adopt almost equally the 3 strategies of actions: upgrading, downgrading and making «watch» announcements but they take time mainly before downgrading a bank by adopting negative «watch» announcements and upgrade easily European banks. This can be motivated by the fact that European banks benefit of a relatively positive perspective. As regards the sub-division of the changes into “strong” and “small” changes, I observe that almost all banks in all European countries display satisfactory ratings and the majority of downgrades are of small magnitude (changes in notches). Precisely, I note a total of 6 “strong” downgrades (almost 9% of the total) of which the haft are expected (contaminated by negative watches) and 5 strong pure upgrades (almost 8% of the total) from the second to the first risk class rating.
23 When analysing the effects of rating changes on stock prices, it may be important to understand the reasoning behind the change (global financial situation outlook or riskiness of the bank’s overall strategy), since some news may be good for shareholders and bad for bondholders. However, because of the lack of information to make this distinction in a fully accurate manner, we assume that positive abnormal returns before or after a downgrade event should be associated to an increase in bank risk such that merger activities or increasing leverage. 24 Unlike ratings «watch» announcements that indicate substantial probability of a rating change in the near future, rating outlooks merely indicate a possible direction for the rating in the medium term and may not influence invertors concerns. For this reason, I don’t include outlooks and confirmations in this study.

11
I obtain daily market data (bank stock prices) from DataStream International and long term ratings history and movements from Fitch IBCA and Standards &Poor’s.25
As I have mentioned earlier, I choose the announcement date as the firstly announced by an agency, Once the appropriate events were identified, I fixed a timing scale such that àtrepresents the announcement date of a new event. The [ àt - n, àt [ period represents the pre-announcing window and the [ àt , àt +n ] period, the post-announcing window, T [ àt - n, àt +n]period corresponds thus to the global event window. Precisely, I estimate the same two factor model as described in the first empirical application on the prior period [ àt - n-m, àt -n[ .I fixed an event window of 81 days: a pre-event period of 40 days and a post-event period of 41 days. Moreover, I retain an estimation period of 100 days.26 The abnormal returns are cumulated from the date (-1) to the date (-40) for the pre-event period and from the date 0 to the date 40 for the post-event period. In order to evaluate the statistical significance of the average abnormal returns and the cumulative average abnormal returns in the event window, I calculate, as for the prior application, the Z statistics defined as:
AAR
tt
AARZσ
=,1 where ( )
−= ∑
−
−=
41
140
2
991
ttAAR ARAAARσ and ∑
−
−=
=41
1401001
ttAARARA
CAAR
tt
CAARZ
σ=,2 where ( )112 +−= ττσ CAAR AARσ
distributed as a Student’s t with n-1 degrees of freedom.
Estimation Window Event Window
D -140 D -41 D-40 D 0 D+40 IV- Results
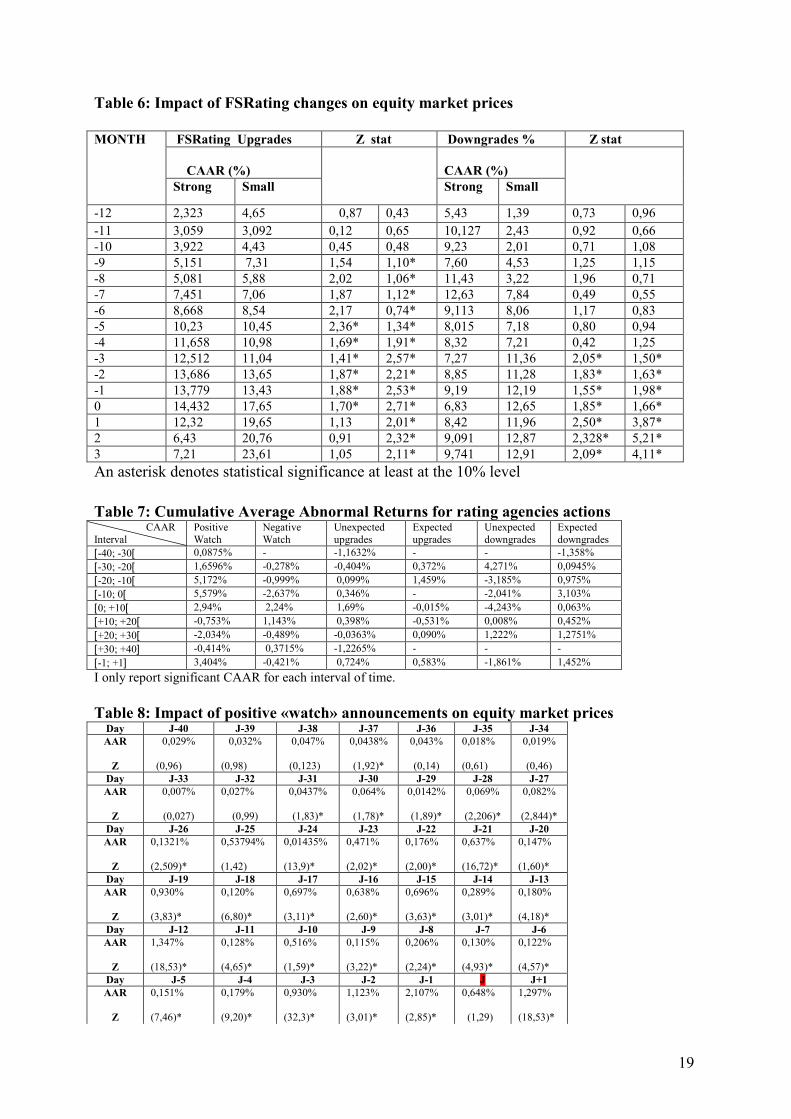
IV-1 Can market actors anticipate supervisory assessments I start by presenting the results of the preliminary event study seeking to answer the question of weather market actors can help the supervisory process. The results are reported in the table 6 of the annex. It represents cumulative average abnormal returns (CAAR) of the entire event window including the event data. I retain as I have mentioned above an event window of fifteen months [-12, +3].For upgrades, as summarized in the table, the CAAR are significantly positive as early as 9 months prior to the event date and they are over 15% by the end of the pre-event window, As 25 While we were able to obtain ratings for more than reflected in this sample, the availability of equity data, which satisfied our requirements in terms of period size, was limited. 26 Note that the period length is arbitrary fixed but we think that retaining longer periods would cause a loose of the pure events. Indeed, the literature generally uses periods of almost the same magnitude. Equity prices are those of closing date, and the event day is integrated in the post-event period.

12
expected, the CAAR are greater for “strong” upgrades (about 24%) but are expected only 5 months before the event date and become insignificant in the post-event window. These results can be explained by the fact that good information contained in quarterly accounting data are generally rapidly disclosed and widely available to the public. Therefore, the FSRating improvement never significantly affects share returns in the post-event window. They are used by financial markets are well as regulators or inspectors to assess risk. However, as concerns the downgrades, the results show that they are significant only 3 months before the event date and that the CAAR are about 13% by the end of the event window. Contrary to some of the previous literature (Krainer and Lopez (2002), the sign associated to significant abnormal returns is of particular interest. Indeed, small downward revision proves to be anticipated but is associated with high significant and positive abnormal returns27. “Strong” downgrades effects are also quite interesting. They are relatively rare events (about 15% of the all movements) and might be of particular interest for bankers and supervisors. Average Abnormal returns are positive but of smaller magnitude (10%) for “strong” downgrades than for “small downgrades” (a revision from a satisfactory to unsatisfactory threshold). Positive CAAR could be associated with a large enough increase in risk to raise the stock’s option value, Moreover, shareholders might believe that regulatory intervention becomes more likely once the FSRating has fallen into the unsatisfactory range. Thus, I can conclude that the positive market reaction to this “stand alone rating downgrade” is motivated by the safety net of which could benefit large European banks. Moreover, insensibility of shareholders to downgrades can be explained by the fact that they have used earlier quarterly accounting data that may not be audited or may not reflect the changing risk profile of the institution. This observation is consistent with the hypothesis that on-site inspections might reduce uncertainty about a bank true market value by certifying the firm’ financial statements. Finally, while market reaction is of different magnitude when we consider separately “strong” downgrades and “small downgrades”, I show that abnormal returns are of significant and expected sigh when we consider both all downgrades and all upgrades. Thus, supervisors may be able to use them as an additional monitoring tool, but must also be careful to interpret mainly positive abnormal returns since they can hide a decline of regulatory capital and can be motivated by a rise in risky assets. The next test consists on determining the additional role of rating agencies as market actors. I particularly test the impact of rating’s actions on the stock prices that are upgrades, downgrades and watches. I also distinguish between expected (contaminated) and unexpected (uncontaminated) events. I am interested in various time intervals around the announcement dates that are: [-40;-30[, [-30;-20[, [-20, -10[, [-10, 0[, [0, 10[, [10, 20[, [20, 30[, [30, 40[ and slightly near the event date: days -1 to +1. The table 7 of the annex summarises CAAR for the different time intervals and for each sort of action. IV-2 Impact of “watch” announcements on stock returns Positive watch impact
27 We have associated a small downgrade to the one of an intra- class of a satisfactory threshold; which means a decrease in just one component of the FSRating mainly “capital ratio” since we have assigned it a double impact size. This observation permits to conclude that market actors anticipating and react positively to a capital ratio downgrade, but have less appetite for risk when they anticipate either a decrease in capital ratio associated with a decrease of one of the other component or a decrease in more then one component of the FSRating.

13
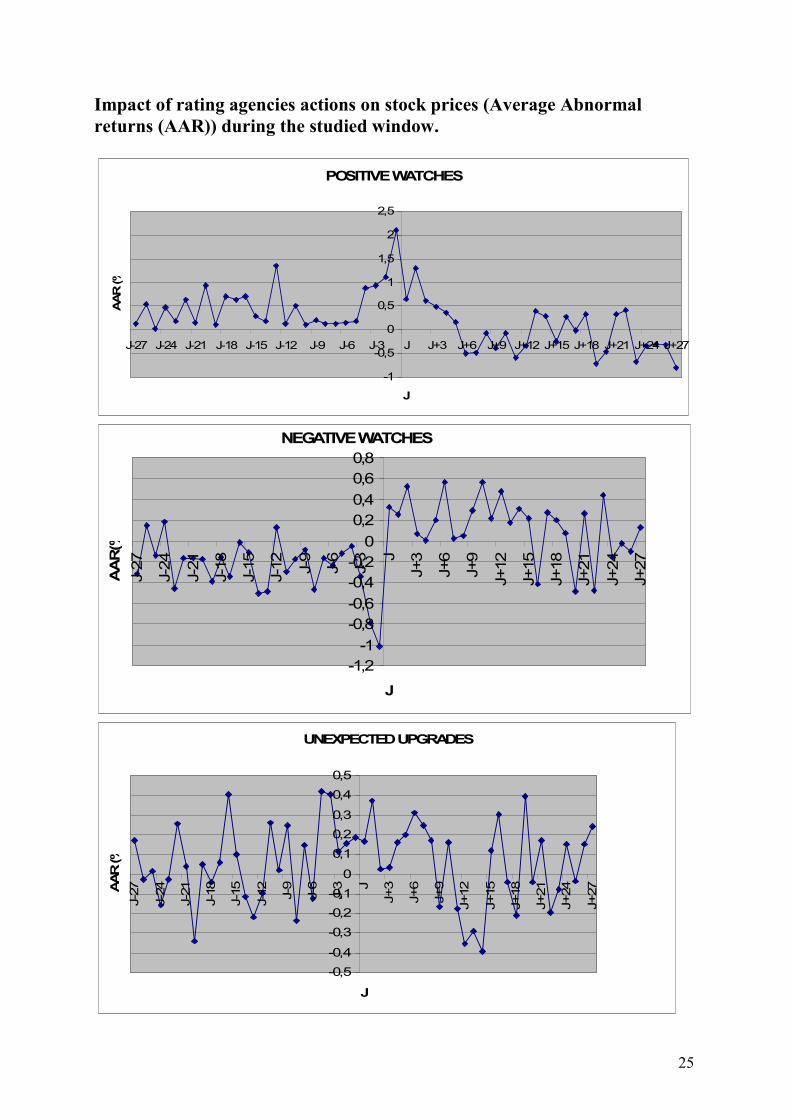
The results of positive “watch” announcements show statistically significant and economically substantial effects 31 days before the event date. All the results are summarized in the table 8 of the annex. They show positive increasing abnormal returns when approaching the event date. The highest average abnormal return (about 2,1%) is realised a day before the announcement date. The average cumulative abnormal returns over the 40 business days preceding the announcement standing is about 5,8% and 3,2% the 5 days before the announcement. However, the reaction of stock prices in the post-event date is somewhat unclear, CAAR are positive but insignificant the announcement day and than become of small magnitude and negative the 6 days after the announcement. Thus, positive “Watches” are early anticipated by shareholders and widely anticipated some days before the announcement and particularly a day before but the shareholders reaction doesn’t persist over the post event date. Since we have isolated systemic information and we concentrate only on idiosyncratic bank situation, it’s difficult to explain the existence of negative abnormal returns in the post event window and we conclude to an ambiguous reaction of shareholders and maybe a threat about the outcome of a positive watch.28
Negative watch impact
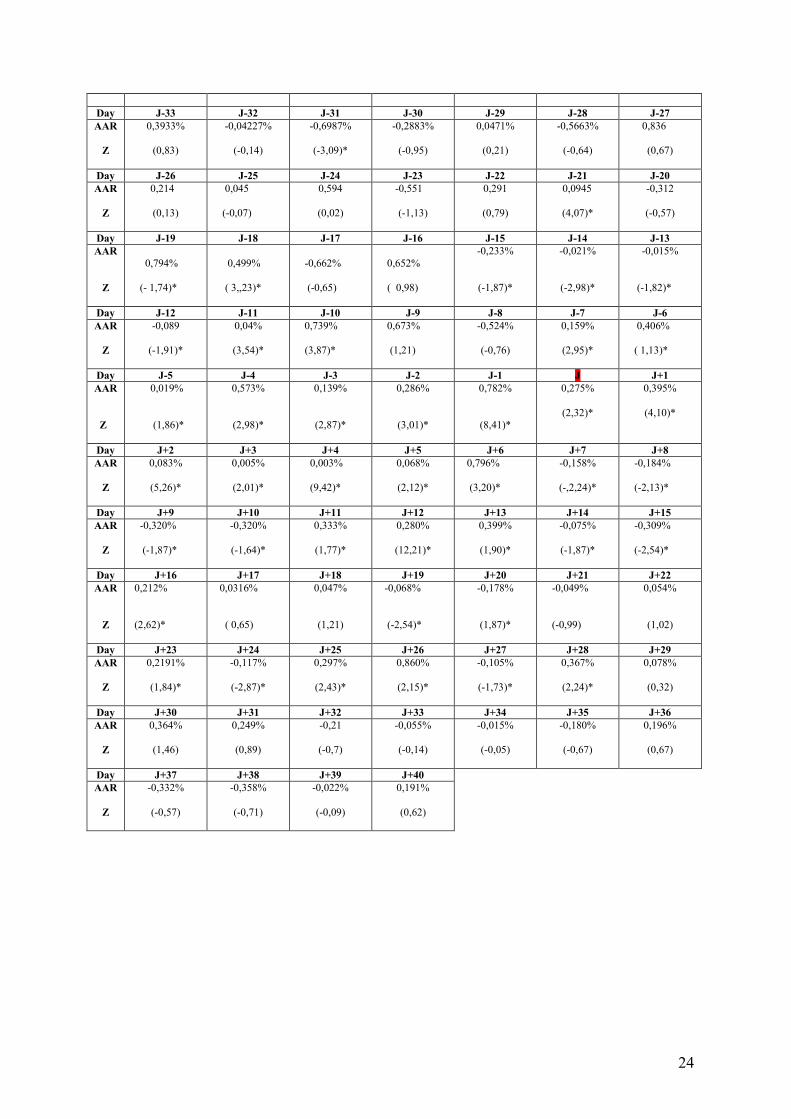
As concerning negative watches, the results summarized in the table 9 of the annex, show significant negative average abnormal returns 27 days preceding the announcement of negative watch. CAAR are about -2,1% in the interval time [-30;-10[ and about -1,5% the ten days before the announce29. The total CAAR in the pre-event data is about -6,7%. Negative abnormal returns are of the highest magnitude 3 days and precisely a day before the agency’s action. Interestingly, AAR begin to bounce the day of the announcement and rise afterwards accumulating significant AAR to about 4,1%. Thus, shareholders are able to anticipate a negative watch before rating agencies but stock prices seem to bounce back rapidly since positive abnormal returns are significant since the announcement day. Thus, I shall conclude by noting that shareholders seem to anticipate watches. Indeed, watch announcements lead to significant price variations, with price rising in response to positive «watch» announcements and falling in response to negative «watch» announcements in various time intervals before the announcement date. I can then conclude that «watch» announcements issued by rating agencies represent an aggregation of public information that is widely and early revealed and that financial markets can process and interpret this public information more timely and efficiently than rating agencies. However, Positive “Watch” announcements lead to unclear effect in the post event window. Negative «watch» announcements lead to positive significant abnormal returns since the event date. This finding could be explained by the fact that positive abnormal returns are motivated by an increase in the risk of the bank’s strategy. Thus, I can attribute anticipated
28 If one suppose that the positive watch is associated to an increase of capital ratio, it’s clearly good information for debtholders as it reflects a fall in default risk on the bank debt, and thus a reduction of market financing risk premium. Nevertheless, this could be bad information for shareholders if the external finding leverage decrease traduces for them less advantageous profitability/ risk couple. This hypothesis could explain negative abnormal returns in the post event window. 29 These percentages include also significant positive abnormal returns.

14
negative watch actions to reasons leading a rise in bank risk such that mergers and acquisition operations and restructuring.30
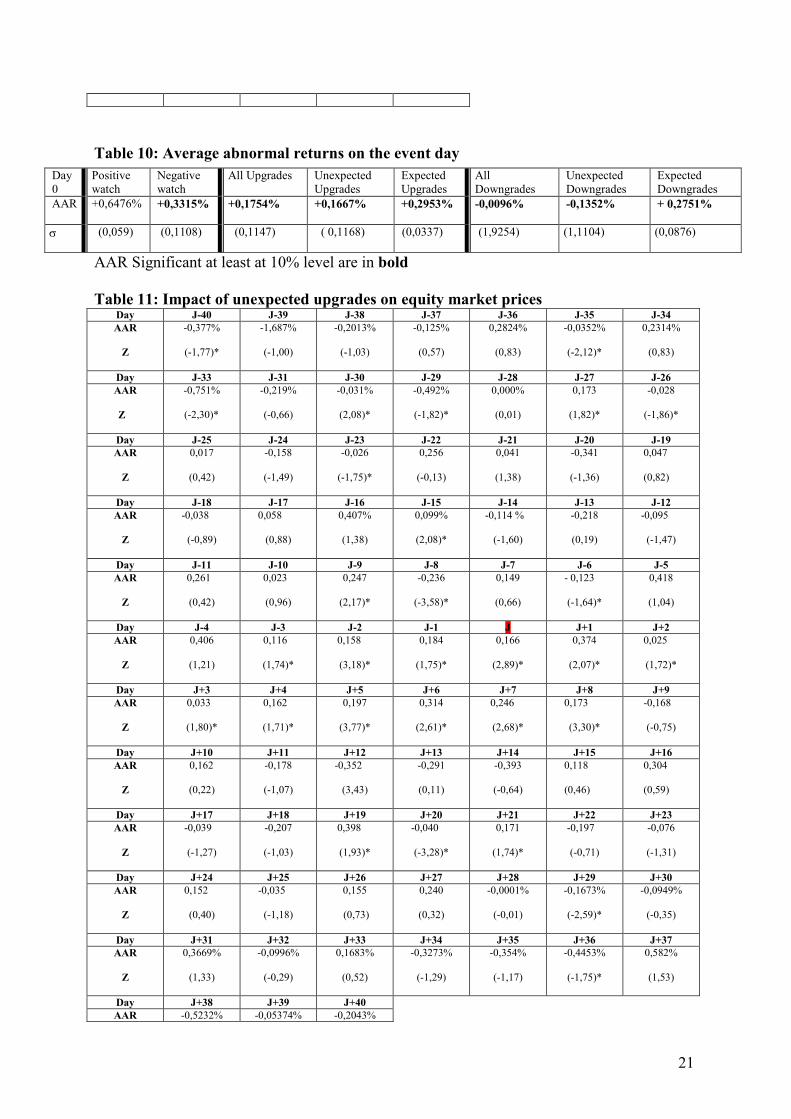
IV-3 Impact of rating changes on stock prices: I present here summarized results of the impact of rating actions on stock prices. I interpret mainly the magnitude and the timeless of market reaction around the event date. The table 10 of the annex details estimated Average Abnormal Returns (AAR) on the event day. As noted earlier, I distinguish between expected (contaminated) and unexpected (uncontaminated) events by identifying whether the ratings change occurred after a rating watch in the same direction. All the results are represented by graphics shown in the appendix Impact of all upgrades:
The results for all upgrades (expected and unexpected) show significant abnormal returns in numerous event windows dates. However, I find negative AAR long before and after the announcement date but positive AAR in the 9 days before and 5 days after the announcement of upgrade. For this time period CAAR are respectively about almost 1,4% and 0,8%. Thus, I can already conclude that shareholders seem to anticipate relatively late rating upgrades and react weekly to these actions. Once again, one can not rely on stock prices information content long after and long before a positive action. Moreover, at least 6 of abnormal returns are contaminated by positive «watch» announcements and news stories about the bank, which become rapidly public information. Thus, the asset price reaction may be due to this information and not due to the ratings change itself. While, only 10% of all upgrades events are contaminated, it’s important to analyse separately the expected (contaminated) and the unexpected (uncontaminated) upgrades. Impact of unexpected upgrades: The results of unexpected upgrades, detailed in the table 11, show significant but very small abnormal returns few days around the announcement date. CAAR are positive only 3 days before and 8 day after the event date. In the pre-event date, significant CAAR represent 0,4% and become insignificant the rest of event window days. They are the highest in the interval [-1,1] but still of relatively small magnitude (about 0,7%) compared to all upgrades taken together. Impact of expected upgrades: Concerning expected upgrades, for which results are detailed in the table 12 of the annex, CAAR are significant for few days of the event window. They are mainly positive at J-23 (+0,3%), J-21 (+0,07%), J-15 (+1,46%), J=0 (+0,29%) and J=1(+0,28%)), CAAR become negative and in most times insignificant afterwards. These results don’t allow us to extract any efficient information from stock prices in case of upgrades especially when they are expected. Moreover, these last results must be interpreted with extreme caution because of the very small number of observations. Besides, I can attribute negative abnormal returns in the post event window to the fact that shareholders have anticipated more important upgrade action of rating agencies (as we have noted, almost all upgrades are by a notch in an intra-
30 The reports diagnosis of S&P rating agencies permit to confirm this result. In fact, 60% of negatives «watch» announcements seem to be motivated by a public announce of mergers acquisitions, 25% by a decline in financial situation and 15% of negative «watch» announcements are for unknown reasons.

15
class threshold). Finally, as for positive watches, if I suppose that the positive watch is associated to an increase of capital ratio, it’s clearly good information for debtholders as it reflects a fall in default risk on the bank debt, and thus a reduction of market financing risk premium. Nevertheless, this could be bad information for shareholders if the external finding leverage lever decrease traduces for them less advantageous profitability/ risk couple. This hypothesis could explain negative abnormal returns in the post event window. Finally, I can note that unexpected upgrades elicit smaller abnormal returns in the pre event window and a larger post event response than for expected ones (perhaps because of a sufficient reaction to these last ones). This result is expected and in line with earlier empirical studies that takes into account contaminated data. However, I shall note also that CAAR of expected sign are small and significant only for few days before and around an announcement date, which means that market anticipations are somewhat late and that rating agencies are not merely acting in response to information in public domain but may perform a useful role in summarising and obtaining information not already in the public domain. Impact of all downgrades:
Downgrades actions are very important not only for the community of investors and shareholders but also for supervisors and bankers. I have seen in the first empirical test that downgrades of “a stand alone” FSRating can exhibit positive abnormal returns and that their magnitude depends on the reason behind (a risky position or a global deterioration of earning outlook). Since equity market actors are found to oppositely anticipate and overreact to downgrades, market discipline might be weakened and information on equity prices will be difficult to explore in the supervisory process. For this reason, I am trying here to determine the impact of long term issuer rating on stocks prices in the objective to highlight the timeliness of market signs reaction and the role of rating agencies in this respect. Looking to all downgrades taken together, I note that abnormal returns are significant only
for some days before and after the announcement day, CAAR are negative and about - 0,934% 3 days before the event data and then seem to bounce back relatively early since the first day after the announcement. As these results are somewhat ambiguous because of a high number of contaminated events (about 32% of the downgrades events), I decide to analyse separately expected (contaminated) and unexpected (uncontaminated) events.
Impact of unexpected downgrades:
Unexpected downgrades represent a great part of rating actions. Results summarized in the table 13, show that the AAR are not often significant. During the event window, cumulative average abnormal returns are often of negative sign but not of large magnitude. When significant, they represent -0,52% and -3,65% respectively in the pre and post event but only -0,13% at the event date. This finding suggest that market can hardly anticipate unexpected downgrades- as found by some of the previous literature (Gropp and Richards (2001)) - but react more strongly after the announcement date.31 Moreover, these findings suggest that ratings agencies have access to private information or at least perform a useful role in
31 Even when one admits that rating agencies don’t know more than the market, we consider an influence of the rating actions on stock prices. Indeed, bank managers are more disciplined by the announcement itself than by the evolution of market valorisation. If they modify their risk positions, the market can integrate this information ex post and then react to the note rather it synthesises information already taken into account.

16
summarising public information mainly which is associated to the bank global earning situation and not only to it’s risk perspective. Finally, difficulties to timely anticipate a downgrade and immediately react to such an event might suggest that banks and supervisors are more reluctant to reveal negative information to the market than positive information. In consequence, the expertise of rating’s agencies is here pointed up since there unexpected downgrade actions are found to content new bad information that still disclosed to the market.32
Impact of expected downgrades:
The results, detailed in the table 14 of the annex, show that abnormal returns are often significant during the event window but have sometimes positive and others negative abnormal returns. More precisely, CAAR are becoming positive when approaching the event date (about +2,3% seven days before) and 5 days after the event date. During the post-event date, CAAR represent only +1,53%. I note also that even during the announcement date abnormal returns steel positive and the CAAR is about +0,27%. This finding supports the notion that stock prices anticipate and react favourably to an increase in volatility (risk) of the underlying assets. This information could be associated, for instance, to the fact that information concerning restructuring operations is widely available to shareholders. Another explanation is that rating’s agencies move slowly and take time to downgrade a note. Moreover, the small reaction of the market to expected downgrades could be associated to polluting stories such as negative «watch» announcements that are already taken into account. Finally, I can attribute the shareholder’s insensibility to such downgrades around the event date to the fact that all downgrades (except 3) of the sample are of small magnitude (1 to 2 notches) and that the majority of European banks under study are well rated (ratings never go down the BB rating) which comfort the risky position of shareholders. A last explanation is that I only study large European banks that can be perceived by shareholders as “too big too fail” since they enjoy strong public guarantee.
V- Conclusion In this paper, I assess the potential information content of equity market signals to integrate in the supervisory process. I examine this question by conducting two sets of event studies to determine first whether financial market variables timely anticipate changes in a constructed FSRating and then whether rating’s agencies can add information and help the monitoring of European banks. To answer this question, I adopt a model that controls for systemic events such as interest rates movements of the OECD countries and the global industrial situation of the G7 countries. The first results suggest that cumulative average abnormal returns help to anticipate a “stand alone” rating change of audited banks some quarter in advance. Thus, the information based on stock prices or on judgmental assessments of credit rating agencies could outperform backward looking information contained in balance sheet data. In fact, numerous studies have found that banks tend to be slow to recognize troubled loans and to add enough to loan
32 The bank opacity will be tested later on by conducting several tests on the sample with respect to bank size (too-big-to-fail effect) and bank balance sheet structure (opacity effect) as determinant of market discipline solidity.
17
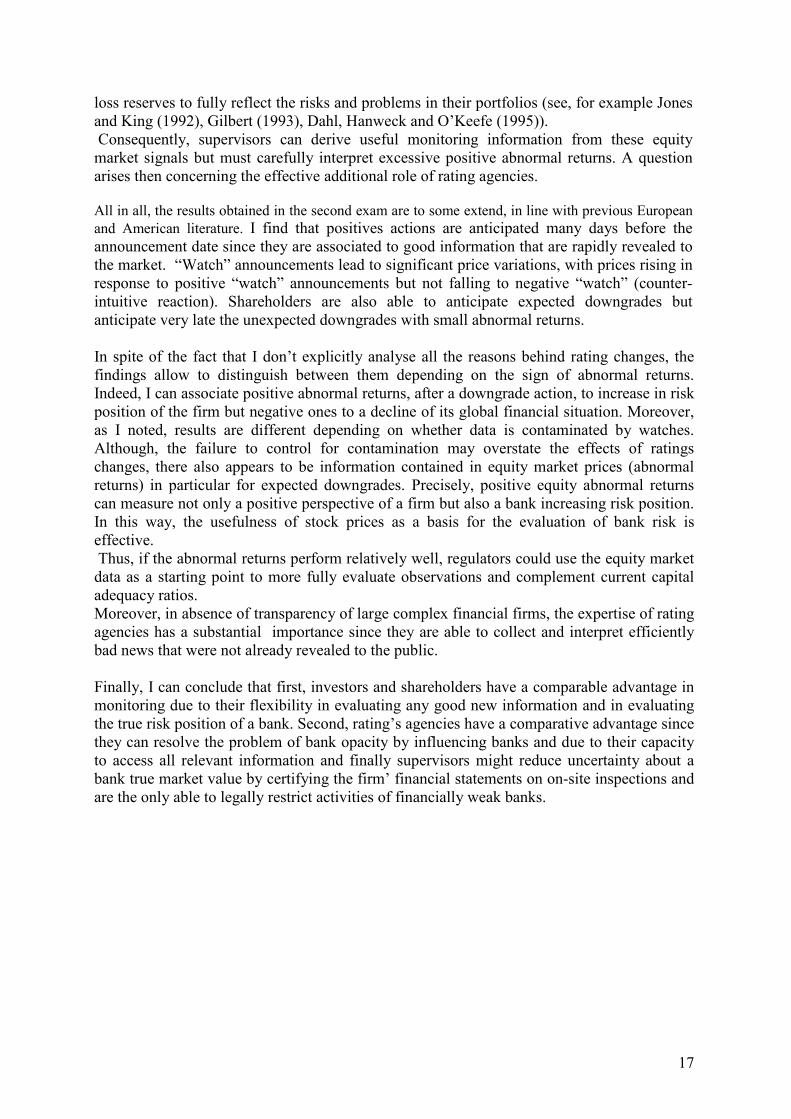
loss reserves to fully reflect the risks and problems in their portfolios (see, for example Jones and King (1992), Gilbert (1993), Dahl, Hanweck and O’Keefe (1995)). Consequently, supervisors can derive useful monitoring information from these equity market signals but must carefully interpret excessive positive abnormal returns. A question arises then concerning the effective additional role of rating agencies. All in all, the results obtained in the second exam are to some extend, in line with previous European and American literature. I find that positives actions are anticipated many days before the announcement date since they are associated to good information that are rapidly revealed to the market. “Watch” announcements lead to significant price variations, with prices rising in response to positive “watch” announcements but not falling to negative “watch” (counter-intuitive reaction). Shareholders are also able to anticipate expected downgrades but anticipate very late the unexpected downgrades with small abnormal returns. In spite of the fact that I don’t explicitly analyse all the reasons behind rating changes, the findings allow to distinguish between them depending on the sign of abnormal returns. Indeed, I can associate positive abnormal returns, after a downgrade action, to increase in risk position of the firm but negative ones to a decline of its global financial situation. Moreover, as I noted, results are different depending on whether data is contaminated by watches. Although, the failure to control for contamination may overstate the effects of ratings changes, there also appears to be information contained in equity market prices (abnormal returns) in particular for expected downgrades. Precisely, positive equity abnormal returns can measure not only a positive perspective of a firm but also a bank increasing risk position. In this way, the usefulness of stock prices as a basis for the evaluation of bank risk is effective. Thus, if the abnormal returns perform relatively well, regulators could use the equity market data as a starting point to more fully evaluate observations and complement current capital adequacy ratios. Moreover, in absence of transparency of large complex financial firms, the expertise of rating agencies has a substantial importance since they are able to collect and interpret efficiently bad news that were not already revealed to the public. Finally, I can conclude that first, investors and shareholders have a comparable advantage in monitoring due to their flexibility in evaluating any good new information and in evaluating the true risk position of a bank. Second, rating’s agencies have a comparative advantage since they can resolve the problem of bank opacity by influencing banks and due to their capacity to access all relevant information and finally supervisors might reduce uncertainty about a bank true market value by certifying the firm’ financial statements on on-site inspections and are the only able to legally restrict activities of financially weak banks.

18
ANNEX Table 4: Distribution of the FSRating movements during the period 1998-2004
Table 5: Distribution of rating actions during the period 1990-2006
Changes Confirmation
Upgrades Downgrades
Country
Small Strong Small Strong
ITALY 12 5 3 9 22 FRANCE 3 9 7 3 17 GERMANY 6 2 1 3 11 SPAIN 5 4 14 UNITED KINGDOM
0 5 6 2 16
NETHERLANDS 1 3 5 9 PORTUGAL 3 3 9 GREECE 2 4 4 3 8 AUSTRIA 2 1 7 BELGIIUM 2 4 SUIZERLAND 3 10 9 3 13 IRLAND 3 3 3 8 FINLANDE 1 3 2 1 6 TOTAL 33 54 47 25 144
Changes «watch» announcements
Confirmation
Upgrades Downgrades Positive Negative
Countries
pure Contaminated Pure
Contaminated
ITALIE 10 2 7 4 5 9 30 FRANCE 6 1 0 5 1 6 13 GERMANY 2 15 6 8 23 SPAIN 5 1 4 1 6 19 UNITED KINGDOM
4 6 1 1 11
NETHERLANDS 2 2 1 7 PORTUGAL 1 1 3 3 11 GREECE 10 1 3 2 7 AUSTRIA 2 1 4 1 2 2 10 BELGIIUM 2 1 1 1 4 SUIZERLAND 2 1 1 12 IRLAND 4 3 7 FINLANDE 4 2 2 1 5 TOTAL 54 6 44 19 17 42 159
19
Table 6: Impact of FSRating changes on equity market prices
An asterisk denotes statistical significance at least at the 10% level
Table 7: Cumulative Average Abnormal Returns for rating agencies actions CAAR Interval
Positive Watch
Negative Watch
Unexpected upgrades
Expected upgrades
Unexpected downgrades
Expected downgrades
[-40; -30[ 0,0875% - -1,1632% - - -1,358% [-30; -20[ 1,6596% -0,278% -0,404% 0,372% 4,271% 0,0945% [-20; -10[ 5,172% -0,999% 0,099% 1,459% -3,185% 0,975% [-10; 0[ 5,579% -2,637% 0,346% - -2,041% 3,103% [0; +10[ 2,94% 2,24% 1,69% -0,015% -4,243% 0,063% [+10; +20[ -0,753% 1,143% 0,398% -0,531% 0,008% 0,452% [+20; +30[ -2,034% -0,489% -0,0363% 0,090% 1,222% 1,2751% [+30; +40] -0,414% 0,3715% -1,2265% - - - [-1; +1] 3,404% -0,421% 0,724% 0,583% -1,861% 1,452% I only report significant CAAR for each interval of time. Table 8: Impact of positive «watch» announcements on equity market prices
Day J-40 J-39 J-38 J-37 J-36 J-35 J-34 AAR
Z
0,029%
(0,96)
0,032% (0,98)
0,047%
(0,123)
0,0438%
(1,92)*
0,043%
(0,14)
0,018% (0,61)
0,019%
(0,46) Day J-33 J-32 J-31 J-30 J-29 J-28 J-27 AAR
Z
0,007%
(0,027)
0,027%
(0,99)
0,0437%
(1,83)*
0,064%
(1,78)*
0,0142%
(1,89)*
0,069%
(2,206)*
0,082%
(2,844)* Day J-26 J-25 J-24 J-23 J-22 J-21 J-20 AAR
Z
0,1321% (2,509)*
0,53794% (1,42)
0,01435% (13,9)*
0,471% (2,02)*
0,176% (2,00)*
0,637% (16,72)*
0,147% (1,60)*
Day J-19 J-18 J-17 J-16 J-15 J-14 J-13 AAR
Z
0,930% (3,83)*
0,120% (6,80)*
0,697% (3,11)*
0,638% (2,60)*
0,696% (3,63)*
0,289% (3,01)*
0,180% (4,18)*
Day J-12 J-11 J-10 J-9 J-8 J-7 J-6 AAR
Z
1,347% (18,53)*
0,128% (4,65)*
0,516% (1,59)*
0,115% (3,22)*
0,206% (2,24)*
0,130% (4,93)*
0,122% (4,57)*
Day J-5 J-4 J-3 J-2 J-1 J J+1 AAR
Z
0,151% (7,46)*
0,179% (9,20)*
0,930% (32,3)*
1,123% (3,01)*
2,107% (2,85)*
0,648%
(1,29)
1,297% (18,53)*
FSRating Upgrades Z stat Downgrades % Z stat
CAAR (%) CAAR (%)
MONTH
Strong Small
Strong Small
-12 2,323 4,65 0,87 0,43 5,43 1,39 0,73 0,96 -11 3,059 3,092 0,12 0,65 10,127 2,43 0,92 0,66 -10 3,922 4,43 0,45 0,48 9,23 2,01 0,71 1,08 -9 5,151 7,31 1,54 1,10* 7,60 4,53 1,25 1,15 -8 5,081 5,88 2,02 1,06* 11,43 3,22 1,96 0,71 -7 7,451 7,06 1,87 1,12* 12,63 7,84 0,49 0,55 -6 8,668 8,54 2,17 0,74* 9,113 8,06 1,17 0,83 -5 10,23 10,45 2,36* 1,34* 8,015 7,18 0,80 0,94 -4 11,658 10,98 1,69* 1,91* 8,32 7,21 0,42 1,25 -3 12,512 11,04 1,41* 2,57* 7,27 11,36 2,05* 1,50* -2 13,686 13,65 1,87* 2,21* 8,85 11,28 1,83* 1,63* -1 13,779 13,43 1,88* 2,53* 9,19 12,19 1,55* 1,98* 0 14,432 17,65 1,70* 2,71* 6,83 12,65 1,85* 1,66* 1 12,32 19,65 1,13 2,01* 8,42 11,96 2,50* 3,87* 2 6,43 20,76 0,91 2,32* 9,091 12,87 2,328* 5,21* 3 7,21 23,61 1,05 2,11* 9,741 12,91 2,09* 4,11*

20
Day J+2 J+3 J+4 J+5 J+6 J+7 J+8 AAR
Z
0,615% (1,69)*
0,489% (1,61)*
0,364% (2,52)*
0,175% (4,21)*
-0,499% (1,11)
-0,474% (1,43)
-0,072% (1,34)
Day J+9 J+10 J+11 J+12 J+13 J+14 J+15 AAR
Z
-0,383% (1,29)
-0,069% (0,86)
-0,584% ( 0,23)
-0,327% ( 1,78)*
0,403% (0,58)
0,283% (1,29)
-0,247% (1,13)
Day J+16 J+17 J+18 J+19 J+20 J+21 J+22 AAR
Z
0,271% (1,89)*
0,008 (4,21)*
0,321% (0,96)
-0,705% (-1,93)*
-0,454% (-21,7)*
0,324% (0,53)
0,425% (1,23)
Day J+23 J+24 J+25 J+26 J+27 J+28 J+29 AAR
Z-0,683% (-31,2)*
-0,343% (-11,4)*
-0,299% (-0,34)
-0,315% (-1,17)
-0,795% (-0 ,55)
0,540% (1,78)*
0,345% (0,969)
Day J+30 J+31 J+32 J+33 J+34 J+35 J+36 AAR
Z0,198% (0,51)
0,343% (1,052)
0,056% (0,131)
-0,408% (-1,128)
0,202% (0,689)
0,702% (2,263)*
-0,236% (-0,715)
Day J+37 J+38 J+39 J+40 AAR
Z0,283% (0,719)
0,182% (0,518)
-0,592% (-1,63)*
-0,524% (-2,107)*
Table 9: impact of negative «watch» announcements on equity market prices Day J-40 J-39 J-38 J-37 J-36 J-35 J-34 AAR
Z
-0,021%
(-0,06)
0,157%
(0,68)
0,423%
(1,54)
0,175%
(0,46)
-0,483%
(-0,64)
-0,578%
(-0,95)
-0,146%
(-0,45) Day J-33 J-32 J-31 J-30 J-29 J-28 J-27 AAR
Z
0,393%
(0,83)
-0,042%
(-0,14)
-0,699%
(-1,09)
-0,288%
(-0,95)
0,047%
(0,21)
-0,566%
(-0,64)
-0,312%
(1,81) Day J-26 J-25 J-24 J-23 J-22 J-21 J-20 AAR
Z
0,150%
(1,62)
-0,134%
(-2,36)*
0,187%
(1,68)*
-0,455%
(-0,88)
-0,167%
(-6,31)*
-0,164%
(-5,82)*
-0,177%
(-1,21) Day J-19 J-18 J-17 J-16 J-15 J-14 J-13 AAR
Z
-0,389%
(-1,48)
-0,151%
(-1,91)*
-0,347%
(-1,76)*
-0,013%
(-11,30)*
-0,109%
-1,08
-0,506%
-0,54
-0,488%
(-2,68)* Day J-12 J-11 J-10 J-9 J-8 J-7 J-6 AAR
Z
0,131%
(1,65)
-0,296%
(-0,77)
-0,175%
(-1,71)*
-0,088%
(-1,78)*
-0,464%
(-1,38)
-0,163%
-1,09
-0,238%
(-2,17)* Day J-5 J-4 J-3 J-2 J-1 J J+1 AAR
Z
-0,121%
(-1,62)
-0,051%
-1,31
-0,340%
(-1,94)*
-0,787%
( - 1,70)*
-1,009%
(-1,81)*
0,331%
(1,68)*
0,257%
(1,91)* Day J+2 J+3 J+4 J+5 J+6 J+7 J+8 AAR
Z
0,521%
( 2,34)*
0,066%
(2,13)*
0,005%
(1,69)*
0,197%
(1,55)
0,568%
(1,78)*
0,026%
(1,34)
0,048%
(1, 21) Day J+9 J+10 J+11 J+12 J+13 J+14 J+15 AAR
Z
0,492%
(1,76)*
0,566%
(2,65)*
0,223%
(2,81)*
0,474%
(0,89)
0,175%
(0,84)
0,305%
(1,23)
0,221%
(1,91)* Day J+16 J+17 J+18 J+19 J+20 J+21 J+22 AAR
Z
-0,415%
(-3,21)*
0,276%
(2,11)*
0,198%
(10,6)*
0,074%
(7,32)*
-0,489%
(-2,21)*
0,263%
(1,27)
-0,478%
(-0 ;21) Day J+23 J+24 J+25 J+26 J+27 J+28 J+29
AAR
Z
0,442%
(0,76)
-0,156%
(-0,34)
-0,019%
(-0,01)
-0,099%
(-0,57)
0,128
(-0,10)
-0,1225%
(-0,45)
0,1689%
(0,57) Day J+30 J+31 J+32 J+33 J+34 J+35 J+36 AAR
Z0,1416%
(0,36)
0,201% (0,70)
0,1925% (0,52)
0,36% (1,16)
-0,01881% (-0,06)
0,02% (0,06)
0,0716% (0,29)
Day J+37 J+38 J+39 J+40 AAR
Z-0,3732% (-1,91)*
0,7447% (2,44)*
0,2632% (0,98)
0,17646% (0,61)
21
Table 10: Average abnormal returns on the event day
AAR Significant at least at 10% level are in bold
Table 11: Impact of unexpected upgrades on equity market prices Day J-40 J-39 J-38 J-37 J-36 J-35 J-34 AAR
Z
-0,377%
(-1,77)*
-1,687%
(-1,00)
-0,2013%
(-1,03)
-0,125%
(0,57)
0,2824%
(0,83)
-0,0352%
(-2,12)*
0,2314%
(0,83)
Day J-33 J-31 J-30 J-29 J-28 J-27 J-26 AAR
Z
-0,751%
(-2,30)*
-0,219%
(-0,66)
-0,031%
(2,08)*
-0,492%
(-1,82)*
0,000%
(0,01)
0,173
(1,82)*
-0,028
(-1,86)*
Day J-25 J-24 J-23 J-22 J-21 J-20 J-19 AAR
Z
0,017
(0,42)
-0,158
(-1,49)
-0,026
(-1,75)*
0,256
(-0,13)
0,041
(1,38)
-0,341
(-1,36)
0,047
(0,82)
Day J-18 J-17 J-16 J-15 J-14 J-13 J-12 AAR
Z
-0,038
(-0,89)
0,058
(0,88)
0,407%
(1,38)
0,099%
(2,08)*
-0,114 %
(-1,60)
-0,218
(0,19)
-0,095
(-1,47)
Day J-11 J-10 J-9 J-8 J-7 J-6 J-5 AAR
Z
0,261
(0,42)
0,023
(0,96)
0,247
(2,17)*
-0,236
(-3,58)*
0,149
(0,66)
- 0,123
(-1,64)*
0,418
(1,04)
Day J-4 J-3 J-2 J-1 J J+1 J+2 AAR
Z
0,406
(1,21)
0,116
(1,74)*
0,158
(3,18)*
0,184
(1,75)*
0,166
(2,89)*
0,374
(2,07)*
0,025
(1,72)*
Day J+3 J+4 J+5 J+6 J+7 J+8 J+9 AAR
Z
0,033
(1,80)*
0,162
(1,71)*
0,197
(3,77)*
0,314
(2,61)*
0,246
(2,68)*
0,173
(3,30)*
-0,168
(-0,75)
Day J+10 J+11 J+12 J+13 J+14 J+15 J+16 AAR
Z
0,162
(0,22)
-0,178
(-1,07)
-0,352
(3,43)
-0,291
(0,11)
-0,393
(-0,64)
0,118
(0,46)
0,304
(0,59)
Day J+17 J+18 J+19 J+20 J+21 J+22 J+23 AAR
Z
-0,039
(-1,27)
-0,207
(-1,03)
0,398
(1,93)*
-0,040
(-3,28)*
0,171
(1,74)*
-0,197
(-0,71)
-0,076
(-1,31)
Day J+24 J+25 J+26 J+27 J+28 J+29 J+30 AAR
Z
0,152
(0,40)
-0,035
(-1,18)
0,155
(0,73)
0,240
(0,32)
-0,0001%
(-0,01)
-0,1673%
(-2,59)*
-0,0949%
(-0,35)
Day J+31 J+32 J+33 J+34 J+35 J+36 J+37 AAR
Z
0,3669%
(1,33)
-0,0996%
(-0,29)
0,1683%
(0,52)
-0,3273%
(-1,29)
-0,354%
(-1,17)
-0,4453%
(-1,75)*
0,582%
(1,53)
Day J+38 J+39 J+40 AAR -0,5232% -0,05374% -0,2043%
Day 0
Positive watch
Negative watch
All Upgrades Unexpected Upgrades
Expected Upgrades
All Downgrades
Unexpected Downgrades
Expected Downgrades
AAR +0,6476% +0,3315% +0,1754% +0,1667%
+0,2953%
-0,0096%
-0,1352%
+ 0,2751%
σ (0,059) (0,1108) (0,1147) ( 0,1168)
(0,0337) (1,9254)
(1,1104)
(0,0876)

22
Z (-2,43)*
(-2,18)*
(-1,74)*
Table 12: Impact of expected upgrades on equity market prices Day J-40 J-39 J-38 J-37 J-36 J-35 J-34 AAR
Z
0,829%
(1,76)
0,2167%
(0,62)
0,248%
(0,89)
0,3557%
(1,39)
0,15%
(0,68)
0,258%
(0,75)
0,48%
(1,71)
Day J-33 J-32 J-31 J-30 J-29 J-28 J-27 AAR
Z
0,088%
(0,22)
0,254%
(0,87)
-1,89%
(-0,89)
-0,233%
(-0,69)
0,215%
(0,70)
-0,093%
(-0,21)
-1,139%
(-1,66)
Day J-26 J-25 J-24 J-23 J-22 J-21 J-20 AAR
Z
-0,489%
(-0,66)
-0,680%
(-2,35)
-0,856%
(0,97)
0,304%
(2,75)*
1,778%
(-1,13)
0,068%
(3,57)*
-0,641%
(0,36)
Day J-19 J-18 J-17 J-16 J-15 J-14 J-13 AAR
Z
-0,874%
(0,08)
0,484%
(-1,82)
-0,414%
(-0,01)
-1,492%
(1,57)
1,459%
(4,21)*
-0,285%
(-0,02)
-0,234%
(0,06)
Day J-12 J-11 J-10 J-9 J-8 J-7 J-6 AAR
Z
-1,379%
(-0,61)
0,213%
(0,57)
-1,253%
(-1,20)
-0,097%
(-0,31)
0,235%
(0,25)
0,162%
(1,06)
0,142%
(0,53)
Day J-5 J-4 J-3 J-2 J-1 J J+1 AAR
Z
0,926%
(1,30)
-0,091%
(-0,15)
-0,336%
(-0,48)
0,128%
(0,46)
-1,046%
(-0,38)
0,295%
(3,47)*
0,288%
(2,27)*
Day J+2 J+3 J+4 J+5 J+6 J+7 J+8 AAR
Z
-0,274%
(-1,23)
0,983%
(0,01)
-0,618%
(-0,54)
-0,598%
(-2,61)*
-0,290%
(0,45)
-1,199%
(0,88)
0,852%
(-0,67)
Day J+9 J+10 J+11 J+12 J+13 J+14 J+15 AAR
Z
1,005%
(-1,12)
-0,253%
(-0,01)
-0,075%
(-0,80)
-0,488%
(-1,22)
-0,524%
(-1,55)
-0,435%
(-1,58)
-0,117%
(-0,61)
Day J+16 J+17 J+18 J+19 J+20 J+21 J+22 AAR
Z
-1,066%
(-0,88)
-0,634%
(-1,10)
-0,485%
(-1,14)
-0,531%
(2,23)*
0,275%
(-1,16)
-0,500%
(-0,04)
-0,187
(1,01)
Day J+23 J+24 J+25 J+26 J+27 J+28 J+29 AAR
Z
-0,246%
(0,50)
-0,851%
(-0,75)
-0,682%
(0,88)
0,090%
(2,68)*
-0,156%
(0,05)
-0,021%
(-1,65)
-0,0005%
(-0,02)
Day J+30 J+31 J+32 J+33 J+34 J+35 J+36 AAR
Z
0,414%
(1,25)
-0,013%
(-0,03)
0,678%
(1,54)
0,791%
(2,31)
0,255%
(0,87)
0,354%
(0,83)
0,119%
(0,37)
Day J+37 J+38 J+39 J+40 AAR
Z
0,702%
(1,62)
-0,892%
(-3,45)
0,381%
(1,44)
-0,361%
(-0,94)

23
Table 13: Impact of unexpected downgrades on stock prices: Day J-40 J-39 J-38 J-37 J-36 J-35 J-34 AAR
Z
-0,02648%
(-0,08)
-0,889%
(-1,82)
-0,00003%
(-0,01)
0,563%
(1,57)
-0,4186%
(-1,21)
-0,00083%
(-0,02)
0,024%
(0,06)
Day J-33 J-32 J-31 J-30 J-29 J-28 J-27 AAR
Z
-0,3167%
(-0,61)
-0,235%
(-0,57)
-0,367%
(-1,20)
-0,089%
(-0,31)
0,083%
(0,25)
-0,4423%
(-1,06)
-0,292%
(-2,34)*
Day J-26 J-25 J-24 J-23 J-22 J-21 J-20 AAR
Z
0,275%
(2,21)*
-0,263%
(-4,32)*
-0,002%
(-3,65)*
-0,356%
(- 1,69)*
5,141%
(8,63)*
-0,232%
(3,11)*
-0,748%
(1,92)*
Day J-19 J-18 J-17 J-16 J-15 J-14 J-13 AAR
Z
-0,554%
(- 1,74)*
-0,002%
( 1,23)
0,014%
(0,65)
0,010%
( 0,98)
-0,381%
(-1,87)*
-0,667%
(-2,98)*
-0,066%
(-1,82)*
Day J-12 J-11 J-10 J-9 J-8 J-7 J-6 AAR
Z
-0,218%
(-1,91)*
1,141%
(3,54)*
-1,552%
(-3,87)*
-0,237%
(-1,21)
0,011%
(1,76)*
-0,158%
(1,95)*
0,223%
( 3,11)*
Day J-5 J-4 J-3 J-2 J-1 J J+1 AAR
Z
0,095%
(1,76)*
-0,119%
(-1,91)*
0,306%
(2,87)*
-0,038%
(-3,01)*
-0,809%
(-2,54)*
-0,135%
(-2,02)*
-0,917%
(-2,31)*
Day J+2 J+3 J+4 J+5 J+6 J+7 J+8 AAR
Z
-0,271%
(-2,77)*
-0,087%
(-3,05)*
-0,392%
(-3,42)*
-0,037%
(-2,13)*
-0,407%
(-7,21)*
-0,785%
(-5,43)*
-0,614%
(-3,22)*
Day J+9 J+10 J+11 J+12 J+13 J+14 J+15 AAR
Z
-0,598%
(-6,10)*
-0,171%
(-3,24)*
0,051%
(1,65)
0,194%
(2,87)*
0,105%
(2,11)*
0,323%
(1,97)*
0,592%
(2,64)*
Day J+16 J+17 J+18 J+19 J+20 J+21 J+22 AAR
Z
0,298%
(2,62)*
0,037%
( 0,65)
-0,231%
(-3,21)*
-1,102%
(-2,54)*
1,386%
(1,87)*
0,394%
( 0,99)
-0,328%
(-4,02)*
Day J+23 J+24 J+25 J+26 J+27 J+28 J+29 AAR
Z
0,341%
(0,76)
-1,154%
(-2,87)
0,124%
(2,43)*
-0,027%
(-2,10)*
-0,248%
(-1,23)
-0,327%
(-1,71)*
-0,261%
(-1,31)
Day J+30 J+31 J+32 J+33 J+34 J+35 J+36 AAR
Z
-0,275%
(-1,23)
0,000%
(0,01)
-0,165%
(-0,54)
-0,828%
(-161)
0,127%
(0,45)
0,281%
(0,88)
-0,194%
(-0,67)
Day J+37 J+38 J+39 J+40 AAR
Z
-0,892%
(-3,45)*
-0,381%
(-1,44)
-0,361%
(-0,94)
-0,699%
(-1,43)
Table 14: Impact of expected downgrades on stock prices Day J-40 J-39 J-38 J-37 J-36 J-35 J-34 AAR
Z
-0,0207%
(-206)*
0,1577%
(0,68)
0,423%
(1,84)*
0,1747%
(0,46)
-0,4831%
(-1,74)*
-0,5785%
(-1,95)*
-0,1459%
(-0,45)
24
Day J-33 J-32 J-31 J-30 J-29 J-28 J-27 AAR
Z
0,3933%
(0,83)
-0,04227%
(-0,14)
-0,6987%
(-3,09)*
-0,2883%
(-0,95)
0,0471%
(0,21)
-0,5663%
(-0,64)
0,836
(0,67)
Day J-26 J-25 J-24 J-23 J-22 J-21 J-20 AAR
Z
0,214
(0,13)
0,045
(-0,07)
0,594
(0,02)
-0,551
(-1,13)
0,291
(0,79)
0,0945
(4,07)*
-0,312
(-0,57)
Day J-19 J-18 J-17 J-16 J-15 J-14 J-13 AAR
Z
0,794%
(- 1,74)*
0,499%
( 3,,23)*
-0,662%
(-0,65)
0,652%
( 0,98)
-0,233%
(-1,87)*
-0,021%
(-2,98)*
-0,015%
(-1,82)*
Day J-12 J-11 J-10 J-9 J-8 J-7 J-6 AAR
Z
-0,089
(-1,91)*
0,04%
(3,54)*
0,739%
(3,87)*
0,673%
(1,21)
-0,524%
(-0,76)
0,159%
(2,95)*
0,406%
( 1,13)*
Day J-5 J-4 J-3 J-2 J-1 J J+1 AAR
Z
0,019%
(1,86)*
0,573%
(2,98)*
0,139%
(2,87)*
0,286%
(3,01)*
0,782%
(8,41)*
0,275%
(2,32)*
0,395%
(4,10)*
Day J+2 J+3 J+4 J+5 J+6 J+7 J+8 AAR
Z
0,083%
(5,26)*
0,005%
(2,01)*
0,003%
(9,42)*
0,068%
(2,12)*
0,796%
(3,20)*
-0,158%
(-,2,24)*
-0,184%
(-2,13)*
Day J+9 J+10 J+11 J+12 J+13 J+14 J+15 AAR
Z
-0,320%
(-1,87)*
-0,320%
(-1,64)*
0,333%
(1,77)*
0,280%
(12,21)*
0,399%
(1,90)*
-0,075%
(-1,87)*
-0,309%
(-2,54)*
Day J+16 J+17 J+18 J+19 J+20 J+21 J+22 AAR
Z
0,212%
(2,62)*
0,0316%
( 0,65)
0,047%
(1,21)
-0,068%
(-2,54)*
-0,178%
(1,87)*
-0,049%
(-0,99)
0,054%
(1,02)
Day J+23 J+24 J+25 J+26 J+27 J+28 J+29 AAR
Z
0,2191%
(1,84)*
-0,117%
(-2,87)*
0,297%
(2,43)*
0,860%
(2,15)*
-0,105%
(-1,73)*
0,367%
(2,24)*
0,078%
(0,32)
Day J+30 J+31 J+32 J+33 J+34 J+35 J+36 AAR
Z
0,364%
(1,46)
0,249%
(0,89)
-0,21
(-0,7)
-0,055%
(-0,14)
-0,015%
(-0,05)
-0,180%
(-0,67)
0,196%
(0,67)
Day J+37 J+38 J+39 J+40 AAR
Z
-0,332%
(-0,57)
-0,358%
(-0,71)
-0,022%
(-0,09)
0,191%
(0,62)
25
Impact of rating agencies actions on stock prices (Average Abnormal returns (AAR)) during the studied window.
POSITIVE WATCHES
-1
-0,5
0
0,5
1
1,5
2
2,5
J-27 J-24 J-21 J-18 J-15 J-12 J-9 J-6 J-3 J J+3 J+6 J+9 J+12 J+15 J+18 J+21 J+24 J+27
J
AAR
(%
NEGATIVE WATCHES
-1,2-1
-0,8-0,6-0,4-0,2
00,20,40,60,8
J-27
J-24
J-21
J-18
J-15
J-12 J-9
J-6
J-3 J
J+3
J+6
J+9
J+12
J+15
J+18
J+21
J+24
J+27
J
AA
R(%
UNEXPECTED UPGRADES
-0,5-0,4
-0,3-0,2-0,1
0
0,10,20,3
0,40,5
J-27
J-24
J-21
J-18
J-15
J-12 J-9
J-6
J-3 J
J+3
J+6
J+9
J+12
J+15
J+18
J+21
J+24
J+27
J
AAR
(%

26
EXPECTED UPGRADES
-2
-1,5
-1
-0,5
0
0,5
1
1,5
2J-
27
J-24
J-21
J-18
J-15
J-12 J-9
J-6
J-3 J
J+3
J+6
J+9
J+12
J+15
J+18
J+21
J+24
J+27
J
AAR
(%
UNEXPECTED DOWNGRADES
-2
-1
0
1
2
3
4
5
6
J-27
J-24
J-21
J-18
J-15
J-12 J-9
J-6
J-3 J
J+3
J+6
J+9
J+12
J+15
J+18
J+21
J+24
J+27
J
AAR
(%

27
EXPECTED DOWNGRADES
-0,8
-0,6
-0,4
-0,2
0
0,2
0,4
0,6
0,8
1J-
27
J-24
J-21
J-18
J-15
J-12 J-9
J-6
J-3 J
J+3
J+6
J+9
J+12
J+15
J+18
J+21
J+24
J+27
J
AA
R(%
BOX 1 AN EVENT STUDY MODEL OF LARGE EUROPEAN BANK STOCK RETURNS I structure my equity market event studies using a two- factor model of large European bank stock returns. I define itR to be the monthly (daily) stock return for the bank and event i at time t. 1) In the estimation window, I estimate for each bank (event)
itticmtiit MRR εββα +++= 21
where DCti
DCtiti PPR 1,,, lnln −−= with DC
tiP , is the (monthly) daily closing price of each bank bond i at time t. cmtR is the overall monthly (daily)market
return for the same period in the country c and tM is a matrix of macroeconomic variables (OECD aggregate short term interest rate (IFS database) , G7 industrial production index (OECD database). The model’s parameters are estimated using mounthly returns for up to 2 years for the first study and up to 100 days for the second study. 2) Using the estimated parameters βα ˆ,ˆ of (1), I calculate at each time t of the event window and for each event the “normal returns” such that
itR (normal)= iα̂ + iβ̂ cmtR (observed) 3) Within the event window, the abnormal return is defined as : ticmtiitit MRRAR 21
ˆˆˆ ββα −−−=
4) For any event i, I cumulate over any time period 21 ττ to of the event window, the abnormal returns of equity such that:
∑=
=2
1
12,
τ
τττ
ttii ARCAR
The average market reaction of n events (by type) at each date t, is defined by:
∑=
=n
iitt AR
nAAR
1
1
To determine the global effect of a number n of events, I compute the cumulative average abnormal return such that:
∑=
=2
1
21,
τ
τττ
ttAARCAAR

28
Bibliography
Allen, L., J. Jagtiani, and M. Moser.( 2001): “Further Evidence on the Information Content of Bank Examination Ratings: A Study of BHC-to-FHC Conversion Applications.” Journal of Financial Services Research 20, pp. 213–232. Avery, Robert B., Terence M. Belton et Michael A. Goldberg (1988) : “Market Discipline in Regulating Bank Risk: New Evidence from the Capital Markets”, Journal of Money, Credit, and Banking, vol. 20, N°. 4, pp. 597-610, November. Bank for International Settlements (BIS) (2004a): “Bank Failures in Mature Economies”, Basel Committee on Banking Supervision, Working Paper, N° 13, April. Bank for International Settlements (BIS) (2001): “Working Paper on Pillar 3- Market Discipline”, Basel Committee on Banking Supervision, September. Baumann, Ursel and Erlend Nier (2004): “Disclosure, Volatility, and Transparency: An Empirical Investigation into the Value of Bank Disclosure”, Economic Policy review, September. Benink, Harald A. and Clas Wihlborg (2002) : “The New Basel Capital Accord: Making It Effective with Stronger Market Discipline”, European Financial Management, vol. 8, no. 1, pp. 103-115, march. Benston, George J. (1993) : “Market Discipline: The Role of Uninsured Depositors and Other Market Participants”, in “Safeguarding the Banking System in an Environment of Financial Cycles”, Richard E. Randall (ed.), Conference Series, No. 37, Federal Reserve Bank of Boston, pp. 65-95,November. Berger, Allen N. and Sally M. Davies (1998): “The Information Content of Bank Examinations”, Journal of Financial Services Research, vol. 14, N°. 2, pp. 117-144, October. Berger, Allen N., Sally M. Davies and Mark J. Flannery (2000) : “Comparing Market and Supervisory Assessments of Bank Performance: Who Knows What When?”, Journal of Money, Credit, and Banking, vol. 32, N° 3, part II, pp. 641-667, August. Beighley, H. Prescott (1977): “The Risk Perception of Bank Holding Company Debt holders”, Journal of Bank Research, pp. 85-93, Summer. Birchler, Urs W. et Diana Hancock (2004): “What Does the Yield on Subordinated Bank Debt Measure?”, Board of Governors of the Federal Reserve System, Finance and Economics Discussion Series, No. 2004-19, April. Birchler and Facchinetti (2006): “Can bank supervisors rely on market data? A critical assessment from a Swiss perspective”, Swiss National Bank Working Papers, August. Bliss, Robert R. (2000): “The Pitfalls in Inferring Risk from Financial Market Data”, Federal Reserve Bank of Chicago, Working Paper, No. 2000-24, December.

29
Bliss, R. (2001) : “Market Discipline and Subordinated Debt: A Review of Some Salient Issues”, Federal Reserve Bank of Chicago, Economic Perspectives, vol.14, N° 1, pp. 24-45,1st Quarter. Bliss, R. and M. J. Flannery (2002) : “Market Discipline in the Governance of U.S. Bank Holdings Companies: Monitoring vs. Influencing”, European Finance Review, vol. 6, N° 3, pp. 361-395. Burton. Steven and Seale Gary (2005) : « a survey of current and potential uses of Market data by the FDIC » FDIC Banking Review 17(1) pp1-17. Cable, J and K, Holland (2000): “Robust versus OLS Estimation of the Market Model: implications for event studies”, Economics letters, 69, pp 385,391. Cannata and Quagliariello (2005): “The Value of Market Information in Banking Supervision: Evidence from Italy, Journal of Financial Services Research 27, N°2, pp. 139-162.
Calomiris, Charles W. (1999): “Building an Incentive-Compatible Safety Net”, Journal of Banking and Finance, vol. 23, N° 10, pp. 1499-1519, October. Chen.Yu-Fu, Funke.M and Mannasoo. K (2006): Extracting Leading Indicators of Bank Fragility from Market Prices Estonia Focus, CESIFO Working Paper N° 1647. Cannata. F and Quagliariello.M (2005) : “The Value of Market Information in Banking Supervision: Evidence from Italy”, Journal of Financial Services Research, vol. 27, N°. 2, pp. 139- 162, April. Covitz, Daniel M., Diana Hancock and Myron L. Kwast (2000): “Mandatory Subordinated Debt: Would Banks Face More Market Discipline?, Board of Governors of the Federal Reserve System, mimeo, June.
Covitz, Daniel M., Diana Hancock and Myron L. Kwast (2002) : “Market Discipline in Banking Reconsidered: the Roles of Deposit Insurance Reform, Funding Manager Decisions and Bond Market Liquidity”, Board of Governors of the Federal Reserve System, Finance and Economics Discussion Series, No. 2002-46, October. Covitz, Daniel M. and Paul Harrison (2004): “Do Banks Time Bond Issuance to Trigger Disclosure, Due Diligence, and Investor Scrutiny?”, Journal of Financial Intermediation, vol. 13, no. 3, pp.299-323, July.
Crouzille.C, Lepetit.L and Tarazi.A (2004) : “Bank Stock Volatility, News and Asymmetric Information in Banking: An Empirical Investigation”, Journal of Multinational Financial Management, vol. 14, N°. 4-5, pp. 443-461, October/December.

30
Curry T.J, Elmer.P.J and Fissel. G.S (2003): “Using Market information to help Identify Distressed Institutions”: A regulatory Perspective FDIC banking review, Volume 15, N° 3. Dawatripont. M and Tirole.J (1994): « Efficient Governance Structure : Implications for Banking Regulation » in C.Mayer and X.Vives : Capital Markets and financial Intermediation. Cambridge University Press, pp 12-35. Dahl, Drew, Gerald A. Hanweck, and John P. O’Keefe (1995): “Audits, Exams and Accounting Integrity in Banking”, Unpublished manuscript, presented at Academy of Financial Services Annual Meeting, October. DeYoung, Robert R., Mark J. Flannery, William W. Lang and Sorin M. Sorescu (2001) : “The Informational Content of Bank Exam Ratings and Subordinated Debt Prices”, Journal of Money, Credit, and Banking, vol. 33, N° 4, pp. 900-925, November. Distinguin. I, Rous.P and Tarazi.A (2005) : “Market Discipline and the Use of Stock Market Data to Predict Bank Financial Distress”, Université de Limoges, mimeo, march. DeYoung, R., M.J. Flannery, W.W. Lang, and S.M. Sorescu (2001): “The Information Content of Bank Exam Ratings and Subordinated Debt Prices.” Journal of Money, Credit, and Banking 33(4) (November), pp. 900–925. Elton, Edwin J., Martin J. Gruber, Deepak Agrawal and Christopher Mann (2001): “Explaining the Rate Spreads on Corporate Bonds”, Journal of Finance, vol. LVI, N° 1, pp. 247-277, February. Evanoff, Douglas D. (1992a): “Preferred Sources of Market Discipline: Depositors vs. Subordinated Debt Holders”, in “Issues in Financial Regulation”, Federal Reserve Bank of Chicago, Working Papers Series, N° 21, November. Evanoff, Douglas D. and Larry D. Wall (2001a): “Reforming Bank Capital Regulation: Using Subordinated Debt to Enhance Market and Supervisory Discipline”, Contemporary Economic Policy, vol. 19, N°. 4, pp. 444-453, October. Evanoff, Douglas D. and Larry D. Wall (2000b): “Subordinated Debt and Bank Capital Reform”, Federal Reserve Bank of Chicago, Working Paper, No. 2000-07, August. Flannery, Mark J. (1998): “Using Market Information in Prudential Bank Supervision: A Review of the U.S. Empirical Evidence”, Journal of Money, Credit, and Banking, vol. 30, no. 3, part I, pp. 273-305, August. Flannery, Mark J. (2001): “The Faces of «Market Discipline»”, Journal of Financial Services Research, vol. 20, N° 2-3, pp.107-119, October/ December. Flannery, Mark J. and Sorin M. Sorescu (1996): “Evidence of Bank Market Discipline in Subordinated Debentures Yields: 1983-1991”, Journal of Finance, vol. 15, N°. 4, pp. 1347-1377, September.

31
Flannery, Mark .J, Kwan .Simon .H , and Nimalendram.M (2002) : “Market evidence on the opaqueness of banking Assets”, published in Journal of Financial Economics, March 2004, v. 71, issue. 3, pp. 419-60. Evanoff, Douglas D. and Larry D. Wall (2001a): “Reforming Bank Capital Regulation: Using Subordinated Debt to Enhance Market and Supervisory Discipline”, Contemporary Economic Policy, vol. 19, N°. 4, pp. 444-453, October. Evanoff, Douglas D. and Larry D. Wall (2002): “Measures of the Riskiness of Banking Organizations: Subordinated Debt Yields, Risk-based Capital, and Examination Ratings”, Journal of Banking and Finance, vol. 26, N°. 5, pp. 989-1009, May. Evanoff, Douglas D. and Larry D. Wall (2003): “Subordinated Debt and Prompt Corrective Regulatory Action”, Federal Reserve Bank of Chicago, Working Paper, N°3. Flannery, Mark J.and Sorin M. Sorescu (1996): “Evidence of Bank Market Discipline in Subordinated Debentures Yields: 1983-1991”, Journal of Finance, vol. LI, no. 4, pp. 1347-1377, September. Flannery, Mark J. (1998) : “Using Market Information in Prudential Bank Supervision: A Review of the U.S. Empirical Evidence”, Journal of Money, Credit, and Banking, vol. 30, N° 3, part I, pp. 273- 305, August. Flannery, Mark J. (2002): “No Pain, No Gain? Effecting Market Discipline via «Reverse Convertible Debentures»”, University of Florida, Working Paper, November. Flannery, Mark J., Simon H. Kwan and Mahendrarajah Nimalendran (2004) : “Market Evidence on the Opaqueness of Banking Firms’ Assets”, Journal of Financial Economics, vol. 71, N° 3, pp. 419-460, March. Flannery, Mark J et Kasturi P.Rangen (2002): Market forces at work in the banking industry: evidence from the capital buildup of the 1990s. Federal Reserve Bank of Chicago, Mai. Furfine, Craig H. (2001): “Banks as Monitors of Other Banks: Evidence from the Overnight Federal Funds Market”, Journal of Business, vol. 74, N° 1, pp. 33-57, January. Furlong .T. Frederick and Williams.Robard (2006): Financial Market Signals and Banking Supervision: Are Current Practices Consistent With Research Findings?: FRSF Economic Review. Gropp, R., and A.J. Richards.( 2001): “Rating Agency Actions and the Pricing of Debt and Equity of European Banks: What Can We Infer about Private Sector Monitoring of Bank soundness? ECB Working Paper N°76. Gropp, R, Vesala, J and Vulves, G (2001): Equity and Bond market signals as leading indicators of bank fragility in Europe, ECB, Working Paper N°150.

32
Gonzáles-Rivera, Gloria et David Nickerson (2003): “Monitoring Financial Intermediaries with Subordinated Debt: A Dynamic Signal Model for Bank Risk”, AFA Annual Meeting, January. Goyal, Vidhan K. (2005): “Market Discipline of Bank Risk: Evidence from Subordinated Debt Contracts”, Journal of Financial Intermediation, vol. 14, no. 3, pp. 318-350, July. Goyeau. D, Sauviat.A and Tarazi.A (2001):“Marché financier et évaluation du risque bancaire. Les agences de notation contribuent-elles à améliorer la discipline de marché ?”, Revue Économique, vol. 52, no. 2, pp. 265-283, March. Gorton, Gary and Anthony M. Santomero (1990): “Market Discipline and Bank Subordinated Debt”, Journal of Money, Credit, and Banking, vol. 22, no. 1, pp. 119-128, February. Gropp, Reint and Anthony J. Richard (2001): “Rating Agency Actions and the Pricing of Debt and Equity of European Banks: What Can We Infer About Private Sector Monitoring of Bank Soundness?”, Economic Notes, vol. 30, N° 3, pp. 373-398, November. Gropp, Reint and Jukka Vesala (2004): “Deposit Insurance, Moral Hazard, and Market Monitoring”, Review of Finance, vol. 8, N°4, pp. 571-602, December. Gropp. R, Vesala.J and Vulpes.G (2002) : “Equity and Bond Market Signals as Leading Indicators of Bank Fragility”, ECB Working Papers N° 150, June. Gropp, Reint, Jukka Vesala and Giuseppe Vulpes (2004) : “Market Indicators, Bank Fragility, and Indirect Market Discipline”, Federal Reserve Bank of New York, Economic Policy Review, vol. 10, N° 2, pp. 53-62, September. Gunther, Jeffery W., Mark E. Levonian and Robert R. Moore (2001) : “Can the Stock Market Tell Bank Supervisors Anything They Don’t Already Know?”, Federal Reserve Bank of Dallas, Economic and Financial Review, pp. 2-9, 2d Quarter. Hall, John R., Thomas B. King, Andrew P. Meyer and Mark D. Vaughan (2002b) : “Do Insured Depositors and Bank Supervisors View Bank Risk Similarly? A Comparison of the Factors affecting Jumbo-CD Yields and CAMEL Scores”, Federal Reserve Bank of St. Louis, Supervisory Policy Analysis Working Paper, No. 2002-05, September. Hanweck, Gerald A. (2002): “The Simultaneous Use of Subordinated Debt and Equity Market Values to Assess Banking Company Insolvency Risk”, FMA Annual Meeting, October. Hanweck, Gerald A. and Lewis J. Spellman (2002): “Forbearance Expectations and the Subordinated Debt Signal of Bank Insolvency”, presented at the joint FDIC and Journal of Financial Services Research Conference on Pricing the Risks of Deposit Insurance, Washington, D.C., September. Hamalainen, Paul, Maximilian J.B. Hall and Barry Howcroft (2005): “A Framework for Market Discipline in Banking Regulation”, Journal of Business Finance and Accounting, vol. 32, N°. 1-2, pp. 183-209, January/ March.

33
Isabelle Distinguin, Philippe Rous and Amine Tarazi (2006): “Market Discipline and the Use of Stock Market Data to Predict Bank Financial Distress”, Journal of Financial Services Research, Volume 30, N° 2,October. Jagtiani, J., G. Kaufman, and C. Lemieux (2000): “Do Markets Discipline Banks and Bank Holding Companies? Evidence from Debt Pricing.” Emerging Issues Series 99-3R, Supervision and Regulation, FRB Chicago. Jagtiani, Julapa A. and Catharine Lemieux (2000): “Stumbling Blocks to Increasing Market Discipline in the Banking Sector: A Note on Bond Pricing and Funding Strategy Prior to Failure”, Federal Reserve Bank of Chicago, Emerging Issues Series, No. S&R-98-8R, April. Jagtiani, Julapa A. and Catharine Lemieux (2001) : “Market Discipline Prior to Bank Failure”, Journal of Economics and Business, vol. 53, N° 2-3, pp. 313-324, March/June. Jagtiani, Julapa A., George G. Kaufman and Catharine Lemieux (2002) : “The Effect of Credit Risk on Bank and Bank Holding Company Bond Yields: Evidence from the Post-FDICIA Period”, Journal of Financial Research, vol. 25, N° 4, pp. 559-575, Winter. Jordan, John S., Joe Peek and Eric S. Rosengren (2000) : “The Market Reaction to the Disclosure of Supervisory Actions: Implications for Bank Transparency”, Journal of Financial Intermediation, vol. 9, N°3, pp. 298-319, July. Kaplan Robert .S and Urwitz Gabriel (1979): “Statistical Models of Bond Ratings: a methodological Inquiry”, University of Chicago Press in its Journal Of business, April, pp 231 261. Keeley, Michael C. (1990): “Deposit Insurance, Risk, and Market Power in Banking”, AmericanEconomic Review, vol. 80, N° 5, pp. 1183-1200, December. Krainer, John and Jose A. Lopez (2004) : “Incorporating Equity Market Information into Supervisory Monitoring Models”, Journal of Money, Credit, and Banking, vol. 36, N° 6, pp. 1043-1068, December. Krainer, John and Jose A. Lopez (2003): “How Might Financial Market Information Be Used for Supervisory Purposes?”, Federal Reserve Bank of San Francisco, Economic Review, pp. 29-45. Krishnan,C.N.V., Peter H. Ritchken and James B. Thomson (2005) : “Monitoring and Controlling Bank Risk: Does Risky Debt Help?”, Journal of Finance, vol. 15, N° 1, pp. 343-378, February. Kwan, Simon H. (2004b): “Testing the Strong-Form of Market Discipline: The Effects of Public Market Signals on Bank Risk”, Federal Reserve Bank of San Francisco, Working Paper, No.19, May. Krainer, J., and J.A.Lopez.(2001):“Incorporating Equity Market Information into Supervisory Monitoring Models.” FRB San Francisco Working Paper 2001-14.

34
Krainer, J.,and J.A. Lopez. (2003):“Forecasting Supervisory Ratings Using Securities Market Information.” Manuscript, Economic Research Department, FRB San Francisco. Lang, William W. and Douglas D. Robertson (2002): “Analysis of Proposals for a Minimum Subordinated Debt Requirement”, Journal of Economics and Business, vol. 54, N° 1, pp. 115-136, January /Febuary. Lucas, Robert E. Jr. (1976): “Econometric Policy Evaluation: A Critique”, Carnegie-Rochester Conference Series on Public Policy, vol. 1, pp. 19-46, reprinted in “La macroéconomie après Lucas. Textes choisis”, Gilbert Abraham-Frois et Françoise Larbre (eds.), Ed. Economica, pp. 105-118. Mark J. Flannery (1998): “Using Market Information in Prudential Bank Supervision: A Review of the U.S. Empirical Evidence”. Journal of Money, Credit and Banking, Vol. 30, N° 3, Part 1 Aug, pp. 273-305. Merton, Robert C. (1974): “On the Pricing of Corporate Debt: The Risk Structure of Interest Rate”, Journal of Finance, vol.29,N° 2, pp. 449-470, May (Chapter 12 in Continuous-Time Finance). Morgan, Donald P. (2002): “Rating Banks: Risk and Uncertainty in an Opaque Industry”, American Economic Review, vol. 92, N° 4, pp. 874-888, September. Morgan, Donald P. and Kevin J. Stiroh (2000): “Bond Market Discipline of Banks: Is the Market Tough Enough?”,Federal Reserve Bank of New York, Staff Report, No. 95, November. Morgan, Donald P. and Kevin J. Stiroh (2001) : “Market Discipline of Banks: The Asset Test”, Journal of Financial Services Research, vol. 20, N° 2-3, pp. 195-208, October/December. Morgan, Donald P. and Kevin J. Stiroh (2005):“Too Big to Fail after All These Years”, Federal Reserve Bank of New York, Staff report N° 220. Nikolova.S (2003): “Bank Risk Reflected in Security Prices: Combining Equity and Debt Market Information to Assess Bank Condition”, University of Florida,Working Paper, November. Park, Sangkyun and Stavros Peristiani (2001) : “Are Bank Shareholders Enemies of Regulators or a Potential Source of Market Discipline?”, Federal Reserve Bank of New York, Staff Report, No. 138, September. Penas, María Fabiana and Haluk Unal (2004) : “Gains in Bank Mergers: Evidence from the BondMarkets”, Journal of Financial Economics, vol. 74, N° 1, pp. 149-179, November. Pettway. R (1976): “Market Tests of Capital Adequacy of Large Commercial Banks”, Journal of Finance, vol. 31, N° 3, pp. 865-875, June. Pop. Adrian (2005): « La discipline de marché dans la régulation bancaire : le rôle de la dette subordonnée ». Thèse de Doctorat, Université d’Orléans.

35
Rochet, Jean-Charles (2004) : « Réglementation prudentielle et discipline de marché », Revue d'économie financière, vol. 73, p. 201-212. Richard H. Pettway (1980): Potential Insolvency, Market Efficiency, and Bank Regulation of Large Commercial Banks. The Journal of Financial and Quantitative Analysis, Vol. 15, No. 1 Mars, pp. 219-236. Rajan, Raghuram G. (2001): “Comment”, in “Prudential Supervision: What Works and What Doesn’t?”, Frederic S. Mishkin (ed.), University of Chicago Press, Chicago, pp. 143-145. Rochet, Jean-Charles et Jean Tirole (1996) : “Interbank Lending and Systemic Risk”, Journal of Money, Credit, and Banking, vol. 28, N° 4, part II, pp. 733-762, November.
Rochet, Js and Vives.X (2004) : “Coordination Failures and the Lender of Last Resort: Was Bagehot Right After All?”, Journal of the European Economic Association, vol. 2, N° 6, pp. 1116-1147, December. Sironi, Andrea (2001): “An Analysis of European Banks’ SND Issues and its Implications for the Design of a Mandatory Subordinated Debt Policy”, Journal of Financial Services Research, vol. 20, N°. 2-3, pp. 233-266, October/December. Saunders, Anthony (2001): “Comment on Evanoff and Wall/ Hancock and Kwast, Journal on Financial services Research 20, pp189-194. Stern. G.H (2001): “Taking market data seriously” Federal Reserve Bank of Minneapolis Region, September, pp 8-11. Swindler, Steve and James A. Wilcox (2002): “Information about Bank Risk in Options Prices”, Journal of Banking and Finance, vol. 26, N°5, pp. 1033-1057, May. Wang, J.(1993):” A Model of Intertemporal Asset Prices under Asymmetric Information”, Review of Economic Studies 60, 249–82. White. Lawrence J. (1997) “The lessons of the 1980s for Bank regulation: An Overview of the Overview” History of the Eighties: Lessons for the Future, Volume II. Federal Deposit Insurance Corporation, Washington D.C.