Embed Size (px)
Citation preview

_IP_SANDIA REPORTSAND91--0894 • UC ....814Unlimited Release
Printed July 1992
Yucca Mountain Site Characterization Project
Anisotropy of the TopopahSpring Member Tuff
R. J. Martin I11,R. H. Price,, P. J. Boyd, R. W. Haupt
Prepared bySand'ia National Laboratories
Albuquerque, New Mexico 87185 and L,vermore California 94550
for the United States Department of EnBrgyunder Contract DE-ACO4-76DPO0789
DISTRIBUTION OF THIS DOOUMEN'I:' IS UNL.IMtTE/,_
" 'rq_ 'l'f ...... ill I'lfll i111r,',q_ _,11,,_r i, .... _,,,,nr_.,,,,,_, ,,11=1_1j ,,...... ,, _,', ,I,_' _rl'w,"

"Prepared by Yucca Mountain Site C,haracterizati(m Project (YMSCP) par-ticipants as part ()t" the Civilian Radioactive Waste Management Pr()gram(CRWM). The h'MS(.t'' ) is managed by, the Yucca M¢)umain Project Office ofthe U,S, Department ()f Energy, I)OE Field ()flit'e, Nevada (D()E/NV).YMSCP work is sponsored by the Office t)f (ieoh_gic Repositories tO(lR) ofthe DOE Office of Civilian Radioactive Waste Management (O(.'_RWM),"
Issued by Sandia Natitmal Laboratories, operated for the [lnited StatesDepartment of Energy by Sandia Corporation.NOTICE: This report was prepared as an account of w(wk sponsored by a_lagency (),"the Uvtited States Government. Neither the []nited States Govern-ment l)or any agency thereof, nor any of their emph)yees, nor any of theircontractors, subc(mtract(_rs, or their enlployees, makes any warranty, expressor implied, or assumes any legal liability or responsibility for the accuracy,c()mp!eteness, or usefulness ()f any infurmati(m, apparatus, pr-duct, ()rprocess disclosed, or represents thai its use would not infringe privatelyowned rights. Reference herein to any specific commercial Ira)duct, pr(wess, ()rservice by trade name, trademark, manufacturer, ()r ()lherwise, d()e,_ notnecessarily constitute (Jr imply its endorsement, recommendation, or thvoringby the [lnited States (h)vern_]_en',, an\' agent\, there_)f (_r any _)f theirc('mtraclors ()r subcontractors, '[ he views and c)t)'inions expressed" herein (h)not necessarily state (_r re,fleet th()se of the (Jnited State_ (i_()vermnent, anyagency thereof (_r arty of their contractt)rs.
Printed iii the I.lnited States .t' .-_merica, '['his report has been repr()duceddirectly i'r(m_ the best available coI)y.
Available i. I)()E and I)()E c_)ntra(.t(ws t'r(mlOffice ¢)t'Scientific and Technical [nformatitmP() B_x 62Oak Ridge, TN 37831
Price_ available from (615) 576-8,1(11, FTS 626-8,:1(.)1
Available to the public fr()mNational Technical Ini'ormati()_ Service[IS I.)epartmel_t of C()mmerce5285 Port Royal RdSpringfield, _'_A 22161
NTIS price codesPrin:?(l copy: A03Microt'i('he copy: A0I
I
" SAND91-0894Unlimited Release
Printed July 1992
ANISOTROPY OF THE
TOPOPAH SPRING MEMBER TUFF
R. J. Martin III't, R. II. Priceit, P. J. Boydt, and R. W. Hauptt
t New England Research, Inc.
White River Junction, VT 05001
;tGeoscience Assessment and Validation Division
Sandia National Laboratories
Albuquerque, New Mexico 87185
ABST_,ACT
The mechanical properties of the tuffaceous rocks within Yucca Mountain are needed for near-
and far-field modeling of the potential nuclear waste repository. If the mechanical properties
are significantly anisotropic (i.e., direction-dependent), a more c,_mplex model is required. Rel-
• evant data from tuf[s tested in earlier studies indicate that elastic and strength properties are
anisotropic. This scoping study confirms the elastic anisotropy and concludes some tufts are
' tra.nsversely isotropic. An approach for sampling and testing the rock to determine the magnitude
of the anisotropy is proposed. _ASTE_
_\ (_5
This work was performed under the auspices of the U S Department of Energy (US DOI,), ()f_ice
" " ' (+Jharacte:rlzat, ion Project, underof (.+,lvfllan Radioactive Waste Management, Yucca Mout_tain Site ' ' ' '
Contract #DE- AC04-76DP00789. The activities described irt this document were performed under,,
Work Brea.kdown Structur_ (WBS) Element 1.2.3.2.7.1.3°
TABLE OF CONTENTS
Se_ctioj_! Page
1.0 Introduction I
2.0 Experiment Procedures 5
3.0 Experiment Results 8
4.0 Discussion and Conclusions 15
5,,0 References 20
6.0 Figures 211
Table Page
Table 1. Salnple Charact, cristics 5
Table 2. \%]ocity Data for 10/AE/78B 9
Table 3. Velocity Data for 10/AE/78A I0
Table 4. Velocity Di,ta for 10/AE/78C l l
Table 5. Fla,stic C,oefficients for Sample 10/AE/7SA 13
Table 6. Elastic Coefficients for Saomple 10/AE/78B 13
Table 7. Engineering Elastic C oeflTicients 14
III
ml
_ ...... Hill........ _1 , ..... ill, ,til illl

CONTENTS (concluded)
F_gure Page_
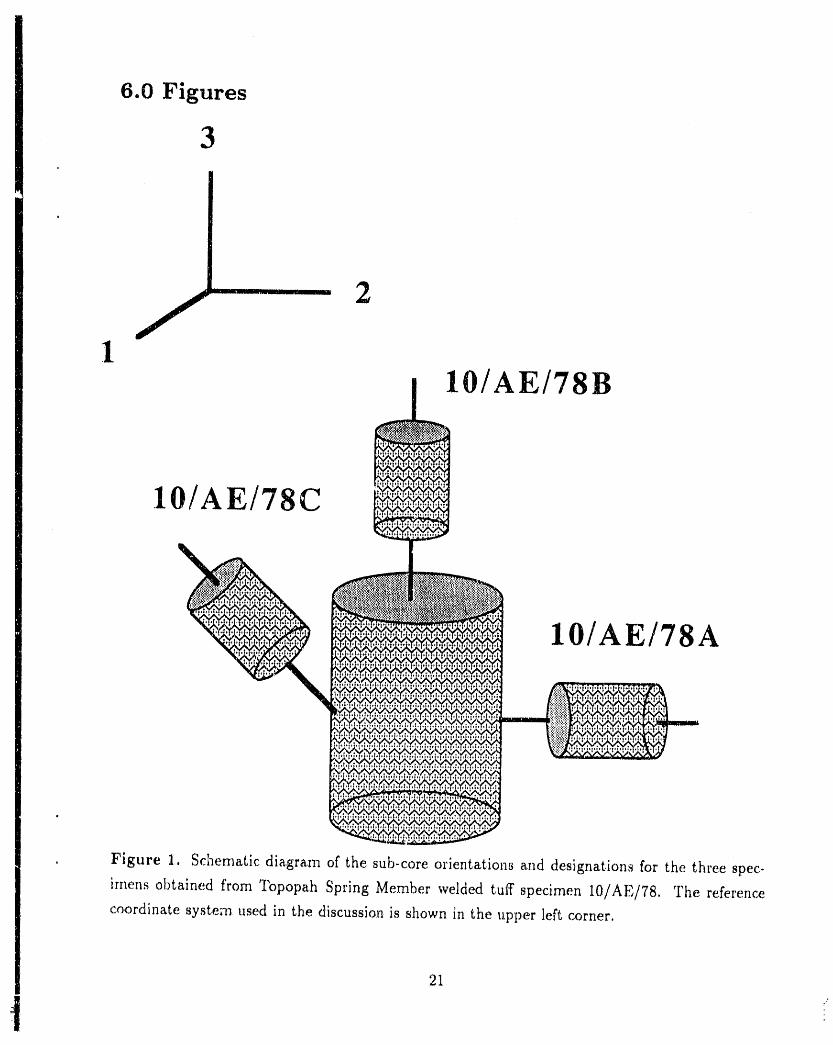
Figure 1. Schematic diagram of the sub.-core orientations and designations for the 21
three specimens obtained from Topopah Spring Member welded tuff specimen
10/AE/78. The reference coordinate system used in the discussion is shown in
the upper left corner.
Figure 2. Compressional (P-wave) and shear wave (Sl and $2) velocities are plotted 22
a,s a function of confining pressure for a vacuum dry specimen of Topopah Spring
Member tuff. The propagation direction, is parallel to the axis of symmetry (i.e.
normal to the bedding plane).
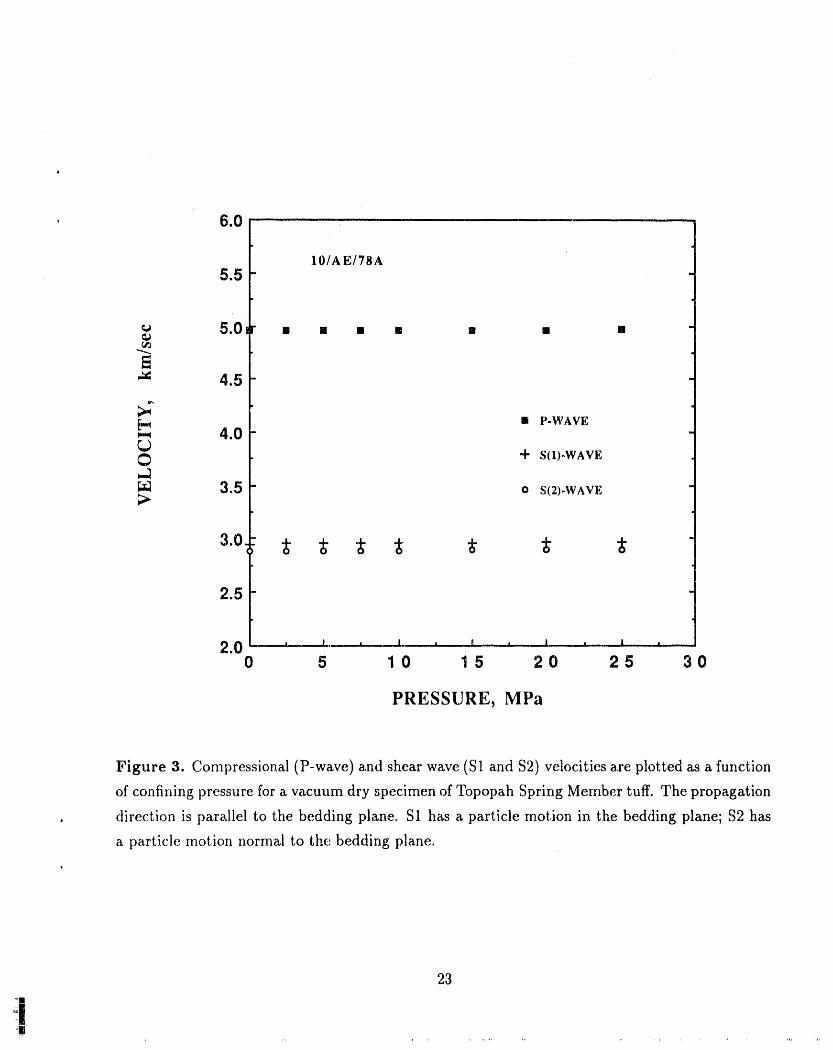
Figure 3. Compressional (P-wave) and shear wave (Sl and $2) velocities arc plotted 23
a,s a function of co,_fining pressure for a vacuum dry specimen of _Ibpopah Spring
Member tuff. The propagation direction is parallel to the bedding plane. Sl ha,s
a particle motion in the bedding plane; $2 has a particle motion normal to rh(:'
bedding plane.
Figure 4. Strains parallel to the 1-, 2-, and 3- directions of Topopa}t Spring Member 2,1
tuff specimen 10/AE/78 are plotted as a function of confining pressure. The
relation between layering and the coordinate system is shown iri .Figure 1.
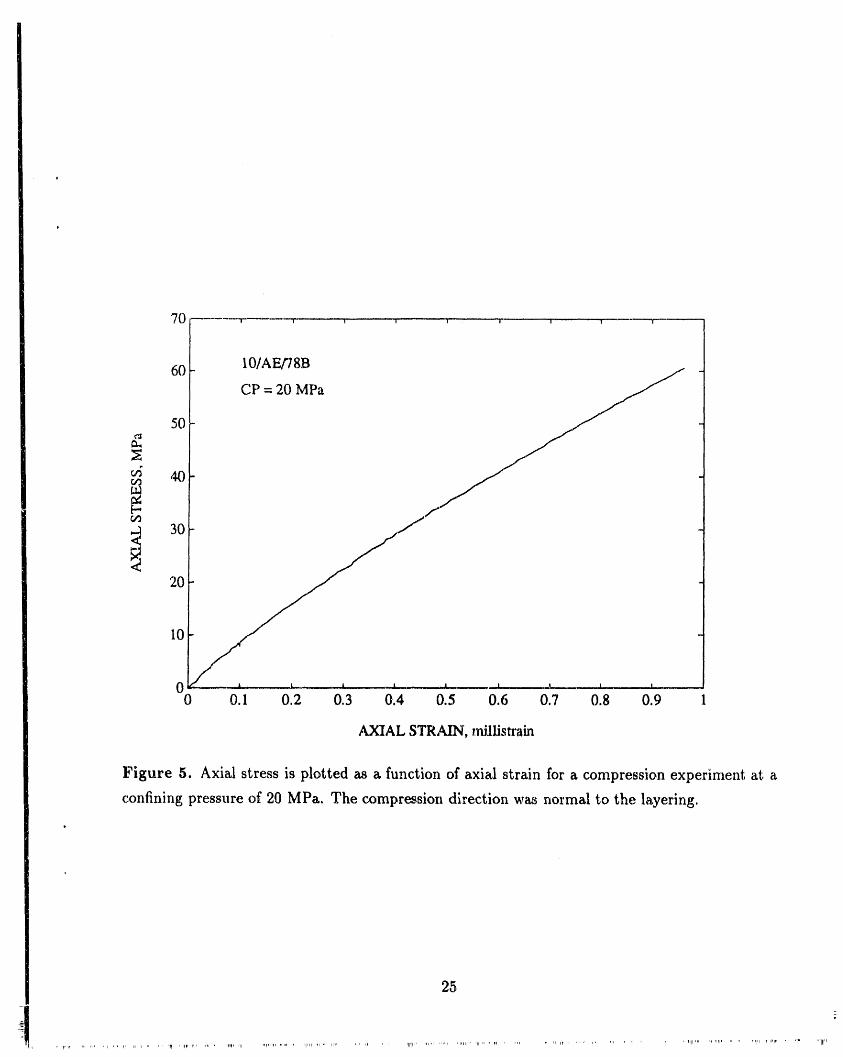
Figure 5. Axial stress is plotted as a function of axial strain for a compression 25
experiment a.t a confining pressure of 20 MPa, The compreasion direction was
normal to the layering.
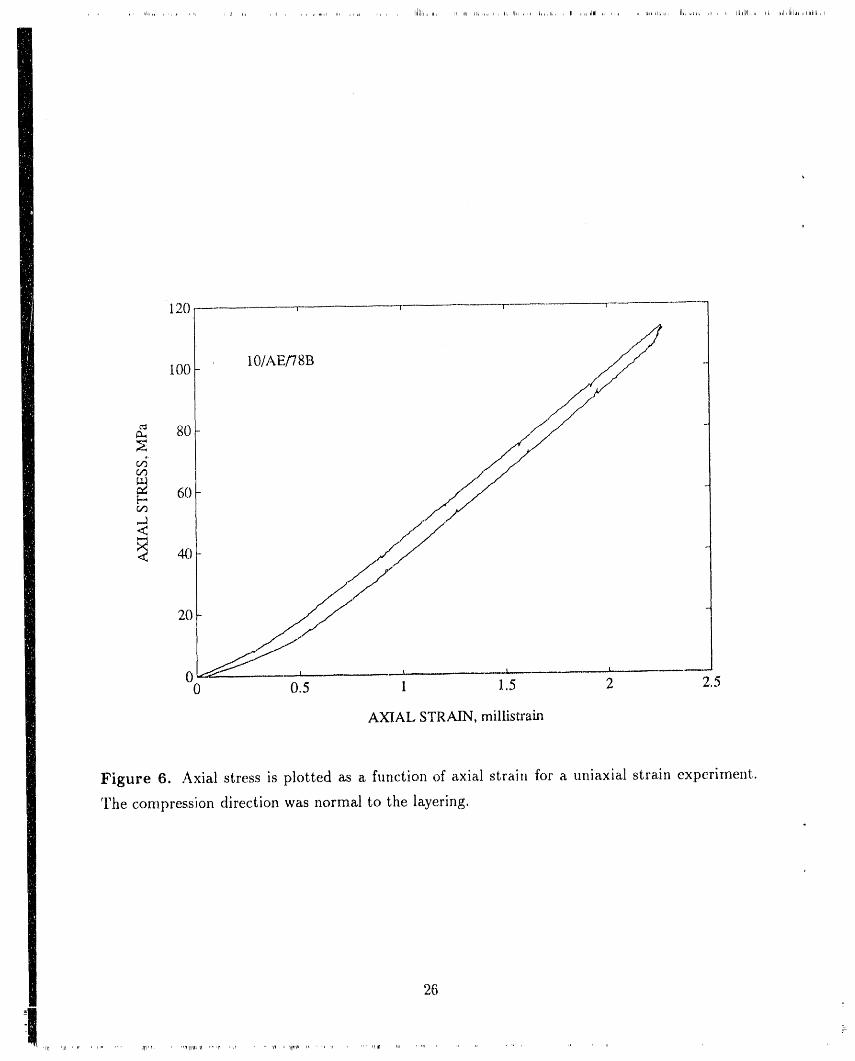
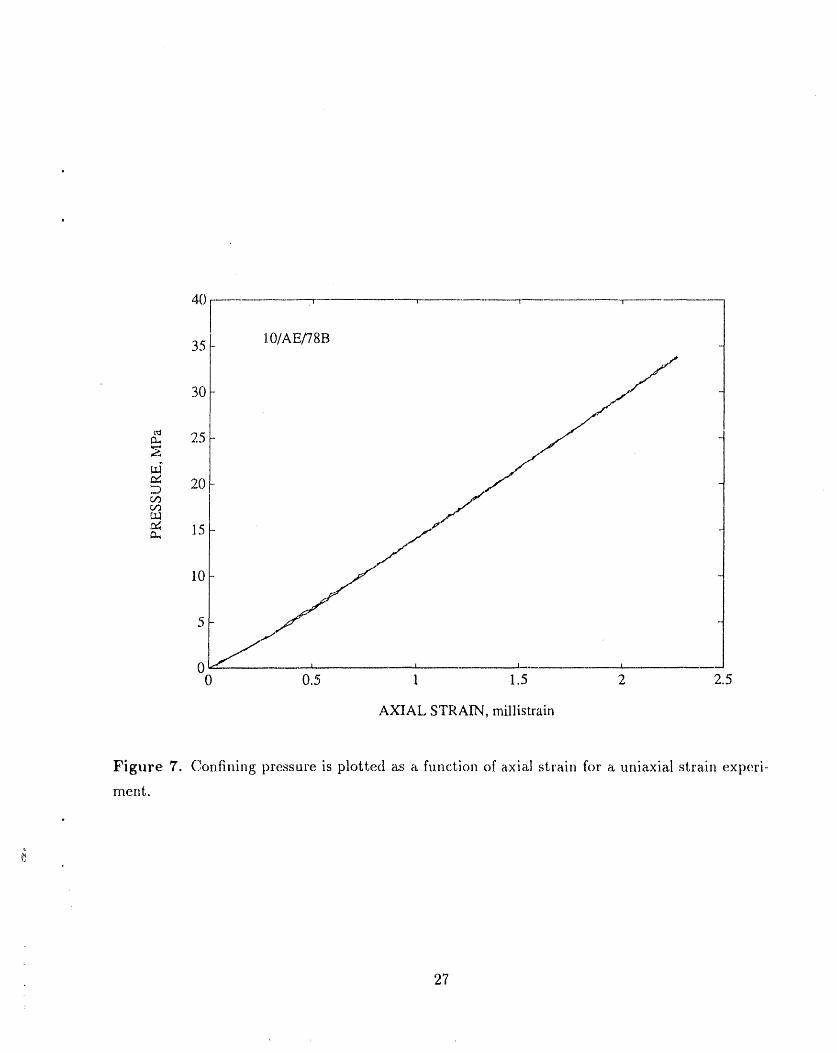
Figure 6. Axial stress is plotted as a function of axial strain for a unia.xia,1 strain 26
experiment. The compression direction was normal to the layering.
Figure 7. Confining pressure is plotted as a function of a,xia.l st,rain for a uniaxial 27
strain experiment.
iV
_'_'_l_,,_qTir',iIl,, ql -lr Ill...... Hllln0qpp,NIIl.,_,r .... ll,,',llrll'lll I " FFIII,ml,,, pl,,ll_l,,lln,lel_l,lll_ _1' 'l'rll"'D '' pllt,'",.'rl_ '_,_IIWIIIII', II UmlP_'"_lit _r ..... i,r,l,.ll,,.,_r,,, i,_, 'pl,, ,IIM,,"II_I,_I,,,...... nl,,.,,_lr ..... ,',_," ,,' 'rlrl,n , ' ',IP_ll ' *,'*lp,l,_lrl IPl_ ...... ,, "III"
ANISOTROPY OF THE
TOPOPAH SPRING MEMBER TUFF
1,.0 Introduction
Investigations are under way to determine the mecha.nical, thermal, and petrological properties
of rocks in the vicinity of the potential nuclear waste repository at Yucca Mountain, Nevada. While
many routine measurements will be carried out, any comprehensive interpretation of these studies
requires an analysis of the variation in properties as a function of orientation with respect to the
depositional surface. It. is important to determine if the rocks exhibit anisotropic properties. If
the elastic _tnd thermal constants vary with orientation (i.e., anisotropy), the fracture strength
may also vary with direction.
Anisotropy is due to the preferred alignment of microcracks, elliptical pores, or ruiner'al grains.
Microcracks develop a.long grain boundaries as rocks with anisotropic minerals cool and/or de-
pressurize. This occurs either through uplift or cooling in the case of extrusive rocks. Elliptical
pores form most frequ_'ntly due to the compaction of gas-filled cavities as extrusive rocks such as
tuff solidify. Many rocks, especially metamorphic gneisses, schists, _nd slates, have a preferred
orientation oi[ minerals because of the way they form. Because many minerals have a tendency to
be anisotropic, then so do the rocks which contain them.
Mechanical anisotropy is directly observed by considering the relations between stress and
strain as a function of orientation within the rock. In thc most general case, the relationship
between a specified state of stress, akr, and the obs._rved strains, c,.i, for _ linear elastic solid is
given by
cii - S;jkl crkl, (1)
where Sijkt is the compliance tensor. (A review of t.ensor _otation and the definitions [or anisotropic
material properties are given in Nye, 1964.) The number of coei_cients required to completcly
dcsctibc the deformation of a solid depends on its property symmetry. It is convenient to describe
" the symmetry of the elements in terms of crystallography. Accordingly, an isotropic material can
b('. defined by the fewest elastic constants, two, and a triclinic by the most, twenty-one. For an
isotropic rock or crystal, the two coefficients are [he familiar Young's rnodulus, E, and Poisson's
ratio, u; other cla,stic rnoduli (e.g., shear modulus, G) can be calculated from these.
Consider a uniaxial compression experiment on an isotropic rock with the stress applied in the
1
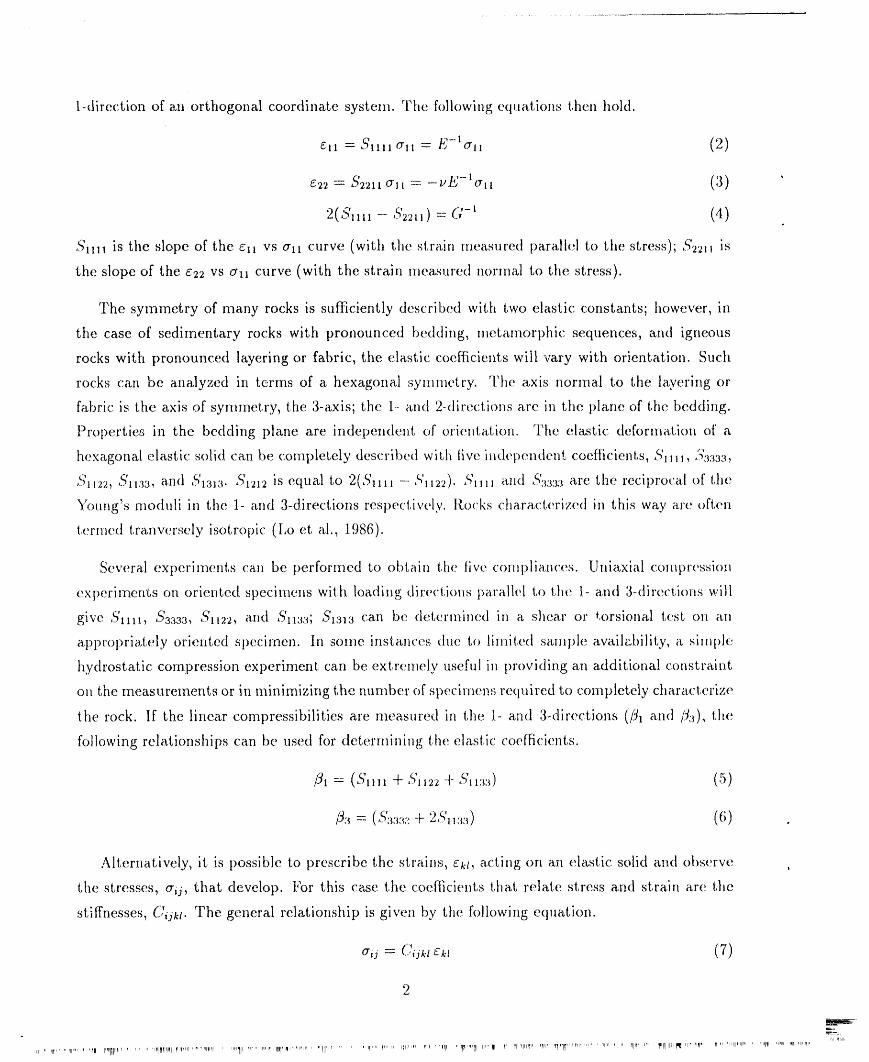
1-direction of an orthogonM coordinate system. The following equ_tions then hold.
cl, = S,111_rll= E -1_,1_ (2)
2(s,,,, - ,s'=,,)==c-' (4)
$11ll is the slope of the cll vs ali curve (with the stra, in measured parallel to the stress); ,..q2_11is
the slope of the c22 vs all curve (with the str_dn mea, sured normal to the stress).
']?he symmetry of ma, ny rocks is sufllciently described with two elastic constants; however, irl
the c_se of sedimentary rocks with pronounced bedding, inetamorphic sequences, and igneous
rocks with pronounced layering or fabric, the cla.stic coefficients will vary with orient_tt, ion. Such
rocks can be _mMyzed hl terms of a. hexagonal synlmctry. Ttle _txis normal to the layering or
fabric is the axis of symmetry, the 3-_xis; the 1.- _tnd 2-directions are in the plane of the bedding.
Properties in the bedding plane are. independen.t of orienta, tion. The ela.stic deformation of a
hexagonal elastic solid c._n be completely described with live independent, coefticients, _"1111,,._:;a::_aa,
"' q' a,nd $13, -1212 ' ,g'l122) _q'll etnd 3':7_:3s._are the reciproca,1 of the_,11_,, ,-.113a, a. q' is equal to 2(S_.11_-. . _l
5oung s moduli in the 1- and 3-d.lrcct_( ns respectively. Rocks characterized in this wa.,¢ are often
termed tr_mversely isotropic (I,o el, a,l., 1986).
Several experiments ca.n be performed to obta,i_ the five complizmce,_. Uniaxial co_ltprcssio_
experiments ()ta orierlted, specimel_s with loading directions pa,ra,lid to the 1- a,nd 3-directions will
give ,...1111,q' $3333, S1122, and Sa_33; S1313 (.',ali be, deter,nimrod in a, shear or |.orsior|nl test on _m
app|'opria, tely oriented specimen. In some insta, nccs due to li_nited sample avail_zbilit, y, a six_l_l_:'
hydrostatic compression experiment ca.n be extremely useful in providing an additional constraint
[,CI IZ :..on the measurements or in minimizing the number of specimens required to completely ch_trac ' "'_e
the rock. If the linear compressibilities are mea.sured in the 1- and 3-directions (fl_ and /_a), tire
following relationships can be used for deter_nining the elastic coefficicnl, s.
= (s,,,1+ + (,r,)
3:,::,:;+ :,:,) (6)
Alterna.tively, it is possible to prescribe the strains, e_t, a,cting on art elastic solid a, td observe
" the coefficients that relate stress _nd strain are thethe stresses, (rO, tha, t develop, lor this case
stiffnesses, Ci.ikt. The general rela, tionship is given t)3, the following equation.
ao = C;j,._e_ (7)
2
_.--...
I,' ' I1_'.... _1..... III I1'_1_1_1_.... , ',_IIqI_II_II_',WN '" 'mZ_ ' '"_11 '"' '_ ,111'11"_,'"'_" ' " IIITM .... ql" I_" ,' lug's' ,1_ '_q_ ,irli_','_lNI II1' III II II'l'_lqll'_ 'III' '_II"l_""e_, ..... H' '_,,.... _I1'_ .... I,Illlllll_'_l' "II" II,, '"11',1_ ' ''1'1_ ',_,, ,H '1_'_,
By ;¢nalogy wil,h the compliance mea,surements, in a rock with hexagonM symmetry, five elastic
coetticients are also required to determine the state of stress due 'Loa prescribed set of strains, lt
should be noted that, whereas there is a relationship between the compliances and stitrnesses, it
is not a term-for-term reciprocity. The exact, relation is given by
Cqkt ,.q'kt.,,,= _,,,_j., (8)
where aim imd _Sj,,are Kronecker delta,s (see Nye, 1964). For example, in the hexagolml systeIn
,5'3333
c,,,, + .- -S'-' (9)
where
-_' "_- S1122) 2(S1133) 2S _- _. 3333( (_' ' --'.. l ll:l • (10)
The at,iffncs,_.s"s,_ can be measured using severed Ilwl, hods. First, each coeflicient, c_m be del, e>
mined in conwmtional deformation experin_cnt, s. I f a specimen of a rock with hexagonal symnletry
' " _"o" be ca.lou-is deformed in u,liaxial st,rain parallel t,o l,lw 3-diw.ction, l,llen t,wo of t,he sl,li[ncss:.s can
lal,cd from the following relationships.
d o33
4.7:_:,3:_= dc33 ( 11)
dGI I: (t2)
(171133 d #..33
Thus, ii; is possible' to characterize an anisoi, ropic rock wil,h hexagonal symmetry by determining
five I,crtlls Of elastic stift'nesses or coInpliances or a coinbilla.t, ioll of both.
hl _tddition to defornmtion experinlents a.l. strain amplitudes on the order of 10-{_to 10-4, stiff-
ness ('oef[icients in single crystals are colnput, ed frorn the a,coust.ic velocity in a specified direction.
For a rock which can be characterized as transw, rsely isol, ropic, l,he following , ions hold (Lo
el, al., 1986).
(;'1,1l= p I/v1_ (13)
--- (_7 , 2Cl122 lilt "- 2P l',s'l (14)
.,:_:_:_3p Vv:_'e (15)
, C1:_13= p V.sa? (1 S)
C1_33 - -C_3_3+ {'lp'_Vv4s't " "" _ "-- -- ApVP45 ((-.'lltl -]- C3333 "]" 9f*-,-'1313) -{-
t"'_ _t (-" O.5(Cllll Jr- _'1313Jl, ....3333 + C:'1313)) (17)
3

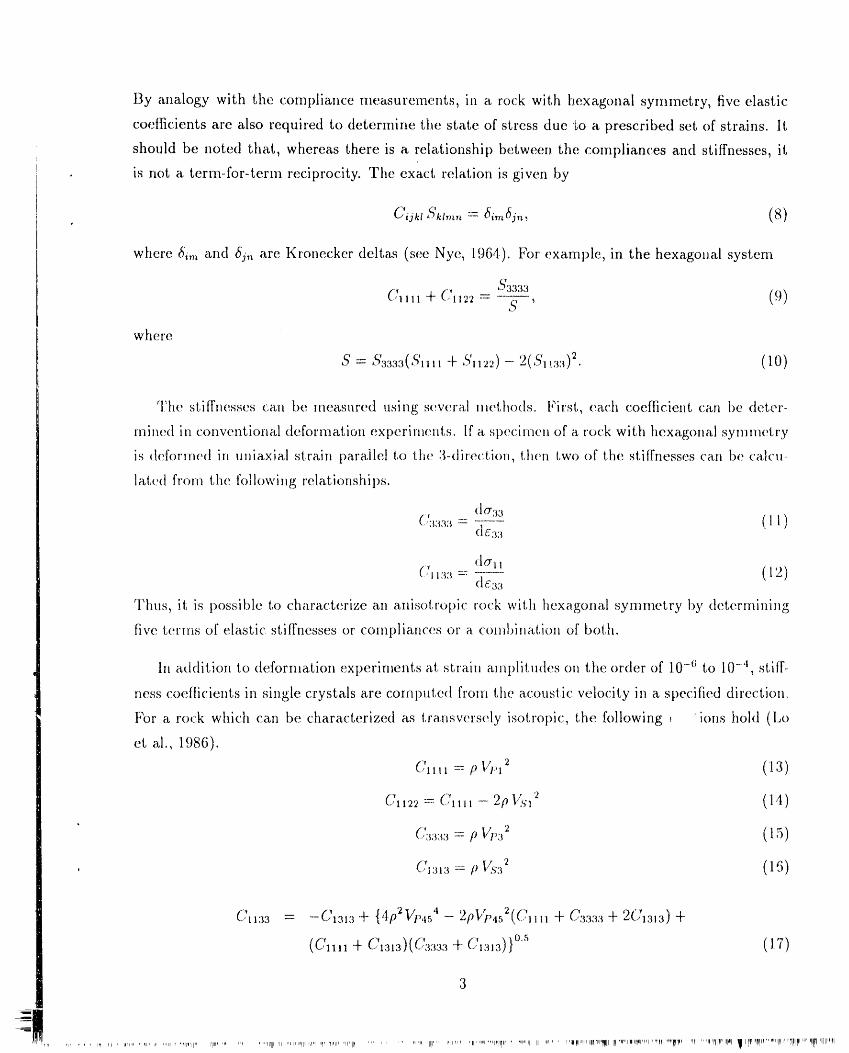
Ill these equations, p is the average bulk density, Vp1 is the compressional wave velocity irl tile 1-
direction, 1/_,3 is the compressional wave velocity in the 3-direction, and Vp4s is the compressional
wave velocity along a ray 45° to the 1- and 3.-directions. The shear wave velocities are measured
in the 1- and 3-directions, Vs3 and Vsl. Note that for V,;1 both the propagation and vibration
directions are in tile 1-2 plane.
Previous studies by Olsson and Jones (1980) and Price et al. (1984) have indicated that tufts
from Yucca Mountain exhibit anisotropy in their elastic and strength properties. In light of these
:findings and the potential importance of anisotropy iri evaluating the physical properties of the
tuff in the vicinity of the potential repository at Yucca Mountain, a detailed study was initiated
on one specirnezi of welded tuff from the Topopah Spring Member. Static measurements were per-
formed on oriented cores to determine the compliances and stiffnesses. Ultrasonic measurelnents
were conducted during the deformation tests and the dynamic and static elastic coe|_cieI._ts wt:rc'
compared. The objectives were to (1) see if the tuff could be cha, ra.cterized as isotropic or trans-
versely isotropic and (2) compare the results obtained ultrasonically with those collected duriklg
static deformation. This result is important because it is much easier to perform acoustic velocity
experiments than deformation tests. Consequently, anisotropy can be measured with a benchtop
acoustic system and the results used to estimate the azimuthal variation of the mechanical a.nd
thermal properties.
4
2.0 Experiment Procedures
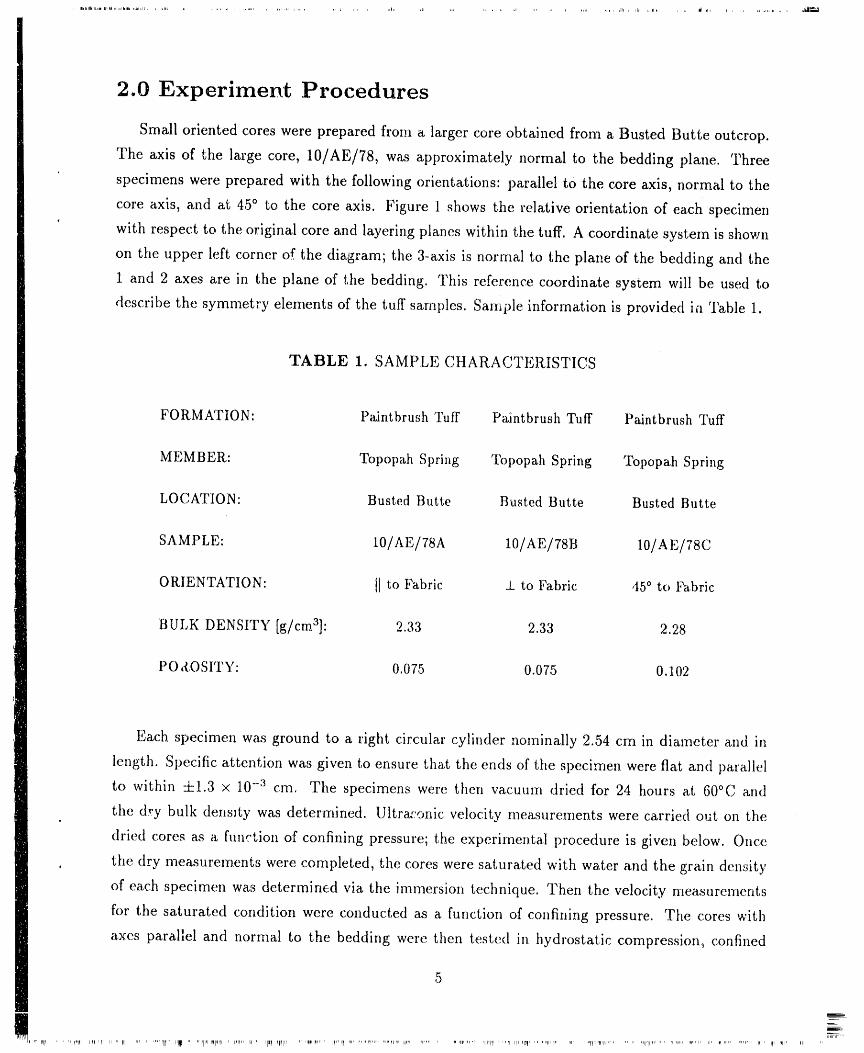
Small oriented cores were prepared from a larger core obtained from a Busted Butte outcrop.
The axis of the large core, 10/AE/78, was approximately normal to the bedding plane. Three
specimens were prepared with the following orientations' parallel to the core axis, normal to the
core axis, and at 45 ° to the core axis. Figure 1 shows the relative orientation of each specimen
with respect to the original core and layering planes within the tuff. A coordinate system is shown
on the upper left corner of the diagram; the 3-axis is normal to the plane of the bedding and the
1 and 2 axes are in the plane of t,he bedding. This reference coordinate system will be used to
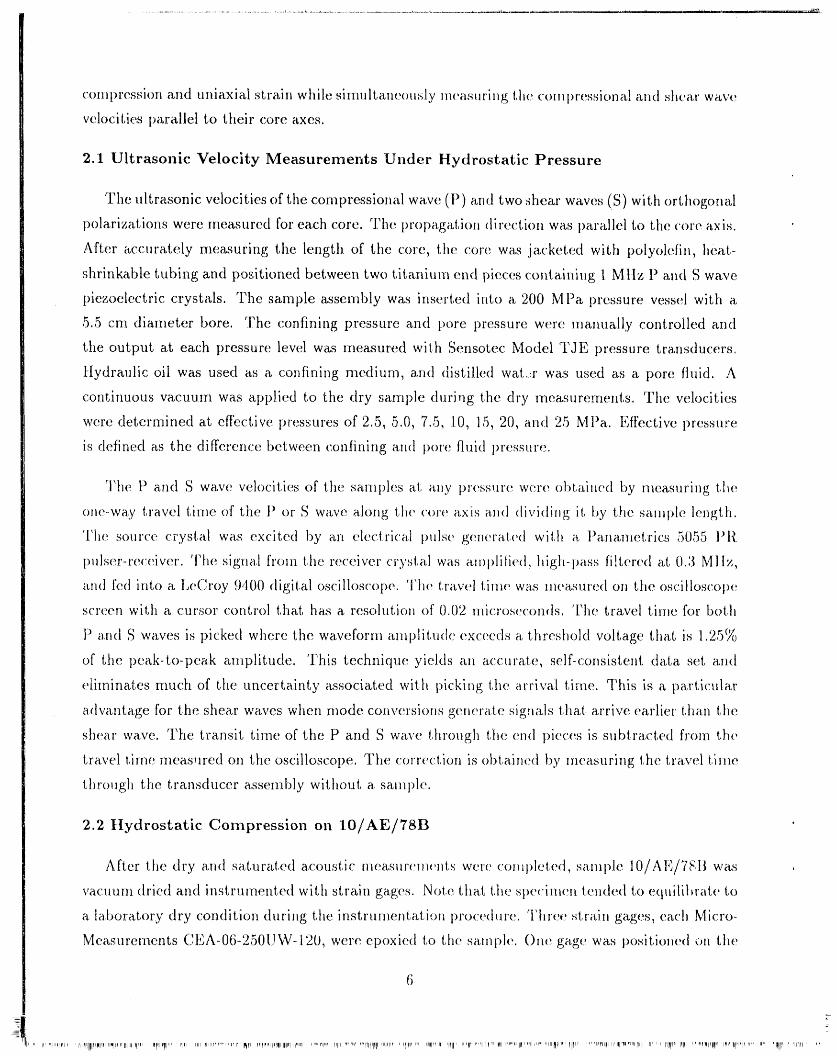
describe the symmetry elements of the tuff samples. Sample information is provided ia Ta_ble 1.
TABLE 1. SAMPLE C tARACTLRISTICS
FORMATION: Paintbrush Tuff Paintbrush Tuff Paintbrush Tuff
MEMBER: Topopah Spring 'Ibpopah Spring Topopah Spring
LOCATION: Busted Butte Busted Butte Busted Butte
SAMPLE: 10/AE/78A 10/AE/78B 10/AE/78C
ORIENTATION: IJto Fabric 2. to Fabric ,15° to Fabric
BULK DENSITY [g/cre3]: 2.33 2.33 2.28
PO A,OSITY: 0.075 0.075 0.102
Each specimen was ground to a right circular cylinder nominally 2.54 cm in diameter and in
length. Specific attention was given to ensure tha.t the ends of the specimen were fiat, and parallel
to within .-t:1.3 x 10-a cm. The specimens were then vacuum dried for 24 hours at 60°C arid
• the dry bulk density was determined. Ultra,':onic velocity measurements were carried out on the
dried cores a.s a function of confining pressure; the experimental procedure is given below. Once
, the dry measurements were completed, the cores were saturated with water and the grain density
of each specimen was determined via the immersion technique. Then the velocity measurements
for the saturated condition were conducted as a function of confining pressure. The cores with
axes parallel and normal to the bedding were then tested in hydrostatic compression, confined
5
ii ;ii_"ir....
I I" _ll' .... ll,,jl Ill l_l li i ii I q ...... lllr,, llll_ .... Irl, _l 'plrl : l_ll II l lllll[ ll_l 1
conlpression and uniaxiM strain while sinnlltaneously lnea,sllrillg tlm coi11pres,_iona, l and stlea, r w_ve
velocities parMlel tc) their core tLxes.
2.1 Ultrasonic Velocity Measurements Under Hydrostatic Pressure
The ult, rt_sonic velocities of the compressional wave (P) and two shear waves (S) with orthogonal
polarizations were measured for each c,ore. The propag_tioll dircctioIl w_s parallel to the core a,xis.
After accurately measuring the length of the core, the core wa.s jacketed with t)olyolefin, heat.-
shrinkable tubing emd positioned between two titanium end pieces containing 1 M lIz P and S wave
piezoelectric crystMs. The sample assembly was inserted into a 200 MPa pressure vessel with a
5.,5 cm diameter bore. The confining pressure and pore pressure were manuMly controlled and
the output at each pressure level was measured with Sensotec Model 'gab pressure transducers.
Hydraulic oil was used as a confining medium, amd distilled wat...r was used a.s a pore fluid. A
continuous vacuum was applied to the dry sample during the dry measurements. The velocities
were determined at efl%ctive pressures of 2.5, 5.0, 7.5, 10, 15, 20, and 25 MPa. Effective pressure
is defined as the difference between conlining and pore fluid pressure°
The F' and S wave velocil, ies of the sanlples at any pressure were o}:)t_iIletl by measuring l,l_(_
one-way travel titlm of the l) or S wave a.long til(' core a.xis a.lld (livi(li_lg ii, by the sa,lnple lellgth.
Tl_e source crystal was excited by an eh.'.ctrica.1 l)lllse ge_lera.te(l with _ l_a,na,metrics 5055 l:'l{
pulser-receiver. 'li'tru signa.l fl'oin the. receiver crystal was a.ll)l)liiied , high-l:mSS filtered at 0.3 Ml lz,
a.nd fed into a Le(:roy 9400 digital oscilloscope. The t,I'a.vel time wa,s i_wasurcd on the oscilloscop(:
screen with a cursor control that has a resolution of 0.02 nticroseconds, The travel time for botl,
P a.nd S waves is i)icked where the waveform aillplit, u(le exceeds a l,hreshold voltage that is 1.25%
of the peak-to-peak amplitude. 'I'his technique yields an accurate, self-consistent data set a,nd
elimina._es much of the uncertainty associated witll picking the arrival time. This is a particular
advemtage for the shear waves when mode conversions generate sig_lals tha_t a.rriw.', earlier tt_an the
shear wave. The transit time of the P and S wave through the end pieces is subtracted from the
travel time mea.s,lred on the oscilloscope. The correction is obtaiilc, d by ineasuring the tr_Lw:_'ll,inm
thro_lgh the transducer assembly without a sa,nple.
2.2 Ilydrostatic Compression on 10/AE/78B
After the dry and saturated acoustic measureln_,llt, s were col_lplet, ed, sa,_ple 10/AE/7S:B was
vacuuln dried and instrumented with strain gages. Note, tl_a,1,tt_e Sl)('(:inw_ te_(l(;(l to equilil_ra.t_' t,o
a laboratory dry condition during the instru_nenta, tio_ l)roc(_(t_re. T[_ree stra, it_ gages, ea(:l_ Micro-
Measurements C,l£A-06-250UW-120, were epoxied to the sa_nl)ie. ()_e gag(_;was position(,(1 (,n tl_e
6
I' " II'"ll,,rm, 'Ii II'l]ll[Iplrla'll_llI'lrllliIli'lll' _l_rlm'_l'' rll_ _n_IIIPl"_""III'r'I'_pI rll_,llP_|lqlllllrlll"_r:'_''rl sar r_lpl,,,n,,: ,,[lll,_]lll,llp_i ,l!RI,,, qlpllrn_[Jail[ , _,'l["r'lllI'[ _anr*",',,apl_r_rH,,e'r,_ll_p,,'Illp_.... Imllal_'lll'm_lw_lrl_r,1, ,_,'HIInl,_11""l_lqlt I I_"IdIl'lrr_'' "'' 'li!lr ' li"Ii' ,'
cylindrical surface with its grid aligned parallel to the sample axis. The other gages_ mount.ed on
the ends of t,he cylinder, were oriented at 90 ° to ea.ch other, Elect, rical leads were soMercd to the
gages and the instrttmented sample wa,s encapsulated with I)evcon t:lexane 80, The Flexane 80
ha.d a t,hickness of approximat, ely 0,75 cm and served, as a jacket, to prevent fluid from penetrating
the sample. The specimen was inserted into the pressure vessel and pressurized to 50 MPa, 'rh,;
output of the strain gage bridges wa,s amplified with a. Va.lidyne Model B.A. 172 DC amplifier ande
rtr+",I i? +measured with a digit, al voltmet+er, J n, bridge wa,s che.ckcd with a. shunt, resister before a.nd aft,eP
the experimer_t.
2,:+ Hydrestatic, Compression, and Uniaxial Strain Experiments with Velocities
tlydrostc+tic compression, confined cornpression, a.nd uniaxial strain experiment, s were per-
'_ '8 "for+ned on specimens 10/AE/78A and i0/AE/7,.. B while '_dmult,aneottsly mea,suring t,he compres+
sional and shear wave velocit, ies parall,:+l to t,he ce,re axis. Aft+er va+cuum drying the specimens for
24 hotlrs at, 60°C, t,hey were jacket,cd with 0.13 mm thick c.ol)pet +. The jackets were then sea.t,edr ", _
to the cores by inse,'ting tbern in a pressure vessel and pressurizirtg t.he system to 20 MPa, l.ht..
specimens were t,hen inst, rt.tntented with tsr,rain ga+ges epoxied parallel (axial) and normal (radial)
r _ "I 9 '¢t,o the (:or+.++ a×is. I t,e strain gages were Micro- Mea,stlrements CEA-06-250UW-l,+0. Next the
si)ecinwn v,,a+ssecured in an ultra,sonic transducer a,ssembly sirnilar to that described above. The
sample a,ssembly wa+sthen inserted int,o a 200 MPa pressure vessel, mounted in a serve-controlled
load irlg fr ame,
rv_l e _ " O(+ .lh.+ servo..controlh+d loading frame. _+xert,,+1 an axial load on the sample column The force
+ ' Forwa,s rnea,sured with a.t_ external load +..:ell,NEt t-.f)20-J..b6, these experiments the press wa+s
J" "_ eo I) +rat_:.J in di.spla+cernent, feedback [ l't..,confirtit+lg p_ .+ssut., wa.s , '+ e_,, .,_- , "e.... e gen_..tat,+d aI_d maintained with a
serve-controlled_ pr e+ssure"inter+sifter. The. out, put, of a. Sensot.ec Model Z / 108-0,t pressure, t,ran sdv..cer
provided t,he feedback signal, bbr the hydrost, a,t,ic compres,_i()n and confined compression exper-
iments, *,he feedback signal for the pressure system wa,,(+obt, ained from the pressure t,ra.nsducer.
For t,he "aniaxial st,rain experiment, s, t,he strain gage sensing the st rain normal t+othe loading axis
wa,s used a,s t,he feedback signal and the confining pressure wa,s allowed to change i.,o maintain a
const.ant, transverse (radial) strain,
r,_ t+r +'_ +Ali the r.{a.L,a,wel:t? recorded using ata IBM/X .[.-ba.s_:d data a.cqt+isition system+ 1lte data acqui-
+-+,+:+ ' +' , used t,o collec+t, an.desit, ion program, A(..]QLIRt+, +l+:_eloped at, New t++ngland tt ,. ardL (NER.) wa,s
st.ore th.e data.,
.11-Jl

3.0 Experiment Results
Typical results of the velocity measuremc:,_s under hydrostatic compression are given in Fig-
ures 2 and 3. Figure 2 shows the change in velocity as a _anction of pressure for the dry specimen,
10/AE/78B. The seismic wave propagation direction is normal to the bedding plane. The co,npres-
sional wave velocity w_s 4.653 km/s at room pressure. As the confining pressure was augmented
to 25 MPa,, the velocity increased only slightly, to 4.662 krn/s, This is a,relatively small char_ge .for
such a, large change in pressure, The polarized shear waves exhibit nearly the same velocity (SI .--
2,821 km/s; $2 = 2,808 km/s) at room pressure and do not increa,se significantly with increasing
pressure. The la,ct that t,he polarized shear wave velocities are virtually identical suggests that
there is very little anisotropy within the bedding plane. "-" --i ne results for the same specimen under
saturated conditions a,s a function of effective confining pressure are presented in Table 2. Com-
plete saturation wa,,sensured by maintaining a consta,nt pore pressure of 2.5 MPa. The saturated
compressional wa,ve velocity wa,s slightly greater (approximal:ely 2%) than t,hat observed in the
dry condition. The polarized shear wave velocities were nearly the same for the two orientations
and varied 1% or less from those observed in the dry condition,, Both the compressional and shear
wave velocities for the sa,turated condition exhibited the same small pressure dependence that wa,s
observed for the dry specim.en.
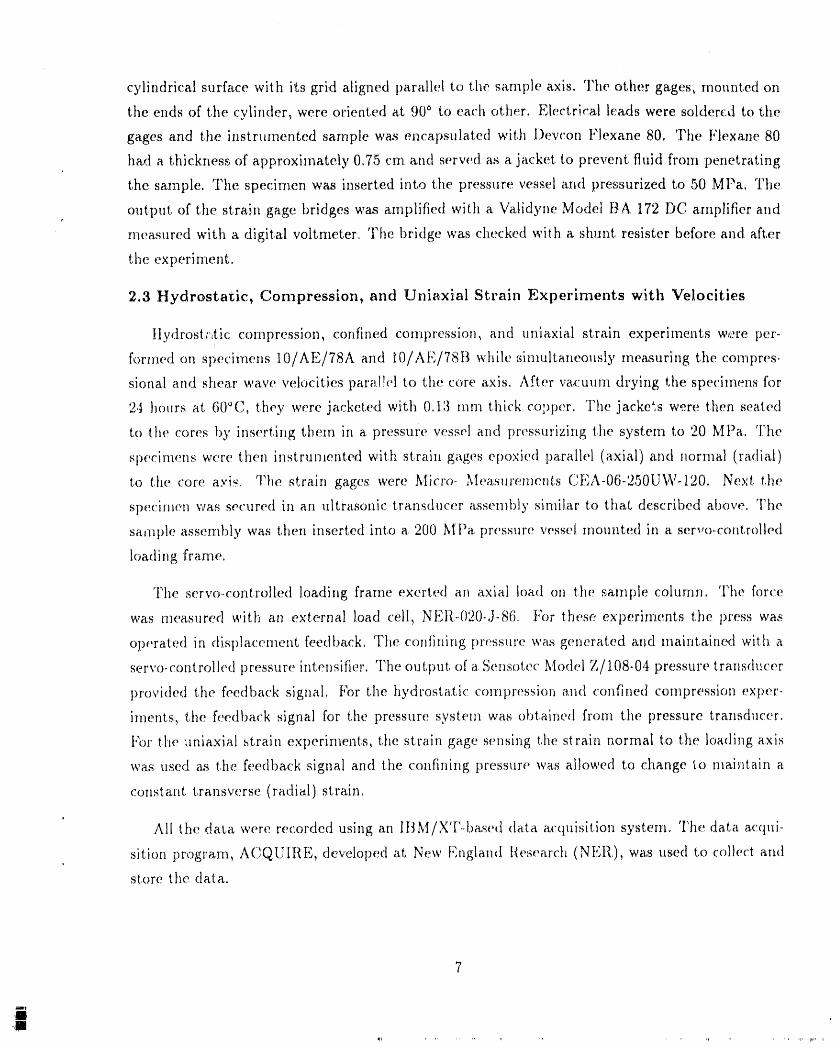
Figure 3 shows the velocity dat,a for t,he horizont, ally oriented specimen in a vacuum dry
condit, ion. The compressional wave ',elocity wa,sapproximately ,I.953 krn/s and e×hibited virtually
no pressure dependence ('l?able 3), "rhi,_ velocity is about 6% greater than the cornpressional
wave velocity for the vert,ically oriented specimen (Figure 2). Shear wa,ve velocity anisotropy is _
evident for waves propagated parallel with the bedding (Figure 3). Shear waves with particle
motions perpendicular to the bedding ($2) had velocit,ies approximately 2.2% lower than those
with mot,ions parallel to the bedding (Sl). As with the vertically oriented core, saturation had
only a minimal effect on the velocit, ies; I;hesaturated velocities for 10/AE/78A are listed in Table 3
a.s a funct.ion of effect,ire confining pressure, although the shear wave anisot, ropy increased slight,iy
to 2.6%.
Sample IO/A r'_7_c'j:,/.,,,Jis oriented al, 450 to the bedding plane. The particle motion of $2 is
perpemtict_lar to the trace of the bedding planes, whereas the part, icle motion of Sl is parallel to
the trace of the beddiug plan.es. Measurements for this orient, at,ior_are necessary to characterize
the anisotropy t,ensor for the t,uff. The results of t,he vacnum ,try and water saturated velocit,y
mea.surements are presented in Table ,1as a function of effective confining pressure; velocity changes
with saturation and increasing pressure are similar to those described for the other orientat, ions.

TABLE 2. VELOCITY DATA FOR SAMPLE 10/AE/78B
VACU UM DRY
(Pc), [MPa] P-Wa, ve [km/s] Sl-Wave [km/s] S2-Wave [km/si
0.0 4.653 2.821 2.808
2.5 4.662 2.821 2.808
5.0 4.662 2.821 2.808
7.5 4.662 2.824 2.812
10.0 4,662 2,827 2.815
15,0 4.662 2.834 2.818
20.0 4,662 2.834 2.818
25,0 4.662 2.834 2.821
WATER SATURATED; PORE PRESSURE ---"2.5 MPa
(Pc)_[MPa] P-Wave [km/si Si-Wave [km/s] S2-Wave [km/si
0.0 4.749 2.808 2.778
2.5 4.749 2.808 2.784
5.0 4.7'49 2.808 2.787
7.,5 4.758 2.808 2.'790
10,0 4.767 2.808 2.790
15.0 4.767 2.808 2.787
20,0 4.767 2.808 2.790_
25.0 4,767 2.812 2.793
1
9
TABLE 3. VELOCITY DATA FOR SAMPLi)3 10/AE/78A
VACUUM DRY
(Pc)¢ [MPa] P-Wave [km/si Sl-Wave [km/s] S2-Wave [km/si
0.0 4.953 2.945 2.882
2.5 4.953 2.9,52 2,88,5
5.0 4.953 2.952 2.885
7.5 4.953 2,956 2.888
10.0 4.953 2,956 2.888
15.0 4.963 2.956 2.892
20.0 4.963 2,966 2.895
25.0 4,973 2,966 2.895
WATER SATURATED; PORE PRESSURE = 2.5 MPa
(Pc)¢ [MPa] P-Wave [km/si S1-Wa,w., [km/s I S2-Wave [km/si
O.O 4.963 2.922 2,846
2.5 4.963 2.!)25 2.8,i9
5.0 4.963 2,928 2,853
7.5 4.973 2.928 2.856
10.0 4,973 2.928 2.856
15.0 4.992 2.928 2.856
20.0 4.992 2.932 2.856
25.0 4.992 2.932 2.859
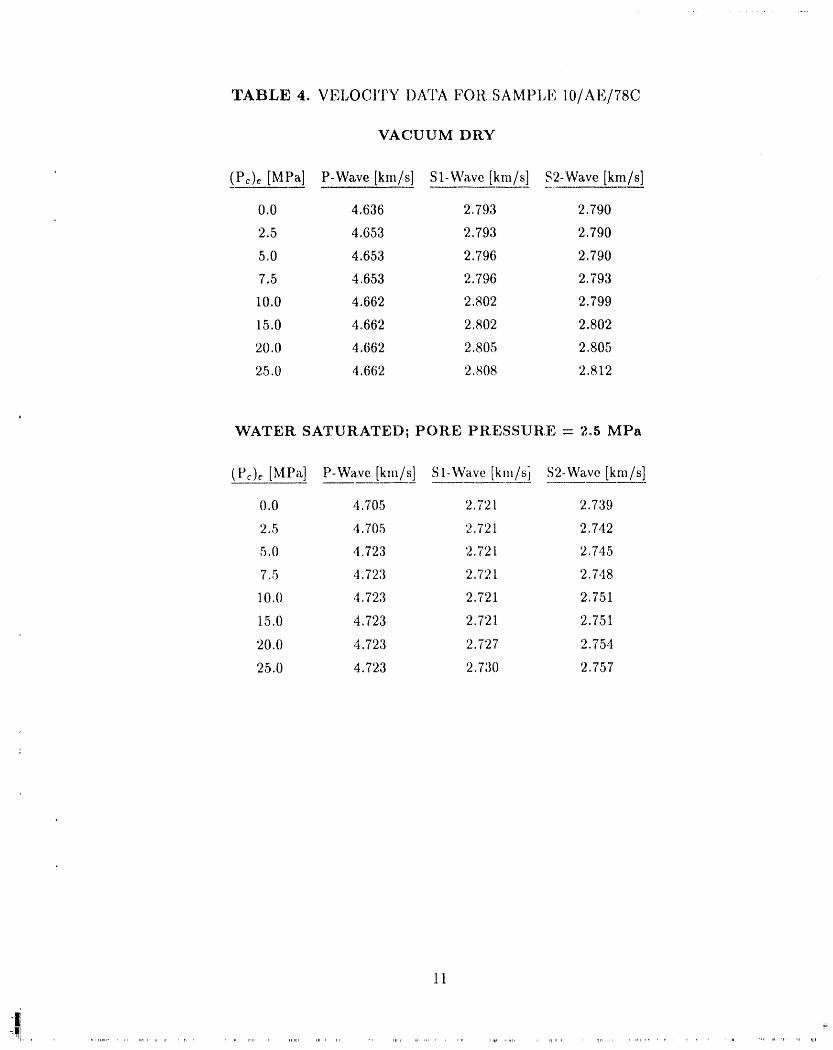
TABLE 4. VELOCITY DATA FOR SAMPLE 10/AE/78C
VACUUM DRY
, 2-Waive [km/s](Pc)e [MPa] P-Wave [km/s] Sl-Wave [km/s] ,q'
0.0 4,636 2.793 2.790
2.5 4,653 2.793 2.790
5.0 4.653 2.796 2,790
7.5 4,653 2.796 2.793
10.0 4.662 2.802 "2.799
15.0 4.662 2.802 2.802
20.0 4.662 2.805 2.805
25.0 4.662 2. 808 2.8 iI2
WATER SATURATED; PORE PRESSURE -- 2°5 MPa
(Pc)e [MPa] P-Wa,ve [km/si SI-Wave [km/si S2-Wave [km/si
0.0 4.705 2.721 2.739
2.5 4.705 2.721 2.742
5.0 4_723 2.721 2.745
7.5 4.723 2.72:1 2.748
10.0 4.723 2.721 2,751
15,0 4.723 2.721 2,751
20.0 4,723 2.727 2.754
25.0 4.723 2,73() 2.757
11
-|
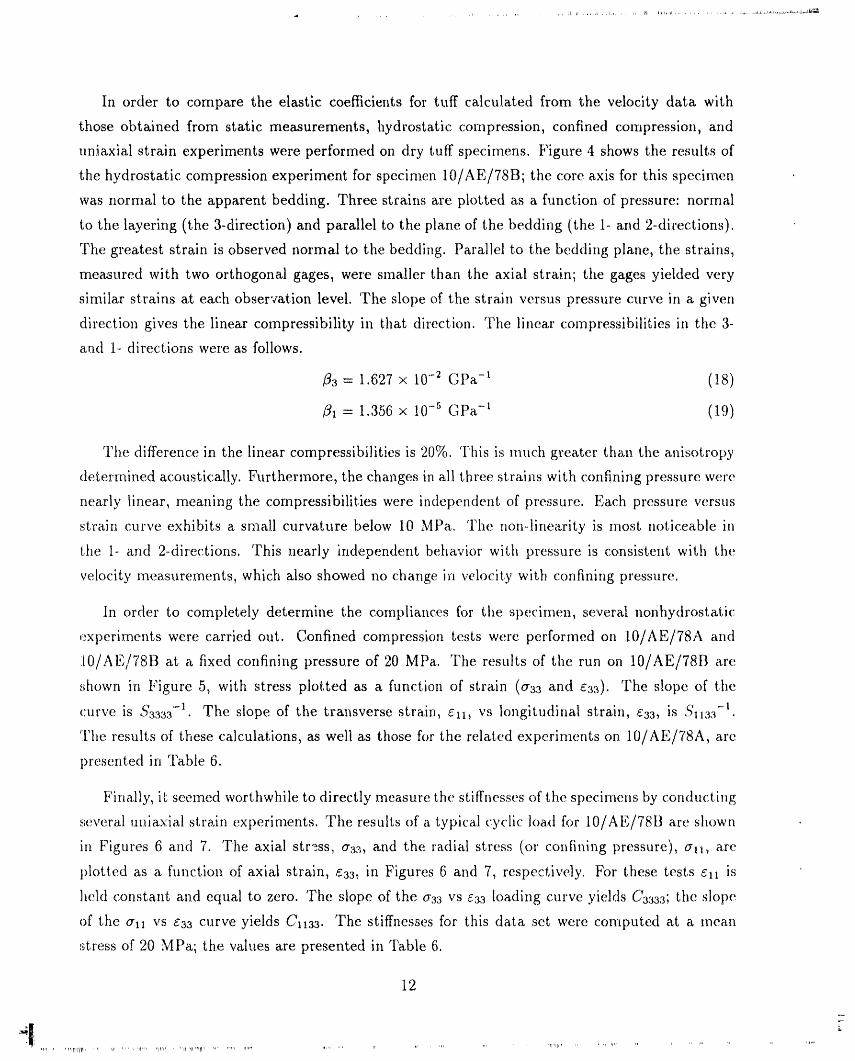
In order to compare the elastic coefficients for tuff calculated from the velocity data with
those obtained from static measurements, hydrostatic cornpression, confined compression, and
uniaxial strain experiments were perforrned on dry tuff specimens. Figure 4 shows the results of
the hydrostatic compression experiment for specimen 10/AE/78B; tile core axis for this specimen
was normal to the apparent bedding. Three strains are plotted as a function of pressure: normal
to the layering (the 3-direction) and parallel to the plane of the bedding (the 1- and 2-directions),
The greatest strain is observed normal to the bedding. ParalM to the bedding plane, the strains,
measured with two orthogonal gages, were smaller than the axial strain; the gages yielded very
similar strains at each observation level. The slope of the strain versus pressure curve in a given
direction gives the linear compressibility in that direction. The linear compressibilities in the 3-
and 1- directions were as follows.
[33= 1.627x 10'2 -' _ -t(_,ta (18)
/31 = 1.356 x 10-s GPa -l (19)
h(.,difference in the linear compressibilities is 20%. This is much greater tha,n, the anisotropy
determined acoustically. Furthermore, the changes in all three strains with confining pressure were
nearly linear, meaning the compressibilities were independent, of pressure. Each pressure versus
strain curve exhibits a. small curvature below 10 MPa. Ihe non-linearity is ,host noticeable in
the 1- and 2-directions. This nearly independent behavior with pressure is consistent with the
velocity measurements, which also showed no change in velocity with confining pressure.
In order to completely determine the compliances for tlm specimen, several nonhydrostatic
experiments were carried out. Confined compression tests were perfornmd on 10/AE/78A and
lO/AE/78B at; a fixed confining pressure of 20 MPa. The results of the run on 10/AE/78B are'.
,_hown in Figure 5, with stress plotted as a function of strain. (aaa and eaa). The slope of the
5' "-_ The slope of the transverse strain, ell, vs longitudinal strain, eaa, is Sll:,acurve is _ 3333 .
"l'he results of these calculations, as well as those for the related experiments on 10/AF/78A, are
l)resented in Table 6.
Finally, it seemed worthwhile to directly measure the stiffnesses of the specirnens by con(tu(:tit_g
several uniaxial strain experiments. The results of a typical cyclic load for lO/AE/78B are shown
in Figures 6 a,nd 7. The axial stress, aaa, and the radial stress (or confining pressure), all, are
plotted as a function of axial strain, ga3, in Figures 6 and 7, respectively. For these tests ell is"¥held constant an.d equal to zero. The slope of the o'aa vs eaa loading curve yields Caaaa, the slope
of the all vs eaa curve yields Cllaa. The stiffnesses for this data set were comput.ed at a mean
stress of 20 MPa; the values are presented in Table 6.
12
I
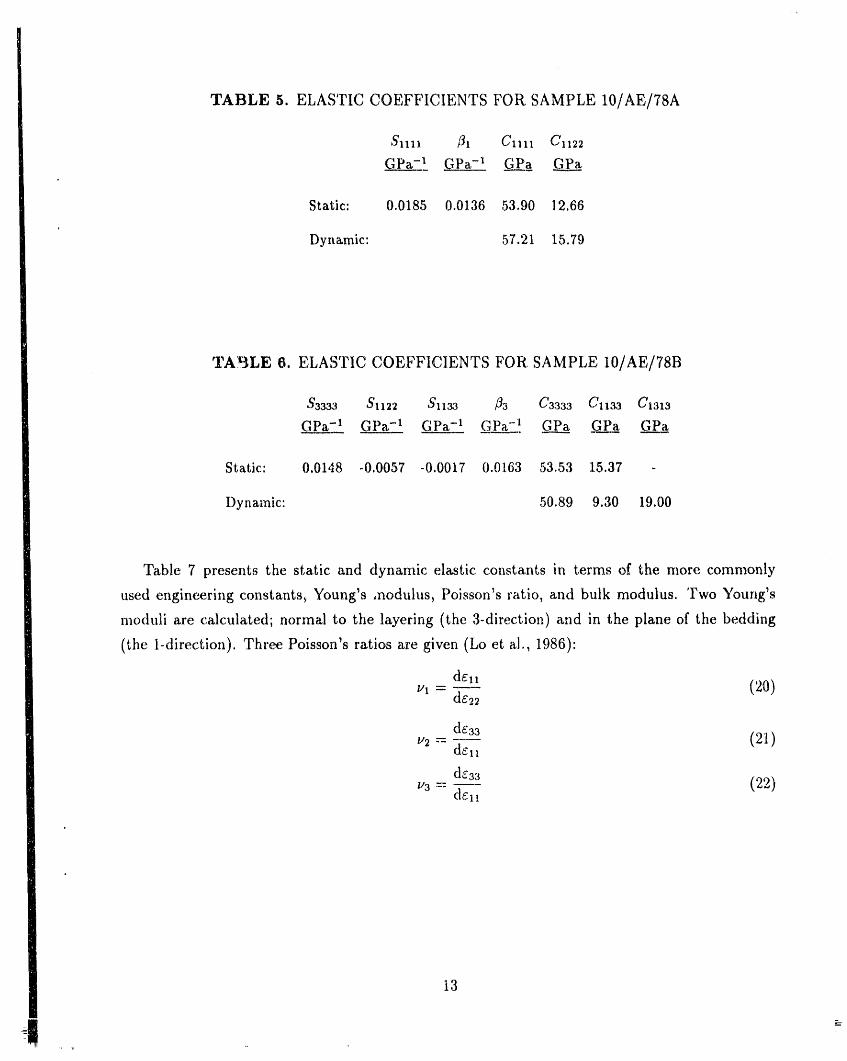
TABLE 5. ELASTIC COEFFICIENTS FOR SAMPLE 10/AE/78A
GPa -l _qPa-I G.._P_Pa_GPa
Static: 0.0185 0.0136 ,53.9012,66
Dynamic: 57.21 15.79
TABLE 6. ELASTIC COEFFICIENTS FOR SAMPLE 10/AE/78B
$3333 S1122 Sl13.3 J_3 C3333 C1]_ C|313
GPa-I GPa-I GPa-I GP_-I GP_._..__G__P_aGP___ha
Static: 0.0148 -0.0057-0,00170.0163 53.53 15.37 -
Dynamic: 50.89 9,30 19.00
Table 7 presents the static and dynamic elastic constants in terms of the more commonly
used engineering constants, Young's ,nodulus, Poisson's ratio, and bulk modulus. Two Young's
moduli are calculated; normal to the layering (the 3-direction) and in the plane of the bedding
(the I-direction). Three Poisson's ratios are given (Lo et ai., 1986):
d_l_ (20)
de:33 (21)/z2 "- dcll
u3 -- (22)dell
13

TABLE 7. ENGINEERING I_LASTIC_ COEFFIC, IENTS
Young's Modulus [GP_] Bulk Modulus [(;Pal Poisson's Ratio
3-direction 1-direction ut v_ v3
Static: 46.43 48.11 23.09 0.167 0.239 0.231
Dynamic: 44.42 50.20 28.62 0.212 0.238 0.211
Before proceeding, several additional observations must 'ce mentioned. Hydrostatic coinpre.s-
sion tests were run on the copper jacketed specimens prior to the deforrnational experiments. Four
observations are pertinent.
(i) The volume coInpressibilities for both specimens (10AE78A a,n(t 10AE78B) were nearly iden-tical.
(ii) q.lm velocities measured on the copper jacketed specimells in the deformational a,pparal, us
were i(lentical to those collected in the vacuum dry condit, ioll using the hydrostatic, velocity
measuri ng system.
(iii) The volume compressibility for the copper jacketed specimen was 3,628 x 10-2 GPa -l,
whereas the volume compressibility for the specimen jacketed in Flexane wa,s 4.305 x 10⁻²
Gpa, -1.
(iv') The dynamic stiffnesses calculated from the velocities mea, sured in t,he uniaxial strain exper-.
iments were in excellent agreement with those computed from the velocities collected under
hydrostatic pressure; the differences were less than 0.5%.
14
1
4.0 Discussion and Conclusions
The experimented data for the Topopah Spring Member welded tuff samples include ultra-
sonic compressional and shear wave velocities as a, function of sample orientation, saturation,
pressure, and differential stress (confined compression and uniaxial strain tests). The effects of
sample anisotropy are apparent in these measurements. Specifically, the tuff is significantly more
compliant normal to the layering than within the bedding plane.
'l'he velocity data indicate that the anisotropy, although small, is consistent with a physically
intuitive rn,_del in which the welding and coral)action process ha.s caused the tutf to become
transversel:/isotropic. The axis of symmetry is perpendicular to the prefferrcd orientation of the
shard lllatI'iX, which is the result of gravity and flow during deposition of the ash flow tuff (Price
ct al., 1985; 1987). Consequently, this prefl'erred orientation of the shard matrix and, possibly,
the pore distribution produced the anisotropy.
t;k)r au ideal transversely isotropic m_,terial, four rel_d, ionsllit)s hold.
r "_(i) I h(. axis of symmetry is normal to the bedding l:)l_me. 'l'his is the slow direction for P waves,
that is, the minimum velocity. Furthermore, S waves propagating parallel to the axis of
symmetry have the same velocity rega, rdless of their vibratiola direction (particle rnotion).
(ii) For t)ropagatio|_ directions normal to the axis of sym_netry (parallel to the bedding plane), P
wave velocities are a, maximum. Shear waves with apa, rticle motion parallel to the bedding
plane tlave a greater velocity th,m those with a t)articl(' motion perpendicular to the bedding.
P(iii) [ or propagation directions between the two principM dire.ctiollS, the velocities for P waves
and S waves with particle motion parallel to the tr_('e of the bedding are intermediate to
tlmse ob,_erved Mong the principal directions.
(iv) The velocity of shear waves with a component of t)a,rticle motion parallel to the axis of
symmetry may be either higher or lower than the velocity perpendicular to the axis of
symmetry.
Because the pressure dependence of velocity is relatively small, the degree of anisotropy can
be described by referring to the velocities measured at low pressure. The P wa.ve velocities in the
two sa.Inples oriented in the vertical and horizontM direction differ by approximately 0.300 km/s
for the dry samples, or about 6.4%. The slow direction for the P wave is parallel with the axis
15
_I .... 'lrllll "11!', I,, '_,rlV,,, ..... ,lr,, .... ,'1,,
................................................................................. ,...................,.......................i............._lltllllldL
of symmetry, which is parallel with tile axis of the vertically oriented sample, 10/AE/78B. The
greatest S wave anisotropy is perpendicular to the axis of symmetry. In this direction the tw() S
waves differ by approximately 0.063 km/s for the dry sample, or about 2.2%. The S wave with the
particle motion perpendicular to the axis of symmetry (SI) is faster than that with the particle
motion parallel with the axis of symmetry ($2).
Although these velocities are consistent with a transversely isotropic model, sample variability
in this limited selection of cores is also apparent. Idea.lly, the P wave velocities propagated at 450
are intermediate between those parallel and perpendicular to the axis of symmetry. In the data
collected for the core oriented at 45°, however, this direction has the lowest P wave velocities. The
lowest S wave velocities of either polarization were also recorded for this sample. In addition, this
sample has the lowest measured bulk density and highest porosity. A reasonable explanation is
that the large core from which these smaller oriented samples were prepared was not homogeneous.
Therefore, variability should be averaged out with measurements on a larger set of cores of this
size or else larger core sizes.
As discussed in Section 1.0, to completely characterize the elastic behavior of a rock or a crystal
with hexagonal symmetry, five coefficients must be deterlnined. For the welded tuff in the dry
condition at 20.0 MPa, the five compliance coefficients computed from the velocity data are asfollows.
Cl111 = 57.3 x l0 s (]Pa (23)
Ca333= 50.6 x 10s GPa (24)
Cl1_2 = 1.6.8 x l0 s GPa (25)
Cla_3 = 18,5 x 10'_ GPa (26)
Cll._a = 9.3 x l0 s GPa (27)
These values are based on a limited set of velocity measurements. Clla_, which is based in part
on the suspect P wave velocity measured in the 45° direction, needs further measurements.
Typically the velocities measured in rocks increase with confining pressure. For the tuff sam-
ples, however, the pressure dependence of velocity is very sma,ll. Over the 25 MPa range of
pressure, the largest increase in P wave velocity is 0.03 km/s for the water saturated horizontal
sample, or about 0.58%. Similarly, for the S wave the largest increase is 0.021 krn/s for the Sl
wave in the dry horizontal sample, or about 0.71%. In addition to, at most, a small pressure
dependence, the increase in velocity with pressure is approximately linear. This indicates that
very little of the total porosity is in the form of compliant cra.cks, which would give rise to large,
16
nonlinear increases in velocities as a function of pressure. During the welding and compaction
process, ali of the cracks and grain contacts were closed and cemented by the flow of the matrix,
the vapor ph_e activity and diffusion through the matrix, and the deposition of tridymite (Price
' et al., 1985). In addition, the devitrification process did not create new low-aspect-ratio voids
(Price et al., 1985; 1987).
The effects of water saturation on velocity in these samples are consistent with the interpreta-
tion of a largely noncompliant porosity. Typically, tile introduction of water into the pore space
increases the overall bulk modulus while having a much smaller effect on the shear modulus. Con-
sequently, P wave velocities increase upon saturation, and a greater increase is obser, ,J when
porosity is contained in fine, compliant, crack-like pore shapes (Cheng, 1978). The S wave ve-
locities decrease with increasing water saturation and crack concentration. If ali of the porosity
is perfectly spherical, the bulk and shear moduli are independent of water saturation (as if the
pores were not even there). Thus, the P wave and S wave velocities decrease in proportion to
the increase in density when going from the dry to saturated condition. For the welded tuff the
majority of the porosity is most likely spherical. The saturated S wave velocities are lower than
dry, and the decrease is nearly predicted by the increase in water-saturated density. The saturated
P wave velocities are equal to or slightly higher than dry, indicating a pore population somewhat
less than spherical. Applying the model developed by Cheng (1978), the porosity can be modelled
with a distribution of pore shapes with aspect ratios of between 1.0 (spheres) and 0.1 (oblate
spheroids).
There is one observation in the dry and saturated data that indicates that the long axis of
the oblate spheroidal or tabular pores have a preferred orientation parallel with the lineation or
bedding. The effects of saturation are greatest on P wave velocities in the vertical direction. In
going from a dry to a saturated condition, P wave velocities increase by 0.096 km/s or about 2.06%.
This is not a large increase, but is consistent with a preferred orientation parallel to bedding. In
the horizontal direction the increase is only 0.01 km/s, or 0.2%, while at 45° the increase is 0.07
km/s, or about 1.49%. This is also what would be anticipated with a transversely isotropic model,
and indicates that at least some of the anisotropy is due to the preferred orientation of pores.
The anisotropy of the welded tuff is also apparent in the linear compressibility data. The linear
compressibility, fl_, is approximately 20% greater parallel to the symmetry axis than perpendicular
to the symmetry axis, fla. Furthermore, the two linear compressibilities measured in the bedding
plane agree very closely. Therefore, the strain measurements are consistent with a transversely
isotropic material. The strain dependence on pressure is nearly linear in all directions, indicating
17
-!' i_l_i q..... I'P,IIIPllr ' _PI_ "_' Ill..... _r' '"_'r_' I'lWi'"']llllpl' _ rll ' , rl _w , _!TI"'.... I1P_ IIi, H,, H 'nQ1, il,l' ' ,iii ,,, _']01_rl ,r l'r" " _m ,iii r _,,, ..... H;,,I, _ , lit
.......... _. _ ................... i ..... ,, , ,' .......... ,. , _ ,,...................... _ ....... _.L.,,, .......,._._ ............. ___ _ ,,. •,, , .___,,-..-,-._,_,-._,.,_,,.,.i...,..,....,,,..-._
that the majority of the porosity is not in the form of low-.aspect-ratio pores, which would cause
a nonlinear behavior at low pressures. In the 3-(tircction, the strain is larger either because of the
preferred orientation of pores parallel with the lineation, or due to the anisotropy and preferred
orientation of the mineralogy.
While the linear compressibility data are consistent with a transversely isotropic rock, the
two measurements are not sufficient to fully describe the material, la'or this rea.son, additional
experiments were performed in confined compression and uniaxial strain. The results of these
lneasurelnents are compiled in Tables 5, 6, a11(t 7. Specifically, ii, is po, s_blc to comi)are the static
and dynamic stiffnesses and engineering elastic constants. The coei[icients Cllll and C1122 are ill
good agreement for the static and dynamic measurements. The dynamic nlodali arc" somewhat
greater than the static. The strain amplitude of static ,.n.asuxt.,in(-..nts('"", , " is thl, ee to five (',rders of
magni rude larger than dynamic measurements. This stati(:.-t()-dynamic ratio is in good a,greement
with previous results (Simmons a.nd Brace, L965; (-.',heng and Johnston, 1981). The more cra ck-lik(_
porosity in the salnple, the greater is the static-to-dynamic ratio. As pressure increases, the crack
porosity decreases and the two cornpressibilities tend to converge. :l'here was no convergeilce at
tligher pressures, and this reinforces the interpretation of oi?late ra.tll('r tha.ll era,ck-like porosity.
A t t()l.)h.m "',s for (2-') .... _ . ar_s(:.... a,'_aaand Cllaa. In both instances tile sta, tic co(:{[icients exceed the
dynamic. (liven the magnitude of the difference, it is well outsi(le the bounds of normal experi-
mental error and directly c.oi|tradicts the linear col111)rcssibility (tata I)resellted in Figure 4. The
"_ , ...... t, l.}_(, r(.;stllt was uIlcllanged. The_neasu_cin(mts were I(.pc,_,(.d and all the cMibratio|ls (:heck(xl. " ,
error a,pl,aa'ently resides in the test geometry..I hc samples were 2.5,l cm in both le_gth and (ti-
ameter, lt _ppears tha.t the impedance contrast between the titanium transducers aa_d the rock
a,lte.red the strain field tlea, r the .interface. This effect has been note(1 by others (e.g., S. I(. Brown,
personal communication), tur nermore, due to the sho,'t sample length, the s_z(.,of the strain gage
gri(l, and the position of the gages on this particu}ar specimen, the strains have. been uz_deresti-r ", r-',,l_ate(l. .Ibis leads to an overestimation of the stiffnesses, lh(.re is no immediate explanation as
to why the data on specimen l O/AE/78A yielded consistent results as did 10/AE/78B when they
were teste, d in true hydrostatic compression. The results cannot l)e attributed to a change in the
sample due t,o multiple loading cycles, because the w;locities remained unchanged throughout the --
sample history. The discrel;)ancy is also reflected in tlm Young's modulus in the 3-direction; the
static modulus exceeds the dynamic. The results indicate that a greater length-to-dianmter ratio
is necessary for these measurements. The commonly accepted ratio of length-to-diameter is ',.0
tO '-)_.2 _o avoid significant end effects.
18
_,llll'0 _1'7111,,,1% _.,'_u,' "rl",lt_[ll_tllll ....... Irl['_l!, .... "lr I'IIN_ 'I'V_II'_H qlI'll_...... ,,_,[ll_ , q,_ll I...... _,,,_ ,.llnl,,,, , rll[l_,,,l[ll_, ., .... , ill][_ _,_,r .... , .... _ I1_"., _ _"r''l_l_, _"lm IlU' '_II 'r_ll [l""tllx" ....... il"lllr";' I']_al' Irl(,, '1'1[1',, 10HiIgl
The results of the study on this specimen of welded tuff clearly indicate that tile rock is
anisotropic and its elastic behavior can be adequately characterized with five coefficients. The
anisotropy of the welded tuff is apparent in tile ultrasonic velocity and strain measurements. The
, source of the anisotropy is either a preferred distribution of ellipsoidal and tabular pores parallel
with the lineation or else a preferred distribution of the mineralogy. The degree of anisotropy is
, on the order of 7% oi' less in velocity and 20% from the linear compressibilities. Because there
is apparently a fair degree of sample inhomogeneity additional measurements on a larger set of
samples would be necessary for a complete characterization.
19
|1

5.0 References
Cheng, C.H., 1978
Seismic Velocities in Porous Rocks: Direct and Inverse Problems, Ph.D. thesis, M.I.T., Cam-
bridge. (NNA.911007.0004) "
Cheng_ C.H._ and D. H. Johnston, 1.981
Dynamic and Static Moduli, Geophys. Res. Letters, 8, 39-42. (NNA.910923.0006)
Lo, T., K. B. Coyner, and M. N. Toksoz, 1986
Experimental Determination of Elastic Anisotropy of Berea Sandstone, Chicopee Shale, and
Chehnsford Granite, Geophysics, 51,164-171. (NNA.910306.0117)
Nye_ J.F._ 1985
Physical Properties of Crystals, The University Press, Oxford. (NNA.911021.0031)
Olsson_ W. A., and A. K. Jones, 1980
Rock Mechanics Properties of Volcanic Tufts from the Nevada Test Site, SANDS0-1453, Sandia
National Laboratories, Albuquerque, NM. (NN A.870406.0497)
Price, R.H., J. R. Connolly, and K. Keil_ 1987
Petrologic and Mechanical Preperties of Outcrop Samples of tile Welded, Devitrified Topopah
Spring Member of the Paintbrush Tuff, SAND86.-l131, Sandia National Laboratories, Albu-
querque, NM. (ttQS.880517.1704)
Price, R.H., F. B. Nimick, 3. R. Connolly, K. Keil, B. M. Schwartz, and S.J. Spence,1985
Preliminary Characterization of the Petrologic, Bulk, and Mechanical Properties of a Litho-
' ' _ n 'physal Zone Within the Topopah Spnng Member of the Paintbrush _Ihlff,SAND84-0860, Sa dla
National Laboratories, Albuquerque, NM. (NNA.870406.0156)
Price, R. It., S. a. Spence, and A. K. Jones, 1984
Uniaxial Compression ]'est Series on Topopah Spring _I\lff from USW GU-3, Yucca Mountain,
Nevada q_st Site, SAND83-1646, Sandia National Laboratories, Albuquerque, NM. (NNA.870406.0252)
Simmons, G., and W. F. Brace, 1965
Comparison of Static and Dynamic Measurements of Compressibility of Rocks, J. Geophys.
Res., 70, 5649-5656. (NNA.910923.0007)
2O
_rl ,rll,,iqtPpI , gll ,VplPPlllllr,erql_tll[I,, illlI,Illl't:l' H'" iTal,ml_,,,, _l'"lflt]l' _'rlt' illarllr ,_' ,llfEIIt ,',',,I " ,,', ,"li'IRI ' ' ,I,,tl_ ', ,rp'llr_'_ll '1_ _llrt' al"' ,,,r' n'tlpI 't, ,liMt,_lrl,tlrl,rll, ..... lal@,lr,_, _, illll_ i_ iIil,l'l_l'11 lip li rl , ,,_ll _ ,lr tit _ irlI roll
6.0 Figures
3
........
J1
10/AE/78B
,$ ,I _|
10/AE/78C
10/AE/78A
. Figure I. Schematic diagram of the sub-core orientations and designations for the three spec-
imens obtained from Topopah Spring Member welded tuff specimen 10/AE/78. The reference
coordinate system used in the discussion is shown in the upper left corner.
21
_[ :

6.0 .......... =
10/AE/78BS.5
5.0
NN m N m IN lm m
"_ 4.5
[-4.0 m P-WAVE
-[', S(I) WAVE
3.5_;_ o S(2) WAVE
3.0
2.5
0 5 10 15 20 25 30
PRESSURE, MPa
Figure 2. Compressional (P-wave) and shear wave (Sl and $2) velocities are plotted a,s a function
of confining pressure for a vacuum dry specimen of q:bpopah Spring Member tuff. The propagation
direction is parallel to the axis of symxnetry (i.e. normal to the bedding plane).
22
, 6.0
10/AE/78A5'5
5.0 = • = = .. = ..
4.5
[i I P-WAVE4.0
•4- Stl)-WAVE
3,5 o S(2).WAVE "
3.0 _ _ _. _ _. _. -_
2.5
0 5 10 15 20 25 30
PRESSURE, MPa
Figure 3. Compressional (P-wave) and shear wave (Sl and $2)velocities axe plotted as a function
of confining pressure for a vacuum dry specimen of Topopah Spring Member tuff. The propagation
. direction is parallel to the bedding plane. Sl has a particle motion in the bedding plane; $2 has
a pa.rticle motion normal to the bedding plane.
23

1.0
10/AE/78B
0.8 D
o_
_- El +
°=N,,,I 06 Oo_
< O.4 [] +
[-- ra o
[] _ 0 I.AXIS
0.2 0
[] _ "_ 2.AXIS
[] Q _ I"13-AXIS
00|. _ • _ _J_ , . I ._ _ ....., I .., _ •0 10 20 30 40 50 60
PRESSURE, MPa
Figure 4. Strains parallel to the 1-, 2-, and 3- directions of Topopah Spring Member tuff speci-
men 10/AE/78 are plotted as a function of confining pressure. The relation between layering and
the coordinate system is shown in Figure 1.
24
60 10/AEf/8B
,,,., 50 r" CP 20 MPa ,_/"
i °:3°20
10
0 -- " j I _ _ __....-,--.d.,--.. e _
0 0.1 0.2 0.3 0.4 0.5 0.6 0.7 0.8 0.9 1
AXIAL STRAIN, millisn'ain
Figure 5. Axial stress is plotted as a function of axial strain for a compression experiment at a
confining pressure of 20 MPa. The compression direction was normal to the layering.i,
25
,i rpllll, Ill ..... T, ,,,II,' 1lr.... _,n.... , ' _, pi I_ .... rii, _,l , li .... Iql 'M np',1...... I.... fillq
120 _ r T T
I00 ' 10/AE/78B
a, 80
cdrm /
60
<
4oY
20
0 0.5 1 1.5 2 2.5
AXIAL STRAIN, millistrain
Figure 6. Axial stress is plotted as a function of axial strain for a uniaxial strain experiment.
The compression direction was normal to the layering.
26
*I
0 1 T I r
35 1 10/AE/78B
30
a., 25 -_
20
15
10
5
0 0.5 1 1.5 2 2.5
AXIAL STRAIN, millistrain
Figure 7. Confining pressure is plotted as a function of axial strain for a uniaxial strain experi-
ment.
t
27
Appendix
Information from the Reference Information Base
Used in this Report
Q
This report contains no information from the RIB.
Candidate Information for the
Reference Information Base
This report contains no candidate information for the RIB.
Candidate Information for the
Site Sz Engineering Properties Data Base
This report contains no candidate information for the SEPDB.
28
1
DISTRIBUTION LIST
I J. W. Bartlett, Director (RW-I) i S. J. Brocoum (RW-22)
Office of Civilian Radioactive Analysis and Verification Division
Waste Management Office of Civilian Radioactive
U,S, Department of Energy Waste Management
' i000 Independence Avenue, S.W. U.S. Department of Energy
Washington, DC 20585 I000 Independence Avenue, S.W.
Washington, DC 20585
1 F. G. Peters, Deputy Director (RW-2)
Office of Civilian Radioactive 1 J. Roberts, Acting Assoc. Dir.
Waste Management (RW-30)
U.S. Department of Energy Office of Systems and Compliance
1000 Independence Avenue, S.W. Office of Civilian Radioactive
Washington, DC 20585 Waste Management
U.S. Department of Energy
1 T. H. Isaacs (RW-4) i000 Independence Avenue, S.W.
Office of Strategic Planning Washington, DC 20585
and International PrOgrams
Office of Civilian Radioactive 1 J. Roberts (RW-33)
Waste Management Director, Regulatory Compliance
U.S. Department of Energy Division
i000 Independence Avenue, S.W. Office of Civilian Radioactive
Washington, DC 20585 Waste Management
U.S. Department of Energy ,
i J. D. Saltzman (RW-5) I000 Independence Avenue, S.W.
Office of External Relations Washington, DC 20585Office of Civilian Radioactive
Waste Management i G. J. Parker (RW-332)
U.S. Department of Energy Office of Civilian Radioactive
i000 Independence Avenue, S.W. Waste Management
Washington, DC 20585 U.S. Department of Energy
i000 Independence Avenue, S.W.
1 Samuel Rousso (RW-IO) Washington, DC 20585
Office of Program and Resources
Management 1 R. A. Milner (RW-40)
Office of Civilian Radioactive Office of Storage and Transportation
Waste Management Office of Civilian Radioactive
U.S. Department of Energy Waste Management
I000 Independence Avenue, S.W_ U.S. Department of Energy
Washington, DC 20585 i000 Independence Avenue, S.W.
Washington, DC 20585
I J. C. Bresee (RW-IO)
Office of Civilian Radioactive 1 S. Rousso, Acting Assoc. Director
Waste Management (RW-50)
U.S. Department of Energy Office of Contract Business
I000 Independence Avenue, S.W. Management
• Washington, DC 20585 Office of Civilian Radioactive
Waste Management
1 C. P. Gertz (RW-20) U.S. Department of Energy
Office of Geologic Disposal i000 Independence Avenue, S.W.
Office of Civilian Radioactive Washington, DC 20585
Waste Management
U.S. Department of Energy
i000 Independence Avenue, S.W.
Washington, DC 20585
!! i
I Trudy Wood (RW-52) i C. L. West, Director
Director, M&O Management Division Office of External Affairs
Office of Civilian Radioactive DOE Field Office, Nevada
Waste Management U.S. Department of Energy
U.S. Department of Energy P.O. Box 98518
I000 Independence Avenue, S.W. Las Vegas, NV 89193-8518
Washington, DC 2058512 Technical Information Officer
I D. U. Deere, Chairman DOE Nevada Field Office
Nuclear Waste Technical Review Board U.S. Department of Energyii00 Wilson Blvd. #910 P.O. Box 98518
Arlington, VA 22209-2297 Las Vegas, NV 89193-8518
1 Dr. Clarence R. Allen I P. K. Fitzsinunons, Technical
Nuclear Waste Technical Review Board Advisor
i000 E. California Blvd. Office of Assistant Manager for
Pasadena, CA 91106 Envirorunental Safety and Health
DOE Field Office, Nevaaa
1 Dr. John E. Cantlon U.S. Department of EnergyNuclear Waste Technical Review Board P.O. Box 98518
1795 Bramble Dr. Las Vegas, NV 89193-851.8
East Lansing, MI 48823
1 D. R. Elle, Director1 Dr. Melvin W. Carter Envirol_ental Protection Division
Nuclear Waste Technical Review Board DOE Nevada Field Office
4621 Ellisbury Dr., N.E. U.S. Department of Energy
Atlanta, GA 30332 P.O. Box 98518
Las Vegas, NV 89].93...85].8
1 Dr. Donald Langmuir
Nuclear Waste Technical Review Board 1 Repository Licensing & Quality109 So. Lookout Mountain Cr. Assurance
Golden, CO 80401 Project Directorate
Division of Waste Management
1 Dr. D. Warner North U.S. Nuclear Regulatory Commission
Nuclear Waste Technical Review Board Washington, DC 20555
Decision Focus, Inc.
4984 E1 Camino Real 1 Senior Project Manager for Yucca
Los Altos, CA 94062 Mountain
Repository Project Branch
1 Dr_ Dennis Lo Price Division of Waste Management
Nuclear Wast Technical Review Board U.S. Nuclear Regulatory Colmmission
I011 Evergreen Way Washington, DC 20555
BIacksburg, VA 24060i NRC Doc_m_ent Control Desk
i Dr. Ellis D. Verink Division of Waste Management
Nuclear Waste Technical Review Board U.S. Nuclear Regulatory Commission
4401 N.W. 18th Piace Washington, DC 20555
Gainesville, FL 32605 ' -_1 P. T. Prestholt
5 C. P. Gertz, Project Manager NRC Site Representative
Yucca Mountain Site Characterization 301 E. Stewart Ave., Room 203 '
Project Office Las Vegas, NV 89101
U.S. Department of EnergyP.O. Box 98608--MS 523 1 E. P. Binnall
Las Vegas, NV 89193-8608 Field Systems Group Leader
Building 50B/4235
Lawrence Berkeley Laboratory
Berkeley, CA 94720
I 2 -III' _J_ I qllll[ II'li IIrIl_l _ li II IIIII r'llrllll'_l' IIl_ "lP II I I _ _ I _ II ' ' " '_' III ' I" I, I II[I II 1, I Ill'rlllll I ..... 111111 I I I_ _ I '_
I Center for Nuclear Waste i J. S. Stuckless
Regulatory Analyses Geological Division Coordinator6220 Culebra Road MS 913
Drawer 28510 Yucca Mountain Project
San Antonio, TX 78284 UoS. Geological SurveyP.O. Box 25046
' 3 W. L+ Clarke Denver, CO 80225
Technical Project Officer for YMPAttn + YMP/LRC i D. H. Appel, Chief
• Lawrence Livermore National Hydrologic Investigations Program
Laboratory MS 421P.O. Box 5514 U.S. Geological Survey
Livermore, CA 94551 P.O. Box 25046Denver, CO 80225
4 R. J. Herbst
Technical Project Officer for YMP i E. J. Helley
N-5, Mail Stop J521 _ Branch of Western Regional GeologyLos Alamos National Laboratory MS 427P.O. Box 1663 U.S. Geological Survey
Los Alamos, NM 8"7545 345 Middlefield RoadMenlo Park, CA 94025
I II. N. Kalia
Exploratory Shaft Test Manager i R. W. Craig, ChiefLos Alamos National Laboratory Nevada Operations Office
Mail Stop 527 U.S. Geological SurveyI01 Convention Center Dr., Suite 820 I01 Convention Center Drive
Las Vegas, NV 891.09 Suite 860, MS 509Las Vegas, NV 89109
1 J. F. Divine
Assistant Director for i D. Zesiger
Engineering Geology U.S. Geological SurveyU.S. Geological Survey i01 Convention Center Dr,106 National Center Suite 860 - MS 509
12201 Sunrise Valley Dr. Las Vegas, NV 89109Reston, VA 22092
i R. V. Watkins, Chief
+ 6 L. R. Hayes Project Planning and Management
Technical Project Officer U.S. Geological Survey
Yucca Mountain Project Branch--MS 425 P.O. Box 25046
U.S. Geological Survey 421 Federal CenterP,O. Box 25046 Denver, CO 80225
Denver, CO 80225i A. L. Flint
I V. R. Schneider U.S. Geological Survey
Asst. Chief Hydrologist--MS 414 MS 721Office of Program Coordination P.O. Box 327
& Technical Support Mercury, NV 89023
• U.S. Geological Survey12201 Sunrise Valley Drive i D. A. BeckReston, VA 22092 UoS. Geological Survey
1500 E. Tropicana, Suite 201
Las Vegas, NV 89119
, i,flll,, ,,. ,, ,. , ,, ,, .l_,ll,,llrll_ ..... til itl,_ ,,ll.r ,, lp ,1", li I1' "llql'r '"' '" 'IIPI" """' ' II'llr Illi _' I_, ml, I'11" ' ,Iiii fll, r_,,.... ,,,, rii .,, tl ' ' I111i,'l'C 'll,ll"'l' I ...... Pll' 'f' ' ' '. ..... li' , r, "111"' ,,_r I'P'rlf_..... 'r''li'rll_ " " I'l," r

1 P. A. Glancy 1 C. E. Ezra
U.S. Geological Survey YMP Support Project ManagerFederal Building, Room 224 EG&G Energy Measurements, Inc.
Carson City, _: 89701 MS V-02P.O. Box 1912
1 Sherman S. C. Wu Las Vegas, NV 89125
Branch of Astrogeology
U.S. Geological Survey I R. E. Jackson, Program Manager2255 N. Gemini Dr. Roy F. Weston, Inc.
Flagstaff, AZ 86001 955 L'Enfant Plaza, Southwest
Washington, DC 20024i J. H. Sass
Branch of Tectonophyslcs i Technical Information Center
U.S. Geological Survey Roy F. Weston_ Inc.2255 N. Gemini Dr. 955 L'Enfant Plaza, Southwest
Flagstaff, AZ 86001 Washington, DC 20024
i DeWayne A, Campbell i D. Hedges, Vice President,Technical Project Officer for YMP Quality Assurance
U.S. Bureau of Reclamation Roy F. Weston, Inc.
Code D-3790 4425 Spring Mountain Road, Suite 300
P.O. Box 25007 Las Vegas, NV 89102Denver, CO 80225
I D. L, Fraser, General Manager
i K. W. Causseaux Reynolds Electrical & Engineering Co.
NHP Reports Chief Mail Stop 555
U.S. Geological Survey P.O. Box 98521421 Federal Center Las Vegas, NV 89193-8521P.O. Box 25046
Denver, CO 80225 i R. F. Pritchett
Technical Project Officer for YMP
i W. R. Keefer Reynolds Electrical & Engineering Co.U.S. Geological Survey MS 408913 Federal Center P.O. Box 98521
P.O. Box 25046 Las Vegas, NV 89193-8521Denver, CO 80225
i B. W. Colston
i M. D. Voegele Presldent/General Manager
Technical Project Officer for YMP Las Vegas Branch
Science Applications International Raytheon Services NevadaCorp. MS 416
I01 Convention Center Dr. P.O. Box 95487
Suite 407 Las Vegas, NV 89193-5487Las Vegas, NV 89109
I R. L. Bullock
2 L. D. Foust Technical Project Officer for YMPNevada Site Manager Raytheon Services Nevada
TRW Environmental Safety Systems Suite P250, MS 403 .i01 Convention Center Drive 101 Convention Center Dr_
Suite 540, MS 423 Las Vegas, NV 89109Las Vegas, NV 89109
I R. E. Lowder
Technical Project Officer for YMPMAC Technical Services
101 Convention Center Drive
Suite i].00
Las Vegas, NV 89109
i Paul Eslinger, Manager i C. H. Johnson
PASS Program Technical Program ManagerL
Pacific Northwest Laboratories Nuclear Waste Project OfficeP.O. Box 999 State of Nevada
, Richland, WA 99352 Evergreen Center, Suite 2521802 North Carson Street
i A0 T. Tamura Carson City, NV 89710
Science and Technology DivisionOffice of Scientific and Technical i John Fordham
Information Water Resources Center
U.S° Department of Energy Desert Research InstituteP.O. Box 62 P.O. Box 60220
Oak Ridge, TN 37831 Reno, NV 89506
i Carlos G. Bell, Jr. I Dr. Martin Mifflin
Professor of Civil Engineering Water Resources Center
Civil and Mechanical Engineering Desert Research Institute
Department 2505 Chandler Avenue, Suite i
University of Nevada, Las Vegas Las Vegas, NV 89120
4505 South Maryland Parkway
Las Vegas, NV 89154 i Eric AndersonMountain West Research-Southwest
i C. F. Costa, Director Inc.Nuclear Radiation Assessment 2901 N. Central Ave. #I000
Division Phoenix, AZ 85012-2730U.S. Environmental Protection
Agency I Department of Comprehensive Planning
Environmental Monitoring Systems Clark County
Laboratory 225 Bridger Avenue, 7th Floor
P.O. Box 93478 Las Vegas, NV 89155
Las Vegas, NV 89193-3478
i Planning Department
i ONWI Library Nye County
Battelle Columbus Laboratory P.O. Box 153Office of Nuclear Waste Isolation Tonopah, NV 89049
505 King Avenue
Columbus, OH 43201 I Lincoln County Commission
Lincoln County
i T. Hay, Executive Assistant P.O. Box 90Office of the Governor Pioche, NV 89043State of Nevada
Capitol Complex 5 Judy Foremaster
Carson City, NV 89710 City of CalienteP.O. Box 158
3 R. R. Loux, Jr. Caliente, NV 89008Executive Director
Nuclear Waste Project Office I Economic Development Department
State of Nevada City of Las Vegas
' Evergreen Center, Suite 252 400 East Stewart Avenue
1802 North Carson Street Las Vegas, NV 89101
Carson City, NV 89710
i Community Planning & Development
City of North Las VegasP.O. Box 4086
Nort.h Las Vegas, NV 89030
5
INiiP,llip, i ,uqplll ,,,i_r, ,rqr "lpl'r,'"lll_ilpN...... ''-_PtqVP'' " 1_1111.... _illlff,_ ........ mlliqpilillr_,, "'qlliP ' ,,,,H,_rlr_ ','r'_ II'lP ' r PIP ....... PIIrllq' llr _pII rl 'rqmlll,mpll....
I Director of Community Planning i Brad Mettam
City of Boulder City P.O. Box 539
P.O. Box 367 Goldfield, NV 89013
Boulder City, NV 89005
i BJorn Selinder
i Commission of the European 190 W. First St.Communities Fallon, NV 89406
200 Rue de la Loi
B-I049 Brussels i Charles Thistlethwaite, AICPBELGIUM Associate Planner
Planning Department2 M. J. Dorsey, Librarian Drawer L
YMP Research and Study Center Independence, CA 93526
Reynolds Electrical & EngineeringCo., Inc. i0 R. J. Martin, III
MS 407 New England Research, Inc.P.O. Box 98521 76 Olcott Drive
Las Vegas, NV 89193-8521 White River Junction, VT 05001
i Amy Anderson
Argonne National Laboratory I 6300 D.E. Miller
Building 362 i 6302 T. E, BleJwas
9700 So. Cass Ave. i 6312 F.W. Bingham
Argonne, IL 60439 i 6313 L.S. Costin2 6318 R.J. Macer for
i Steve Bradhurst 100/1232713/SANDgI-O894/NQP.O. Box 1510 2 6318 F. Cheek-Martin for DRMS
Reno, NV 89505 file 51/L02-04/06/87i 6319 R.R. Richards
I Vernon Poe
P.O. Box 1026 25 6115 R.H. Price
Hawthorne, NV 89415 5 7141 S.A. Landenberger
8 7613-2 Document ProcessingJason Pitts for DOE/OSTI
Lincoln County Courthouse 3 7151 G.C. Claycomb
Pioche, NV 89043 i 6115 P.J. Hommert, Acting
20 6341 WMT Library
I Michael L. Baughman i 6410 D.A. Dahlgren35 Clark Road i 8523-2 Central Technical Files
Fiskdale, MA 01518
I Glenn Van Roekel
Director of Community DevelopmentP.O. Box 158
Caliente, NV 89008
I Ray Williams, Jr.P.O. Box I0
Austin, NV 89310
i Leonard J. Fiorenzi
P.O. Box 257
Eureka, NV 89316
6
I ITI ' n, ,_, ii,a I, ..... qpI ,,