Embed Size (px)
Citation preview

Biochemistry 1982, 21, 4989-4999 4989
Le Pecq, J. B., Le Bret, M., Barbet, J., & Roques, R. (1975) Proc. Natl. Acad. Sci. U.S.A. 72, 2915.
Lerman, L. S . (1961) J . Mol. Biol. 3, 18. Lerman, L. S . (1963) Proc. Natl. Acad. Sci U.S.A. 49, 94. Lerman, L. S . (1964a) J . Cell. Comp. Physiol. 64 ( l ) , 1. Lerman, L. S . (1964b) J . Mol. Biol. 10, 367. McGhee, J. D., & von Hippel, P. H. (1974) J . Mol. Biol. 86,
Organon, N. V. (1957) Dutch Patent 83956. Pelaprat, D., Delbarre, A., Le Guen, I., Roques, B. P., & Le
Revet, B. M. J., Schmir, M., & Vinograd, J. (1971) Nature
Rolski, S . , & Rolski, K. (1969) Acta Pol. Pharm. 26, 301. Roques, B. P., Barbet, J., & Le Pecq, J. B. (1976) C. R. Hebd.
Schock, R. U. (1957) J . Am. Chem. SOC. 79, 1672.
469.
Pecq, J. B. (1980) J . Med. Chem. 23, 1336.
(London), New Biol. 229, 10.
Seances Acad. Sci. Ser. D 283, 1453.
Ts’o, P. 0. P. (1968) in Molecular Associations in Biology (Pullmann, B., Ed.) Academic Press, New York.
Viswamitra, M. A,, Kennard, O., Cruse, W. B. T., Egert, E., Sheldrick, G. M., Jones, P. G., Waring, M. J., Wakelin, L. P. G., & Olsen, R. K. (1981) Nature (London) 289, 817.
Wakelin, L. P. G., & Waring, M. J. (1976) Biochem. J . 157, 721.
Wakelin, L. P. G., Romanos, M., Chen, T. K., Glaubiger, D., Canellakis, E. S . , & Waring, M. J. (1978) Biochemistry 17, 5057.
Wilson, W. D., & Jones, R. L. (1982) in Intercalation Chemistry (Whittingham, S . , Ed.) pp 177-222, Academic Press, New York.
Wilson, W. D., Keel, R. A., Jones, R. L., & Mosher, C. W. (1982) Nucleic Acids Res. 10, 4093.
Wright, R. G., Wakelin, L. P. G., Fields, A., Acheson, R. M., & Waring, M. J. (1980) Biochemistry 19, 5825.
Anion Binding and pH-Dependent Electrostatic Effects in Ribonuclease?
James B. Matthew and Frederic M. Richards*
ABSTRACT: The solvent-accessibility-modified, Tanford- Kirkwood, discrete charge model for electrostatic effects is applied to both ribonuclease A and ribonuclease S . The be- havior of individual titratable sites and the pH-dependent free energy of denaturation are correctly predicted. The use of the solvent-accessibility factor in reducing charge-site interactions introduces a higher Coulombic shielding for solvent-exposed sites. This shielding is interpreted as a higher local strength or alternatively a higher effective dielectric constant. Specific
%e Tanford-Kirkwood discrete charge theory for globular proteins describes the calculation of an interaction energy between two point charges separated from each other by a distance, rij, on, or in, a sphere of low dielectric constant surrounded by a solvent of higher dielectric constant with a finite ionic strength. The latter appearance of detailed protein structures from X-ray diffraction studies provided positions for the charged groups and thus removed the ad hoc as- sumptions about position which had been required in the early work. However, Tanford & Roxby (1972) abandoned the dielectric sphere model as a predictive tool when they deter- mined that an adjustable burial parameter was required to fit protein titration curves. In an attempt to overcome the un- certainty of the burial parameter and to allow for the irreg- ularities of the protein surface, Shire et al. (1974) introduced a modification where the single burial parameter was replaced by the fractional solvent accessibility of each ionizable group as determined from crystal structural data. The development of this general procedure and the current algorithms in use are reviewed (Matthew et ai., 1979a, 1981b).
From the Department of Molecular Biophysics and Biochemistry, Yale University, New Haven, Connecticut 0651 1. Received December 8, 1981; revised manuscript received April 14, 1982. This work was supported by National Institute of General Medical Sciences Grant GM-22778. J.B.M. was supported by Fellowship F32 CA06633 from the National Cancer Institute.
anion binding sites are determined by locating areas of high positive electrostatic potential at the protein solvent interface. The potential and thus the anion affinity of a given site are calculated and shown to vary with the pH-dependent charge array. pH-dependent anion binding constants are calculated for the ribonuclease S active site. These binding constants and the predicted response of the active-site histidine pKII2 values to anion binding are shown to agree with experimental de- terminations.
To date, the static-accessibility-modified, Tanford-Kirk- wood, theory has been successfully applied to sperm whale myoglobin and 11 species variations (Botelho et al., 1978; Friend & Gurd, 1979a,b), to oxy- and deoxyhemoglobins and their interactions involving hydrogen ions, chloride ions, carbamino adducts, and organic phosphate polyanions (Matthew et al., 1979a,b, 1981a,b), and to protein-protein interactions (Friend et al., 1981). The intent of these studies has been to test the versatility and predictive power of the algorithm by treating a variety of proteins. The mathematical detail (Matthew et al., 1979a), the sensitivity to variations in model parameters (Matthew et al., 1978, 1979a), and the effects of charge array dissymmetries with respect to charge conformation and static solvent accessibility (Matthew et al., 1979b) have been examined.
In this paper we examine the influence of the static-ac- cessibility parameters on the Tanford-Kirkwood work factors. The actual insertion of charged groups into the bulk solvent, as reflected by increased accessibility, results in a set of r e d u d interaction energies. These reduced pair interactions are in- terpreted either as a higher effective dielectric constant which includes the bulk ionic strength value or as a higher local ionic strength in the bulk dielectric medium.
Using the calculated protein charge array and the known protein surface topography, we develop a procedure for the identification of specific ion binding sites at the protein surface
0006-2960/82/0421-4989$01.25/0 0 1982 American Chemical Society
4990 B I O C H E M I S T R Y M A T T H E W A N D R I C H A R D S
based on electrostatic criteria. The ribonuclease system is used as an example. In particular, the active site of ribonuclease is identified as a general anion binding site allowing us to evaluate our treatment in the context of the literature per- taining to active-site histidine proton affinities as well as known anionic ligand association constants.
Experimental Procedures Electrostatic Theory: Extension to Ion Site Binding. The
Tanford-Kirkwood theory (Tanford & Kirkwood, 1957) is used to calculate the electrostatic free energy for a set of discrete point charges on a spherical surface of radius b and ion exclusion radius, a. La Place’s equation applies to the protein low dielectric region and in the ion exclusion region which consists of solvent dielectric but no mobile ions. The Poisson-Boltzmann equation is applied in the high dielectric mobile ion region with the same assumptions that are inherent in the Debye-Huckel treatment (1923). The theory applies only when the electrostatic potential energy e$ is less than kT. However, the electrostatic potential energy of a small ion in the vicinity of a highly charged polymer is often several kT. The well-known phenomenon of specific ion “site binding” is not accounted for by the Debye-Huckel approximation used in the Tanford-Kirkwood treatment. This problem has been discussed for many years, and several different approaches have been suggested, for polyelectrolytes of a single charge type by Harris & Rice (1956) and Wall & Berkowitz (1957) and for proteins by Nagasawa & Holtzer (1964). All of these authors have pointed out the need to develop a general elec- trostatic interpretation of specific ion binding.
Protein molecules are unique polyelectrolytes in that they carry their own partial complement of counterions which ex- hibit charge cancellations at their characteristic isoionic point and “tight” binding in the form of intramolecular salt bridges. It is expected that when the protein’s own charge array is sufficiently asymmetric, by either composition, geometry, or both, that the surface electrostatic potential in the absence of steric hindrance will dictate both specific ion binding sites and the apparent binding affinities. We suggest an extension of the solvent-accessibility approach to provide for the systematic identification of specific ion binding sites on the protein surface. Once identified the binding constants and occupancies for these sites can be calculated as a function of pH and ionic strength.
Solvent-Accessibility-Modified Tanford-Kirkwood Theory. ( a ) Static Accessibility. Following Lee & Richards (1971) the “accessible surface area” is calculated as the area around an atom in angstroms squared over which the center of the solvent (i.e., water) molecule can be placed, enabling it to maintain van der Waals contact without penetrating any other atom in the protein. As in previous work, the influence of protein structure on the solvent accessibility of individual charge sites is obtained by normalization to the accessibility of the same atom in a model tripeptide where accessibilities are assumed to attain their maximum value indicative of the fully hydrated site.
These fractional accessibility values vary from 0.01, indi- cating virtually no van der Waals contact with water in the static structure, to 1 .O, inferring no protein structural restraints on solvation. Each protein charge site known to be titrable in the native structure has some solvent contact; thus they are all at the protein solvent interface. Parts A-C of Table I tabulate the charge group fractional solvent accessibility calculated from the crystallographic structures of RNase S (Wyckoff et al., 1970) and RNase A (A. Wlodawer, personal communication) and give estimates for the isolated S-protein component of RNase S.
t I 1 I I I 1
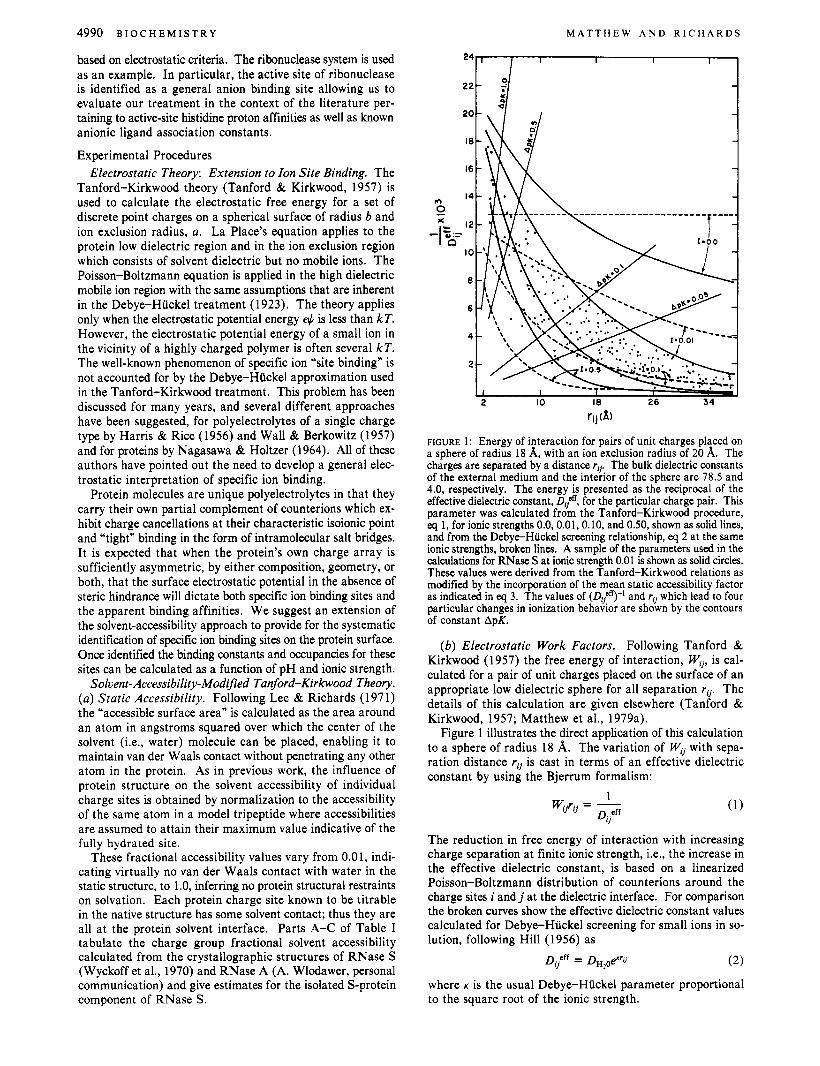
FIGURE 1: Energy of interaction for pairs of unit charges placed on a sphere of radius 18 A, with an ion exclusion radius of 20 A. The charges are separated by a distance rip The bulk dielectric constants of the external medium and the interior of the sphere are 78.5 and 4.0, respectively. The energy is presented as the reciprocal of the effective dielectric constant, D$ for the particular charge pair. This parameter was calculated from the Tanford-Kirkwood procedure, eq 1, for ionic strengths 0.0, 0.01, 0.10, and 0.50, shown as solid lines, and from the Debye-Huckel screening relationship, eq 2 at the same ionic strengths, broken lines. A sample of the parameters used in the calculations for RNase S at ionic strength 0.01 is shown as solid circles. These values were derived from the Tanford-Kirkwood relations as modified by the incorporation of the mean static accessibility factor as indicated in eq 3. The values of (QF9-l and rij which lead to four particular changes in ionization behavior are shown by the contours of constant ApK.
( b ) Electrostatic Work Factors. Following Tanford & Kirkwood (1957) the free energy of interaction, Wij, is cal- culated for a pair of unit charges placed on the surface of an appropriate low dielectric sphere for all separation rij. The details of this calculation are given elsewhere (Tanford & Kirkwood, 1957; Matthew et al., 1979a).
Figure 1 illustrates the direct application of this calculation to a sphere of radius 18 A. The variation of w, with sepa- ration distance rij is cast in terms of an effective dielectric constant by using the Bjerrum formalism:
The reduction in free energy of interaction with increasing charge separation at finite ionic strength, i.e., the increase in the effective dielectric constant, is based on a linearized Poisson-Boltzmann distribution of counterions around the charge sites i a n d j at the dielectric interface. For comparison the broken curves show the effective dielectric constant values calculated for Debye-Huckel screening for small ions in so- lution, following Hill (1956) as
Dijeff = &#”j (2)
where K is the usual Debye-Huckel parameter proportional to the square root of the ionic strength.

E L E C T R O S T A T I C E F F E C T S I N R I B O N U C L E A S E V O L . 2 1 , N O . 2 0 , 1 9 8 2 4991
Table I: Static Accessibilities and Calculated pK,, Values
charged group fractional solvent accessibility pK,,, calcd, I = 0.10
PKiIlt RNase A RNase S S prot. RNase A RNase S s prot.
Glu-2 Glu-9 ASP- 14 Ala-20 Asp38
Asp5 3 (3111-4 9
ASP-83 Glu-86 Glu-1 1 1 Asp-1 21 Val- 1 24
Tyr-25 Tyr-73 Tyr-76 Tyr-92 Tyr-97 Tyr-115 Lys-1 Lys-7 Arg-10 Lys-3 1 Arg-3 3 Lys-37 Arg-39 Lys-41 LYS-6 1 LYS-66 Arg-85 Lys-91 LYS-98 Lys-104
Lys-1 His-1 2 Ser-21 His48 His-105 His-1 19
4.5 4.5 4.0 4.0 4.0 4.0 4.0 4.0 4.0 4.5 4.0 4.0
10.0 10.0 10.0 10.0 10.0 10.0 10.4 10.4 12.0 10.4 12.0 10.4 12.0 10.4 10.4 10.4 12.0 10.4 10.4 10.4
7.8 6.6 7.8 6.0 6.6 6.0
A. Carboxyl Groups 0.30 0.02 b 2.98 0.72 0.69 b 4.35 0.26 0.42 b 2.20 a 0.82 b a 0.02 0.05 0.05 1.66 0.28 0.19 0.19 3.76 0.44 0.66 0.66 4.07 0.33 0.24 0.24 2.73 0.49 0.32 0.32 3.64 0.78 0.98 0.98 4.34 0.03 0.13 0.13 2.30 0.75 0.27 0.27 3.72
B. Basic Residues 0.02 0.02 0.06 10.63 0.38 0.40 0.40 10.50 0.62 0.68 0.68 10.03 0.45 0.46 0.46 10.08 “M” “M” “M” “M” 0.31 0.18 0.18 10.63 0.95 0.85 b 10.45 0.74 0.79 b 10.31 0.1 2 0.25 b >13 0.52 0.28 0.28 10.55 0.39 0.43 0.73 >13 0.91 0.62 0.62 10.40 0.37 0.07 0.07 >13 0.15 0.29 0.46 9.58 0.95 0.83 0.83 10.53 0.61 0.51 0.5 1 10.95 0.47 0.66 0.66 13.00 0.61 0.94 0.94 10.51 0.40 0.58 0.58 10.00 0.89 0.46 0.46 10.60
C. Histidine Residues and Terminal Amino Groups 0.82 0.79 b 7.79 0.17 0.13 b 6.27 a 0.85 0.85 a 0.02 0.02 0.69 6.52 0.73 0.83 0.83 6.64 0.12 0.13 0.13 6.68
3.10 4.44 2.78 3.91 1.60 3.72 4.00 2.87 3.56 4.40 2.64 2.65
10.65 10.60 10.01 10.00 “M” 10.84 10.49 10.25 12.7 10.75
>13.0 10.37
>13 9.58
10.54 11.03 12.80 10.45 10.60 11.52
7.77 6.38 7.70 6.59 6.61 6.34
b b b b 2.01 3.77 4.01 3.00 3.66 4.43 2.87 2.71
10.02 10.60 10.00 10.02 “M” 10.81 b b b 10.73 12.4 10.37
10.0 10.54 11.02 12.9 10.45 10.60 11.51
>13
b b 7.70 6.07 6.61 6.47
RNase A does not have Ala-20 and Ser-21 charge sites which are generated by enzymatic cleavage in the synthesis of RNase S. S-protein structure assumes that S protein is the same average structure as the S-protein portion of the RNase S complex. Charge sites of the S peptide are eliminated. to elimination to the S peptide. “M” denotes masked (see the text).
Accessibility changes of charge group of the S-protein portion of RNase S complex with respect to RNase S are solely due
At all distances greater than 14 A, and, at ionic strengths greater than 0.01, for distances greater than 8 A, the effective dielectric constant is greater than that of water, indicating the dominance of the external bulk dielectric constant. Only at short distances (rij = 3-10 A, where ApK, values are greater than 0.3) are the W., values noticeably sensitive to the presence of the low dielectric region. For two charges separated by 4 A the effective dielectric value for their interaction is 54.3 at I = 0.01. If the internal dielectric constant had been chosen as 10 rather than 4, the effective dielectric value would rise only to 57.0. It is particularly noteworthy that the experi- mentally observed pK values for groups involved in salt bridges, where the maximum shift in pK is about 1.5, correspond to an effective dielectric value of 50 at a separation of 3.0 A.
( c ) Incorporation of the Solvent-Accessibility Parameter. In the modification of the Tanford-Kirkwood treatment, solvent accessibility (SA), specific for each group, has been incorporated into the calculation of Wij as follows:
where Gij is the average accessibility of sites i and j . w; = W7(1 -SA,) (3)
The electrostatic energies of interaction W,; for the pairwise interactions of all charged sites i and j on ribonuclease are plotted as points in Figure 1. The values calculated by the Tanford-Kirkwood formalism at I = 0.01 when reduced by 1- Sij are distributed between the curve for I = 0.01 as an upper limit and a curve equivalent to I = 0.5 as a lower limit. In the same way, the Wij’ values for ribonuclease at I = 0.1 (not shown) fall between the Coulombic screening curves of I = 0.1 and 0.5.
Physfcal Interpretation of the Accessibility Modified T-K Formalism. Different accessibilities of the various groups reflect the ability of the protein to restrict both solvent in- teractions and the effective sequestering of counter ions. When SA, exceeds 0.95, the interaction energy between the two charge sites is negligible, and neither one perturbs the pK value of the other. For lower values of Gij the protein is sterically restricting access of solvent and mobile counterions to the high local field of the charge sites: E + > kT. At an average ac- cessibility of 0.05 or less, the protein is assumed to restrict the counterions to the ionic exclusion radius where the linearized
-

4992 B I O C H E M I S T R Y
Poisson-Boltzmann ionic strength approximation is valid, i.e., E$ < kT. Hence, the charge sites at low accessibility are allowed to interact as calculated by the Tanford-Kirkwood formalism. The linear relation between wj and zij ap- proximates the r-' dependence of the local field around a point charge. The use of the Gij factor in reducing electrostatic free energy results in a higher effective Coulombic shielding for solvent-exposed sites. This shielding, due to higher local ionic strength, can be interpreted as a higher effective local dielectric constant (Matthew et al., 1981b).
The effects on charge-site interaction mediated by steric constraints on counterion approach are shown in Figure 2. Figure 2A shows the field calculated for two univalent ions immersed in a uniform dielectric with no mobile ions. In panels B-D an anion is allowed to approach the cationic pair with restriction of geometry. (6) Calculation of pKi and AG,,. The influence of the
summed electrostatic fields at a given site i, controlling its effective pKi, is derived by an iterative scheme expressed as
M A T T H E W A N D R I C H A R D S
where (pKhtj) is the intrinsic ionization constant of the group i, the value it would have in the absence of any influence from other charged sites on the protein.' The iteration is continued at each pH until all pKi and zi values stabilize.
At each pH and ionic strength the unique protein charge array confers an electrostatic potential at site i causing the apparent pK to deviate from pKi,,. The pKi of almost every group is found to vary with pH, and it is convenient to define the parameter P K , , ~ for a group, this being the pH at which a particular group is half-titrated. In the absence of elec- trostatic interaction Zj,,ApKij goes to zero, then pKht equals PIClIz, and the variations of pKi with pH disappear. In the reference state for all of these calculations, the groups are maximally accessible to solvent and have no electrostatic in- teraction with each other. This hypothetical state can be approached for many proteins under conditions of complete denaturation. If the random configuration has a high charge density, Le., poly(DL-lysine), the assumption that equates the random coil to the reference state (ApKij = 0) would not be valid. Note also that in an intact protein when the pKi of a particular group happens to equal pKint,i this does not neces- sarily imply a lack of electrostatic interactions but may be a reflection of strong but cancelling interactions with neighboring groups.
The electrostatic free energy of placing a pair of unit charges i and j on the protein is Wi,l (eq 3). By summing Will terms for all pairwise interactions, the summed electrostatic free energy with respect to the reference state is obtained:
I The variation of the pK values of model compounds with dielectric constant in mixed solvents is well established (Barcarella et al., 1955), neutral acids being much more sensitive than cationic acids to a variation in solvent dielectric value. If the shielding of a charge site from solvent by the protein did induce a dielectric value dependent change in pKi,,, the effect should most easily be detected in the carboxylic acids of the protein. In bovine pancreatic trypsin inhibitor where pK112 values for the two Asp and two Glu residues and the terminal carboxyl group are known (Richarz & Wiithrich, 1978), the average of the calculated pK1/2 values is 3.22 while the average of the observed values is 3.36. All of these residues have a static accessibility of 0.4 or greater. When we consider that the charge-site interactions at the protein surface are accounted for by effective dielectric constant values of 50 or more (see Figure l ) , we have neglected this possible effect on pKi,,.
in which zi and zj represent the charge occupancy for each site calculated from the iterative procedure represented in eq 4 at any given pH and ionic strength.
Application to Ribonuclease. (a) Atomic Coordinates. Orthogonal atomic coordinates for bovine ribonuclease S are those reported by Wyckoff et al. (1970). They were derived from an electron density map at a nominal resolution of 2 A obtained from crystals grown from strong ammonium sulfate solution, space group P3'21. Coordinates for ribonuclease A were obtained from A. Wlodawer (personal communication) and transformed to an orthogonal unit cell. The crystals for this study were grown from 2-methyl- 1 -propanol-water mix- tures and grew in space group P2,. Atomic coordinates for S protein were assumed to be equivalent to the S-protein portion of the ribonuclease S complex. It is assumed that the crystallographic structures are unchanged over the pH range of study.
(b) Intrinsic pK Values. As discussed above, the intrinsic proton dissociation constants for acidic and basic groups of proteins are based on measured pK values for model com- pounds. Following previous work (Matthew et al., 1978, 1979a,b, 1981a,b) we distinguish two categories of proton binding sites. The first class comprises all groups with normal pKint values: terminal carboxyl, 3.60; Asp, 4.00; Glu, 4.50; terminal amino, 8.00; Cys SH, 9.0; Tyr, 10.00; Lys, 10.40; and Arg, 12.00. For glutamic acid, aspartic acid, histidine, and arginine where two atoms exist for possible charge placement, we choose the most solvent-accessible atomic coordinate. The appropriate pKi,, for histidine depends on which of ring ni- trogen atoms is chosen: His N", 6.00; His N', 6.60.*
The second class is that of "masked" groups. These residues are generally charge sites which are buried in their neutral form well within the protein interior. This class is encountered in RNase A or RNase S only in the case of Tyr-97 which would already be in neutral form under all but the most basic conditions.
In previous work titratable groups that were hydrogen bonded to the protein surface fell into a third category. The practice of altering the pKint values of these groups by 0.5 was an ad hoc formalism which was never tested for its necessity. In surveying previous work we found that these groups were relatively rare, usually restricted to carboxylic acids or arginine, and marginally affected the predictions only at pH extremes. This class has been omitted in the present study.
(c) Treatment of Specific Ion Binding Sites. The presence of bound anions such as chloride and inorganic or organic phosphates requires special consideration. These ions con-
Choice of the pKint values for histidines-12, -48, -105, and -119 between the two tautomeric forms were determined by the relative ex- posure to solvent of the two nitrogen atoms. Subsequently, a 13C NMR study on RNase A (Walters & Allerhand, 1980) has been reported that determined the titrating form of these histidines in 0.2 M acetic acid. In agreement with our choices they found His-12 and His-1 19 to be N' and N", respectively. They found a mixed tautomeric behavior for His-105 (70% N' and 30% N"); we have chosen N' on the basis of accessible surface criteria. His-48 is predicted to exhibit N" tautomeric form (pKi,, = 6.0) based on the accessibility calculation; however, the I3C NMR study is consistent with N' (pKi,, = 6.6). While this appears to be a contradiction, it should be recalled that His-48 in RNase A has a dis- continuous titration curve, except in the presence of acetate. In RNase S the His-48 titration is continuous over the entire range of pH. His-48 in RNase A has been implicated in a pH-dependent transition centered at pH 6.2 (0.1 M KC1) which is not observed in RNase S or in RNase A in the presence of acetate.

E L E C T R O S T A T I C E F F E C T S IN R I B O N U C L E A S E
_--._ . . C
FIGURE 2: Potential fields calculated for two cationic unit charges, immerged in a uniform medium with a hulk dielectric constant of 70. The field contour values are in units of kT. The positive field values are shown as solid lines. The points were calculated on a 1-A square grid. In each panel the cationic pint charges are I 8 A apart. In panels El-D. a negative couterion is inserted in different positions. In (B) it is approaching the midpoint between the two cationic sites. In (C) it is assumed to be sterically excluded from intercalation but allowed to approach one charge asymmetrically to a distance of 7 A. In (D) the counterion is close enough to form an ion pair with a separation of 3 A. All positive contours of 2kT and above are shaded.
tribute to Coulombic influences and may themselves represent titratable proton sites. They also have the ability to diffuse away to relieve or enhance interactions rather than shifting protonation state. The thermodynamics of ion binding are treated as follows [see also Matthew et al. (1981a)l. The term AG., is calculated for the protein with and without bound anion. For a permanent anion such as chloride, the difference between these two values gives the binding constant. This binding constant is calculated in the iterative procedure at various pH values to yield the pH dependence of the anion association. When the anion is itself a titratable species such as inorganic phosphate, the calculation for the fully occupied site includes terms in the iteration reflecting this additional ionizable group. The actual procedure for HP0,2- placed a potential negative charge on two of the four tetrahedral oxygen atoms. One of these was assigned the first pK of phosphoric acid and the other the second. They were treated as inde- pendent sites in the calculation (with their own cross term omitted), and the net protonation was calculated from the final occupancies. The calculation was not sensitive to the choice of which oxygen was used because they are so close together (1.9 A).
In contrast to previous work (Matthew et al., 39794 1981a) where we relied on chemical or crystallographic data for specific ion site location, the coordinates chosen in this study are determined by locating the area of high potential at the protein solvent interface. The potential a t a given site, and thus the ion affinity, varies with pH and ionic strength. In the course of this work it became clear that identification of these high potential sites was facilitated by carrying out the calculations at relatively high ionic strength (I = 0.1) where only the high potential sites persist as the fields collapse toward the protein surface. For example, a site whose potential is calculated to be 5kT at zero ionic strength, 3kT at 0.01, and 2kT at 0.1 would have monovalent anion affinities of 200.20, and IO M-I, respectively. It should be noted that no sidechain rearrangement has been allowed in response to binding. Thus chelation effects, if any, are omitted, and the calculated magnitudes of interaction may be underestimates.
V O L . 2 1 , N O . 2 0 , 1 9 8 2 4993
Nucleotides such as 2’-CMP or 3’-CMP binding to RNase S present the additional complexity of substantial nonelec- trostatic components to binding energy. In these cases the anionic portion of the ligand may have to compromise the charge placement that maximizes electrostatic interaction in order to accommodate the steric restraints inferred by hy- drogen bonding or nonpolar interactions. In these cases the possible variation in the pH-dependent component of binding is evaluated by testing the sensitivity to charge placement within the ion site.
Results and Discussion Calculated pK, Values for RNase A and RNase S. Elec-
trostatic calculations were carried out on both ribonuclease A and ribonuclease S. Despite the enzymatic cleavage in RNase S between residues 20 and 21, the structures of the two forms of the enzyme are very similar and yield similar accessibilities and calculated pKi values for the individual charge sites. However, minor structural differences were expected due to the different crystal forms and different conditions of crystallization. The structures do show minor side-chain rearrangement, the loss of the carboxyl-terminal salt bridge (Val-124 ... Lys-104) in the RNase A structure being the most marked. The calculated fractional accessibility values are listed for RNase A, RNase S, and the S protein, as well as the calculated pKl12 values for the functional groups ionizing in the acidic (Table IA), basic (Table IB), and neutral (Table IC) pH regions, respectively. The value of pKllz is the pH a t which the calculated pK, is numerically equal to the pH corresponding to half-titration of that group.
Asp-14, Asp-83, and Asp-121 are predicted to have pKl12 values less than 3.0 and Asp38 less than 2.0. Individual pK values for acidic residues in the ribonuclease system have not been measured, but low pH transition measurements by Hermans & Scheraga (1961) lead to the assertion that at least one acid function has a pKl12 less than 2.0. The P K , / ~ of Asp14 in RNase S has been determined to be 2.4 (Niu et al., 1979).
Five of the six tyrosine residues will titrate between pH IO and 11. TYI-97 is assumed to be masked on the basis of solvent exclusion. Not only is the Tyr-97 hydroxyl function excluded from solvent but also the entire phenol ring is totally buried. These predictions agree with the proton NMR work of Lenstra et al. (1979) on RNase A. Tyr-73, -76, -92, and - 1 15 were observed to titrate above pH 10.0. However, the resonance assigned to Tyr-25 did not respond to pH changes between IO and 11. Aromatic resonances corresponding to Tyr-97 were not identified.
Lys-41, the active-site lysine, is predicted to have a pKi12 about one unit lower than the other nine lysine residues whose PK,,~ values average about 10.5 in RNase A. This is indicative of a highly positive electrostatic field which is verified by the workof Jentoft et al. (1981) on [13C]methylated lysine residues in RNase A.
Of particular interest are the calculated pKII2 values for the histidine residues and the variation of their effective pKvalues with pH, ionic strength, and active-site ligands. The predicted behavior of all four histidines is very similar in RNase A and RNase S, but His-48 in S protein is affected by the removal of S peptide. The decrease in pKIlz is largely due to the removal of Asp-I4 and the resulting increased solvent acces- sibility. The pKl12 values for these four histidine residues have been determined under a variety of experimental conditions employing both I3C and ‘H NMR. Values at five similar experimental conditions (tenth molar monovalent salt con- centrations) are summarized in Table 11, and low pH per-

4994 B I O C H E M I S T R Y M A T T H E W A N D R I C H A R D S
Table 11: Values of pK,,, Observed by NMR Techniques in the Ribonuclease System
RNase A RNase S S peptide or S protein
histi- 0.3 M 0.2 M 0.2 M 0.2 M 0.2 M 0.15 M HP0,2- dine NaCl 0.2 M NaCl 0.1 M NaCl acetate acetate 0.1 M NaCl acetate D,O acetate + 0.2 M acetate
12 5.79Q 6.Wf (4.49) 6.05'1~ (4.61)h 5.gd 5.7' 6.00big (4.72) 6.3d 6.75e 6.861: 7.03j 48 i i i 6.31a 6.2' 6.13' (4.22) 6.4d 5.3e 5.64: (0.0) 5.961: (0.0)
105 6.72Q 6.635 6.76' 6 . Id 6.6' 6.74' (-) 6.7d 6.54e 6.72' 6.903 119 6.19Q 6.165 6.31 b,g (5.01) 6.2d 6.00' 6.3 b ~ g (5.4) 6.7d 6.We 6.98' (0.0) 7.35' (0.0) Markley (1975). Cohen et al. (1973). 'Walters & Allerhand (1980). Meadows et al. (1968). e Bradbury et al. (1977). f Matthews
& Westmoreland (1973). gGriffin et al. (1973). behavior. 'Titration of histidine-48 is discontinuous in RNase A, except in the presence of acetate (see footnote a). (1976).
Values in parentheses are observed pH-dependint perturbations of.the primary titration Shindo & Cohen
7.0
2 6.0 Q
5.0
RNASE-S
I I I 1 I 1 1 3 5 7 9
PH
FIGURE 3: Calculated pH dependence of the pKi values for the histidine residues of ribonuclease S at ionic strengths of 0.01 (solid lines) and 0.10 (broken lines). On the intersections of this line with the straight lines pH = pKi, the pKl12 values are taken from the histidine curves. The pKint for histidines-12 and -105 is 6.60 corresponding to the N' form. In the absence of charge array interactions, all of these plots would be horizontal.
turbations of the C-2 proton resonance are reported. The calculated variations of pKi with pH for histidines-12, -1 19, -48 and -105 are shown in Figure 3 at two ionic strengths 0.01 and 0.10. In the case of His-105 no low pH inflection has even been reported, and Figure 3 shows that the calculated pKi at both ionic strengths does not deviate more than 0.10 from the pKi,, of 6.6 except at pH values of less than 4. In contrast, the predicted pKi values for His-48, - 1 19, and -1 2 are seen to exhibit significant low pH inflections which agree well with experimental observations.
The observed chemical shift perturbations of the 'H NMR histidine resonances at low pH, 4-5, have been attributed to through space electric field effects of proximal anionic acids: Asp-121 for His-1 19 and His-12; Asp-14 for His-48. These interpretations involving single-charged groups are markedly oversimplified. An anionic acid in the proximity of a positive charge would be expected to have an apparent pK lower than the intrinsic value. Thus calculated interactions for Asp- 14 and Asp-121 show a pKl12 depression to below pH 3.0 (see
A ANION SITE
CENTER POSITIVE @ CHARGE
FIGURE 4: Diagram illustrating the relative locations of the charge sites constituting the active center for RNase S. This plane through the protein is determined by the charge sites of His-1 2, His- 1 19, and Lys-41. Positions labeled A1 and A2 represent two alternative positionings for anions in the active site. Also shown is the coordinate of the center for positive charge of the protein representing the positive pole of the molrnular dipole. These three sites, A l , A2, and the positive center of charges, all fall within 1 A of the defined plane. The magnitude of the monopole in units of net charge and the molecular dipole in Debye units (1 debye = 1 X lo-'* esu cm) are plotted vs. pH in the insert.
Table IA). These two residues cannot be involved in the observed NMR inflections between pH 4 and 5. Detailed analysis of the contribution to the low pH cationic environ- ments of His-119, His-12, and His-48 show more general electrostatic effects due to the long-range overlap of additive Coulombic fields from a number of charged groups.
Active Site in Ribonuclease: An Anion Binding Site. At the isoionic pH (9.2), net charge equals zero, and the measured number of associated anions or cations is zero. Saroff & Carroll (1962) have shown the number of chloride ions bound per mole of RNase A to be zero at pH 9.6, 0.50 at pH 6.6, and 2.0 at pH 4.5 (total chloride concentrations of 0.012, 0.016, and 0.085 M, respectively).
Plots of the electrostatic potential at the protein surface at several ionic strengths show two sites with exceptionally positive potential at pH 6.0. The number of solvent-accessible, high-potential sites increases to at least five by pH 4.0.3 One of the two positive centers identified at pH 6.0 is the active-site cluster, while the second site is approximately 8 A away on
Five anion sites were identified by locating areas of high positive potential outside the protein van der Waals envelope. For the readers information, we give the distance from each site to three titratable groups in the structure: site 1, 4.0 8, to Lys-31, 6.0 8, to Lys-37, and 6.6 8, to Tyr-92; site 2, 4.0 8, to Lys-7, 5.1 8, to Arg-10, and 6.9 8, to Lys-41; site 3, 5.0 8, to His-12, 8.6 8, to Lys-41, and 6.1 8, to His-119; site 4, 4.0 8, to Arg-85, 8.1 8, to Lys-98, and 10.8 8, to Lys-66; site 5 , 4.1 8, to Lys-104, 5.6 8, to His-105, and 6.3 8, to Val-124.

E L E C T R O S T A T I C E F F E C T S I N R I B O N U C L E A S E
the same protein face and aligned in such a way as to suggest a role in orienting or docking a substrate RNA fragment [see Richards (1982)l.
In Figure 4 the relative positions of the active-site charge cluster on the protein surface are shown. Lysine-41, histi- dine-12, and histidine-1 19 have all been implicated in ligand and inhibitor binding reactions and in enzymatic cleavage of substrate (Blackburn & Moore, 1982). Two positions from the potential wntours have been chosen to illustrate the sen- sitivity of these calculations to anion placement in this positive center. These positions correspond closely with crystallo- graphic observations of anion binding. Position A1 is close to the phosphorus atom in the dinucleotide inhibitor UpcA (Wyckoff et al., 1970). Position A2 wrresponds to the divalent sulfate ion intercalated between the activesite histidine res- idues in RNase A.
Of particular interest in evaluating the active site as a cationic center for long-range attraction of negatively charged ribonucleic acid is the protein molecular dipole. The straightforward calculation of the centers of positive and negative charge with respect to the protein coordinates using the calculated pH-dependent charge array shows that the center of positive charge at all pH values falls within the active site (Figure 4). The calculated protein net charge (monopole) vs. pH as well as the pH-dependent molecular dipole is plotted in the insert of Figure 4. Both the monopole and dipole of RNase S favor anion approach to the active site a t pH 6.0, the pH of maximal enzymatic activity. When taken in wn- junction with the two high-potential anion binding sites on the catalytic face of the protein at pH 6.0, this observation suggests an electrostatic mechanism for long-range attraction and orientation of substrate, with the final docking specificity requiring steric fit and solvent exclusion considerations.
The calculated electrostatic potential, expressed in units of kT, in the active site of ribonuclease S at pH values of 8 and 6 is shown in parts A and B of Figure 5 , respectively. The pH-dependent development of the anion binding site is evident. At pH 8, where the two active-site histidines are essentially unprotonated [i.e., pKt12 values of -6.3 (Table IA)], the active-site potential is (2-3)kTwmpared to (5-6)kT at pH 6. Figure 5C illustrates the long-range effect of binding a divalent anion in this site a t pH 6.0. The effect of including two negative charges is damped by an increase in protonation of the active-site histidines. In the following section we treat the response of the protein charge array as a function of pH to the binding of mono- and divalent phosphate ligands at this site. To avoid confusion we have not included the partial occupancies of the four other anion sites, as they exert a negligible effect on the activesite potential. For example, a t pH 5.0 (I = 0.10) the active-site chloride occupancy is pre- dicted to be 0.43. When all five chloride sites are included in the calculation, the predicted total bound anions is 1.65, of which 0.40 is attributed to the active-site position.
Electrostatic Effects of Anion Binding at the Active Site on Proton Uptake and Release. Since the net charge of a phosphate ligand is influenced by and also influences the protonation of its binding domain, we can calculate net proton uptake or release only by considering both components. The observed shifts in apparent proton affinities for the activesite histidine residues in response to the binding of several anionic ligands are tabulated in Table IIIA. With increasing anionic charge on the ligand, the observed pKtl, values are seen to increase from -6 to 8.
Table IIIB gives the computed effective pKt12 values for histidine-12 and -119 when full occupancy ligands are simu-
V O L . 2 1 , N O . 20, 1 9 8 2 4995
FIGURE 5: Calculated electrostatic field for a cross section through the active site of ribonuclease S. See Richards & Wyckoff (1973) for piclures of the protein. The section is perpendicular to they axis at position y = -6. The calculations were made on a square grid I A on a side. The heavily shaded areas are inside the van der Waals envelop of the protein. The field contour interval is I kT. Positive values are given by the solid contour and negative values by dashed contours. As in Figure 2 positive field contours of 2kT and above are lightlyshaded. (Panel A) pH 8.0, anion site@) unoccupied: (panel B) pH 6.0. anion site(s) unoccupied, (panel C) pH 6.0. phosphate in anion site A2. These contours were drawn for an effective ionic strength of zero.

4996 B I O C H E M I S T R Y M A T T H E W AND R I C H A R D S
Table 111: Histidine Residues in the Active Site of Ribonuclease
A. Observed pK,,, Values in the Presence of Several Active-Site Ligands monovalent mono- and divalent
0.10 M 0.1 M NaCl+ 0.1 M NaCl + divalent
NaCl UpCA 0.02 M PO," 0.1 M PO,'- 3'-UMP 3'-CMP 2'-CMP
histidine-12 6.0" 5.86 6,75' 7.15' 6.4 7.4 6 8.06 histidine- 1 19 6.3' 6.1 7.03' 7.63' 7.86 8.0b 8.06
B. Calculated pK,,, Values in the Presence of Bound Mono- or Divalent AnionC c1- c1- P0,2-/HP0,'
unoccupiedd position A1 position A2 position A1 position A 2
histidine-1 2 6.38 6.86 6.80 7.20 7.52 histidine-1 19 6.34 6.64 7.02 6.82 7.24
' Cohen et al. (1973). Positions A1 and A 2 for bound anion placement corresponds to those given in Figure 6. All the calculated pK,,, values were calculated assuming a Debye screening of 0.10; the explicit exclusion of a site bound ion is given as a
Griffin et al. (1973).
reference for comparison with the site-bound cases.
Table IV: Comouted Protonation State of Inorrranic Phosuhate in the Free State and Bound to the Ribonuclease S Active Site'
free bound position 1 bound position 2 a Z i p bound-free
PH PKi Zi PKid Zi PKid Zi position 1 position 2
5.0 Po,- 1.65 -1.00 1.22 -1.00 1.32 -1 .oo 5.4 Po,- 1.83 -1.00 1.55 -1.00 1.62 -1.00
5.8 Po,- 2.12 -1.00 1.82 -1.00 1.84 -1.00
6.2 Po,- 2.43 -1 .oo 1.93 -1.00 1.98 -1.00
6.6 Po,- 2.67 -1.00 2.20 -1.00 2.12 -1.00
7.0 PO,' 2.80 -1.00 2.37 -1.00 2.28 -1.00
p0,z- 5.91 -0.1 1 5.11 -0.43 4.94 -0.53 -0.3 2 -0.42
Po,,- 5.91 -0.24 5.14 -0.65 4.96 -0.73 -0.4 1 -0.49
p0,2- 5.91 -0.44 5.17 -0.81 4.99 -0.86 -0.37 -0.4 2
Po,'?- 5.9 1 -0.66 5.19 -0.87 5.05 -0.93 -0.2 1 -0.27
PO,,. 5.91 -0.83 5.29 -0.95 5.16 -0.96 -0.12 -0.13
Po,- 5.91 -0.92 5.39 -0.98 5.32 -0.98 -0.06 -0.06
' Calculations are reported for Debye ionic strength screening of 0.10. The pKht values for free inorganic phosphate were assigned such that the calculation approximates H,PO, titration behavior (Matthew et al., 1981a). The pKbt values are 1.5 and 4.5 with a charge-site separation of 1.9 A. proton uptake.
Value corresponding to proton release from the phosphate net release into solution requires correction for protein pKi values at half-titration, Le., pK,,, , are 5.1 and 4.9 for bound positions A1 and A2, respectively.
lated at two alternate positions in the active site. The values computed for the unoccupied site are given in column one for reference. These predicted effects due to ligand binding should be viewed as underestimates as no side-chain rearrangements have been allowed to maximize Coulombic interactions. At these interactive distances of less than 5 A, a movement to more realistic chelate geometry involving a reduction in dis- tance of 1 A can easily increase the effects listed in Table IIIB by 20%.
The net release or uptake of protons attributable to ligand binding to the active site of RNase S can be computed by using the increased pKi values of the protein calculated at a given pH in the presence of ligand and the calculated proton release by the ligand. Table IV tabulates the pKi values and proton occupancy (z i ) at six pH values for bound and free inorganic phosphate. It is clear that only the second ionization is relevant in the pH range 4-7. These computations predict the proton release from inorganic phosphate to range from half at pH 5.4 to zero at high pH.
In Figure 6 the solid curve shows the calculated net proton uptake or release from RNase S in response to inorganic phosphate association (Figure 4, position Al , I = 0.01). This net proton flux is further resolved into protein uptake and phosphate release. While the absolute magnitude of these calculated contributions will vary with anion placement, ionic strength, and site occupancy, it is significant that the pH dependence and magnitude of proton flux closely follow the experimental values of Hummel & Witzel (1966) over the entire pH range. The insert in Figure 6 shows the proton uptake or release observed when saturating quantities of 2'-
CMP or 3'-CMP are added to RNase A. These data support our calculated sensitivity to exact charge placement.
Electrostatic Free Energy of Anion Binding at the Active Site. The additional electrostatic stabilizations of the overall protein charge array introduced by anion binding are cast as pH-dependent association constants, log K,,,,, = AAG,,/ (2.3RT). These pH-dependent association constants are plotted in Figure 7 for a monovalent ion such as chloride and for inorganic phosphate at ionic strengths of 0.01 and 0.10. Figure 7 also shows the experimental association constants for inorganic phosphate, 2'-CMP, 3'-CMP, and 3'-UMP (An- derson et al., 1968). The predicted pH dependence for in- organic phosphate accurately follows the observed pH de- pendence, and the overall predicted magnitude of the elec- trostatic component of phosphate binding is 75-80% of the experimental value. (As discussed above, the magnitude of the predicted effect can increase at least 20% in response to specific placement or side-chain rearrangement.) The broken lines drawn through the nucleotide data correspond to the predicted pH dependence of inorganic phosphate, demon- strating that these anions follow the pH-dependent behavior observed and predicted for inorganic phosphate. The pH-in- dependent component of 3'-UMP and 3'-CMP must be about 2.5 kcal/mol while the specific interactions of 2'-CMP must account for 4.0 kcal/mol. A portion of the difference in the 2' and 3' binding energy can be attributed to the different electrostatic field at the position of the 2'- and 3'-phosphate groups. The nature of such a shift is shown by curves 2 and 2' in Figure 7. These calculations are in agreement with the conclusions of Flogel et al. (1975) "that the thermodynamic

E L E C T R O S T A T I C E F F E C T S I N R I B O N U C L E A S E
5.0-
4.0
0 Y
V O L . 2 1 , N O . 2 0 , 1 9 8 2 4997
-
1.0 n-l
*---- . . 0 - 3’-CMP ,
I.
f W Y
2 a 0 3
2 0 I- O a: a
0. W v)
W -J W
a
a
0.
PROTEIN-PROTON /I’ / UPTAKE ’1’2 \ -0’
PHOSPHATE PROTONRELEASE
I I I I 1.0 5.0 6.0 7.0
PH FIGURE 6: Calculated proton uptake or release induced by full oc- cupancy of anion site A1 by phosphate at Z = 0.01 as a function of pH (solid curve). This calculated uptake or release is resolved into the dashed curve: protein-proton uptake (curve 2) and phosphate ion proton release (curve 3). The insert shows the observed proton uptake or release for 2’-CMP (0) and 3’-CMP (0) (Hummel & Witzel, 1966).
discrimination between specific ligands (i.e., those derived from cytosine or uracil) is primarily based on the phosphate moiety as manifested in the magnitude of the electrostatic interactions”.
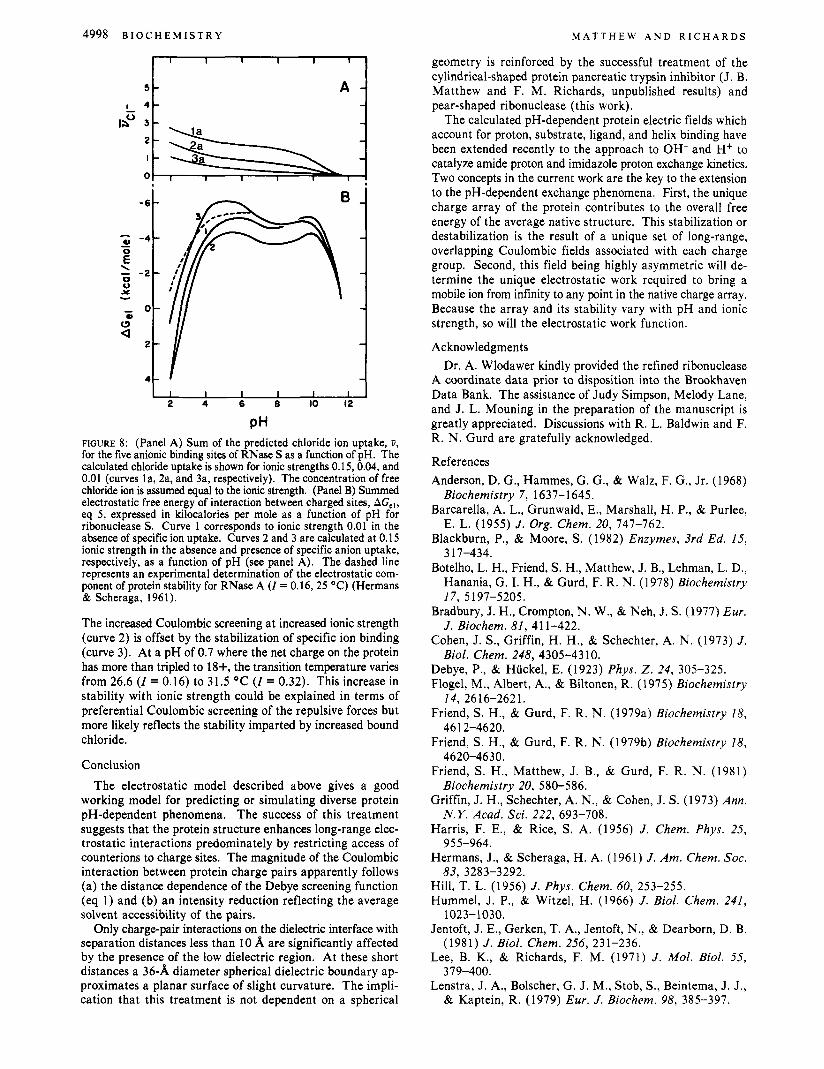
pH-Dependent Electrostatic Free Energy. The calculated contributions of electrostatic free energy to the stability of the native structure for ribonuclease S at ionic strengths of 0.01 and 0.15 (eq 5) are shown in Figure 8, panel B, curves 1 and 2, respectively. At all but most acidic pH values, the free energy is negative, indicating substantial stabilization. The pH-dependent free energy of stabilization calculated at 0.10 ionic strength is not shown but lies between curves 1 and 2 through the entire pH range. Measurements of the transition temperature with changing pH at constant ionic strength (Z = 0.16) lead to a pH-dependent component for the transition free energy whose maximum value is 5.4 kcal/mol at pH 5-7. This pH dependence of protein stability observed by Hermans & Scheraga (1961) for RNase A is included in Figure 8. For the pH range of 4-7 the observed and predicted values at Z = 0.15 are within 1 kcal, but the acid limb of the calculated curve drops more steeply than the experimental one. This is consistent with the fact that the calculation employs the lin- earized Poisson-Boltzmann approximation which does not allow for the uptake of bound chloride ion and the resultant stabilization.
Curve 3 shows the pH-dependent stabilization ( I = 0.15) when the calculated partial occupancies of the five anion sites identified at the solvent interface for RNase S are included in the calc~lation.~ When specific chloride uptake is included, the difference between the experimental and calculated sta- bilities at Z = 0.15 is less than 0.5 kcal at pH 6.0, and the difference in the acid limb is reduced by 70%.
Figure 8, panel A, shows the predicted chloride uptake by RNase S at ionic strengths of 0.15,0.04, and 0.01 (curves la,
3*0 t 2*nl 1.0
+ 3‘-UMP -i
6.0 7.0 5*0 pH 4.0
FIGURE 7: pHdependent additional electrostatic stabilization produced by the binding of univalent and divalent anions in the RNase S active site (position Al ) expressed as pH-dependent association constants. Curves 1 and 1’ are for a univalent anion such as chloride at ionic strengths of 0.10 and 0.01, while curves 2 and 2’ are calculated for the titratable phosphate ion. Data are those of Anderson et al. (1968) determined spectrophotometrically for the pH-dependent binding of inorganic phosphate (O), 3‘-CMP (O), 3’-UMP (+), and 2’-CMP (A). The broken lines drawn through the nucleotide data are the calculated pH-dependent phosphate curves translated up to demon- strate the common pH dependence of these phosphate compounds. (The protonation of the pyrimidine ring nitrogen in the acid region has not been taken into account in these calculations but would lead to a decrease in binding for CMP at pH values near 4.0.)
2a, and 3a). These values represent the monovalent anion site occupancies summed over the five high potential sites. The data of Saroff & Carroll (1962) agree with the predicted anion uptake between pH 9.6 and 4.5 and its variation as a function of ionic strength. The data below pH 4.0 (Loeb & Saroff, 1964) were obtained at total chloride concentrations less than 0.04, yet the measurements indicated that RNase A binds more than three chloride ions. Our calculations below pH 4.0 at the same ionic strength would predict half that amount. Because these calculations are based on the crystal structure, it is not suprising that they do not accurately predict the marked increase in chloride affinity of ribonuclease in the pH range 2-4. These ion binding studies were carried out at 25 OC where the midpoint for the acid-induced conformational transition is approximately pH 2.0 (Hermans & Scheraga, 1961). At low pH, where repulsion interactions begin to dominate the charge array stability, conformational dis- placements or rearrangements which relieve unfavorable in- teractions or facilitate anion uptake would be expected.
Experimental determinations of the thermal transition of RNase A have been measured at two pH values as a function of ionic strength (Hermans & Scheraga, 1961). At pH 6.5 the transition temperature for RNase A varies between 62 and 63 OC for the ionic strength range 0.01-0.50. The calculated stabilities (curves 1-3) at pH 6.5 show that two opposing effects lead to this insensitivity to increasing ionic strength.
4998 B I oc H E M I S T R Y
5 -
M A T T H E W A N D R I C H A R D S
I I I 1 I 1
A -
2
I
0 i s s J
2 4 6 8 IO 12
PH FIGURE 8: (Panel A) Sum of the predicted chloride ion uptake, 8, for the five anionic binding sites of RNase S as a function of pH. The calculated chloride uptake is shown for ionic strengths 0.15, 0.04, and 0.01 (curves la, 2a, and 3a, respectively). The concentration of free chloride ion is assumed equal to the ionic strength. (Panel B) Summed electrostatic free energy of interaction between charged sites, AG,,, eq 5, expressed in kilocalories per mole as a function of pH for ribonuclease S . Curve 1 corresponds to ionic strength 0.01 in the absence of specific ion uptake. Curves 2 and 3 are calculated at 0.15 ionic strength in the absence and presence of specific anion uptake, respectively, as a function of pH (see panel A). The dashed line represents an experimental determination of the electrostatic com- ponent of protein stability for RNase A ( I = 0.16,25 "C) (Hermans & Scheraga, 1961).
The increased Coulombic screening at increased ionic strength (curve 2) is offset by the stabilization of specific ion binding (curve 3). At a pH of 0.7 where the net charge on the protein has more than tripled to 18+, the transition temperature varies from 26.6 ( I = 0.16) to 31.5 OC ( I = 0.32). This increase in stability with ionic strength could be explained in terms of preferential Coulombic screening of the repulsive forces but more likely reflects the stability imparted by increased bound chloride.
Conclusion The electrostatic model described above gives a good
working model for predicting or simulating diverse protein pH-dependent phenomena. The success of this treatment suggests that the protein structure enhances long-range elec- trostatic interactions predominately by restricting access of counterions to charge sites. The magnitude of the Coulombic interaction between protein charge pairs apparently follows (a) the distance dependence of the Debye screening function (eq 1) and (b) an intensity reduction reflecting the average solvent accessibility of the pairs.
Only charge-pair interactions on the dielectric interface with separation distances less than 10 A are significantly affected by the presence of the low dielectric region. At these short distances a 36-A diameter spherical dielectric boundary ap- proximates a planar surface of slight curvature. The impli- cation that this treatment is not dependent on a spherical
geometry is reinforced by the successful treatment of the cylindrical-shaped protein pancreatic trypsin inhibitor (J. B. Matthew and F. M. Richards, unpublished results) and pear-shaped ribonuclease (this work).
The calculated pH-dependent protein electric fields which account for proton, substrate, ligand, and helix binding have been extended recently to the approach to OH- and H+ to catalyze amide proton and imidazole proton exchange kinetics. TWO concepts in the current work are the key to the extension to the pH-dependent exchange phenomena. First, the unique charge array of the protein contributes to the overall free energy of the average native structure. This stabilization or destabilization is the result of a unique set of long-range, overlapping Coulombic fields associated with each charge group. Second, this field being highly asymmetric will de- termine the unique electrostatic work required to bring a mobile ion from infinity to any point in the native charge array. Because the array and its stability vary with pH and ionic strength, so will the electrostatic work function.
Acknowledgments Dr. A. Wlodawer kindly provided the refined ribonuclease
A coordinate data prior to disposition into the Brookhaven Data Bank. The assistance of Judy Simpson, Melody Lane, and J. L. Mouning in the preparation of the manuscript is greatly appreciated. Discussions with R. L. Baldwin and F. R. N. Gurd are gratefully acknowledged.
References Anderson, D. G., Hammes, G. G., & Walz, F. G., Jr. (1968)
Barcarella, A. L., Grunwald, E., Marshall, H. P., & Purlee,
Blackburn, P., & Moore, S. (1982) Enzymes, 3rd Ed. 15,
Botelho, L. H., Friend, S. H., Matthew, J. B., Lehman, L. D., Hanania, G. I. H., & Gurd, F. R. N. (1978) Biochemistry
Bradbury, J. H., Crompton, N. W., & Neh, J. S. (1977) Eur.
Cohen, J. S . , Griffin, H. H., & Schechter, A. N. (1973) J .
Debye, P., & Huckel, E. (1923) Phys. 2. 24, 305-325. Flogel, M., Albert, A., & Biltonen, R. (1975) Biochemistry
Friend, S. H., & Gurd, F. R. N. (1979a) Biochemistry 18,
Friend, S. H., & Gurd, F. R. N. (1979b) Biochemistry 18,
Friend, S . H., Matthew, J. B., & Gurd, F. R. N. (1981)
Griffin, J. H., Schechter, A. N., & Cohen, J. S. (1 973) Ann.
Harris, F. E., & Rice, S. A. (1956) J . Chem. Phys. 25,
Hermans, J., & Scheraga, H. A. (1961) J . Am. Chem. SOC.
Hill, T. L. (1956) J . Phys. Chem. 60, 253-255. Hummel, J. P., & Witzel, H. (1966) J . Biol. Chem. 241,
Jentoft, J. E., Gerken, T. A., Jentoft, N., & Dearborn, D. B.
Lee, B. K., & Richards, F. M. (1971) J . Mol. Biol. 55,
Lenstra, J. A., Bolscher, G. J. M., Stob, S., Beintema, J. J., & Kaptein, R. (1979) Eur. J . Biochem. 98, 385-397.
Biochemistry 7 , 1637-1645.
E. L. (1955) J . Org. Chem. 20, 747-762.
3 17-434.
17, 5 197-5205.
J . Biochem. 81, 41 1-422.
Biol. Chem. 248, 4305-43 10.
14, 2616-2621.
46 12-4620.
4620-46 3 0.
Biochemistry 20, 580-586.
N.Y. Acad. Sci. 222, 693-708.
955-964.
83, 3283-3292.
1023-1 030.
(1981) J . Biol. Chem. 256, 231-236.
3 79-400.

Biochemistry 1982,
Loeb, G. I., & Saroff, H. A. (1964) Biochemistry 3,
Markley, J . L. (1975) Biochemistry 14, 3546-3553. Matthew, J. B., Friend, S. H., Botelho, L. H., Lehman, L. D.,
Hanania, G. I. H., & Gurd, F. R. N . (1978) Biochem. Biophys. Res. Commun. 81, 416-421.
Matthew, J. B., Hanania, G. I. H., & Gurd, F. R. N. (1979a) Biochemistry 18, 1919-1928.
Matthew, J. B., Hanania, G. I. H., & Gurd, F. R. N. (1979b) Biochemistry 18, 1928-1936.
Matthew, J. B., Friend, S . H., & Gurd, F. R. N. (1981a) Biochemistry 20, 57 1-580.
Matthew, J. B., Friend, S . H., & Gurd,-F. R. N. (1981b) Interactions between Iron and Protein in Oxygen and Electron Transport, ElsevierjNorth-Holland, New York.
Matthews, C. R., & Westmorland, D. G. (1973) Ann. N.Y. Acad. Sci. 222, 240-253.
Meadows, D. H., Jardetsky, O., Epand, R. M., Ruterjans, H. H., & Scheraga, H. A. (1968) Proc. Natl. Acad. Sci. U.S.A.
Nagasawa, M., & Holtzer, A. (1964) J . Am. Chem. SOC. 86,
Niu, C. H., Matsuura, S. , Shindo, H., & Cohen, J. S. (1979)
18 19-1 826.
60, 766-772.
5 3 1-5 38.
J . Biol. Chem. 254, 3788-3796.
21, 4999-5009 4999
Richards, F. M. (1982) Brookhaven Symp. Biol. No. 32. Richards, F. M., & Wyckoff, H. W. (1973) Atlas of Mo-
lecular Structure I . Ribonuclease-S, Oxford University Press, Ely House, London.
Richarz, R., & Wiithrich, K. (1978) Biochemistry 17 ,
Saroff, H. A., & Carroll, W. R. (1962) J . Biol. Chem. 237,
Shindo, H., & Cohen, J. S . (1976) J . Biol. Chem. 251,
Shire, S . J., Hanania, G. I. H., & Gurd, F. R. N. (1974)
Tanford, C., & Kirkwood, J. G. (1957) J . Am. Chem. SOC.
Tanford, C., & Roxby, R. (1972) Biochemistry 11,
Wall, F. T., & Berkowitz, J. (1957) J . Chem. Phys. 26,
Walters, D. E., & Allerhand, A. (1980) J . Biol. Chem. 255,
Wyckoff, H. W., Tsernoglou, D., Hanson, A. W., Knox, J. R., Lee, B., & Richards, F. M. (1970) J . Biol. Chem. 245,
2263-2269.
33 84-3 387.
2648-2652.
Biochemistry 13, 2967-2974.
79, 5333-5339.
2 192-2 195.
114-122.
6200-6 204.
305-328.
Torsional Motion and Elasticity of the Deoxyribonucleic Acid Double Helix and Its Nucleosomal Complexest
I. Hurley, P. Osei-Gyimah, S. Archer, C. P. Scholes, and L. S. Lerman*
ABSTRACT: Torsional thermal oscillations of the DNA double helix within the electron paramagnetic resonance (EPR) time scale (10-10-10-3 s) as indicated by a rigid, intercalating probe are much smaller in the spacer segment between nucleosomes in chromatin than in long, free DNA molecules. Still smaller DNA oscillation is indicated in intact nuclei and yet smaller if the nuclei have been treated with glutaraldehyde. The values of EPR measurements are not affected by the loading density of probe. If the probe were capable of substantial oscillations or movement different from that of the helix, those oscillations would be expected to dominate the spectra when movement of the helix is restrained. We conclude that the correlation time for torsional movement of free DNA inferred from EPR spectra is characteristic of the double helix and that there is
R e v i o u s work in this laboratory (Robinson et al., 1979) has shown the rotational correlation time (TJ reported by electron paramagnetic resonance (EPR) spectra of bound spin-labeled ethidium depends upon the size of the DNA molecule with which it is associated. The inferred T, was found to increase with increasing DNA length up to a limiting value of 30 ns
From the Department of Biological Sciences, State University of New York at Albany, Albany, New York 12222 (I.H. and L.S.L.), the Department of Chemistry, Rensselaer Polytechnic Institute, Troy, New York (P.0.-G. and S.A.), the Department of Physics, State University of New York at Albany, Albany, New York 12222, and the Center for Biological Macromolecules, State University of New York at Albany, Albany, New York 12222 (I.H., C.P.S., and L.S.L.). Received March 16, 1982. This work was supported by Grants PCM 772558304 and PCM 81 11321 from the National Science Foundation.
no significant independent motion of the probe. The corre- lation time for the DNA double helix in molecules longer than approximately 500 base pairs is close to 30 ns, corresponding to an elastic constant of 1.5 X ergs cm for deformation by twisting. The motions observed in chromatin are consistent with a model in which spheres of 50-60-A radius are connected by simple elastic rods with the length of spacer DNA and the same elastic constant. The spin-labeled ethidium probe has been characterized in detail by nuclear magnetic resonance, infrared, fluorescence, and visible light spectroscopy. The binding equilibria are consistent with the hypothesis that strongly immobilized probe molecules are preferentially bound to spacer DNA.
for double helices 500 base pairs (bp) or longer. These results were seen to be in agreement with the predictions of a model of DNA torsional motion in which the double helix is modeled as a set of coaxial disks linked with torsional springs immersed in a viscous medium (Robinson et al., 1980b). An alternative conjectural explanation for the observed dependence upon length might be that the correlation time increases with in- creasing length up to a limit imposed by hypothetical inde- pendent motion of spin-labeled ethidium relative to the DNA base pairs to which it is bound and does not truly reflect the internal motion of long DNA helices. We will refer to the conjectural independent motion as wobble.
We have now obtained EPR spectra of spin-labeled ethidium bound to DNA in systems in which the motion of each DNA segment is restricted. An approximate upper limit to the extent
0006-2960/82/0421-4999$01.25/0 0 1982 American Chemical Society