Embed Size (px)
Citation preview

Bar Ilan University
School of Engineering
VLSI Lab
Animation Graphic Engine
Lee Cohen
Yair Naperstak
Idan Shtainmet
Final Project – Forth Year
Computer Engineering
Project Leader: Mr. Moshe Doron
Academic Supervisor: Prof. Wimer
October 2009

2
Contents Page
1. Introduction 4
2. Project targets and problem at hand 5
3. Theoretical background 6
4. Development environment - Hardware & Software 9
5. Design Flow 10
6. System Block Diagram 11
7. AGE Block Diagram 12
7.1. Internal Memories 13
7.2. Data Types & formats 14
8. Detailed AGE Functionality & Implementation
8.1. Overall view of the design 15
8.2. Pipe stages
8.2.1. Multiplication of real world vertices by transformation matrix 17
8.2.2. Multiplication of triangle outward normal vector by transformation matrix 21
8.2.3. Projection & Vertex to Pixel 24
8.2.4. Hidden triangles test + D, L*N & 1/C calculation 27
8.2.5. Slopes calculation 31
8.2.6. Scanning a triangle for Rasterization 34
8.2.7. Pixel visibility test 38
8.2.8. Set pixel Color & write to Frame-Buffer 42
9. Functional Verification 44
10. Analyzing Performance 45
11. Encountered problems and solutions 46
12. Conclusions and Summary 47
13. Ideas for continuation 48
14. Bibliographic List 49
15. Appendices
15.1. Appendix A – Altera's VGA DE2-70 schematics 50
15.2. Appendix B – Two Frame buffers schematic 52
15.3. Rasterization algorithm results 53

3
Figures:
Fig. 1 – Scan conversion of a triangle using linear edge function 6
Fig. 2 – Visible vs. hidden pixels 7
Fig. 3 – Triangle illumination – alignment between source light & triangle normal vectors 7
Fig. 4 – Triangle-based 3D image 8
Fig. 5 – Transformation Matrices 8
Fig. 6 – System Block Diagram 11
Fig. 7 – AGE Block Diagram 12
Fig. 8 – AGE Global State Machine / Data Flow Diagram 16
Fig. 9 – Vertex Transformation Pipe Stage 20
Fig. 10 – Normal Transformation Block Diagram 23
Fig.11 – Vertex To Pixel Pipe Stage 26
Fig. 12 – Hidden Triangles & D Calculation Stage 30
Fig. 13 – Slopes Calculation Stage 33
Fig. 14 – Triangle Vertices and edges slopes 34
Fig. 15 – Rasterization Algorithm 36
Fig. 16 – Rasterization FSM 37
Fig. 17 – Pixel Visibility Decision Stage 41
Fig. 18 – Pixel color & Depth Calculation & write to FB 43
Tables:
Table1 – Internal Memories 13
Table2 – Data Types & Formats 14
Table3 – Pixel Visibility Calculations 40

4
1. Introduction
The Animation Graphic Engine (AGE) is a three-dimensional (3D) Computer Graphics
Hardware Accelerator, performing basic Animation operations (3D graphics manipulation) and
pixel-related backend Rasterization operations, the basic steps required to render a polygon-
based (Triangles)
3D graphics model generating photo-realistic images in real time.
3D graphics pipeline polygon-based 3D graphic rendering is the process of converting the
geometric description of a 3D model (or a virtual world) to a two-dimensional image (a 2D
array of picture elements or pixels) that can be displayed on a computer monitor.
Each pixel represents a color value consisting of red, green, and blue (RGB) components.
System-level description
Commonly-used Computer graphics subsystem Architecture consists of host CPU-based
Geometry Processing and dedicated Hardware Accelerator for Animation and Rasterization.
The AGE can be used by Desktop/Laptop Computers as well as by Game Consoles, PDAs or
Mobile Smart-Phones. It can be embedded as an integral part of the system Hardware or be
implemented as an attached USB2.0 Device.
Graphic Application like OpenGL, defines the object to be displayed, both its geometry and
color.
Performs triangulation of its surface, calculating the vertices edges and the triangles that
comprise the object. Assigns colors to every vertex. Sends the following initial data to the USB
port:
- List of vertices comprising the triangulated object’s surface.
- List of triangles given by their enclosing edges in cyclic order and their RGB color.
- An outward normal vector to every triangle (set to unit length).
- A box of the real world where the object exists, given by their coordinates.
- The screen view port where the object should be displayed, given by the window location
within the
screen (in pixels).
- A light unit vector.
- Background RGB colors for the frame buffer.
The Application then performs an animation session where the above object with its world box
are moving and rotating in space according to some externally defined trajectory. The animation
related data is transferred to the USB port at a rate of 24 frames/Sec and it comprises of a
4 4× matrix representing object’s new position and an indicator which one of the projection
planes XY, XZ or YZ will be displayed in the screen view port.

5
The AGE, following the completion of the initialization stage, performs the animation at a rate
of 24 frames/Sec by applying hardware operations whose mathematical definitions and
hardware implementation are described subsequently. The result of every animation step is the
contents of a Frame Buffer comprising of the predefined screen view port's pixels associated
with RGB colors each. The Frame Buffer data is addressed directly to the graphics board of the
Host Computer.
2. Project targets and problem at hand
The goal of the project was to develop and implement a Hardware Core that can perform the
basic rendering operations defined for handling polygon-based three dimensional (3-D) graphic
images.
Computer graphics subsystems today are based on very fast multiple compute cores, having
common memory pool executing the rendering operations in floating point.
This architecture is power-hungry, requires cooling systems and suited for wall-plugged
Devices.
There is a lack of low power; battery operated graphical cores that can serve Mobile Game
Consoles, Personal Digital Assistant s and Smart-Phones.
This project is a good start for a solution to the "mobile graphics" syndrome.
Continuation along this track will eventually provide a quality solution to the problem.

6
3. Theoretical background
Every time you see a 3D animation on the computer you actually see a bunch of vertices
mapped as polygons, those polygons are painted by the computer or AGE to build a 2D picture
after projection.
Vertices are points in 3D space:
Vertices can describe a polygon:
A polygon can be described by the plane equation:
In the above picture we can see three Vertices that describe a Triangle in the 3D space.
Using vertices and mapping them to triangles, one can represent every object in the 3D space on the
computer.
Since the computer screen is capable to display only 2D plane, projection is needed in order to
transpose from the 3D space to the 2D plane.
Next, all the triangles that are represented by the vertices need to be converted to 'real' triangles.
This is done by painting all the pixels within the area of the triangle:

7
Fig. 1 – Scan conversion of a triangle using linear edge function
Following the completion of the 2D drawing, Z Buffer is being used to make the hidden and
invisible pixels disappear.
Fig. 2 Visible vs. hidden pixels
This stage decides according to the depth of each object which is closer to the viewer and hence
needed to be painted and which object is far away and needed to be eliminated from the displayed
image.
Light source is being used to illuminate the displayed image. Any triangle within the image is given
the right amount of light intensity, according to its Normal (vector perpendicular to triangle surface)
alignment with the Light source vector.

8
Fig. 3 – Triangle illumination – alignment between source light & triangle normal vectors
At this point a complete picture has been created.
An example of a triangle-based 3D picture:
Fig. 4 – Triangle-based 3D image
Model viewing & transform – using rotations matrices multiplication
Every 3D drawing can be transformed (rotated and displaced) very easily. All that is needed is to
multiply the vertices by a 4X4 transformation matrix:
Normal

9
Fig. 5 – Transformation Matrices

10
4. Development environment - Hardware & Software
4.1. MicroSoft Office Visio Tool has been used to draw the Schematics and Block Diagrams of
AGE High Level Design.
4.2. Hardware Low Level Design has been performed using the Verilog Hardware Description
Language (HDL).
4.3. Simulation and Logical Verification of the Design has been performed using both Cadence
Incisive and Mentor Graphics ModelSim Simulators.
4.4. Altera Quartus II FPGA Software Development Environment (SDE), has been used to
migrate the Design into a FPGA (Field Programmable Gate Array) Board and
perform HW Debug Sessions.
4.5. Altera FPGA Development Board DE2-70 was used as the Target Hardware Platform for
implementing the AGE Core in a Programmable (FPGA) Device.
4.6. Agilent Logic Analyzer was a very useful tool for Hardware Debug.

11
5. Design Flow
• Received Requirements for the AGE Core, consisting of the graphical input/output data
formats and the mathematical equations of the graphical operations needed for rendering
polygon based Three-Dimensional Images.
• Wrote the AGE Core Specification
• Performed High-Level Design (Architecture/Block Diagrams & Execution Flow Diagrams)
• Performed Low-Level Design, employing the Verilog HDL
• Simulated and verified logical design, using Cadence Incisive & Mentor Graphics
Simulators
• Mapped the design into the Altera FPGA Board
• Performed Hardware debug on the FPGA Board using Board's debug features and Agilent
Logic Analyzer/Oscilloscope
• Ran the graphical Demo and presented results on a VGA Monitor

12
6. System Block Diagram
Figure 6 describes the USB AGE Device system block diagram.
The AGE Core consists of the GPU (Graphic Processing Unit) and Memories blocks.
The AGE is connected to the external device through a USB port.
The project focuses on the GPU (Graphic Processing Unit) and the Memories sections.

13
Fig. 6 – System Block Diagram
7. AGE Block Diagram
Figure 7 describes the AGE - Memories and GPU, including USB port and DMA to load the
initialization data needed to execute the animation process.
Fig. 7 – AGE Block Diagram

14
7.1. Internal Memories
Notations:
V- Number of vertices
T- Number of triangles
R- Screen resolution
Name Word
(bits)
Type Size Description
World Vertex
Memory
32 Dual-Port
SRAM
96b*V Holds vertices coordinates in three
consecutive cells( X, Y, Z. X -the first
cell, Z the third cell )
Triangle Outward
Normal Memory
32 Single-
Port
SRAM
96b*T Holds triangles coordinates in three
consecutive cells (A, B, C. A -the first
cell, C the third cell )
Color Memory 24 Single-
Port
SRAM
24b*T Holds triangles colors in RGB format
(one Byte for every color element - R ,G
,B)
Screen Vertex
Memory
24 Simple
Dual-Port
SRAM
24b*V Holds the vertices in screen coordinates-
pixels.
Each cell holds both X & Y coordinates
(Y-12 LSB, X-12 MSB)
Triangle Memory 48 Dual-Port
SRAM
48b*T Holds each triangle’s three vertices’
addresses.
(For 100K Triangles and 50K vertices
we get 48 bits per cell)
Screen Coordinate
Reciprocal Memory
16 ROM 16b*4096 Holds
2 1
1
Y Y−, in 1.15 Fixed Point
format.
FIFO _AB 81 FIFO 81b*32 Holds two normals and triangle’s index.
(A normal-31 LSB, index - 17 MSB)
FIFO _D 96 FIFO 96b*32 Holds D, reciprocal of one normal and
L*N
(D-31 LSB, L*N - 31 MSB)
Z-Buffer 32 Dual-Port 32b*R Holds each pixel’s depth value.

15
SRAM
Frame-Buffer 24 Dual-Port
SRAM
24b*R Holds each pixel’s color, to be written to
the screen.
Table1 – Internal Memories
7.2. Data Types & Formats
In this section we describe the various Data we have in our implementation and their
format.
Data Type Size
(bits)
Description
World
coordinate
Signed Fixed
Point Integer
32 Element describing the position of a vertex in the
“real world”, in 16.16 Fixed Point format each
coordinate.
A vertex comprises of three coordinates, resulting in
96 bits per vertex
Normal Signed Fixed
Point Integer
32 Outward normal vectors to every triangle, in 16.16
Fixed Point format each element.
A Normal vector comprises of three elements,
resulting in 96 bits per vector
Light unit
vector
Signed Fixed
Point Integer
32 A vector describing the direction of the light source,
in 16.16 Fixed Point format (each element)
A Normal vector comprises of three elements,
resulting in 96 bits per vector
Color Fixed Point
Integer
24 A color of a triangle represented by RGB format (1
byte for every color element - R, G, B)
Screen
coordinate
Fixed Point
Integer
12 A pixel coordinates on the screen.
Each pixel comprises of two coordinates (X&Y),
resulting in 24 bits per pixel
Slopes Signed Fixed
Point Integer
27 Slopes of the triangles are calculated from screen
coordinates, resulting in 12.15 Fixed Point format.
Slopes Signed Fixed 16 Rom is used to avoid division operation while

16
Reciprocal Point Integer computing slopes. Holds
2 1
1
Y Y−, in 1.15 Fixed Point
format.
Plane binary 2 An indicator to the plane we choose to watch.
00: X-Y, 10: Y-Z, 11: X-Z . (MSB,LSB)
Table2 - Data Types & Formats

17
8. Detailed AGE functionality & Implementation
The architecture of the AGE chip design is “pipelined” based.
This section describes in detail every stage of the pipe, mainly:
•••• Stage Functionality.
•••• Hardware considerations.
•••• Hardware components selected and used in the design (Memories, Multipliers etc.)
•••• Hardware implementation of the required functionality.
8.1. Overall view of the design
Figure 8 is an overall view of the pipe design.
It is actually the AGE Global State Machine / Data Flow Diagram.
The major stages in the pipe are:
• Initialization (where object data is downloaded).
• Vertices transformation (transformation matrix multiplication).
• Normals transformation (transformation matrice multiplication).
• World coordinate to screen coordinate transformation.
• Decision on triangle visibility (according to the Normal) + D & 1/C & L*N calculation
• Calculation of triangles slopes.
• Rasterization algorithm.
• Decision on pixel visibility & color (depth calculation of every pixel).
• Write to Frame-Buffer (if pixel is visible).

18
19
Fig. 8 - AGE Global State Machine / Data Flow Diagram
8.2. Pipe stages
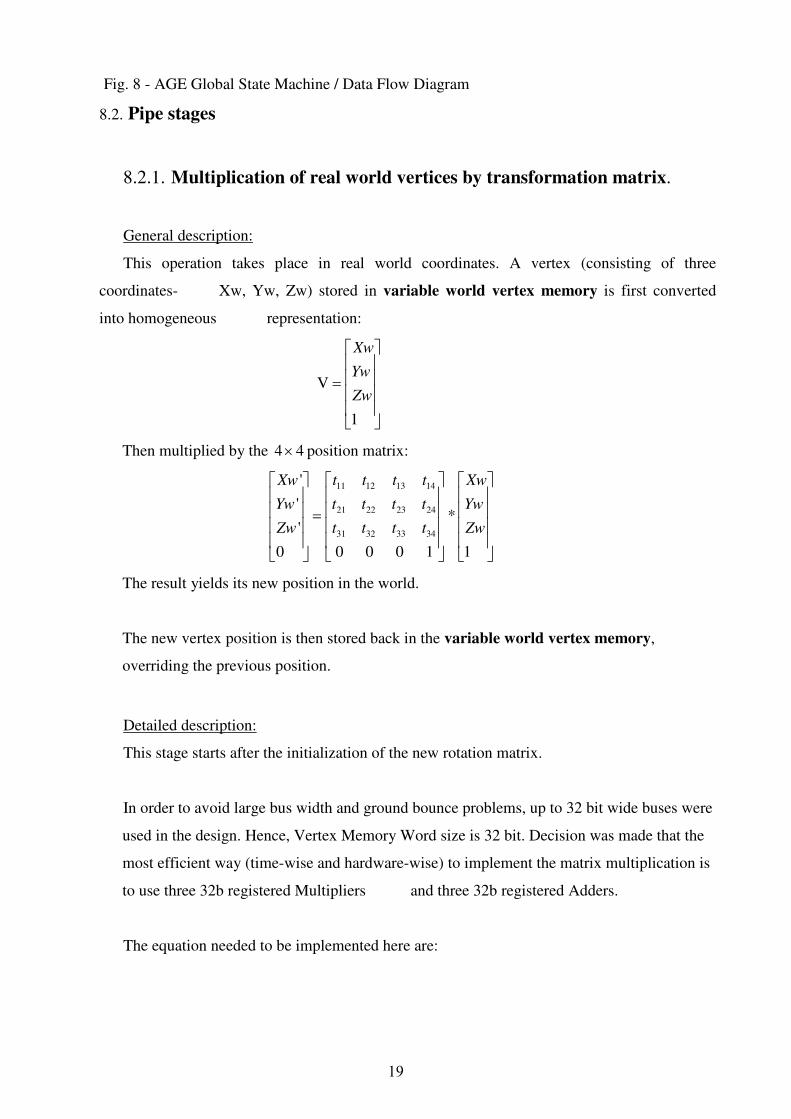
8.2.1. Multiplication of real world vertices by transformation matrix.
General description:
This operation takes place in real world coordinates. A vertex (consisting of three
coordinates- Xw, Yw, Zw) stored in variable world vertex memory is first converted
into homogeneous representation:
V
1
Xw
Yw
Zw
=
Then multiplied by the 4 4× position matrix:
11 12 13 14
21 22 23 24
31 32 33 34
'
'
'
0 0 0 0 1
Xw t t t t
Yw t t t t
Zw t t t t
=
*
1
Xw
Yw
Zw
The result yields its new position in the world.
The new vertex position is then stored back in the variable world vertex memory,
overriding the previous position.
Detailed description:
This stage starts after the initialization of the new rotation matrix.
In order to avoid large bus width and ground bounce problems, up to 32 bit wide buses were
used in the design. Hence, Vertex Memory Word size is 32 bit. Decision was made that the
most efficient way (time-wise and hardware-wise) to implement the matrix multiplication is
to use three 32b registered Multipliers and three 32b registered Adders.
The equation needed to be implemented here are:

20
11 12 13 14
21 22 23 24
31 32 33 34
' * * *
' * * *
' * * *
X w t Xw t Yw t Zw t
Y w t Xw t Yw t Zw t
Z w t Xw t Yw t Zw t
= + + +
= + + +
= + + +
Sequential implementation has been chosen, as follows:
First X world coordinate is being read and multiply it with 11 21 31, ,t t t using three Multipliers
and the result is being stored in the Multipliers’ Registers.
Y world coordinate is being read on the next clock and multiply it with 12 22 32, ,t t t ,
(Multiplexers are used to change the matrix values) again using the three Multipliers. At the
same time the results stored in the Multipliers’ Registers from the previous multiplication
(the X multiplication) is now added with 14 24 34, ,t t t , using three Adders, and stored in the
Adders Registers.
(Note: even though normally a 32b with 32b multiplication yields a 64b result, here the
matrix rotation values are not bigger than 1. the Scaling and Translating values can be
bigger than 1, but it’s the Software responsibility to keep the object ” inside the world box”
which is represented by 32 bit. Hence, the resulting transformation is always 32b and not 64b)
Z coordinate is being read on the next clock and multiply it with 13 23 33, ,t t t The result is
being stored in the Multipliers Register, and at the same time the previous result of the
multiplier is added (the Y multiplication) with the content of the Adder Register
(Multiplexers are used to change the Adders input from 14 24 34, ,t t t to the Adders’ Registers),
and store it in the Register, overwriting the pervious value.
So far, the following values have been stored in the three Adders’ registers:
11 12 14
21 22 24
31 32 34
1 * *
2 * *
3 * *
reg t Xw t Yw t
reg t Xw t Yw t
reg t Xw t Yw t
= + +
= + +
= + +
Now all that is left to do is to add, on the next clock, the value stored in the Multipliers’
Register with the value stored in the adders’ registers, thus completing the matrix
multiplication.

21
The result is now written back to the vertex memory, overwriting the previous values of the
vertex.
In addition, two of the three coordinates are also stored in registers, to be used in another
pipe stage - the “vertex to pixel conversion” stage.
The two coordinates are being chosen according to a 2 bit plane indicator we receive from
the software:
• 00 means the X-Y plane, so we store the X and Y coordinates.
• 10 means the X-Z plane, so we store the X and Z coordinates.
• 11 means the Y-Z plane, so we store the Y and Z coordinates.
This stage is done and moves to the IDLE state when all the vertices have been transformed,
as indicated by a comparator which compares the RD_counter to the 3*Number_of _vertices
(as every vertex is stored in the memory in 3 consecutive addresses -X, Y, Z), a value given
to us beforehand by the software.
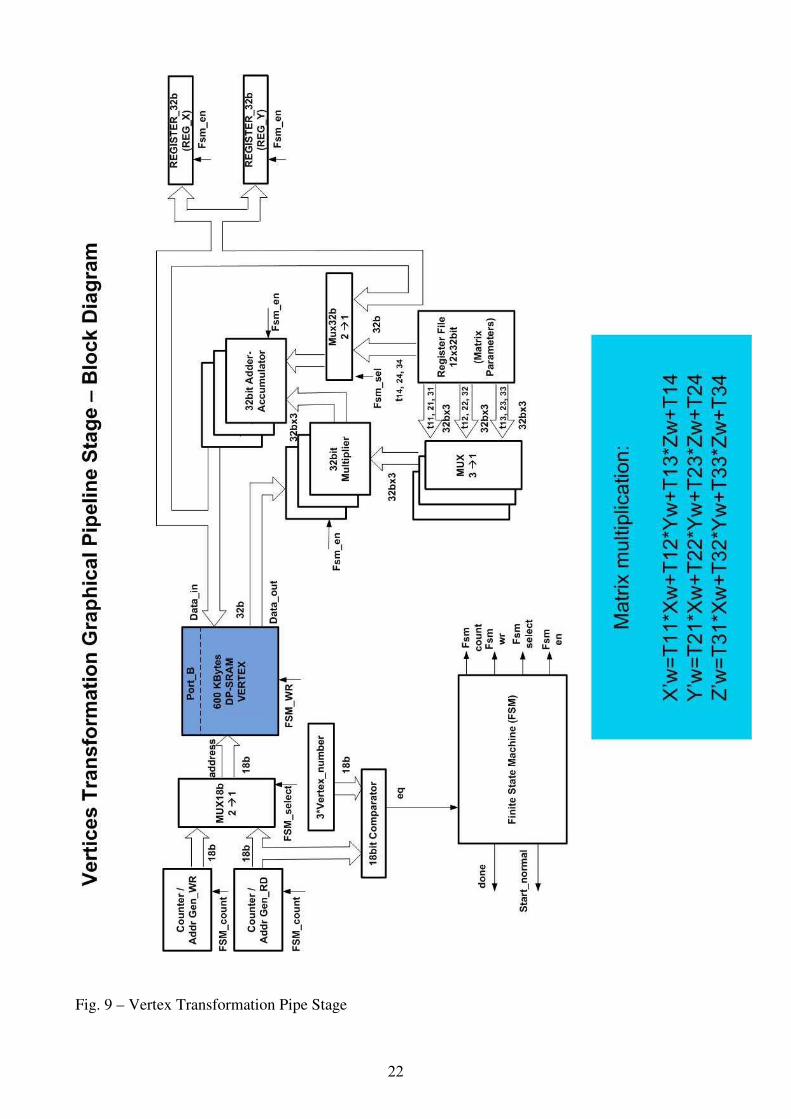
Figure 9 describes the High-Level design of this stage.
22
Fig. 9 – Vertex Transformation Pipe Stage

23
8.2.2. Multiplication of triangle outward normal vector by transformation
matrix.
General description:
As the object is changing position, the outward normal vectors of its triangles are
changing correspondingly. This change is obtained by converting first the vector
stored in the variable triangle outward normal memory into homogeneous
representation:
V
0
A
B
C
=
Then it multiplied by the 4 4× position matrix:
11 12 13 14
21 22 23 24
31 32 33 34
'
'
'
0 0 0 0 1
A t t t t
B t t t t
C t t t t
=
*
0
A
B
C
The result yields its new Normal values in the world.
The result is then stored back in the variable triangle outward normal memory,
overriding the previous normal.
The vector ( ), ,A B C is initially set to unit length by the application software. Its
length is then maintained unit since transformation matrix preserves vector length
(Assumption: in this implementation, animation excludes scaling of world and
perspective projections).

24
Detailed description:
This stage starts after the vertex transformation stage has multiplied 2 vertices, so
when the first normal is transformed there will be a complete transformed triangle (3
vertices + normal) for the next stages of the pipe to start working.
Preserving bus width limitation to 32b, the Normals are also stored in a memory of
32b Word size. Hence, normal transformation implementation is almost identical to
the vertices transformation.
There are two major differences:
1. Since the normal must maintain unit length after the transformation, displacement
is not performed – only rotation,
i.e. the last column of the matrix is not added, so the homogeneous representation
of the normal is ( ), , ,0A B C unlike the vertex homogeneous representation which
is ( ), , ,1xw yw zw .
2. When the new normal values, are written back to the memory, the normal
Parameters (A, B, C) are also in registers to be used in another pipe stage - the
“Decide on hidden triangles” stage.
Figure 10 describes the High-Level design of this stage.

25

26
Fig. 10 – Normal Transformation Block Diagram
8.2.3. Projecting triangle on viewing plane & Convert every vertex to pixel
coordinates.
General description:
Since the 3D object is projected on a 2D screen plane, the depth coordinate which is
perpendicular to the projection plane is dropped. Assume without loss of generality
that this is ZW coordinate.
The projected world coordinate ( ),XW YW is converted into a screen coordinate
( ),XS YS by the transformation:
( )( )( )( )
min min
min min
*
*
XS xs XSF xw xw
YS ys YSF yw yw
= + −
= + −
Where:
XSmin - the minimum screen X coordinate.
YSmin - the minimum screen Y coordinate.
XWmin - the minimum world X coordinate.
YWmin - the minimum world Y coordinate
XSF & YSF - a scaling factor, given by:
( ) ( )max min max minXSF xs xs xw xw= − −
( ) ( )max min max minYSF ys ys yw yw= − −
Where:
XSmax - the maximum screen X coordinate.
YSmax - the maximum screen Y coordinate.
XWmax - the maximum world X coordinate.
YWmax - the maximum world Y coordinate

27
The screen coordinates thus obtained are stored in the variable screen view port
vertex memory. The scaling factor of the above transformations is vertex and
triangle independent and can therefore be delivered by the software once per frame
and stored in a local register.
Detailed description:
This stage starts every time the “vertex transformation” stage has finished
transforming a vertex and has stored two coordinates for this stage in the dedicated
registers.
Projecting of the 3-D object into the 2-D screen is done by the “vertex
transformation” stage, storing two of the three coordinates (X, Y and Z) according to
the “Plane” indicator, as mentioned in the “vertex transformation” detailed
description.
Since the calculation of the equation needed in this stage takes much less time than
the equations in the “vertex transformation” stage takes and since only after “vertex
transformation” completes transforming a vertex, this stage can start, there is no need
to calculate XS and YS simultaneously. Hence, we can save Hardware by
calculating them sequentially, using only one Subtractor, one Multiplier and one
Adder.
(NOTE: as mentioned above, although we relate here to X and Y coordinates, as we
“see” the X-Y plane, this may change according to the plane indicator. e.g. if we
chose the X-Z plane, the Y register will hold the Z coordinate and we will convert
the Z coordinate into screen coordinate).
First the YW coordinate is converted as follows:
1. Calculating the subtraction ( )minyw yw− and store the result in a register.
2. Calculating the multiplication ( )min*YSF yw yw− and store the result in a
register.
3. Calculating the addition minys + ( )min*YSF yw yw− .
The result is then stored in a 12b register.
Using a multiplexer, the input coordinate is switched to XW, and the process is
repeated using the X values.

28
The final result is then stored in the Screen Coordinate Memory, which has 24b
Word size (YS is stored as the 12b LSB and XS as the 12b MSB).
Since the “vertex to pixel” conversion is plane-dependant, there is a need to know
which values to use for the conversion (e.g. for X-Z plane - the Z scale factor, which
may be different from the Y scale factor).
Hence, we use again the plane indicator as a “select” input for multiplexer that routes
two out of three values needed for the conversion.
Figure 11 describes the High-Level design of this stage.

29

30
Fig. 11 – Vertex to Pixel Pipe Stage
8.2.4. Deciding on hidden triangles + D, L*N & 1/C calculation
General description:
Decision is taken according to the Normals whether the triangle is hidden from the
viewer, a case where rasterization of the triangle is ruled out, thus saving a lot of
computations.
The decision is done by observing the outward normal vector ( ), ,A B C of the
triangle.
It is certainly hidden from observer’s eye if:
• 0C < For X-Y plane.
• 0B < For X-Z plane.
• 0A < For Y-Z plane.
After ruling out the possibility that the triangle is hidden, the D value of the triangle,
the 1/C value (for X-Y plane) and the L*N light vector are calculated for the next
stages of the pipe (see Detailed description for further elaboration)
The value of D in the plane presentation-
0Ax By Cz D+ + + =
This value is required later for Z-depth calculations. It is obtained by-
( )D Ax By Cz= − + +
Where the point ( ), ,x y z is taken as one of triangle’s vertices. The vector ( ), ,A B C is
initially set to unit length by the application software. Its length is then maintained
unit since transformation matrix preserves vector length (Assumption: in this
implementation, animation excludes scaling of world and perspective projections).
The L*N calculation is simply the dot product of the light vector and the Normals,
given by:
* * *Lx A Ly B Lz C+ +

31
The index number of the triangle + A, B and 1/C (for X-Y plane) + L*N are then
stored in two FIFO memories.
Detailed description:
This stage starts every time the “Normal transformation” stage has finished
transforming the Normals of a triangle and has stored them in the dedicated registers.
The decision on triangle visibility is done by checking the MSB of the appropriate
Normal (as the Normals are represented in two’s complement), according to the
“plane” indicator.
If the MSB is 1, the normal has a negative value, the vector is pointed away from the
viewer and the triangle is hidden from the viewer.
Once the decision was taken that the triangle is not hidden, its index is sent to the
"slope calculation" and "rasterization" stages.
Since the rasterization stage is most time consuming, and there is no way to decide
how long the rasterization of a single triangle would take (depending on its size and
shape), it is the bottleneck of the pipe (see Detailed description of that stage). For
this reason it was decided that in order to save time later, some rasterization and
color calculations, will be performed in this stage.
The two equations that need to be implemented are:
( )D Ax By Cz= − + +
L ALx BLx CLx= + +
A single 32b Multiplier is being used. One input is connected to the Normals (A, B,
C) and the other input is connected alternately to the coordinate (x, y, z) and the light
vector
(Lx, Ly, Lz).

32
The correct vertex coordinates are received through the triangle index, which is
connected to the Triangle Memory address input. The Triangle Memory acts as a
pointer to each triangle's three vertices. Here we only need one of the vertices.
(NOTE: since this stage also reads from Vertex Memory independently from "Vertex
Transformation" stage, the Vertex Memory is a Dual-Port Memory)
Every multiplication result is stored in registers (one for D and one for L*N), and
than added with the previous result, to come up after three multiplication with the
requested Values – D & L*N
(NOTE: unlike the previous mathematical implementations, here the ADDER is not
registered, and its combinatorial output is connected directly to the Multiplier input,
making the implementation more Asynchronous).
Another calculation that was implemented here in order to save time later is the
division
1/A (for Y-Z plane) or 1/B (for X-Z plane) or 1/C (for X-Y Plane) according to the
"plane" indicator. The other two Normals are also sent to the next stages.
All this data is stored in two FIFOs . One 81b FIFO holds the two Normals and the
triangle index (the two Normals are the 64 LSB, the triangle index is the 17 MSB).
The other FIFO is of 96b width and holds D, L*N and 1/C (D is the 32b LSB, L*N is
the 32b MSB).
It was decided to use FIFO and to store a number of triangles data and not simply to
store one triangle data while holding the pipe until the rasterization of a triangle is
over, to avoid rasterization stage forced wait (stall), a case that may arise if
consecutive triangles are "hidden", which is not uncommon since in an average
object up to third of the triangles might be invisible.
The optimal depth of the FIFO is to be determined empirically. A 32 deep FIFO is
being used in the design.
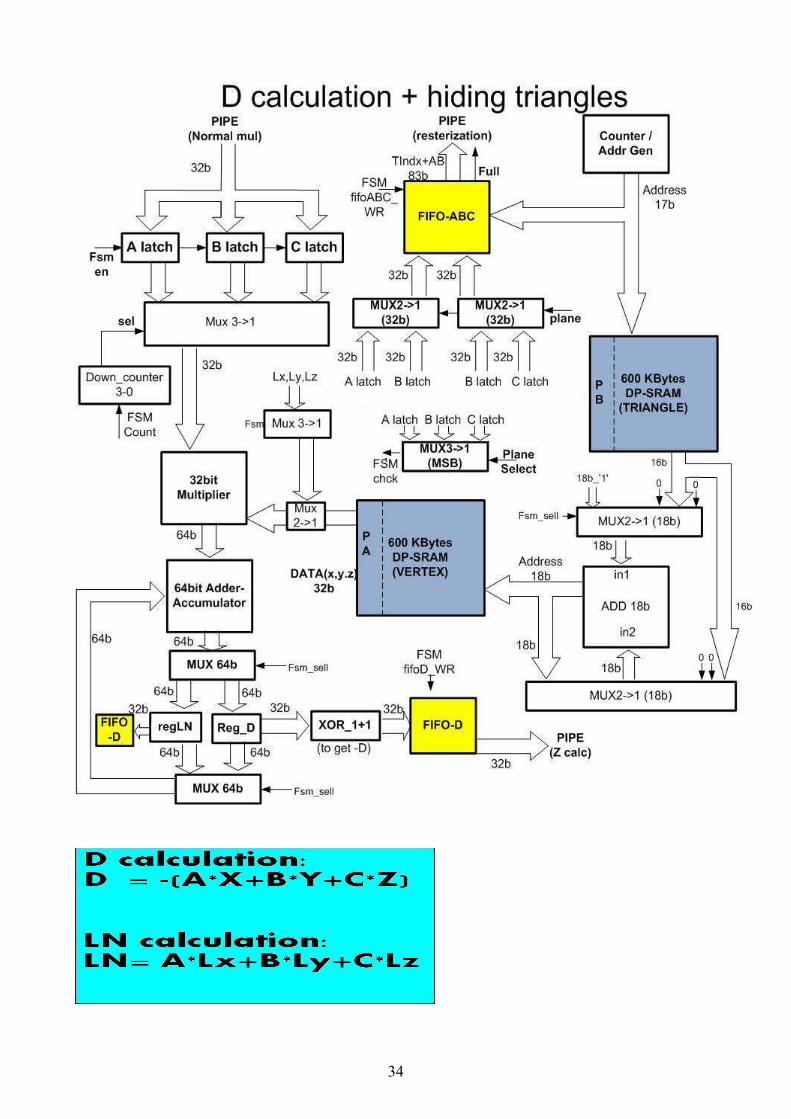
Figure 12 describes the High-Level design of this stage.

33
34

35
Fig. 12 – Hidden Triangles + D & LN Calculation Stage
8.2.5. Slopes Calculation
General description:
As a preliminary step before the actual rasterization process, there is a need to
calculate the three slopes of the three edges comprising our triangle. The needed
value is the change in X for every unit step in Y, so the actual computation is:
2 1
2 1
X X
Y Y
−−
Detailed description:
This stage starts as long as there is a triangle data stored in the FIFO (FIFO not
empty signal).
In order to avoid a Division operation, which is time and Hardware consuming, this
computation is performed in screen rather than world coordinate, in the expense of
precisions. The advantage of division in screen coordinates is in the possibility to
implement division as multiplication:
2 1
2 1
1*X X
Y Y−
−
Avoiding the need for Hardware Divider.
Since the range of screen coordinates is limited to 1024 or 2048 at most, all
denominator fractions can be pre-calculated and stored in appropriate ROM memory
prior to starting the animation.
The data stored in the ROM is fixed point 16b [1.15] format (+1 is represented by
0111…).
The three screen vertices of the triangle are accessed using the triangle index. The
index is connected as the Triangle Memory address bus input. The Triangle Memory

36
serves as a pointer to the triangles’ three screen vertices, and so is connected to the
address input for the Screen Vertex Memory.
(NOTE: this stage reads only from the Screen Vertex Memory, while “vertex to
pixel” stage writes only to it, hence it is a simple Dual-Port memory, with one read
port and one write port.
Since this stage also reads from Triangle Memory independently from "D
Calculation" stage, the Triangle Memory is a Dual-Port Memory)
Having the three vertices, the slope is computed as follows:
The 2 1Y Y− computation serves as the address input for the ROM, which than return
the value:
2 1
1
Y Y−
It is connected to a 16b multiplier, which than computes:
2 1
2 1
1*X X
Y Y−
−
The process is repeated for the three slopes.
Since the Rasterization also needs to sort the vertices according to their Y value, the
computed three 2 1Y Y− possibilities, enables to do that by storing the MSB of the
results in three DFF.
Figure 13 describes the High-Level design of this stage

37

38
Fig. 13 – Slopes Calculation Stage
8.2.6. Scanning a triangle for Rasterization.
General description:
This is the most time consuming step of the pipeline.
Having the three pixels comprising the triangle, there is a need to find all the pixels
that are inside the triangle, to color and write them into the frame buffer (if they pass
the
Z-Depth test), i.e. there is a need to "fill" the triangle with pixels. This is called the
"Rasterization" process.
The scanning of the triangle is done by an algorithm which runs from the bottom of
the triangle to its top, where in every line it runs from the left slope to the right slope.
Detailed description:
This stage starts as soon as the three slopes of the triangle are calculated.
Fig. 14 – Triangle Vertices and edges slopes
Figure 14 illustrates a triangle whose vertex screen coordinates and edge slopes have
already been calculated and stored in appropriate registers. The first step finds the
vertex with the smallest Y screen coordinate (VERy_L). Two edges are emanating

39
from this vertex, one upward to VERy_m and one upward to VERy_H, with known
slopes which have been calculated before, denoted by slopeLM and slopeLH,
respectively. The last slope between VERy_m and VERy_H, is called slopeMH.
These slopes have been calculated previously. All of them were sorted according to
their Y screen coordinates.
In order to scan the Triangle it is split it into two Triangles: low_tri and high_tri.
Triangle rasterization process starts from the lowest vertex of the low triangle
portion.
The pixel residing on the LM edge is calculated 1st and then keep adding pixels
horizontally all the way to the pixel residing on the opposite slope. Y is incremented
by 1 and the process continues until the middle vertex is reached. Then, a switch
from slope LM to slope LH is performed and the process of filling pixels on the high
triangle all the way to triangle top (high vertex) continues.
Two special cases need individual handling:
1. The two lowest vertices have the same height (lower triangle turns into a line).
2. All the vertices have the same height (both triangles turn into a line).
Appendix C contains test results for the algorithm.
Figure 15 describes the High-Level design of this stage.

40
Rasterization Algorithm

41
Fig.15 Rasterization Algorithm
The Rasterization process is controlled by the following FSM: (Fig. 16)

42

43
8.2.7. Decide on pixel visibility
General description:
After determined that a pixel is part of a visible triangle, there is a need to determine
whether this specific pixel is visible.
This is accomplished using a Z-buffer – a memory the size of the Frame-buffer.
Initially, the content of the Z-buffer is reset, per frame, to store the smallest integer
( 312− in 2’s complement representations of 32-bit fixed point numbers). Then every
pixel in its turn is looked for the real world zw coordinate corresponding to that
pixel. If its value is smaller than the value found in Z-buffer (hence it is closer to
viewer’s eye), the color calculation of that pixel is progressing. In addition, the depth
value of that pixel is update. Otherwise, the pixel is ignored and next pixel is
considered.
The calculation of Z-value is made by first translating the pair ( ),pixel pixel
xs ys of the
given pixel into ( ),pixel pixel
xw yw by the transformation:
( )( )
min min
min min
1/ *
1/ *
pixel pixel
pixel pixel
Xw xw XSF xs xs
Yw yw YSF ys ys
= + −
= + −
Where:
XSmin - the minimum screen X coordinate.
YSmin - the minimum screen Y coordinate.
XWmin - the minimum world X coordinate.
YWmin - the minimum world Y coordinate
IXSF & IYSF –inverse of the scaling factor, given by:
max min max min1/ ( ) / ( )XSF xw xw xs xs= − −
max min max min1/ ( ) / ( )YSF yw yw ys ys= − −
Where:
XSmax - the maximum screen X coordinate.
YSmax - the maximum screen Y coordinate.
XWmax - the maximum world X coordinate.
YWmax - the maximum world Y coordinate

44
Once ( ),pixel pixel
xw yw is known, its depth in the real world, pixelzw , is obtained from
the plane equation:
0pixel pixel pixelAxw Byw Czw D+ + + =
Yielding:
( ) ( )1pixel pixel pixel
zw C Axw Byw D= − + + .
Detailed description:
This stage starts every time the Rasterization is sending a pixel.
The implementation of these equations includes 5 multiplication operations and 4
adding operations, but since they are executed sequentially, only 2 Multipliers
connected to 2 Adders, are being used.
Here too, only the Multipliers are registered, whereas the Adders are connected
directly to the Multipliers input, making the implementation more Asynchronous.
The different Multipliers and Adders inputs are chosen with multiplexers controlled
by the FSM.
As described previously, the values D and 1/C have been already calculated and
stored together with A, B (for X-Y plane) in the FIFO.
The scaling factor of the above transformations is vertex and triangle independent
and can therefore be delivered by the software once per frame and stored in a local
register.
The order of the mathematical operations in the Multipliers and the Adders is
described in the following tables:
MULTIPLIER 1:
in2 in1
XSp-XSmin 1/XSF 1

45
XWp A 3
(AX+BY+D) -1/C 6
MULTIPLIER 2:
in2 in1
YSp-YSmin 1/YSF 1
YWp B 3
Adder 2:
in2 in1
1/YSF(YSp-Ysmin) Ywmin 2
BYWp D 4
Table 3 – Pixel Visibility Calculations
(The order of the execution is numbered in the leftmost column. If the same numbers
appears in two different modules, it means the two operations are executed
simultaneously).
Adder 1:
in2 in1
1/XSF(YSp-Ysmin) Xwmin 2
A*XWp B*YWp+D 5

46
Figure 17 describes the High-Level design of this stage.

47
48
Fig. 17 – Pixel Visibility Decision Stage
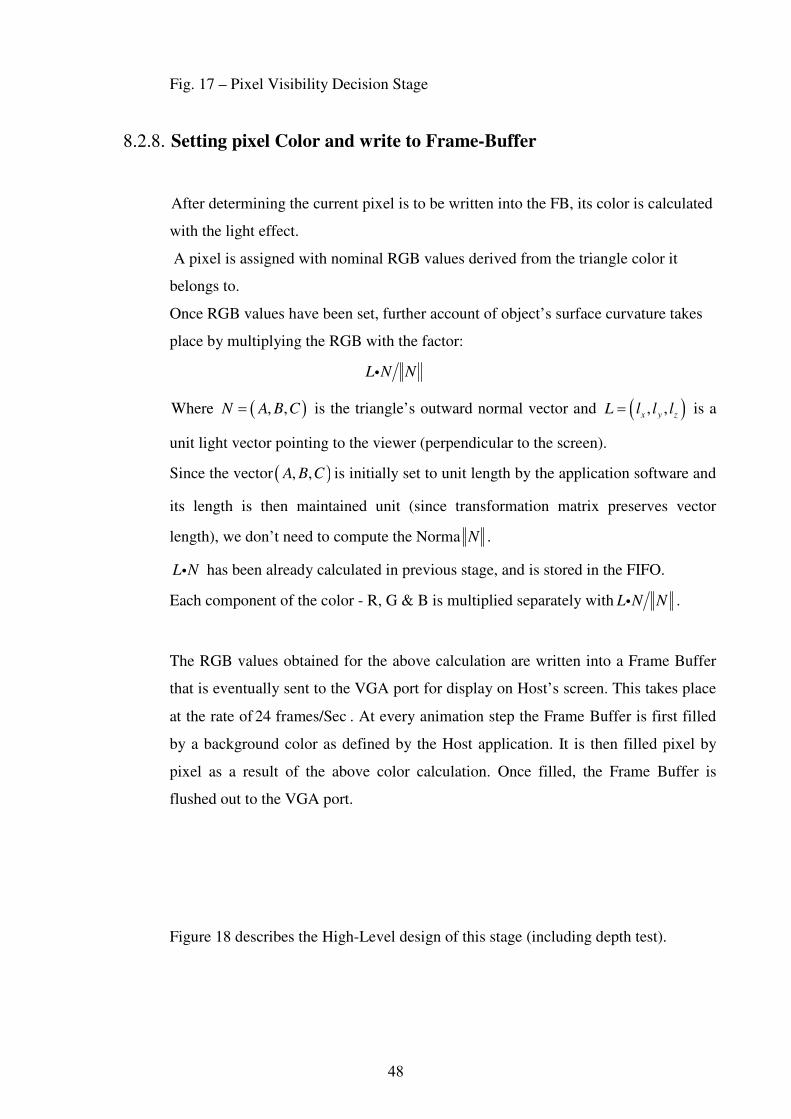
8.2.8. Setting pixel Color and write to Frame-Buffer
After determining the current pixel is to be written into the FB, its color is calculated
with the light effect.
A pixel is assigned with nominal RGB values derived from the triangle color it
belongs to.
Once RGB values have been set, further account of object’s surface curvature takes
place by multiplying the RGB with the factor:
L N Ni
Where ( ), ,N A B C= is the triangle’s outward normal vector and ( ), ,x y z
L l l l= is a
unit light vector pointing to the viewer (perpendicular to the screen).
Since the vector ( ), ,A B C is initially set to unit length by the application software and
its length is then maintained unit (since transformation matrix preserves vector
length), we don’t need to compute the Norma N .
L Ni has been already calculated in previous stage, and is stored in the FIFO.
Each component of the color - R, G & B is multiplied separately with L N Ni .
The RGB values obtained for the above calculation are written into a Frame Buffer
that is eventually sent to the VGA port for display on Host’s screen. This takes place
at the rate of 24 frames/Sec . At every animation step the Frame Buffer is first filled
by a background color as defined by the Host application. It is then filled pixel by
pixel as a result of the above color calculation. Once filled, the Frame Buffer is
flushed out to the VGA port.
Figure 18 describes the High-Level design of this stage (including depth test).

49
Fig. 18 – Pixel color & Depth Calculation & write to FB
(NOTE: the Pixel_index value, which serves as the address of the pixel for both the
Frame-Buffer and the Z-buffer, is given to us by the Rasterization stage, and is
determined according to the maximum X & Y screen coordinates along with the
pixel coordinates)

50
9. Functional Verification
To check our AGE design, we downloaded it to a programmable board, Altera’s DE2-70
FPGA, taking advantage of the board’s VGA output.
(Appendix A contains the board’s VGA schematic and timing requirements for 640X480
screen resolutions)
(Note: The VGA driver was given to us by Mr. Benjamin Abramov and for that we thank
him).
To replace the Software initialization step, we’ve initialized the memories of the FPGA with
the data of an object, and used the board’s toggle switches to choose between a few
rotations/translation matrices we’ve prepared in advance.
Memory resources were a serious issue, and even with the DE2-70 1Mb memory we had to
limit ourselves in three ways:
1. Maximum resolution of 128X128.
2. using only 12 bit RGB (4 bit to each color element- R, G, B), instead of 24b.
3. Simple objects.
After arduous work on debugging the design on the board, we were able to see the object on
screen and animate it according to our matrices.

51
10. Analyzing Performance
After analyzing the object’s behavior during the animation session, we could discern a few
problems:
1. A repeated flicker on the screen.
This is not an error in our design. The flicker is caused by incompatibilities between our
design and the VGA driver - the screen is reading from the Frame-Buffer while we are in
the middle of writing to it. The problem can be solved using two Frame-Buffers. While
the screen is reading from one Frame-Buffer, we write to the other and vise-versa. We
could not implement the solution due to lack of memory resources on the FPGA board.
Appendix B describes the schematics of the two buffers implementations.
2. After the animation has ran for a few minutes, we could discern “decay” in the Normal
& Vertices values, resulting in a slight movement of the vertices, but more severely,
triangles are disappearing from our view too soon (not passing the “visible triangle”
test”).
This is caused by the fact that we implement the Vertices and Normal matrix
multiplications in Fixed-Point format rather that Floating-Point format. To fix this

52
problem we would need to change the Fixed-Point of the Normal so that the fraction part
would be represented by more bits (as the Normal is unit length we can actually go to
1.30 Fixed-Point representation of the Normal rather than 16.16 format that we use).
3. Color issues.
Some color problems could be seen during the animation session especially with the
light source effect.
This is connected to the previous problem since the RGB 24b color is multiplied by
L*N,
And since the N is decaying, it affects the color. Another possible source for the problem
is the use of only 12b per RGB rather that 24b.
(As a side note we mention that the RGB format is not very useful for color effects, and
is only suitable for very basic ones. This can also be another possible source for our
problem)
11. Encountered problems and solutions
During the course of the project, we've encountered the following problems:
11.1. Bus size management – avoid using very wide busses to prevent ground bounce and
noise interferences within the ASIC or FPGA Devices.
Problem resolved by reading sequentially, rather than concurrently, vertices, normal
vectors, etc. from memories.
11.2. Memory organization – handle multiple memory accesses
11.3. Avoid divisions (time & resource consuming) – use ROM.
11.4. Normal vectors must be of unit magnitude in order to preserve correct lighting but
scaling is not supported – can corrupt lighting and damage Z-buffer. Limitation.
11.5. Inaccuracies inflicted by setting world coordinated and matrix parameters to signed
32bits with decimal point between the two 16bits parts.

53
11.6. Inaccuracies inflicted by the ROM division parameters – sign bit + 15 magnitude bits.
11.7. Very limited memory resources on FPGA Board. The Cyclon II FPGA device has only
~480Kbits of internal memory. It forced us to support only small viewport having
128x128 screen pixels and 12bits RGB/pixel rather than 24bits/pixel.

54
12. Conclusions and Summary
Devoting considerable time and effort to understand the mathematical requirements for the
graphical implementation, allowed us to better understand the implications of Hardware
implementation, with its associated limitations and better analyze the outcome/results.
Combining the Verilog HDL behavioral flexibility with the guaranteed performance of Altera
Quartus II MegaFunctions Blocks, enabled efficient Programming of the FPGA on the
Development Board.
Adhering to the Design Documentation requirements (Spec, Hi-Level Design, Flow Diagrams,
etc.),
enabled us to incorporate the entire, detailed design intricacies into the Project Book.
This will serve as a good baseline for continuation projects like AGE Backend and designing
an AGE USB device.
Good Teamwork is the key to fruitful and successful design!

55
13. Ideas for continuation
• As this design is a graphic engine, it can be used as a platform to implement many (more
sophisticated) Graphical Operations such as: shading, scaling, multiple light sources, etc.
• The AGE design can be implemented in ASIC, using Cadence Encounter Synthesis tool,
Low-Power Kit, System-On-Chip Functional Verification Kit and VirageLogic 65nm
Libraries.
• Incorporate the AGE into the USB2.0 Device System (µController, Protocol Engine,
SDK) and design a Vendor Specific AGE Device.
• Exercise Prof. Baranov High-Level Front End and Synthesis Tools on AGE Design.

56
14. Bibliographic List
a. Three-dimensional computer graphics architecture BIU_BU/surveys2.pdf
b. 3-D Accelerator on Chip 3-D Accelerator on Chip.pdf
c. OpenGL Matrix manipulations http://www.morrowland.com/apron/tutorials/gl/gl_matrix.php
d. AGE Programming Model AGE Programming
Model.Rev1.doc

57
15. Appendices
15.1 Appendix A
Altera's DE2-70 FPGA board VGA schematics and timing

58
VGA Controller Timing
hblank
Active Pixels
640x480 VGA Horizontal Timing
640x480 VGA Vertical Timing
RGB
hsync
Front
porchBack
porch
640 pixels
48
16
160
vblank
Active linesRGB
vsync
Front
porchBack
porch
480 lines
31
11
44
800 pixelsPixel
clock rate
25.175MHz
96
2
Line Frequency
25.175MHz:800 =
31.469KHz
Field Frequency
31.469KHz:525 =
59.94Hz
Image dimension H
Idh = 640 – 2aa a
160 + 2a
16 + a
Back
porch48 + a
Front
porch
Image dimension V
Idv = 480 – 2bb b
44 + 2b
11 + bFront
porch
Back
porch31 + b

59
15.2. Appendix B
VGA controller with 2 frame buffers schematic

60
15.3. Appendix C
Below are some results of the rasterisation algorithm, for 11X11 Frame buffer:
10
9 X
8
7
6
5
4
3
2 X
1
0 X
0 1 2 3 4 5 6 7 8 9 10
(The 3 'X'es are the input vertices of triangle.)
10 10
9 9
8 8
7 7
6 X 6 X
5 5
4 4
3 3
2 2
1 1
0 X X 0 X X
0 1 2 3 4 5 6 7 8 9 10 0 1 2 3 4 5 6 7 8 9 10
As the above figure presents, the algorithm overcomes the "two lowest vertices are in the
same height" special case.

61
10 10
9 9
8 8
7 7
6 6 X
5 5
4 4
3 3 X
2 2
1 1
0 X X X 0 X
0 1 2 3 4 5 6 7 8 9 10 0 1 2 3 4 5 6 7 8 9 10
10
9 X X
8
7
6
5 X X
4
3
2
1
0 X X
0 1 2 3 4 5 6 7 8 9 10 0 1 4 5 9
The same way with 3 vertices that produces a line instead of a triangle.
• Notice that the algorithm have a tendency to draw one pixel to the left,
This is due to rounding problem.
Since its only one pixel, it won't affect the display.