Embed Size (px)
Citation preview
June 30, 2020
Chris DuBois | SVP, Protein Practice | IRIAnne-Marie Roerink | Principal | 210 Analytics
ANIMAL PROTEIN REIGNS HIGH AMID PANDEMIC; WHAT’S NEXT?
Mid-Year Meat Department Performance Review
© 2020 Information Resources Inc. (IRI). Confidential and Proprietary. 2
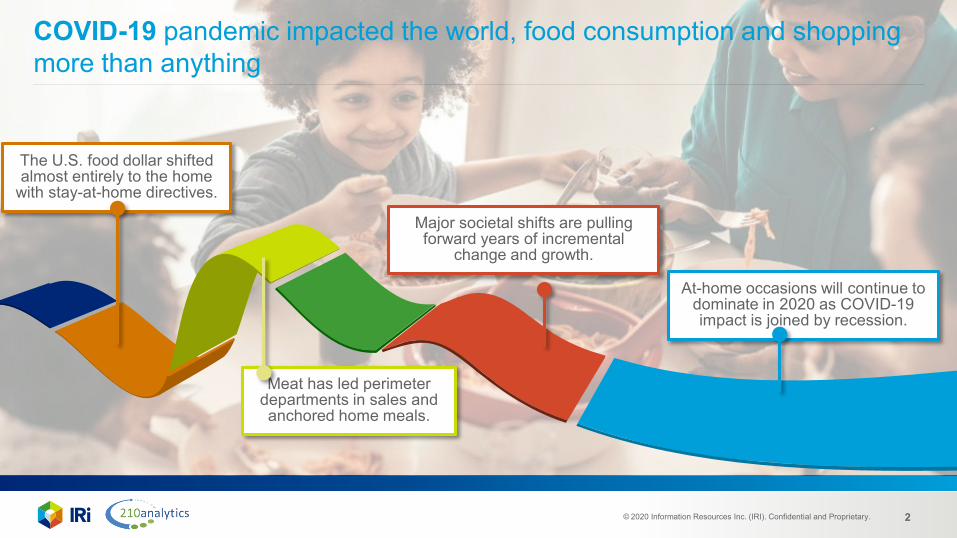
COVID-19 pandemic impacted the world, food consumption and shopping more than anything
The U.S. food dollar shifted almost entirely to the home
with stay-at-home directives.
Meat has led perimeter departments in sales and anchored home meals.
Major societal shifts are pulling forward years of incremental
change and growth.
At-home occasions will continue to dominate in 2020 as COVID-19 impact is joined by recession.
© 2020 Information Resources Inc. (IRI). Confidential and Proprietary. 3
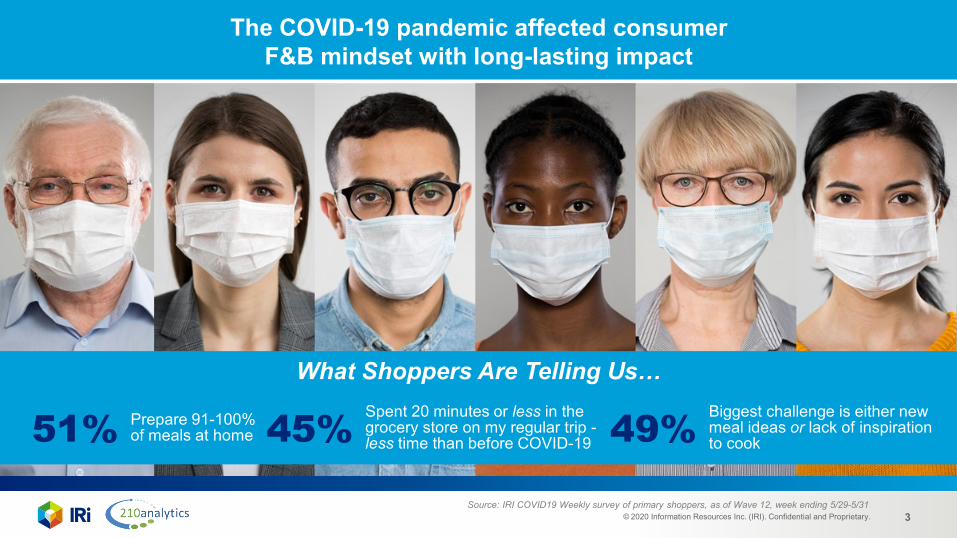
The COVID-19 pandemic affected consumer F&B mindset with long-lasting impact
Source: IRI COVID19 Weekly survey of primary shoppers, as of Wave 12, week ending 5/29-5/31
What Shoppers Are Telling Us…
51% Prepare 91-100% of meals at home 45% Spent 20 minutes or less in the
grocery store on my regular trip -less time than before COVID-19 49% Biggest challenge is either new
meal ideas or lack of inspiration to cook
© 2020 Information Resources Inc. (IRI). Confidential and Proprietary. 4
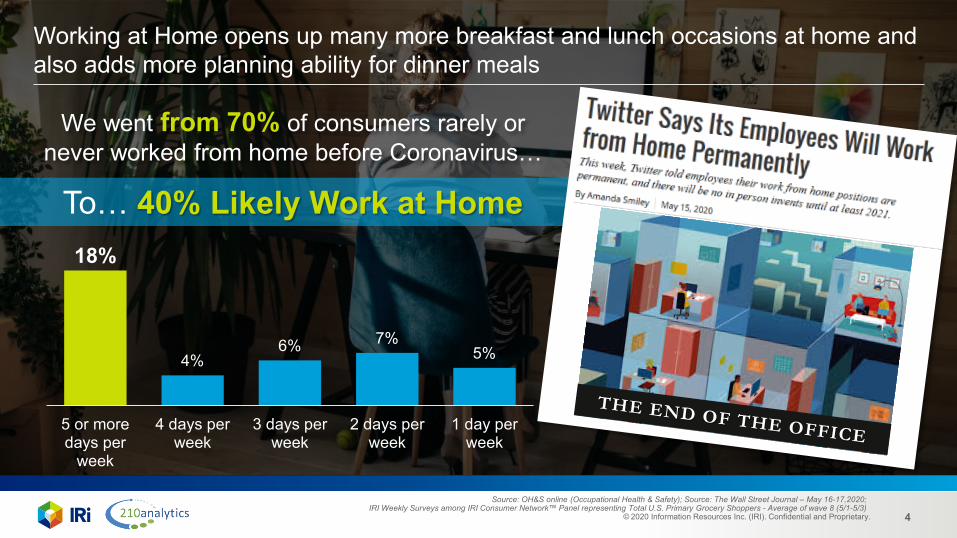
Working at Home opens up many more breakfast and lunch occasions at home and also adds more planning ability for dinner meals
We went from 70% of consumers rarely or never worked from home before Coronavirus…
To… 40% Likely Work at Home
Source: OH&S online (Occupational Health & Safety); Source: The Wall Street Journal – May 16-17,2020; IRI Weekly Surveys among IRI Consumer Network™ Panel representing Total U.S. Primary Grocery Shoppers - Average of wave 8 (5/1-5/3)
18%
4%6% 7%
5%
5 or moredays per
week
4 days perweek
3 days perweek
2 days perweek
1 day perweek
© 2020 Information Resources Inc. (IRI). Confidential and Proprietary. 5
LEGEND
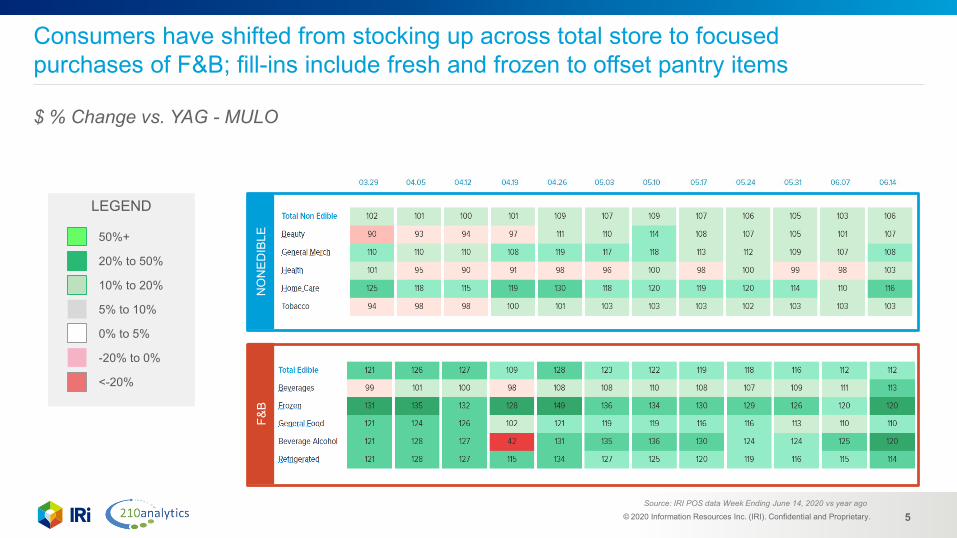
Consumers have shifted from stocking up across total store to focused purchases of F&B; fill-ins include fresh and frozen to offset pantry items
$ % Change vs. YAG - MULO
50%+
20% to 50%
10% to 20%
0% to 5%
-20% to 0%
5% to 10%
<-20%
NO
NED
IBLE
F&B
Source: IRI POS data Week Ending June 14, 2020 vs year ago
© 2020 Information Resources Inc. (IRI). Confidential and Proprietary. 6
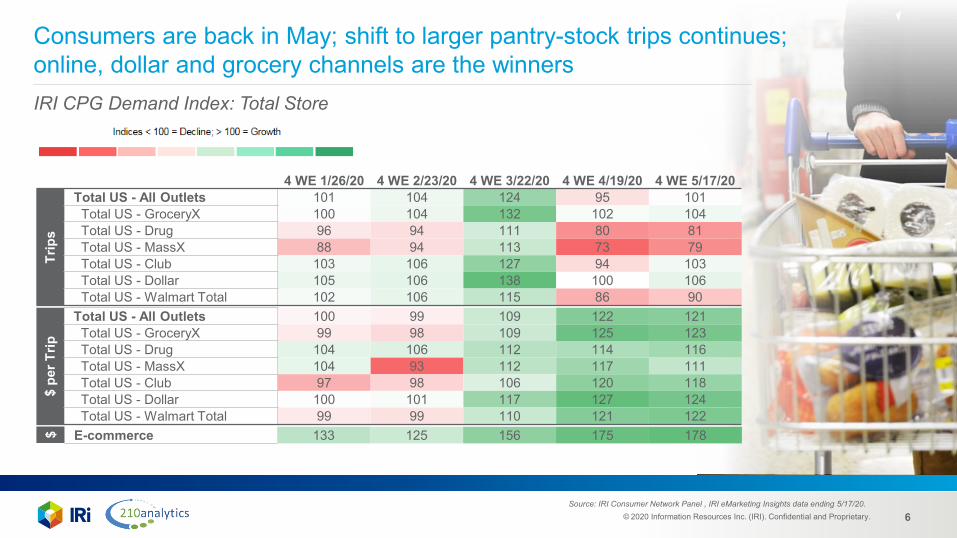
E-commerce 133 125 156 175 178
Consumers are back in May; shift to larger pantry-stock trips continues; online, dollar and grocery channels are the winnersIRI CPG Demand Index: Total Store
$
4 WE 1/26/20 4 WE 2/23/20 4 WE 3/22/20 4 WE 4/19/20 4 WE 5/17/20
Trip
s
Total US - All Outlets 101 104 124 95 101Total US - GroceryX 100 104 132 102 104Total US - Drug 96 94 111 80 81Total US - MassX 88 94 113 73 79Total US - Club 103 106 127 94 103Total US - Dollar 105 106 138 100 106Total US - Walmart Total 102 106 115 86 90
$ pe
r Trip
Total US - All Outlets 100 99 109 122 121Total US - GroceryX 99 98 109 125 123Total US - Drug 104 106 112 114 116Total US - MassX 104 93 112 117 111Total US - Club 97 98 106 120 118Total US - Dollar 100 101 117 127 124Total US - Walmart Total 99 99 110 121 122
Source: IRI Consumer Network Panel , IRI eMarketing Insights data ending 5/17/20.
© 2020 Information Resources Inc. (IRI). Confidential and Proprietary. 7
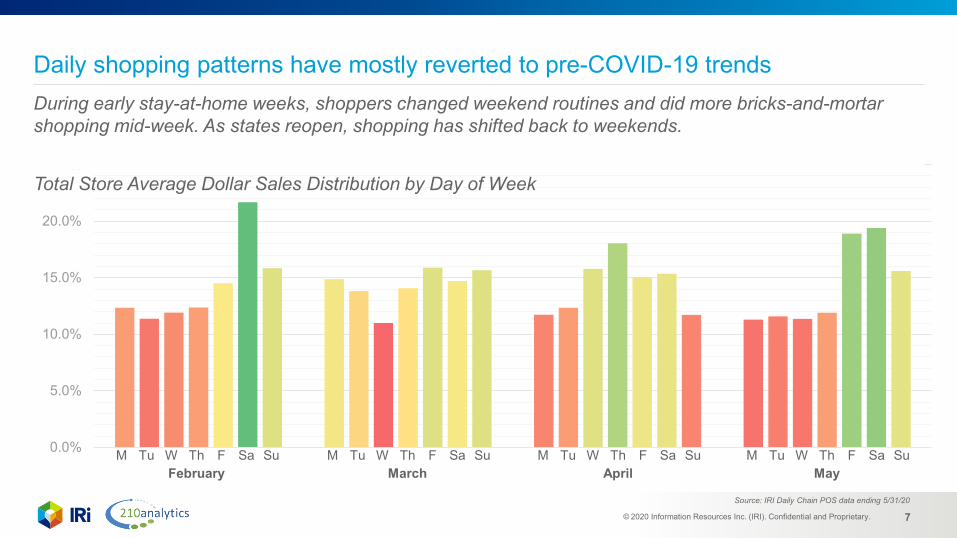
Daily shopping patterns have mostly reverted to pre-COVID-19 trends
Source: IRI Daily Chain POS data ending 5/31/20
0.0%
5.0%
10.0%
15.0%
20.0%
25.0%
M Tu W Th F Sa SuFebruary
M Tu W Th F Sa SuMarch
M Tu W Th F Sa SuApril
M Tu W Th F Sa SuMay
During early stay-at-home weeks, shoppers changed weekend routines and did more bricks-and-mortar shopping mid-week. As states reopen, shopping has shifted back to weekends.
Total Store Average Dollar Sales Distribution by Day of Week
© 2020 Information Resources Inc. (IRI). Confidential and Proprietary. 8
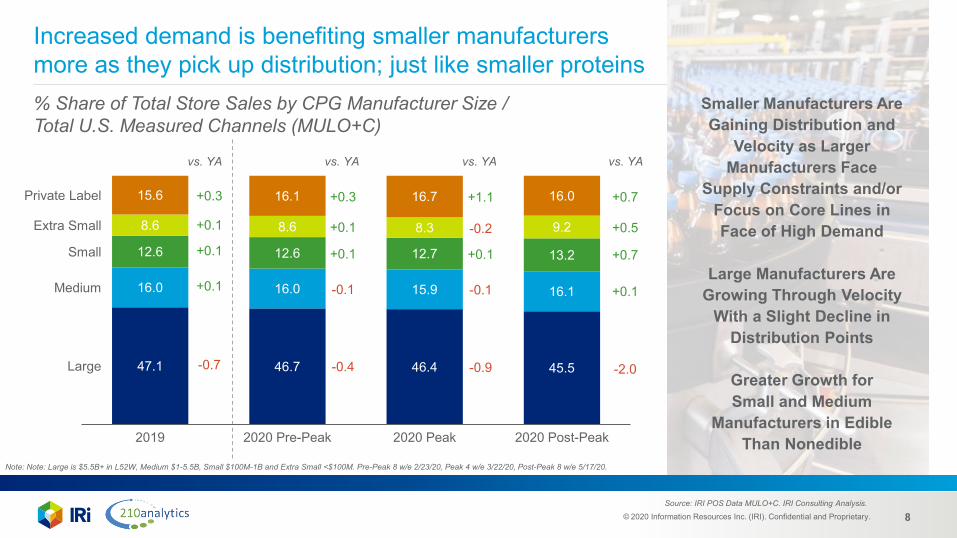
Increased demand is benefiting smaller manufacturers more as they pick up distribution; just like smaller proteins% Share of Total Store Sales by CPG Manufacturer Size / Total U.S. Measured Channels (MULO+C)
47.1 46.7 46.4 45.5
16.0 16.0 15.9 16.1
12.6 12.6 12.7 13.2
8.6 8.6 8.3 9.2
15.6 16.1 16.7 16.0
Large
2020 Post-Peak2019 2020 Pre-Peak 2020 Peak
Medium
Small
Extra Small
Private Label +0.3
+0.1
+0.1
+0.1
-0.7
+0.3
+0.1
+0.1
-0.1
-0.4
+1.1
-0.2
+0.1
-0.1
-0.9
vs. YA vs. YA vs. YA vs. YA
+0.7
+0.5
+0.7
+0.1
-2.0
Smaller Manufacturers Are Gaining Distribution and
Velocity as Larger Manufacturers Face
Supply Constraints and/or Focus on Core Lines in Face of High Demand
Large Manufacturers Are Growing Through Velocity
With a Slight Decline in Distribution Points
Greater Growth for Small and Medium
Manufacturers in Edible Than Nonedible
Source: IRI POS Data MULO+C. IRI Consulting Analysis.
Note: Note: Large is $5.5B+ in L52W, Medium $1-5.5B, Small $100M-1B and Extra Small <$100M. Pre-Peak 8 w/e 2/23/20, Peak 4 w/e 3/22/20, Post-Peak 8 w/e 5/17/20.
© 2020 Information Resources Inc. (IRI). Confidential and Proprietary. 9
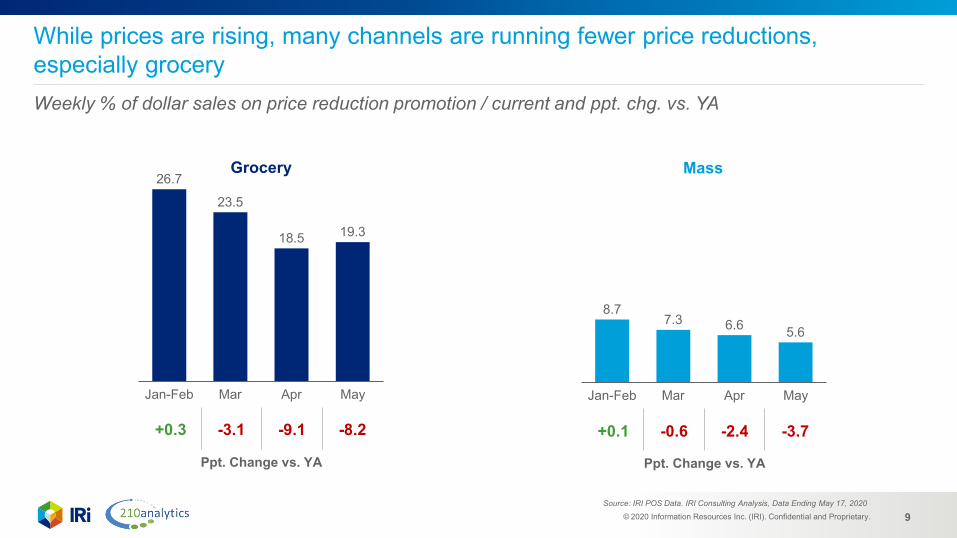
While prices are rising, many channels are running fewer price reductions, especially groceryWeekly % of dollar sales on price reduction promotion / current and ppt. chg. vs. YA
26.7
23.5
18.5 19.3
MarJan-Feb Apr May
+0.3 -3.1 -9.1 -8.2
Ppt. Change vs. YA
8.77.3 6.6 5.6
AprJan-Feb Mar May
+0.1 -0.6 -2.4 -3.7
Grocery Mass
Source: IRI POS Data. IRI Consulting Analysis, Data Ending May 17, 2020
Ppt. Change vs. YA
© 2020 Information Resources Inc. (IRI). Confidential and Proprietary. 10
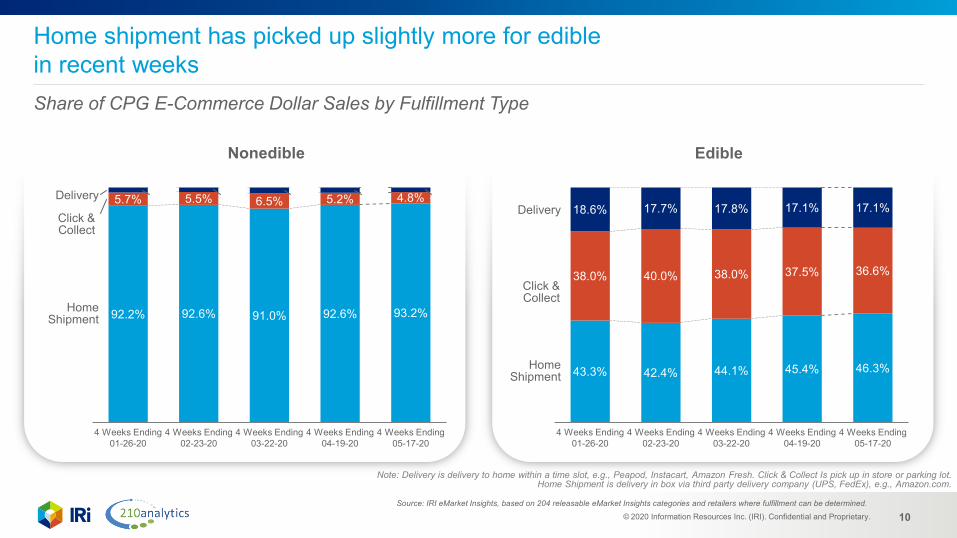
Nonedible Edible
Note: Delivery is delivery to home within a time slot, e.g., Peapod, Instacart, Amazon Fresh. Click & Collect Is pick up in store or parking lot. Home Shipment is delivery in box via third party delivery company (UPS, FedEx), e.g., Amazon.com.
Home shipment has picked up slightly more for edible in recent weeksShare of CPG E-Commerce Dollar Sales by Fulfillment Type
92.2% 92.6% 91.0% 92.6% 93.2%
5.7% 5.5% 6.5% 5.2%2.1% 1.9% 2.5% 2.3% 2.0%
4 Weeks Ending 04-19-20
4 Weeks Ending 01-26-20
4 Weeks Ending 03-22-20
Click &Collect
4 Weeks Ending 02-23-20
4.8%
4 Weeks Ending 05-17-20
HomeShipment
Delivery
43.3% 42.4% 44.1% 45.4% 46.3%
38.0% 40.0% 38.0% 37.5% 36.6%
18.6% 17.7% 17.8% 17.1% 17.1%
4 Weeks Ending 05-17-20
4 Weeks Ending 04-19-20
4 Weeks Ending 03-22-20
4 Weeks Ending 01-26-20
4 Weeks Ending 02-23-20
HomeShipment
Delivery
Source: IRI eMarket Insights, based on 204 releasable eMarket Insights categories and retailers where fulfillment can be determined.
Click &Collect
© 2020 Information Resources Inc. (IRI). Confidential and Proprietary. 11
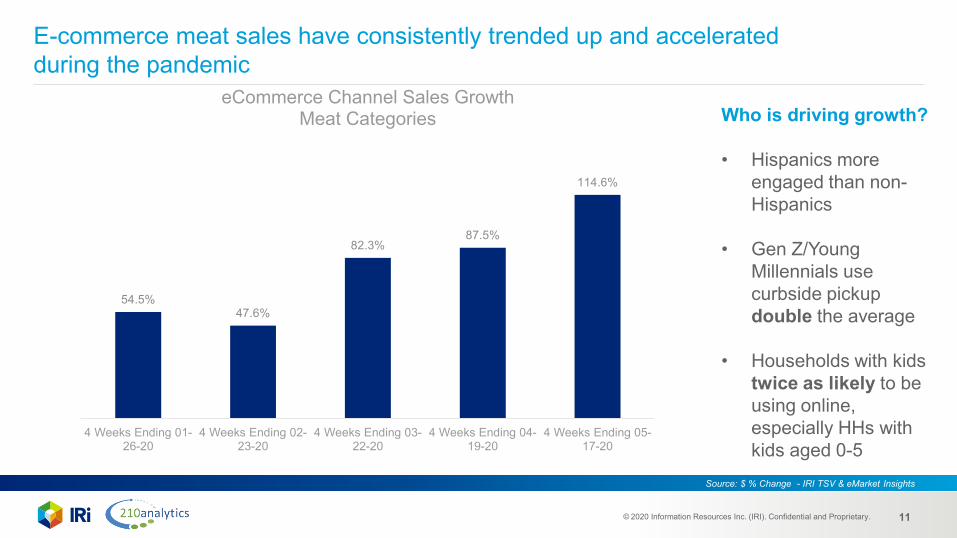
E-commerce meat sales have consistently trended up and accelerated during the pandemic
54.5%47.6%
82.3%87.5%
114.6%
4 Weeks Ending 01-26-20
4 Weeks Ending 02-23-20
4 Weeks Ending 03-22-20
4 Weeks Ending 04-19-20
4 Weeks Ending 05-17-20
eCommerce Channel Sales GrowthMeat Categories
Source: $ % Change - IRI TSV & eMarket Insights
Who is driving growth?
• Hispanics more engaged than non-Hispanics
• Gen Z/Young Millennials use curbside pickup double the average
• Households with kids twice as likely to be using online, especially HHs with kids aged 0-5
© 2020 Information Resources Inc. (IRI). Confidential and Proprietary. 12
Meat department performance Dollars Volume Retail prices Assortment Channels
© 2020 Information Resources Inc. (IRI). Confidential and Proprietary. 13
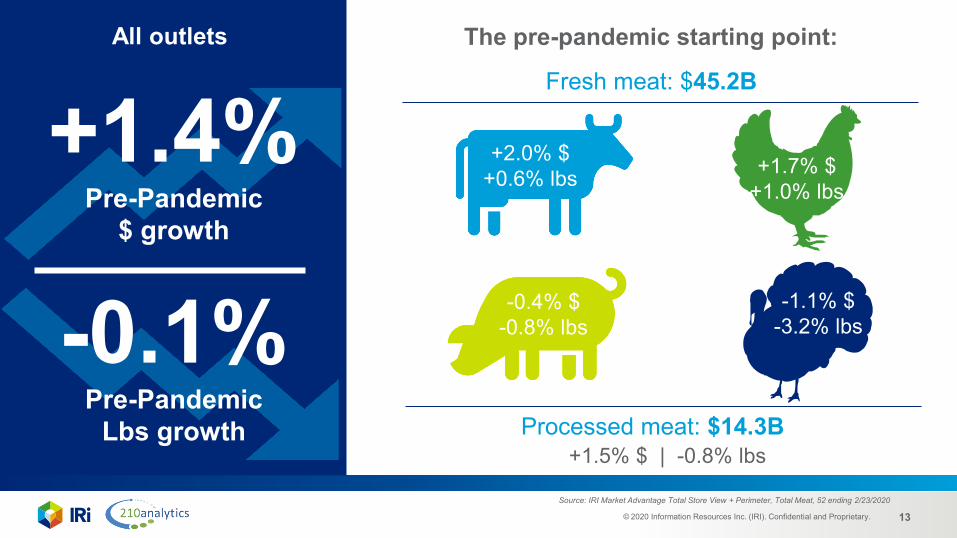
All outlets
Fresh meat: $45.2B
Source: IRI Market Advantage Total Store View + Perimeter, Total Meat, 52 ending 2/23/2020
+1.4%Pre-Pandemic
$ growth
-0.1%Pre-Pandemic
Lbs growth+1.5% $ | -0.8% lbs
-1.1% $-3.2% lbs
+2.0% $+0.6% lbs
-0.4% $-0.8% lbs
+1.7% $+1.0% lbs
Processed meat: $14.3B
The pre-pandemic starting point:
© 2020 Information Resources Inc. (IRI). Confidential and Proprietary. 14
13.7%17.5%20.4%21.5%24.4%25.6%
10.7%30.4%30.0%
25.1%80.7%78.8%
9.1%3.1%
6/7/20205/31/20205/24/20205/17/20205/10/2020
5/3/20204/19/20204/12/2020
4/5/20203/29/20203/22/20203/15/2020
3/8/20203/1/2020
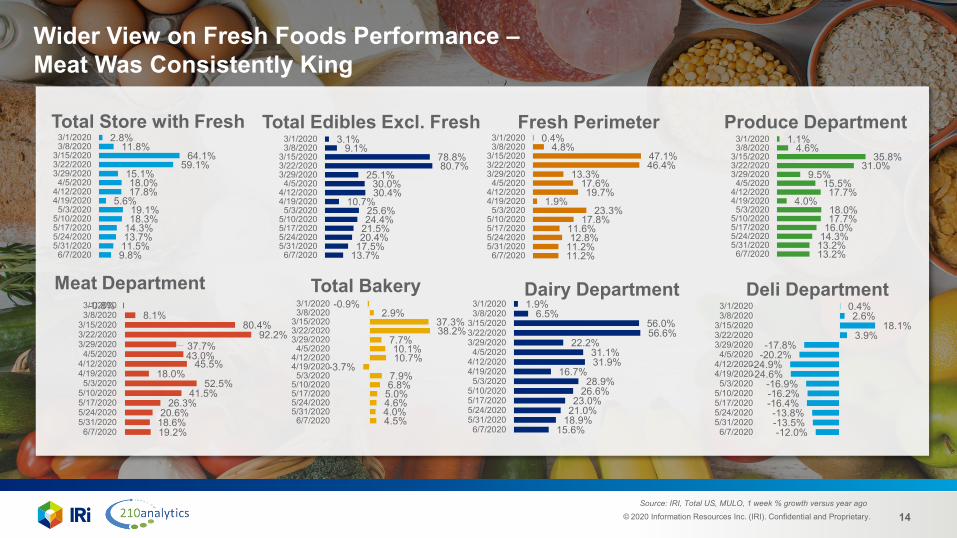
Wider View on Fresh Foods Performance –Meat Was Consistently King
19.2%18.6%20.6%
26.3%41.5%
52.5%18.0%
45.5%43.0%37.7%
92.2%80.4%
8.1%-0.8%
6/7/20205/31/20205/24/20205/17/20205/10/2020
5/3/20204/19/20204/12/2020
4/5/20203/29/20203/22/20203/15/2020
3/8/20203/1/2020
13.2%13.2%14.3%16.0%17.7%18.0%
4.0%17.7%
15.5%9.5%
31.0%35.8%
4.6%1.1%
6/7/20205/31/20205/24/20205/17/20205/10/2020
5/3/20204/19/20204/12/2020
4/5/20203/29/20203/22/20203/15/2020
3/8/20203/1/2020
Meat Department
Produce Department
Source: IRI, Total US, MULO, 1 week % growth versus year ago
11.2%11.2%12.8%11.6%
17.8%23.3%
1.9%19.7%
17.6%13.3%
46.4%47.1%
4.8%0.4%
6/7/20205/31/20205/24/20205/17/20205/10/2020
5/3/20204/19/20204/12/2020
4/5/20203/29/20203/22/20203/15/2020
3/8/20203/1/2020
Fresh Perimeter
Total Bakery
4.5%4.0%4.6%5.0%6.8%7.9%
-3.7%10.7%10.1%
7.7%38.2%37.3%
2.9%-0.9%
6/7/20205/31/20205/24/20205/17/20205/10/2020
5/3/20204/19/20204/12/2020
4/5/20203/29/20203/22/20203/15/2020
3/8/20203/1/2020
15.6%18.9%21.0%23.0%
26.6%28.9%
16.7%31.9%31.1%
22.2%56.6%56.0%
6.5%1.9%
6/7/20205/31/20205/24/20205/17/20205/10/2020
5/3/20204/19/20204/12/2020
4/5/20203/29/20203/22/20203/15/2020
3/8/20203/1/2020
Dairy Department
-12.0%-13.5%-13.8%
-16.4%-16.2%-16.9%
-24.6%-24.9%
-20.2%-17.8%
3.9%18.1%
2.6%0.4%
6/7/20205/31/20205/24/20205/17/20205/10/2020
5/3/20204/19/20204/12/2020
4/5/20203/29/20203/22/20203/15/2020
3/8/20203/1/2020
Deli Department
Total Edibles Excl. FreshTotal Store with Fresh
9.8%11.5%13.7%14.3%18.3%19.1%
5.6%17.8%18.0%
15.1%59.1%
64.1%11.8%
2.8%
6/7/20205/31/20205/24/20205/17/20205/10/2020
5/3/20204/19/20204/12/2020
4/5/20203/29/20203/22/20203/15/2020
3/8/20203/1/2020
© 2020 Information Resources Inc. (IRI). Confidential and Proprietary. 15
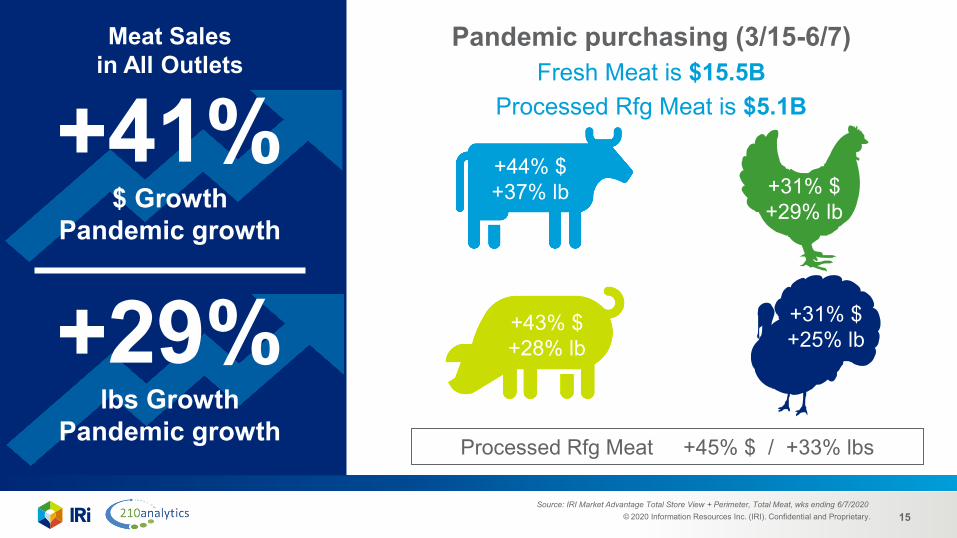
Meat Sales in All Outlets
Pandemic purchasing (3/15-6/7)Fresh Meat is $15.5B
Processed Rfg Meat is $5.1B
Source: IRI Market Advantage Total Store View + Perimeter, Total Meat, wks ending 6/7/2020
+31% $+25% lb
+44% $+37% lb
+43% $+28% lb
+31% $+29% lb
Processed Rfg Meat +45% $ / +33% lbs
+41%$ Growth
Pandemic growth
+29%lbs Growth
Pandemic growth
© 2020 Information Resources Inc. (IRI). Confidential and Proprietary. 16
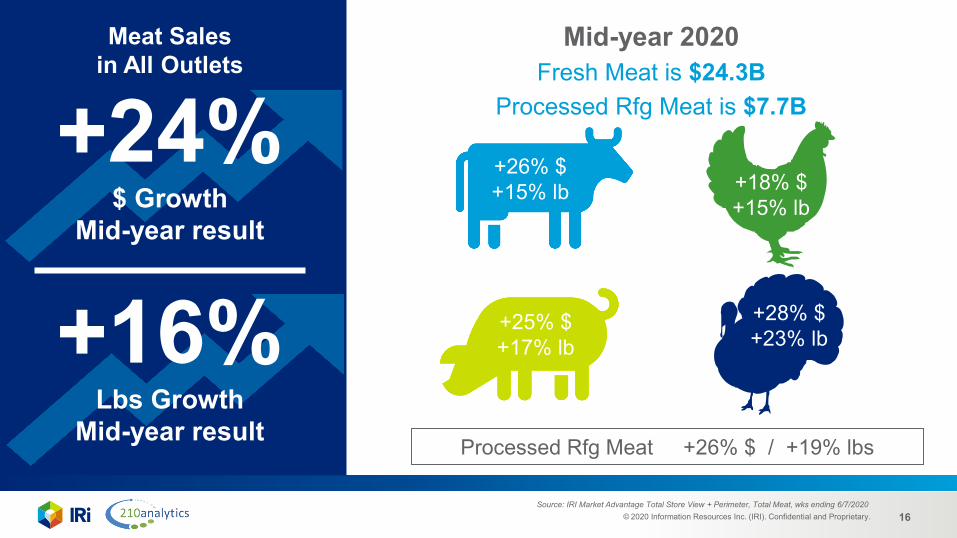
Meat Sales in All Outlets
Mid-year 2020Fresh Meat is $24.3B
Processed Rfg Meat is $7.7B
Source: IRI Market Advantage Total Store View + Perimeter, Total Meat, wks ending 6/7/2020
+28% $+23% lb
+26% $+15% lb
+25% $+17% lb
+18% $+15% lb
Processed Rfg Meat +26% $ / +19% lbs
+24%$ Growth
Mid-year result
+16%Lbs Growth
Mid-year result
© 2020 Information Resources Inc. (IRI). Confidential and Proprietary. 17
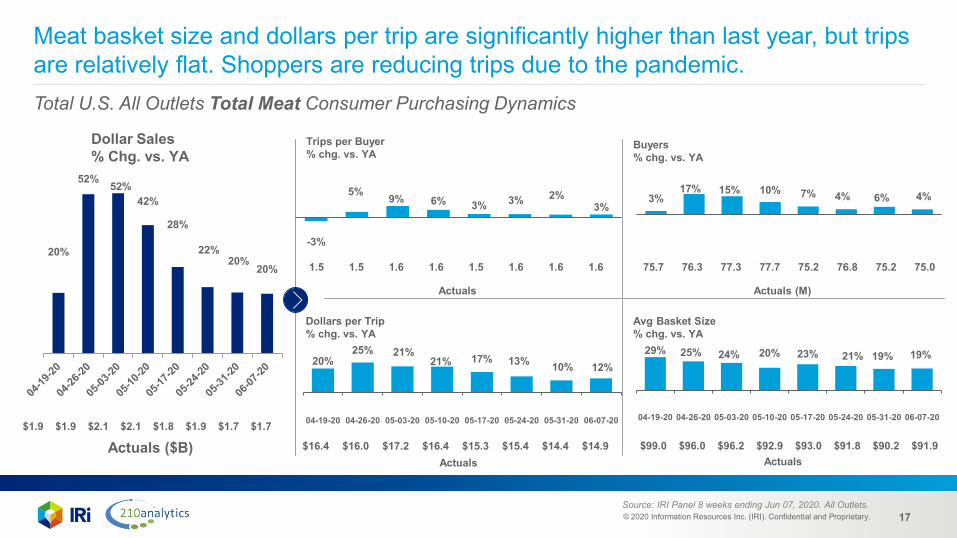
Meat basket size and dollars per trip are significantly higher than last year, but trips are relatively flat. Shoppers are reducing trips due to the pandemic.Total U.S. All Outlets Total Meat Consumer Purchasing Dynamics
Dollar Sales % Chg. vs. YA
Trips per Buyer% chg. vs. YA
Buyers% chg. vs. YA
Dollars per Trip% chg. vs. YA
Avg Basket Size% chg. vs. YA
$19.6
$21.3
$29.7
$28.4
$20.8
$22.0
$21.9
$21.3
Actuals ($B)
-3%
5% 9% 6% 3% 3% 2%3%
1.5 1.5 1.6 1.6 1.5 1.6 1.6 1.6 75.7 76.3 77.3 77.7 75.2 76.8 75.2 75.0
$16.4 $16.0 $17.2 $16.4 $15.3 $15.4 $14.4 $14.9 $99.0 $96.0 $96.2 $92.9 $93.0 $91.8 $90.2 $91.9
Actuals
Actuals
Actuals (M)
Actuals
20%
52% 52%42%
28%
22%20%
20%
$1.9 $1.9 $2.1 $2.1 $1.8 $1.9 $1.7 $1.7
3%17% 15% 10% 7% 4% 6% 4%
20%25% 21%
21% 17% 13% 10% 12%
04-19-20 04-26-20 05-03-20 05-10-20 05-17-20 05-24-20 05-31-20 06-07-20
29% 25% 24% 20% 23% 21% 19% 19%
04-19-20 04-26-20 05-03-20 05-10-20 05-17-20 05-24-20 05-31-20 06-07-20
Source: IRI Panel 8 weeks ending Jun 07, 2020. All Outlets.
© 2020 Information Resources Inc. (IRI). Confidential and Proprietary. 18
c
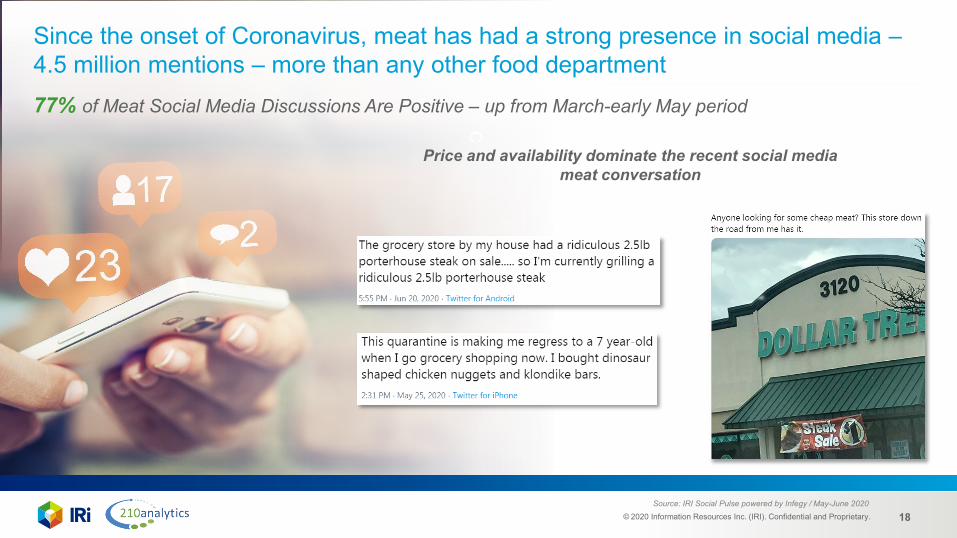
Since the onset of Coronavirus, meat has had a strong presence in social media –4.5 million mentions – more than any other food department
Source: IRI Social Pulse powered by Infegy / May-June 2020
77% of Meat Social Media Discussions Are Positive – up from March-early May period
Price and availability dominate the recent social media meat conversation
© 2020 Information Resources Inc. (IRI). Confidential and Proprietary. 19
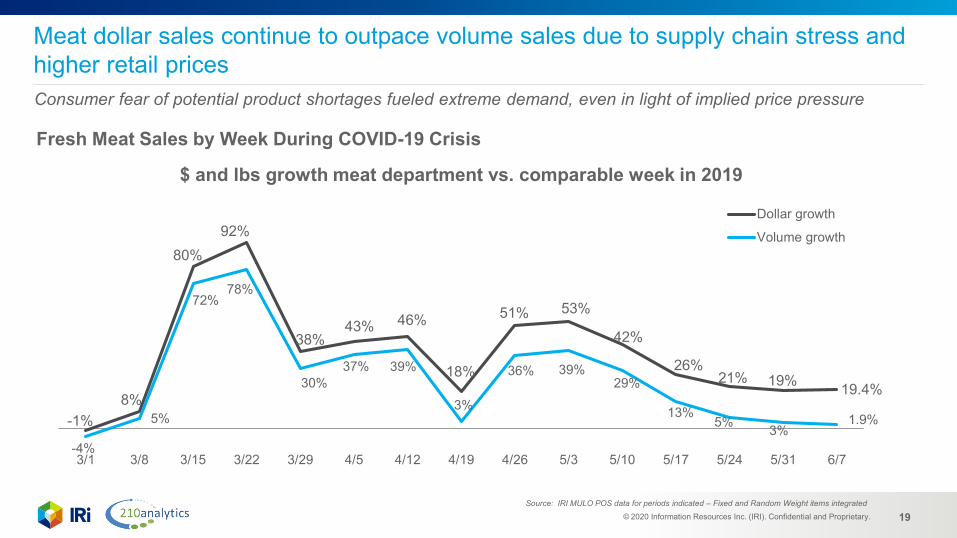
Meat dollar sales continue to outpace volume sales due to supply chain stress and higher retail prices
Fresh Meat Sales by Week During COVID-19 Crisis
Source: IRI MULO POS data for periods indicated – Fixed and Random Weight items integrated
Consumer fear of potential product shortages fueled extreme demand, even in light of implied price pressure
-1%8%
80%92%
38%43% 46%
18%
51% 53%
42%
26%21% 19% 19.4%
-4%
5%
72%78%
30%37% 39%
3%
36% 39%29%
13%5% 3%
1.9%
3/1 3/8 3/15 3/22 3/29 4/5 4/12 4/19 4/26 5/3 5/10 5/17 5/24 5/31 6/7
$ and lbs growth meat department vs. comparable week in 2019
Dollar growth
Volume growth
© 2020 Information Resources Inc. (IRI). Confidential and Proprietary. 20
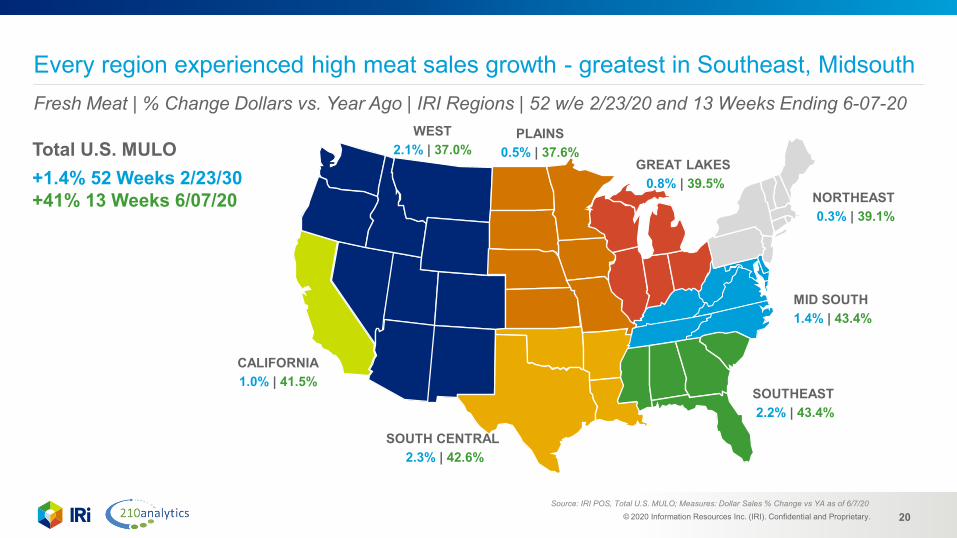
Every region experienced high meat sales growth - greatest in Southeast, MidsouthFresh Meat | % Change Dollars vs. Year Ago | IRI Regions | 52 w/e 2/23/20 and 13 Weeks Ending 6-07-20
WEST2.1% | 37.0%
CALIFORNIA1.0% | 41.5%
SOUTH CENTRAL 2.3% | 42.6%
SOUTHEAST 2.2% | 43.4%
NORTHEAST 0.3% | 39.1%
PLAINS 0.5% | 37.6%
GREAT LAKES 0.8% | 39.5%
MID SOUTH 1.4% | 43.4%
Total U.S. MULO+1.4% 52 Weeks 2/23/30+41% 13 Weeks 6/07/20
Source: IRI POS, Total U.S. MULO; Measures: Dollar Sales % Change vs YA as of 6/7/20
© 2020 Information Resources Inc. (IRI). Confidential and Proprietary. 21
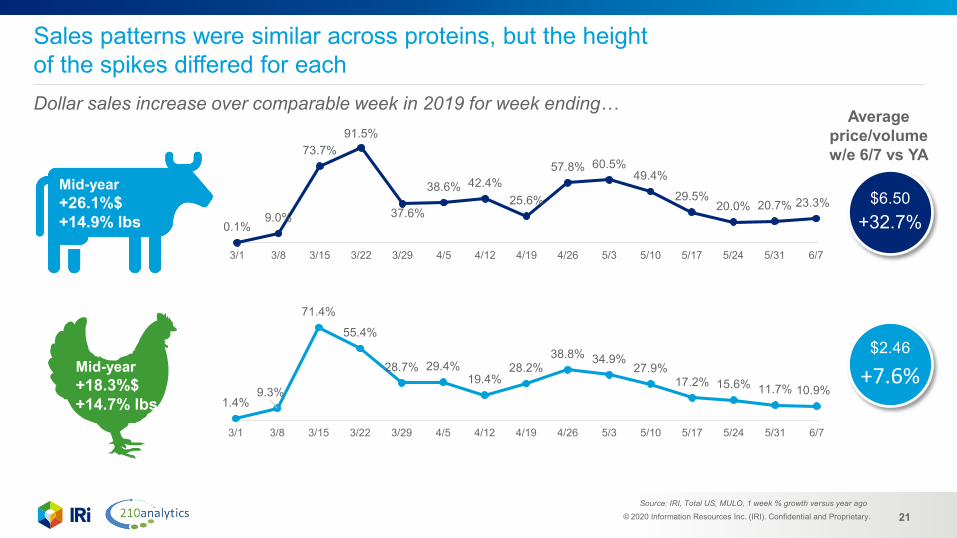
Sales patterns were similar across proteins, but the height of the spikes differed for eachDollar sales increase over comparable week in 2019 for week ending…
Source: IRI, Total US, MULO, 1 week % growth versus year ago
0.1%9.0%
73.7%91.5%
37.6%
38.6% 42.4%25.6%
57.8% 60.5%49.4%
29.5%20.0% 20.7% 23.3%
3/1 3/8 3/15 3/22 3/29 4/5 4/12 4/19 4/26 5/3 5/10 5/17 5/24 5/31 6/7
1.4%9.3%
71.4%
55.4%
28.7% 29.4%19.4%
28.2%38.8% 34.9%
27.9%17.2% 15.6% 11.7% 10.9%
3/1 3/8 3/15 3/22 3/29 4/5 4/12 4/19 4/26 5/3 5/10 5/17 5/24 5/31 6/7
Average price/volume w/e 6/7 vs YA
$6.50+32.7%
$2.46
+7.6%
Mid-year+26.1%$+14.9% lbs
Mid-year+18.3%$+14.7% lbs
© 2020 Information Resources Inc. (IRI). Confidential and Proprietary. 22
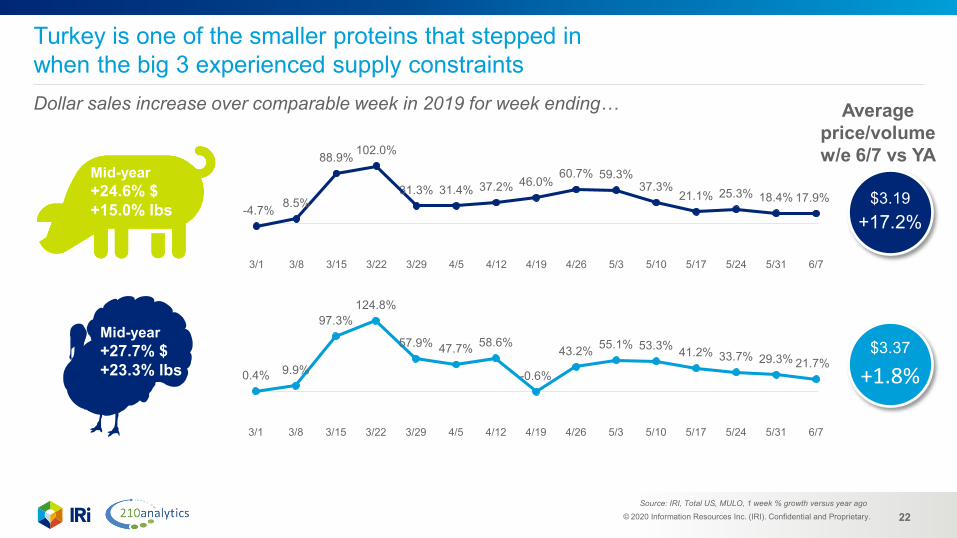
Turkey is one of the smaller proteins that stepped in when the big 3 experienced supply constraintsDollar sales increase over comparable week in 2019 for week ending…
Source: IRI, Total US, MULO, 1 week % growth versus year ago
-4.7% 8.5%
88.9% 102.0%
31.3% 31.4% 37.2% 46.0%60.7% 59.3%
37.3%21.1% 25.3% 18.4% 17.9%
3/1 3/8 3/15 3/22 3/29 4/5 4/12 4/19 4/26 5/3 5/10 5/17 5/24 5/31 6/7
0.4% 9.9%
97.3%124.8%
57.9% 47.7% 58.6%
-0.6%
43.2% 55.1% 53.3% 41.2% 33.7% 29.3% 21.7%
3/1 3/8 3/15 3/22 3/29 4/5 4/12 4/19 4/26 5/3 5/10 5/17 5/24 5/31 6/7
Average price/volume w/e 6/7 vs YA
$3.19+17.2%
$3.37
+1.8%
Mid-year+24.6% $+15.0% lbs
Mid-year+27.7% $+23.3% lbs
© 2020 Information Resources Inc. (IRI). Confidential and Proprietary. 23
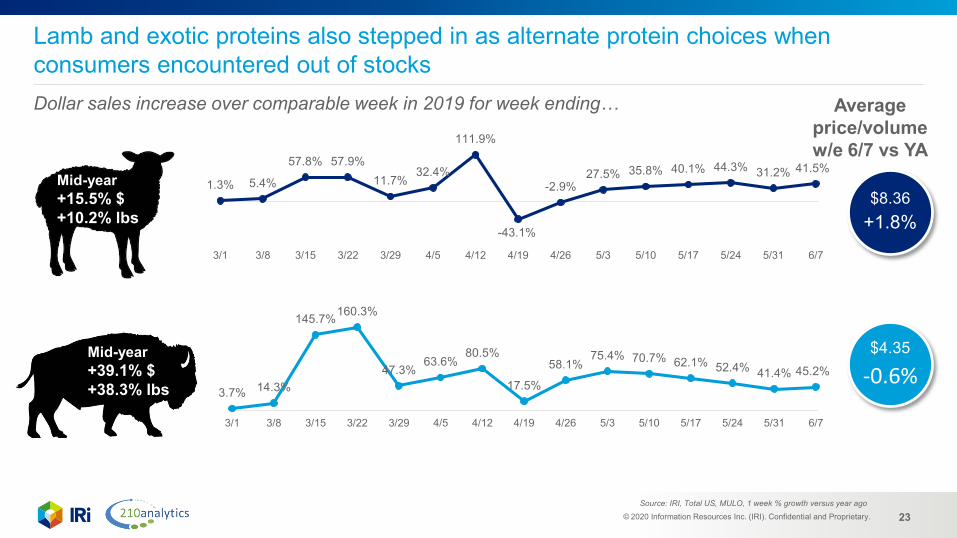
Lamb and exotic proteins also stepped in as alternate protein choices when consumers encountered out of stocksDollar sales increase over comparable week in 2019 for week ending…
Source: IRI, Total US, MULO, 1 week % growth versus year ago
1.3% 5.4%
57.8% 57.9%11.7%
32.4%
111.9%
-43.1%
-2.9%27.5% 35.8% 40.1% 44.3% 31.2% 41.5%
3/1 3/8 3/15 3/22 3/29 4/5 4/12 4/19 4/26 5/3 5/10 5/17 5/24 5/31 6/7
3.7% 14.3%
145.7%160.3%
47.3%63.6%
80.5%
17.5%
58.1%75.4% 70.7% 62.1% 52.4% 41.4% 45.2%
3/1 3/8 3/15 3/22 3/29 4/5 4/12 4/19 4/26 5/3 5/10 5/17 5/24 5/31 6/7
$8.36+1.8%
$4.35
-0.6%
Average price/volume w/e 6/7 vs YA
Mid-year+15.5% $+10.2% lbs
Mid-year+39.1% $+38.3% lbs
© 2020 Information Resources Inc. (IRI). Confidential and Proprietary. 24
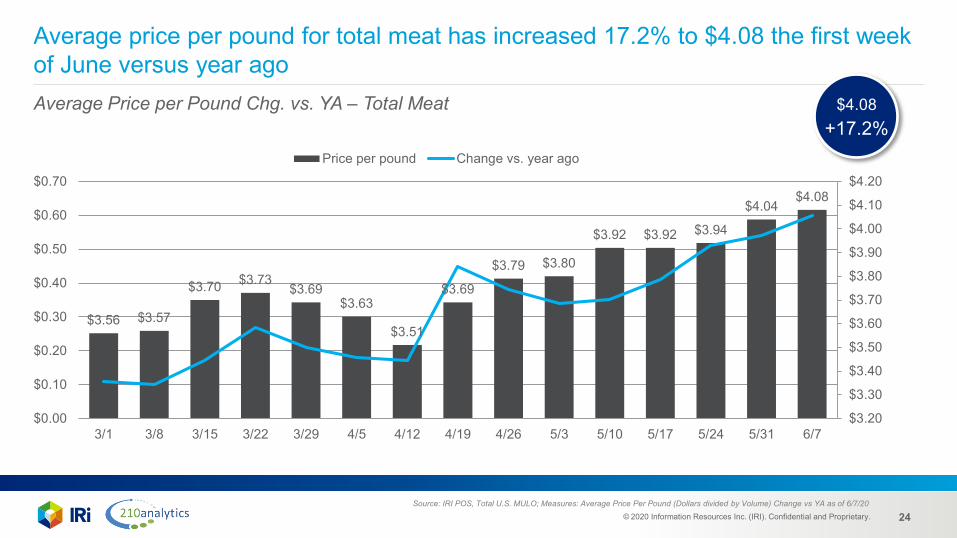
Average Price per Pound Chg. vs. YA – Total Meat
Source: IRI POS, Total U.S. MULO; Measures: Average Price Per Pound (Dollars divided by Volume) Change vs YA as of 6/7/20
Average price per pound for total meat has increased 17.2% to $4.08 the first week of June versus year ago
$3.56 $3.57
$3.70 $3.73$3.69
$3.63
$3.51
$3.69
$3.79 $3.80
$3.92 $3.92 $3.94
$4.04$4.08
$3.20
$3.30
$3.40
$3.50
$3.60
$3.70
$3.80
$3.90
$4.00
$4.10
$4.20
$0.00
$0.10
$0.20
$0.30
$0.40
$0.50
$0.60
$0.70
3/1 3/8 3/15 3/22 3/29 4/5 4/12 4/19 4/26 5/3 5/10 5/17 5/24 5/31 6/7
Price per pound Change vs. year ago
$4.08+17.2%
© 2020 Information Resources Inc. (IRI). Confidential and Proprietary. 25
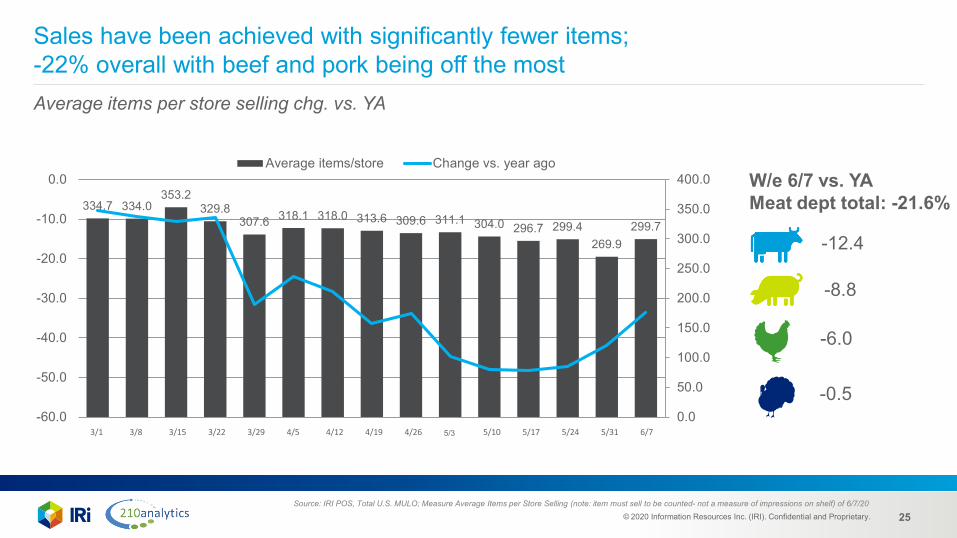
Sales have been achieved with significantly fewer items; -22% overall with beef and pork being off the mostAverage items per store selling chg. vs. YA
Source: IRI POS, Total U.S. MULO; Measure Average Items per Store Selling (note: item must sell to be counted- not a measure of impressions on shelf) of 6/7/20
W/e 6/7 vs. YAMeat dept total: -21.6%334.7 334.0
353.2329.8
307.6 318.1 318.0 313.6 309.6 311.1 304.0 296.7 299.4269.9
299.7
0.0
50.0
100.0
150.0
200.0
250.0
300.0
350.0
400.0
-60.0
-50.0
-40.0
-30.0
-20.0
-10.0
0.0Average items/store Change vs. year ago
-12.4
-6.0
-0.5
-8.8
3/1 3/8 3/15 3/22 3/29 4/5 4/12 4/19 4/26 5/3 5/10 5/17 5/24 5/31 6/7
© 2020 Information Resources Inc. (IRI). Confidential and Proprietary. 26
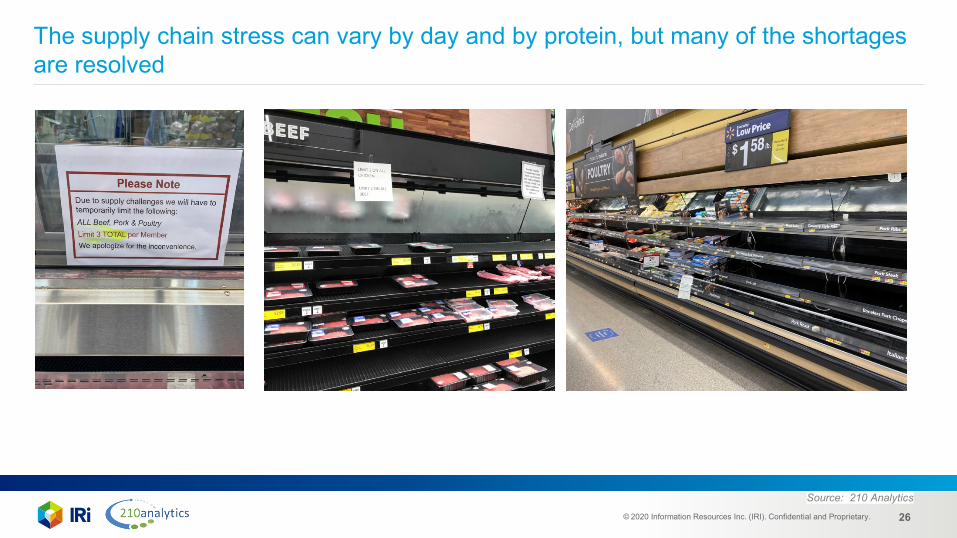
The supply chain stress can vary by day and by protein, but many of the shortages are resolved
Source: 210 Analytics
© 2020 Information Resources Inc. (IRI). Confidential and Proprietary. 27
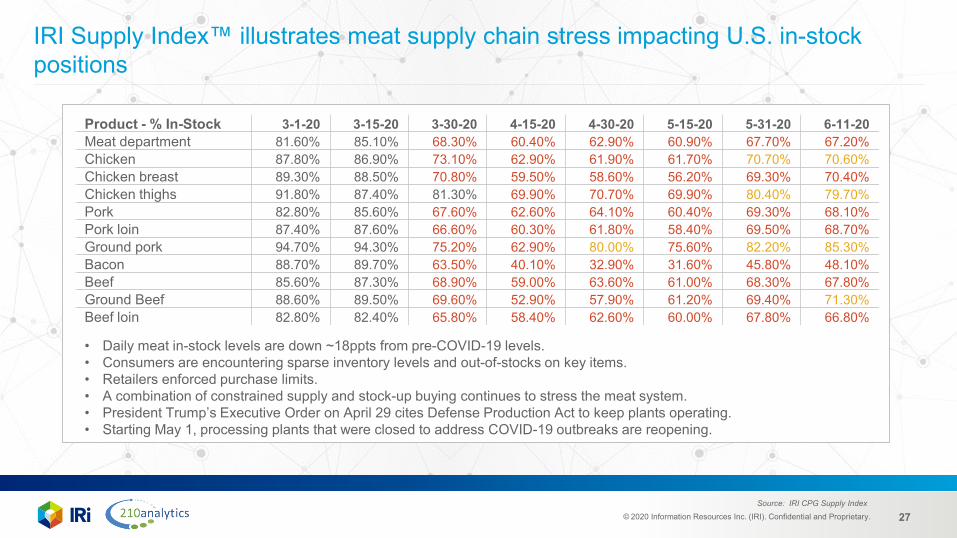
IRI Supply Index™ illustrates meat supply chain stress impacting U.S. in-stock positions
• Daily meat in-stock levels are down ~18ppts from pre-COVID-19 levels.• Consumers are encountering sparse inventory levels and out-of-stocks on key items.• Retailers enforced purchase limits.• A combination of constrained supply and stock-up buying continues to stress the meat system.• President Trump’s Executive Order on April 29 cites Defense Production Act to keep plants operating.• Starting May 1, processing plants that were closed to address COVID-19 outbreaks are reopening.
Source: IRI CPG Supply Index
Product - % In-Stock 3-1-20 3-15-20 3-30-20 4-15-20 4-30-20 5-15-20 5-31-20 6-11-20Meat department 81.60% 85.10% 68.30% 60.40% 62.90% 60.90% 67.70% 67.20%Chicken 87.80% 86.90% 73.10% 62.90% 61.90% 61.70% 70.70% 70.60%Chicken breast 89.30% 88.50% 70.80% 59.50% 58.60% 56.20% 69.30% 70.40%Chicken thighs 91.80% 87.40% 81.30% 69.90% 70.70% 69.90% 80.40% 79.70%Pork 82.80% 85.60% 67.60% 62.60% 64.10% 60.40% 69.30% 68.10%Pork loin 87.40% 87.60% 66.60% 60.30% 61.80% 58.40% 69.50% 68.70%Ground pork 94.70% 94.30% 75.20% 62.90% 80.00% 75.60% 82.20% 85.30%Bacon 88.70% 89.70% 63.50% 40.10% 32.90% 31.60% 45.80% 48.10%Beef 85.60% 87.30% 68.90% 59.00% 63.60% 61.00% 68.30% 67.80%Ground Beef 88.60% 89.50% 69.60% 52.90% 57.90% 61.20% 69.40% 71.30%Beef loin 82.80% 82.40% 65.80% 58.40% 62.60% 60.00% 67.80% 66.80%
© 2020 Information Resources Inc. (IRI). Confidential and Proprietary. 28
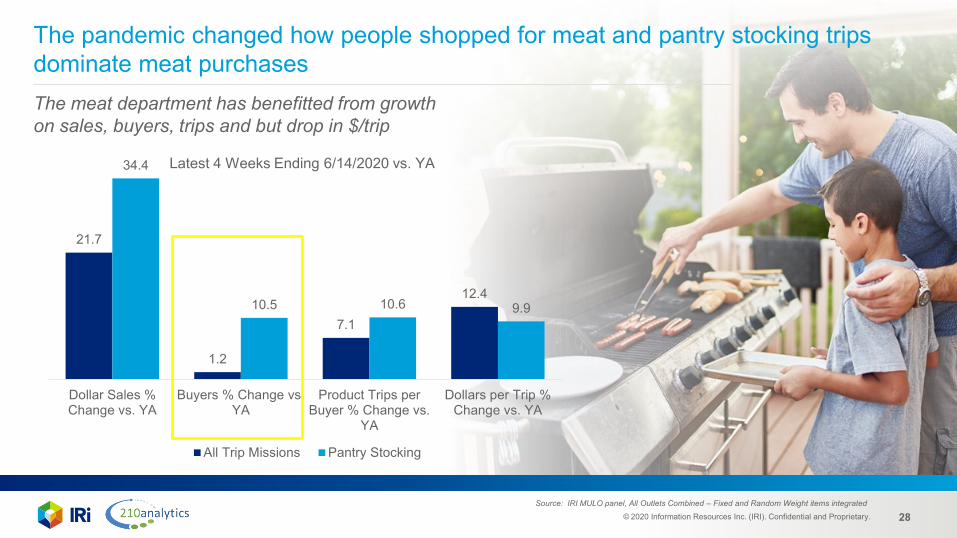
21.7
1.2
7.1
12.4
34.4
10.5 10.6 9.9
Dollar Sales %Change vs. YA
Buyers % Change vs.YA
Product Trips perBuyer % Change vs.
YA
Dollars per Trip %Change vs. YA
All Trip Missions Pantry Stocking
The pandemic changed how people shopped for meat and pantry stocking trips dominate meat purchasesThe meat department has benefitted from growth on sales, buyers, trips and but drop in $/trip
Latest 4 Weeks Ending 6/14/2020 vs. YA
Source: IRI MULO panel, All Outlets Combined – Fixed and Random Weight items integrated
© 2020 Information Resources Inc. (IRI). Confidential and Proprietary. 29
Performance deep dive Meat Claims Frozen meat Seafood Plant-based meat
alternatives
© 2020 Information Resources Inc. (IRI). Confidential and Proprietary. 30
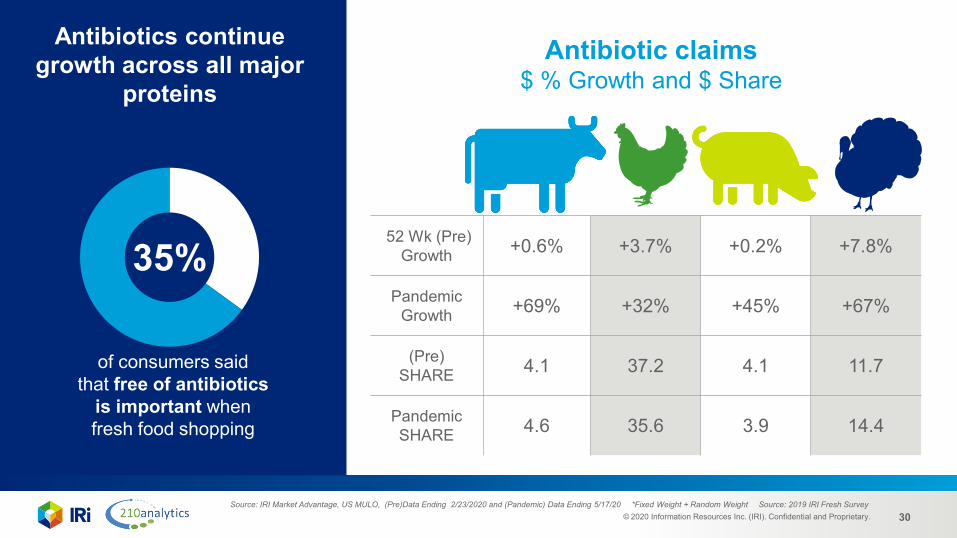
52 Wk (Pre)Growth +0.6% +3.7% +0.2% +7.8%
PandemicGrowth +69% +32% +45% +67%
(Pre) SHARE 4.1 37.2 4.1 11.7
Antibiotics continue growth across all major
proteinsAntibiotic claims
$ % Growth and $ Share
Source: IRI Market Advantage, US MULO, (Pre)Data Ending 2/23/2020 and (Pandemic) Data Ending 5/17/20 *Fixed Weight + Random Weight Source: 2019 IRI Fresh Survey
35%
of consumers said that free of antibiotics
is important when fresh food shopping
Pandemic SHARE 4.6 35.6 3.9 14.4
© 2020 Information Resources Inc. (IRI). Confidential and Proprietary. 31
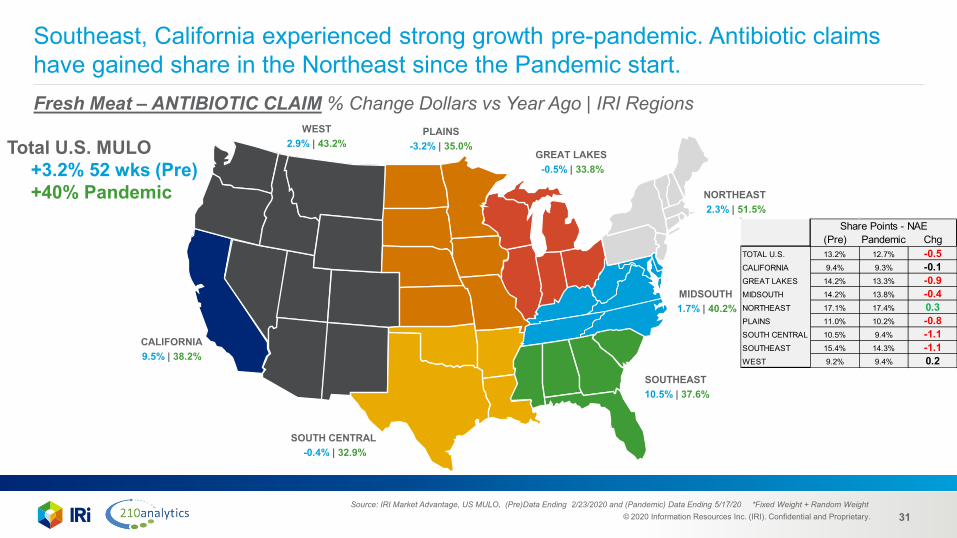
Southeast, California experienced strong growth pre-pandemic. Antibiotic claims have gained share in the Northeast since the Pandemic start.Fresh Meat – ANTIBIOTIC CLAIM % Change Dollars vs Year Ago | IRI Regions
WEST2.9% | 43.2%
CALIFORNIA9.5% | 38.2%
SOUTH CENTRAL -0.4% | 32.9%
SOUTHEAST 10.5% | 37.6%
NORTHEAST 2.3% | 51.5%
PLAINS -3.2% | 35.0%
GREAT LAKES -0.5% | 33.8%
MIDSOUTH 1.7% | 40.2%
Total U.S. MULO+3.2% 52 wks (Pre)+40% Pandemic
Source: IRI Market Advantage, US MULO, (Pre)Data Ending 2/23/2020 and (Pandemic) Data Ending 5/17/20 *Fixed Weight + Random Weight
(Pre) Pandemic ChgTOTAL U.S. 13.2% 12.7% -0.5CALIFORNIA 9.4% 9.3% -0.1GREAT LAKES 14.2% 13.3% -0.9MIDSOUTH 14.2% 13.8% -0.4NORTHEAST 17.1% 17.4% 0.3PLAINS 11.0% 10.2% -0.8SOUTH CENTRAL 10.5% 9.4% -1.1SOUTHEAST 15.4% 14.3% -1.1WEST 9.2% 9.4% 0.2
Share Points - NAE
© 2020 Information Resources Inc. (IRI). Confidential and Proprietary. 32
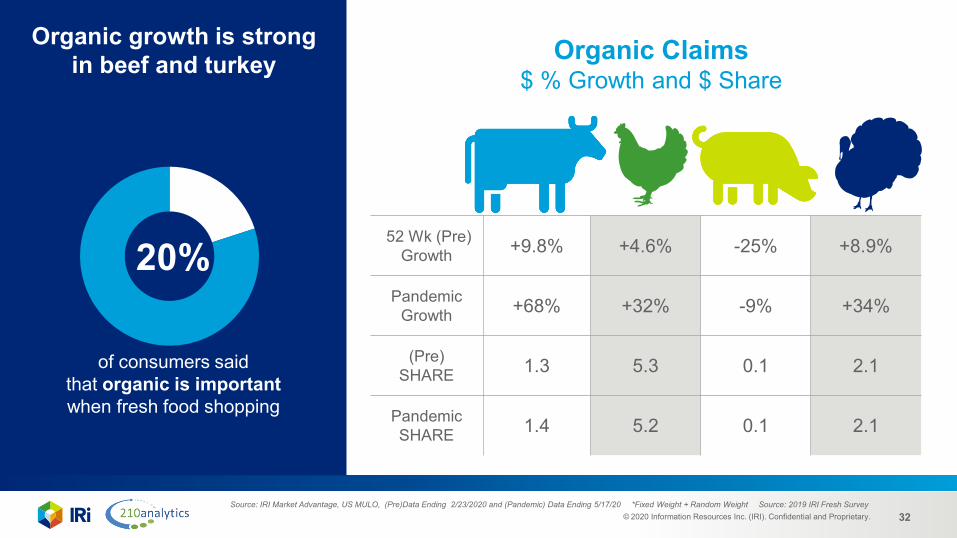
52 Wk (Pre)Growth +9.8% +4.6% -25% +8.9%
PandemicGrowth +68% +32% -9% +34%
(Pre) SHARE 1.3 5.3 0.1 2.1
Organic growth is strong in beef and turkey Organic Claims
$ % Growth and $ Share
Source: IRI Market Advantage, US MULO, (Pre)Data Ending 2/23/2020 and (Pandemic) Data Ending 5/17/20 *Fixed Weight + Random Weight Source: 2019 IRI Fresh Survey
of consumers said that organic is important when fresh food shopping Pandemic
SHARE 1.4 5.2 0.1 2.1
20%
© 2020 Information Resources Inc. (IRI). Confidential and Proprietary. 33
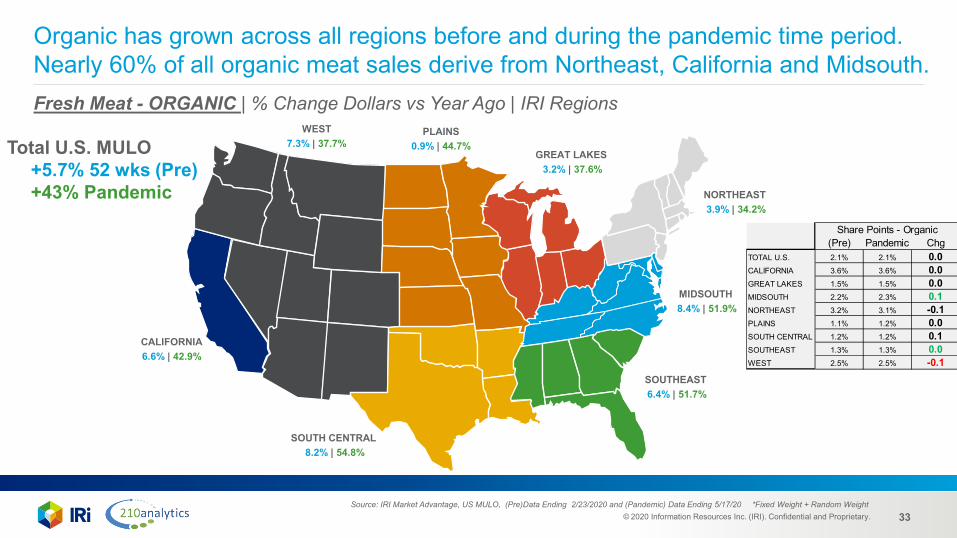
Organic has grown across all regions before and during the pandemic time period. Nearly 60% of all organic meat sales derive from Northeast, California and Midsouth.Fresh Meat - ORGANIC | % Change Dollars vs Year Ago | IRI Regions
WEST7.3% | 37.7%
CALIFORNIA6.6% | 42.9%
SOUTH CENTRAL 8.2% | 54.8%
SOUTHEAST 6.4% | 51.7%
NORTHEAST 3.9% | 34.2%
PLAINS 0.9% | 44.7%
GREAT LAKES 3.2% | 37.6%
MIDSOUTH 8.4% | 51.9%
Total U.S. MULO+5.7% 52 wks (Pre)+43% Pandemic
Source: IRI Market Advantage, US MULO, (Pre)Data Ending 2/23/2020 and (Pandemic) Data Ending 5/17/20 *Fixed Weight + Random Weight
(Pre) Pandemic ChgTOTAL U.S. 2.1% 2.1% 0.0CALIFORNIA 3.6% 3.6% 0.0GREAT LAKES 1.5% 1.5% 0.0MIDSOUTH 2.2% 2.3% 0.1NORTHEAST 3.2% 3.1% -0.1PLAINS 1.1% 1.2% 0.0SOUTH CENTRAL 1.2% 1.2% 0.1SOUTHEAST 1.3% 1.3% 0.0WEST 2.5% 2.5% -0.1
Share Points - Organic
© 2020 Information Resources Inc. (IRI). Confidential and Proprietary. 34
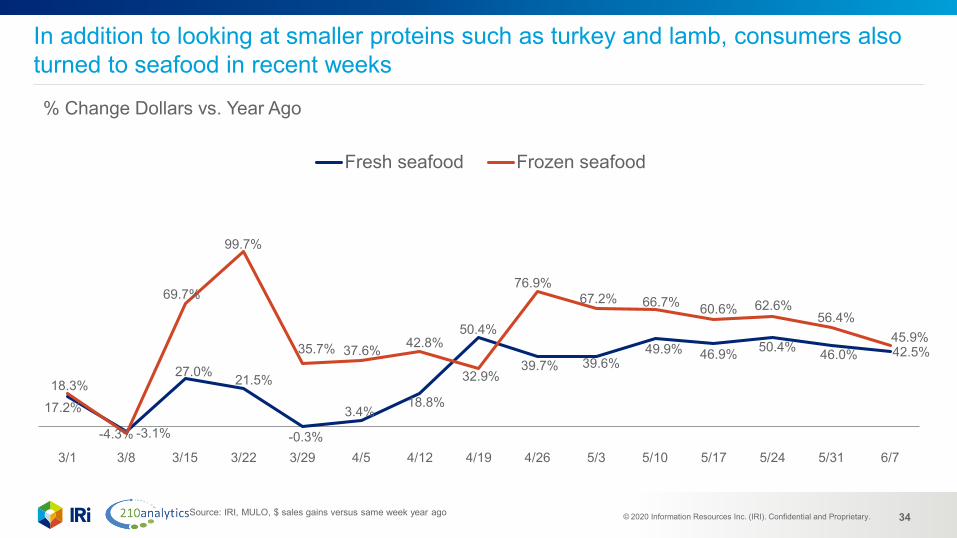
In addition to looking at smaller proteins such as turkey and lamb, consumers also turned to seafood in recent weeks
Source: IRI, MULO, $ sales gains versus same week year ago
17.2%
-3.1%
27.0% 21.5%
-0.3%
3.4%18.8%
50.4%
39.7% 39.6%49.9% 46.9% 50.4% 46.0% 42.5%
18.3%
-4.3%
69.7%
99.7%
35.7% 37.6% 42.8%
32.9%
76.9%67.2% 66.7% 60.6% 62.6%
56.4%45.9%
3/1 3/8 3/15 3/22 3/29 4/5 4/12 4/19 4/26 5/3 5/10 5/17 5/24 5/31 6/7
Fresh seafood Frozen seafood
% Change Dollars vs. Year Ago
© 2020 Information Resources Inc. (IRI). Confidential and Proprietary. 35
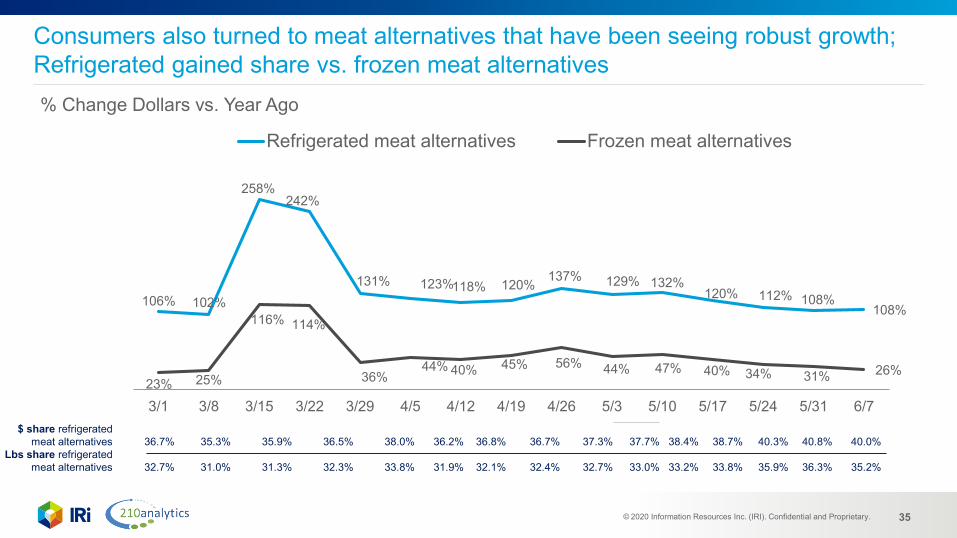
Consumers also turned to meat alternatives that have been seeing robust growth;Refrigerated gained share vs. frozen meat alternatives
106% 102%
258%242%
131% 123%118% 120% 137% 129% 132%120% 112% 108%
108%
23% 25%
116% 114%
36%44% 40% 45% 56% 44% 47% 40% 34% 31% 26%
3/1 3/8 3/15 3/22 3/29 4/5 4/12 4/19 4/26 5/3 5/10 5/17 5/24 5/31 6/7
Refrigerated meat alternatives Frozen meat alternatives
$ share refrigerated meat alternatives 36.7% 35.3% 35.9% 36.5% 38.0% 36.2% 36.8% 36.7% 37.3% 37.7% 38.4% 38.7% 40.3% 40.8% 40.0%
Lbs share refrigerated meat alternatives 32.7% 31.0% 31.3% 32.3% 33.8% 31.9% 32.1% 32.4% 32.7% 33.0% 33.2% 33.8% 35.9% 36.3% 35.2%
% Change Dollars vs. Year Ago
© 2020 Information Resources Inc. (IRI). Confidential and Proprietary. 36
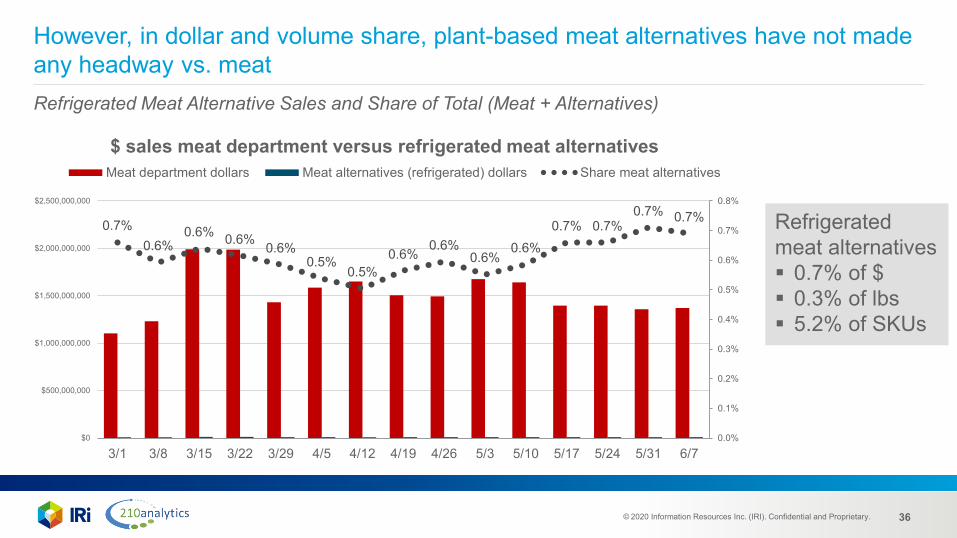
However, in dollar and volume share, plant-based meat alternatives have not made any headway vs. meatRefrigerated Meat Alternative Sales and Share of Total (Meat + Alternatives)
0.7%0.6%
0.6% 0.6% 0.6%0.5%
0.5%0.6%
0.6%0.6%
0.6%0.7% 0.7%
0.7% 0.7%
0.0%
0.1%
0.2%
0.3%
0.4%
0.5%
0.6%
0.7%
0.8%
$0
$500,000,000
$1,000,000,000
$1,500,000,000
$2,000,000,000
$2,500,000,000
3/1 3/8 3/15 3/22 3/29 4/5 4/12 4/19 4/26 5/3 5/10 5/17 5/24 5/31 6/7
$ sales meat department versus refrigerated meat alternatives Meat department dollars Meat alternatives (refrigerated) dollars Share meat alternatives
Refrigerated meat alternatives 0.7% of $ 0.3% of lbs 5.2% of SKUs
© 2020 Information Resources Inc. (IRI). Confidential and Proprietary. 37
Performance by cut Value-added Grinds Meat types
© 2020 Information Resources Inc. (IRI). Confidential and Proprietary. 38
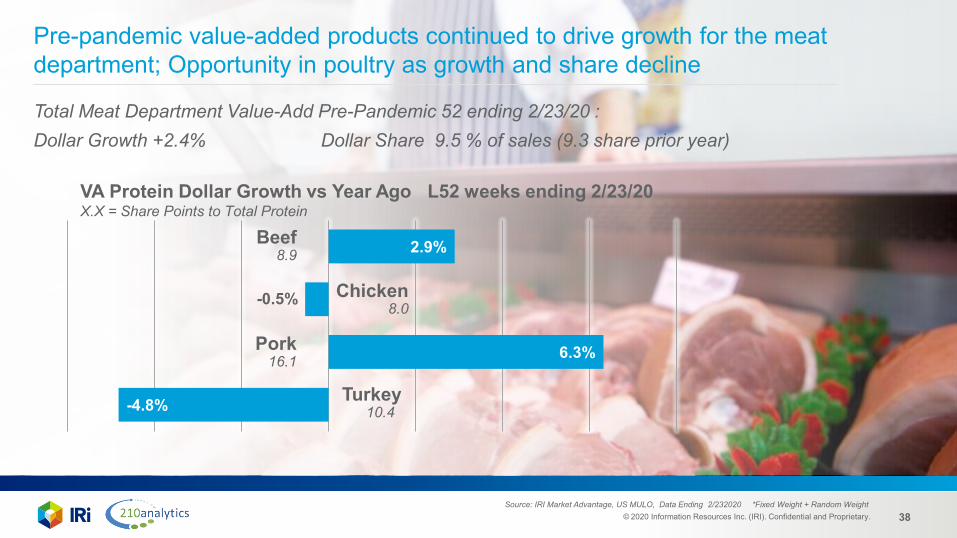
Pre-pandemic value-added products continued to drive growth for the meat department; Opportunity in poultry as growth and share decline
Total Meat Department Value-Add Pre-Pandemic 52 ending 2/23/20 : Dollar Growth +2.4% Dollar Share 9.5 % of sales (9.3 share prior year)
VA Protein Dollar Growth vs Year Ago L52 weeks ending 2/23/20X.X = Share Points to Total Protein
Source: IRI Market Advantage, US MULO, Data Ending 2/232020 *Fixed Weight + Random Weight
-4.8%
6.3%
2.9%
-0.5%
Beef8.9
Chicken8.0
Pork16.1
Turkey10.4
© 2020 Information Resources Inc. (IRI). Confidential and Proprietary. 39
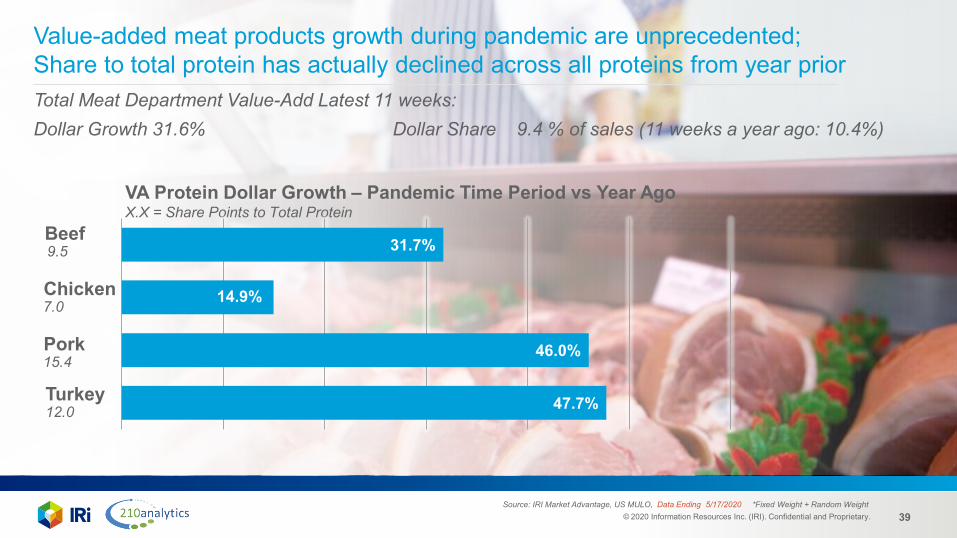
Value-added meat products growth during pandemic are unprecedented;Share to total protein has actually declined across all proteins from year priorTotal Meat Department Value-Add Latest 11 weeks: Dollar Growth 31.6% Dollar Share 9.4 % of sales (11 weeks a year ago: 10.4%)
VA Protein Dollar Growth – Pandemic Time Period vs Year AgoX.X = Share Points to Total Protein
Source: IRI Market Advantage, US MULO, Data Ending 5/17/2020 *Fixed Weight + Random Weight
47.7%
46.0%
14.9%
31.7%Beef9.5
Chicken7.0
Pork15.4
Turkey12.0
© 2020 Information Resources Inc. (IRI). Confidential and Proprietary. 40
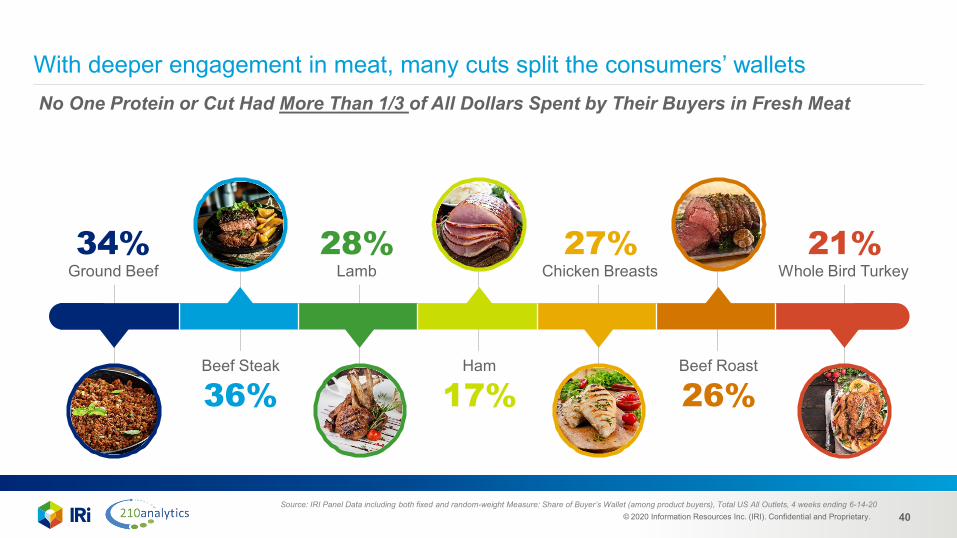
With deeper engagement in meat, many cuts split the consumers’ wallets
Source: IRI Panel Data including both fixed and random-weight Measure: Share of Buyer’s Wallet (among product buyers), Total US All Outlets, 4 weeks ending 6-14-20
No One Protein or Cut Had More Than 1/3 of All Dollars Spent by Their Buyers in Fresh Meat
Ground Beef
Beef RoastHamBeef Steak
Whole Bird TurkeyChicken BreastsLamb34%
36%
28% 21%27%
17% 26%
© 2020 Information Resources Inc. (IRI). Confidential and Proprietary. 41
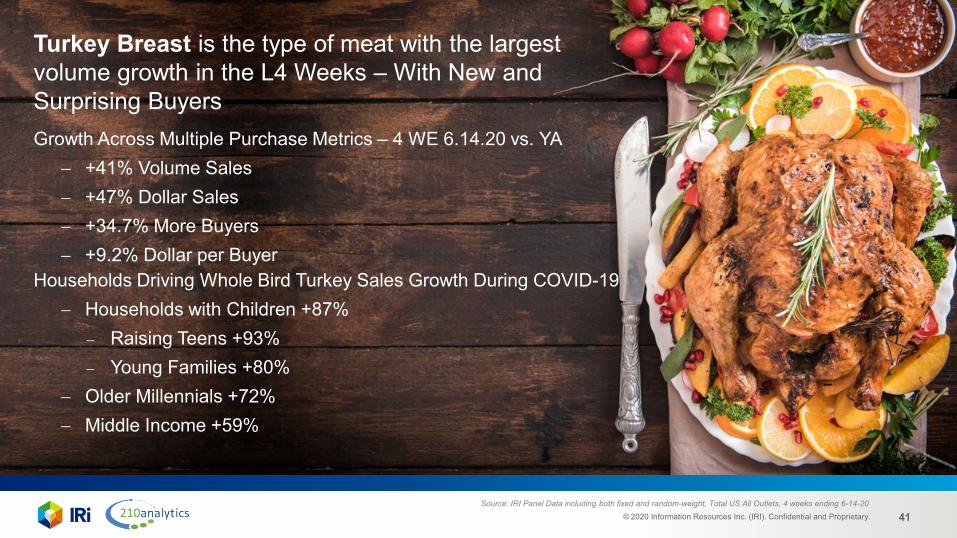
Turkey Breast is the type of meat with the largest volume growth in the L4 Weeks – With New and Surprising Buyers
Source: IRI Panel Data including both fixed and random-weight, Total US All Outlets, 4 weeks ending 6-14-20
Households Driving Whole Bird Turkey Sales Growth During COVID-19− Households with Children +87%
− Raising Teens +93%− Young Families +80%
− Older Millennials +72%− Middle Income +59%
Growth Across Multiple Purchase Metrics – 4 WE 6.14.20 vs. YA− +41% Volume Sales− +47% Dollar Sales − +34.7% More Buyers − +9.2% Dollar per Buyer
© 2020 Information Resources Inc. (IRI). Confidential and Proprietary. 42
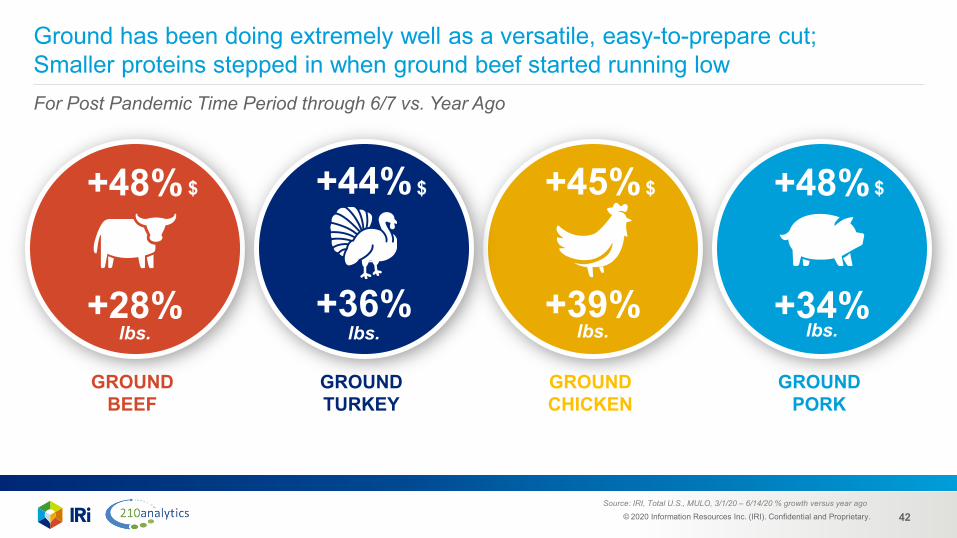
Ground has been doing extremely well as a versatile, easy-to-prepare cut;Smaller proteins stepped in when ground beef started running lowFor Post Pandemic Time Period through 6/7 vs. Year Ago
+28% +36% +39% +34%
GROUND BEEF
GROUND TURKEY
GROUND CHICKEN
GROUND PORK
Source: IRI, Total U.S., MULO, 3/1/20 – 6/14/20 % growth versus year ago
+48% +44% +45% +48%$
lbs. lbs. lbs. lbs.
$ $ $
© 2020 Information Resources Inc. (IRI). Confidential and Proprietary. 43
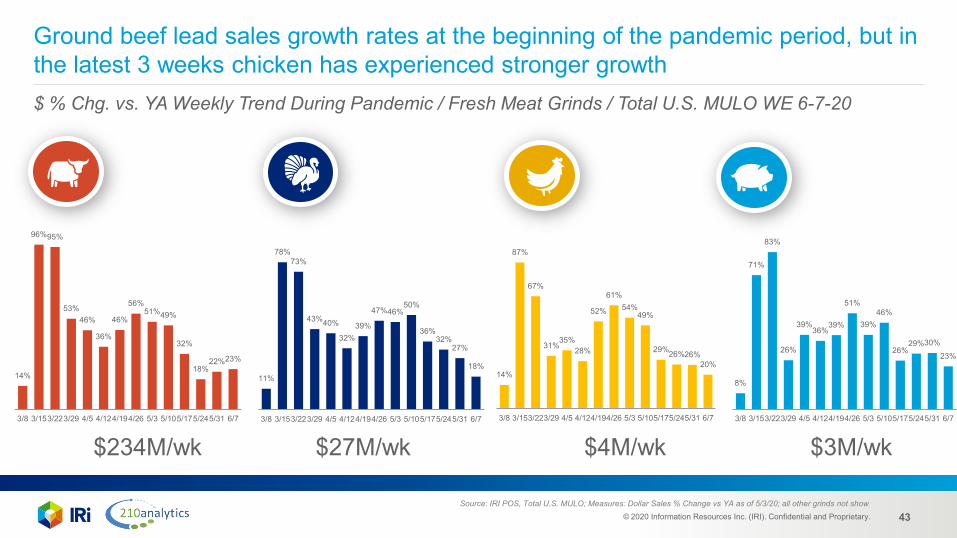
Ground beef lead sales growth rates at the beginning of the pandemic period, but in the latest 3 weeks chicken has experienced stronger growth $ % Chg. vs. YA Weekly Trend During Pandemic / Fresh Meat Grinds / Total U.S. MULO WE 6-7-20
14%
96%95%
53%46%
36%
46%
56%51%49%
32%
18%22%23%
3/8 3/153/223/29 4/5 4/124/194/26 5/3 5/105/175/245/31 6/7
14%
87%
67%
31%35%
28%
52%
61%54%
49%
29%26%26%20%
3/8 3/153/223/29 4/5 4/124/194/26 5/3 5/105/175/245/31 6/7
8%
71%
83%
26%
39%36%
39%
51%
39%46%
26%29%30%
23%
3/8 3/153/223/29 4/5 4/124/194/26 5/3 5/105/175/245/31 6/7
11%
78%73%
43%40%
32%39%
47%46%50%
36%32%
27%
18%
3/8 3/153/223/29 4/5 4/124/194/26 5/3 5/105/175/245/31 6/7
Source: IRI POS, Total U.S. MULO; Measures: Dollar Sales % Change vs YA as of 5/3/20; all other grinds not show
$234M/wk $27M/wk $4M/wk $3M/wk
© 2020 Information Resources Inc. (IRI). Confidential and Proprietary. 44
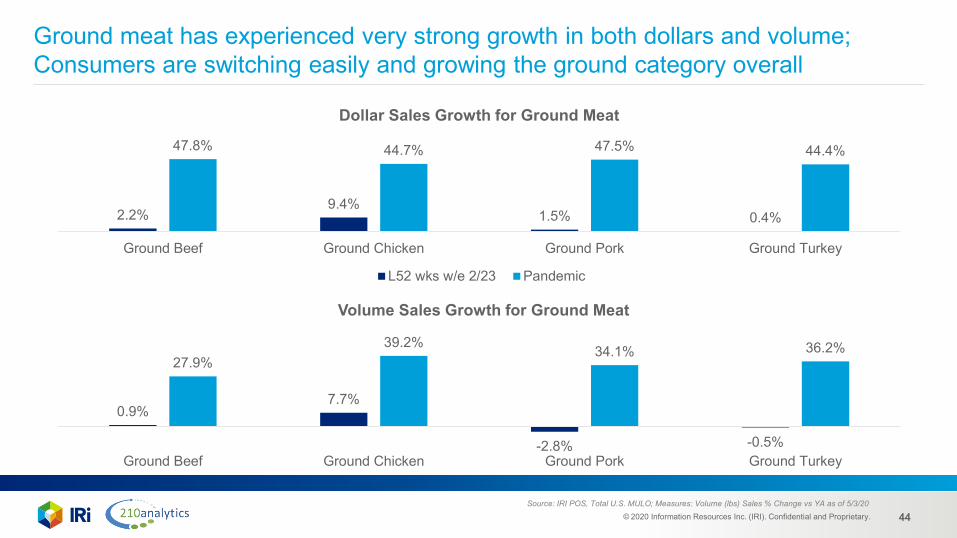
Ground meat has experienced very strong growth in both dollars and volume; Consumers are switching easily and growing the ground category overall
2.2%9.4%
1.5% 0.4%
47.8% 44.7% 47.5% 44.4%
Ground Beef Ground Chicken Ground Pork Ground Turkey
Dollar Sales Growth for Ground Meat
L52 wks w/e 2/23 Pandemic
0.9%7.7%
-2.8% -0.5%
27.9%39.2% 34.1% 36.2%
Ground Beef Ground Chicken Ground Pork Ground Turkey
Volume Sales Growth for Ground Meat
Source: IRI POS, Total U.S. MULO; Measures: Volume (lbs) Sales % Change vs YA as of 5/3/20
© 2020 Information Resources Inc. (IRI). Confidential and Proprietary. 45
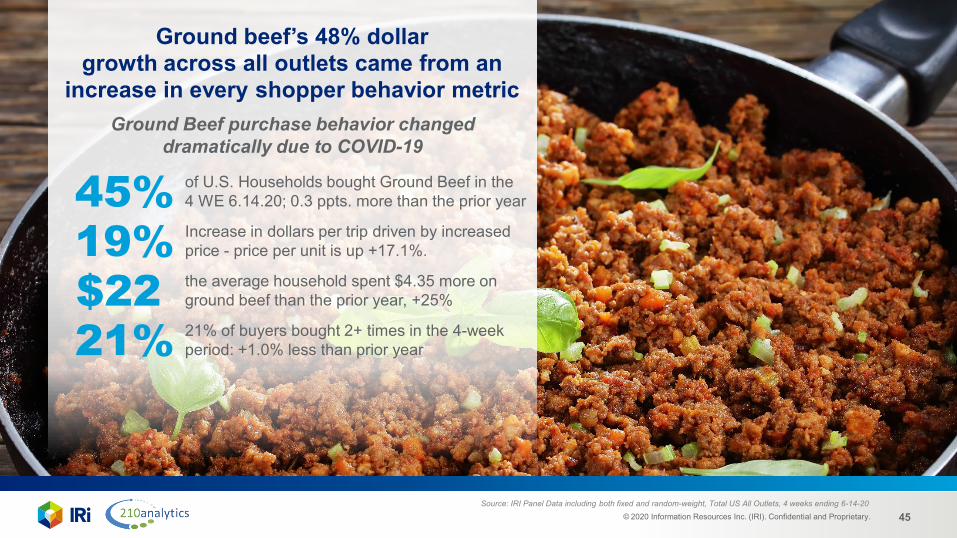
Ground beef’s 48% dollar growth across all outlets came from an
increase in every shopper behavior metricGround Beef purchase behavior changed
dramatically due to COVID-19
Source: IRI Panel Data including both fixed and random-weight, Total US All Outlets, 4 weeks ending 6-14-20
of U.S. Households bought Ground Beef in the 4 WE 6.14.20; 0.3 ppts. more than the prior year45%Increase in dollars per trip driven by increased price - price per unit is up +17.1%.19%the average household spent $4.35 more on ground beef than the prior year, +25%$2221% of buyers bought 2+ times in the 4-week period: +1.0% less than prior year21%
© 2020 Information Resources Inc. (IRI). Confidential and Proprietary. 46
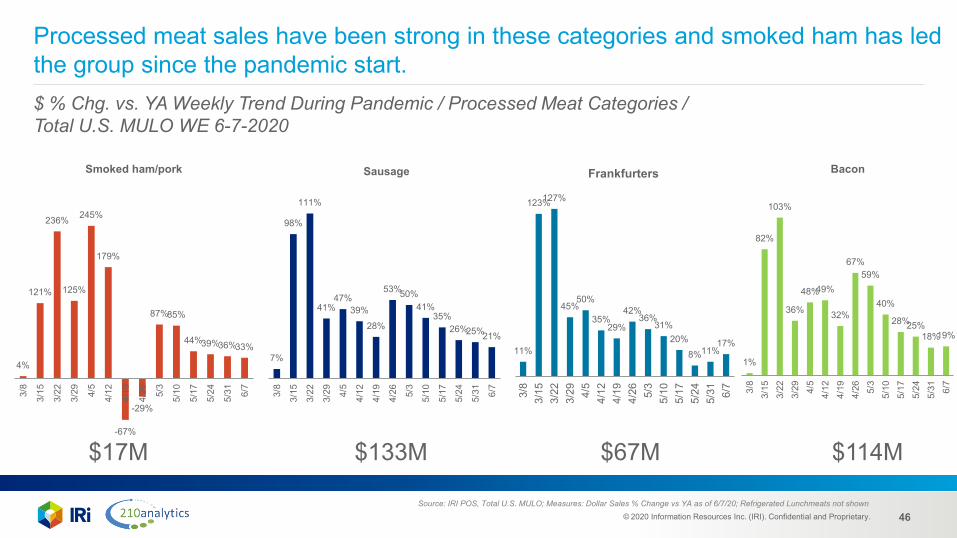
Processed meat sales have been strong in these categories and smoked ham has led the group since the pandemic start. $ % Chg. vs. YA Weekly Trend During Pandemic / Processed Meat Categories / Total U.S. MULO WE 6-7-2020
Source: IRI POS, Total U.S. MULO; Measures: Dollar Sales % Change vs YA as of 6/7/20; Refrigerated Lunchmeats not shown
4%
121%
236%
125%
245%
179%
-67%
-29%
87%85%
44%39%36%33%
3/8
3/15
3/22
3/29 4/
5
4/12
4/19
4/26 5/
3
5/10
5/17
5/24
5/31 6/
7
Smoked ham/pork
7%
98%
111%
41%47%
39%28%
53%50%41%
35%26%25%21%
3/8
3/15
3/22
3/29 4/
5
4/12
4/19
4/26 5/
3
5/10
5/17
5/24
5/31 6/
7
Sausage
1%
82%
103%
36%
48%49%
32%
67%59%
40%
28%25%18%19%
3/8
3/15
3/22
3/29 4/
54/
124/
194/
26 5/3
5/10
5/17
5/24
5/31 6/
7
Bacon
11%
123%127%
45%50%
35%29%
42%36%
31%20%
8%11%17%
3/8
3/15
3/22
3/29 4/5
4/12
4/19
4/26 5/3
5/10
5/17
5/24
5/31 6/7
Frankfurters
$17M $133M $67M $114M
© 2020 Information Resources Inc. (IRI). Confidential and Proprietary. 47
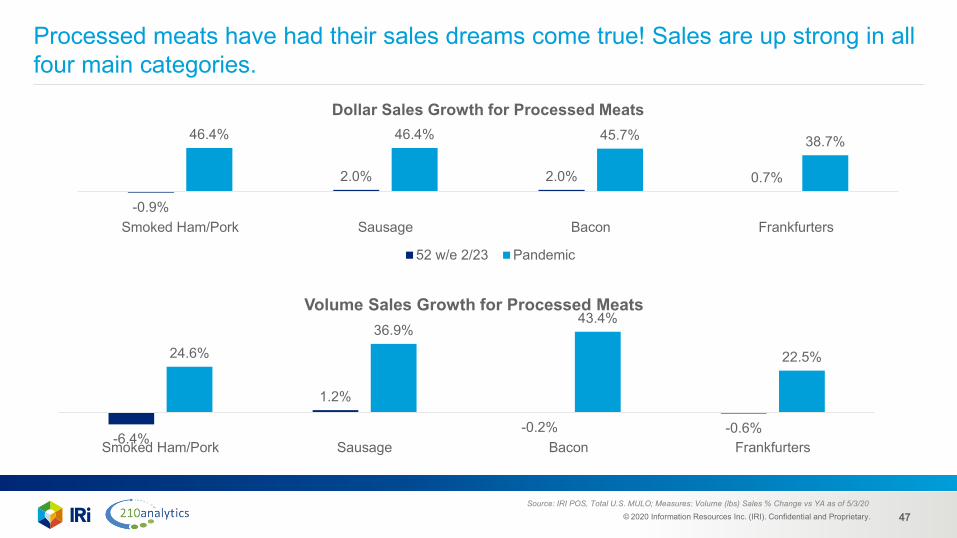
Processed meats have had their sales dreams come true! Sales are up strong in all four main categories.
-0.9%
2.0% 2.0% 0.7%
46.4% 46.4% 45.7% 38.7%
Smoked Ham/Pork Sausage Bacon Frankfurters
Dollar Sales Growth for Processed Meats
52 w/e 2/23 Pandemic
-6.4%
1.2%
-0.2% -0.6%
24.6%36.9%
43.4%
22.5%
Smoked Ham/Pork Sausage Bacon Frankfurters
Volume Sales Growth for Processed Meats
Source: IRI POS, Total U.S. MULO; Measures: Volume (lbs) Sales % Change vs YA as of 5/3/20

© 2020 Information Resources Inc. (IRI). Confidential and Proprietary. 48
ahead
© 2020 Information Resources Inc. (IRI). Confidential and Proprietary. 49
Meat department takeaways and key considerations• People returned to the familiar amid COVID-19 and meat returned to the center of plate• More at-home cooking from scratch driving experimentation and interest across more meal
occasions, including more people around the table• Big upside for meat affinity and knowledge, including appliances, species and cuts• Re-engagement with foodservice has started, but above average grocery share is likely for
months to come• One big opportunity is helping consumers with meal planning
Recommendations:• Pursue new buyers and reinforce new behaviors• Proactively plan for economic pressure with strategic pricing/promotional engagement• E-commerce: win from the first click and drive repeat purchases• Bring solutions, not silos to capture and keep the many new meal occasions
© 2020 Information Resources Inc. (IRI). Confidential and Proprietary. 50
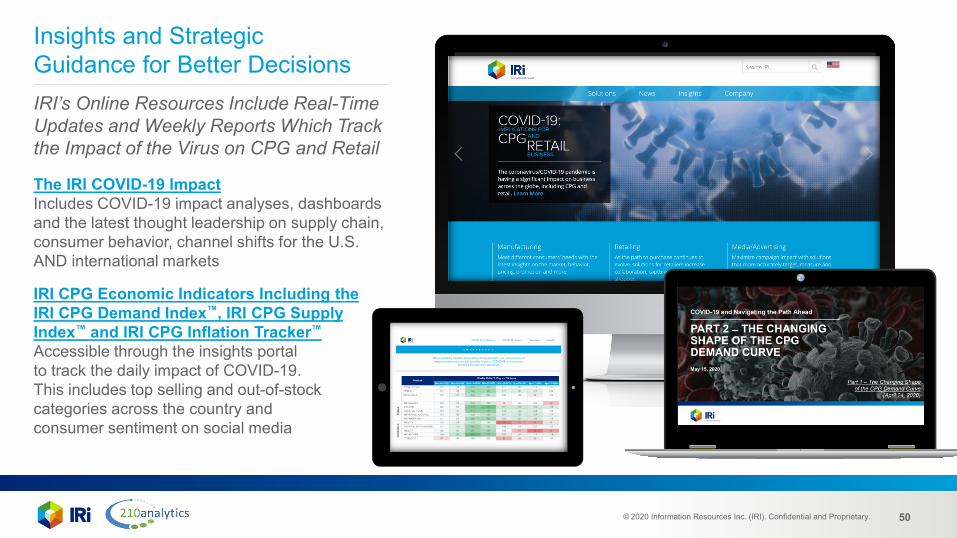
Insights and Strategic Guidance for Better DecisionsIRI’s Online Resources Include Real-Time Updates and Weekly Reports Which Track the Impact of the Virus on CPG and Retail
The IRI COVID-19 lmpactIncludes COVID-19 impact analyses, dashboards and the latest thought leadership on supply chain, consumer behavior, channel shifts for the U.S. AND international markets
IRI CPG Economic Indicators Including the IRI CPG Demand Index™, IRI CPG Supply Index™ and IRI CPG Inflation Tracker™
Accessible through the insights portal to track the daily impact of COVID-19. This includes top selling and out-of-stock categories across the country and consumer sentiment on social media

© 2020 Information Resources Inc. (IRI). Confidential and Proprietary. 51
Want to Be the First to Know?
Registered Users Get New Thought Leadership from IRI’s Research, Data & Analytics Experts
www.iriworldwide.com/en-US/Insights/Subscribe

© 2020 Information Resources Inc. (IRI). Confidential and Proprietary. 52
Questions?
For more information or questions:Chris: [email protected]: [email protected]
© 2020 Information Resources Inc. (IRI). Confidential and Proprietary. 53
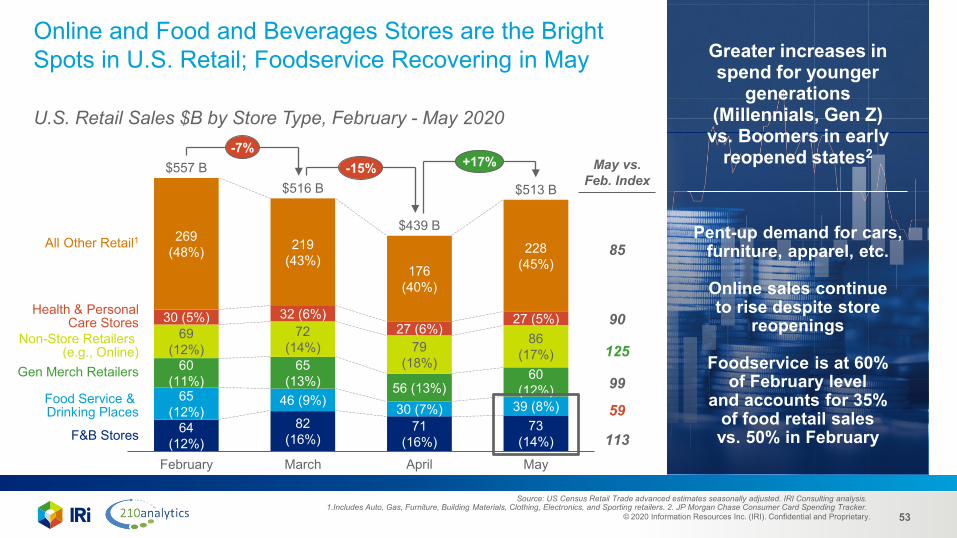
Online and Food and Beverages Stores are the Bright Spots in U.S. Retail; Foodservice Recovering in May
U.S. Retail Sales $B by Store Type, February - May 2020
Greater increases in spend for younger
generations (Millennials, Gen Z)
vs. Boomers in early reopened states2
Pent-up demand for cars, furniture, apparel, etc.
Online sales continue to rise despite store
reopenings
Foodservice is at 60% of February level
and accounts for 35% of food retail sales vs. 50% in February
Source: US Census Retail Trade advanced estimates seasonally adjusted. IRI Consulting analysis.1.Includes Auto, Gas, Furniture, Building Materials, Clothing, Electronics, and Sporting retailers. 2. JP Morgan Chase Consumer Card Spending Tracker.
69(12%)
228(45%)
73(14%)
30 (5%)
30 (7%)
269(48%)
46 (9%)
65(13%)
72(14%)
32 (6%)
March
71(16%)
39 (8%)56 (13%)
79(18%)
82(16%)
176(40%)
Food Service & Drinking Places
April
60(12%)
27 (6%)86
(17%)
27 (5%)Health & Personal
Care Stores
May
Gen Merch Retailers
F&B Stores
All Other Retail1
$557 B$516 B
$439 B
64(12%)
219(43%)
February
65(12%)
60(11%)
$513 B
Non-Store Retailers (e.g., Online)
-7%-15% +17% May vs.
Feb. Index
85
90
125
99
59
113
© 2020 Information Resources Inc. (IRI). Confidential and Proprietary. 54
CY 2019
Jan + Feb Mar Apr MayCY
2019Jan + Feb Mar Apr MayCY
2019Jan + Feb Mar Apr May
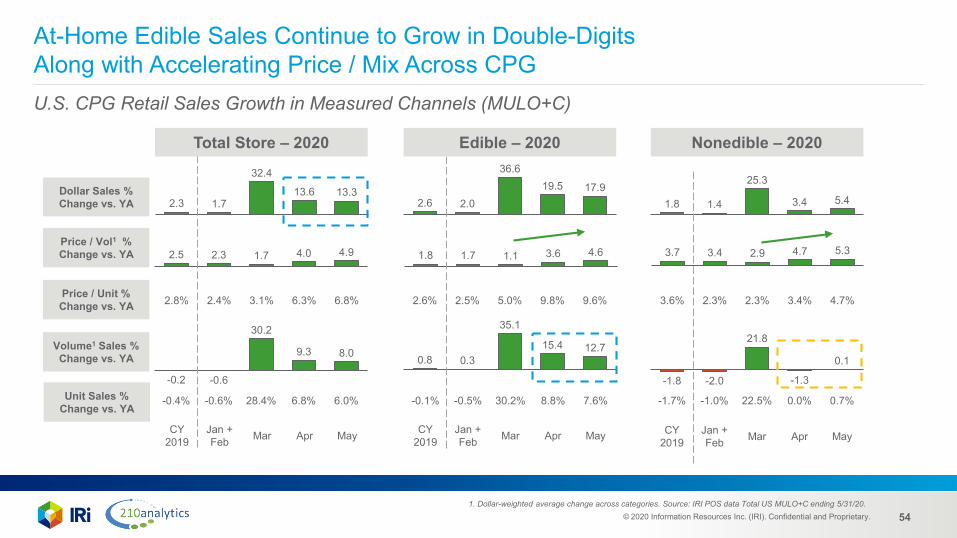
3.6% 2.3% 2.3% 3.4% 4.7%2.6% 2.5% 5.0% 9.8% 9.6%2.8% 2.4% 3.1% 6.3% 6.8%
-1.7% -1.0% 22.5% 0.0% 0.7%-0.1% -0.5% 30.2% 8.8% 7.6%-0.4% -0.6% 28.4% 6.8% 6.0%
At-Home Edible Sales Continue to Grow in Double-Digits Along with Accelerating Price / Mix Across CPGU.S. CPG Retail Sales Growth in Measured Channels (MULO+C)
Volume1 Sales % Change vs. YA
2.3 1.7
32.4
13.6 13.3
2.5 2.3 1.7 4.0 4.9
-0.6
30.2
9.3 8.0
-0.2
2.6 2.0
36.619.5 17.9
1.8 1.7 1.1 3.6 4.6
0.8 0.3
35.1
15.4 12.7
1.8 1.4
25.3
3.4 5.4
3.7 3.4 2.9 4.7 5.3
-1.8 -2.0
21.8
-1.3
0.1
1. Dollar-weighted average change across categories. Source: IRI POS data Total US MULO+C ending 5/31/20.
Dollar Sales % Change vs. YA
Price / Vol1 % Change vs. YA
Price / Unit % Change vs. YA
Unit Sales % Change vs. YA
Total Store – 2020 Edible – 2020 Nonedible – 2020
© 2020 Information Resources Inc. (IRI). Confidential and Proprietary. 55
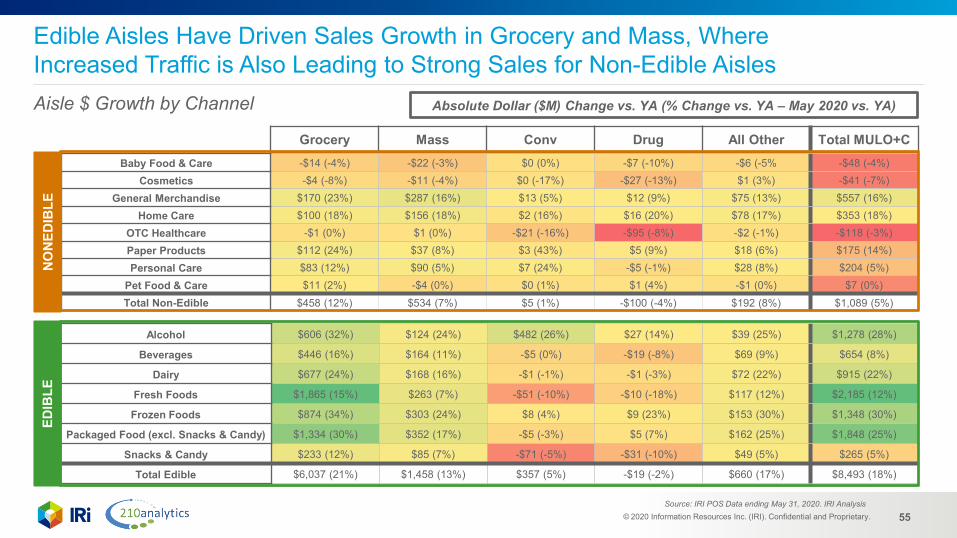
Baby Food & Care -$14 (-4%) -$22 (-3%) $0 (0%) -$7 (-10%) -$6 (-5% -$48 (-4%)Cosmetics -$4 (-8%) -$11 (-4%) $0 (-17%) -$27 (-13%) $1 (3%) -$41 (-7%)
General Merchandise $170 (23%) $287 (16%) $13 (5%) $12 (9%) $75 (13%) $557 (16%)Home Care $100 (18%) $156 (18%) $2 (16%) $16 (20%) $78 (17%) $353 (18%)
OTC Healthcare -$1 (0%) $1 (0%) -$21 (-16%) -$95 (-8%) -$2 (-1%) -$118 (-3%)Paper Products $112 (24%) $37 (8%) $3 (43%) $5 (9%) $18 (6%) $175 (14%)Personal Care $83 (12%) $90 (5%) $7 (24%) -$5 (-1%) $28 (8%) $204 (5%)
Pet Food & Care $11 (2%) -$4 (0%) $0 (1%) $1 (4%) -$1 (0%) $7 (0%)Total Non-Edible $458 (12%) $534 (7%) $5 (1%) -$100 (-4%) $192 (8%) $1,089 (5%)
Alcohol $606 (32%) $124 (24%) $482 (26%) $27 (14%) $39 (25%) $1,278 (28%)
Beverages $446 (16%) $164 (11%) -$5 (0%) -$19 (-8%) $69 (9%) $654 (8%)
Dairy $677 (24%) $168 (16%) -$1 (-1%) -$1 (-3%) $72 (22%) $915 (22%)
Fresh Foods $1,865 (15%) $263 (7%) -$51 (-10%) -$10 (-18%) $117 (12%) $2,185 (12%)
Frozen Foods $874 (34%) $303 (24%) $8 (4%) $9 (23%) $153 (30%) $1,348 (30%)
Packaged Food (excl. Snacks & Candy) $1,334 (30%) $352 (17%) -$5 (-3%) $5 (7%) $162 (25%) $1,848 (25%)
Snacks & Candy $233 (12%) $85 (7%) -$71 (-5%) -$31 (-10%) $49 (5%) $265 (5%)
Total Edible $6,037 (21%) $1,458 (13%) $357 (5%) -$19 (-2%) $660 (17%) $8,493 (18%)
Grocery Mass Conv Drug All Other Total MULO+C
EDIB
LEN
ON
EDIB
LEEdible Aisles Have Driven Sales Growth in Grocery and Mass, Where Increased Traffic is Also Leading to Strong Sales for Non-Edible AislesAisle $ Growth by Channel Absolute Dollar ($M) Change vs. YA (% Change vs. YA – May 2020 vs. YA)
Source: IRI POS Data ending May 31, 2020. IRI Analysis
© 2020 Information Resources Inc. (IRI). Confidential and Proprietary. 56
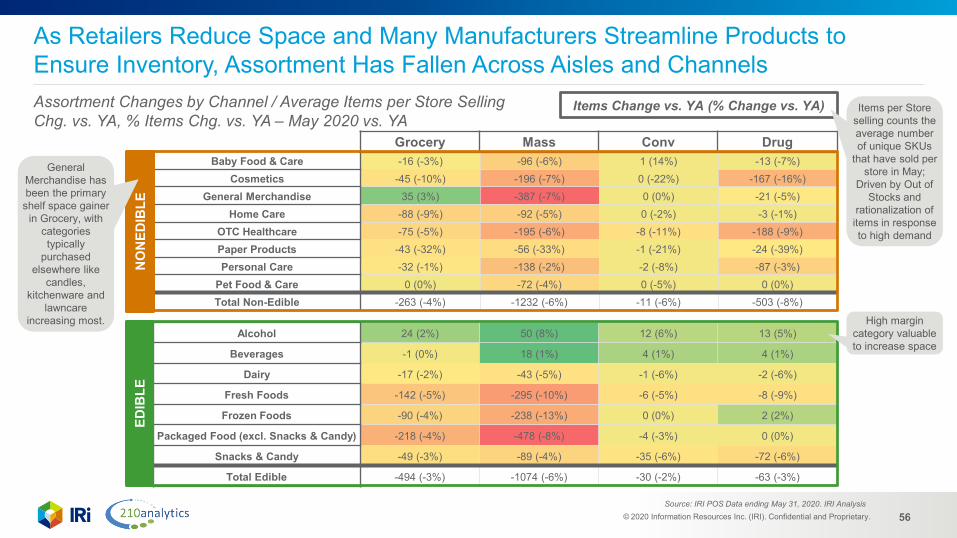
Baby Food & Care -16 (-3%) -96 (-6%) 1 (14%) -13 (-7%)Cosmetics -45 (-10%) -196 (-7%) 0 (-22%) -167 (-16%)
General Merchandise 35 (3%) -387 (-7%) 0 (0%) -21 (-5%)Home Care -88 (-9%) -92 (-5%) 0 (-2%) -3 (-1%)
OTC Healthcare -75 (-5%) -195 (-6%) -8 (-11%) -188 (-9%)Paper Products -43 (-32%) -56 (-33%) -1 (-21%) -24 (-39%)Personal Care -32 (-1%) -138 (-2%) -2 (-8%) -87 (-3%)
Pet Food & Care 0 (0%) -72 (-4%) 0 (-5%) 0 (0%)Total Non-Edible -263 (-4%) -1232 (-6%) -11 (-6%) -503 (-8%)
Alcohol 24 (2%) 50 (8%) 12 (6%) 13 (5%)
Beverages -1 (0%) 18 (1%) 4 (1%) 4 (1%)
Dairy -17 (-2%) -43 (-5%) -1 (-6%) -2 (-6%)
Fresh Foods -142 (-5%) -295 (-10%) -6 (-5%) -8 (-9%)
Frozen Foods -90 (-4%) -238 (-13%) 0 (0%) 2 (2%)
Packaged Food (excl. Snacks & Candy) -218 (-4%) -478 (-8%) -4 (-3%) 0 (0%)
Snacks & Candy -49 (-3%) -89 (-4%) -35 (-6%) -72 (-6%)
Total Edible -494 (-3%) -1074 (-6%) -30 (-2%) -63 (-3%)
Grocery Mass Conv DrugED
IBLE
NO
NED
IBLE
As Retailers Reduce Space and Many Manufacturers Streamline Products to Ensure Inventory, Assortment Has Fallen Across Aisles and ChannelsAssortment Changes by Channel / Average Items per Store Selling Chg. vs. YA, % Items Chg. vs. YA – May 2020 vs. YA
General Merchandise has been the primary
shelf space gainer in Grocery, with
categories typically
purchased elsewhere like
candles, kitchenware and
lawncare increasing most.
Items Change vs. YA (% Change vs. YA)
High margin category valuable to increase space
Items per Store selling counts the average number of unique SKUs
that have sold per store in May;
Driven by Out of Stocks and
rationalization of items in response to high demand
Source: IRI POS Data ending May 31, 2020. IRI Analysis
© 2020 Information Resources Inc. (IRI). Confidential and Proprietary. 57
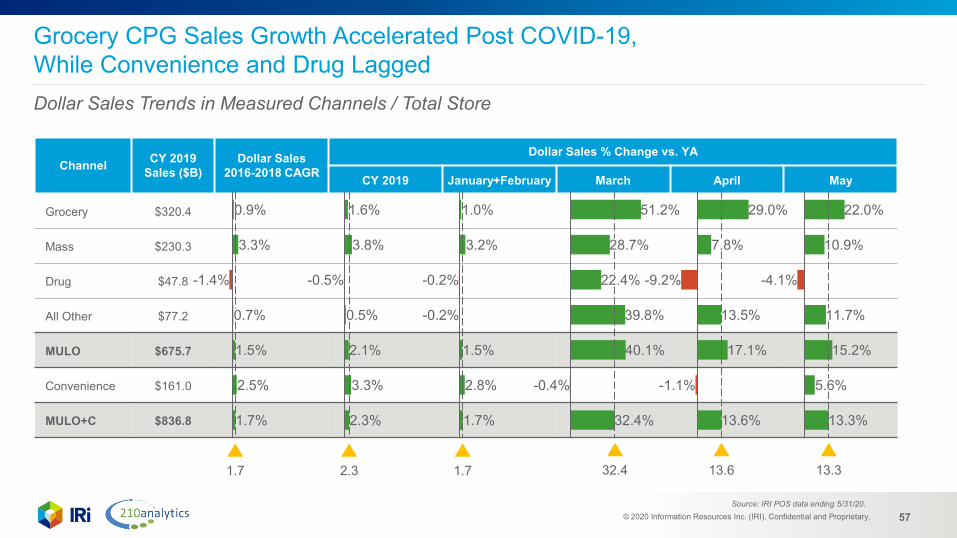
Channel CY 2019 Sales ($B)
Dollar Sales 2016-2018 CAGR
Dollar Sales % Change vs. YA
CY 2019 January+February March April May
Grocery $320.4
Mass $230.3
Drug $47.8
All Other $77.2
MULO $675.7
Convenience $161.0
MULO+C $836.8
22.0%
10.9%
-4.1%
11.7%
15.2%
5.6%
13.3%
Grocery CPG Sales Growth Accelerated Post COVID-19, While Convenience and Drug LaggedDollar Sales Trends in Measured Channels / Total Store
0.9%
3.3%
-1.4%
0.7%
1.5%
2.5%
1.7%
1.7
1.6%
3.8%
-0.5%
0.5%
2.1%
3.3%
2.3%
2.3
1.0%
3.2%
-0.2%
-0.2%
1.5%
2.8%
1.7%
1.7
29.0%
7.8%
-9.2%
13.5%
17.1%
-1.1%
13.6%
13.6 13.3
Source: IRI POS data ending 5/31/20.
51.2%
28.7%
22.4%
39.8%
40.1%
-0.4%
32.4%
32.4
© 2020 Information Resources Inc. (IRI). Confidential and Proprietary. 58
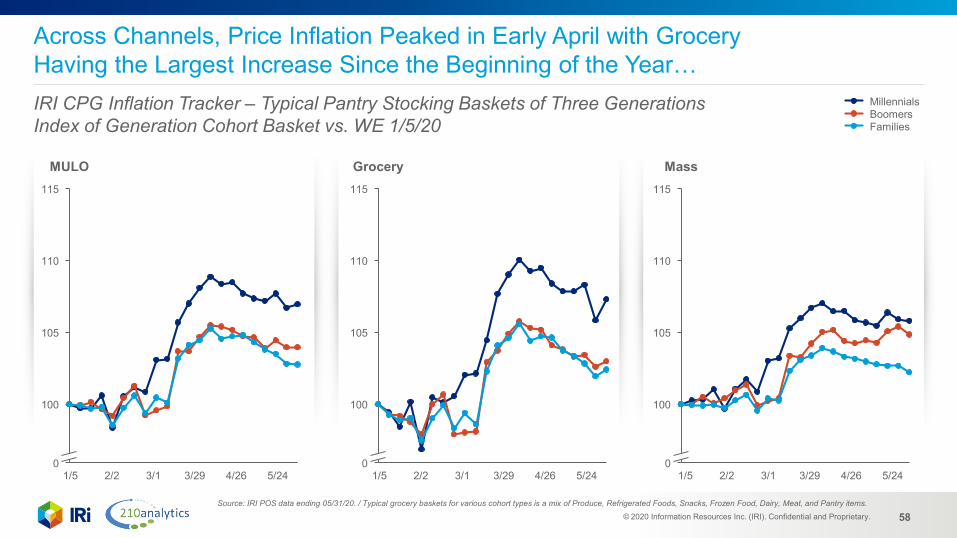
Across Channels, Price Inflation Peaked in Early April with Grocery Having the Largest Increase Since the Beginning of the Year…IRI CPG Inflation Tracker – Typical Pantry Stocking Baskets of Three GenerationsIndex of Generation Cohort Basket vs. WE 1/5/20
0
105
100
110
115
MULO
0
105
100
110
115
Grocery
MillennialsBoomersFamilies
100
0
105
110
115
Mass
1/5 2/2 3/1 3/29 4/26 5/24 1/5 2/2 3/1 3/29 4/26 5/24 1/5 2/2 3/1 3/29 4/26 5/24
Source: IRI POS data ending 05/31/20. / Typical grocery baskets for various cohort types is a mix of Produce, Refrigerated Foods, Snacks, Frozen Food, Dairy, Meat, and Pantry items.
© 2020 Information Resources Inc. (IRI). Confidential and Proprietary. 59
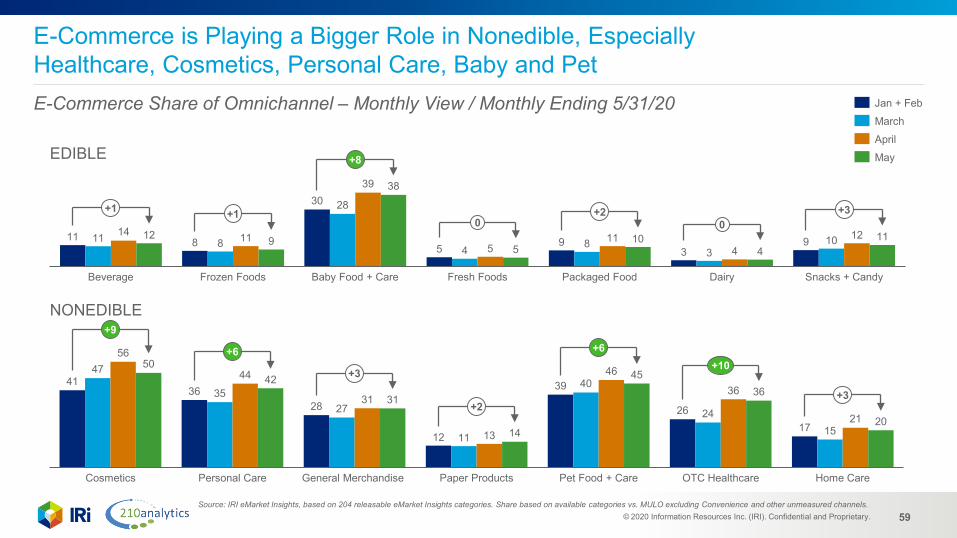
E-Commerce is Playing a Bigger Role in Nonedible, Especially Healthcare, Cosmetics, Personal Care, Baby and PetE-Commerce Share of Omnichannel – Monthly View / Monthly Ending 5/31/20
11 8
30
5 93
911 8
28
4 83
1014 11
39
511
41212 9
38
510
411
Fresh Foods DairyPackaged FoodBeverage Frozen Foods Baby Food + Care Snacks + Candy
+1 +1
+8
0+2
0+3
4136
28
12
39
2617
47
3527
11
40
2415
56
44
31
13
46
36
21
5042
31
14
4536
20
Pet Food + Care Home CareGeneral Merchandise OTC HealthcareCosmetics Personal Care Paper Products
+9
+6
+3
+2
+6+10
+3
EDIBLE
NONEDIBLE
Source: IRI eMarket Insights, based on 204 releasable eMarket Insights categories. Share based on available categories vs. MULO excluding Convenience and other unmeasured channels.
Jan + FebMarchAprilMay
© 2020 Information Resources Inc. (IRI). Confidential and Proprietary. 60
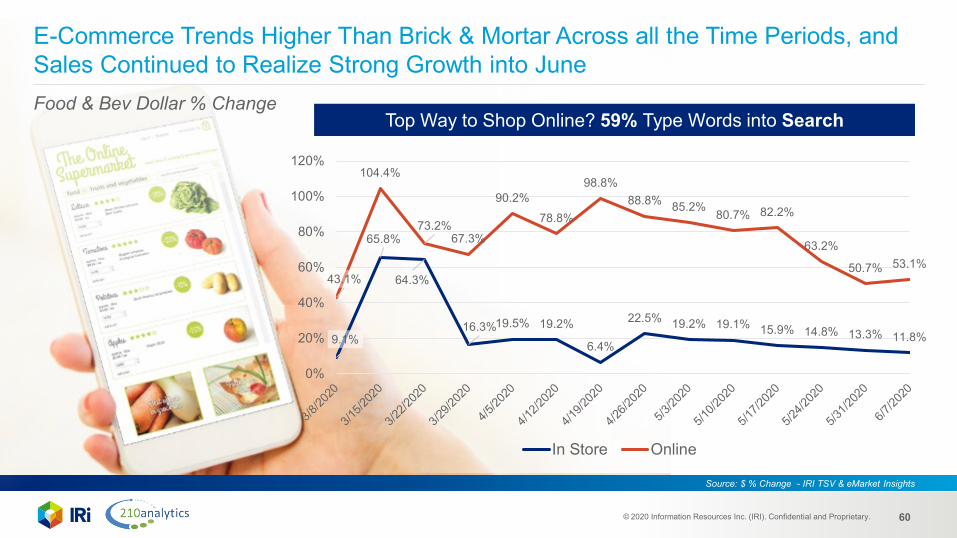
E-Commerce Trends Higher Than Brick & Mortar Across all the Time Periods, and Sales Continued to Realize Strong Growth into JuneFood & Bev Dollar % Change
9.1%
65.8%
64.3%
16.3%19.5% 19.2%
6.4%
22.5% 19.2% 19.1% 15.9% 14.8% 13.3% 11.8%
43.1%
104.4%
73.2%67.3%
90.2%78.8%
98.8%88.8% 85.2% 80.7% 82.2%
63.2%
50.7% 53.1%
0%
20%
40%
60%
80%
100%
120%
In Store Online
Source: $ % Change - IRI TSV & eMarket Insights
Top Way to Shop Online? 59% Type Words into Search
© 2020 Information Resources Inc. (IRI). Confidential and Proprietary. 61
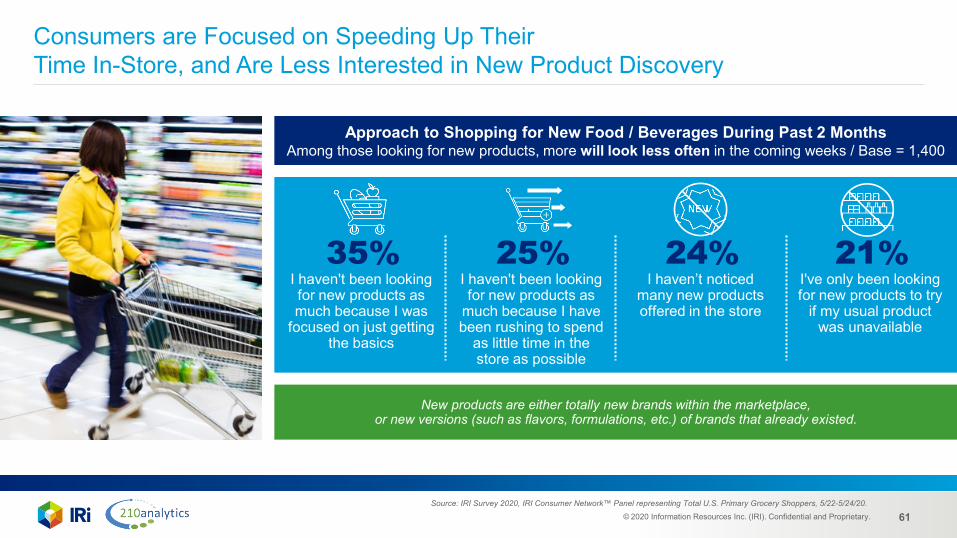
Approach to Shopping for New Food / Beverages During Past 2 MonthsAmong those looking for new products, more will look less often in the coming weeks / Base = 1,400
New products are either totally new brands within the marketplace, or new versions (such as flavors, formulations, etc.) of brands that already existed.
Consumers are Focused on Speeding Up Their Time In-Store, and Are Less Interested in New Product Discovery
Source: IRI Survey 2020, IRI Consumer Network™ Panel representing Total U.S. Primary Grocery Shoppers, 5/22-5/24/20.
35%I haven't been looking for new products as much because I was
focused on just getting the basics
25%I haven't been looking for new products as
much because I have been rushing to spend
as little time in the store as possible
24%I haven’t noticed
many new products offered in the store
21%I've only been looking for new products to try
if my usual product was unavailable