Embed Size (px)
Citation preview
Angus Deaton, Princeton UniversityWORLD STATISTICS DAY: ICP USERS MEETING

The BIG questions
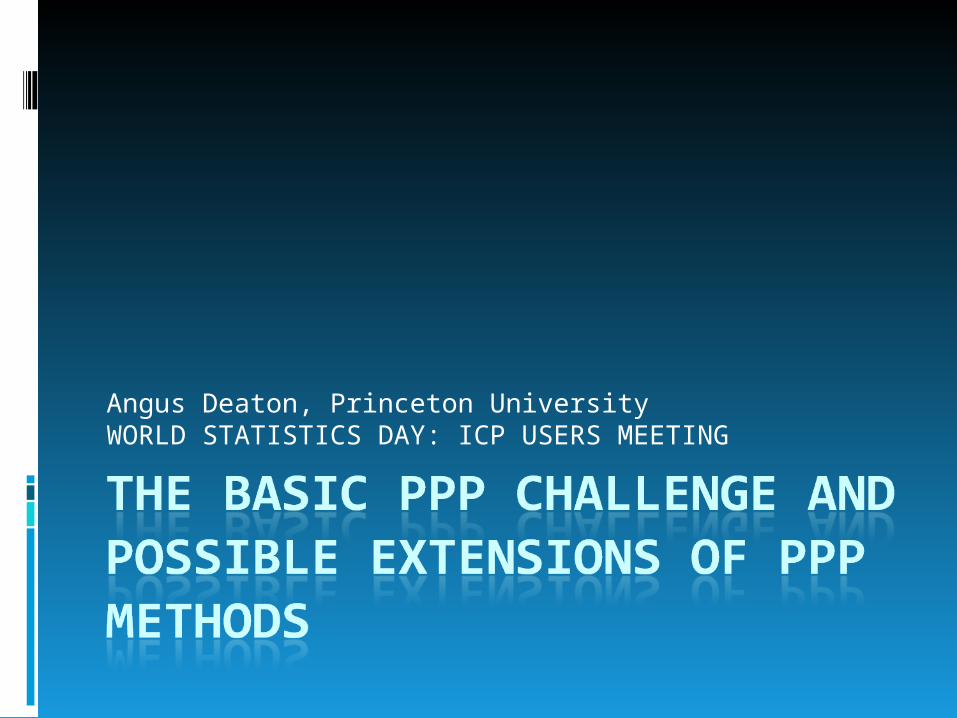
The shape of the world
Who is poor and who is rich? How many poor people are there in the world? How can we measure progress on income
poverty for the MDGs? How do the poor live? What is life really like in
the poorest places in the world? How big are the differences?
What is the ratio of American to Indian income? How do we describe the living standards of poor
people to people in the rich world? The global distribution of income?
Over countries Over the citizens of the world
3
NONE can be answered without PPP exchange
rates
Where do PPPs come from?
Ultimately from the International Comparison Program (ICP) Though the CIA fact-book may be the most
heavily used immediate source For academic users, perhaps the Penn World
Table Or the World Development Indicators
ICP collects prices on comparable goods & services in many countries To construct multilateral price indexes for each
country relative to a base, such as the US For consumption, investment, GDP, etc Used to deflate nominal local currency amounts
to give “real” common unit international PPP measures
5
History
ICP is like the Olympic Games, though somewhat less regular First were just a few Amateurs Over time, professionalized, lots of training Huge improvement in technique Regularly held
First in 1960 & 1970s, U. Penn plus UN Six countries in 1967 Four more in 1970 Prices for relatively small number of goods and
services Extended to other countries using interpolation 1978 results for more than 100 countries
ICP 1993
Before 2008, PPPs used price data collected in 1993, updated for inflation rates since then
Important missing (or partially missing) countries, including India and China, both imputed based on old or incomplete data
A regional system with each region collecting prices on its own, and calculating its own PPPs with regional numeraire
Weak center with ad hoc links between regions Between regional links are Achilles heel of ICP Involve hard comparisons between countries with different
patterns of demand and relative prices Think of comparing a Bihari laborer who eats only rice with a
Congolese farmer, or Japanese factory worker UN (1997) report concluded that the ICP 1993 had lost
credibility Yet these numbers are encoded in the poverty MDG Academic users treat Penn World Table (1993 based) with
abandon
7
ICP 2005
Did much better: global office housed by World Bank
146 countries Including India and China Many African countries never previously included
Regional structure again, each region pricing its own regional list Makes sense, but some regions very diverse
A “ring” of 18 countries, at least 2 in each region Ring countries priced a special ring list of more
than 1,100 commodities These prices were then used to link the regions Calculating price indexes for whole regions relative to
one another
8

Did it make a difference?
(or just same old, same old?)
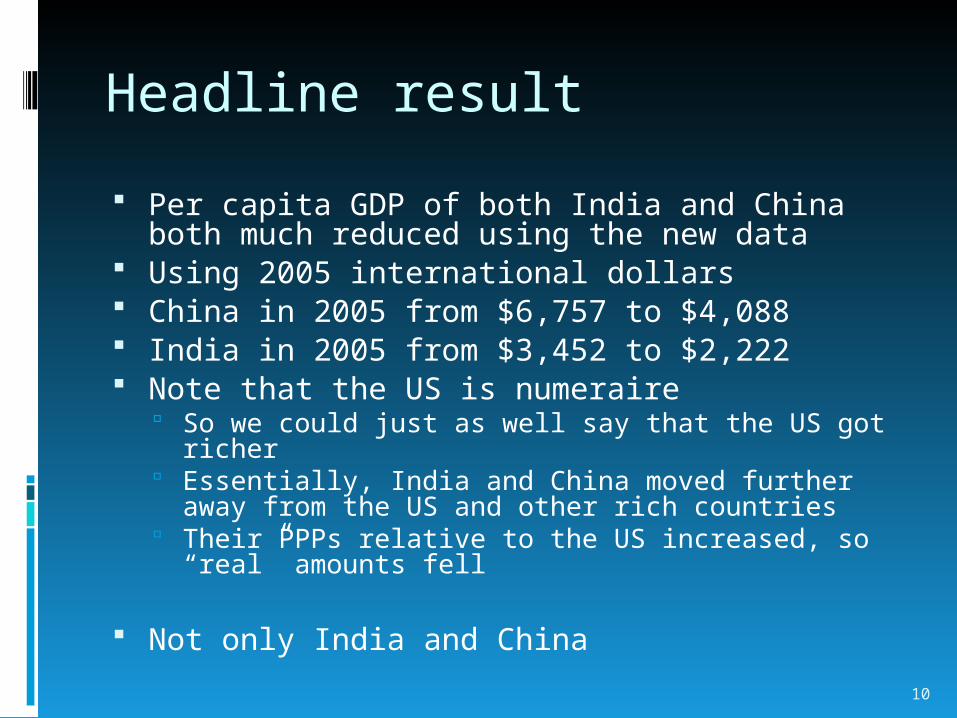
Headline result
Per capita GDP of both India and China both much reduced using the new data
Using 2005 international dollars China in 2005 from $6,757 to $4,088 India in 2005 from $3,452 to $2,222 Note that the US is numeraire
So we could just as well say that the US got richer Essentially, India and China moved further away
from the US and other rich countries Their PPPs relative to the US increased, so “real”
amounts fell
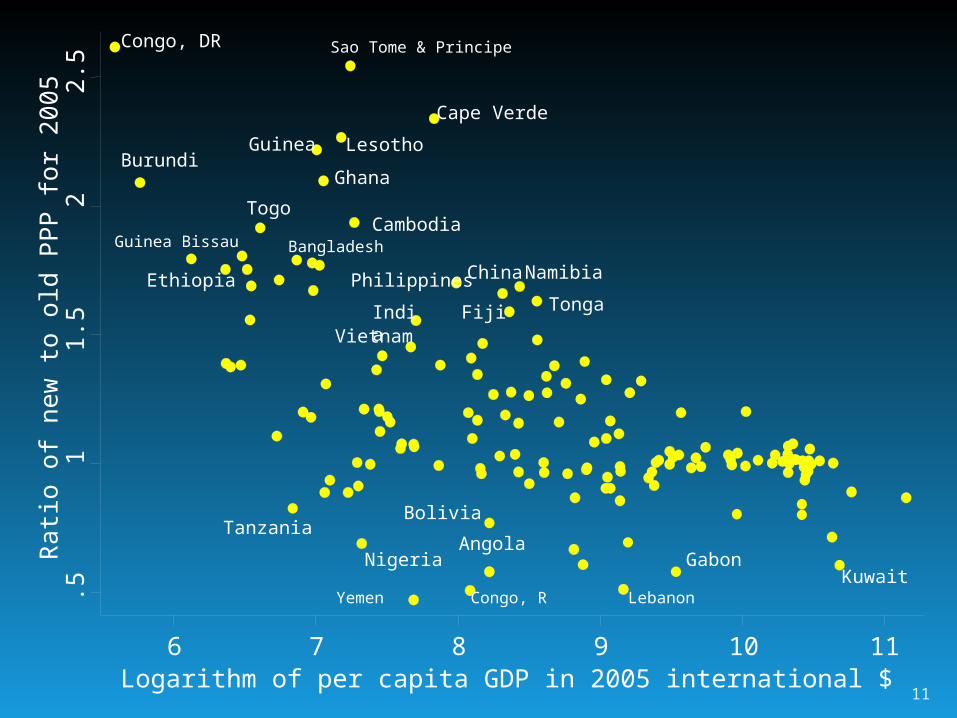
Not only India and China
10
.51
1.5
22.
5R
atio
of n
ew to
old
PP
P fo
r 20
05
6 7 8 9 10 11Logarithm of per capita GDP in 2005 international $
Congo, DR
Burundi
Sao Tome & Principe
Cape Verde
LesothoGuinea
Ghana
CambodiaTogo
Guinea Bissau
India
Philippines China Namibia
Tonga
Yemen Congo, R Lebanon
GabonKuwait
Fiji
Nigeria
TanzaniaAngola
Bolivia
Ethiopia
Vietnam
Bangladesh
11
.5.5
2.5
4.5
6.5
8.6
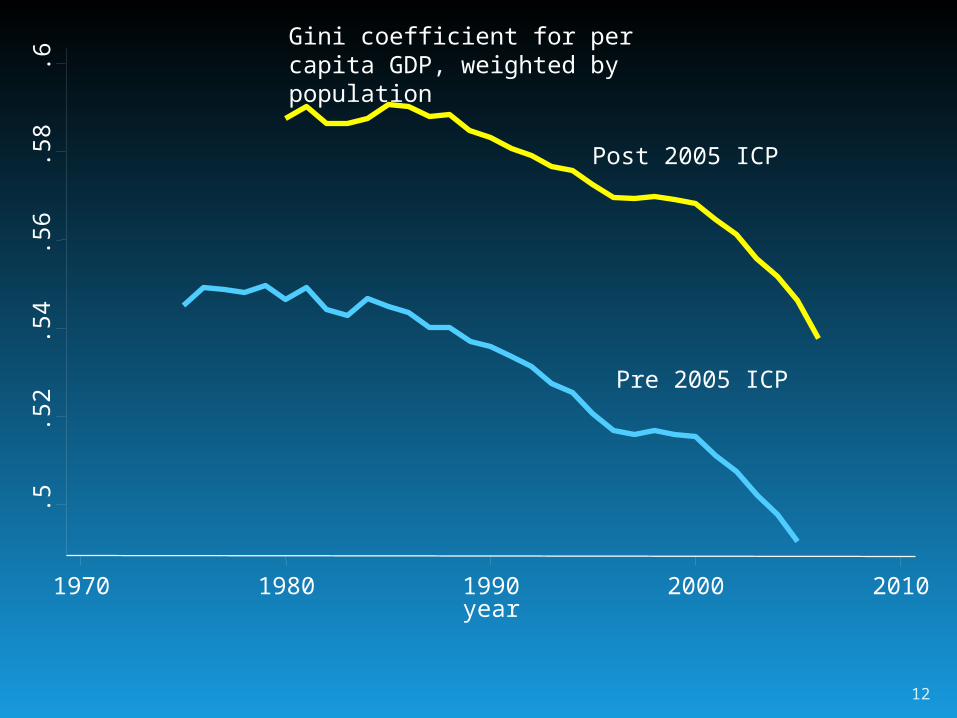
1970 1980 1990 2000 2010year
Post 2005 ICP
Pre 2005 ICP
Gini coefficient for per capita GDP, weighted by population
12
.45
.5.5
5.6
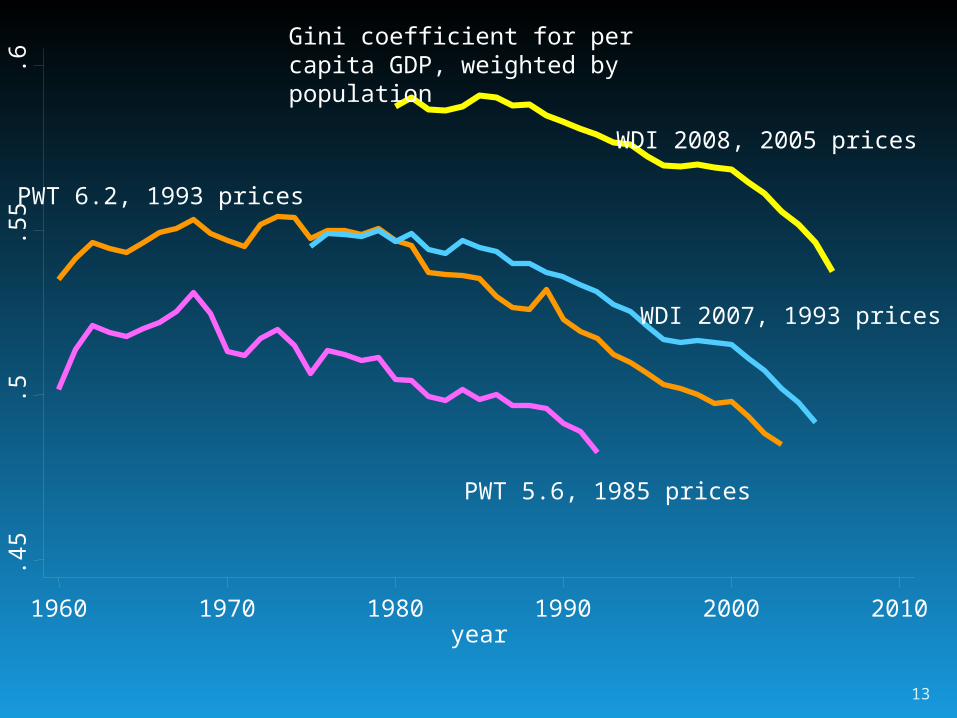
1960 1970 1980 1990 2000 2010year
WDI 2008, 2005 prices
WDI 2007, 1993 prices
PWT 5.6, 1985 prices
PWT 6.2, 1993 prices
Gini coefficient for per capita GDP, weighted by population
13
Extensions: where from here? Gradual process of technical improvement
Those who work on this could give a long list! Government services: health, education Construction Improving national accounts
International $ accounts use both national accounts and PPPs, and are only as good as weakest of these
Becoming a high priority Broadens the range of ICP and new partners
Linking the regions Technical and conceptual problems here
Important that users be involved Academics, for example, are not very well
informed on strengths and weaknesses
Prices and quantities
National income accounts are based on collection of both physical volumes and prices (or volumes and expenditures)
ICP is different, collects only prices Expenditures are collected by local statistical
offices as part of their national accounts Ideally, the ICP could collect volumes as
well as prices Beginning to do so: e.g. education, or
housing Again, the long term aim is integration
of national accounts and ICP Long term aim, but should be kept in mind
Linking between rounds
Past rounds have been different from one another In country coverage and technical improvement
Made little sense to reconcile them with previous rounds E.g. 2005 with 1993
From now on, more regular, higher quality How to blend old information with new? Avoid discontinuous jumps Updating between rounds? Long term goal is to integrate ICP with domestic
price collection Many challenges associated with this Otherwise we have to explain CPI versus ICP
differences
New uses of ICP data
Gallup World Poll uses PPPs in their data More than 155 countries, random national
samples Surveying the population of the world every year!
Gallup collects income data Single question but matches other information Includes in their numbers incomes for individuals in PPPs These numbers are valuable to their clients
Perhaps we will hear more about these uses Possible uses of Gallup data collection back into
ICP? Their regularity could conceivably help with updating Again, blue sky at this point
New uses of ICP information ICP collects millions of price quotes around the world It then turns them into a set of index numbers (PPP
exchange rates) which are published But the prices themselves could have many other uses
Others may want their own indexes, with different weights for different purposes
Sectors: e.g. much interest in health, and prices of health related items, pharmaceuticals, or procedures
International patterns of malnutrition: prices of milk, cereals, etc.
Prices for providing safe water in countries around the world Some of the prices (ring prices) are available to
researchers But many prices are not currently available Another area where working with users, and with countries,
ICP could produce and publish more, and more useful information

Thank you!