Embed Size (px)
DESCRIPTION
Angus Council Housing Need & Demand Assessment Steering Group Meeting 15 th December 2009. Aims of Session. To review outcomes of secondary analysis (Core Outputs 1-4) To validate the baseline HNADA calculation for affordable housing Consider evidence from CHR - PowerPoint PPT Presentation
Citation preview

Client Logo Here
Angus Council
Housing Need & Demand Assessment
Steering Group Meeting15th December 2009
Client Logo Here
Aims of Session
1. To review outcomes of secondary analysis (Core Outputs 1-4)
2. To validate the baseline HNADA calculation for affordable housing Consider evidence from CHR Review calculation outcomes for each HMA
3. To outline methodology for assessing the requirement for market housing
4. To present the outcomes of the HNADA market housing model

Client Logo Here
Secondary Analysis: Core Outputs 1-4
Client Logo Here
HNADA Core Outputs
• HNADA credible if “analysis delivers core outputs”
• Core outputs provide:• Housing market intelligence• Estimated ranges of need or housing requirements
• Housing market analysis outputs• Evidence to interpret system operation• Informs intervention planning
• Range focus: as housing markets are dynamic, definitive measures of need cannot be attained
Client Logo Here
HNADA Core Outputs
Housing Market Intelligence(Demographic & Economic Context)1. Estimates of current dwellings2. Analysis of housing market trends
Range: Housing Requirement/Need 3. Total future households4. Specific housing requirements5. Current households in need6. Future affordable housing requirement7. Future market housing requirement8. Future requirement for either market or
affordable housing
Client Logo Here
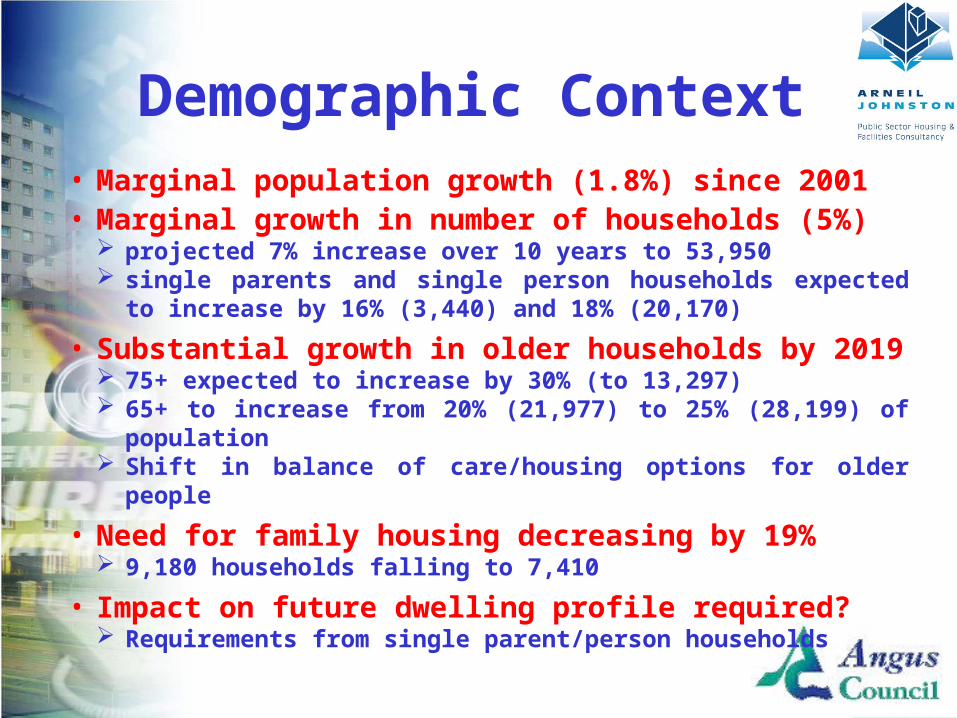
Demographic Context• Marginal population growth (1.8%) since 2001• Marginal growth in number of households (5%)
projected 7% increase over 10 years to 53,950 single parents and single person households expected to
increase by 16% (3,440) and 18% (20,170)
• Substantial growth in older households by 2019 75+ expected to increase by 30% (to 13,297) 65+ to increase from 20% (21,977) to 25% (28,199) of
population Shift in balance of care/housing options for older people
• Need for family housing decreasing by 19% 9,180 households falling to 7,410
• Impact on future dwelling profile required? Requirements from single parent/person households

Client Logo Here
Economic Context• Economic Performance since 2000
Economic growth at national and global levels Like Scotland, Angus has enjoyed high levels of output
and employment
• Employment Rate in Angus: 2008/09 Higher employment rate (84.3%) than Scotland (79.6%) Higher self-employment (10.5%) than Scotland (7.6%) or
UK (9.1%)
• Unemployment rate Increased by 0.3% to 4.4% (April 08-March 09) October 2009: 3.1% of population in receipt of JSA
• Income and Earnings Angus average gross weekly pay = £470.80 Scotland average gross weekly pay = £461.80
Client Logo Here
Economic Context
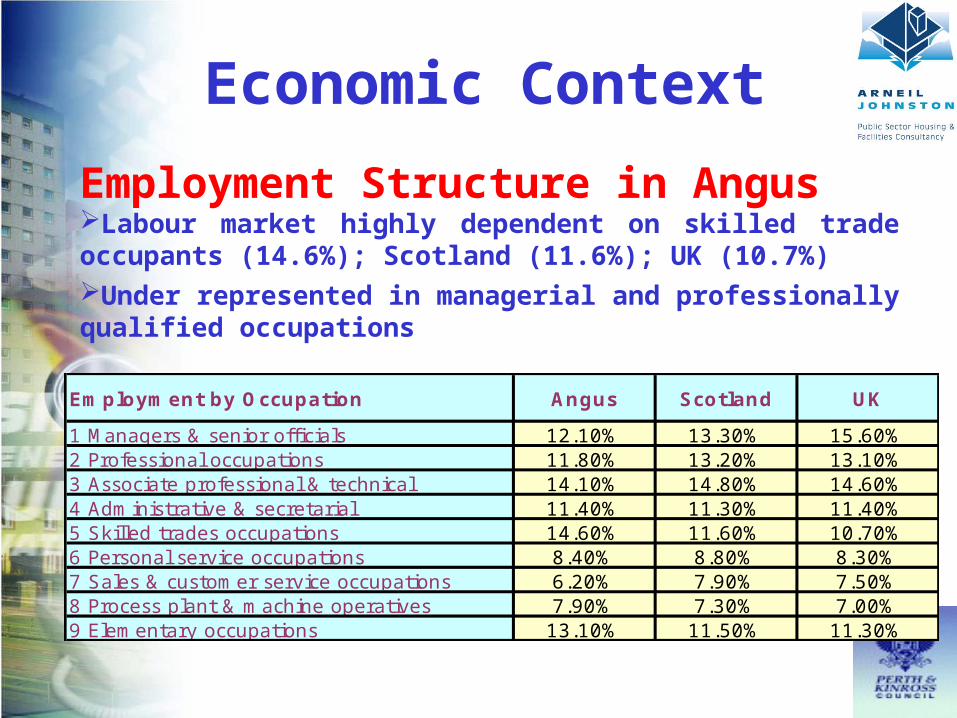
Employment Structure in AngusLabour market highly dependent on skilled trade occupants (14.6%); Scotland (11.6%); UK (10.7%)Under represented in managerial and professionally qualified occupations
Employment by Occupation Angus Scotland UK
1 Managers & senior officials 12.10% 13.30% 15.60%2 Professional occupations 11.80% 13.20% 13.10%3 Associate professional & technical 14.10% 14.80% 14.60%4 Administrative & secretarial 11.40% 11.30% 11.40%5 Skilled trades occupations 14.60% 11.60% 10.70%6 Personal service occupations 8.40% 8.80% 8.30%7 Sales & customer service occupations 6.20% 7.90% 7.50%8 Process plant & machine operatives 7.90% 7.30% 7.00%9 Elementary occupations 13.10% 11.50% 11.30%
Client Logo Here
Estimate of Current Dwellings
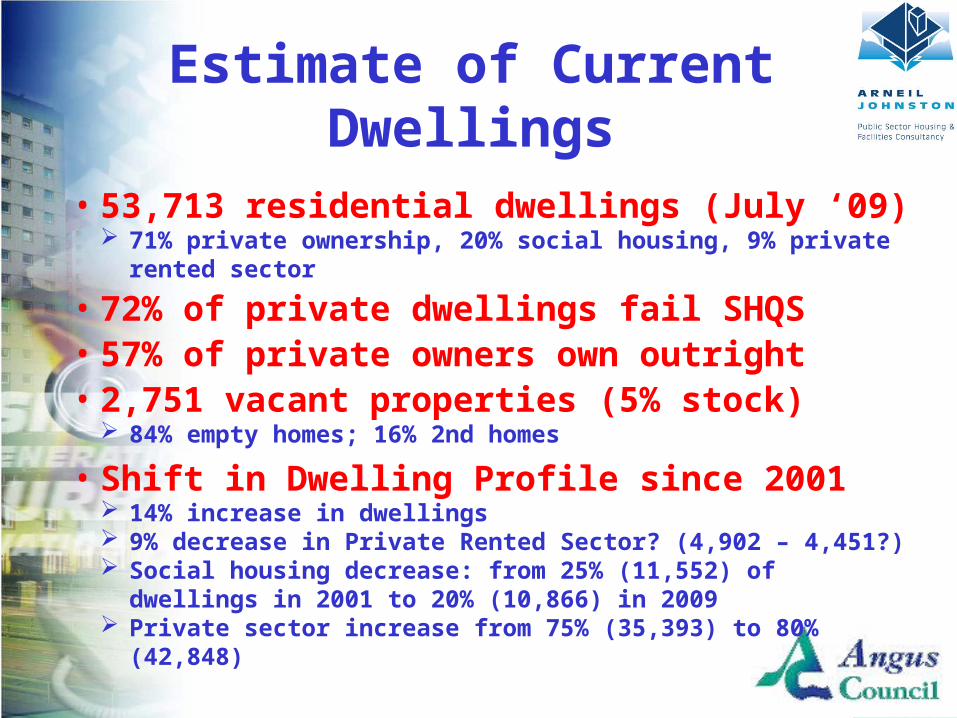
• 53,713 residential dwellings (July ‘09) 71% private ownership, 20% social housing, 9% private
rented sector
• 72% of private dwellings fail SHQS• 57% of private owners own outright• 2,751 vacant properties (5% stock)
84% empty homes; 16% 2nd homes
• Shift in Dwelling Profile since 2001 14% increase in dwellings 9% decrease in Private Rented Sector? (4,902 – 4,451?) Social housing decrease: from 25% (11,552) of dwellings
in 2001 to 20% (10,866) in 2009 Private sector increase from 75% (35,393) to 80%
(42,848)
Client Logo Here
Housing Market Trends 2003-08
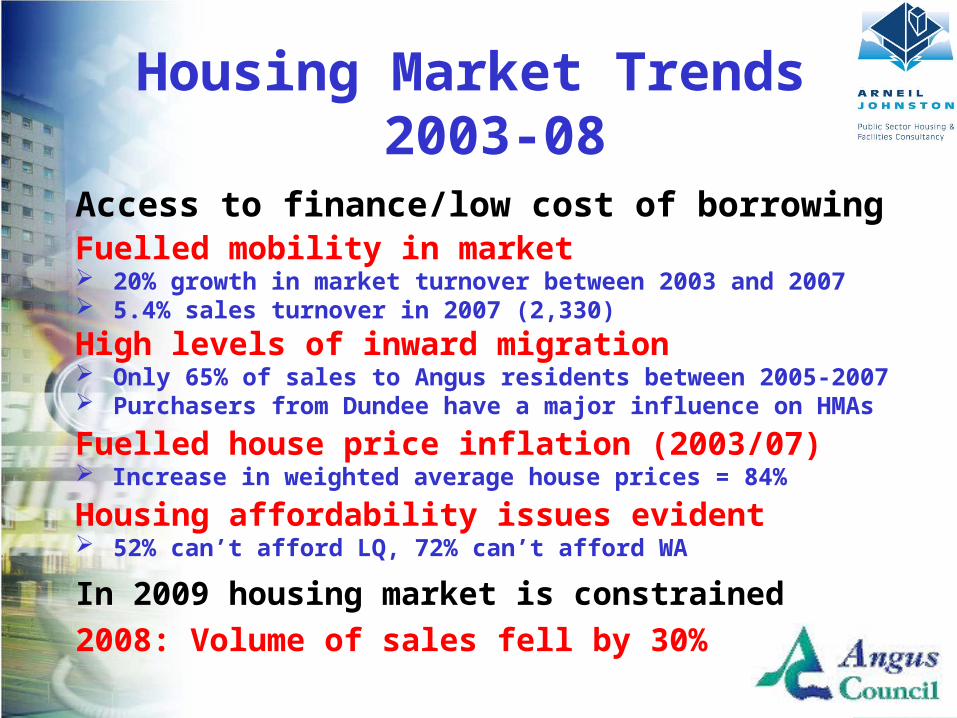
Access to finance/low cost of borrowing Fuelled mobility in market 20% growth in market turnover between 2003 and 2007 5.4% sales turnover in 2007 (2,330)
High levels of inward migration Only 65% of sales to Angus residents between 2005-2007 Purchasers from Dundee have a major influence on HMAs
Fuelled house price inflation (2003/07) Increase in weighted average house prices = 84%
Housing affordability issues evident 52% can’t afford LQ, 72% can’t afford WA
In 2009 housing market is constrained2008: Volume of sales fell by 30%
Client Logo Here
Housing Market Trends 2003-08
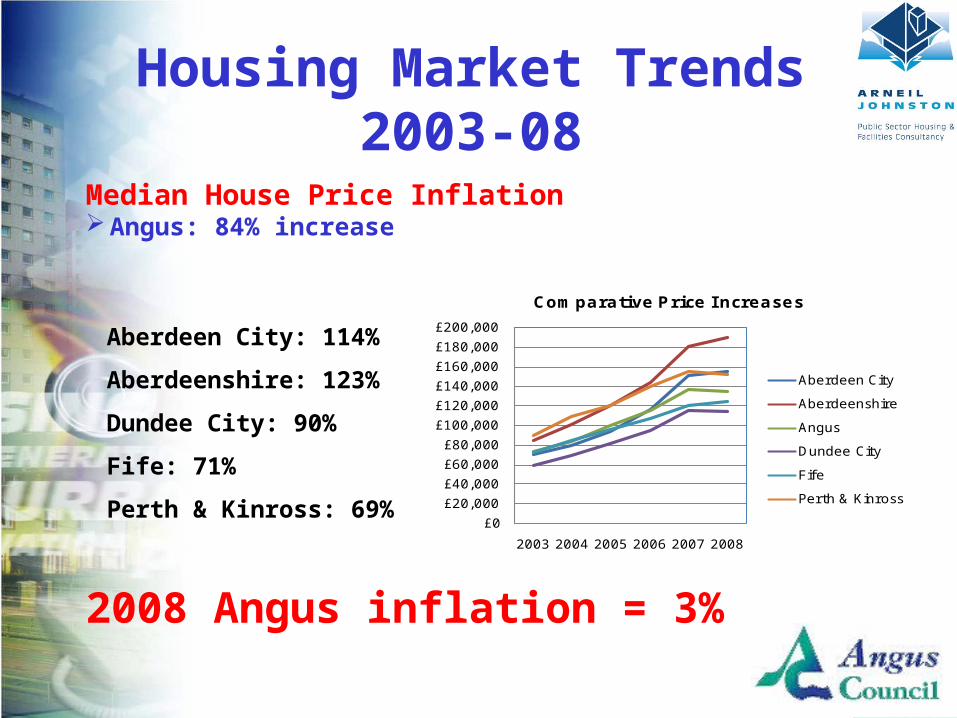
Aberdeen City: 114%
Aberdeenshire: 123%
Dundee City: 90%
Fife: 71%
Perth & Kinross: 69%
Median House Price InflationAngus: 84% increase
£0
£20,000
£40,000
£60,000
£80,000
£100,000
£120,000
£140,000
£160,000
£180,000
£200,000
2003 2004 2005 2006 2007 2008
Comparative Price I ncreases
Aberdeen City
Aberdeenshire
Angus
Dundee City
Fife
Perth & Kinross
2008 Angus inflation = 3%
Client Logo Here
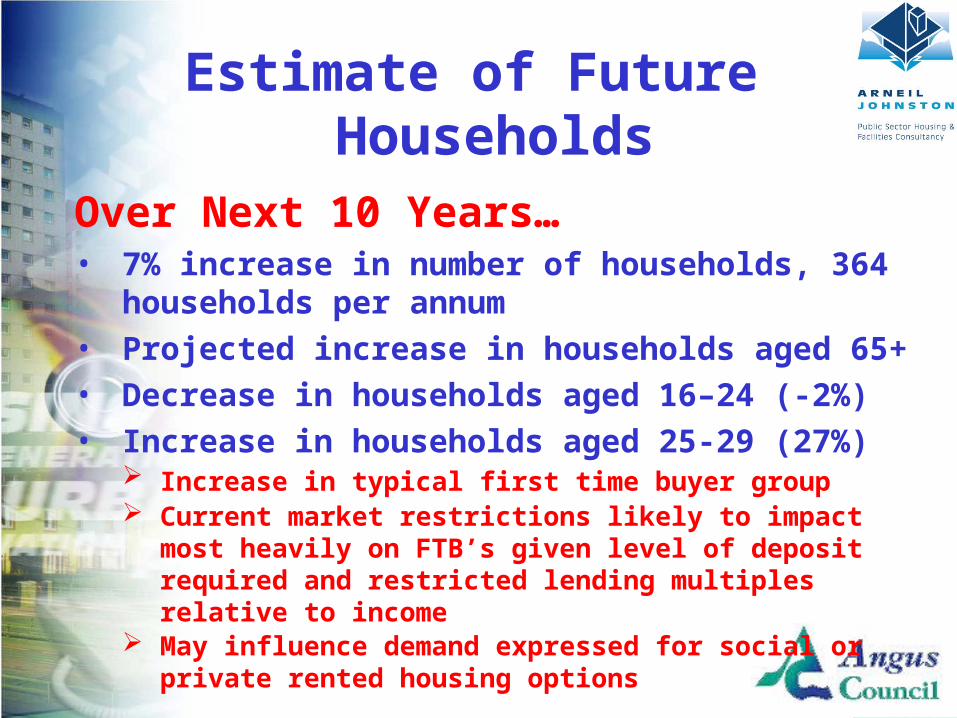
Estimate of Future Households
Over Next 10 Years…• 7% increase in number of households, 364
households per annum• Projected increase in households aged 65+ • Decrease in households aged 16–24 (-2%)• Increase in households aged 25-29 (27%)
Increase in typical first time buyer group Current market restrictions likely to impact most
heavily on FTB’s given level of deposit required and restricted lending multiples relative to income
May influence demand expressed for social or private rented housing options
Client Logo Here
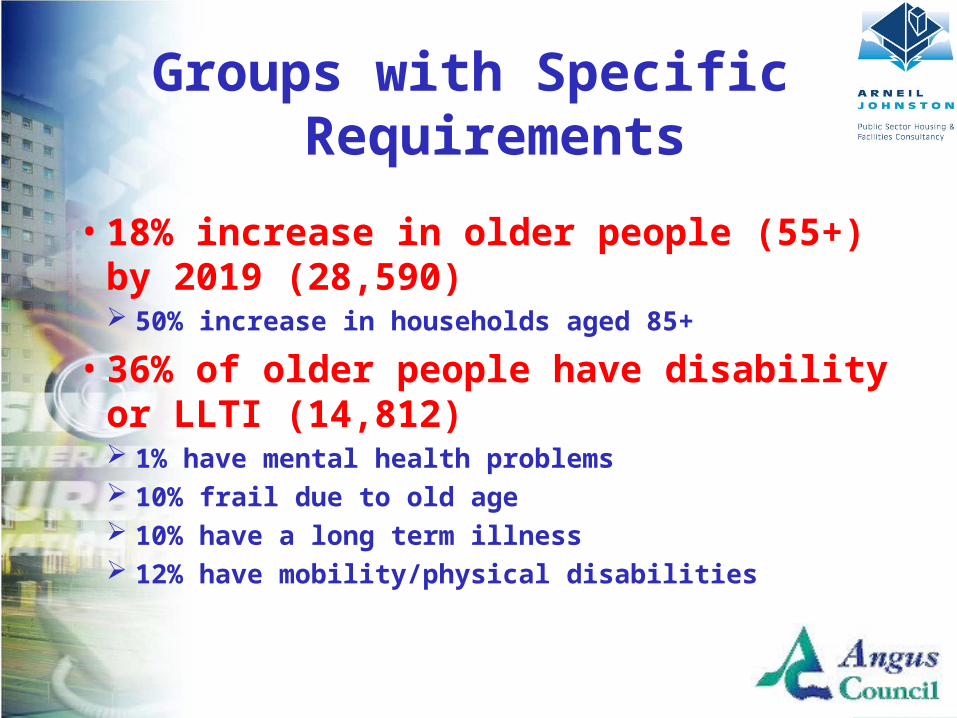
• 18% increase in older people (55+) by 2019 (28,590) 50% increase in households aged 85+
• 36% of older people have disability or LLTI (14,812) 1% have mental health problems 10% frail due to old age 10% have a long term illness 12% have mobility/physical disabilities
Groups with Specific Requirements
Client Logo Here
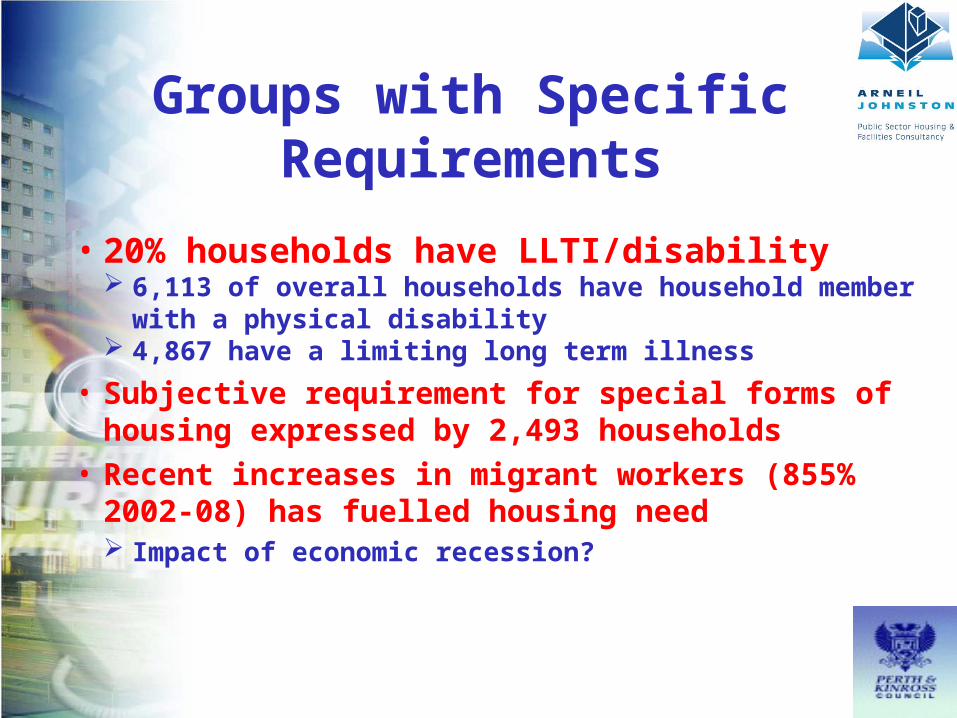
Groups with Specific Requirements
• 20% households have LLTI/disability 6,113 of overall households have household
member with a physical disability 4,867 have a limiting long term illness
• Subjective requirement for special forms of housing expressed by 2,493 households
• Recent increases in migrant workers (855% 2002-08) has fuelled housing need Impact of economic recession?
Client Logo Here
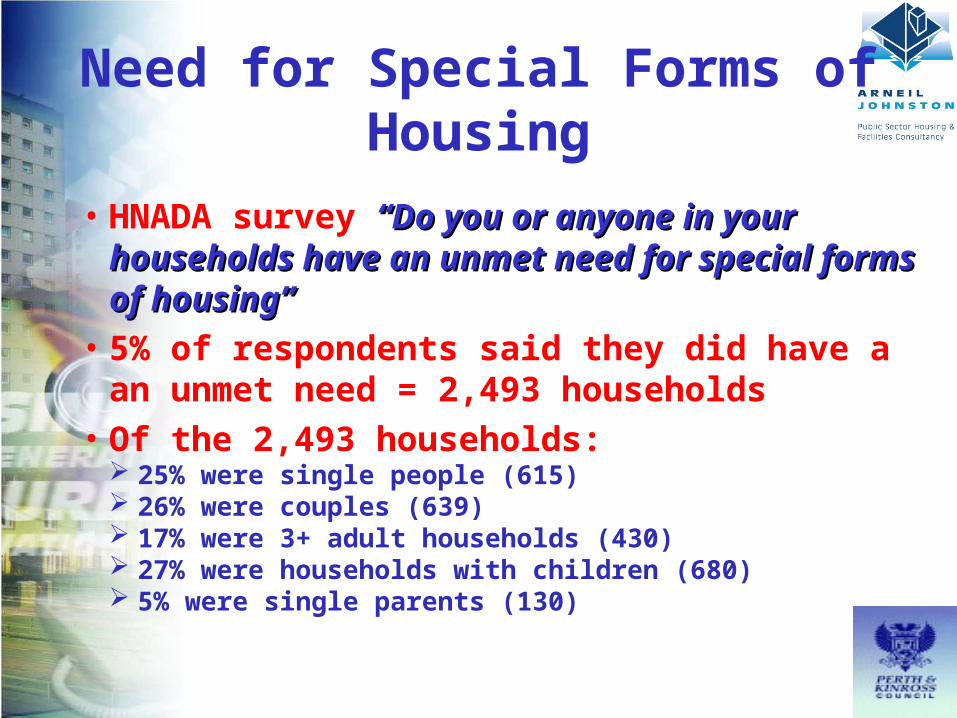
Need for Special Forms of Housing
• HNADA survey “Do you or anyone in your “Do you or anyone in your households have an unmet need for households have an unmet need for special forms of housing”special forms of housing”
• 5% of respondents said they did have a an unmet need = 2,493 households
• Of the 2,493 households: 25% were single people (615) 26% were couples (639) 17% were 3+ adult households (430) 27% were households with children (680) 5% were single parents (130)

Client Logo Here
Of the 2,493 households: • 50% require ground floor accommodation• 32% require specialist care housing• 3% require wheelchair accommodation• 6% require sheltered accommodation• 8% require other special forms of housing
Need for Special Forms of Housing
Client Logo Here
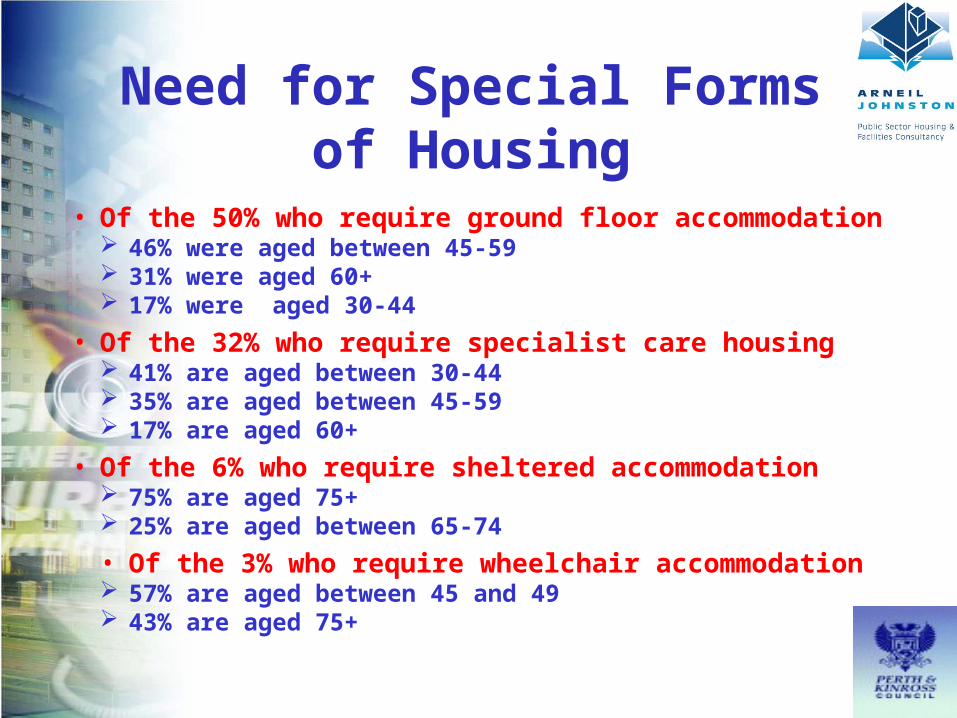
• Of the 50% who require ground floor accommodation 46% were aged between 45-59 31% were aged 60+ 17% were aged 30-44
• Of the 32% who require specialist care housing 41% are aged between 30-44 35% are aged between 45-59 17% are aged 60+
• Of the 6% who require sheltered accommodation 75% are aged 75+ 25% are aged between 65-74
• Of the 3% who require wheelchair accommodation 57% are aged between 45 and 49 43% are aged 75+
Need for Special Forms of Housing
Client Logo Here
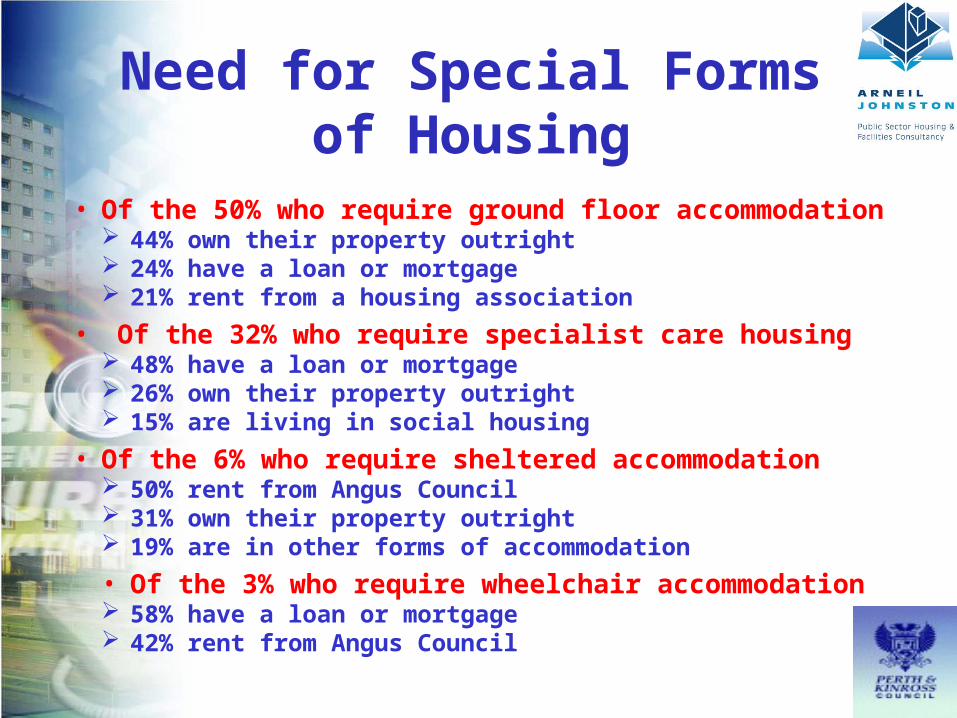
• Of the 50% who require ground floor accommodation 44% own their property outright 24% have a loan or mortgage 21% rent from a housing association
• Of the 32% who require specialist care housing 48% have a loan or mortgage 26% own their property outright 15% are living in social housing
• Of the 6% who require sheltered accommodation 50% rent from Angus Council 31% own their property outright 19% are in other forms of accommodation
• Of the 3% who require wheelchair accommodation 58% have a loan or mortgage 42% rent from Angus Council
Need for Special Forms of Housing
Client Logo Here
Baseline Housing Need Calculation for
Affordable Housing
Client Logo Here
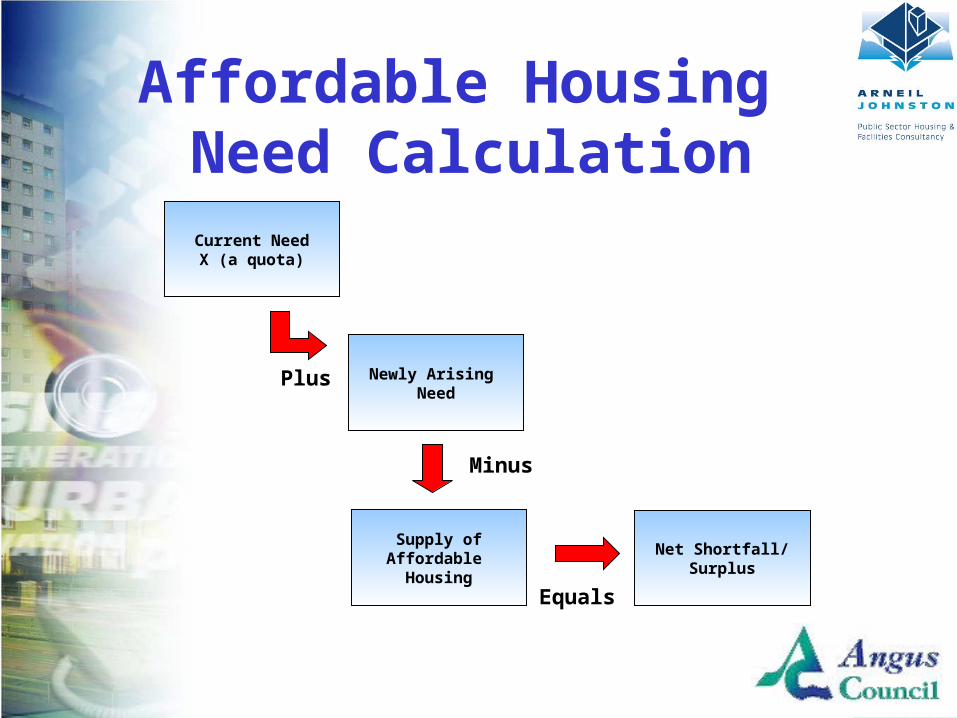
Plus
Current NeedX (a quota)
Newly Arising Need
Minus
Equals
Supply ofAffordable
Housing
Net Shortfall/Surplus
Affordable Housing Need Calculation
Client Logo Here
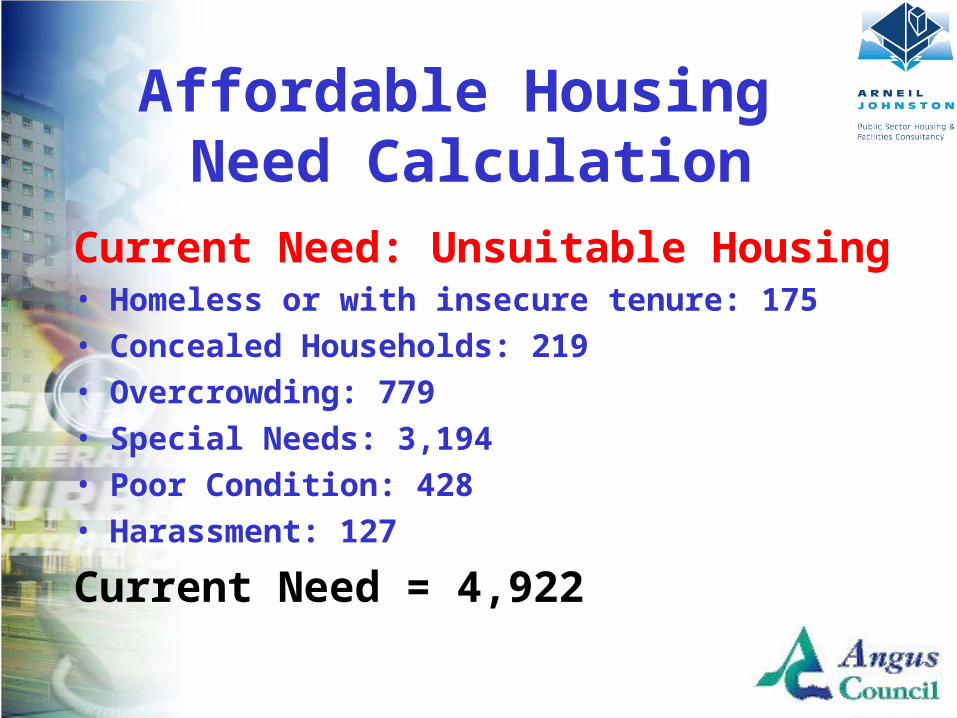
Current Need: Unsuitable Housing• Homeless or with insecure tenure: 175• Concealed Households: 219• Overcrowding: 779• Special Needs: 3,194• Poor Condition: 428• Harassment: 127
Current Need = 4,922
Affordable Housing Need Calculation
Client Logo Here
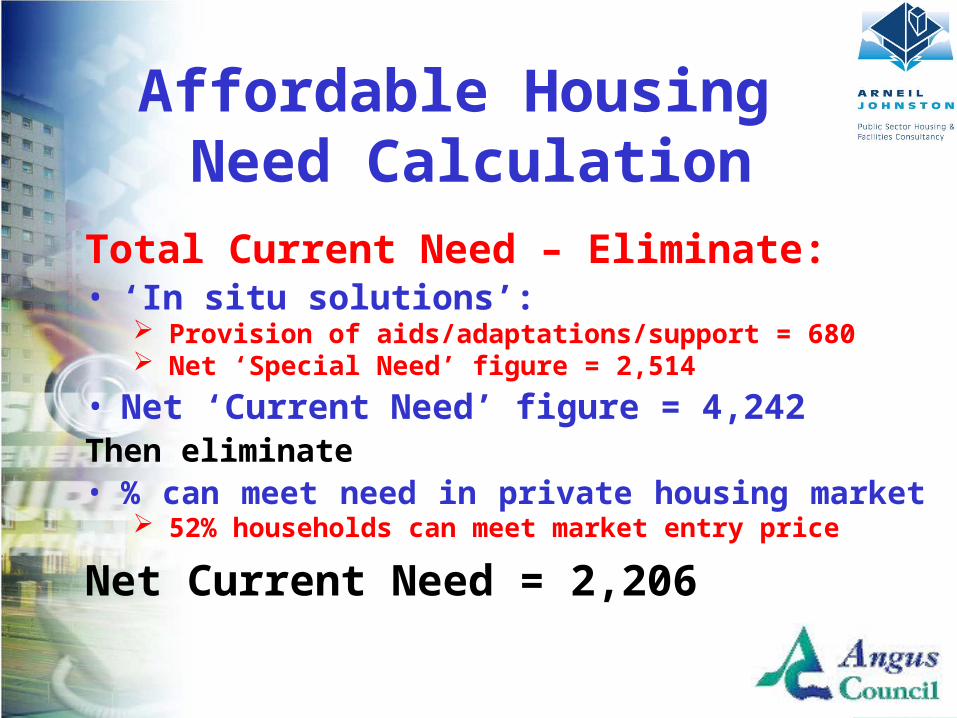
Total Current Need – Eliminate:• ‘In situ solutions’:
Provision of aids/adaptations/support = 680 Net ‘Special Need’ figure = 2,514
• Net ‘Current Need’ figure = 4,242Then eliminate• % can meet need in private housing market
52% households can meet market entry price
Net Current Need = 2,206
Affordable Housing Need Calculation
Client Logo Here
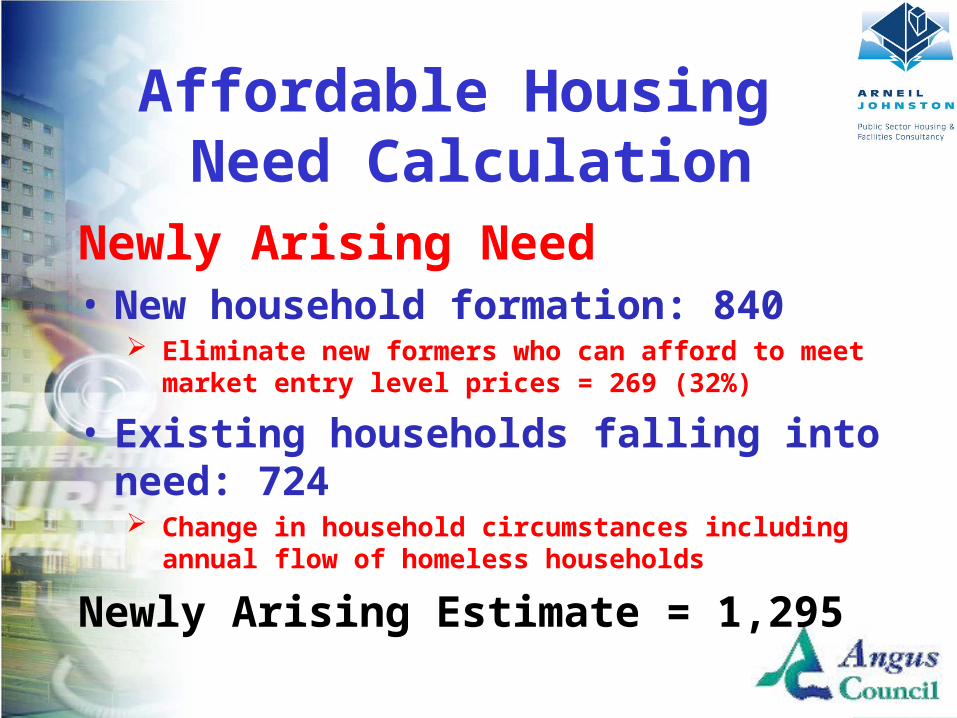
Newly Arising Need• New household formation: 840
Eliminate new formers who can afford to meet market entry level prices = 269 (32%)
• Existing households falling into need: 724 Change in household circumstances including
annual flow of homeless households
Newly Arising Estimate = 1,295
Affordable Housing Need Calculation
Client Logo Here
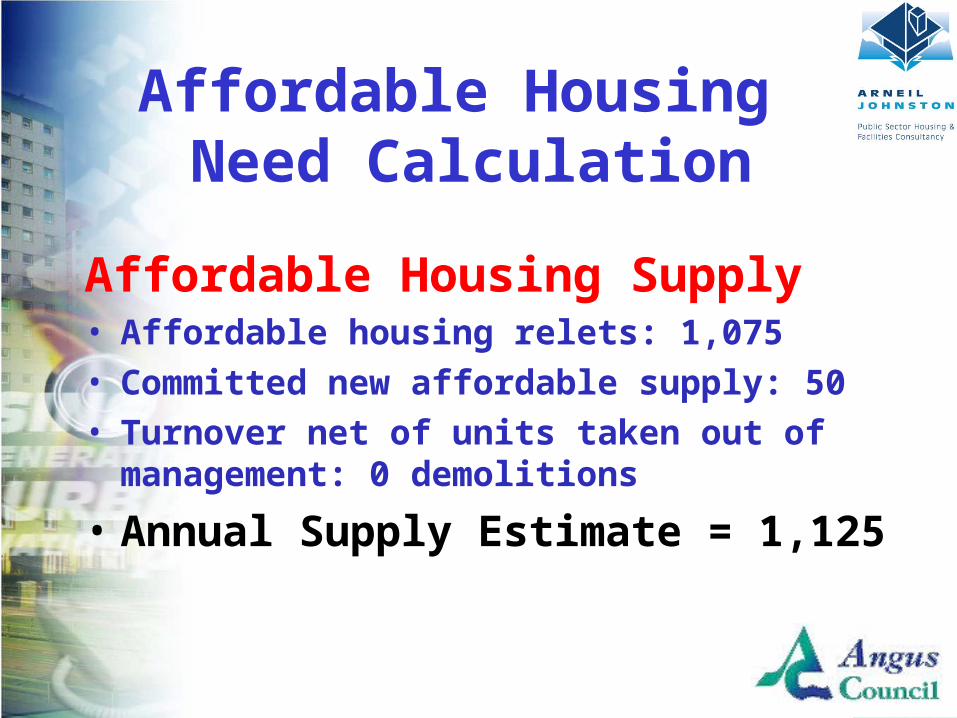
Affordable Housing Supply• Affordable housing relets: 1,075• Committed new affordable supply: 50 • Turnover net of units taken out of
management: 0 demolitions
• Annual Supply Estimate = 1,125
Affordable Housing Need Calculation
Client Logo Here
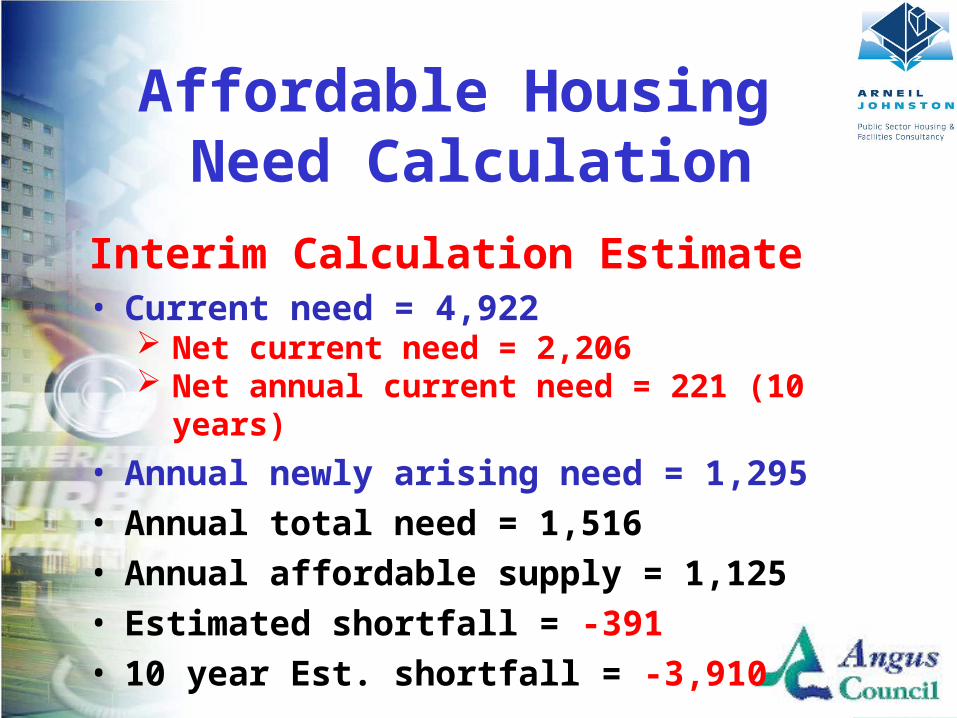
Interim Calculation Estimate• Current need = 4,922
Net current need = 2,206 Net annual current need = 221 (10 years)
• Annual newly arising need = 1,295• Annual total need = 1,516• Annual affordable supply = 1,125• Estimated shortfall = -391• 10 year Est. shortfall = -3,910
Affordable Housing Need Calculation
Client Logo Here
Calculation for Affordable Housing:
CHR Validation

Client Logo Here
Calculating the Requirement for Market Housing
Client Logo Here
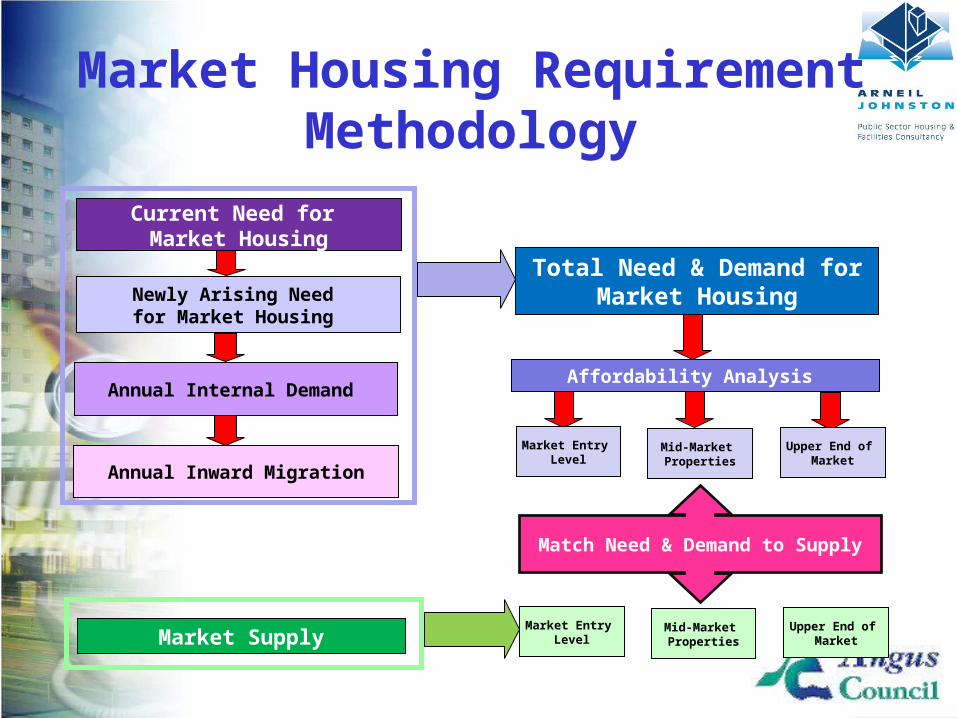
Market Housing Requirement Methodology
Annual Inward Migration
Market Entry Level
Current Need for Market Housing
Mid-Market Properties
Upper End of Market
Newly Arising Need for Market Housing
Annual Internal Demand
Market Supply
Affordability Analysis
Total Need & Demand for Market Housing
Market Entry Level
Mid-Market Properties
Upper End of Market
Match Need & Demand to Supply

Client Logo Here
Current Need: Market Housing North HMA: 56% CAN afford = 729 South HMA: 39% CAN afford = 490 East HMA: 52% CAN afford = 417 West HMA: 47% CAN afford = 415
Angus Gross Current Need = 2,051Angus Annual Current Need = 205
Calculation Inputs
Client Logo Here
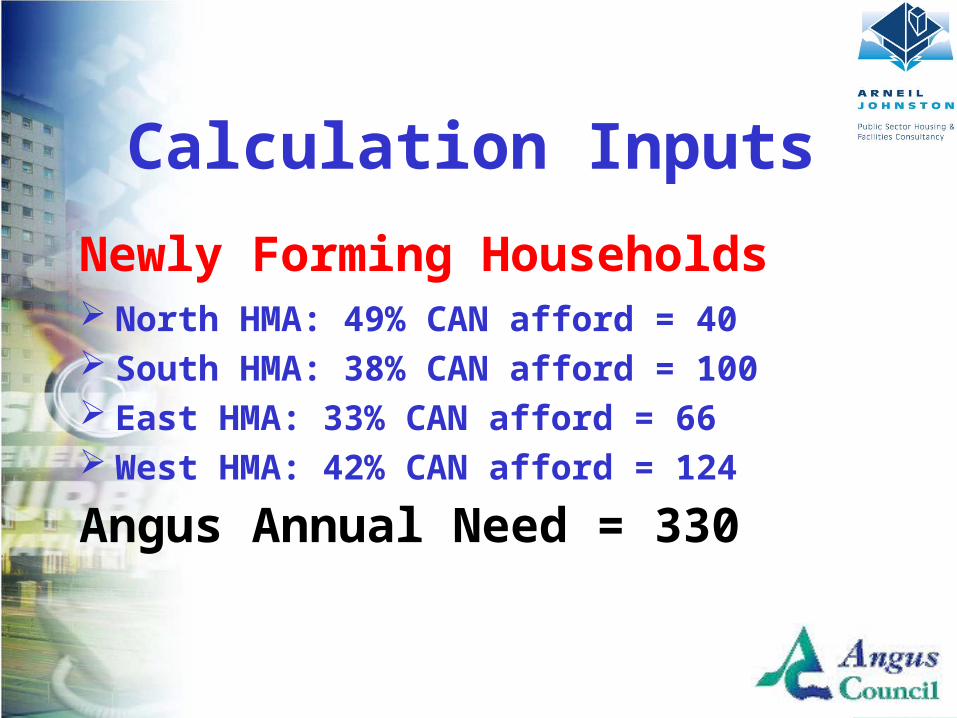
Newly Forming Households North HMA: 49% CAN afford = 40 South HMA: 38% CAN afford = 100 East HMA: 33% CAN afford = 66 West HMA: 42% CAN afford = 124
Angus Annual Need = 330
Calculation Inputs
Client Logo Here
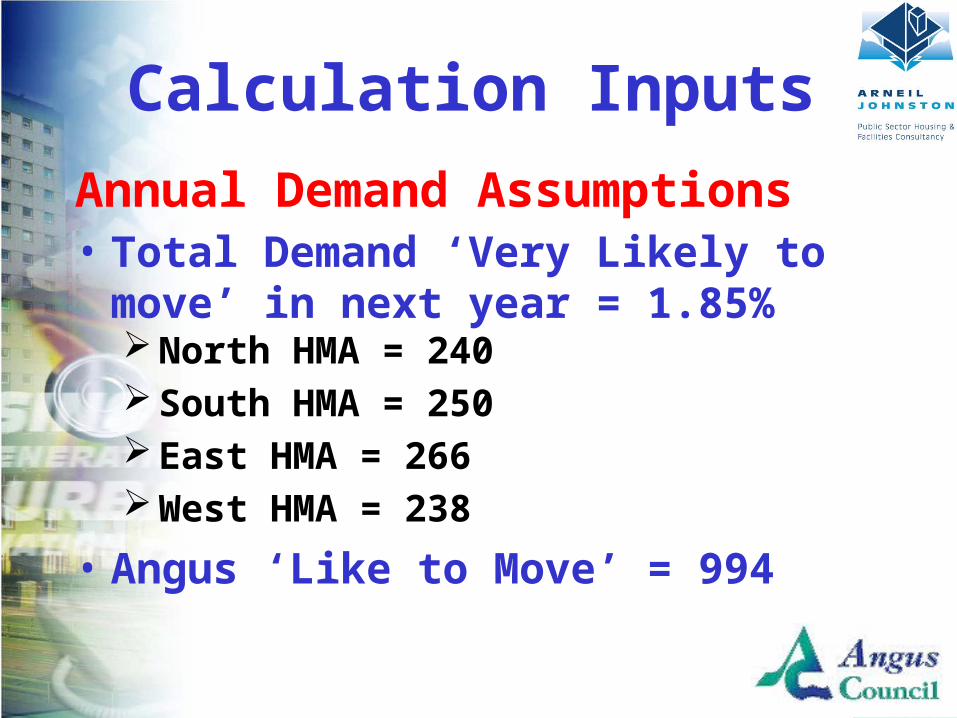
Annual Demand Assumptions• Total Demand ‘Very Likely to
move’ in next year = 1.85%North HMA = 240South HMA = 250East HMA = 266West HMA = 238
• Angus ‘Like to Move’ = 994
Calculation Inputs

Client Logo Here
Demand: In Migration (2007)North HMA = 279South HMA = 289East HMA = 190West HMA = 227
Angus In Migration = 985
Calculation Inputs

Client Logo Here
Annual Inward Migration (2008 Sales)
Current Need for Market Housing
Newly Arising Need for Market Housing
Annual Internal Demand
205 per annum
330 per annum
994 per annum
985 per annum
=
=
=
=
Total Annual Demand = 2,514
Calculation InputsTotal Annual Need & Demand Yr 1
Client Logo Here
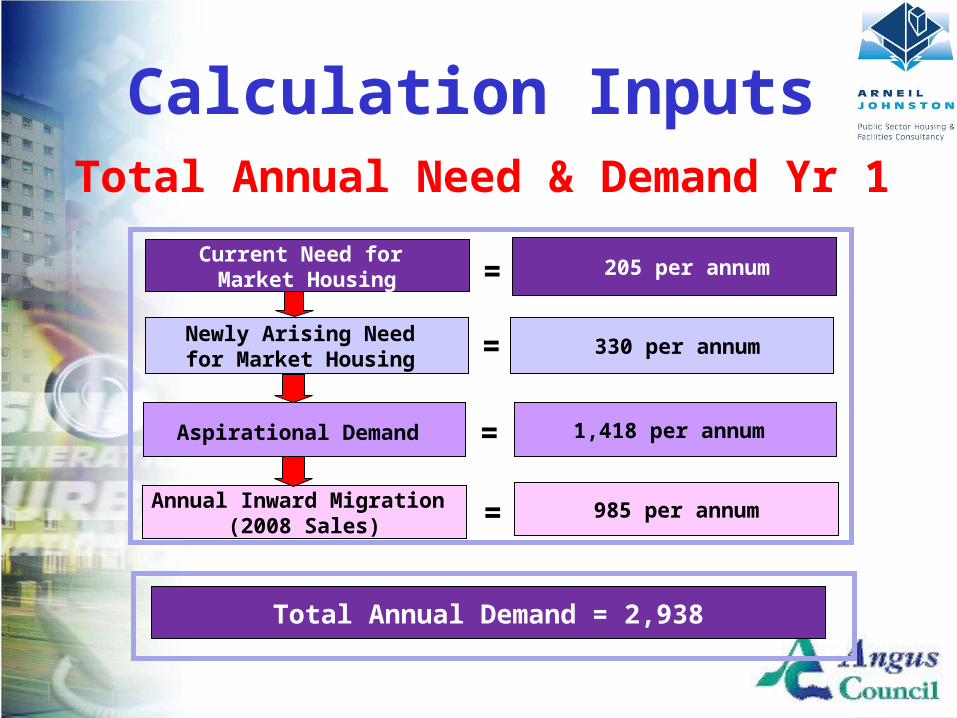
Annual Inward Migration (2008 Sales)
Current Need for Market Housing
Newly Arising Need for Market Housing
Aspirational Demand
205 per annum
330 per annum
1,418 per annum
985 per annum
=
=
=
=
Total Annual Demand = 2,938
Calculation InputsTotal Annual Need & Demand Yr 1
Client Logo Here
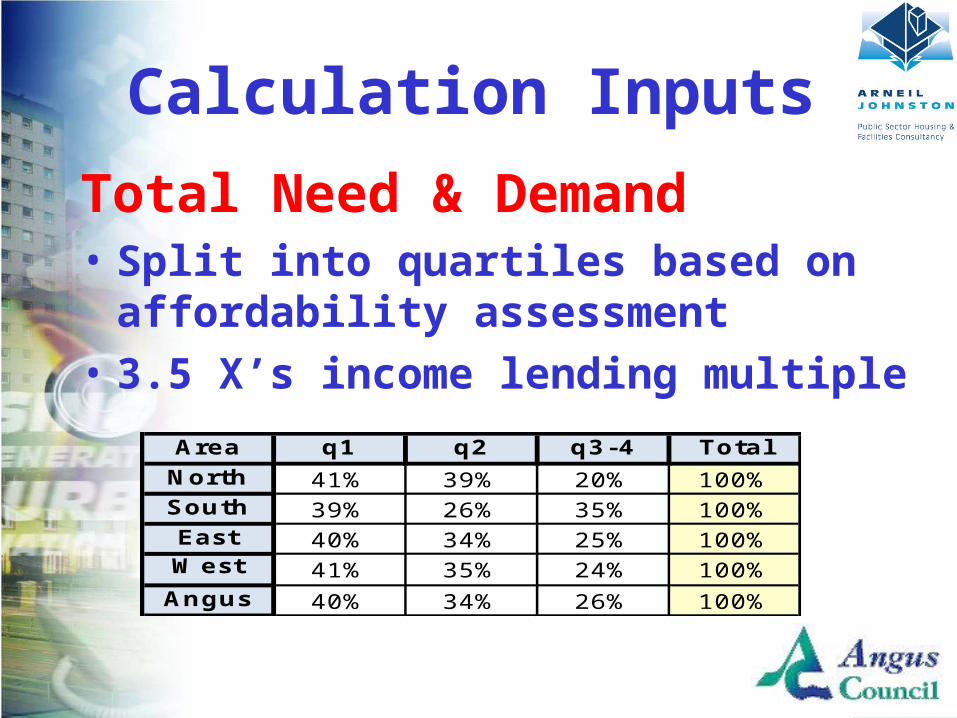
Total Need & Demand• Split into quartiles based on
affordability assessment• 3.5 X’s income lending multiple
Calculation Inputs
Area q1 q2 q3-4 Total
North 41% 39% 20% 100%South 39% 26% 35% 100%East 40% 34% 25% 100%West 41% 35% 24% 100%Angus 40% 34% 26% 100%

Client Logo Here
Market Housing Supply (2007)
Calculation Inputs
Sales Volume 2007 = 2,350 Modelling Assumption :
• Sales in Year 1 – 3 reduced by 30%• Volume of sales incrementally increase from Yr 4
to year 10 by approx. 6% per annum
Area q1 q2 q3-4 Total North 181 181 360 722 South 127 117 242 486 East 148 145 293 586 West 139 139 278 556 Angus 595 582 1,173 2,350
Client Logo Here
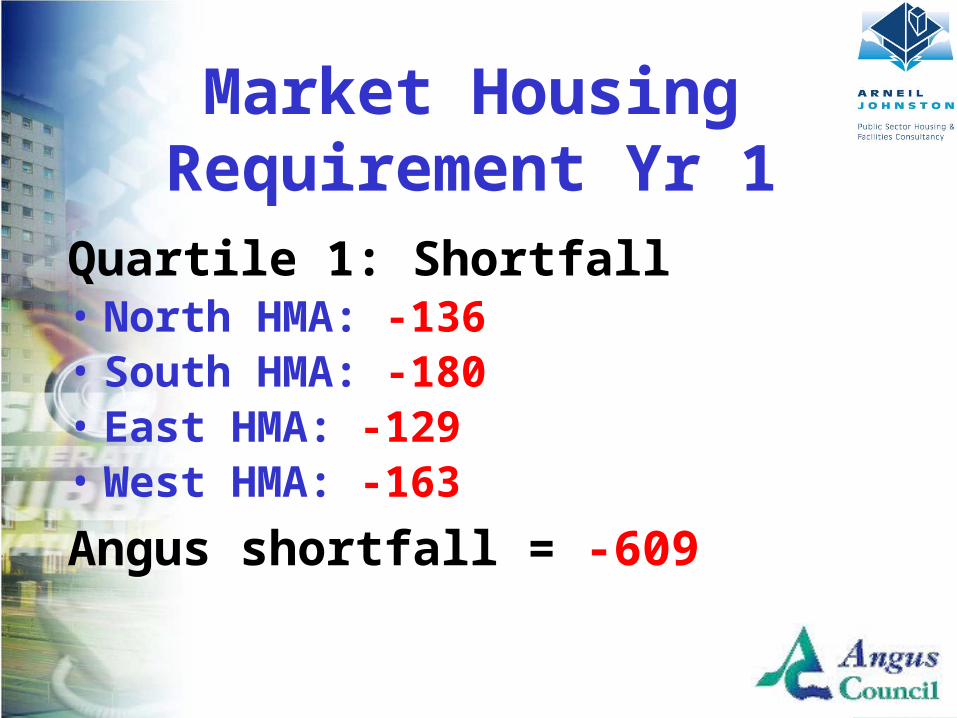
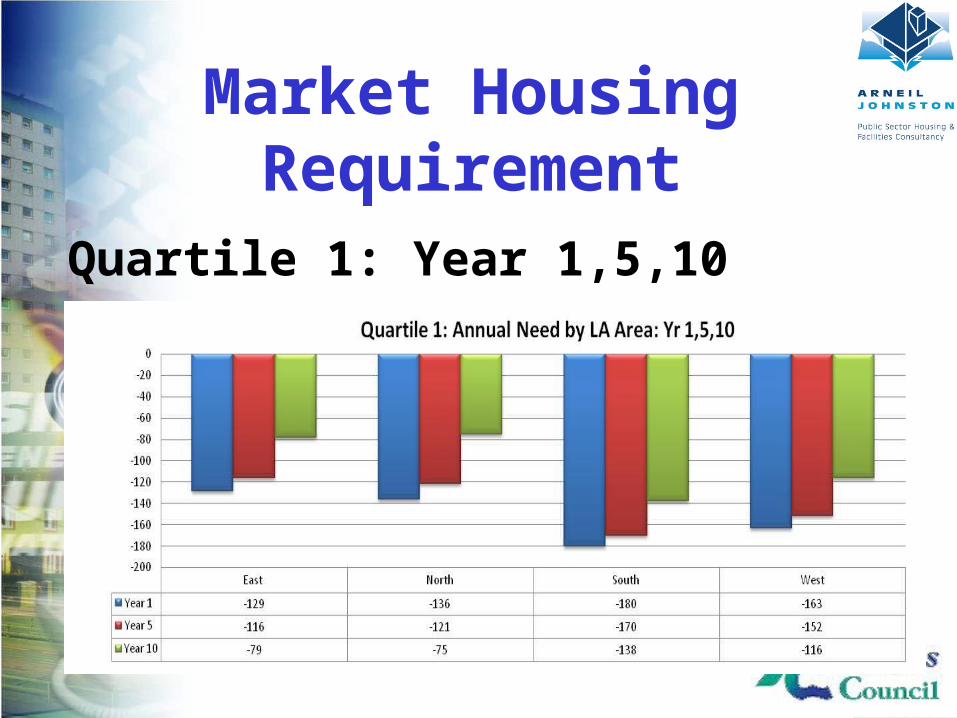
Quartile 1: Shortfall• North HMA: -136• South HMA: -180• East HMA: -129• West HMA: -163
Angus shortfall = -609
Market Housing Requirement Yr 1
Client Logo Here
Quartile 1: Year 1,5,10
Market Housing Requirement

Client Logo Here
Quartile 2: Shortfall/Surplus• North HMA: -124• South HMA: -100• East HMA: -96• West HMA: -129Angus shortfall = -450
Market Housing Requirement Yr 1

Client Logo Here
Quartile 2: Year 1,5,10
Market Housing Requirement
Client Logo Here
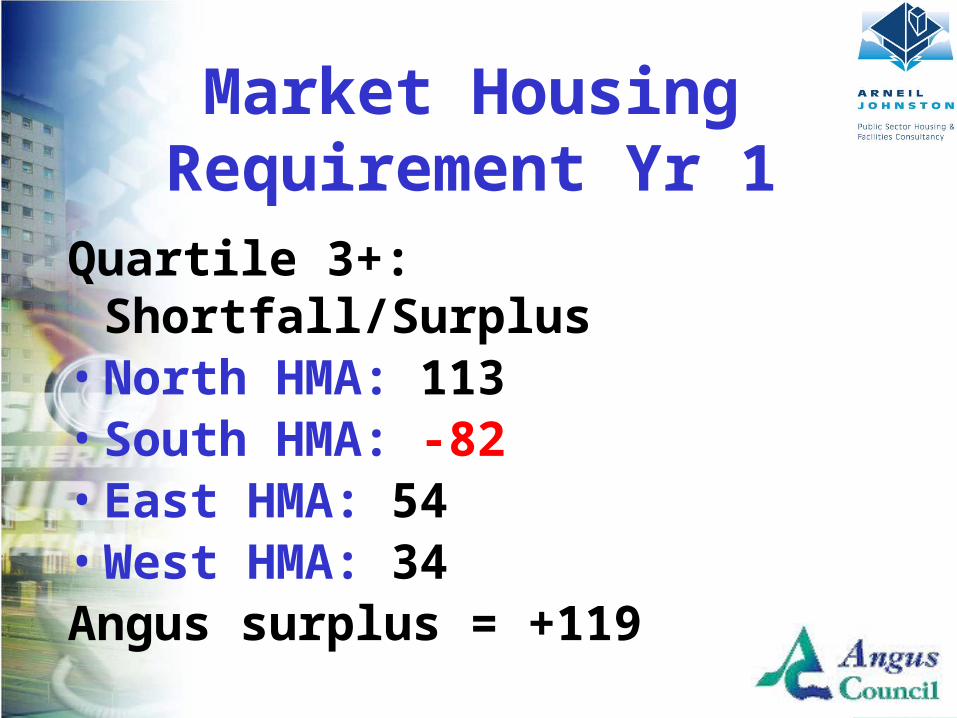
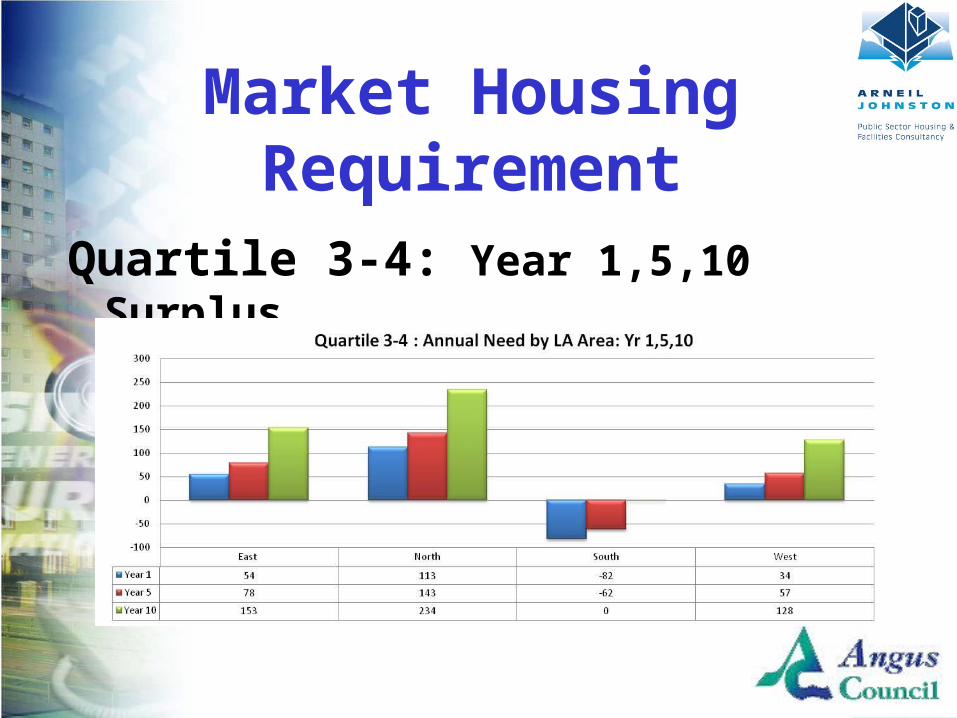
Quartile 3+: Shortfall/Surplus• North HMA: 113• South HMA: -82• East HMA: 54• West HMA: 34Angus surplus = +119
Market Housing Requirement Yr 1
Client Logo Here
Quartile 3-4: Year 1,5,10 Surplus
Market Housing Requirement
Client Logo Here
Market Housing Requirement
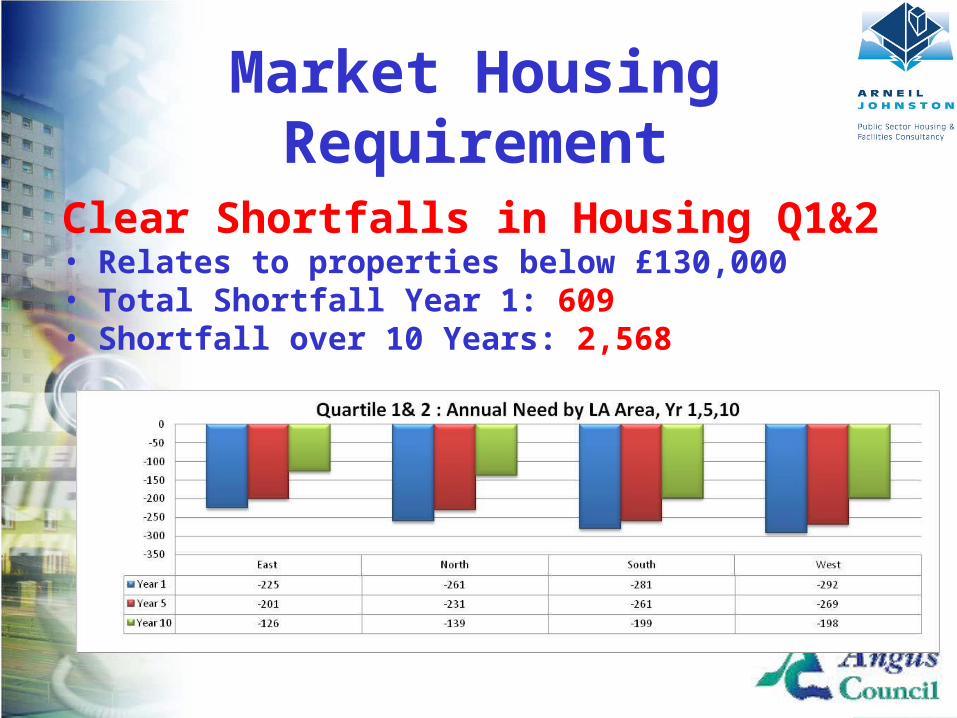
Clear Shortfalls in Housing Q1&2• Relates to properties below £130,000• Total Shortfall Year 1: 609• Shortfall over 10 Years: 2,568
Client Logo Here
Market Housing Requirement
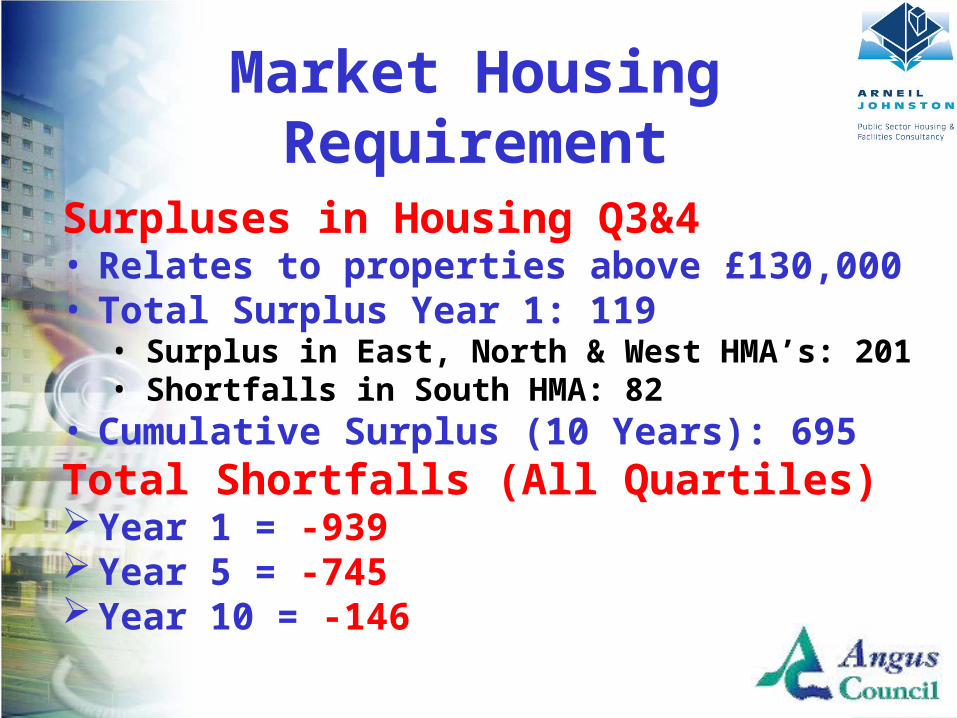
Surpluses in Housing Q3&4• Relates to properties above £130,000• Total Surplus Year 1: 119
• Surplus in East, North & West HMA’s: 201• Shortfalls in South HMA: 82
• Cumulative Surplus (10 Years): 695Total Shortfalls (All Quartiles)Year 1 = -939Year 5 = -745Year 10 = -146

Client Logo Here
Market Housing Requirement
• Cumulative Shortfall of Market Housing: 6,400
• New Build Delivery Assumption: 2,640 (2007: 290 sales per annum)
• Housing Land Requirement circa 9,000?
YearAnnual Market
Housing Shortfall
Cumulative Market Housing
Shortfall1 939 9392 939 1,8793 939 2,8184 845 3,6635 745 4,4086 639 5,0477 526 5,5738 407 5,9809 281 6,261
10 146 6,407


![The Role of Government in Steering [Energy] Demand](https://img.pdfslide.us/doc/110x75/5884fcab1a28ab7d698b4a83/the-role-of-government-in-steering-energy-demand.jpg)