Embed Size (px)
Citation preview
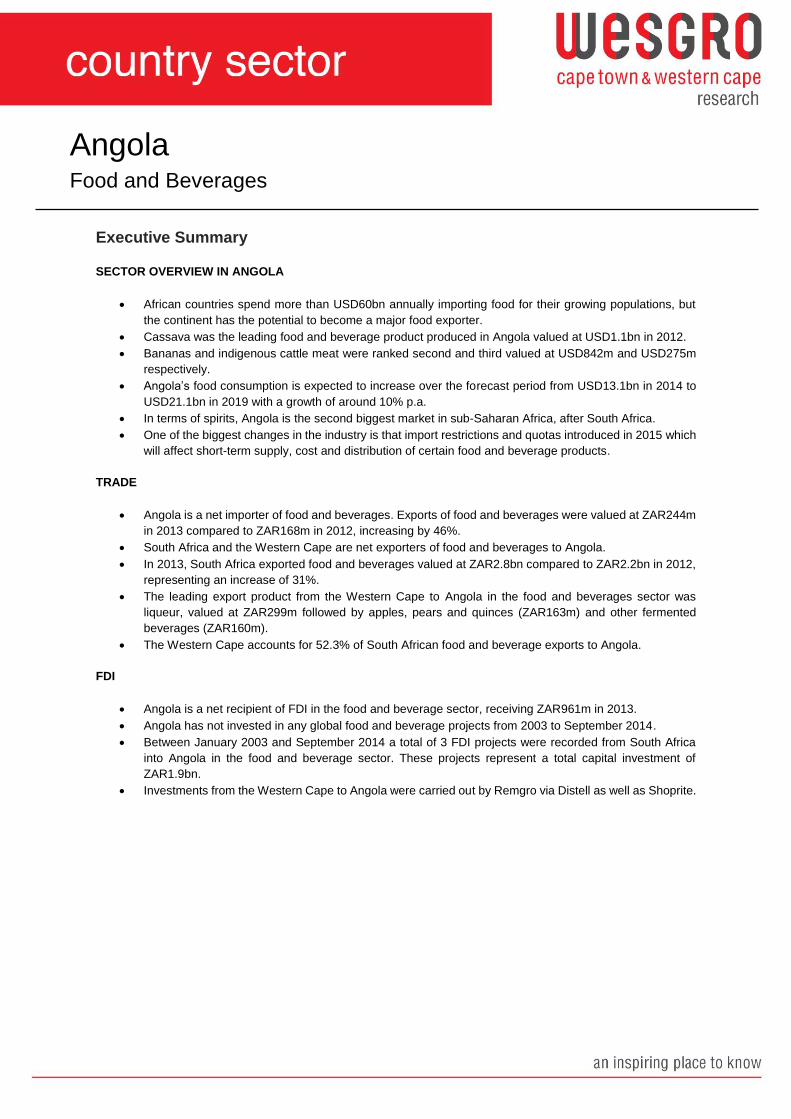
Angola Food and Beverages
Executive Summary
SECTOR OVERVIEW IN ANGOLA
African countries spend more than USD60bn annually importing food for their growing populations, but
the continent has the potential to become a major food exporter.
Cassava was the leading food and beverage product produced in Angola valued at USD1.1bn in 2012.
Bananas and indigenous cattle meat were ranked second and third valued at USD842m and USD275m
respectively.
Angola’s food consumption is expected to increase over the forecast period from USD13.1bn in 2014 to
USD21.1bn in 2019 with a growth of around 10% p.a.
In terms of spirits, Angola is the second biggest market in sub-Saharan Africa, after South Africa.
One of the biggest changes in the industry is that import restrictions and quotas introduced in 2015 which
will affect short-term supply, cost and distribution of certain food and beverage products.
TRADE
Angola is a net importer of food and beverages. Exports of food and beverages were valued at ZAR244m
in 2013 compared to ZAR168m in 2012, increasing by 46%.
South Africa and the Western Cape are net exporters of food and beverages to Angola.
In 2013, South Africa exported food and beverages valued at ZAR2.8bn compared to ZAR2.2bn in 2012,
representing an increase of 31%.
The leading export product from the Western Cape to Angola in the food and beverages sector was
liqueur, valued at ZAR299m followed by apples, pears and quinces (ZAR163m) and other fermented
beverages (ZAR160m).
The Western Cape accounts for 52.3% of South African food and beverage exports to Angola.
FDI
Angola is a net recipient of FDI in the food and beverage sector, receiving ZAR961m in 2013.
Angola has not invested in any global food and beverage projects from 2003 to September 2014.
Between January 2003 and September 2014 a total of 3 FDI projects were recorded from South Africa
into Angola in the food and beverage sector. These projects represent a total capital investment of
ZAR1.9bn.
Investments from the Western Cape to Angola were carried out by Remgro via Distell as well as Shoprite.
2
TABLE OF CONTENTS
1. Definitions/descriptions................................................................................................................................... 3
2. Overview of food and beverage market in Angola .......................................................................................... 3
2.1 SWOT analysis of Angola’s food and beverage sector .......................................................................... 5
3. Trade .............................................................................................................................................................. 6
3.1 Angola’s Global Trade of Food and Beverages ..................................................................................... 6
3.2 South African Trade of Food and Beverages with Angola ..................................................................... 9
3.3 Western Cape Trade of Food and Beverages with Angola .................................................................. 10
3.4 Trade Regulations Markings and Standards ........................................................................................ 12
3.4.1. Standards ................................................................................................................................... 12
3.5 Tariffs for South African food and beverages ...................................................................................... 13
4. FDI ............................................................................................................................................................... 14
4.1 Inward FDI into the Angolan food & beverage sector .......................................................................... 14
4.2 Outward FDI from Angola into the food and beverage sector .............................................................. 15
4.3 Bilateral FDI between South Africa, the Western Cape and Angola .................................................... 15
3
1. Definitions/descriptions
According to FDI.net (2012), the food and beverage processing sector refers to the manufacturing, processing and
preservation of meat, fish, fruit, vegetables, oils and fats; manufacture of dairy products; manufacture of grain mill
products, starches and starch products and prepared animals feeds; manufacture of other food products (e.g.
bread, sugar, chocolate, pasta, coffee, nuts and spices); and the manufacture of bottled and canned soft drinks,
fruit juices, beer, wines, etc. This analysis includes unprocessed food and beverages such as raw fruit and
vegetables, seeds and nuts.
African countries spend more than USD60bn annually importing food for their growing populations, but the
continent has the potential to become a major food exporter. Large areas of unused arable land, low fertiliser use
and poor irrigation mean there is scope for improving yields in Africa, which are among the lowest in the world. A
rising middle class continues to boost African demand for food products, especially for processed and packaged
food, creating a continental food market in MENA that the World Bank estimates could be worth USD1trn in 2030
(Gulford Manufacturing, 2015).
2. Overview of food and beverage market in Angola
Angola is a high-risk, high-reward food and drink market in Sub-Saharan Africa. Strong economic expansion
combined with a young, growing population and untapped market niches offer many opportunities for foreign
investors (Business Monitor International, 2015). That said, Angola's challenging regulatory and operating
environment is a major threat. For example import duties introduced on the 23 January 2015 for numerous food
and drink products and steadily rising inflation are causing barriers in the market for exporters. These higher import
tariffs are part of the government's effort to diversify the oil-dependent economy as well as support domestic
industries such as agriculture and manufacturing. While some staple goods, such as flour, beans, rice, palm oil,
sugar, powdered milk and soap, will be exempt from the tariffs, vegetables and fruits are among the items that will
be restricted.
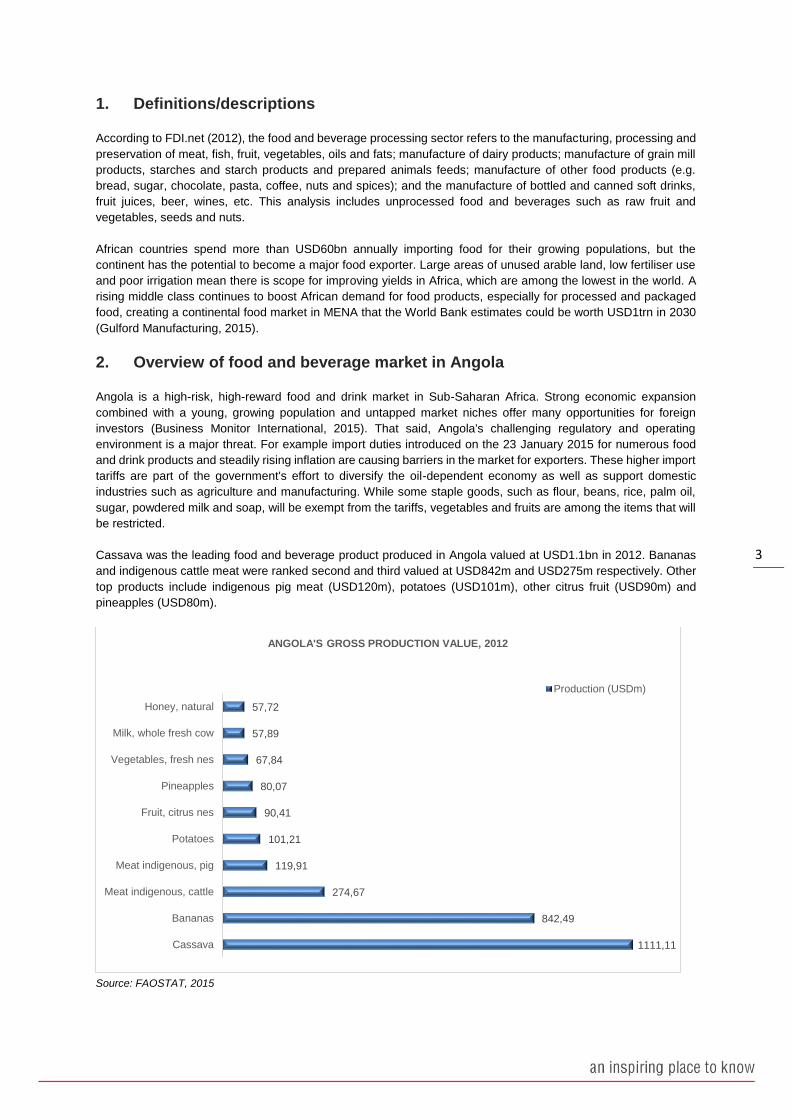
Cassava was the leading food and beverage product produced in Angola valued at USD1.1bn in 2012. Bananas
and indigenous cattle meat were ranked second and third valued at USD842m and USD275m respectively. Other
top products include indigenous pig meat (USD120m), potatoes (USD101m), other citrus fruit (USD90m) and
pineapples (USD80m).
Source: FAOSTAT, 2015
1111,11
842,49
274,67
119,91
101,21
90,41
80,07
67,84
57,89
57,72
Cassava
Bananas
Meat indigenous, cattle
Meat indigenous, pig
Potatoes
Fruit, citrus nes
Pineapples
Vegetables, fresh nes
Milk, whole fresh cow
Honey, natural
ANGOLA'S GROSS PRODUCTION VALUE, 2012
Production (USDm)
4
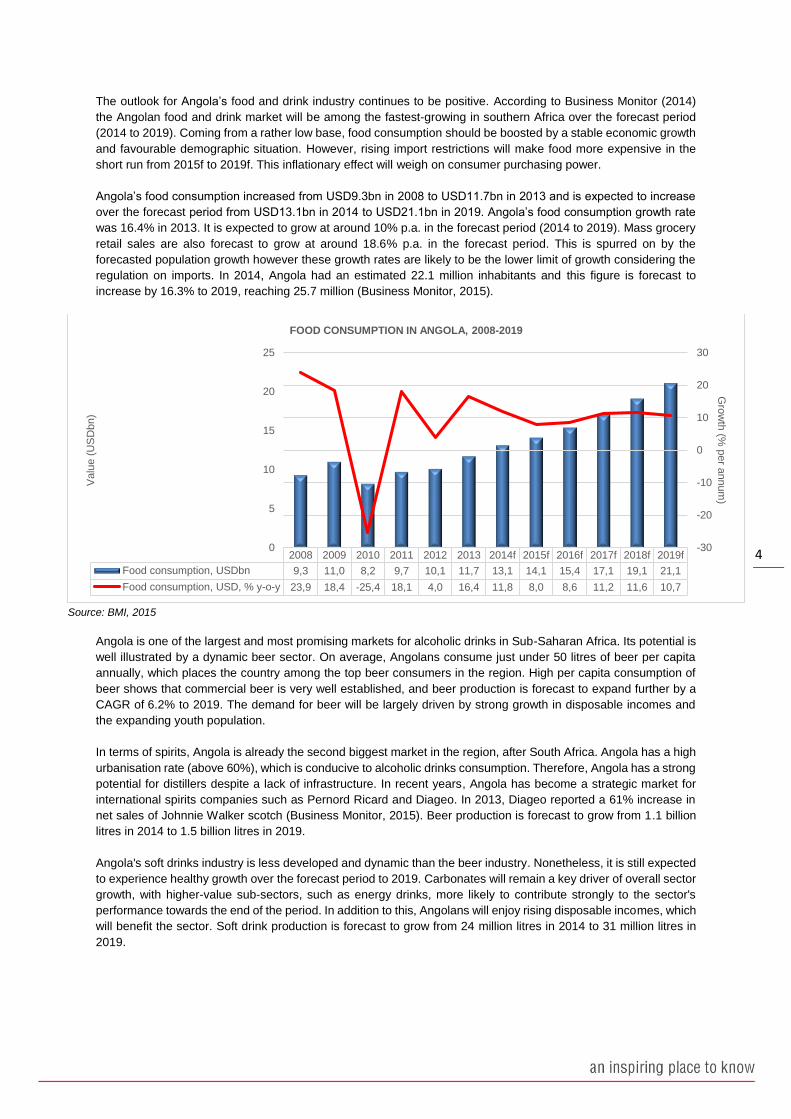
The outlook for Angola’s food and drink industry continues to be positive. According to Business Monitor (2014)
the Angolan food and drink market will be among the fastest-growing in southern Africa over the forecast period
(2014 to 2019). Coming from a rather low base, food consumption should be boosted by a stable economic growth
and favourable demographic situation. However, rising import restrictions will make food more expensive in the
short run from 2015f to 2019f. This inflationary effect will weigh on consumer purchasing power.
Angola’s food consumption increased from USD9.3bn in 2008 to USD11.7bn in 2013 and is expected to increase
over the forecast period from USD13.1bn in 2014 to USD21.1bn in 2019. Angola’s food consumption growth rate
was 16.4% in 2013. It is expected to grow at around 10% p.a. in the forecast period (2014 to 2019). Mass grocery
retail sales are also forecast to grow at around 18.6% p.a. in the forecast period. This is spurred on by the
forecasted population growth however these growth rates are likely to be the lower limit of growth considering the
regulation on imports. In 2014, Angola had an estimated 22.1 million inhabitants and this figure is forecast to
increase by 16.3% to 2019, reaching 25.7 million (Business Monitor, 2015).
Source: BMI, 2015
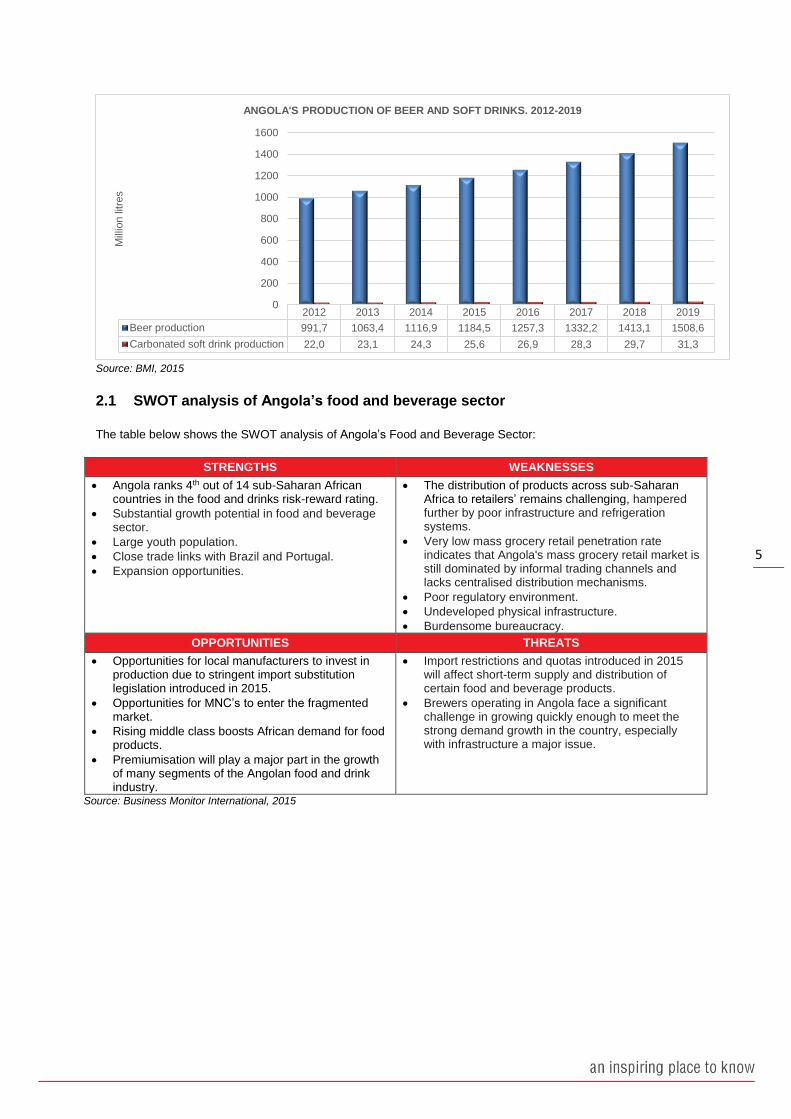
Angola is one of the largest and most promising markets for alcoholic drinks in Sub-Saharan Africa. Its potential is
well illustrated by a dynamic beer sector. On average, Angolans consume just under 50 litres of beer per capita
annually, which places the country among the top beer consumers in the region. High per capita consumption of
beer shows that commercial beer is very well established, and beer production is forecast to expand further by a
CAGR of 6.2% to 2019. The demand for beer will be largely driven by strong growth in disposable incomes and
the expanding youth population.
In terms of spirits, Angola is already the second biggest market in the region, after South Africa. Angola has a high
urbanisation rate (above 60%), which is conducive to alcoholic drinks consumption. Therefore, Angola has a strong
potential for distillers despite a lack of infrastructure. In recent years, Angola has become a strategic market for
international spirits companies such as Pernord Ricard and Diageo. In 2013, Diageo reported a 61% increase in
net sales of Johnnie Walker scotch (Business Monitor, 2015). Beer production is forecast to grow from 1.1 billion
litres in 2014 to 1.5 billion litres in 2019.
Angola's soft drinks industry is less developed and dynamic than the beer industry. Nonetheless, it is still expected
to experience healthy growth over the forecast period to 2019. Carbonates will remain a key driver of overall sector
growth, with higher-value sub-sectors, such as energy drinks, more likely to contribute strongly to the sector's
performance towards the end of the period. In addition to this, Angolans will enjoy rising disposable incomes, which
will benefit the sector. Soft drink production is forecast to grow from 24 million litres in 2014 to 31 million litres in
2019.
2008 2009 2010 2011 2012 2013 2014f 2015f 2016f 2017f 2018f 2019f
Food consumption, USDbn 9,3 11,0 8,2 9,7 10,1 11,7 13,1 14,1 15,4 17,1 19,1 21,1
Food consumption, USD, % y-o-y 23,9 18,4 -25,4 18,1 4,0 16,4 11,8 8,0 8,6 11,2 11,6 10,7
0
5
10
15
20
25
-30
-20
-10
0
10
20
30
Valu
e (
US
Dbn)
Gro
wth
(% p
er a
nnum
)
FOOD CONSUMPTION IN ANGOLA, 2008-2019
5
Source: BMI, 2015
2.1 SWOT analysis of Angola’s food and beverage sector
The table below shows the SWOT analysis of Angola’s Food and Beverage Sector:
STRENGTHS WEAKNESSES
Angola ranks 4th out of 14 sub-Saharan African countries in the food and drinks risk-reward rating.
Substantial growth potential in food and beverage sector.
Large youth population.
Close trade links with Brazil and Portugal.
Expansion opportunities.
The distribution of products across sub-Saharan Africa to retailers’ remains challenging, hampered further by poor infrastructure and refrigeration systems.
Very low mass grocery retail penetration rate indicates that Angola's mass grocery retail market is still dominated by informal trading channels and lacks centralised distribution mechanisms.
Poor regulatory environment.
Undeveloped physical infrastructure.
Burdensome bureaucracy.
OPPORTUNITIES THREATS
Opportunities for local manufacturers to invest in production due to stringent import substitution legislation introduced in 2015.
Opportunities for MNC’s to enter the fragmented market.
Rising middle class boosts African demand for food products.
Premiumisation will play a major part in the growth of many segments of the Angolan food and drink industry.
Import restrictions and quotas introduced in 2015 will affect short-term supply and distribution of certain food and beverage products.
Brewers operating in Angola face a significant challenge in growing quickly enough to meet the strong demand growth in the country, especially with infrastructure a major issue.
Source: Business Monitor International, 2015
2012 2013 2014 2015 2016 2017 2018 2019
Beer production 991,7 1063,4 1116,9 1184,5 1257,3 1332,2 1413,1 1508,6
Carbonated soft drink production 22,0 23,1 24,3 25,6 26,9 28,3 29,7 31,3
0
200
400
600
800
1000
1200
1400
1600
Mill
ion litre
sANGOLA'S PRODUCTION OF BEER AND SOFT DRINKS. 2012-2019
6
3. Trade
3.1 Angola’s Global Trade of Food and Beverages
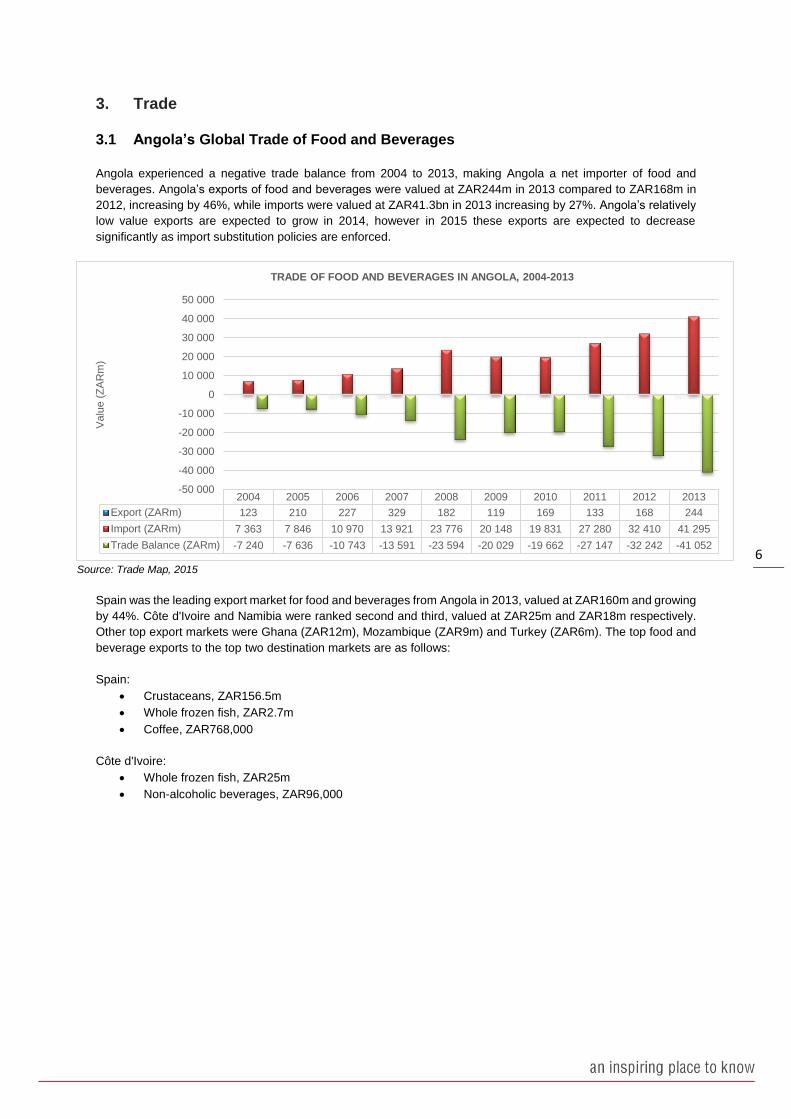
Angola experienced a negative trade balance from 2004 to 2013, making Angola a net importer of food and
beverages. Angola’s exports of food and beverages were valued at ZAR244m in 2013 compared to ZAR168m in
2012, increasing by 46%, while imports were valued at ZAR41.3bn in 2013 increasing by 27%. Angola’s relatively
low value exports are expected to grow in 2014, however in 2015 these exports are expected to decrease
significantly as import substitution policies are enforced.
Source: Trade Map, 2015
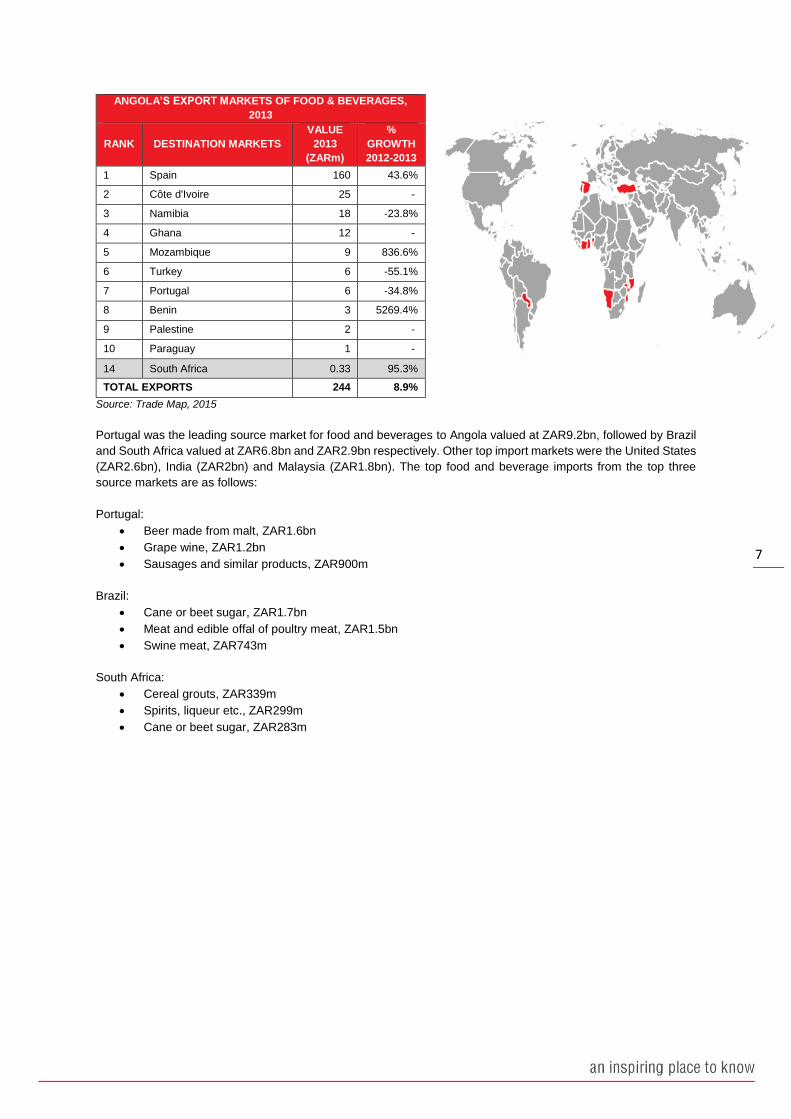
Spain was the leading export market for food and beverages from Angola in 2013, valued at ZAR160m and growing
by 44%. Côte d'Ivoire and Namibia were ranked second and third, valued at ZAR25m and ZAR18m respectively.
Other top export markets were Ghana (ZAR12m), Mozambique (ZAR9m) and Turkey (ZAR6m). The top food and
beverage exports to the top two destination markets are as follows:
Spain:
Crustaceans, ZAR156.5m
Whole frozen fish, ZAR2.7m
Coffee, ZAR768,000
Côte d'Ivoire:
Whole frozen fish, ZAR25m
Non-alcoholic beverages, ZAR96,000
2004 2005 2006 2007 2008 2009 2010 2011 2012 2013
Export (ZARm) 123 210 227 329 182 119 169 133 168 244
Import (ZARm) 7 363 7 846 10 970 13 921 23 776 20 148 19 831 27 280 32 410 41 295
Trade Balance (ZARm) -7 240 -7 636 -10 743 -13 591 -23 594 -20 029 -19 662 -27 147 -32 242 -41 052
-50 000
-40 000
-30 000
-20 000
-10 000
0
10 000
20 000
30 000
40 000
50 000
Valu
e (
ZA
Rm
)
TRADE OF FOOD AND BEVERAGES IN ANGOLA, 2004-2013
7
ANGOLA’S EXPORT MARKETS OF FOOD & BEVERAGES,
2013
RANK DESTINATION MARKETS
VALUE
2013
(ZARm)
%
GROWTH
2012-2013
1 Spain 160 43.6%
2 Côte d'Ivoire 25 -
3 Namibia 18 -23.8%
4 Ghana 12 -
5 Mozambique 9 836.6%
6 Turkey 6 -55.1%
7 Portugal 6 -34.8%
8 Benin 3 5269.4%
9 Palestine 2 -
10 Paraguay 1 -
14 South Africa 0.33 95.3%
TOTAL EXPORTS 244 8.9%
Source: Trade Map, 2015
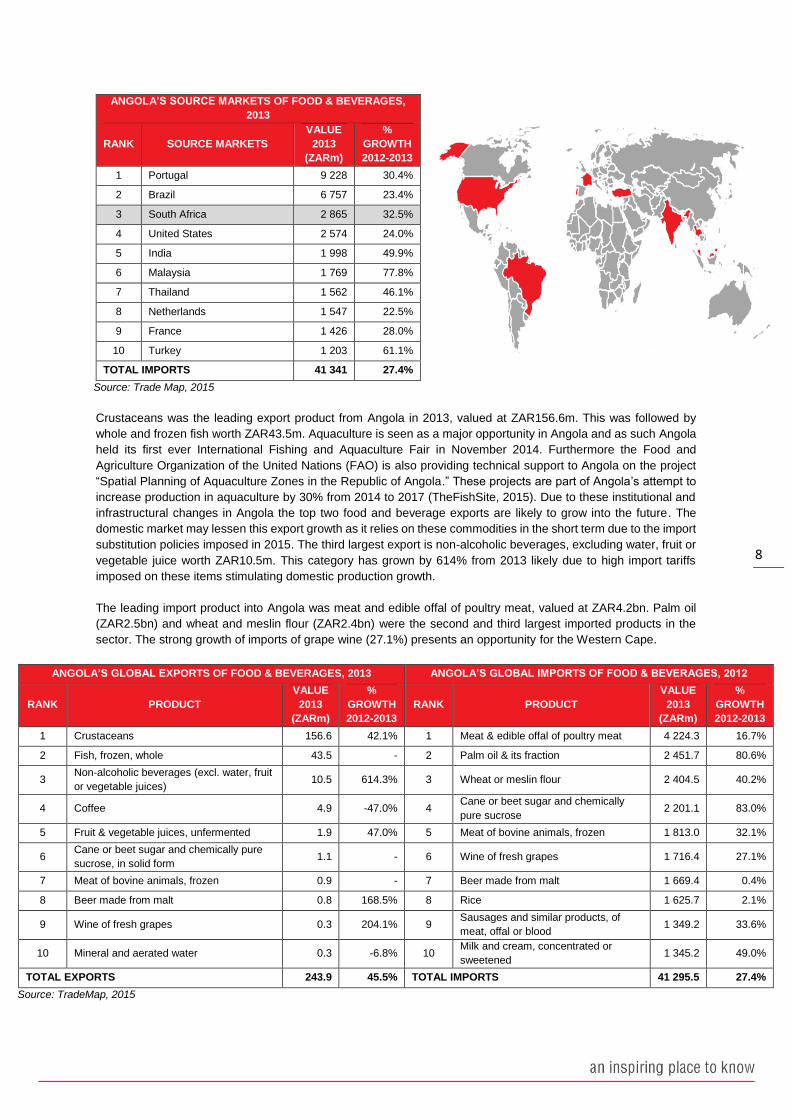
Portugal was the leading source market for food and beverages to Angola valued at ZAR9.2bn, followed by Brazil
and South Africa valued at ZAR6.8bn and ZAR2.9bn respectively. Other top import markets were the United States
(ZAR2.6bn), India (ZAR2bn) and Malaysia (ZAR1.8bn). The top food and beverage imports from the top three
source markets are as follows:
Portugal:
Beer made from malt, ZAR1.6bn
Grape wine, ZAR1.2bn
Sausages and similar products, ZAR900m
Brazil:
Cane or beet sugar, ZAR1.7bn
Meat and edible offal of poultry meat, ZAR1.5bn
Swine meat, ZAR743m
South Africa:
Cereal grouts, ZAR339m
Spirits, liqueur etc., ZAR299m
Cane or beet sugar, ZAR283m
8
Source: Trade Map, 2015
Crustaceans was the leading export product from Angola in 2013, valued at ZAR156.6m. This was followed by
whole and frozen fish worth ZAR43.5m. Aquaculture is seen as a major opportunity in Angola and as such Angola
held its first ever International Fishing and Aquaculture Fair in November 2014. Furthermore the Food and
Agriculture Organization of the United Nations (FAO) is also providing technical support to Angola on the project
“Spatial Planning of Aquaculture Zones in the Republic of Angola.” These projects are part of Angola’s attempt to
increase production in aquaculture by 30% from 2014 to 2017 (TheFishSite, 2015). Due to these institutional and
infrastructural changes in Angola the top two food and beverage exports are likely to grow into the future. The
domestic market may lessen this export growth as it relies on these commodities in the short term due to the import
substitution policies imposed in 2015. The third largest export is non-alcoholic beverages, excluding water, fruit or
vegetable juice worth ZAR10.5m. This category has grown by 614% from 2013 likely due to high import tariffs
imposed on these items stimulating domestic production growth.
The leading import product into Angola was meat and edible offal of poultry meat, valued at ZAR4.2bn. Palm oil
(ZAR2.5bn) and wheat and meslin flour (ZAR2.4bn) were the second and third largest imported products in the
sector. The strong growth of imports of grape wine (27.1%) presents an opportunity for the Western Cape.
ANGOLA’S GLOBAL EXPORTS OF FOOD & BEVERAGES, 2013 ANGOLA’S GLOBAL IMPORTS OF FOOD & BEVERAGES, 2012
RANK PRODUCT
VALUE
2013
(ZARm)
%
GROWTH
2012-2013
RANK PRODUCT
VALUE
2013
(ZARm)
%
GROWTH
2012-2013
1 Crustaceans 156.6 42.1% 1 Meat & edible offal of poultry meat 4 224.3 16.7%
2 Fish, frozen, whole 43.5 - 2 Palm oil & its fraction 2 451.7 80.6%
3 Non-alcoholic beverages (excl. water, fruit
or vegetable juices) 10.5 614.3% 3 Wheat or meslin flour 2 404.5 40.2%
4 Coffee 4.9 -47.0% 4 Cane or beet sugar and chemically
pure sucrose 2 201.1 83.0%
5 Fruit & vegetable juices, unfermented 1.9 47.0% 5 Meat of bovine animals, frozen 1 813.0 32.1%
6 Cane or beet sugar and chemically pure
sucrose, in solid form 1.1 - 6 Wine of fresh grapes 1 716.4 27.1%
7 Meat of bovine animals, frozen 0.9 - 7 Beer made from malt 1 669.4 0.4%
8 Beer made from malt 0.8 168.5% 8 Rice 1 625.7 2.1%
9 Wine of fresh grapes 0.3 204.1% 9 Sausages and similar products, of
meat, offal or blood 1 349.2 33.6%
10 Mineral and aerated water 0.3 -6.8% 10 Milk and cream, concentrated or
sweetened 1 345.2 49.0%
TOTAL EXPORTS 243.9 45.5% TOTAL IMPORTS 41 295.5 27.4%
Source: TradeMap, 2015
ANGOLA’S SOURCE MARKETS OF FOOD & BEVERAGES,
2013
RANK SOURCE MARKETS
VALUE
2013
(ZARm)
%
GROWTH
2012-2013
1 Portugal 9 228 30.4%
2 Brazil 6 757 23.4%
3 South Africa 2 865 32.5%
4 United States 2 574 24.0%
5 India 1 998 49.9%
6 Malaysia 1 769 77.8%
7 Thailand 1 562 46.1%
8 Netherlands 1 547 22.5%
9 France 1 426 28.0%
10 Turkey 1 203 61.1%
TOTAL IMPORTS 41 341 27.4%
9
3.2 South African Trade of Food and Beverages with Angola
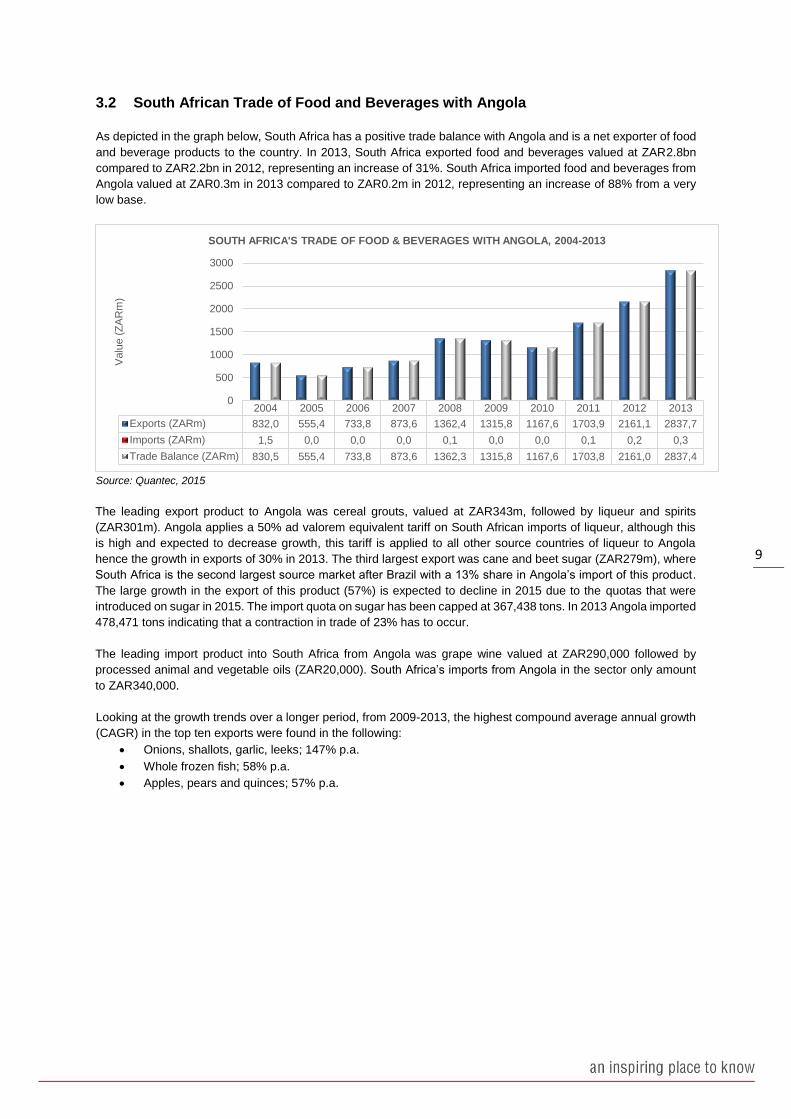
As depicted in the graph below, South Africa has a positive trade balance with Angola and is a net exporter of food
and beverage products to the country. In 2013, South Africa exported food and beverages valued at ZAR2.8bn
compared to ZAR2.2bn in 2012, representing an increase of 31%. South Africa imported food and beverages from
Angola valued at ZAR0.3m in 2013 compared to ZAR0.2m in 2012, representing an increase of 88% from a very
low base.
Source: Quantec, 2015
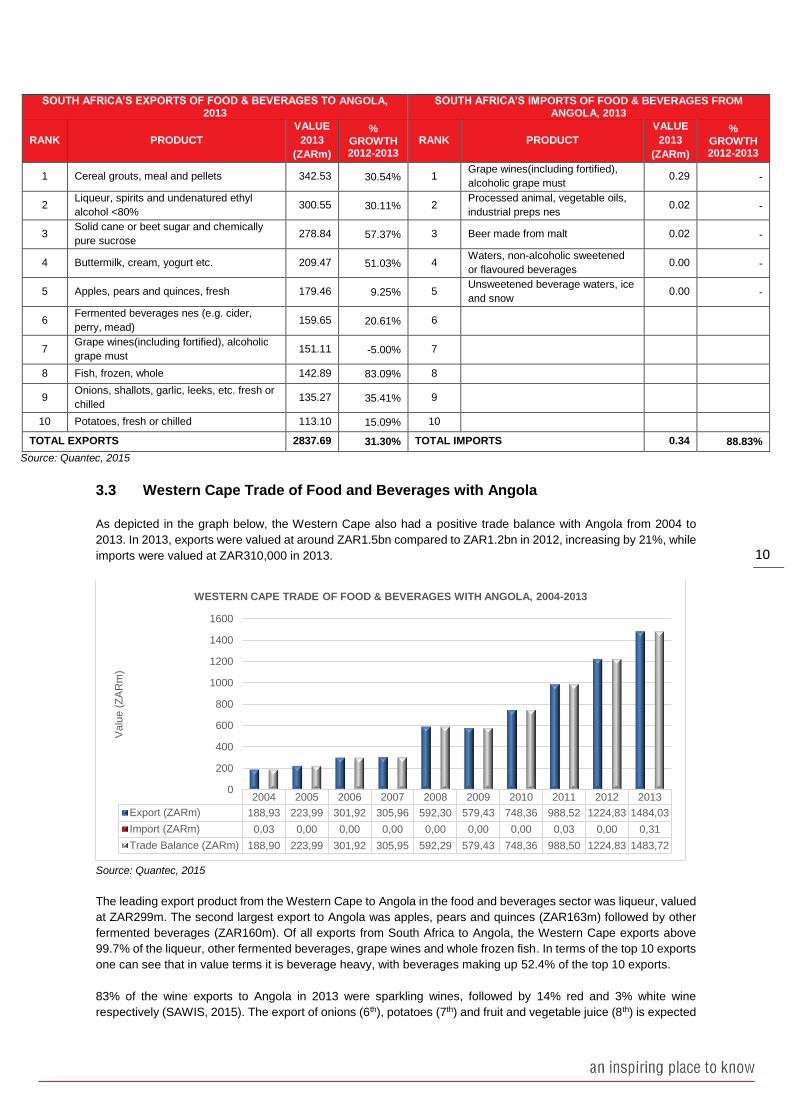
The leading export product to Angola was cereal grouts, valued at ZAR343m, followed by liqueur and spirits
(ZAR301m). Angola applies a 50% ad valorem equivalent tariff on South African imports of liqueur, although this
is high and expected to decrease growth, this tariff is applied to all other source countries of liqueur to Angola
hence the growth in exports of 30% in 2013. The third largest export was cane and beet sugar (ZAR279m), where
South Africa is the second largest source market after Brazil with a 13% share in Angola’s import of this product.
The large growth in the export of this product (57%) is expected to decline in 2015 due to the quotas that were
introduced on sugar in 2015. The import quota on sugar has been capped at 367,438 tons. In 2013 Angola imported
478,471 tons indicating that a contraction in trade of 23% has to occur.
The leading import product into South Africa from Angola was grape wine valued at ZAR290,000 followed by
processed animal and vegetable oils (ZAR20,000). South Africa’s imports from Angola in the sector only amount
to ZAR340,000.
Looking at the growth trends over a longer period, from 2009-2013, the highest compound average annual growth
(CAGR) in the top ten exports were found in the following:
Onions, shallots, garlic, leeks; 147% p.a.
Whole frozen fish; 58% p.a.
Apples, pears and quinces; 57% p.a.
2004 2005 2006 2007 2008 2009 2010 2011 2012 2013
Exports (ZARm) 832,0 555,4 733,8 873,6 1362,4 1315,8 1167,6 1703,9 2161,1 2837,7
Imports (ZARm) 1,5 0,0 0,0 0,0 0,1 0,0 0,0 0,1 0,2 0,3
Trade Balance (ZARm) 830,5 555,4 733,8 873,6 1362,3 1315,8 1167,6 1703,8 2161,0 2837,4
0
500
1000
1500
2000
2500
3000
Valu
e (
ZA
Rm
)
SOUTH AFRICA'S TRADE OF FOOD & BEVERAGES WITH ANGOLA, 2004-2013
10
SOUTH AFRICA’S EXPORTS OF FOOD & BEVERAGES TO ANGOLA, 2013
SOUTH AFRICA’S IMPORTS OF FOOD & BEVERAGES FROM ANGOLA, 2013
RANK PRODUCT
VALUE
2013
(ZARm)
% GROWTH 2012-2013
RANK PRODUCT
VALUE
2013
(ZARm)
% GROWTH 2012-2013
1 Cereal grouts, meal and pellets 342.53 30.54% 1 Grape wines(including fortified),
alcoholic grape must 0.29 -
2 Liqueur, spirits and undenatured ethyl
alcohol <80% 300.55 30.11% 2
Processed animal, vegetable oils,
industrial preps nes 0.02 -
3 Solid cane or beet sugar and chemically
pure sucrose 278.84 57.37% 3 Beer made from malt 0.02 -
4 Buttermilk, cream, yogurt etc. 209.47 51.03% 4 Waters, non-alcoholic sweetened
or flavoured beverages 0.00 -
5 Apples, pears and quinces, fresh 179.46 9.25% 5 Unsweetened beverage waters, ice
and snow 0.00 -
6 Fermented beverages nes (e.g. cider,
perry, mead) 159.65 20.61% 6
7 Grape wines(including fortified), alcoholic
grape must 151.11 -5.00% 7
8 Fish, frozen, whole 142.89 83.09% 8
9 Onions, shallots, garlic, leeks, etc. fresh or
chilled 135.27 35.41% 9
10 Potatoes, fresh or chilled 113.10 15.09% 10
TOTAL EXPORTS 2837.69 31.30% TOTAL IMPORTS 0.34 88.83%
Source: Quantec, 2015
3.3 Western Cape Trade of Food and Beverages with Angola
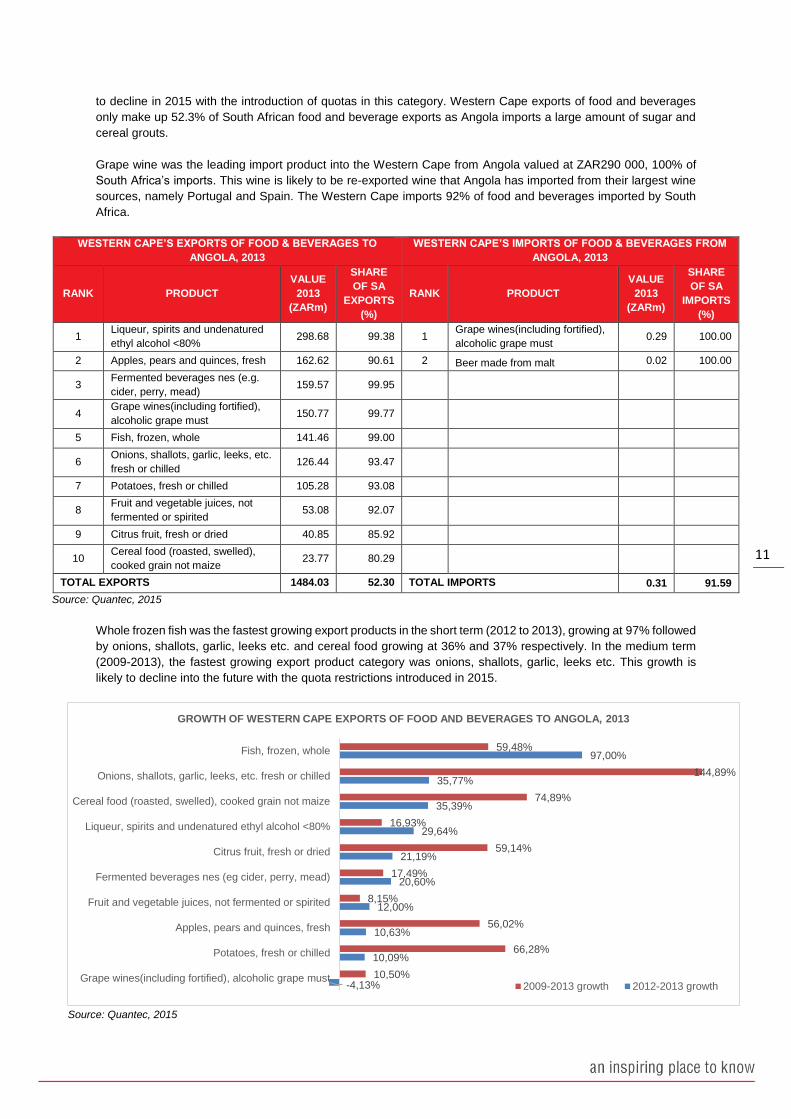
As depicted in the graph below, the Western Cape also had a positive trade balance with Angola from 2004 to
2013. In 2013, exports were valued at around ZAR1.5bn compared to ZAR1.2bn in 2012, increasing by 21%, while
imports were valued at ZAR310,000 in 2013.
Source: Quantec, 2015
The leading export product from the Western Cape to Angola in the food and beverages sector was liqueur, valued
at ZAR299m. The second largest export to Angola was apples, pears and quinces (ZAR163m) followed by other
fermented beverages (ZAR160m). Of all exports from South Africa to Angola, the Western Cape exports above
99.7% of the liqueur, other fermented beverages, grape wines and whole frozen fish. In terms of the top 10 exports
one can see that in value terms it is beverage heavy, with beverages making up 52.4% of the top 10 exports.
83% of the wine exports to Angola in 2013 were sparkling wines, followed by 14% red and 3% white wine
respectively (SAWIS, 2015). The export of onions (6th), potatoes (7th) and fruit and vegetable juice (8th) is expected
2004 2005 2006 2007 2008 2009 2010 2011 2012 2013
Export (ZARm) 188,93 223,99 301,92 305,96 592,30 579,43 748,36 988,52 1224,83 1484,03
Import (ZARm) 0,03 0,00 0,00 0,00 0,00 0,00 0,00 0,03 0,00 0,31
Trade Balance (ZARm) 188,90 223,99 301,92 305,95 592,29 579,43 748,36 988,50 1224,83 1483,72
0
200
400
600
800
1000
1200
1400
1600
Valu
e (
ZA
Rm
)
WESTERN CAPE TRADE OF FOOD & BEVERAGES WITH ANGOLA, 2004-2013
11
to decline in 2015 with the introduction of quotas in this category. Western Cape exports of food and beverages
only make up 52.3% of South African food and beverage exports as Angola imports a large amount of sugar and
cereal grouts.
Grape wine was the leading import product into the Western Cape from Angola valued at ZAR290 000, 100% of
South Africa’s imports. This wine is likely to be re-exported wine that Angola has imported from their largest wine
sources, namely Portugal and Spain. The Western Cape imports 92% of food and beverages imported by South
Africa.
WESTERN CAPE’S EXPORTS OF FOOD & BEVERAGES TO
ANGOLA, 2013
WESTERN CAPE’S IMPORTS OF FOOD & BEVERAGES FROM
ANGOLA, 2013
RANK PRODUCT
VALUE
2013
(ZARm)
SHARE
OF SA
EXPORTS
(%)
RANK PRODUCT
VALUE
2013
(ZARm)
SHARE
OF SA
IMPORTS
(%)
1 Liqueur, spirits and undenatured
ethyl alcohol <80% 298.68 99.38 1
Grape wines(including fortified),
alcoholic grape must 0.29 100.00
2 Apples, pears and quinces, fresh 162.62 90.61 2 Beer made from malt 0.02 100.00
3 Fermented beverages nes (e.g.
cider, perry, mead) 159.57 99.95
4 Grape wines(including fortified),
alcoholic grape must 150.77 99.77
5 Fish, frozen, whole 141.46 99.00
6 Onions, shallots, garlic, leeks, etc.
fresh or chilled 126.44 93.47
7 Potatoes, fresh or chilled 105.28 93.08
8 Fruit and vegetable juices, not
fermented or spirited 53.08 92.07
9 Citrus fruit, fresh or dried 40.85 85.92
10 Cereal food (roasted, swelled),
cooked grain not maize 23.77 80.29
TOTAL EXPORTS 1484.03 52.30 TOTAL IMPORTS 0.31 91.59
Source: Quantec, 2015
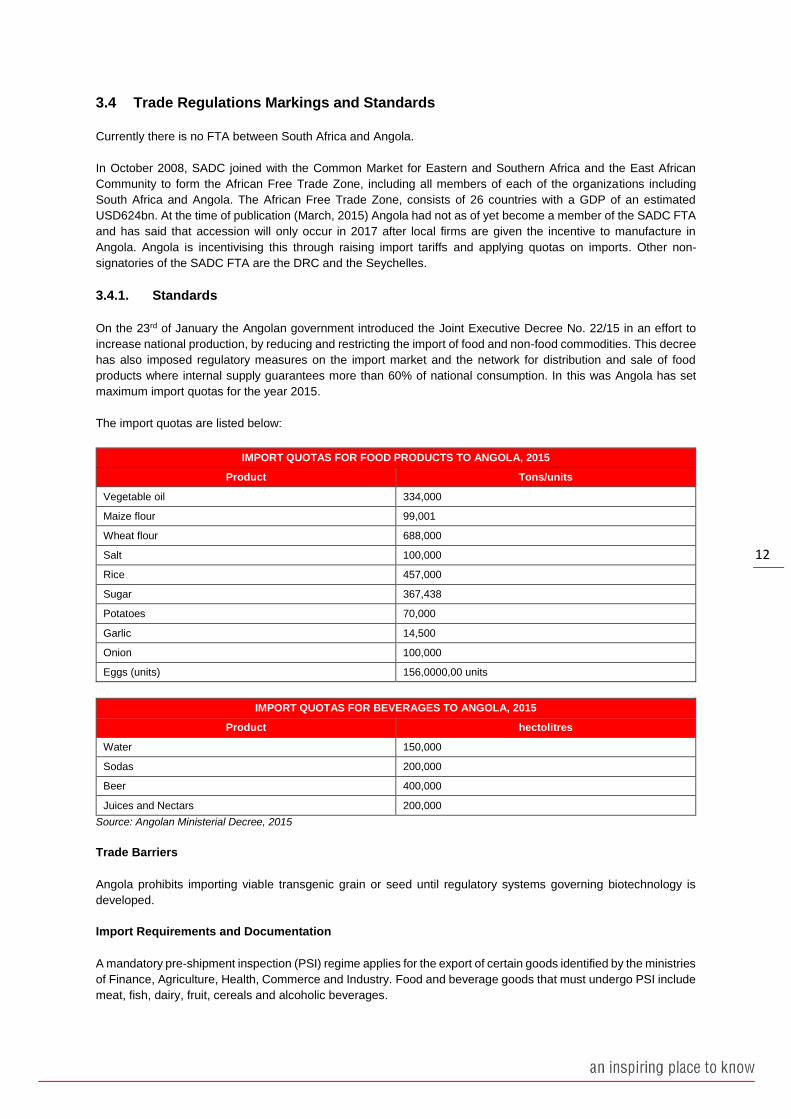
Whole frozen fish was the fastest growing export products in the short term (2012 to 2013), growing at 97% followed
by onions, shallots, garlic, leeks etc. and cereal food growing at 36% and 37% respectively. In the medium term
(2009-2013), the fastest growing export product category was onions, shallots, garlic, leeks etc. This growth is
likely to decline into the future with the quota restrictions introduced in 2015.
Source: Quantec, 2015
-4,13%
10,09%
10,63%
12,00%
20,60%
21,19%
29,64%
35,39%
35,77%
97,00%
10,50%
66,28%
56,02%
8,15%
17,49%
59,14%
16,93%
74,89%
144,89%
59,48%
Grape wines(including fortified), alcoholic grape must
Potatoes, fresh or chilled
Apples, pears and quinces, fresh
Fruit and vegetable juices, not fermented or spirited
Fermented beverages nes (eg cider, perry, mead)
Citrus fruit, fresh or dried
Liqueur, spirits and undenatured ethyl alcohol <80%
Cereal food (roasted, swelled), cooked grain not maize
Onions, shallots, garlic, leeks, etc. fresh or chilled
Fish, frozen, whole
GROWTH OF WESTERN CAPE EXPORTS OF FOOD AND BEVERAGES TO ANGOLA, 2013
2009-2013 growth 2012-2013 growth
12
3.4 Trade Regulations Markings and Standards
Currently there is no FTA between South Africa and Angola.
In October 2008, SADC joined with the Common Market for Eastern and Southern Africa and the East African
Community to form the African Free Trade Zone, including all members of each of the organizations including
South Africa and Angola. The African Free Trade Zone, consists of 26 countries with a GDP of an estimated
USD624bn. At the time of publication (March, 2015) Angola had not as of yet become a member of the SADC FTA
and has said that accession will only occur in 2017 after local firms are given the incentive to manufacture in
Angola. Angola is incentivising this through raising import tariffs and applying quotas on imports. Other non-
signatories of the SADC FTA are the DRC and the Seychelles.
3.4.1. Standards
On the 23rd of January the Angolan government introduced the Joint Executive Decree No. 22/15 in an effort to
increase national production, by reducing and restricting the import of food and non-food commodities. This decree
has also imposed regulatory measures on the import market and the network for distribution and sale of food
products where internal supply guarantees more than 60% of national consumption. In this was Angola has set
maximum import quotas for the year 2015.
The import quotas are listed below:
IMPORT QUOTAS FOR FOOD PRODUCTS TO ANGOLA, 2015
Product Tons/units
Vegetable oil 334,000
Maize flour 99,001
Wheat flour 688,000
Salt 100,000
Rice 457,000
Sugar 367,438
Potatoes 70,000
Garlic 14,500
Onion 100,000
Eggs (units) 156,0000,00 units
IMPORT QUOTAS FOR BEVERAGES TO ANGOLA, 2015
Product hectolitres
Water 150,000
Sodas 200,000
Beer 400,000
Juices and Nectars 200,000
Source: Angolan Ministerial Decree, 2015
Trade Barriers
Angola prohibits importing viable transgenic grain or seed until regulatory systems governing biotechnology is
developed.
Import Requirements and Documentation
A mandatory pre-shipment inspection (PSI) regime applies for the export of certain goods identified by the ministries
of Finance, Agriculture, Health, Commerce and Industry. Food and beverage goods that must undergo PSI include
meat, fish, dairy, fruit, cereals and alcoholic beverages.
13
3.5 Tariffs for South African food and beverages
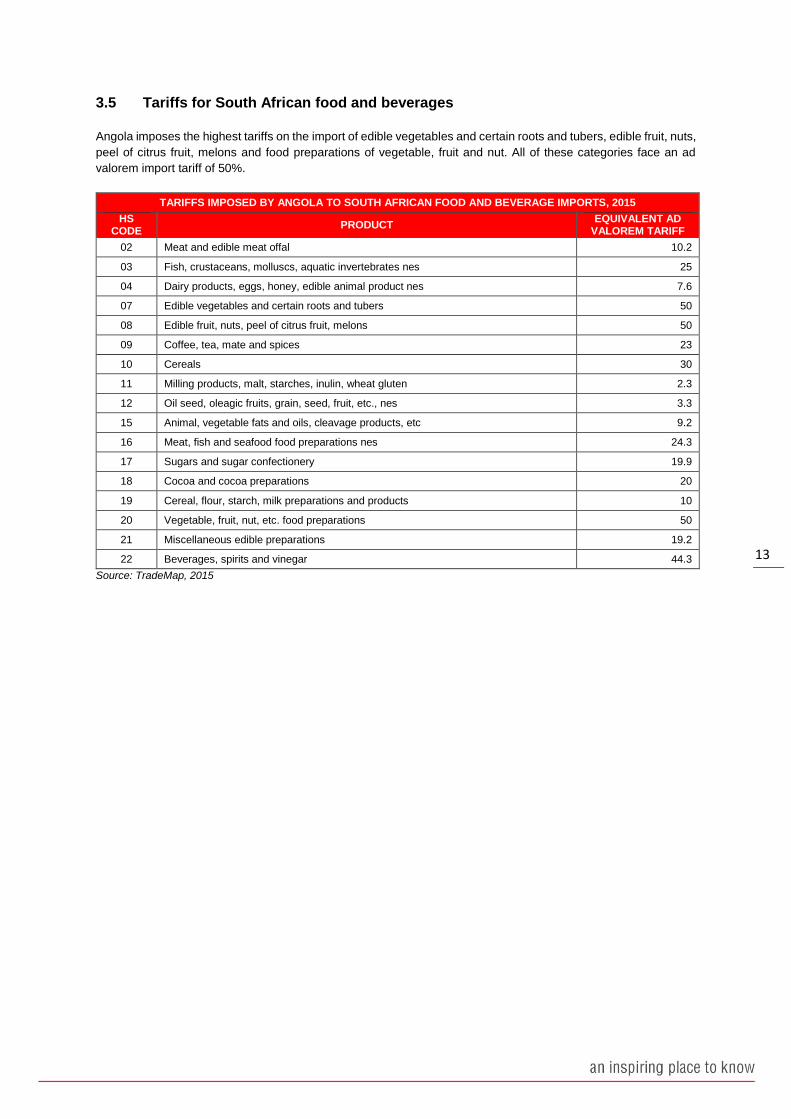
Angola imposes the highest tariffs on the import of edible vegetables and certain roots and tubers, edible fruit, nuts,
peel of citrus fruit, melons and food preparations of vegetable, fruit and nut. All of these categories face an ad
valorem import tariff of 50%.
TARIFFS IMPOSED BY ANGOLA TO SOUTH AFRICAN FOOD AND BEVERAGE IMPORTS, 2015
HS CODE
PRODUCT EQUIVALENT AD
VALOREM TARIFF
02 Meat and edible meat offal 10.2
03 Fish, crustaceans, molluscs, aquatic invertebrates nes 25
04 Dairy products, eggs, honey, edible animal product nes 7.6
07 Edible vegetables and certain roots and tubers 50
08 Edible fruit, nuts, peel of citrus fruit, melons 50
09 Coffee, tea, mate and spices 23
10 Cereals 30
11 Milling products, malt, starches, inulin, wheat gluten 2.3
12 Oil seed, oleagic fruits, grain, seed, fruit, etc., nes 3.3
15 Animal, vegetable fats and oils, cleavage products, etc 9.2
16 Meat, fish and seafood food preparations nes 24.3
17 Sugars and sugar confectionery 19.9
18 Cocoa and cocoa preparations 20
19 Cereal, flour, starch, milk preparations and products 10
20 Vegetable, fruit, nut, etc. food preparations 50
21 Miscellaneous edible preparations 19.2
22 Beverages, spirits and vinegar 44.3
Source: TradeMap, 2015
14
4. FDI
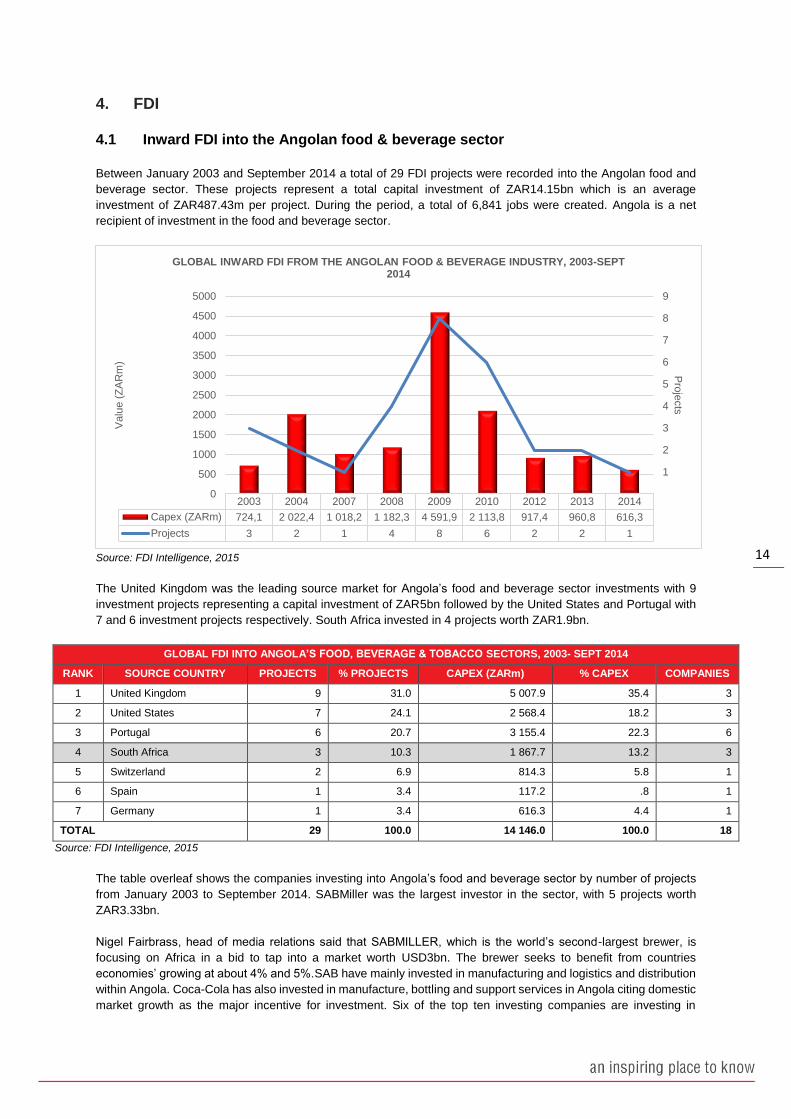
4.1 Inward FDI into the Angolan food & beverage sector
Between January 2003 and September 2014 a total of 29 FDI projects were recorded into the Angolan food and
beverage sector. These projects represent a total capital investment of ZAR14.15bn which is an average
investment of ZAR487.43m per project. During the period, a total of 6,841 jobs were created. Angola is a net
recipient of investment in the food and beverage sector.
Source: FDI Intelligence, 2015
The United Kingdom was the leading source market for Angola’s food and beverage sector investments with 9
investment projects representing a capital investment of ZAR5bn followed by the United States and Portugal with
7 and 6 investment projects respectively. South Africa invested in 4 projects worth ZAR1.9bn.
GLOBAL FDI INTO ANGOLA’S FOOD, BEVERAGE & TOBACCO SECTORS, 2003- SEPT 2014
RANK SOURCE COUNTRY PROJECTS % PROJECTS CAPEX (ZARm) % CAPEX COMPANIES
1 United Kingdom 9 31.0 5 007.9 35.4 3
2 United States 7 24.1 2 568.4 18.2 3
3 Portugal 6 20.7 3 155.4 22.3 6
4 South Africa 3 10.3 1 867.7 13.2 3
5 Switzerland 2 6.9 814.3 5.8 1
6 Spain 1 3.4 117.2 .8 1
7 Germany 1 3.4 616.3 4.4 1
TOTAL 29 100.0 14 146.0 100.0 18
Source: FDI Intelligence, 2015
The table overleaf shows the companies investing into Angola’s food and beverage sector by number of projects
from January 2003 to September 2014. SABMiller was the largest investor in the sector, with 5 projects worth
ZAR3.33bn.
Nigel Fairbrass, head of media relations said that SABMILLER, which is the world’s second-largest brewer, is
focusing on Africa in a bid to tap into a market worth USD3bn. The brewer seeks to benefit from countries
economies’ growing at about 4% and 5%.SAB have mainly invested in manufacturing and logistics and distribution
within Angola. Coca-Cola has also invested in manufacture, bottling and support services in Angola citing domestic
market growth as the major incentive for investment. Six of the top ten investing companies are investing in
2003 2004 2007 2008 2009 2010 2012 2013 2014
Capex (ZARm) 724,1 2 022,4 1 018,2 1 182,3 4 591,9 2 113,8 917,4 960,8 616,3
Projects 3 2 1 4 8 6 2 2 1
1
2
3
4
5
6
7
8
9
0
500
1000
1500
2000
2500
3000
3500
4000
4500
5000
Pro
jects
Valu
e (
ZA
Rm
)
GLOBAL INWARD FDI FROM THE ANGOLAN FOOD & BEVERAGE INDUSTRY, 2003-SEPT 2014
15
manufacturing and distribution infrastructure in the beverage sector, which could affect Western Cape exports of
beverages to Angola.
COMPANIES INVESTING INTO ANGOLA’S FOOD & BEVERAGE SECTOR, 2003-SEPT 2014
INVESTING COMPANY COUNTRY PROJECTS CAPEX (ZARbn)
SABMiller United Kingdom 5 3.33
Coca-Cola United States 3 0.46
Coca-Cola Bottling (Luanda) United States 3 1.43
Lonrho Springs United Kingdom 2 0.31
Lonrho Agriculture United Kingdom 2 1.37
Nestle Switzerland 2 0.81
Unicer Portugal 1 1.41
Ferpinta Angola Portugal 1 0.06
Shoprite South Africa 1 0.23
Sousa Cintra Portugal 1 0.62
TOTAL FROM TOP 10 INVESTORS 21 10.02
Source: FDI Intelligence, 2015
4.2 Outward FDI from Angola into the food and beverage sector
Angola did not invest in any outward projects into the food and beverage sector from 2003 to September 2014.
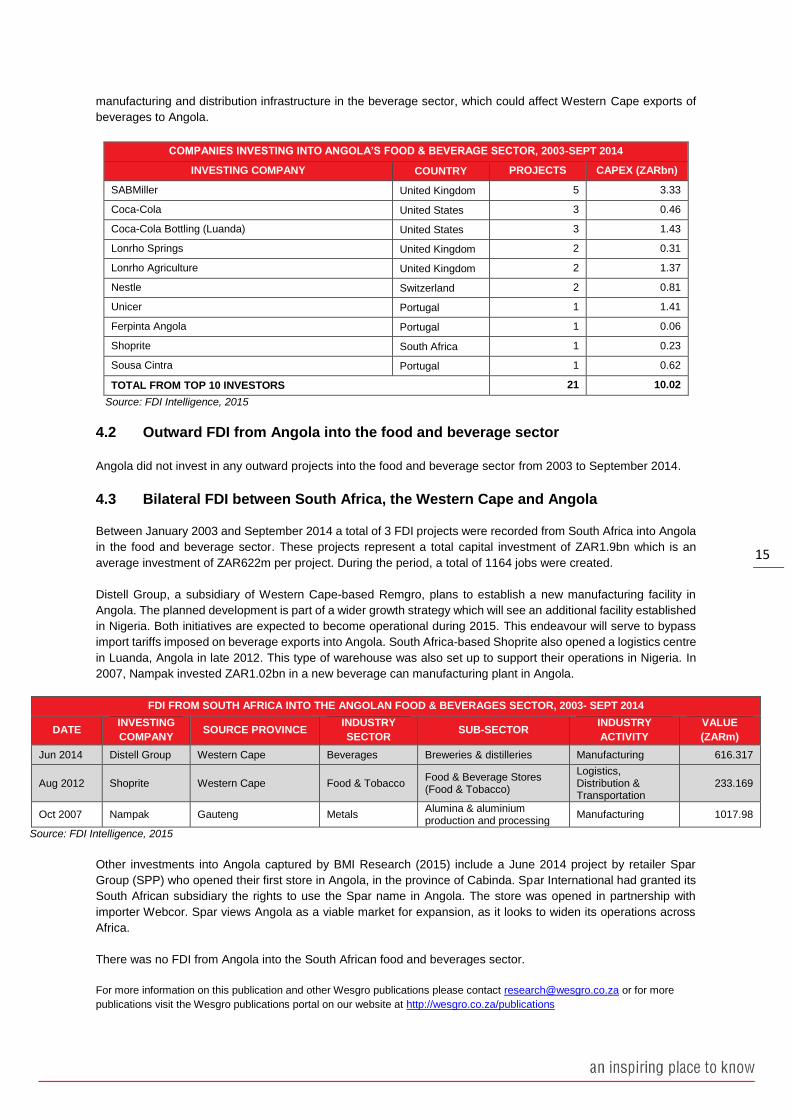
4.3 Bilateral FDI between South Africa, the Western Cape and Angola
Between January 2003 and September 2014 a total of 3 FDI projects were recorded from South Africa into Angola
in the food and beverage sector. These projects represent a total capital investment of ZAR1.9bn which is an
average investment of ZAR622m per project. During the period, a total of 1164 jobs were created.
Distell Group, a subsidiary of Western Cape-based Remgro, plans to establish a new manufacturing facility in
Angola. The planned development is part of a wider growth strategy which will see an additional facility established
in Nigeria. Both initiatives are expected to become operational during 2015. This endeavour will serve to bypass
import tariffs imposed on beverage exports into Angola. South Africa-based Shoprite also opened a logistics centre
in Luanda, Angola in late 2012. This type of warehouse was also set up to support their operations in Nigeria. In
2007, Nampak invested ZAR1.02bn in a new beverage can manufacturing plant in Angola.
FDI FROM SOUTH AFRICA INTO THE ANGOLAN FOOD & BEVERAGES SECTOR, 2003- SEPT 2014
DATE INVESTING
COMPANY SOURCE PROVINCE
INDUSTRY
SECTOR SUB-SECTOR
INDUSTRY
ACTIVITY
VALUE
(ZARm)
Jun 2014 Distell Group Western Cape Beverages Breweries & distilleries Manufacturing 616.317
Aug 2012 Shoprite Western Cape Food & Tobacco Food & Beverage Stores (Food & Tobacco)
Logistics, Distribution & Transportation
233.169
Oct 2007 Nampak Gauteng Metals Alumina & aluminium production and processing
Manufacturing 1017.98
Source: FDI Intelligence, 2015
Other investments into Angola captured by BMI Research (2015) include a June 2014 project by retailer Spar
Group (SPP) who opened their first store in Angola, in the province of Cabinda. Spar International had granted its
South African subsidiary the rights to use the Spar name in Angola. The store was opened in partnership with
importer Webcor. Spar views Angola as a viable market for expansion, as it looks to widen its operations across
Africa.
There was no FDI from Angola into the South African food and beverages sector.
For more information on this publication and other Wesgro publications please contact [email protected] or for more
publications visit the Wesgro publications portal on our website at http://wesgro.co.za/publications