Embed Size (px)
Citation preview
Technical Report WF/90/4 MRP Report 112
Geophysical and investigations on
geochemical Anglesey, North Wales
D C Cooper, I F Smith, M J C Nutt and J D Cornwell


BRITISH GEOLOGICAL SURVEY
Technical Report WF/90/4 Mineral Resources Series
Geophysical and geochemical investigations on Anglesey, North Wales
D C Cooper, BSc, PhD I F Smith, BSc, MSc M J C Nutt, BSc, PhD J D Cornwell, MSc, PhD
Contributors N Bell T R Marshall, MSc K E Rollin, BSc D J Patrick, BSc, PhD F A Collar, MSc, PhD
Cover illustration
A banded carbonate/sphalerite/marca- site/galena vein from the Gwynfynydd Gold Mine, near Dolgellau in North Wales
This report was prepared for the Department of Trade and Industry
Maps and diagrams in this report use topography that is based on Ordnance Survey mapping
Bibliographical reference
Cooper, D C, Smith, I F, Nutt, M J C, and Cornwell, J D. 1990. Geophysical and geochemical investigations on Anglesey, North Wales. British Geological Survey Technical Report WF/90/4 (BGS Mineral Reconnaissance Programme Report 1 12). Mineral Reconnaissance Programme Report 1 12
0 NERC copyright 1990 Keyworth, Nottingham 1990

The full range of Survey publications is available through the Sales Desks at Keyworth, Murchison House, Edinburgh, and at the BGS London Information Office in the Natural History Museum, Earth Galleries. The adjacent bookshop stocks the more popular books for sale over the counter. Most BGS books and reports are listed in HMSO’s Sectional List 45, and can be bought from HMSO and through HMSO agents and retailers. Maps are listed in the BGS Map Catalogue and the Ordnance Survey’s Trade Catalogue, and can be bought from Ordnance Survey agents as well as from BGS.
The British Geological Survey carries out the geological survey of Great Britain and Northern Ireland (the latter as an agency service for the government of Northern Ireland), and of the surrounding continental shelf, as well as its basic research projects. It also undertakes programmes of British technical aid in geology in developing countries as arranged by the Overseas Development Administration.
The British Geological Survey is a component Natural Environment Research Council.
of the
Keyworth, Nottingham NG 12 5GG
* Plumtree (06077) 611 1 Telex 378173 BGSKEY G
Fax 06077-6602
Murchison House, West Mains Road, Edinburgh EH9 3LA
e 031-667 1000 Telex 727343 SEISED G
Fax 031-668 2683
London Information Office at the Natural History Museum, Earth Galleries, Exhibition Road, South Kensington, London SW7 2DE
e 071-589 4090 Fax 071-584 8270 * 071-938 9056/57
19 Grange Terrace,
* 031-667 1000
Edinburgh EH9 2LF
Telex 727343 SEISED G
St Just, 30 Pennsylvania Road, Exeter EX4 6BX
* Exeter (0392) 78312 Fax 0392-437505
Bryn Eithyn Hall, Llanfarian, Aberystwyth, Dyfed SY23 4BY
a? Aberystwyth (0970) 611038 Fax 0970-624822
Windsor Court, Windsor Terrace, Newcastle upon Tyne NE2 4HB
* 091-281 7088 Fax 091-281 9016
Geological Survey of Northern Ireland, 20 College Gardens, Belfast BT9 6BS
8 Belfast (0232) 666595 Fax 0232-662835
Maclean Building, Crowmarsh Gifford, Wallingford, Oxfordshire OX10 8BB
a Wallingford (0491) 38800 Telex 849365 HYDROL G
Fax 0491-25338
Parent Body
Natural Environment Research Council
Polaris House, North Star Avenue, Swindon, Wiltshire SN2 1 EU * Swindon (0793) 411500 Telex 444293 ENVRE G
Fax 0793-411501
This report relates to work carried.out by the British Geological Survey on behalf of the Department of Trade and Industry. The information contained herein must not be published without reference to the Director, British Geological Survey.
Dr D Slater Manager, Mineral Intelligence Group British Geological Survey Keyworth Nottingham NG12 5GG
SUMMARY
INTRODUCTION
REGIONAL GRAVITY SURVEY Rock densities Regional Bouguer anomaly field Residual Bouguer anomalies Sources of the main anomalies Conclusions
GEOPHYSICAL SURVEYS AT PARYS MOUNTAIN Electromagnetic methods - Slingram Electromagnetic methods -Very Low Frequency EM (VIZ) Magnetic Induced Polarisation (IP) Gravity Seismic refraction IP measurements along seismic refraction lines Conclusions
GROUND INVESTIGATIONS OF AIRBORNE GEOPHYSICAL ANOMALIES Geophysical methods
Electromagnetic Magnetic
Results (general) Electromagnetic Magnetic
Investigation of individual anomalies Bodewryd Rhosbeirio Treferwydd Trefor
Tyntywyn Conclusions
CERRIGCEINWEN Geology and mineralisation Groundwater survey Soil sampling Conclusions
CITYDULAS Geology and mineralisation Soil sampling Induced Polarisation survey Discussion Conclusions

LLMBADRIG Geology and mineralisation Groundwater survey Soil sampling
Pilwrn Geophysical surveys Conclusions
LLANDYFRYDOG Geology and mineralisation Reconnaissance soil sampling Grid-based soil sampling Rock sampling Conclusions
LLIGWY
CONCLUSIONS AND RECOMMENDATIONS
ACKNOWLEDGEMENTS
REFERENCES
FIGURES
1. 2. 3. 4. 5. 6. 7. 8. 9.
10.
11. 12.
13.
14. 15.
16. 17. 18. 19.
20.
21.
22. 23. 24. 25. 26. 27.
28. 29.
30.
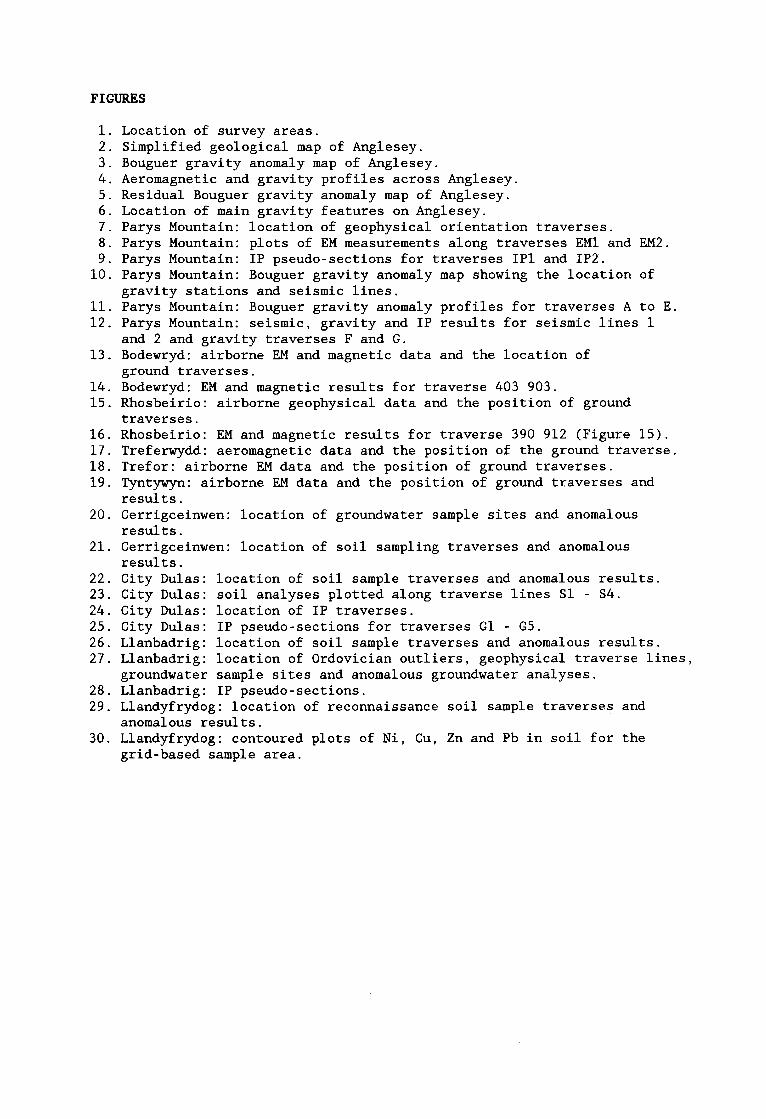
Location of survey areas. Simplified geological map of Anglesey. Bouguer gravity anomaly map of Anglesey. Aeromagnetic and gravity profiles across Anglesey. Residual Bouguer gravity anomaly map of Anglesey. Location of main gravity features on Anglesey. Parys Mountain: location of geophysical orientation traverses. Parys Mountain: plots of EM measurements along traverses EM1 and EM2. Parys Mountain: IP pseudo-sections for traverses IPl and IP2. Parys Mountain: Bouguer gravity anomaly map showing the location of gravity stations and seismic lines. Parys Mountain: Bouguer gravity anomaly profiles for traverses A to E. Parys Mountain: seismic, gravity and IP results for seismic lines 1 and 2 and gravity traverses F and G. Bodewryd: airborne EM and magnetic data and the location of ground traverses. Bodewryd: EM and magnetic results for traverse 403 903. Rhosbeirio: airborne geophysical data and the position of ground traverses. Rhosbeirio: EM and magnetic results for traverse 390 912 (Figure 15). Treferwydd: aeromagnetic data and the position of the ground traverse. Trefor: airborne EM data and the position of ground traverses. Tyntywyn: airborne EM data and the position of ground traverses and results. Cerrigceinwen: location of groundwater sample sites and anomalous results. Cerrigceinwen: location of soil sampling traverses and anomalous results. City Dulas: location of soil sample traverses and anomalous results. City Dulas: soil analyses plotted along traverse lines Sl - S4. City Dulas: location of IP traverses. City Dulas: IP pseudo-sections for traverses Gl - G5. Llanbadrig: location of soil sample traverses and anomalous results. Llanbadrig: location of Ordovician outliers, geophysical traverse lines, groundwater sample sites and anomalous groundwater analyses. Llanbadrig: IP pseudo-sections. Llandyfrydog: location of reconnaissance soil sample traverses and anomalous results. Llandyfrydog: contoured plots of Ni, Cu, Zn and Pb in soil for the grid-based sample area.

1. Densities of main rock types on Anglesey. 2. Densities and velocities of rocks from Parys Mountain. 3. Summary of ground investigations into airborne geophysical
4.
5.
6. 7.
8. 9.
10. 11.
anomalies. Cerrigceinwen: summary of analytical data samples. Cerrigceinwen: summary of analytical data samples. City Dulas: summary of analytical data in Llanbadrig: summary of analytical data in samples. Llanbadrig: summary of analytical data in
in ppm for groundwater
in ppm for 468 soil
ppm for 93 soil samples. ppm for groundwater
ppm for soil samples.
Llandyfrydog: summary of analytical data in ppm for soil samples. Llandyfrydog: analytical data in ppm for rock samples. Lligwy: summary of analytical data in ppm for 35 soil samples.
This report describes a number of surveys carried out on not covered by previous reports in this seri .es.
Anglesey
A gravity survey of the island identified two large amplitude lows: one associated with volcanic rocks and granite cropping out southeast of the Menai Strait Fault; the other centred off the northwest coast and possibly caused by a concealed granite. If of Caledonian age, such a granite would have influenced the distribution of base-metal mineralisation on the island. Positive anomalies are associated with metabasic rocks in the southeast of the island whilst Carboniferous sedimentary rocks give rise to gravity lows between Malltraeth and Dulas.
Geophysical orientation studies showed that the Parys Mountain mineralisation generates strong induced polarisation (IP) chargeability anomalies, but only weak electro-magnetic (EM) anomalies prone to interference from artificial sources. The very low frequency electro- magnetic (VLF(EM)) method proved useful for detecting steeply dipping conductors and magnetic anomalies were produced by some basic rocks. A gravity survey detected Bouguer anomalies which two seismic refraction lines showed to be possibly caused by concealed acid volcanic rocks. IP traversing indicated that no substantial mineralisation was associated with the Bouguer anomalies.
Ground geophysical surveys confirmed airborne EM and magnetic anomalies at Bodewryd, Rhosbeirio, Treferwydd, and Tyntywyn. At Trefor airborne EM anomalies were attributed to radio transmitter noise. At Rhosbeirio and Tyntywyn the cause of the EM ground anomalies remains uncertain, whilst
at Bodewryd and Treferwydd basic dykes are the probable source of magnetic and EM anomalies.
Soil sampling was carried out around Cerrigceinwen, City Dulas, Llanbadrig, Llandyfrydog and Lligwy to investigate promising indications of mineralisation arising from earlier regional surveys. In addition
geochemical groundwater surveys were carried out around Cerrigceinwen
and Llanbadrig, geophysical traversing at Llanbadrig and City Dulas, and rock sampling at Llandyfrydog. Anomalous results related to
mineralisation, possibly of similar style to that found at Parys Mountain or Carmel Head, were recorded at Llanbadrig. Geochemical and
geophysical anomalies probably caused by hitherto undiscovered mineralisation were also found at City Dulas. At Llandyfrydog large base-metal in soil anomalies were ascribed to metal-rich water, derived from the Parys Mountain mines, flooding across and percolating into superficial deposits. Some smaller anomalies were probably derived from weak base-metal vein mineralisation. In the Cerrigceinwen area stream sediment and groundwater survey data suggested that mineralisation might be associated with spilitic rocks within the Mona Complex and the basal Carboniferous succession, but limited soil sampling across these lithologies only located a few isolated base-metal anomalies. The single soil traverse sampled across the basal Carboniferous at Lligwy produced similar results.
D 0 VA\
%
_LEY
/-/I City Dulas r 7
z Treferwydd
L
-- r 1 l I I
Llan~yfrydog
0 5km
y miles 0
-L
r7 L-l
390
SEY u 380
7 BEAUMARIS
r’
Ngure 1 Location of survey areas.
2
INTRODUCTION
This report describes the results of a series of geochemical and geophysical investigations carried out on Anglesey (Figure 1). Those around Cerrigceinwen, City Dulas, Llanbadrig, Llandyfrydog and Lligwy were instigated to obtain more information about areas in Anglesey where earlier Mineral Reconnaissance Programme work had provided evidence of some base-metal mineral potential. To help interpret the results of this work, geophysical orientation studies were carried out across the Parys Mountain ore deposit and this information forms a further section of the report. The results of brief ground geophysical surveys undertaken to explore the cause of airborne anomalies (Smith, 1979) and a gravity survey of the island are also described.
The earlier Mineral Reconnaissance Programme work referred to above comprised a reassessment of the geology and mineralisation of the island by BGS in the light of information obtained (under the Mineral Exploration and Investment Grants Act 1972) from monitoring an extensive drilling programme at Parys Mountain, and the results of a reconnaissance geochemical drainage survey (Cooper, Nutt and Morgan, 1982). The results of extensive follow-up investigations in one of the areas identified from this reassessment have been reported separately (Cooper, Nutt, Smith and Easterbrook, 1989).
Anglesey is located at the northwest corner of Wales and is linked to the mainland by road and rail bridges across the Menai Strait (Figure 1). The island has an area of about 750 km2 and a temperate climate. The land is generally low-lying and has the gently rolling features of a peneplain with a few isolated hills rising above 100 m. Most of the land is farmed and is grassland. The population is distributed amongst numerous farms, hamlets and several small towns, linked by a complex network of roads. The few industrial developments include an aluminium smelter and a nuclear power station.
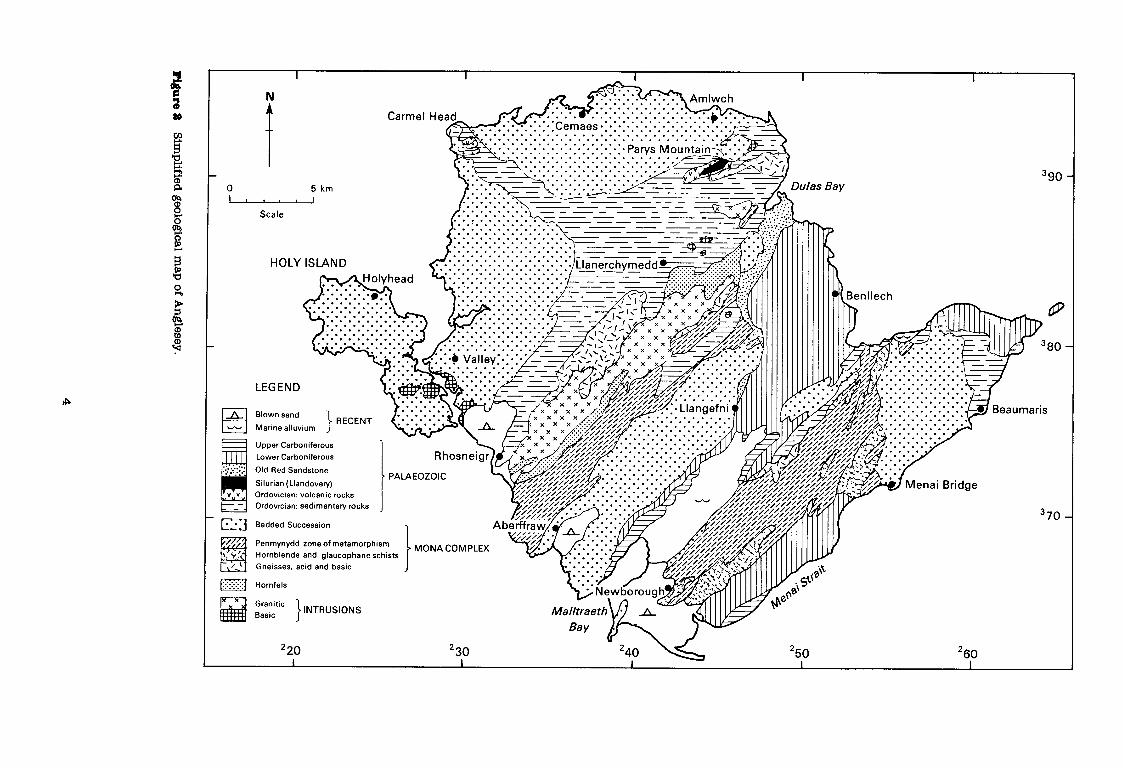
The geology of Anglesey is amongst the most diverse for an area of its size in the United Kingdom (Figure 2). Rocks range from Precambrian gneisses and granites, through a Lower Palaeozoic succession of sediments with volcanics, to an Upper Palaeozoic sequence of limestones, sandstones, and Coal Measures. The structure of the Precambrian and Lower Palaeozoic rocks is complex and, together with the tectonic setting, is not fully understood. Over much of the island the rocks are obscured by superficial deposits, most notably boulder clay and sands and gravels of glacial origin. The geology of the island is summarised in previous reports in this series (Cooper, Nutt and Morgan, 1982; Cooper, Nutt, Smith and Easterbrook, 1989) and on the BGS 1:50 000 geological map of Anglesey (Greenly, 1920; reprinted 1972). The only detailed geological description of the whole island is that given by Greenly (1919). Aspects of the geology and structure have been addressed in recent years by Barber and Max (1979), Bates (1972; 1974), Shackleton (1969; 1975), Maltman (1973; 1977), Beckinsale and Thorpe (1979), Nutt and Smith (1981a; 1981b) and Gibbons (1983).
Many occurrences of metalliferous mineralisation are known on Anglesey but all are minor except for the base-metal deposits at Parys Mountain (Cooper, Nutt and Morgan, 1982), which were worked extensively during the eighteenth and nineteenth centuries. They have been the subject of detailed investigation during the last twenty years and work is now in progress to open a new mine on the site. Present mining reserves are
3
Amlwch
Scale
HOLY ISLAND
. . . . . :-. A . . . . . ‘* t . . . . . . . . . Q . , . . . . .
80
LEGEND ld##?( . . . . . . . . . . . . . . . . . . . . . . . . . . . . . . . . . . . . _& td Blown sand
Marine alluvium RECENT
~~~~:.:.:.:.:.:.:.:.:.:~ Beaumaris . . . . . . . .
I Upper Carboniferous . . . . . . . . . . . . . Lower Carboniferous
. . . . . . .
Old Red Sandstone
Silurian (Llandovery) PAIAEOZOIC
Ordovician: volcanic rocks
r_-_j Ordovician: sedimentary rocks
l . --l p. -. j Bedded Succession
I Ab_erffraw/# ,,
. . ::. .*.. a.. . ...*. :.. Iii v v
// E.3 Penmynydd zone of metamorphism
XI52 Hornblende and glaucophane schists MONA COMPLEX
j_ \/,’ 1 Gneisses, acid and basic
Hornfels
Granitic
Basic > INTRUSIONS
220 I
quoted as 5.28 million short tons grading 6.04% Zn, 1.49% Cu, 3.03% Pb, 2.02 oz/ton Ag and 0.013 oz/ton Au (Gooding, 1988).
Mineral occurrences on Anglesey have been divided into three groups on the basis of their principal ore-metal content (Cooper, Nutt and Morgan, 1982). These are (a) copper; (b) copper, lead and zinc and (c) barium (baryte) and lead. Group (a), believed to represent the oldest mineral- isation on the island, comprises thin veins of quartz, pyrite and chalcopyrite in rocks of the Mona Complex. Group (b), of which the Parys Mountain deposits are an example, appear to be the only group of economic significance. Typically they comprise lenses, disseminations and veins of Cu, Pb and Zn sulphides accompanied by pyrite, quartz and carbonate gangue situated at or close to the junction of altered silica- rich rocks with mudstones/pelites. Group (c) is dominated by baryte vein mineralisation but also includes Pb veins. It is commonly developed in or close to basal Carboniferous rocks. All the groups show an epigenetic
style though the Parys Mountain deposits are now believed by many to be remobilised syngenetic deposits of volcanogenic origin.
REGIONAL GRAVITY SURVEY
A gravity survey of Anglesey was undertaken to complement other regional surveys of the island (Smith, 1979; Cooper, Nutt and Morgan, 1982) and to provide baseline data for mineral exploration purposes. Anglesey was included in the gravity survey of North Wales by Powell (1956) but the increased anomaly definition required for MRP purposes demanded a greater station density. A re-survey was therefore carried out and 496 gravity stations established. The distribution of these was arranged to take into account other gravity data collected on the island as part of a research project by the University of Leeds Department of Earth Sciences.
The anomaly values shown in Figure 3 have been reduced to sea level
using a density on land of 2.70 Mg/m3 for the Bouguer correction and are tied into the national network through a gravity base at Bangor.
Corrections for the effect of near terrain (Hammer zones A-H) have been computed for individual stations; corrections for far terrain were interpolated from a small number of representative values.
Rock densities
Density data for some of the numerous and varied lithologies found on the island were reported by Powell (1956) and by workers on the University of Leeds project (Table 1). Additional samples were collected for this study and laboratory measurements made included saturated
density (Table l), sonic velocity and magnetic susceptibility (Forster, 1974).
5
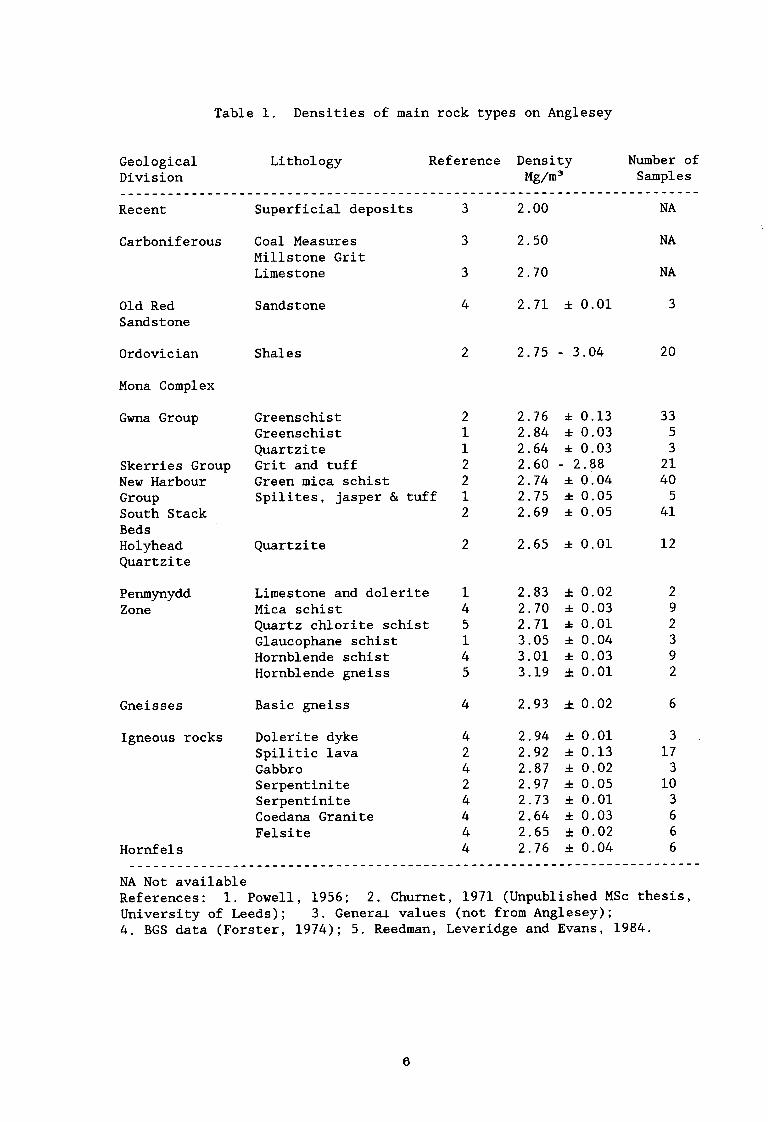
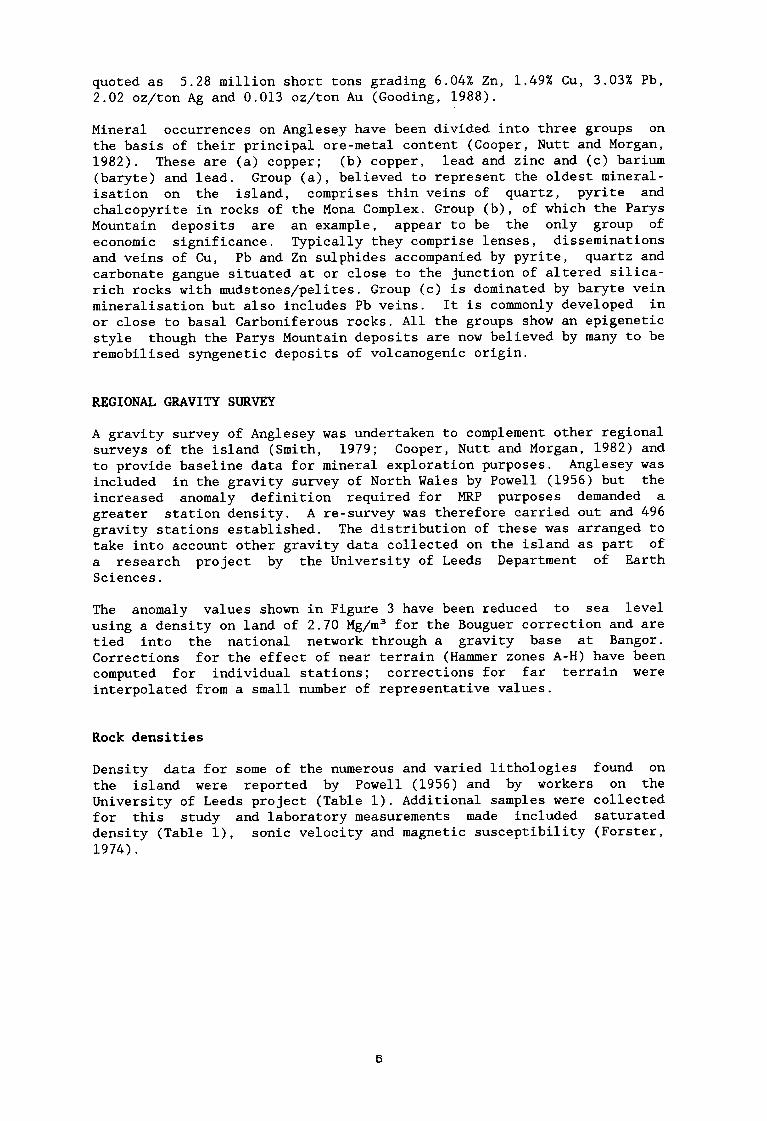
Table 1. Densities of main rock types on Anglesey
Geological Lithology Reference Density Number of Division Mg/m3 Samples ____________________~~~~~~~~~~~~~~~~~~~~~~~~~~~~~~~~~~~~~~~~~~~~~~~~~~~~~
Recent Superficial deposits
Carboniferous Coal Measures Millstone Grit Limestone
Old Red Sandstone
Sandstone
2.00 NA
2.50 NA
2.70 NA
2.71 f 0.01 3
Ordovician Shales 2.75 - 3.04 20
Mona Complex
Gwna Group
Skerries Group New Harbour Group South Stack Beds Holyhead Quartzite
Greenschist Greenschist Quartzite Grit and tuff Green mica schist Spilites, jasper & tuff
Quartzite
2.76 f 0.13 33 2.84 i 0.03 5 2.64 f 0.03 3 2.60 - 2.88 21 2.74 f 0.04 40 2.75 f 0.05 5 2.69 f 0.05 41
2.65 f 0.01 12
Penmynydd Zone
Limestone and dolerite Mica schist Quartz chlorite schist Glaucophane schist Hornblende schist Hornblende gneiss
3
3
3
4
2
2 1 1 2 2 1 2
2
1 4 5 1 4 5
4
4 2 4 2 4 4 4 4
2.83 f 0.02 2.70 f 0.03 2.71 f 0.01 3.05 f 0.04 3.01 f 0.03 3.19 f 0.01
2.93 * 0.02
2.94 f 0.01 2.92 f 0.13 2.87 f 0.02 2.97 f 0.05 2.73 f 0.01 2.64 f 0.03 2.65 f 0.02 2.76 f 0.04
Gneisses Basic gneiss 6
Igneous rocks Dolerite dyke Spilitic lava Gabbro Serpentinite Serpentinite Coedana Granite Felsite
Hornfels
3 17 3
10 3 6 6 6
____________________~~~~~~~~~~~~~~~~_~~~~~~~~~~~~~~~~~~~~~~~~~~ ____-____
NA Not available References: 1. Powell, 1956; 2. Churnet, 1971 (Unpublished MSc thesis, University of Leeds); 3. General values (not from Anglesey); 4. BGS data (Forster, 1974); 5. Reedman, Leveridge and Evans, 1984.
6
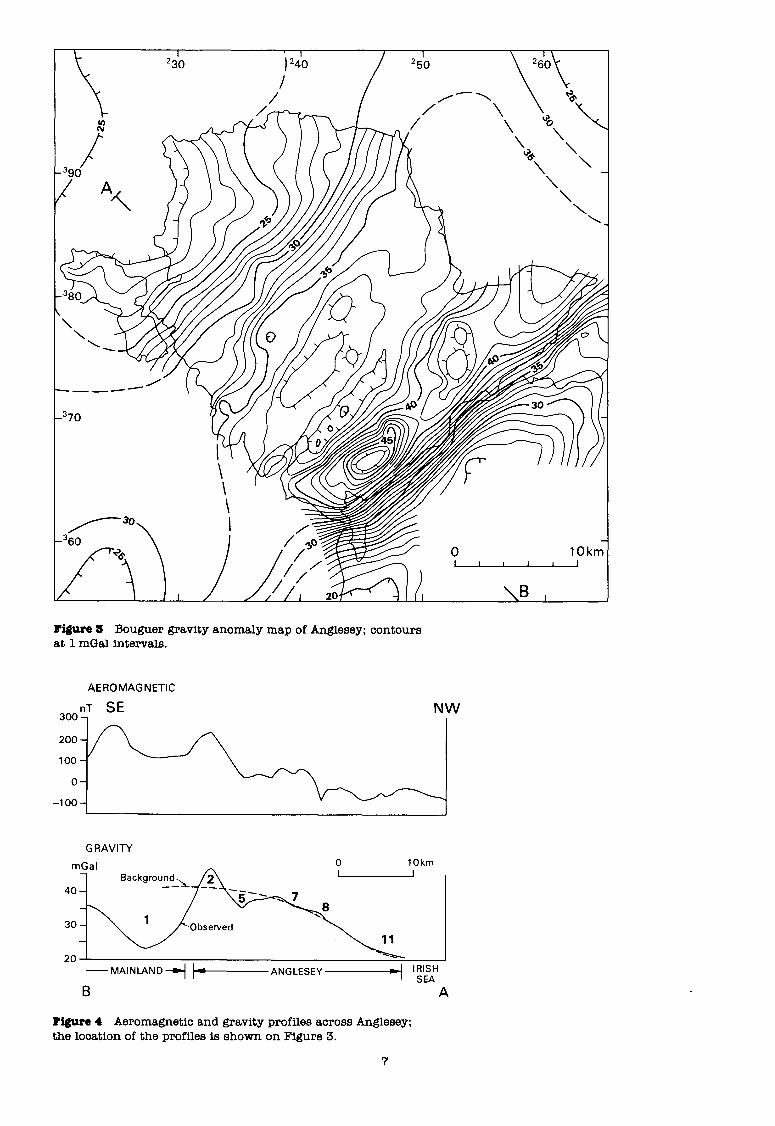
Hgure S Bouguer gravity anomaly map of Anglesey; contours at 1 mGa1 intervals.
AEROMAGNETIC
GRAVITY
mGal 10km
B A
Figure 4 Aeromagnetic and gravity profiles across Anglesey; the location of the profiles is shown on Figure 3.
7
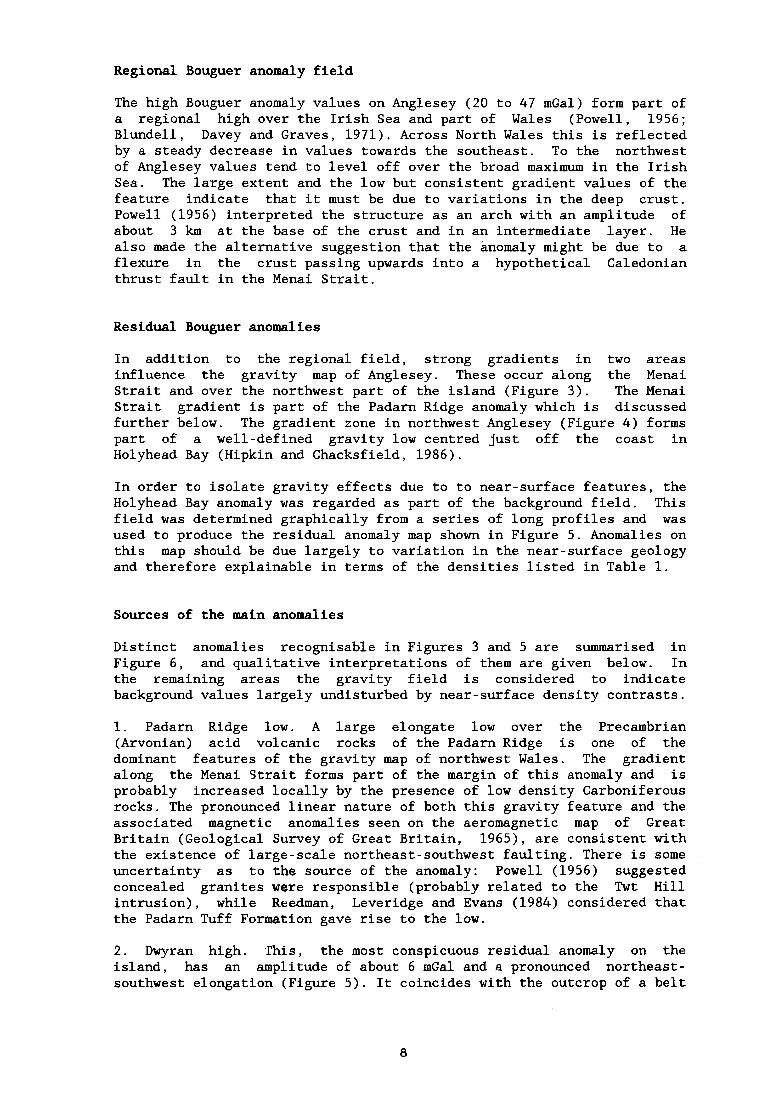
Regional Bouguer anomaly field
The high Bouguer anomaly values on Anglesey (20 to 47 mGa1) form part of a regional high over the Irish Sea and part of Wales (Powell, 1956; Blundell, Davey and Graves, 1971). Across North Wales this is reflected by a steady decrease in values towards the southeast. To the northwest of Anglesey values tend to level off over the broad maximum in the Irish Sea. The large extent and the low but consistent gradient values of the feature indicate that it must be due to variations in the deep crust. Powell (1956) interpreted the structure as an arch with an amplitude of about 3 km at the base of the crust and in an intermediate layer. He also made the alternative suggestion that the anomaly might be due to a flexure in the crust passing upwards into a hypothetical Caledonian thrust fault in the Menai Strait.
Residual Bouguer anomalies
In addition to the regional field, strong gradients in two areas influence the gravity map of Anglesey. These occur along the Menai Strait and over the northwest part of the island (Figure 3). The Menai Strait gradient is part of the Padarn Ridge anomaly which is discussed further below. The gradient zone in northwest Anglesey (Figure 4) forms part of a well-defined gravity low centred just off the coast in Holyhead Bay (Hipkin and Chacksfield, 1986).
In order to isolate gravity effects due to to near-surface features, the Holyhead Bay anomaly was regarded as part of the background field. This field was determined graphically from a series of long profiles and was used to produce the residual anomaly map shown in Figure 5. Anomalies on this map should be due largely to variation in the near-surface geology and therefore explainable in terms of the densities listed in Table 1.
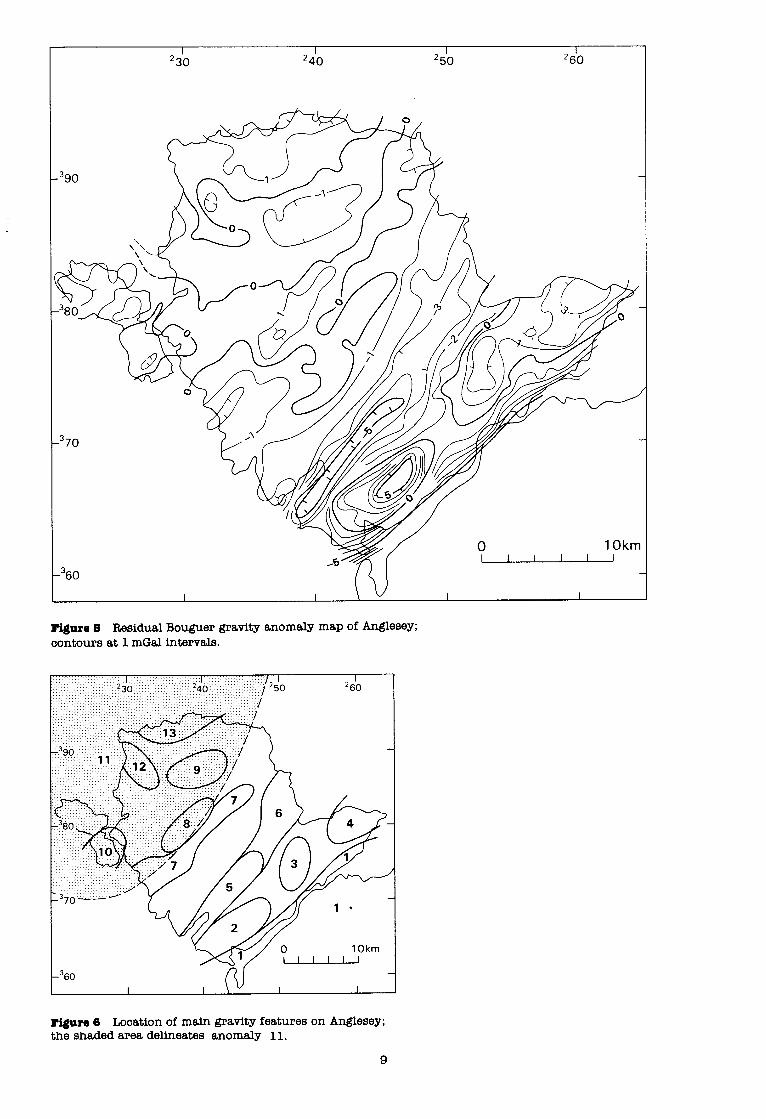
Sources of the main anomalies
Distinct anomalies recognisable in Figures 3 and 5 are summarised in Figure 6, and qualitative interpretations of them are given below. In the remaining areas the gravity field is considered to indicate background values largely undisturbed by near-surface density contrasts.
1. Padarn Ridge low. A large elongate low over the Precambrian (Arvonian) acid volcanic rocks of the Padarn Ridge is one of the dominant features of the gravity map of northwest Wales. The gradient along the Menai Strait forms part of the margin of this anomaly and is probably increased locally by the presence of low density Carboniferous rocks. The pronounced linear nature of both this gravity feature and the associated magnetic anomalies seen on the aeromagnetic map of Great Britain (Geological Survey of Great Britain, 1965), are consistent with the existence of large-scale northeast-southwest faulting. There is some uncertainty as to the source of the anomaly: Powell (1956) suggested concealed granites were responsible (probably related to the Twt Hill intrusion), while Reedman, Leveridge and Evans (1984) considered that the Padarn Tuff Formation gave rise to the low.
2. Dwyran high. Ihis, the most conspicuous residual anomaly on the island, has an amplitude of about 6 mGa1 and a pronounced northeast- southwest elongation (Figure 5). It coincides with the outcrop of a belt
8
I I I I
*30 *40 *50 *60
1 Okrr
,360
Figure 5 Residual Bouguer gravity anomaly map of Anglesey; contours at 1 mGal intervals.
-360
I I I I
Figure 6 Location of main gravity features on Anglesey; the shaded area delineates anomaly 11.
9
of hornblende schists within the Penmynydd zone of the Mona Complex. The observed density contrast (Table 1) between the hornblende schists and surrounding mica schists is sufficient to explain the gravity anomaly if the former extends todepthsof lkm- 3km. The occurrence of a pronounced aeromagnetic anomaly coincident with the gravity high indicates that the hornblende schists should also be magnetic, but this was not supported by susceptibility measurements on the samples (Forster, 1974).
3. Penmynydd high. The Penmynydd anomaly (Figures 5 and 6) is the central of three positive gravity anomalies in the Aethwy region, the area between the Berw Fault and Menai Strait (Barber and Max, 1979). Its coincidence with glaucophane schists, which are of relatively high density (Table 1) suggests that these are the rocks responsible. The schists were interpreted by Thorpe (1972) on geochemical grounds as metamorphosed ocean floor basalts. To the east the anomaly ends along the contact with the Gwna Group and to the southwest it decreases with the increasing proportion of mica schists near Penmynydd. The broad character of the high is consistent with the presence of several dispersed dense horizons within the mica schists.
4. Llangoed high. This high of about 3 mGa1 (Figure 5) occurs over the Carboniferous Limestone and Ordovician outcrops in the extreme eastern part of Anglesey. The absence of high density rocks within the Lower Carboniferous, together with the absence of positive anomalies over similar rocks elsewhere on the island, indicate that the anomaly must originate in rocks lying beneath the limestone succession. Possible explanations include the presence of large amounts of basic igneous material in the underlying Mona Complex. This is suggested by the deflection of the contours (Figure 5) to include the spilitic lavas and basic intrusions at the western margin of the high. Gravity data for the offshore area indicate that the Llangoed high continues to the northeast with increasing amplitude for a distance of about 10 km.
5. Malltraeth low. The pronounced low with a well-defined northeast- southwest elongation and an amplitude of -5 mGa1 (Figure 5) is related to the small basin of Coal Measures and Millstone Grit preserved beneath the alluvium of Malltraeth Marsh. Greenly (1919) estimated the combined thickness of the middle and upper Carboniferous rocks here to be about 460 m, which would produce an anomaly of about -3.8 mGa1 for a density contrast of -0.2 Mg/m3. The alluvium, which reaches 34 q in thickness at the southwest end of the anomaly, could contribute -1 mGa1, the total thereby satisfying the observed anomaly.
6. Llanddyfan low. The Malltraeth Bouguer anomaly low continues to the northeast beyond the mapped outcrop of Upper Carboniferous rocks as a broad low over the Carboniferous Limestone succession. The anomaly is probably due to these rocks and possibly also to underlying Old Red Sandstone (Devonian) strata, which the limited data available (Table 1) suggest are at least in part similar in density to the Carboniferous Limestone. The location of the minimum residual anomaly (Figure 5) indicates that the axis of the basin lies approximately beneath the centre of the outcrop.
7. Coedana low. This weak elongated anomaly follows the 15 km long outcrop of the Coedana Granite and it is probable that this low density intrusion (Table 1) is responsible. The small amplitude of the anomaly suggests that, with a density contrast of about -0.1 Mg/m3, the
10
intrusion cannot extend down for more than about 0.5 km.
The lack of any significant positive anomaly to the north of this feature, around Llandyfrydog, suggests that the ultramafic intrusions of that area are of limited size.
8. Llandrygarn high. This high corresponds exactly with the outcrop of Mona Complex gneisses. The geological map (Greenly, 1920) indicates that acid and micaceous gneisses dominate but, as these rocks would be expected to have relatively low densities, it is likely that the anomaly is caused by orthogneisses (amphibolites and hornblende gneiss) which may, therefore, be more extensive than previously suggested.
9. Llanbabo low. This broad, ill-defined low is centred over Ordovician sedimentary rocks around the Llyn Alaw reservoir. It is probable that the anomaly is due to these rocks, which show a weak and variable contrast against the underlying rocks of the Mona Complex (Table 1).
10. Rhoscolyn low. The weak gravity low in this area coincides mainly with part of the outcrop of the New Harbour Group, a succession of siltstones, sandstones and grits with serpentinites, spilitic lavs, tuffs and jasper cherts metamorphosed to greenschist facies. This succession generally shows up as normal or slightly low Bouguer anomaly values and the presence of a low here may simply reflect a high proportion of low density sandstones and grits. The existence of a low in this area, where there are several gabbroic and serpentinite bodies, is significant: it implies that the high density gabbroic bodies are of limited size and, consequently, the mineral potential for elements typically concentrated in large bodies of mafic-ultramafic rocks is reduced.
11. Holyhead Bay low. Only part of this major gravity low is seen on- shore, where it is reflected by the pronounced decrease in values towards the northwest (Figures 3 and 4). Off-shore, the anomaly values continue to increase to the northwest and the low is elongated in a NNE direction (Hipkin and Chacksfield, 1986). No sedimentary basins are known to exist off-shore in this area and such an explanation would in
any case fail to account for the on-shore gradient over rocks of the Mona Complex. The most likely cause of the anomaly is a thick development of low density acid igneous rocks. A granitic intrusion is favoured but a thick pile of acid volcanic rocks is an alternative
possibility. The anomaly contrasts in area and amplitude to that of the Coedana Granite and a similar age is therefore considered less likely. It is interesting to note that the anomaly is intersected by a series of linear magnetic anomalies ascribed to Tertiary dykes (Smith, 1979), but granites of Tertiary age are often associated with positive gravity anomalies. Therefore, if the anomaly is due to a granite, a Caledonian age for the intrusion is favoured. The postulated granite would underlie
a large area of northwest Anglesey (Figure 6), including areas where
most of the known pre-Carboniferous mineralisation occurs (Cooper, Nutt
and Morgan, 1982). It may therefore, if of late Caledonian age,
represent a hitherto unrecognised control on mineralisation in the area and be the cause of the postulated remobilisation of pre-existing mineral deposits at Parys Mountain.
12. Llanfaethlu anomalies. The northwest-southeast trending contours (Figure 5) reflect the position of a fault-bounded area of Ordovician
rocks, but the gravity data are not sufficiently detailed to permit
11
interpretation.
13. Llanbadrig high. A broad high is evident over the Mona Complex (Bedded Succession) and Ordovician outliers in the north of the island (Figure 5). The margins of the high correspond approximately with the Carmel Head thrust. The rocks exposed at surface coincident with this anomaly, are dominated by siltstones and sandstones metamorphosed to greenschist facies. These are low density rocks which suggest that the source of the anomaly is concealed.
Conclusions
1. The most extensive anomaly is a broad gravity low centred in Holyhead Bay and extending on-shore in the northwest of the island. In the
absence of any geological evidence for its origin, it is suggested that
either a concealed granitic intrusion or a thick pile of acidic volcanic rocks is responsible. If a granitic intrusion is present it may be of Caledonian age and have influenced the distribution of mineralisation in its vicinity where, significantly, most base-metal occurrences are
recorded.
2. On the residual anomaly map the central part of the island is
characterised by low amplitude anomalies (2-3 mGa1) that can be usually related to lithologies exposed at surface. This pattern suggests that (i) the bulk of the rocks in this area have broadly similar densities and (ii) those which show a strong contrast, such as the Coedana Granite and the basic intrusions of Holy Island, have a limited size or depth
extent.
3. In contrast to the central area, the belt of Mona Complex rocks in
the Aethwy region of southeast Anglesey is marked by pronounced gravity
anomalies associated with distinctive aeromagnetic anomalies. The
contrast with the central area may reflect fundamental differences
between the Mona Complex rocks of the two areas. The pronounced
anomalies in the southeast of the island are related to metamorphosed
basic and ultrabasic rocks which may have some mineral potential.
4. The gravity data are sufficient to define the general extent of residual anomalies due to near-surface sources, but further information
on their form and geological significance could be obtained from more detailed surveys, such as that carried out at Parys Mountain (see
below).
12
GEOPHYSICAL SURVEYS AT PARYS MOUNTAIN
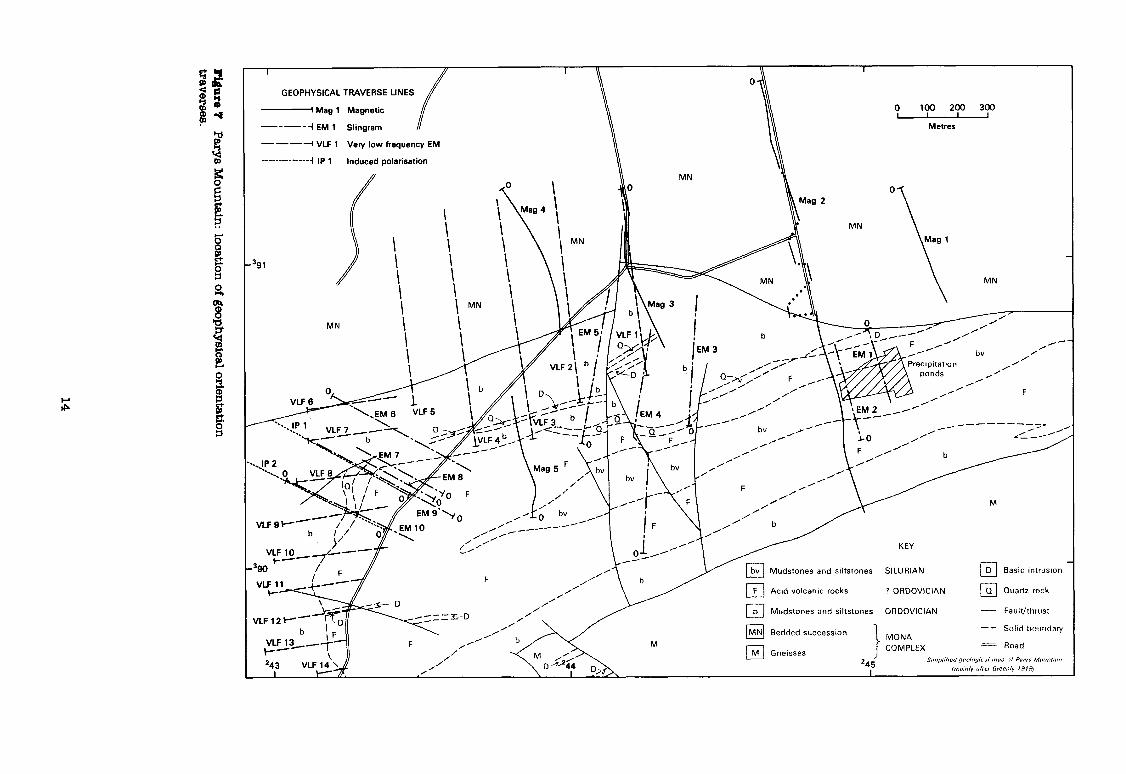
An orientation study was undertaken to determine the characteristic response of various geophysical methods to the style of mineralisation found at Parys Mountain as an aid to prospecting for similar occurrences elsewhere on Anglesey. The outline geology of the area and the position of geophysical traverses are shown in Figure 7.
The mineralisation at Parys Mountain occurs within a sheared and faulted, tightly recumbent, eastward-plunging syncline containing a core of altered Silurian (Llandovery) dark-grey mudstones, underlain
successively by a sequence of highly altered acid volcanic rocks of uncertain age and Ordovician (Llanvirn) mudstones and siltstones. The altered and mineralised zone is about 500 m wide and extends for over
2 km along strike. Alteration includes locally intense silicification,
chloritisation and sericitisation. Mineralisation is concentrated along shear zones and lithological boundaries, notably near the base and top of the volcanic rocks in the northern limb of the syncline. Copper mineralisation is associated with pyritisation and is disseminated in large ellipsoidal bodies. Along the northern limb of the syncline silicified Silurian rocks contain lenses of 'bluestone', a dark fine-
grained rock consisting mainly of an intergrowth of quartz, sphalerite and galena with a fine network of pyrite and chalcopyrite (Nutt and
Webb, 1978). 'Bluestone' was also found in the Ordovician rocks at the
western end of the mountain close to Morfa-du. The ore deposits were exploited by opencast and deep mining methods from three main centres. From east to west these were the Mona, Parys and Morfa-du mines. Large opencast pits are the principal accessible remains of the Mona and Parys workings as the deep mines are flooded.
Electromagnetic methods - Slingram
Measurements were taken in three areas chosen as representative of different aspects of the mineralisation, using a roving source-receiver
(Slingram) system.
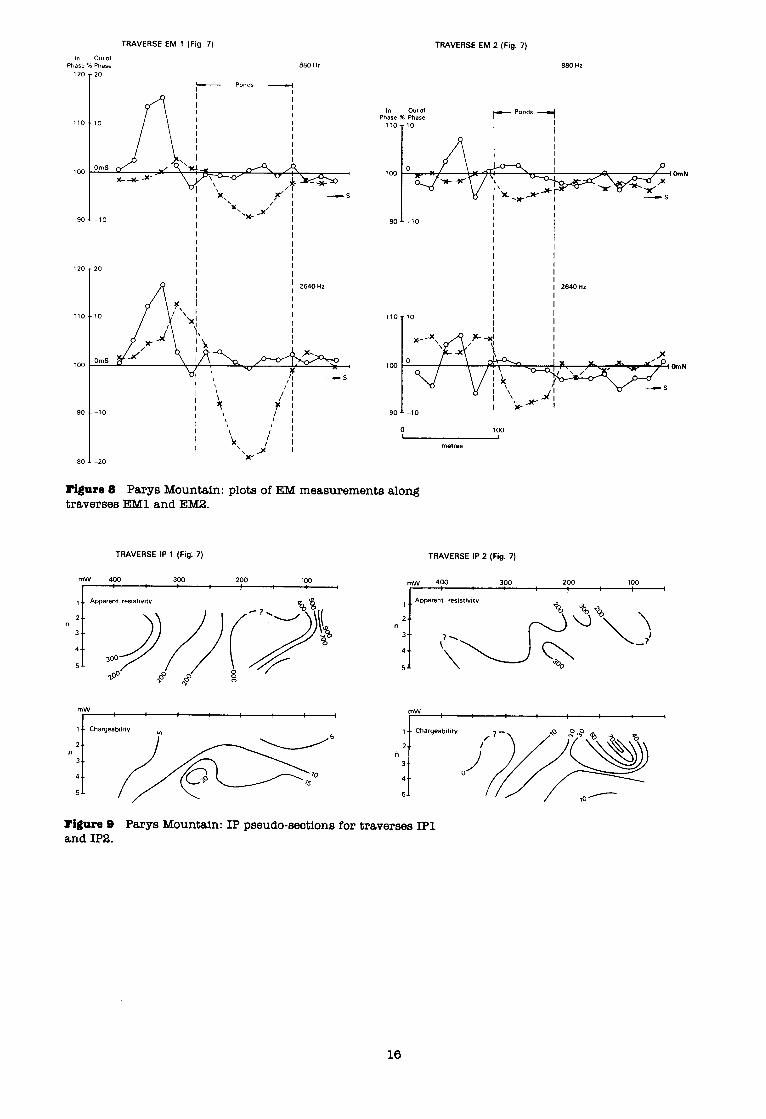
(i) Two traverses (EM1 and EM2, Figure 7), totalling 500 m in length, were measured across IP anomalies at the eastern end of the mountain, where an extension of the mineralisation was indicated by courtesy of Cominco Ltd. The traverses crossed some shallow precipitation ponds. Similar anomaly patterns were seen on both
traverses and at both frequencies (Figure 8). They do not, however,
fit to any standard 'type curves' and no unique interpretation is
possible. The closest fit suggests a body 30 m thick, at or near
surface, striking east, and dipping to the north at about 20". The
water in the precipitation ponds is probably very conductive and
part of the anomaly may be caused by this solution and precipitated copper in the bottom of the ponds.
(ii) Three roughly north-south traverses were measured across the
north side of the mountain and the periphery of the opencast pits
(EM3-EM5, Figure 7) to assess the possibility of detecting residual deposits. However, no systematic anomalies were found and only
irregular variation or noise was observed.
13
GEOPHYSICAL TRAVERSE LINES
- Mag 1 Magnetic
-----i EM 1 Slingram
------I VLF 1 Very low frequency EM
___________-__ 4 ,p , Induced polarisation
f
I
I
I
I
391 I I
I 1
I 1
I lMN MN I I
Mudstones and siltstones SILURIAN
’ ORDOVICIAN
ORDOVICIAN - Fault/thrust
-- SolId boundary
ZZ= Road
0 loo 200 300 I I I I
Metres
MN
(iii) At the western end of the mountain five traverses (EMG-EMlO, Figure 7) were measured across a near-surface deposit of 'bluestone' mineralisation, which had been shown to be conductive in hand specimen when tested with a pocket continuity tester. Different
apparatus, frequencies and coil separations were employed but no systematic variation was observed.
It was concluded that the EM Slingram method typically does not produce anomalies over known base-metal mineral deposits at Parys Mountain.
Electromagnetic methods - Very Low Frequency EM (VLF)
Two areas in the north and west of the mountain were surveyed with the VLF(EM) method, using a remote transmitter and moving receiver. The first area, in the north, contained a mineralised structure dipping north, whilst the second area contained a near vertical north-south striking 'bluestone' lode.
(i) Five traverses were measured in the more northern area (VLFl- VLFS, Figure 7). Very small anomalies were found (in-phase of 15% and quadrature of O-10%) with slightly divergent curves, indicative of a conductor dipping at a shallow angle to the north. At the southern end of the traverses any detail was obscured by noise from mine tips. An anomaly due to a fence was also noted.
(ii) In the western area, near Morfa-du, nine traverses (VLF6-VLF14, Figure 7) were measured. Anomalies were generally weak with values up to 20% locally. However, noise due to power-lines extended to the region of the lode so that reliable data could not be obtained.
The work indicated that in this environment VLF(EM) may detect weak anomalies due to mineralisation, although the signal may well be obscured by noise from artificial sources. The response of the mineralisation to EM methods was weak, indicating that electrical continuity within the bodies is limited. The VLF(EM) method cannot be recommended as a reliable indicator of Parys Mountain type mineralisations, unless the cultural noise level from fences and electrical sources is particularly low. However, the method is widely recognised as having value in tracing geological faults, so in selected (interference free) areas it would be useful for this purpose.
Magnetic
As control for the ground follow-up to the airborne survey (Smith, 1979), an east-west magnetic anomaly of about 50 nT to the north of
Parys Mountain was investigated, together with a weaker feature over the mountain. The two features were crossed by five traverses with a total length of 3.5 km (Magl-Mag5, Figure 7).
.
The results showed a general confirmation of the airborne survey data
and suggest an association between the northern anomaly and basic rocks in the Mona Complex. However, much of the ground-work was spoiled by interference from high voltage power lines masking any anomalies with a geological source. It was concluded that, provided artificial anomalies and power lines are avoided, the magnetic method will produce
15
TRAVERSE EM 1 (Fig. 7) TRAVERSE EM 2 (Fig. 7)
In out 01 Phase % Phase
120
T
20
I_
880 Hz
Ponds c_c(
120
110
80
20 I I I I
In out of Phase % Phase
110
100
90
880 Hz
OmN
1 I I
-10 I I
I I I I I I
Figure 8 Parys Mountain: plots of EM measurements along traverses EM1 and EMB.
I 2640Hz
100 OmN
90
0 100 1 I
metre.9
TRAVERSE IP 1 (Fig. 7) TRAVERSE IP 2 (Fig. 7)
Figure 9 Parys Mountain: IP pseudo-sections for traverses IPl and IP2.
16
geologically useful data.
Induced Polarisation (IP)
A deposit of the 'bluestone' type of mineralisation at Morfa-du was chosen as an orientation target for a dipole-dipole IP survey. Two parallel traverses were surveyed (IPl-IP2, Figure 7): they were 350 m
long, 150 m apart and the dipoles were 50 m each. Both traverses show chargeability anomalies associated with lowered resistivity values. However, the indicated depth of burial, amplitude and anomaly pattern for .each traverse is different and it was not possible to correlate between the two with any confidence. Traverse IP2 (Figure 9) shows a
chargeability anomaly of over 70 ms close to the probable position of the 'bluestone' mineralisation. The anomaly is strongest at the surface but decreases to zero at depths below n-4. Traverse IPl (Figure 9)
reveals an anomaly at n=3 some 100 m north of the expected position. The anomaly, with a maximum of about 20 ms, appears to continue below the
depth of investigation.
These results indicate that the IP method is effective for detecting buried mineralisation of the Parys Mountain 'bluestone' type, producing clear anomalies over a proven sulphide deposit.
Gravity
An orientation survey was carried out to assess the possibility of
locating concealed acid volcanics within the Ordovician/Silurian
sedimentary rocks. When Bouguer gravity anomalies located during this survey suggested that a concealed extension of the acid volcanic rocks
might be present at Parys Mountain, a follow-up seismic refraction survey was conducted to determine whether these anomalies might be
caused by a thickening of drift deposits. IP measurements were also
taken to look for indications of mineralisation in the vicinity of the
Bouguer anomalies.
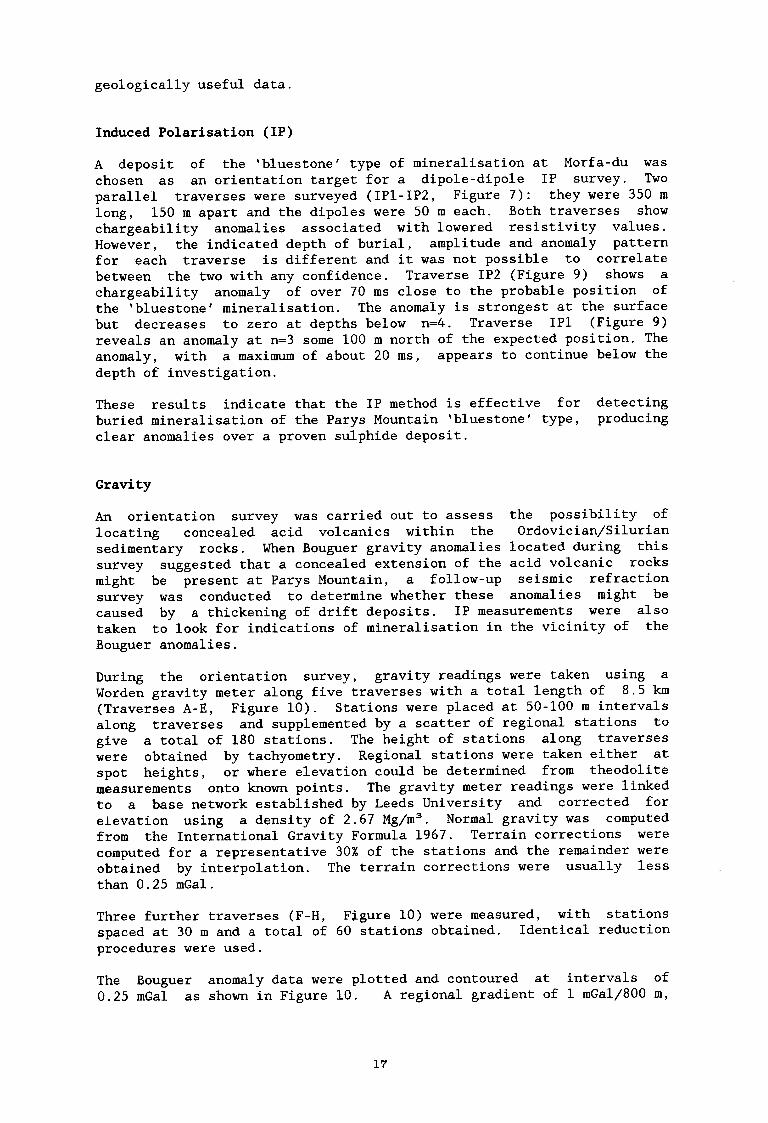
During the orientation survey, gravity readings were taken using a
Worden gravity meter along five traverses with a total length of 8.5 km (Traverses A-E, Figure 10). Stations were placed at 50-100 m intervals
along traverses and supplemented by a scatter of regional stations to give a total of 180 stations. The height of stations along traverses
were obtained by tachyometry. Regional stations were taken either at
spot heights, or where elevation could be determined from theodolite
measurements onto known points. The gravity meter readings were linked
to a base network established by Leeds University and corrected for elevation using a density of 2.67 Mg/m3. Normal gravity was computed
from the International Gravity Formula 1967. Terrain corrections were computed for a representative 30% of the stations and the remainder were obtained by interpolation. The terrain corrections were usually less than 0.25 mGa1.
Three further traverses (F-H, Figure 10) were measured, with stations spaced at 30 m and a total of 60 stations obtained. Identical reduction
procedures were used.
The Bouguer anomaly data were plotted and contoured at intervals of
0.25 mGa1 as shown in Figure 10. A regional gradient of 1 mGa1/800 m,
17
392
391
390
389
GEOPHYSICAL KEY
Contour of Bouguer anomaly
--- Regional Bouguer anomaly values
. Gravity station 1 2
. Seismic profile showing shot points
(including gravity stations at 30m intervals)
0 300 I 1 1 I
Metres
TRAVERSE G SEISMIC LINE
242 243 244 I
245 I I
246 .’ t I
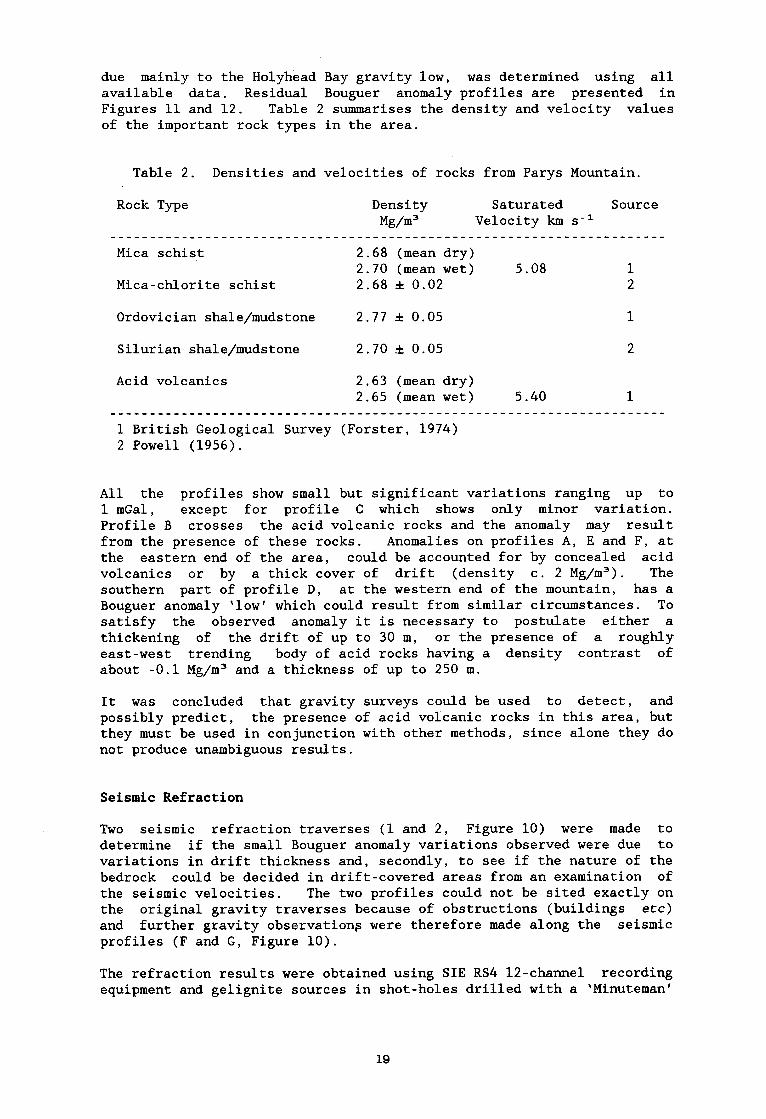
due mainly to the Holyhead Bay gravity low, was determined using all available data. Residual Bouguer anomaly profiles are presented in Figures 11 and 12. Table 2 summarises the density and velocity values of the important rock types in the area.
Table 2. Densities and velocities of rocks from Parys Mountain.
Rock Type Density Saturated Source
Mg/m3 Velocity km s-l ____________________~~~~~~~~~~~~~~~~~~~~~~~~~~~~~~~~~~~~~~~~~~~~~~~~~~
Mica schist 2.68 (mean dry) 2.70 (mean wet) 5.08 1
Mica-chlorite schist 2.68 f 0.02 2
Ordovician shale/mudstone 2.77 f 0.05 1
Silurian shale/mudstone 2.70 f 0.05 2
Acid volcanics 2.63 (mean dry) 2.65 (mean wet) 5.40 1
____________________~~~~~~~~~ ____________________---- -__----_-_-------
1 British Geological Survey (Forster, 1974) 2 Powell (1956).
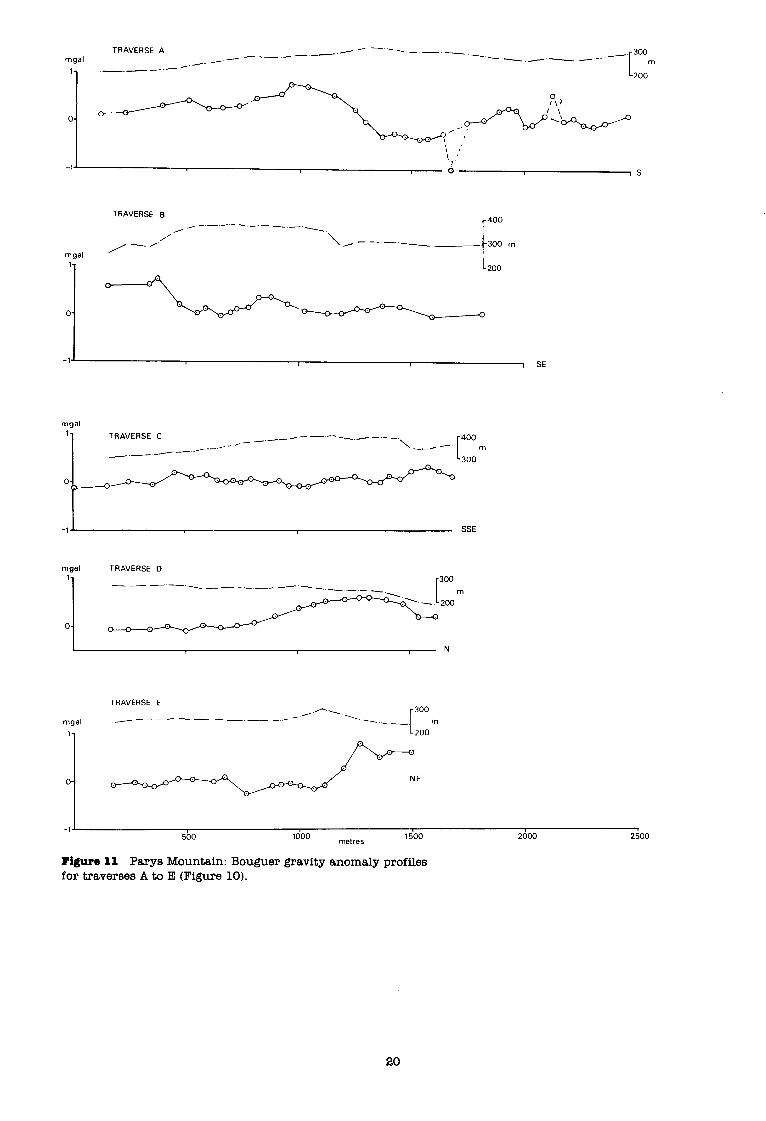
All the profiles show small but significant variations ranging up to 1 mGa1, except for profile C which shows only minor variation. Profile B crosses the acid volcanic rocks and the anomaly may result from the presence of these rocks. Anomalies on profiles A, E and F, at the eastern end of the area, could be accounted for by concealed acid volcanics or by a thick cover of drift (density c. 2 Mg/m3). The
southern part of profile D, at the western end of the mountain, has a
Bouguer anomaly 'low' which could result from similar circumstances. To satisfy the observed anomaly it is necessary to postulate either a thickening of the drift of up to 30 m, or the presence of a roughly east-west trending body of acid rocks having a density contrast of about -0.1 Mg/m3 and a thickness of up to 250 m.
It was concluded that gravity surveys could be used to detect, and possibly predict, the presence of acid volcanic rocks in this area, but they must be used in conjunction with other methods, since alone they do not produce unambiguous results.
Seismic Refraction
Two seismic refraction traverses (1 and 2, Figure 10) were made to determine if the small Bouguer anomaly variations observed were due to variations in drift thickness and, secondly, to see if the nature of the bedrock could be decided in drift-covered areas from an examination of the seismic velocities. The two profiles could not be sited exactly on the original gravity traverses because of obstructions (buildings etc)
and further gravity observations were therefore made along the seismic profiles (F and G, Figure 10).
The refraction results were obtained using SIE RS4 12-channel recording equipment and gelignite sources in shot-holes drilled with a 'Minuteman'
19
TRAVERSE 8
_-----____
mgal l-
-1 I I I , SE
mgal l- TRAVERSE C -- _ --.
_--- -/---.
\ 400
--- m _---
_-/-
[ 300
-1; I SSE
mgel TRAVERSE D l-
-_ _- ._--,_--_ ---2, m
O- 0 c
TRAVERSE E , -‘\ 300
mgal _----A-_- /- \
l__- f m
11 L 200
O-
-1' I 500
, 1000
metres 1500 2000 2500
Figure 11 Parys Mountain: Bouguer gravity anomaly profiles for traverses A to E (Figure 10).
20
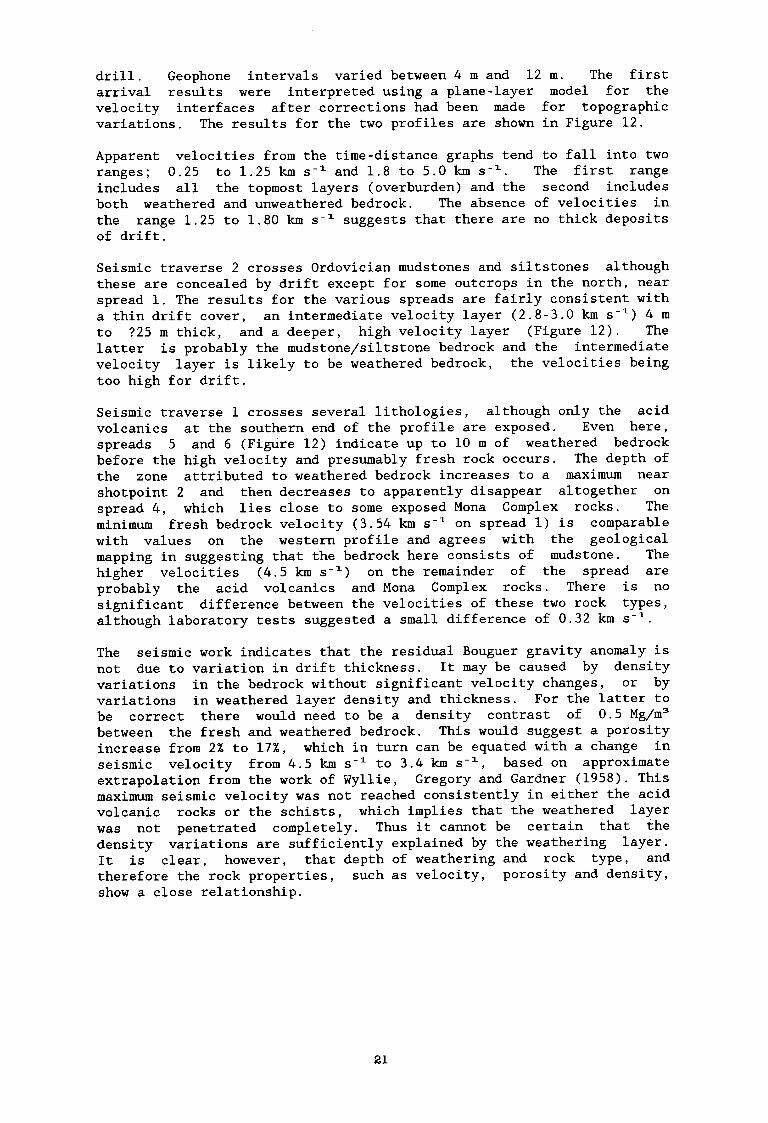
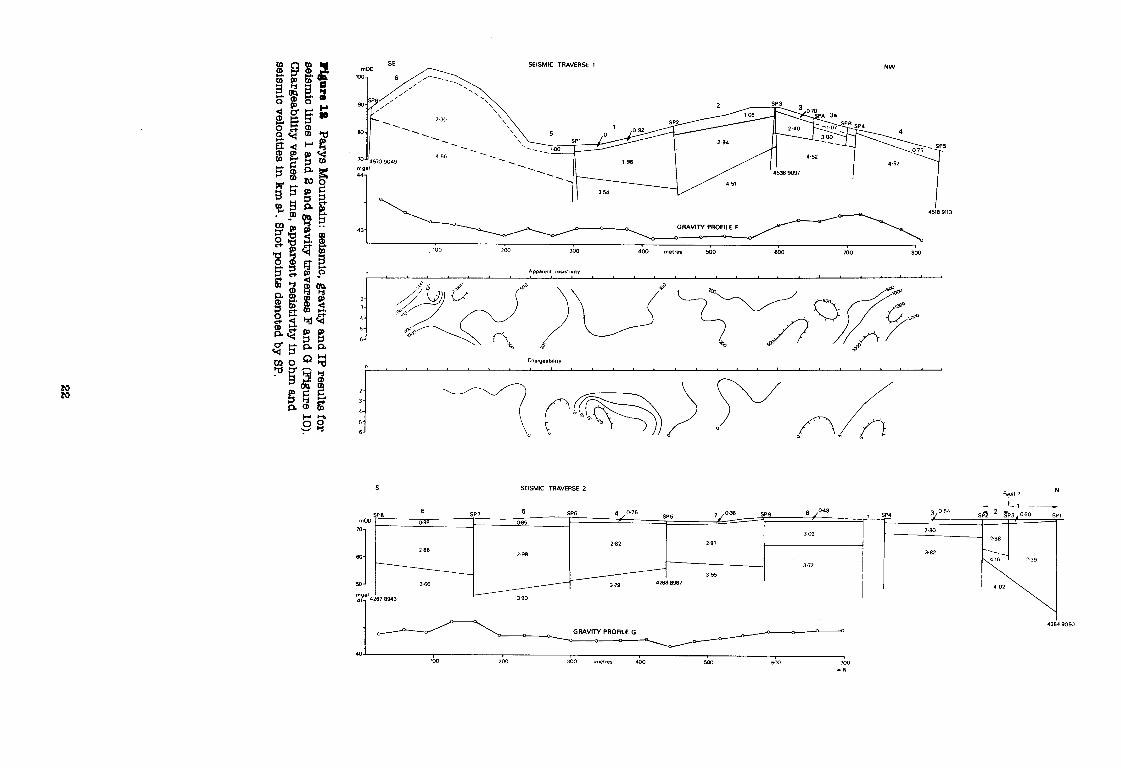
drill. Geophone intervals varied between 4 m and 12 m. The first arrival results were interpreted using a plane-layer model for the velocity interfaces after corrections had been made for topographic variations. The results for the two profiles are shown in Figure 12.
Apparent velocities from the time-distance graphs tend to fall into two ranges; 0.25 to 1.25 km s-l and 1.8 to 5.0 km s-l. The first range includes all the topmost layers (overburden) and the second includes both weathered and unweathered bedrock. The absence of velocities in the range 1.25 to 1.80 km s-l suggests that there are no thick deposits of drift.
Seismic traverse 2 crosses Ordovician mudstones and siltstones although these are concealed by drift except for some outcrops in the north, near spread 1. The results for the various spreads are fairly consistent with a thin drift cover, an intermediate velocity layer (2.8-3.0 km s-l) 4 m to ?25 m thick, and a deeper, high velocity layer (Figure 12). The latter is probably the mudstone/siltstone bedrock and the intermediate velocity layer is likely to be weathered bedrock, the velocities being too high for drift.
Seismic traverse 1 crosses several lithologies, although only the acid
volcanics at the southern end of the profile are exposed. Even here, spreads 5 and 6 (Figure 12) indicate up to 10 m of weathered bedrock before the high velocity and presumably fresh rock occurs. The depth of
the zone attributed to weathered bedrock increases to a maximum near shotpoint 2 and then decreases to apparently disappear altogether on spread 4, which lies close to some exposed Mona Complex rocks. The
minimum fresh bedrock velocity (3.54 km s-l on spread 1) is comparable with values on the western profile and agrees with the geological mapping in suggesting that the bedrock here consists of mudstone. The
higher velocities (4.5 km s-l) on the remainder of the spread are probably the acid volcanics and Mona Complex rocks. There is no significant difference between the velocities of these two rock types, although laboratory tests suggested a small difference of 0.32 km s-l.
The seismic work indicates that the residual Bouguer gravity anomaly is not due to variation in drift thickness. It may be caused by density variations in the bedrock without significant velocity changes, or by
variations in weathered layer density and thickness. For the latter to be correct there would need to be a density contrast of 0.5 Mg/m3
between the fresh and weathered bedrock. This would suggest a porosity increase from 2% to 17%, which in turn can be equated with a change in seismic velocity from 4.5 km s-'- to 3.4 km s-l, based on approximate extrapolation from the work of Wyllie, Gregory and Gardner (1958). This maximum seismic velocity was not reached consistently in either the acid volcanic rocks or the schists, which implies that the weathered layer
was not penetrated completely. Thus it cannot be certain that the density variations are sufficiently explained by the weathering layer.
It is clear, however, that depth of weathering and rock type, and
therefore the rock properties, such as velocity, porosity and density,
show a close relationship.
21
SE SEISMIC TRAVERSE 1
4518 9113
43- GRAVITY PROFILE F
100 , 203 I 300 400 metres 500 600 700 600
Chargeabhty ” 4
S SEISMIC TRAVERSE 2 N
GRAVITY PROFILE G
42i4 9050
4OJ loo 200 300 mewe* 400 500 600 700
-N
IP measurements along seismic refraction lines
Time domain IP measurements were made along seismic line 1 (Figure 10) using identical parameters to those employed at City Dulas (see below). The results are shown in Figure 12; shot-hole SP6 at the southern end of line Ll is located at 30N (metres north along the profile). At about 570N there is a slight re-orientation of the profile westwards.
Apparent resistivity values vary from below 100 ohm m to over 2000 ohm m with the *highest values towards the ends of the line, where seismic results suggest a thin weathered zone. Chargeabilities are generally below 10 ms but values up to 20 ms occur between 300-400N associated with low apparent resistivities. Repeatable negative chargeabilities were frequently recorded south of 270N and can be attributed to induction effects. The appearance of positive chargeabilities north of dipole 270-300N suggests that the junction between the volcanics and Silurian mudstones lies just to the south of 270N. The chargeability maximum and apparent resistivity minimum between 300-420N coincides in part with a topographic low and the outcrop of Silurian mudstones, with a consequent increase in groundwater saturation and conductivity. Caution should therefore be used in relating the chargeability maximum to bedrock mineralisation. Between 450-5lON negative IP values are attributed to inductive effects resulting from a resistive bedrock beneath more conductive overburden. North of this, to about 720N, apparent resistivity (<500 ohm m) and chargeability (<5 ms) values are generally low. At the northern end of the traverse increased values of both apparent resistivity and chargeability may be associated with spilitic lavas or intrusions at depth within the Mona Complex.
Conclusions
1. The IP method generates strong chargeability anomalies over 'bluestone' sulphide deposits at Parys Mountain and is therefore a useful technique for detecting buried mineralisation of this type. In contrast, EM methods are ineffective and suffer greatly from artificial source interference. The VLF(EM) is useful for detecting steeply dipping conductors in interference-free areas whilst magnetic anomalies reflect particular lithologies in areas free of artificial sources.
2. Seismic refraction profiles show that Bouguer anomalies detected during the gravity orientation survey are not caused by a thickening of overburden. It is not possible to positively identify the lithology responsible for the Bouguer anomaly but acid volcanic rocks are a likely source. IP measurements reveal a chargeability high coincident with the junction of Silurian mudstones and acid volcanic rocks. This could be related to mineralisation although a change in groundwater conditions or presence of graphite in the mudstones may cause the effect.
23
GROUND INVESTIGATIONS OF AIRBORNE GEOPHYSICAL ANOMALIES
An airborne magnetic, electromagnetic and radiometric survey was carried out across the northern part of Anglesey for the Mineral Reconnaissance Programme (Smith, 1979). Ground surveys were subsequently carried out to verify and establish the position of the airborne anomalies, and to eliminate those with an artificial source. These ground surveys are described below, omitting those covered by a previous report (Cooper, Nutt, Smith and Easterbrook, 1989) or described elsewhere in this report.
Geophysical methods
Electromagnetic
Two EM methods were employed: Slingram and Very Low Frequency (VLF). The following Slingram systems were used: (i) ABEM 35/88 'EM Gun' operating at 3560 and 880 Hz; (ii) ABEM 'Demigun' operating at 2640 and 880 Hz; (iii) Geonics EM17 operating at 1600 Hz and (iv) Geonics EM15, a metal detector.
The equipment used was described by Burley, Cornwell and Tombs (1978). To check airborne anomalies several sub-parallel traverses were measured across the peaks of anomalies normal to their strike, with a sufficient traverse length to allow for any positional errors on the airborne maps and to extend into areas of background values. The data were interpreted by matching the field curves against 'standard curves' or by using characteristic curves (Grant and West, 1965; Ketola and Puranen, 1967).
The VLF(EM) method (using the Geonics EM 16) was used largely in conjunction with Slingram and readings were taken at the same stations. Interpretation was qualitative.
Magnetic
Two types of magnetometer were used: (i) proton precession magnetometer (ELSEC) measuring the total magnetic field and (ii) fluxgate magnetometer (Sharpe and Jalander) measuring the vertical magnetic component.
Generally the magnetometer was used in conjunction with Slingram and readings were taken at EM stations. Diurnal corrections were made by looping out from a temporary base station, returning as often as practicable. The resulting variation was distributed linearly over the period of the loop. In the case of the proton magnetometer the values are absolute but those of the fluxgate are related to an arbitrary datum.
No attempt was made during the ground survey to refer magnetic values
either to the airborne survey data or to the Aeromagnetic Map of Great
Britain (Geological Survey of Great Britain, 1965). A convenient regional field was removed when this was necessary for interpretation of any profile.
24
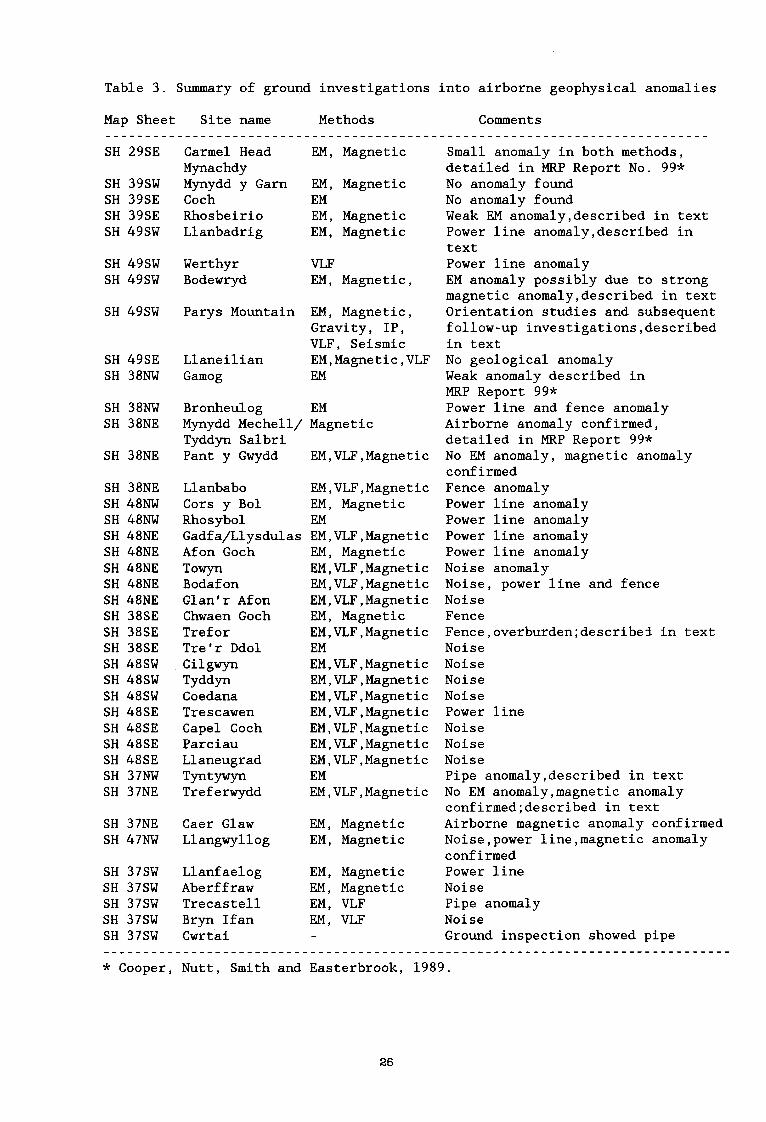
Table 3. Summary of ground investigations into airborne geophysical anomalies
Map Sheet Site name Methods Comments ____________________~~~~~~~~~~~~~~~~~~~~~~~~~~~~~~~~~~~~~~~~~~~~~~~~~~~~~~~~
SH 29SE
SH 39SW SH 39SE SH 39SE SH 49SW
SH 49SW SH 49SW
SH 49SW
SH 49SE SH 38NW
SH 38NW SH 38NE
SH 38NE
SH 38NE SH 48NW SH 48NW SH 48NE SH 48NE SH 48NE SH 48NE SH 48NE SH 38SE SH 38SE SH 38SE SH 48SW SH 48SW SH 48SW SH 48SE SH 48SE SH 48SE SH 48SE SH 37NW SH 37NE
SH 37NE SH 47NW
SH 37SW SH 37SW SH 37SW SH 37SW SH 37SW
Carmel Head Mynachdy Mynydd y Garn Coch Rhosbeirio Llanbadrig
EM, Magnetic
EM, Magnetic EM EM, Magnetic EM, Magnetic
Werthyr Bodewryd
VLF EM, Magnetic,
Parys Mountain
Llaneilian Gamog
EM, Magnetic, Gravity, IP, VLF, Seismic EM,Magnetic,VLF EM
Bronheulog Mynydd Mechell/ Tyddyn Salbri Pant y Gwydd
EM Magnetic
EM,VLF,Magnetic
Llanbabo EM,VLF,Magnetic Cors y Bol EM, Magnetic Rhosybol EM Gadfa/Llysdulas EM,VLF,Magnetic Afon Goch EM, Magnetic
Towyn EM,VLF,Magnetic Bodafon EM,VLF,Magnetic Glan'r Afon EM,VLF,Magnetic Chwaen Goch EM, Magnetic Trefor EM,VLF,Magnetic Tre'r Ddol EM Cilgwyn EM,VLF,Magnetic
TYddYn EM,VLF,Magnetic Coedana EM,VLF,Magnetic Trescawen EM,VLF,Magnetic Cape1 Coch EM,VLF,Magnetic Parciau EM,VLF,Magnetic Llaneugrad EM,VLF,Magnetic
Tyntywyn EM Treferwydd EM,VLF,Magnetic
Caer Glaw Llangwyllog
EM, Magnetic EM, Magnetic
Llanfaelog Aberffraw Trecastell Bryn Ifan Cwrtai
EM, Magnetic EM, Magnetic EM, VLF EM, VLF
Small anomaly in both methods, detailed in MRP Report No. 99* No anomaly found No anomaly found Weak EM anomaly,described in text Power line anomaly,described in text Power line anomaly EM anomaly possibly due to strong magnetic anomaly,described in text Orientation studies and subsequent follow-up investigations,described in text No geological anomaly Weak anomaly described in MRP Report 99* Power line and fence anomaly Airborne anomaly confirmed, detailed in MRP Report 99* No EM anomaly, magnetic anomaly confirmed Fence anomaly Power line anomaly Power line anomaly Power line anomaly Power line anomaly Noise anomaly Noise, power line and fence Noise Fence Fence,overburden;described in text Noise Noise Noise Noise Power line Noise Noise Noise Pipe anomaly,described in text No EM anomaly,magnetic anomaly confirmed;described in text Airborne magnetic anomaly confirmed Noise,power line,magnetic anomaly confirmed Power line Noise Pipe anomaly Noise Ground inspection showed pipe
____________________~~~~~~_______~~~~~~~~~~~~~~~~~~~~~~~~~~~~~~~~~~~~~~~~~~~~~~
* Cooper, Nutt, Smith and Easterbrook, 1989.
25
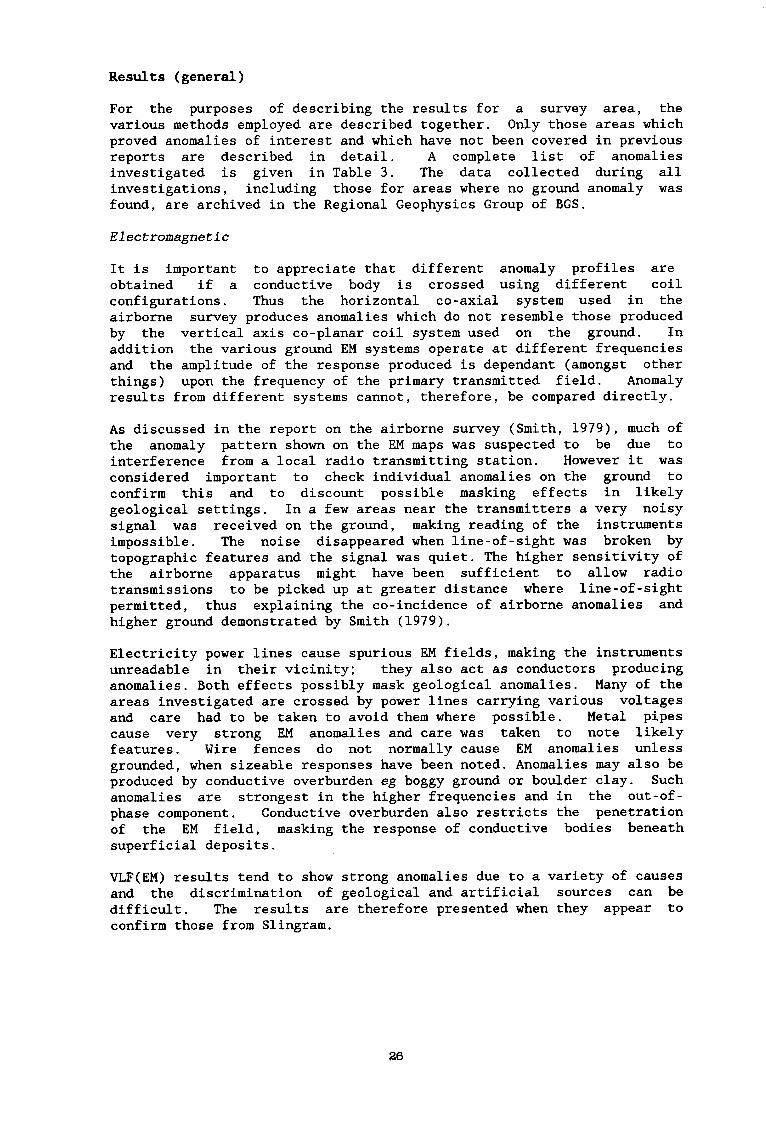
Results (general)
For the purposes of describing the results for a survey area, the various methods employed are described together. Only those areas which proved anomalies of interest and which have not been covered in previous reports are described in detail. A complete list of anomalies investigated is given in Table 3. The data collected during all investigations, including those for areas where no ground anomaly was found, are archived in the Regional Geophysics Group of BGS.
Electromagnetic
It is important to appreciate that different anomaly profiles are obtained if a conductive body is crossed using different coil configurations. Thus the horizontal co-axial system used in the airborne survey produces anomalies which do not resemble those produced by the vertical axis co-planar coil system used on the ground. In addition the various ground EM systems operate at different frequencies and the amplitude of the response produced is dependant (amongst other things) upon the frequency of the primary transmitted field. Anomaly results from different systems cannot, therefore, be compared directly.
As discussed in the report on the airborne survey (Smith, 1979), much of the anomaly pattern shown on the EM maps was suspected to be due to interference from a local radio transmitting station. However it was considered important to check individual anomalies on the ground to confirm this and to discount possible masking effects in likely geological settings. In a few areas near the transmitters a very noisy signal was received on the ground, making reading of the instruments impossible. The noise disappeared when line-of-sight was broken by topographic features and the signal was quiet. The higher sensitivity of the airborne apparatus might have been sufficient to allow radio transmissions to be picked up at greater distance where line-of-sight permitted, thus explaining the co-incidence of airborne anomalies and higher ground demonstrated by Smith (1979).
Electricity power lines cause spurious EM fields, making the instruments unreadable in their vicinity; they also act as conductors producing anomalies. Both effects possibly mask geological anomalies. Many of the areas investigated are crossed by power lines carrying various voltages and care had to be taken to avoid them where possible. Metal pipes cause very strong EM anomalies and care was taken to note likely features. Wire fences do not normally cause EM anomalies unless grounded, when sizeable responses have been noted. Anomalies may also be produced by conductive overburden eg boggy ground or boulder clay. Such anomalies are strongest in the higher frequencies and in the out-of- phase component. Conductive overburden also restricts the penetration of the EM field, masking the response of conductive bodies beneath superficial deposits.
VLF(EM) results tend to show strong anomalies due to a variety of causes and the discrimination of geological and artificial sources can be difficult. The results are therefore presented when they appear to confirm those from Slingram.
26
Vletres
Y Geophysical traverse
Contours of total magnetic ,--
-- () -- field strength above standard : “1 i i : (‘,;t ‘j*, \ 5‘ *:. datum (contour interval 50 nT)
__ ̂ _. ̂ Contours of EM in-phase ‘) firi’,:: :“r,.‘> :, I
-loo- component in ppm (contour ._. interval 100 ppm) __.__ . ~
I t*,‘-> t, ;rt. I;;?,<! ,a. $t -- -Jr-- _...- ~>“,.<C!‘,
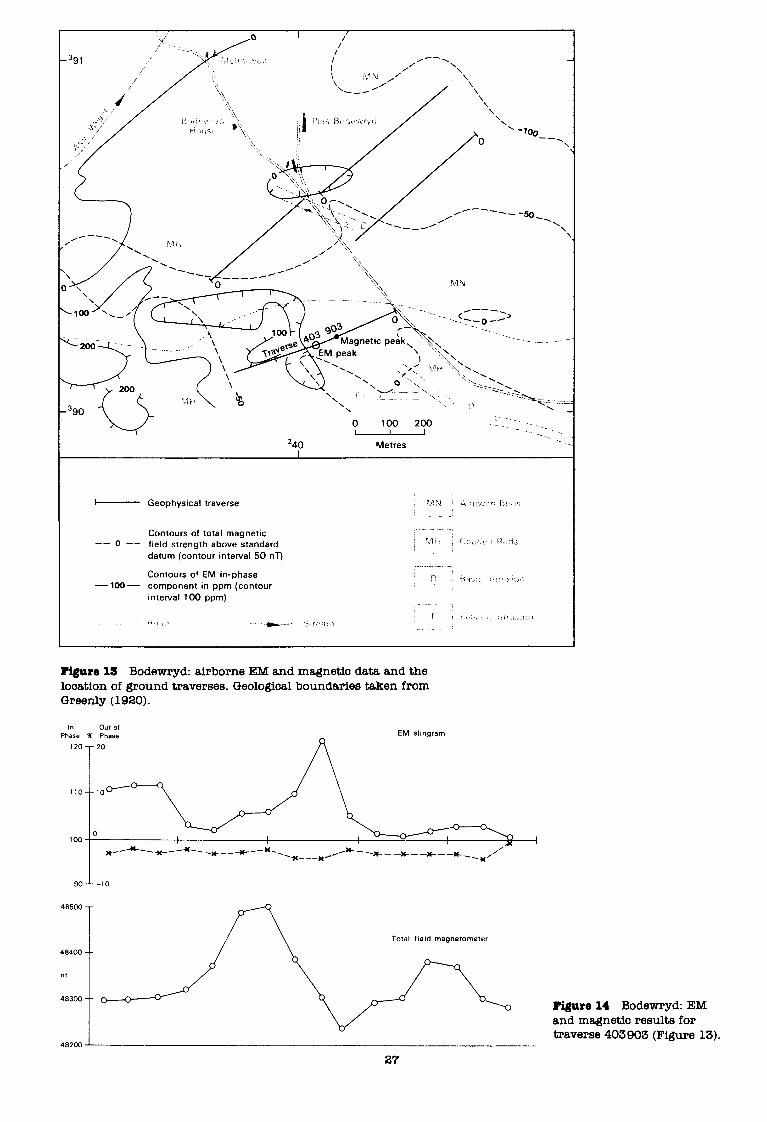
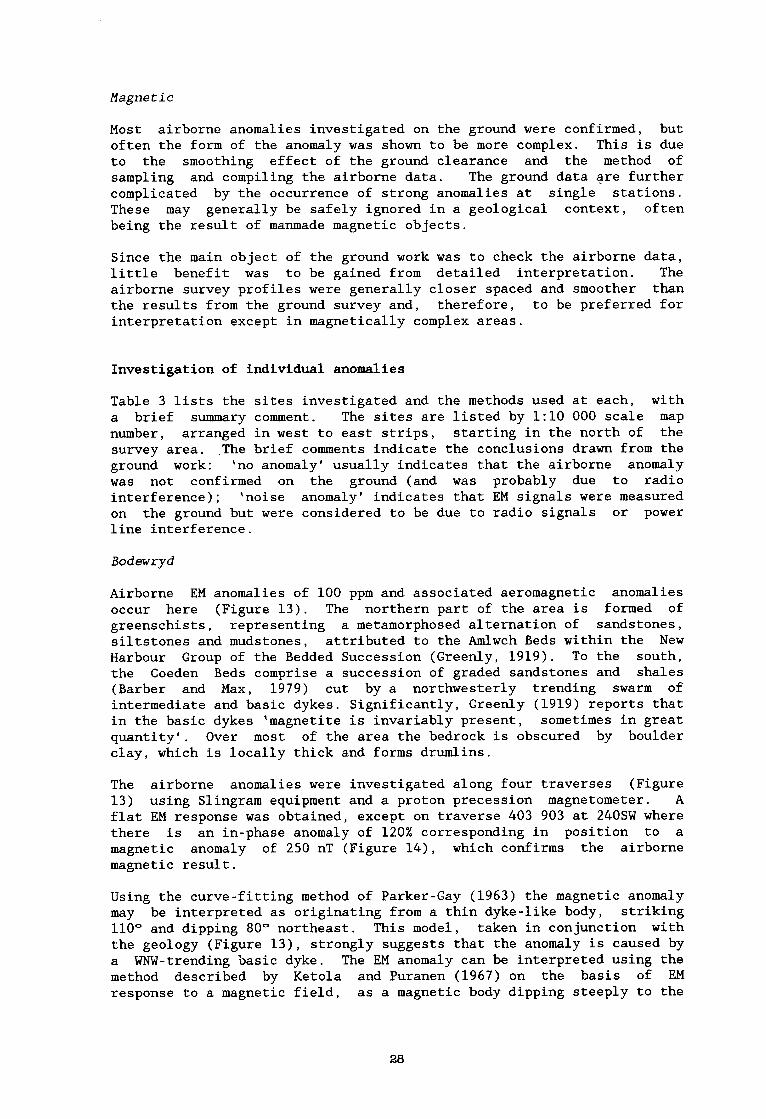
Figure 15 Bodawryd: airborne EM and magnetic data and the location of ground traverses. Geological boundaries taken from Greenly (1920).
Total field magnetometer
27
Magnetic
Most airborne anomalies investigated on the ground were confirmed, but often the form of the anomaly was shown to be more complex. This is due
to the smoothing effect of the ground clearance and the method of sampling and compiling the airborne data. The ground data are further complicated by the occurrence of strong anomalies at single stations. These may generally be safely ignored in a geological context, often
being the result of manmade magnetic objects.
Since the main object of the ground work was to check the airborne data, little benefit was to be gained from detailed interpretation. The
airborne survey profiles were generally closer spaced and smoother than
the results from the ground survey and, therefore, to be preferred for
interpretation except in magnetically complex areas.
Investigation of individual anomalies
Table 3 lists the sites investigated and the methods used at each, with
a brief summary comment. The sites are listed by 1:lO 000 scale map
number, arranged in west to east strips, starting in the north of the survey area. The brief comments indicate the conclusions drawn from the ground work: 'no anomaly' usually indicates that the airborne anomaly
was not confirmed on the ground (and was probably due to radio
interference); 'noise anomaly' indicates that EM signals were measured
on the ground but were considered to be due to radio signals or power
line interference.
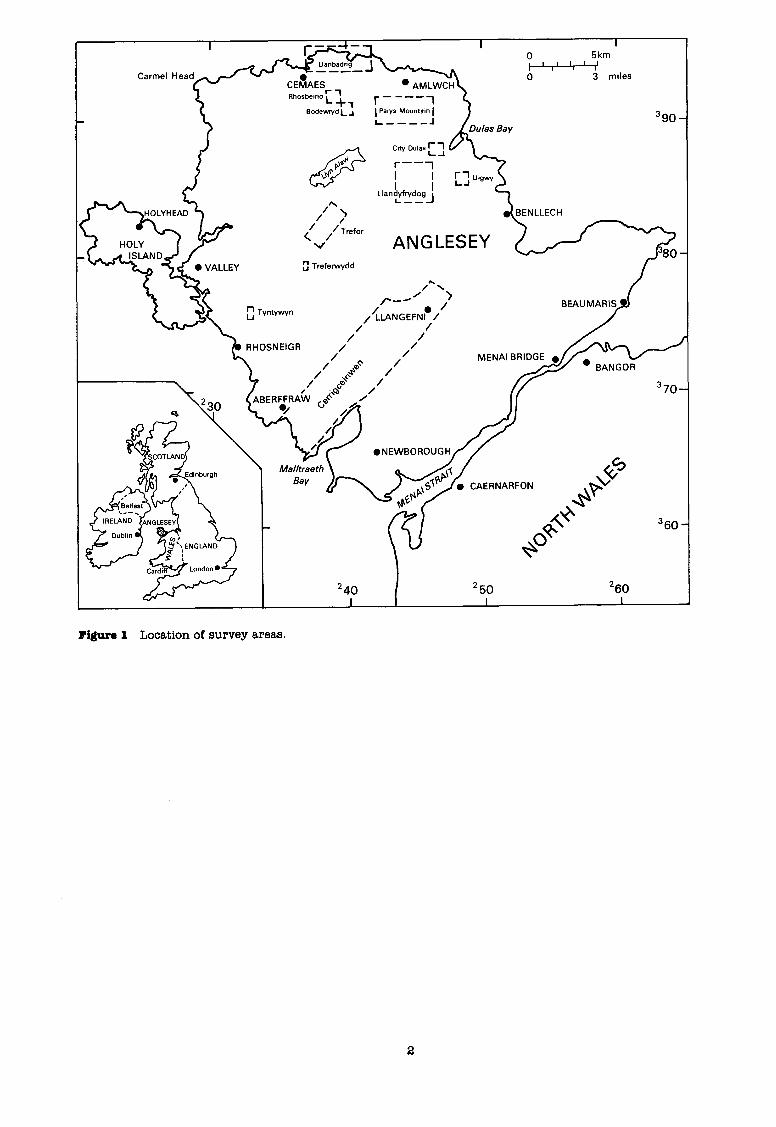
Bodewryd
Airborne EM anomalies of 100 ppm and associated aeromagnetic anomalies occur here (Figure 13). The northern part of the area is formed of greenschists, representing a metamorphosed alternation of sandstones,
siltstones and mudstones, attributed to the Amlwch Beds within the New
Harbour Group of the Bedded Succession (Greenly, 1919). To the south,
the Coeden Beds comprise a succession of graded sandstones and shales (Barber and Max, 1979) cut by a northwesterly trending swarm of intermediate and basic dykes. Significantly, Greenly (1919) reports that
in the basic dykes 'magnetite is invariably present, sometimes in great
quantity'. Over most of the area the bedrock is obscured by boulder
clay, which is locally thick and forms drumlins.
The airborne anomalies were investigated along four traverses (Figure
13) using Slingram equipment and a proton precession magnetometer. A
flat EM response was obtained, except on traverse 403 903 at 240SW where
there is an in-phase anomaly of 120% corresponding in position to a
magnetic anomaly of 250 nT (Figure 14), which confirms the airborne magnetic result.
Using the curve-fitting method of Parker-Gay (1963) the magnetic anomaly may be interpreted as originating from a thin dyke-like body, striking
110" and dipping 80" northeast. This model, taken in conjunction with
the geology (Figure 13), strongly suggests that the anomaly is caused by a WNW-trending basic dyke. The EM anomaly can be interpreted using the method described by Ketola and Puranen (1967) on the basis of EM
response to a magnetic field, as a magnetic body dipping steeply to the
28
.391
0 100 200 : + __
I I 1 / . -A.., P Melin-wen
J .\ ‘, Metres / 24c
+ Geophysical traverse
. _A Alluvium
Contours of total magnetic field --o-- strength (contour interval 50 nT)
_,oo_ Contours of EM in-phase component (contour interval 100 ppm)
- ̂ ___. I MN 1 Amlwch Beds
__- _._. . - __ --_-
: MNJ Cherts (jaspers) __._l._”
__I_._- - Road
- t^- Stream
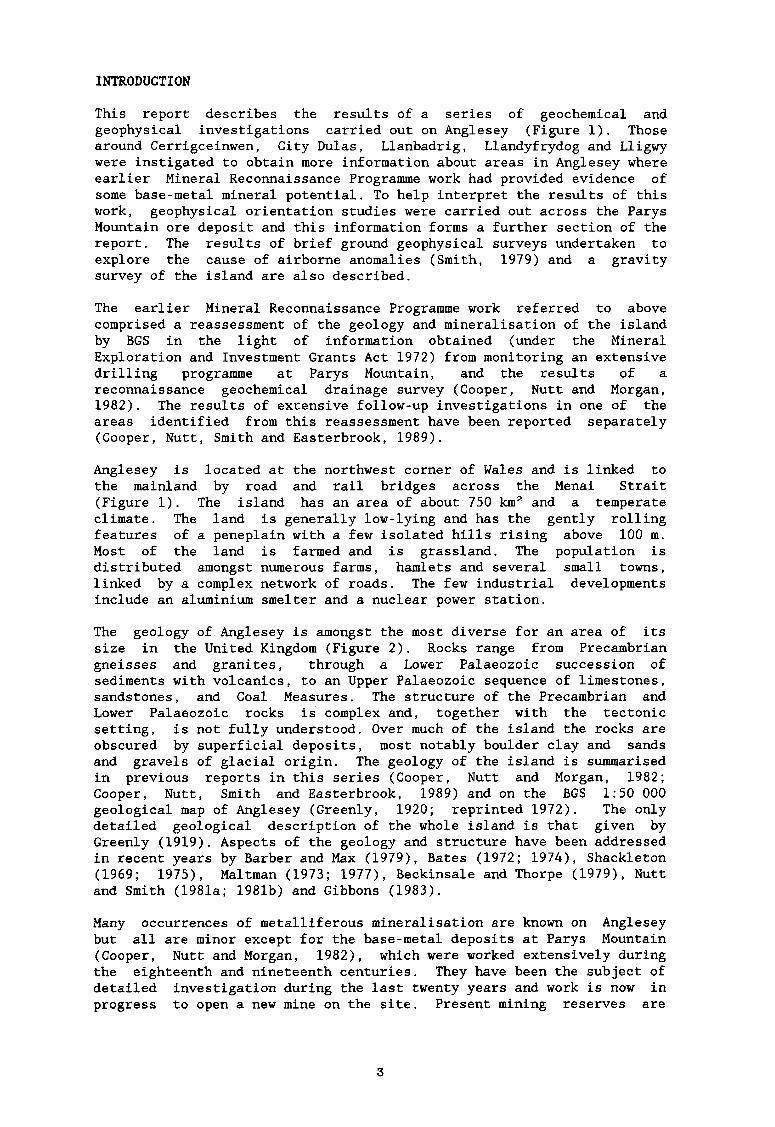
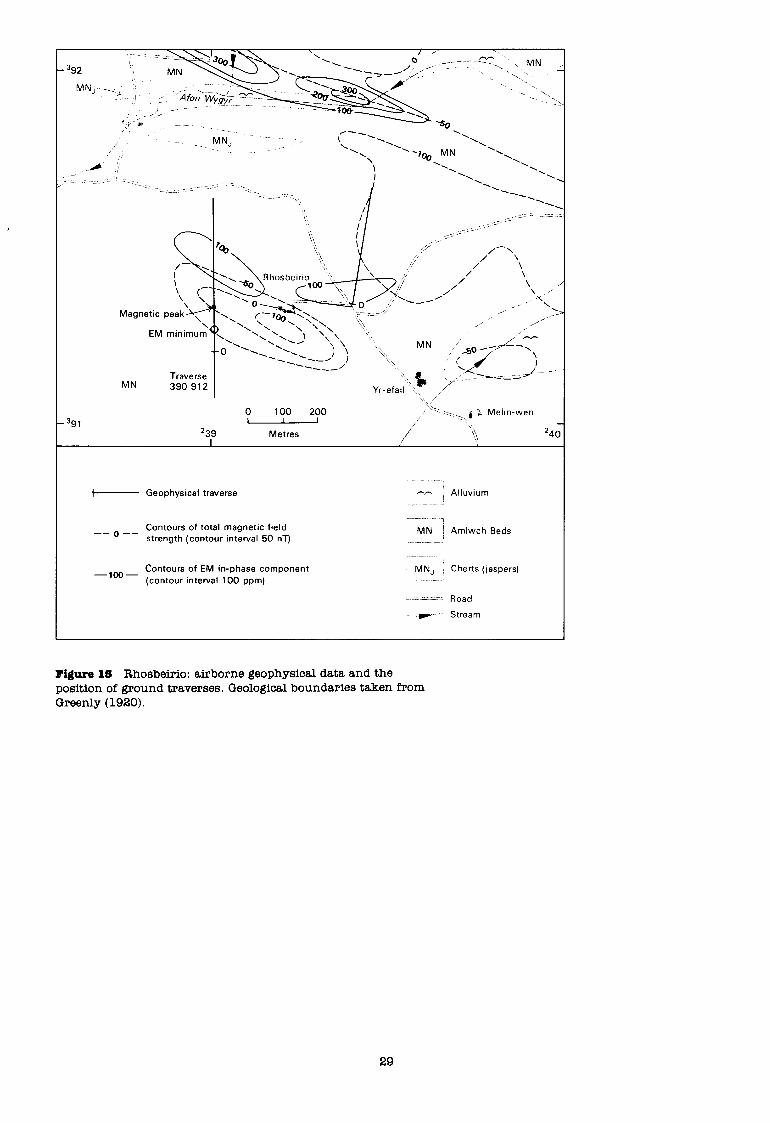
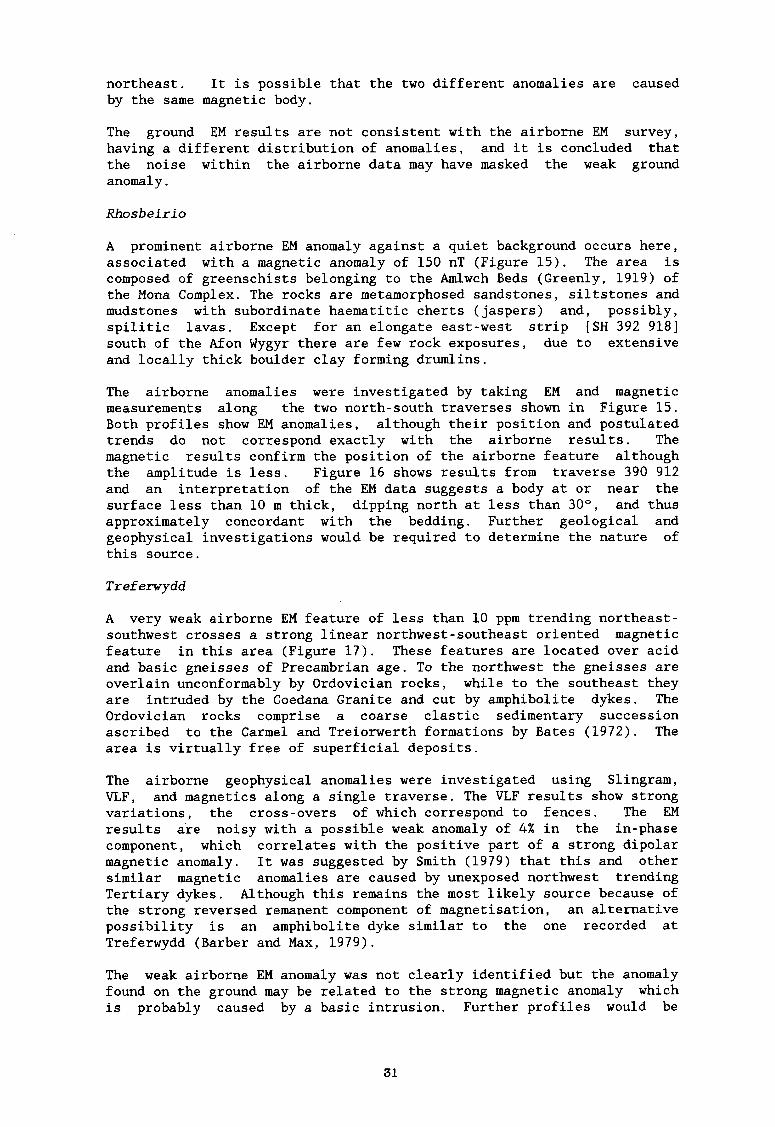
Figure 16 Rhosbeirio: airborne geophysical data and the position of ground traverses. Geological boundaries taken from Greenly (1920).
29
EM
880 Hz
In out of
p/ In Phase
/X ** Out of Phase
TRAVERSE 390 912
3560 Hz
Y /
X
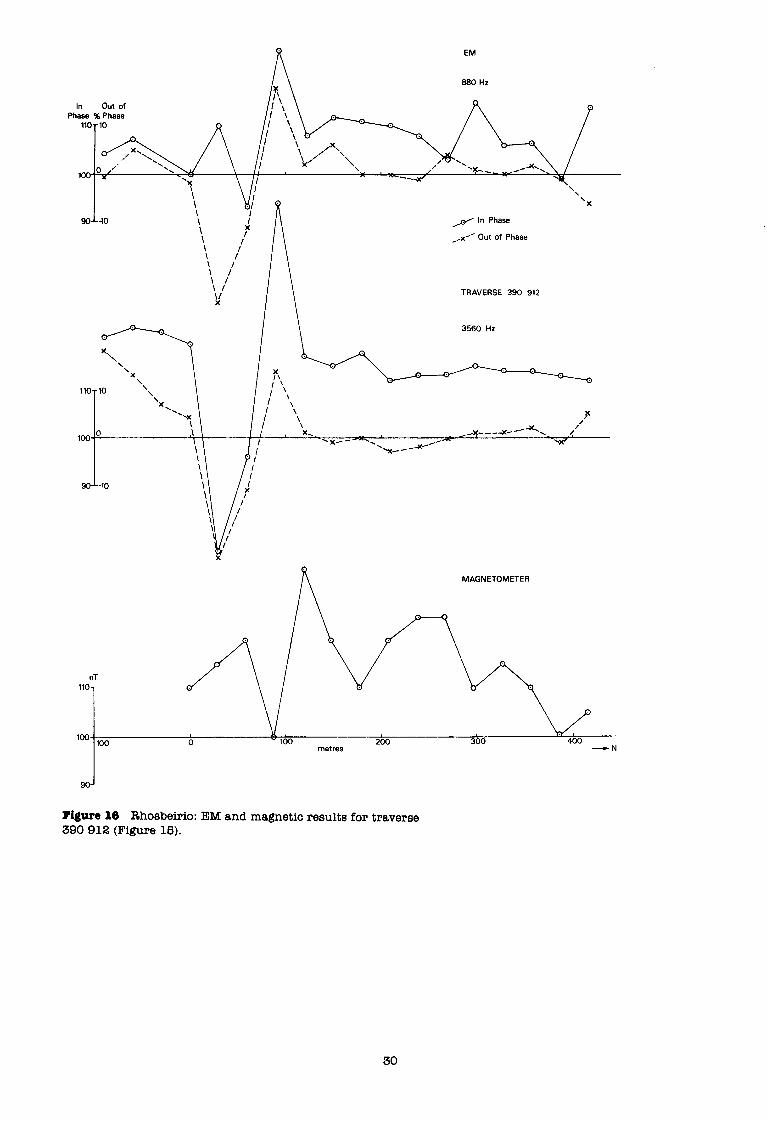
Figure 10 Rhosbeirio: EM and magnetic results for traverse 390 912 (Figure 15).
30
northeast. It is possible that the two different anomalies are caused by the same magnetic body.
The ground EM results are not consistent with the airborne EM survey, having a different distribution of anomalies, and it is concluded that the noise within the airborne data may have masked the weak ground
anomaly.
Rhosbeirio
A prominent airborne EM anomaly against a quiet background occurs here, associated with a magnetic anomaly of 150 nT (Figure 15). The area is composed of greenschists belonging to the Amlwch Beds (Greenly, 1919) of the Mona Complex. The rocks are metamorphosed sandstones, siltstones and mudstones with subordinate haematitic cherts (jaspers) and, possibly, spilitic lavas. Except for an elongate east-west strip [SH 392 9181 south of the Afon Wygyr there are few rock exposures, due to extensive and locally thick boulder clay forming drumlins.
The airborne anomalies were investigated by taking EM and magnetic measurements along the two north-south traverses shown in Figure 15. Both profiles show EM anomalies, although their position and postulated trends do not correspond exactly with the airborne results. The magnetic results confirm the position of the airborne feature although the amplitude is less. Figure 16 shows results from traverse 390 912 and an interpretation of the EM data suggests a body at or near the surface less than 10 m thick, dipping north at less than 30”, and thus
approximately concordant with the bedding. Further geological and geophysical investigations would be required to determine the nature of this source.
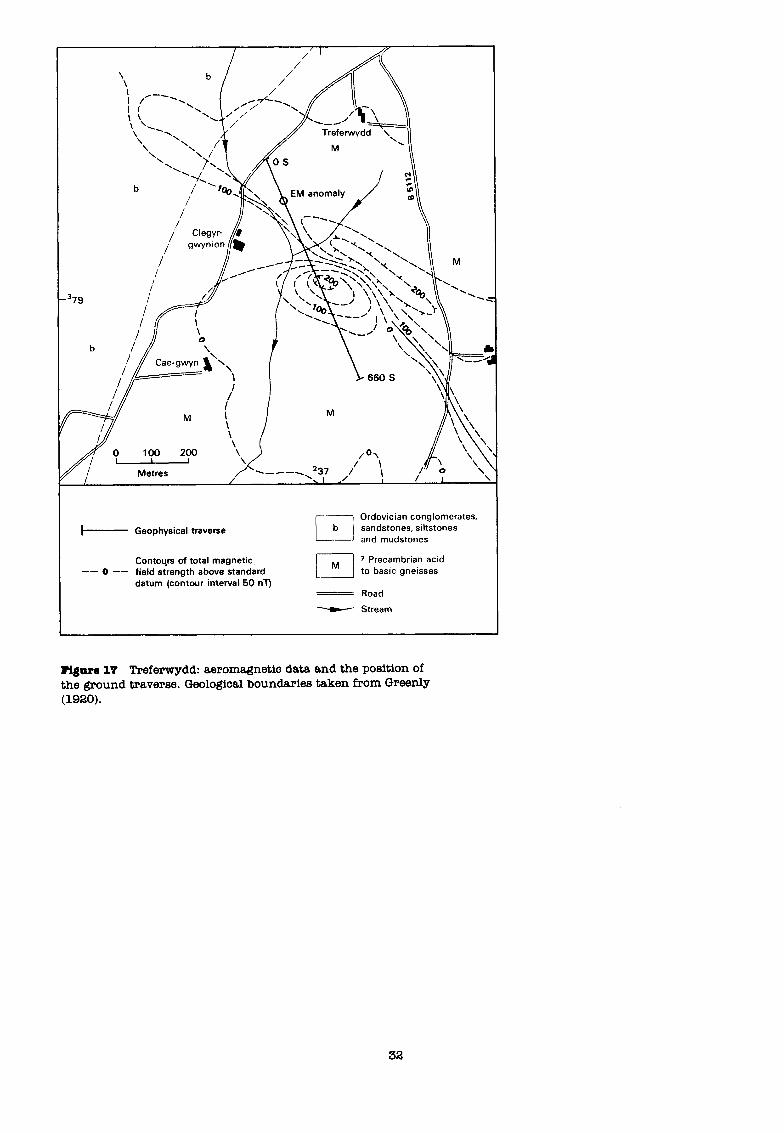
Tref erwydd
A very weak airborne EM feature of less than 10 ppm trending northeast- southwest crosses a strong linear northwest-southeast oriented magnetic
feature in this area (Figure 17). These features are located over acid and basic gneisses of Precambrian age. To the northwest the gneisses are overlain unconformably by Ordovician rocks, while to the southeast they are intruded by the Coedana Granite and cut by amphibolite dykes. The Ordovician rocks comprise a coarse elastic sedimentary succession ascribed to the Carmel and Treiorwerth formations by Bates (1972). The area is virtually free of superficial deposits.
The airborne geophysical anomalies were investigated using Slingram, VLF, and magnetics along a single traverse. The VLF results show strong variations, the cross-overs of which correspond to fences. The EM
results are noisy with a possible weak anomaly of 4% in the in-phase
component, which correlates with the positive part of a strong dipolar magnetic anomaly. It was suggested by Smith (1979) that this and other similar magnetic anomalies are caused by unexposed northwest trending
Tertiary dykes. Although this remains the most likely source because of the strong reversed remanent component of magnetisation, an alternative
possibility is an amphibolite dyke similar to the one recorded at
Treferwydd (Barber and Max, 1979).
The weak airborne EM anomaly was not clearly identified but the anomaly found on the ground may be related to the strong magnetic anomaly which is probably caused by a basic intrusion. Further profiles would be
31
I- Geophysical traverse
- Ordovician conglomerates,
I b sandstones, siltstones
and mudstones
Contoqrs of total magnetic -- 0 _- field strength above standard /
M ? Precambrian acid to basic gneisses
datum (contour interval 50 nT) = Road
“F” Stream
Figure 17 Treferwydd: aeromagnetic data and the position of the ground traverse. Geological boundaries taken from Greenly (1920).
32
1 Ground geophysical traverse
-loo- Contour of airborne EM in-phase
component (contour interval 100 ppm)
Ordovician wltstones and mudstones
Ordowclan sandstones and conglomerates
7 Precambrian gnetsses
Basic Intrusion
= Road
------- __---_- Track
0 100 200 300 400 500 I I L I I
Metres
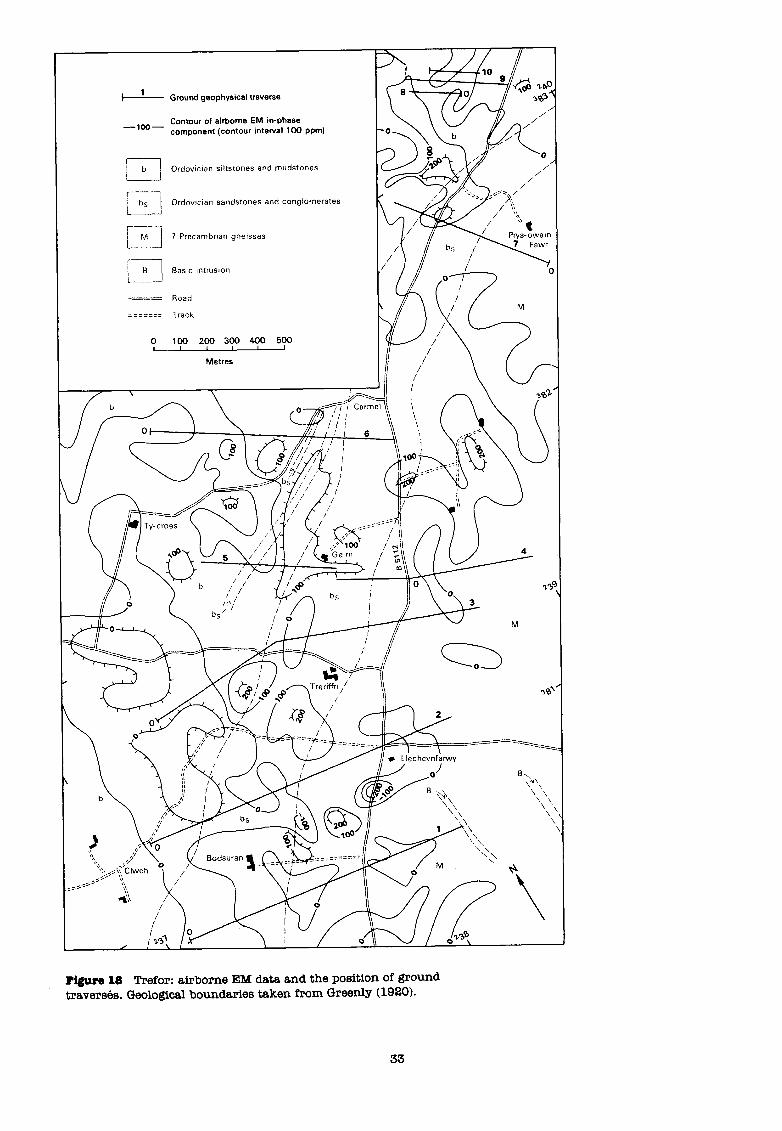
Figure 18 Trefor: airborne EM data and the position of ground travers6s. Geological boundaries taken from Greenly (1920).
33
I
- 232 I
233 376
8, _,;’ ,
/’ .< ,’ ,:’
/ + /, <
,9 ,< ’
‘5 I”
.1- ~ </” b , ’
,‘f , ,* S
.-Z __. -- I,
f, ,,r _ ,’ .,
‘i , ,, ,:. , .T-
S
0 100 200 1 I 1
Metres b -
I 375.
_ Ground geophysical traverse
-so- Contours of airborne EM in-phase component (in ppm)
/ s 1 Blown sand
---_ ._- l i-
1 Alluvium ._-__ .-I .__ ^ _ .
--_90-- Contours of ground EM in-phase : b / Ordovician rocks component (in %)
. - __ _- _ _ ._ _ __ .: Road/track
-) -. River
i-l-;st Railway
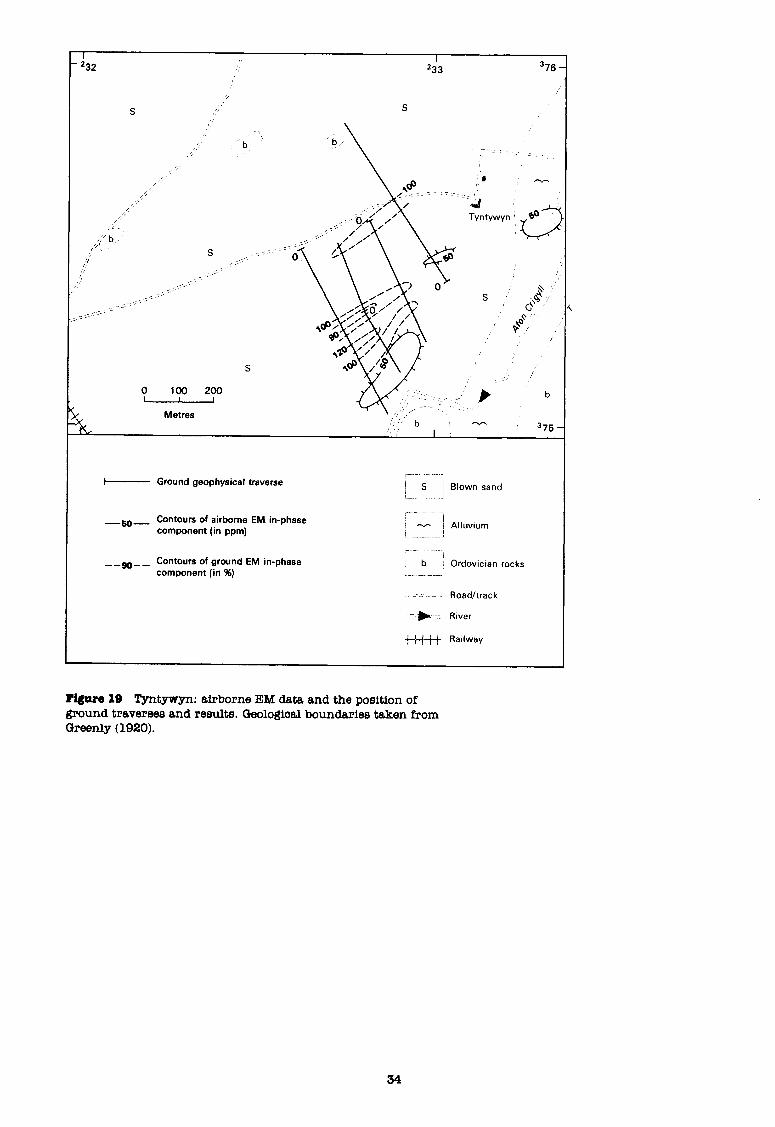
Figure 19 Tyntywyn: airborne EM data and the position of ground traverses and results. Geological boundaries taken from Greenly (1920).
34
necessary to confirm this correlation.
Tref or
Airborne EM anomalies of up to 200 ppm occur along the crest of a broad low ridge formed by the outcrop of Ordovician rocks unconformably overlying acid gneisses which occupy the ground to the southeast. The Ordovician rocks consist of Arenig sandstones with grits and conglomerates (Carmel Formation), overlain in the west by gritty mudstones with sandstones and conglomerates in a muddy matrix (Nantannog Formation; Bates, 1972). Superficial deposits of boulder clay, thin on the ridge where there are several rock exposures, obscure the rocks in the lower ground.
A series of traverses (Figure 18) was measured using various combinations of EM instruments. The area was electrically noisy, being crossed bY a number of power lines. Only on one traverse was a
significant anomaly found, which detailed follow-up work showed was due to a grounded fence; no sign of this anomaly is seen on the airborne data. Other traverses showed out-of-phase anomalies without corresponding in-phase values, and these are thought to originate from conductive overburden.
The airborne EM anomalies are attributed to radio transmission noise. Anomalies recorded on the ground are believed to have been caused by a grounded fence and conductive overburden.
Tyntywyn
The area around this EM anomaly (Figure 19) is covered by superficial deposits of blown sand, with alluvium adjacent to the Afon Crigyll. These deposits are believed to be underlain by Ordovician rocks which crop out to the north around Llyn Traffwll. The Ordovician rocks, of Arenig and Llanvirn age, comprise boulder beds, conglomerates, grits, sandstones and gritty mudstones of the Carmel, Treiorwerth and Nantannog formations (Bates, 1972).
The area is in general free from airborne EM variations except for a small, isolated feature of less than 100 ppm. Four ground traverses, totalling 2 km in length, were measured using Slingram equipment in the vicinity of the airborne anomaly (Figure 19). Both EM components showed rapid and strong variations in amplitude on all traverses. A shallow feature of moderate conductivity is deduced. Two main anomalies appear to lie parallel to the regional strike, but no stratabound source of EM anomalies was found elsewhere in the Ordovician rocks most likely to underlie this area. Inspection of the area suggested that buried pipes and other conductors might be present, due to the military use of the
area. It appears most likely, therefore, that these anomalies do not have a geological source.
Conclusions
1. Ground surveys confirmed that the complex pattern of airborne EM
anomalies was due largely to interference from a radio transmitter. Anomalies in eighteen areas (listed in Table 3) were demonstrated to have man-made origins such as power-lines and pipes. Five weak anomalies (Table 3) appear to be caused by geological sources, although none could
36

be shown to be diagnostic of mineralisation.
2. Ground magnetic surveys confirmed that aeromagnetic anomalies were real, accurately positioned and had geological origins. The airborne data is useful for mapping certain lithologies and geological groupings but is of no direct value in the identification of 'Parys Mountain style' mineralisation.
30
This is the first of five areas to be described where limited
geophysical and geochemical surveys were carried out to investigate
promising indications of mineralisation recorded by earlier regional- scale MRP surveys. In this area the reconnaissance-scale geochemical drainage survey results revealed a belt of anomalies close to the
unconformable junction between the basal Carboniferous and underlying Bedded Succession (Gwna Group) rocks between Llangefni and Malltraeth Bay (Figures 1 and 2). The anomalous metals included Ni, Cu, Zn, Sn, Ba and Pb. The majority of samples were heavily contaminated but
mineralogical work showed that, besides contaminants, baryte and,
locally, chalcopyrite were present (Cooper, Nutt and Morgan, 1982).
Further stream sediment and panned concentrate anomalies were recorded
in the Cerrigceinwen - Cerig Engan - Mona area (Figure 20). Here the
anomalous samples, characterised by high levels of Ti, Fe, Ni, Cu and
Zn, came from streams following the regional strike of spilitic rocks within the Gwna Group. There is some evidence from old records of mineralisation associated with both the basal Carboniferous and the
splilitic rocks of the area. To seek further evidence of mineralisation and to supplement the relatively poor surface drainage cover a
geochemical groundwater survey was carried out across the area shown in Figure 1. Following the receipt of encouraging results, limited
reconnaissance soil sampling was undertaken.
Geology and mineralisation
The northwestern part of the area is composed of rocks belonging to the Gwna Group of Greenly's (1919) Bedded Succession (Figures 1 and 2). Here the Gwna Group consists largely of mglange containing a wide variety of clasts and spilitic lavas. Two belts of spilitic lavas, termed the
Ceinwen and Llanddwyn Spilitic Formation and Engan Spilitic Formation by Shackleton (1975), crop out around Cerrigceinwen and between Mona and
Llyn Coron [SH 378 7001 respectively. The rocks are metamorphosed to
greenschist facies and are highly deformed and sheared in places.
In the southeast of the area the Gwna Group is unconformably overlain by limestones, sandstones, cherts and thin grits and shales of
Carboniferous age. Progressively younger beds overlap and overstep onto the Gwna Group towards the southwest, so that near Bodorgan the local
equivalent of the Millstone Grit (Namurian) lies directly on the Gwna
Group.
There is evidence of minor mineralisation in both the Gwna Group and
Carboniferous rocks. At Cerrigceinwen [SH 422 7361 a trial comprising a shaft and adit in spilites with carbonate lenses is said to have been
for lead, and Greenly (1919) records the presence of 'a remarkable schist at Gwalchmai rich in contemporaneous granoblastic pyrite'. During the drainage and groundwater surveys it was found that quartz vein structures are more common in the mglange than suggested by existing
maps; some of these veins may have been recorded as thin discontinuous
quartzite lenses by Greenly (1919). The only mineralisation known in the Carboniferous rocks consists of 'strike-veins of barytes a few inches
thick', observed by Greenly (1919) at Ffrwd-onen [SH 442 7321, Ty-calch [SH 418 7101, Ty'n-llwyn [SH 408 7011 and northwest of TY-pigyn [SH 399 6921. Similar mineralisation was recorded in Gwna Group rocks
37
close to the Carboniferous unconformity southeast of the smithy at Llangristiolus [SH 432 7281. The reconnaissance drainage results indicate that baryte mineralisation is more extensive than is inferred by these few occurrences (Cooper, Nutt and Morgan, 1982).
Basic dykes of at least two ages, pre- and post- Carboniferous, cut the succession at near right angles to the regional strike. Superficial deposits, consisting principally of boulder clay, are generally thin with numerous outcrops of solid.
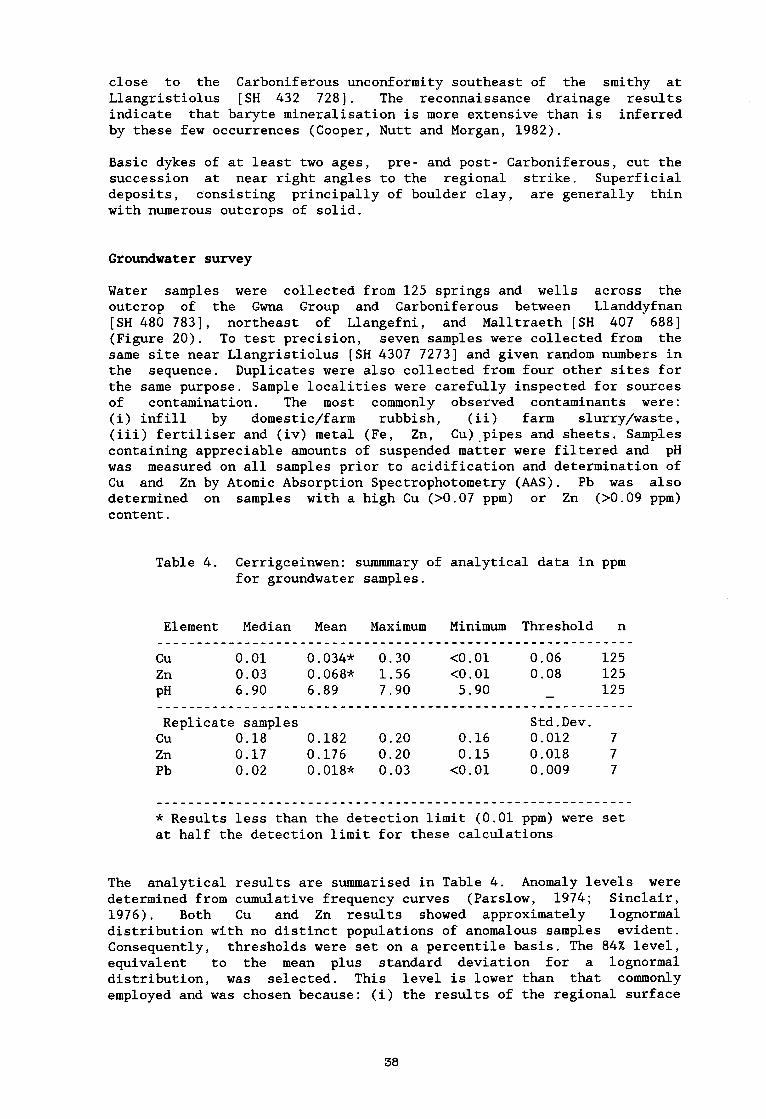
Groundwater survey
Water samples were collected from 125 springs and wells across the outcrop of the Gwna Group and Carboniferous between Llanddyfnan [SH 480 7831, northeast of Llangefni, and Malltraeth [SH 407 6881 (Figure 20). To test precision, seven samples were collected from the same site near Llangristiolus [SH 4307 72731 and given random numbers in the sequence. Duplicates were also collected from four other sites for the same purpose. Sample localities were carefully inspected for sources of contamination. The most commonly observed contaminants were: (i) infill by domestic/farm rubbish, (ii) farm slurry/waste, (iii) fertiliser and (iv) metal (Fe, Zn, Cu).pipes and sheets. Samples containing appreciable amounts of suspended matter were filtered and pH was measured on all samples prior to acidification and determination of Cu and Zn by Atomic Absorption Spectrophotometry (AAS). Pb was also determined on samples with a high Cu content.
(>0.07 ppm) or Zn (>0.09 ppm)
Table 4. Cerrigceinwen: summmary for groundwater samples
of analytical data in ppm
Element Median Mean Maximum Minimum Threshold n ____________________~~~~~~~~~~~~~~~~~~~~~~~~~~~~~~~~~~~~~~~~
cu 0.01 0.034* 0.30 <O.Ol 0.06 125 Zn 0.03 0.068-k 1.56 <O.Ol 0.08 125 PH 6.90 6.89 7.90 5.90 125 _ ____________________~~~~~~~~~~~~~~~~~~~~~ ---_---------------
Replicate samples Std.Dev. cu 0.18 0.182 0.20 0.16 0.012 7 Zn 0.17 0.176 0.20 0.15 0.018 7 Pb 0.02 0.018* 0.03 <O.Ol 0.009 7
____________________~~~~~~~~~~~~~~~~~~~~~~~~~~~~~~~~~~~~~~~~
* Results less than the detection limit (0.01 ppm) were set at half the detection limit for these calculations
The analytical results are summarised in Table 4. Anomaly levels were
determined from cumulative frequency curves (Parslow, 1974; Sinclair,
1976). Both Cu and Zn results showed approximately lognormal
distribution with no distinct populations of anomalous samples evident. Consequently, thresholds were set on a percentile basis. The 84% level, equivalent to the mean plus standard deviation for a lognormal distribution, was selected. This level is lower than that commonly employed and was chosen because: (i) the results of the regional surface
38
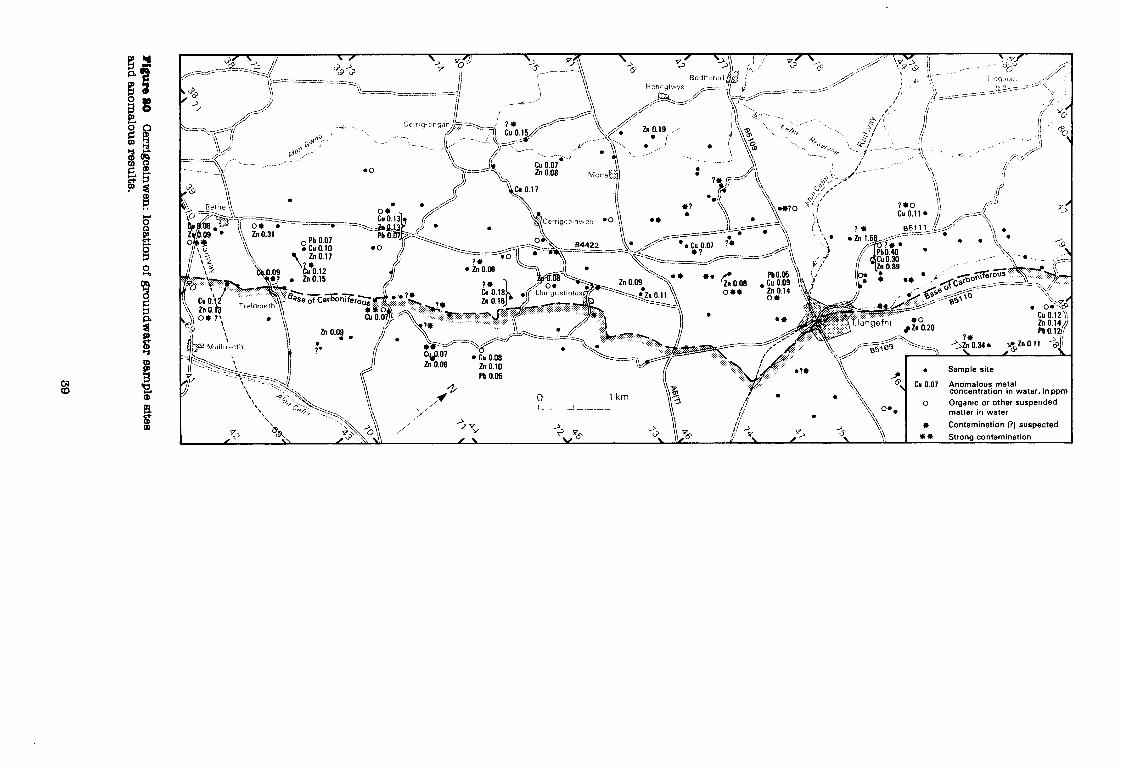
Contamination (?) suspected
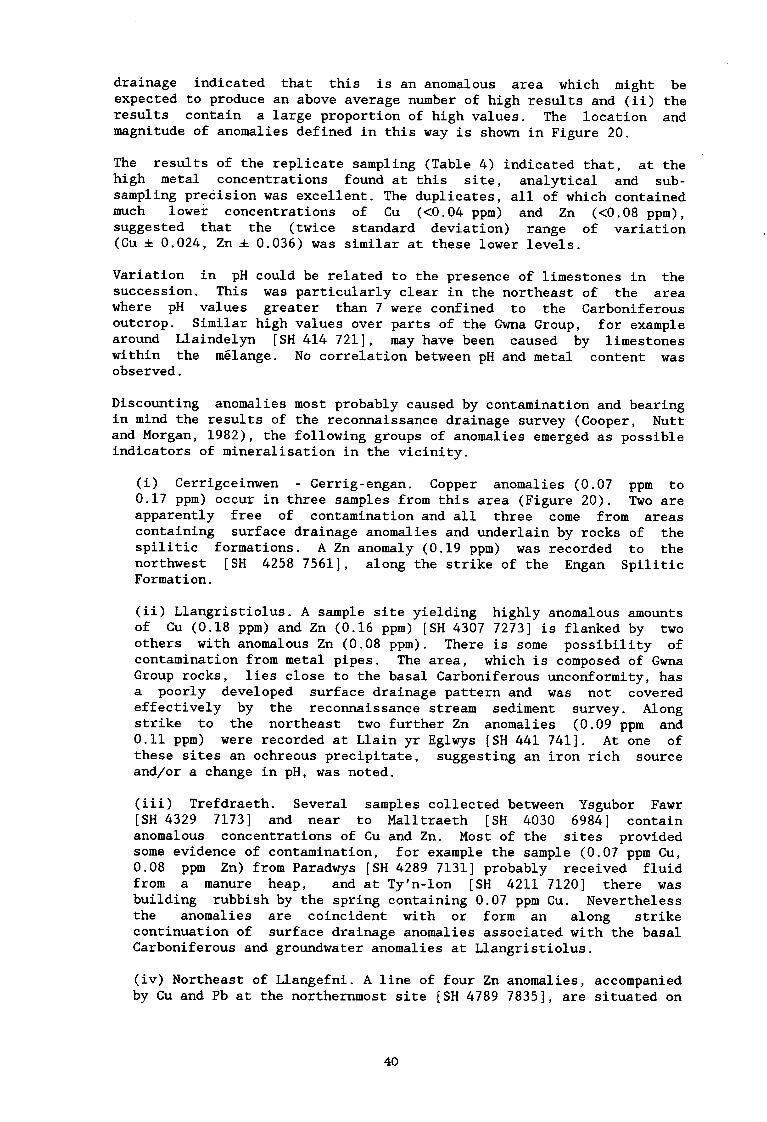
drainage indicated that this is an anomalous area which might be expected to produce an above average number of high results and (ii) the results contain a large proportion of high values. The location and magnitude of anomalies defined in this way is shown in Figure 20.
The results of the replicate sampling (Table 4) indicated that, at the high metal concentrations found at this site, analytical and sub- sampling precision was excellent. The duplicates, all of which contained much lower concentrations of Cu (<0.04 ppm) and Zn (<0.08 ppm), suggested that the (twice standard deviation) range of variation (Cu f 0.024, Zn f 0.036) was similar at these lower levels.
Variation in pH could be related to the presence of limestones in the succession. This was particularly clear in the northeast of the area where pH values greater than 7 were confined to the Carboniferous outcrop. Similar high values over parts of the Gwna Group, for example around Llaindelyn [SH 414 7211, may have been caused by limestones within the mglange. No correlation between pH and metal content was observed.
Discounting anomalies most probably caused by contamination and bearing in mind the results of the reconnaissance drainage survey (Cooper, Nutt and Morgan, 1982), the following groups of anomalies emerged as possible indicators of mineralisation in the vicinity.
(i) Cerrigceinwen - Cerrig-engan. Copper anomalies (0.07 ppm to 0.17 ppm) occur in three samples from this area (Figure 20). Two are apparently free of contamination and all three come from areas containing surface drainage anomalies and underlain by rocks of the spilitic formations. A Zn anomaly (0.19 ppm) was recorded to the northwest [SH 4258 75611, along the strike of the Engan Spilitic Formation.
(ii) Llangristiolus. A sample site yielding highly anomalous amounts of Cu (0.18 ppm) and Zn (0.16 ppm) [SH 4307 72731 is flanked by two others with anomalous Zn (0.08 ppm). There is some possibility of contamination from metal pipes. The area, which is composed of Gwna Group rocks, lies close to the basal Carboniferous unconformity, has a poorly developed surface drainage pattern and was not covered effectively by the reconnaissance stream sediment survey. Along strike to the northeast two further Zn anomalies (0.09 ppm and 0.11 ppm) were recorded at Llain yr Eglwys [SH 441 7411. At one of these sites an ochreous precipitate, suggesting an iron rich source and/or a change in pH, was noted.
(iii) Trefdraeth. Several samples collected between Ysgubor Fawr [SH 4329 71731 and near to Malltraeth [SH 4030 69841 contain anomalous concentrations of Cu and Zn. Most of the sites provided some evidence of contamination, for example the sample (0.07 ppm Cu, 0.08 ppm Zn) from Paradwys [SH 4289 71311 probably received fluid from a manure heap, and at Ty'n-lon [SH 4211 71201 there was building rubbish by the spring containing 0.07 ppm Cu. Nevertheless the anomalies are coincident with or form an along strike continuation of surface drainage anomalies associated with the basal Carboniferous and groundwater anomalies at Llangristiolus.
(iv) Northeast of Llangefni. A line of four Zn anomalies, accompanied by Cu and Pb at the northernmost site [SH 4789 78351, are situated on
40
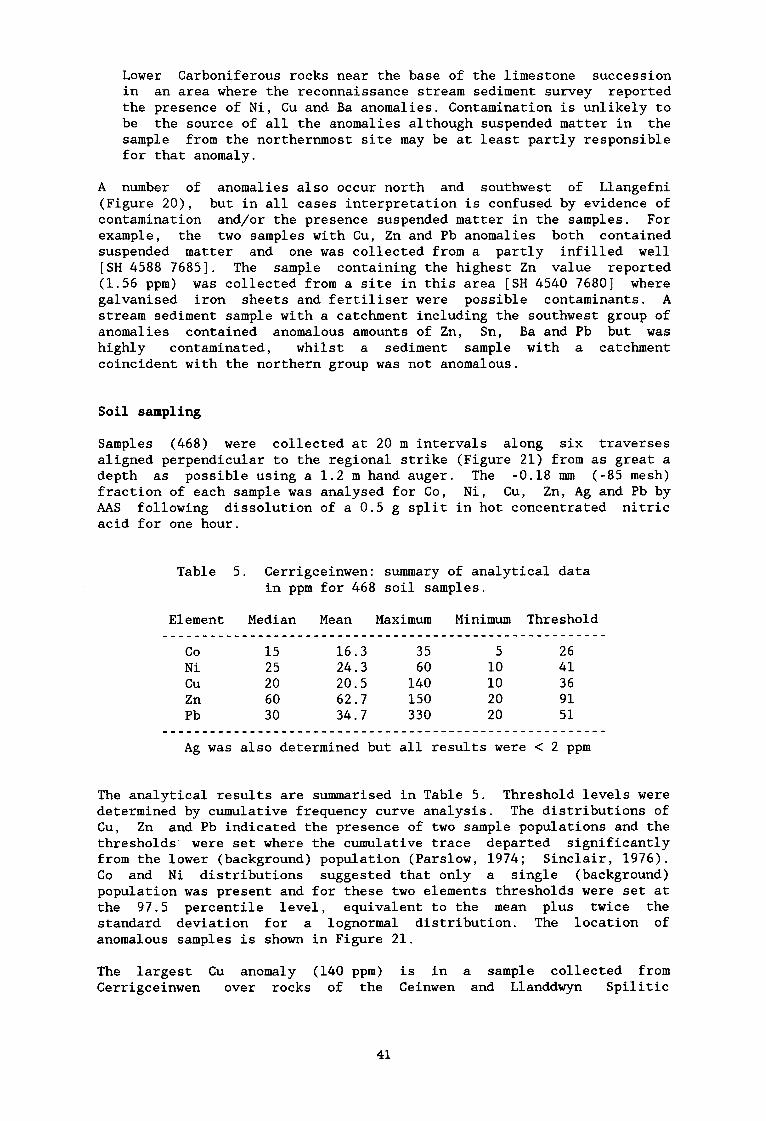
Lower Carboniferous rocks near the base of the limestone succession in an area where the reconnaissance stream sediment survey reported the presence of Ni, Cu and Ba anomalies. Contamination is unlikely to be the source of all the anomalies although suspended matter in the sample from the northernmost site may be at least partly responsible for that anomaly.
A number of anomalies also occur north and southwest of Llangefni (Figure 20), but in all cases interpretation is confused by evidence of contamination and/or the presence suspended matter in the samples. For example, the two samples with Cu, Zn and Pb anomalies both contained suspended matter and one was collected from a partly infilled well [SH 4588 76851. The sample containing the highest Zn value reported (1.56 ppm) was collected from a site in this area [SH 4540 76801 where galvanised iron sheets and fertiliser were possible contaminants. A stream sediment sample with a catchment including the southwest group of anomalies contained anomalous amounts of Zn, Sn, Ba and Pb but was highly contaminated, whilst a sediment sample with a catchment coincident with the northern group was not anomalous.
Soil sampling
Samples (468) were collected at 20 m intervals along six traverses aligned perpendicular to the regional strike (Figure 21) from as great a depth as possible using a 1.2 m hand auger. The -0.18 mm (-85 mesh) fraction of each sample was analysed for Co, Ni, Cu, Zn, Ag and Pb by AAS following dissolution of a 0.5 g split in hot concentrated nitric acid for one hour.
Table 5. Cerrigceinwen: summary of analytical data in ppm for 468 soil samples.
Element Median Mean Maximum Minimum Threshold ____________________~~~~~~~~~~~~~~~~~~~~~ -_-------------
co 15 16.3 35 5 26 Ni 25 24.3 60 10 41 cu 20 20.5 140 10 36 Zn 60 62.7 150 20 91 Pb 30 34.7 330 20 51
____________________~~~~~~~~~~ ____________________------
Ag was also determined but all results were < 2 ppm
The analytical results are summarised in Table 5. Threshold levels were determined by cumulative frequency curve analysis. The distributions of
Cu, Zn and Pb indicated the presence of two sample populations and the thresholds. were set where the cumulative trace departed significantly from the lower (background) population (Parslow, 1974; Sinclair, 1976). Co and Ni distributions suggested that only a single (background) population was present and for these two elements thresholds were set at the 97.5 percentile level, equivalent to the mean plus twice the standard deviation for a lognormal distribution. The location of anomalous samples is shown in Figure 21.
The largest Cu anomaly (140 ppm) is in a sample collected from Cerrigceinwen over rocks of the Ceinwen and Llanddwyn Spilitic
41
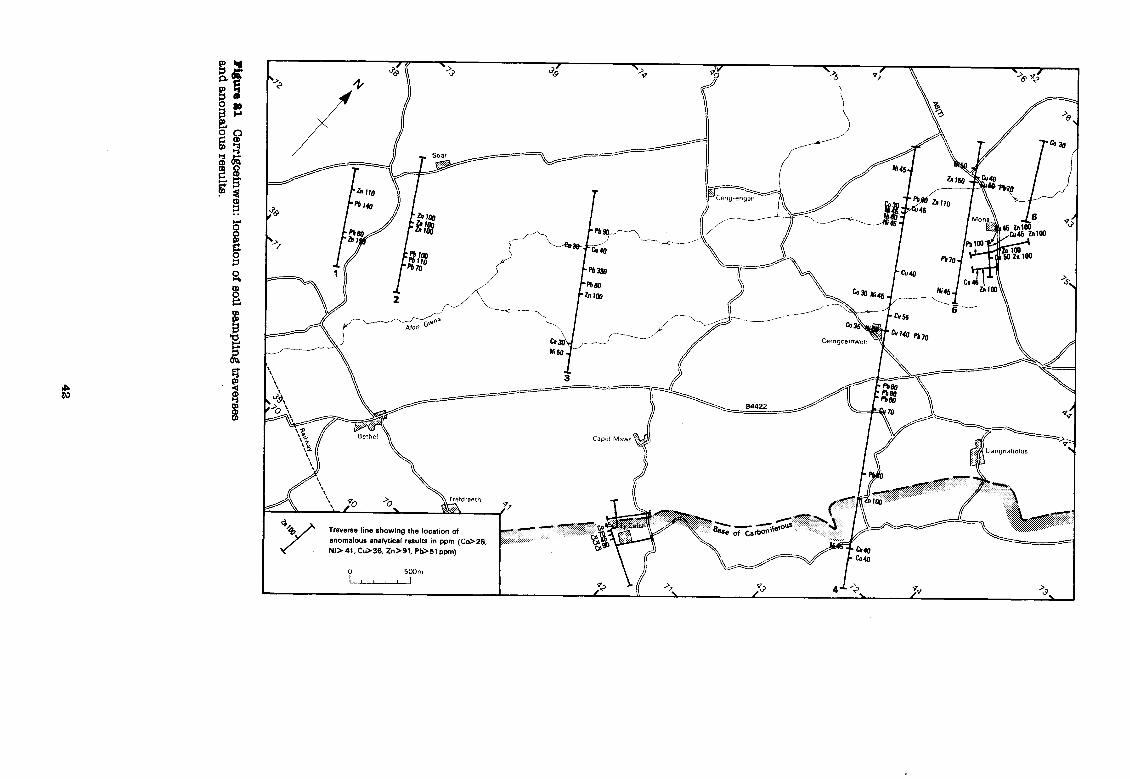
6
Traverse line showing the location of
an0mabU.S analytical resuks in ppm (CoS26,
Ni> 41, CuB3fi,Zn>gl, PI+51 ppm)
8::” Llangrlstlolus a ..: r _: : .C
Formation, about 200 m from an old trial. It is accompanied by weakly anomalous levels of Co, Ni and Pb and probably reflects metal enrichments in the rocks hereabouts. The second highest Cu anomaly
(70 ppm), which occurs on the same traverse southeast of Cerrigceinwen [SH 4275 73191, is of low magnitude and not accompanied by other metal enrichments. All other Cu anomalies are close to the threshold level (~60 ppm) and, in common with all the high Co (<35 ppm) and Ni (~60 ppm) results, are interpreted as the product of the relatively high background concentrations found in some of the lithologies (eg spilitic lavas) forming this area.
Most Pb anomalies, including all those on traverses 1 and 2, occur in organic rich samples collected from shallow depths (<0.3 m) over bedrock. They most probably represent secondary concentrations caused by the formation of organo-lead complexes. The exceptions include the largest Pb anomaly (330 ppm at [SH 4020 72521 on traverse 3). This may be related to mineralisation, particularly as quartz veining crops out in the vicinity. Some weak anomalies on traverses 4 and 5 are also in samples with a low organic content but in at least two of these cases the possible sources of Pb include contamination. The sample containing 80 ppm Pb from southwest of Llangristiolus [SH 4305 72771 was collected close to a track and buildings as well as an outcrop of quartz-veined schists, whilst the Pb anomaly on traverse 5, accompanied by Cu (50 ppm) and Zn (150 ppm) anomalies, is in a sample collected from thin soil adjacent to the A5 trunk road [SH 4215 75133. The cause of a second Zn anomaly of 150 ppm (on traverse 1 at [SH 3859 71411) is uncertain. All other Zn anomalies are near threshold (100-110 ppm) and, in common with the weak Co, Ni and Cu anomalies are attributed to normal background variation in the bedrocks, particularly the basic lavas and intrusions.
During the screening of drainage anomalies, a small number of soil samples were collected along short traverses at Ty Calch [SH 419 7111 and Mona [SH 425 7491 (Figure 21). The -0.18 mm fractions of the samples were analysed for Cu, Pb and Zn using the methods outlined above. The results did not yield any high-magnitude anomalies, but at Ty Calch a broad Cu anomaly reaching 90 ppm was identified near to an outcrop of shales in limestone. The anomalies (Figure 21) are close to the base of the Carboniferous which contains baryte veining here (Greenly, 1919). Gwna Group rocks cropping out to the northwest are sheared and contain pyrite, quartz and carbonate veins.
Conclusions
1. The groundwater survey supported and amplified the results of the reconnaissance stream sediment survey in suggesting the presence of metalliferous enrichments associated with basal Carboniferous rocks and parts of the Gwna Group.
2. Subsequent reconnaissance soil sampling did not detect any substantial metal enrichments, but only part of the area containing surface drainage and groundwater anomalies was traversed. A few of the isolated anomalies recorded may be derived from base-metal mineralisation.
43
CITY DULAS
Reconnaissance geochemical (soil) and geophysical (IP) surveys were carried out to gain more information on the extent of base-metal mineralisation in this area (Figure l), where the geological setting, the geochemical drainage survey data and reports of old mine workings all suggested some mineral potential.
Geology and mineralisation
The area lies on the southeast side of the Deri inlier (Greenly, 1919). The inlier is composed of quartz mica schists and granitic rocks, and is surrounded by an Ordovician succession dominated by dark grey siltstones and mudstones. To the southeast the Ordovician rocks are overlain unconformably by an Old Red Sandstone (Devonian) succession of yellow, red and purple conglomerates, sandstones and concretionary siltstones with intercalations of concretionary limestones and dolomites (Greenly, 1919; Allen, 1965). Basic intrusions cut the Ordovician rocks and two are exposed in the Afon Goch southwest of City Dulas (Greenly, 1919). Superficial deposits, dominated by boulder clay, cover most of the area. Generally narrow strips of alluvium contaminated by mine waste from Parys Mountain are found in the valley of the Afon Goch. About a kilometre to the northwest of this area the boulder clay is enriched in base metals due to the presence of mineralised material from Parys Mountain (Urquidi Barrau, Unpublished PhD thesis, University of London, 1973).
The presence of old mine workings for Pb and Ba at City Dulas was mentioned by Greenly (1919) and Lewis (1967). Papers in the Lligwy Estate archives (University College Library, Bangor) record the presence of three east-west striking lodes containing Pb and a north-south baryte vein (Figure 22). The southern two Pb lodes are said to dip southwards. The only remains of the workings now evident are a possible overgrown tip [SH 4691 87411 and a blocked adit [SH 4698 87551.
Sediment samples collected from streams crossing this area are contaminated by material from Parys Mountain but, in addition to the base-metal anomalies expected from this source, the samples collected from the Afon Goch [SH 4700 87451 and a tributary [SH 4688 87561 at City Dulas were rich in barium. Mineralogical examination of the latter sample showed that it contained baryte, although it was collected upstream of the reported position of the north-south baryte lode. A local source of baryte is probable as barium levels in streams draining the Parys mineralisation are generally not anomalous and large barium anomalies are not repeated in samples collected further upstream (eg at [SH 4650 88461, [SH 4668 88541 and [SH 4610 86801). A local source of base-metals may also be present but any contribution to these drainage samples from such a source would be obscured by the Parys Mountain material (Cooper, Nutt and Morgan, 1982).
Soil sampling
Soil samples (93) were collected at 20 m intervals along four north-
south traverses from as great a depth as possible using a 1.2 m hand auger (Figure 22). A 0.5 g sub-sample of the -0.18 mm (-85 mesh)
4-4
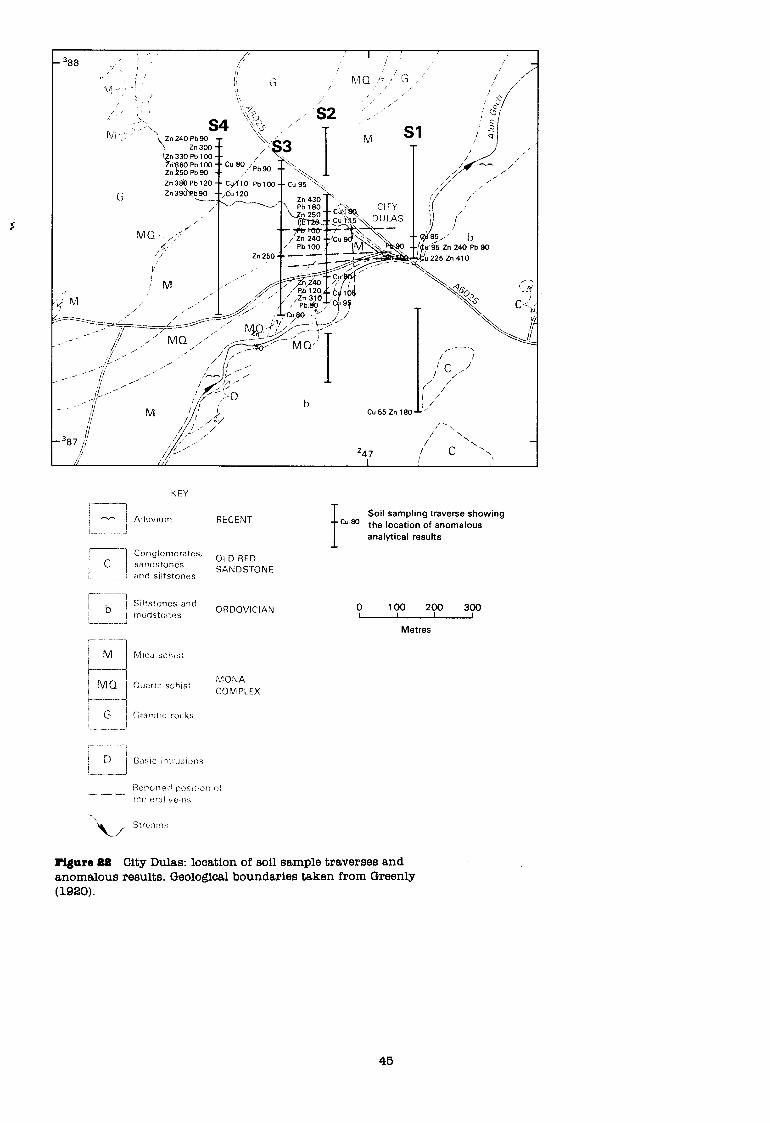
r
/ , ” MQ /’
L,
M Cu55Zt-1180
f ‘II / ‘\ /’
\ \ 247
: c ‘I\ -
!
KEY s------------- - ,
i - ; A~luvrum
.-----__’
~_
RECENT Soil sampling traverse showing
‘” cm the location of anomalous analytical results
; c Conglomerates, si3ndstone.s
OLD RED
I-_._ ___ atlrl SlltStoneS SANDSTONE
I;--- I----l
/ b i Siltstones and j nNtistones
ORDOVICIAN 0 100 200 300
Metres
MOlUA COMPLEX
Figure IBIB City Dulas: location of soil sample traverses and anomalous results. Geological boundaries taken from Greenly (1920).
45
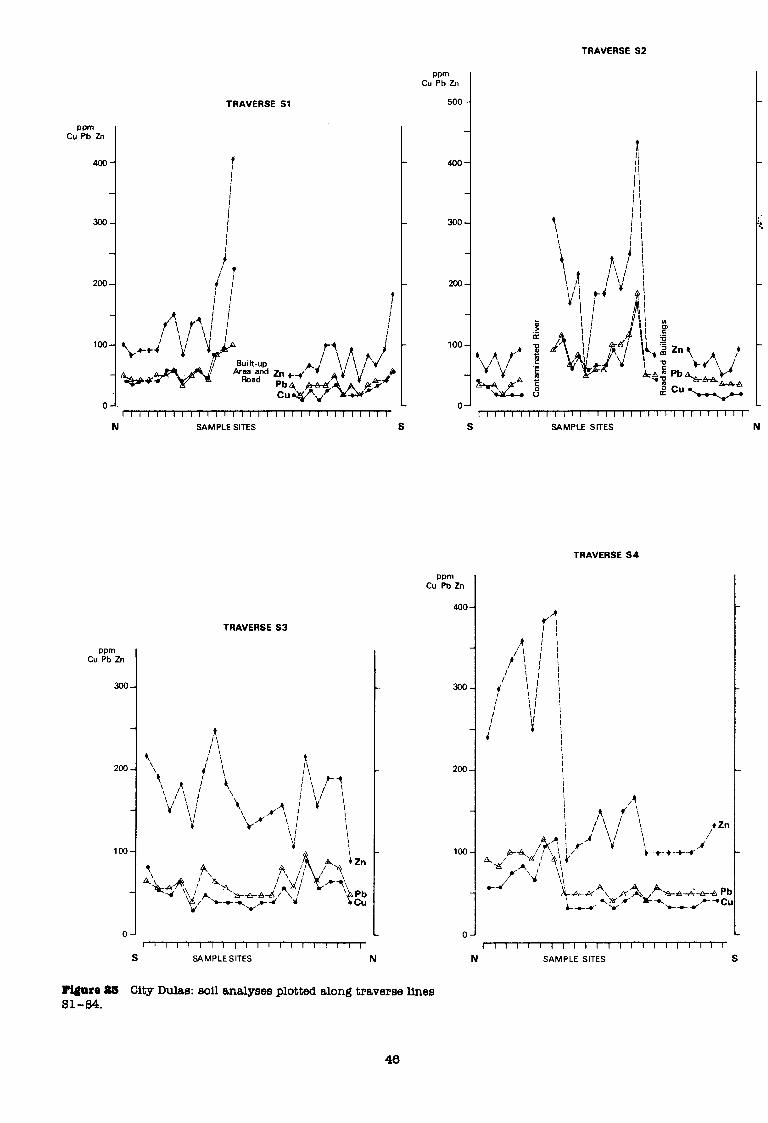
TRAVERSE 52
mm Cu Pb Zn
TRAVERSE Sl
pm Cu Pb Zn
400-
300-
200 -
loo-
n-r I I I 111 1 I I I I I I I l III I I I I l l I I l I I1 I l
N SAMPLE SITES
pm Cu Pb 2n
II I I I I I I I I I I I I I I I I I I
TRAVERSES3
500 -
400-
300 -
200-
100-
Pm Cu Pb Zn
400
300
200
100
0
S SAMPLE SITES N
S SAMPLE SITES N
Hgure 8b City Dulas: soil analyses plotted along traverse lines 51-84.
TRAVERSE S4
II I l I j Ill II I I I 11 l 11 1 l ’
N SAMPLE SITES S
40
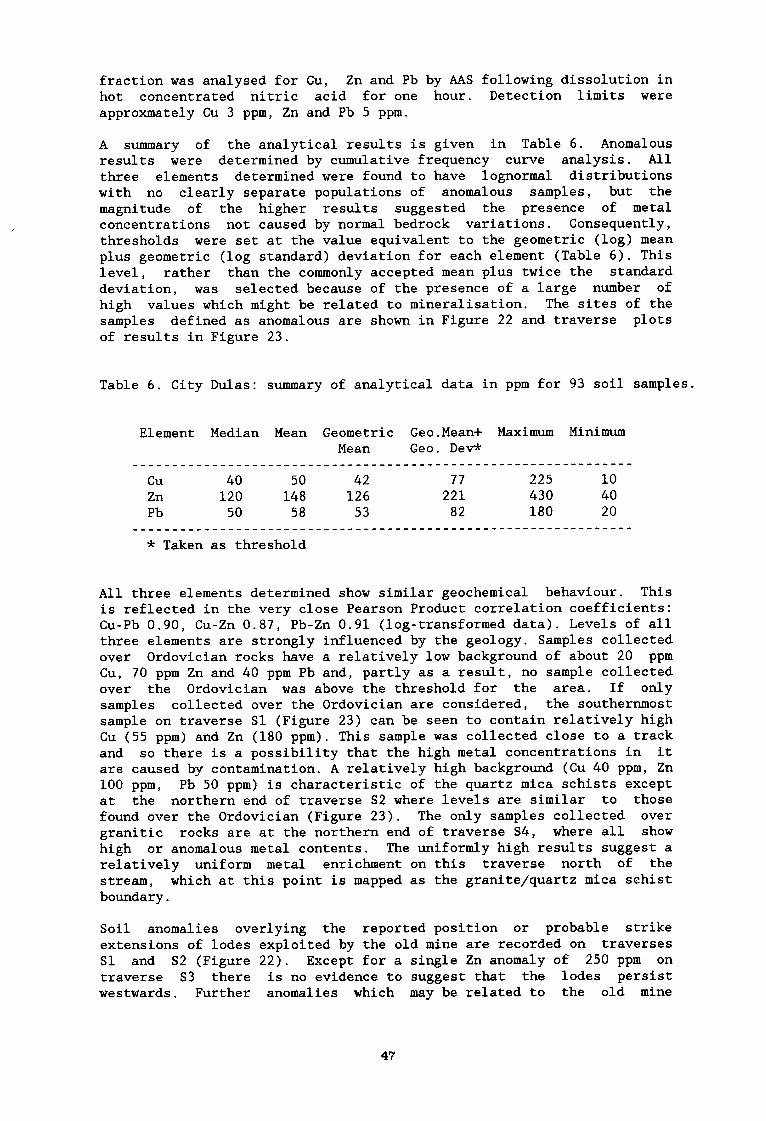
fraction was analysed for Cu, Zn and Pb by AAS following dissolution in hot concentrated nitric acid for one hour. Detection limits were approxmately Cu 3 ppm, Zn and Pb 5 ppm.
A summary of the analytical results is given in Table 6. Anomalous results were determined by cumulative frequency curve analysis. All three elements determined were found to have lognormal distributions with no clearly separate populations of anomalous samples, but the magnitude of the higher results suggested the presence of metal concentrations not caused by normal bedrock variations. Consequently, thresholds were set at the value equivalent to the geometric (log) mean plus geometric (log standard) deviation for each element (Table 6). This level, rather than the commonly accepted mean plus twice the standard deviation, was selected because of the presence of a large number of high values which might be related to mineralisation. The sites of the samples defined as anomalous are shown in Figure 22 and traverse plots of results in Figure 23.
Table 6. City Dulas: summary of analytical data in ppm for 93 soil sample S.
Element Median Mean Geometric Geo.Mean+ Maximum Minimum Mean Geo. Dev*
____________________~~~~~~~~~~~~~~~~~~~~~~~~~~~~~~~~ _--_-_----- cu 40 50 42 77 225 10 Zn 120 148 126 221 430 40 Pb 50 58 53 82 180 20
___________________~~~~~~~~~~~~~~~~~~~ ____________________-----
* Taken as threshold
All three elements determined show similar geochemical behaviour. This is reflected in the very close Pearson Product correlation coefficients: Cu-Pb 0.90, Cu-Zn 0.87, Pb-Zn 0.91 (log-transformed data). Levels of all three elements are strongly influenced by the geology. Samples collected over Ordovician rocks have a relatively low background of about 20 ppm Cu, 70 ppm Zn and 40 ppm Pb and, partly as a result, no sample collected over the Ordovician was above the threshold for the area. If only samples collected over the Ordovician are considered, the southernmost sample on traverse Sl (Figure 23) can be seen to contain relatively high Cu (55 ppm) and Zn (180 ppm). This sample was collected close to a track and so there is a possibility that the high metal concentrations in it are caused by contamination. A relatively high background (Cu 40 ppm, Zn 100 ppm, Pb 50 ppm) is characteristic of the quartz mica schists except at the northern end of traverse S2 where levels are similar to those found over the Ordovician (Figure 23). The only samples collected over granitic rocks are at the northern end of traverse S4, where all show high or anomalous metal contents. The uniformly high results suggest a relatively uniform metal enrichment on this traverse north of the stream, which at this point is mapped as the granite/quartz mica schist boundary.
Soil anomalies overlying the reported position or probable strike extensions of lodes exploited by the old mine are recorded on traverses Sl and S2 (Figure 22). Except for a single Zn anomaly of 250 ppm on traverse S3 there is no evidence to suggest that the lodes persist westwards. Further anomalies which may be related to the old mine
47
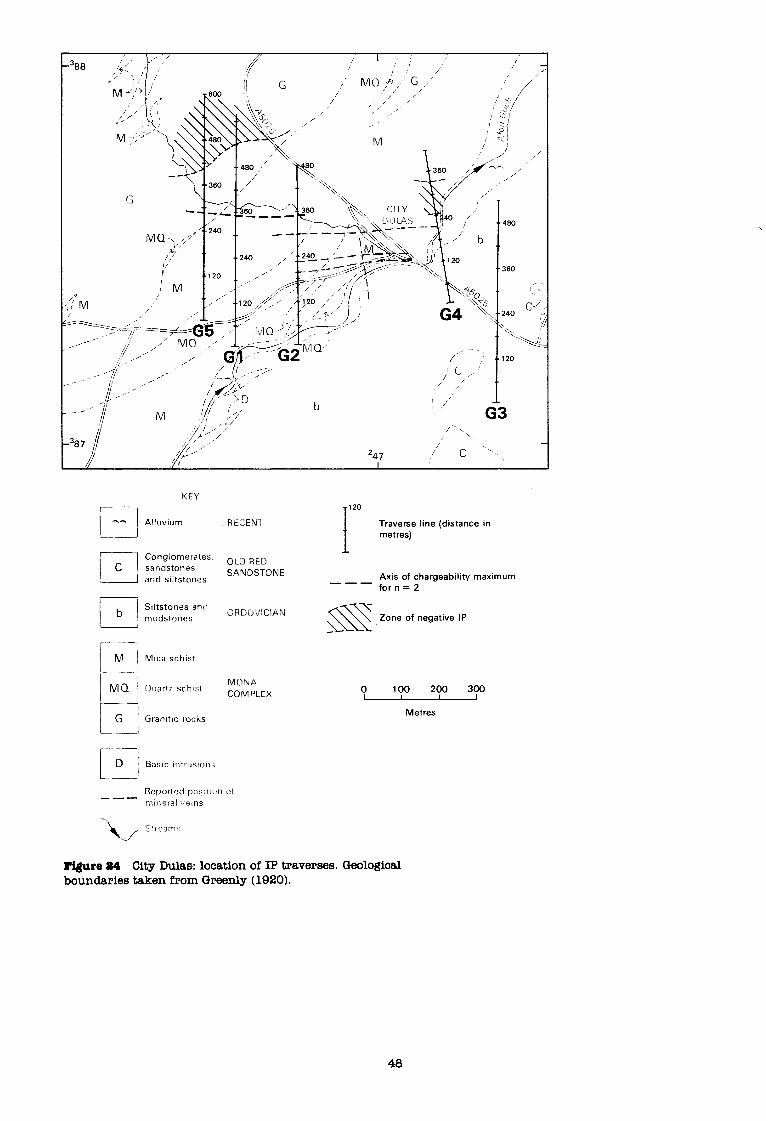
KEY
l------
l Ah /
Alluvium RECENll I -J
Conglomerates, *LO RED sandstones
.__._! and slltstones SANDSTONF
! M I
! M~c;t schist
-II
!-- I MQ oucirtz schist MONA
/,/ Granltrc rocks
COMPLCX
I 120
Traverse line (distance in metres)
Axis of chargeability maximum --- for t-t= 2
7’ a l-
Zone of negative IP
0 100 200 300
Metres
?igure 84 City Dulas: location of Ip traverses. Geological boundaries taken from Greenly (1920).
48
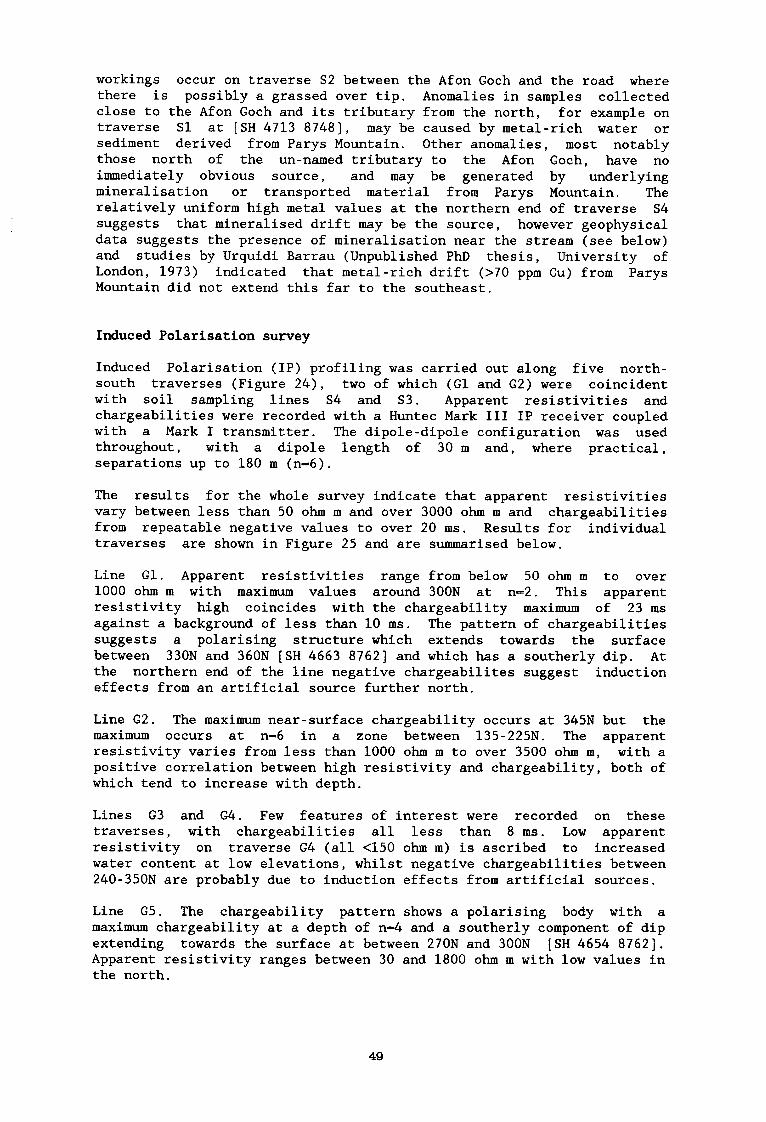
workings occur on traverse S2 between the Afon Goch and the road where there is possibly a grassed over tip. Anomalies in samples collected close to the Afon Goch and its tributary from the north, for example on traverse Sl at [SH 4713 87481, may be caused by metal-rich water or sediment derived from Parys Mountain. Other anomalies, most notably those north of the un-named tributary to the Afon Goch, have no immediately obvious source, and may be generated by underlying mineralisation or transported material from Parys Mountain. The relatively uniform high metal values at the northern end of traverse S4 suggests that mineralised drift may be the source, however geophysical data suggests the presence of mineralisation near the stream (see below) and studies by Urquidi Barrau (Unpublished PhD thesis, University of London, 1973) indicated that metal-rich drift (>70 ppm Cu) from Parys Mountain did not extend this far to the southeast.
Induced Polarisation survey
Induced Polarisation (IP) profiling was carried out along five north- south traverses (Figure 24), two of which (Gl and G2) were coincident with soil sampling lines S4 and S3. Apparent resistivities and chargeabilities were recorded with a Huntec Mark III IP receiver coupled with a Mark I transmitter. The dipole-dipole configuration was used throughout, with a dipole length of 30 m and, where practical, separations up to 180 m (n-6).
The results for the whole survey indicate that apparent resistivities vary between less than 50 ohm m and over 3000 ohm m and chargeabilities from repeatable negative values to over 20 ms. Results for individual traverses are shown in Figure 25 and are summarised below.
Line Gl. Apparent resistivities range from below 50 ohm m to over 1000 ohm m with maximum values around 300N at n=2. This apparent resistivity high coincides with the chargeability maximum of 23 ms against a background of less than 10 ms. The pattern of chargeabilities suggests a polarising structure which extends towards the surface between 330N and 360N [SH 4663 87621 and which has a southerly dip. At the northern end of the line negative chargeabilites suggest induction effects from an artificial source further north.
Line G2. The maximum near-surface chargeability occurs at 345N but the maximum occurs at n=6 in a zone between 135-225N. The apparent resistivity varies from less than 1000 ohm q to over 3500 ohm m, with a positive correlation between high resistivity and chargeability, both of which tend to increase with depth.
Lines G3 and G4. Few features of interest were recorded on these traverses, with chargeabilities all less than 8 ms. Low apparent resistivity on traverse G4 (all <150 ohm m) is ascribed to increased water content at low elevations, whilst negative chargeabilities between 240-350N are probably due to induction effects from artificial sources.
Line G5. The chargeability pattern shows a polarising body with a maximum chargeability at a depth of n-4 and a southerly component of dip extending towards the surface at between 270N and 300N [SH 4654 87621. Apparent resistivity ranges between 30 and 1800 ohm m with low values in the north.
49
Gl
Apparent Resistivity Chargeability
0 60 120 180 246 300 360 420 480 540 600mN 0 60 120 180 240 300 360 420 480 540 600mN IL I I1 I I I I I I I I I I I I k Il_J
G2
Apparent Resistivity
0 60 120 180 240 300 360 420 48OmN I 1 II 11 11 11 11 (1 ’ 10
G3 Apparent Resistivity Chargeability
r , I I, I 81 I I1 1 I I I I t I 4 6 8 10 12 14
": 2v
18 12s
mtllisecs
0 60 120 180 240 300 360 420 480 54OmN L I II a 11 11 11 11 11 11 18
G4
Apparent Resistivity I I I I I I II I I I I II f
2 4 8 8 10 12 14 s
0 60 120 180 240 300 360 420mN 11 II 11 11 fi 1 ” 11 I
G5
Apparent Resistivity
S2m
Chargeability
0 60 120 180 240 300 360 420 480mN I b I( 11 11 11 11 11 11 1
Chargeability
0 60 120 180 240 300 360 420mN L 1 1 B t I I I I I I I I I 1
Chargeability
0 60 120 180 240 300 380 420 480 540 600mN 0 60 120 180 240 300 360 420 480 546 6OOmN II I * 11 10 11 11 11 11 11 fl 1 I II I( fi 1 * 11 8 I $1 II 1 I k 11 I
lrigure 88 City Dulas: IP pseudo-sections for traverses Gtl-(35 (Fi$ure 24).
50
Discussion
Apparent resistivity variations are mostly the result of changes in
bedrock lithology, pore water conductivity, degree of rock saturation and the effects of a non-homogeneous overburden. Generally, apparent resistivity tends to decrease as elevation decreases and this is ascribed to saturation variation. There is also a correlation between elevation and high conductivity overburden which will increase this effect.
No strong chargeability features were detected coincident with the reported position of the lodes exploited by City Dulas mine. However,
chargeability anomalies on geophysical traverses Gl, G2 and G5 suggest
the presence of an east-west trending, southerly dipping mineralised structure to the north, whose surface extension is nearly coincident
with a stream course (Figure 7). The tendency for chargeability maxima to be located at depth suggests that the source is not within over- burden. The westward extension of the zone is not defined but it apparently does not extend as far east as traverse G4. The strike and
direction of dip of the chargeability anomaly is the same as that
reported for two of the lodes in City Dulas mine and it is therefore possible that this anomaly reflects a similar structure, perhaps carrying mineralisation with different physical properties.
No geochemical anomalies were recorded on soil lines S3 and S4 (coincident with geophysics lines G2 and Gl) where they cross the IP
anomaly. The reasons for this are unclear. There are several
possibilities including: (i) the mineralised structure picked up by the IP survey may not reach the surface; (ii) the chargeability anomaly may be produced by a pyritic zone; and (iii) the mineralisation may be masked by superficial deposits. There is also a more general lack of spatial correlation between soil anomalies and geophysical features. This is probably due in part to geophysical features that are not related to mineralisation, but may also be caused by soil anomalies that are (i) transported, (ii) the product of contamination from the Afon Goch or old mine workings or (iii) recording mineralisation that does not generate chargeability anomalies. Further work, such as deep profile
soil sampling, would be required to resolve these uncertainties.
Conclusions
1. IP profiling has outlined an east-west southerly dipping zone of high chargeability which may be caused by the presence of a mineralised structure with the same orientation as the veins exploited for Pb by the old City Dulas mine. There are several possible reasons for the absence of coincident base-metal anomalies in soils.
2. The source of Cu, Zn and Pb anomalies in the area is uncertain. Some are probably related to the known mineralisation and its exploitation whilst some others may be the product of contamination from Parys Mountain. These sources are possibly masking anomalies derived from
undiscovered mineralisation in the vicinity.
51
LLANBADRIG
The reassessment of the geology and known mineralisation on Anglesey indicated that, like the northwest corner of Anglesey (Cooper, Nutt, Smith and Easterbrook, 1989), this area might contain 'group (b)', ie 'Parys Mountain type', mineralisation. The reconnaissance-scale geo- chemical drainage survey data provided little information on this area because of the poorly developed surface drainage pattern, but a brief field examination of the geology confirmed it's potential. A geochemical groundwater survey followed by traverse-based reconnaissance soil sampling and geophysical (IP and EM) work was carried out to look for evidence of buried mineralisation, but the work programme was curtailed by changing priorities.
Geology and mineralisation
The area consists of a series of east-west trending outliers of Ordovician rocks within the Bedded Succession (Gwna and Skerries groups) of the Mona Complex (Figure 27). The best described of these outliers is called the Gynfor outlier (Greenly, 1919; Bates, 1972; Barber and Max, 1979) from its well exposed coastal outcrop at Ogof Gynfor [SH 378 9481. The Ordovician rocks, which are locally altered (silicified) and disrupted by faults and thrusts, comprise an Arenig to Caradocian succession of conglomerates, grits, sandstones, mudstones and oolitic ironstone (Bates, 1972). The underlying Bedded Succession consists of a mglange, with prominent limestone and quartzite rafts and blocks, belonging to the Gwna Group of Greenly (1919) and a succession of greywackes and tuffs termed by Greenly (1919) the Skerries Group. Like northwest Anglesey (Cooper, Nutt, Smith and Easterbrook, 1989), the relationship between the Ordovician rocks and the Bedded Succession in this area is open to reinterpretation. Elsewhere on Anglesey the junction may be unconformable but in this area Barber and Max (1979) concluded that 'the deposition of the Gwna Group continued into the overlying Ordovician without any significant sedimentary, tectonic or metamorphic break'; features with which we would concur. Structurally, the area is dominated by large-scale synclinal and anticlinal folds, much broken by faults and thrusts. The folds are asymmetrical with the southern limbs of synclines gently dipping and the northern limbs steep or overturned (Barber and Max, 1979). Superficial deposits are generally thin but hollows between rocky ridges are partly infilled by boulder clay and, locally, alluvium.
The area contains several abandoned mine workings and trials for Cu with Zn or Pb (Figure 26). Some of these are associated with the Ordovician outliers, notably at Pantygaseg [SH 412 9451 where sphalerite and chalcopyrite in a quartz and siderite gangue have been worked from close to the junction of silicified Ordovician and Gwna Group grits and pelites, and the Dinorben workings at Ogof Gynfor [SH 379 9481. Reports of workings attributed to Dinorben are also located near Bryn-y-neuadd [SH 378 9411, Tyddyn Rhydderch [SH 381 9421 and Isallt [SH 384 9471. Other named mines in the area, both worked for Cu in the Bedded Succession, are Hell's Mouth (at [SH 393 9481 and [SH 394 9461) and Bull Bay (at [SH 421 9421, [SH 424 9461 and [SH 418 9431). Trials and unnamed workings for Cu are located at Porth Adfan [SH 400 9491, Porth Pridd [SH 409 9471 and Pilwrn [SH 412 9331 (Cooper, Nutt and Morgan, 1982).
52
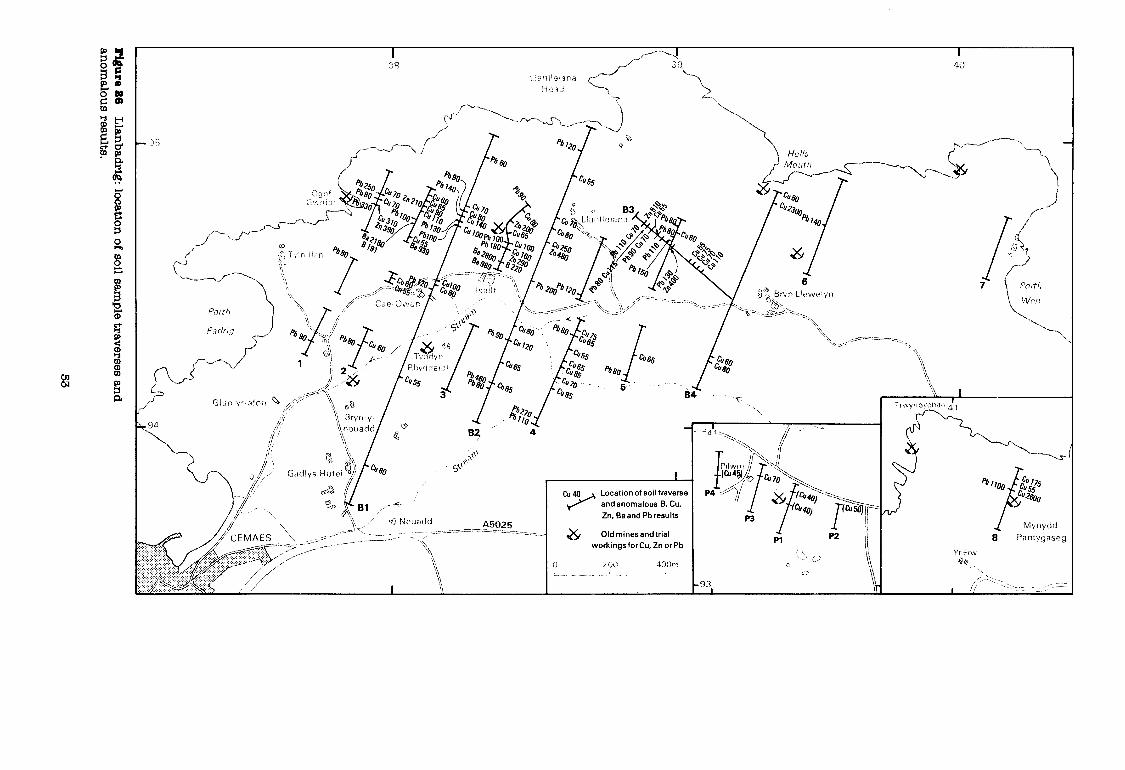
cu 40 A Location of soil traverse
‘Yp \ f&j, B1 ,i Y ,,<- ’ T and anomalous 6, Cu.
\ I \ \\ c’] Nouadd
Zn, Ba and Pb results
A5025 & Old mines and trial
workings for Cu, Zn or Pb
230 4ahl _ .x ““.._.” - -_ I
1 P2
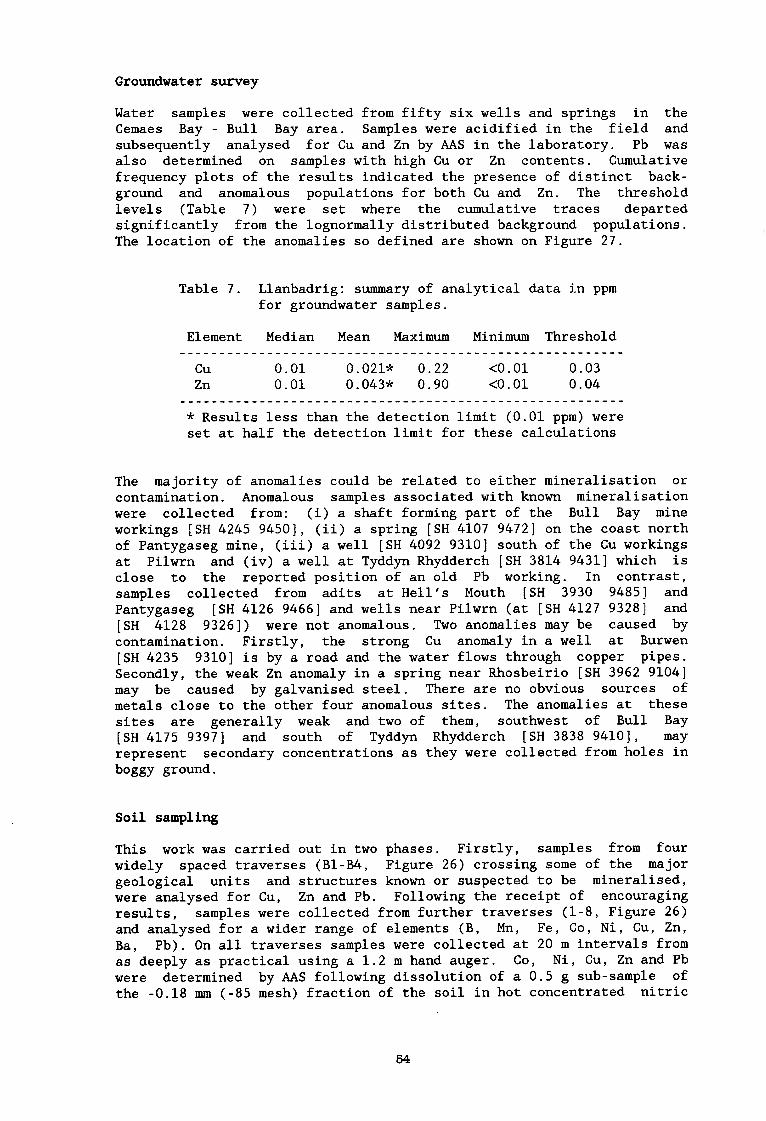
Groundwater survey
Water samples were collected from fifty six wells and springs in the Cemaes Bay - Bull Bay area. Samples were acidified in the field and subsequently analysed for Cu and Zn by AAS in the laboratory. Pb was also determined on samples with high Cu or Zn contents. Cumulative frequency plots of the results indicated the presence of distinct back- ground and anomalous populations for both Cu and Zn. The threshold levels (Table 7) were set where the cumulative traces departed significantly from the lognormally distributed background populations. The location of the anomalies so defined are shown on Figure 27.
Table 7. Llanbadrig: summary of analytical data in ppm for groundwater samples.
Element Median Mean Maximum Minimum Threshold ____________________~~~~~~~~~~~~~~~~~~~~~~~~~~~~~~~~~~~~
cu 0.01 0.0216: 0.22 <O.Ol 0.03 Zn 0.01 0.043* 0.90 co.01 0.04
____________________~~~~~~~~~~~~~~~~~~~~~~~~~~~~~~~~~~-~
* Results less than the detection limit (0.01 ppm) were set at half the detection limit for these calculations
The majority of anomalies could be related to either mineralisation or contamination. Anomalous samples associated with known mineralisation
were collected from: (i) a shaft forming part of the Bull Bay mine
workings [SH 4245 94501, (ii) a spring [SH 4107 94721 on the coast north of Pantygaseg mine, (iii) a well [SH 4092 93101 south of the Cu workings at Pilwrn and (iv) a well at Tyddyn Rhydderch [SH 3814 94311 which is close to the reported position of an old Pb working. In contrast,
samples collected from adits at Hell's Mouth [SH 3930 94851 and Pantygaseg [SH 4126 94661 and wells near Pilwrn (at [SH 4127 93281 and [SH 4128 93261) were not anomalous. Two anomalies may be caused by
contamination. Firstly, the strong Cu anomaly in a well at Burwen [SH 4235 93101 is by a road and the water flows through copper pipes. Secondly, the weak Zn anomaly in a spring near Rhosbeirio [SH 3962 91041 may be caused by galvanised steel. There are no obvious sources of metals close to the other four anomalous sites. The anomalies at these
sites are generally weak and two of them, southwest of Bull Bay
[SH 4175 93971 and south of Tyddyn Rhydderch [SH 3838 94101, may represent secondary concentrations as they were collected from holes in boggy ground.
Soil sampling
This work was carried out in two phases. Firstly, samples from four
widely spaced traverses (Bl-B4, Figure 26) crossing some of the major
geological units and structures known or suspected to be mineralised,
were analysed for Cu, Zn and Pb. Following the receipt of encouraging
results, samples were collected from further traverses (l-8, Figure 26) and analysed for a wider range of elements (B, Mn, Fe, Co, Ni, Cu, Zn,
Ba, Pb). On all traverses samples were collected at 20 m intervals from as deeply as practical using a 1.2 m hand auger. Co, Ni, Cu, Zn and Pb
were determined by AAS following dissolution of a 0.5 g sub-sample of the -0.18 mm (-85 mesh) fraction of the soil in hot concentrated nitric
54
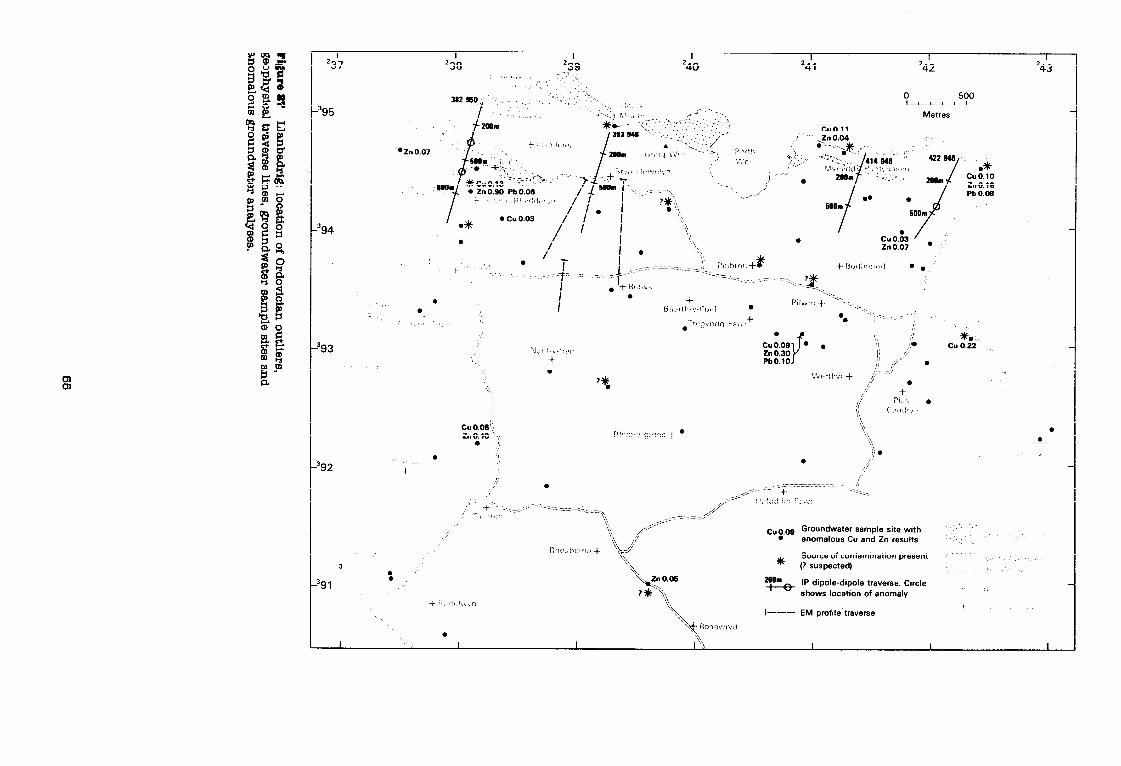
I
237 I I I
238 239 240 I
241 I I
242 243 j .I / ‘,I \ *_ ‘, ‘. ‘\
394
393
L%er? tryr + ,‘, ’
::
;;;’ +.
P ’ $1, l
C” 0.05!. Zn0.10 ‘9
l *l
)92
, \‘ /- _ 1 - ’ -.*
(I\.(
cue o9 Groundwater sample site with l ’ anomalous Cu and Zn results
I : _ _
R I : 0 :r t, c I r I 0 + Source of contamination present
3 * (? suspected) l
391 l 2oom c IP dipole-dipole traverse. Circle :
shows location of anomaly $ I(\ s !I 1:~ b n -v
I--- EM profrle traverse
I l
I I I I I
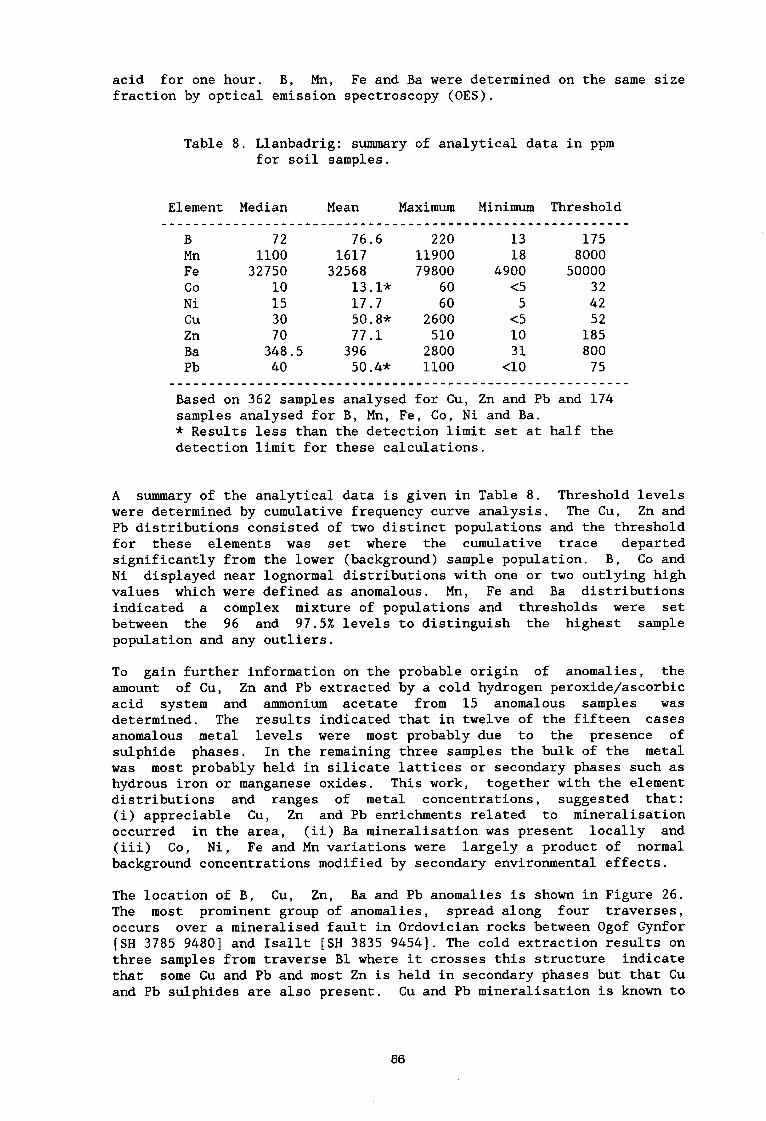
acid for one hour. B, Mn, Fe and Ba were determined on the same size fraction by optical emission spectroscopy (OES).
Table 8. Llanbadrig: summary of analytical data in ppm for soil samples.
Element Median Mean Maximum Minimum Threshold ___________ ____________________~~~~~~~~~~~ ,_________ _______
B 72 76.6 220 13 175 Mn 1100 1617 11900 18 8000 Fe 32750 32568 79800 4900 50000 co 10 13.1-k 60 <5 32 Ni 15 17.7 60 5 42 cu 30 50.8* 2600 <5 52 Zn 70 77.1 510 10 185 Ba 348.5 396 2800 31 800 Pb 40 50.4* 1100 cl0 75
____________________~~~~~~~~~~~~~~~~~~~~~~~~~~~~~~~~~~~~~~
Based on 362 samples analysed for Cu, Zn and Pb and 174 samples analysed for B, Mn, Fe, Co, Ni and Ba. * Results less than the detection limit set at half the detection limit for these calculations.
A summary of the analytical data is given in Table 8. Threshold levels were determined by cumulative frequency curve analysis. The Cu, Zn and Pb distributions consisted of two distinct populations and the threshold for these elements was set where the cumulative trace departed significantly from the lower (background) sample population. B, Co and Ni displayed near lognormal distributions with one or two outlying high values which were defined as anomalous. Mn, Fe and Ba distributions indicated a complex mixture of populations and thresholds were set
between the 96 and 97.5% levels to distinguish the highest sample population and any outliers.
To gain further information on the probable origin of anomalies, the
amount of cu, Zn and Pb extracted by a cold hydrogen peroxide/ascorbic acid system and ammonium acetate from 15 anomalous samples was
determined. The results indicated that in twelve of the fifteen cases anomalous metal levels were most probably due to the presence of sulphide phases. In the remaining three samples the bulk of the metal was most probably held in silicate lattices or secondary phases such as hydrous iron or manganese oxides. This work, together with the element
distributions and ranges of metal concentrations, suggested that: (i) appreciable Cu, Zn and Pb enrichments related to mineralisation occurred in the area, (ii) Ba mineralisation was present locally and (iii) Co, Ni, Fe and Mn variations were largely a product of normal background concentrations modified by secondary environmental effects.
The location of B, Cu, Zn, Ba and Pb anomalies is shown in Figure 26. The most prominent group of anomalies, spread along four traverses,
occurs over a mineralised fault in Ordovician rocks between Ogof Gynfor [SH 3785 94801 and Isallt [SH 3835 94541. The cold extraction results on three samples from traverse Bl where it crosses this structure indicate
that some Cu and Pb and most Zn is held in secondary phases but that Cu and Pb sulphides are also present. Cu and Pb mineralisation is known to
56
be associated with this structure and was exploited at the Dinorben Mine on the coast [SH 379 9481 and north of Isallt [SH 384 9471 (Cooper, Nutt and Morgan, 1982). These soil results suggest that the mineralisation is more extensive than indicated by the old workings and that, besides Cu, Zn and Pb, Ba mineralisation is present on the southern side of the structure. The main mineralisation at Ogof Gynfor occurs at a faulted contact between dark Ordovician mudstone and a pebbly conglomeratic sandstone rich in silica, a situation similar to 'group b' mineralised settings elsewhere on Anglesey (Cooper, Nutt, Smith and Easterbrook, 1989).
Two other anomalies are connected with known mineralisation: near Hell's Mouth (Greenly, 1919) on traverse B4 [SH 3935 94821 and at Mynydd Pantygaseg (Greenly, 1919) on traverse 8 [SH 4122 94541. Other anomalies which may be related to underlying mineralisation overlie schists and limestones of the Gwna Group east of Llanlleina at the northwest end of traverse B3 [SH 3890 94701, near Cae Owen on traverses Bl and 2 [SH 381 9451, east of Gadlys Hotel on traverse Bl [SH 3791 93871 and east of Tyddyn Rhydderch on traverse B2 at [SH 3836 94151. The ground conditions and results of the cold extraction analyses suggest that the cu and Zn anomalies southwest of Llanlleina on traverse B2 [SH 3857 94701 and on traverse 4 are at least in part the product of secondary concentration processes. The cold extraction analyses also suggest that the weak Cu anomalies on traverse Bl to the southwest of Tyddyn Rhydderch [SH 3803 94171 and on B3 to the northwest of Bryn Llewelyn [SH 3909 94551 are secondary concentrations. The latter group, however, is located close to a fault, mapped from Hell's Mouth to Tyddyn Rhydderch, which may be the source from where the copper has migrated.
Pilwrn
A small number of soil samples were collected from near this farm to test for the presence and extent of mineralisation indicated by the remains of a small trial working, believed to have been for Cu (Cooper, Nutt and Morgan, 1982). On the ground there is little to be seen except for the remains of a shaft and features that suggest exploitation along an ESE-striking vertical fault, with greenschists to the north and fine- grained sandstone to the south. Both these lithologies occur within the Amlwch Beds of Greenly (1919). Superficial deposits consist of a thin veneer of boulder clay in the vicinity of the working.
Thirty two soil samples were collected at 20 m intervals along four short traverses placed approximately 150 m apart perpendicular to the presumed strike of the mineralised structure (Figure 26). Samples were prepared and analysed for Cu, Zn and Pb as described previously.
The results were all of low magnitude with the maxima (Cu 70 ppm, Zn 120 ppm and Pb 50 ppm) little or no more than twice the median (i.e. back- ground) levels (Cu 30 ppm, Zn 60 ppm and Pb 30 ppm). Consequently,
applying the thresholds calculated for the Llanbadrig area (Table 8) produced only one anomalous value (70 ppm Cu at [SH 4116 93361). However, plotting other high values of Cu (> 35 ppm) revealed a roughly ESE-trending belt of these values (Figure 26) on the north side of the mapped line of the mineralised structure. The three highest Cu results are in samples collected at shallow depth (< 0.45 m) and two of these samples contain the highest levels of Pb reported (50 ppm). The samples were not organic rich and there is no reason to believe they are not reflecting an underlying enrichment. High Zn levels (90-120 ppm)
67
correlate closely with the high Cu results.
The pattern of high values supports the geological and trial working evidence in indicating the presence of an ESE- trending mineralised structure here. The soil data suggests that it is at least 0.5 km in length. However, the low magnitude of the metal enrichments, generally less than twice background, suggests that any near-surface mineralisation is weak.
Geophysical surveys
Airborne EM anomalies of 100 ppm were investigated by taking ground EM measurements at 30 m intervals along four traverses (Figure 27). The results showed no systematic anomaly but the profiles had up to 5% variation ascribed to noise. A power line, which crosses the area and affected the results, is the probable source of the airborne anomaly.
Four widely spaced reconnaissance IP dipole-dipole traverses using 50 m dipoles were measured using the Huntec Mark III equipment to look for evidence of base-metal mineralisation (Figure 27). The chargeability results (Figure 28) show the presence of anomalies reaching 30 ms against a background of 5-10 ms. On traverse 382 950 two northward dipping anomalies are evident. The more northerly, with an amplitude of 20 ms, is coincident with the southern side of the Ogof Gynfor - Isallt structure and associated soil anomalies. The more southerly, at Cae Owen [SH 3807 94501, is the largest chargeability anomaly recorded (30 ms). Cu and Pb in soil anomalies are recorded nearby and the IP anomaly may, therefore, be related to underlying mineralisation, although coincidence with a road and proximity to a farm casts some doubt on this interpretation.
Features in the southern section of traverse 393 948 are not reliable because of a malfunctioning instrument. On traverse 414 946 only a very weak chargeability feature coincides with the silicified and locally mineralised Ordovician and Gwna Group rocks forming Mynydd Pantygaseg. On traverse 422 946 a strong anomaly reaching 30 ms at depth is coincident with the eastern extension of this structure. The anomaly is close to a shaft of the Bull Bay mine workings (Cooper, Nutt and Morgan, 1982) and is interpreted as reflecting the presence of a northward dipping mineralised zone.
The apparent resistivity readings show a broad correlation with the principal geological groups: Gwna Group rocks typically returning measurements below 1 k ohm m and Skerries Group showing higher values (1-7 k ohm m). The high chargeability zones crossed by traverse 382 950 give higher apparent resistivity values (up to 1.5 k ohm m) than the surrounding rocks, whilst along the eastern traverses the reverse pattern occurs. This may be caused by differences in host rocks associated with the mineralisation, rather than the mineralisation
itself. It is not clear whether the high chargeability values and changes in apparent resistivity in the zones thought to contain mineralisation are produced by the presence of sulphides, by clay minerals produced by alteration, or a combination of both.
58
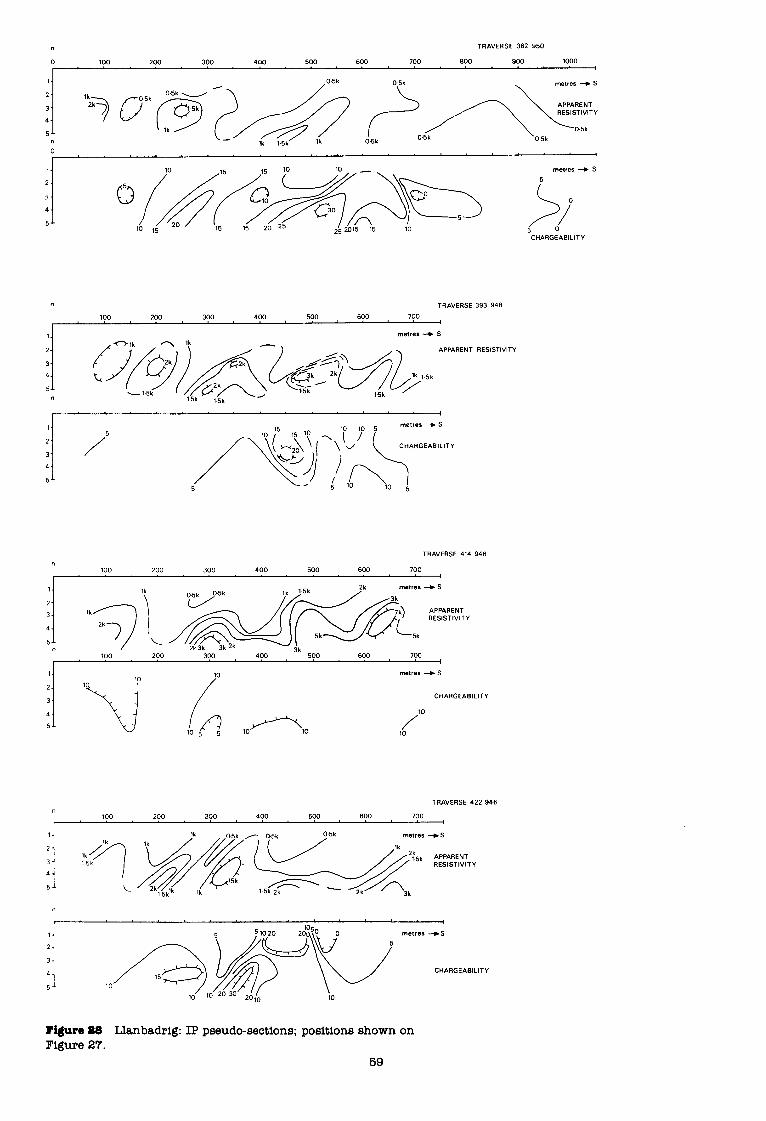
TRAVERSE 382 950
0 100 200 300 400 500 600 700 800 900 1000 I 1
(j 5
”
CHARGEABILITY
” TRAVERSE 393 948
100 200 300 400 500 600 700
I
1
2
3
4
5 I
5
/
metres -b S
CHARGEABILITY
TRAVERSE 414 946
” 100 200 300 400 500 600 700
I
:/
”
lkf--$ ‘j< ~&.&&&-~~;K~:. 3k
100 200 300 400 500 600 700 I
metres +s
CHARGEABILITY
10
/ 10
TRAVERSE 422 946 ”
100 200 300 400 500 600 700 I
j ,o/& ga\u metres _.,..EUL,TY
10 10 20 30 2010 10
Figure 88 Llanbadrig: IP pseudo-sections; positions shown on Figure 27.
69
Conclusions
1. Base-metal anomalies in soil, IP chargeability anomalies and, locally, the presence of old mine workings indicate the presence of base-metal sulphide mineralisation. The most prominent grouping of anomalies is associated with the Ogof Gynfor Ordovician outlier and its junctions with the Gwna m4lange.
2. The pattern of anomalies suggests that controls on mineralisation are similar to those determined at Parys Mountain and in the Carmel Head area (Cooper, Nutt, Smith and Easterbrook, 1989).
3. Besides base-metals there is evidence locally for barium mineralisation associated with the Ogof Gynfor - Isallt structure. The data suggest that this structure is mineralised over a strike length of at least 500 q and further work is merited to ascertain the persistence and amount of mineralisation at depth.
4. Other anomalies in the area also merit further investigation to ascertain their cause and extent, notably the IP and soil anomalies near Cae Owen.
60
LLANDYFRYDOG
The reconnaissance geochemical drainage survey revealed anomalous amounts of Cu, Zn, Ba and Pb in stream sediment and panned concentrate samples taken from sites in a tributary to the Afon Goch running through Llandyfrydog (at [SH 450 8601, [SH 449 8591 and [SH 446 8551). The panned concentrate samples were rich in pyrite and the stream was apparently free of contaminants. Samples taken from the Afon Goch itself provided no useful information on base-metal mineralisation because of contamination by material from Parys Mountain.
In an attempt to identify the source of the drainage anomalies and test for base-metal mineralisation in the area a programme of traverse-based reconnaissance soil sampling was carried out (Figure 29). Following the detection of anomalous metal concentrations in these samples, a grid- based soil sampling exercise was completed across part of the area and rock samples collected for analysis from available exposures.
Geology and mineralisation
The bedrock consists of Ordovician sedimentary rocks cut by basic and ultrabasic intrusions. The Ordovician succession is dominated by mudstones and siltstones of Llanvirn age. Thin bands of grit are present locally and an oolitic ironstone horizon crops out at Llandyfrydog Mill [SH 451 8611. The principal intrusions are described as hornblende picrites (Greenly, 1919) or hornblende gabbros (Maltman, 1977). The original mineralogy of the intrusions is often extensively altered with the formation of secondary green hornblende, serpentine, epidote, chlorite, actinolite, calcite, quartz and leucoxene (Greenly, 1919; Maltman, 1973). The margins of the intrusions are rarely seen but where exposed are chloritic. Contact metamorphism of the host rocks is extensive with the development of fine white mica and chlorite spots. The age of the intrusions is uncertain. A K/Ar determination on hornblende from one of the picrites gave an age of 471*50 Ma which was regarded as a minimum (Fitch and others, 1969). This date, similarities with a Lower Ordovician intrusion on the Lleyn Peninsula and the absence of picrites cutting younger rocks, has led to the suggestion that the Llandyfrydog picrites are Ordovician in age. In addition to these ultra- mafic intrusions, several thin sills of dolerite outcrop at Llandyfrydog. Except for the alluvium along the Afon Goch much of the area is free of superficial deposits or possesses a thin cover of boulder clay.
Reconnaissance soil sampling
Soil samples were collected at 20 m intervals along six traverses (Figure 29) from as great a depth as possible using 1.20 m hand augers. The -0.18 mm (-85 mesh) fraction of the soil was analysed for Cu, Zn and Pb by AAS following dissolution of a 0.5 g sample in hot concentrated nitric acid for one hour.
A summary of the analytical results is given in Table 9 and anomalous sites are shown in Figure 29. Threshold levels were determined by cumulative frequency curve analysis. The sample populations of all three elements consisted of a lognormally distributed lower (background)
61
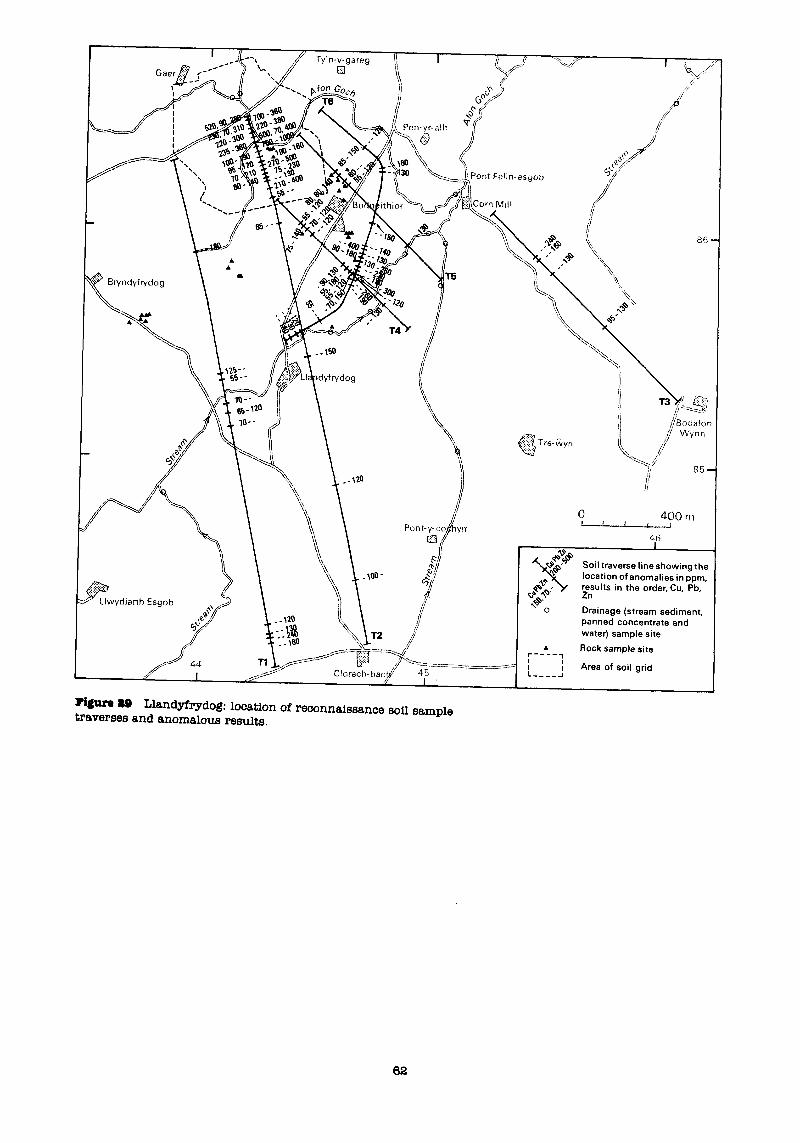
\
-
86
44
I
Soil traverse line showing thf location of anomalies in ppm, results in the order, Cu, Pb, Zn
Drainage (stream sediment, panned concentrate and water) sample site
A
r-----t Rock sample site
1 i c_____l
Area of soil grid
Figure 99 Llandyfrydog: location of reconnaissance soil sample traverses and anomalous results.
62
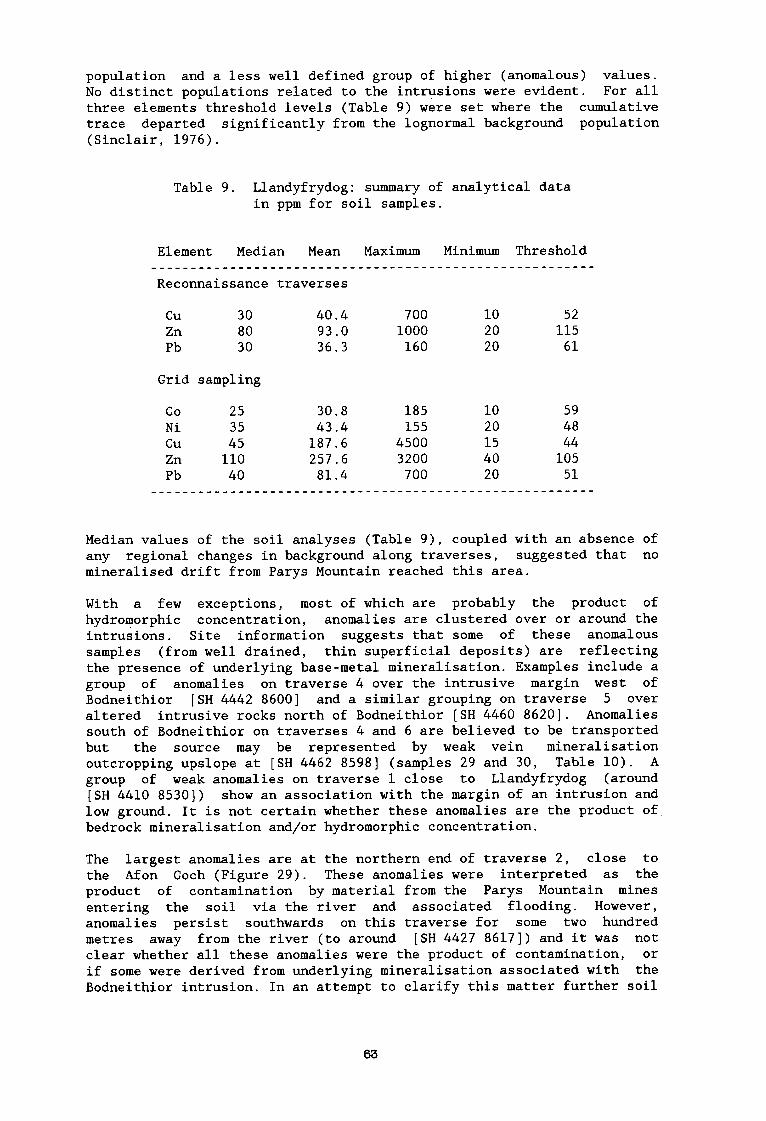
population and a less well defined group of higher (anomalous) values. No distinct populations related to the intrusions were evident. For all
three elements threshold levels (Table 9) were set where the cumulative
trace departed significantly from the lognormal background population
(Sinclair, 1976).
Table 9. Llandyfrydog: summary of analytical data in ppm for soil samples.
Element Median Mean Maximum Minimum Threshold ____________________~~~~~~~~~~~~~~~~~~~~~~~~~~~~~-~-~---
Reconnaissance traverses
cu 30 40.4 700 10 52 Zn 80 93.0 1000 20 115 Pb 30 36.3 160 20 61
Grid sampling
co 25 30.8 185 10 59 Ni 35 43.4 155 20 48 cu 45 187.6 4500 15 44 Zn 110 257.6 3200 40 105 Pb 40 81.4 700 20 51
Median values of the soil analyses (Table 9), coupled with an absence of
any regional changes in background along traverses, suggested that no
mineralised drift from Parys Mountain reached this area.
With a few exceptions, most of which are probably the product of
hydromorphic concentration, anomalies are clustered over or around the intrusions. Site information suggests that some of these anomalous
samples (f rom well drained, thin superficial deposits) are reflecting
the presence of underlying base-metal mineralisation. Examples include a group of anomalies on traverse 4 over the intrusive margin west of
Bodneithior [SH 4442 86001 and a similar grouping on traverse 5 over
altered intrusive rocks north of Bodneithior [SH 4460 86201. Anomalies
south of Bodneithior on traverses 4 and 6 are believed to be transported but the source may be represented by weak vein mineralisation
outcropping upslope at [SH 4462 85981 (samples 29 and 30, Table 10). A
group of weak anomalies on traverse 1 close to Llandyfrydog (around [SH 4410 85301) show an association with the margin of an intrusion and low ground. It is not certain whether these anomalies are the product of bedrock mineralisation and/or hydromorphic concentration.
The largest anomalies are at the northern end of traverse 2, close to
the Afon Goch (Figure 29). These anomalies were interpreted as the product of contamination by material from the Parys Mountain mines
entering the soil via the river and associated flooding. However,
anomalies persist southwards on this traverse for some two hundred
metres away from the river (to around [SH 4427 86171) and it was not clear whether all these anomalies were the product of contamination, or if some were derived from underlying mineralisation associated with the
Bodneithior intrusion. In an attempt to clarify this matter further soil
03
samples were collected on a grid basis about the large anomaly at the north end of traverse 2 and rock samples collected from exposures in the vicinity.
Grid-based soil sampling
Soil samples (217) were collected on a 40 m by 40 m grid in the area between Bodneithior and Gaer (Figure 30). Samples were taken, prepared and analysed in the same way as for the reconnaissance survey except that Co and Ni were also determined by AAS. A summary of the analytical data is given in Table 9. Cumulative frequency plots again indicated that each element distribution contained at least two sample populations and thresholds (Table 9) were determined in precisely the same way as for the reconnaissance samples. In this dataset the proportion of samples belonging to the background populations was smaller. The distribution of high metal values is shown by contoured plots (Figure 30). Contours were drawn at the threshold and at the 80 and 95 percentile levels of the distribution in the cases where these levels were above the threshold.
It is evident from the contoured plots that the spatial distribution of
cu, Zn and Pb in the soil is related to the drainage. The relationship is even more marked if areas of alluvium are included (1:lO 560 field slips, Greenly, 1919), and there can be little doubt that the source of
- the majority of anomalies is metal-rich water and suspended matter in the Afon Goch. The presence of large Cu and Zn anomalies close to the unnamed stream entering the Afon Goch from the southwest cannot be caused by Parys Mountain material coming down the stream, and it is thought that these anomalies may be caused by backwash running up the stream from the Afon Goch in times of flood.
A few of the soil anomalies may have a different source, for example an anomalous sample (Cu 950 ppm, Zn 1300 ppm) taken on a ridge in the middle of a field to the southeast of Gyfyngwen [SH 4424 86271. A short soil profile was taken here and, for comparison, at three sites in low ground close to watercourses (Pb map, Figure 30). The three profiles from low ground showed the same pattern, with metal levels peaking within 0.8 m of the surface and falling off to the maximum depth sampled (1.4 m). Highest Cu and Zn values showed some correlation with horizons rich in Fe and Mn hydrous oxides whilst Pb levels were highest in the topsoil. In contrast, the profile taken on the ridge showed a steady increase in metal concentration with depth to bedrock (or a large block) at 0.8 m, suggesting the presence of underlying mineralisation.
High Co and Ni values also show an association with contaminated alluvium and the highest Co results (> 60 ppm) are all in samples collected close to the Afon Goch. Enrichment of both elements close to the Afon Goch can be accounted for by trace amounts of these metals in the Parys Mountain sulphides. Some high values in the southern part of the grid (Figure 30) may be reflecting the basic composition of the bedrock here, but the maximum levels of both Co (60 ppm) and Ni
(155 ppm) in this area do not suggest that the Bodneithior intrusion is enriched in these elements to an economically significant level.
04
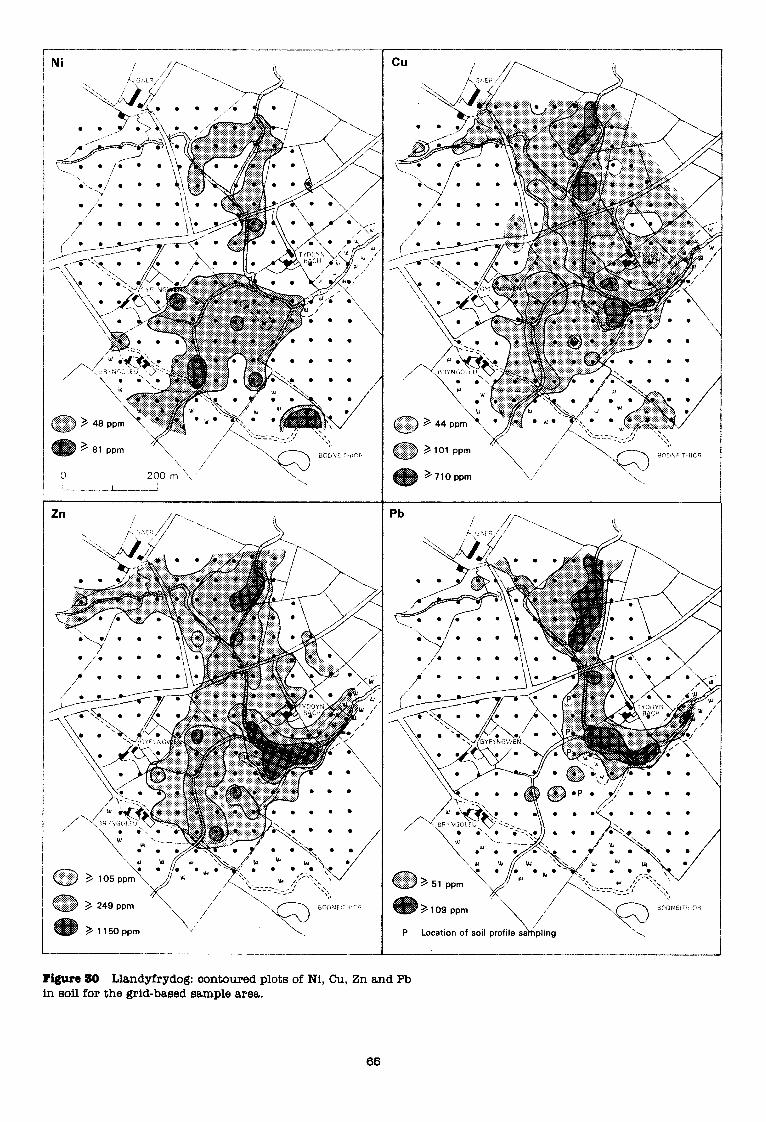
t __-....L--.._A
Zn ;t Pb
,.~.‘.~.~.~., i . . . . . 0 :.:.:.:.:., ::~::::::::::: . . . . . . . . . . 3
3 109 ppm
\
/ /( \
/’ \ /
3 1150ppm ,’
P Location of soil profile sakipling
Figure SO Llandyfrydog: contoured plots of Ni, Cu, Zn and Pb in soil for the grid-based sample area.
65
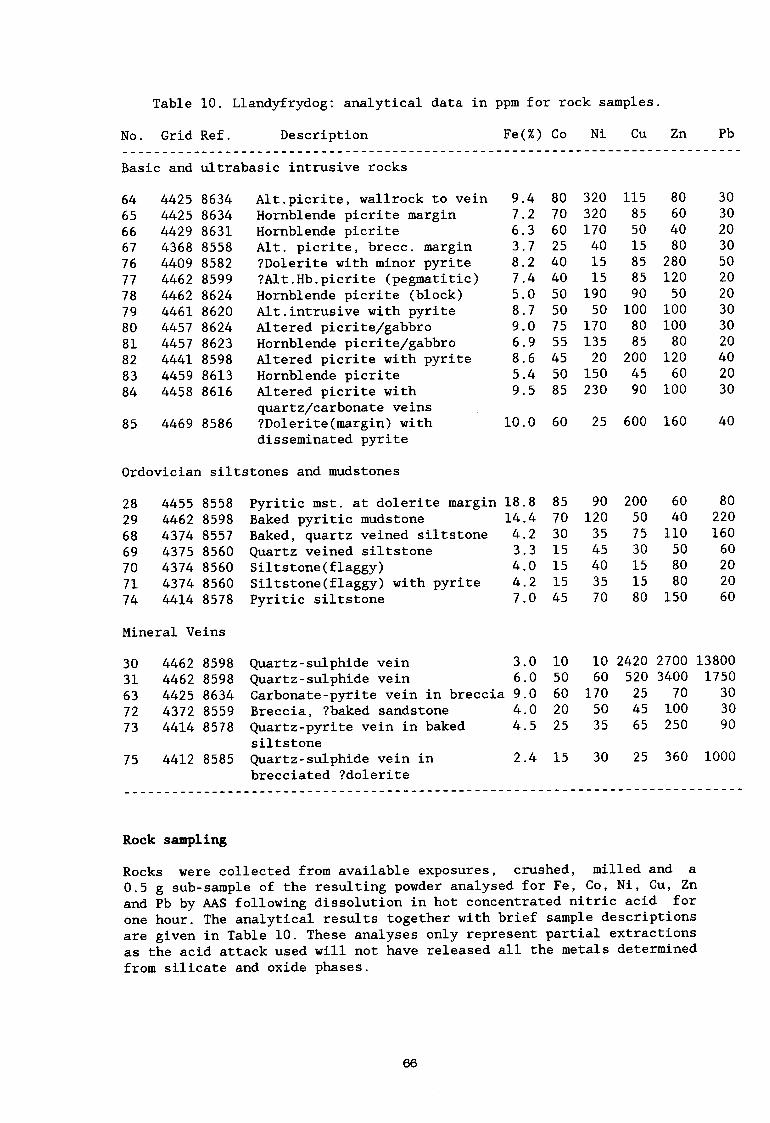
Table 10. Llandyfrydog: analytical data in ppm for rock samples.
No. Grid Ref. Description Fe(%) Co Ni Cu Zn Pb ____________________~~~~~~~~~~~~~~~~~~~~~~~~~~~~~~~~~~~~~~~~~~~~~~~~~~~~~~~~~~
Basic and ultrabasic intrusive rocks
64 4425 8634 65 4425 8634 66 4429 8631 67 4368 8558 76 4409 8582 77 4462 8599 78 4462 8624 79 4461 8620 80 4457 8624 81 4457 8623 82 4441 8598 83 4459 8613 84 4458 8616
85 4469 8586
Alt.picrite, wallrock to vein Hornblende picrite margin Hornblende picrite Alt. picrite, brecc. margin ?Dolerite with minor pyrite ?Alt.Hb.picrite (pegmatitic) Hornblende picrite (block) Alt.intrusive with pyrite Altered picrite/gabbro Hornblende picrite/gabbro Altered picrite with pyrite Hornblende picrite Altered picrite with quartz/carbonate veins ?Dolerite(margin) with disseminated pyrite
9.4 80 320 115 80 30 7.2 70 320 85 60 30 6.3 60 170 50 40 20 3.7 25 40 15 80 30 8.2 40 15 85 280 50 7.4 40 15 85 120 20 5.0 50 190 90 50 20 8.7 50 50 100 100 30 9.0 75 170 80 100 30 6.9 55 135 85 80 20 8.6 45 20 200 120 40 5.4 50 150 45 60 20 9.5 85 230 90 100 30
10.0 60 25 600 160 40
Ordovician siltstones and mudstones
28 4455 8558 Pyritic mst. at dolerite margin 18.8 85 90 200 60 29 4462 8598 Baked pyritic mudstone 14.4 70 120 50 40 68 4374 8557 Baked, quartz veined siltstone 4.2 30 35 75 110 69 4375 8560 Quartz veined siltstone 3.3 15 45 30 50 70 4374 8560 Siltstone(flaggy) 4.0 15 40 15 80 71 4374 8560 Siltstone(flaggy) with pyrite 4.2 15 35 15 80 74 4414 8578 Pyritic siltstone 7.0 45 70 80 150
Mineral Veins
80 220 160 60 20 20 60
30 4462 8598 Quartz-sulphide vein 3.0 10 10 2420 2700 13800
31 4462 8598 Quartz-sulphide vein 6.0 50 60 520 3400 1750
63 4425 8634 Carbonate-pyrite vein in breccia 9.0 60 170 25 70 30 72 4372 8559 Breccia, ?baked sandstone 4.0 20 50 45 100 30
73 4414 8578 Quartz-pyrite vein in baked 4.5 25 35 65 250 90
siltstone 75 4412 8585 Quartz-sulphide vein in 2.4 15 30 25 360 1000
brecciated ?dolerite ____________________~~_~~~~~~~~~~~~~~~~~~~~~~~~~~~~~~~~~~~-~~~~~~~~~-~---- ----
Rock sampling
Rocks were collected from available exposures, crushed, milled and a
0.5 g sub-sample of the resulting powder analysed for Fe, Co, Ni, Cu, Zn and Pb by AAS following dissolution in hot concentrated nitric acid for
one hour. The analytical results together with brief sample descriptions are given in Table 10. These analyses only represent partial extractions as the acid attack used will not have released all the metals determined from silicate and oxide phases.
66
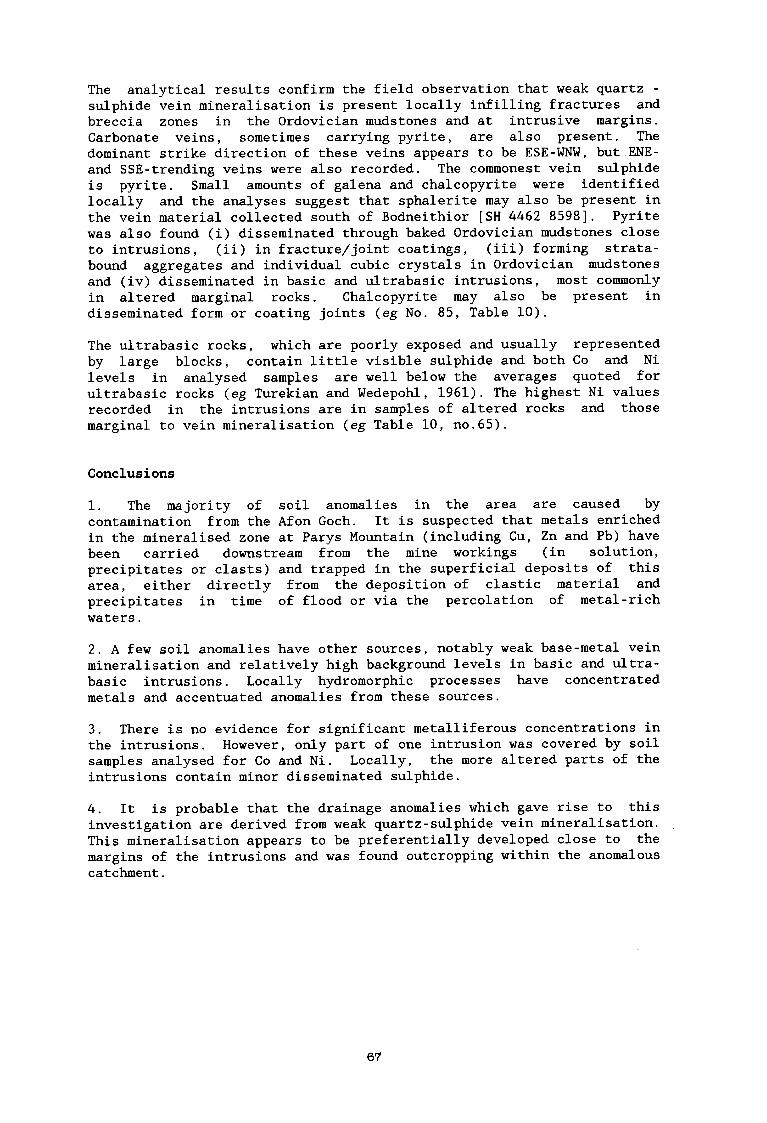
The analytical results confirm the field observation that weak quartz - sulphide vein mineralisation is present locally infilling fractures and breccia zones in the Ordovician mudstones and at intrusive margins. Carbonate veins, sometimes carrying pyrite, are also present. The dominant strike direction of these veins appears to be ESE-WNW, but ENE- and SSE-trending veins were also recorded. The commonest vein sulphide is pyrite. Small amounts of galena and chalcopyrite were identified locally and the analyses suggest that sphalerite may also be present in the vein material collected south of Bodneithior [SH 4462 85981. Pyrite was also found (i) disseminated through baked Ordovician mudstones close to intrusions, (ii) in fracture/joint coatings, (iii) forming strata- bound aggregates and individual cubic crystals in Ordovician mudstones and (iv) disseminated in basic and ultrabasic intrusions, most commonly in altered marginal rocks. Chalcopyrite may also be present in disseminated form or coating joints (eg No. 85, Table 10).
The ultrabasic rocks, which are poorly exposed and usually represented by large blocks, contain little visible sulphide and both Co and Ni
levels in analysed samples are well below the averages quoted for ultrabasic rocks (eg Turekian and Wedepohl, 1961). The highest Ni values recorded in the intrusions are in samples of altered rocks and those marginal to vein mineralisation (eg Table 10, no.65).
Conclusions
1. The majority of soil anomalies in the area are caused by contamination from the Afon Goch. It is suspected that metals enriched in the mineralised zone at Parys Mountain (including Cu, Zn and Pb) have been carried downstream from the mine workings (in solution, precipitates or clasts) and trapped in the superficial deposits of this area, either directly from the deposition of elastic material and precipitates in time of flood or via the percolation of metal-rich
waters.
2. A few soil anomalies have other sources, notably weak base-metal vein mineralisation and relatively high background levels in basic and ultra- basic intrusions. Locally hydromorphic processes have concentrated metals and accentuated anomalies from these sources.
3. There is no evidence for significant metalliferous concentrations in the intrusions. However, only part of one intrusion was covered by soil samples analysed for Co and Ni. Locally, the more altered parts of the intrusions contain minor disseminated sulphide.
4. It is probable that the drainage anomalies which gave rise to this investigation are derived from weak quartz-sulphide vein mineralisation. _ This mineralisation appears to be preferentially developed close to the margins of the intrusions and was found outcropping within the anomalous catchment.
67
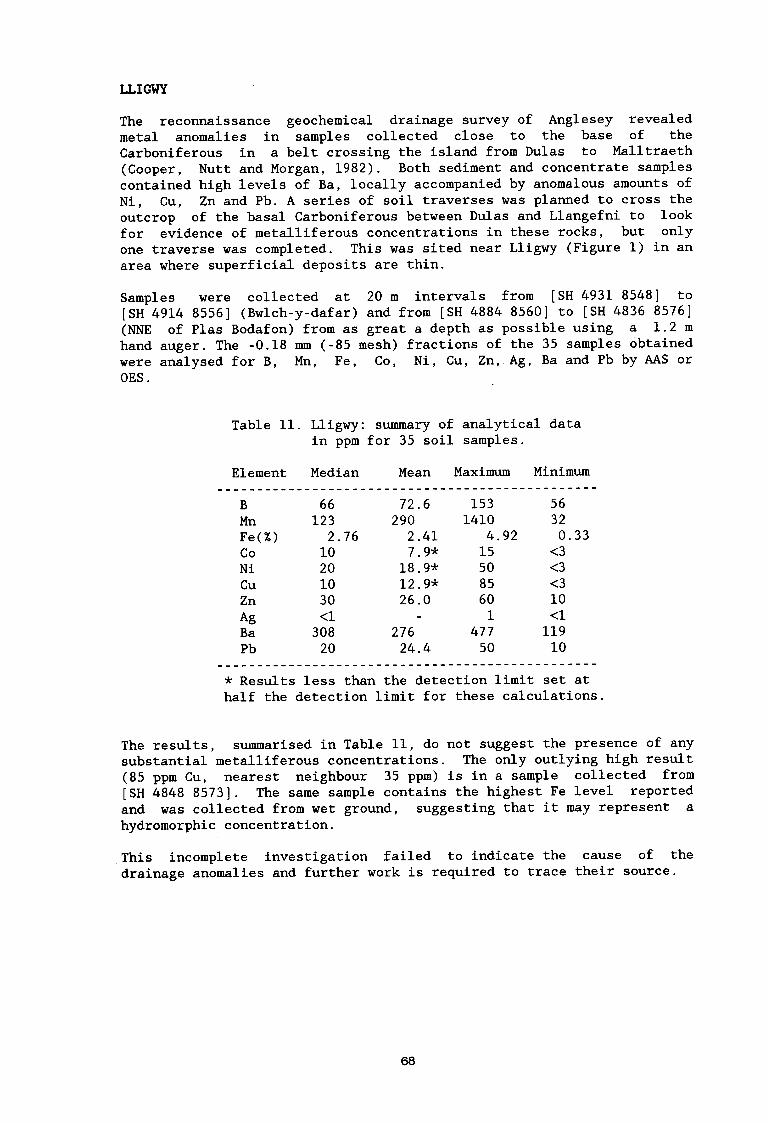
LLIGWY
The reconnaissance geochemical drainage survey of Anglesey revealed metal anomalies in samples collected close to the base of the Carboniferous in a belt crossing the island from Dulas to Malltraeth
(Cooper, Nutt and Morgan, 1982). Both sediment and concentrate samples contained high levels of Ba, locally accompanied by anomalous amounts of
Ni, Cu, Zn and Pb. A series of soil traverses was planned to cross the outcrop of the basal Carboniferous between Dulas and Llangefni to look
for evidence of metalliferous concentrations in these rocks, but only one traverse was completed. This was sited near Lligwy (Figure 1) in an area where superficial deposits are thin.
Samples were collected at 20 m intervals from [SH 4931 85481 to [SH 4914 85561 (Bwlch-y-dafar) and from [SH 4884 85601 to [SH 4836 85761 (NNE of Plas Bodafon) from as great a depth as possible using a 1.2 m hand auger. The -0.18 mm (-85 mesh) fractions of the 35 samples obtained were analysed for B, Mn, Fe, Co, Ni, Cu, Zn, Ag, Ba and Pb by AAS or OES.
Table 11. Lligwy: summary of analytical data in ppm for 35 soil samples.
Element Median Mean Maximum Minimum ____________________~~~~_~~~~~~~~~~~~~~~~~~~~~~~
B 66 72.6 153 56 Mn 123 290 1410 32 Fe(%) 2.76 2.41 4.92 0.33 CO 10 7.9* 15 <3 Ni 20 18.96: 50 <3 cu 10 12.9* 85 <3 Zn 30 26.0 60 10
Ag Cl 1 <1 Ba 308 276 477 119 Pb 20 24.4 50 10
------_-- ____________________~~~_~~~~~~~~~~~~~~~
* Results less than the detection limit set at half the detection limit for these calculations.
The results, summarised in Table 11, do not suggest the presence of any substantial q etalliferous concentrations. The only outlying high result (85 ppm Cu, nearest neighbour 35 ppm) is in a sample collected from [SH 4848 85731. The same sample contains the highest Fe level reported and was collected from wet ground, suggesting that it may represent a hydromorphic concentration.
This incomplete investigation failed to indicate the cause of the drainage anomalies and further work is required to trace their source.
68
CONCLUSIONS AND RECOMMENDATIONS
1. Of the areas covered by this report, the results from Llanbadrig gave the strongest indication of appreciable base-metal mineral potential. Mineralisation of similar style to that found in northwest and northeast Anglesey may be present, and further work is recommended to determine
the style, magnitude and extent of mineralisation indicated by the reconnaissance surveys. The possibility of gold mineralisation should also be investigated.
2. At City Dulas further work is recommended to ascertain the style and extent of mineralisation indicated by the IP and soil survey results and its relationship to the veins exploited by an old lead mine.
3. In the Cerrigceinwen area the causes of groundwater and stream
sediment anomalies were not satisfactorily explained by the results of reconnaissance soil sampling, which only suggested the presence of weak isolated metal enrichments. Further work is recommended to ascertain if the results of the limited soil sampling survey, which did not adequately cover critical sections such as the base of the
Carboniferous, are giving a false impression of the mineral potential of this area. Similarly, further attention should be given to the basal Carboniferous in the Lligwy area.
4. Large base-metal in soil anomalies near Llandyfrydog are caused largely by contamination. Some smaller anomalies are related to small quartz and/or carbonate veins, locally carrying minor quantities of sulphide minerals.
5. The geophysical orientation studies indicated that IP techniques were the most useful for detecting buried mineralisation of the type sought
by these surveys. The magnetic and VLF(EM) methods were useful for mapping purposes in areas free of artificial sources. Detailed gravity
data could also be useful under specific conditions.
6. The regional gravity survey data were sufficient to identify and
define the general extent of residual anomalies due to near surface
sources, but further work is merited to gain more precise information on their form and geological significance. A large gravity anomaly bordering northwest Anglesey may be caused by a buried granite. If of
Caledonian age, it could have influenced the distribution of base-metal mineralisation in much of north and west Anglesey. The mineral potential of metamorphosed basic rocks causing positive gravity anomalies in the
southeast of the island merit investigation.
ACKNOWLEDGEMENTS
Permission to use the gravity data and to quote density values obtained by University of Leeds MSc students is gratefully acknowledged. The BGS gravity survey was carried out by J M Allsop and Z K Dabek and the
samples for density measurement collected by D Lowe. Chemical analyses were provided through the efforts of several BGS staff in the Analytical Geochemistry Group of BGS. The diagrams were neatly drawn by J W Arbon and C Simpson, members of the BGS Drawing Office at Keyworth.
69
ALLEN, J R L. 1965. The sedimentation and paleogeography of the Old Red Sandstone of Anglesey. Proceedings of the Yorkshire Geological Society, 35, 139-185.
BARBER, A J, and Max, M D. 1979. A new look at the Mona Complex (Anglesey, North Wales). Journal of the Geological Society of London, 136, 407-432.
BATES, D E B. 1972. The stratigraphy of the Ordovician rocks of Anglesey. Geological Journal, 8, 29-58.
BATES, D E B. 1974. The structure of the Lower Palaeozoic rocks of Anglesey with special reference to faulting. Geological Journal, 9, 39-60.
BECKINSALE, R D, and THORPE, R S. 1979. Rubidium-strontium whole rock isochron evidence for the age of metamorphism and magmatism in the Mona Complex of Anglesey. Journal of the Geological Society of London, 139, 433-439.
BLUNDELL, D J, DAVEY, F J, AND GRAVES, L J. 1971. Geophysical surveys over the south Irish Sea and Nymphe Bank. Journal of the Geological Society of London, 127, 339-375.
BURLEY, A J, CORNWELL, J D, and TOMBS, J M C. 1978. Geophysical field techniques for mineral exploration. Mineral Reconnaissance Programme Report Institute of Geological Sciences, No. 20.
COOPER, D C, NUTT, M J C, and MORGAN, D J. 1982. A reconnaissance geochemical survey of Anglesey. Mineral Reconnaissance Programme Report Institute of Geological Sciences, No. 51.
COOPER, D C, NUTT, M J C, SMITH, I F, and EASTERBROOK, G D. 1989. Base- metal and gold mineralisation in north-west Anglesey, North Wales. Mineral Reconnaissance Programme Report, British Geological Survey, No. 99.
FITCH, F J, MILLER, J A, EVANS, A L, GRASTY, R L, and MENEISY, M Y. 1969. Isotopic age determinations on rocks from Wales and the Welsh borders. 23-45 in The Pre-Cambrian and Lower Palaeozoic rocks of Wales. WOOD, A (editor). (Cardiff: University of Wales Press.)
FORSTER, A. 1974. Density, porosity, magnetic susceptibility and sonic velocity determinations on selected rock samples from Anglesey. Engineering Geology Unit Report, Institute of Geological Sciences, No. 38.
GEOLOGICAL SURVEY OF GREAT BRITAIN. 1965. Aeromagnetic map of Great Britain, Sheet 2. 1:625 000. (Chessington, Surrey: Ordnance Survey for Geological Survey of Great Britain.)
GIBBONS, W. 1983. Stratigraphy, subduction and strike-slip faulting in the Mona Complex of North Wales - a review. Proceedings of the Geological Association, 94, 147-163.
70
GOODING, K. 1988. Go-ahead given for metals mine on Anglesey. Financial Times, London, 28 April.
GRANT, F S, and WEST, G F. 1965. Interpretation theory in applied Geophysics. McGraw-Hill, 584~~.
GREENLY, E. 1919. The geology of Anglesey. Memoir of the Geological Survey of Great Britain, Sheet 119 (England and Wales).
GREENLY, E. 1920. Geological map of Anglesey. 1:63 360. (London: HMSO for Geological Survey of Great Britain.)
HIPKIN, R G, and CHACKSFIELD, B C (compilers). 1986. Bouguer anomaly map of the British Isles. Southern Sheet. 1:625 000. (Keyworth, Nottingham: British Geological Survey.)
KETOLA, M, and PURANEN, M. 1967. Type curves for the interpretation of Slingram (h orizontal loop) anomalies over tabular bodies. Geologinen Tutkimuslaitos, Otaniemi, Finland, Report of Investigations, No.1.
LEWIS, W J. 1967. Lead Mining in Wales. (Cardiff: University of Wales Press.)
MALTMAN, A J. 1973. The serpentinites and related rocks of Anglesey, North Wales, United Kingdom. PhD thesis, University of Illinois. (London: University Microfilms International.)
MALTMAN, A J. 1977. Serpentinites and related rocks of Anglesey. Geological Journal, 12, 113-128.
NUTT, M JC, and SMITH, E G. 1981a. Transcurrent faulting and the anomalous position of pre-Carboniferous Anglesey. Nature, 290, 492-495.
NUTT, M JC, and SMITH, E G. 1981b. Transcurrent faulting and the anomalous position of pre-Carboniferous Anglesey. Nature, 293, 760-762.
NUTT, M J C, and WEBB, B C. 1978. North Wales. 275 in Mineral Deposits of Europe, Volume 1: Northwest Europe. BOWIE, S H U, KVALHEIM, A, and HASLAM, H W (editors). (London: Institution of Mining and Metallurgy.)
PARKER-GAY, S. 1963. Standard curves for the interpretation of magnetic anomalies over long tabular bodies. Geophysics, 28, 161-200.
PARSLOW, G R. 1974. Determination of background and threshold in exploration geochemistry. Journal of Geochemical Exploration, 3, 319-336.
POWELL, D W. 1956. Gravity and magnetic anomalies in North Wales. Quarterly Journal of the Geological Society of London, 111, 375-392.
REEDMAN, A J, LEVERIDGE, B E, and EVANS, R B. 1984. The Arfon Group ('Arvonian') of North Wales. Proceedings of the Geological Association, 95, 313-321.
SINCLAIR, A J. 1976. Applications of probability graphs in mineral exploration. Association of Exploration Geochemists Special Volume, No. 4.
71
SHACKLETON, R M. 1969. The Pre-Cambrian of North Wales. l-22 in The Pre- Cambrian and Lower Palaeozoic rocks of Wales. WOOD, A (editor). (Cardiff: University of Wales Press.)
SHACKLETON, R M. 1975. Precambrian rocks of Wales. 76-82 in A correlation of the Precambrian rocks in the British Isles. HARRIS, A L, HOLLAND, C H, and LEAKE, B E (editors). Special Report of the Geological Society of London, No. 6.
SMITH, I F. 1979. Airborne geophysical survey of part of Anglesey, North Wales. Mineral Reconnaissance Programme Report Institute of Geological Sciences, No. 27.
THORPE, R S. 1972. Ocean floor basalt affinity of Precambrian glaucophane schist from Anglesey. Nature, 240, 164-166.
TUREKIAN, K K, and WEDEPOHL, K H. 1961. Distribution of elements in some major units of the earths crust. Bulletin of the Geological Society of America, 72, 175-191.
WYLLIE, M R J, GREGORY, A R, and GARDNER, G H F. 1958. An experimental investigation of factors affecting elastic wave velocities in poor media. Geophysics, 23, 459-493.
72