Embed Size (px)
Citation preview

Ann. Geophys., 32, 875–888, 2014www.ann-geophys.net/32/875/2014/doi:10.5194/angeo-32-875-2014© Author(s) 2014. CC Attribution 3.0 License.
Coordinated radar observations of plasma wave characteristics inthe auroral F regionR. A. Makarevich and W. A. Bristow
Geophysical Institute, University of Alaska Fairbanks, Fairbanks, AK, USA
Correspondence to:R. Makarevich ([email protected])
Received: 3 April 2014 – Revised: 16 June 2014 – Accepted: 21 June 2014 – Published: 29 July 2014
Abstract. Properties of decameter-scale plasma waves inthe auroral F region are investigated using coordinated ob-servations of plasma wave characteristics with the KodiakHF coherent radar (KOD) and Poker Flat Incoherent Scat-ter Radar (PFISR) systems in the Alaskan sector. We an-alyze one event on 14 November 2012 that occurred dur-ing the first PFISR Ion-Neutral Observations in the Ther-mosphere (PINOT) campaign when exceptionally good F re-gion backscatter data at 1 s resolution were collected by KODover the wide range of locations also monitored by PFISR.In particular, both radar systems were observing continu-ously along the same magnetic meridian, which allowed fora detailed comparison between the line-of-sight (l-o-s) ve-locity data sets. It is shown that l-o-s velocity correlationfor data points strictly matched in time (within 1 s) dependsstrongly on the number of ionospheric echoes detected byKOD in a given post-integration interval or, equivalently, onthe KOD echo occurrence in that interval. The l-o-s veloc-ity correlations reach 0.7–0.9 for echo occurrences exceed-ing 70 %, while also showing considerable correlations of0.5–0.6 for occurrences as low as 10 %. Using the same ap-proach of strictly matching the KOD and PFISR data points,factors controlling coherent echo power are investigated, fo-cusing on the electric field and electron density dependen-cies. It is demonstrated that the signal-to-noise ratio (SNR)of F region echoes increases nearly monotonically with anincreasing electric field strength as well as with an increasingelectron density, except at large density values, where SNRdrops significantly. The electric field control can be under-stood in terms of the growth rate of the gradient-drift wavesbeing proportional to the convection drift speed under con-ditions of fast-changing convection flows, while the densityeffect may involve over-refraction at large density values andradar backscatter power proportionality to the perturbationdensity.
Keywords. Ionosphere (auroral ionosphere; ionospheric ir-regularities; plasma waves and instabilities)
1 Introduction
Decameter-scale plasma irregularities within the ionosphericF region are routinely used as tracers of ambient plasma mov-ing with the E × B drift since their phase velocityV irr iswidely accepted to be the convection velocityV E (Tsunoda,1988). The Super Dual Auroral Radar Network (Super-DARN) in particular relies on the above equivalence to mea-sure the global plasma convection in both hemispheres usingthe coherent scatter radar (CSR) technique (Greenwald et al.,1995; Chisham et al., 2007). The relationship between irreg-ularity phase and ambient plasma velocities has been the fo-cus of numerous investigations that predominantly employedcomparisons with theV E measurements by incoherent scat-ter radar (ISR) systems (Villain et al., 1985; Ruohoniemiet al., 1987; Davies et al., 1999; Xu et al., 2001; Gillies et al.,2010; Bahcivan et al., 2013) and low Earth-orbit satellites(LEO) (Drayton et al., 2005; Gillies et al., 2009). The overallagreement has been demonstrated with typical correlationsof 0.7–0.9 (e.g.,Drayton et al., 2005; Gillies et al., 2010).The more recent studies have employed revised velocity es-timates considering the refractive index in the scattering vol-ume, which significantly improved agreement in slopes ofthe linear fit (Gillies et al., 2009, 2010).
The agreement between the irregularity and convection ve-locities has also been shown to depend, in part, on spatialvariations within the SuperDARN and ISR data sets. Thusthe agreement has been demonstrated to considerably im-prove for data sets with a greater degree of spatial homogene-ity (Gillies et al., 2010), as expected for SuperDARN andISR scattering volumes of significantly different sizes. On
Published by Copernicus Publications on behalf of the European Geosciences Union.

876 R. A. Makarevich and W. A. Bristow: SuperDARN and PFISR F region observations
occasion, E region backscatter may also contaminate F re-gion data sets which can lead to much smaller Doppler veloc-ities observed by SuperDARN (Chisham and Pinnock, 2002;Makarevich, 2008, 2010; Bahcivan et al., 2013).
The overall quality of the SuperDARN measurements isexpected to depend on the availability of irregularities in thescattering volume and on backscatter powerP or the signal-to-noise ratio (SNR) received by the radar. The ISR tech-nique is similar in this regard and the ISR signal intensityis directly controlled by the background electron densityNeconditions within the scattering volume: SNR∝ Ne (e.g.,Rishbeth and Williams, 1985). The density control of co-herent powerP is less direct and the relationship betweenSNR of coherent backscatter andNe is far from being estab-lished (e.g.,Danskin et al., 2002; Kane et al., 2012). One con-sideration is magnetic aspect angle conditions, since powerpeaks strongly in a direction perpendicular to the local mag-netic field line (zero off-perpendicular aspect angle). Thusbackscatter power and backscatter occurrence are expectedto depend on refraction, which, in turn, is controlled by thedensity, so both under-refraction and over-refraction casesare possible (Milan et al., 1997; Danskin et al., 2002; Kaneet al., 2012). In addition, higher absorption will also reduceecho power and occurrence. On the other hand, the irregu-larity intensity may depend on the vector quantities of con-vection velocityV E (or, equivalently, electric fieldE) andelectron density gradient∇Ne. The convection and gradientfactors are important because they control the growth rateof the gradient-drift instability (GDI) which is believed tobe the primary plasma structuring mechanism in the auroralF region (Tsunoda, 1988). One has to emphasize that, whilethe V E control of P is expected, experimentally, no clearrelationship was found (Danskin et al., 2002).
Ultimately, both relationshipsV irr (V E) andP(V E,Ne)
are related since the experimental ability to establish the for-mer depends on coherent radar data quality which dependson the latter, as discussed above. Establishing these relation-ships is important for our understanding of both fundamentalGDI structuring processes and more applied propagation ef-fects in coherent scatter technique. Previous experimental in-vestigations in this area cited above focused on SuperDARNconjunctions with the European Incoherent Scatter (EIS-CAT), Sondrestrom, and Resolute Bay ISR facilities, with theefforts to match the measurements often being limited by ex-perimental modes employed. With these limitations, the clos-est conjunctions were found (typically within 1–5 min), thatis, not necessarily matched exactly (e.g., within 1 s) even inthe time domain. A typical experimental configuration alsoinvolved analysis of data in field-aligned ISR beams, withmeridional context not considered.
In this study, we analyze measurements of the F region co-herent echo power and velocity with the SuperDARN radarin Kodiak, Alaska (KOD), in conjunction with the PokerFlat Incoherent Scatter Radar (PFISR) during the first PFISRIon-Neutral Observations in the Thermosphere (PINOT)
campaign. The event under study of 14 November 2012 wascharacterized by nearly continuous F region backscatter ob-served over a 2 h period within the PFISR viewing area. Inaddition to standard SuperDARN data at 3 s integration and60 s cadence, KOD provided the data at 1 s resolution in onebeam that was aligned with a meridional PFISR beam. Theseobservations provided an excellent opportunity to re-examinetheV irr(V E) andP(V E,Ne) relationships using strict datamatching in time, while also addressing the spatial-match as-pect by conducting cross-analysis between different latitudi-nal bins. The specific objectives of the current study are (1)to investigate the relationship between the F region irregu-larity velocity and PFISR convection velocity, and (2) to re-examine the convection velocity and electron density controlof the coherent echo power using coordinated radar measure-ments during the PINOT campaign.
2 Experiment description
In this study, we analyze the SNR and Doppler velocity datafrom the SuperDARN KOD radar located in Kodiak, Alaska,US (57.6◦ N, 152.2◦ W; with boresight of 30◦ W of geo-graphic N). This radar is similar to other SuperDARN radars,technically and operationally, as described byGreenwaldet al. (1995) and, more recently, byChisham et al.(2007).In its standard mode of operation, KOD scans through 16 az-imuthal directions (radar beams 0–15). The radar measures a17-lag auto-correlation function from which estimates of theDoppler velocity, power, and spectral width of ionosphericechoes in 75–100 range bins for each radar beam are ob-tained. The measured Doppler velocity corresponds to theline-of-sight (l-o-s) irregularity velocity and is, by conven-tion, positive for irregularities propagating towards the radar.The range gate length is usually 45 km, with the first rangegate at 180 km.
Similar to some other newer SuperDARN radars, KOD isalso capable of running in a “stereo” mode and providing ob-servations from two channels, one set of observations fromChannel A and the other from Channel B. During the firstPINOT campaign in November 2012, Channel A was run-ning as in the standard mode, while Channel B was fixed onbeam 3 only (no scanning), a meridional direction towardsPFISR. As a result, KOD (Channel B) observations were ob-tained in this one direction only, but at 1 s resolution. Thisallowed us to post-integrate KOD data in Channel B usingPFISR integration periods, so that KOD and PFISR data arematched in time within 1 s.
Figure1a shows, with the blue (red) color, the ionosphericfootprint of the KOD field-of-view (FoV) computed using thestandard (new) SuperDARN virtual height model (Chishamet al., 2008) up to a range of 1440 km. The selected KODranges are shown by the circular arcs, while straight linesshow KOD beams 0–15. Beams 0, 3, 6, 9, 12, and 15 aremarked with digits near a range of 1440 km.
Ann. Geophys., 32, 875–888, 2014 www.ann-geophys.net/32/875/2014/

R. A. Makarevich and W. A. Bristow: SuperDARN and PFISR F region observations 877
Figure 1. (a)Experiment setup diagram showing the near-range (< 1440 km) geographic footprint of the SuperDARN Kodiak radar (KOD)computed using the standard SuperDARN virtual height model (blue lines). The circular arcs show the start locations of selected range gatesand straight lines show all 16 beams with beams 0, 3, 6, 9, 12, and 15 indicated by digits near range 1440 km. The curved red lines aregeographic locations of the same range gates computed using a new virtual height model byChisham et al.(2008). Also shown are the beamsof the Poker Flat Incoherent Scatter Radar (PFISR) corresponding to range gates with the long pulse data (thick pink lines) and lines of equalmagnetic latitudes3 = 60◦ N and3 = 70◦ N computed using the altitude adjusted corrected geomagnetic (AACGM) model at an altitude400 km (green lines). The PFISR beam 64079 is indicated by the digits. The two panels on the right show the(b) AACGM magnetic latitudeand(c) virtual height versus KOD range for the standard (blue) and new (red) virtual height models. The pink lines and dots represent rangegates in PFISR beam 64079.
The two right panels of Fig.1 show the magnetic lati-tude (MLAT; panel b) and virtual height versus slant rangein KOD beam 3 for the two models (panel c). All MLATvalues were computed using the altitude adjusted correctedgeomagnetic (AACGM) model, an extension of the PolarAnglo-American Conjugate Experiment model (Baker andWing, 1989). The transition between the E and F regionbackscatter is more gradual in the standard model in Fig.1b,while outside of this region the virtual height is fixed at115 km (short ranges) and 400 km (farther ranges). In Fig.1athe differences between blue (standard model) and red (newmodel) circular arcs are small near Poker Flat, but they be-come somewhat larger at farther and shorter ranges. In theMLAT interval of interest shown by the horizontal pink linesin Fig. 1b, these differences result in a small shift in nomi-nally conjugate locations (by up to one PFISR gate).
The PFISR facility is located at the Poker Flat ResearchRange (65.13◦ N, 147.47◦ W; MLAT = 65.4◦ N) near Fair-banks, Alaska (Heinselman and Nicolls, 2008) (Fig. 1a).PFISR is a phased-array system with narrow beam thatcan be steered electronically in many directions within theviewing area. Data from multiple beams can be collectednearly simultaneously (sequentially on a pulse-by-pulse ba-sis, but with a very high time cadence) within the same
integration period. During the period of interest at 00:00–04:00 UT (11:00–15:00 MLT) on 14 November 2012 PFISRoperated in the special mode PINOT Daytime31 designedfor PINOT daytime studies, a variation of the 13-beam TimeHistory of Events and Macroscale Interactions during Sub-storms (THEMIS) mode THEMIS31 used for substorm stud-ies (Lyons et al., 2009).
Figure1a shows footprints of all 13 beams of PFISR withthe pink lines. Since all meridional beams point in the samedirection, they appear as one line. The beam 64079 that over-laps KOD beam 3 the most is marked by digits. It has anazimuth of 20.5◦ E of geographic N and elevation of 76.0◦.In Fig. 1b, this beam is shown as pink straight lines markingMLATs of each PFISR range gate. In Fig.1c, the altitudes ofall range gates are also shown for PFISR beam 64079.
In most modes, including PINOT, PFISR uses 2 sets ofinterleaved pulses: a long pulse (LP) with 72 km range reso-lution designed for F region studies and an alternating code(AC) pulse with 4.5 km resolution used for E region studies.In this study, we employed the LP data for the electron den-sity and ion drift velocity as well as the convection speedVE
estimates. The ion velocity measured in each gate is, by con-vention, positive for ions propagating away from the radar.The VE estimates are obtained from ion velocities using a
www.ann-geophys.net/32/875/2014/ Ann. Geophys., 32, 875–888, 2014

878 R. A. Makarevich and W. A. Bristow: SuperDARN and PFISR F region observations
method described byHeinselman and Nicolls(2008). The 3-D electric field vectors are obtained from the ion drift com-ponents in LP gates above 150 km in altitude by fitting andbinning in MLAT; these estimates are most accurate close tothe meridional beams including beam 64079. For both PFISRdensity and velocity the integration period was 1 min. Thedata in the first two MLAT bins were not considered as thosebins had large errors inVE because of the pointing geometryof ion drift velocity vectors that fall into those bins.
3 Event overview
The KOD range gates coincident with the PFISR polewardbeams, including beam 64079 of interest, all refer to F regionbackscatter observations (Fig.1c). At these ranges eventswith nearly continuous backscatter observations are rela-tively rare. To determine how typical the event under studywas, the echo occurrence analysis was conducted in KODbeam 3 for the entire month of November 2012 (not shownhere for brevity). The typical occurrence values throughoutthe day in this period were 15 %, with the highest occurrenceof 25–35 % observed between 00:00–04:00 UT. To assess thedegree to which backscatter was continuous within this inter-val, the echo occurrence values were also calculated for thehourly intervals on each day in November 2012, and the dayof interest was clearly the highest in occurrence out of all 30days for the 2 h interval 01:00–03:00 UT, with echo occur-rence of 67 %. This is more than 2 times the typical valuein this period (30 %) and more than 4 times the typical valueover all 24 h (15 %), which makes this event particularly wellsuited for the analysis involving both the PFISR and KODdata.
Figure 2 presents an overview of the event under studyon 14 November 2012, 00:00–04:00 UT. It shows MLATkeograms of reversed ion drift velocity in PFISR beam 64079(panel a), irregularity l-o-s velocity in KOD beam 3 (panel b),KOD SNR in beam 3 (panel c), PFISR convection speedVE
(panel d), and PFISR electron density at 350 km (panel e).The KOD data shown in panels b and c were obtained frompost-integrating 1 s resolution data from Channel B of KODover each PFISR integration interval, as described in Sect.2.The PFISR density in each MLAT bin in panel e was ob-tained from interpolated PFISR density data at 350 km in allbeams and the height of 350 km was chosen to have a goodMLAT coverage. The MLAT bin size was 0.25◦, that is, thesame as that used forVE estimates. The thick vertical linesseparate 5 selected periods of interest, with digits on top ofpanel a indicating these periods.
Figure2a and b shows that KOD and PFISR l-o-s veloc-ities exhibit strong similarities when the difference in signconvention is taken into account, for example, convectionwas strongly away from the radars in period 2 (blue plotcells). Some differences are also evident, for example, con-vection towards the radars in period 3 near MLAT 69◦ (red
cells) is more evident in the PFISR data than in the KODdata. The velocity differences are examined in more detail inSect.4.
Figure 2c shows a band of coherent echoes that exhib-ited some meridional motion throughout most of the in-terval of interest which was most pronounced in period 3.This was also the period when PFISR observed very sim-ilar equatorward motion of the region with enhanced con-vection VE > 2000 m s−1, dark red cells in Fig.2d. Thus,in period 3 the association between enhanced SNR andVE
is evident. However, near the beginning of period 3 (i.e., at01:15–01:30 UT) and near MLAT 66.5◦ another region of en-hanced SNR is seen without particularly enhancedVE . Im-portantly however, in the same MLAT–UT interval Fig.2eshows a very similar crescent-shaped area of enhanced den-sity logNe ≈ 11.3 m−3, which suggests that these echoes aredue to enhanced density rather than convection.
If one examines Fig.2c–e now for all 5 selected periods,the following observations can be made about theP(VE,Ne)
relationship. WhenNe is too high, SNR is close to zero andno F region echoes are observed, as for all MLATs for theentire period 1 and progressively more equatorward area dur-ing period 2. A similar feature is observed whenNe is low,as for most of period 5. WhenNe is moderate andVE isstrongly enhanced, SNR is also enhanced, as in period 2 atMLAT > 68◦ and at the start of period 5 near MLAT 66◦.SNR can also be enhanced at lowVE values, as long asNe isenhanced but below the levels of period 1 and 2. Period 4 is aclear example of this density control as areas with enhancedSNR andNe (orange and red cells) are very similar in Fig.2cand e. Overall, one can conclude that the two effects of inter-est, that is, the convection and density controls of coherentecho power, are both present and that either can be dominantdepending on what values the other parameter takes. Thesetwo effects are examined in more detail in Sect.5.
4 Line-of-sight velocity comparisons
Section3 demonstrated that l-o-s velocity measurements byKOD and PFISR agreed in general, while also exhibitingsome differences in detail. One potential complication incomparing these measurements is that the exact location ofSuperDARN measurements depends on the mapping model.The presentation of Fig.2a and b addressed this issue by con-sidering all range/MLAT bins and looking at general trendssuch as meridional motions. In the next analysis presented inFig. 3, a similar idea is employed, where we consider sev-eral range gates for both radars near the nominally conjugategates. In this presentation we show joint KOD–PFISR ve-locity measurements that are exactly matched in space (ac-cording to the mapping model) as well as measurementsthat are slightly mismatched in space to address the ques-tion of how possible spatial differences may affect the result
Ann. Geophys., 32, 875–888, 2014 www.ann-geophys.net/32/875/2014/

R. A. Makarevich and W. A. Bristow: SuperDARN and PFISR F region observations 879
65
66
67
68
69
70
MLA
T, d
eg
0
400
800
1200
1600
2000
VE, m/s
(d) PFISR h > 150 km
65
66
67
68
69
70M
LAT,
deg
-1000-750-500-25002505007501000
-Vi, m/s
(a) PFISR Beam 64079
Period 1 2 3 4 5
0000 0030 0100 0130 0200 0230 0300 0330 0400
Universal Time
65
66
67
68
69
70
MLA
T, d
eg
10.0
10.4
10.8
11.2
11.6
12.0
log Ne, m-3
(e) PFISR h = 350 km
65
66
67
68
69
70
MLA
T, d
eg
0
10
20
30
40
50
SNR, dB
(c) KOD Beam 3 Chan B
65
66
67
68
69
70
MLA
T, d
eg
-1000-750-500-25002505007501000
Vel, m/s
(b) KOD Beam 3 Chan B
Figure 2. Magnetic latitude keograms of(a) the negative of the line-of-sight (l-o-s) component of the ion drift velocity measured by PFISRin beam 64079;(b) the Doppler velocity measured by KOD in beam 3 and in Channel B and post-integrated over the PFISR integrationperiods;(c) the KOD signal-to-noise ratio (SNR) in beam 3, Channel B;(d) the PFISR convection drift magnitudeVE derived from LP datain all beams; and(e) the PFISR electron densityNe at an altitude of 350 km.
of comparisons. A similar approach is also used in the poweranalysis, Sect.5.
Figure 3 shows the point-by-point comparisons betweenKOD and PFISR velocities for various range gates of PFISR(columns) and KOD (rows). All panels in any given columncontain the same PFISR data points and all panels in anygiven row contain the same KOD data points. The data pointsincluded in this analysis were from the entire event (00:00–04:00 UT) and the MLAT gates shown here are those that had
the longest KOD velocity time series (e.g., see Fig.2b) andhence largest number of points with both measurements. Inthe following analysis presented in Fig.4, most other MLATgates with measurements were considered. In Fig.3, thecolor coding is in KOD SNR and nominally conjugate gatesare highlighted by the grey background. The linear Pearsoncorrelation coefficients are given in the bottom-left cornerof each panel. The maximum coefficients for each row areshown in red. No additional data filtering of any kind was
www.ann-geophys.net/32/875/2014/ Ann. Geophys., 32, 875–888, 2014

880 R. A. Makarevich and W. A. Bristow: SuperDARN and PFISR F region observations
-1200 -800 -400 0 400PF -Vel, m/s
-1200
-800
-400
0
400
SD V
el, m
/s
0.551
-1200
-800
-400
0
400
SD V
el, m
/s
0.631
-1200
-800
-400
0
400
SD V
el, m
/s
0.499
PF 68.6o
-1200
-800
-400
0
400
SD V
el, m
/s
0.492
-800 -400 0 400PF -Vel, m/s
0.443
0.570
0.535
PF 68.8o
0.410
-800 -400 0 400PF -Vel, m/s
0.348
0.509
0.538
PF 69.0o
0.415
-800 -400 0 400PF -Vel, m/s
0.332
SD 68.6
o 1215 km
0.535
SD 69.0
o 1260 km
0.585
SD 69.4
o 1305 km
PF 69.1o
0.412
SD 69.8
o 1350 km
0
10
20
30
40
50
SNR, dB
Figure 3. Scatter plots of the SuperDARN KOD Doppler velocity (SD Vel) in beam 3 versus the reversed PFISR ion drift velocity in beam64079 (PF-Vel). The columns (rows) refer to 4 selected MLATs of the PFISR (KOD) observations as given at the top (right). The points arecolor-coded in SNR measured by KOD. The digits in the bottom-left corner of each panel show the linear Pearson correlation coefficientbetween the two velocity data sets. The red digits indicate the maximum correlation for a given KOD range gate (within the PF range gatesconsidered here). The panel highlighted with a grey background refers to the nominally matched MLATs (also within the considered PFgates).
employed here except that we required that at least 10 % ofeach PFISR integration period contained KOD echoes foreach range gate (i.e.,≥ 6 echoes out of possible 60 in eachmin). Higher threshold values of 30, 50, and 70 % were alsoconsidered, with results presented in Fig.4.
Despite the minimum amount of requirements, both visualagreement and correlations are reasonable. To be more ac-curate, the 99 % confidence levels for the data sets shownwere∼ 0.2, which means that correlations of 0.3–0.6 werestatistically significant. In fact, when one considers echoeswith larger SNR values, the agreement appears even better asred points tend to cluster more around the ideal coincidenceline. Correlations change within∼ 20 % of maximum valuewithin the top 3 rows and within∼40% within the bottom
row. For the 2nd and 4th rows, the maximum correlation isobserved at the nominally conjugate gate, while for the othertwo rows it is observed at lower MLAT bins for KOD (by0.5◦).
The last observation about Fig.3 is that there is a largespread of points in each panel. The correlation analysis takesthis into account and, for our samples, the correlations werehighly significant as discussed above. What correlation anal-ysis does not take into account is uncertainties in individ-ual points. For SuperDARN measurements, these uncertain-ties are represented by velocity error and, to some extent,spectral width estimates. The errors in individual velocitiesare usually small and most uncertainty after post-integrationcomes from velocity standard deviation. It is also generally
Ann. Geophys., 32, 875–888, 2014 www.ann-geophys.net/32/875/2014/

R. A. Makarevich and W. A. Bristow: SuperDARN and PFISR F region observations 881
66
67
68
69
70
SD M
LAT,
deg
10%
(a)
0.0
0.2
0.4
0.6
0.8
1.0
Corr
30%
(b)
66 67 68 69 PFISR MLAT, deg
66
67
68
69
70
SD M
LAT,
deg
50%
(c)
66 67 68 69 70PFISR MLAT, deg
70%
(d)
Figure 4. Matrices of correlation coefficients between the KODand PFISR velocity measurements for various minimum percent-age coverage of the PFISR integration periods by KOD (see text fordetails).
understood that spectral widths exceeding 200 m s−1 requirecareful interpretation, small widths may indicate ground-scatter contamination, and typical widths of ionospheric F re-gion echoes are on the order of 150 m s−1 (Ponomarenkoand Waters, 2006). Our observations were fully consistentwith these general results, as∼ 50 % of all points had widthsof 50–100 m s−1 and the other half had widths of 100–200 m s−1, with only a small fraction (< 1 %) having largewidths> 200 m s−1. The high statistical significance of cor-relations and the absence of large-error/large-width pointsgives additional confidence in results presented in Fig.3.
Figure 4 examines the velocity cross-correlations forbroader MLAT intervals. Figure3 presented only 4 PFISRgates× 4 KOD gates = 16 points of cross-correlation. Fig-ure 4 now presents 17× 13 = 221 points. The MLAT gatesthat were shown in Fig.3 refer to the top-right portion ofFig. 4a. The different panels a–d show the correlations cal-culated for different minimum requirements for KOD datacoverage of (or, equivalently, KOD echo occurrence during)the PFISR integration intervals. Thus this requirement is thesame for Fig.4a as for Fig.3, that is, KOD had to observeat least six echoes during each of the 60 s PFISR integra-tion intervals for this point to be included in the data set andcorrelation calculation. For panels b, c, and d, this minimumrequirement was, respectively, 30 % or 18 echoes, 50 % or30 echoes, and 70 % or 42 echoes. The dashed diagonal lineindicates nominally conjugate locations.
One feature that is immediately obvious in Fig.4 is gen-erally improving correlations with a MLAT increase. Par-ticularly low and negative correlations are observed belowMLAT of ∼ 68◦ and to the right of the diagonal line. FromFig. 1, there is nothing particularly special about this MLAT;it is in the middle of the PFISR coverage range and E regionrange gates (180–810 km) are at much lower MLATs. Fig-ure2b shows, however, that KOD did not observe many high-velocity echoes below∼ 68◦. Pearson correlations are some-what sensitive to the range of values, being higher over largerranges of values for linearly correlated quantities, which mayhave contributed to low correlation values at these MLATs.It is also possible that the lower correlations simply reflecthigher variability of the KOD and/or PFISR measurements atlower MLATs. Correlations are considerably higher at higherMLATs and close to the dashed line of perfect conjugacy;this data subset was shown in Fig.3.
Figure4 clearly demonstrates that the correlation progres-sively improves from panel a to d. Thus for 10 % mini-mum occurrence in panel a it is 0.5–0.6 in the top-right cor-ner where peak correlations are observed, while for 70 % inpanel d it is 0.7–0.9, also in the top-right corner. Improve-ment is also observed in other parts of the panels (gener-ally to the left of the dashed line). This means that betterKOD/PFISR agreement is achieved for greater KOD echooccurrence. A similar analysis was also conducted using pro-gressively larger KOD SNR thresholds instead of percent oc-currence (not presented here). A very similar correlation in-crease was obtained, which is perhaps not surprising sincelarger echo occurrence usually means larger echo power.
Figure4 also shows that many contours of significant pos-itive correlation are roughly aligned with the diagonal lineof nominally conjugate locations, for example, the contourof 0.4 (green) in panels c and d. The situation is not asstraightforward with contours near maxima, as some KODrange/MLAT bins appear to have larger correlations (e.g.,MLAT of 69◦ in panel b and MLAT of 68◦ in panel d). Itis possible that this is due to cross-range interference that isknown to be stronger for certain ranges (Ponomarenko andWaters, 2006). Despite this, correlation maxima tend to benear the diagonal line in panels c and d, which is to be ex-pected if the mapping model works reasonably well. Theoverall conclusion from this analysis is, therefore, that thehigher occurrence or SNR threshold used for velocity com-parisons, the better the expected agreement. This may appearto be a trivial (i.e., widely expected) result but, importantly,we show that no evidence of saturation in improvement isseen. This implies that this effect is strong and may, in part,be responsible for the observed correlation improvementsfrom one data set to another when velocity filtering or otherimprovements are applied. Since power itself is dependent ondensity and convection velocity, this makes interpreting theresults of velocity comparisons particularly challenging.
www.ann-geophys.net/32/875/2014/ Ann. Geophys., 32, 875–888, 2014
882 R. A. Makarevich and W. A. Bristow: SuperDARN and PFISR F region observations
0 1000 2000 3000 VE, m/s
0
10
20
30
40
50
SNR,
dB
0 1000 2000 3000 VE, m/s
0 1000 2000 3000 VE, m/s
0 1000 2000 3000 4000VE, m/s
SD 68.6
o 1215 km
0
10
20
30
40
50
SNR,
dB
SD 69.0
o 1260 km
0
10
20
30
40
50
SNR,
dB
SD 69.4
o 1305 km
PF 68.25o
0
10
20
30
40
50
SNR,
dB
PF 68.50o
PF 68.75o
PF 69.00o
SD 69.8
o 1350 km
10.0
10.5
11.0
11.5
12.0
log Ne, m-3
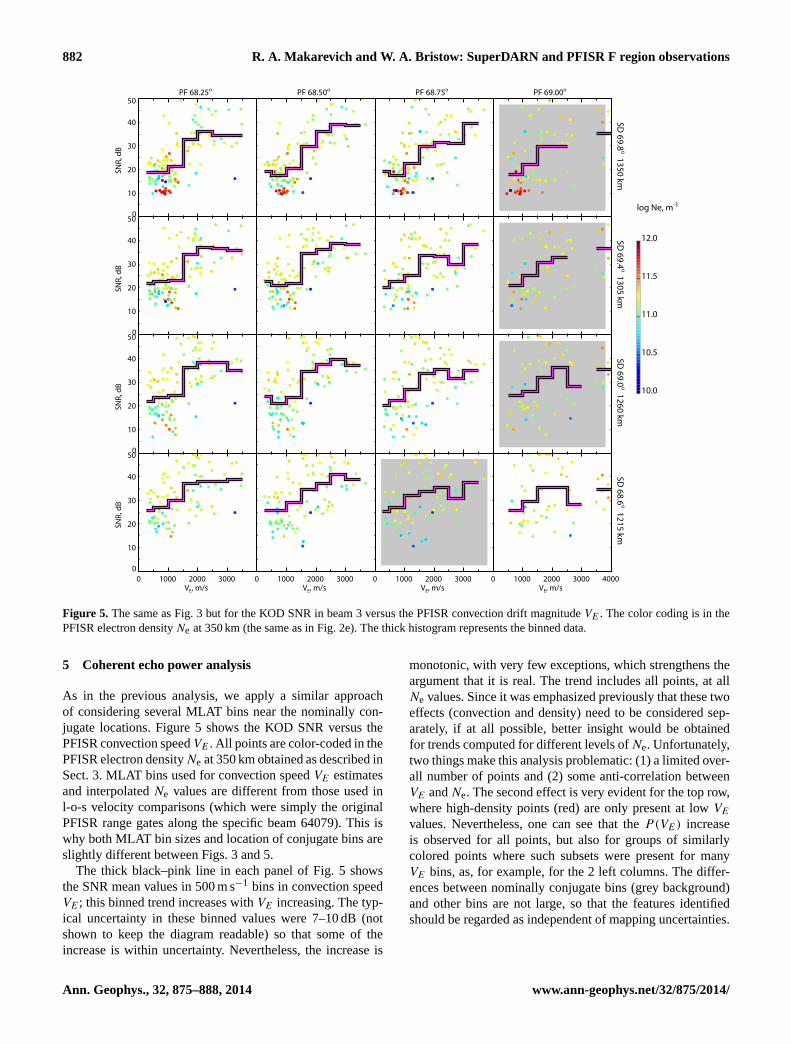
Figure 5. The same as Fig.3 but for the KOD SNR in beam 3 versus the PFISR convection drift magnitudeVE . The color coding is in thePFISR electron densityNe at 350 km (the same as in Fig.2e). The thick histogram represents the binned data.
5 Coherent echo power analysis
As in the previous analysis, we apply a similar approachof considering several MLAT bins near the nominally con-jugate locations. Figure5 shows the KOD SNR versus thePFISR convection speedVE . All points are color-coded in thePFISR electron densityNe at 350 km obtained as described inSect.3. MLAT bins used for convection speedVE estimatesand interpolatedNe values are different from those used inl-o-s velocity comparisons (which were simply the originalPFISR range gates along the specific beam 64079). This iswhy both MLAT bin sizes and location of conjugate bins areslightly different between Figs.3 and5.
The thick black–pink line in each panel of Fig.5 showsthe SNR mean values in 500 m s−1 bins in convection speedVE ; this binned trend increases withVE increasing. The typ-ical uncertainty in these binned values were 7–10 dB (notshown to keep the diagram readable) so that some of theincrease is within uncertainty. Nevertheless, the increase is
monotonic, with very few exceptions, which strengthens theargument that it is real. The trend includes all points, at allNe values. Since it was emphasized previously that these twoeffects (convection and density) need to be considered sep-arately, if at all possible, better insight would be obtainedfor trends computed for different levels ofNe. Unfortunately,two things make this analysis problematic: (1) a limited over-all number of points and (2) some anti-correlation betweenVE andNe. The second effect is very evident for the top row,where high-density points (red) are only present at lowVE
values. Nevertheless, one can see that theP(VE) increaseis observed for all points, but also for groups of similarlycolored points where such subsets were present for manyVE bins, as, for example, for the 2 left columns. The differ-ences between nominally conjugate bins (grey background)and other bins are not large, so that the features identifiedshould be regarded as independent of mapping uncertainties.
Ann. Geophys., 32, 875–888, 2014 www.ann-geophys.net/32/875/2014/
R. A. Makarevich and W. A. Bristow: SuperDARN and PFISR F region observations 883
10.0 10.5 11.0 11.5 log Ne, m-3
0
10
20
30
40
50
SNR,
dB
10.0 10.5 11.0 11.5 log Ne, m-3
10.0 10.5 11.0 11.5 log Ne, m-3
10.0 10.5 11.0 11.5 12.0log Ne, m-3
SD 68.6
o 1215 km
0
10
20
30
40
50
SNR,
dB
SD 69.0
o 1260 km
0
10
20
30
40
50
SNR,
dB
SD 69.4
o 1305 km
PF 68.25o
0
10
20
30
40
50
SNR,
dB
PF 68.50o
PF 68.75o
PF 69.00o
SD 69.8
o 1350 km
0
800
1600
2400
3200
4000
VE, m/s
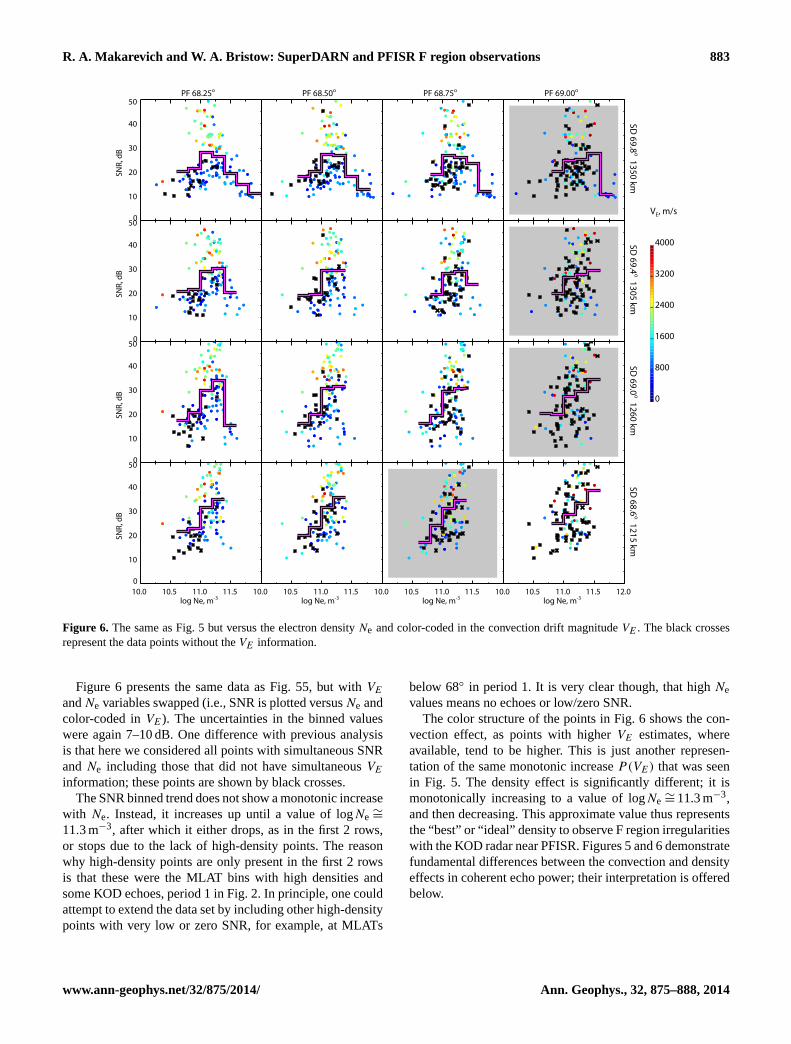
Figure 6. The same as Fig.5 but versus the electron densityNe and color-coded in the convection drift magnitudeVE . The black crossesrepresent the data points without theVE information.
Figure6 presents the same data as Fig. 55, but with VE
andNe variables swapped (i.e., SNR is plotted versusNe andcolor-coded inVE). The uncertainties in the binned valueswere again 7–10 dB. One difference with previous analysisis that here we considered all points with simultaneous SNRandNe including those that did not have simultaneousVE
information; these points are shown by black crosses.The SNR binned trend does not show a monotonic increase
with Ne. Instead, it increases up until a value of logNe ∼=
11.3 m−3, after which it either drops, as in the first 2 rows,or stops due to the lack of high-density points. The reasonwhy high-density points are only present in the first 2 rowsis that these were the MLAT bins with high densities andsome KOD echoes, period 1 in Fig.2. In principle, one couldattempt to extend the data set by including other high-densitypoints with very low or zero SNR, for example, at MLATs
below 68◦ in period 1. It is very clear though, that highNevalues means no echoes or low/zero SNR.
The color structure of the points in Fig.6 shows the con-vection effect, as points with higherVE estimates, whereavailable, tend to be higher. This is just another represen-tation of the same monotonic increaseP(VE) that was seenin Fig. 5. The density effect is significantly different; it ismonotonically increasing to a value of logNe ∼= 11.3 m−3,and then decreasing. This approximate value thus representsthe “best” or “ideal” density to observe F region irregularitieswith the KOD radar near PFISR. Figures5 and6 demonstratefundamental differences between the convection and densityeffects in coherent echo power; their interpretation is offeredbelow.
www.ann-geophys.net/32/875/2014/ Ann. Geophys., 32, 875–888, 2014

884 R. A. Makarevich and W. A. Bristow: SuperDARN and PFISR F region observations
6 Discussion
In this study, plasma wave characteristics in the auroral F re-gion were analyzed using coordinated radar observationswith the Kodiak coherent HF radar and PFISR facility inAlaska. The data were collected during the first PINOT cam-paign during which the two radar systems provided coinci-dent measurements of irregularity and ambient plasma char-acteristics near PFISR including in the same meridional di-rection. This allowed us to match the radar data in timewithin 1 s, while accounting for spatial effects by conductingcross-comparisons between different range gates, in order toinvestigate the fundamental relationships between the irreg-ularity phase and convection velocityV irr(V E) and betweenthe irregularity power, convection velocity, and ambient elec-tron densityP(V E,Ne).
6.1 Irregularity and convection velocities
Comparisons between the coincident Doppler velocity mea-surements by coherent and incoherent radar system have at-tracted significant research effort in the past, Sect.1. Thisanalysis is important for verification of the equivalence be-tween the small-scale irregularity velocity and large-scaleconvection velocity, a principle that enables observations ofionospheric plasma convection dynamics with coherent HFradars such as SuperDARN. While the equivalence principleitself is widely accepted both from the theoretical and exper-imental points of view (e.g., see the review byChisham et al.,2007), detailed analysis results often contain hints as to howto fine-tune radar data processing and analysis methods.
One important point that was recognized early on was dif-ferent sizes of the radar sampling volume between coherentand incoherent scatter radar techniques (Ruohoniemi et al.,1987; Davies et al., 1999). At typical 1000 km ranges fromthe radar site where CSR/ISR comparisons are normally con-ducted, at standard 45 km range resolution, and at typicalsounding frequencies of 10–12 MHz, these sizes in the hori-zontal plane are on the order of 50 km× 100 km for coher-ent versus 5 km× 50 km for incoherent radar measurements(Ruohoniemi et al., 1987). Thus, while both systems are mea-suring the same parameter physically (plasma velocity), theplasma parcels they refer to have different scales and cantherefore exhibit some differences in velocity at any giventime if the plasma flow is highly nonuniform. If the flow isrelatively uniform, smaller differences are expected. In largepart because of this expectation, various restrictions are of-ten employed in CSR/ISR and CSR/LEO comparative stud-ies such as velocity filtering and selection of uniform-flowevents (e.g.,Davies et al., 1999; Drayton et al., 2005; Gillieset al., 2009). The other related aspect is possible effects ofground and E region scatter, both of which can effectivelysuppress HF radar velocity significantly below the convec-tion component (Davies et al., 1999; Chisham and Pinnock,2002; Makarevitch et al., 2004). While standard criteria on
coherent echo velocity, width, and range eliminate most ofground and E region echoes, additional restrictions have beenshown to improve correlations with ISR measurements evenfurther, from∼ 0.7 linear correlations to∼ 0.9 (Gillies et al.,2009).
In the current study, a somewhat different approach hasbeen employed as described below. First, we focus on ob-servations from Channel B of KOD. In this channel, KODmeasurements were collected from one fixed direction only(beam 3) but at 1 s resolution. This is comparable with typ-ical integration periods of standard SuperDARN modes thathave been employed in the past, that is, integrations of 3 s(fast scan) or 7 s (normal scan) per beam with all 16 beamsscanned in 60 or 120 s. However, the important difference isthat no scanning was done on Channel B, which allowed us topost-integrate the KOD data using the same (within 1 s) timeintervals as those used in the PFISR data analysis. This is incontrast with previous studies that used scanning modes andcompared SuperDARN data at 3 or 7 s integration with 20–100 s integrations for ISR data (e.g.,Davies et al., 1999; Xuet al., 2001). Combined with PFISR ability to also providequasi-continuous data from a number of directions, includingseveral that were aligned with KOD beam 3 (Fig.1) this al-lowed us to strictly match measurements in time. Moreover,characterization of post-integrated KOD data in terms of co-herent echo occurrence or power for each post-integrateddata point allowed us to investigate the dependence of cor-relation on these measures related to data quality.
The results of this new analysis showed that the qual-ity of agreement expressed as linear correlation strongly de-pends on the KOD coverage of PFISR integration periodsor, equivalently, on the coherent echo occurrence (Fig.4).For minimum considered coverage levels of 10 %, the cor-relations were on the order of 0.5, but rising significantlyto 0.7–0.9 for coverages exceeding 70 % (Fig.4). Since thiswhole analysis was based on single-fixed-beam observationsin Channel B, it is instructive to compare the results withthose based on multiple-beam data from Channel A whereno post-integration was possible. These results were largelysimilar, in that the KOD Channel A velocities also exhib-ited significant positive correlations with PFISR ion drift ve-locities. The correlation magnitudes were similar to those inFigs.3and4a, but lower than those for higher coverage levelsin Fig. 4b–d, with the maximum correlations of 0.5–0.6, thatis, lower by 0.2–0.3 than maximum correlations with KODvelocities in Channel B.
These results indicate that substantial improvements inagreement between the irregularity and convection velocitymeasurements can be achieved if continuous single-beamvelocity measurements are available, for example, fromChannel B of “stereo” HF radars. The availability of high-time-resolution continuous measurements for a HF radarmeans that the measurements from two radar systems canbe matched in time exactly (within 1 s for the current study).
Ann. Geophys., 32, 875–888, 2014 www.ann-geophys.net/32/875/2014/

R. A. Makarevich and W. A. Bristow: SuperDARN and PFISR F region observations 885
The important and nontrivial point about the irregularityand convection velocity comparisons is that improved agree-ment, in general,does not meanimproved data quality. Onecan argue however, that improved agreementwould meanim-proved data quality if one assumes that the irregularity andconvection velocity in the F regionmust beequivalent, as the-ory predicts and most observations show. Under this equiva-lence principle, the greater degree of agreement is, the betterthe data quality must be. In this context, the current resultssuggest that improvements in overall measurement qualityof coherent echo characteristics can be achieved by usinglonger integration times. This argument is not restricted tosingle-beam measurements, but it is those measurements thatprovide additional opportunities to verify and ultimately relyon the velocity equivalence principle.
A central issue here is also that the measurement quality isnot just the values of parameters measured, but also the spa-tial and temporal intervals they refer to. The present studyreinforces the importance of the well-known but sometimesoverlooked differences between integration, resolution, andcadence time intervals, by demonstrating the high value andquality of measurements for which integration is conductedover the entire cadence interval. A highly expected but not of-ten demonstrated result here is that integrated measurementswould represent this interval better, if more of them comefrom it.
At the same time, multiple-beam measurements are nor-mally used in SuperDARN since improvements would beachieved at the expense of data statistics. The importantnew results of the current study were also that no saturationwas observed in quality of agreement with increasing cov-erage/occurrence level and that substantial improvements inagreement do not necessarily require sophisticated data se-lection procedures. Large magnitudes of improvement andabsence of saturation even suggest that strictly matching thedata in time may be more important than, say, matching themin space or applying other restrictions.
On the issue of spatial differences between SuperDARNand ISR measurement volumes, one complication is thatneither height nor horizontal position is known accuratelyfor SuperDARN measurements as discussed below. Thesame ionospheric refraction that enables backscatter mea-surements from the high-latitude F region, makes the map-ping task more challenging at HF frequencies. This wasone reason why a new virtual height model has been devel-oped byChisham et al.(2008) and tested for accuracy byYeoman et al.(2008) using known locations of artificiallygenerated backscatter. The new model showed substantialimprovements, particularly at further SuperDARN ranges. Atthe 1000–1500 km ranges of interest both models are accu-rate within 15 km, as demonstrated byYeoman et al.(2001)for the standard andYeoman et al.(2008) for the new model,respectively.
In the current study both virtual height models have beenused to calculate geographic positions of HF range gates
(Fig. 1a) and the AACGM model was then used to convertthem into geomagnetic coordinates (Fig.1b). As expected forthese ranges, only minor differences were found between themodel results, but since PFISR range gates were∼ 3 timessmaller in MLAT extent than those of KOD, this resulted inslight differences in nominally conjugate gate pairs. To ad-dress the issue of spatial differences/uncertainties, the currentstudy considered several range/MLAT bins in the vicinity ofnominally conjugate pairs (Figs.3–6). Since all features ofinterest were observed in majority of gates with few excep-tions, the results of the current study should be regarded asindependent of the mapping model and associated uncertain-ties.
6.2 Factors controlling coherent echo power
The other fundamental relationship under investigation wasa dependence of coherent echo power or SNR on the con-vection velocity and electron densityP(V E,Ne). The de-pendence on the convection velocityV E or, equivalently, onthe electric fieldE is expected from the GDI theory, sincethe growth rate of GDI wavesγ is proportional to the mag-nitude of convection velocity relative to that of the neutralgas or the slip velocityV0 = VE −Vn (Linson and Workman,1970; Huba et al., 1983; Keskinen, 1984). In our observa-tions, convection velocities were between 200–4000 m s−1
(Fig. 5) and for most of the interval of interest,VE was vary-ing on timescales of 20–30 min (Fig.2d). In this situation, theneutral winds are very unlikely to respond to ion convectionso that to largely cancel variations inVE . Previous investi-gations at similar auroral latitudes demonstrated that neutralwinds typically respond to ion convection with a time lag of30–40 min and do not exceed 200–300 m s−1 (Kosch et al.,2010). The present observations were conducted during thedaytime hours (11:00–15:00 MLT) and no optical measure-ments of neutral drifts were available. One expects, though,that under these conditions, fast and strong variations inVE
should result in similarly fast and strong variations inV0and hence GDI growth rateγ . While the relationship be-tween the instability growth rateγ and backscatter poweris far from being straightforward, it is often assumed thathigher growth rates result in stronger perturbation densitiesδNe which, in turn, means stronger backscatter power sinceP ∝ |δNe|
2 (e.g.,Schlegel, 1996).The previous experimental efforts, however, were largely
inconclusive with respect to the expected convection effectin F region backscatter power. ThusDanskin et al.(2002)found only some increase of power versus electric field up toE = 80 mV m−1 or VE = 1600 m s−1. The increase observedby Danskin et al.(2002) was not really monotonic (see theirFig. 8a). The absence of clear results may, in part, be at-tributed to limited range of availableVE values and othercompeting effects that are difficult to separate from that ofVE , particularly density-related effects such as absorptionand propagation. In this context, the important new result of
www.ann-geophys.net/32/875/2014/ Ann. Geophys., 32, 875–888, 2014

886 R. A. Makarevich and W. A. Bristow: SuperDARN and PFISR F region observations
the current study is the convection effects are much moreevident for extendedVE range of up to 3500–4000 m s−1
(Fig. 5). In addition, simultaneous consideration of densityand convection velocity aided in separating these effects,even though the separation was not complete, due to lim-ited statistics andVE − Ne anticorrelation, as was discussedin Sect.5. The present study thus strengthens the notion ofthe backscatter power being affected by convection strengthin support of the above theoretical argument. In particular,the results are largely consistent with the notion of perturba-tion density increasing with the convection electric field. Thisis a relatively well-established result in the E region (e.g.,Haldoupis et al., 1984, 1990), but not in the F region, whereexperimental evidence is largely lacking.
A closely related effect is power dependence on the back-ground electron densityNe. One aspect of the problem ispropagation conditions. One expects these conditions to beunfavorable for both low and high density values since aradar beam would not reach orthogonality with a magneticfield. This is precisely what has been observed in the presentstudy (Figs.2 and6). These effects are well known and oftendiscussed in HF radar studies focusing on occurrence and/orpower analysis of F region irregularities (Milan et al., 1997;Danskin et al., 2002; Koustov et al., 2004).
There is potentially one other effect, however, that re-ceived much less attention and that may have contributed tothe trends observed in the current study. This effect involvesbackground density indirectly affecting the perturbation den-sity as explained below. The key question here is if and howthe instability processes affect the fractional densityδNe/Nerather than the perturbation densityδNe itself. The answer tothis question is largely unknown for the F region irregular-ities. It has been suggested however, that for their E regioncounterparts, the fractional density is controlled by the elec-tric field E or by the convection speedVE (e.g.,Kustov et al.,1988; Haldoupis et al., 1990; Schlegel, 1996), so that
P(VE,Ne) ∝ |δNe/Ne|2N2
e = f (VE)N2e , (1)
wheref (VE) is some function of the convection speed. Forthe E region several possible dependenciesf (VE) have beensuggested, while in the F region the effect remains largelyuninvestigated.
In our observations, the F region backscatter power wasshown to increase withNe up until a certain value nearlogNe = 11.3 m−3 (Fig. 6). This was observed for both allpoints considered (i.e., for allVE values) and for subsets ofpoints with the sameVE values where such subsets werelarge enough (blue points in Fig.6). Hence, one can inter-pret the observed increaseP(Ne) as being due to the powercontrol by theN2
e factor in Eq. (1) in the situation when con-vection variations are small andf (VE) ≈ const. Of coursewhen convection variations are significant, their effect is toincrease power for largerVE values, as was also demon-strated in the current study. For example, for the group ofpoints near logNe = 11.3 m−3 in Fig. 6, the power increase
with Ne is stronger than it would be in the absence of anyvariations inVE . Importantly though, not all of the increasein power near this value is due to an increase inVE , sincean increase is clearly observed for only blue points in Fig.6.One can thus argue that the power increase with backgrounddensity is, at least to some extent, due to the indirect effectdescribed above.
The current study has attempted to experimentally sepa-rate the background density effects from those of the convec-tion velocity in the F region echo power and Eq. (1) can beviewed as one way to summarize two results of this investi-gation: (1) that these groups of effects are separable and (2)that the dependence on convection velocityf (VE) is mono-tonic and with little evidence of saturation.
Besides convection velocity and background density, theF region backscatter power may be affected by the conduc-tance of the underlying E region (Vickrey and Kelley, 1982).This effect is due to shorting of perturbation electric fieldsthrough highly conducting E layer. The experimental evi-dence for this effect remains inconclusive (Danskin et al.,2002; Kane et al., 2012), and unfortunately the current ex-perimental configuration did not allow us to shed any fur-ther light on it. PFISR is one of the few instruments thatcan provide high-quality data on density and hence conduc-tance. However, the PFISR E region ranges only extend upto MLAT of 66.5◦ (3 first pink lines in Fig.1b), thus overlap-ping only the first 3 range gates of PFISR in Fig.2d and only2 conjugate ranges of KOD in Fig.2b–c. In the current eventthese were most uninteresting gates, with fewer joint pointsand very few points with large density values (e.g., Fig.5), sothat a simultaneous investigation of three competing effectswas not possible.
7 Summary and conclusions
Analysis of coordinated radar observations of plasma wavecharacteristics in the auroral F region showed that
1. Agreements between l-o-s velocities measured usingcoherent and incoherent radar techniques improvesdrastically when data points are strictly matched in time(within 1 s) and when progressively stronger restrictionsare introduced on the number of ionospheric echoes de-tected by a coherent radar in a given analysis intervalor, equivalently, on its coverage of this interval. No sat-uration is observed in improvement as measured in lin-ear correlations for progressively stronger restrictions,which suggests that simultaneity in time is one of themain factors that control the quality of agreement. Thisstrengthens the notion of small-scale F region irregular-ities serving as tracers of large-scale plasma convection.Under the assumption of equivalence between the con-vection and irregularity velocities, it also provides analternative way to ensure the high quality of Dopplervelocity data.
Ann. Geophys., 32, 875–888, 2014 www.ann-geophys.net/32/875/2014/

R. A. Makarevich and W. A. Bristow: SuperDARN and PFISR F region observations 887
2. The F region backscatter power increases nearly mono-tonically with convection speed or, equivalently, withthe electric field magnitude, with little evidence of sat-uration at the highest observed convection drifts near3500 m s−1. This result is consistent with the irregu-larity growth rate increase with convection speed ex-pected from the linear theory of the gradient-drift in-stability. The power is also controlled strongly by thebackground density. The density effect is nonlinear withthe peak power observed near logNe = 11.3 m−3. Thepower increases with density in the density range be-low this value, which is likely due to under-refractionaffecting propagation and aspect conditions. Similarly,the power decrease above this critical value is likely tobe due to over-refraction. The power increase at lowerdensity values may also be due to an indirect densityeffect involving radar backscatter power proportionalityto both fractional perturbation density and backgrounddensity factors.
Acknowledgements.This research was supported by NSF grantsAGS-1243476, AGS-1242913, and AGS-1069024. The Poker FlatIncoherent Scatter Radar is operated by SRI International on be-half of the US National Science Foundation under NSF CooperativeAgreement AGS-1133009.
Topical Editor K. Hosokawa thanks two anonymous referees fortheir help in evaluating this paper.
References
Bahcivan, H., Nicolls, M. J., and Perry, G.: Comparison of Super-DARN irregularity drift measurements and F-region ion veloci-ties from the Resolute Bay ISR, J. Atmos. Sol.-Terr. Phys., 105,325–331, 2013.
Baker, K. B. and Wing, S.: A new magnetic coordinate system forconjugate studies at high latitudes, J. Geophys. Res., 94, 9139–9143, 1989.
Chisham, G. and Pinnock, M.: Assessing the contamination of Su-perDARN global convection maps by non-F-region backscat-ter, Ann. Geophys., 20, 13–28, doi:10.5194/angeo-20-13-2002,2002.
Chisham, G., Lester, M., Milan, S. E., Freeman, M. P., Bristow,W. A., Grocott, A., McWilliams, K. A., Ruohoniemi, J. M.,Yeoman, T., Dyson, P. L., Greenwald, R. A., Kikuchi, T., Pin-nock, M., Rash, J. P. S., Sato, N., Sofko, G. J., Villain, J.-P., and Walker, A. D. M.: A decade of the Super Dual Auro-ral Radar Network (SuperDARN): scientific achievements, newtechniques and future directions, Surv. Geophys., 28, 33–109,doi:10.1007/s10712-007-9017-8, 2007.
Chisham, G., Yeoman, T. K., and Sofko, G. J.: Mapping ionosphericbackscatter measured by the SuperDARN HF radars – Part 1:A new empirical virtual height model, Ann. Geophys., 26, 823–841, doi:10.5194/angeo-26-823-2008, 2008.
Danskin, D. W., Koustov, A. V., Ogawa, T., Nishitani, N., Nozawa,S., Milan, S. E., Lester, M., and Andre, D.: On the factors con-
trolling occurrence of F-region coherent echoes, Ann. Geophys.,20, 1385–1397, doi:10.5194/angeo-20-1385-2002, 2002.
Davies, J. A., Lester, M., Milan, S. E., and Yeoman, T. K.: A com-parison of velocity measurements from the CUTLASS Finlandradar and the EISCAT UHF system, Ann. Geophys., 17, 892–902, doi:10.1007/s00585-999-0892-9, 1999.
Drayton, R. A., Koustov, A. V., Hairston, M. R., and Villain,J.-P.: Comparison of DMSP cross-track ion drifts and Super-DARN line-of-sight velocities, Ann. Geophys., 23, 2479–2486,doi:10.5194/angeo-23-2479-2005, 2005.
Gillies, R. G., Hussey, G. C., Sofko, G. J., McWilliams, K. A., Fiori,R. A. D., Ponomarenko, P., and St.-Maurice, J.-P.: Improve-ment of SuperDARN velocity measurements by estimating theindex of refraction in the scattering region using interferometry,Geophys. Res. Lett., 114, A07305, doi:10.1029/2008JA013967,2009.
Gillies, R. G., Hussey, G. C., Sofko, G. J., Wright, D. M., andDavies, J. A.: A comparison of EISCAT and SuperDARN F-region measurements with consideration of the refractive indexin the scattering volume, Geophys. Res. Lett., 115, A06319,doi:10.1029/2009JA014694, 2010.
Greenwald, R. A., Baker, K. B., Dudeney, J. R., Pinnock, M., Jones,T. B., Thomas, E. C., Villain, J.-P., Cerisier, J.-C., Senior, C.,Hanuise, C., Hunsuker, R. D., Sofko, G., Koehler, J., Nielsen,E., Pellinen, R., Walker, A. D. M., Sato, N., and Yamagishi, H.:DARN/SuperDARN: A global view of the dynamics of high-latitude convection, Space Sci. Rev., 71, 763–796, 1995.
Haldoupis, C., Nielsen, E., and Ierkic, H. M.: STARE Doppler spec-tral studies of westward electrojet radar aurora, Planet. SpaceSci., 32, 1291–1300, 1984.
Haldoupis, C., Nielsen, E., and Schlegel, K.: Dependence of radarauroral scattering cross section on the ambient electron densityand the destabilizing electric field, Ann. Geophysicae, 8, 195–212, 1990.
Heinselman, C. J. and Nicolls, M. J.: A Bayesian approach to elec-tric field and E-region neutral wind estimation with the PokerFlat Advanced Modular Incoherent Scatter Radar, Radio Sci., 43,RS5013, doi:10.1029/2007RS003805, 2008.
Huba, J. D., Ossakow, S. L., Satyanarayana, P., and Guzdar, P. N.:Linear theory of theE × B instability with an inhomogeneouselectric field, J. Geophys. Res., 88, 425–435, 1983.
Kane, T. A., Makarevich, R. A., and Devlin, J. C.: HF radar obser-vations of ionospheric backscatter during geomagnetically quietperiods, Ann. Geophys., 30, 221–233, doi:10.5194/angeo-30-221-2012, 2012.
Keskinen, M. J.: Nonlinear theory of theE × B instability with aninhomogeneous electric field, J. Geophys. Res., 89, 3913–3920,1984.
Kosch, M. J., Anderson, C., Yiu, H.-C. I., Kellerman, A. C.,Makarevich, R. A., Aruliah, A., Conde, M., Griffin, E.,Davies, T., McWhirter, I., and Dyson, P. L.: First obser-vations of simultaneous inter-hemispheric conjugate high-latitude thermospheric winds, J. Geophys. Res., 115, A09328,doi:10.1029/2009JA015178, 2010.
Koustov, A. V., Sofko, G. J., André, D., Danskin, D. W., and Benke-vitch, L. V.: Seasonal variation of HF radar F region echo oc-currence in the midnight sector, J. Geophys. Res., 109, A06305,doi:10.1029/2003JA010337, 2004.
www.ann-geophys.net/32/875/2014/ Ann. Geophys., 32, 875–888, 2014

888 R. A. Makarevich and W. A. Bristow: SuperDARN and PFISR F region observations
Kustov, A. V., Uspenskii, M. V., and Williams, F. J. S.: Saturationeffects of auroral-electrojet turbulence, Geom. Aeron., 28, 923–927, 1988.
Linson, L. M. and Workman, J. B.: Formation of striations in iono-spheric plasma clouds, J. Geophys. Res., 75, 3211–3219, 1970.
Lyons, L. R., Zou, S., Heinselman, C. J., Nicolls, M. J., and Ander-son, P. C.: Poker Flat radar observations of the magnetosphere-ionosphere coupling electrodynamics of the earthward penetrat-ing plasma sheet following convection enhancements, J. Atmos.Sol.-Terr. Phys., 71, 717–728, 2009.
Makarevich, R. A.: HF radar observations of high-velocityE-regionechoes from the eastward auroral electrojet, J. Geophys. Res.,113, A09321, doi:10.1029/2008JA013204, 2008.
Makarevich, R. A.: On the occurrence of high-velocity E-regionechoes in SuperDARN observations, J. Geophys. Res., 115,A07302, doi:10.1029/2009JA014698, 2010.
Makarevitch, R. A., Honary, F., and Koustov, A. V.: SimultaneousHF measurements of E- and F-region Doppler velocities at largeflow angles, Ann. Geophys., 22, 1177–1185, doi:10.5194/angeo-22-1177-2004, 2004.
Milan, S. E., Yeoman, T. K., Lester, M., Thomas, E. C., andJones, T. B.: Initial backscatter occurrence statistics fromthe CUTLASS HF radars, Ann. Geophys., 15, 703–718,doi:10.1007/s00585-997-0703-0, 1997.
Ponomarenko, P. V. and Waters, C. L.: Spectral width of Super-DARN echoes: measurement, use and physical interpretation,Ann. Geophys., 24, 115–128, doi:10.5194/angeo-24-115-2006,2006.
Rishbeth, H. and Williams, P. J. S.: The EISCAT ionospheric radar:The system and its early results, Q. J. R. Astron. Soc., 26, 478–512, 1985.
Ruohoniemi, J. M., Greenwald, R. A., Baker, K. B., Villain, J. P.,and McCready, M. A.: Drift motions of small-scale irregularitiesin the high-latitude F region – An experimental comparison withplasma drift motions, J. Geophys. Res., 92, 4553–4564, 1987.
Schlegel, K.: Coherent backscatter from ionospheric E-regionplasma irregularities, J. Atmos. Terr. Phys., 58, 933–941, 1996.
Tsunoda, R. T.: High-latitude F region irregularities – A review andsynthesis, Rev. Geophys., 26, 719–760, 1988.
Vickrey, J. F. and Kelley, M. C.: The effects of a conducting E layeron classical F region cross-field plasma diffusion, J. Geophys.Res., 87, 4461–4468, 1982.
Villain, J. P., Hanuise, C., and Caudal, G.: A SAFARI-EISCATcomparison between the velocity of F region small-scale irreg-ularities and the ion drift, Geophys. Res. Lett., 90, 8433–8443,1985.
Xu, L., Koustov, A. V., Thayer, J., and McCready, M. A.: Su-perDARN convection and Sondrestrom plasma drift, Ann. Geo-phys., 19, 749–759, doi:10.5194/angeo-19-749-2001, 2001.
Yeoman, T. K., Wright, D. M., Stocker, A. J., and Jones, T. B.: Anevaluation of range accuracy in the Super Dual Auroral radarNetwork over-the-horizon HF radar systems, Radio Sci., 36,801–813, 2001.
Yeoman, T. K., Chisham, G., Baddeley, L. J., Dhillon, R. S.,Karhunen, T. J. T., Robinson, T. R., Senior, A., and Wright,D. M.: Mapping ionospheric backscatter measured by the Su-perDARN HF radars – Part 2: Assessing SuperDARN virtualheight models, Ann. Geophys., 26, 843–852, doi:10.5194/angeo-26-843-2008, 2008.
Ann. Geophys., 32, 875–888, 2014 www.ann-geophys.net/32/875/2014/