Embed Size (px)
Citation preview


LLOOSS AANNGGEELLEESS UUNNIIFFIIEEDD SSCCHHOOOOLL DDIISSTTRRIICCTT
SSUUPPEERRIINNTTEENNDDEENNTT’’SS 22001144--1155 FFIINNAALL BBUUDDGGEETT
BOARD OF EDUCATION
Richard Vladovic, Board President Board District 7
Vacant, Board District 1 Steve Zimmer, Board District 4 Mónica García, Board District 2 Bennett Kayser, Board District 5 Tamar Galatzan, Board District 3 Mónica Ratliff, Board District 6
John E. Deasy
Superintendent of Schools
Megan Reilly Matt Hill Chief Financial Officer Chief Strategy Officer
Tony Atienza Director, Budget Services and Financial Planning
Prepared by Budget Services and Financial Planning Division
June 24, 2014


MEMBERS OF THE BOARD LOS ANGELES UNIFIED SCHOOL DISTRICT
June 12, 2014
To LAUSD’s Community of Stakeholders:
The past year has brought the biggest changes in school finance in the last 30 years. The Governor’s new Local
Control Funding Formula is now the primary means of funding K-12 education across the state. Bolstered by
the passage of Proposition 30 last year, and resulting increase in revenues, the funding model recognizes the
realities of educating students of different grades, and the greater needs of students who live in poverty, are
English learners, or are in a foster care placement. For the first time, the State is using a need-based model to
fund school districts, and we proudly support this model and the funding it brings to our highest need students.
While the formula indeed provides new funding for LAUSD, our challenge to the state is to fully fund the model
before the Governor’s Fiscal Year 2020-21 full funding goal.
Along with a new funding model has come new accountability, in the form of the Local Control Accountability
Plan. We support our schools to engage in strategic resource planning and allocation, and the District will now
engage in an annual process which closely mirrors the activities and process we encourage at our campuses.
This annual planning, embodied in the LCAP, allows LAUSD to identify our priorities, reflect the data
supporting our priorities, and to describe the actions and services we will take to address the issues or gaps we
see in student data. Further, we have identified goals, targets and metrics with which to measure our progress
toward our goals. And most critically, this new funding model requires the District to engage various
stakeholders in the discussion and planning of the LCAP; and creates new opportunities to meaningfully engage
our parents, staff, and community of stakeholders in discussion and learning about the needs of our students.
The Local Control Funding Formula and the Local Control Accountability Plan come together annually via the
District budget, where we demonstrate that our LCAP is not just a simple planning document, but one which
reflects the actionable priorities of the District for the coming 3 years. While LAUSD will receive new LCFF
funding, our needs outpace our resources, and we continue to prioritize resources to the areas of highest possible
academic impact as a result. We have written our first LCAP for FY 14-15, with much assistance from parents,
teachers, principals and other stakeholders, who attended our town halls, community meetings, presentations,
board meetings and who responded to our surveys and questions, without whom this document and our budget,
would not be possible. The budget behind this cover letter aligns to, and reflects, the priorities we’ve identified
as a community, in our LCAP. Because the LCAP is a 3-year plan, we will have the opportunity to revisit the
document annually to review and appraise our performance against the metrics we’ve identified in the plan. In
support of our continuing LCAP planning process, I have also included the Equity-Based Index for 2014-15.
I hope that you will join us in those discussions and our focus on improving outcomes for all of our students.
With hope,
Dr. John E. Deasy
Superintendent
Attachment
RICHARD A. VLADOVIC, Ed.D., PRESIDENT
TAMAR GALATZAN
MÓNICA GARCÍA
BENNETT KAYSER
MÓNICA RATLIFF
STEVEN ZIMMER
Administrative Office
333 South Beaudry Avenue, 24th Floor
Los Angeles, California 90017
Telephone: (213) 241-7000
Fax: (213) 241-8442
JOHN E. DEASY, Ph.D.
SUPERINTENDENT OF SCHOOLS

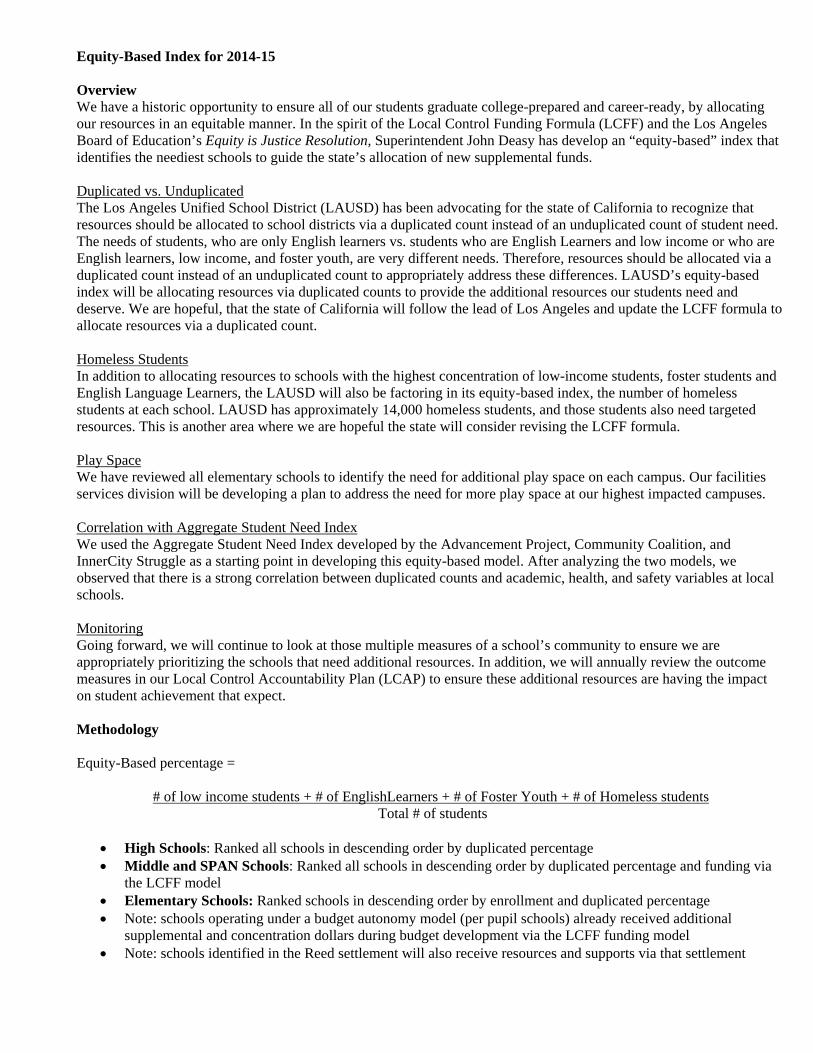
Equity-Based Index for 2014-15 Overview We have a historic opportunity to ensure all of our students graduate college-prepared and career-ready, by allocating our resources in an equitable manner. In the spirit of the Local Control Funding Formula (LCFF) and the Los Angeles Board of Education’s Equity is Justice Resolution, Superintendent John Deasy has develop an “equity-based” index that identifies the neediest schools to guide the state’s allocation of new supplemental funds. Duplicated vs. Unduplicated The Los Angeles Unified School District (LAUSD) has been advocating for the state of California to recognize that resources should be allocated to school districts via a duplicated count instead of an unduplicated count of student need. The needs of students, who are only English learners vs. students who are English Learners and low income or who are English learners, low income, and foster youth, are very different needs. Therefore, resources should be allocated via a duplicated count instead of an unduplicated count to appropriately address these differences. LAUSD’s equity-based index will be allocating resources via duplicated counts to provide the additional resources our students need and deserve. We are hopeful, that the state of California will follow the lead of Los Angeles and update the LCFF formula to allocate resources via a duplicated count. Homeless Students In addition to allocating resources to schools with the highest concentration of low-income students, foster students and English Language Learners, the LAUSD will also be factoring in its equity-based index, the number of homeless students at each school. LAUSD has approximately 14,000 homeless students, and those students also need targeted resources. This is another area where we are hopeful the state will consider revising the LCFF formula. Play Space We have reviewed all elementary schools to identify the need for additional play space on each campus. Our facilities services division will be developing a plan to address the need for more play space at our highest impacted campuses. Correlation with Aggregate Student Need Index We used the Aggregate Student Need Index developed by the Advancement Project, Community Coalition, and InnerCity Struggle as a starting point in developing this equity-based model. After analyzing the two models, we observed that there is a strong correlation between duplicated counts and academic, health, and safety variables at local schools. Monitoring Going forward, we will continue to look at those multiple measures of a school’s community to ensure we are appropriately prioritizing the schools that need additional resources. In addition, we will annually review the outcome measures in our Local Control Accountability Plan (LCAP) to ensure these additional resources are having the impact on student achievement that expect. Methodology Equity-Based percentage =
# of low income students + # of EnglishLearners + # of Foster Youth + # of Homeless students Total # of students
High Schools: Ranked all schools in descending order by duplicated percentage Middle and SPAN Schools: Ranked all schools in descending order by duplicated percentage and funding via
the LCFF model Elementary Schools: Ranked schools in descending order by enrollment and duplicated percentage Note: schools operating under a budget autonomy model (per pupil schools) already received additional
supplemental and concentration dollars during budget development via the LCFF funding model Note: schools identified in the Reed settlement will also receive resources and supports via that settlement


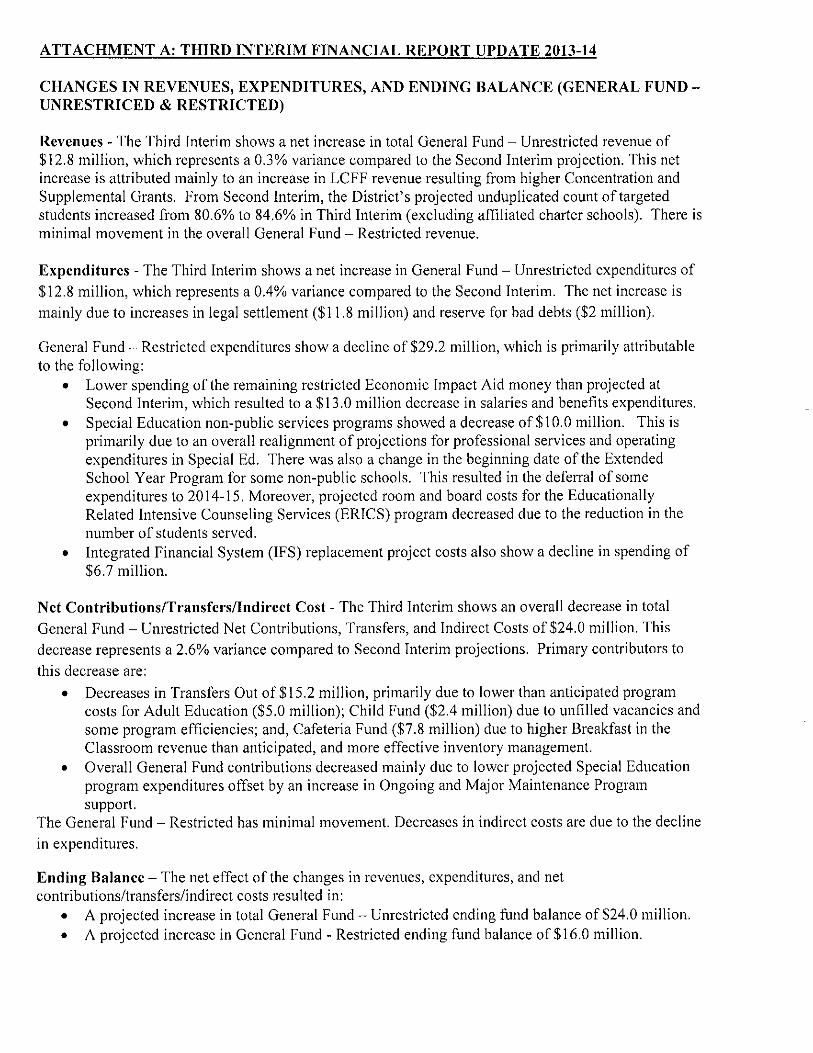

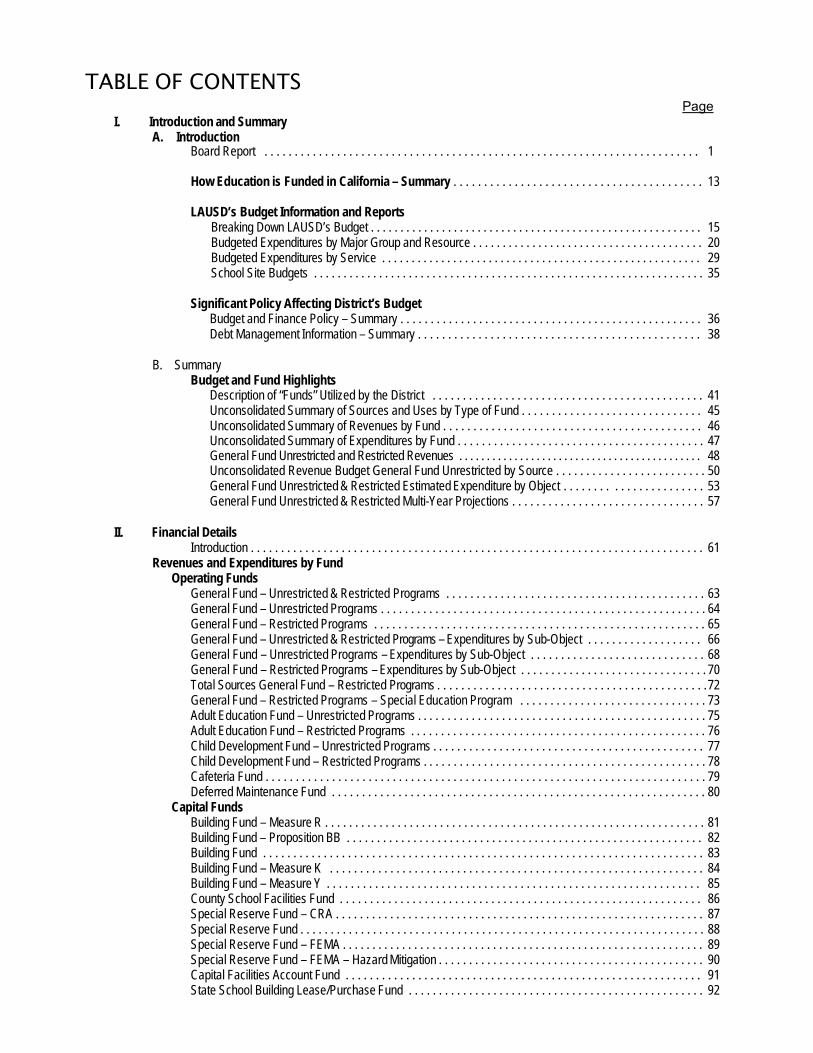
TABLE OF CONTENTS Page
I. Introduction and Summary A. Introduction
Board Report . . . . . . . . . . . . . . . . . . . . . . . . . . . . . . . . . . . . . . . . . . . . . . . . . . . . . . . . . . . . . . . . . . . . . . . . 1 How Education is Funded in California – Summary . . . . . . . . . . . . . . . . . . . . . . . . . . . . . . . . . . . . . . . . . 13
LAUSD’s Budget Information and Reports Breaking Down LAUSD’s Budget . . . . . . . . . . . . . . . . . . . . . . . . . . . . . . . . . . . . . . . . . . . . . . . . . . . . . . . . 15 Budgeted Expenditures by Major Group and Resource . . . . . . . . . . . . . . . . . . . . . . . . . . . . . . . . . . . . . . . 20 Budgeted Expenditures by Service . . . . . . . . . . . . . . . . . . . . . . . . . . . . . . . . . . . . . . . . . . . . . . . . . . . . . . 29 School Site Budgets . . . . . . . . . . . . . . . . . . . . . . . . . . . . . . . . . . . . . . . . . . . . . . . . . . . . . . . . . . . . . . . . . . 35
Significant Policy Affecting District’s Budget Budget and Finance Policy – Summary . . . . . . . . . . . . . . . . . . . . . . . . . . . . . . . . . . . . . . . . . . . . . . . . . . 36 Debt Management Information – Summary . . . . . . . . . . . . . . . . . . . . . . . . . . . . . . . . . . . . . . . . . . . . . . . 38
B. Summary
Budget and Fund Highlights Description of “Funds” Utilized by the District . . . . . . . . . . . . . . . . . . . . . . . . . . . . . . . . . . . . . . . . . . . . . 41 Unconsolidated Summary of Sources and Uses by Type of Fund . . . . . . . . . . . . . . . . . . . . . . . . . . . . . . 45 Unconsolidated Summary of Revenues by Fund . . . . . . . . . . . . . . . . . . . . . . . . . . . . . . . . . . . . . . . . . . . 46 Unconsolidated Summary of Expenditures by Fund . . . . . . . . . . . . . . . . . . . . . . . . . . . . . . . . . . . . . . . . . 47 General Fund Unrestricted and Restricted Revenues . . . . . . . . . . . . . . . . . . . . . . . . . . . . . . . . . . . . . . . . . . . . 48 Unconsolidated Revenue Budget General Fund Unrestricted by Source . . . . . . . . . . . . . . . . . . . . . . . . . 50 General Fund Unrestricted & Restricted Estimated Expenditure by Object . . . . . . . . . . . . . . . . . . . . . . . 53 General Fund Unrestricted & Restricted Multi-Year Projections . . . . . . . . . . . . . . . . . . . . . . . . . . . . . . . . 57
II. Financial Details
Introduction . . . . . . . . . . . . . . . . . . . . . . . . . . . . . . . . . . . . . . . . . . . . . . . . . . . . . . . . . . . . . . . . . . . . . . . . . . . 61 Revenues and Expenditures by Fund
Operating Funds General Fund – Unrestricted & Restricted Programs . . . . . . . . . . . . . . . . . . . . . . . . . . . . . . . . . . . . . . . . . . . 63 General Fund – Unrestricted Programs . . . . . . . . . . . . . . . . . . . . . . . . . . . . . . . . . . . . . . . . . . . . . . . . . . . . . . 64 General Fund – Restricted Programs . . . . . . . . . . . . . . . . . . . . . . . . . . . . . . . . . . . . . . . . . . . . . . . . . . . . . . . 65 General Fund – Unrestricted & Restricted Programs – Expenditures by Sub-Object . . . . . . . . . . . . . . . . . . . 66 General Fund – Unrestricted Programs – Expenditures by Sub-Object . . . . . . . . . . . . . . . . . . . . . . . . . . . . . 68 General Fund – Restricted Programs – Expenditures by Sub-Object . . . . . . . . . . . . . . . . . . . . . . . . . . . . . . . 70 Total Sources General Fund – Restricted Programs . . . . . . . . . . . . . . . . . . . . . . . . . . . . . . . . . . . . . . . . . . . . . 72 General Fund – Restricted Programs – Special Education Program . . . . . . . . . . . . . . . . . . . . . . . . . . . . . . . 73 Adult Education Fund – Unrestricted Programs . . . . . . . . . . . . . . . . . . . . . . . . . . . . . . . . . . . . . . . . . . . . . . . . 75 Adult Education Fund – Restricted Programs . . . . . . . . . . . . . . . . . . . . . . . . . . . . . . . . . . . . . . . . . . . . . . . . . 76 Child Development Fund – Unrestricted Programs . . . . . . . . . . . . . . . . . . . . . . . . . . . . . . . . . . . . . . . . . . . . . 77 Child Development Fund – Restricted Programs . . . . . . . . . . . . . . . . . . . . . . . . . . . . . . . . . . . . . . . . . . . . . . . 78 Cafeteria Fund . . . . . . . . . . . . . . . . . . . . . . . . . . . . . . . . . . . . . . . . . . . . . . . . . . . . . . . . . . . . . . . . . . . . . . . . . 79 Deferred Maintenance Fund . . . . . . . . . . . . . . . . . . . . . . . . . . . . . . . . . . . . . . . . . . . . . . . . . . . . . . . . . . . . . . 80
Capital Funds Building Fund – Measure R . . . . . . . . . . . . . . . . . . . . . . . . . . . . . . . . . . . . . . . . . . . . . . . . . . . . . . . . . . . . . . . 81 Building Fund – Proposition BB . . . . . . . . . . . . . . . . . . . . . . . . . . . . . . . . . . . . . . . . . . . . . . . . . . . . . . . . . . . 82 Building Fund . . . . . . . . . . . . . . . . . . . . . . . . . . . . . . . . . . . . . . . . . . . . . . . . . . . . . . . . . . . . . . . . . . . . . . . . . 83 Building Fund – Measure K . . . . . . . . . . . . . . . . . . . . . . . . . . . . . . . . . . . . . . . . . . . . . . . . . . . . . . . . . . . . . . 84 Building Fund – Measure Y . . . . . . . . . . . . . . . . . . . . . . . . . . . . . . . . . . . . . . . . . . . . . . . . . . . . . . . . . . . . . . 85 County School Facilities Fund . . . . . . . . . . . . . . . . . . . . . . . . . . . . . . . . . . . . . . . . . . . . . . . . . . . . . . . . . . . . 86 Special Reserve Fund – CRA . . . . . . . . . . . . . . . . . . . . . . . . . . . . . . . . . . . . . . . . . . . . . . . . . . . . . . . . . . . . . 87 Special Reserve Fund . . . . . . . . . . . . . . . . . . . . . . . . . . . . . . . . . . . . . . . . . . . . . . . . . . . . . . . . . . . . . . . . . . . 88 Special Reserve Fund – FEMA . . . . . . . . . . . . . . . . . . . . . . . . . . . . . . . . . . . . . . . . . . . . . . . . . . . . . . . . . . . . 89 Special Reserve Fund – FEMA – Hazard Mitigation . . . . . . . . . . . . . . . . . . . . . . . . . . . . . . . . . . . . . . . . . . . . 90 Capital Facilities Account Fund . . . . . . . . . . . . . . . . . . . . . . . . . . . . . . . . . . . . . . . . . . . . . . . . . . . . . . . . . . . 91 State School Building Lease/Purchase Fund . . . . . . . . . . . . . . . . . . . . . . . . . . . . . . . . . . . . . . . . . . . . . . . . . 92
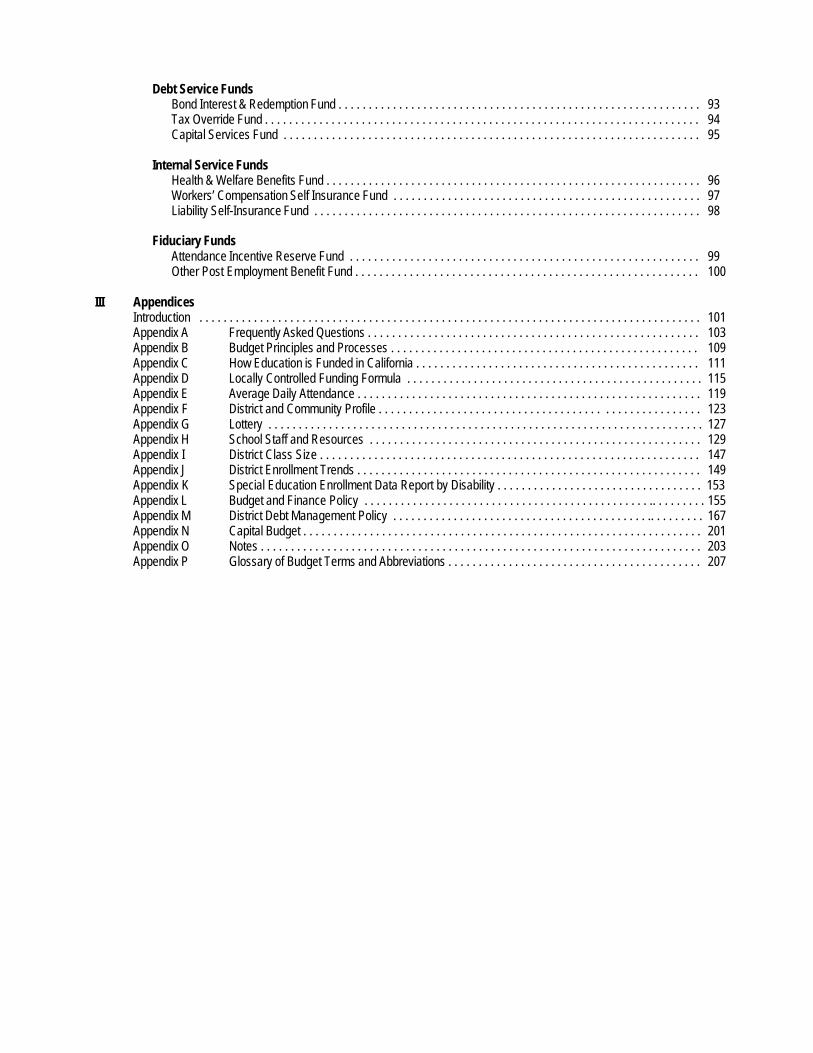
Debt Service Funds
Bond Interest & Redemption Fund . . . . . . . . . . . . . . . . . . . . . . . . . . . . . . . . . . . . . . . . . . . . . . . . . . . . . . . . . . . . 93 Tax Override Fund . . . . . . . . . . . . . . . . . . . . . . . . . . . . . . . . . . . . . . . . . . . . . . . . . . . . . . . . . . . . . . . . . . . . . . . . 94 Capital Services Fund . . . . . . . . . . . . . . . . . . . . . . . . . . . . . . . . . . . . . . . . . . . . . . . . . . . . . . . . . . . . . . . . . . . . . 95
Internal Service Funds
Health & Welfare Benefits Fund . . . . . . . . . . . . . . . . . . . . . . . . . . . . . . . . . . . . . . . . . . . . . . . . . . . . . . . . . . . . . . 96 Workers’ Compensation Self Insurance Fund . . . . . . . . . . . . . . . . . . . . . . . . . . . . . . . . . . . . . . . . . . . . . . . . . . . 97 Liability Self-Insurance Fund . . . . . . . . . . . . . . . . . . . . . . . . . . . . . . . . . . . . . . . . . . . . . . . . . . . . . . . . . . . . . . . . 98
Fiduciary Funds Attendance Incentive Reserve Fund . . . . . . . . . . . . . . . . . . . . . . . . . . . . . . . . . . . . . . . . . . . . . . . . . . . . . . . . . . 99 Other Post Employment Benefit Fund . . . . . . . . . . . . . . . . . . . . . . . . . . . . . . . . . . . . . . . . . . . . . . . . . . . . . . . . . 100
III Appendices Introduction . . . . . . . . . . . . . . . . . . . . . . . . . . . . . . . . . . . . . . . . . . . . . . . . . . . . . . . . . . . . . . . . . . . . . . . . . . . . . . . . . . . 101 Appendix A Frequently Asked Questions . . . . . . . . . . . . . . . . . . . . . . . . . . . . . . . . . . . . . . . . . . . . . . . . . . . . . . . 103 Appendix B Budget Principles and Processes . . . . . . . . . . . . . . . . . . . . . . . . . . . . . . . . . . . . . . . . . . . . . . . . . . . 109 Appendix C How Education is Funded in California . . . . . . . . . . . . . . . . . . . . . . . . . . . . . . . . . . . . . . . . . . . . . . . 111 Appendix D Locally Controlled Funding Formula . . . . . . . . . . . . . . . . . . . . . . . . . . . . . . . . . . . . . . . . . . . . . . . . . 115 Appendix E Average Daily Attendance . . . . . . . . . . . . . . . . . . . . . . . . . . . . . . . . . . . . . . . . . . . . . . . . . . . . . . . . . 119 Appendix F District and Community Profile . . . . . . . . . . . . . . . . . . . . . . . . . . . . . . . . . . . . . . . . . . . . . . . . . . . . . 123 Appendix G Lottery . . . . . . . . . . . . . . . . . . . . . . . . . . . . . . . . . . . . . . . . . . . . . . . . . . . . . . . . . . . . . . . . . . . . . . . . 127 Appendix H School Staff and Resources . . . . . . . . . . . . . . . . . . . . . . . . . . . . . . . . . . . . . . . . . . . . . . . . . . . . . . . 129 Appendix I District Class Size . . . . . . . . . . . . . . . . . . . . . . . . . . . . . . . . . . . . . . . . . . . . . . . . . . . . . . . . . . . . . . . 147 Appendix J District Enrollment Trends . . . . . . . . . . . . . . . . . . . . . . . . . . . . . . . . . . . . . . . . . . . . . . . . . . . . . . . . . 149 Appendix K Special Education Enrollment Data Report by Disability . . . . . . . . . . . . . . . . . . . . . . . . . . . . . . . . . . 153 Appendix L Budget and Finance Policy . . . . . . . . . . . . . . . . . . . . . . . . . . . . . . . . . . . . . . . . . . . . . . . .. . . . . . . . . 155 Appendix M District Debt Management Policy . . . . . . . . . . . . . . . . . . . . . . . . . . . . . . . . . . . . . . . . . . .. . . . . . . . . 167 Appendix N Capital Budget . . . . . . . . . . . . . . . . . . . . . . . . . . . . . . . . . . . . . . . . . . . . . . . . . . . . . . . . . . . . . . . . . . 201 Appendix O Notes . . . . . . . . . . . . . . . . . . . . . . . . . . . . . . . . . . . . . . . . . . . . . . . . . . . . . . . . . . . . . . . . . . . . . . . . . 203 Appendix P Glossary of Budget Terms and Abbreviations . . . . . . . . . . . . . . . . . . . . . . . . . . . . . . . . . . . . . . . . . . 207
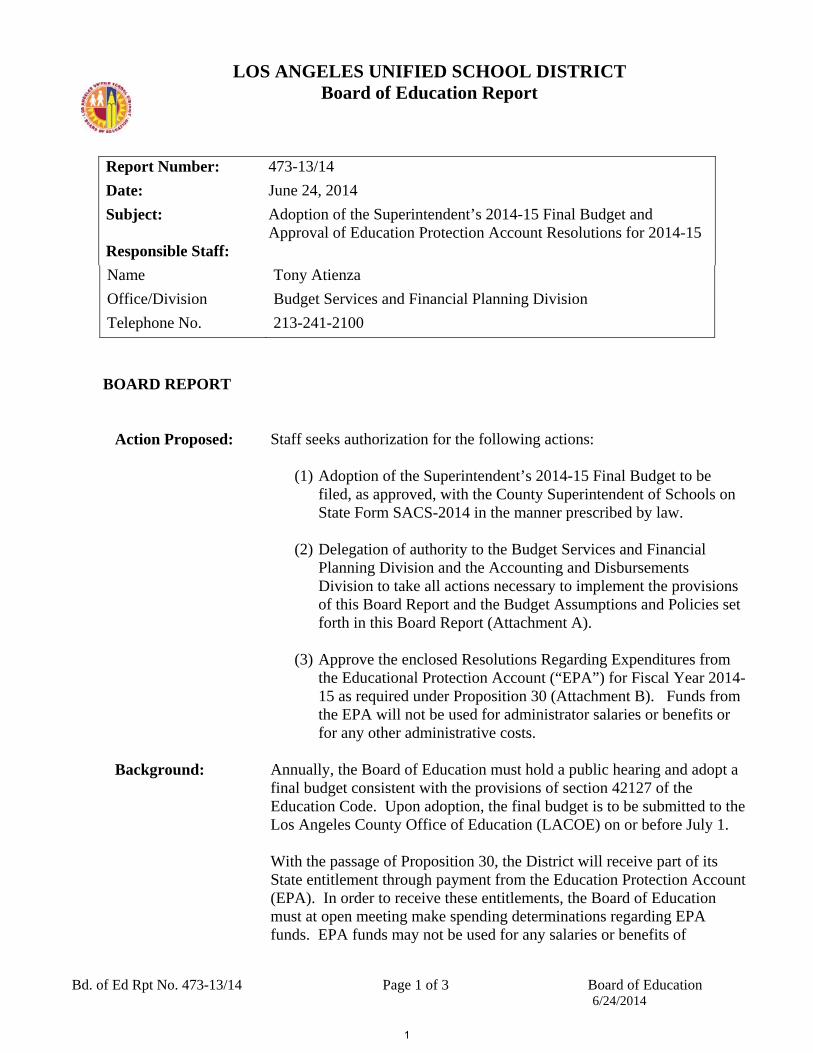
LOS ANGELES UNIFIED SCHOOL DISTRICT Board of Education Report
Bd. of Ed Rpt No. 473-13/14 Page 1 of 3 Board of Education 6/24/2014
Report Number: 473-13/14 Date: June 24, 2014 Subject: Adoption of the Superintendent’s 2014-15 Final Budget and
Approval of Education Protection Account Resolutions for 2014-15 Responsible Staff: Name Tony Atienza Office/Division Budget Services and Financial Planning Division Telephone No. 213-241-2100
BOARD REPORT
Action Proposed:
Staff seeks authorization for the following actions:
(1) Adoption of the Superintendent’s 2014-15 Final Budget to be filed, as approved, with the County Superintendent of Schools on State Form SACS-2014 in the manner prescribed by law.
(2) Delegation of authority to the Budget Services and Financial
Planning Division and the Accounting and Disbursements Division to take all actions necessary to implement the provisions of this Board Report and the Budget Assumptions and Policies set forth in this Board Report (Attachment A).
(3) Approve the enclosed Resolutions Regarding Expenditures from the Educational Protection Account (“EPA”) for Fiscal Year 2014-15 as required under Proposition 30 (Attachment B). Funds from the EPA will not be used for administrator salaries or benefits or for any other administrative costs.
Background:
Annually, the Board of Education must hold a public hearing and adopt a final budget consistent with the provisions of section 42127 of the Education Code. Upon adoption, the final budget is to be submitted to the Los Angeles County Office of Education (LACOE) on or before July 1. With the passage of Proposition 30, the District will receive part of its State entitlement through payment from the Education Protection Account (EPA). In order to receive these entitlements, the Board of Education must at open meeting make spending determinations regarding EPA funds. EPA funds may not be used for any salaries or benefits of
1
LOS ANGELES UNIFIED SCHOOL DISTRICT Board of Education Report
Bd. of Ed Rpt No. 473-13/14 Page 2 of 3 Board of Education 6/24/2014
administrators or any other administrative costs. The District is also required to annually publish on its web site an accounting of how much EPA funds were received and how the funds were spent. As a result of the implementation of the Local Control Funding Formula (LCFF) and the related Local Control and Accountability Plan (LCAP), sections 42127 and 52062 of the Education Code now requires two separate Governing Board public meetings, held at least one day apart for the District budget hearing and budget adoption. In addition, the LCAP public hearing and adoption must occur at the same meetings as the budget public hearing and adoption.
Expected Outcomes:
The outcome of this Board action is an adopted budget for the 2014-15 fiscal year that will enable the District to comply with Education Code Section 42127. A further expected outcome of this Board Action is an adoption of Resolutions Regarding EPA expenditures for 2014-15.
Board Options and Consequences:
The District will meet the annual budget adoption requirements of Education Code Section 42127 should the Board vote to approve. Should the Board vote not to approve, the District will not meet the requirements of Education Code Section 42127. Non-approval of EPA resolution as set forth in Proposition 30 may place the EPA entitlement at risk.
Policy Implications:
Budget Impact: Adoption of a Final Budget for 2014-15.
Issues and Analysis:
Attachments:
2


ATTACHMENT A Bd. Of Ed Rpt No. 473/13-14
Bd. of Ed. No. 473-13/14 - 1 - June 17, 2014
BUDGET ASSUMPTIONS AND POLICIES
The Superintendent’s 2014-15 Final Budget reflects the following:
2014-15 Fiscal Year:
1. 0.85% of COLA and a 28.06% GAP funding percentage for the Local Control Funding Formula (LCFF) revenue.
2. 0.85% COLA for selected categorical programs outside of the LCFF.
3. LCFF ADA of 482,641 for regular District schools and 39,858 for affiliated charter schools.
4. Two-year average unduplicated count and percentage of 430,074 and 84.57% average for
regular District schools and 16,765 and 40.2% on average for affiliated charter schools.
5. Education Protection Account (EPA) portion of LCFF of $559.2 million to be spent for instruction.
6. Proportionality expenditure increase requirement of $137.9 million.
7. 0.85% COLA on the State-funded portion of Special Education (AB 602 funding).
8. A net enrollment decline of 14,216 from 2013-14 for non-charter and affiliated charter
schools. Independent Charter school enrollment is estimated to increase by approximately 7,157.
9. A California Consumer Price Index (CPI) of 2.1% on other operating expenditures, except
utilities which is projected to increase by 6%.
10. Funding for employee health and medical benefits at the per participant rate set forth in the 2012-2014 Health and Welfare agreement.
11. Contribution for Other Postemployment Benefit Plans (OPEB) of $88 million for 2014-15.
12. Reflects a $135 million accumulated OPEB designated balance, which is subject to distribution at the 2013-14 Year-End Closing in accordance with the Budget and Finance Policy.
13. Increase of 1.25% in State Teachers' Retirement System (STRS) rates for 2014-15 from
8.25% to 9.50%.
4
ATTACHMENT A Bd. Of Ed Rpt No. 473/13-14
Bd. of Ed. No. 473-13/14 - 2 - June 17, 2014
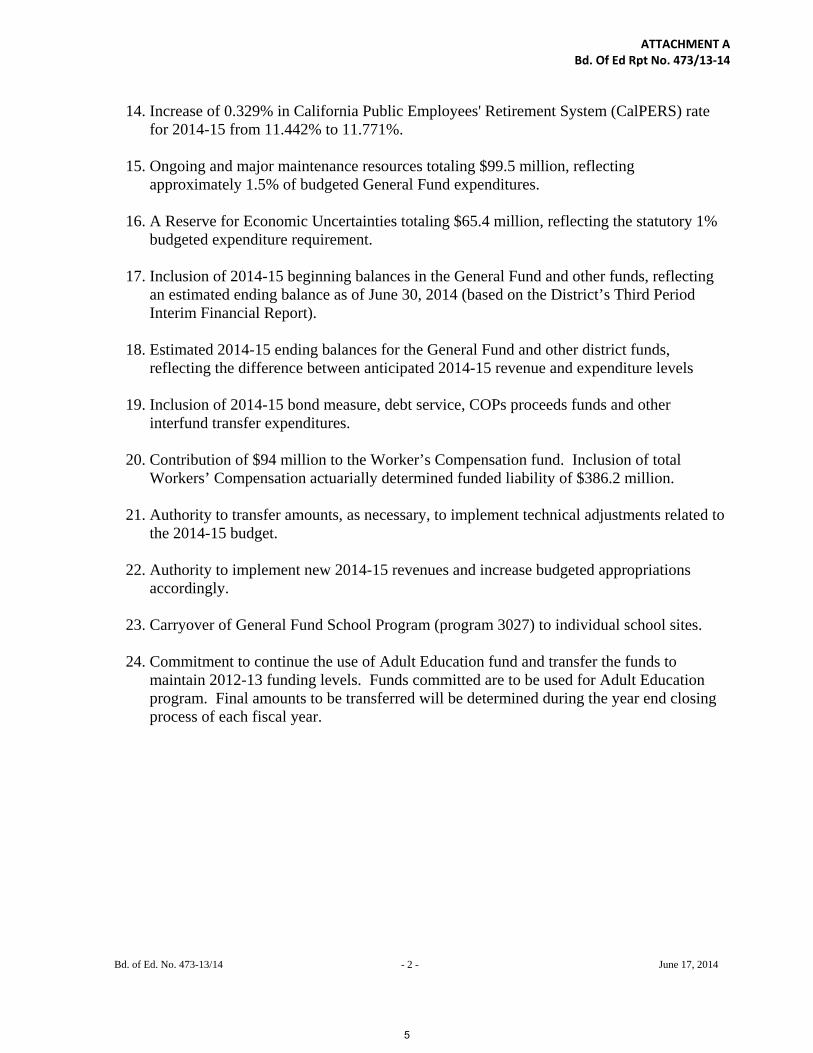
14. Increase of 0.329% in California Public Employees' Retirement System (CalPERS) rate for 2014-15 from 11.442% to 11.771%.
15. Ongoing and major maintenance resources totaling $99.5 million, reflecting approximately 1.5% of budgeted General Fund expenditures.
16. A Reserve for Economic Uncertainties totaling $65.4 million, reflecting the statutory 1% budgeted expenditure requirement.
17. Inclusion of 2014-15 beginning balances in the General Fund and other funds, reflecting
an estimated ending balance as of June 30, 2014 (based on the District’s Third Period Interim Financial Report).
18. Estimated 2014-15 ending balances for the General Fund and other district funds,
reflecting the difference between anticipated 2014-15 revenue and expenditure levels
19. Inclusion of 2014-15 bond measure, debt service, COPs proceeds funds and other interfund transfer expenditures.
20. Contribution of $94 million to the Worker’s Compensation fund. Inclusion of total
Workers’ Compensation actuarially determined funded liability of $386.2 million.
21. Authority to transfer amounts, as necessary, to implement technical adjustments related to the 2014-15 budget.
22. Authority to implement new 2014-15 revenues and increase budgeted appropriations
accordingly.
23. Carryover of General Fund School Program (program 3027) to individual school sites.
24. Commitment to continue the use of Adult Education fund and transfer the funds to maintain 2012-13 funding levels. Funds committed are to be used for Adult Education program. Final amounts to be transferred will be determined during the year end closing process of each fiscal year.
5
ATTACHMENT A Bd. Of Ed Rpt No. 473/13-14
Bd. of Ed. No. 473-13/14 - 3 - June 17, 2014
2015-16 and 2016-17 Fiscal Years:
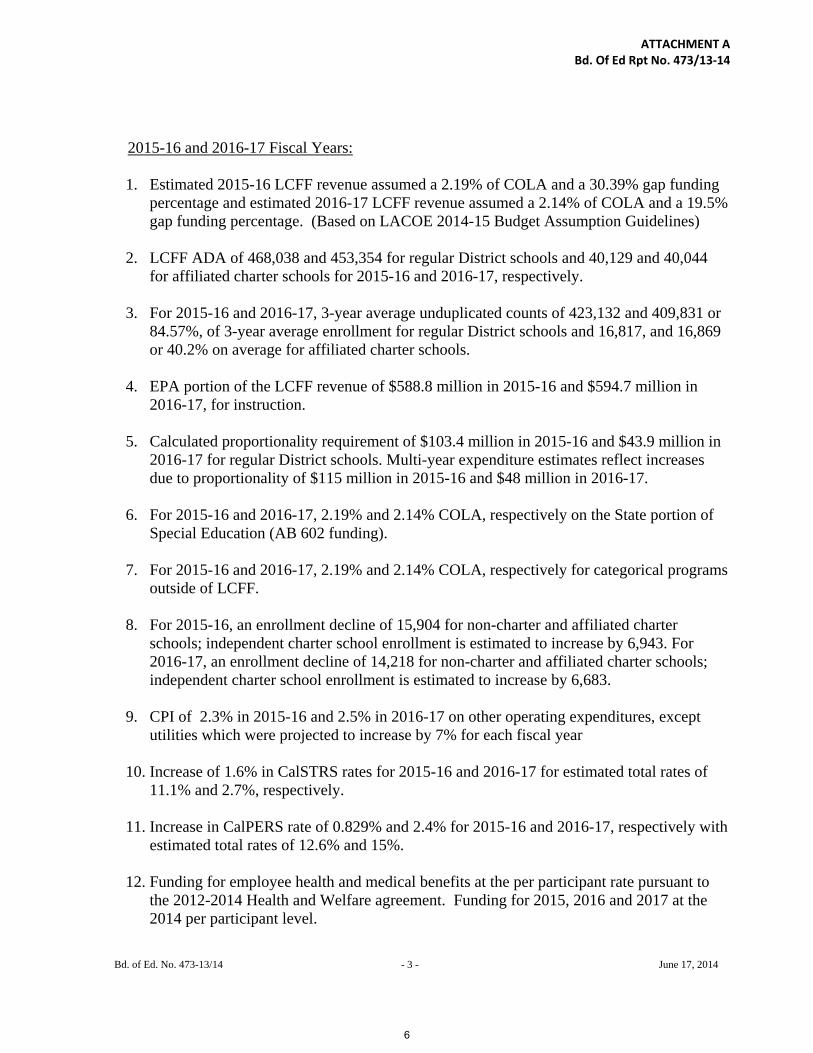
1. Estimated 2015-16 LCFF revenue assumed a 2.19% of COLA and a 30.39% gap funding percentage and estimated 2016-17 LCFF revenue assumed a 2.14% of COLA and a 19.5% gap funding percentage. (Based on LACOE 2014-15 Budget Assumption Guidelines)
2. LCFF ADA of 468,038 and 453,354 for regular District schools and 40,129 and 40,044 for affiliated charter schools for 2015-16 and 2016-17, respectively.
3. For 2015-16 and 2016-17, 3-year average unduplicated counts of 423,132 and 409,831 or
84.57%, of 3-year average enrollment for regular District schools and 16,817, and 16,869 or 40.2% on average for affiliated charter schools.
4. EPA portion of the LCFF revenue of $588.8 million in 2015-16 and $594.7 million in
2016-17, for instruction.
5. Calculated proportionality requirement of $103.4 million in 2015-16 and $43.9 million in 2016-17 for regular District schools. Multi-year expenditure estimates reflect increases due to proportionality of $115 million in 2015-16 and $48 million in 2016-17.
6. For 2015-16 and 2016-17, 2.19% and 2.14% COLA, respectively on the State portion of
Special Education (AB 602 funding).
7. For 2015-16 and 2016-17, 2.19% and 2.14% COLA, respectively for categorical programs outside of LCFF.
8. For 2015-16, an enrollment decline of 15,904 for non-charter and affiliated charter schools; independent charter school enrollment is estimated to increase by 6,943. For 2016-17, an enrollment decline of 14,218 for non-charter and affiliated charter schools; independent charter school enrollment is estimated to increase by 6,683.
9. CPI of 2.3% in 2015-16 and 2.5% in 2016-17 on other operating expenditures, except
utilities which were projected to increase by 7% for each fiscal year
10. Increase of 1.6% in CalSTRS rates for 2015-16 and 2016-17 for estimated total rates of 11.1% and 2.7%, respectively.
11. Increase in CalPERS rate of 0.829% and 2.4% for 2015-16 and 2016-17, respectively with
estimated total rates of 12.6% and 15%.
12. Funding for employee health and medical benefits at the per participant rate pursuant to the 2012-2014 Health and Welfare agreement. Funding for 2015, 2016 and 2017 at the 2014 per participant level.
6
ATTACHMENT A Bd. Of Ed Rpt No. 473/13-14
Bd. of Ed. No. 473-13/14 - 4 - June 17, 2014
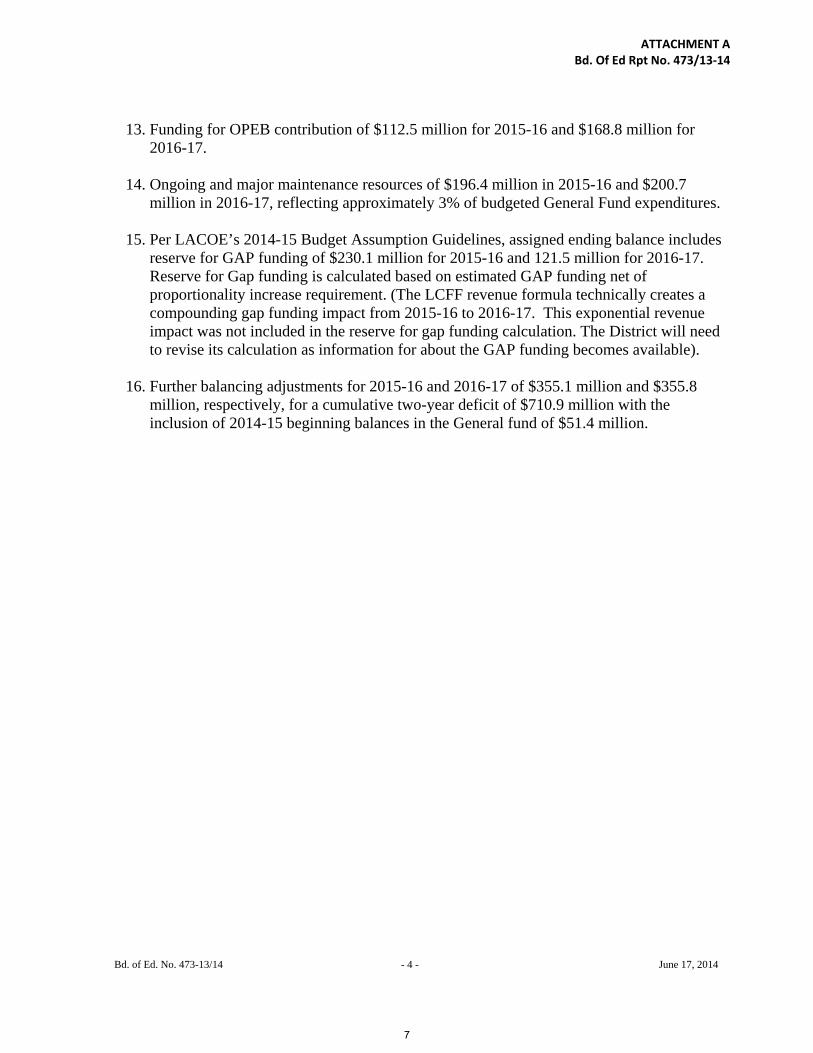
13. Funding for OPEB contribution of $112.5 million for 2015-16 and $168.8 million for
2016-17.
14. Ongoing and major maintenance resources of $196.4 million in 2015-16 and $200.7 million in 2016-17, reflecting approximately 3% of budgeted General Fund expenditures.
15. Per LACOE’s 2014-15 Budget Assumption Guidelines, assigned ending balance includes
reserve for GAP funding of $230.1 million for 2015-16 and 121.5 million for 2016-17. Reserve for Gap funding is calculated based on estimated GAP funding net of proportionality increase requirement. (The LCFF revenue formula technically creates a compounding gap funding impact from 2015-16 to 2016-17. This exponential revenue impact was not included in the reserve for gap funding calculation. The District will need to revise its calculation as information for about the GAP funding becomes available).
16. Further balancing adjustments for 2015-16 and 2016-17 of $355.1 million and $355.8
million, respectively, for a cumulative two-year deficit of $710.9 million with the inclusion of 2014-15 beginning balances in the General fund of $51.4 million.
7

1
ATTACHMENT B Bd. Of Ed Rpt No. 473/13-14
RESOLUTION REGARDING EXPENDITURES FROM THE EDUCATION PROTECTION ACCOUNT FOR FISCAL YEAR 2014-15
WHEREAS, the voters approved Proposition 30 on November 6, 2012;
WHEREAS, Proposition 30 added Article XIII, Section 36 to the California
Constitution effective November 7, 2012;
WHEREAS, the provisions of Article XIII, Section 36(e) create in the state
General Fund an Education Protection Account to receive and disburse the revenues
derived from the incremental increases in taxes imposed by Article XIII, Section 36(f);
WHEREAS, before June 30th
of each year, the Director of Finance shall estimate
the total amount of additional revenues, less refunds that will be derived from the
incremental increases in tax rates made pursuant to Article XIII, Section 36(f) that will be
available for transfer into the Education Protection Account during the next fiscal year;
WHEREAS, if the sum determined by the State Controller is positive, the State
Controller shall transfer the amount calculated into the Education Protection Account
within ten days preceding the end of the fiscal year;
WHEREAS, all monies in the Education Protection Account are
continuously appropriated for the support of school districts, county offices of education,
charter schools and community college districts;
WHEREAS, monies deposited in the Education Protection Account shall not be
used to pay any costs incurred by the Legislature, the Governor or any agency of state
government;
8
2
ATTACHMENT B Bd. Of Ed Rpt No. 473/13-14
WHEREAS, a community college district, county office of education, school
district, or charter school shall have the sole authority to determine how the monies
received from the Education Protection Account are spent in the school or schools within
its jurisdiction;
WHEREAS, the governing board of the Los Angeles Unified School District
(“District”) shall make the spending determinations with respect to monies received
from the Education Protection Account in open session of a public meeting of the
governing board;
WHEREAS, the monies received from the Education Protection Account shall
not be used for salaries or benefits for administrators or any other administrative cost;
WHEREAS, each community college district, county office of education, school
district and charter school shall annually publish on its Internet website an accounting
of how much money was received from the Education Protection Account and how
that money was spent;
WHEREAS, the annual independent financial and compliance audit required
of community college districts, county offices of education, school districts and
charter schools shall ascertain and verify whether the funds provided from the
Education Protection Account have been properly disbursed and expended as required
by Article XIII, Section 36 of the California Constitution;
WHEREAS, expenses incurred by community college districts, county offices of
education, school districts and charter schools to comply with the additional audit
requirements of Article XIII, Section 36 may be paid with funding from the Education
Protection Act and shall not be considered administrative costs for purposes of
Article XIII, Section 36.
9
3
ATTACHMENT B Bd. Of Ed Rpt No. 473/13-14
NOW, THEREFORE, IT IS HEREBY RESOLVED:
1. The monies received from the Education Protection Account shall be spent
as required by Article XIII, Section 36 and the spending determinations on how the
money will be spent shall be made in open session of a public meeting of the governing
board of the District;
2. In compliance with Article XIII, Section 36(e), with the California
Constitution, the governing board of the District has determined to spend the monies
received from the Education Protection Act as set forth in Attachment 2. DATED _, 2014.
Board President
Executive Officer of the Board
10
4
ATTACHMENT B Bd. Of Ed Rpt No. 473/13-14
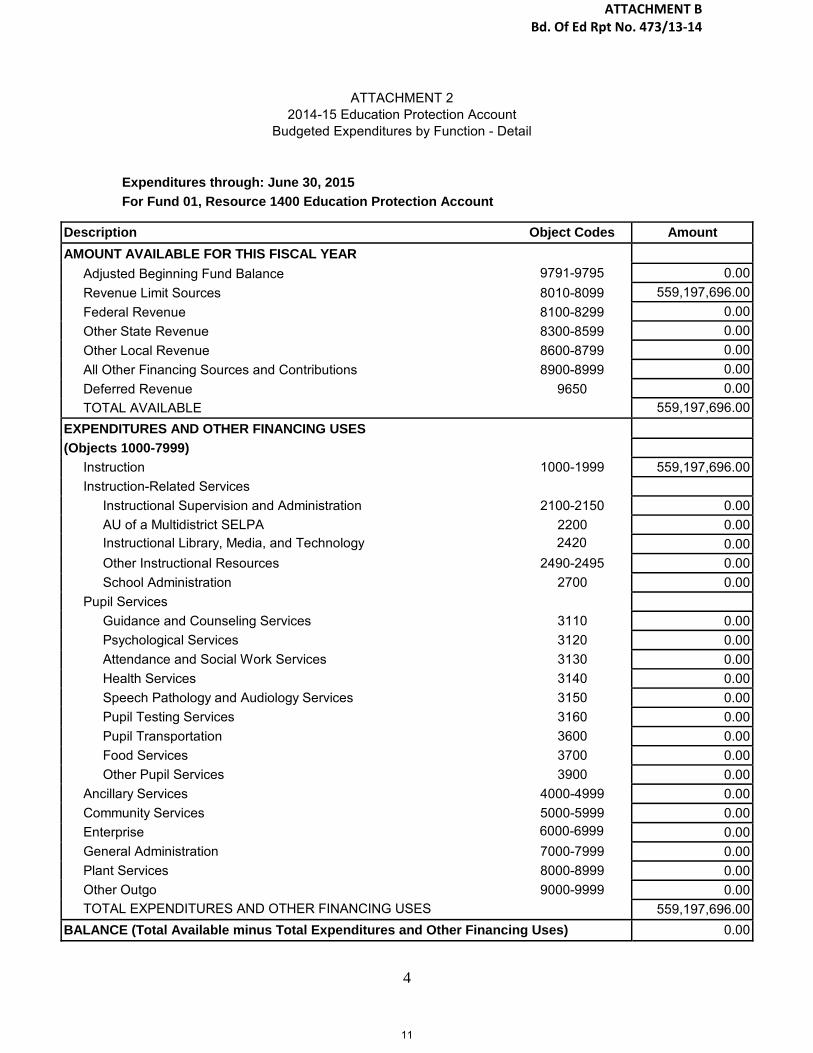
ATTACHMENT 2 2014-15 Education Protection Account
Budgeted Expenditures by Function - Detail
Expenditures through: June 30, 2015 For Fund 01, Resource 1400 Education Protection Account
Description Object Codes Amount AMOUNT AVAILABLE FOR THIS FISCAL YEAR
9791-9795
Adjusted Beginning Fund Balance 0.00Revenue Limit Sources 8010-8099 559,197,696.00Federal Revenue 8100-8299 0.00Other State Revenue 8300-8599 0.00Other Local Revenue 8600-8799 0.00All Other Financing Sources and Contributions 8900-8999 0.00Deferred Revenue 9650 0.00TOTAL AVAILABLE 559,197,696.00
EXPENDITURES AND OTHER FINANCING USES (Objects 1000-7999)
Instruction Instruction-Related Services
Instructional Supervision and Administration AU of a Multidistrict SELPA Instructional Library, Media, and Technology Other Instructional Resources School Administration
Pupil Services Guidance and Counseling Services Psychological Services Attendance and Social Work Services Health Services Speech Pathology and Audiology Services Pupil Testing Services Pupil Transportation Food Services Other Pupil Services
Ancillary Services Community Services Enterprise General Administration Plant Services Other Outgo TOTAL EXPENDITURES AND OTHER FINANCING USES
1000-1999
2100-2150 2200 2420
2490-2495 2700
3110 3120 3130 3140 3150 3160 3600 3700 3900
4000-4999 5000-5999 6000-6999 7000-7999 8000-8999 9000-9999
559,197,696.00
0.000.000.000.000.00
0.000.000.000.000.000.000.000.000.000.000.000.000.000.000.00
559,197,696.00BALANCE (Total Available minus Total Expenditures and Other Financing Uses) 0.00
11

12
HOW EDUCATION IS FUNDED IN CALIFORNIA
Summary
Prior to the 1970s, California’s schools were financed largely with property tax revenues imposed by
local school districts. This led to dramatic differences in school district funding. A school district with
very high property values could raise more revenue per pupil with a low property tax rate, while a
district with low property values could raise less with a much higher property tax rate. The state
attempted to reduce these differences by providing more state aid to low-property wealth districts.
Despite this effort, per pupil revenues varied considerably between districts. In fiscal year 1968-69, for
example, per pupil expenditures ranged from $577 in Baldwin Park to $1,232 in Beverly Hills.1
In 1978, voters approved Proposition 13. The new law limited property tax rates to 1 percent of a
property’s assessed value at the time of acquisition. Proposition 13 reduced property tax revenues
available for local governments and school districts. To cushion the impact to school districts, the state
Legislature shifted state dollars to schools.
As a result, California’s schools today are largely dependent on the state budget, particularly income and
sales tax revenues. Income and sales taxes are more volatile revenue sources than property taxes. When
the economy sours, unemployment rises, leading to fewer purchases. This correspondingly leads to less
income and goods to be taxed. As a result, fewer dollars become available for schools.
School districts are further constrained in their ability to raise taxes independently of the State. Bond
issues, usually limited to building programs, require a 55% vote for passage. Proposition 13 also
requires that a 2/3 vote is needed for local districts to enact parcel tax measures.
The Governor has changed the state’s allocation formula for school districts to increase flexibility at the
local level. The State’s new formula is the Local Control Funding Formula (LCFF). Under LCFF, the
state provides a base grant for all students and additional grants for high-need students such as English
Learners, economically disadvantaged students and foster youth pupils.
1 California Budget Project, School Finance in California and the Proposition 98 Guarantee (April 2006).
13
For more comprehensive information on how schools are funded in California, read:
California Budget Project, School Finance in California and the Proposition 98 Guarantee
http://www.cbp.org/pdfs/2006/0604_prop98.pdf
Legislative Analyst’s Office, The Basics of Proposition 98
http://www.lao.ca.gov/2009/edu/prop98_primer/prop98_primer.aspx
LAUSD Budget Realities, California Education Funding,
http://budgetrealities.lausd.net/california_education_funding
EdSource, It’s a deal: Brown, top lawmakers raise base funding in finance formula
http://www.edsource.org/today/2013/its-a-deal-brown-top-lawmakers-raise-base-funding-in-
finance-formula/33350#.UbinNrXvvnE
14

BREAKING DOWN LAUSD’S BUDGET
Introduction
This section is a discussion of the District’s overall budget. It summarizes in general terms the various components of the budget with particular attention given to the General Fund.
15

SUPERINTENDENT’S 2014-15 FINAL BUDGET
BREAKING DOWN LAUSD’S BUDGET
LAUSD’s budget, like the District itself, is large and complex. This section discusses the different parts
of the budget, with particular attention paid to the General Fund budget. All dollar amounts represent
totals for the 2014-15 school year.
The “Total Budget”
As required by California law, LAUSD’s budget is reported by “Fund.” The uses of these different funds
can be summarized into five main categories:
A. Fiduciary Funds – moneys used to account for assets held in trust
B. Internal Service Funds – moneys used for goods or services given internally to other District
funds on a cost reimbursement basis
C. Debt Service Funds – moneys used for the payment of principal and interest on long-term bonds
D. Capital Project Funds – moneys used for the purchase or construction of facilities
E. Operating Funds – moneys used to fund the general, day-to-day operation of the District’s
schools and offices
Figure 1: Total Budget
* Figures rounded, graphic not to scale, amounts in billions
16
SUPERINTENDENT’S 2014-15 FINAL BUDGET
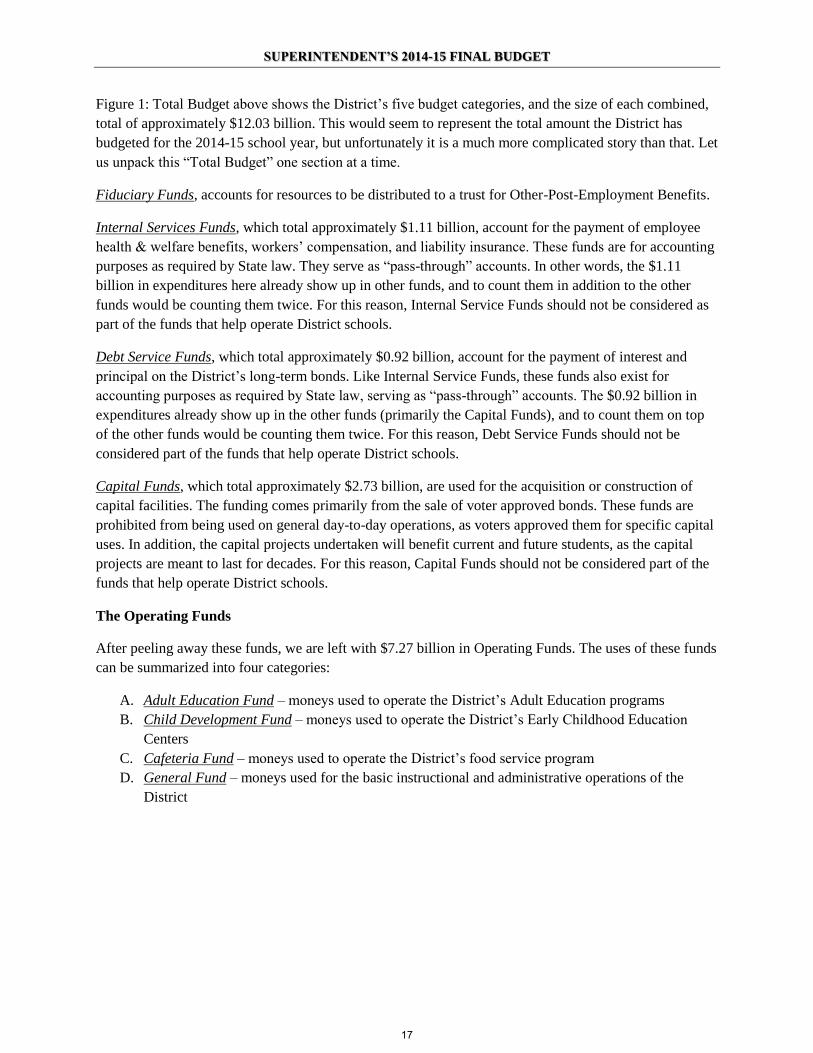
Figure 1: Total Budget above shows the District’s five budget categories, and the size of each combined,
total of approximately $12.03 billion. This would seem to represent the total amount the District has
budgeted for the 2014-15 school year, but unfortunately it is a much more complicated story than that. Let
us unpack this “Total Budget” one section at a time.
Fiduciary Funds, accounts for resources to be distributed to a trust for Other-Post-Employment Benefits.
Internal Services Funds, which total approximately $1.11 billion, account for the payment of employee
health & welfare benefits, workers’ compensation, and liability insurance. These funds are for accounting
purposes as required by State law. They serve as “pass-through” accounts. In other words, the $1.11
billion in expenditures here already show up in other funds, and to count them in addition to the other
funds would be counting them twice. For this reason, Internal Service Funds should not be considered as
part of the funds that help operate District schools.
Debt Service Funds, which total approximately $0.92 billion, account for the payment of interest and
principal on the District’s long-term bonds. Like Internal Service Funds, these funds also exist for
accounting purposes as required by State law, serving as “pass-through” accounts. The $0.92 billion in
expenditures already show up in the other funds (primarily the Capital Funds), and to count them on top
of the other funds would be counting them twice. For this reason, Debt Service Funds should not be
considered part of the funds that help operate District schools.
Capital Funds, which total approximately $2.73 billion, are used for the acquisition or construction of
capital facilities. The funding comes primarily from the sale of voter approved bonds. These funds are
prohibited from being used on general day-to-day operations, as voters approved them for specific capital
uses. In addition, the capital projects undertaken will benefit current and future students, as the capital
projects are meant to last for decades. For this reason, Capital Funds should not be considered part of the
funds that help operate District schools.
The Operating Funds
After peeling away these funds, we are left with $7.27 billion in Operating Funds. The uses of these funds
can be summarized into four categories:
A. Adult Education Fund – moneys used to operate the District’s Adult Education programs
B. Child Development Fund – moneys used to operate the District’s Early Childhood Education
Centers
C. Cafeteria Fund – moneys used to operate the District’s food service program
D. General Fund – moneys used for the basic instructional and administrative operations of the
District
17
SUPERINTENDENT’S 2014-15 FINAL BUDGET
Figure 2: Operating Funds
* Figures rounded, graphic not to scale, amounts in billions
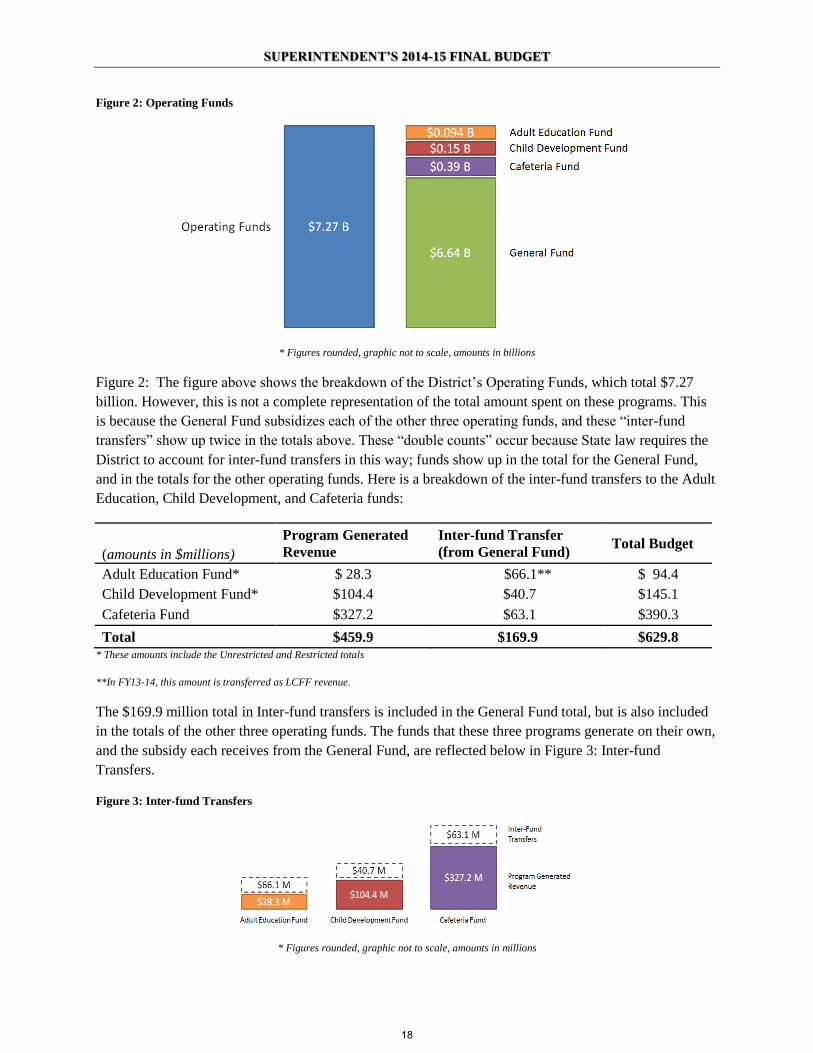
Figure 2: The figure above shows the breakdown of the District’s Operating Funds, which total $7.27
billion. However, this is not a complete representation of the total amount spent on these programs. This
is because the General Fund subsidizes each of the other three operating funds, and these “inter-fund
transfers” show up twice in the totals above. These “double counts” occur because State law requires the
District to account for inter-fund transfers in this way; funds show up in the total for the General Fund,
and in the totals for the other operating funds. Here is a breakdown of the inter-fund transfers to the Adult
Education, Child Development, and Cafeteria funds:
(amounts in $millions)
Program Generated
Revenue
Inter-fund Transfer
(from General Fund) Total Budget
Adult Education Fund* $ 28.3 $66.1** $ 94.4
Child Development Fund* $104.4 $40.7 $145.1
Cafeteria Fund $327.2 $63.1 $390.3
Total $459.9 $169.9 $629.8 * These amounts include the Unrestricted and Restricted totals
**In FY13-14, this amount is transferred as LCFF revenue.
The $169.9 million total in Inter-fund transfers is included in the General Fund total, but is also included
in the totals of the other three operating funds. The funds that these three programs generate on their own,
and the subsidy each receives from the General Fund, are reflected below in Figure 3: Inter-fund
Transfers.
Figure 3: Inter-fund Transfers
* Figures rounded, graphic not to scale, amounts in millions
18
SUPERINTENDENT’S 2014-15 FINAL BUDGET
The General Fund
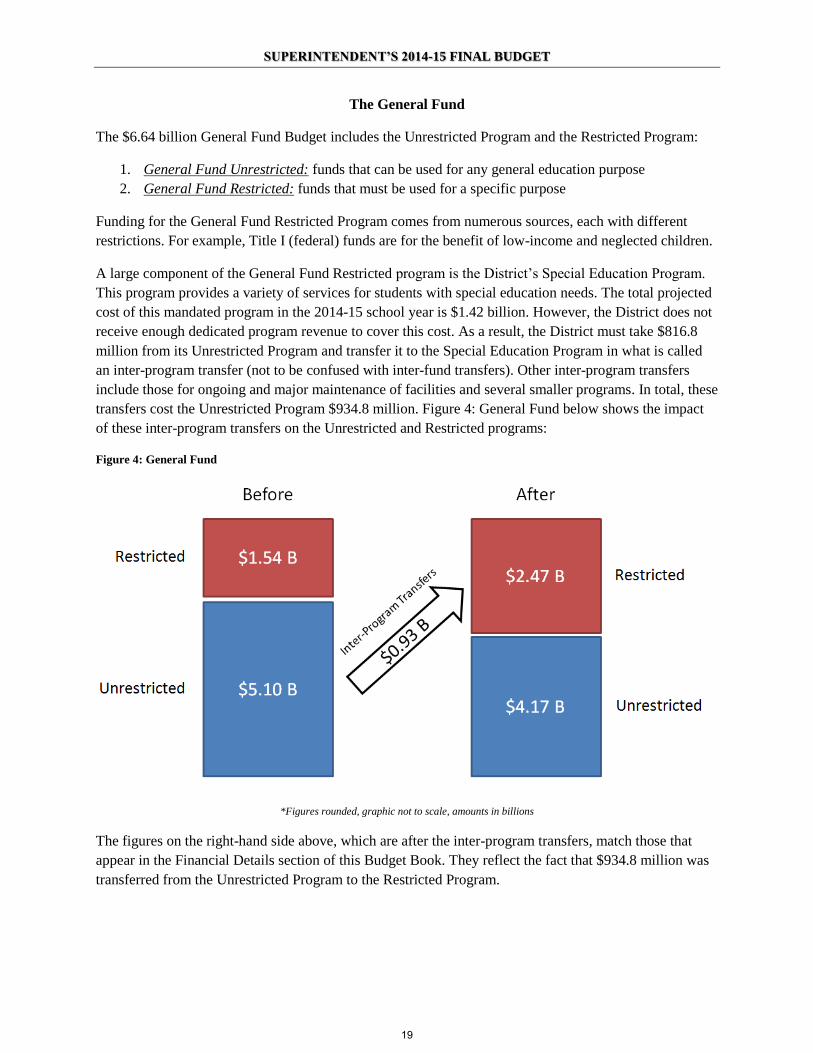
The $6.64 billion General Fund Budget includes the Unrestricted Program and the Restricted Program:
1. General Fund Unrestricted: funds that can be used for any general education purpose
2. General Fund Restricted: funds that must be used for a specific purpose
Funding for the General Fund Restricted Program comes from numerous sources, each with different
restrictions. For example, Title I (federal) funds are for the benefit of low-income and neglected children.
A large component of the General Fund Restricted program is the District’s Special Education Program.
This program provides a variety of services for students with special education needs. The total projected
cost of this mandated program in the 2014-15 school year is $1.42 billion. However, the District does not
receive enough dedicated program revenue to cover this cost. As a result, the District must take $816.8
million from its Unrestricted Program and transfer it to the Special Education Program in what is called
an inter-program transfer (not to be confused with inter-fund transfers). Other inter-program transfers
include those for ongoing and major maintenance of facilities and several smaller programs. In total, these
transfers cost the Unrestricted Program $934.8 million. Figure 4: General Fund below shows the impact
of these inter-program transfers on the Unrestricted and Restricted programs:
Figure 4: General Fund
*Figures rounded, graphic not to scale, amounts in billions
The figures on the right-hand side above, which are after the inter-program transfers, match those that
appear in the Financial Details section of this Budget Book. They reflect the fact that $934.8 million was
transferred from the Unrestricted Program to the Restricted Program.
19
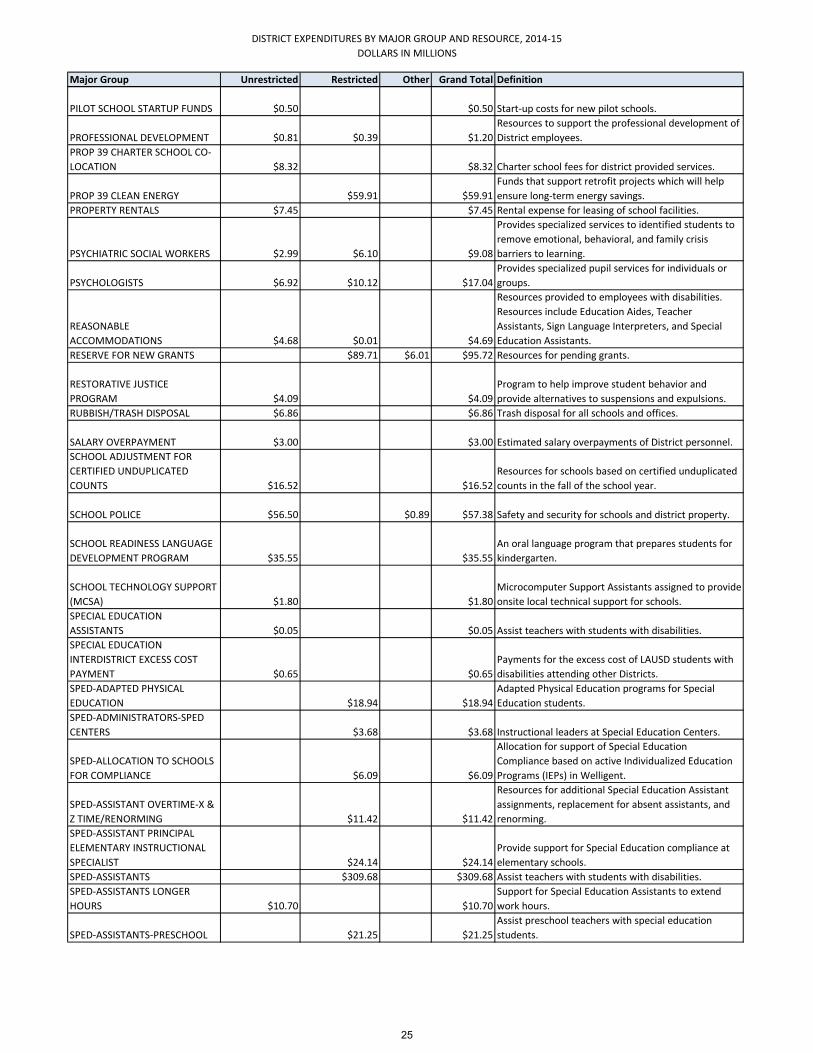
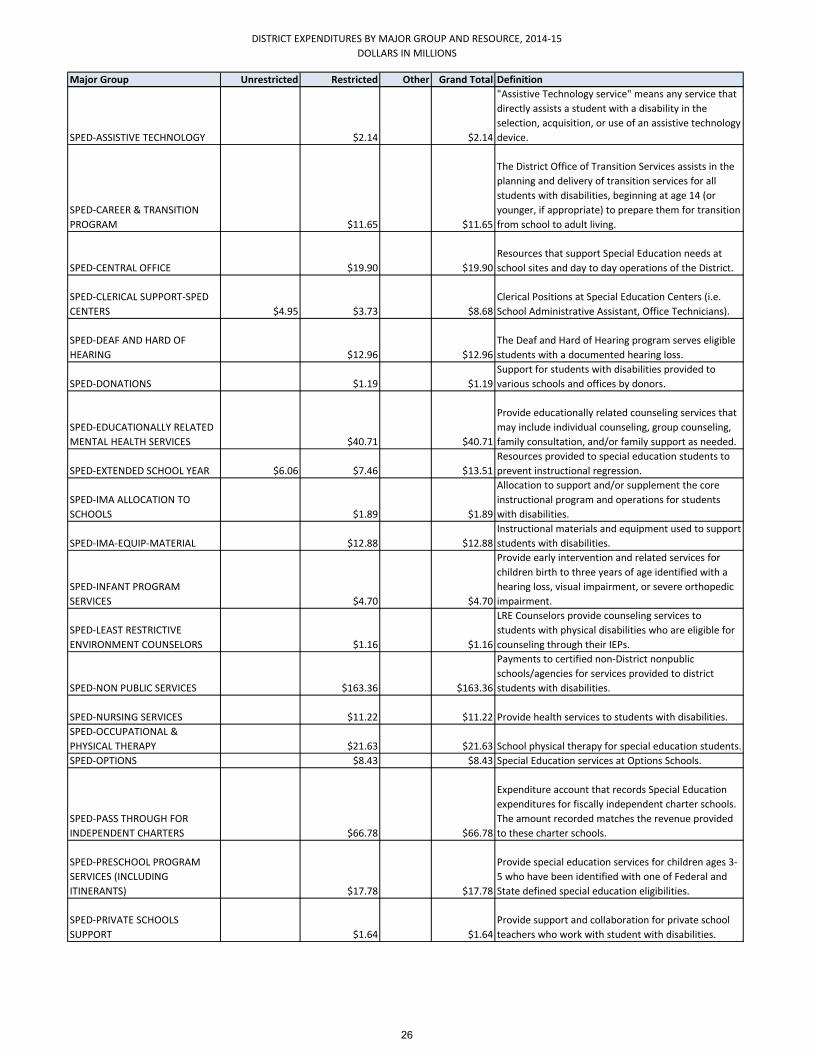
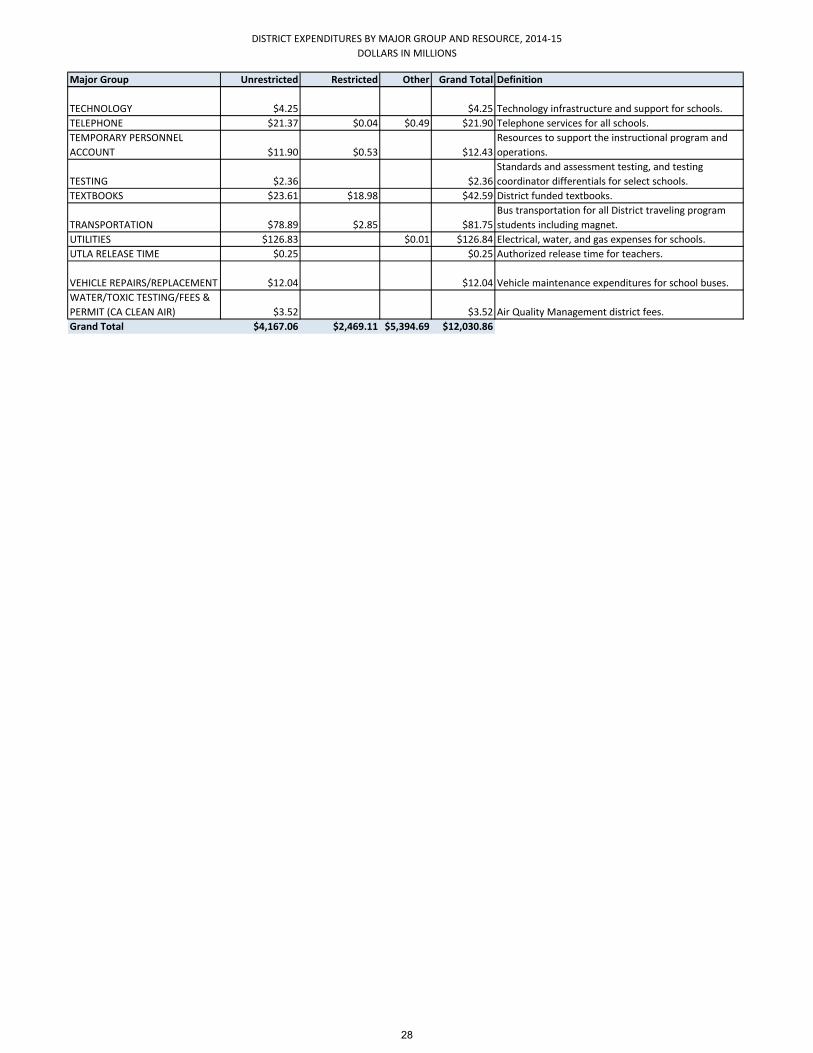
BUDGETED EXPENDITURES BY MAJOR GROUP AND RESOURCE
Introduction
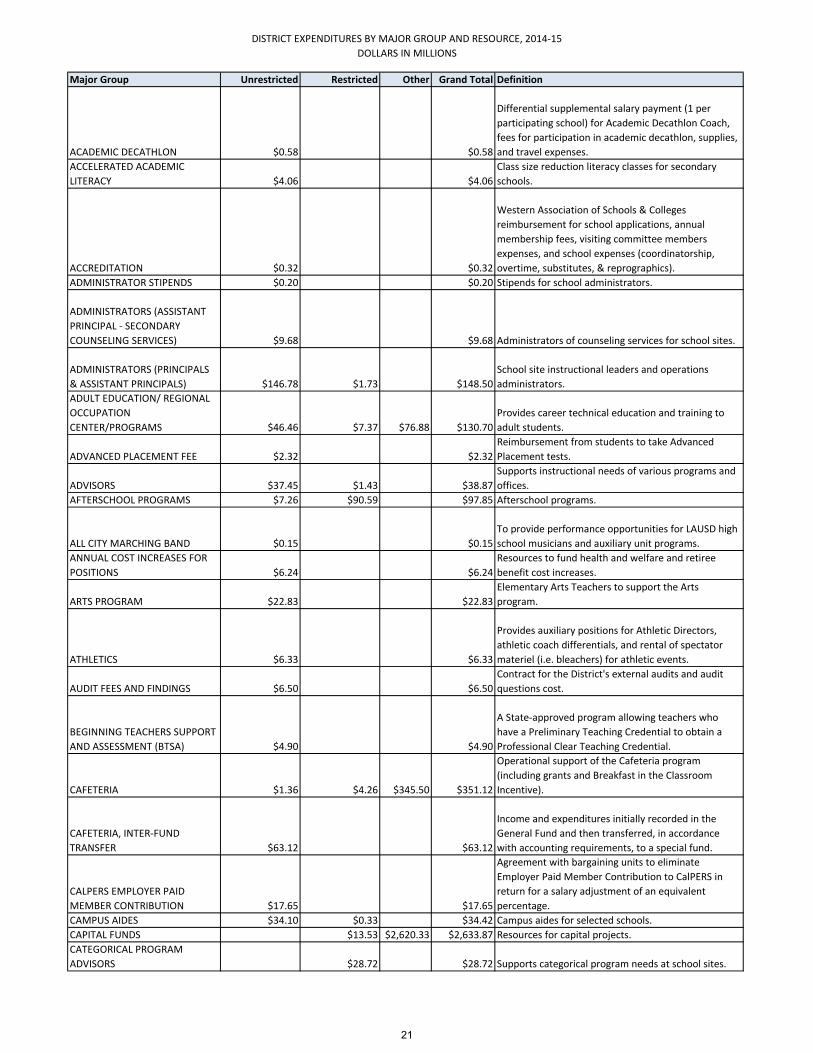
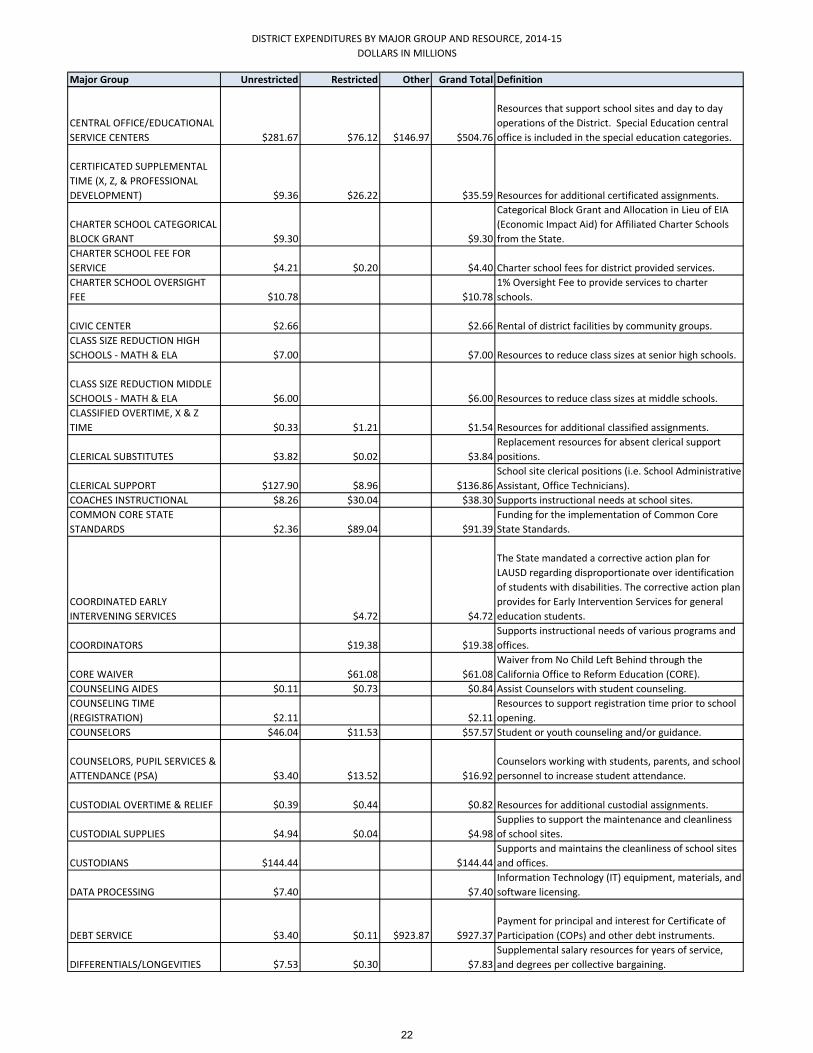
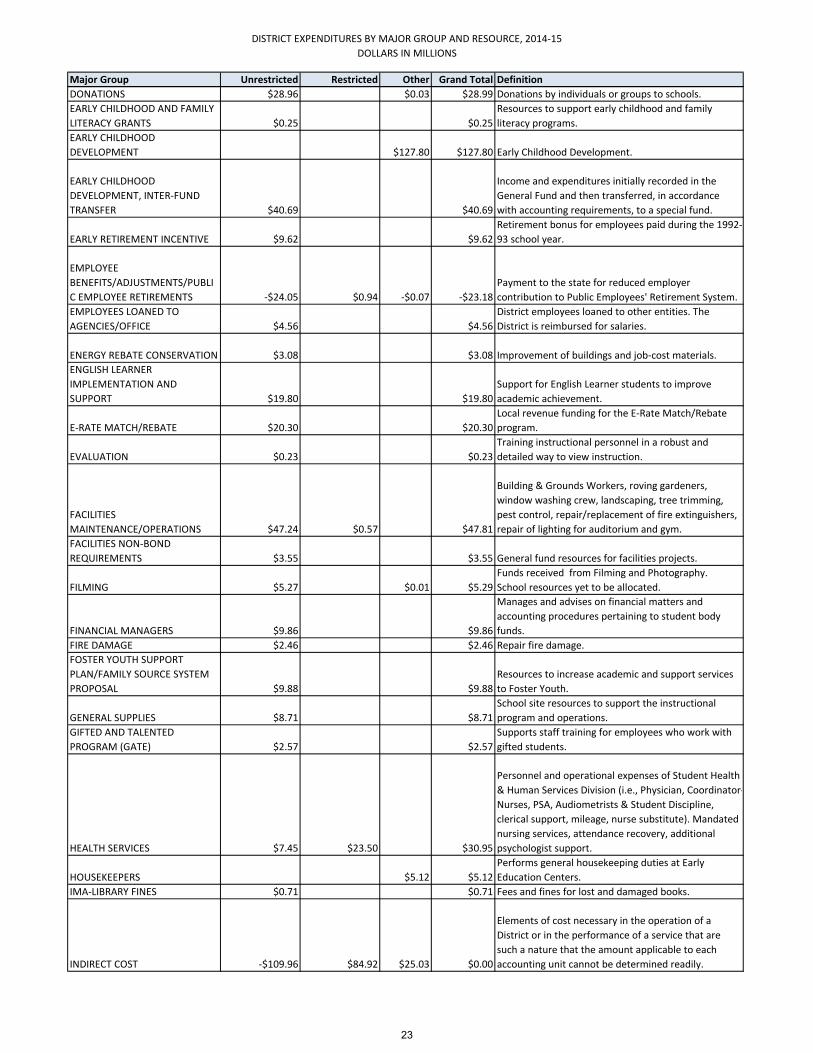
This report shows budgeted expenditures by major groups as defined by the District. The
resources are split between General Fund Unrestricted, General Fund Restricted, and Other
funds. Other funds include Adult Education, Child Development, Fiduciary, Cafeteria, Capital,
Debt Services, Internal Service, and Deferred Maintenance.
The District Expenditures by Major Group and Resource Report will be available on the Budget
Services website under Budget Documents. This report will be updated quarterly. The Budget
Documents page for the Budget Services website can be accessed at
http://lausd.schoolwires.net/Page/1327.
20
DISTRICT EXPENDITURES BY MAJOR GROUP AND RESOURCE, 2014-15
DOLLARS IN MILLIONS
Major Group Unrestricted Restricted Other Grand Total Definition
ACADEMIC DECATHLON $0.58 $0.58
Differential supplemental salary payment (1 per
participating school) for Academic Decathlon Coach,
fees for participation in academic decathlon, supplies,
and travel expenses.
ACCELERATED ACADEMIC
LITERACY $4.06 $4.06
Class size reduction literacy classes for secondary
schools.
ACCREDITATION $0.32 $0.32
Western Association of Schools & Colleges
reimbursement for school applications, annual
membership fees, visiting committee members
expenses, and school expenses (coordinatorship,
overtime, substitutes, & reprographics).
ADMINISTRATOR STIPENDS $0.20 $0.20 Stipends for school administrators.
ADMINISTRATORS (ASSISTANT
PRINCIPAL - SECONDARY
COUNSELING SERVICES) $9.68 $9.68 Administrators of counseling services for school sites.
ADMINISTRATORS (PRINCIPALS
& ASSISTANT PRINCIPALS) $146.78 $1.73 $148.50
School site instructional leaders and operations
administrators.
ADULT EDUCATION/ REGIONAL
OCCUPATION
CENTER/PROGRAMS $46.46 $7.37 $76.88 $130.70
Provides career technical education and training to
adult students.
ADVANCED PLACEMENT FEE $2.32 $2.32
Reimbursement from students to take Advanced
Placement tests.
ADVISORS $37.45 $1.43 $38.87
Supports instructional needs of various programs and
offices.
AFTERSCHOOL PROGRAMS $7.26 $90.59 $97.85 Afterschool programs.
ALL CITY MARCHING BAND $0.15 $0.15
To provide performance opportunities for LAUSD high
school musicians and auxiliary unit programs.
ANNUAL COST INCREASES FOR
POSITIONS $6.24 $6.24
Resources to fund health and welfare and retiree
benefit cost increases.
ARTS PROGRAM $22.83 $22.83
Elementary Arts Teachers to support the Arts
program.
ATHLETICS $6.33 $6.33
Provides auxiliary positions for Athletic Directors,
athletic coach differentials, and rental of spectator
materiel (i.e. bleachers) for athletic events.
AUDIT FEES AND FINDINGS $6.50 $6.50
Contract for the District's external audits and audit
questions cost.
BEGINNING TEACHERS SUPPORT
AND ASSESSMENT (BTSA) $4.90 $4.90
A State-approved program allowing teachers who
have a Preliminary Teaching Credential to obtain a
Professional Clear Teaching Credential.
CAFETERIA $1.36 $4.26 $345.50 $351.12
Operational support of the Cafeteria program
(including grants and Breakfast in the Classroom
Incentive).
CAFETERIA, INTER-FUND
TRANSFER $63.12 $63.12
Income and expenditures initially recorded in the
General Fund and then transferred, in accordance
with accounting requirements, to a special fund.
CALPERS EMPLOYER PAID
MEMBER CONTRIBUTION $17.65 $17.65
Agreement with bargaining units to eliminate
Employer Paid Member Contribution to CalPERS in
return for a salary adjustment of an equivalent
percentage.
CAMPUS AIDES $34.10 $0.33 $34.42 Campus aides for selected schools.
CAPITAL FUNDS $13.53 $2,620.33 $2,633.87 Resources for capital projects.
CATEGORICAL PROGRAM
ADVISORS $28.72 $28.72 Supports categorical program needs at school sites.
21
DISTRICT EXPENDITURES BY MAJOR GROUP AND RESOURCE, 2014-15
DOLLARS IN MILLIONS
Major Group Unrestricted Restricted Other Grand Total Definition
CENTRAL OFFICE/EDUCATIONAL
SERVICE CENTERS $281.67 $76.12 $146.97 $504.76
Resources that support school sites and day to day
operations of the District. Special Education central
office is included in the special education categories.
CERTIFICATED SUPPLEMENTAL
TIME (X, Z, & PROFESSIONAL
DEVELOPMENT) $9.36 $26.22 $35.59 Resources for additional certificated assignments.
CHARTER SCHOOL CATEGORICAL
BLOCK GRANT $9.30 $9.30
Categorical Block Grant and Allocation in Lieu of EIA
(Economic Impact Aid) for Affiliated Charter Schools
from the State.
CHARTER SCHOOL FEE FOR
SERVICE $4.21 $0.20 $4.40 Charter school fees for district provided services.
CHARTER SCHOOL OVERSIGHT
FEE $10.78 $10.78
1% Oversight Fee to provide services to charter
schools.
CIVIC CENTER $2.66 $2.66 Rental of district facilities by community groups.
CLASS SIZE REDUCTION HIGH
SCHOOLS - MATH & ELA $7.00 $7.00 Resources to reduce class sizes at senior high schools.
CLASS SIZE REDUCTION MIDDLE
SCHOOLS - MATH & ELA $6.00 $6.00 Resources to reduce class sizes at middle schools.
CLASSIFIED OVERTIME, X & Z
TIME $0.33 $1.21 $1.54 Resources for additional classified assignments.
CLERICAL SUBSTITUTES $3.82 $0.02 $3.84
Replacement resources for absent clerical support
positions.
CLERICAL SUPPORT $127.90 $8.96 $136.86
School site clerical positions (i.e. School Administrative
Assistant, Office Technicians).
COACHES INSTRUCTIONAL $8.26 $30.04 $38.30 Supports instructional needs at school sites.
COMMON CORE STATE
STANDARDS $2.36 $89.04 $91.39
Funding for the implementation of Common Core
State Standards.
COORDINATED EARLY
INTERVENING SERVICES $4.72 $4.72
The State mandated a corrective action plan for
LAUSD regarding disproportionate over identification
of students with disabilities. The corrective action plan
provides for Early Intervention Services for general
education students.
COORDINATORS $19.38 $19.38
Supports instructional needs of various programs and
offices.
CORE WAIVER $61.08 $61.08
Waiver from No Child Left Behind through the
California Office to Reform Education (CORE).
COUNSELING AIDES $0.11 $0.73 $0.84 Assist Counselors with student counseling.
COUNSELING TIME
(REGISTRATION) $2.11 $2.11
Resources to support registration time prior to school
opening.
COUNSELORS $46.04 $11.53 $57.57 Student or youth counseling and/or guidance.
COUNSELORS, PUPIL SERVICES &
ATTENDANCE (PSA) $3.40 $13.52 $16.92
Counselors working with students, parents, and school
personnel to increase student attendance.
CUSTODIAL OVERTIME & RELIEF $0.39 $0.44 $0.82 Resources for additional custodial assignments.
CUSTODIAL SUPPLIES $4.94 $0.04 $4.98
Supplies to support the maintenance and cleanliness
of school sites.
CUSTODIANS $144.44 $144.44
Supports and maintains the cleanliness of school sites
and offices.
DATA PROCESSING $7.40 $7.40
Information Technology (IT) equipment, materials, and
software licensing.
DEBT SERVICE $3.40 $0.11 $923.87 $927.37
Payment for principal and interest for Certificate of
Participation (COPs) and other debt instruments.
DIFFERENTIALS/LONGEVITIES $7.53 $0.30 $7.83
Supplemental salary resources for years of service,
and degrees per collective bargaining.
22
DISTRICT EXPENDITURES BY MAJOR GROUP AND RESOURCE, 2014-15
DOLLARS IN MILLIONS
Major Group Unrestricted Restricted Other Grand Total Definition
DONATIONS $28.96 $0.03 $28.99 Donations by individuals or groups to schools.
EARLY CHILDHOOD AND FAMILY
LITERACY GRANTS $0.25 $0.25
Resources to support early childhood and family
literacy programs.
EARLY CHILDHOOD
DEVELOPMENT $127.80 $127.80 Early Childhood Development.
EARLY CHILDHOOD
DEVELOPMENT, INTER-FUND
TRANSFER $40.69 $40.69
Income and expenditures initially recorded in the
General Fund and then transferred, in accordance
with accounting requirements, to a special fund.
EARLY RETIREMENT INCENTIVE $9.62 $9.62
Retirement bonus for employees paid during the 1992-
93 school year.
EMPLOYEE
BENEFITS/ADJUSTMENTS/PUBLI
C EMPLOYEE RETIREMENTS -$24.05 $0.94 -$0.07 -$23.18
Payment to the state for reduced employer
contribution to Public Employees' Retirement System.
EMPLOYEES LOANED TO
AGENCIES/OFFICE $4.56 $4.56
District employees loaned to other entities. The
District is reimbursed for salaries.
ENERGY REBATE CONSERVATION $3.08 $3.08 Improvement of buildings and job-cost materials.
ENGLISH LEARNER
IMPLEMENTATION AND
SUPPORT $19.80 $19.80
Support for English Learner students to improve
academic achievement.
E-RATE MATCH/REBATE $20.30 $20.30
Local revenue funding for the E-Rate Match/Rebate
program.
EVALUATION $0.23 $0.23
Training instructional personnel in a robust and
detailed way to view instruction.
FACILITIES
MAINTENANCE/OPERATIONS $47.24 $0.57 $47.81
Building & Grounds Workers, roving gardeners,
window washing crew, landscaping, tree trimming,
pest control, repair/replacement of fire extinguishers,
repair of lighting for auditorium and gym.
FACILITIES NON-BOND
REQUIREMENTS $3.55 $3.55 General fund resources for facilities projects.
FILMING $5.27 $0.01 $5.29
Funds received from Filming and Photography.
School resources yet to be allocated.
FINANCIAL MANAGERS $9.86 $9.86
Manages and advises on financial matters and
accounting procedures pertaining to student body
funds.
FIRE DAMAGE $2.46 $2.46 Repair fire damage.
FOSTER YOUTH SUPPORT
PLAN/FAMILY SOURCE SYSTEM
PROPOSAL $9.88 $9.88
Resources to increase academic and support services
to Foster Youth.
GENERAL SUPPLIES $8.71 $8.71
School site resources to support the instructional
program and operations.
GIFTED AND TALENTED
PROGRAM (GATE) $2.57 $2.57
Supports staff training for employees who work with
gifted students.
HEALTH SERVICES $7.45 $23.50 $30.95
Personnel and operational expenses of Student Health
& Human Services Division (i.e., Physician, Coordinator-
Nurses, PSA, Audiometrists & Student Discipline,
clerical support, mileage, nurse substitute). Mandated
nursing services, attendance recovery, additional
psychologist support.
HOUSEKEEPERS $5.12 $5.12
Performs general housekeeping duties at Early
Education Centers.
IMA-LIBRARY FINES $0.71 $0.71 Fees and fines for lost and damaged books.
INDIRECT COST -$109.96 $84.92 $25.03 $0.00
Elements of cost necessary in the operation of a
District or in the performance of a service that are
such a nature that the amount applicable to each
accounting unit cannot be determined readily.
23

DISTRICT EXPENDITURES BY MAJOR GROUP AND RESOURCE, 2014-15
DOLLARS IN MILLIONS
Major Group Unrestricted Restricted Other Grand Total Definition
INSTRUCTIONAL AIDES $2.01 $3.68 $5.69
Assist certificated employees in developing and
presenting specialized educational materials and in
conducting instructional activities requiring specialized
education, training, or vocational experience.
INSTRUCTIONAL MATERIALS $59.78 $97.31 $1.40 $158.49
Resources that support and/or supplement the core
instructional program and operations.
INSTRUCTIONAL TECHNOLOGY
SUPPORT (VLC) $4.00 $4.00 Resources to support virtual learning.
INSURANCE PREMIUMS $26.03 $26.03
Cost of insurance coverage for liability, property, and
vehicles.
INTER-FUND TRANSFER
CERTIFICATE OF PARTICIPATION
(COPS) $39.00 $39.00
Income and expenditures initially recorded in the
General Fund and then transferred, in accordance
with accounting requirements, to a special fund.
INTER-FUND TRANSFER
MEDICARE PART D $9.20 $9.20
Income and expenditures initially recorded in the
General Fund and then transferred, in accordance
with accounting requirements, to a special fund.
INTERNAL SERVICE FUNDS $1,108.22 $1,108.22
Payments and claims for Health and Welfare Fund and
Workers' Compensation.
JUNIOR RESERVE OFFICER
TRAINING CORPS (JROTC) $5.30 $5.30 Teacher positions for the JROTC program.
LIABILITY RESERVE $15.65 $15.65 Districtwide liability.
LIBRARY AIDES $9.01 $3.41 $12.42
Provides assistance to students and teachers in a
school library media center.
LOCAL INITIATIVE SCHOOL $1.11 $1.11 Local School Initiative support resources.
LUMP SUM VACATION $12.92 $12.92 Lump sum vacation and other benefits.
MAGNET SCHOOLS RESOURCES $17.66 $17.66 Additional resources for magnet schools and centers.
MILEAGE & TUITION
REIMBURSEMENT $1.58 $0.02 $1.60
Mileage and Tuition reimbursement due to a
bargaining unit agreement.
NEW SCHOOLS START UP COSTS $0.29 $0.29
Start-up costs for new schools, including
administrators, counselors, clerical, library supplies,
custodians, custodial supplies, instructional materials,
general supplies, and professional development days.
NON-FILMING RENTAL $5.92 $5.92
Funds received from non filming rental. School
resources yet to be allocated.
NURSES $19.76 $15.89 $35.66 Support health services.
OFF-NORM & ONE TIME SCHOOL
ALLOCATIONS $7.40 $7.40
One-time allocations such as teachers, administrators
and clerical positions and other off-norm positions.
ONGOING & MAJOR
MAINTENANCE $80.03 $80.03
Regular Routine General Maintenance program, Plant
Maintenance, School Bathroom Renovation, & Plant
Maintenance Salaries.
OPTIONS PROGRAM $74.66 $2.66 $6.20 $83.53
Options schools are designed to provide students a
smaller, more personalized education supported by
knowledgeable, supportive educators working
collaboratively.
PARAPROFESSIONAL TEACHER
TRAINING $0.82 $0.82
A paraeducator (instructional assistant/aide) career
ladder program that leads to a teacher preparation
program.
PARENT INVOLVEMENT $7.45 $13.49 $20.93
Parent support through workshops, trainings,
communications, and school involvement.
PERSONNEL WITH PENDING
CASES $21.19 $21.19 Personnel housed pending personnel action.
PHYSICAL EDUCATION TEACHER
INCENTIVE $1.64 $1.64
Provides funding to hire credentialed physical
education teachers in selected schools serving grades
kindergarten and first through eight.
24
DISTRICT EXPENDITURES BY MAJOR GROUP AND RESOURCE, 2014-15
DOLLARS IN MILLIONS
Major Group Unrestricted Restricted Other Grand Total Definition
PILOT SCHOOL STARTUP FUNDS $0.50 $0.50 Start-up costs for new pilot schools.
PROFESSIONAL DEVELOPMENT $0.81 $0.39 $1.20
Resources to support the professional development of
District employees.
PROP 39 CHARTER SCHOOL CO-
LOCATION $8.32 $8.32 Charter school fees for district provided services.
PROP 39 CLEAN ENERGY $59.91 $59.91
Funds that support retrofit projects which will help
ensure long-term energy savings.
PROPERTY RENTALS $7.45 $7.45 Rental expense for leasing of school facilities.
PSYCHIATRIC SOCIAL WORKERS $2.99 $6.10 $9.08
Provides specialized services to identified students to
remove emotional, behavioral, and family crisis
barriers to learning.
PSYCHOLOGISTS $6.92 $10.12 $17.04
Provides specialized pupil services for individuals or
groups.
REASONABLE
ACCOMMODATIONS $4.68 $0.01 $4.69
Resources provided to employees with disabilities.
Resources include Education Aides, Teacher
Assistants, Sign Language Interpreters, and Special
Education Assistants.
RESERVE FOR NEW GRANTS $89.71 $6.01 $95.72 Resources for pending grants.
RESTORATIVE JUSTICE
PROGRAM $4.09 $4.09
Program to help improve student behavior and
provide alternatives to suspensions and expulsions.
RUBBISH/TRASH DISPOSAL $6.86 $6.86 Trash disposal for all schools and offices.
SALARY OVERPAYMENT $3.00 $3.00 Estimated salary overpayments of District personnel.
SCHOOL ADJUSTMENT FOR
CERTIFIED UNDUPLICATED
COUNTS $16.52 $16.52
Resources for schools based on certified unduplicated
counts in the fall of the school year.
SCHOOL POLICE $56.50 $0.89 $57.38 Safety and security for schools and district property.
SCHOOL READINESS LANGUAGE
DEVELOPMENT PROGRAM $35.55 $35.55
An oral language program that prepares students for
kindergarten.
SCHOOL TECHNOLOGY SUPPORT
(MCSA) $1.80 $1.80
Microcomputer Support Assistants assigned to provide
onsite local technical support for schools.
SPECIAL EDUCATION
ASSISTANTS $0.05 $0.05 Assist teachers with students with disabilities.
SPECIAL EDUCATION
INTERDISTRICT EXCESS COST
PAYMENT $0.65 $0.65
Payments for the excess cost of LAUSD students with
disabilities attending other Districts.
SPED-ADAPTED PHYSICAL
EDUCATION $18.94 $18.94
Adapted Physical Education programs for Special
Education students.
SPED-ADMINISTRATORS-SPED
CENTERS $3.68 $3.68 Instructional leaders at Special Education Centers.
SPED-ALLOCATION TO SCHOOLS
FOR COMPLIANCE $6.09 $6.09
Allocation for support of Special Education
Compliance based on active Individualized Education
Programs (IEPs) in Welligent.
SPED-ASSISTANT OVERTIME-X &
Z TIME/RENORMING $11.42 $11.42
Resources for additional Special Education Assistant
assignments, replacement for absent assistants, and
renorming.
SPED-ASSISTANT PRINCIPAL
ELEMENTARY INSTRUCTIONAL
SPECIALIST $24.14 $24.14
Provide support for Special Education compliance at
elementary schools.
SPED-ASSISTANTS $309.68 $309.68 Assist teachers with students with disabilities.
SPED-ASSISTANTS LONGER
HOURS $10.70 $10.70
Support for Special Education Assistants to extend
work hours.
SPED-ASSISTANTS-PRESCHOOL $21.25 $21.25
Assist preschool teachers with special education
students.
25
DISTRICT EXPENDITURES BY MAJOR GROUP AND RESOURCE, 2014-15
DOLLARS IN MILLIONS
Major Group Unrestricted Restricted Other Grand Total Definition
SPED-ASSISTIVE TECHNOLOGY $2.14 $2.14
"Assistive Technology service" means any service that
directly assists a student with a disability in the
selection, acquisition, or use of an assistive technology
device.
SPED-CAREER & TRANSITION
PROGRAM $11.65 $11.65
The District Office of Transition Services assists in the
planning and delivery of transition services for all
students with disabilities, beginning at age 14 (or
younger, if appropriate) to prepare them for transition
from school to adult living.
SPED-CENTRAL OFFICE $19.90 $19.90
Resources that support Special Education needs at
school sites and day to day operations of the District.
SPED-CLERICAL SUPPORT-SPED
CENTERS $4.95 $3.73 $8.68
Clerical Positions at Special Education Centers (i.e.
School Administrative Assistant, Office Technicians).
SPED-DEAF AND HARD OF
HEARING $12.96 $12.96
The Deaf and Hard of Hearing program serves eligible
students with a documented hearing loss.
SPED-DONATIONS $1.19 $1.19
Support for students with disabilities provided to
various schools and offices by donors.
SPED-EDUCATIONALLY RELATED
MENTAL HEALTH SERVICES $40.71 $40.71
Provide educationally related counseling services that
may include individual counseling, group counseling,
family consultation, and/or family support as needed.
SPED-EXTENDED SCHOOL YEAR $6.06 $7.46 $13.51
Resources provided to special education students to
prevent instructional regression.
SPED-IMA ALLOCATION TO
SCHOOLS $1.89 $1.89
Allocation to support and/or supplement the core
instructional program and operations for students
with disabilities.
SPED-IMA-EQUIP-MATERIAL $12.88 $12.88
Instructional materials and equipment used to support
students with disabilities.
SPED-INFANT PROGRAM
SERVICES $4.70 $4.70
Provide early intervention and related services for
children birth to three years of age identified with a
hearing loss, visual impairment, or severe orthopedic
impairment.
SPED-LEAST RESTRICTIVE
ENVIRONMENT COUNSELORS $1.16 $1.16
LRE Counselors provide counseling services to
students with physical disabilities who are eligible for
counseling through their IEPs.
SPED-NON PUBLIC SERVICES $163.36 $163.36
Payments to certified non-District nonpublic
schools/agencies for services provided to district
students with disabilities.
SPED-NURSING SERVICES $11.22 $11.22 Provide health services to students with disabilities.
SPED-OCCUPATIONAL &
PHYSICAL THERAPY $21.63 $21.63 School physical therapy for special education students.
SPED-OPTIONS $8.43 $8.43 Special Education services at Options Schools.
SPED-PASS THROUGH FOR
INDEPENDENT CHARTERS $66.78 $66.78
Expenditure account that records Special Education
expenditures for fiscally independent charter schools.
The amount recorded matches the revenue provided
to these charter schools.
SPED-PRESCHOOL PROGRAM
SERVICES (INCLUDING
ITINERANTS) $17.78 $17.78
Provide special education services for children ages 3-
5 who have been identified with one of Federal and
State defined special education eligibilities.
SPED-PRIVATE SCHOOLS
SUPPORT $1.64 $1.64
Provide support and collaboration for private school
teachers who work with student with disabilities.
26

DISTRICT EXPENDITURES BY MAJOR GROUP AND RESOURCE, 2014-15
DOLLARS IN MILLIONS
Major Group Unrestricted Restricted Other Grand Total Definition
SPED-PROGRAM SPECIALISTS-
CERTIFICATED $5.25 $5.25
Program Specialists plan programs, coordinate
curricular resources, and monitor the effectiveness of
programs for students with disabilities.
SPED-PSYCHIATRIC SOCIAL
WORKERS $6.64 $6.64
Provide case management; individual, group, and
family therapy, and mental health consultation to
special education population.
SPED-PSYCHOLOGISTS $31.85 $31.85
Provide assessment and counseling services to
students with disabilities.
SPED-REIMBURSEMENT-DUE
PROCESS $7.59 $7.59
Reimbursement to parents, schools and agencies
based on Due Process agreements involving students
with disabilities.
SPED-SPEECH & LANGUAGE $38.65 $38.65
School-based Speech Therapy supports the
educational program for students who have a disorder
in communication involving articulation, language,
fluency and/or voice.
SPED-SUPPLEMENTAL INCREASE $17.55 $17.55
Support for special education students that are English
Learner, Low-Income, and/or Foster Care to improve
academic achievement.
SPED-TEACHER-ITINERANTS $7.65 $7.65 Special Education Itinerant Teacher Positions.
SPED-TEACHER-RESOURCE
SPECIALIST PROGRAM $113.54 $113.54 Resource Specialist Program Teacher Positions.
SPED-TEACHER-SPECIAL DAY
PROGRAM $240.33 $240.33 Special Day Program Teacher Positions.
SPED-TEACHER-SPECIAL DAY
PROGRAM-PRESCHOOL $41.34 $41.34 Special Day Program Preschool Teacher Positions.
SPED-TEACHER-SUPPL & SUB
TIME/RENORMING/PROF
DEVELOPMENT $9.37 $9.37
Resources for additional teacher assignments,
replacement for absent teachers, renorming, and
professional development.
SPED-TEMPORARY PERSONNEL
ACCOUNT $0.23 $0.23
Resources to support the instructional program and
operations at Special Education Centers.
SPED-TRANSPORTATION $65.12 $65.12 Transportation for students with disabilities.
SPED-VISUALLY IMPAIRED $5.62 $5.62
The Visually Impaired (VI) program provides services
to students with vision impairments.
STUDENT HEALTH AND HUMAN
SUPPORT PERSONNEL $5.73 $3.38 $9.12
Provides health, mental health, and learning support
services to students.
SUBSTITUTES-DAY TO DAY AND
LONG-TERM $63.23 $7.26 $70.49
Replacement resources for absent teachers. Includes
funding for long-term substitutes, long-term clerical
substitutes, and Contract Pool Teachers.
SUMMER SCHOOL-CREDIT
RECOVERY $1.00 $11.00 $12.00
To fund the summer school program for credit
recovery courses.
SUPPORT SERVICES (PSAs, PSWs) $13.14 $13.14 Maintain 12-13 staffing levels for support personnel.
TARGETED SUPPORT FOR
MIDDLE AND SPAN SCHOOLS $7.00 $7.00 Resources to support middle and span schools.
TEACHER - LIBRARY MEDIA $8.93 $1.58 $10.52
Aligns the school library media program, collection,
and services with the school curriculum.
TEACHER ACADEMIC
DIFFERENTIALS $0.99 $0.99
Supplemental pay for coordinating academic activities
(i.e. Yearbook, Musicals, Decathlon).
TEACHER ASSISTANTS $12.12 $29.60 $41.72
Provides reinforcement and support of instruction
under the direct supervision of a highly qualified
classroom teacher.
TEACHER SUPPORT - REED
SETTLEMENT $25.43 $25.43
Resources to improve teacher retention and academic
achievement at Reed schools.
TEACHERS $1,894.12 $95.20 $1,989.33 Teacher positions.
TEACHERS - CONTRACT POOL $44.04 $44.04
Contract pool teachers. These teachers may also serve
as day-to-day and long-term substitutes.
27
DISTRICT EXPENDITURES BY MAJOR GROUP AND RESOURCE, 2014-15
DOLLARS IN MILLIONS
Major Group Unrestricted Restricted Other Grand Total Definition
TECHNOLOGY $4.25 $4.25 Technology infrastructure and support for schools.
TELEPHONE $21.37 $0.04 $0.49 $21.90 Telephone services for all schools.
TEMPORARY PERSONNEL
ACCOUNT $11.90 $0.53 $12.43
Resources to support the instructional program and
operations.
TESTING $2.36 $2.36
Standards and assessment testing, and testing
coordinator differentials for select schools.
TEXTBOOKS $23.61 $18.98 $42.59 District funded textbooks.
TRANSPORTATION $78.89 $2.85 $81.75
Bus transportation for all District traveling program
students including magnet.
UTILITIES $126.83 $0.01 $126.84 Electrical, water, and gas expenses for schools.
UTLA RELEASE TIME $0.25 $0.25 Authorized release time for teachers.
VEHICLE REPAIRS/REPLACEMENT $12.04 $12.04 Vehicle maintenance expenditures for school buses.
WATER/TOXIC TESTING/FEES &
PERMIT (CA CLEAN AIR) $3.52 $3.52 Air Quality Management district fees.
Grand Total $4,167.06 $2,469.11 $5,394.69 $12,030.86
28
BUDGETED EXPENDITURES BY SERVICE
Introduction
These two reports show budgeted expenditures by major groups as defined by the District. These
reports detail the specific expenditures that are supported by the District’s Local Control Funding
Formula (LCFF) resources. In addition, the reports denote the services that are attached to each
expenditure. These services are further explained in the District’s Local Control Accountability
Plan (LCAP). For more information on the District’s LCAP, please visit:
http://achieve.lausd.net/Page/5124
The first report shows budgeted expenditures that are supported by base LCFF resources. Base
LCFF resources are intended to support all students, regardless of student need. The second
report shows budgeted expenditures that are supported by supplemental and concentration LCFF
resources. These resources are specifically intended to support students that are Low-Income,
English Learner, or Foster Youth.
29
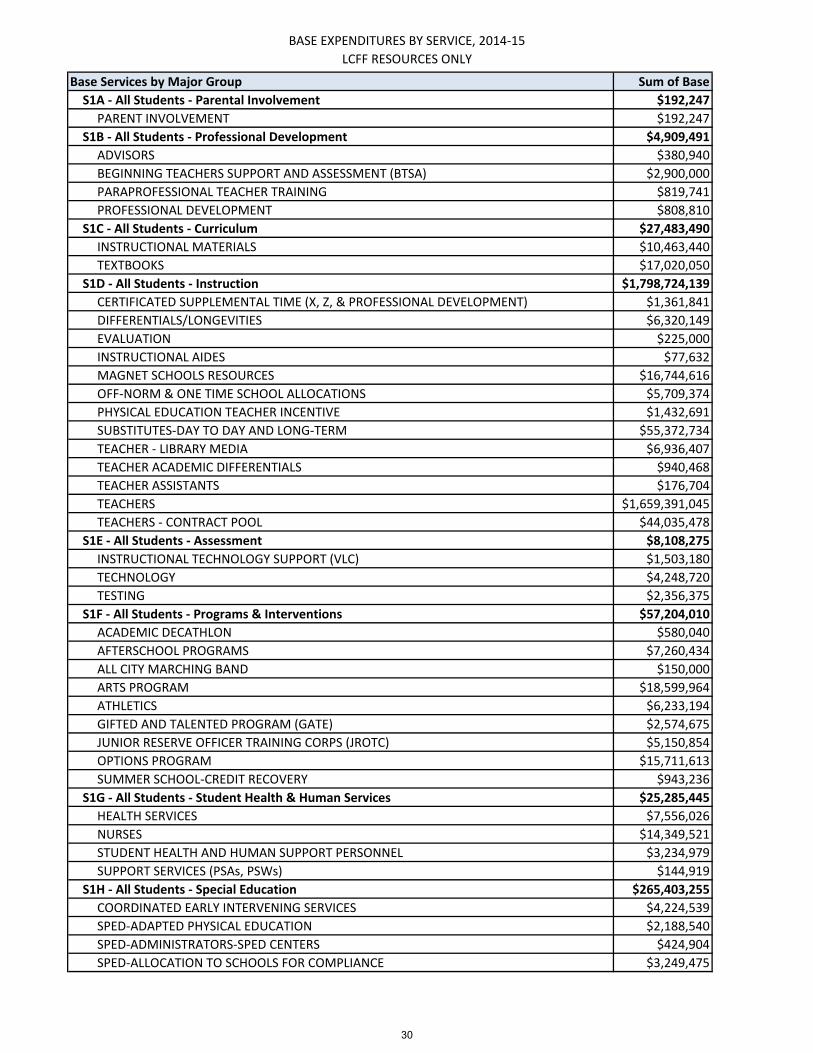
BASE EXPENDITURES BY SERVICE, 2014-15
LCFF RESOURCES ONLY
Base Services by Major Group Sum of Base
S1A - All Students - Parental Involvement $192,247
PARENT INVOLVEMENT $192,247
S1B - All Students - Professional Development $4,909,491
ADVISORS $380,940
BEGINNING TEACHERS SUPPORT AND ASSESSMENT (BTSA) $2,900,000
PARAPROFESSIONAL TEACHER TRAINING $819,741
PROFESSIONAL DEVELOPMENT $808,810
S1C - All Students - Curriculum $27,483,490
INSTRUCTIONAL MATERIALS $10,463,440
TEXTBOOKS $17,020,050
S1D - All Students - Instruction $1,798,724,139
CERTIFICATED SUPPLEMENTAL TIME (X, Z, & PROFESSIONAL DEVELOPMENT) $1,361,841
DIFFERENTIALS/LONGEVITIES $6,320,149
EVALUATION $225,000
INSTRUCTIONAL AIDES $77,632
MAGNET SCHOOLS RESOURCES $16,744,616
OFF-NORM & ONE TIME SCHOOL ALLOCATIONS $5,709,374
PHYSICAL EDUCATION TEACHER INCENTIVE $1,432,691
SUBSTITUTES-DAY TO DAY AND LONG-TERM $55,372,734
TEACHER - LIBRARY MEDIA $6,936,407
TEACHER ACADEMIC DIFFERENTIALS $940,468
TEACHER ASSISTANTS $176,704
TEACHERS $1,659,391,045
TEACHERS - CONTRACT POOL $44,035,478
S1E - All Students - Assessment $8,108,275
INSTRUCTIONAL TECHNOLOGY SUPPORT (VLC) $1,503,180
TECHNOLOGY $4,248,720
TESTING $2,356,375
S1F - All Students - Programs & Interventions $57,204,010
ACADEMIC DECATHLON $580,040
AFTERSCHOOL PROGRAMS $7,260,434
ALL CITY MARCHING BAND $150,000
ARTS PROGRAM $18,599,964
ATHLETICS $6,233,194
GIFTED AND TALENTED PROGRAM (GATE) $2,574,675
JUNIOR RESERVE OFFICER TRAINING CORPS (JROTC) $5,150,854
OPTIONS PROGRAM $15,711,613
SUMMER SCHOOL-CREDIT RECOVERY $943,236
S1G - All Students - Student Health & Human Services $25,285,445
HEALTH SERVICES $7,556,026
NURSES $14,349,521
STUDENT HEALTH AND HUMAN SUPPORT PERSONNEL $3,234,979
SUPPORT SERVICES (PSAs, PSWs) $144,919
S1H - All Students - Special Education $265,403,255
COORDINATED EARLY INTERVENING SERVICES $4,224,539
SPED-ADAPTED PHYSICAL EDUCATION $2,188,540
SPED-ADMINISTRATORS-SPED CENTERS $424,904
SPED-ALLOCATION TO SCHOOLS FOR COMPLIANCE $3,249,475
30
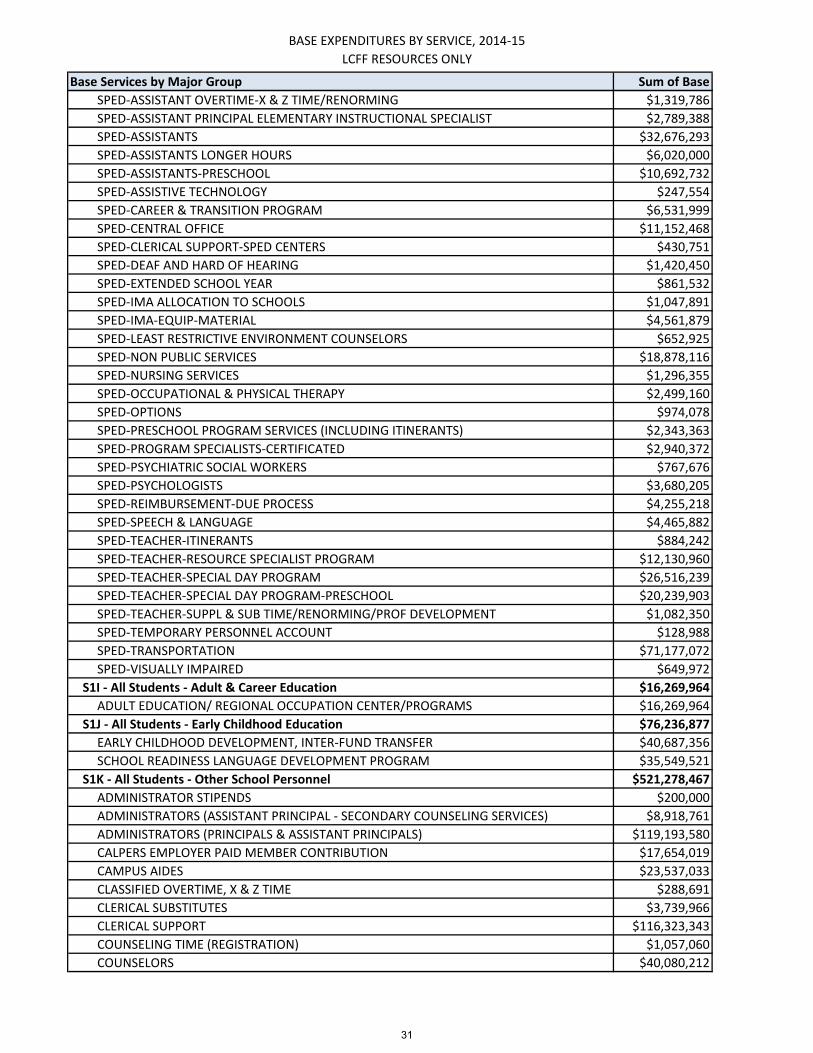
BASE EXPENDITURES BY SERVICE, 2014-15
LCFF RESOURCES ONLY
Base Services by Major Group Sum of Base
SPED-ASSISTANT OVERTIME-X & Z TIME/RENORMING $1,319,786
SPED-ASSISTANT PRINCIPAL ELEMENTARY INSTRUCTIONAL SPECIALIST $2,789,388
SPED-ASSISTANTS $32,676,293
SPED-ASSISTANTS LONGER HOURS $6,020,000
SPED-ASSISTANTS-PRESCHOOL $10,692,732
SPED-ASSISTIVE TECHNOLOGY $247,554
SPED-CAREER & TRANSITION PROGRAM $6,531,999
SPED-CENTRAL OFFICE $11,152,468
SPED-CLERICAL SUPPORT-SPED CENTERS $430,751
SPED-DEAF AND HARD OF HEARING $1,420,450
SPED-EXTENDED SCHOOL YEAR $861,532
SPED-IMA ALLOCATION TO SCHOOLS $1,047,891
SPED-IMA-EQUIP-MATERIAL $4,561,879
SPED-LEAST RESTRICTIVE ENVIRONMENT COUNSELORS $652,925
SPED-NON PUBLIC SERVICES $18,878,116
SPED-NURSING SERVICES $1,296,355
SPED-OCCUPATIONAL & PHYSICAL THERAPY $2,499,160
SPED-OPTIONS $974,078
SPED-PRESCHOOL PROGRAM SERVICES (INCLUDING ITINERANTS) $2,343,363
SPED-PROGRAM SPECIALISTS-CERTIFICATED $2,940,372
SPED-PSYCHIATRIC SOCIAL WORKERS $767,676
SPED-PSYCHOLOGISTS $3,680,205
SPED-REIMBURSEMENT-DUE PROCESS $4,255,218
SPED-SPEECH & LANGUAGE $4,465,882
SPED-TEACHER-ITINERANTS $884,242
SPED-TEACHER-RESOURCE SPECIALIST PROGRAM $12,130,960
SPED-TEACHER-SPECIAL DAY PROGRAM $26,516,239
SPED-TEACHER-SPECIAL DAY PROGRAM-PRESCHOOL $20,239,903
SPED-TEACHER-SUPPL & SUB TIME/RENORMING/PROF DEVELOPMENT $1,082,350
SPED-TEMPORARY PERSONNEL ACCOUNT $128,988
SPED-TRANSPORTATION $71,177,072
SPED-VISUALLY IMPAIRED $649,972
S1I - All Students - Adult & Career Education $16,269,964
ADULT EDUCATION/ REGIONAL OCCUPATION CENTER/PROGRAMS $16,269,964
S1J - All Students - Early Childhood Education $76,236,877
EARLY CHILDHOOD DEVELOPMENT, INTER-FUND TRANSFER $40,687,356
SCHOOL READINESS LANGUAGE DEVELOPMENT PROGRAM $35,549,521
S1K - All Students - Other School Personnel $521,278,467
ADMINISTRATOR STIPENDS $200,000
ADMINISTRATORS (ASSISTANT PRINCIPAL - SECONDARY COUNSELING SERVICES) $8,918,761
ADMINISTRATORS (PRINCIPALS & ASSISTANT PRINCIPALS) $119,193,580
CALPERS EMPLOYER PAID MEMBER CONTRIBUTION $17,654,019
CAMPUS AIDES $23,537,033
CLASSIFIED OVERTIME, X & Z TIME $288,691
CLERICAL SUBSTITUTES $3,739,966
CLERICAL SUPPORT $116,323,343
COUNSELING TIME (REGISTRATION) $1,057,060
COUNSELORS $40,080,212
31
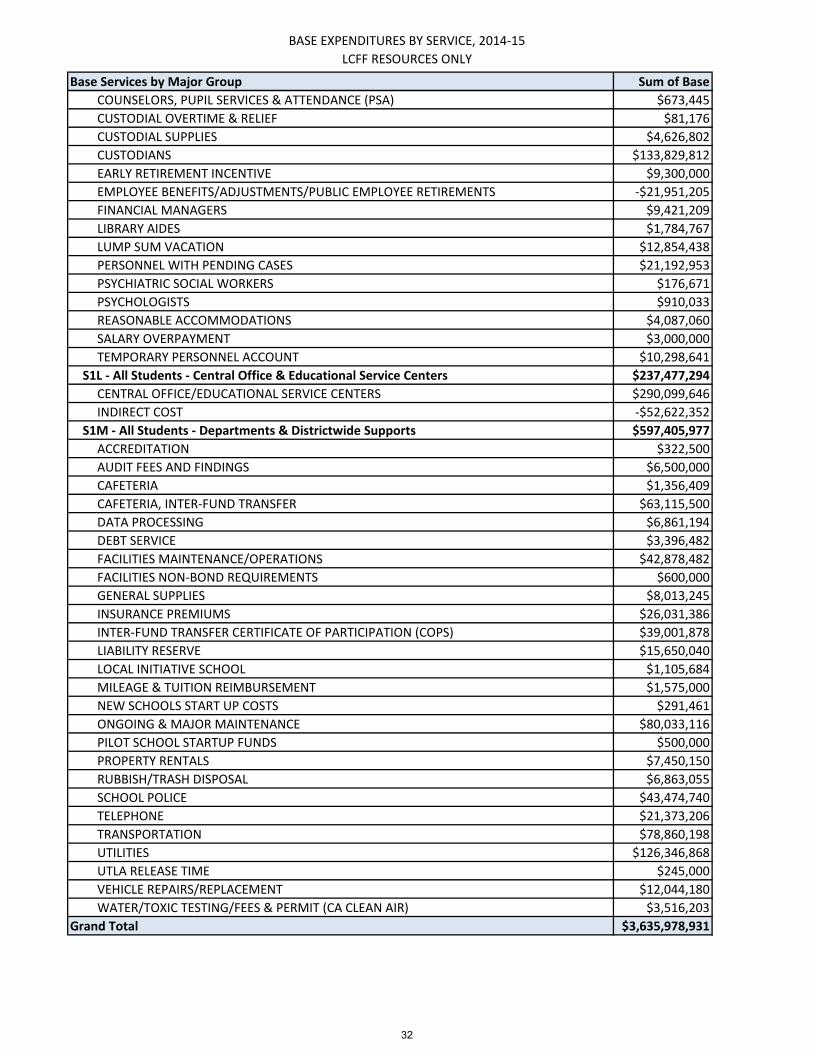
BASE EXPENDITURES BY SERVICE, 2014-15
LCFF RESOURCES ONLY
Base Services by Major Group Sum of Base
COUNSELORS, PUPIL SERVICES & ATTENDANCE (PSA) $673,445
CUSTODIAL OVERTIME & RELIEF $81,176
CUSTODIAL SUPPLIES $4,626,802
CUSTODIANS $133,829,812
EARLY RETIREMENT INCENTIVE $9,300,000
EMPLOYEE BENEFITS/ADJUSTMENTS/PUBLIC EMPLOYEE RETIREMENTS -$21,951,205
FINANCIAL MANAGERS $9,421,209
LIBRARY AIDES $1,784,767
LUMP SUM VACATION $12,854,438
PERSONNEL WITH PENDING CASES $21,192,953
PSYCHIATRIC SOCIAL WORKERS $176,671
PSYCHOLOGISTS $910,033
REASONABLE ACCOMMODATIONS $4,087,060
SALARY OVERPAYMENT $3,000,000
TEMPORARY PERSONNEL ACCOUNT $10,298,641
S1L - All Students - Central Office & Educational Service Centers $237,477,294
CENTRAL OFFICE/EDUCATIONAL SERVICE CENTERS $290,099,646
INDIRECT COST -$52,622,352
S1M - All Students - Departments & Districtwide Supports $597,405,977
ACCREDITATION $322,500
AUDIT FEES AND FINDINGS $6,500,000
CAFETERIA $1,356,409
CAFETERIA, INTER-FUND TRANSFER $63,115,500
DATA PROCESSING $6,861,194
DEBT SERVICE $3,396,482
FACILITIES MAINTENANCE/OPERATIONS $42,878,482
FACILITIES NON-BOND REQUIREMENTS $600,000
GENERAL SUPPLIES $8,013,245
INSURANCE PREMIUMS $26,031,386
INTER-FUND TRANSFER CERTIFICATE OF PARTICIPATION (COPS) $39,001,878
LIABILITY RESERVE $15,650,040
LOCAL INITIATIVE SCHOOL $1,105,684
MILEAGE & TUITION REIMBURSEMENT $1,575,000
NEW SCHOOLS START UP COSTS $291,461
ONGOING & MAJOR MAINTENANCE $80,033,116
PILOT SCHOOL STARTUP FUNDS $500,000
PROPERTY RENTALS $7,450,150
RUBBISH/TRASH DISPOSAL $6,863,055
SCHOOL POLICE $43,474,740
TELEPHONE $21,373,206
TRANSPORTATION $78,860,198
UTILITIES $126,346,868
UTLA RELEASE TIME $245,000
VEHICLE REPAIRS/REPLACEMENT $12,044,180
WATER/TOXIC TESTING/FEES & PERMIT (CA CLEAN AIR) $3,516,203
Grand Total $3,635,978,931
32
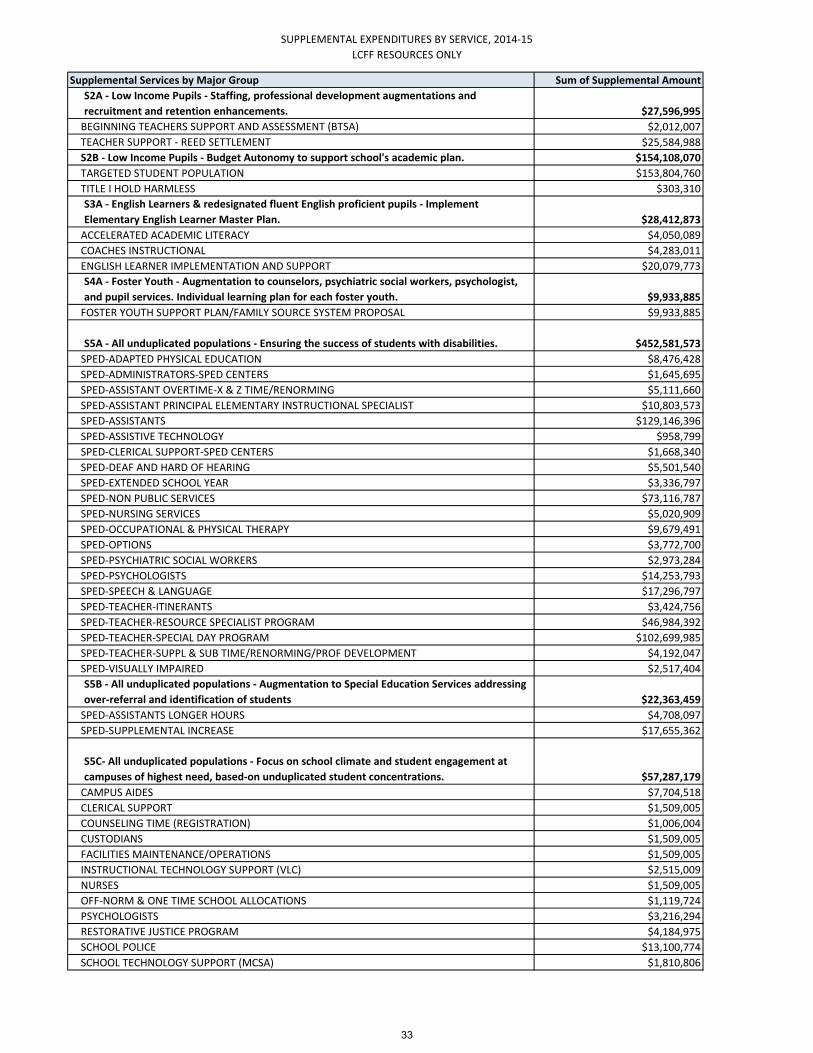
SUPPLEMENTAL EXPENDITURES BY SERVICE, 2014-15
LCFF RESOURCES ONLY
Supplemental Services by Major Group Sum of Supplemental Amount
S2A - Low Income Pupils - Staffing, professional development augmentations and
recruitment and retention enhancements. $27,596,995
BEGINNING TEACHERS SUPPORT AND ASSESSMENT (BTSA) $2,012,007
TEACHER SUPPORT - REED SETTLEMENT $25,584,988
S2B - Low Income Pupils - Budget Autonomy to support school's academic plan. $154,108,070
TARGETED STUDENT POPULATION $153,804,760
TITLE I HOLD HARMLESS $303,310
S3A - English Learners & redesignated fluent English proficient pupils - Implement
Elementary English Learner Master Plan. $28,412,873
ACCELERATED ACADEMIC LITERACY $4,050,089
COACHES INSTRUCTIONAL $4,283,011
ENGLISH LEARNER IMPLEMENTATION AND SUPPORT $20,079,773
S4A - Foster Youth - Augmentation to counselors, psychiatric social workers, psychologist,
and pupil services. Individual learning plan for each foster youth. $9,933,885
FOSTER YOUTH SUPPORT PLAN/FAMILY SOURCE SYSTEM PROPOSAL $9,933,885
S5A - All unduplicated populations - Ensuring the success of students with disabilities. $452,581,573
SPED-ADAPTED PHYSICAL EDUCATION $8,476,428
SPED-ADMINISTRATORS-SPED CENTERS $1,645,695
SPED-ASSISTANT OVERTIME-X & Z TIME/RENORMING $5,111,660
SPED-ASSISTANT PRINCIPAL ELEMENTARY INSTRUCTIONAL SPECIALIST $10,803,573
SPED-ASSISTANTS $129,146,396
SPED-ASSISTIVE TECHNOLOGY $958,799
SPED-CLERICAL SUPPORT-SPED CENTERS $1,668,340
SPED-DEAF AND HARD OF HEARING $5,501,540
SPED-EXTENDED SCHOOL YEAR $3,336,797
SPED-NON PUBLIC SERVICES $73,116,787
SPED-NURSING SERVICES $5,020,909
SPED-OCCUPATIONAL & PHYSICAL THERAPY $9,679,491
SPED-OPTIONS $3,772,700
SPED-PSYCHIATRIC SOCIAL WORKERS $2,973,284
SPED-PSYCHOLOGISTS $14,253,793
SPED-SPEECH & LANGUAGE $17,296,797
SPED-TEACHER-ITINERANTS $3,424,756
SPED-TEACHER-RESOURCE SPECIALIST PROGRAM $46,984,392
SPED-TEACHER-SPECIAL DAY PROGRAM $102,699,985
SPED-TEACHER-SUPPL & SUB TIME/RENORMING/PROF DEVELOPMENT $4,192,047
SPED-VISUALLY IMPAIRED $2,517,404
S5B - All unduplicated populations - Augmentation to Special Education Services addressing
over-referral and identification of students $22,363,459
SPED-ASSISTANTS LONGER HOURS $4,708,097
SPED-SUPPLEMENTAL INCREASE $17,655,362
S5C- All unduplicated populations - Focus on school climate and student engagement at
campuses of highest need, based-on unduplicated student concentrations. $57,287,179
CAMPUS AIDES $7,704,518
CLERICAL SUPPORT $1,509,005
COUNSELING TIME (REGISTRATION) $1,006,004
CUSTODIANS $1,509,005
FACILITIES MAINTENANCE/OPERATIONS $1,509,005
INSTRUCTIONAL TECHNOLOGY SUPPORT (VLC) $2,515,009
NURSES $1,509,005
OFF-NORM & ONE TIME SCHOOL ALLOCATIONS $1,119,724
PSYCHOLOGISTS $3,216,294
RESTORATIVE JUSTICE PROGRAM $4,184,975
SCHOOL POLICE $13,100,774
SCHOOL TECHNOLOGY SUPPORT (MCSA) $1,810,806
33
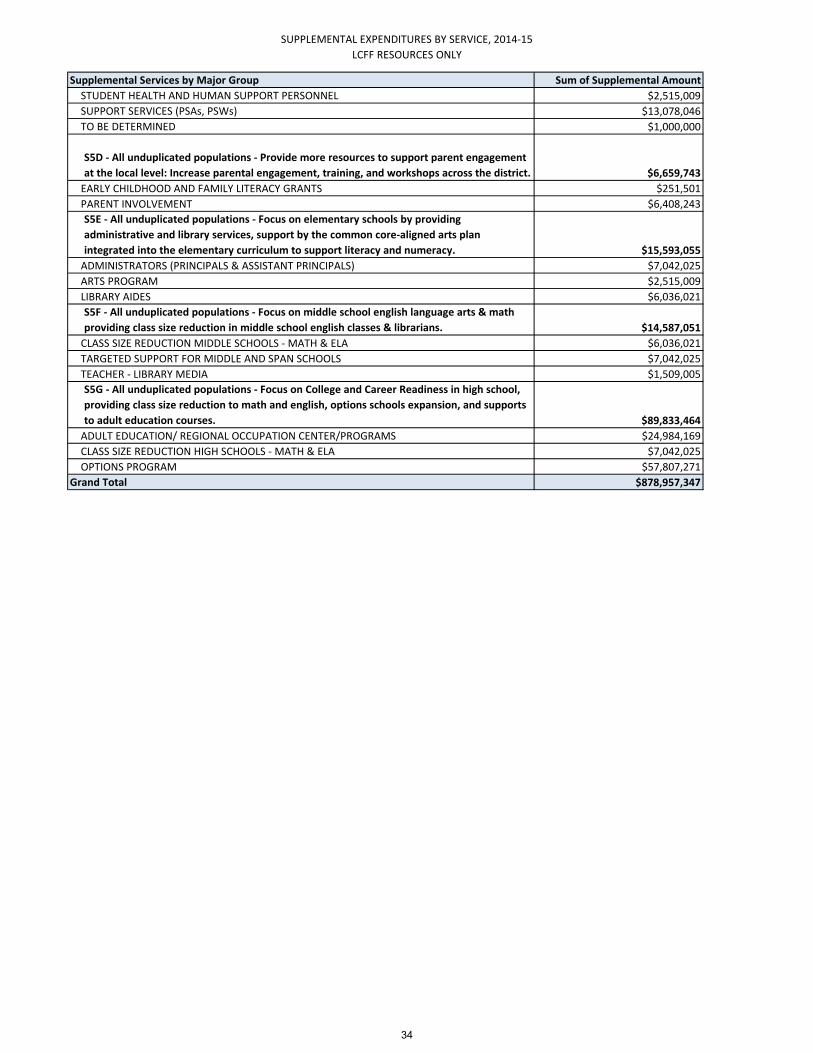
SUPPLEMENTAL EXPENDITURES BY SERVICE, 2014-15
LCFF RESOURCES ONLY
Supplemental Services by Major Group Sum of Supplemental Amount
STUDENT HEALTH AND HUMAN SUPPORT PERSONNEL $2,515,009
SUPPORT SERVICES (PSAs, PSWs) $13,078,046
TO BE DETERMINED $1,000,000
S5D - All unduplicated populations - Provide more resources to support parent engagement
at the local level: Increase parental engagement, training, and workshops across the district. $6,659,743
EARLY CHILDHOOD AND FAMILY LITERACY GRANTS $251,501
PARENT INVOLVEMENT $6,408,243
S5E - All unduplicated populations - Focus on elementary schools by providing
administrative and library services, support by the common core-aligned arts plan
integrated into the elementary curriculum to support literacy and numeracy. $15,593,055
ADMINISTRATORS (PRINCIPALS & ASSISTANT PRINCIPALS) $7,042,025
ARTS PROGRAM $2,515,009
LIBRARY AIDES $6,036,021
S5F - All unduplicated populations - Focus on middle school english language arts & math
providing class size reduction in middle school english classes & librarians. $14,587,051
CLASS SIZE REDUCTION MIDDLE SCHOOLS - MATH & ELA $6,036,021
TARGETED SUPPORT FOR MIDDLE AND SPAN SCHOOLS $7,042,025
TEACHER - LIBRARY MEDIA $1,509,005
S5G - All unduplicated populations - Focus on College and Career Readiness in high school,
providing class size reduction to math and english, options schools expansion, and supports
to adult education courses. $89,833,464
ADULT EDUCATION/ REGIONAL OCCUPATION CENTER/PROGRAMS $24,984,169
CLASS SIZE REDUCTION HIGH SCHOOLS - MATH & ELA $7,042,025
OPTIONS PROGRAM $57,807,271
Grand Total $878,957,347
34

School Site Budgets
School site budget information is available at each school’s Portal Page. There are two school budget reports available: School Budget Summary Report and School Spending Report.
The School Budget Summary Report provides an overview on school funding and the positions and resources purchased with these funds. Additionally, the report provides an overview of student enrollment, attendance, types of students attending, and school characteristics. This report is updated monthly. The School Spending Report provides budget and expenditure information with available balances by program name. In addition, this report is exportable to Excel. The School Spending Report is updated daily. The Portal Page for each school can be accessed through the District’s home page at http://home.lausd.net. Click on “Find a School” in the home page header. Search for a school by name, school code, or zip code, or by using the drop down menus. Once you have selected a school in the search results, you will be taken to the school’s Portal Page. The reports are on the left side of the page under the “School Budget Reports” heading. You will find links to the reports and instructions on how to use each report.
35

LOS ANGELES UNIFIED SCHOOL DISTRICT
BUDGET AND FINANCE POLICY
SUMMARY
The Board of Education adopted the District’s Budget and Finance Policy in June 2004. The Policy is intended to assist the Board of Education in making sound policy, guide the development of the District’s budget, enhance the management of the District’s finances, minimize the risk that the District’s financial condition will create a need for Los Angeles County Office of Education (LACOE) action, and reduce potential audit concerns. The Board and Superintendent set priorities and allocate resources through the budget. The Budget and Finance Policy was developed based on standards from the Government Finance Officers Association’s (GFOA) “Recommended Budget Practices” document. The Policy is also consistent with the State Board of Education (Education Code Sections 33127, 33128), and current Governmental Accounting Standards Board (GASB) rules and standards. In any areas that LAUSD’s budgeting and accounting practices were not in compliance with this policy at the time of its adoption, implementation was phased in. In February 2009, effective for the 2010-11 financial statements, GASB issued Statement No. 54 Fund Balance Reporting and Governmental Fund Type Definitions. This new standard has left the total fund balance amount unchanged, but has changed the categories, the terminology, and how the components of the fund balance are presented and established. The fund balance policy is intended to provide guidelines and to establish procedure for reporting fund balance. In November 2013, the District adopted an updated Budget and Finance Policy that establishes a formula that calculates annual contributions to an Other-Post-Employment Benefit (OPEB) trust when the balances in the general fund exceed the 5% minimum reserve threshold. The Finance and Budget Policy is a “living document,” which the District expects will evolve over time to best connect District policy, budgeting, and financing principles. The Budget and Finance Policy enumerates various broad principles for budgeting and financial operations, as follows: Principle One: The budget should be based on the goals of the Board and Superintendent. The Board and Superintendent have the primary responsibility for developing and articulating the District’s goals. As the budget is developed and presented, these goals should be considered. Principle Two: The budget should be based on sound financial principles. LAUSD’s budget should keep the District financially viable and able to sustain its key programs over time. The following specific financial principles are explained in detail in the full Budget and Finance Policy document:
36

• Balanced Operating Budget • Alignment of Budget with Expected Expenditures • Adequate Reserves • Revenue Maximization • Revenue Estimation • Cost Recovery Through Fees and Charges • Multi-Year Capital Plan and Budget • Asset Management • Equipment Replacement • Prudent Debt Management • Program Sustainability • GASB Compliance
Principle Three: The budget should be clear and easy to understand. The budget should be organized and presented in such a way that readers can understand:
• What the District intends to do and how it intends to do it • The District’s overall financial condition • The historical context for LAUSD programs
Consistent with the GFOA standards, LAUSD has identified guidelines for the presentation of budgets. These standards provided guidance for development of LAUSD’s budgets from four perspectives, as a:
• Policy Document • Financial Plan • Operations Guide • Communications Device
Principle Four: The budget should be timely and easy to manage at the school level. The process of managing the budget is easier for schools and offices if they have access to systems and training. The Chief Financial Officer is responsible for defining the parameters under which schools and offices may manage their budgets, as set forth by the Board of Education. Principle Five: The budget process should inform stakeholders. Prior to the adoption of the final budget, District staff should present the budget to stakeholders. The Board should also conduct a formal public review of the budget, prior to its adoption. The District’s Budget and Finance Policy can be found in its entirety as an Appendix to the Superintendent’s 2014-15 Final Budget document.
37
LOS ANGELES UNIFIED SCHOOL DISTRICT
DEBT MANAGEMENT INFORMATION
Summary
Debt Management Policy. In April 2005, the Board of Education approved a Debt Management Policy that established certain guidelines for the issuance of various types of debt instruments and other long- term financial obligations. The Board is required to review the Policy annually. The Office of the Chief Financial Officer periodically recommends changes to the Policy to better serve the District’s interests. The most recent Debt Management Policy, adopted in November 2013, is included as an appendix to this budget document.
• The Policy requires preparation of an annual Debt Report for submission to the Board and the Superintendent. The latest Debt Report was adopted by the Board on November 2013.
• The District’s actual performance on debt factors, targets, and ceilings are included in
the Debt Report presented to the Board.
• Leases undertaken through the District’s standard procurement process for all equipment with a useful life of less than six years are excluded from the Policy.
The District’s Debt Report includes the following general topics:
1. General Obligation Bond debt
a. The District’s bonded debt limitation and assessed valuation growth b. Bonds outstanding and bonds authorized but unissued c. Intended issuances of bonds d. Tax rate performance for outstanding bonds
i. Proposition BB tax rates ii. Measure K tax rates
iii. Measure R tax rates iv. Measure Y tax rates v. Measure Q tax rates
2. Certificates of Participation (“COPs”) debt
a. COPs outstanding
38
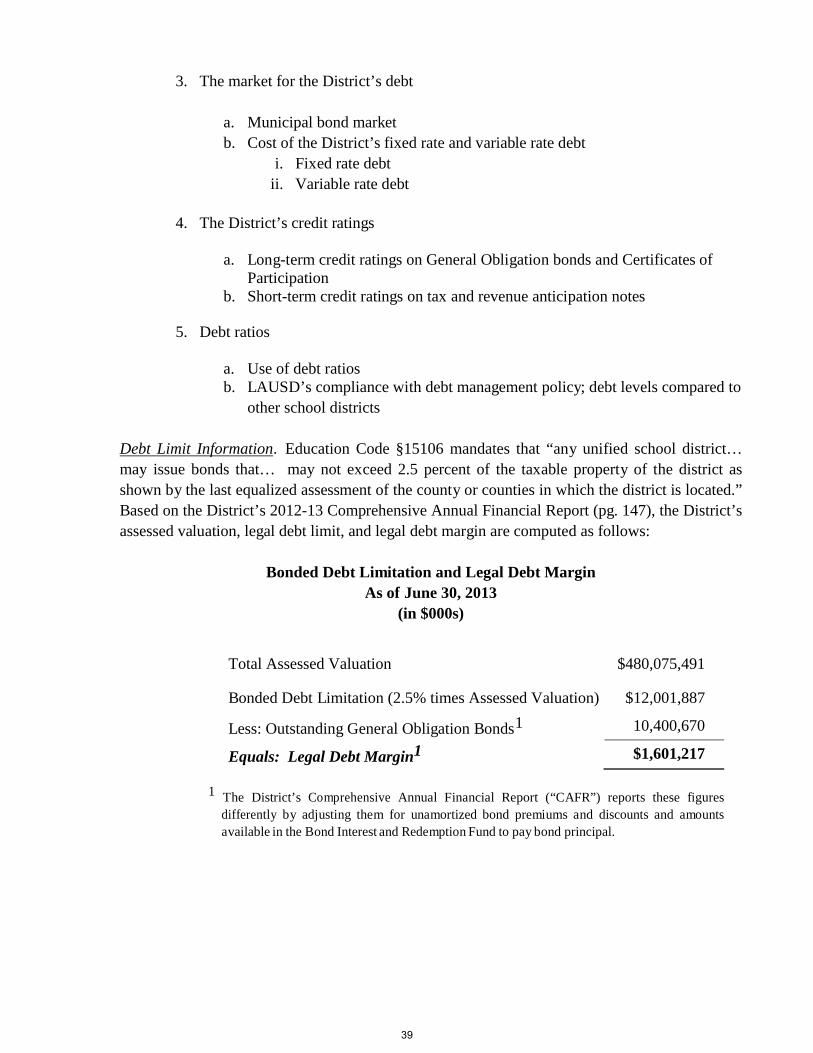
3. The market for the District’s debt
a. Municipal bond market b. Cost of the District’s fixed rate and variable rate debt
i. Fixed rate debt ii. Variable rate debt
4. The District’s credit ratings
a. Long-term credit ratings on General Obligation bonds and Certificates of
Participation b. Short-term credit ratings on tax and revenue anticipation notes
5. Debt ratios
a. Use of debt ratios b. LAUSD’s compliance with debt management policy; debt levels compared to
other school districts Debt Limit Information. Education Code §15106 mandates that “any unified school district… may issue bonds that… may not exceed 2.5 percent of the taxable property of the district as shown by the last equalized assessment of the county or counties in which the district is located.” Based on the District’s 2012-13 Comprehensive Annual Financial Report (pg. 147), the District’s assessed valuation, legal debt limit, and legal debt margin are computed as follows:
Bonded Debt Limitation and Legal Debt Margin
As of June 30, 2013 (in $000s)
Total Assessed Valuation $480,075,491
Bonded Debt Limitation (2.5% times Assessed Valuation) $12,001,887
Less: Outstanding General Obligation Bonds1 10,400,670
Equals: Legal Debt Margin1 $1,601,217
1 The District’s Comprehensive Annual Financial Report (“CAFR”) reports these figures differently by adjusting them for unamortized bond premiums and discounts and amounts available in the Bond Interest and Redemption Fund to pay bond principal.
39
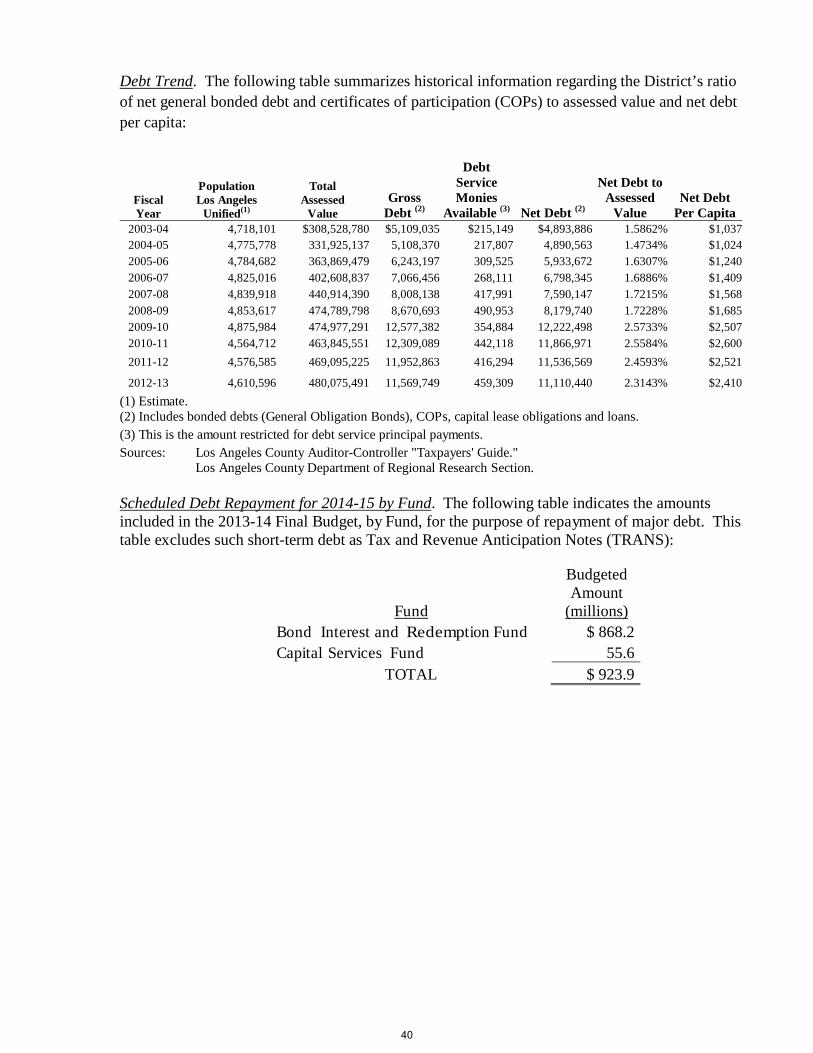
Debt Trend. The following table summarizes historical information regarding the District’s ratio of net general bonded debt and certificates of participation (COPs) to assessed value and net debt per capita:
Fiscal Year
Population Los Angeles
Unified(1)
Total
Assessed Value
Gross Debt (2)
Debt Service Monies
Available (3) Net Debt (2)
Net Debt to Assessed
Value Net Debt
Per Capita2003-04 4,718,101 $308,528,780 $5,109,035 $215,149 $4,893,886 1.5862% $1,0372004-05 4,775,778 331,925,137 5,108,370 217,807 4,890,563 1.4734% $1,0242005-06 4,784,682 363,869,479 6,243,197 309,525 5,933,672 1.6307% $1,2402006-07 4,825,016 402,608,837 7,066,456 268,111 6,798,345 1.6886% $1,4092007-08 4,839,918 440,914,390 8,008,138 417,991 7,590,147 1.7215% $1,5682008-09 4,853,617 474,789,798 8,670,693 490,953 8,179,740 1.7228% $1,6852009-10 4,875,984 474,977,291 12,577,382 354,884 12,222,498 2.5733% $2,5072010-11 4,564,712 463,845,551 12,309,089 442,118 11,866,971 2.5584% $2,6002011-12 4,576,585 469,095,225 11,952,863 416,294 11,536,569 2.4593% $2,521
2012-13 4,610,596 480,075,491 11,569,749 459,309 11,110,440 2.3143% $2,410(1) Estimate. (2) Includes bonded debts (General Obligation Bonds), COPs, capital lease obligations and loans. (3) This is the amount restricted for debt service principal payments. Sources: Los Angeles County Auditor-Controller "Taxpayers' Guide." Los Angeles County Department of Regional Research Section. Scheduled Debt Repayment for 2014-15 by Fund. The following table indicates the amounts included in the 2013-14 Final Budget, by Fund, for the purpose of repayment of major debt. This table excludes such short-term debt as Tax and Revenue Anticipation Notes (TRANS):
Fund
Budgeted Amount
(millions) Bond Interest and Redemption Fund $ 868.2 Capital Services Fund 55.6
TOTAL $ 923.9
40
DESCRIPTIONS OF “FUNDS” UTILIZED BY THE DISTRICT
California State law requires school districts to organize their financial reporting by “Funds.” The California School Accounting Manual, which governs school district budgeting and accounting practices in California, defines “Fund” as “an accounting entity with a self-balancing set of accounts recording financial resources and liabilities. It is established to carry on specific activities or to attain certain objectives of an LEA (a Local Educational Agency) in accordance with special regulations, restrictions, or limitations.” (Section 101, December 1998).
LEAs such as the Los Angeles Unified School District are required to budget by Fund. The Superintendent’s Final Budget is comprised of a General Fund and 21 special funds. The uses of these funds can be summarized as follows:1
Operating Funds.
General Fund is used to account for the basic instructional, support, and administrative operations of the District. The General Fund includes services to regular K-12 schools, the special education program, and other programs. The General Fund can support and account for both restricted and unrestricted funding sources and expenditures. Many of the restricted sources are summarized in the Restricted General fund section of this document.
Adult Education Fund is used to account separately for federal, State, and local revenues for adult education programs, as well as for expenditures in support of that program. Expenditures in the Adult Education Fund are limited to those for adult education purposes. Moneys received for programs other than adult education may not be expended for adult education purposes (Education Code §52616[b]).
Child Development Fund is used to account for federal, State, and local revenues to operate child development programs. In the Los Angeles Unified School District, the Child Development Fund covers the activities of the Early Childhood Education Centers that operate throughout the District. The Child Development Fund may be used only for expenditures for the operation of child development programs, but may be subsidized by the General Fund.
Cafeteria Fund is used to account for federal, State, and local resources to operate the District’s food service program (Education Code §38091 and §38100).
Deferred Maintenance Fund is used to account for the remaining balance of State apportionments and the District’s contributions from fiscal year prior to 2009-10 for deferred maintenance purposes (Education Code §s 17582 through 17587). Expenditures in the Deferred Maintenance Fund are for major maintenance projects such as plumbing, heating, air conditioning, electrical, roofing, floors, and interior or exterior paint.
1 Definitions reflect the California School Accounting Manual descriptions where available, augmented by information from the District budget and from the District’s 2006-07 Comprehensive Annual Financial Report to reflect specific District usages of individual funds.
41

Capital Projects Funds.
Building Funds exist primarily to account for proceeds from the sale of bonds (Education Code §15146). Expenditures are most commonly made against Object 6000 – Capital Outlay accounts. As the result of the passage of multiple bond elections, the District operates five separate Building Funds:
Building Fund accounts for proceeds from the sale of bonds prior to 1997, as well as State allowances and other resources designed for facilities expansion.
Building Fund – Proposition BB accounts for the proceeds resulting from passage of Proposition BB, a local school bond measure approved by the voters in April 1997 for construction of new schools and repair and modernization of existing schools.
Building Fund – Measure K accounts for the proceeds resulting from passage of Measure K, a local school bond measure approved by the voters in November 2002, for new school construction and repair and modernization of existing schools.
Building Fund – Measure R accounts for the proceeds resulting from passage of Measure R, a local school bond measure approved by the voters in March 2004, for new school construction and repairs to existing schools.
Building Fund – Measure Y accounts for the proceeds resulting from passage of Measure Y, a local school bond measure approved by the voters in November 2005, for school construction and modernization, with the goal of returning all schools to a traditional calendar.
County School Facilities Funds account for revenues and expenditures resulting from building projects funded primarily or in part from State bond elections or from matching funds. The District used to operate four separate County School Facilities Funds. These four funds are consolidated into one single County School Facilities Funds starting 2013-14.
County School Facilities Fund – Proposition 1D provides funding from the Kindergarten- University Public Education Facilities Bond Act of 2006. Proposition 1D was approved by the voters in the November 2006 general election. Funds provide additional dollars for existing school facilities programs. Funds also provide new dollars for seismic mitigation of the most vulnerable school facilities, creation of career technical education facilities, reduction of severely overcrowded sites, and incentives for the construction of high-performance “green” schools.
County School Facilities Fund – Proposition 55 accounts for the matching funds received as a result of the passage of Measure R. Proposition 55 was passed by the voters in March 2004.
County School Facilities Fund – Proposition 47 accounts for apportionments received from the State School Facilities Fund. The passage of Proposition 47 in November 2002 authorized the sale of bonds for new school facility construction, modernization projects, and facility hardship grants.
42
County School Facilities Fund - 1A accounts for school construction and modernization funds received from proceeds resulting from the passage of Proposition 1A in 1998, as well as for local matching funds.
Capital Facilities Account Fund accounts for resources received from developer fees levied upon new residential, commercial, or industrial development projects within the District’s boundaries. The dollars are used to obtain funds for the construction or acquisition of school facilities to relieve overcrowding.
State School Building Lease-Purchase Fund accounts for State apportionments received in accordance with State Education Code §17700-17780, primarily for relief of overcrowding.
Special Reserve Funds for Capital Outlay Projects provides for the accumulation of General Fund moneys for capital outlay purposes (Education Code §42840). Transfers authorized by the governing board must be utilized for capital outlay purposes. The District operates four Special Reserve Funds:
Special Reserve Fund accounts for District resources designated for capital outlay purposes such as land purchases, ground improvements, facilities construction and improvements, new acquisitions, and related expenditures.
Special Reserve Fund – FEMA – Earthquake accounts for funds received from the Federal Emergency Management Agency (FEMA) for capital outlay projects resulting from the January 17, 1994 Northridge Earthquake.
Special Reserve Fund – FEMA – Hazard Mitigation accounts for funds received from FEMA and for the 25% District matching funds for the retrofit/replacement of pendant lighting and suspended ceilings in selected buildings at schools, offices, and Early Childhood Education Centers.
Special Reserve Fund – Community Redevelopment Agency accounts for reimbursements of tax increment revenues from certain community redevelopment agencies based on agreements between the District and the agencies. The reimbursements are to be used for capital projects within the respective redevelopment areas covered in the agreements.
Debt Service Funds.
Bond Interest and Redemption Fund accounts for the payment of the principal and interest on Proposition BB, Measure K and Measure R bond issues. Revenues are derived from ad valorem taxes levied upon all property subject to tax by the District.
Tax Override Fund accounts for the accumulation of resources from ad valorem tax levies for the repayment of State School Building Aid Fund apportionment.
Capital Services Fund accounts for the accumulation of resources for the repayment of principal and interest on certificates of participation (COPs) and long-term capital lease agreements. Revenues are derived primarily from operating transfers from user funds and investment income.
43
Internal Service Funds.
Health and Welfare Benefits Fund pays for claims, administrative costs, insurance premiums, and related expenditures for the District’s Health and Welfare Benefits program. Medical and dental claims for the self-insured portion of the Fund are administered by outside claims administrators. Premium payments to Health Maintenance Organizations for medical benefits and to outside carriers for vision services, dental services, and optional life insurance are also paid out of this Fund.
Workers’ Compensation Self-Insurance Fund pays for claims, excess insurance coverage, administrative costs, and related expenditures. An outside claims administrator manages Workers’ Compensation claims for the District.
Liability Self-Insurance Fund pays for claims, excess insurance coverage, administrative costs, and related expenditures, and to provide funds for insurance deductible amounts. An outside claims administrator manages liability claims for the District.
Fiduciary Funds.
Attendance Incentive Reserve Fund accounts for 50% of the salary savings from substitute teacher accounts resulting from reduced costs of absenteeism of UTLA-represented employees. The Fund rewards regular attendance of teachers in order to improve the instructional program.
Other Post Employment Benefit (OPEB) Fund accounts for resources to be distributed to a trust for employees’ Other-Post-Employment Benefits.
Student Body Funds account for cash held by the District on behalf of student bodies at various school sites. The California School Accounting Manual does not require that Student Body Fund moneys be reported to the California Department of Education as part of the District budget. However, in accordance with The California School Accounting Manual, Student Body Fund information is included in the District’s Comprehensive Annual Financial Report.
44
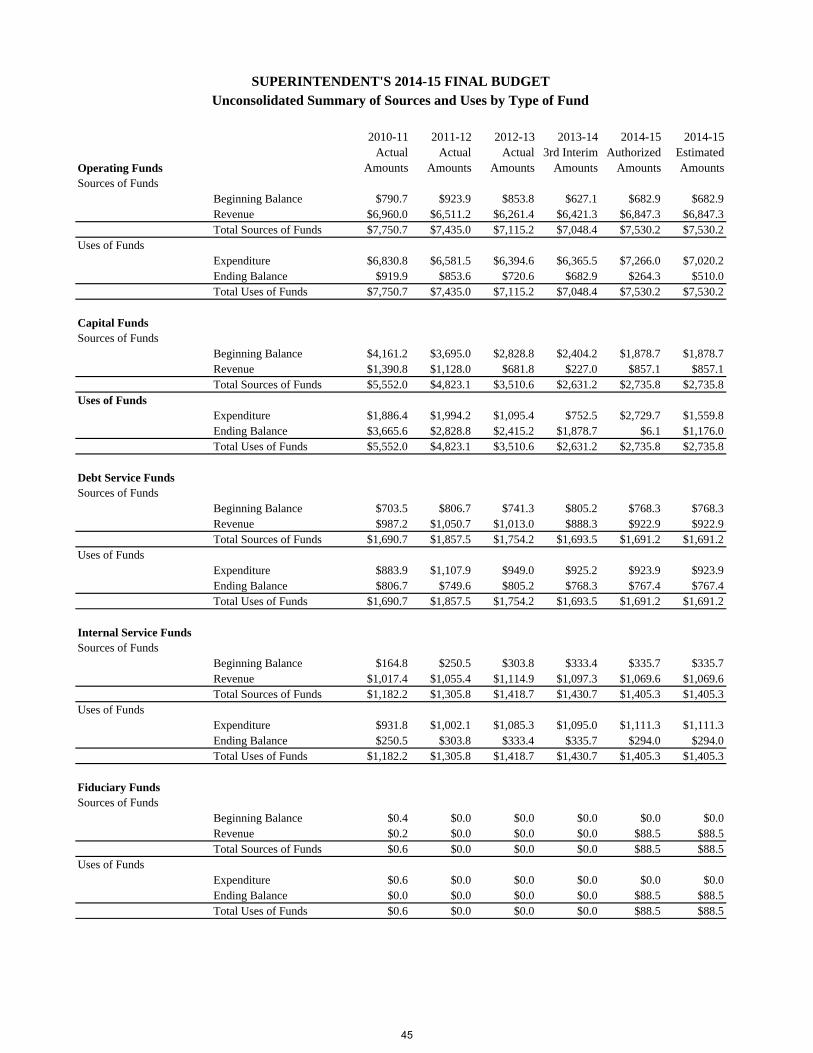
2010-11 2011-12 2012-13 2013-14 2014-15 2014-15Actual Actual Actual 3rd Interim Authorized Estimated
Operating Funds Amounts Amounts Amounts Amounts Amounts AmountsSources of Funds
Beginning Balance $790.7 $923.9 $853.8 $627.1 $682.9 $682.9Revenue $6,960.0 $6,511.2 $6,261.4 $6,421.3 $6,847.3 $6,847.3Total Sources of Funds $7,750.7 $7,435.0 $7,115.2 $7,048.4 $7,530.2 $7,530.2
Uses of FundsExpenditure $6,830.8 $6,581.5 $6,394.6 $6,365.5 $7,266.0 $7,020.2Ending Balance $919.9 $853.6 $720.6 $682.9 $264.3 $510.0Total Uses of Funds $7,750.7 $7,435.0 $7,115.2 $7,048.4 $7,530.2 $7,530.2
Capital FundsSources of Funds
Beginning Balance $4,161.2 $3,695.0 $2,828.8 $2,404.2 $1,878.7 $1,878.7Revenue $1,390.8 $1,128.0 $681.8 $227.0 $857.1 $857.1Total Sources of Funds $5,552.0 $4,823.1 $3,510.6 $2,631.2 $2,735.8 $2,735.8
Uses of FundsExpenditure $1,886.4 $1,994.2 $1,095.4 $752.5 $2,729.7 $1,559.8Ending Balance $3,665.6 $2,828.8 $2,415.2 $1,878.7 $6.1 $1,176.0Total Uses of Funds $5,552.0 $4,823.1 $3,510.6 $2,631.2 $2,735.8 $2,735.8
Debt Service FundsSources of Funds
Beginning Balance $703.5 $806.7 $741.3 $805.2 $768.3 $768.3Revenue $987.2 $1,050.7 $1,013.0 $888.3 $922.9 $922.9Total Sources of Funds $1,690.7 $1,857.5 $1,754.2 $1,693.5 $1,691.2 $1,691.2
Uses of FundsExpenditure $883.9 $1,107.9 $949.0 $925.2 $923.9 $923.9Ending Balance $806.7 $749.6 $805.2 $768.3 $767.4 $767.4Total Uses of Funds $1,690.7 $1,857.5 $1,754.2 $1,693.5 $1,691.2 $1,691.2
Internal Service FundsSources of Funds
Beginning Balance $164.8 $250.5 $303.8 $333.4 $335.7 $335.7Revenue $1,017.4 $1,055.4 $1,114.9 $1,097.3 $1,069.6 $1,069.6Total Sources of Funds $1,182.2 $1,305.8 $1,418.7 $1,430.7 $1,405.3 $1,405.3
Uses of FundsExpenditure $931.8 $1,002.1 $1,085.3 $1,095.0 $1,111.3 $1,111.3Ending Balance $250.5 $303.8 $333.4 $335.7 $294.0 $294.0Total Uses of Funds $1,182.2 $1,305.8 $1,418.7 $1,430.7 $1,405.3 $1,405.3
Fiduciary FundsSources of Funds
Beginning Balance $0.4 $0.0 $0.0 $0.0 $0.0 $0.0Revenue $0.2 $0.0 $0.0 $0.0 $88.5 $88.5Total Sources of Funds $0.6 $0.0 $0.0 $0.0 $88.5 $88.5
Uses of FundsExpenditure $0.6 $0.0 $0.0 $0.0 $0.0 $0.0Ending Balance $0.0 $0.0 $0.0 $0.0 $88.5 $88.5Total Uses of Funds $0.6 $0.0 $0.0 $0.0 $88.5 $88.5
SUPERINTENDENT'S 2014-15 FINAL BUDGETUnconsolidated Summary of Sources and Uses by Type of Fund
45
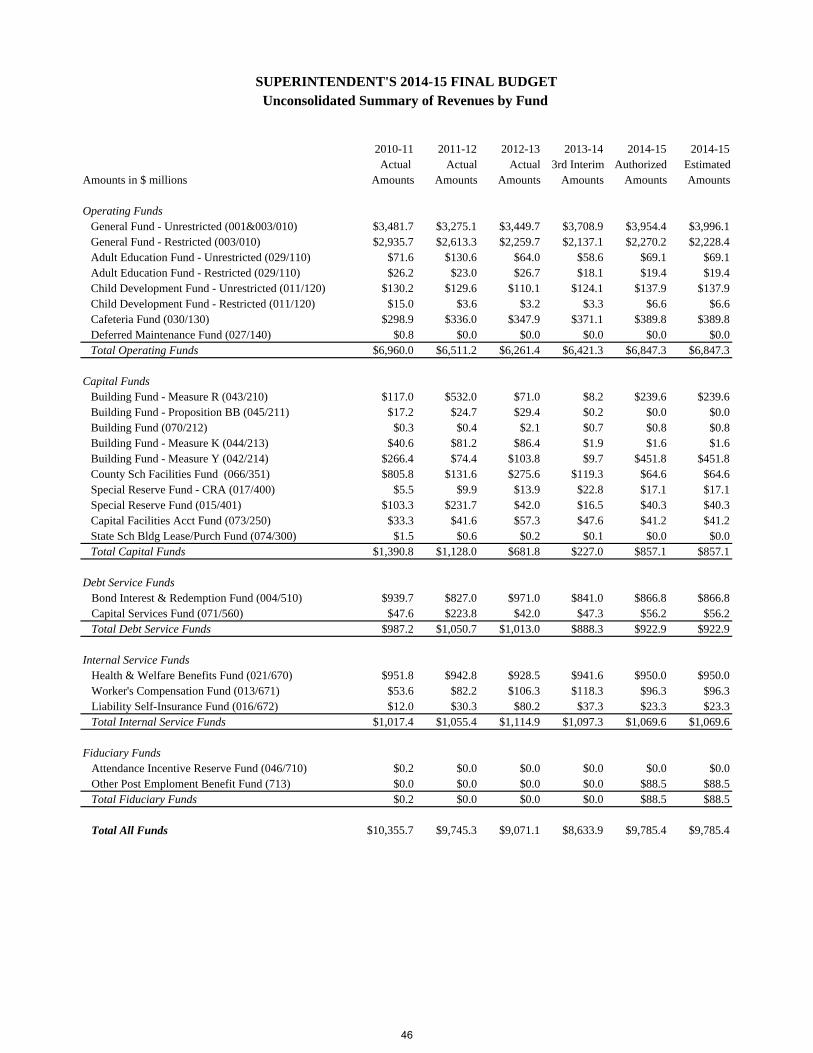
2010-11 2011-12 2012-13 2013-14 2014-15 2014-15Actual Actual Actual 3rd Interim Authorized Estimated
Amounts in $ millions Amounts Amounts Amounts Amounts Amounts Amounts Operating Funds
General Fund - Unrestricted (001&003/010) $3,481.7 $3,275.1 $3,449.7 $3,708.9 $3,954.4 $3,996.1General Fund - Restricted (003/010) $2,935.7 $2,613.3 $2,259.7 $2,137.1 $2,270.2 $2,228.4Adult Education Fund - Unrestricted (029/110) $71.6 $130.6 $64.0 $58.6 $69.1 $69.1Adult Education Fund - Restricted (029/110) $26.2 $23.0 $26.7 $18.1 $19.4 $19.4Child Development Fund - Unrestricted (011/120) $130.2 $129.6 $110.1 $124.1 $137.9 $137.9Child Development Fund - Restricted (011/120) $15.0 $3.6 $3.2 $3.3 $6.6 $6.6Cafeteria Fund (030/130) $298.9 $336.0 $347.9 $371.1 $389.8 $389.8Deferred Maintenance Fund (027/140) $0.8 $0.0 $0.0 $0.0 $0.0 $0.0Total Operating Funds $6,960.0 $6,511.2 $6,261.4 $6,421.3 $6,847.3 $6,847.3
Capital FundsBuilding Fund - Measure R (043/210) $117.0 $532.0 $71.0 $8.2 $239.6 $239.6Building Fund - Proposition BB (045/211) $17.2 $24.7 $29.4 $0.2 $0.0 $0.0Building Fund (070/212) $0.3 $0.4 $2.1 $0.7 $0.8 $0.8Building Fund - Measure K (044/213) $40.6 $81.2 $86.4 $1.9 $1.6 $1.6Building Fund - Measure Y (042/214) $266.4 $74.4 $103.8 $9.7 $451.8 $451.8County Sch Facilities Fund (066/351) $805.8 $131.6 $275.6 $119.3 $64.6 $64.6Special Reserve Fund - CRA (017/400) $5.5 $9.9 $13.9 $22.8 $17.1 $17.1Special Reserve Fund (015/401) $103.3 $231.7 $42.0 $16.5 $40.3 $40.3Capital Facilities Acct Fund (073/250) $33.3 $41.6 $57.3 $47.6 $41.2 $41.2State Sch Bldg Lease/Purch Fund (074/300) $1.5 $0.6 $0.2 $0.1 $0.0 $0.0Total Capital Funds $1,390.8 $1,128.0 $681.8 $227.0 $857.1 $857.1
Debt Service Funds Bond Interest & Redemption Fund (004/510) $939.7 $827.0 $971.0 $841.0 $866.8 $866.8 Capital Services Fund (071/560) $47.6 $223.8 $42.0 $47.3 $56.2 $56.2 Total Debt Service Funds $987.2 $1,050.7 $1,013.0 $888.3 $922.9 $922.9
Internal Service Funds Health & Welfare Benefits Fund (021/670) $951.8 $942.8 $928.5 $941.6 $950.0 $950.0 Worker's Compensation Fund (013/671) $53.6 $82.2 $106.3 $118.3 $96.3 $96.3 Liability Self-Insurance Fund (016/672) $12.0 $30.3 $80.2 $37.3 $23.3 $23.3 Total Internal Service Funds $1,017.4 $1,055.4 $1,114.9 $1,097.3 $1,069.6 $1,069.6
Fiduciary Funds Attendance Incentive Reserve Fund (046/710) $0.2 $0.0 $0.0 $0.0 $0.0 $0.0 Other Post Emploment Benefit Fund (713) $0.0 $0.0 $0.0 $0.0 $88.5 $88.5 Total Fiduciary Funds $0.2 $0.0 $0.0 $0.0 $88.5 $88.5
Total All Funds $10,355.7 $9,745.3 $9,071.1 $8,633.9 $9,785.4 $9,785.4
SUPERINTENDENT'S 2014-15 FINAL BUDGETUnconsolidated Summary of Revenues by Fund
46
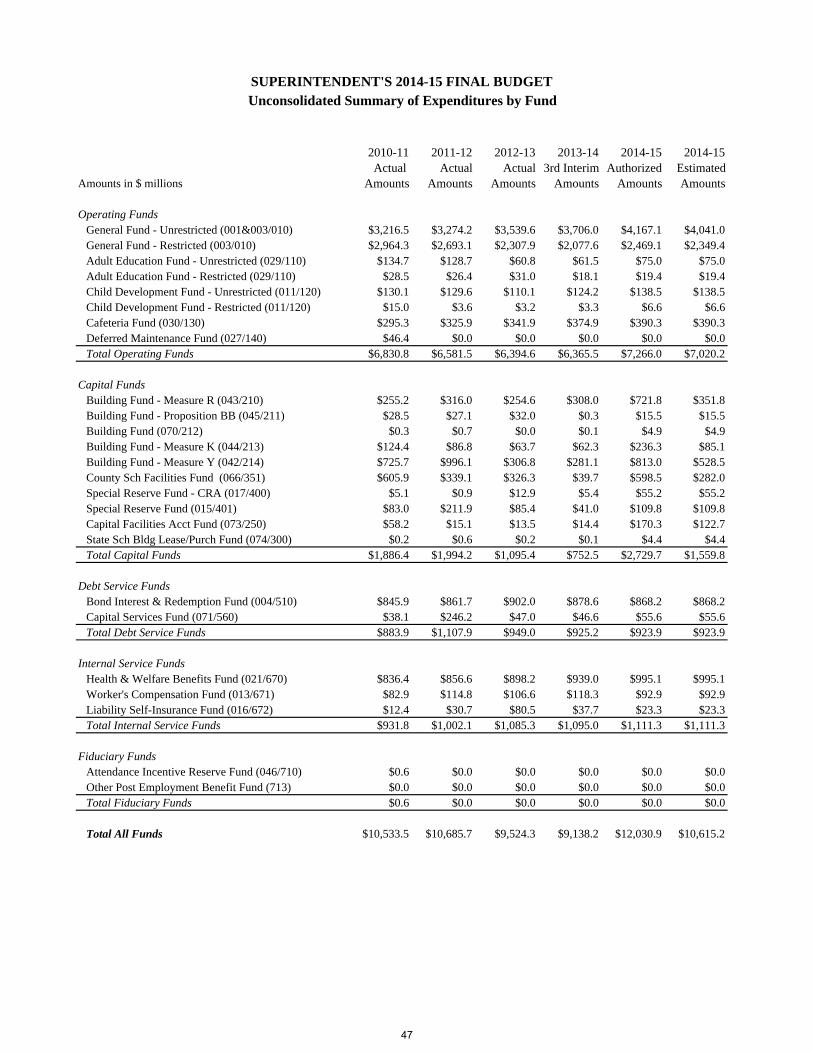
2010-11 2011-12 2012-13 2013-14 2014-15 2014-15Actual Actual Actual 3rd Interim Authorized Estimated
Amounts in $ millions Amounts Amounts Amounts Amounts Amounts Amounts Operating Funds
General Fund - Unrestricted (001&003/010) $3,216.5 $3,274.2 $3,539.6 $3,706.0 $4,167.1 $4,041.0General Fund - Restricted (003/010) $2,964.3 $2,693.1 $2,307.9 $2,077.6 $2,469.1 $2,349.4Adult Education Fund - Unrestricted (029/110) $134.7 $128.7 $60.8 $61.5 $75.0 $75.0Adult Education Fund - Restricted (029/110) $28.5 $26.4 $31.0 $18.1 $19.4 $19.4Child Development Fund - Unrestricted (011/120) $130.1 $129.6 $110.1 $124.2 $138.5 $138.5Child Development Fund - Restricted (011/120) $15.0 $3.6 $3.2 $3.3 $6.6 $6.6Cafeteria Fund (030/130) $295.3 $325.9 $341.9 $374.9 $390.3 $390.3Deferred Maintenance Fund (027/140) $46.4 $0.0 $0.0 $0.0 $0.0 $0.0Total Operating Funds $6,830.8 $6,581.5 $6,394.6 $6,365.5 $7,266.0 $7,020.2
Capital FundsBuilding Fund - Measure R (043/210) $255.2 $316.0 $254.6 $308.0 $721.8 $351.8Building Fund - Proposition BB (045/211) $28.5 $27.1 $32.0 $0.3 $15.5 $15.5Building Fund (070/212) $0.3 $0.7 $0.0 $0.1 $4.9 $4.9Building Fund - Measure K (044/213) $124.4 $86.8 $63.7 $62.3 $236.3 $85.1Building Fund - Measure Y (042/214) $725.7 $996.1 $306.8 $281.1 $813.0 $528.5County Sch Facilities Fund (066/351) $605.9 $339.1 $326.3 $39.7 $598.5 $282.0Special Reserve Fund - CRA (017/400) $5.1 $0.9 $12.9 $5.4 $55.2 $55.2Special Reserve Fund (015/401) $83.0 $211.9 $85.4 $41.0 $109.8 $109.8Capital Facilities Acct Fund (073/250) $58.2 $15.1 $13.5 $14.4 $170.3 $122.7State Sch Bldg Lease/Purch Fund (074/300) $0.2 $0.6 $0.2 $0.1 $4.4 $4.4Total Capital Funds $1,886.4 $1,994.2 $1,095.4 $752.5 $2,729.7 $1,559.8
Debt Service FundsBond Interest & Redemption Fund (004/510) $845.9 $861.7 $902.0 $878.6 $868.2 $868.2Capital Services Fund (071/560) $38.1 $246.2 $47.0 $46.6 $55.6 $55.6Total Debt Service Funds $883.9 $1,107.9 $949.0 $925.2 $923.9 $923.9
Internal Service FundsHealth & Welfare Benefits Fund (021/670) $836.4 $856.6 $898.2 $939.0 $995.1 $995.1Worker's Compensation Fund (013/671) $82.9 $114.8 $106.6 $118.3 $92.9 $92.9Liability Self-Insurance Fund (016/672) $12.4 $30.7 $80.5 $37.7 $23.3 $23.3Total Internal Service Funds $931.8 $1,002.1 $1,085.3 $1,095.0 $1,111.3 $1,111.3
Fiduciary FundsAttendance Incentive Reserve Fund (046/710) $0.6 $0.0 $0.0 $0.0 $0.0 $0.0Other Post Employment Benefit Fund (713) $0.0 $0.0 $0.0 $0.0 $0.0 $0.0Total Fiduciary Funds $0.6 $0.0 $0.0 $0.0 $0.0 $0.0
Total All Funds $10,533.5 $10,685.7 $9,524.3 $9,138.2 $12,030.9 $10,615.2
SUPERINTENDENT'S 2014-15 FINAL BUDGETUnconsolidated Summary of Expenditures by Fund
47
General Fund Unrestricted & Restricted Revenues
The 2014-15 General Fund is estimated at $6.2 billion.
The District’s Local Control Funding Formula (LCFF) revenue for 2014-15 is $4.7 billion for both traditional and affiliated charter school. LCFF revenue is reflected in the Unrestricted General Fund except for $66 million reflected in the Adult Education Fund.
LCFF revenue is calculated assuming a 0.85% COLA and a 28.06% Gap Funding. The revenue estimated used the May Revision LCFF funding of $4.5 billion state-wide.
48
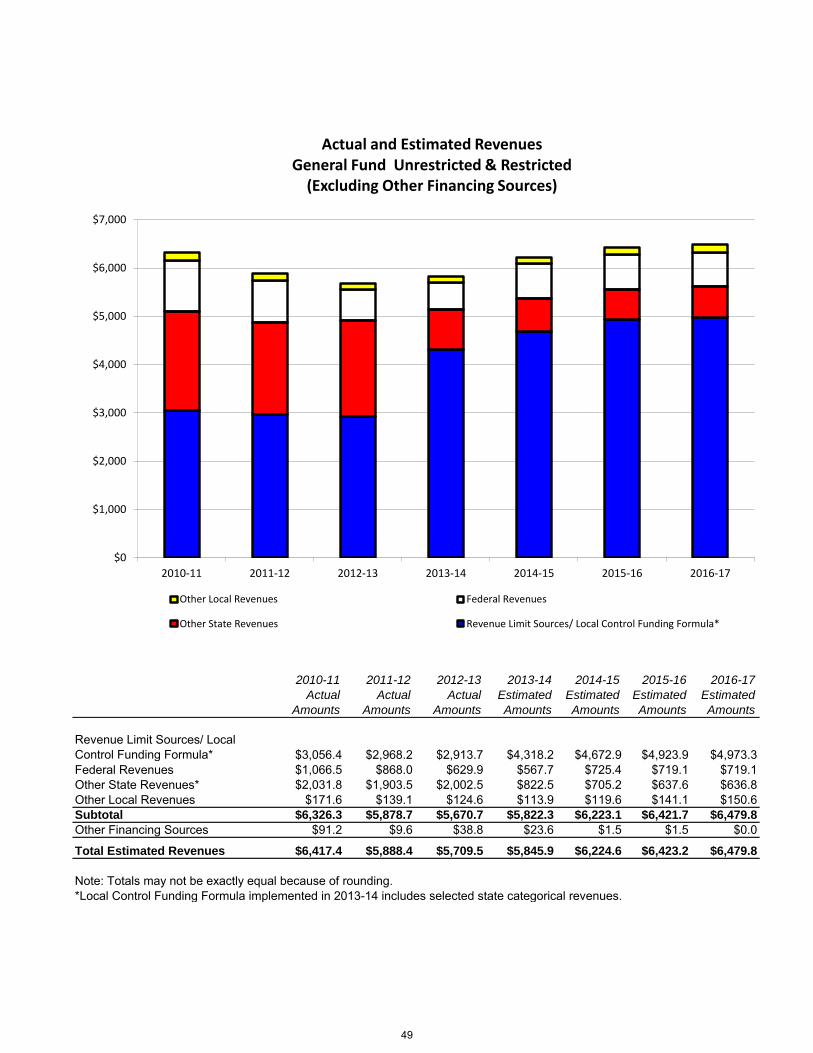
2010-11 2011-12 2012-13 2013-14 2014-15 2015-16 2016-17
Actual Actual Actual Estimated Estimated Estimated Estimated
Amounts Amounts Amounts Amounts Amounts Amounts Amounts
Revenue Limit Sources/ Local Control Funding Formula* $3,056.4 $2,968.2 $2,913.7 $4,318.2 $4,672.9 $4,923.9 $4,973.3Federal Revenues $1,066.5 $868.0 $629.9 $567.7 $725.4 $719.1 $719.1Other State Revenues* $2,031.8 $1,903.5 $2,002.5 $822.5 $705.2 $637.6 $636.8Other Local Revenues $171.6 $139.1 $124.6 $113.9 $119.6 $141.1 $150.6Subtotal $6,326.3 $5,878.7 $5,670.7 $5,822.3 $6,223.1 $6,421.7 $6,479.8Other Financing Sources $91.2 $9.6 $38.8 $23.6 $1.5 $1.5 $0.0
Total Estimated Revenues $6,417.4 $5,888.4 $5,709.5 $5,845.9 $6,224.6 $6,423.2 $6,479.8
Note: Totals may not be exactly equal because of rounding.*Local Control Funding Formula implemented in 2013-14 includes selected state categorical revenues.
$0
$1,000
$2,000
$3,000
$4,000
$5,000
$6,000
$7,000
2010-11 2011-12 2012-13 2013-14 2014-15 2015-16 2016-17
Actual and Estimated Revenues General Fund Unrestricted & Restricted
(Excluding Other Financing Sources)
Other Local Revenues Federal Revenues
Other State Revenues Revenue Limit Sources/ Local Control Funding Formula*
49
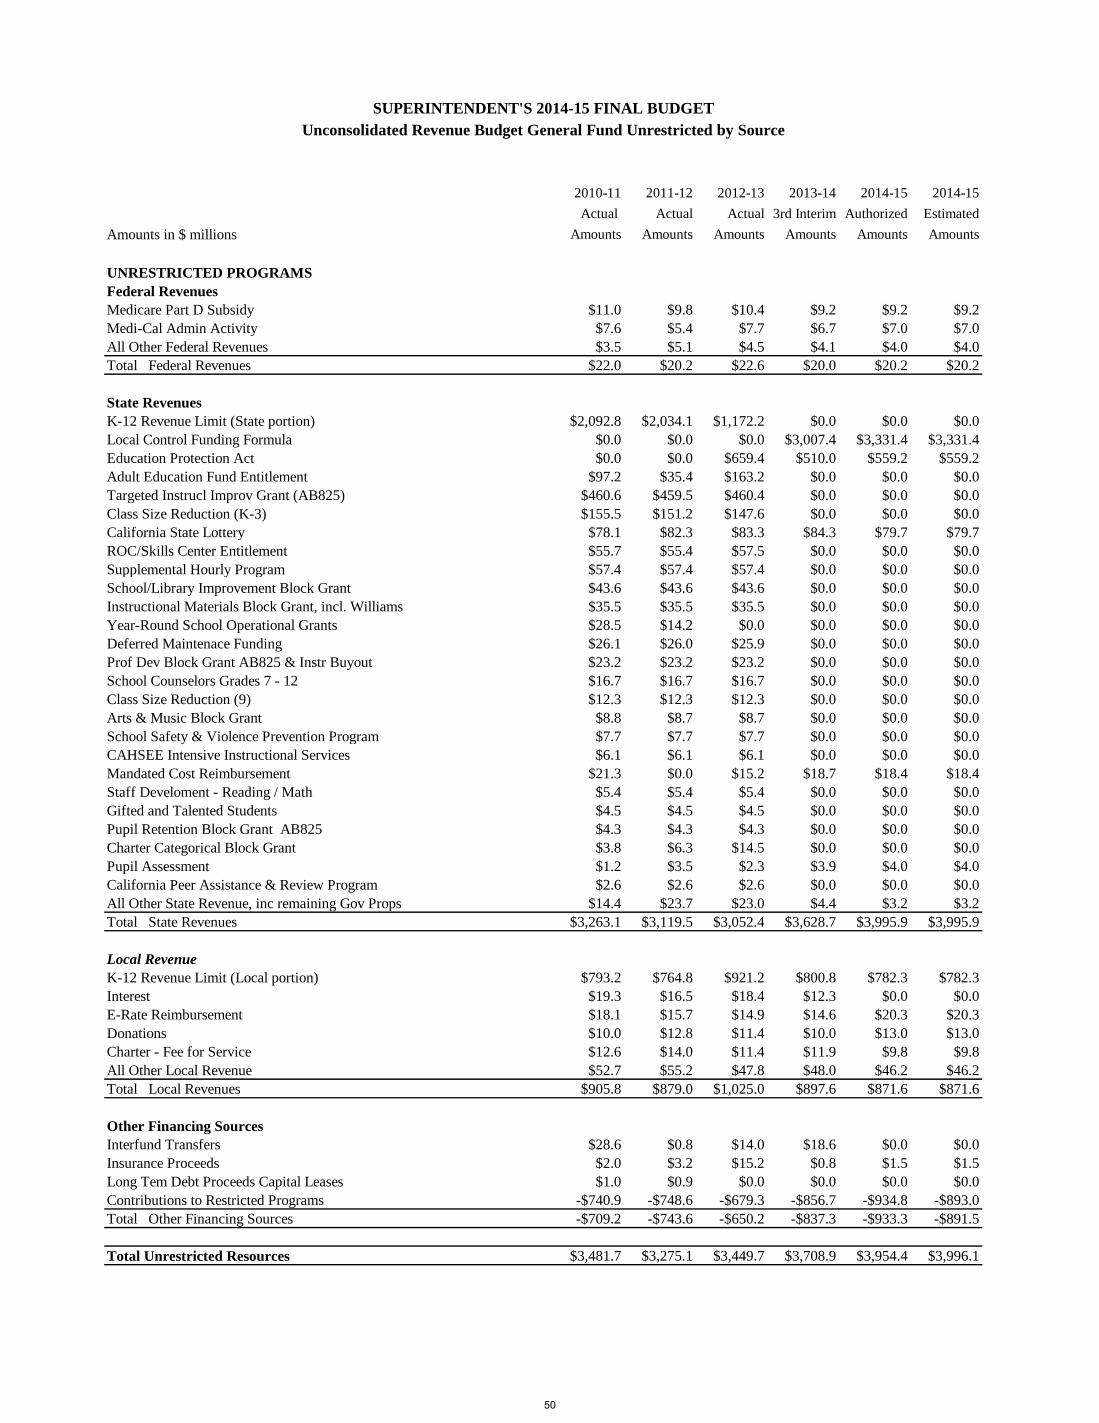
2010-11 2011-12 2012-13 2013-14 2014-15 2014-15
Actual Actual Actual 3rd Interim Authorized Estimated
Amounts in $ millions Amounts Amounts Amounts Amounts Amounts Amounts
UNRESTRICTED PROGRAMS
Federal Revenues
Medicare Part D Subsidy $11.0 $9.8 $10.4 $9.2 $9.2 $9.2
Medi-Cal Admin Activity $7.6 $5.4 $7.7 $6.7 $7.0 $7.0
All Other Federal Revenues $3.5 $5.1 $4.5 $4.1 $4.0 $4.0
Total Federal Revenues $22.0 $20.2 $22.6 $20.0 $20.2 $20.2
State Revenues
K-12 Revenue Limit (State portion) $2,092.8 $2,034.1 $1,172.2 $0.0 $0.0 $0.0
Local Control Funding Formula $0.0 $0.0 $0.0 $3,007.4 $3,331.4 $3,331.4
Education Protection Act $0.0 $0.0 $659.4 $510.0 $559.2 $559.2
Adult Education Fund Entitlement $97.2 $35.4 $163.2 $0.0 $0.0 $0.0
Targeted Instrucl Improv Grant (AB825) $460.6 $459.5 $460.4 $0.0 $0.0 $0.0
Class Size Reduction (K-3) $155.5 $151.2 $147.6 $0.0 $0.0 $0.0
California State Lottery $78.1 $82.3 $83.3 $84.3 $79.7 $79.7
ROC/Skills Center Entitlement $55.7 $55.4 $57.5 $0.0 $0.0 $0.0
Supplemental Hourly Program $57.4 $57.4 $57.4 $0.0 $0.0 $0.0
School/Library Improvement Block Grant $43.6 $43.6 $43.6 $0.0 $0.0 $0.0
Instructional Materials Block Grant, incl. Williams $35.5 $35.5 $35.5 $0.0 $0.0 $0.0
Year-Round School Operational Grants $28.5 $14.2 $0.0 $0.0 $0.0 $0.0
Deferred Maintenace Funding $26.1 $26.0 $25.9 $0.0 $0.0 $0.0
Prof Dev Block Grant AB825 & Instr Buyout $23.2 $23.2 $23.2 $0.0 $0.0 $0.0
School Counselors Grades 7 - 12 $16.7 $16.7 $16.7 $0.0 $0.0 $0.0
Class Size Reduction (9) $12.3 $12.3 $12.3 $0.0 $0.0 $0.0
Arts & Music Block Grant $8.8 $8.7 $8.7 $0.0 $0.0 $0.0
School Safety & Violence Prevention Program $7.7 $7.7 $7.7 $0.0 $0.0 $0.0
CAHSEE Intensive Instructional Services $6.1 $6.1 $6.1 $0.0 $0.0 $0.0
Mandated Cost Reimbursement $21.3 $0.0 $15.2 $18.7 $18.4 $18.4
Staff Develoment - Reading / Math $5.4 $5.4 $5.4 $0.0 $0.0 $0.0
Gifted and Talented Students $4.5 $4.5 $4.5 $0.0 $0.0 $0.0
Pupil Retention Block Grant AB825 $4.3 $4.3 $4.3 $0.0 $0.0 $0.0
Charter Categorical Block Grant $3.8 $6.3 $14.5 $0.0 $0.0 $0.0
Pupil Assessment $1.2 $3.5 $2.3 $3.9 $4.0 $4.0
California Peer Assistance & Review Program $2.6 $2.6 $2.6 $0.0 $0.0 $0.0
All Other State Revenue, inc remaining Gov Props $14.4 $23.7 $23.0 $4.4 $3.2 $3.2
Total State Revenues $3,263.1 $3,119.5 $3,052.4 $3,628.7 $3,995.9 $3,995.9
Local Revenue
K-12 Revenue Limit (Local portion) $793.2 $764.8 $921.2 $800.8 $782.3 $782.3
Interest $19.3 $16.5 $18.4 $12.3 $0.0 $0.0
E-Rate Reimbursement $18.1 $15.7 $14.9 $14.6 $20.3 $20.3
Donations $10.0 $12.8 $11.4 $10.0 $13.0 $13.0
Charter - Fee for Service $12.6 $14.0 $11.4 $11.9 $9.8 $9.8
All Other Local Revenue $52.7 $55.2 $47.8 $48.0 $46.2 $46.2
Total Local Revenues $905.8 $879.0 $1,025.0 $897.6 $871.6 $871.6
Other Financing Sources
Interfund Transfers $28.6 $0.8 $14.0 $18.6 $0.0 $0.0
Insurance Proceeds $2.0 $3.2 $15.2 $0.8 $1.5 $1.5
Long Tem Debt Proceeds Capital Leases $1.0 $0.9 $0.0 $0.0 $0.0 $0.0
Contributions to Restricted Programs -$740.9 -$748.6 -$679.3 -$856.7 -$934.8 -$893.0
Total Other Financing Sources -$709.2 -$743.6 -$650.2 -$837.3 -$933.3 -$891.5
Total Unrestricted Resources $3,481.7 $3,275.1 $3,449.7 $3,708.9 $3,954.4 $3,996.1
SUPERINTENDENT'S 2014-15 FINAL BUDGET
Unconsolidated Revenue Budget General Fund Unrestricted by Source
50
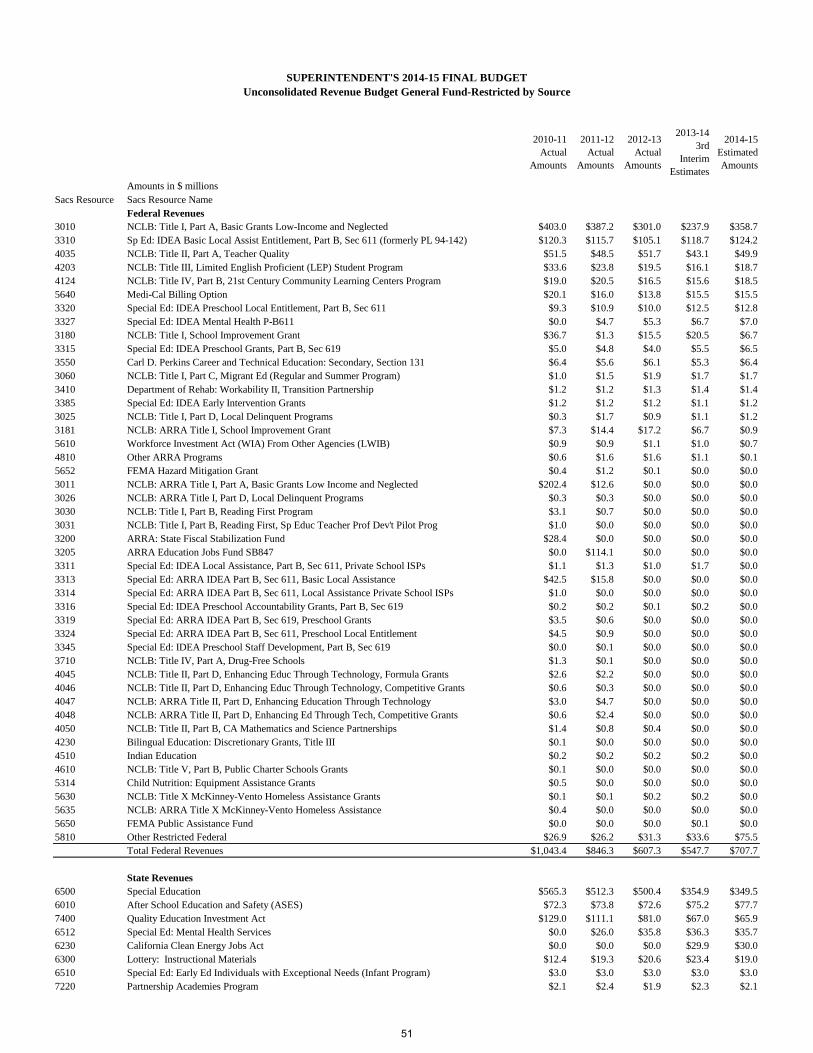
2010-11 Actual
Amounts
2011-12 Actual
Amounts
2012-13 Actual
Amounts
2013-14 3rd
Interim Estimates
2014-15 Estimated Amounts
Amounts in $ millionsSacs Resource Sacs Resource Name
Federal Revenues3010 NCLB: Title I, Part A, Basic Grants Low-Income and Neglected $403.0 $387.2 $301.0 $237.9 $358.73310 Sp Ed: IDEA Basic Local Assist Entitlement, Part B, Sec 611 (formerly PL 94-142) $120.3 $115.7 $105.1 $118.7 $124.24035 NCLB: Title II, Part A, Teacher Quality $51.5 $48.5 $51.7 $43.1 $49.94203 NCLB: Title III, Limited English Proficient (LEP) Student Program $33.6 $23.8 $19.5 $16.1 $18.74124 NCLB: Title IV, Part B, 21st Century Community Learning Centers Program $19.0 $20.5 $16.5 $15.6 $18.55640 Medi-Cal Billing Option $20.1 $16.0 $13.8 $15.5 $15.53320 Special Ed: IDEA Preschool Local Entitlement, Part B, Sec 611 $9.3 $10.9 $10.0 $12.5 $12.83327 Special Ed: IDEA Mental Health P-B611 $0.0 $4.7 $5.3 $6.7 $7.03180 NCLB: Title I, School Improvement Grant $36.7 $1.3 $15.5 $20.5 $6.73315 Special Ed: IDEA Preschool Grants, Part B, Sec 619 $5.0 $4.8 $4.0 $5.5 $6.53550 Carl D. Perkins Career and Technical Education: Secondary, Section 131 $6.4 $5.6 $6.1 $5.3 $6.43060 NCLB: Title I, Part C, Migrant Ed (Regular and Summer Program) $1.0 $1.5 $1.9 $1.7 $1.73410 Department of Rehab: Workability II, Transition Partnership $1.2 $1.2 $1.3 $1.4 $1.43385 Special Ed: IDEA Early Intervention Grants $1.2 $1.2 $1.2 $1.1 $1.23025 NCLB: Title I, Part D, Local Delinquent Programs $0.3 $1.7 $0.9 $1.1 $1.23181 NCLB: ARRA Title I, School Improvement Grant $7.3 $14.4 $17.2 $6.7 $0.95610 Workforce Investment Act (WIA) From Other Agencies (LWIB) $0.9 $0.9 $1.1 $1.0 $0.74810 Other ARRA Programs $0.6 $1.6 $1.6 $1.1 $0.15652 FEMA Hazard Mitigation Grant $0.4 $1.2 $0.1 $0.0 $0.03011 NCLB: ARRA Title I, Part A, Basic Grants Low Income and Neglected $202.4 $12.6 $0.0 $0.0 $0.03026 NCLB: ARRA Title I, Part D, Local Delinquent Programs $0.3 $0.3 $0.0 $0.0 $0.03030 NCLB: Title I, Part B, Reading First Program $3.1 $0.7 $0.0 $0.0 $0.03031 NCLB: Title I, Part B, Reading First, Sp Educ Teacher Prof Dev't Pilot Prog $1.0 $0.0 $0.0 $0.0 $0.03200 ARRA: State Fiscal Stabilization Fund $28.4 $0.0 $0.0 $0.0 $0.03205 ARRA Education Jobs Fund SB847 $0.0 $114.1 $0.0 $0.0 $0.03311 Special Ed: IDEA Local Assistance, Part B, Sec 611, Private School ISPs $1.1 $1.3 $1.0 $1.7 $0.03313 Special Ed: ARRA IDEA Part B, Sec 611, Basic Local Assistance $42.5 $15.8 $0.0 $0.0 $0.03314 Special Ed: ARRA IDEA Part B, Sec 611, Local Assistance Private School ISPs $1.0 $0.0 $0.0 $0.0 $0.03316 Special Ed: IDEA Preschool Accountability Grants, Part B, Sec 619 $0.2 $0.2 $0.1 $0.2 $0.03319 Special Ed: ARRA IDEA Part B, Sec 619, Preschool Grants $3.5 $0.6 $0.0 $0.0 $0.03324 Special Ed: ARRA IDEA Part B, Sec 611, Preschool Local Entitlement $4.5 $0.9 $0.0 $0.0 $0.03345 Special Ed: IDEA Preschool Staff Development, Part B, Sec 619 $0.0 $0.1 $0.0 $0.0 $0.03710 NCLB: Title IV, Part A, Drug-Free Schools $1.3 $0.1 $0.0 $0.0 $0.04045 NCLB: Title II, Part D, Enhancing Educ Through Technology, Formula Grants $2.6 $2.2 $0.0 $0.0 $0.04046 NCLB: Title II, Part D, Enhancing Educ Through Technology, Competitive Grants $0.6 $0.3 $0.0 $0.0 $0.04047 NCLB: ARRA Title II, Part D, Enhancing Education Through Technology $3.0 $4.7 $0.0 $0.0 $0.04048 NCLB: ARRA Title II, Part D, Enhancing Ed Through Tech, Competitive Grants $0.6 $2.4 $0.0 $0.0 $0.04050 NCLB: Title II, Part B, CA Mathematics and Science Partnerships $1.4 $0.8 $0.4 $0.0 $0.04230 Bilingual Education: Discretionary Grants, Title III $0.1 $0.0 $0.0 $0.0 $0.04510 Indian Education $0.2 $0.2 $0.2 $0.2 $0.04610 NCLB: Title V, Part B, Public Charter Schools Grants $0.1 $0.0 $0.0 $0.0 $0.05314 Child Nutrition: Equipment Assistance Grants $0.5 $0.0 $0.0 $0.0 $0.05630 NCLB: Title X McKinney-Vento Homeless Assistance Grants $0.1 $0.1 $0.2 $0.2 $0.05635 NCLB: ARRA Title X McKinney-Vento Homeless Assistance $0.4 $0.0 $0.0 $0.0 $0.05650 FEMA Public Assistance Fund $0.0 $0.0 $0.0 $0.1 $0.05810 Other Restricted Federal $26.9 $26.2 $31.3 $33.6 $75.5
Total Federal Revenues $1,043.4 $846.3 $607.3 $547.7 $707.7
State Revenues6500 Special Education $565.3 $512.3 $500.4 $354.9 $349.56010 After School Education and Safety (ASES) $72.3 $73.8 $72.6 $75.2 $77.77400 Quality Education Investment Act $129.0 $111.1 $81.0 $67.0 $65.96512 Special Ed: Mental Health Services $0.0 $26.0 $35.8 $36.3 $35.76230 California Clean Energy Jobs Act $0.0 $0.0 $0.0 $29.9 $30.06300 Lottery: Instructional Materials $12.4 $19.3 $20.6 $23.4 $19.06510 Special Ed: Early Ed Individuals with Exceptional Needs (Infant Program) $3.0 $3.0 $3.0 $3.0 $3.07220 Partnership Academies Program $2.1 $2.4 $1.9 $2.3 $2.1
SUPERINTENDENT'S 2014-15 FINAL BUDGETUnconsolidated Revenue Budget General Fund-Restricted by Source
51
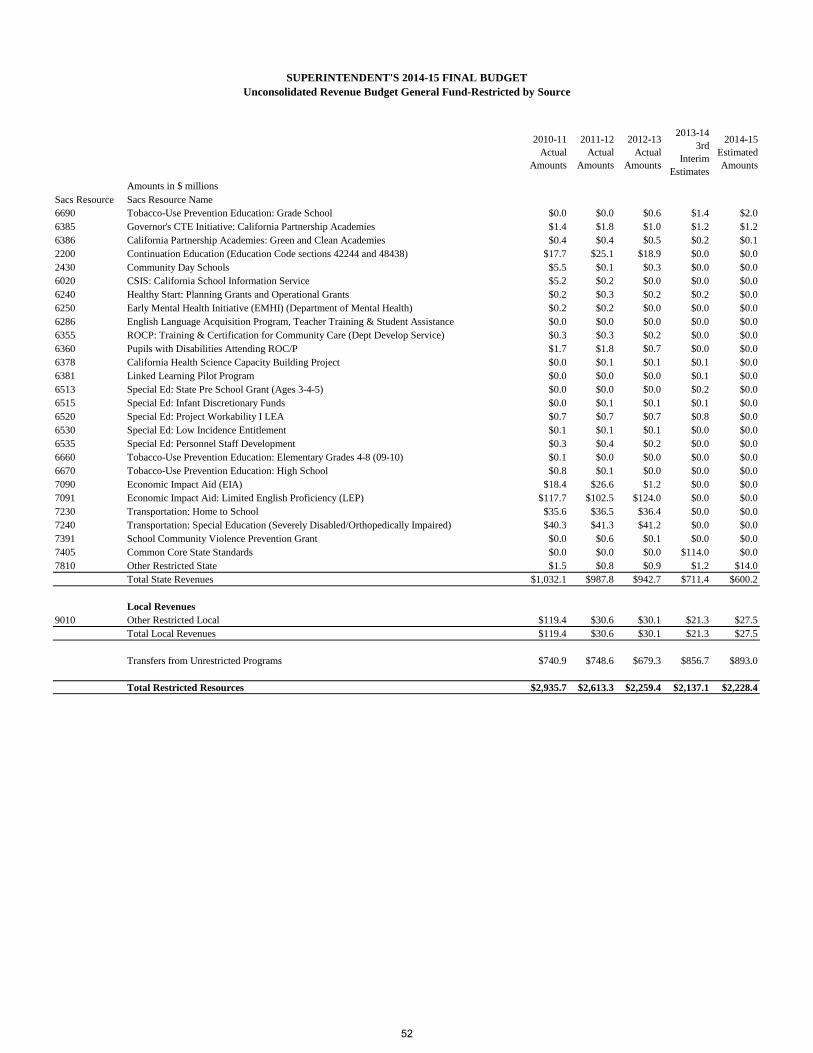
2010-11 Actual
Amounts
2011-12 Actual
Amounts
2012-13 Actual
Amounts
2013-14 3rd
Interim Estimates
2014-15 Estimated Amounts
Amounts in $ millionsSacs Resource Sacs Resource Name
SUPERINTENDENT'S 2014-15 FINAL BUDGETUnconsolidated Revenue Budget General Fund-Restricted by Source
6690 Tobacco-Use Prevention Education: Grade School $0.0 $0.0 $0.6 $1.4 $2.06385 Governor's CTE Initiative: California Partnership Academies $1.4 $1.8 $1.0 $1.2 $1.26386 California Partnership Academies: Green and Clean Academies $0.4 $0.4 $0.5 $0.2 $0.12200 Continuation Education (Education Code sections 42244 and 48438) $17.7 $25.1 $18.9 $0.0 $0.02430 Community Day Schools $5.5 $0.1 $0.3 $0.0 $0.06020 CSIS: California School Information Service $5.2 $0.2 $0.0 $0.0 $0.06240 Healthy Start: Planning Grants and Operational Grants $0.2 $0.3 $0.2 $0.2 $0.06250 Early Mental Health Initiative (EMHI) (Department of Mental Health) $0.2 $0.2 $0.0 $0.0 $0.06286 English Language Acquisition Program, Teacher Training & Student Assistance $0.0 $0.0 $0.0 $0.0 $0.06355 ROCP: Training & Certification for Community Care (Dept Develop Service) $0.3 $0.3 $0.2 $0.0 $0.06360 Pupils with Disabilities Attending ROC/P $1.7 $1.8 $0.7 $0.0 $0.06378 California Health Science Capacity Building Project $0.0 $0.1 $0.1 $0.1 $0.06381 Linked Learning Pilot Program $0.0 $0.0 $0.0 $0.1 $0.06513 Special Ed: State Pre School Grant (Ages 3-4-5) $0.0 $0.0 $0.0 $0.2 $0.06515 Special Ed: Infant Discretionary Funds $0.0 $0.1 $0.1 $0.1 $0.06520 Special Ed: Project Workability I LEA $0.7 $0.7 $0.7 $0.8 $0.06530 Special Ed: Low Incidence Entitlement $0.1 $0.1 $0.1 $0.0 $0.06535 Special Ed: Personnel Staff Development $0.3 $0.4 $0.2 $0.0 $0.06660 Tobacco-Use Prevention Education: Elementary Grades 4-8 (09-10) $0.1 $0.0 $0.0 $0.0 $0.06670 Tobacco-Use Prevention Education: High School $0.8 $0.1 $0.0 $0.0 $0.07090 Economic Impact Aid (EIA) $18.4 $26.6 $1.2 $0.0 $0.07091 Economic Impact Aid: Limited English Proficiency (LEP) $117.7 $102.5 $124.0 $0.0 $0.07230 Transportation: Home to School $35.6 $36.5 $36.4 $0.0 $0.07240 Transportation: Special Education (Severely Disabled/Orthopedically Impaired) $40.3 $41.3 $41.2 $0.0 $0.07391 School Community Violence Prevention Grant $0.0 $0.6 $0.1 $0.0 $0.07405 Common Core State Standards $0.0 $0.0 $0.0 $114.0 $0.07810 Other Restricted State $1.5 $0.8 $0.9 $1.2 $14.0
Total State Revenues $1,032.1 $987.8 $942.7 $711.4 $600.2
Local Revenues9010 Other Restricted Local $119.4 $30.6 $30.1 $21.3 $27.5
Total Local Revenues $119.4 $30.6 $30.1 $21.3 $27.5
Transfers from Unrestricted Programs $740.9 $748.6 $679.3 $856.7 $893.0
Total Restricted Resources $2,935.7 $2,613.3 $2,259.4 $2,137.1 $2,228.4
52
General Fund Unrestricted and Restricted Estimated Expenditures by Object
The accompanying graph shows General Fund estimated expenditures by “object of expenditure.” Objects of expenditure define what we buy with our resources.
“Certificated Salaries” include the salaries of teachers, librarians, counselors, nurses, school, and District administrators.
“Classified Salaries” include the salaries of instructional aides, office employees,
custodians, carpenters, plumbers, bus drivers, and those non-certificated employees who manage and supervise their work.
“Employee Benefits” include the cost of retirement plans, employee health insurance, and
Workers’ Compensation Insurance.
“Books and Supplies” includes the cost of textbooks, instructional materials, general supplies and fuel.
“Other Operating Expense” includes the cost of contracts, utilities, rents and leases, travel
expense, and instructional consultants.
“Capital Outlay” includes the cost of facilities (land and buildings), books and media for libraries, and equipment. Most of the District’s capital outlay costs are in bond funds devoted specifically to school construction and modernization.
“Other Outgo” includes miscellaneous items that are not usually considered part of the
current expense of education.
53

6,390.4$
Note: Individual amounts may not add to total due to rounding.
(Amounts in millions and percent of total)
TOTAL =
General Fund Estimated Expenditure Budgetby Major Object
Other Operating Expenses, $724.6 ,
12%
Certificated Salaries, $2,694.6 , 42%
Classified Salaries, $828.6 , 13%
Other Outgo, $130.9 , 2%
Employee Benefits, $1,472.7 , 23%
Instructional Books and Supplies, $526.6 , 8%
Capital Outlay, $12.5 , 0%
54
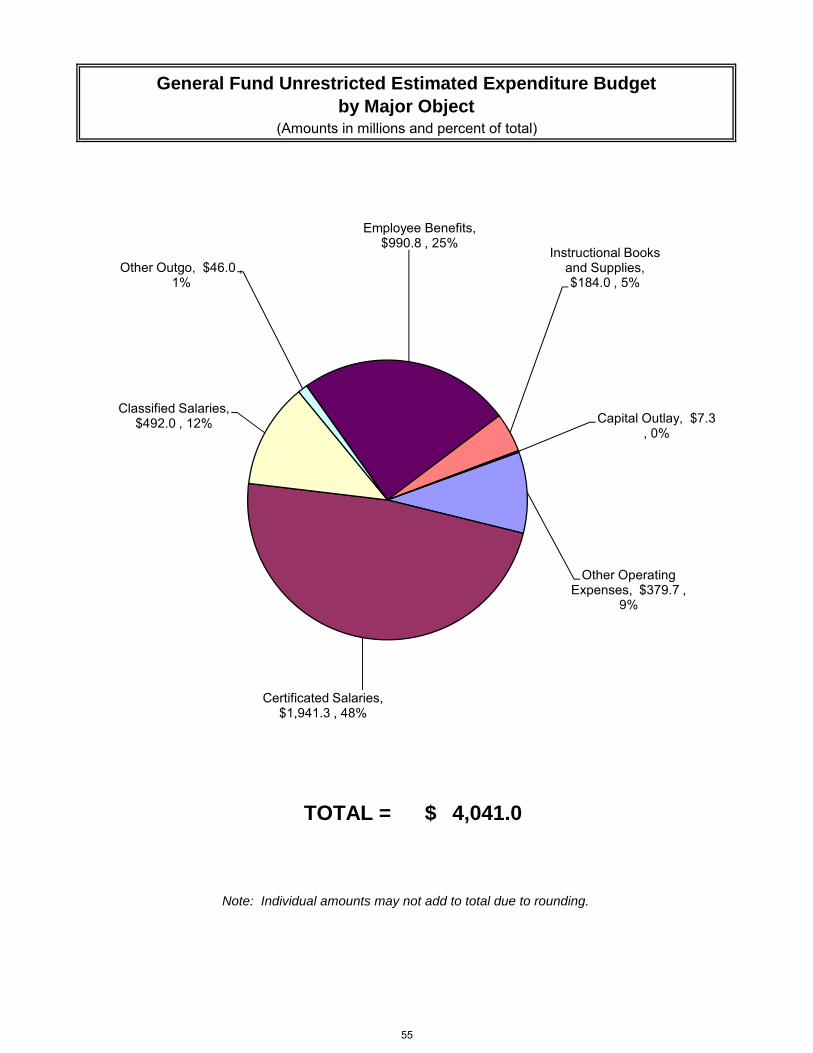
4,041.0$
General Fund Unrestricted Estimated Expenditure Budgetby Major Object
(Amounts in millions and percent of total)
TOTAL =
Note: Individual amounts may not add to total due to rounding.
Other Operating Expenses, $379.7 ,
9%
Certificated Salaries, $1,941.3 , 48%
Classified Salaries, $492.0 , 12%
Other Outgo, $46.0 , 1%
Employee Benefits, $990.8 , 25%
Instructional Books and Supplies, $184.0 , 5%
Capital Outlay, $7.3 , 0%
55
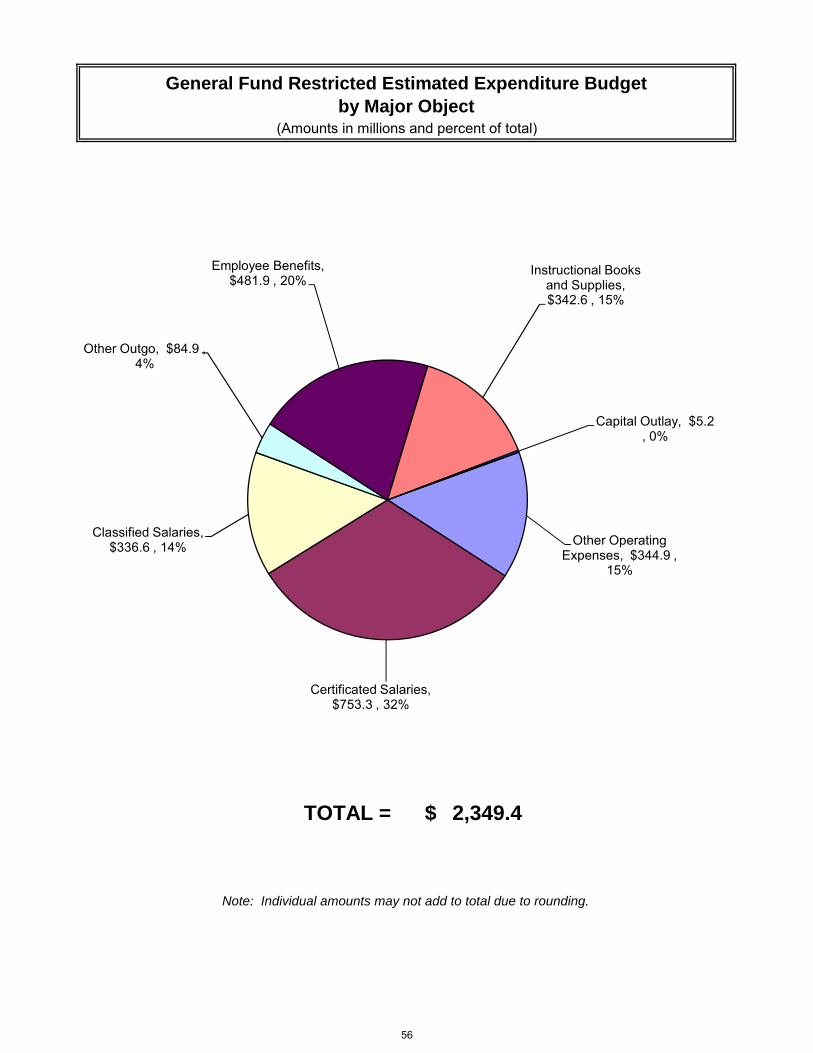
2,349.4$
General Fund Restricted Estimated Expenditure Budgetby Major Object
(Amounts in millions and percent of total)
TOTAL =
Note: Individual amounts may not add to total due to rounding.
Other Operating Expenses, $344.9 ,
15%
Certificated Salaries, $753.3 , 32%
Classified Salaries, $336.6 , 14%
Other Outgo, $84.9 , 4%
Employee Benefits, $481.9 , 20%
Instructional Books and Supplies, $342.6 , 15%
Capital Outlay, $5.2 , 0%
56
SUPERINTENDENT’S 2014-15 FINAL BUDGET
General Fund Unrestricted & Restricted Multi-Year Projection
AB1200 (Chapter 1213/1991) and AB2756 (Chapter 52/2004) were enacted in response to a number of near bankruptcies, an increase in requests for state emergency loans, and a number of school districts going into financial distress. As a result, districts are required to submit a Multi-Year Projection (MYP) of the General Fund that includes the current fiscal year and two subsequent fiscal years. These are taken into account by the county as part of its fiscal solvency review process.
The projections in the MYP are calculated based on a given set of assumptions and are expected to change as various factors change. The assumptions used are listed in the Budget Assumptions and Policies pages, found in Attachment A of the Board Report.
57

Multi-Year ProjectionGeneral Fund
Unrestricted/Restricted
6/10/2014
2009-10 2010-11 2011-12 2012-13 2013-14 2014-15 2015-16 2016-17Actual Actual Actual Actual Estimated Estimated Estimated Estimated
Amounts Amounts Amounts Amounts Amounts Amounts Amounts AmountsBeginning Balance $750.0 $662.9 $903.5 $824.8 $592.7 $655.2 $489.3 $323.0Revenues and Other Financing Sources
LCFF/Revenue Limit Sources 8010-8099 $2,977.2 $3,056.4 $2,968.2 $2,913.7 $4,318.2 $4,672.9 $4,923.9 $4,973.3Federal Revenues 8100-8299 $964.0 $1,066.5 $868.0 $629.9 $567.7 $727.9 $719.1 $719.1Other State Revenues 8300-8599 $2,159.4 $2,031.8 $1,903.5 $2,002.5 $822.5 $705.5 $637.6 $636.8Other Local Revenues 8600-8799 $108.1 $171.6 $139.1 $124.6 $113.9 $116.8 $141.1 $150.6Other Financing SourcesTransfers In 8900-8929 $62.9 $88.1 $5.5 $23.6 $22.8 $0.0 $0.0 $0.0Other Sources 8930-8979 $3.0 $3.0 $4.2 $15.2 $0.8 $1.5 $1.5 $0.0Contribution to Restricted Programs 8980-8999 $0.0 $0.0 $0.0 $0.0 $0.0 $0.0 $0.0 $0.0
Total Revenues and Other Financing Sources $6,274.5 $6,417.4 $5,888.4 $5,709.5 $5,846.0 $6,224.6 $6,423.2 $6,479.8Total Sources of Funds $7,024.5 $7,080.3 $6,791.9 $6,534.3 $6,438.7 $6,879.8 $6,912.5 $6,802.8
Expenditures and Other Financing UsesCertificated Salaries 1000-1999 $2,807.9 $2,813.1 $2,681.6 $2,591.7 $2,596.0 $2,694.6 $2,791.2 $2,796.3Classified Salaries 2000-2999 $908.1 $854.2 $819.2 $781.4 $798.1 $828.6 $879.7 $881.9Employee Benefits 3000-3999 $1,407.4 $1,338.6 $1,365.8 $1,349.6 $1,339.0 $1,472.7 $1,577.1 $1,696.1Books & Supplies 4000-4999 $260.1 $353.4 $231.1 $165.5 $214.1 $526.6 $389.6 $365.4Services, Other Operating Expenses 5000-5999 $760.7 $681.4 $698.0 $775.4 $714.2 $724.6 $806.6 $823.8Capital Outlay 6000-6999 $18.2 $71.6 $43.6 $23.3 $11.2 $12.5 $8.4 $7.0Other Outgo 7100-7299 $0.6 $0.2 $1.2 $1.2 $1.1 $1.1 $1.1 $1.1Other Outgo 7400-7499 $1.7 $1.7 $1.3 $0.9 $0.9 $1.0 $0.9 $0.9Direct Support/Indirect Costs 7300-7399 -$11.6 -$9.2 -$27.4 -$12.6 -$17.5 -$25.0 -$14.4 -$16.7Other Financing Uses 7610-7699 $224.4 $75.8 $152.8 $171.0 $126.3 $153.8 $149.2 $148.4
Total Expenditures and Other Financing Uses $6,377.5 $6,180.8 $5,967.3 $5,847.5 $5,783.5 $6,390.5 $6,589.5 $6,704.2Ending Fund Balance $646.9 $899.6 $824.6 $686.8 $655.2 $489.3 $323.0 $98.6Total Uses of Funds $7,024.5 $7,080.3 $6,791.9 $6,534.3 $6,438.7 $6,879.8 $6,912.5 $6,802.8
Change in Fund Balance -$103.0 $236.7 -$78.9 -$138.0 $62.5 -$165.9 -$166.3 -$224.4
Components of Ending Balance:Non Spendable-Inventories/Cash/Others $10.8 $10.4 $11.2 $18.5 $18.5 $18.5 $18.5 $18.5Restricted Ending Balances $278.0 $266.4 $186.6 $138.5 $198.9 $77.9 $56.9 $62.6Assigned Ending Balances
Other Designations/Carryovers $173.2 $147.0 $162.2 $223.7 $321.0 $303.2 $307.2 $311.4Reserve for Revenue Uncertainties-Gap Funding $0.0 $0.0 $303.1 $202.0 $0.0 $0.0 $230.1 $351.6
Unassigned Ending BalancesReserve for Economic Uncertainties $65.4 $65.4 $65.4 $65.4 $65.4 $65.4 $65.4 $65.4Undesignated/Unassigned Ending Balances $119.5 $410.3 $96.2 $38.8 $51.4 $24.3 -$355.1 -$710.9
Total Ending Balance $646.9 $899.6 $824.6 $686.8 $655.2 $489.3 $323.0 $98.6
58

Multi-Year ProjectionGeneral FundUnrestricted
6/10/2014
2009-10 2010-11 2011-12 2012-13 2013-14 2014-15 2015-16 2016-17Actual Actual Actual Actual Estimated Estimated Estimated Estimated
Amounts Amounts Amounts Amounts Amounts Amounts Amounts AmountsBeginning Balance $263.4 $366.9 $636.1 $637.2 $453.3 $456.3 $411.4 $266.0Revenues and Other Financing Sources
LCFF/Revenue Limit Sources 8010-8099 $2,805.8 $2,886.0 $2,798.9 $2,752.8 $4,318.2 $4,672.9 $4,923.9 $4,973.3Federal Revenues 8100-8299 $18.5 $22.0 $20.2 $22.6 $20.0 $20.2 $20.2 $20.2Other State Revenues 8300-8599 $1,262.1 $1,169.9 $1,085.4 $1,220.7 $111.3 $105.3 $103.1 $100.9Other Local Revenues 8600-8799 $96.9 $112.7 $114.3 $103.8 $96.7 $89.3 $111.7 $121.3Other Financing SourcesTransfers In 8900-8929 $16.4 $28.6 $0.8 $14.0 $18.6 $0.0 $0.0 $0.0Other Sources 8930-8979 $3.0 $3.0 $4.2 $15.2 $0.8 $1.5 $1.5 $0.0Contribution to Restricted Programs 8980-8999 -$809.3 -$740.8 -$748.6 -$679.3 -$856.7 -$893.0 -$985.5 -$1,009.8
Total Revenues and Other Financing Sources $3,393.5 $3,481.3 $3,275.1 $3,449.7 $3,708.9 $3,996.2 $4,175.0 $4,205.9Total Sources of Funds $3,656.9 $3,848.2 $3,911.2 $4,087.0 $4,162.2 $4,452.5 $4,586.4 $4,471.9
Expenditures and Other Financing UsesCertificated Salaries 1000-1999 $1,606.1 $1,726.3 $1,709.7 $1,749.9 $1,822.8 $1,941.3 $1,983.2 $2,006.5Classified Salaries 2000-2999 $418.6 $395.7 $410.6 $400.4 $454.6 $492.0 $526.4 $529.8Employee Benefits 3000-3999 $784.2 $770.4 $823.0 $846.8 $891.1 $990.8 $1,099.2 $1,209.9Books & Supplies 4000-4999 $109.7 $143.0 $88.2 $66.6 $107.2 $184.0 $216.5 $192.0Services, Other Operating Expenses 5000-5999 $207.3 $152.2 $195.9 $349.4 $367.9 $379.7 $404.1 $416.9Capital Outlay 6000-6999 $9.7 $11.6 $17.7 $19.8 $6.1 $7.3 $7.0 $5.6Other Outgo 7100-7299 $0.6 $0.2 $1.2 $1.2 $1.1 $1.1 $1.1 $1.1Other Outgo 7400-7499 $1.7 $1.7 $1.3 $0.9 $0.9 $1.0 $0.9 $0.9Direct Support/Indirect Costs 7300-7399 -$72.4 -$59.9 -$126.4 -$66.4 -$72.2 -$110.0 -$67.0 -$75.2Other Financing Uses 7610-7699 $224.4 $74.9 $152.8 $171.0 $126.3 $153.8 $149.2 $148.4
Total Expenditures and Other Financing Uses $3,289.9 $3,216.0 $3,274.2 $3,539.6 $3,706.0 $4,041.0 $4,320.6 $4,435.9Ending Fund Balance $366.9 $632.2 $637.0 $547.4 $456.3 $411.4 $265.8 $36.0Total Uses of Funds $3,656.9 $3,848.2 $3,911.2 $4,087.0 $4,162.2 $4,452.5 $4,586.4 $4,471.9
Change in Fund Balance $103.5 $265.3 $0.9 -$89.9 $3.0 -$44.8 -$145.6 -$230.1
Components of Ending Balance:Non Spendable-Inventories/Cash/Others $9.8 $9.4 $10.2 $17.5 $18.5 $18.5 $18.5 $18.5Restricted Ending Balances $0.0 $0.0 $0.0 $0.0 $0.0 $0.0 $0.0 $0.0Assigned Ending Balances
Other Designations/Carryovers $172.2 $147.0 $162.2 $223.7 $321.0 $303.2 $307.2 $311.4Reserve for Revenue Uncertainties-Gap Funding $0.0 $0.0 $303.1 $202.0 $0.0 $0.0 $230.1 $351.6
Unassigned Ending BalancesReserve for Economic Uncertainties $65.4 $65.4 $65.4 $65.4 $65.4 $65.4 $65.4 $65.4Undesignated/Unassigned Ending Balances $119.5 $410.3 $96.2 $38.8 $51.4 $24.3 -$355.1 -$710.9
Total Ending Balance $366.9 $632.2 $637.0 $547.4 $456.3 $411.4 $266.0 $36.0
59

Multi-Year ProjectionGeneral Fund
Restricted
6/10/2014
2009-10 2010-11 2011-12 2012-13 2013-14 2014-15 2015-16 2016-17Actual Actual Actual Actual Estimated Estimated Estimated Estimated
Amounts Amounts Amounts Amounts Amounts Amounts Amounts AmountsBeginning Balance $486.6 $296.0 $267.4 $187.6 $139.4 $198.9 $77.9 $56.9Revenues and Other Financing Sources
LCFF/Revenue Limit Sources 8010-8099 $171.4 $170.4 $169.3 $160.9 $0.0 $0.0 $0.0 $0.0Federal Revenues 8100-8299 $945.4 $1,044.5 $847.7 $607.3 $547.7 $707.7 $698.9 $698.8Other State Revenues 8300-8599 $897.3 $861.9 $818.1 $781.8 $711.2 $600.2 $534.5 $535.9Other Local Revenues 8600-8799 $11.1 $59.0 $24.9 $20.8 $17.2 $27.5 $29.3 $29.3Other Financing SourcesTransfers In 8900-8929 $46.5 $59.5 $4.7 $9.6 $4.2 $0.0 $0.0 $0.0Other Sources 8930-8979 $0.0 $0.0 $0.0 $0.0 $0.0 $0.0 $0.0 $0.0Contribution to Restricted Programs 8980-8999 $809.3 $740.8 $748.6 $679.3 $856.7 $893.0 $985.5 $1,009.8
Total Revenues and Other Financing Sources $2,881.1 $2,936.1 $2,613.3 $2,259.7 $2,137.1 $2,228.4 $2,248.2 $2,273.9Total Sources of Funds $3,367.6 $3,232.1 $2,880.7 $2,447.3 $2,276.5 $2,427.3 $2,326.1 $2,330.8
Expenditures and Other Financing UsesCertificated Salaries 1000-1999 $1,201.9 $1,086.8 $971.9 $841.8 $773.2 $753.3 $808.0 $789.8Classified Salaries 2000-2999 $489.5 $458.6 $408.7 $381.0 $343.5 $336.6 $353.3 $352.0Employee Benefits 3000-3999 $623.2 $568.2 $542.8 $502.8 $447.8 $481.9 $478.0 $486.2Books & Supplies 4000-4999 $150.4 $210.4 $142.9 $98.8 $106.9 $342.6 $173.1 $173.5Services, Other Operating Expenses 5000-5999 $553.4 $529.2 $502.0 $426.1 $346.3 $344.9 $402.5 $406.9Capital Outlay 6000-6999 $8.5 $59.9 $25.8 $3.4 $5.2 $5.2 $1.4 $1.4Other Outgo 7100-7299 $0.0 $0.0 $0.0 $0.0 $0.0 $0.0 $0.0 $0.0Other Outgo 7400-7499 $0.0 $0.0 $0.0 $0.0 $0.0 $0.0 $0.0 $0.0Direct Support/Indirect Costs 7300-7399 $60.8 $50.7 $99.0 $53.8 $54.7 $84.9 $52.6 $58.5Other Financing Uses 7610-7699 $0.0 $0.9 $0.0 $0.1 $0.0 $0.0 $0.0 $0.0
Total Expenditures and Other Financing Uses $3,087.6 $2,964.7 $2,693.1 $2,307.9 $2,077.6 $2,349.4 $2,268.9 $2,268.3Ending Fund Balance $280.0 $267.4 $187.6 $139.4 $198.9 $77.9 $57.1 $62.6Total Uses of Funds $3,367.6 $3,232.1 $2,880.7 $2,447.3 $2,276.5 $2,427.3 $2,326.1 $2,330.8
Change in Fund Balance -$206.5 -$28.6 -$79.8 -$48.1 $59.5 -$121.1 -$20.7 $5.7
Components of Ending Balance:Non Spendable-Inventories/Cash/Others $1.0 $1.0 $1.0 $1.0 $0.0 $0.0 $0.0 $0.0Restricted Ending Balances $278.0 $266.4 $186.6 $138.5 $198.9 $77.9 $56.9 $62.6Assigned Ending Balances
Other Designations/Carryovers $1.0 $0.0 $0.0 $0.0 $0.0 $0.0 $0.0 $0.0Reserve for Revenue Uncertainties-Gap Funding $0.0 $0.0 $0.0 $0.0 $0.0 $0.0 $0.0 $0.0
Unassigned Ending BalancesReserve for Economic Uncertainties $0.0 $0.0 $0.0 $0.0 $0.0 $0.0 $0.0 $0.0Undesignated/Unassigned Ending Balances $0.0 $0.0 $0.0 $0.0 $0.0 $0.0 $0.0 $0.0
Total Ending Balance $280.0 $267.4 $187.6 $139.4 $198.9 $77.9 $56.9 $62.6% of ending balance to 14% 13% 10% 9% 16% 6% 5%
60
FINANCIAL DETAILS
Introduction The Financial Details Section presents District budget information that is more detailed than the summary and graphic information presented in the Fund Highlights.
This section includes tables for revenue and expenditures by fund, and General Fund details.
61
SUPERINTENDENT’S 2014-15 FINAL BUDGET
General Fund
Unrestricted & Restricted
62

2010-11
Actual
Amounts
2011-12
Actual
Amounts
2012-13
Actual
Amounts
2013-14
3rd Interim
Estimate
2014-15
Authorized
Amounts
2014-15
Estimated
Amounts
Beginning Balance
$10.8 $10.4 $11.2 $18.5 $18.5 $18.5
$278.0 $266.4 $186.6 $138.5 $198.9 $198.9
$173.2 $147.0 $162.2 $122.6 $321.0 $321.0
$0.0 $0.0 $303.1 $303.1 $0.0 $0.0
$65.4 $65.4 $65.4 $65.4 $65.4 $65.4
$119.5 $410.3 $96.2 $38.8 $51.4 $51.4
$0.0 $5.1 $0.0 $0.0 $0.0 $0.0
$16.0 -$1.1 $0.2 -$94.1 $0.0 $0.0
Total Beginning Balance $662.9 $903.5 $824.8 $592.7 $655.2 $655.2
Revenue
$3,056.4 $2,968.2 $2,913.7 $0.0 $0.0 $0.0
Local Control Funding Formula $0.0 $0.0 $0.0 $4,318.2 $4,672.9 $4,672.9
$1,066.5 $868.0 $629.9 $567.7 $727.9 $727.9
$2,031.8 $1,903.5 $2,002.5 $822.7 $705.5 $705.5
$171.6 $139.1 $124.6 $113.8 $116.8 $116.8
$88.1 $5.5 $23.6 $22.8 $0.0 $0.0
$3.0 $4.2 $15.2 $0.8 $1.5 $1.5
$0.0 $0.0 $0.0 $0.0 $0.0 $0.0
Total Revenue $6,417.4 $5,888.4 $5,709.5 $5,846.0 $6,224.6 $6,224.6
Total Sources of Funds $7,080.3 $6,791.9 $6,534.3 $6,438.7 $6,879.8 $6,879.8
Expenditure
$2,813.1 $2,681.6 $2,591.7 $2,596.0 $2,644.3 $2,694.6
$854.2 $819.2 $781.4 $798.1 $825.0 $828.6
$1,338.6 $1,365.8 $1,349.6 $1,339.0 $1,477.6 $1,472.7
$353.4 $231.1 $165.5 $214.1 $802.7 $526.6
$681.4 $698.0 $775.4 $714.2 $709.3 $724.6
$71.6 $43.6 $23.3 $11.2 $46.7 $12.5
$68.4 $127.9 $160.6 $110.9 $130.5 $130.9
Total Expenditure $6,180.8 $5,967.3 $5,847.5 $5,783.5 $6,636.2 $6,390.4
Ending Balance
$10.4 $11.2 $18.5 $18.5 $18.5 $18.5
$266.4 $186.6 $138.5 $198.9 $0.0 $77.9
$147.0 $162.2 $122.6 $321.0 $135.4 $303.2
$0.0 $303.1 $303.1 $0.0 $0.0 $0.0
$65.4 $65.4 $65.4 $65.4 $65.4 $65.4
$410.3 $96.2 $38.8 $51.4 $24.3 $24.3
Total Ending Balance $899.6 $824.6 $686.8 $655.2 $243.6 $489.3
Total Uses of Funds $7,080.3 $6,791.9 $6,534.3 $6,438.7 $6,879.8 $6,879.8
Assigned Ending Balances
Reserve for Revenue Uncertainties
Unassigned Ending Balances
Reserve for Economic Uncertainties
Undesignated/Unassigned Ending Balances
Other Operating Expenses
Capital Outlay
Other Outgo
Non Spendable-Inventories, Cash, Others
Restricted Ending Balances
Uses of Funds
Certificated Salaries
Classified Salaries
Employee Benefits
Books and Supplies
Interfund Transfers In
Other Financing Sources
Interprogram Transfers
Audit Adjustments
Revenue Limit Revenues
Federal Revenues
State Revenues
Local Revenues
SUPERINTENDENT'S 2014-15 FINAL BUDGET
OPERATING FUND
General Fund - Unrestricted and Restricted Programs (001&003/010)
General Fund is the primary operating fund for the K - 12 program.
Amounts in $ millions
Sources of Funds
Non Spendable-Inventories, Cash, Others
Restricted Beginning Balances
Assigned Beginning Balances
Reserve for Revenue Uncertainties
Unassigned Beginning Balances
Reserve for Economic Uncertainties
Undesignated/Unassigned Beginning Balances
Restatement of Beginning Balances
63
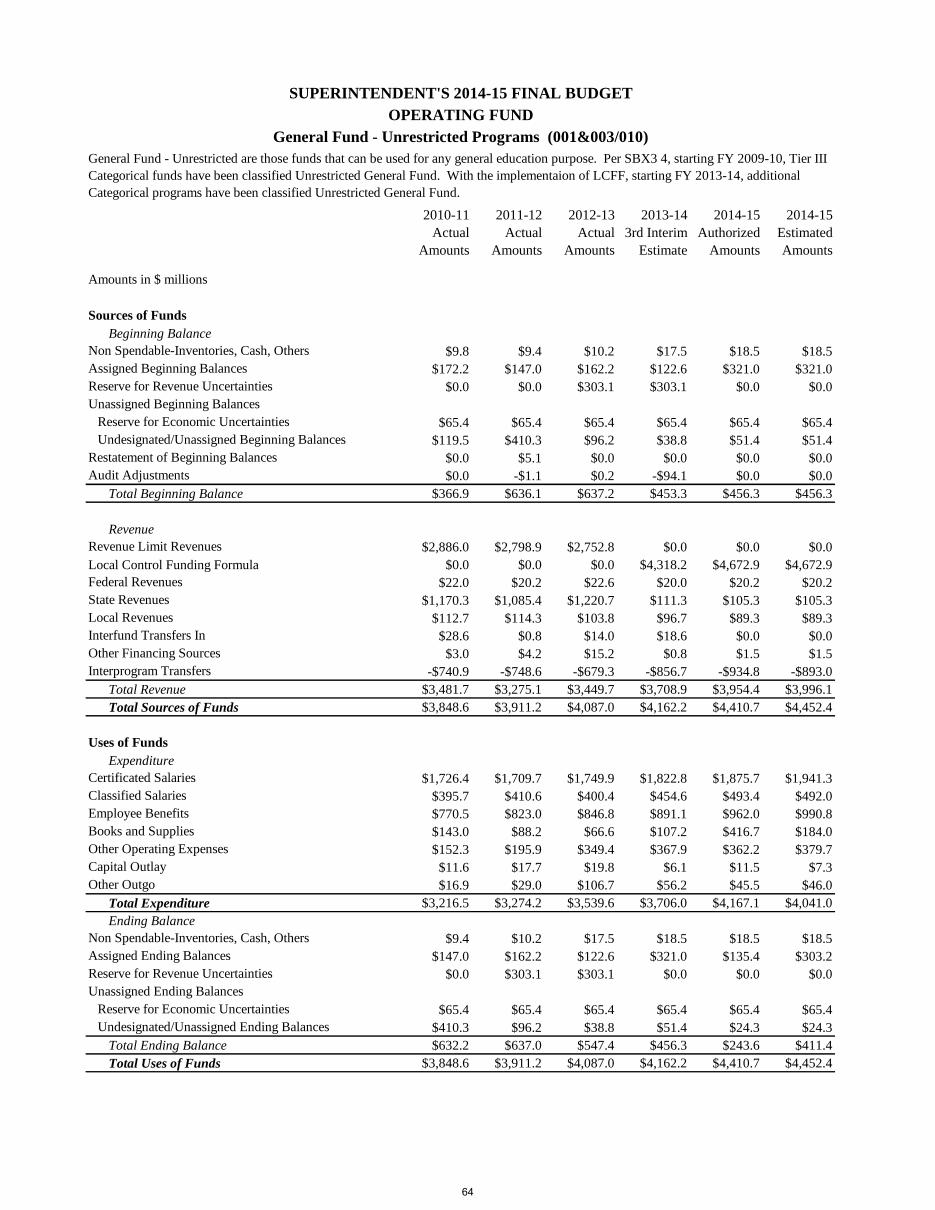
2010-11
Actual
Amounts
2011-12
Actual
Amounts
2012-13
Actual
Amounts
2013-14
3rd Interim
Estimate
2014-15
Authorized
Amounts
2014-15
Estimated
Amounts
Beginning Balance
$9.8 $9.4 $10.2 $17.5 $18.5 $18.5
$172.2 $147.0 $162.2 $122.6 $321.0 $321.0
$0.0 $0.0 $303.1 $303.1 $0.0 $0.0
$65.4 $65.4 $65.4 $65.4 $65.4 $65.4
$119.5 $410.3 $96.2 $38.8 $51.4 $51.4
$0.0 $5.1 $0.0 $0.0 $0.0 $0.0
$0.0 -$1.1 $0.2 -$94.1 $0.0 $0.0
Total Beginning Balance $366.9 $636.1 $637.2 $453.3 $456.3 $456.3
Revenue
$2,886.0 $2,798.9 $2,752.8 $0.0 $0.0 $0.0
Local Control Funding Formula $0.0 $0.0 $0.0 $4,318.2 $4,672.9 $4,672.9
$22.0 $20.2 $22.6 $20.0 $20.2 $20.2
$1,170.3 $1,085.4 $1,220.7 $111.3 $105.3 $105.3
$112.7 $114.3 $103.8 $96.7 $89.3 $89.3
$28.6 $0.8 $14.0 $18.6 $0.0 $0.0
$3.0 $4.2 $15.2 $0.8 $1.5 $1.5
-$740.9 -$748.6 -$679.3 -$856.7 -$934.8 -$893.0
Total Revenue $3,481.7 $3,275.1 $3,449.7 $3,708.9 $3,954.4 $3,996.1
Total Sources of Funds $3,848.6 $3,911.2 $4,087.0 $4,162.2 $4,410.7 $4,452.4
Expenditure
$1,726.4 $1,709.7 $1,749.9 $1,822.8 $1,875.7 $1,941.3
$395.7 $410.6 $400.4 $454.6 $493.4 $492.0
$770.5 $823.0 $846.8 $891.1 $962.0 $990.8
$143.0 $88.2 $66.6 $107.2 $416.7 $184.0
$152.3 $195.9 $349.4 $367.9 $362.2 $379.7
$11.6 $17.7 $19.8 $6.1 $11.5 $7.3
$16.9 $29.0 $106.7 $56.2 $45.5 $46.0
Total Expenditure $3,216.5 $3,274.2 $3,539.6 $3,706.0 $4,167.1 $4,041.0
Ending Balance
$9.4 $10.2 $17.5 $18.5 $18.5 $18.5
$147.0 $162.2 $122.6 $321.0 $135.4 $303.2
$0.0 $303.1 $303.1 $0.0 $0.0 $0.0
$65.4 $65.4 $65.4 $65.4 $65.4 $65.4
$410.3 $96.2 $38.8 $51.4 $24.3 $24.3
Total Ending Balance $632.2 $637.0 $547.4 $456.3 $243.6 $411.4
Total Uses of Funds $3,848.6 $3,911.2 $4,087.0 $4,162.2 $4,410.7 $4,452.4
Assigned Ending Balances
Reserve for Revenue Uncertainties
Unassigned Ending Balances
Reserve for Economic Uncertainties
Undesignated/Unassigned Ending Balances
Other Operating Expenses
Capital Outlay
Other Outgo
Non Spendable-Inventories, Cash, Others
Uses of Funds
Certificated Salaries
Classified Salaries
Employee Benefits
Books and Supplies
Interfund Transfers In
Other Financing Sources
Interprogram Transfers
Audit Adjustments
Revenue Limit Revenues
Federal Revenues
State Revenues
Local Revenues
SUPERINTENDENT'S 2014-15 FINAL BUDGET
General Fund - Unrestricted Programs (001&003/010)
OPERATING FUND
General Fund - Unrestricted are those funds that can be used for any general education purpose. Per SBX3 4, starting FY 2009-10, Tier III
Categorical funds have been classified Unrestricted General Fund. With the implementaion of LCFF, starting FY 2013-14, additional
Categorical programs have been classified Unrestricted General Fund.
Amounts in $ millions
Sources of Funds
Non Spendable-Inventories, Cash, Others
Assigned Beginning Balances
Reserve for Revenue Uncertainties
Unassigned Beginning Balances
Reserve for Economic Uncertainties
Undesignated/Unassigned Beginning Balances
Restatement of Beginning Balances
64
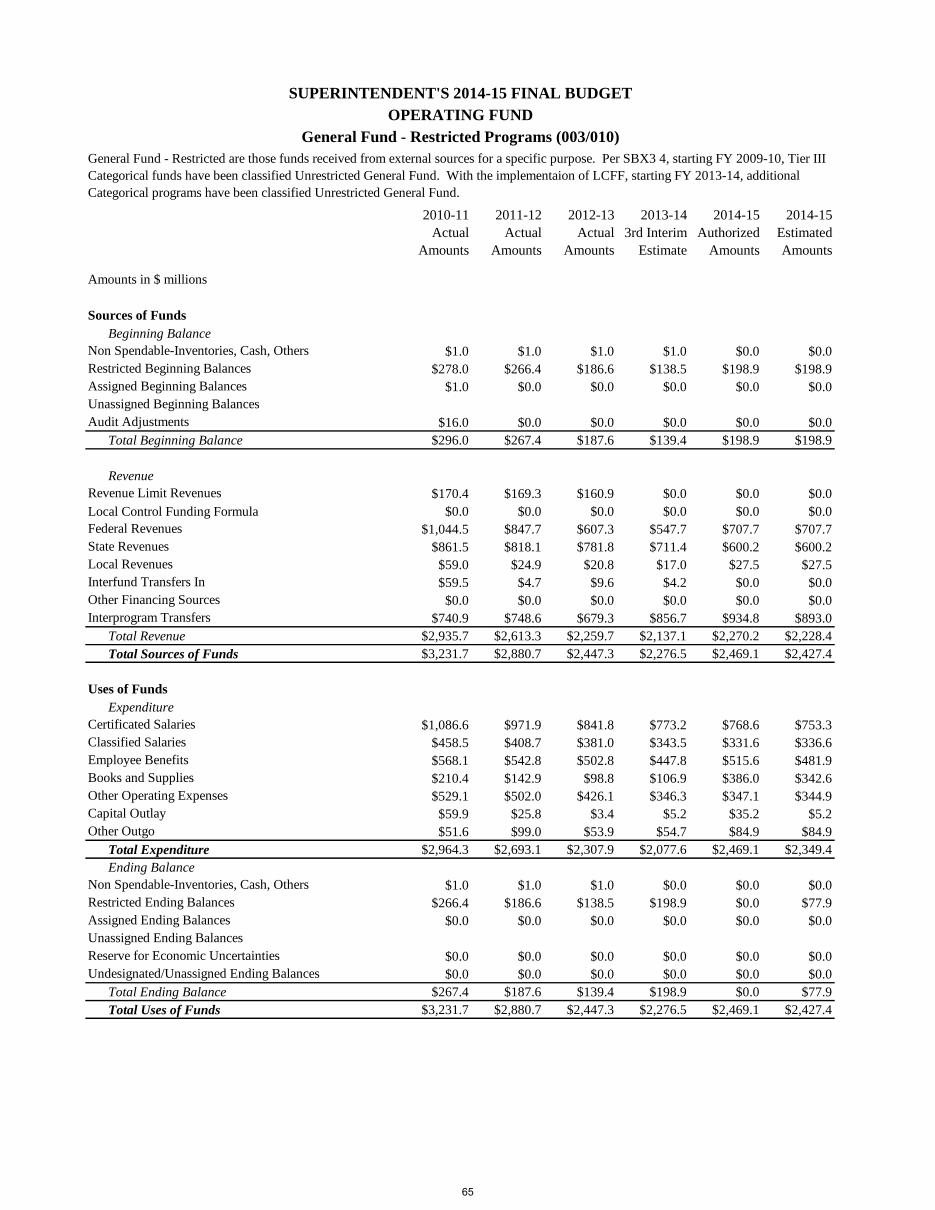
2010-11
Actual
Amounts
2011-12
Actual
Amounts
2012-13
Actual
Amounts
2013-14
3rd Interim
Estimate
2014-15
Authorized
Amounts
2014-15
Estimated
Amounts
Beginning Balance
$1.0 $1.0 $1.0 $1.0 $0.0 $0.0
$278.0 $266.4 $186.6 $138.5 $198.9 $198.9
$1.0 $0.0 $0.0 $0.0 $0.0 $0.0
$16.0 $0.0 $0.0 $0.0 $0.0 $0.0
Total Beginning Balance $296.0 $267.4 $187.6 $139.4 $198.9 $198.9
Revenue
$170.4 $169.3 $160.9 $0.0 $0.0 $0.0
Local Control Funding Formula $0.0 $0.0 $0.0 $0.0 $0.0 $0.0
$1,044.5 $847.7 $607.3 $547.7 $707.7 $707.7
$861.5 $818.1 $781.8 $711.4 $600.2 $600.2
$59.0 $24.9 $20.8 $17.0 $27.5 $27.5
$59.5 $4.7 $9.6 $4.2 $0.0 $0.0
$0.0 $0.0 $0.0 $0.0 $0.0 $0.0
$740.9 $748.6 $679.3 $856.7 $934.8 $893.0
Total Revenue $2,935.7 $2,613.3 $2,259.7 $2,137.1 $2,270.2 $2,228.4
Total Sources of Funds $3,231.7 $2,880.7 $2,447.3 $2,276.5 $2,469.1 $2,427.4
Expenditure
$1,086.6 $971.9 $841.8 $773.2 $768.6 $753.3
$458.5 $408.7 $381.0 $343.5 $331.6 $336.6
$568.1 $542.8 $502.8 $447.8 $515.6 $481.9
$210.4 $142.9 $98.8 $106.9 $386.0 $342.6
$529.1 $502.0 $426.1 $346.3 $347.1 $344.9
$59.9 $25.8 $3.4 $5.2 $35.2 $5.2
$51.6 $99.0 $53.9 $54.7 $84.9 $84.9
Total Expenditure $2,964.3 $2,693.1 $2,307.9 $2,077.6 $2,469.1 $2,349.4
Ending Balance
$1.0 $1.0 $1.0 $0.0 $0.0 $0.0
$266.4 $186.6 $138.5 $198.9 $0.0 $77.9
$0.0 $0.0 $0.0 $0.0 $0.0 $0.0
$0.0 $0.0 $0.0 $0.0 $0.0 $0.0
$0.0 $0.0 $0.0 $0.0 $0.0 $0.0
Total Ending Balance $267.4 $187.6 $139.4 $198.9 $0.0 $77.9
Total Uses of Funds $3,231.7 $2,880.7 $2,447.3 $2,276.5 $2,469.1 $2,427.4
Unassigned Ending Balances
Reserve for Economic Uncertainties
Undesignated/Unassigned Ending Balances
Other Outgo
Non Spendable-Inventories, Cash, Others
Restricted Ending Balances
Assigned Ending Balances
Classified Salaries
Employee Benefits
Books and Supplies
Other Operating Expenses
Capital Outlay
Interfund Transfers In
Other Financing Sources
Interprogram Transfers
Uses of Funds
Certificated Salaries
Audit Adjustments
Revenue Limit Revenues
Federal Revenues
State Revenues
Local Revenues
SUPERINTENDENT'S 2014-15 FINAL BUDGET
OPERATING FUND
General Fund - Restricted Programs (003/010)
General Fund - Restricted are those funds received from external sources for a specific purpose. Per SBX3 4, starting FY 2009-10, Tier III
Categorical funds have been classified Unrestricted General Fund. With the implementaion of LCFF, starting FY 2013-14, additional
Categorical programs have been classified Unrestricted General Fund.
Amounts in $ millions
Sources of Funds
Non Spendable-Inventories, Cash, Others
Restricted Beginning Balances
Assigned Beginning Balances
Unassigned Beginning Balances
65
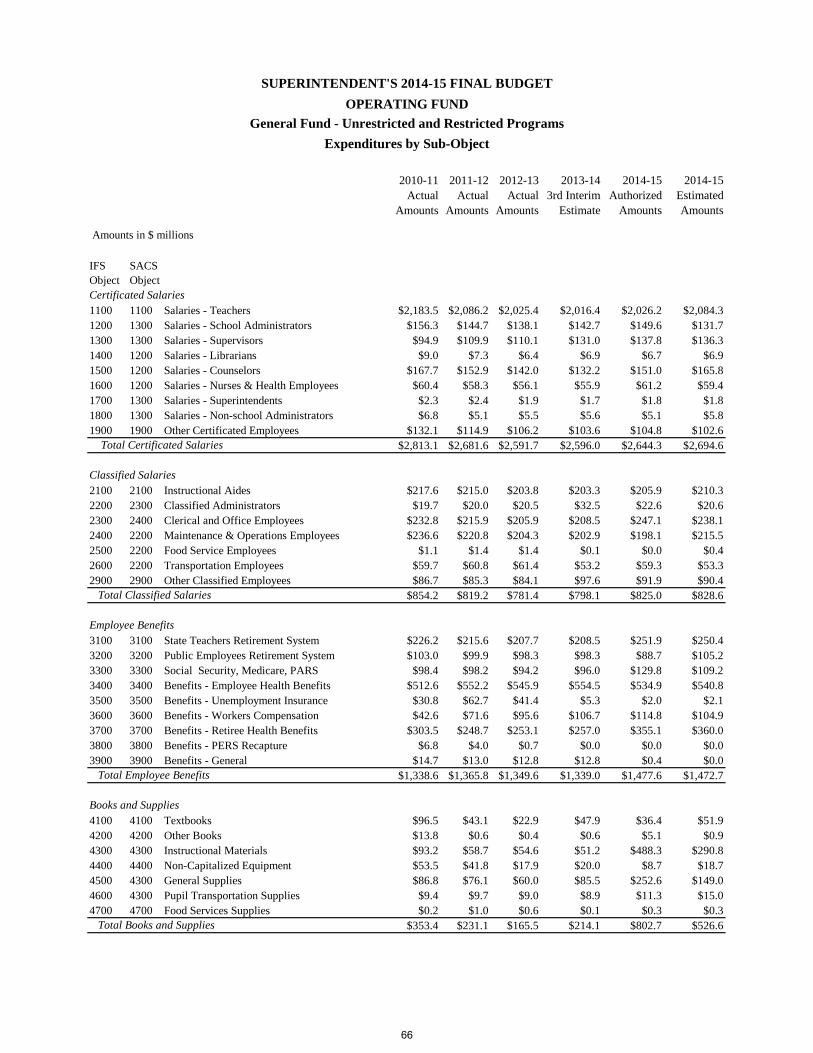
2010-11 Actual
Amounts
2011-12 Actual
Amounts
2012-13 Actual
Amounts
2013-14 3rd Interim
Estimate
2014-15 Authorized
Amounts
2014-15 Estimated Amounts
IFS Object
SACS Object
1100 1100 Salaries - Teachers $2,183.5 $2,086.2 $2,025.4 $2,016.4 $2,026.2 $2,084.31200 1300 Salaries - School Administrators $156.3 $144.7 $138.1 $142.7 $149.6 $131.71300 1300 Salaries - Supervisors $94.9 $109.9 $110.1 $131.0 $137.8 $136.31400 1200 Salaries - Librarians $9.0 $7.3 $6.4 $6.9 $6.7 $6.91500 1200 Salaries - Counselors $167.7 $152.9 $142.0 $132.2 $151.0 $165.81600 1200 Salaries - Nurses & Health Employees $60.4 $58.3 $56.1 $55.9 $61.2 $59.41700 1300 Salaries - Superintendents $2.3 $2.4 $1.9 $1.7 $1.8 $1.81800 1300 Salaries - Non-school Administrators $6.8 $5.1 $5.5 $5.6 $5.1 $5.81900 1900 Other Certificated Employees $132.1 $114.9 $106.2 $103.6 $104.8 $102.6
$2,813.1 $2,681.6 $2,591.7 $2,596.0 $2,644.3 $2,694.6
2100 2100 Instructional Aides $217.6 $215.0 $203.8 $203.3 $205.9 $210.32200 2300 Classified Administrators $19.7 $20.0 $20.5 $32.5 $22.6 $20.62300 2400 Clerical and Office Employees $232.8 $215.9 $205.9 $208.5 $247.1 $238.12400 2200 Maintenance & Operations Employees $236.6 $220.8 $204.3 $202.9 $198.1 $215.52500 2200 Food Service Employees $1.1 $1.4 $1.4 $0.1 $0.0 $0.42600 2200 Transportation Employees $59.7 $60.8 $61.4 $53.2 $59.3 $53.32900 2900 Other Classified Employees $86.7 $85.3 $84.1 $97.6 $91.9 $90.4
$854.2 $819.2 $781.4 $798.1 $825.0 $828.6
3100 3100 State Teachers Retirement System $226.2 $215.6 $207.7 $208.5 $251.9 $250.43200 3200 Public Employees Retirement System $103.0 $99.9 $98.3 $98.3 $88.7 $105.23300 3300 Social Security, Medicare, PARS $98.4 $98.2 $94.2 $96.0 $129.8 $109.23400 3400 Benefits - Employee Health Benefits $512.6 $552.2 $545.9 $554.5 $534.9 $540.83500 3500 Benefits - Unemployment Insurance $30.8 $62.7 $41.4 $5.3 $2.0 $2.13600 3600 Benefits - Workers Compensation $42.6 $71.6 $95.6 $106.7 $114.8 $104.93700 3700 Benefits - Retiree Health Benefits $303.5 $248.7 $253.1 $257.0 $355.1 $360.03800 3800 Benefits - PERS Recapture $6.8 $4.0 $0.7 $0.0 $0.0 $0.03900 3900 Benefits - General $14.7 $13.0 $12.8 $12.8 $0.4 $0.0
$1,338.6 $1,365.8 $1,349.6 $1,339.0 $1,477.6 $1,472.7
4100 4100 Textbooks $96.5 $43.1 $22.9 $47.9 $36.4 $51.94200 4200 Other Books $13.8 $0.6 $0.4 $0.6 $5.1 $0.94300 4300 Instructional Materials $93.2 $58.7 $54.6 $51.2 $488.3 $290.84400 4400 Non-Capitalized Equipment $53.5 $41.8 $17.9 $20.0 $8.7 $18.74500 4300 General Supplies $86.8 $76.1 $60.0 $85.5 $252.6 $149.04600 4300 Pupil Transportation Supplies $9.4 $9.7 $9.0 $8.9 $11.3 $15.04700 4700 Food Services Supplies $0.2 $1.0 $0.6 $0.1 $0.3 $0.3
$353.4 $231.1 $165.5 $214.1 $802.7 $526.6
SUPERINTENDENT'S 2014-15 FINAL BUDGET
General Fund - Unrestricted and Restricted Programs
Expenditures by Sub-Object
OPERATING FUND
Total Certificated Salaries
Total Classified Salaries
Total Employee Benefits
Total Books and Supplies
Amounts in $ millions
Certificated Salaries
Books and Supplies
Employee Benefits
Classified Salaries
66
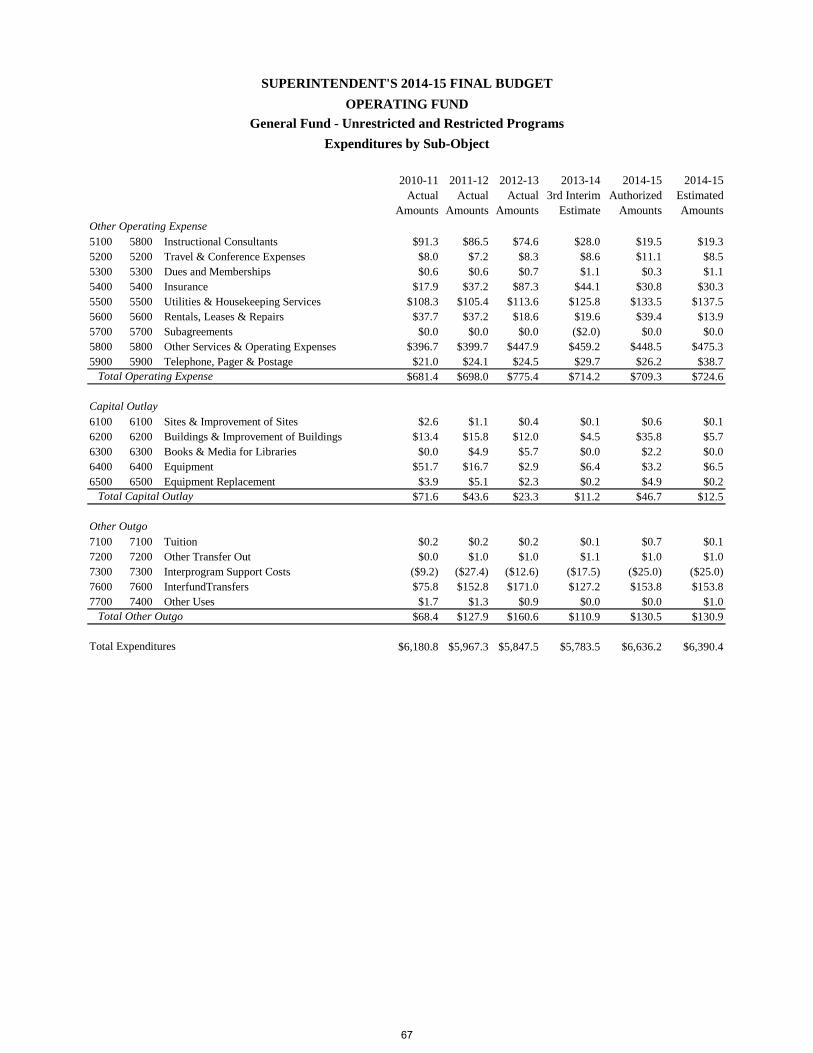
2010-11 Actual
Amounts
2011-12 Actual
Amounts
2012-13 Actual
Amounts
2013-14 3rd Interim
Estimate
2014-15 Authorized
Amounts
2014-15 Estimated Amounts
SUPERINTENDENT'S 2014-15 FINAL BUDGET
General Fund - Unrestricted and Restricted Programs
Expenditures by Sub-Object
OPERATING FUND
5100 5800 Instructional Consultants $91.3 $86.5 $74.6 $28.0 $19.5 $19.35200 5200 Travel & Conference Expenses $8.0 $7.2 $8.3 $8.6 $11.1 $8.55300 5300 Dues and Memberships $0.6 $0.6 $0.7 $1.1 $0.3 $1.15400 5400 Insurance $17.9 $37.2 $87.3 $44.1 $30.8 $30.35500 5500 Utilities & Housekeeping Services $108.3 $105.4 $113.6 $125.8 $133.5 $137.55600 5600 Rentals, Leases & Repairs $37.7 $37.2 $18.6 $19.6 $39.4 $13.95700 5700 Subagreements $0.0 $0.0 $0.0 ($2.0) $0.0 $0.05800 5800 Other Services & Operating Expenses $396.7 $399.7 $447.9 $459.2 $448.5 $475.35900 5900 Telephone, Pager & Postage $21.0 $24.1 $24.5 $29.7 $26.2 $38.7
$681.4 $698.0 $775.4 $714.2 $709.3 $724.6
6100 6100 Sites & Improvement of Sites $2.6 $1.1 $0.4 $0.1 $0.6 $0.16200 6200 Buildings & Improvement of Buildings $13.4 $15.8 $12.0 $4.5 $35.8 $5.76300 6300 Books & Media for Libraries $0.0 $4.9 $5.7 $0.0 $2.2 $0.06400 6400 Equipment $51.7 $16.7 $2.9 $6.4 $3.2 $6.56500 6500 Equipment Replacement $3.9 $5.1 $2.3 $0.2 $4.9 $0.2
$71.6 $43.6 $23.3 $11.2 $46.7 $12.5
7100 7100 Tuition $0.2 $0.2 $0.2 $0.1 $0.7 $0.17200 7200 Other Transfer Out $0.0 $1.0 $1.0 $1.1 $1.0 $1.07300 7300 Interprogram Support Costs ($9.2) ($27.4) ($12.6) ($17.5) ($25.0) ($25.0)7600 7600 InterfundTransfers $75.8 $152.8 $171.0 $127.2 $153.8 $153.87700 7400 Other Uses $1.7 $1.3 $0.9 $0.0 $0.0 $1.0
$68.4 $127.9 $160.6 $110.9 $130.5 $130.9
$6,180.8 $5,967.3 $5,847.5 $5,783.5 $6,636.2 $6,390.4
Other Outgo
Total Other Outgo
Total Expenditures
Other Operating Expense
Total Operating Expense
Capital Outlay
Total Capital Outlay
67
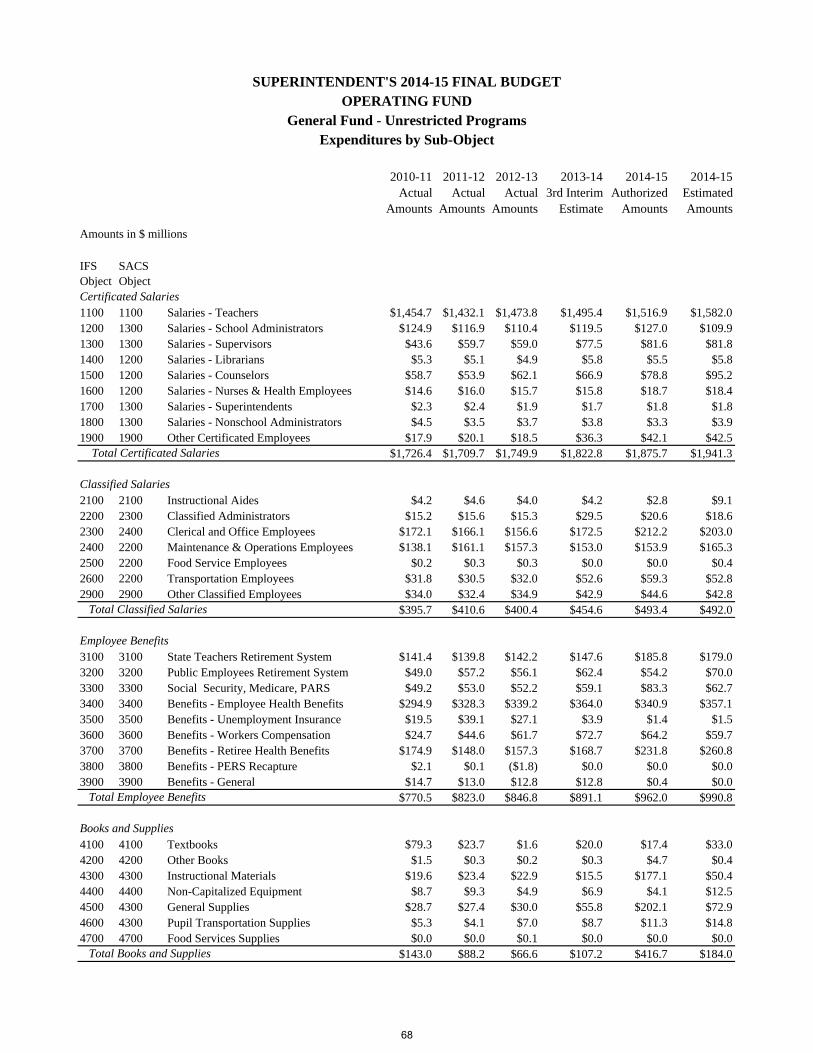
2010-11 Actual
Amounts
2011-12 Actual
Amounts
2012-13 Actual
Amounts
2013-14 3rd Interim
Estimate
2014-15 Authorized
Amounts
2014-15 Estimated Amounts
IFS Object
SACS Object
1100 1100 Salaries - Teachers $1,454.7 $1,432.1 $1,473.8 $1,495.4 $1,516.9 $1,582.01200 1300 Salaries - School Administrators $124.9 $116.9 $110.4 $119.5 $127.0 $109.91300 1300 Salaries - Supervisors $43.6 $59.7 $59.0 $77.5 $81.6 $81.81400 1200 Salaries - Librarians $5.3 $5.1 $4.9 $5.8 $5.5 $5.81500 1200 Salaries - Counselors $58.7 $53.9 $62.1 $66.9 $78.8 $95.21600 1200 Salaries - Nurses & Health Employees $14.6 $16.0 $15.7 $15.8 $18.7 $18.41700 1300 Salaries - Superintendents $2.3 $2.4 $1.9 $1.7 $1.8 $1.81800 1300 Salaries - Nonschool Administrators $4.5 $3.5 $3.7 $3.8 $3.3 $3.91900 1900 Other Certificated Employees $17.9 $20.1 $18.5 $36.3 $42.1 $42.5
$1,726.4 $1,709.7 $1,749.9 $1,822.8 $1,875.7 $1,941.3
2100 2100 Instructional Aides $4.2 $4.6 $4.0 $4.2 $2.8 $9.12200 2300 Classified Administrators $15.2 $15.6 $15.3 $29.5 $20.6 $18.62300 2400 Clerical and Office Employees $172.1 $166.1 $156.6 $172.5 $212.2 $203.02400 2200 Maintenance & Operations Employees $138.1 $161.1 $157.3 $153.0 $153.9 $165.32500 2200 Food Service Employees $0.2 $0.3 $0.3 $0.0 $0.0 $0.42600 2200 Transportation Employees $31.8 $30.5 $32.0 $52.6 $59.3 $52.82900 2900 Other Classified Employees $34.0 $32.4 $34.9 $42.9 $44.6 $42.8
$395.7 $410.6 $400.4 $454.6 $493.4 $492.0
3100 3100 State Teachers Retirement System $141.4 $139.8 $142.2 $147.6 $185.8 $179.03200 3200 Public Employees Retirement System $49.0 $57.2 $56.1 $62.4 $54.2 $70.03300 3300 Social Security, Medicare, PARS $49.2 $53.0 $52.2 $59.1 $83.3 $62.73400 3400 Benefits - Employee Health Benefits $294.9 $328.3 $339.2 $364.0 $340.9 $357.13500 3500 Benefits - Unemployment Insurance $19.5 $39.1 $27.1 $3.9 $1.4 $1.53600 3600 Benefits - Workers Compensation $24.7 $44.6 $61.7 $72.7 $64.2 $59.73700 3700 Benefits - Retiree Health Benefits $174.9 $148.0 $157.3 $168.7 $231.8 $260.83800 3800 Benefits - PERS Recapture $2.1 $0.1 ($1.8) $0.0 $0.0 $0.03900 3900 Benefits - General $14.7 $13.0 $12.8 $12.8 $0.4 $0.0
$770.5 $823.0 $846.8 $891.1 $962.0 $990.8
4100 4100 Textbooks $79.3 $23.7 $1.6 $20.0 $17.4 $33.04200 4200 Other Books $1.5 $0.3 $0.2 $0.3 $4.7 $0.44300 4300 Instructional Materials $19.6 $23.4 $22.9 $15.5 $177.1 $50.44400 4400 Non-Capitalized Equipment $8.7 $9.3 $4.9 $6.9 $4.1 $12.54500 4300 General Supplies $28.7 $27.4 $30.0 $55.8 $202.1 $72.94600 4300 Pupil Transportation Supplies $5.3 $4.1 $7.0 $8.7 $11.3 $14.84700 4700 Food Services Supplies $0.0 $0.0 $0.1 $0.0 $0.0 $0.0
$143.0 $88.2 $66.6 $107.2 $416.7 $184.0
SUPERINTENDENT'S 2014-15 FINAL BUDGETOPERATING FUND
General Fund - Unrestricted ProgramsExpenditures by Sub-Object
Amounts in $ millions
Total Classified Salaries
Total Certificated Salaries
Total Employee Benefits
Total Books and Supplies
Certificated Salaries
Books and Supplies
Employee Benefits
Classified Salaries
68

2010-11 Actual
Amounts
2011-12 Actual
Amounts
2012-13 Actual
Amounts
2013-14 3rd Interim
Estimate
2014-15 Authorized
Amounts
2014-15 Estimated Amounts
SUPERINTENDENT'S 2014-15 FINAL BUDGETOPERATING FUND
General Fund - Unrestricted ProgramsExpenditures by Sub-Object
5100 5800 Instructional Consultants $5.3 $7.3 $3.7 $5.6 $4.6 $4.35200 5200 Travel & Conference Expenses $2.0 $2.5 $2.8 $3.4 $6.8 $3.55300 5300 Dues and Memberships $0.4 $0.5 $0.6 $1.1 $0.3 $1.15400 5400 Insurance $17.9 $37.2 $87.3 $44.1 $30.8 $30.35500 5500 Utilities & Housekeeping Services $105.9 $105.2 $113.5 $125.7 $133.5 $137.45600 5600 Rentals, Leases & Repairs $23.0 $26.5 $13.3 $14.8 $21.4 $12.75700 5700 Subagreements ($88.6) ($87.0) $0.0 ($2.0) $0.0 $0.05800 5800 Other Services & Operating Expenses $66.9 $80.7 $104.2 $146.0 $139.4 $152.65900 5900 Telephone, Pager & Postage $19.4 $23.1 $24.0 $29.2 $25.5 $37.8
$152.3 $195.9 $349.4 $367.9 $362.2 $379.7
6100 6100 Sites & Improvement of Sites $0.8 $0.9 $0.4 $0.1 $0.6 $0.16200 6200 Buildings & Improvement of Buildings $9.6 $11.0 $11.6 $4.3 $5.4 $5.46300 6300 Books & Media for Libraries $0.0 $4.9 $5.7 $0.0 $2.2 $0.06400 6400 Equipment $1.3 $0.7 $1.9 $1.4 $2.6 $1.56500 6500 Equipment Replacement $0.0 $0.2 $0.2 $0.2 $0.7 $0.2
$11.6 $17.7 $19.8 $6.1 $11.5 $7.3
7100 7100 Tuition $0.2 $0.2 $0.2 $0.1 $0.7 $0.17200 7200 Other Transfer Out $0.0 $1.0 $1.0 $1.1 $1.0 $1.07300 7300 Interprogram Support Costs ($59.9) ($126.4) ($66.4) ($72.2) ($110.0) ($110.0)7600 7600 InterfundTransfers $74.9 $152.8 $171.0 $127.2 $153.8 $153.87700 7400 Other Uses $1.7 $1.3 $0.9 $0.0 $0.0 $1.0
$16.9 $29.0 $106.7 $56.2 $45.5 $46.0
$3,216.5 $3,274.2 $3,539.6 $3,706.0 $4,167.1 $4,041.0
Capital Outlay
Total Capital Outlay
Total Expenditures
Other Outgo
Total Other Outgo
Other Operating Expense
Total Operating Expense
69
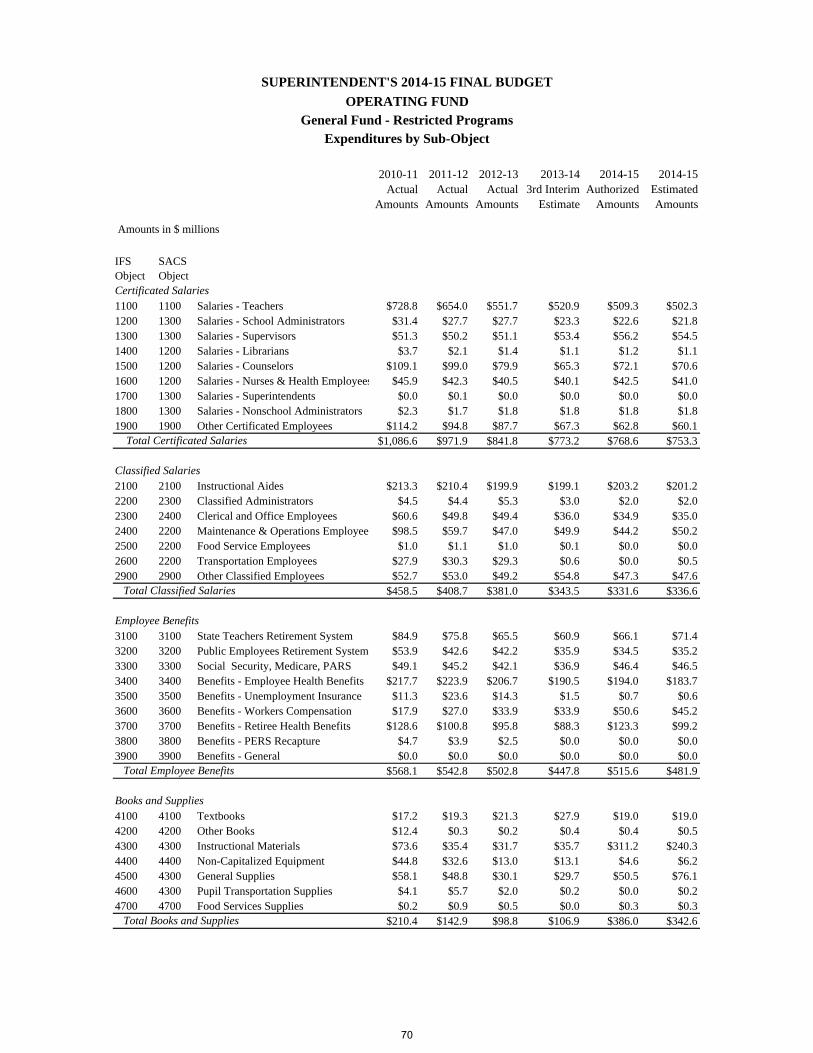
2010-11 Actual
Amounts
2011-12 Actual
Amounts
2012-13 Actual
Amounts
2013-14 3rd Interim
Estimate
2014-15 Authorized
Amounts
2014-15 Estimated Amounts
IFS Object
SACS Object
1100 1100 Salaries - Teachers $728.8 $654.0 $551.7 $520.9 $509.3 $502.31200 1300 Salaries - School Administrators $31.4 $27.7 $27.7 $23.3 $22.6 $21.81300 1300 Salaries - Supervisors $51.3 $50.2 $51.1 $53.4 $56.2 $54.51400 1200 Salaries - Librarians $3.7 $2.1 $1.4 $1.1 $1.2 $1.11500 1200 Salaries - Counselors $109.1 $99.0 $79.9 $65.3 $72.1 $70.61600 1200 Salaries - Nurses & Health Employees $45.9 $42.3 $40.5 $40.1 $42.5 $41.01700 1300 Salaries - Superintendents $0.0 $0.1 $0.0 $0.0 $0.0 $0.01800 1300 Salaries - Nonschool Administrators $2.3 $1.7 $1.8 $1.8 $1.8 $1.81900 1900 Other Certificated Employees $114.2 $94.8 $87.7 $67.3 $62.8 $60.1
$1,086.6 $971.9 $841.8 $773.2 $768.6 $753.3
2100 2100 Instructional Aides $213.3 $210.4 $199.9 $199.1 $203.2 $201.22200 2300 Classified Administrators $4.5 $4.4 $5.3 $3.0 $2.0 $2.02300 2400 Clerical and Office Employees $60.6 $49.8 $49.4 $36.0 $34.9 $35.02400 2200 Maintenance & Operations Employees $98.5 $59.7 $47.0 $49.9 $44.2 $50.22500 2200 Food Service Employees $1.0 $1.1 $1.0 $0.1 $0.0 $0.02600 2200 Transportation Employees $27.9 $30.3 $29.3 $0.6 $0.0 $0.52900 2900 Other Classified Employees $52.7 $53.0 $49.2 $54.8 $47.3 $47.6
$458.5 $408.7 $381.0 $343.5 $331.6 $336.6
3100 3100 State Teachers Retirement System $84.9 $75.8 $65.5 $60.9 $66.1 $71.43200 3200 Public Employees Retirement System $53.9 $42.6 $42.2 $35.9 $34.5 $35.23300 3300 Social Security, Medicare, PARS $49.1 $45.2 $42.1 $36.9 $46.4 $46.53400 3400 Benefits - Employee Health Benefits $217.7 $223.9 $206.7 $190.5 $194.0 $183.73500 3500 Benefits - Unemployment Insurance $11.3 $23.6 $14.3 $1.5 $0.7 $0.63600 3600 Benefits - Workers Compensation $17.9 $27.0 $33.9 $33.9 $50.6 $45.23700 3700 Benefits - Retiree Health Benefits $128.6 $100.8 $95.8 $88.3 $123.3 $99.23800 3800 Benefits - PERS Recapture $4.7 $3.9 $2.5 $0.0 $0.0 $0.03900 3900 Benefits - General $0.0 $0.0 $0.0 $0.0 $0.0 $0.0
$568.1 $542.8 $502.8 $447.8 $515.6 $481.9
4100 4100 Textbooks $17.2 $19.3 $21.3 $27.9 $19.0 $19.04200 4200 Other Books $12.4 $0.3 $0.2 $0.4 $0.4 $0.54300 4300 Instructional Materials $73.6 $35.4 $31.7 $35.7 $311.2 $240.34400 4400 Non-Capitalized Equipment $44.8 $32.6 $13.0 $13.1 $4.6 $6.24500 4300 General Supplies $58.1 $48.8 $30.1 $29.7 $50.5 $76.14600 4300 Pupil Transportation Supplies $4.1 $5.7 $2.0 $0.2 $0.0 $0.24700 4700 Food Services Supplies $0.2 $0.9 $0.5 $0.0 $0.3 $0.3
$210.4 $142.9 $98.8 $106.9 $386.0 $342.6
SUPERINTENDENT'S 2014-15 FINAL BUDGET
OPERATING FUNDGeneral Fund - Restricted Programs
Expenditures by Sub-Object
Amounts in $ millions
Total Certificated Salaries
Total Classified Salaries
Total Employee Benefits
Total Books and Supplies
Books and Supplies
Employee Benefits
Classified Salaries
Certificated Salaries
70

2010-11 Actual
Amounts
2011-12 Actual
Amounts
2012-13 Actual
Amounts
2013-14 3rd Interim
Estimate
2014-15 Authorized
Amounts
2014-15 Estimated Amounts
IFS Object
SACS Object
SUPERINTENDENT'S 2014-15 FINAL BUDGET
OPERATING FUNDGeneral Fund - Restricted Programs
Expenditures by Sub-Object
Amounts in $ millions
5100 5800 Instructional Consultants $86.0 $79.2 $70.9 $22.4 $14.9 $15.05200 5200 Travel & Conference Expenses $5.9 $4.8 $5.5 $5.1 $4.3 $5.05300 5300 Dues and Memberships $0.1 $0.1 $0.1 $0.1 $0.0 $0.05400 5400 Insurance $0.0 $0.0 $0.0 $0.0 $0.0 $0.05500 5500 Utilities & Housekeeping Services $2.4 $0.2 $0.2 $0.1 $0.0 $0.15600 5600 Rentals, Leases & Repairs $14.8 $10.7 $5.3 $4.8 $18.1 $1.25700 5700 Subagreement for Services $88.6 $87.0 $0.0 $0.0 $0.0 $0.05800 5800 Other Services & Operating Expenses $329.8 $319.0 $343.7 $313.3 $309.2 $322.65900 5900 Telephone, Pager & Postage $1.6 $1.0 $0.4 $0.6 $0.7 $0.9
$529.1 $502.0 $426.1 $346.3 $347.1 $344.9
6100 6100 Sites & Improvement of Sites $1.8 $0.2 ($0.1) $0.0 $0.0 $0.06200 6200 Buildings & Improvement of Building $3.8 $4.8 $0.4 $0.2 $30.4 $0.36300 6300 Books & Meida for Libraries $0.0 $0.0 $0.0 $0.0 $0.0 $0.06400 6400 Equipment $50.4 $15.9 $1.0 $5.0 $0.6 $4.96500 6500 Equipment Replacement $3.9 $4.9 $2.1 $0.0 $4.3 $0.0
$59.9 $25.8 $3.4 $5.2 $35.2 $5.2
7200 7200 Other Transfer Out $0.0 $0.0 $0.0 $0.0 $0.0 $0.07300 7300 Interprogram Support Costs $50.7 $99.0 $53.8 $54.7 $84.9 $84.97600 7600 InterfundTransfers $0.9 $0.0 $0.1 $0.0 $0.0 $0.0
$51.6 $99.0 $53.9 $54.7 $84.9 $84.9
$2,964.3 $2,693.1 $2,307.9 $2,077.6 $2,469.1 $2,349.4
Capital Outlay
Total Capital Outlay
Total Expenditures
Other Outgo
Total Other Outgo
Other Operating Expense
Total Operating Expense
71
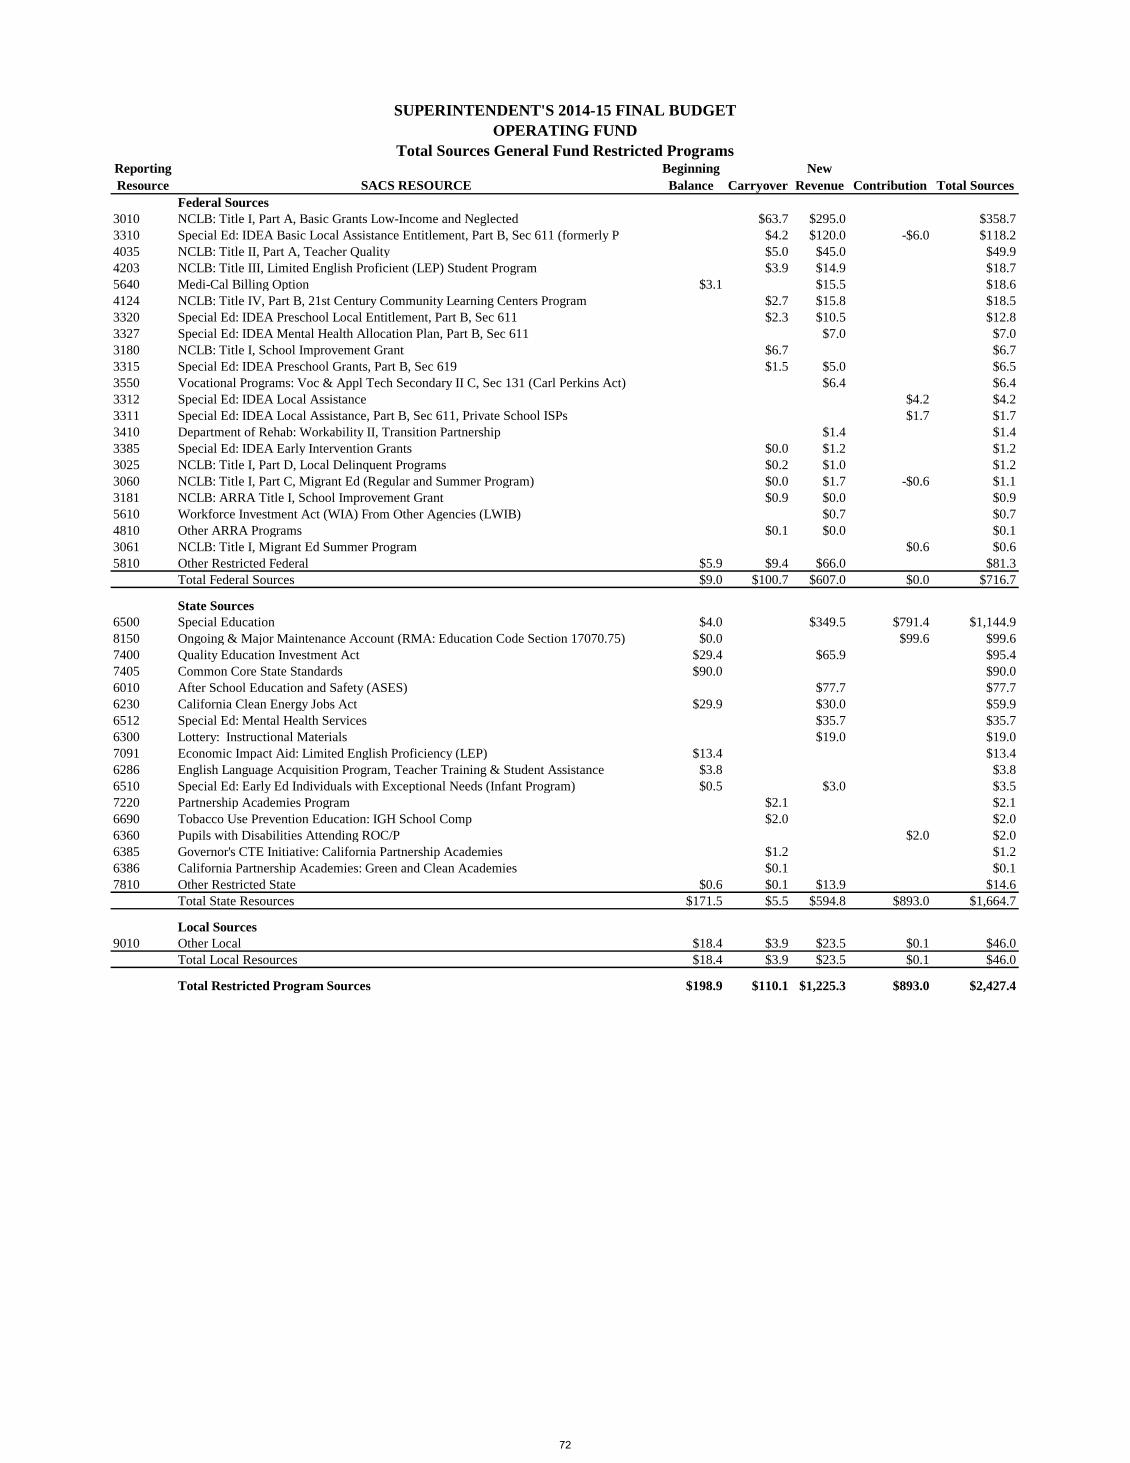
Reporting
Resource SACS RESOURCE
Beginning
Balance Carryover
New
Revenue Contribution Total Sources
Federal Sources
3010 NCLB: Title I, Part A, Basic Grants Low-Income and Neglected $63.7 $295.0 $358.7
3310 Special Ed: IDEA Basic Local Assistance Entitlement, Part B, Sec 611 (formerly P $4.2 $120.0 -$6.0 $118.2
4035 NCLB: Title II, Part A, Teacher Quality $5.0 $45.0 $49.9
4203 NCLB: Title III, Limited English Proficient (LEP) Student Program $3.9 $14.9 $18.7
5640 Medi-Cal Billing Option $3.1 $15.5 $18.6
4124 NCLB: Title IV, Part B, 21st Century Community Learning Centers Program $2.7 $15.8 $18.5
3320 Special Ed: IDEA Preschool Local Entitlement, Part B, Sec 611 $2.3 $10.5 $12.8
3327 Special Ed: IDEA Mental Health Allocation Plan, Part B, Sec 611 $7.0 $7.0
3180 NCLB: Title I, School Improvement Grant $6.7 $6.7
3315 Special Ed: IDEA Preschool Grants, Part B, Sec 619 $1.5 $5.0 $6.5
3550 Vocational Programs: Voc & Appl Tech Secondary II C, Sec 131 (Carl Perkins Act) $6.4 $6.4
3312 Special Ed: IDEA Local Assistance $4.2 $4.2
3311 Special Ed: IDEA Local Assistance, Part B, Sec 611, Private School ISPs $1.7 $1.7
3410 Department of Rehab: Workability II, Transition Partnership $1.4 $1.4
3385 Special Ed: IDEA Early Intervention Grants $0.0 $1.2 $1.2
3025 NCLB: Title I, Part D, Local Delinquent Programs $0.2 $1.0 $1.2
3060 NCLB: Title I, Part C, Migrant Ed (Regular and Summer Program) $0.0 $1.7 -$0.6 $1.1
3181 NCLB: ARRA Title I, School Improvement Grant $0.9 $0.0 $0.9
5610 Workforce Investment Act (WIA) From Other Agencies (LWIB) $0.7 $0.7
4810 Other ARRA Programs $0.1 $0.0 $0.1
3061 NCLB: Title I, Migrant Ed Summer Program $0.6 $0.6
5810 Other Restricted Federal $5.9 $9.4 $66.0 $81.3
Total Federal Sources $9.0 $100.7 $607.0 $0.0 $716.7
State Sources
6500 Special Education $4.0 $349.5 $791.4 $1,144.9
8150 Ongoing & Major Maintenance Account (RMA: Education Code Section 17070.75) $0.0 $99.6 $99.6
7400 Quality Education Investment Act $29.4 $65.9 $95.4
7405 Common Core State Standards $90.0 $90.0
6010 After School Education and Safety (ASES) $77.7 $77.7
6230 California Clean Energy Jobs Act $29.9 $30.0 $59.9
6512 Special Ed: Mental Health Services $35.7 $35.7
6300 Lottery: Instructional Materials $19.0 $19.0
7091 Economic Impact Aid: Limited English Proficiency (LEP) $13.4 $13.4
6286 English Language Acquisition Program, Teacher Training & Student Assistance $3.8 $3.8
6510 Special Ed: Early Ed Individuals with Exceptional Needs (Infant Program) $0.5 $3.0 $3.5
7220 Partnership Academies Program $2.1 $2.1
6690 Tobacco Use Prevention Education: IGH School Comp $2.0 $2.0
6360 Pupils with Disabilities Attending ROC/P $2.0 $2.0
6385 Governor's CTE Initiative: California Partnership Academies $1.2 $1.2
6386 California Partnership Academies: Green and Clean Academies $0.1 $0.1
7810 Other Restricted State $0.6 $0.1 $13.9 $14.6
Total State Resources $171.5 $5.5 $594.8 $893.0 $1,664.7
Local Sources
9010 Other Local $18.4 $3.9 $23.5 $0.1 $46.0
Total Local Resources $18.4 $3.9 $23.5 $0.1 $46.0
Total Restricted Program Sources $198.9 $110.1 $1,225.3 $893.0 $2,427.4
Total Sources General Fund Restricted Programs
OPERATING FUND
SUPERINTENDENT'S 2014-15 FINAL BUDGET
72

2010-11
Actual
Amounts
2011-12
Actual
Amounts
2012-13
Actual
Amounts
2013-14
3rd Interim
Estimate
2014-15
Authorized
Amounts
2014-15
Estimated
Amounts
Beginning Balance
$6.8 $14.2 $9.5 $3.6 $4.5 $4.5
Total Beginning Balance $6.8 $14.2 $9.5 $3.6 $4.5 $4.5
Revenue
$147.5 $144.2 $142.0 $0.0 $0.0 $0.0
$153.6 $154.6 $96.5 $112.1 $113.4 $113.4
$423.6 $399.5 $396.6 $350.7 $342.7 $342.7
$0.2 $0.4 $0.3 $0.1 $0.3 $0.3
$48.6 $51.2 $56.7 $58.4 $63.1 $63.1
$582.2 $605.5 $599.9 $805.6 $816.8 $770.6
$13.9 $13.9 $10.6 $11.5 $12.1 $12.1
$22.2 $25.0 $0.0 $0.0 $71.2 $71.2
Total Revenue $1,391.6 $1,394.2 $1,302.6 $1,338.3 $1,419.6 $1,373.3
Total Sources of Funds $1,398.4 $1,408.4 $1,312.1 $1,341.9 $1,424.0 $1,377.8
Expenditure
$425.3 $424.5 $434.7 $449.6 $476.2 $452.1
$234.9 $229.2 $221.5 $219.7 $222.7 $221.2
$299.3 $310.7 $320.7 $316.8 $360.0 $325.7
$29.7 $24.1 $19.0 $25.1 $24.2 $22.1
$322.0 $300.9 $224.9 $232.6 $221.0 $236.4
$48.6 $51.2 $56.7 $58.4 $63.1 $63.1
$0.3 $0.8 $0.1 $0.4 $0.1 $0.4
$24.2 $57.5 $30.9 $34.8 $56.7 $56.7
Total Expenditure $1,384.2 $1,398.9 $1,308.5 $1,337.5 $1,424.0 $1,377.8
Ending Balance
$14.2 $9.5 $3.6 $4.5 $0.0 $0.0
Total Ending Balance $14.2 $9.5 $3.6 $4.5 $0.0 $0.0
Total Uses of Funds $1,398.4 $1,408.4 $1,312.1 $1,341.9 $1,424.0 $1,377.8
Regular Program
SUPERINTENDENT'S 2014-15 FINAL BUDGET
OPERATING FUND
General Fund - Restricted Program
Special Education (D)This program ensures the provision of programs, services, and supports for students with disabilities, as determined by their
Individualized Education Program (IEP) and in accordance with State and Federal regulations. This program is within the General
Fund Restricted Programs. With the implementation of LCFF, the Transportation portion have been classfied Unrestricted General
Fund.
Amounts in $ millions
Sources of Funds
Restricted Beginning Balances
Revenue Limit Revenues/LCFF
Federal Revenues
State Revenues
Local Revenues
SELPA Charter Schools Revenue
Contribution-Unrestricted Programs
Contribution-Fair Share
Contribution-Transportation Programs (LCFF)
Uses of Funds
Certificated Salaries
Classified Salaries
Employee Benefits
Books and Supplies
Other Operating Expenses
SELPA Charter School Expenditures
Capital Outlay
Other Outgo
Restricted Ending Balances
Unassigned Ending Balances
73

Other Funds
74
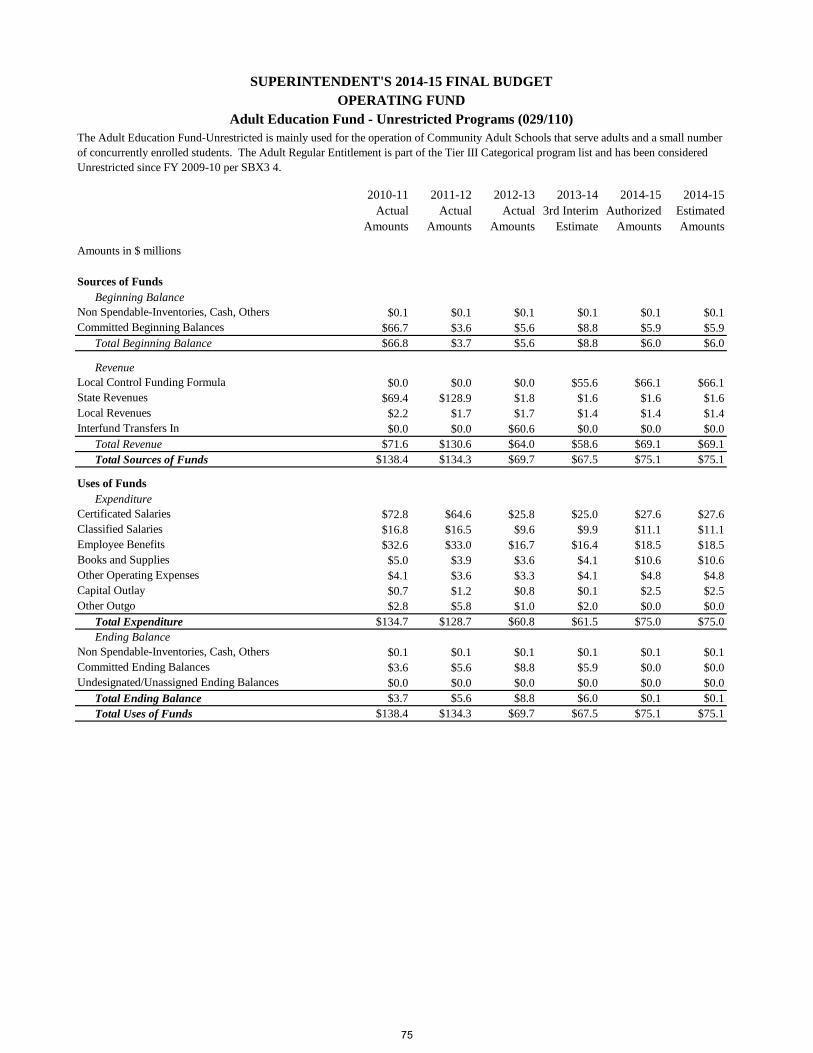
2010-11
Actual
Amounts
2011-12
Actual
Amounts
2012-13
Actual
Amounts
2013-14
3rd Interim
Estimate
2014-15
Authorized
Amounts
2014-15
Estimated
Amounts
Beginning Balance
$0.1 $0.1 $0.1 $0.1 $0.1 $0.1
$66.7 $3.6 $5.6 $8.8 $5.9 $5.9
Total Beginning Balance $66.8 $3.7 $5.6 $8.8 $6.0 $6.0
Revenue
$0.0 $0.0 $0.0 $55.6 $66.1 $66.1
$69.4 $128.9 $1.8 $1.6 $1.6 $1.6
$2.2 $1.7 $1.7 $1.4 $1.4 $1.4
$0.0 $0.0 $60.6 $0.0 $0.0 $0.0
Total Revenue $71.6 $130.6 $64.0 $58.6 $69.1 $69.1
Total Sources of Funds $138.4 $134.3 $69.7 $67.5 $75.1 $75.1
Expenditure
$72.8 $64.6 $25.8 $25.0 $27.6 $27.6
$16.8 $16.5 $9.6 $9.9 $11.1 $11.1
$32.6 $33.0 $16.7 $16.4 $18.5 $18.5
$5.0 $3.9 $3.6 $4.1 $10.6 $10.6
$4.1 $3.6 $3.3 $4.1 $4.8 $4.8
$0.7 $1.2 $0.8 $0.1 $2.5 $2.5
$2.8 $5.8 $1.0 $2.0 $0.0 $0.0
Total Expenditure $134.7 $128.7 $60.8 $61.5 $75.0 $75.0
Ending Balance
$0.1 $0.1 $0.1 $0.1 $0.1 $0.1
$3.6 $5.6 $8.8 $5.9 $0.0 $0.0
$0.0 $0.0 $0.0 $0.0 $0.0 $0.0
Total Ending Balance $3.7 $5.6 $8.8 $6.0 $0.1 $0.1
Total Uses of Funds $138.4 $134.3 $69.7 $67.5 $75.1 $75.1
State Revenues
Local Revenues
Interfund Transfers In
Amounts in $ millions
Sources of Funds
Non Spendable-Inventories, Cash, Others
Committed Beginning Balances
SUPERINTENDENT'S 2014-15 FINAL BUDGET
OPERATING FUND
Adult Education Fund - Unrestricted Programs (029/110)
The Adult Education Fund-Unrestricted is mainly used for the operation of Community Adult Schools that serve adults and a small number
of concurrently enrolled students. The Adult Regular Entitlement is part of the Tier III Categorical program list and has been considered
Unrestricted since FY 2009-10 per SBX3 4.
Committed Ending Balances
Undesignated/Unassigned Ending Balances
Other Operating Expenses
Capital Outlay
Other Outgo
Non Spendable-Inventories, Cash, Others
Uses of Funds
Certificated Salaries
Classified Salaries
Employee Benefits
Books and Supplies
Local Control Funding Formula
75
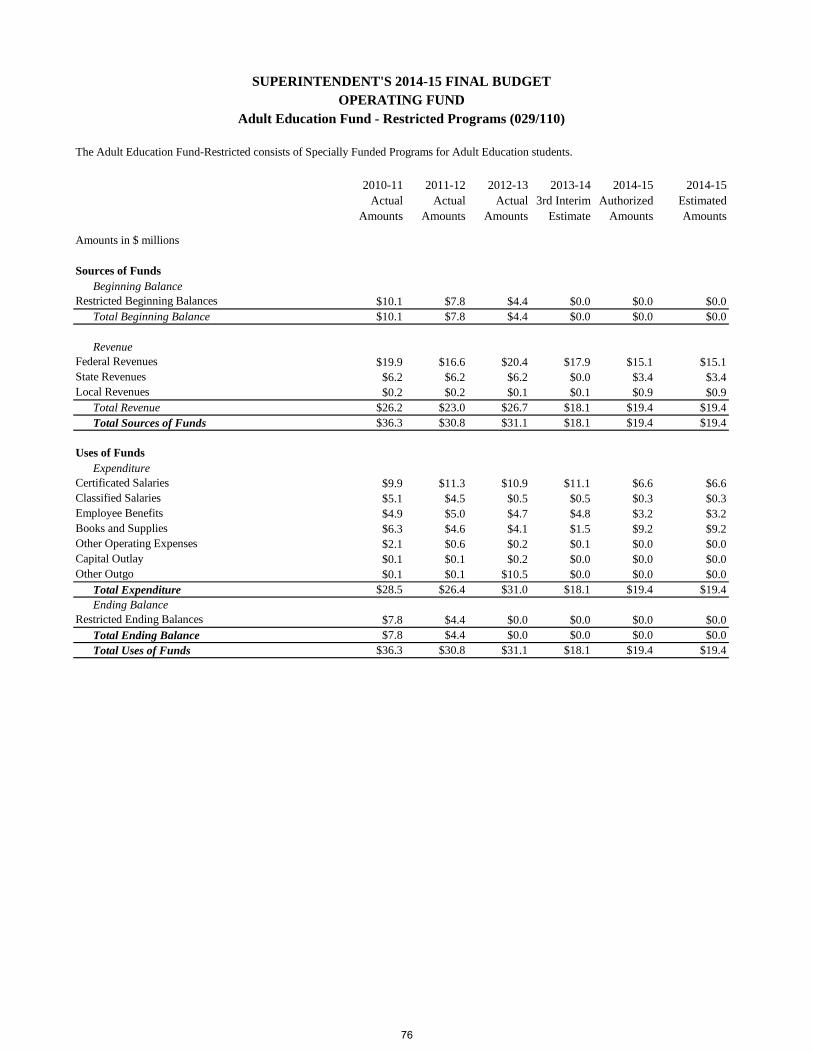
2010-11
Actual
Amounts
2011-12
Actual
Amounts
2012-13
Actual
Amounts
2013-14
3rd Interim
Estimate
2014-15
Authorized
Amounts
2014-15
Estimated
Amounts
Beginning Balance
$10.1 $7.8 $4.4 $0.0 $0.0 $0.0
Total Beginning Balance $10.1 $7.8 $4.4 $0.0 $0.0 $0.0
Revenue
$19.9 $16.6 $20.4 $17.9 $15.1 $15.1
$6.2 $6.2 $6.2 $0.0 $3.4 $3.4
$0.2 $0.2 $0.1 $0.1 $0.9 $0.9
Total Revenue $26.2 $23.0 $26.7 $18.1 $19.4 $19.4
Total Sources of Funds $36.3 $30.8 $31.1 $18.1 $19.4 $19.4
Expenditure
$9.9 $11.3 $10.9 $11.1 $6.6 $6.6
$5.1 $4.5 $0.5 $0.5 $0.3 $0.3
$4.9 $5.0 $4.7 $4.8 $3.2 $3.2
$6.3 $4.6 $4.1 $1.5 $9.2 $9.2
$2.1 $0.6 $0.2 $0.1 $0.0 $0.0
$0.1 $0.1 $0.2 $0.0 $0.0 $0.0
$0.1 $0.1 $10.5 $0.0 $0.0 $0.0
Total Expenditure $28.5 $26.4 $31.0 $18.1 $19.4 $19.4
Ending Balance
$7.8 $4.4 $0.0 $0.0 $0.0 $0.0
Total Ending Balance $7.8 $4.4 $0.0 $0.0 $0.0 $0.0
Total Uses of Funds $36.3 $30.8 $31.1 $18.1 $19.4 $19.4
State Revenues
Local Revenues
Uses of Funds
Certificated Salaries
Classified Salaries
Amounts in $ millions
Sources of Funds
Restricted Beginning Balances
Federal Revenues
SUPERINTENDENT'S 2014-15 FINAL BUDGET
OPERATING FUND
Adult Education Fund - Restricted Programs (029/110)
The Adult Education Fund-Restricted consists of Specially Funded Programs for Adult Education students.
Restricted Ending Balances
Employee Benefits
Books and Supplies
Other Operating Expenses
Capital Outlay
Other Outgo
76

2010-11
Actual
Amounts
2011-12
Actual
Amounts
2012-13
Actual
Amounts
2013-14
3rd
Interim
Estimate
2014-15
Authorized
Amounts
2014-15
Estimated
Amounts
Beginning Balance
$0.0 $0.1 $0.1 $0.1 $0.6 $0.6
Audit Adjustments $0.0 $0.0 $0.0 $0.6 $0.0 $0.0
Total Beginning Balance $0.1 $0.1 $0.1 $0.7 $0.6 $0.6
Revenue
$59.6 $35.7 $24.6 $25.8 $26.0 $26.0
$59.6 $71.5 $67.6 $66.4 $68.2 $68.2
$2.9 $2.9 $2.6 $3.2 $3.0 $3.0
$8.0 $19.4 $15.3 $28.8 $40.7 $40.7
Total Revenue $130.2 $129.6 $110.1 $124.1 $137.9 $137.9
Total Sources of Funds $130.2 $129.7 $110.2 $124.8 $138.5 $138.5
Expenditure
$44.1 $40.9 $34.0 $34.8 $35.6 $35.6
$42.7 $40.0 $34.7 $42.7 $44.1 $44.1
$38.4 $38.3 $34.1 $38.4 $43.9 $43.9
$1.8 $1.5 $1.7 $1.6 $4.4 $4.4
$3.1 $2.4 $2.4 $2.7 $3.2 $3.2
$0.0 $0.0 $0.0 $0.0 $0.0 $0.0
$0.0 $6.5 $3.2 $4.1 $7.3 $7.3
Total Expenditure $130.1 $129.6 $110.1 $124.2 $138.5 $138.5
Ending Balance
$0.1 $0.1 $0.1 $0.6 $0.0 $0.0
Total Ending Balance $0.1 $0.1 $0.1 $0.6 $0.0 $0.0
Total Uses of Funds $130.2 $129.7 $110.2 $124.8 $138.5 $138.5
Federal Revenues
State Revenues
Local Revenues
Interfund Transfers In
Amounts in $ millions
Sources of Funds
Restricted Beginning Balances
SUPERINTENDENT'S 2014-15 FINAL BUDGET
OPERATING FUND
Child Development Fund - Unrestricted Program (011/120)
Child Development Fund provides half day and full day programs. Fees are based on each family's ability to pay.
Uses of Funds
Certificated Salaries
Classified Salaries
Employee Benefits
Books and Supplies
Other Operating Expenses
Capital Outlay
Other Outgo
Restricted Ending Balances
77

2010-11
Actual
Amounts
2011-12
Actual
Amounts
2012-13
Actual
Amounts
2013-14
3rd Interim
Estimate
2014-15
Authorized
Amounts
2014-15
Estimated
Amounts
Revenue
$4.5 $0.1 $0.0 $0.0 $0.1 $0.1
$0.4 $0.7 $0.7 $0.0 $1.0 $1.0
$10.1 $2.8 $2.5 $3.3 $5.5 $5.5
$0.0 $0.0 $0.0 $0.0 $0.0 $0.0
$0.0 $0.0 $0.0 $0.0 $0.0 $0.0
Total Revenue $15.0 $3.6 $3.2 $3.3 $6.6 $6.6
Total Sources of Funds $15.0 $3.6 $3.2 $3.3 $6.6 $6.6
Expenditure
$5.6 $0.9 $1.4 $1.8 $1.4 $1.4
$2.1 $1.1 $0.5 $0.2 $0.2 $0.2
$2.4 $0.8 $0.8 $0.7 $0.6 $0.6
$1.7 $0.4 $0.4 $0.4 $4.1 $4.1
$2.4 $0.1 $0.0 $0.1 $0.1 $0.1
$0.3 $0.0 $0.0 $0.0 $0.0 $0.0
$0.3 $0.2 $0.1 $0.1 $0.1 $0.1
Total Expenditure $15.0 $3.6 $3.2 $3.3 $6.6 $6.6
Total Uses of Funds $15.0 $3.6 $3.2 $3.3 $6.6 $6.6
Amounts in $ millions
Sources of Funds
Federal Revenues
State Revenues
SUPERINTENDENT'S 2014-15 FINAL BUDGET
OPERATING FUND
Child Development Fund - Restricted Program (011/120)
Child Development Fund are Specially Funded programs for pre-school children.
Uses of Funds
Certificated Salaries
Classified Salaries
Local Revenues
Interprogram Transfers
Other Financing Sources
Employee Benefits
Books and Supplies
Other Operating Expenses
Capital Outlay
Other Outgo
78
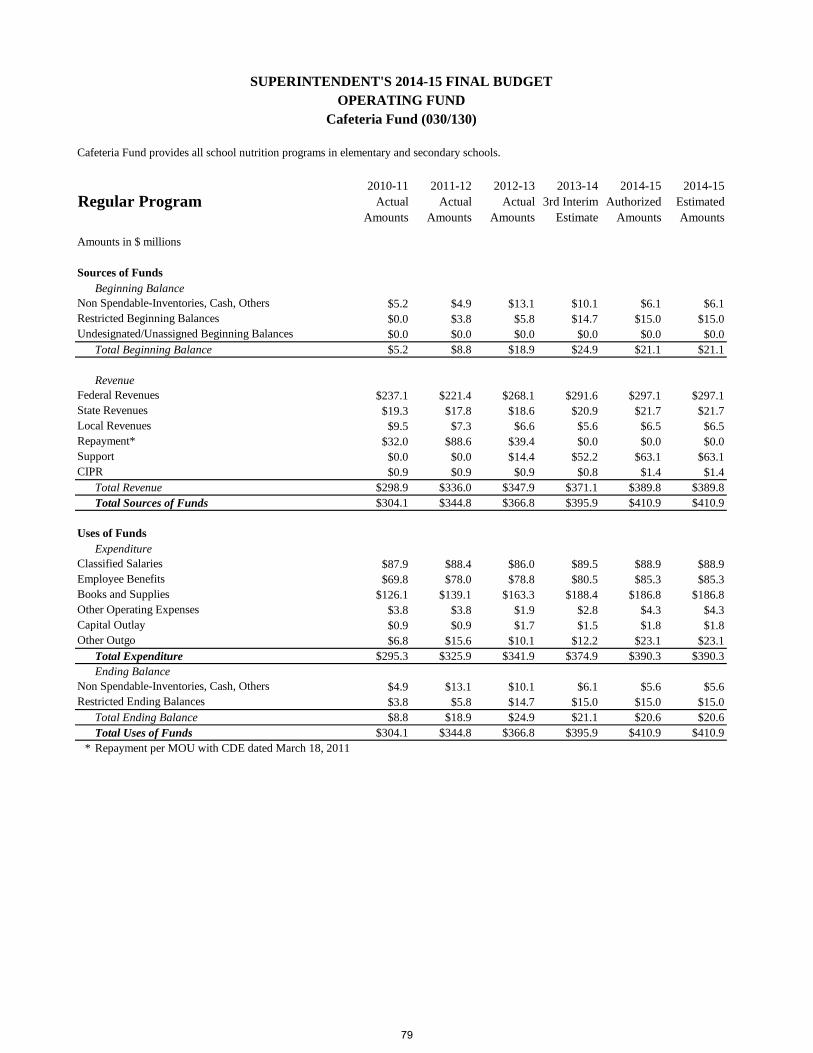
2010-11
Actual
Amounts
2011-12
Actual
Amounts
2012-13
Actual
Amounts
2013-14
3rd Interim
Estimate
2014-15
Authorized
Amounts
2014-15
Estimated
Amounts
Beginning Balance
$5.2 $4.9 $13.1 $10.1 $6.1 $6.1
$0.0 $3.8 $5.8 $14.7 $15.0 $15.0
$0.0 $0.0 $0.0 $0.0 $0.0 $0.0
Total Beginning Balance $5.2 $8.8 $18.9 $24.9 $21.1 $21.1
Revenue
$237.1 $221.4 $268.1 $291.6 $297.1 $297.1
$19.3 $17.8 $18.6 $20.9 $21.7 $21.7
$9.5 $7.3 $6.6 $5.6 $6.5 $6.5
$32.0 $88.6 $39.4 $0.0 $0.0 $0.0
$0.0 $0.0 $14.4 $52.2 $63.1 $63.1
$0.9 $0.9 $0.9 $0.8 $1.4 $1.4
Total Revenue $298.9 $336.0 $347.9 $371.1 $389.8 $389.8
Total Sources of Funds $304.1 $344.8 $366.8 $395.9 $410.9 $410.9
Expenditure
$87.9 $88.4 $86.0 $89.5 $88.9 $88.9
$69.8 $78.0 $78.8 $80.5 $85.3 $85.3
$126.1 $139.1 $163.3 $188.4 $186.8 $186.8
$3.8 $3.8 $1.9 $2.8 $4.3 $4.3
$0.9 $0.9 $1.7 $1.5 $1.8 $1.8
$6.8 $15.6 $10.1 $12.2 $23.1 $23.1
Total Expenditure $295.3 $325.9 $341.9 $374.9 $390.3 $390.3
Ending Balance
$4.9 $13.1 $10.1 $6.1 $5.6 $5.6
$3.8 $5.8 $14.7 $15.0 $15.0 $15.0
Total Ending Balance $8.8 $18.9 $24.9 $21.1 $20.6 $20.6
Total Uses of Funds $304.1 $344.8 $366.8 $395.9 $410.9 $410.9
* Repayment per MOU with CDE dated March 18, 2011
Federal Revenues
State Revenues
Local Revenues
Repayment*
Support
Amounts in $ millions
Sources of Funds
Non Spendable-Inventories, Cash, Others
Restricted Beginning Balances
Undesignated/Unassigned Beginning Balances
Regular Program
SUPERINTENDENT'S 2014-15 FINAL BUDGET
OPERATING FUND
Cafeteria Fund (030/130)
Cafeteria Fund provides all school nutrition programs in elementary and secondary schools.
CIPR
Uses of Funds
Other Outgo
Non Spendable-Inventories, Cash, Others
Restricted Ending Balances
Classified Salaries
Employee Benefits
Books and Supplies
Other Operating Expenses
Capital Outlay
79
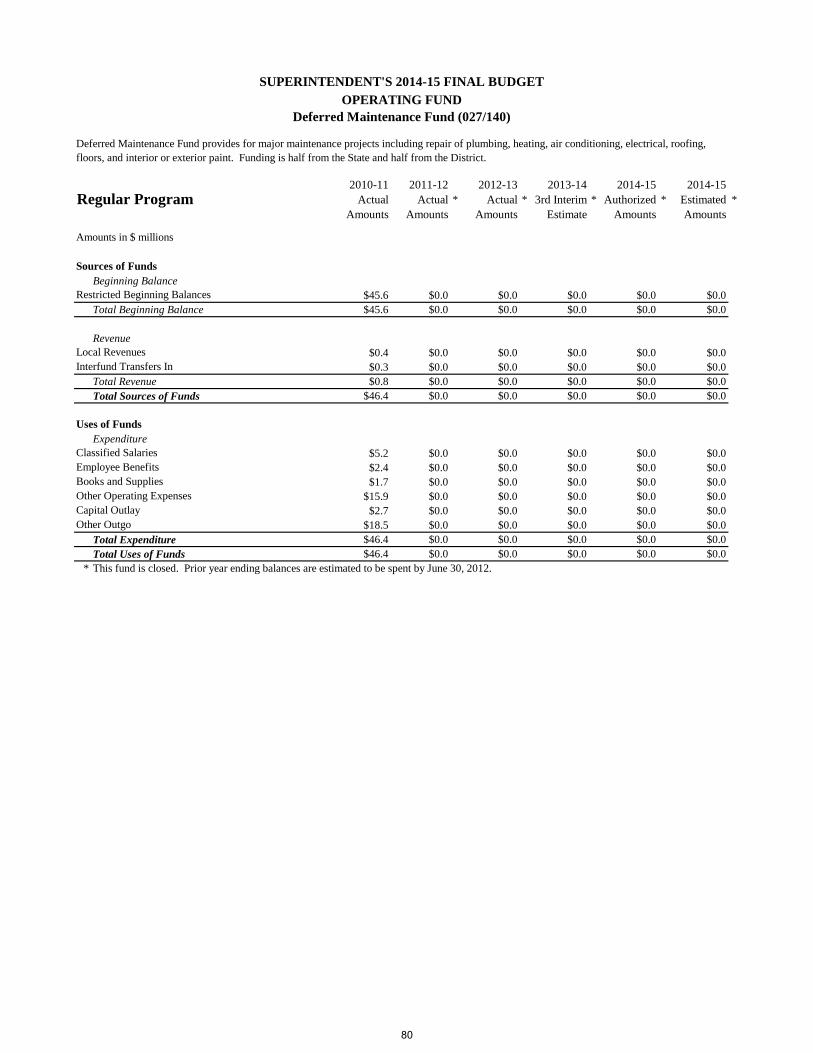
2010-11
Actual
Amounts
2011-12
Actual
Amounts
*
2012-13
Actual
Amounts
*
2013-14
3rd Interim
Estimate
*
2014-15
Authorized
Amounts
*
2014-15
Estimated
Amounts
*
Beginning Balance
$45.6 $0.0 $0.0 $0.0 $0.0 $0.0
Total Beginning Balance $45.6 $0.0 $0.0 $0.0 $0.0 $0.0
Revenue
$0.4 $0.0 $0.0 $0.0 $0.0 $0.0
$0.3 $0.0 $0.0 $0.0 $0.0 $0.0
Total Revenue $0.8 $0.0 $0.0 $0.0 $0.0 $0.0
Total Sources of Funds $46.4 $0.0 $0.0 $0.0 $0.0 $0.0
Expenditure
$5.2 $0.0 $0.0 $0.0 $0.0 $0.0
$2.4 $0.0 $0.0 $0.0 $0.0 $0.0
$1.7 $0.0 $0.0 $0.0 $0.0 $0.0
$15.9 $0.0 $0.0 $0.0 $0.0 $0.0
$2.7 $0.0 $0.0 $0.0 $0.0 $0.0
$18.5 $0.0 $0.0 $0.0 $0.0 $0.0
Total Expenditure $46.4 $0.0 $0.0 $0.0 $0.0 $0.0
Total Uses of Funds $46.4 $0.0 $0.0 $0.0 $0.0 $0.0
* This fund is closed. Prior year ending balances are estimated to be spent by June 30, 2012.
Local Revenues
Interfund Transfers In
Uses of Funds
Classified Salaries
Amounts in $ millions
Sources of Funds
Restricted Beginning Balances
Regular Program
SUPERINTENDENT'S 2014-15 FINAL BUDGET
OPERATING FUND
Deferred Maintenance Fund (027/140)
Deferred Maintenance Fund provides for major maintenance projects including repair of plumbing, heating, air conditioning, electrical, roofing,
floors, and interior or exterior paint. Funding is half from the State and half from the District.
Employee Benefits
Books and Supplies
Other Operating Expenses
Capital Outlay
Other Outgo
80

2010-11
Actual
Amounts
2011-12
Actual
Amounts
2012-13
Actual
Amounts
2013-14
3rd Interim
Estimate
2014-15
Authorized
Amounts
2014-15
Estimated
Amounts
Beginning Balance
$0.3 $0.3 $0.3 $0.3 $0.3 $0.3
$880.1 $741.9 $967.9 $784.3 $482.2 $482.2
$0.0 $10.1 $0.0 -$2.3 $0.0 $0.0
Total Beginning Balance $880.4 $752.3 $968.2 $782.3 $482.5 $482.5
Revenue
$10.8 $17.8 $10.4 $8.2 $4.4 $4.4
$106.2 $514.2 $60.6 $0.0 $0.0 $0.0
$0.0 $0.0 $0.0 $0.0 $235.2 $235.2
Total Revenue $117.0 $532.0 $71.0 $8.2 $239.6 $239.6
Total Sources of Funds $997.4 $1,284.2 $1,039.2 $790.5 $722.1 $722.1
Expenditure
$22.2 $34.3 $38.8 $24.4 $33.1 $33.1
$10.0 $15.0 $18.6 $10.6 $13.4 $13.4
$1.4 $3.4 $2.2 $81.7 $0.1 $0.1
$24.6 $27.4 $18.8 $92.1 $0.1 $0.1
$187.3 $208.9 $142.3 $99.3 $675.1 $305.1
$9.7 $27.1 $33.9 $0.0 $0.0 $0.0
Total Expenditure $255.2 $316.0 $254.6 $308.0 $721.8 $351.8
Ending Balance
$0.3 $0.3 $0.3 $0.3 $0.3 $0.3
$741.9 $967.9 $784.3 $482.2 $0.0 $370.0
Total Ending Balance $742.2 $968.2 $784.6 $482.5 $0.3 $370.3
Total Uses of Funds $997.4 $1,284.2 $1,039.2 $790.5 $722.1 $722.1
Amounts in $ millions
Sources of Funds
Regular Program
SUPERINTENDENT'S 2014-15 FINAL BUDGET
CAPITAL FUND
Building Fund - Measure R (043/210)
Measure R was a local bond measure approved by voters in March 2004. The total value of the bond was $ 3,350 million. This fund is
used for new school construction and repairs to existing schools. Most projects also receive matching State funds.
Non Spendable-Inventories, Cash, Others
Restricted Beginning Balances
Audit Adjustments
Local Revenues
Interfund Transfers In
Other Financing Sources
Uses of Funds
Classified Salaries
Employee Benefits
Restricted Ending Balances
Books and Supplies
Other Operating Expenses
Capital Outlay
Other Outgo
Non Spendable-Inventories, Cash, Others
81
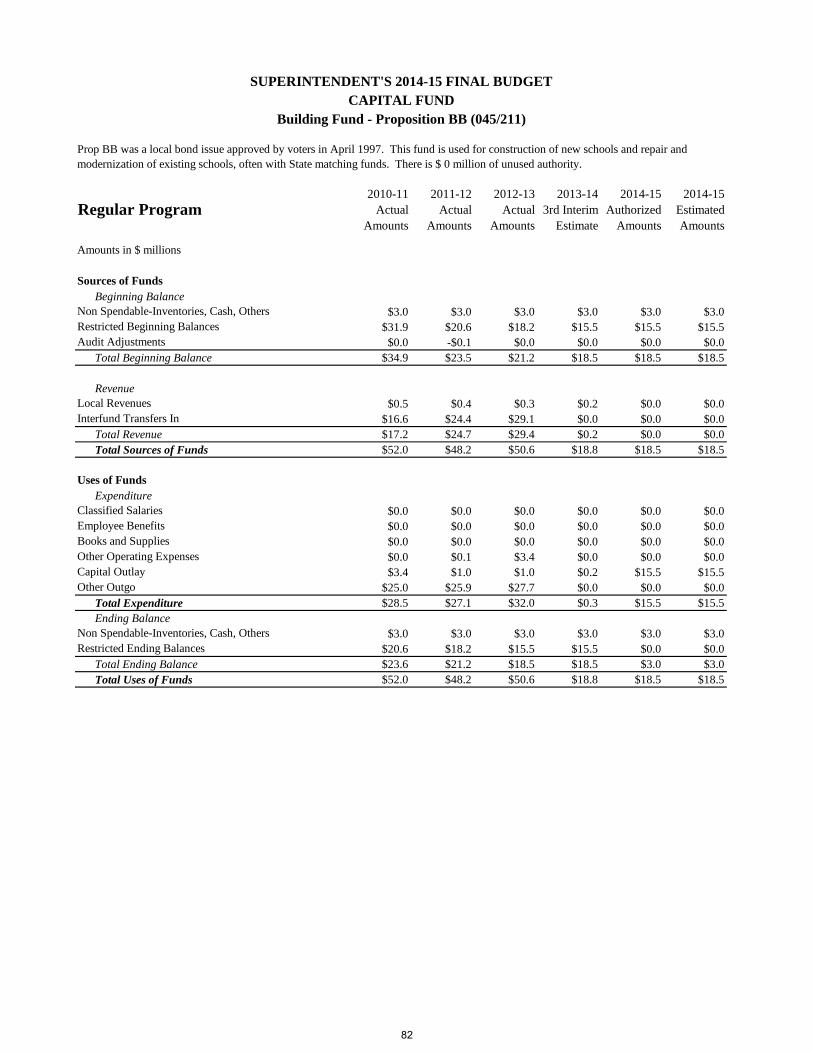
2010-11
Actual
Amounts
2011-12
Actual
Amounts
2012-13
Actual
Amounts
2013-14
3rd Interim
Estimate
2014-15
Authorized
Amounts
2014-15
Estimated
Amounts
Beginning Balance
$3.0 $3.0 $3.0 $3.0 $3.0 $3.0
$31.9 $20.6 $18.2 $15.5 $15.5 $15.5
$0.0 -$0.1 $0.0 $0.0 $0.0 $0.0
Total Beginning Balance $34.9 $23.5 $21.2 $18.5 $18.5 $18.5
Revenue
$0.5 $0.4 $0.3 $0.2 $0.0 $0.0
$16.6 $24.4 $29.1 $0.0 $0.0 $0.0
Total Revenue $17.2 $24.7 $29.4 $0.2 $0.0 $0.0
Total Sources of Funds $52.0 $48.2 $50.6 $18.8 $18.5 $18.5
Expenditure
$0.0 $0.0 $0.0 $0.0 $0.0 $0.0
$0.0 $0.0 $0.0 $0.0 $0.0 $0.0
$0.0 $0.0 $0.0 $0.0 $0.0 $0.0
$0.0 $0.1 $3.4 $0.0 $0.0 $0.0
$3.4 $1.0 $1.0 $0.2 $15.5 $15.5
$25.0 $25.9 $27.7 $0.0 $0.0 $0.0
Total Expenditure $28.5 $27.1 $32.0 $0.3 $15.5 $15.5
Ending Balance
$3.0 $3.0 $3.0 $3.0 $3.0 $3.0
$20.6 $18.2 $15.5 $15.5 $0.0 $0.0
Total Ending Balance $23.6 $21.2 $18.5 $18.5 $3.0 $3.0
Total Uses of Funds $52.0 $48.2 $50.6 $18.8 $18.5 $18.5
Amounts in $ millions
Sources of Funds
Regular Program
SUPERINTENDENT'S 2014-15 FINAL BUDGET
CAPITAL FUND
Building Fund - Proposition BB (045/211)
Prop BB was a local bond issue approved by voters in April 1997. This fund is used for construction of new schools and repair and
modernization of existing schools, often with State matching funds. There is $ 0 million of unused authority.
Non Spendable-Inventories, Cash, Others
Restricted Beginning Balances
Audit Adjustments
Local Revenues
Interfund Transfers In
Capital Outlay
Other Outgo
Non Spendable-Inventories, Cash, Others
Restricted Ending Balances
Uses of Funds
Classified Salaries
Employee Benefits
Books and Supplies
Other Operating Expenses
82

2010-11
Actual
Amounts
2011-12
Actual
Amounts
2012-13
Actual
Amounts
2013-14
3rd Interim
Estimate
2014-15
Authorized
Amounts
2014-15
Estimated
Amounts
Beginning Balance
$2.0 $2.0 $1.4 $3.5 $4.1 $4.1
$0.0 -$0.2 $0.0 $0.0 $0.0 $0.0
Total Beginning Balance $2.0 $1.8 $1.4 $3.5 $4.1 $4.1
Revenue
$0.3 $0.4 $2.1 $0.6 $0.8 $0.8
$0.0 $0.0 $0.0 $0.1 $0.0 $0.0
Total Revenue $0.3 $0.4 $2.1 $0.7 $0.8 $0.8
Total Sources of Funds $2.3 $2.1 $3.5 $4.2 $4.9 $4.9
Expenditure
$0.0 $0.3 $0.0 $0.0 $0.0 $0.0
$0.3 $0.4 $0.0 $0.0 $4.9 $4.9
$0.0 $0.0 $0.0 $0.0 $0.0 $0.0
Total Expenditure $0.3 $0.7 $0.0 $0.1 $4.9 $4.9
Ending Balance
$2.0 $1.4 $3.5 $4.1 $0.0 $0.0
Total Ending Balance $2.0 $1.4 $3.5 $4.1 $0.0 $0.0
Total Uses of Funds $2.3 $2.1 $3.5 $4.2 $4.9 $4.9
Other Operating Expenses
Capital Outlay
Other Outgo
Restricted Ending Balances
Regular Program
SUPERINTENDENT'S 2014-15 FINAL BUDGET
CAPITAL FUND
Building Fund (070/212)
The Building Fund is used to account for proceeds from the sale of bonds, state allowances, and other resources designated for facility
expansion.
Uses of Funds
Amounts in $ millions
Sources of Funds
Restricted Beginning Balances
Audit Adjustments
Interfund Transfers In
Local Revenues
83
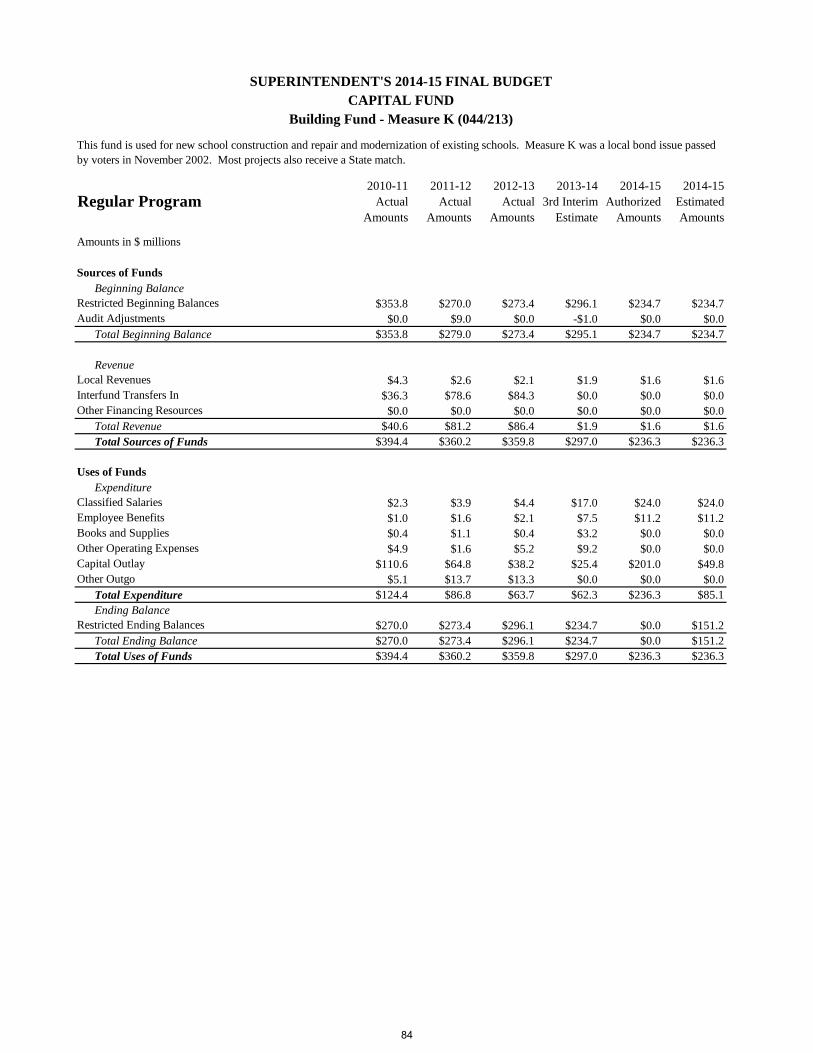
2010-11
Actual
Amounts
2011-12
Actual
Amounts
2012-13
Actual
Amounts
2013-14
3rd Interim
Estimate
2014-15
Authorized
Amounts
2014-15
Estimated
Amounts
Beginning Balance
$353.8 $270.0 $273.4 $296.1 $234.7 $234.7
$0.0 $9.0 $0.0 -$1.0 $0.0 $0.0
Total Beginning Balance $353.8 $279.0 $273.4 $295.1 $234.7 $234.7
Revenue
$4.3 $2.6 $2.1 $1.9 $1.6 $1.6
$36.3 $78.6 $84.3 $0.0 $0.0 $0.0
$0.0 $0.0 $0.0 $0.0 $0.0 $0.0
Total Revenue $40.6 $81.2 $86.4 $1.9 $1.6 $1.6
Total Sources of Funds $394.4 $360.2 $359.8 $297.0 $236.3 $236.3
Expenditure
$2.3 $3.9 $4.4 $17.0 $24.0 $24.0
$1.0 $1.6 $2.1 $7.5 $11.2 $11.2
$0.4 $1.1 $0.4 $3.2 $0.0 $0.0
$4.9 $1.6 $5.2 $9.2 $0.0 $0.0
$110.6 $64.8 $38.2 $25.4 $201.0 $49.8
$5.1 $13.7 $13.3 $0.0 $0.0 $0.0
Total Expenditure $124.4 $86.8 $63.7 $62.3 $236.3 $85.1
Ending Balance
$270.0 $273.4 $296.1 $234.7 $0.0 $151.2
Total Ending Balance $270.0 $273.4 $296.1 $234.7 $0.0 $151.2
Total Uses of Funds $394.4 $360.2 $359.8 $297.0 $236.3 $236.3
Interfund Transfers In
Other Financing Resources
Uses of Funds
Classified Salaries
Employee Benefits
Amounts in $ millions
Sources of Funds
Restricted Beginning Balances
Audit Adjustments
Local Revenues
Regular Program
This fund is used for new school construction and repair and modernization of existing schools. Measure K was a local bond issue passed
by voters in November 2002. Most projects also receive a State match.
SUPERINTENDENT'S 2014-15 FINAL BUDGET
CAPITAL FUND
Building Fund - Measure K (044/213)
Books and Supplies
Other Operating Expenses
Capital Outlay
Other Outgo
Restricted Ending Balances
84
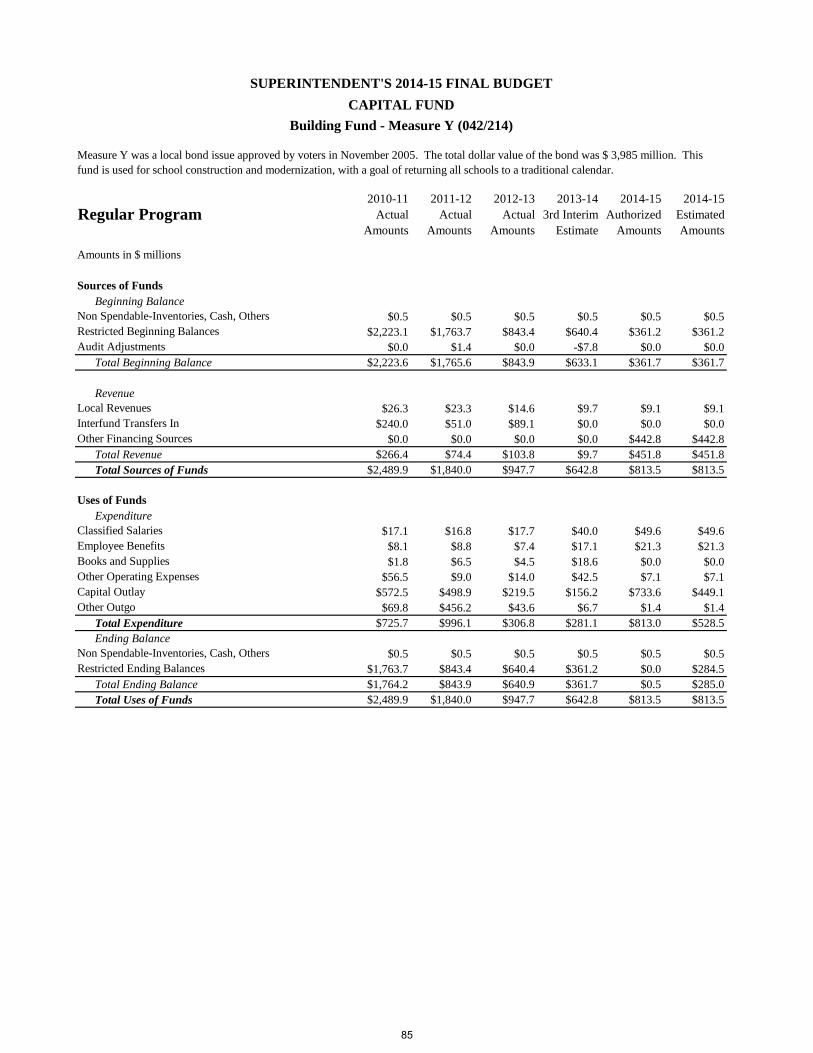
2010-11
Actual
Amounts
2011-12
Actual
Amounts
2012-13
Actual
Amounts
2013-14
3rd Interim
Estimate
2014-15
Authorized
Amounts
2014-15
Estimated
Amounts
Beginning Balance
$0.5 $0.5 $0.5 $0.5 $0.5 $0.5
$2,223.1 $1,763.7 $843.4 $640.4 $361.2 $361.2
$0.0 $1.4 $0.0 -$7.8 $0.0 $0.0
Total Beginning Balance $2,223.6 $1,765.6 $843.9 $633.1 $361.7 $361.7
Revenue
$26.3 $23.3 $14.6 $9.7 $9.1 $9.1
$240.0 $51.0 $89.1 $0.0 $0.0 $0.0
$0.0 $0.0 $0.0 $0.0 $442.8 $442.8
Total Revenue $266.4 $74.4 $103.8 $9.7 $451.8 $451.8
Total Sources of Funds $2,489.9 $1,840.0 $947.7 $642.8 $813.5 $813.5
Expenditure
$17.1 $16.8 $17.7 $40.0 $49.6 $49.6
$8.1 $8.8 $7.4 $17.1 $21.3 $21.3
$1.8 $6.5 $4.5 $18.6 $0.0 $0.0
$56.5 $9.0 $14.0 $42.5 $7.1 $7.1
$572.5 $498.9 $219.5 $156.2 $733.6 $449.1
$69.8 $456.2 $43.6 $6.7 $1.4 $1.4
Total Expenditure $725.7 $996.1 $306.8 $281.1 $813.0 $528.5
Ending Balance
$0.5 $0.5 $0.5 $0.5 $0.5 $0.5
$1,763.7 $843.4 $640.4 $361.2 $0.0 $284.5
Total Ending Balance $1,764.2 $843.9 $640.9 $361.7 $0.5 $285.0
Total Uses of Funds $2,489.9 $1,840.0 $947.7 $642.8 $813.5 $813.5
Amounts in $ millions
Sources of Funds
Regular Program
SUPERINTENDENT'S 2014-15 FINAL BUDGET
CAPITAL FUND
Building Fund - Measure Y (042/214)
Measure Y was a local bond issue approved by voters in November 2005. The total dollar value of the bond was $ 3,985 million. This
fund is used for school construction and modernization, with a goal of returning all schools to a traditional calendar.
Non Spendable-Inventories, Cash, Others
Restricted Beginning Balances
Audit Adjustments
Local Revenues
Interfund Transfers In
Other Financing Sources
Uses of Funds
Classified Salaries
Employee Benefits
Restricted Ending Balances
Books and Supplies
Other Operating Expenses
Capital Outlay
Other Outgo
Non Spendable-Inventories, Cash, Others
85
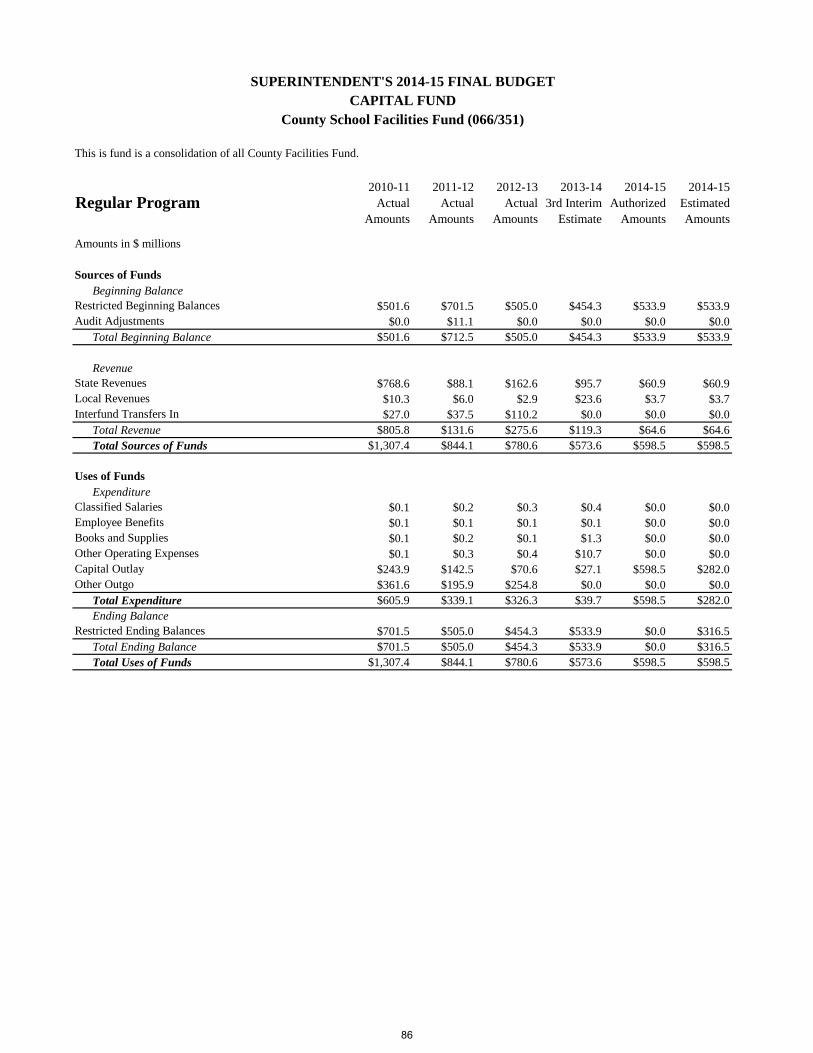
2010-11
Actual
Amounts
2011-12
Actual
Amounts
2012-13
Actual
Amounts
2013-14
3rd Interim
Estimate
2014-15
Authorized
Amounts
2014-15
Estimated
Amounts
Beginning Balance
$501.6 $701.5 $505.0 $454.3 $533.9 $533.9
$0.0 $11.1 $0.0 $0.0 $0.0 $0.0
Total Beginning Balance $501.6 $712.5 $505.0 $454.3 $533.9 $533.9
Revenue
$768.6 $88.1 $162.6 $95.7 $60.9 $60.9
$10.3 $6.0 $2.9 $23.6 $3.7 $3.7
$27.0 $37.5 $110.2 $0.0 $0.0 $0.0
Total Revenue $805.8 $131.6 $275.6 $119.3 $64.6 $64.6
Total Sources of Funds $1,307.4 $844.1 $780.6 $573.6 $598.5 $598.5
Expenditure
$0.1 $0.2 $0.3 $0.4 $0.0 $0.0
$0.1 $0.1 $0.1 $0.1 $0.0 $0.0
$0.1 $0.2 $0.1 $1.3 $0.0 $0.0
$0.1 $0.3 $0.4 $10.7 $0.0 $0.0
$243.9 $142.5 $70.6 $27.1 $598.5 $282.0
$361.6 $195.9 $254.8 $0.0 $0.0 $0.0
Total Expenditure $605.9 $339.1 $326.3 $39.7 $598.5 $282.0
Ending Balance
$701.5 $505.0 $454.3 $533.9 $0.0 $316.5
Total Ending Balance $701.5 $505.0 $454.3 $533.9 $0.0 $316.5
Total Uses of Funds $1,307.4 $844.1 $780.6 $573.6 $598.5 $598.5
Amounts in $ millions
Sources of Funds
Regular Program
SUPERINTENDENT'S 2014-15 FINAL BUDGET
CAPITAL FUND
County School Facilities Fund (066/351)
This is fund is a consolidation of all County Facilities Fund.
Restricted Beginning Balances
Audit Adjustments
State Revenues
Local Revenues
Interfund Transfers In
Other Operating Expenses
Capital Outlay
Other Outgo
Restricted Ending Balances
Uses of Funds
Classified Salaries
Employee Benefits
Books and Supplies
86
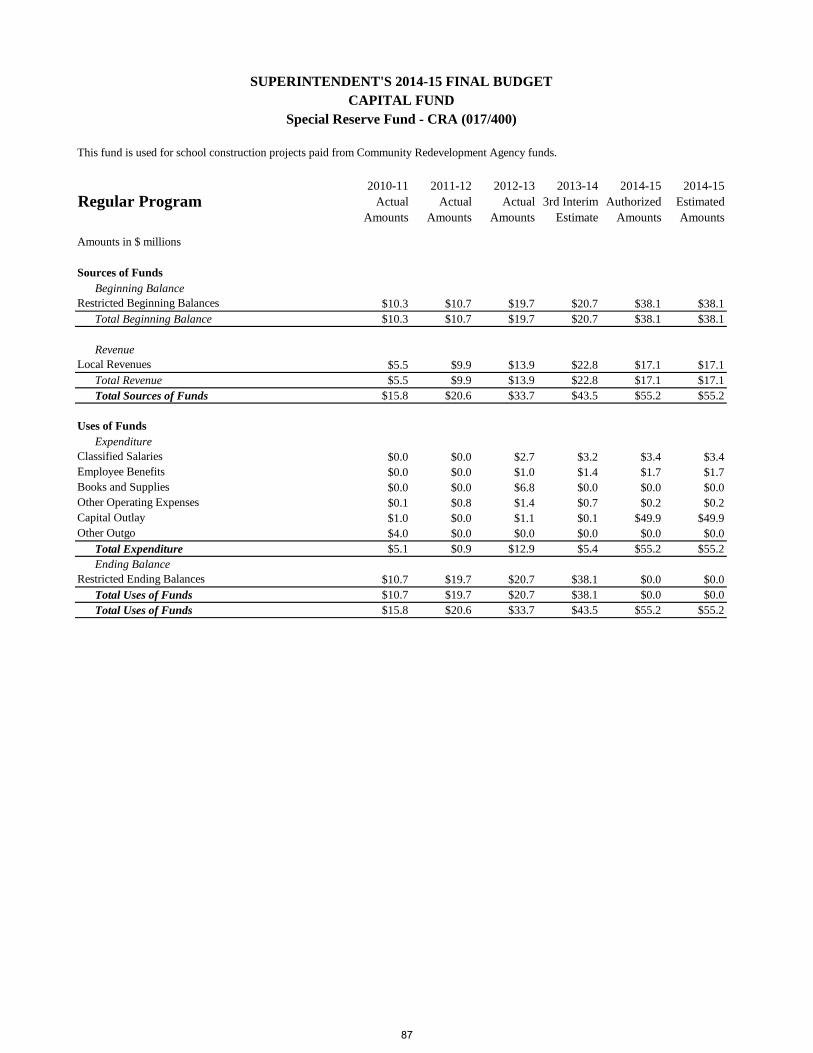
2010-11
Actual
Amounts
2011-12
Actual
Amounts
2012-13
Actual
Amounts
2013-14
3rd Interim
Estimate
2014-15
Authorized
Amounts
2014-15
Estimated
Amounts
Beginning Balance
$10.3 $10.7 $19.7 $20.7 $38.1 $38.1
Total Beginning Balance $10.3 $10.7 $19.7 $20.7 $38.1 $38.1
Revenue
$5.5 $9.9 $13.9 $22.8 $17.1 $17.1
Total Revenue $5.5 $9.9 $13.9 $22.8 $17.1 $17.1
Total Sources of Funds $15.8 $20.6 $33.7 $43.5 $55.2 $55.2
Expenditure
$0.0 $0.0 $2.7 $3.2 $3.4 $3.4
$0.0 $0.0 $1.0 $1.4 $1.7 $1.7
$0.0 $0.0 $6.8 $0.0 $0.0 $0.0
$0.1 $0.8 $1.4 $0.7 $0.2 $0.2
$1.0 $0.0 $1.1 $0.1 $49.9 $49.9
$4.0 $0.0 $0.0 $0.0 $0.0 $0.0
Total Expenditure $5.1 $0.9 $12.9 $5.4 $55.2 $55.2
Ending Balance
$10.7 $19.7 $20.7 $38.1 $0.0 $0.0
Total Uses of Funds $10.7 $19.7 $20.7 $38.1 $0.0 $0.0
Total Uses of Funds $15.8 $20.6 $33.7 $43.5 $55.2 $55.2
Amounts in $ millions
Sources of Funds
Regular Program
SUPERINTENDENT'S 2014-15 FINAL BUDGET
CAPITAL FUND
Special Reserve Fund - CRA (017/400)
This fund is used for school construction projects paid from Community Redevelopment Agency funds.
Restricted Beginning Balances
Local Revenues
Uses of Funds
Classified Salaries
Restricted Ending Balances
Employee Benefits
Books and Supplies
Other Operating Expenses
Capital Outlay
Other Outgo
87
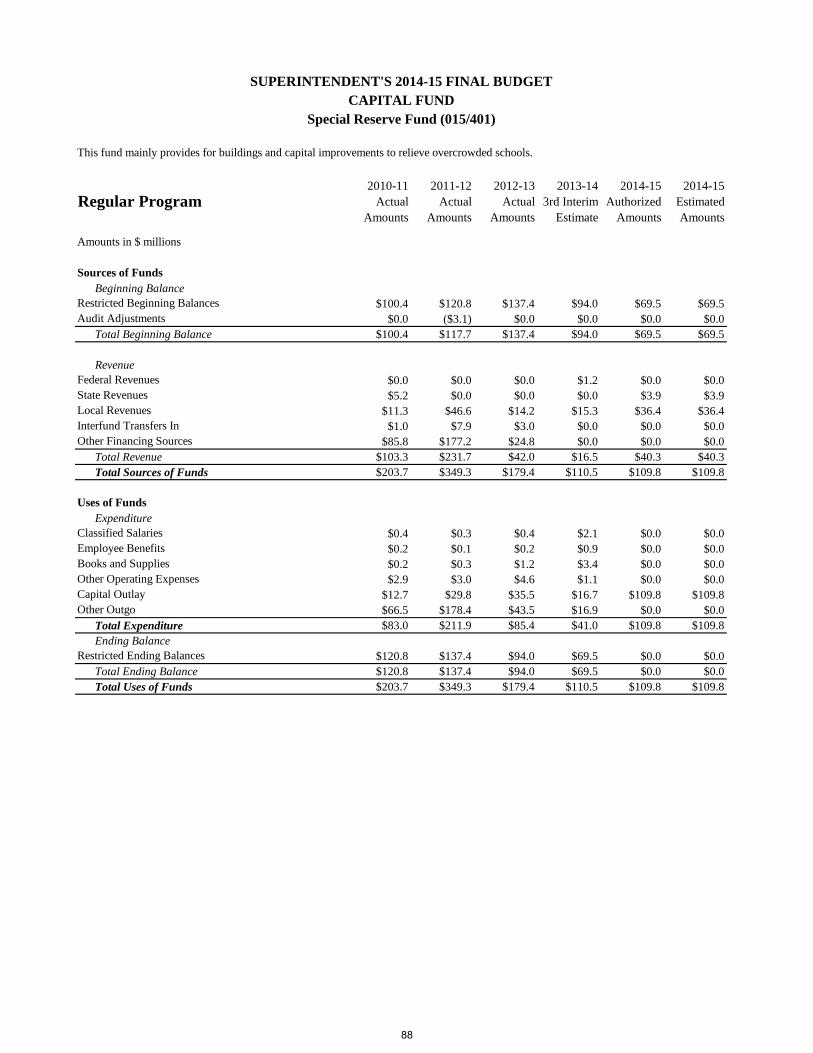
2010-11
Actual
Amounts
2011-12
Actual
Amounts
2012-13
Actual
Amounts
2013-14
3rd Interim
Estimate
2014-15
Authorized
Amounts
2014-15
Estimated
Amounts
Beginning Balance
$100.4 $120.8 $137.4 $94.0 $69.5 $69.5
$0.0 ($3.1) $0.0 $0.0 $0.0 $0.0
Total Beginning Balance $100.4 $117.7 $137.4 $94.0 $69.5 $69.5
Revenue
$0.0 $0.0 $0.0 $1.2 $0.0 $0.0
$5.2 $0.0 $0.0 $0.0 $3.9 $3.9
$11.3 $46.6 $14.2 $15.3 $36.4 $36.4
$1.0 $7.9 $3.0 $0.0 $0.0 $0.0
$85.8 $177.2 $24.8 $0.0 $0.0 $0.0
Total Revenue $103.3 $231.7 $42.0 $16.5 $40.3 $40.3
Total Sources of Funds $203.7 $349.3 $179.4 $110.5 $109.8 $109.8
Expenditure
$0.4 $0.3 $0.4 $2.1 $0.0 $0.0
$0.2 $0.1 $0.2 $0.9 $0.0 $0.0
$0.2 $0.3 $1.2 $3.4 $0.0 $0.0
$2.9 $3.0 $4.6 $1.1 $0.0 $0.0
$12.7 $29.8 $35.5 $16.7 $109.8 $109.8
$66.5 $178.4 $43.5 $16.9 $0.0 $0.0
Total Expenditure $83.0 $211.9 $85.4 $41.0 $109.8 $109.8
Ending Balance
$120.8 $137.4 $94.0 $69.5 $0.0 $0.0
Total Ending Balance $120.8 $137.4 $94.0 $69.5 $0.0 $0.0
Total Uses of Funds $203.7 $349.3 $179.4 $110.5 $109.8 $109.8
Amounts in $ millions
Sources of Funds
Regular Program
SUPERINTENDENT'S 2014-15 FINAL BUDGET
CAPITAL FUND
Special Reserve Fund (015/401)
This fund mainly provides for buildings and capital improvements to relieve overcrowded schools.
Restricted Beginning Balances
Audit Adjustments
Federal Revenues
State Revenues
Local Revenues
Interfund Transfers In
Other Financing Sources
Uses of Funds
Classified Salaries
Restricted Ending Balances
Employee Benefits
Books and Supplies
Other Operating Expenses
Capital Outlay
Other Outgo
88
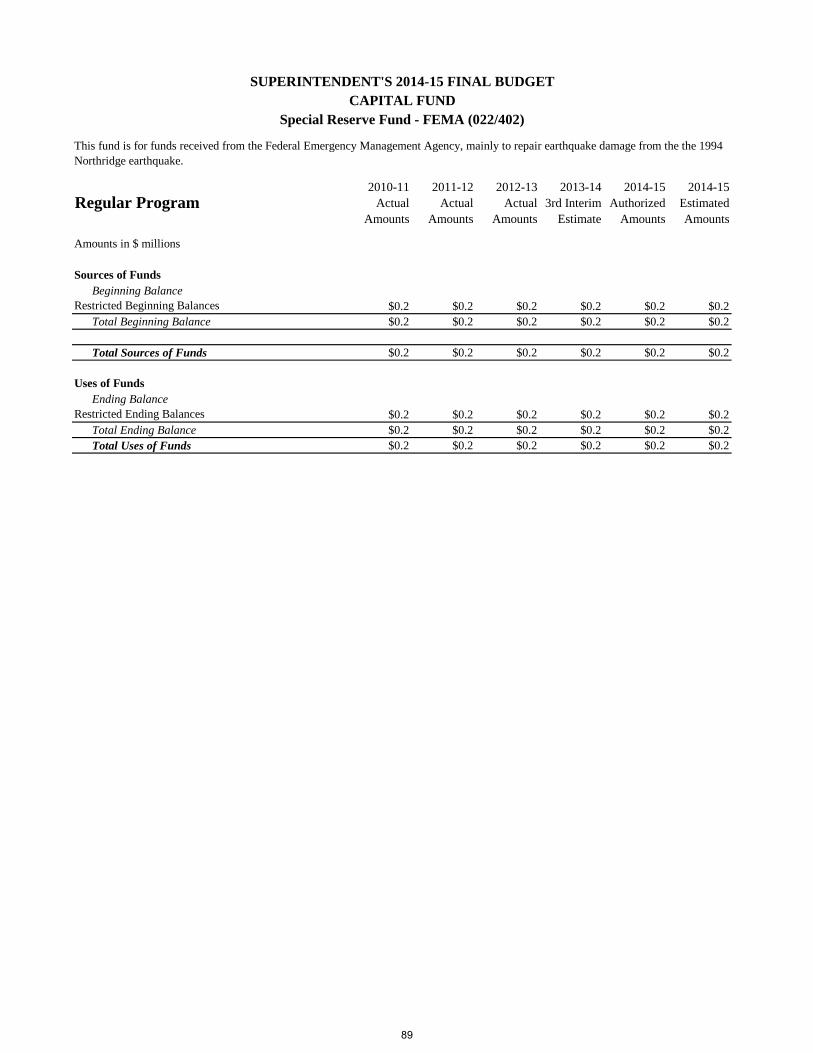
2010-11
Actual
Amounts
2011-12
Actual
Amounts
2012-13
Actual
Amounts
2013-14
3rd Interim
Estimate
2014-15
Authorized
Amounts
2014-15
Estimated
Amounts
Beginning Balance
$0.2 $0.2 $0.2 $0.2 $0.2 $0.2
Total Beginning Balance $0.2 $0.2 $0.2 $0.2 $0.2 $0.2
Total Sources of Funds $0.2 $0.2 $0.2 $0.2 $0.2 $0.2
Ending Balance
$0.2 $0.2 $0.2 $0.2 $0.2 $0.2
Total Ending Balance $0.2 $0.2 $0.2 $0.2 $0.2 $0.2
Total Uses of Funds $0.2 $0.2 $0.2 $0.2 $0.2 $0.2
Amounts in $ millions
Sources of Funds
Regular Program
SUPERINTENDENT'S 2014-15 FINAL BUDGET
CAPITAL FUND
Special Reserve Fund - FEMA (022/402)
This fund is for funds received from the Federal Emergency Management Agency, mainly to repair earthquake damage from the the 1994
Northridge earthquake.
Restricted Beginning Balances
Uses of Funds
Restricted Ending Balances
89

2010-11
Actual
Amounts
2011-12
Actual
Amounts
2012-13
Actual
Amounts
2013-14
3rd Interim
Estimate
2014-15
Authorized
Amounts
2014-15
Estimated
Amounts
Beginning Balance
$2.0 $2.0 $2.0 $2.0 $2.0 $2.0
Total Beginning Balance $2.0 $2.0 $2.0 $2.0 $2.0 $2.0
Total Sources of Funds $2.0 $2.0 $2.0 $2.0 $2.0 $2.0
Ending Balance
$2.0 $2.0 $2.0 $2.0 $2.0 $2.0
Total Ending Balance $2.0 $2.0 $2.0 $2.0 $2.0 $2.0
Total Uses of Funds $2.0 $2.0 $2.0 $2.0 $2.0 $2.0
Amounts in $ millions
Sources of Funds
Regular Program
SUPERINTENDENT'S 2014-15 FINAL BUDGET
CAPITAL FUND
Special Resv Fund - FEMA - Hazard Mitigation (062/403)
This fund is used for funds received from the Federal Emergency Management Agency to reduce hazards. District matching funds are
required. In the past, these funds have been used mainly to replace pendant lighting and suspended ceilings in schools.
Restricted Beginning Balances
Uses of Funds
Restricted Ending Balances
90
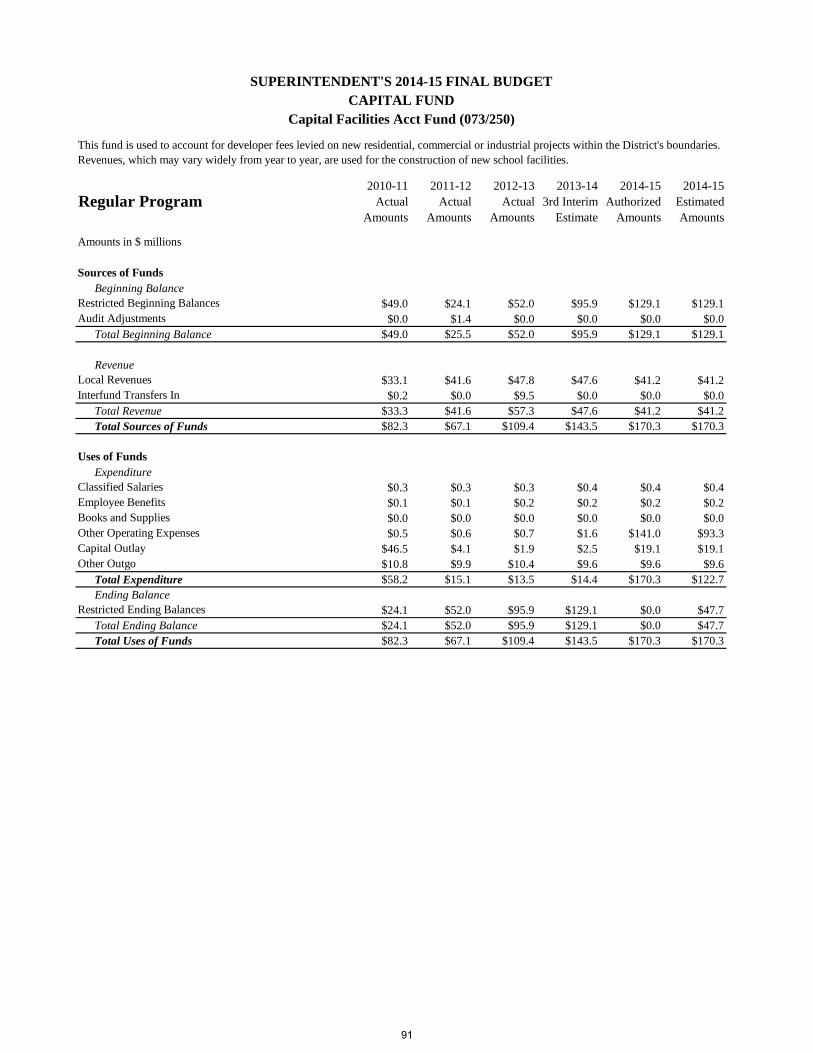
2010-11
Actual
Amounts
2011-12
Actual
Amounts
2012-13
Actual
Amounts
2013-14
3rd Interim
Estimate
2014-15
Authorized
Amounts
2014-15
Estimated
Amounts
Beginning Balance
$49.0 $24.1 $52.0 $95.9 $129.1 $129.1
$0.0 $1.4 $0.0 $0.0 $0.0 $0.0
Total Beginning Balance $49.0 $25.5 $52.0 $95.9 $129.1 $129.1
Revenue
$33.1 $41.6 $47.8 $47.6 $41.2 $41.2
$0.2 $0.0 $9.5 $0.0 $0.0 $0.0
Total Revenue $33.3 $41.6 $57.3 $47.6 $41.2 $41.2
Total Sources of Funds $82.3 $67.1 $109.4 $143.5 $170.3 $170.3
Expenditure
$0.3 $0.3 $0.3 $0.4 $0.4 $0.4
$0.1 $0.1 $0.2 $0.2 $0.2 $0.2
$0.0 $0.0 $0.0 $0.0 $0.0 $0.0
$0.5 $0.6 $0.7 $1.6 $141.0 $93.3
$46.5 $4.1 $1.9 $2.5 $19.1 $19.1
$10.8 $9.9 $10.4 $9.6 $9.6 $9.6
Total Expenditure $58.2 $15.1 $13.5 $14.4 $170.3 $122.7
Ending Balance
$24.1 $52.0 $95.9 $129.1 $0.0 $47.7
Total Ending Balance $24.1 $52.0 $95.9 $129.1 $0.0 $47.7
Total Uses of Funds $82.3 $67.1 $109.4 $143.5 $170.3 $170.3
Interfund Transfers In
Uses of Funds
Classified Salaries
Employee Benefits
Amounts in $ millions
Sources of Funds
Restricted Beginning Balances
Audit Adjustments
Local Revenues
Regular Program
SUPERINTENDENT'S 2014-15 FINAL BUDGET
CAPITAL FUND
Capital Facilities Acct Fund (073/250)
This fund is used to account for developer fees levied on new residential, commercial or industrial projects within the District's boundaries.
Revenues, which may vary widely from year to year, are used for the construction of new school facilities.
Books and Supplies
Other Operating Expenses
Capital Outlay
Other Outgo
Restricted Ending Balances
91
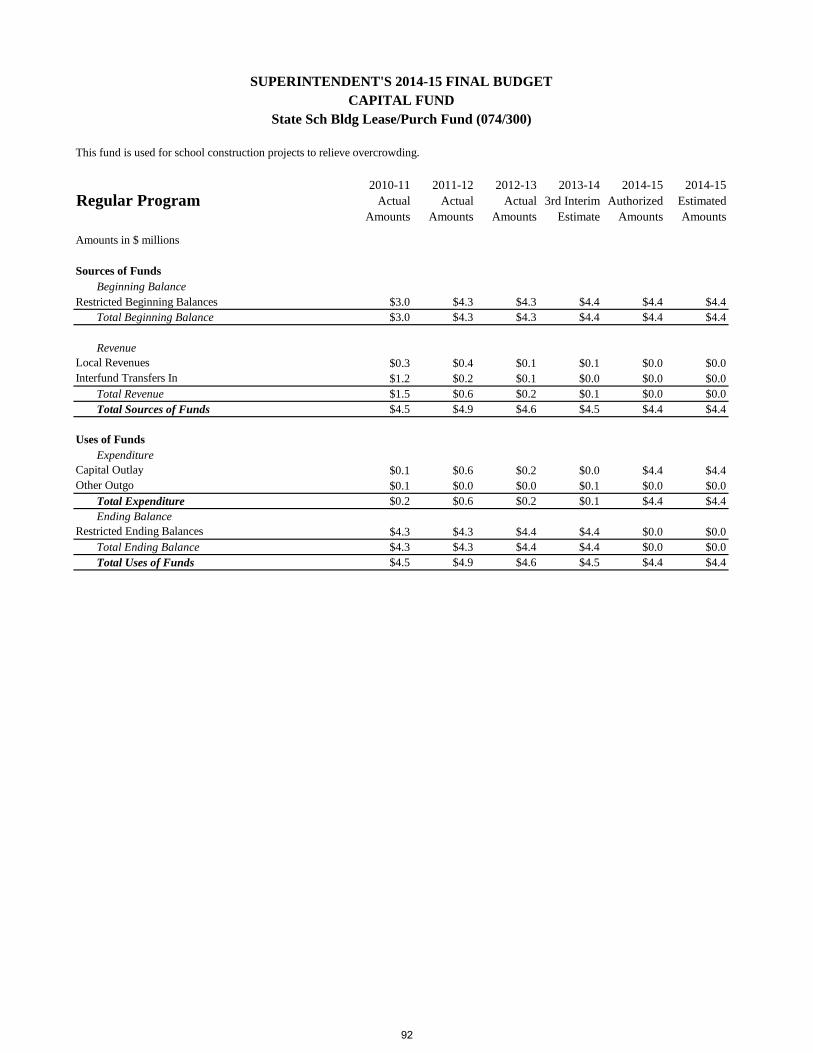
2010-11
Actual
Amounts
2011-12
Actual
Amounts
2012-13
Actual
Amounts
2013-14
3rd Interim
Estimate
2014-15
Authorized
Amounts
2014-15
Estimated
Amounts
Beginning Balance
Restricted Beginning Balances $3.0 $4.3 $4.3 $4.4 $4.4 $4.4
Total Beginning Balance $3.0 $4.3 $4.3 $4.4 $4.4 $4.4
Revenue
$0.3 $0.4 $0.1 $0.1 $0.0 $0.0
$1.2 $0.2 $0.1 $0.0 $0.0 $0.0
Total Revenue $1.5 $0.6 $0.2 $0.1 $0.0 $0.0
Total Sources of Funds $4.5 $4.9 $4.6 $4.5 $4.4 $4.4
Expenditure
$0.1 $0.6 $0.2 $0.0 $4.4 $4.4
$0.1 $0.0 $0.0 $0.1 $0.0 $0.0
Total Expenditure $0.2 $0.6 $0.2 $0.1 $4.4 $4.4
Ending Balance
$4.3 $4.3 $4.4 $4.4 $0.0 $0.0
Total Ending Balance $4.3 $4.3 $4.4 $4.4 $0.0 $0.0
Total Uses of Funds $4.5 $4.9 $4.6 $4.5 $4.4 $4.4
Amounts in $ millions
Sources of Funds
Regular Program
SUPERINTENDENT'S 2014-15 FINAL BUDGET
CAPITAL FUND
State Sch Bldg Lease/Purch Fund (074/300)
This fund is used for school construction projects to relieve overcrowding.
Local Revenues
Interfund Transfers In
Capital Outlay
Other Outgo
Restricted Ending Balances
Uses of Funds
92
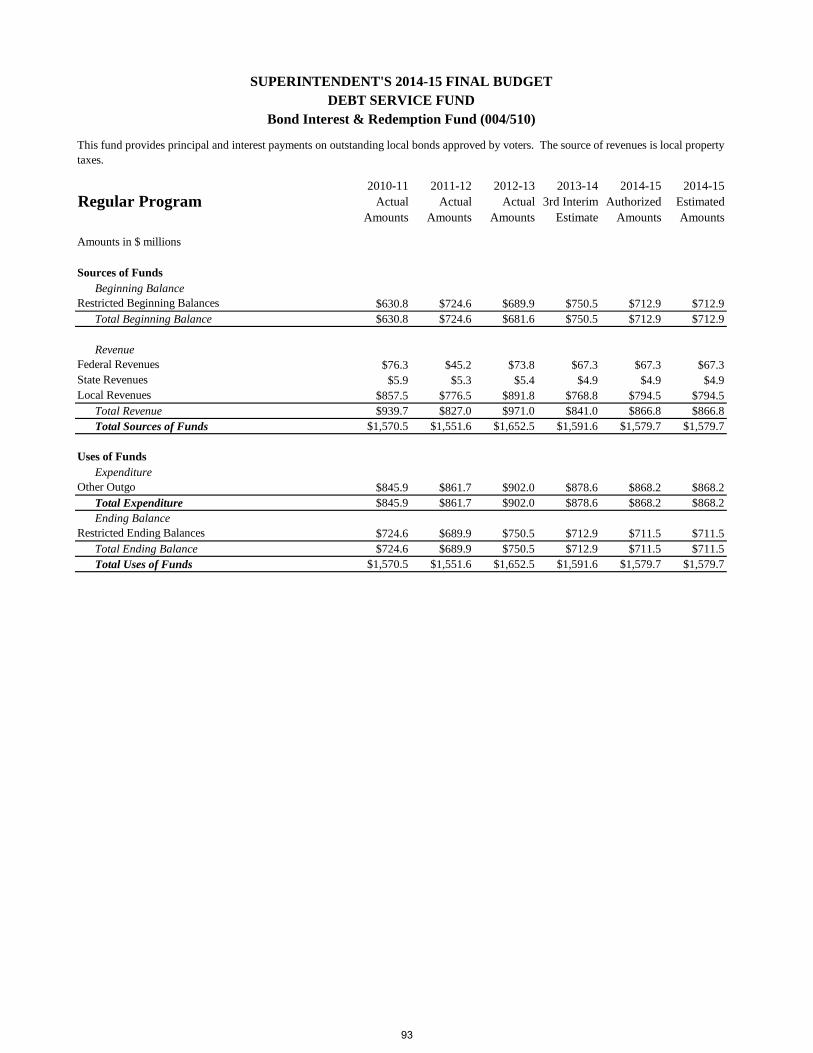
2010-11
Actual
Amounts
2011-12
Actual
Amounts
2012-13
Actual
Amounts
2013-14
3rd Interim
Estimate
2014-15
Authorized
Amounts
2014-15
Estimated
Amounts
Beginning Balance
$630.8 $724.6 $689.9 $750.5 $712.9 $712.9
Total Beginning Balance $630.8 $724.6 $681.6 $750.5 $712.9 $712.9
Revenue
$76.3 $45.2 $73.8 $67.3 $67.3 $67.3
$5.9 $5.3 $5.4 $4.9 $4.9 $4.9
$857.5 $776.5 $891.8 $768.8 $794.5 $794.5
Total Revenue $939.7 $827.0 $971.0 $841.0 $866.8 $866.8
Total Sources of Funds $1,570.5 $1,551.6 $1,652.5 $1,591.6 $1,579.7 $1,579.7
Expenditure
$845.9 $861.7 $902.0 $878.6 $868.2 $868.2
Total Expenditure $845.9 $861.7 $902.0 $878.6 $868.2 $868.2
Ending Balance
$724.6 $689.9 $750.5 $712.9 $711.5 $711.5
Total Ending Balance $724.6 $689.9 $750.5 $712.9 $711.5 $711.5
Total Uses of Funds $1,570.5 $1,551.6 $1,652.5 $1,591.6 $1,579.7 $1,579.7
Amounts in $ millions
Sources of Funds
Regular Program
SUPERINTENDENT'S 2014-15 FINAL BUDGET
DEBT SERVICE FUND
Bond Interest & Redemption Fund (004/510)
This fund provides principal and interest payments on outstanding local bonds approved by voters. The source of revenues is local property
taxes.
Restricted Beginning Balances
Federal Revenues
State Revenues
Local Revenues
Uses of Funds
Other Outgo
Restricted Ending Balances
93
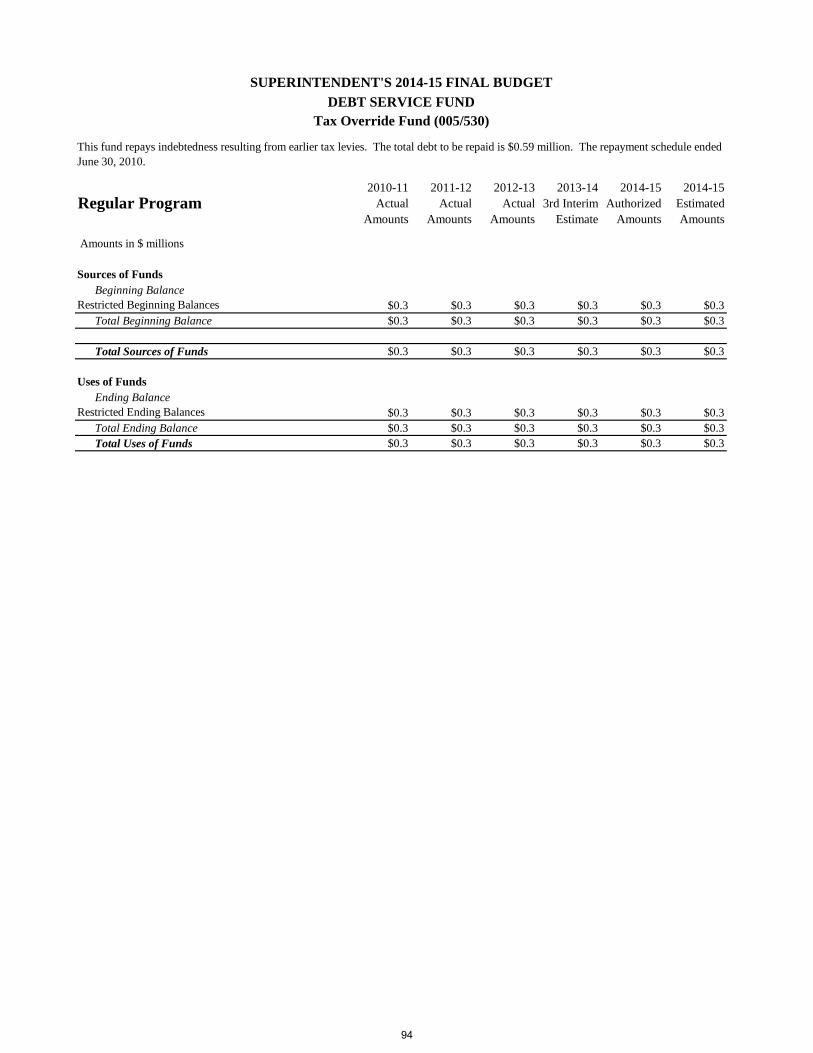
2010-11
Actual
Amounts
2011-12
Actual
Amounts
2012-13
Actual
Amounts
2013-14
3rd Interim
Estimate
2014-15
Authorized
Amounts
2014-15
Estimated
Amounts
Beginning Balance
$0.3 $0.3 $0.3 $0.3 $0.3 $0.3
Total Beginning Balance $0.3 $0.3 $0.3 $0.3 $0.3 $0.3
Total Sources of Funds $0.3 $0.3 $0.3 $0.3 $0.3 $0.3
Ending Balance
$0.3 $0.3 $0.3 $0.3 $0.3 $0.3
Total Ending Balance $0.3 $0.3 $0.3 $0.3 $0.3 $0.3
Total Uses of Funds $0.3 $0.3 $0.3 $0.3 $0.3 $0.3
Amounts in $ millions
Sources of Funds
Regular Program
SUPERINTENDENT'S 2014-15 FINAL BUDGET
DEBT SERVICE FUND
Tax Override Fund (005/530)
This fund repays indebtedness resulting from earlier tax levies. The total debt to be repaid is $0.59 million. The repayment schedule ended
June 30, 2010.
Restricted Ending Balances
Restricted Beginning Balances
Uses of Funds
94
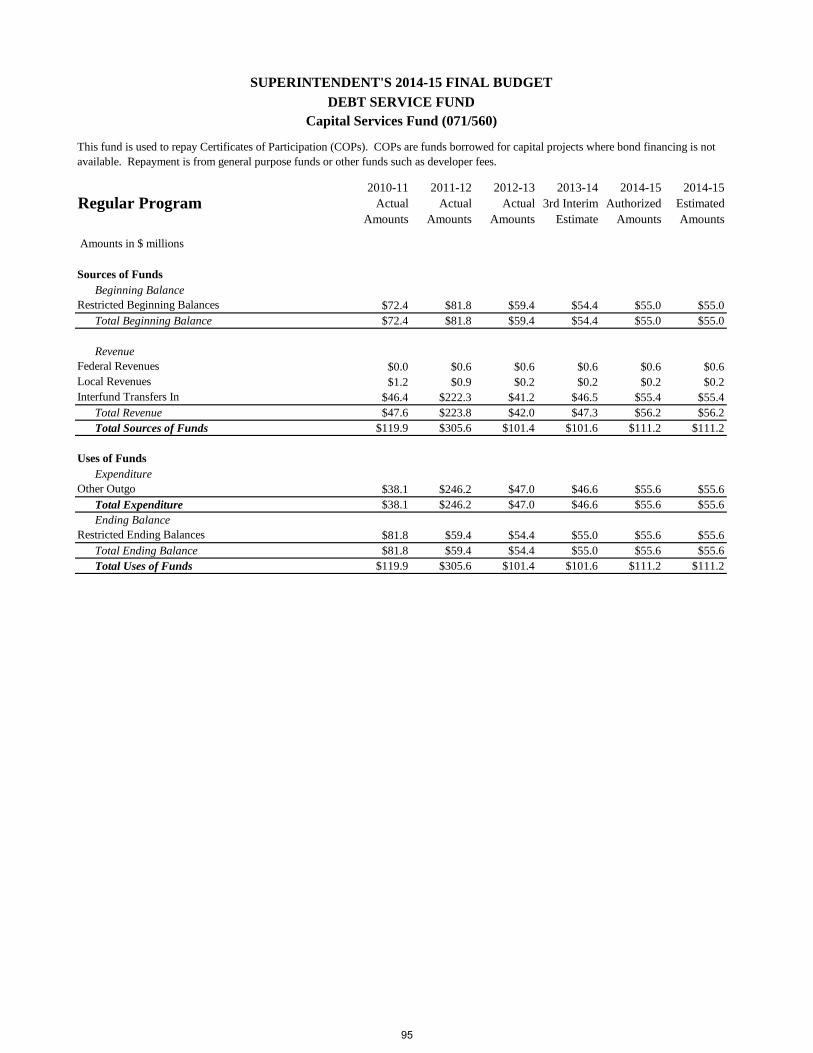
2010-11
Actual
Amounts
2011-12
Actual
Amounts
2012-13
Actual
Amounts
2013-14
3rd Interim
Estimate
2014-15
Authorized
Amounts
2014-15
Estimated
Amounts
Beginning Balance
$72.4 $81.8 $59.4 $54.4 $55.0 $55.0
Total Beginning Balance $72.4 $81.8 $59.4 $54.4 $55.0 $55.0
Revenue
$0.0 $0.6 $0.6 $0.6 $0.6 $0.6
$1.2 $0.9 $0.2 $0.2 $0.2 $0.2
$46.4 $222.3 $41.2 $46.5 $55.4 $55.4
Total Revenue $47.6 $223.8 $42.0 $47.3 $56.2 $56.2
Total Sources of Funds $119.9 $305.6 $101.4 $101.6 $111.2 $111.2
Expenditure
$38.1 $246.2 $47.0 $46.6 $55.6 $55.6
Total Expenditure $38.1 $246.2 $47.0 $46.6 $55.6 $55.6
Ending Balance
$81.8 $59.4 $54.4 $55.0 $55.6 $55.6
Total Ending Balance $81.8 $59.4 $54.4 $55.0 $55.6 $55.6
Total Uses of Funds $119.9 $305.6 $101.4 $101.6 $111.2 $111.2
Amounts in $ millions
Sources of Funds
Regular Program
SUPERINTENDENT'S 2014-15 FINAL BUDGET
DEBT SERVICE FUND
Capital Services Fund (071/560)
This fund is used to repay Certificates of Participation (COPs). COPs are funds borrowed for capital projects where bond financing is not
available. Repayment is from general purpose funds or other funds such as developer fees.
Restricted Beginning Balances
Federal Revenues
Local Revenues
Interfund Transfers In
Uses of Funds
Other Outgo
Restricted Ending Balances
95
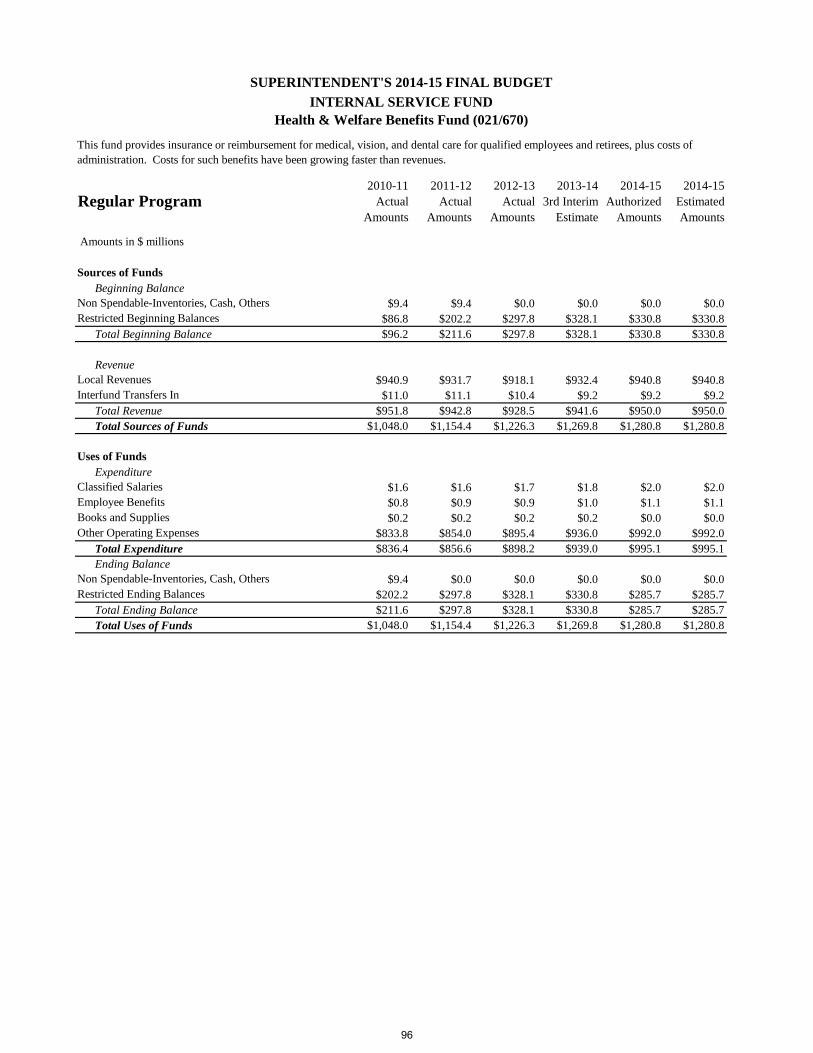
2010-11
Actual
Amounts
2011-12
Actual
Amounts
2012-13
Actual
Amounts
2013-14
3rd Interim
Estimate
2014-15
Authorized
Amounts
2014-15
Estimated
Amounts
Beginning Balance
$9.4 $9.4 $0.0 $0.0 $0.0 $0.0
$86.8 $202.2 $297.8 $328.1 $330.8 $330.8
Total Beginning Balance $96.2 $211.6 $297.8 $328.1 $330.8 $330.8
Revenue
$940.9 $931.7 $918.1 $932.4 $940.8 $940.8
$11.0 $11.1 $10.4 $9.2 $9.2 $9.2
Total Revenue $951.8 $942.8 $928.5 $941.6 $950.0 $950.0
Total Sources of Funds $1,048.0 $1,154.4 $1,226.3 $1,269.8 $1,280.8 $1,280.8
Expenditure
$1.6 $1.6 $1.7 $1.8 $2.0 $2.0
$0.8 $0.9 $0.9 $1.0 $1.1 $1.1
$0.2 $0.2 $0.2 $0.2 $0.0 $0.0
$833.8 $854.0 $895.4 $936.0 $992.0 $992.0
Total Expenditure $836.4 $856.6 $898.2 $939.0 $995.1 $995.1
Ending Balance
$9.4 $0.0 $0.0 $0.0 $0.0 $0.0
$202.2 $297.8 $328.1 $330.8 $285.7 $285.7
Total Ending Balance $211.6 $297.8 $328.1 $330.8 $285.7 $285.7
Total Uses of Funds $1,048.0 $1,154.4 $1,226.3 $1,269.8 $1,280.8 $1,280.8
Amounts in $ millions
Sources of Funds
Regular Program
SUPERINTENDENT'S 2014-15 FINAL BUDGET
INTERNAL SERVICE FUND
Health & Welfare Benefits Fund (021/670)
This fund provides insurance or reimbursement for medical, vision, and dental care for qualified employees and retirees, plus costs of
administration. Costs for such benefits have been growing faster than revenues.
Non Spendable-Inventories, Cash, Others
Restricted Beginning Balances
Local Revenues
Interfund Transfers In
Uses of Funds
Classified Salaries
Employee Benefits
Books and Supplies
Other Operating Expenses
Non Spendable-Inventories, Cash, Others
Restricted Ending Balances
96
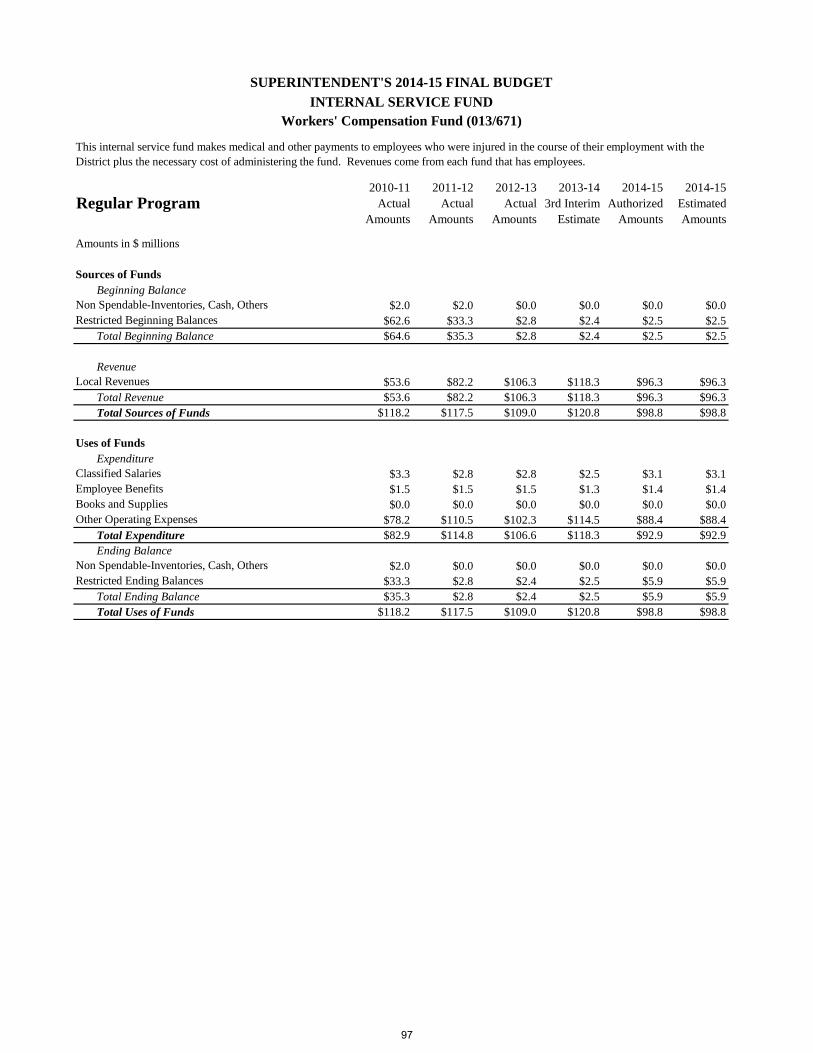
2010-11
Actual
Amounts
2011-12
Actual
Amounts
2012-13
Actual
Amounts
2013-14
3rd Interim
Estimate
2014-15
Authorized
Amounts
2014-15
Estimated
Amounts
Beginning Balance
$2.0 $2.0 $0.0 $0.0 $0.0 $0.0
$62.6 $33.3 $2.8 $2.4 $2.5 $2.5
Total Beginning Balance $64.6 $35.3 $2.8 $2.4 $2.5 $2.5
Revenue
$53.6 $82.2 $106.3 $118.3 $96.3 $96.3
Total Revenue $53.6 $82.2 $106.3 $118.3 $96.3 $96.3
Total Sources of Funds $118.2 $117.5 $109.0 $120.8 $98.8 $98.8
Expenditure
$3.3 $2.8 $2.8 $2.5 $3.1 $3.1
$1.5 $1.5 $1.5 $1.3 $1.4 $1.4
$0.0 $0.0 $0.0 $0.0 $0.0 $0.0
$78.2 $110.5 $102.3 $114.5 $88.4 $88.4
Total Expenditure $82.9 $114.8 $106.6 $118.3 $92.9 $92.9
Ending Balance
$2.0 $0.0 $0.0 $0.0 $0.0 $0.0
$33.3 $2.8 $2.4 $2.5 $5.9 $5.9
Total Ending Balance $35.3 $2.8 $2.4 $2.5 $5.9 $5.9
Total Uses of Funds $118.2 $117.5 $109.0 $120.8 $98.8 $98.8
Local Revenues
Uses of Funds
Classified Salaries
Amounts in $ millions
Sources of Funds
Non Spendable-Inventories, Cash, Others
Restricted Beginning Balances
Regular Program
SUPERINTENDENT'S 2014-15 FINAL BUDGET
INTERNAL SERVICE FUND
Workers' Compensation Fund (013/671)
This internal service fund makes medical and other payments to employees who were injured in the course of their employment with the
District plus the necessary cost of administering the fund. Revenues come from each fund that has employees.
Employee Benefits
Books and Supplies
Other Operating Expenses
Non Spendable-Inventories, Cash, Others
Restricted Ending Balances
97

2010-11
Actual
Amounts
2011-12
Actual
Amounts
2012-13
Actual
Amounts
2013-14
3rd Interim
Estimate
2014-15
Authorized
Amounts
2014-15
Estimated
Amounts
Beginning Balance
$4.0 $3.6 $0.0 $0.0 $0.0 $0.0
$0.0 $0.0 $3.2 $2.8 $2.4 $2.4
Total Beginning Balance $4.0 $3.6 $3.2 $2.8 $2.4 $2.4
Revenue
$12.0 $30.3 $80.2 $37.3 $23.3 $23.3
Total Revenue $12.0 $30.3 $80.2 $37.3 $23.3 $23.3
Total Sources of Funds $16.0 $33.9 $83.4 $40.2 $25.7 $25.7
Expenditure
$0.2 $0.2 $0.2 $0.2 $0.2 $0.2
$1.1 $0.9 $0.8 $0.8 $1.1 $1.1
$0.5 $0.5 $0.5 $0.5 $0.5 $0.5
$0.0 $0.0 $0.0 $0.0 $0.1 $0.1
$10.6 $29.1 $79.1 $36.3 $21.4 $21.4
Total Expenditure $12.4 $30.7 $80.5 $37.7 $23.3 $23.3
Ending Balance
$3.6 $0.0 $0.0 $0.0 $0.0 $0.0
$0.0 $3.2 $2.8 $2.4 $2.4 $2.4
Total Ending Balance $3.6 $3.2 $2.8 $2.4 $2.4 $2.4
Total Uses of Funds $16.0 $33.9 $83.4 $40.2 $25.7 $25.7
Uses of Funds
Certificated Salaries
Amounts in $ millions
Sources of Funds
Non Spendable-Inventories, Cash, Others
Restricted Beginning Balances
Local Revenues
Regular Program
SUPERINTENDENT'S 2014-15 FINAL BUDGET
INTERNAL SERVICE FUND
Liability Self-Insurance Fund (016/672)
This fund provides resources for liability claims and judgments against the District, and the cost of administering them.
Restricted Ending Balances
Classified Salaries
Employee Benefits
Books and Supplies
Other Operating Expenses
Non Spendable-Inventories, Cash, Others
98
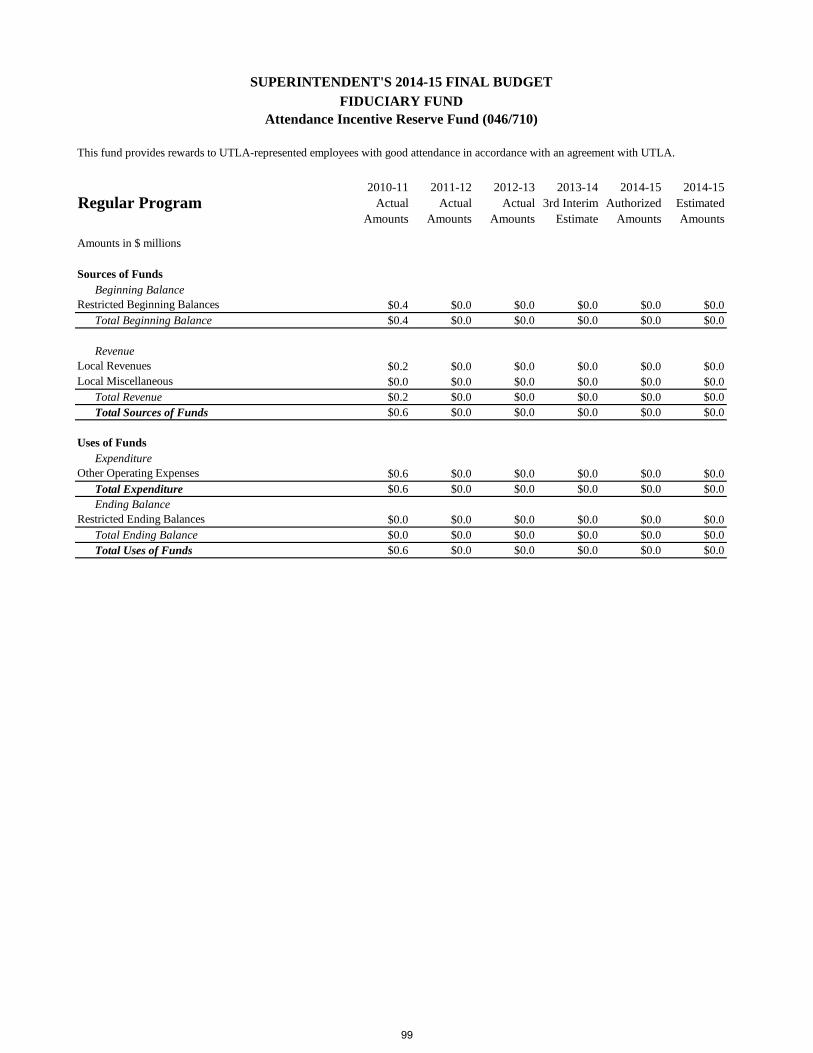
2010-11
Actual
Amounts
2011-12
Actual
Amounts
2012-13
Actual
Amounts
2013-14
3rd Interim
Estimate
2014-15
Authorized
Amounts
2014-15
Estimated
Amounts
Beginning Balance
$0.4 $0.0 $0.0 $0.0 $0.0 $0.0
Total Beginning Balance $0.4 $0.0 $0.0 $0.0 $0.0 $0.0
Revenue
$0.2 $0.0 $0.0 $0.0 $0.0 $0.0
$0.0 $0.0 $0.0 $0.0 $0.0 $0.0
Total Revenue $0.2 $0.0 $0.0 $0.0 $0.0 $0.0
Total Sources of Funds $0.6 $0.0 $0.0 $0.0 $0.0 $0.0
Expenditure
$0.6 $0.0 $0.0 $0.0 $0.0 $0.0
Total Expenditure $0.6 $0.0 $0.0 $0.0 $0.0 $0.0
Ending Balance
$0.0 $0.0 $0.0 $0.0 $0.0 $0.0
Total Ending Balance $0.0 $0.0 $0.0 $0.0 $0.0 $0.0
Total Uses of Funds $0.6 $0.0 $0.0 $0.0 $0.0 $0.0
Amounts in $ millions
Sources of Funds
Regular Program
SUPERINTENDENT'S 2014-15 FINAL BUDGET
FIDUCIARY FUND
Attendance Incentive Reserve Fund (046/710)
This fund provides rewards to UTLA-represented employees with good attendance in accordance with an agreement with UTLA.
Restricted Ending Balances
Restricted Beginning Balances
Local Revenues
Local Miscellaneous
Uses of Funds
Other Operating Expenses
99

FIDUCIARY FUND
SUPERINTENDENT'S 2014-15 FINAL BUDGET
Other Post Employment Benefit Fund (713)
This fund is to account for the Other Post Employment Benefits (OPEB) contributions.
2010-11
Actual
Amounts
2011-12
Actual
Amounts
2012-13
Actual
Amounts
2013-14
3rd
Interim
Estimate
2014-15
Authorized
Amounts
2014-15
Estimated
Amounts
Amounts in $millions
Sources of Funds
Revenue
In-District Premiums/Contribution $0.0 $0.0 $0.0 $0.0 $88.5 $88.5
Total Revenue $0.0 $0.0 $0.0 $0.0 $88.5 $88.5
Total Sources of Funds $0.0 $0.0 $0.0 $0.0 $88.5 $88.5
Uses of Funds
Ending Balance
Restricted Beginning Balances $0.0 $0.0 $0.0 $0.0 $88.5 $88.5
Total Ending Balance $0.0 $0.0 $0.0 $0.0 $88.5 $88.5
Total Uses of Funds $0.0 $0.0 $0.0 $0.0 $88.5 $88.5
Regular Program
FIDUCIARY FUND
100
APPENDICES
INTRODUCTION
This Section provides information related to a number of areas of importance with regard to the District’s budget for the 2013-14 fiscal year. Included in this Section are the following: Appendix A – Frequently Asked Questions. This section provides questions and answers regarding the District’s Final Budget. Appendix B – Budget Principles and Processes. This section explains the District’s general principles used in preparing its budget, and the process for developing and amending the budget. Appendix C – How Education is Funded in California. This section provides detail on how California funds its schools, and information on the state’s K-12 education finance laws since the 1970s. Appendix D – LCFF Information. Beginning fiscal year 13-14, the Local Control Funding Formula (LCFF) replaced the revenue limit and most state categorical programs. The significantly simplified State funding formula for local education agencies was initiated by Governor Jerry Brown with the goals of transparency and greater expenditure flexibility. Full funding implementation is projected to be in fiscal year 2020-21. Appendix E – Average Daily Attendance (ADA). These pages provide information regarding Average Daily Attendance (ADA). The State uses ADA to allocate many funding sources to local education agencies. ADA is based on actual in-seat attendance and attendance credit. This appendix includes information on funded ADA. Appendix F – District and Community Profile. These pages provide information about the District students and communities characteristics. This also includes the number of schools and centers.
Appendix G – Lottery. The California State Lottery contributes to local education agencies as a supplement to other state funding. Lottery revenue is allocated for the sole purpose of instruction. Proposition 20 established a portion of the Lottery revenue for instructional materials. The remaining portion is for other instructional expense.
Appendix H – School Staff and Resources. These pages provide information on the staffing of District schools, based on existing allocation formulas. This information is provided for elementary and secondary schools, magnet schools, options schools, special education schools and programs, adult schools, regional occupational centers and programs, and other schools for which the District allocates positions and other resources. This section also includes information on the allocation of support staff, instructional materials, and other supplies to District schools. Appendix I – District Class Size. These pages provide information about the District’s current and historical class sizes.
101

Appendix J – Enrollment Trends and Projections. This section provides information on District enrollment trends. The District uses data on live births in Los Angeles County and historical grade retention ratios, as well as economic factors and other relevant information, to project enrollment. Estimated enrollments in grades 1 through 12 for the 2013-14 through 2015-16 school years are calculated using various scenarios, generally involving weighted and true averages. The grade retention ratio uses past trends to estimate student progress to the next grade level. Enrollments in kindergarten are calculated as a percentage of live births in Los Angeles County five years earlier. Separate Enrollment charts are provided for regular District schools, fiscally independent charter schools and total district-wide enrollment. Appendix K – Special Education Enrollment Data Report by Disability This page provides enrollment data for special education students by disability type. Appendix L – Budget and Finance Policy. These pages provide the complete text of the District’s Budget and Finance Policy, as adopted by the Board of Education in June 2004. Appendix M – District Debt Management Policy. These pages provide the complete text of the District’s Debt Management Policy, as adopted by the Board of Education. Appendix N – Capital Budget. This page provides a hyperlink for information regarding the District’s capital facilities plan and other major capital expenditures anticipated during the next several years. Appendix O - Notes. These pages provide information regarding a number of items throughout the budget. Appendix P - Glossary of Abbreviations. These pages provide definitions of terms and abbreviations appearing throughout the budget document.
102

APPENDIX A
FREQUENTLY ASKED QUESTIONS ABOUT THE BUDGET
What is the Local Control Funding Formula (LCFF)?
California’s FY 2013-14 state budget replaced the previous K-12 finance system with a
new Local Control Funding Formula designed to significantly simplify how state funding
is provided to districts. For school districts and charter schools, the LCFF creates base,
supplemental, and concentration grants in place of most previously existing K-12 funding
streams, including revenue limits and most state categorical programs. The goal of the
LCFF is to align funding with the demographic profile of the students served, and
provide greater flexibility to use these funds to improve outcomes of students.
How are “unduplicated pupils” defined for purposes of calculating supplemental
and concentration grant amounts?
Supplemental and concentration grant amounts are calculated based on the percentage of
“unduplicated pupils” in the District. For purposes of the LCFF, the unduplicated count
includes pupils who are English learners, meet income eligibility requirements for free or
reduced-price meals under the National School Lunch Program, or are in Foster care.
“Unduplicated count” means that each pupil is counted only once, even if the pupil meets
more than one of these criteria.
When will the Local Control Funding Formula be implemented?
Implementation of the LCFF began in the 2013-14 fiscal year. The state Department of
Finance estimates that achieving full funding levels under the LCFF will take eight years.
During the intervening years, some LCFF provisions will be phased in (e.g., funding
levels and K-3 class size).
What is the Local Control Accountability Plan (LCAP)?
The LCAP is an important component of the Local Control Funding Formula (LCFF).
Under the LCFF, all districts are required to prepare an LCAP, which describes how they
intend to meet annual goals for all pupils, with specific activities to address state and
local priorities.
103
APPENDIX A
FREQUENTLY ASKED QUESTIONS ABOUT THE BUDGET
Which resources are in the Unrestricted General Fund, and which are not?
The Unrestricted General Fund includes most of the District’s K-12 operating
programs. For example, it includes:
• Funding for teachers, administrators, clerical, and custodial staff at schools.
• Funding for recreation-oriented after-school programs.
• Funding for the administration of the District, including general management,
finance, information technology and human resources.
The Restricted General Fund includes the following resources:
• Federal categorical funds for low-income, low-achieving, or limited- English-
proficient students, including Title I (Socioeconomically Disadvantaged), Title
II A (High Quality Teachers), and Title III (English learners).
• Funding for the District’s special education program.
• Funding for school maintenance, such as repairs.
• Funding for school breakfasts and lunches.
• State and federal funding for instructionally-oriented before- and after-school
programs.
• Funding for early childhood education programs conducted at children’s
centers.
• Capital funds, such as bond funds for school construction, and funds that pay
principal and interest on bonded indebtedness.
Does the Revised Budget include an estimate of student enrollment?
Yes. The Los Angeles Unified School District uses data on live births in Los Angeles
County and historical grade retention ratios, as well as economic factors and other
relevant information, to project enrollment. Estimated enrollments in grades 1 through
12 are calculated using a variety of scenarios, generally involving weighted and true
averages. The grade retention ratio measures the percentage of students expected to
progress to the next grade level from one year to the next, based on past trends.
Enrollments in kindergarten are calculated as a percentage of live births in Los
Angeles County five years earlier.
104

APPENDIX A
FREQUENTLY ASKED QUESTIONS ABOUT THE BUDGET
What does it mean to be a “declining enrollment” district?
Enrollment peaked in 2002-03 at 746,831, and has declined each year since. This decline
is due to several factors, including reduced birth rates in Los Angeles County, and cost-
of-living increases, including housing, in southern California.
Declining enrollment affects both revenue and expenditures. However, declining
enrollment typically causes a more rapid decline in revenues following the first year, in
which declining enrollment districts are essentially “held harmless” for the decline. In
addition, the increase in percentage of students enrolled in independent charter schools
contributes to the change in revenue and expenditures District-wide.
How do charter schools impact District enrollment projections?
The fiscally-independent charter school data include both schools that have converted
from non-charter to fiscally-independent charter school status (“conversion charters”) and
schools that began their existence as fiscally-independent charter schools (“start-up
charters”). The chart below shows the increase in the percentage of students enrolled in
independent charter schools over the last decade.
-
100,000
200,000
300,000
400,000
500,000
600,000
700,000
800,000
District Enrollment Trends 2001-02 to 2014-15 (Projected)
Independent Charters
District K-12
105
APPENDIX A
FREQUENTLY ASKED QUESTIONS ABOUT THE BUDGET
What legal requirements govern the District’s budget process? Legal requirements for school district budgeting are spelled out in the State Education
Code.
• The District is required to adopt a budget each year by June 30th
. The
Superintendent and Chief Financial Officer must certify that the budget is
balanced in the current year and, based on reasonable income and expenditure
assumptions, that the District will be able to balance its budget for two
subsequent years. Thus, based on the best information available, we have
considered the District’s likely revenues and expenditures in 2015-16 and
2016-17 when balancing the 2014-15 budget.
• Any time the District enters into a collective bargaining agreement, we are
required to submit a multi-year projection confirming the District’s ability to
pay for the agreement in the current year and two subsequent years. What happens when the State adopts its budget after the Constitutional deadline?
The State Constitution requires that the Legislature adopts a State Budget no later
than June 15th
of the preceding fiscal year, and that the Governor sign the proposed
State Budget Act no later than June 30th.
When the Legislature and the Governor miss their deadlines, the requirements for
school district budget development do not change. The District will be required to
submit its 2014-15 Final Budget to the Los Angeles County Office of Education no
later than July 1, 2014 to meet its legal obligation, regardless of the adoption date of
the State budget.
Is the Final Budget balanced?
Yes. The Final Budget is balanced through the use of Proposition 30 sales tax revenues
and additional revenues flowing to the District resulting from implementation of the
Governor’s Local Control Funding Formula effective FY 2013-14.
What is the difference between Proposition 30 and Proposition 39, and what impact
did they have on the budget?
Proposition 30 provided sales tax revenue to prevent further cuts in FY 2012-
13. Furloughs were rescinded upon passage of Proposition 30 and restored the
full instructional school year.
Proposition 39 provides funding for efficiency-related upgrades to school
facilities, including installation of green energy technologies. It is not
instructional funding.
106
APPENDIX A
FREQUENTLY ASKED QUESTIONS ABOUT THE BUDGET
How can employee benefits be reported in both the General Fund and the Health
& Welfare Benefits fund? Isn’t that double counting?
The District established the Health & Welfare Benefits Fund to meet the
requirements of the Governmental Accounting Standards Board. The Health &
Welfare Benefits Fund receives contributions from different user funds with positions
that earn medical benefits. Examples of user funds include the General Fund,
Cafeteria Fund, Capital Funds and other funds with positions that earn medical
benefits. User fund contributions are transferred to the Health & Welfare Benefits
Fund. Expenditures in this fund represent the actual insurance premiums paid to
outside providers. As a result, contributions are reported as expenditures in the user
funds and reported as revenue in the Health & Welfare Benefits Fund.
Why does the estimated amount of required budget reductions change over time? The District receives or develops new financial information continuously. Revenue
and beginning balance estimates change at the following periods:
• At the First Period Interim Financial Report in December
• When the Governor announces his budget in January
• At the Second Period Interim Financial Report in March
• When the Governor publishes the “May Revise”
• In years requiring a Third Interim Financial Report, in June, when that Report
is presented
• When the Legislature and Governor adopt the State Budget in June or later.
• At various times during the year when the State Department of Education
publishes fund allocations
Expenditure estimates change at the following periods:
• At the First Period Interim Financial Report in December
• When the Governor announces his budget in January
• At the Second Period Interim Financial Report in March
• When the Governor publishes the “May Revise”
• In years requiring a Third Interim Financial Report, in June, when that Report
is presented
• During the course of the fiscal year when new revenue sources become
available and when schools or offices make budget adjustments with ongoing
(“continuous”) budget implications
• When the budget is being developed
• When we are able to develop better cost estimates internally The Budget Services & Financial Planning Division attempts to keep the
Superintendent and Board updated on a regular basis regarding significant changes in
the District’s revenue and expenditure estimates.
107

108
APPENDIX B
BUDGET PRINCIPLES AND PROCESSES
A. Principles of Budgeting and Accounting
The California School Accounting Manual and the California Education Code govern budget development for California school districts, and their standards form the basis for development of the District’s Adopted Final Budget. Among these standards are: Basis for Accounting. The California School Accounting Manual mandates that districts use either the accrual basis or the modified accrual basis in accounting for revenues and expenditures. The difference between the two is as follows:
• In the Modified Accrual Basis, revenues are recognized in the period when they become available and measurable, and expenditures are recognized when a liability is incurred, regardless of when the receipt or payment of cash takes place. School districts use the modified accrual basis in accounting for governmental funds such as the General Fund and Adult Education Fund.
• In the Accrual Basis, revenues are recorded when earned, and expenditures are recorded when a liability is incurred, regardless of when the receipt or payment of cash takes place. School districts use the accrual basis in proprietary funds such as the Cafeteria and Self-Insurance Funds, and fiduciary funds such as the Annuity Reserve Fund.
Basis for Budgeting. The California School Accounting Manual also mandates the basis for school district budgeting. It requires that “generally, for California (school districts), the basis of budgeting should be the same as the basis of accounting used in the audited financial statements. Budgetary accounting must conform to the account codes in the standardized account code structure.” California school districts are required to display their budgets by fund, by object, and by function. Budgetary accounts are “projections and show how much is estimated to be spent or received during a given period of time to carry out the local educational agency’s (LEA’s) goals.” In general, budgetary accounts have two purposes: (1) to record the estimated revenues of a fund by source and amount, and (2) to record and control the limits that are set on the expenditure levels by the appropriations. The recording of actual revenue and expenditures allows a comparison to the available amounts to be committed or expended within the limits set by law or by the governing board. Revenue Budget. For each fund, the revenue budget anticipates all income from federal, state, and local sources, as well as the anticipated beginning balance. The total of beginning balance and income is the maximum amount a school district may legally budget to spend for any fund.
Expenditure Budget. Each fund has an expenditure budget reflecting the fund’s authorized costs, and, for most funds, the anticipated expenditure level. Budget by General Fund District Defined Program. Because the General Fund budget comprises many programs, it is divided into District Defined Programs such as Special Education, Regional Occupational Centers/Skills Centers, etc., to bring into focus programs of particular interest.
109
B. The budget process
Budget Preparation. The first step in preparing the budget is to determine the cost to continue the existing program. Enrollment-related costs are adjusted for projected changes. Costs not directly controllable by the District, such as utilities, retirement contributions, insurance, continuing contractual obligations, and legal costs, are adjusted to reflect estimated expenditures for the coming fiscal year. Estimates of income are developed based on a review of federal and State statutory provisions and local revenue sources. Beginning balance amounts for the budget year are calculated utilizing a comparison of anticipated revenues and expenditures for the current year. The projected beginning balances and revenues are compared to the cost of continuing current programs to determine whether budget reductions may be necessary or whether unanticipated amounts may be available for allocation. Board and public participation. Board meetings are scheduled for discussion of proposed budget changes. These are public meetings that can be attended in person or viewed on the District’s television station at scheduled times. Members of the public may contact the District to speak on individual budget items or on the budget as a whole. A public hearing, at which any member of the public may address the Board regarding the District’s proposed budget, is mandated prior to Board adoptions of the Final Budget in June.
C. Budget revision process Budget adjustments. The Budget Services and Financial Planning Division either receives or initiates well over 20,000 requests annually to adjust or revise the adopted budget. Generally, a budget adjustment (B.A.) enables a school or office to use funds previously budgeted for a particular purpose. Certain limitations apply to B.A.s. For example, schools or offices may not transfer funds from a restricted program into an unrestricted one (e.g., transfers from Title I into a District-funded school instructional materiel account would not be permitted). B.A.s may be either continuous (ongoing), or limited to the remainder of the current fiscal year. They may be either “routine,” requiring only normal handling by staff, or “non-routine,” requiring formal approval by the Board of Education. Categories of “non-routine” B.A.s are determined by the Board, and are currently defined as follows:
A. All B.A.s from object of expenditure 7900(IFS) – Undistributed Reserves.
B. All B.A.s which increase the total number of regular, non-school-based budgeted positions, except for those that are fully funded from the budgeted resources of the requesting office (“cost-neutral” budget adjustments).
In addition to the above, California Education Code §42602 authorizes Boards of Education to increase income to reflect unanticipated new revenues during the course of the fiscal year.
110

APPENDIX C
HOW EDUCATION IS FUNDED IN CALIFORNIA
Prior to the 1970s, California’s schools were financed largely with property tax revenues imposed for the benefit
of local school districts. This led to dramatic differences in school district funding. A school district with very
high property values could raise more revenue per pupil with a low property tax rate, while a district with low
property values could raise less with a much higher property tax rate. The state attempted to reduce these
differences by providing more state aid to low-property wealth districts. Despite this effort, per pupil revenues
varied considerably between districts. In fiscal year 1968-69, for example, per pupil expenditures ranged from
$577 in Baldwin Park to $1,232 in Beverly Hills.1 This disparity lead to the important Serrano v. Priest (1976)
equal protection litigation, which was resolved through statutory enactments that called for a general equalization
of state apportionment revenue to school districts.
In 1978, voters approved Proposition 13. The new law limited property tax rates to 1 percent of a property’s
assessed value at the time of acquisition. Proposition 13 reduced property tax revenues available for local
governments and school districts. To cushion the impact to school districts, the state Legislature shifted state
dollars to schools.
With the adoption of Proposition 98 (1988) and Proposition 111 (1990), a minimum funding level from State and
local property taxes was provided to K-14 public schools. California schools today receive the large majority of
their funding from the State, primarily from income and sales tax revenues. To a much lesser extent, districts also
receive some local property revenues that are collected at the local level but distributed by the State. Income and
sales taxes are more volatile revenue sources than property taxes. When the economy sours, unemployment rises,
leading to fewer purchases. This correspondingly leads to less income and goods to be taxed. As a result, fewer
dollars become available for schools.
California school districts therefore face dramatic cyclical funding variations as the economy rises and falls.
Further, California’s Governor and State Legislature, whose vote on the State Budget Act determines how State
funds may be spent, have enormous control over the ability of local school districts to utilize funding to meet the
specific needs of their students. Approximately 60% of all school district funds in California are general purpose
in nature; the remaining 40% are restricted to specific purposes, such as the needs of special education students,
low income students, limited English-proficient students, and specific grade levels. This greatly constrains local
boards of education in their spending decisions. They are further constrained in their ability to raise taxes
independently of the State. Bond issues, usually limited to building programs, require a 55% vote for passage.
Parcel tax measures require a 2/3 vote.
The Governor has recently proposed revising the state’s allocation formula for school districts to increase
flexibility at the local level. This proposal is known as the Local Control Funding Formula (LCFF). Under LCFF,
the state would provide a base grant for all students and additional grants for high-need students such as English
Learners and socio-economically disadvantaged pupils.
The following provides information on legislation and court rulings that have significantly affected California’s
educational funding.2
Senate Bill 90 (1972) – In 1972, the Legislature established revenue limits for California public schools. The legislation placed ceilings on the amount of tax money each district could receive per pupil. This was in order to help reduce the wide differences in school funding between high and low property-wealth districts. The 1972-73 general purpose spending level became the base amount in determining each district’s annual revenue limit.
1 California Budget Project, School Finance in California and the Proposition 98 Guarantee (April 2006).
2 Many of these rulings have been amended by subsequent legislation.
111
APPENDIX C
HOW EDUCATION IS FUNDED IN CALIFORNIA
Serrano v. Priest (1976) – This 1976 California Supreme Court decision declared the existing system of financing schools unconstitutional because it violated the equal protection clause of the State Constitution. The Court ruled that property tax rates and per pupil expenditures should be equalized and that, by 1980, the difference in revenue limits per pupil should be less than $100 (the “Serrano band”). This allowable difference in revenue limits has subsequently been adjusted for inflation. In equalizing funding, districts are divided into three types: elementary, high school, and unified. They are then further divided into small and large districts to ensure that appropriate funding comparisons are made. Special purpose or “categorical” funds are excluded from this calculation. Assembly Bill 65 (1977) – In response to the Serrano decision, the California State Legislature passed AB 65, creating an annual inflation adjustment based on a sliding scale in order to equalize revenue limits among districts over time. Higher inflation increases were provided to districts with low revenue limits, with lower (occasionally no) inflation adjustments for high revenue districts. Proposition 13 (1978) – This constitutional amendment (the “Jarvis Amendment”) approved by California voters in 1978 limits property taxes to 1% of a property’s assessed value, and caps increases in assessed value at 2% annually or the percentage growth in the Consumer Price Index, whichever is less. It also mandated a 2/3 vote for approval of new taxes, such as parcel taxes. Assembly Bill 8 (1978) – In response to Proposition 13, the Legislature established a formula for dividing property taxes among cities, counties, and school districts. This shielded schools from some of the measure’s effects. In the process, the State replaced the lost property taxes and effectively took control of school district funding. Gann Limit (Proposition 4, 1979) – Proposition 4 created a constitutional limit on government spending at every level in the State, including school districts. No agency’s expenditures can exceed its Gann Limit, which is adjusted annually for inflation and population increase. Senate Bill 813 (1983) – SB 813 provided additional money to school districts through equalization of revenue limits and new categorical programs, longer school day/year, and higher beginning teachers’ salaries. It also established statewide model curriculum standards. Lottery Initiative (1984) – In November 1984, voters approved Proposition 37, a constitutional amendment establishing the California State Lottery. Provisions guarantee that a minimum of 34% of total lottery receipts be distributed to public schools, colleges, and universities. Funds are to supplement, not replace, State support for education. Lottery funds cannot be used for purchase or construction of facilities, for land, or research. Under Proposition 20, passed in March 2000, 50% of lottery funding above the 1997-98 funding level must be used for purchase of instructional materials. Proposition 98 (1988) – This constitutional amendment guarantees a minimum funding level from State and property taxes for K-14 public schools in a complex formula based on State tax revenues. It also requires each school to prepare and publicize an annual School Accountability Report Card (SARC) that covers at least 13 required topics. A 2/3 vote of the Legislature and the Governor’s signature are required to suspend Proposition 98 for a year. Proposition 111 (1990) – This constitutional amendment changed the inflation index for the Gann Limit calculation, effectively raising the limit. Additionally, the minimum Proposition 98 funding guarantee was changed to reflect the growth of California’s overall economy. It did so by shifting the adjustment from the growth of per capita personal income (which historically has tended to be a lower amount) to the growth in State per capita General Fund revenues plus one-half percent.
112
APPENDIX C
HOW EDUCATION IS FUNDED IN CALIFORNIA
Assembly Bill 1200 (1991) – AB 1200 established a system for school district accounting practices that specifies how districts must report their revenues and expenditures. It requires that districts project their fiscal solvency two years out, and provide the State with Board-approved financial interim reports twice annually. County offices of education are made responsible for monitoring and providing technical assistance to their districts. AB 2756 (2004) adds to the responsibilities and control of county offices of education over the budget and expenditure reporting of local districts. Class Size Reduction, K-3 (SB 1777, 1996) – This legislation provided incentives for school districts to reduce K-3 classes to a pupil-teacher ratio of no more than 20 to 1, and provided additional funding to districts that met these ratios. A one-time allocation of $25,000 per added classroom was also made available. Senate Bill 1468 (1997) – This legislation changed the way average daily attendance (ADA) is counted, largely eliminating the concept of “excused absences” and basing ADA on students who are actually at school. To ensure that districts did not lose a large proportion of their revenue, the per-pupil revenue limit rate was adjusted by the average attendance rates of each individual school district. Assembly Bill 602 (1997) – This legislation revised the state’s allocation formula for special education funding
for school districts. The formula distributes a large share of special education funds based on total student
population of each school district, rather than the number of special education students at each district or the
specific needs of those students.
Assembly Bill 1115 (1999) – Under the terms of this bill, an independent charter school is deemed a school of the chartering school district for the purposes of establishing its special education local plan (“SELPA”) status unless it designates otherwise in its charter petition. As such, independent charter schools which are members of a school district’s SELPA are entitled to an equitable share of special education services and funding. Assembly Bill 1600 (1999) – This bill gave charter schools the option to receive funding directly from the State, rather than from their local district, in the form of a block grant. Proposition 39 (2000) - This constitutional amendment established a 55% vote threshold for the issuance of school facilities construction bonds. In order to issue bonds under Proposition 39, the District must, among other things, use Proposition 39 bond funds only for those projects specifically listed in the ballot measure and strategic execution plans; create and maintain a citizens’ bond oversight committee; and annually ensure that performance and financial audits are conducted for Proposition 39 facilities projects. Proposition 39 also requires the District to offer reasonably equivalent District school facility space to independent charter schools.
Proposition 49 (2002) - This voter initiative, otherwise known as the "The After School Education and Safety Program Act of 2002," increased state funding for before and after school programs at elementary and middle schools. Funding is provided to the District through a competitive grant process with priority given to school sites that have at least 50 percent of its students receiving free and reduced priced lunch. A portion of state funding under Proposition 49 satisfies the revenue limit guarantee under Proposition 98.
Assembly Bill 825 (2009) - Under the terms of this bill, the District receives funding for its Integration Program and for other instructional program needs as part of a targeted instructional improvement block grant.
Senate Bill 1133 (Quality Education Investment Act of 2006) – Adopted in 2006 as a settlement of the CTA v. Schwarzenegger et al. lawsuit, the QEIA program provides targeted funding for eligible schools in API deciles 1, 2 and 3. The funding is to be used primarily for class-size reduction purposes and overall academic achievement goals.
113

APPENDIX C
HOW EDUCATION IS FUNDED IN CALIFORNIA
Education Trailer Bill - Senate Bill 4 of the 2009-10 Third Extraordinary Session (SBX3 4, 2009) – For
fiscal years 2008-09 through 2012-13, this bill established: (1) Categorical Program Flexibility, which grouped
categorical programs into Tiers I, II, and III, and identified Tier III programs as unrestricted; (2) the public
hearing requirement as a condition for receipt of Tier III funds; (3) the use of 2008-09 as the base year in
calculating for most of the Tier III categorical programs and use of 2007-08 as the base year for calculating the
revenue limit-related Tier III categorical programs; and (4) the use of June 30, 2008 ending balances as
unrestricted funds with a few program exceptions. See the glossary for additional details on Tiers I, II, and III
programs. In addition, SBX3 4 relaxed K-3 Class Size Reduction penalties for fiscal years 2008-09 through 2011-
12 only.
Proposition 30 (2012) The initiative , passed on November 2012 provides for a personal income tax increase
over seven years for California residents with an annual income over $250,000, through the end of 2018. This also
provides for an increase in sales tax by 0.25 percent over four years (from January 1, 2013 through December 31,
2016). This initiative funds K-12 public education among other purposes.
Local Control Funding Formula (2013) – This legislation simplified the state’s allocation formula for school
districts. The new funding formula intends to increase transparency for state funding to schools and increase
flexibility at the local level. Under LCFF, the state provides a base grant for all students and additional grants for
high-need students such as English Learners and socio-economically disadvantaged pupils. Proposition 39 (2013) – The California Clean Energy Jobs Act changed the corporate income tax code and
allocates projected revenue to the state General Fund and the Clean Energy Job Creation Fund for 5 fiscal years
beginning 2013-14. Under the initiative, available funds are to be used for eligible projects to improve energy
efficiency and expand clean energy generation in schools. School Districts can request funding by submitting an
application to the California Energy Commission.
Source: This section of the budget relies heavily on information found in the State Funding of K-12 Education section of the State Funding of Education website, from EdSource.
114
APPENDIX D
LOCAL CONTROL FUNDING FORMULA
Up until fiscal year 2012-13, the Revenue Limit was the basic financial support for District activities. In
fiscal year 2013-14, Governor Jerry Brown implemented the new State funding formula for local
education agencies called Local Control Funding Formula (LCFF). AB 97 was enacted, amending
California Education Code 42238.07 which relates to education finance. The goal of LCFF is to
significantly simplify how state funding is provided to local education agencies (LEAs), to create
transparency of funding, and to grant local control of funds.
Unlike the revenue limit which was based largely on COLA and average daily attendance (ADA), the
LCFF includes several variables to calculate an LEA’s entitlement; these are ADA, enrollment,
unduplicated student count, COLA, and gap funding percentage. The change in the reporting of ADA
was driven by the LCFF formula where ADAs are summed into grade spans of K-3, 4-6, 7-8, and 9-12.
The unduplicated student count refers to pupils who are identified as either English Learner, met the
requirements for free or reduced-priced meals, or in foster care, that are counted only once even if the
pupil meets more than one of the criteria mentioned. All pupil counts are based on Fall 1 certified
enrollment reported in the California Longitudinal Pupil Achievement Data System (CALPADS) as of
fall Census Day (first Wednesday in October).
The LCFF’s targeted entitlement includes a base grant, augmentation grants for K-3 Grade Span
Adjustment (formerly K-3 Class Size Reduction Program), Grades 9-12 Career Technical Education,
Supplemental and Concentration grants, Pupil Transportation, and Targeted Instructional Improvement
Block Grant. The total of these is the targeted full funding at the end of the implementation period,
fiscal year 2020-21. The current year’s funding is equals to a percent of the difference between the
targeted funding and a “hold harmless” amount, plus the “hold harmless” amount. The difference
mentioned here is called the gap funding. The gap funding represents a portion of the increase above
the “hold harmless” amount, which is funded incrementally each fiscal year until full implementation.
As a condition of receiving the K-3 Grade Span Adjustment, LAUSD is required to maintain an
average K-3 class size enrollment of not more than 24 pupils or a collectively-bargained alternative
class size, at each school site. Failure of one school site to exceed this average class size will jeopardize
the whole amount of LAUSD’s K-3 Grade Span Adjustment. Charter schools do not have to maintain
or make progress toward the required average class size of 24 pupils.
The supplemental and concentration grants are dependent on an LEA’s number of unduplicated student
count, specifically, the percentage of the unduplicated count to total enrollment. And although LCFF
funding is considered unrestricted, the supplemental and concentration grants are to be spent on the
targeted disadvantaged student population. LEAs are required to specify on the Local Control
Accountability Plan (LCAP), the amount of expenditures for the targeted disadvantaged student
population.
The LCFF eliminated the revenue limit and most of the state categorical programs funding streams. The
categorical programs that are folded in the LCFF are not bound by the program compliance
requirements that existed before the implementation of LCFF. Below is a list of categorical programs
participated in by LAUSD that are now folded into the LCFF.
115
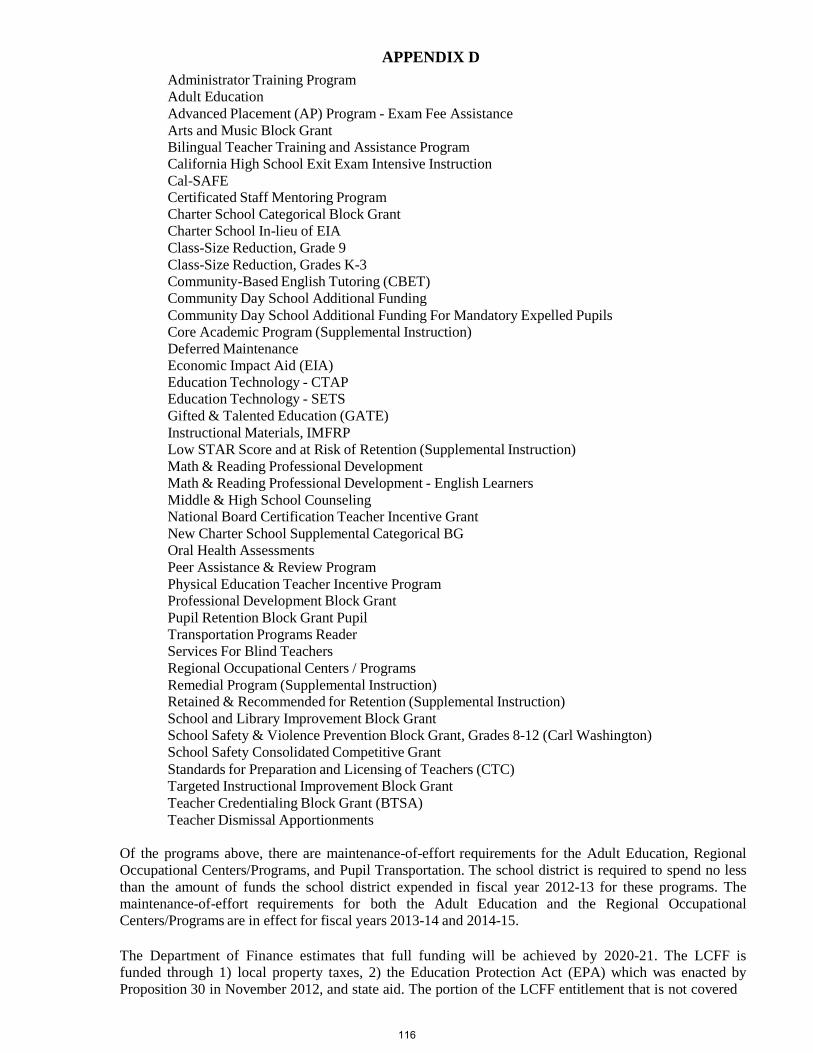
APPENDIX D
Administrator Training Program
Adult Education
Advanced Placement (AP) Program - Exam Fee Assistance
Arts and Music Block Grant Bilingual Teacher Training and Assistance Program
California High School Exit Exam Intensive Instruction
Cal-SAFE Certificated Staff Mentoring Program
Charter School Categorical Block Grant
Charter School In-lieu of EIA
Class-Size Reduction, Grade 9
Class-Size Reduction, Grades K-3
Community-Based English Tutoring (CBET)
Community Day School Additional Funding
Community Day School Additional Funding For Mandatory Expelled Pupils Core Academic Program (Supplemental Instruction)
Deferred Maintenance
Economic Impact Aid (EIA)
Education Technology - CTAP Education Technology - SETS
Gifted & Talented Education (GATE)
Instructional Materials, IMFRP
Low STAR Score and at Risk of Retention (Supplemental Instruction)
Math & Reading Professional Development
Math & Reading Professional Development - English Learners
Middle & High School Counseling National Board Certification Teacher Incentive Grant
New Charter School Supplemental Categorical BG
Oral Health Assessments
Peer Assistance & Review Program
Physical Education Teacher Incentive Program Professional Development Block Grant
Pupil Retention Block Grant Pupil
Transportation Programs Reader
Services For Blind Teachers
Regional Occupational Centers / Programs
Remedial Program (Supplemental Instruction) Retained & Recommended for Retention (Supplemental Instruction)
School and Library Improvement Block Grant
School Safety & Violence Prevention Block Grant, Grades 8-12 (Carl Washington)
School Safety Consolidated Competitive Grant
Standards for Preparation and Licensing of Teachers (CTC)
Targeted Instructional Improvement Block Grant
Teacher Credentialing Block Grant (BTSA)
Teacher Dismissal Apportionments
Of the programs above, there are maintenance-of-effort requirements for the Adult Education, Regional
Occupational Centers/Programs, and Pupil Transportation. The school district is required to spend no less
than the amount of funds the school district expended in fiscal year 2012-13 for these programs. The
maintenance-of-effort requirements for both the Adult Education and the Regional Occupational
Centers/Programs are in effect for fiscal years 2013-14 and 2014-15.
The Department of Finance estimates that full funding will be achieved by 2020-21. The LCFF is
funded through 1) local property taxes, 2) the Education Protection Act (EPA) which was enacted by
Proposition 30 in November 2012, and state aid. The portion of the LCFF entitlement that is not covered
116
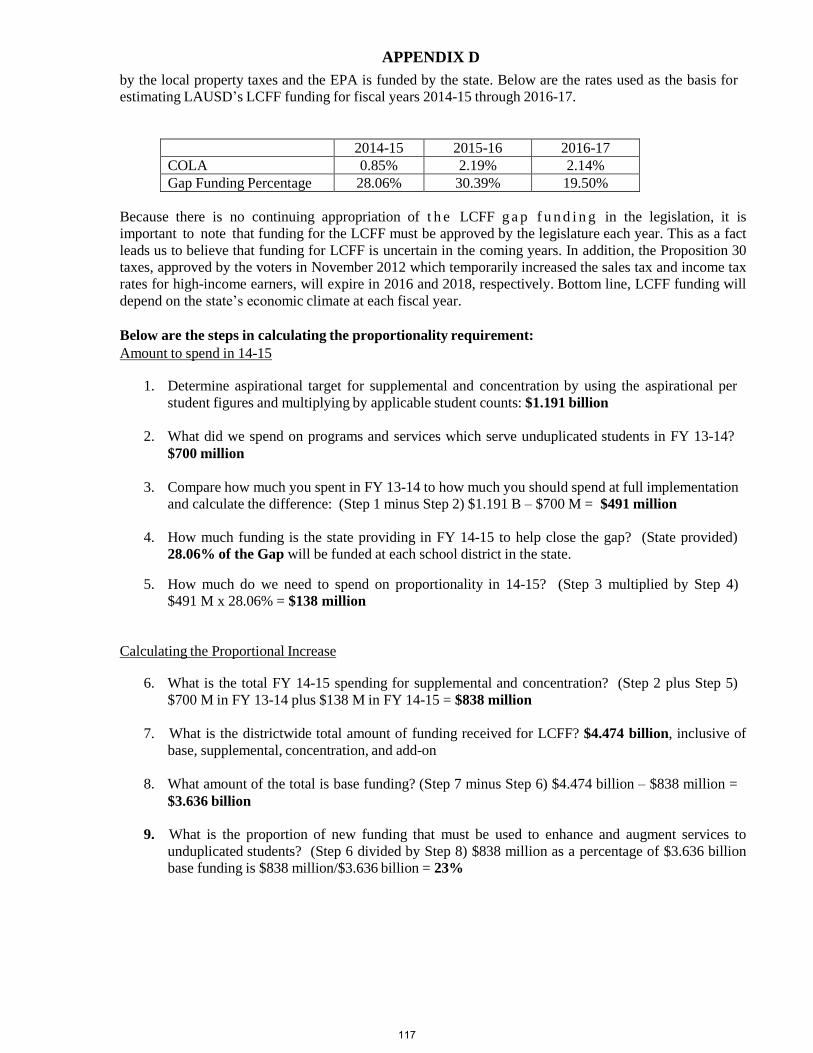
APPENDIX D
by the local property taxes and the EPA is funded by the state. Below are the rates used as the basis for
estimating LAUSD’s LCFF funding for fiscal years 2014-15 through 2016-17.
2014-15 2015-16 2016-17
COLA 0.85% 2.19% 2.14%
Gap Funding Percentage 28.06% 30.39% 19.50%
Because there is no continuing appropriation of t h e LCFF g a p f u n d i n g in the legislation, it is
important to note that funding for the LCFF must be approved by the legislature each year. This as a fact
leads us to believe that funding for LCFF is uncertain in the coming years. In addition, the Proposition 30
taxes, approved by the voters in November 2012 which temporarily increased the sales tax and income tax
rates for high-income earners, will expire in 2016 and 2018, respectively. Bottom line, LCFF funding will
depend on the state’s economic climate at each fiscal year.
Below are the steps in calculating the proportionality requirement:
Amount to spend in 14-15
1. Determine aspirational target for supplemental and concentration by using the aspirational per
student figures and multiplying by applicable student counts: $1.191 billion
2. What did we spend on programs and services which serve unduplicated students in FY 13-14?
$700 million
3. Compare how much you spent in FY 13-14 to how much you should spend at full implementation
and calculate the difference: (Step 1 minus Step 2) $1.191 B – $700 M = $491 million
4. How much funding is the state providing in FY 14-15 to help close the gap? (State provided)
28.06% of the Gap will be funded at each school district in the state.
5. How much do we need to spend on proportionality in 14-15? (Step 3 multiplied by Step 4)
$491 M x 28.06% = $138 million
Calculating the Proportional Increase
6. What is the total FY 14-15 spending for supplemental and concentration? (Step 2 plus Step 5)
$700 M in FY 13-14 plus $138 M in FY 14-15 = $838 million
7. What is the districtwide total amount of funding received for LCFF? $4.474 billion, inclusive of
base, supplemental, concentration, and add-on
8. What amount of the total is base funding? (Step 7 minus Step 6) $4.474 billion – $838 million =
$3.636 billion
9. What is the proportion of new funding that must be used to enhance and augment services to
unduplicated students? (Step 6 divided by Step 8) $838 million as a percentage of $3.636 billion
base funding is $838 million/$3.636 billion = 23%
117
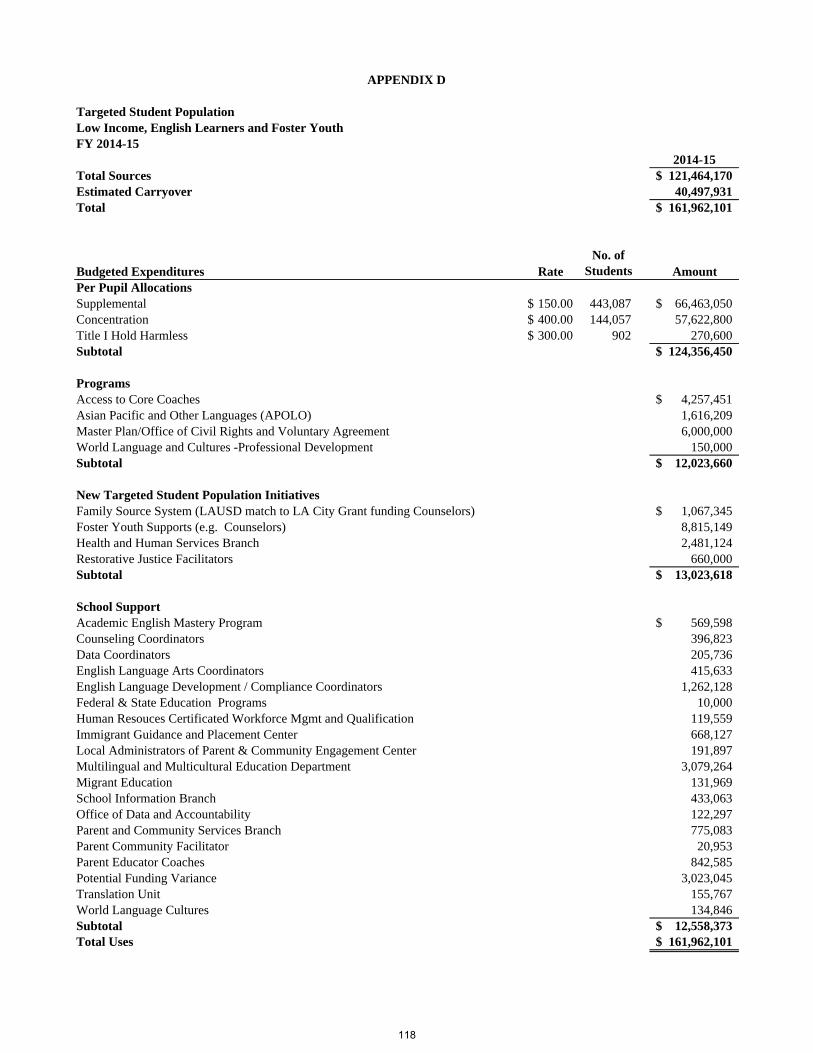
Targeted Student PopulationLow Income, English Learners and Foster YouthFY 2014-15
2014-15Total Sources 121,464,170$ Estimated Carryover 40,497,931 Total 161,962,101$
Budgeted Expenditures RateNo. of
Students AmountPer Pupil AllocationsSupplemental 150.00$ 443,087 66,463,050$ Concentration 400.00$ 144,057 57,622,800 Title I Hold Harmless 300.00$ 902 270,600 Subtotal 124,356,450$
ProgramsAccess to Core Coaches 4,257,451$ Asian Pacific and Other Languages (APOLO) 1,616,209 Master Plan/Office of Civil Rights and Voluntary Agreement 6,000,000 World Language and Cultures -Professional Development 150,000 Subtotal 12,023,660$
New Targeted Student Population InitiativesFamily Source System (LAUSD match to LA City Grant funding Counselors) 1,067,345$ Foster Youth Supports (e.g. Counselors) 8,815,149 Health and Human Services Branch 2,481,124 Restorative Justice Facilitators 660,000 Subtotal 13,023,618$
School SupportAcademic English Mastery Program 569,598$ Counseling Coordinators 396,823 Data Coordinators 205,736 English Language Arts Coordinators 415,633 English Language Development / Compliance Coordinators 1,262,128 Federal & State Education Programs 10,000 Human Resouces Certificated Workforce Mgmt and Qualification 119,559 Immigrant Guidance and Placement Center 668,127 Local Administrators of Parent & Community Engagement Center 191,897 Multilingual and Multicultural Education Department 3,079,264 Migrant Education 131,969 School Information Branch 433,063 Office of Data and Accountability 122,297 Parent and Community Services Branch 775,083 Parent Community Facilitator 20,953 Parent Educator Coaches 842,585 Potential Funding Variance 3,023,045 Translation Unit 155,767 World Language Cultures 134,846 Subtotal 12,558,373$ Total Uses 161,962,101$
APPENDIX D
118
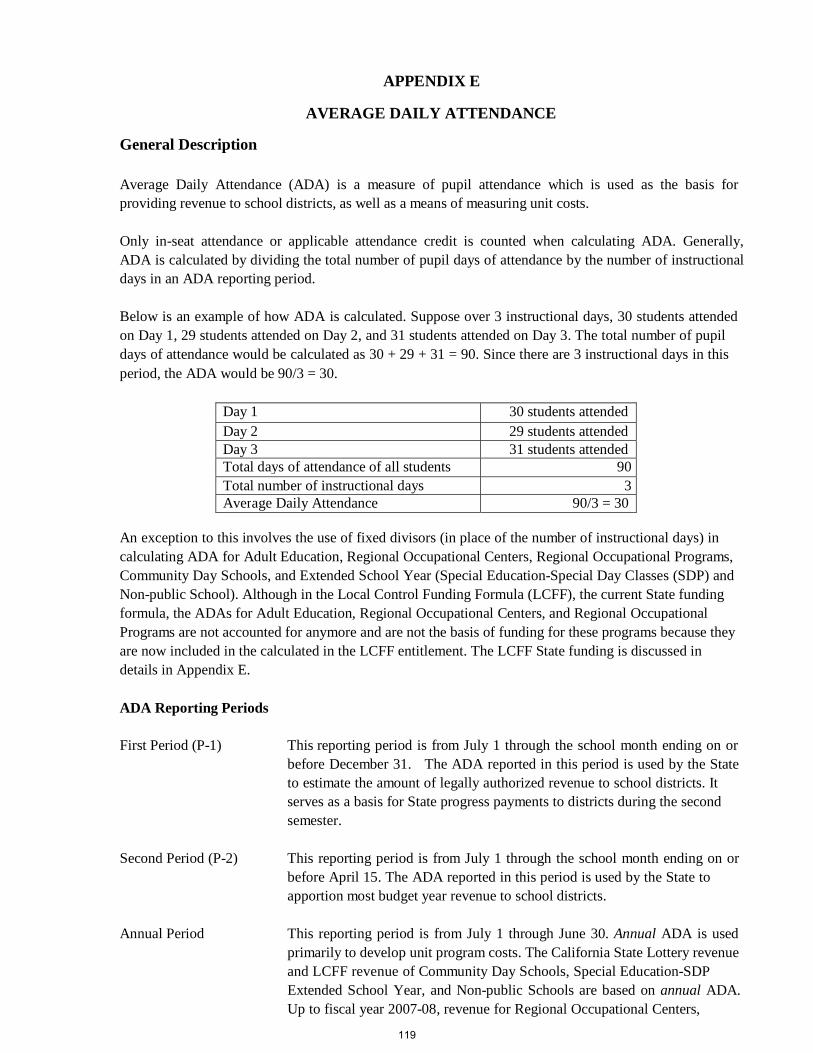
APPENDIX E
General Description
AVERAGE DAILY ATTENDANCE
Average Daily Attendance (ADA) is a measure of pupil attendance which is used as the basis for providing revenue to school districts, as well as a means of measuring unit costs. Only in-seat attendance or applicable attendance credit is counted when calculating ADA. Generally, ADA is calculated by dividing the total number of pupil days of attendance by the number of instructional days in an ADA reporting period. Below is an example of how ADA is calculated. Suppose over 3 instructional days, 30 students attended on Day 1, 29 students attended on Day 2, and 31 students attended on Day 3. The total number of pupil days of attendance would be calculated as 30 + 29 + 31 = 90. Since there are 3 instructional days in this period, the ADA would be 90/3 = 30.
Day 1 30 students attended Day 2 29 students attended Day 3 31 students attended Total days of attendance of all students 90 Total number of instructional days 3 Average Daily Attendance 90/3 = 30
An exception to this involves the use of fixed divisors (in place of the number of instructional days) in calculating ADA for Adult Education, Regional Occupational Centers, Regional Occupational Programs, Community Day Schools, and Extended School Year (Special Education-Special Day Classes (SDP) and Non-public School). Although in the Local Control Funding Formula (LCFF), the current State funding formula, the ADAs for Adult Education, Regional Occupational Centers, and Regional Occupational Programs are not accounted for anymore and are not the basis of funding for these programs because they are now included in the calculated in the LCFF entitlement. The LCFF State funding is discussed in details in Appendix E. ADA Reporting Periods
First Period (P-1) This reporting period is from July 1 through the school month ending on or
before December 31. The ADA reported in this period is used by the State to estimate the amount of legally authorized revenue to school districts. It serves as a basis for State progress payments to districts during the second semester.
Second Period (P-2) This reporting period is from July 1 through the school month ending on or
before April 15. The ADA reported in this period is used by the State to apportion most budget year revenue to school districts.
Annual Period This reporting period is from July 1 through June 30. Annual ADA is used
primarily to develop unit program costs. The California State Lottery revenue and LCFF revenue of Community Day Schools, Special Education-SDP Extended School Year, and Non-public Schools are based on annual ADA. Up to fiscal year 2007-08, revenue for Regional Occupational Centers,
119
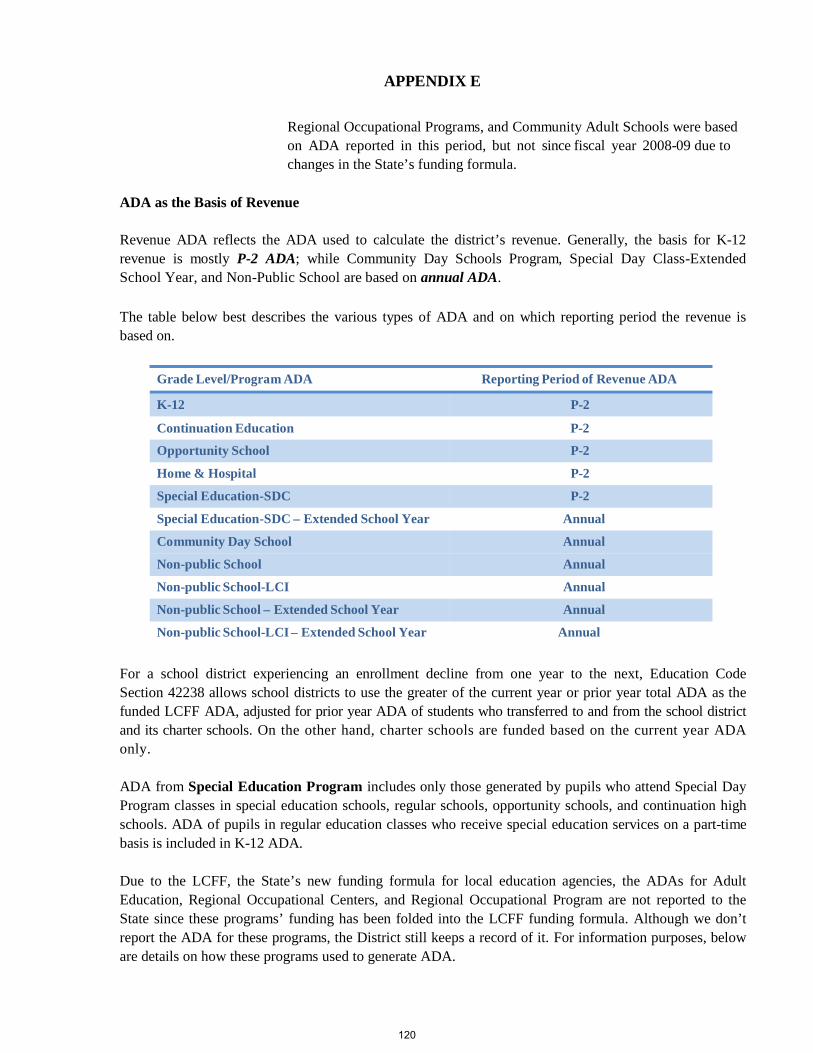
APPENDIX E Regional Occupational Programs, and Community Adult Schools were based on ADA reported in this period, but not since fiscal year 2008-09 due to changes in the State’s funding formula.
ADA as the Basis of Revenue
Revenue ADA reflects the ADA used to calculate the district’s revenue. Generally, the basis for K-12 revenue is mostly P-2 ADA; while Community Day Schools Program, Special Day Class-Extended School Year, and Non-Public School are based on annual ADA.
The table below best describes the various types of ADA and on which reporting period the revenue is based on.
Grade Level/Program ADA Reporting Period of Revenue ADA
K-12 P-2
Continuation Education P-2
Opportunity School P-2
Home & Hospital P-2
Special Education-SDC P-2
Special Education-SDC – Extended School Year Annual
Community Day School Annual
Non-public School Annual
Non-public School-LCI Annual
Non-public School – Extended School Year Annual
Non-public School-LCI – Extended School Year Annual
For a school district experiencing an enrollment decline from one year to the next, Education Code Section 42238 allows school districts to use the greater of the current year or prior year total ADA as the funded LCFF ADA, adjusted for prior year ADA of students who transferred to and from the school district and its charter schools. On the other hand, charter schools are funded based on the current year ADA only. ADA from Special Education Program includes only those generated by pupils who attend Special Day Program classes in special education schools, regular schools, opportunity schools, and continuation high schools. ADA of pupils in regular education classes who receive special education services on a part-time basis is included in K-12 ADA. Due to the LCFF, the State’s new funding formula for local education agencies, the ADAs for Adult Education, Regional Occupational Centers, and Regional Occupational Program are not reported to the State since these programs’ funding has been folded into the LCFF funding formula. Although we don’t report the ADA for these programs, the District still keeps a record of it. For information purposes, below are details on how these programs used to generate ADA.
120
APPENDIX E Adult Education Programs are hourly programs and pupils are considered in attendance if they attend at least once during the scheduled hour. Only those units of ADA earned that fall under the ten mandated classes below were included in the revenue calculation for prior fiscal years ending in 2007-08.
1. Parenting 2. Elementary basic education in core academic areas for pupils not possessing a diploma
or equivalency and to provide remedial instruction 3. Secondary basic education in core academic areas for pupils not possessing a diploma
or equivalency and to provide remedial instruction 4. English-As-A-Second Language (ESL) 5. Citizenship 6. Vocational education; short-term career technical programs with high employment potential 7. Programs for older adults 8. Adults with disabilities 9. Home economics education 10. Health and safety education
A day of attendance in adult education is three hours; 525 hours (three hours per day multiplied by 175 days) equals one adult ADA. Pupil attendance may be more or less than the three hours in a day, and the adult school may operate more or less than the 175 days a year. Therefore, adult ADA is simply total hours of attendance divided by 525. If more than 175 days were offered, it is possible for a student to earn more than one ADA. Regional Occupational Centers/Programs (ROC/P) are hourly programs and pupils are considered in attendance if they attend at least once during the scheduled hour. Generally, there is no limit on the number of ROC/P hours that might be earned by a single pupil. If a pupil is enrolled in ROC/P as part of a work experience program, however, the hours are capped at 15 per calendar week. A day of attendance for pupils in a regional occupational center and regional occupational program is three hours; 525 hours is equal to one ADA.
As part of the ROC/P, the district offers programs for apprentices which are funded by the State based on the lesser of the actual hours earned or State-approved number of hours, times a rate per hour. The actual hours earned are now reported to the California Community Colleges Chancellor’s Office who also allocates the funding to the District. The funding for this program is outside of the LCFF funding formula.
121
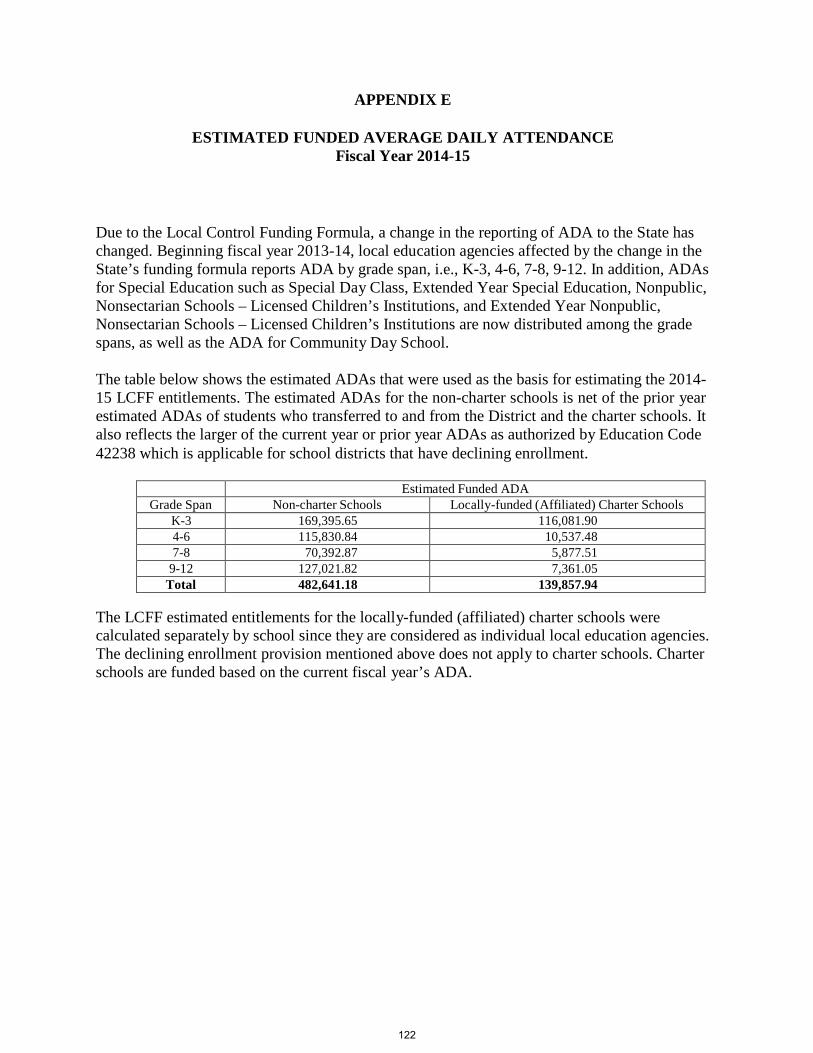
APPENDIX E
ESTIMATED FUNDED AVERAGE DAILY ATTENDANCE Fiscal Year 2014-15
Due to the Local Control Funding Formula, a change in the reporting of ADA to the State has changed. Beginning fiscal year 2013-14, local education agencies affected by the change in the State’s funding formula reports ADA by grade span, i.e., K-3, 4-6, 7-8, 9-12. In addition, ADAs for Special Education such as Special Day Class, Extended Year Special Education, Nonpublic, Nonsectarian Schools – Licensed Children’s Institutions, and Extended Year Nonpublic, Nonsectarian Schools – Licensed Children’s Institutions are now distributed among the grade spans, as well as the ADA for Community Day School.
The table below shows the estimated ADAs that were used as the basis for estimating the 2014- 15 LCFF entitlements. The estimated ADAs for the non-charter schools is net of the prior year estimated ADAs of students who transferred to and from the District and the charter schools. It also reflects the larger of the current year or prior year ADAs as authorized by Education Code 42238 which is applicable for school districts that have declining enrollment.
Estimated Funded ADA
Grade Span Non-charter Schools Locally-funded (Affiliated) Charter Schools K-3 169,395.65 116,081.90 4-6 115,830.84 10,537.48 7-8 70,392.87 5,877.51
9-12 127,021.82 7,361.05 Total 482,641.18 139,857.94
The LCFF estimated entitlements for the locally-funded (affiliated) charter schools were calculated separately by school since they are considered as individual local education agencies. The declining enrollment provision mentioned above does not apply to charter schools. Charter schools are funded based on the current fiscal year’s ADA.
122

APPENDIX F
DISTRICT AND COMMUNITY PROFILE
The Los Angeles Unified School District covers 710 square miles, encompassing most of the
City of Los Angeles, all or parts of 31 other cities, and various unincorporated areas of Los
Angeles County. Approximately 4.8 million people live within the District’s boundaries,
including 3.8 million who live within Los Angeles City limits.
District Characteristics The Los Angeles Unified School District is the nation’s second largest school district. Its student
population mirrors the ethnic and financial diversity of the communities it serves: Enrollment. The total K-12 enrollment as of September 2013 was 651,496 students, including
those attending magnet, opportunity, and continuation schools and centers, charter schools, and
schools for the handicapped. Total K-12 enrollment was divided between regular District
schools (556,115) and fiscally independent charter schools (95,381). When one includes
individuals served through community adult schools, regional occupational centers and
programs, skills centers, and early childhood education centers, the District’s total enrollment is
approximately 726,398. Student Characteristics. The District’s students come from a wide variety of backgrounds.
According to the most recent 2013-14 survey, which does not include charter school data, some
93 languages other than English are spoken in LAUSD schools by the District’s 157,824 students
who were still learning to speak English proficiently, with the primary non-English languages
being Spanish (93.1% of English learners), Korean (1.0%), Armenian (1.1%), Tagalog (0.9%),
Cantonese (0.4%), Arabic (0.4%), Vietnamese (0.3%) and Russian (0.4%). The District’s
student population can be summarized by ethnicity as follows: Hispanic (74.0%), Black, not
Hispanic (8.8%), White, not Hispanic (9.2%), Asian (6.4%), American Indian/Alaskan Native
(0.4%), and Pacific Islander (0.4%). Approximately 73.40% of LAUSD students qualify for
special funding under federal poverty guidelines. (Source – LAUSD 2013-14 Consolidated
Application). Structure and Number of Schools. Continuing in the 2013-14 fiscal year, the District is divided
into five Local Education Service Centers which serve elementary, middle, and senior high
schools. The Local Education Service Centers provided support to 18 primary centers, 457
elementary schools, 84 middle schools, 100 high schools, 21 multi-grade or “span” schools, and
34 magnet schools. For the 2013-14 school year there are an additional 540 District
school/center sites, which can be summarized as follows:
• 148 Magnet Centers • 11 Fiscally Independent Charter Primary Schools
• 4 Other Learning Communities • 48 Fiscally Independent Charter Elementary Schools
• 13 Special Education Schools • 39 Fiscally Independent Charter Middle Schools
• 81 Options Schools (including 26 AEWC) • 54 Fiscally Independent Charter High Schools
• 85 Early Education Centers • 44 Fiscally Independent Charter Span Schools
• 10 Adult Service Centers • 1 ROP Center
• 1 Home/Hospital • 1 Centers for Advanced Transition Skills (multiple
physical locations)
123
APPENDIX F
Employees. Based on employee reporting and classifications for the 2013-14 fiscal year, the
District had 60,139 regular employees, including 27,813 teachers 5,792 certificated support
personnel and administrators, and 26,534 classified personnel. A “certificated” employee must
hold a requisite teaching, support service or an administrative services credential.
Community Characteristics Economic Characteristics. Los Angeles is the most populous county in the nation, and is larger
in population than 43 states. Population eclipsed the 10 million mark in 2013, and will continue
on a modest growth of just under one percent per year. Los Angeles County’s largest industry
clusters by employment are entertainment, trade (transportation, logistics and distribution),
business services, knowledge creation and fashion. The various elements of the Los Angeles County economy experience cyclical trends. Among
the trends seen in 2014 are the following:
• Los Angeles County’s population continues to increase. The Los Angeles County
Economic Development Corporation (LAEDC) projects an increase of approximately
70,000, or 0.7%, in 2014.
• Total estimated 2014 nonfarm employment in Los Angeles County is expected to
increase by 1.6% or 61,800 jobs, following an increase of 1.6%, or 61,600 jobs in 2013.
By 2015, nonfarm employment is expected to exceed four million, but it may be 2016
or 2017 before nonfarm employment exceeds the peak of 4.12 million reached in 2007. • LAEDC projects total personal income will increase by 4.5% in 2014 and 4.7% in 2015.
The per capita personal income is expected to average $46,715 in 2014, up by 4.0% over
2013.
• LAEDC forecasts the Consumer Price Index will increase by 1.4% in 2014.
• LAEDC forecasts an average unemployment rate for Los Angeles County of 8.7.0% for
2014, a slight decrease from 2013 average of 9.8%. The unemployment rate is expected
to decline in 2015 to an average 7.8%. The largest employment gains in 2014 are
predicted in health services, leisure & hospitality, professional scientific & technology,
administration & support, and construction. Government entities will experience
reduction in work force associated with continuing budget problems. • Approximately 15,700 new housing permits were issued in 2013, a 19.8% increase from
13,100 permits issued in 2012. LAEDC estimates that approximately 21,100 permits will
be issued in 2014 and 27,200 permits will be issued in 2015.
• The value of nonresidential building permits issued during 2013 increased 9.4% from
2012. LAEDC forecasts a 13.0% gain in 2014, followed by a 9.3% gain in 2015.
• The LA County median home price for 2013 was $405,580, up by 23.9% year-over-
years.
124

APPENDIX F
NUMBER OF SCHOOLS AND CENTERS
School Sites The table on the following page shows the preliminary number of schools and centers budgeted
for operation for the 2014-15 school year. Generally, Continuation High Schools and Magnet
Centers share sites with a regular school. Adult Education Service Areas are groups of sites,
operating under ten location codes, in shared facilities with secondary schools or stand-alone
Division of Adult and Career Education sites which provide academic and career technical
training. Alternative Education Work Centers provide alternative instruction to high school
students within the various Adult Education Service Areas. The ROP Center consists of a
series of individual work locations identified as one school location for purpose of attendance
and expenditure reporting.
Grade Level Configuration Elementary schools include students from kindergarten through sixth grade. Middle schools
have sixth through eighth grade students, and senior high schools have ninth through twelfth
grade students. Some magnet schools follow a traditional grade configuration while others
include kindergarten through the twelfth grade. Span schools can include combinations of
elementary and secondary grades or secondary grades only. School Size
Individual schools vary widely in enrollment size. Elementary schools range from less than 200
to more than 1,200 pupils. Middle schools range from less than 300 to more than 1,900, and
senior high schools range from less than 300 to more than 2 ,800. Magnet schools range from
less than 300 to more than 1,800 pupils. Some Magnet Centers serve less than 100 pupils,
while other magnet centers enroll 800 or more.
Most Special Education Schools and Opportunity Schools have enrollments between 100
and 300 pupils. Continuation High Schools generally have fewer than 200 pupils.
Enrollment ranges in this section are based on projected enrollments used for preliminary
staffing allocations for 2014-15
.
125
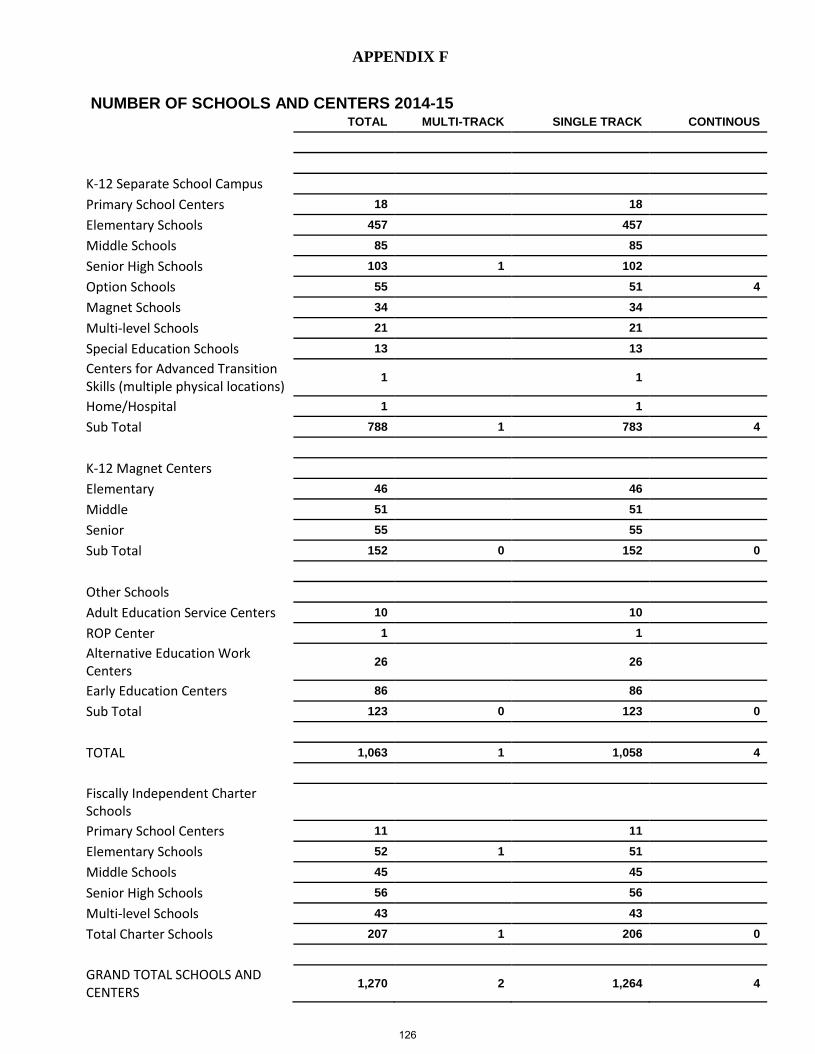
APPENDIX F
NUMBER OF SCHOOLS AND CENTERS 2014-15
TOTAL MULTI-TRACK SINGLE TRACK CONTINOUS
K-12 Separate School Campus Primary School Centers 18
18
Elementary Schools 457
457
Middle Schools 85
85
Senior High Schools 103 1 102
Option Schools 55
51 4
Magnet Schools 34
34
Multi-level Schools 21
21
Special Education Schools 13
13
Centers for Advanced Transition Skills (multiple physical locations)
1 1
Home/Hospital 1 1
Sub Total 788 1 783 4
K-12 Magnet Centers Elementary 46
46
Middle 51
51
Senior 55 55
Sub Total 152 0 152 0
Other Schools Adult Education Service Centers 10
10
ROP Center 1
1
Alternative Education Work Centers
26
26
Early Education Centers 86 86
Sub Total 123 0 123 0
TOTAL 1,063 1 1,058 4
Fiscally Independent Charter Schools
Primary School Centers 11
11
Elementary Schools 52 1 51
Middle Schools 45
45
Senior High Schools 56
56
Multi-level Schools 43
43
Total Charter Schools 207 1 206 0
GRAND TOTAL SCHOOLS AND CENTERS
1,270 2 1,264 4
126
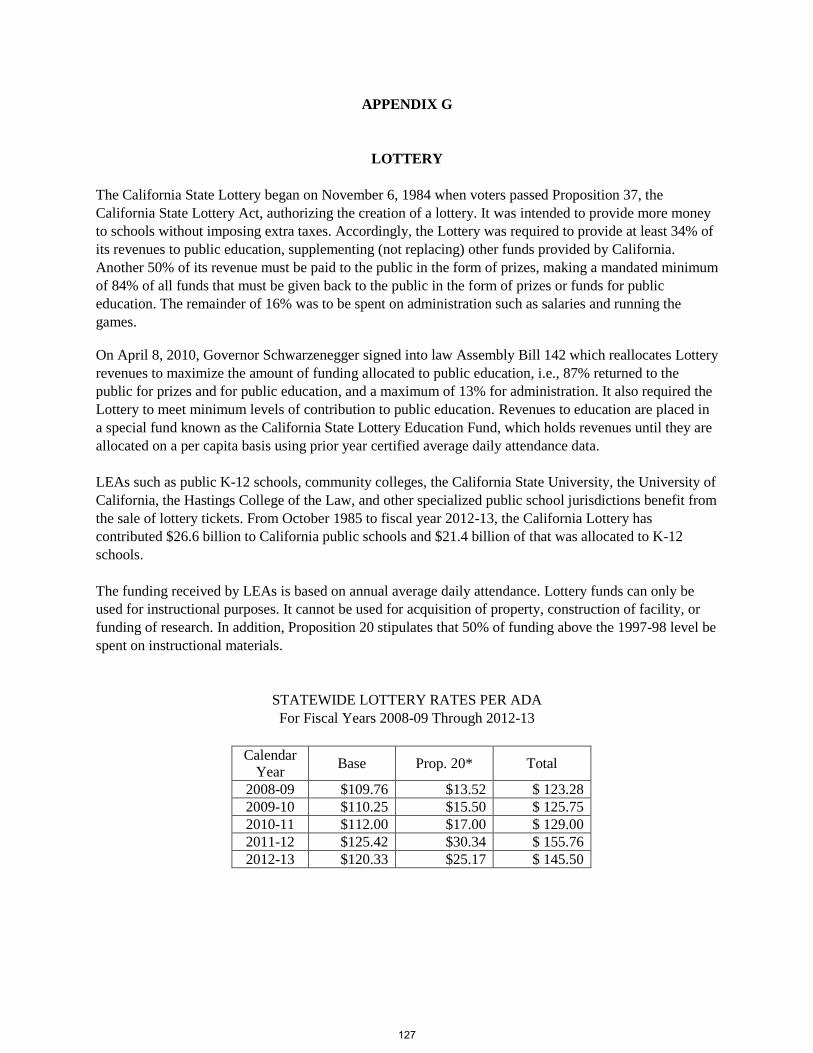
APPENDIX G
LOTTERY
The California State Lottery began on November 6, 1984 when voters passed Proposition 37, the
California State Lottery Act, authorizing the creation of a lottery. It was intended to provide more money
to schools without imposing extra taxes. Accordingly, the Lottery was required to provide at least 34% of
its revenues to public education, supplementing (not replacing) other funds provided by California.
Another 50% of its revenue must be paid to the public in the form of prizes, making a mandated minimum
of 84% of all funds that must be given back to the public in the form of prizes or funds for public
education. The remainder of 16% was to be spent on administration such as salaries and running the
games.
On April 8, 2010, Governor Schwarzenegger signed into law Assembly Bill 142 which reallocates Lottery
revenues to maximize the amount of funding allocated to public education, i.e., 87% returned to the
public for prizes and for public education, and a maximum of 13% for administration. It also required the
Lottery to meet minimum levels of contribution to public education. Revenues to education are placed in
a special fund known as the California State Lottery Education Fund, which holds revenues until they are
allocated on a per capita basis using prior year certified average daily attendance data.
LEAs such as public K-12 schools, community colleges, the California State University, the University of
California, the Hastings College of the Law, and other specialized public school jurisdictions benefit from
the sale of lottery tickets. From October 1985 to fiscal year 2012-13, the California Lottery has
contributed $26.6 billion to California public schools and $21.4 billion of that was allocated to K-12
schools.
The funding received by LEAs is based on annual average daily attendance. Lottery funds can only be
used for instructional purposes. It cannot be used for acquisition of property, construction of facility, or
funding of research. In addition, Proposition 20 stipulates that 50% of funding above the 1997-98 level be
spent on instructional materials.
STATEWIDE LOTTERY RATES PER ADA
For Fiscal Years 2008-09 Through 2012-13
Calendar
Year Base Prop. 20* Total
2008-09 $109.76 $13.52 $ 123.28
2009-10 $110.25 $15.50 $ 125.75
2010-11 $112.00 $17.00 $ 129.00
2011-12 $125.42 $30.34 $ 155.76
2012-13 $120.33 $25.17 $ 145.50
127
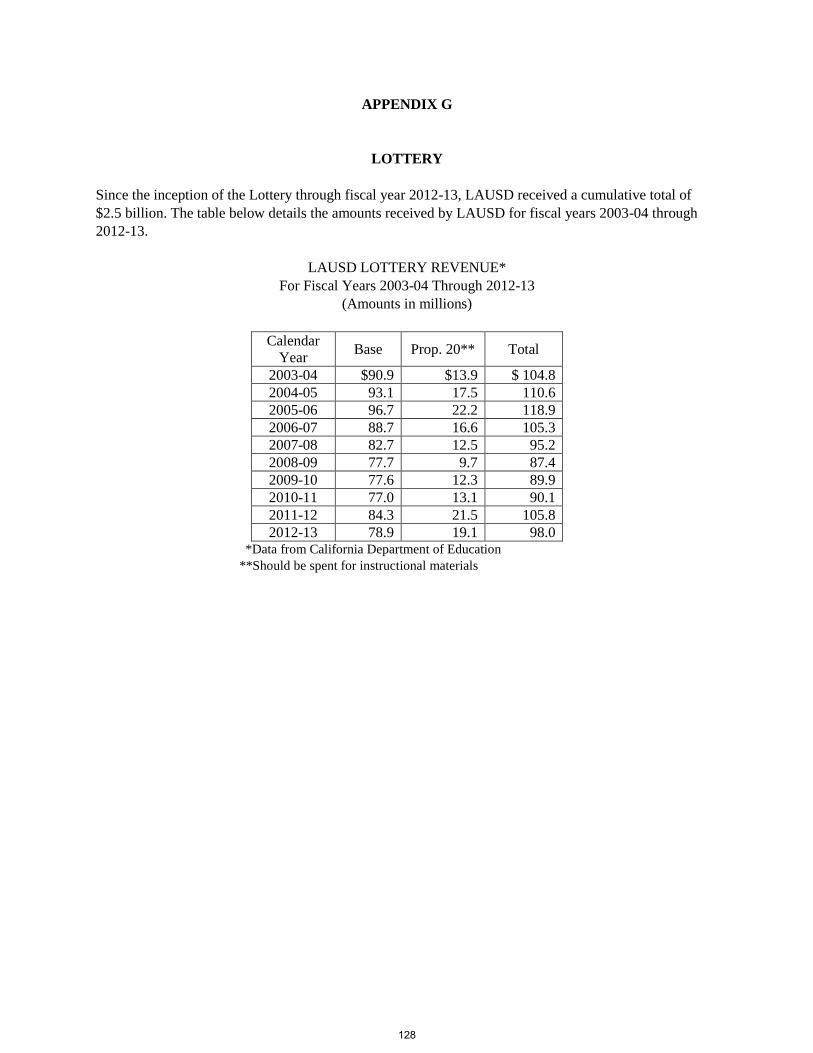
APPENDIX G
LOTTERY
Since the inception of the Lottery through fiscal year 2012-13, LAUSD received a cumulative total of
$2.5 billion. The table below details the amounts received by LAUSD for fiscal years 2003-04 through
2012-13.
LAUSD LOTTERY REVENUE*
For Fiscal Years 2003-04 Through 2012-13
(Amounts in millions)
Calendar
Year Base Prop. 20** Total
2003-04 $90.9 $13.9 $ 104.8
2004-05 93.1 17.5 110.6
2005-06 96.7 22.2 118.9
2006-07 88.7 16.6 105.3
2007-08 82.7 12.5 95.2
2008-09 77.7 9.7 87.4
2009-10 77.6 12.3 89.9
2010-11 77.0 13.1 90.1
2011-12 84.3 21.5 105.8
2012-13 78.9 19.1 98.0 *Data from California Department of Education
**Should be spent for instructional materials
128
APPENDIX H
SCHOOL STAFF AND RESOURCES
Introduction
The School Staff and Resources section describes the staff and non-staff allocations made
to most District schools based on Board-approved allocation rates or “norms.” Staffing ratios
are provided for regular elementary schools, regular secondary schools, magnet and alternative
schools, special education schools, early childhood centers, community adult schools, regional
occupational centers (ROC) and skills centers.
Personnel resources provided on a “norm” basis include positions such as teachers, principals,
assistant principals, librarians, clerical, and other office personnel. Staffing allocations also
included non- classroom support personnel as guidance, welfare, attendance, physical and mental
health personnel, campus aides, and maintenance and operations staff.
A separate listing is provided to show materiel and supplies allocation rates, which cover needs
such as basic instructional materials, textbooks, custodial, gardening and operational supplies,
and school- community advisory committee expenses.
129
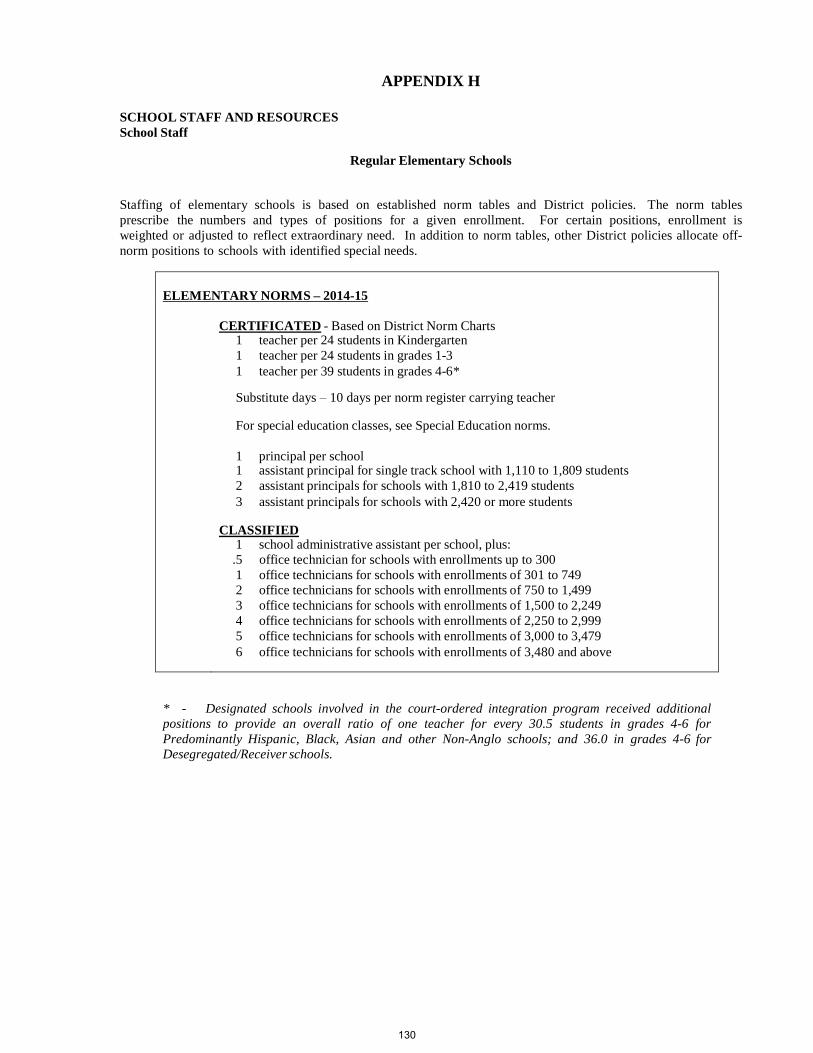
APPENDIX H
SCHOOL STAFF AND RESOURCES
School Staff
Regular Elementary Schools
Staffing of elementary schools is based on established norm tables and District policies. The norm tables
prescribe the numbers and types of positions for a given enrollment. For certain positions, enrollment is
weighted or adjusted to reflect extraordinary need. In addition to norm tables, other District policies allocate off-
norm positions to schools with identified special needs.
ELEMENTARY NORMS – 2014-15
CERTIFICATED - Based on District Norm Charts 1 teacher per 24 students in Kindergarten
1 teacher per 24 students in grades 1-3
1 teacher per 39 students in grades 4-6* Substitute days – 10 days per norm register carrying teacher For special education classes, see Special Education norms. 1 principal per school 1 assistant principal for single track school with 1,110 to 1,809 students
2 assistant principals for schools with 1,810 to 2,419 students
3 assistant principals for schools with 2,420 or more students
CLASSIFIED 1 school administrative assistant per school, plus:
.5 office technician for schools with enrollments up to 300
1 office technicians for schools with enrollments of 301 to 749
2 office technicians for schools with enrollments of 750 to 1,499
3 office technicians for schools with enrollments of 1,500 to 2,249
4 office technicians for schools with enrollments of 2,250 to 2,999
5 office technicians for schools with enrollments of 3,000 to 3,479
6 office technicians for schools with enrollments of 3,480 and above
* - Designated schools involved in the court-ordered integration program received additional
positions to provide an overall ratio of one teacher for every 30.5 students in grades 4-6 for
Predominantly Hispanic, Black, Asian and other Non-Anglo schools; and 36.0 in grades 4-6 for
Desegregated/Receiver schools.
130

APPENDIX H
SCHOOL STAFF AND RESOURCES
School Staff (Continued)
Regular Secondary Schools
Staffing of secondary schools is based on established norm tables and District policies. The norm tables
prescribe the numbers and types of positions for a given enrollment. At the secondary level, teacher norm tables
are modified to provide only five teaching periods. In addition, other District policies allocate off-norm positions
to schools with identified special needs.
SECONDARY NORMS – 2014-15
CERTIFICATED – Based on District Norm Charts 1 teacher per 42.5 students in middle schools*
1 teacher per 42.5 students in senior high schools**
1 principal per school
1 assistant principal, secondary counseling services per school with enrollment of 800
to 1,354
1 assistant principal per school with enrollment of 1,355 to 1,749
2 assistant principal per school with enrollment of 1,750 to 2,088
3 assistant principal per school with enrollment of 2,089 to 4,233
4 assistant principal per school with enrollment of at least 4,234 Substitute days – 10 days per norm register carrying teacher
CLASSIFIED 1 school administrative assistant per school, plus:
.5 clerical position for middle schools with enrollments up to 550 plus 1 clerical
position for each additional 500 students over 700
.5 clerical position for senior high schools with enrollments of up to 550, plus 1
clerical position for each additional 500 students over 700
# financial manager per middle school – financial manager at middle school will serve
two (2) sites
1 senior financial manager per senior high school
* - Designated middle schools involved in court-ordered integration programs received
additional positions to provide an overall ratio of one teacher for every 34.0 students in academic
classes for Predominantly Hispanic, Black, Asian, and Other Non-Anglo schools; and 39.5
students in academic classes for Desegregated/Receiver Schools.
** - Designated senior high schools involved in court-ordered integration programs received
additional positions to provide an overall ratio of one teacher for every 34.0 9th and 10th grade
students in academic classes for Predominantly Hispanic, Black, Asian, and Other Non-Anglo
schools; and 39.5 9th and 10th grade students in academic classes for Desegregated/Receiver
Schools.
131

APPENDIX H
SCHOOL STAFF AND RESOURCES
School Staff (Continued)
Magnet Schools Several Magnet Schools provide services for both elementary and secondary students. Basic teacher allocations
are determined by the magnet and alternative school norm tables for total enrollment. Other staff is based on District
policy.
MAGNET NORMS – 2014-15
Magnet schools and centers identified as serving Predominantly Hispanic, Black, Asian,
and Other Non-Anglo students:
1 teacher per 24.0 students in grades K-3
1 teacher per 30.5 students in grades 4-5
1 teacher per 34.0 students in grades 6-8
1 teacher per 34.0 students in grades 9-12
All other magnet schools and centers: 1 teacher per 24.0 students in grades K-3
1 teacher per 34.0 students in grades 4-5
1 teacher per 36.5 students in grades 6-8
1 teacher per 36.5 students in grades 9-12 Substitute days – 10 days per norm register carrying teacher
Options Schools Options schools serve students for whom placement in the regular school environment is not in the best interest of
the students. Because these students require an individualized program to meet their unique academic and
behavior needs, a lower pupil/teacher norm is provided.
CONTINUATION NORMS – 2014-15 1 teacher per 29 students per continuation school
1 principal per continuation school
1 school office manager/clerk per continuation school
OPPORTUNITY AND COMMUNITY DAY SCHOOL NORMS – 2014-15 1 teacher per 21 students per opportunity and community day school
1 principal per opportunity and stand-alone community day school
1 assistant principal per opportunity school and stand-alone community day school – sites
with enrollment greater than 500
1 school administrative assistant per opportunity school and stand-alone community day
school
INDEPENDENT STUDY NORMS – 2014-15 1 teacher per 30 students per independent study school
1 principal
2 assistant principals
1 school administrative assistant
132

APPENDIX H
SCHOOL STAFF AND RESOURCES
School Staff (Continued)
Special Education Programs & Special Education Schools
Special Day Programs serve pupils whose nature or severity of disability precludes participation in a general
education program for a majority of the school day.
Resource Specialist Programs provide instructional services for individuals with exceptional needs in general
education schools. Resource specialist students are assigned to their general education classroom for a majority of
the school day and receive services from the resource specialist teacher either directly in a collaborative basis with
the general education classroom teacher or a Learning Center Model. Designated Instruction and Services are provided to special education students who require assistance in a
particular area, such as language, speech, audiology, mobility, adaptive physical education, vision, counseling, etc.
SPECIAL EDUCATION NORMS – 2014-15
Special Day Programs - Class size varies depending on type of program. Special day programs have
program support staff allocated based on special education program needs. Designated Instruction and Services – Student/teacher ratios vary by type of service, except for
language, speech, and hearing which may not exceed a caseload of 55 students. There are no
trainees/assistants for this program.
A Special Education Schools
1 principal per school
1 asst. principal at large enrollment schools or schools serving low incidence groups
B Elementary Schools
1 school administrative assistant, B Basis
2 office technicians, B Basis C Secondary or K-12 Schools
1 school administrative assistant, B Basis
1 senior office technician, B Basis
1 office technician, B Basis
133
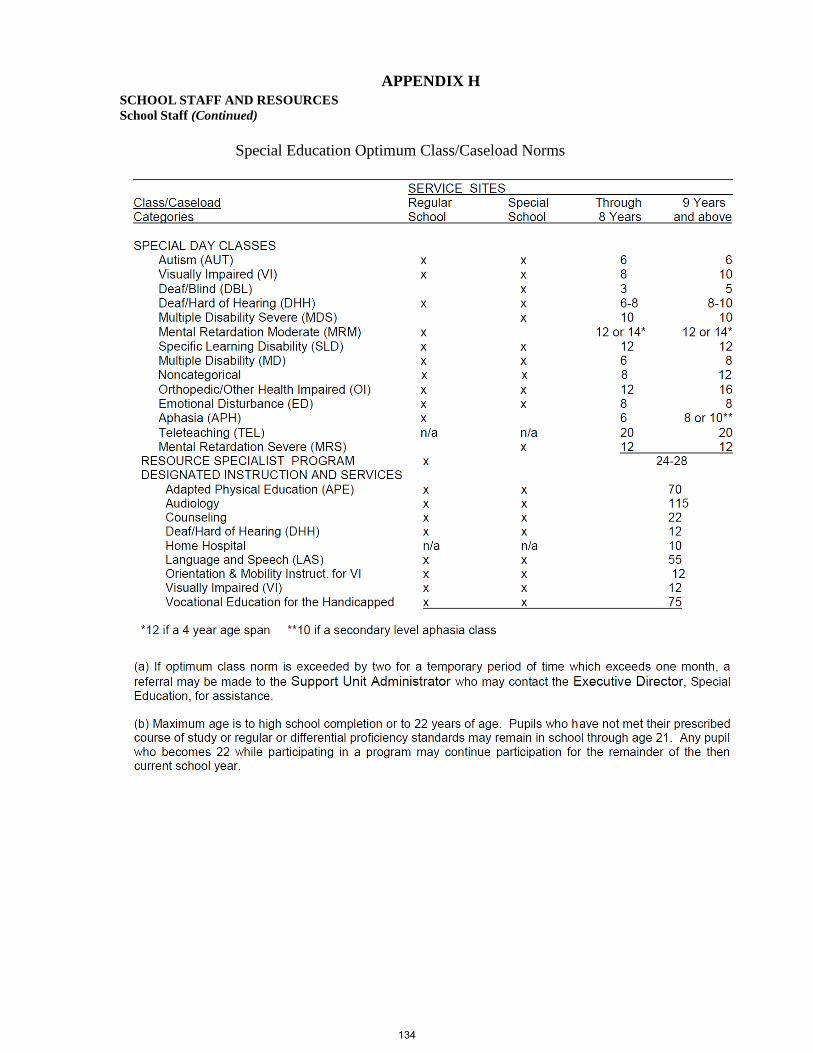
APPENDIX H
SCHOOL STAFF AND RESOURCES
School Staff (Continued)
Special Education Optimum Class/Caseload Norms
134

APPENDIX H SCHOOL STAFF AND RESOURCES
School Staff (Continued)
Early Childhood Centers
Early Childhood Education Centers are staffed based on the guidelines and staffing ratios established by
Education Code 8288, 5CCR 18290, 18291, and 18292 for administrative, certificated, and classified personnel. The
Los Angeles Unified School District maintains at least the following minimum ratios in all early education centers.
1:8 adult-child ratio,
1:24 teacher-child ratio
Staffing is allocated based on enrollment capacity and hours of operation. Compliance with these ratios shall be
determined based on actual attendance.
EARLY CHILDHOOD CENTERS – 2014-15
CERTIFICATED
1 principal per early childhood center 1 teacher per 24 students in each early childhood center * teacher 4-hour
CLASSIFIED 1 office manager per early childhood center 1 housekeeper per each early childhood center 4 aide 3-hour for early childhood centers with enrollment capacity of 96
5 aide 3-hour for early childhood centers with enrollment capacity of 120
6 aide 3-hour for early childhood centers with enrollment capacity of 144
7 aide 3-hour for early childhood centers with enrollment capacity of 168
8 aide 3-hour for early childhood centers with enrollment capacity of 192
8 aide 8-hour for early childhood centers with enrollment capacity of 96
10 aide 8-hour for early childhood centers with enrollment capacity of 120
12 aide 8-hour for early childhood centers with enrollment capacity of 144
14 aide 8-hour for early childhood centers with enrollment capacity of 168
16 aide 8-hour for early childhood centers with enrollment capacity of 192
* Based on individual early childhood center needs and the hours of operation
135

APPENDIX H
SCHOOL STAFF AND RESOURCES
School Staff (Continued)
Community Adult Schools
Community Adult Schools (CAS) are staffed based on established staffing guidelines for administrative and
classified personnel. Teacher positions are allocated at each school site from the teacher hour allocation. Due to wide variances in the
programs offered at each site, teacher hours are allocated based on available funding and community need. In
addition, other District programs allocate additional positions to schools with identified special community needs.
COMMUNITY ADULT SCHOOL NORMS – 2014-15
CERTIFICATED
1 principal 2 assistant principals, operations 2 assistant principals, adult counseling services
CLASSIFIED
1 school administrative assistant 1 occupational center financial manager 1 school office computer coordinator * office technicians
* Based upon individual school needs.
136

APPENDIX H
SCHOOL STAFF AND RESOURCES
School Staff (Continued)
Regional Occupational Centers (ROC)/Skills Centers (SC) Regional Occupational Centers (ROC)/Skills Centers (SC) are staffed based on established staffing guidelines for
administrative and classified personnel. Due to wide variances in the programs offered at each site, teacher hours are allocated based on available funding
and community needs. In addition, other District programs allocate additional positions to schools with identified
special community needs.
ROC/SKILLS CENTERS NORMS – 2014-15
CERTIFICATED
1 principal 2 assistant principals, operations
2 assistant principals, adult counseling services
CLASSIFIED
1 school administrative assistant 1 occupational center financial manager 1 school office computer coordinator * office technicians
* Based upon individual school needs.
Regional Occupational Program
The Regional Occupational Program is staffed based on the same staffing guidelines as Community Adult Schools,
Regional Occupational Centers, and Skills Centers. Additional staff may be allocated based on the needs of the
secondary schools that the program serves.
Alternative Education & Work Centers Alternative Education and Work Centers (AEWC), which are associated with Community Adult Schools, Regional
Occupational Centers, or Skills Centers, are located at 26 sites. AEWC provides students who left the
comprehensive high schools, with additional educational opportunities leading to a high school diploma or
equivalency, apprenticeship, and other career and technical education training programs. An AEWC site is under
the principal of a Community Adult School, Regional Occupational Center, or Skills Center. A typical AEWC
site has the following staff: 1 outreach consultant, 2-4 teachers, 3-6 teacher assistants, and 1 school safety officer.
137
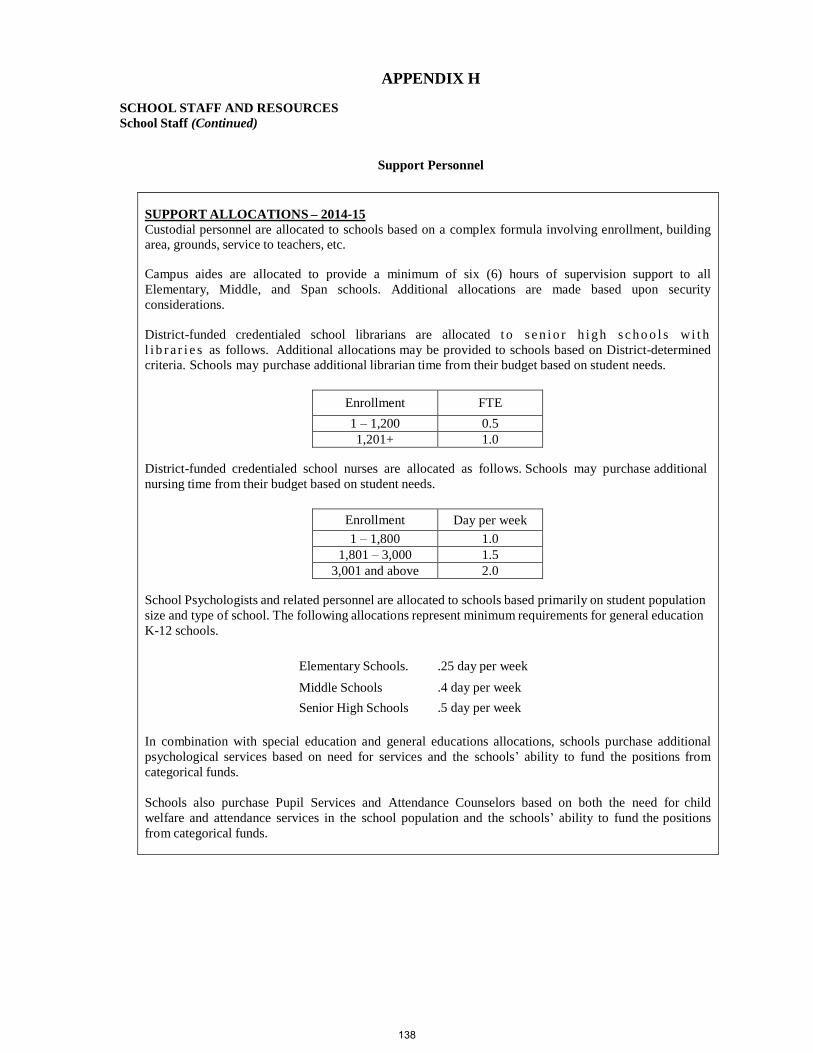
APPENDIX H
SCHOOL STAFF AND RESOURCES
School Staff (Continued)
Support Personnel
SUPPORT ALLOCATIONS – 2014-15
Custodial personnel are allocated to schools based on a complex formula involving enrollment, building area, grounds, service to teachers, etc. Campus aides are allocated to provide a minimum of six (6) hours of supervision support to all
Elementary, Middle, and Span schools. Additional allocations are made based upon security
considerations. District-funded credentialed school librarians are allocated t o s e n i o r h i g h s c h o o l s wi t h
l i b r a r i e s as follows. Additional allocations may be provided to schools based on District-determined
criteria. Schools may purchase additional librarian time from their budget based on student needs.
Enrollment FTE
1 – 1,200 0.5
1,201+ 1.0
District-funded credentialed school nurses are allocated as follows. Schools may purchase additional
nursing time from their budget based on student needs.
Enrollment Day per week
1 – 1,800 1.0
1,801 – 3,000 1.5
3,001 and above 2.0
School Psychologists and related personnel are allocated to schools based primarily on student population
size and type of school. The following allocations represent minimum requirements for general education
K-12 schools.
Elementary Schools. .25 day per week
Middle Schools .4 day per week
Senior High Schools .5 day per week
In combination with special education and general educations allocations, schools purchase additional
psychological services based on need for services and the schools’ ability to fund the positions from
categorical funds.
Schools also purchase Pupil Services and Attendance Counselors based on both the need for child
welfare and attendance services in the school population and the schools’ ability to fund the positions
from categorical funds.
138
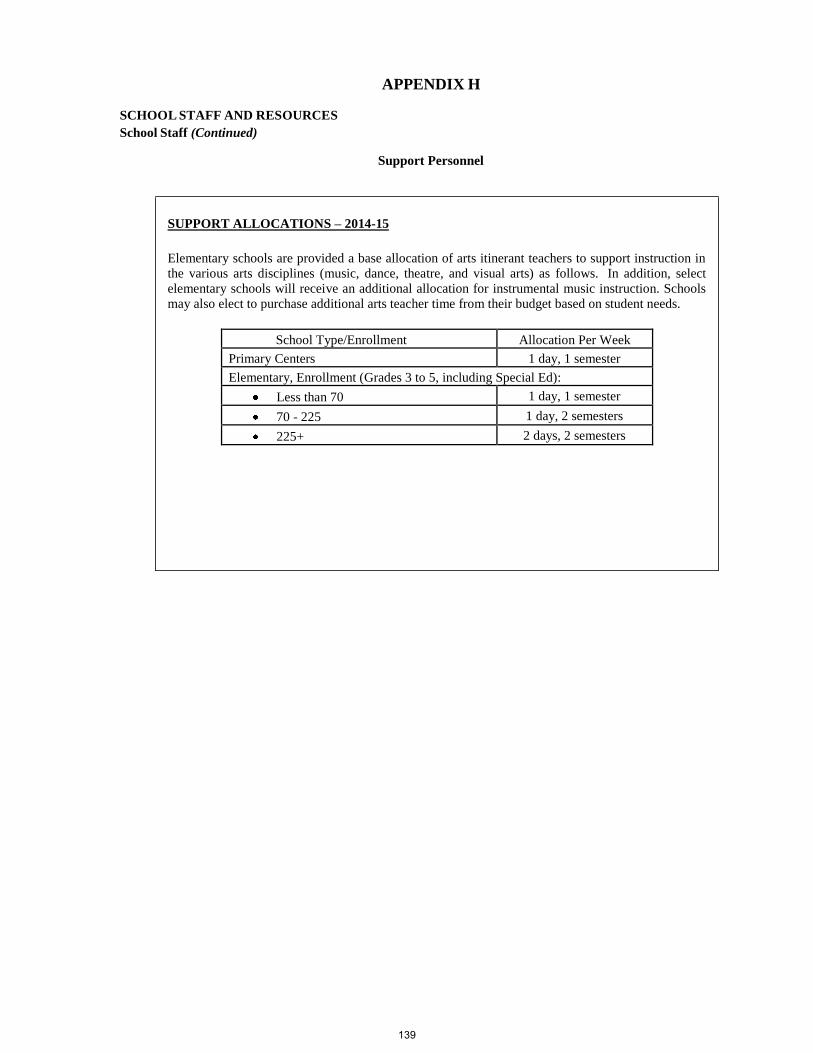
APPENDIX H SCHOOL STAFF AND RESOURCES
School Staff (Continued)
Support Personnel
SUPPORT ALLOCATIONS – 2014-15
Elementary schools are provided a base allocation of arts itinerant teachers to support instruction in
the various arts disciplines (music, dance, theatre, and visual arts) as follows. In addition, select
elementary schools will receive an additional allocation for instrumental music instruction. Schools
may also elect to purchase additional arts teacher time from their budget based on student needs.
School Type/Enrollment Allocation Per Week
Primary Centers 1 day, 1 semester
Elementary, Enrollment (Grades 3 to 5, including Special Ed):
Less than 70 1 day, 1 semester
70 - 225 1 day, 2 semesters
225+ 2 days, 2 semesters
139

APPENDIX H
SCHOOL STAFF AND RESOURCES
School Staff (Continued)
Materiel and Supplies Allocation Rates
Instructional material, school advisory committee expense funds, and various operational supplies are also
allocated to schools according to fixed formulas. INSTRUCTIONAL MATERIAL
Program 2013-14 Rate 2014-15 Rate
Regular - K-6 $16.00 per Enrl. $16.00 per Enrl.
7-8 20.00 per Enrl. 20.00 per Enrl.
9-12 22.00 per Enrl. 22.00 per Enrl.
Instructional Materials Block Grant * *
Community Adult School 11.00 per Enrl. 20.00 per Enrl.
Options Programs 739.00 per Teacher 739.00 per Teacher
Regional Occupational Centers and Skills Centers 11.00 per Enrl. 20.00 per Enrl.
Regional Occupational Program * *
Special Education – Special Day Classes –
Special Education Schools
Regular Schools
Early Ed Centers
500.00 17.00
200.00
per Class
**
**
500.00 17.00
200.00
per Class
**
Special Day Program
* - Allocations are determined based on schools’ need.
** - Per active Individualized Education Program (IEP) in Welligent
140
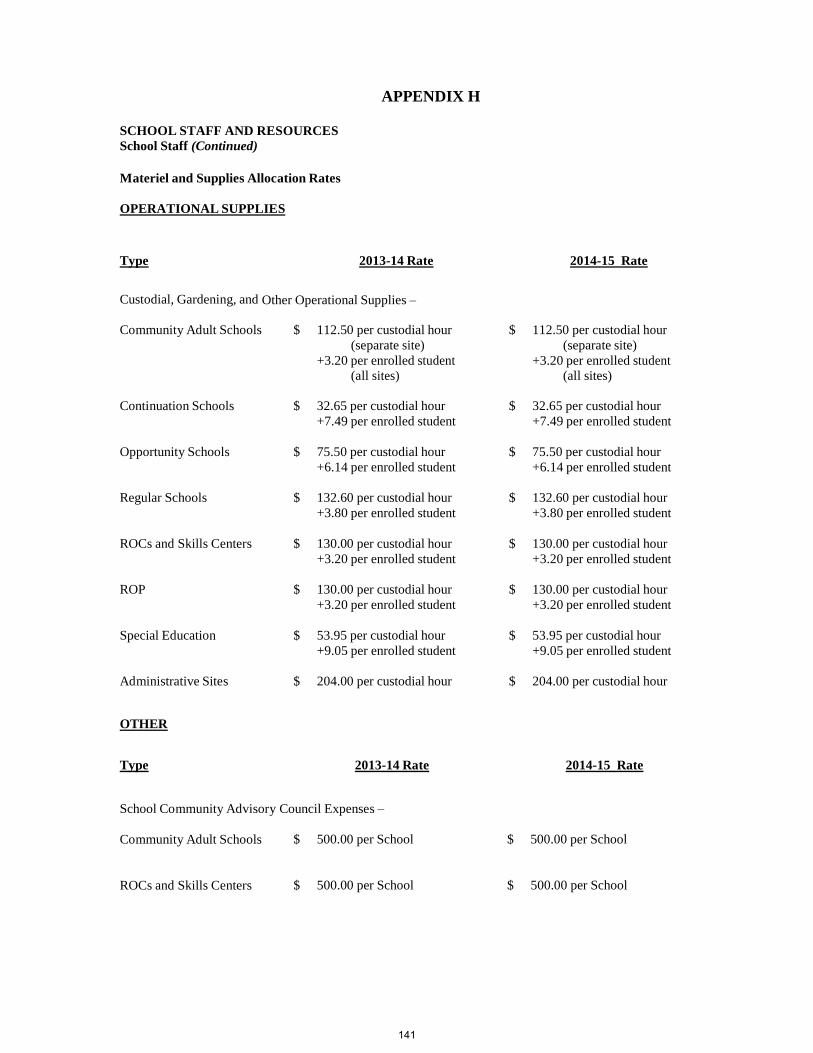
APPENDIX H
SCHOOL STAFF AND RESOURCES
School Staff (Continued)
Materiel and Supplies Allocation Rates
OPERATIONAL SUPPLIES
Type 2013-14 Rate 2014-15 Rate
Custodial, Gardening, and Other Operational Supplies –
Community Adult Schools $ 112.50 per custodial hour
(separate site)
+3.20 per enrolled student
(all sites)
$ 112.50 per custodial hour
(separate site)
+3.20 per enrolled student
(all sites)
Continuation Schools $ 32.65 per custodial hour
+7.49 per enrolled student $ 32.65 per custodial hour
+7.49 per enrolled student
Opportunity Schools $ 75.50 per custodial hour
+6.14 per enrolled student $ 75.50 per custodial hour
+6.14 per enrolled student
Regular Schools $ 132.60 per custodial hour
+3.80 per enrolled student $ 132.60 per custodial hour
+3.80 per enrolled student
ROCs and Skills Centers $ 130.00 per custodial hour
+3.20 per enrolled student $ 130.00 per custodial hour
+3.20 per enrolled student
ROP $ 130.00 per custodial hour
+3.20 per enrolled student $ 130.00 per custodial hour
+3.20 per enrolled student
Special Education $ 53.95 per custodial hour
+9.05 per enrolled student $ 53.95 per custodial hour
+9.05 per enrolled student
Administrative Sites $ 204.00 per custodial hour $ 204.00 per custodial hour
OTHER
Type 2013-14 Rate 2014-15 Rate
School Community Advisory Council Expenses –
Community Adult Schools $ 500.00 per School $ 500.00 per School
ROCs and Skills Centers $ 500.00 per School $ 500.00 per School
141
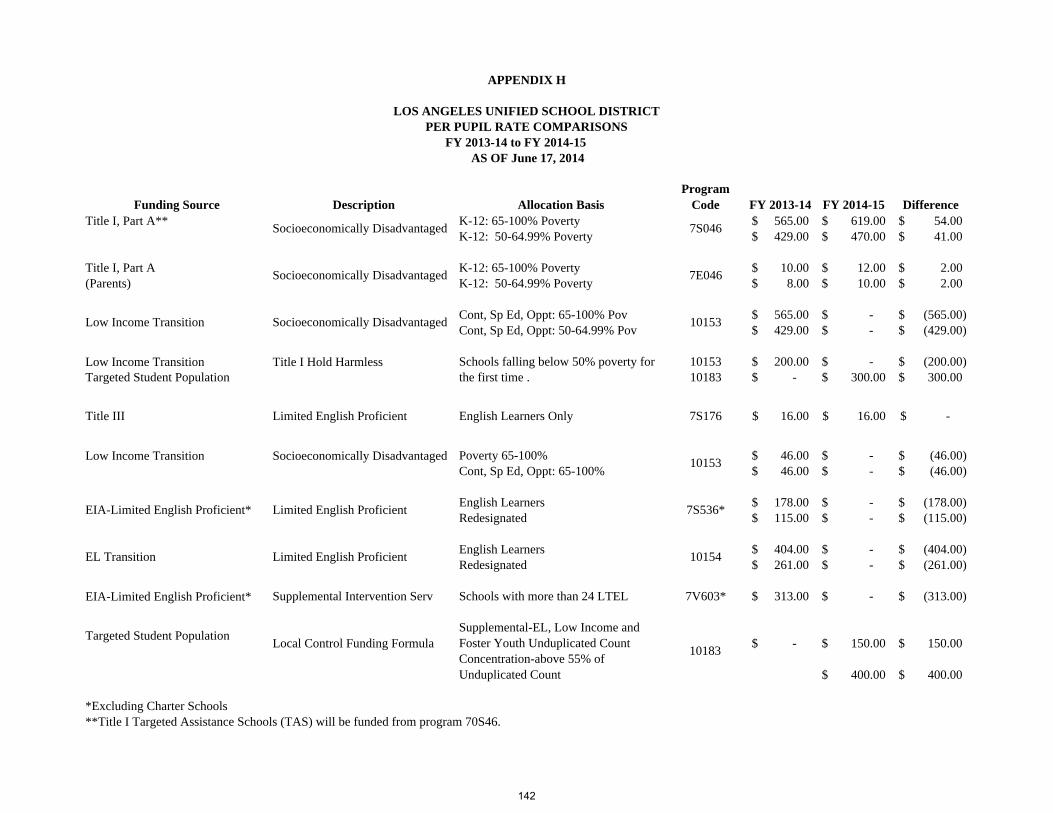
Funding Source Description Allocation BasisProgram
Code FY 2013-14 FY 2014-15 DifferenceTitle I, Part A** K-12: 65-100% Poverty 565.00$ 619.00$ 54.00$ K-12: 50-64.99% Poverty 429.00$ 470.00$ 41.00$
Title I, Part A K-12: 65-100% Poverty 10.00$ 12.00$ 2.00$ (Parents) K-12: 50-64.99% Poverty 8.00$ 10.00$ 2.00$
Cont, Sp Ed, Oppt: 65-100% Pov 565.00$ -$ (565.00)$ Cont, Sp Ed, Oppt: 50-64.99% Pov 429.00$ -$ (429.00)$
Low Income Transition Title I Hold Harmless Schools falling below 50% poverty for 10153 200.00$ -$ (200.00)$ Targeted Student Population the first time . 10183 -$ 300.00$ 300.00$
Low Income Transition Socioeconomically Disadvantaged Poverty 65-100% 46.00$ -$ (46.00)$ Cont, Sp Ed, Oppt: 65-100% 46.00$ -$ (46.00)$
English Learners 178.00$ -$ (178.00)$ Redesignated 115.00$ -$ (115.00)$
English Learners 404.00$ -$ (404.00)$ Redesignated 261.00$ -$ (261.00)$
EIA-Limited English Proficient* Supplemental Intervention Serv Schools with more than 24 LTEL 7V603* 313.00$ -$ (313.00)$
Targeted Student Population Local Control Funding FormulaSupplemental-EL, Low Income and Foster Youth Unduplicated Count -$ 150.00$ 150.00$ Concentration-above 55% of Unduplicated Count 400.00$ 400.00$
*Excluding Charter Schools**Title I Targeted Assistance Schools (TAS) will be funded from program 70S46.
FY 2013-14 to FY 2014-15 AS OF June 17, 2014
10183
EL Transition Limited English Proficient 10154
7S176
10153
-$ 16.00$ Title III Limited English Proficient English Learners Only
EIA-Limited English Proficient* Limited English Proficient 7S536*
16.00$
Low Income Transition Socioeconomically Disadvantaged 10153
Socioeconomically Disadvantaged 7S046
Socioeconomically Disadvantaged 7E046
APPENDIX H
LOS ANGELES UNIFIED SCHOOL DISTRICTPER PUPIL RATE COMPARISONS
142
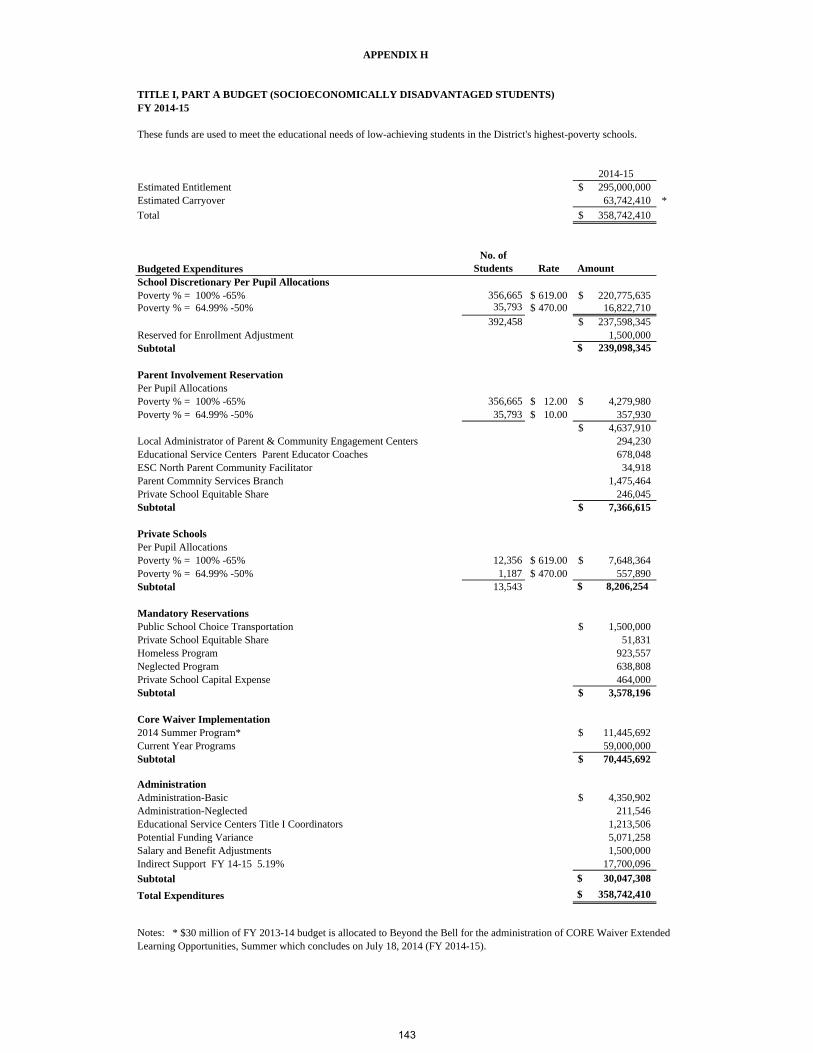
FY 2014-15
These funds are used to meet the educational needs of low-achieving students in the District's highest-poverty schools.
2014-15 Estimated Entitlement 295,000,000$ Estimated Carryover 63,742,410 *Total 358,742,410$
Budgeted ExpendituresNo. of
Students Rate Amount School Discretionary Per Pupil AllocationsPoverty % = 100% -65% 356,665 619.00$ 220,775,635$ Poverty % = 64.99% -50% 35,793 470.00$ 16,822,710
392,458 237,598,345$ Reserved for Enrollment Adjustment 1,500,000 Subtotal $ 239,098,345
Parent Involvement Reservation Per Pupil AllocationsPoverty % = 100% -65% 356,665 12.00$ 4,279,980$ Poverty % = 64.99% -50% 35,793 10.00$ 357,930
4,637,910$ Local Administrator of Parent & Community Engagement Centers 294,230 Educational Service Centers Parent Educator Coaches 678,048 ESC North Parent Community Facilitator 34,918 Parent Commnity Services Branch 1,475,464 Private School Equitable Share 246,045 Subtotal 7,366,615$
Private SchoolsPer Pupil AllocationsPoverty % = 100% -65% 12,356 619.00$ 7,648,364$ Poverty % = 64.99% -50% 1,187 470.00$ 557,890 Subtotal 13,543 $ 8,206,254
Mandatory ReservationsPublic School Choice Transportation 1,500,000$ Private School Equitable Share 51,831 Homeless Program 923,557 Neglected Program 638,808 Private School Capital Expense 464,000 Subtotal 3,578,196$
Core Waiver Implementation2014 Summer Program* 11,445,692$ Current Year Programs 59,000,000 Subtotal 70,445,692$
Administration-Basic 4,350,902$ Administration-Neglected 211,546 Educational Service Centers Title I Coordinators 1,213,506 Potential Funding Variance 5,071,258 Salary and Benefit Adjustments 1,500,000 Indirect Support FY 14-15 5.19% 17,700,096 Subtotal $ 30,047,308
Total Expenditures $ 358,742,410
Notes: * $30 million of FY 2013-14 budget is allocated to Beyond the Bell for the administration of CORE Waiver ExtendedLearning Opportunities, Summer which concludes on July 18, 2014 (FY 2014-15).
APPENDIX H
TITLE I, PART A BUDGET (SOCIOECONOMICALLY DISADVANTAGED STUDENTS)
Administration
143

TITLE II, Part A - HIGHLY QUALIFIED TEACHERS
FY 2014-15
These funds are used to increase the academic achievement of all students by helping schools improve teacher
and principal quality through professional development and ensure all teachers are highly qualified.
2014-15
Estimated Entitlement 40,868,371$
Estimated Carryover 4,086,837
Total 44,955,208$
Budgeted Expenditures Amount
Pre K - 12 Curriculum Services
ESC - Local Instructional Directors 10,020,218$
Internal Comm-Elearning - Multimedia Designer 114,271
College & Career Counseling 67,419
Office of Curriculum, Instruction / School Support 1,386,949
Subtotal 11,588,857$
Human Resources (HR)
HR-Employee Performance Accountability 167,794$
HR-Office of Chief Human Resource Officer 1,053,951
HR-Certificated Placement & Assignments 1,791,162
HR-Employee Services 88,498
HR-Personnel Research & Assessment 455,009
HR-Certificated Workforce Management 2,924,780
HR-Certificated Performance Evaluation Support 944,969
HR-Bilingual Differential Salaries 2,000,000
Subtotal 9,426,163$
Talent Management (TM)
TM-National Board Certified Teacher Stipends 10,000,000$
TM-District Intern - LISTOS Program 1,008,037
TM-Beginning Teacher Growth, Development, & Induction 625,129
Office of Intensive Support & Intervention 78,276
Office of the Executive Director 411,174
TM-Teacher Growth & Development 4,272,597
TM-Teacher & Administrative Development Branch 457,150
TM-Peer Assistance/Teacher Mentor 136,373
Subtotal 16,988,736$
Private School Equitable Share 4,043,217$
Other
Indirect Cost FY 14-15 5.19% 2,069,393$
Potential Funding Variance 2.00% 838,842
2,908,235$
Total Expenditures 44,955,208$
APPENDIX H
144

TITLE III - LIMITED ENGLISH PROFICIENCY (LEP)FY 2014-15
These funds are used to ensure that limited-English-proficient (LEP) students attain English proficiency and meet the same academicstandards that other students are expected to meet
2014-15Estimated Entitlement 14,862,088$ Estimated Carryover 3,857,142$ Total 18,719,230$
Budgeted ExpendituresNo. of LEP
Students Rate Amount
Per Pupil Allocations 146,754 16.00$ 2,348,064$
Resources to Support SchoolsTitle III Access to Core Coaches (187.00 FTE's) 15,097,898$ Multilingual and Multicultural Education Department 390,273 Subtotal 15,488,171$
Private Schools 1,517 93.32$ 141,566$
Indirect Cost ( 2% Cap) 367,044$
Potential Funding Variance $ 374,385
Total Expenditures $ 18,719,230
APPENDIX H
145

146
APPENDIX I
DISTRICT CLASS SIZE
This section provides information related to student teacher rations at District’s schools.
District policy pertaining to the recommendation of staffing for most Certificated and Clerical
personnel at District schools is based on recommended staffing tables that take into account
student enrollment and other school characteristics.
The chart on the next page provides a historical comparison of teacher to student staffing ratios
by school type and integration status.
147
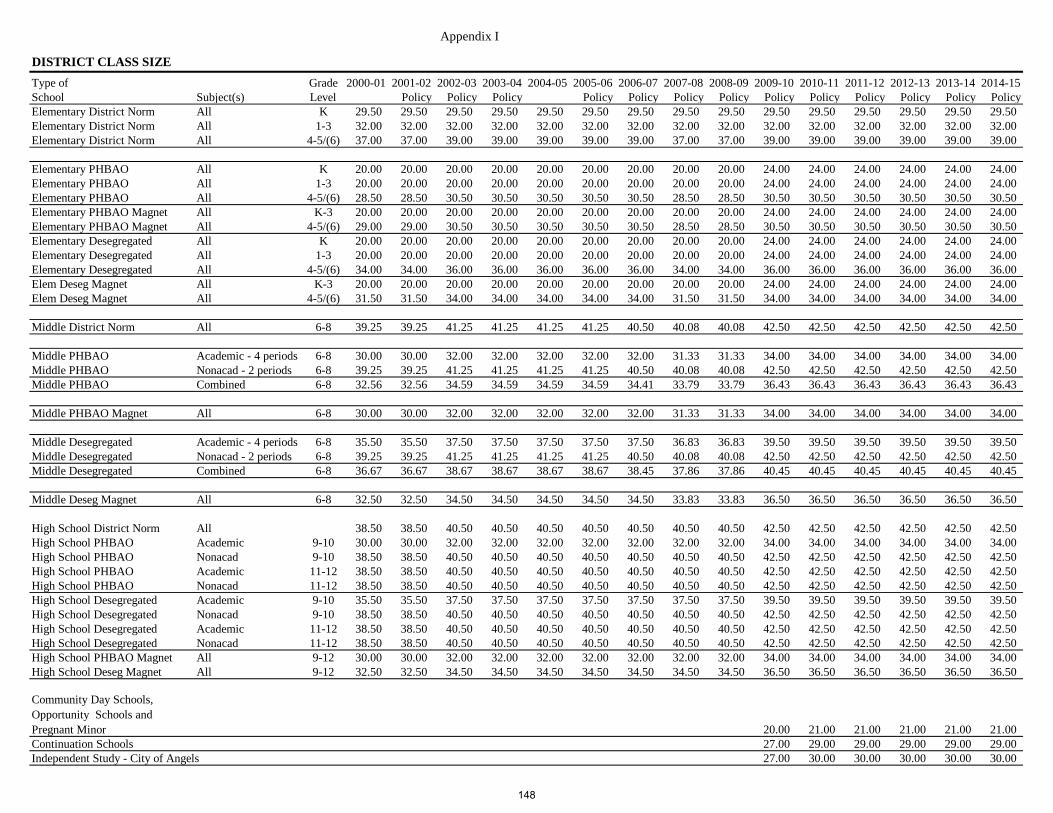
Appendix I
DISTRICT CLASS SIZE
Type of Grade 2000-01 2001-02 2002-03 2003-04 2004-05 2005-06 2006-07 2007-08 2008-09 2009-10 2010-11 2011-12 2012-13 2013-14 2014-15
School Subject(s) Level Policy Policy Policy Policy Policy Policy Policy Policy Policy Policy Policy Policy Policy
Elementary District Norm All K 29.50 29.50 29.50 29.50 29.50 29.50 29.50 29.50 29.50 29.50 29.50 29.50 29.50 29.50 29.50
Elementary District Norm All 1-3 32.00 32.00 32.00 32.00 32.00 32.00 32.00 32.00 32.00 32.00 32.00 32.00 32.00 32.00 32.00
Elementary District Norm All 4-5/(6) 37.00 37.00 39.00 39.00 39.00 39.00 39.00 37.00 37.00 39.00 39.00 39.00 39.00 39.00 39.00
Elementary PHBAO All K 20.00 20.00 20.00 20.00 20.00 20.00 20.00 20.00 20.00 24.00 24.00 24.00 24.00 24.00 24.00
Elementary PHBAO All 1-3 20.00 20.00 20.00 20.00 20.00 20.00 20.00 20.00 20.00 24.00 24.00 24.00 24.00 24.00 24.00
Elementary PHBAO All 4-5/(6) 28.50 28.50 30.50 30.50 30.50 30.50 30.50 28.50 28.50 30.50 30.50 30.50 30.50 30.50 30.50
Elementary PHBAO Magnet All K-3 20.00 20.00 20.00 20.00 20.00 20.00 20.00 20.00 20.00 24.00 24.00 24.00 24.00 24.00 24.00
Elementary PHBAO Magnet All 4-5/(6) 29.00 29.00 30.50 30.50 30.50 30.50 30.50 28.50 28.50 30.50 30.50 30.50 30.50 30.50 30.50
Elementary Desegregated All K 20.00 20.00 20.00 20.00 20.00 20.00 20.00 20.00 20.00 24.00 24.00 24.00 24.00 24.00 24.00
Elementary Desegregated All 1-3 20.00 20.00 20.00 20.00 20.00 20.00 20.00 20.00 20.00 24.00 24.00 24.00 24.00 24.00 24.00
Elementary Desegregated All 4-5/(6) 34.00 34.00 36.00 36.00 36.00 36.00 36.00 34.00 34.00 36.00 36.00 36.00 36.00 36.00 36.00
Elem Deseg Magnet All K-3 20.00 20.00 20.00 20.00 20.00 20.00 20.00 20.00 20.00 24.00 24.00 24.00 24.00 24.00 24.00
Elem Deseg Magnet All 4-5/(6) 31.50 31.50 34.00 34.00 34.00 34.00 34.00 31.50 31.50 34.00 34.00 34.00 34.00 34.00 34.00
Middle District Norm All 6-8 39.25 39.25 41.25 41.25 41.25 41.25 40.50 40.08 40.08 42.50 42.50 42.50 42.50 42.50 42.50
Middle PHBAO Academic - 4 periods 6-8 30.00 30.00 32.00 32.00 32.00 32.00 32.00 31.33 31.33 34.00 34.00 34.00 34.00 34.00 34.00
Middle PHBAO Nonacad - 2 periods 6-8 39.25 39.25 41.25 41.25 41.25 41.25 40.50 40.08 40.08 42.50 42.50 42.50 42.50 42.50 42.50
Middle PHBAO Combined 6-8 32.56 32.56 34.59 34.59 34.59 34.59 34.41 33.79 33.79 36.43 36.43 36.43 36.43 36.43 36.43
Middle PHBAO Magnet All 6-8 30.00 30.00 32.00 32.00 32.00 32.00 32.00 31.33 31.33 34.00 34.00 34.00 34.00 34.00 34.00
Middle Desegregated Academic - 4 periods 6-8 35.50 35.50 37.50 37.50 37.50 37.50 37.50 36.83 36.83 39.50 39.50 39.50 39.50 39.50 39.50
Middle Desegregated Nonacad - 2 periods 6-8 39.25 39.25 41.25 41.25 41.25 41.25 40.50 40.08 40.08 42.50 42.50 42.50 42.50 42.50 42.50
Middle Desegregated Combined 6-8 36.67 36.67 38.67 38.67 38.67 38.67 38.45 37.86 37.86 40.45 40.45 40.45 40.45 40.45 40.45
Middle Deseg Magnet All 6-8 32.50 32.50 34.50 34.50 34.50 34.50 34.50 33.83 33.83 36.50 36.50 36.50 36.50 36.50 36.50
High School District Norm All 38.50 38.50 40.50 40.50 40.50 40.50 40.50 40.50 40.50 42.50 42.50 42.50 42.50 42.50 42.50
High School PHBAO Academic 9-10 30.00 30.00 32.00 32.00 32.00 32.00 32.00 32.00 32.00 34.00 34.00 34.00 34.00 34.00 34.00
High School PHBAO Nonacad 9-10 38.50 38.50 40.50 40.50 40.50 40.50 40.50 40.50 40.50 42.50 42.50 42.50 42.50 42.50 42.50
High School PHBAO Academic 11-12 38.50 38.50 40.50 40.50 40.50 40.50 40.50 40.50 40.50 42.50 42.50 42.50 42.50 42.50 42.50
High School PHBAO Nonacad 11-12 38.50 38.50 40.50 40.50 40.50 40.50 40.50 40.50 40.50 42.50 42.50 42.50 42.50 42.50 42.50
High School Desegregated Academic 9-10 35.50 35.50 37.50 37.50 37.50 37.50 37.50 37.50 37.50 39.50 39.50 39.50 39.50 39.50 39.50
High School Desegregated Nonacad 9-10 38.50 38.50 40.50 40.50 40.50 40.50 40.50 40.50 40.50 42.50 42.50 42.50 42.50 42.50 42.50
High School Desegregated Academic 11-12 38.50 38.50 40.50 40.50 40.50 40.50 40.50 40.50 40.50 42.50 42.50 42.50 42.50 42.50 42.50
High School Desegregated Nonacad 11-12 38.50 38.50 40.50 40.50 40.50 40.50 40.50 40.50 40.50 42.50 42.50 42.50 42.50 42.50 42.50
High School PHBAO Magnet All 9-12 30.00 30.00 32.00 32.00 32.00 32.00 32.00 32.00 32.00 34.00 34.00 34.00 34.00 34.00 34.00
High School Deseg Magnet All 9-12 32.50 32.50 34.50 34.50 34.50 34.50 34.50 34.50 34.50 36.50 36.50 36.50 36.50 36.50 36.50
Community Day Schools,
Opportunity Schools and
Pregnant Minor 20.00 21.00 21.00 21.00 21.00 21.00
Continuation Schools 27.00 29.00 29.00 29.00 29.00 29.00
Independent Study - City of Angels 27.00 30.00 30.00 30.00 30.00 30.00
148

APPENDIX J
DISTRICT ENROLLMENT TRENDS
This section provides information and data related to the number of students served in the District’s schools.
Enrollment and Enrollment Projections. To project enrollment, the Los Angeles Unified School District uses data
on live births in Los Angeles County, historical grade retention ratios, economic factors, and other relevant
information. Estimated enrollments in grades 1 through 12 are calculated using a variety of scenarios, generally
involving weighted and true averages. The grade retention ratio measures the percentage of students expected to
progress to the next grade level from one year to the next, based on past trends. Kindergarten enrollments are
calculated as a percentage of live births in Los Angeles County from five years earlier.
Enrollment peaked in 2002-03 at 746,831, and has declined each year since. This is due to several factors, including
the reduced birth rate in Los Angeles County and the increasing cost of living, including housing, in southern
California.
Declining enrollment affects both revenue and expenditures. However, declining enrollment typically causes a more
rapid decline in revenues after the first year. This is because declining enrollment districts are essentially “held
harmless” for the decline from the previous year. Another contributing factor to the change in revenue and
expenditure District-wide is the increase in the percentage of students enrolled in independent charter schools.
The District’s enrollment projections differentiate between students in fiscally-independent charter and non- charter
locations. This helps the District estimate the impact of fiscally-independent charter schools on the District’s budget.
The fiscally-independent charter school data include both schools that have converted from non- charter to fiscally-
independent charter school status (“conversion charters”) and schools that began their existence as fiscally-
independent charter schools (“start-up charters”).
The chart below shows the increase in the number of students enrolled in independent charter schools over the past
decade. In contrast, the District’s total K-12 enrollment has declined over the same period.
-
100,000
200,000
300,000
400,000
500,000
600,000
700,000
800,000
District Enrollment Trends 2001-02 to 2014-15 (Projected)
Independent Charters
District K-12
149

Norm Day Enrollment - Including Independent Charter Schools
2005-06 2006-07 2007-08 2008-09 2009-10 2010-11 2011-12 2012-13 2013-14 2014-15 2015-16 2016-17
Actual Actual Actual Actual Actual Actual Actual Actual Actual Estimated Estimated Estimated
LA County - Live Births Lagged 5 Years 157,391 153,523 151,167 152,192 151,504 150,377 151,837 151,813 147,684 139,679 133,160 130,312
Graded Enrollment
Kindergarten 54,462 52,452 50,822 50,877 51,193 51,638 52,846 53,262 55,315 56,627 58,132 57,174
Grade 1 56,872 55,267 53,543 52,305 51,798 51,904 51,692 52,143 50,892 49,177 46,197 47,448
Grade 2 56,097 54,222 53,082 52,338 50,674 50,406 50,230 50,353 51,070 47,180 46,110 43,813
Grade 3 56,530 53,348 51,814 51,418 50,376 49,165 48,946 48,736 49,154 50,088 46,193 45,068
Grade 4 56,568 53,618 51,174 50,692 49,982 49,176 47,860 47,755 47,783 47,895 48,920 45,222
Grade 5 57,531 54,205 51,787 50,206 49,430 49,204 48,126 47,068 47,384 47,806 47,806 48,714
Grade 6 56,262 53,089 50,559 49,246 47,622 47,221 47,249 46,020 45,173 45,239 45,867 46,092
Grade 7 53,815 53,702 51,458 49,557 48,084 46,756 46,186 46,150 45,269 45,366 45,379 45,957
Grade 8 50,262 51,837 51,985 50,452 48,595 47,125 46,062 45,295 45,381 44,491 43,617 43,824
Grade 9 71,056 67,816 66,643 67,029 63,549 60,439 58,920 55,872 53,339 54,455 54,382 54,289
Grade 10 52,045 52,480 51,749 51,900 53,543 52,306 50,527 49,478 48,282 45,815 46,461 46,087
Grade 11 40,303 42,399 43,536 43,082 43,884 45,040 43,477 42,308 41,822 40,801 38,672 39,172
Grade 12 29,090 29,058 31,899 34,755 34,733 36,279 37,280 36,748 36,489 35,805 34,641 32,559
Total graded enrollment 690,893 673,493 660,051 653,857 643,463 636,659 629,401 621,188 617,353 610,745 602,377 595,419
K-5 enrollment 338,060 323,112 312,222 307,836 303,453 301,493 299,700 299,317 301,598 298,773 293,358 287,439
6-8 enrollment 160,339 158,628 154,002 149,255 144,301 141,102 139,497 137,465 135,823 135,096 134,863 135,873
9-12 enrollment 192,494 191,753 193,827 196,766 195,709 194,064 190,204 184,406 179,932 176,876 174,156 172,107
Total graded enrollment 690,893 673,493 660,051 653,857 643,463 636,659 629,401 621,188 617,353 610,745 602,377 595,419
Ungraded enrollment
Special day classes in regular schools 27,486 26,713 26,328 26,350 26,465 26,308 25,851 25,691 25,891 25,485 24,952 24,433
Special day classes in special ed schools 3,908 3,673 3,656 3,604 3,552 3,555 3,537 3,291 2,893 2,848 2,788 2,730
Continuation and opportunity schools 4,932 4,558 4,242 4,327 4,961 5,126 5,444 5,546 5,359 5,359 5,359 5,359
Nonpublic schools 10 24 11
Total ungraded enrollment 36,336 34,968 34,237 34,281 34,978 34,989 34,832 34,528 34,143 33,692 33,099 32,522
0 0 0 0 0 0 0
Total graded and ungraded enrollment 727,229 708,461 694,288 688,138 678,441 671,648 664,233 655,716 651,496 644,437 635,476 627,941
ENROLLMENT PROJECTIONS
Appendix J
150
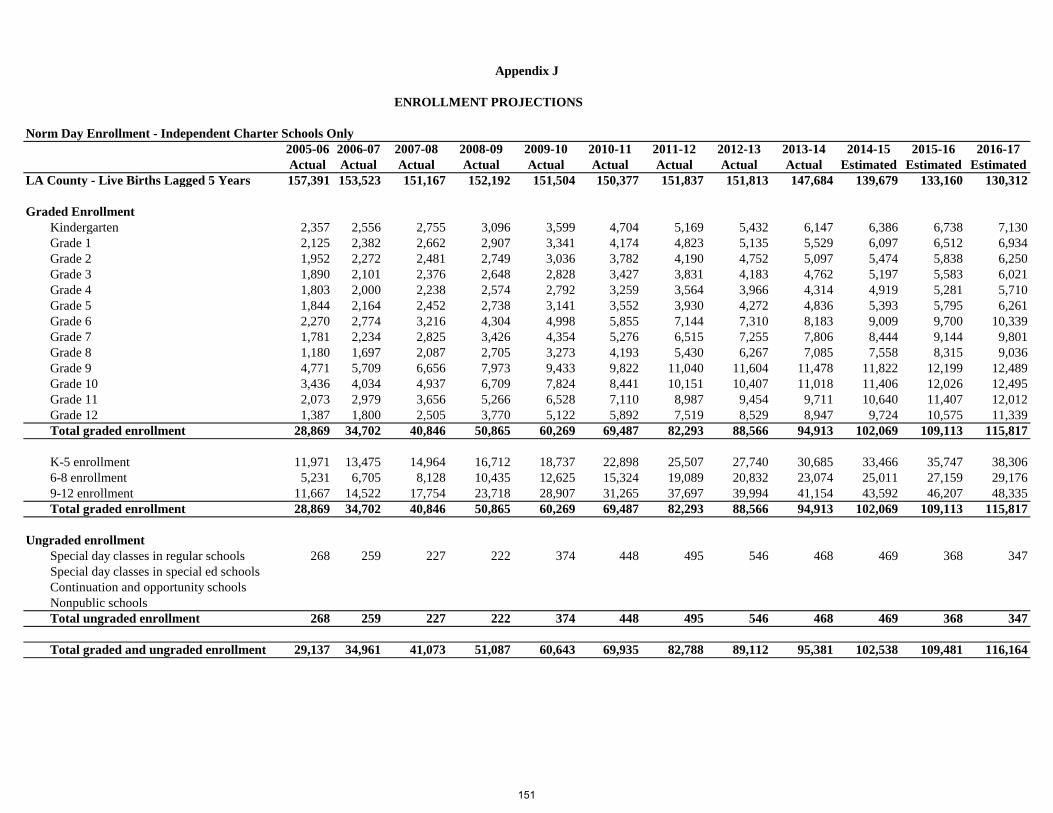
ENROLLMENT PROJECTIONS
Appendix J
Norm Day Enrollment - Independent Charter Schools Only
2005-06 2006-07 2007-08 2008-09 2009-10 2010-11 2011-12 2012-13 2013-14 2014-15 2015-16 2016-17
Actual Actual Actual Actual Actual Actual Actual Actual Actual Estimated Estimated Estimated
LA County - Live Births Lagged 5 Years 157,391 153,523 151,167 152,192 151,504 150,377 151,837 151,813 147,684 139,679 133,160 130,312
Graded Enrollment
Kindergarten 2,357 2,556 2,755 3,096 3,599 4,704 5,169 5,432 6,147 6,386 6,738 7,130
Grade 1 2,125 2,382 2,662 2,907 3,341 4,174 4,823 5,135 5,529 6,097 6,512 6,934
Grade 2 1,952 2,272 2,481 2,749 3,036 3,782 4,190 4,752 5,097 5,474 5,838 6,250
Grade 3 1,890 2,101 2,376 2,648 2,828 3,427 3,831 4,183 4,762 5,197 5,583 6,021
Grade 4 1,803 2,000 2,238 2,574 2,792 3,259 3,564 3,966 4,314 4,919 5,281 5,710
Grade 5 1,844 2,164 2,452 2,738 3,141 3,552 3,930 4,272 4,836 5,393 5,795 6,261
Grade 6 2,270 2,774 3,216 4,304 4,998 5,855 7,144 7,310 8,183 9,009 9,700 10,339
Grade 7 1,781 2,234 2,825 3,426 4,354 5,276 6,515 7,255 7,806 8,444 9,144 9,801
Grade 8 1,180 1,697 2,087 2,705 3,273 4,193 5,430 6,267 7,085 7,558 8,315 9,036
Grade 9 4,771 5,709 6,656 7,973 9,433 9,822 11,040 11,604 11,478 11,822 12,199 12,489
Grade 10 3,436 4,034 4,937 6,709 7,824 8,441 10,151 10,407 11,018 11,406 12,026 12,495
Grade 11 2,073 2,979 3,656 5,266 6,528 7,110 8,987 9,454 9,711 10,640 11,407 12,012
Grade 12 1,387 1,800 2,505 3,770 5,122 5,892 7,519 8,529 8,947 9,724 10,575 11,339
Total graded enrollment 28,869 34,702 40,846 50,865 60,269 69,487 82,293 88,566 94,913 102,069 109,113 115,817
K-5 enrollment 11,971 13,475 14,964 16,712 18,737 22,898 25,507 27,740 30,685 33,466 35,747 38,306
6-8 enrollment 5,231 6,705 8,128 10,435 12,625 15,324 19,089 20,832 23,074 25,011 27,159 29,176
9-12 enrollment 11,667 14,522 17,754 23,718 28,907 31,265 37,697 39,994 41,154 43,592 46,207 48,335
Total graded enrollment 28,869 34,702 40,846 50,865 60,269 69,487 82,293 88,566 94,913 102,069 109,113 115,817
Ungraded enrollment
Special day classes in regular schools 268 259 227 222 374 448 495 546 468 469 368 347
Special day classes in special ed schools
Continuation and opportunity schools
Nonpublic schools
Total ungraded enrollment 268 259 227 222 374 448 495 546 468 469 368 347
Total graded and ungraded enrollment 29,137 34,961 41,073 51,087 60,643 69,935 82,788 89,112 95,381 102,538 109,481 116,164
151
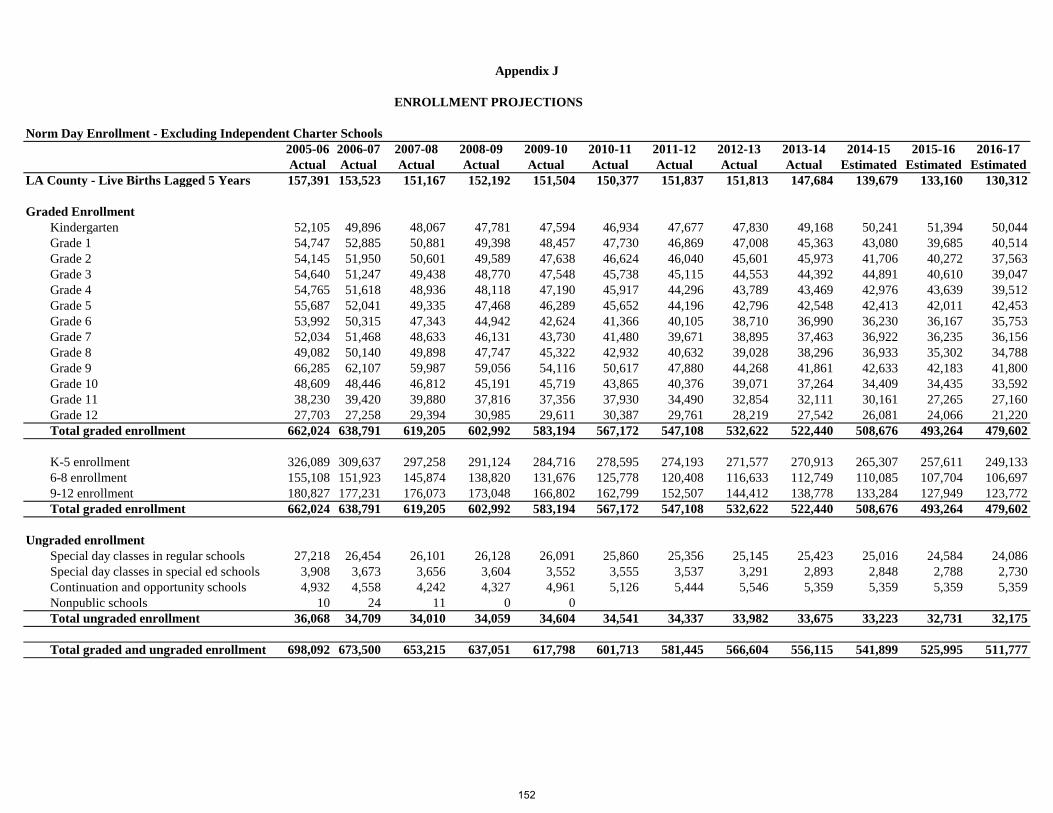
ENROLLMENT PROJECTIONS
Appendix J
Norm Day Enrollment - Excluding Independent Charter Schools
2005-06 2006-07 2007-08 2008-09 2009-10 2010-11 2011-12 2012-13 2013-14 2014-15 2015-16 2016-17
Actual Actual Actual Actual Actual Actual Actual Actual Actual Estimated Estimated Estimated
LA County - Live Births Lagged 5 Years 157,391 153,523 151,167 152,192 151,504 150,377 151,837 151,813 147,684 139,679 133,160 130,312
Graded Enrollment
Kindergarten 52,105 49,896 48,067 47,781 47,594 46,934 47,677 47,830 49,168 50,241 51,394 50,044
Grade 1 54,747 52,885 50,881 49,398 48,457 47,730 46,869 47,008 45,363 43,080 39,685 40,514
Grade 2 54,145 51,950 50,601 49,589 47,638 46,624 46,040 45,601 45,973 41,706 40,272 37,563
Grade 3 54,640 51,247 49,438 48,770 47,548 45,738 45,115 44,553 44,392 44,891 40,610 39,047
Grade 4 54,765 51,618 48,936 48,118 47,190 45,917 44,296 43,789 43,469 42,976 43,639 39,512
Grade 5 55,687 52,041 49,335 47,468 46,289 45,652 44,196 42,796 42,548 42,413 42,011 42,453
Grade 6 53,992 50,315 47,343 44,942 42,624 41,366 40,105 38,710 36,990 36,230 36,167 35,753
Grade 7 52,034 51,468 48,633 46,131 43,730 41,480 39,671 38,895 37,463 36,922 36,235 36,156
Grade 8 49,082 50,140 49,898 47,747 45,322 42,932 40,632 39,028 38,296 36,933 35,302 34,788
Grade 9 66,285 62,107 59,987 59,056 54,116 50,617 47,880 44,268 41,861 42,633 42,183 41,800
Grade 10 48,609 48,446 46,812 45,191 45,719 43,865 40,376 39,071 37,264 34,409 34,435 33,592
Grade 11 38,230 39,420 39,880 37,816 37,356 37,930 34,490 32,854 32,111 30,161 27,265 27,160
Grade 12 27,703 27,258 29,394 30,985 29,611 30,387 29,761 28,219 27,542 26,081 24,066 21,220
Total graded enrollment 662,024 638,791 619,205 602,992 583,194 567,172 547,108 532,622 522,440 508,676 493,264 479,602
K-5 enrollment 326,089 309,637 297,258 291,124 284,716 278,595 274,193 271,577 270,913 265,307 257,611 249,133
6-8 enrollment 155,108 151,923 145,874 138,820 131,676 125,778 120,408 116,633 112,749 110,085 107,704 106,697
9-12 enrollment 180,827 177,231 176,073 173,048 166,802 162,799 152,507 144,412 138,778 133,284 127,949 123,772
Total graded enrollment 662,024 638,791 619,205 602,992 583,194 567,172 547,108 532,622 522,440 508,676 493,264 479,602
Ungraded enrollment
Special day classes in regular schools 27,218 26,454 26,101 26,128 26,091 25,860 25,356 25,145 25,423 25,016 24,584 24,086
Special day classes in special ed schools 3,908 3,673 3,656 3,604 3,552 3,555 3,537 3,291 2,893 2,848 2,788 2,730
Continuation and opportunity schools 4,932 4,558 4,242 4,327 4,961 5,126 5,444 5,546 5,359 5,359 5,359 5,359
Nonpublic schools 10 24 11 0 0
Total ungraded enrollment 36,068 34,709 34,010 34,059 34,604 34,541 34,337 33,982 33,675 33,223 32,731 32,175
Total graded and ungraded enrollment 698,092 673,500 653,215 637,051 617,798 601,713 581,445 566,604 556,115 541,899 525,995 511,777
152

APPENDIX K
ID HH DEAF SLI VI ED OI OHI SLD DB AUT TBI Total
Dec 2009 4,511 1,140 437 8,836 498 2,298 2,422 6,463 46,445 11 9,322 149 82,532
Dec 2010 4,543 1,248 422 12,264 495 2,076 2,419 7,067 40,961 23 10,555 142 82,215
Dec 2011 4,455 1,251 422 12,772 530 2,080 2,372 7,617 39,689 21 10,902 146 82,257
Dec 2012 4,388 1,265 391 12,536 508 1,862 2,242 8,185 39,010 19 12,225 134 82,765
Dec 2013 4,257 1,331 364 12,250 502 1,775 2,276 8,409 38,360 16 12,695 129 82,364
ID HH DEAF SLI VI ED OI OHI SLD DB AUT TBI Total
Dec 2009 4,425 1,070 425 8,243 480 2,247 2,378 6,017 43,364 11 9,028 139 77,827
Dec 2010 4,460 1,178 412 11,488 476 2,034 2,374 6,486 37,856 23 10,200 132 77,119
Dec 2011 4,342 1,173 412 11,806 514 2,009 2,304 6,777 35,917 21 10,389 135 75,799
Dec 2012 4,274 1,180 382 11,468 494 1,780 2,175 7,139 34,747 19 11,544 123 75,325
Dec 2013 4,144 1,239 355 11,171 490 1,697 2,208 7,287 34,000 16 11,928 118 74,653
ID HH DEAF SLI VI ED OI OHI SLD DB AUT TBI Total
Dec 2009 86 70 12 593 18 51 44 446 3,081 0 294 10 4,705
Dec 2010 83 70 10 776 19 42 45 581 3,105 0 355 10 5,096
Dec 2011 113 78 10 966 16 71 68 840 3,772 0 513 11 6,458
Dec 2012 114 85 9 1,068 14 82 67 1,046 4,263 0 681 11 7,440
Dec 2013 113 92 9 1,079 12 78 68 1,122 4,360 0 767 11 7,711
Students with Disabilities - Including Independent Charter Schools
Students with Disabilities - Excluding Independent Charter Schools
Students with Disabilities - Independent Charter Schools Only
Special Education Enrollment Data Report by Disability
Data Source: CASEMIS - December Reports Primary Disability Categories: Intellectual Disability(ID), Hard of Hearing (HH), Deafness(DEAF), Speech or Language Impairment (SLI), Visual Impairment (VI), Emotional Disturbance (ED), Orthopedic Impairment (OI), Other Health Impairment (OHI), Specific Learning Disability (SLD), Autism (AUT), Traumatic Brain
153

154
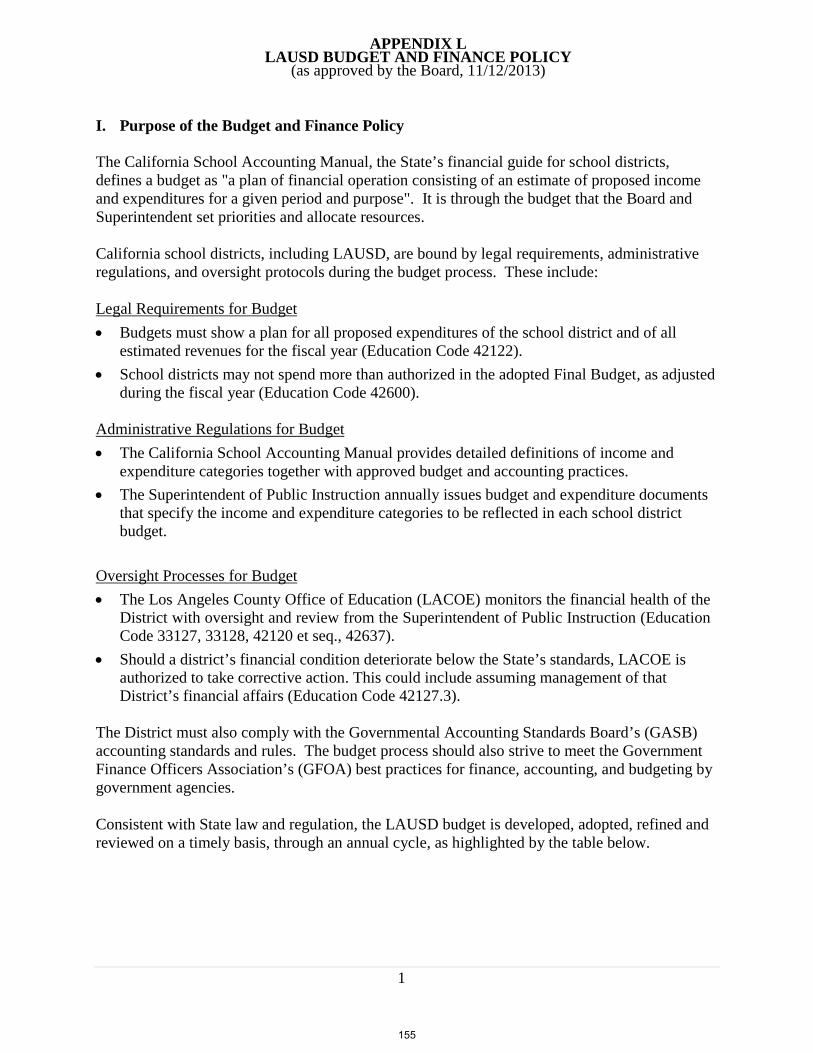
1
APPENDIX L LAUSD BUDGET AND FINANCE POLICY
(as approved by the Board, 11/12/2013)
I. Purpose of the Budget and Finance Policy
The California School Accounting Manual, the State’s financial guide for school districts, defines a budget as "a plan of financial operation consisting of an estimate of proposed income and expenditures for a given period and purpose". It is through the budget that the Board and Superintendent set priorities and allocate resources.
California school districts, including LAUSD, are bound by legal requirements, administrative regulations, and oversight protocols during the budget process. These include:
Legal Requirements for Budget Budgets must show a plan for all proposed expenditures of the school district and of all
estimated revenues for the fiscal year (Education Code 42122). School districts may not spend more than authorized in the adopted Final Budget, as adjusted
during the fiscal year (Education Code 42600).
Administrative Regulations for Budget The California School Accounting Manual provides detailed definitions of income and
expenditure categories together with approved budget and accounting practices. The Superintendent of Public Instruction annually issues budget and expenditure documents
that specify the income and expenditure categories to be reflected in each school district budget.
Oversight Processes for Budget The Los Angeles County Office of Education (LACOE) monitors the financial health of the
District with oversight and review from the Superintendent of Public Instruction (Education Code 33127, 33128, 42120 et seq., 42637).
Should a district’s financial condition deteriorate below the State’s standards, LACOE is authorized to take corrective action. This could include assuming management of that District’s financial affairs (Education Code 42127.3).
The District must also comply with the Governmental Accounting Standards Board’s (GASB) accounting standards and rules. The budget process should also strive to meet the Government Finance Officers Association’s (GFOA) best practices for finance, accounting, and budgeting by government agencies.
Consistent with State law and regulation, the LAUSD budget is developed, adopted, refined and reviewed on a timely basis, through an annual cycle, as highlighted by the table below.
155
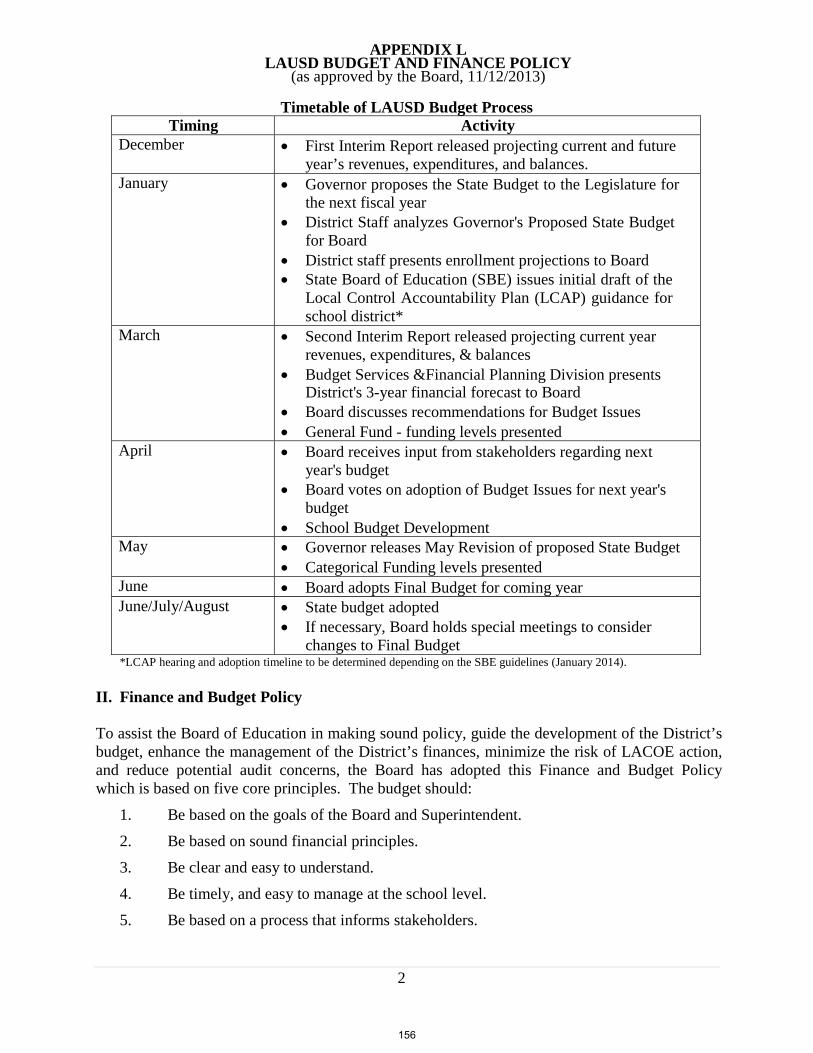
2
APPENDIX L LAUSD BUDGET AND FINANCE POLICY
(as approved by the Board, 11/12/2013)
Timetable of LAUSD Budget Process Timing Activity
December First Interim Report released projecting current and future year’s revenues, expenditures, and balances.
January Governor proposes the State Budget to the Legislature for the next fiscal year
District Staff analyzes Governor's Proposed State Budget for Board
District staff presents enrollment projections to Board State Board of Education (SBE) issues initial draft of the
Local Control Accountability Plan (LCAP) guidance for school district*
March Second Interim Report released projecting current year revenues, expenditures, & balances
Budget Services &Financial Planning Division presents District's 3-year financial forecast to Board
Board discusses recommendations for Budget Issues General Fund - funding levels presented
April Board receives input from stakeholders regarding next year's budget
Board votes on adoption of Budget Issues for next year's budget
School Budget Development May Governor releases May Revision of proposed State Budget
Categorical Funding levels presented June Board adopts Final Budget for coming year June/July/August State budget adopted
If necessary, Board holds special meetings to consider changes to Final Budget
*LCAP hearing and adoption timeline to be determined depending on the SBE guidelines (January 2014).
II. Finance and Budget Policy
To assist the Board of Education in making sound policy, guide the development of the District’s budget, enhance the management of the District’s finances, minimize the risk of LACOE action, and reduce potential audit concerns, the Board has adopted this Finance and Budget Policy which is based on five core principles. The budget should:
1. Be based on the goals of the Board and Superintendent.
2. Be based on sound financial principles.
3. Be clear and easy to understand.
4. Be timely, and easy to manage at the school level.
5. Be based on a process that informs stakeholders.
156

3
APPENDIX L LAUSD BUDGET AND FINANCE POLICY
(as approved by the Board, 11/12/2013)
This policy was developed after reviewing the document “Recommended Budget Practices” developed by the GFOA. The policy is also consistent with the standards and criteria established by the State Board of Education (Education Code Sections 33127, 33128), as well as current GASB rules and standards. To the extent that LAUSD’s current budgeting and accounting practices are not in compliance with this policy, implementation of this policy is to be phased in.
The Finance and Budget Policy is a “living document.” LAUSD expects that it will evolve over time to best connect District policy, budgeting, and financing principles.
Principle One: The budget should be based on the goals of the Board of Education and Superintendent.
The Board of Education and Superintendent have the primary responsibility for developing and articulating the District’s goals; these goals will be the framework for the budget.
Principle Two: The budget should be based on sound financial principles.
LAUSD’s budget should be based on financial principles that will keep the District viable and able to sustain its key programs over time. The following specific financial principles, based on law, expert advice and experience, are offered to this end:
a) Structurally Balanced Operating Budget b) Appropriate Use of One-Time Revenues c) Alignment of Budget with Expected Expenditures d) Maintenance of Appropriate and Adequate Fund Balance and Reserves e) Revenue Maximization f) Revenue and Expenditure Estimation g) Cost Recovery Through Fees and Charges h) Capital Plan i) Asset Management j) Prudent Debt Management k) Program Sustainability l) GASB Compliance
A) STRUCTURALLY BALANCED OPERATING BUDGET
The Superintendent must annually prepare and recommend a structurally balanced budget where operating revenues are equal to, or exceed, operating expenditures (Education Code Sections 42100, 42127.5).
The Office of the Chief Financial Officer shall prepare the First and Second Period Interim Financial Reports in accordance with the law and make appropriate recommendations to the Board if financial adjustments are necessary. Annual
157
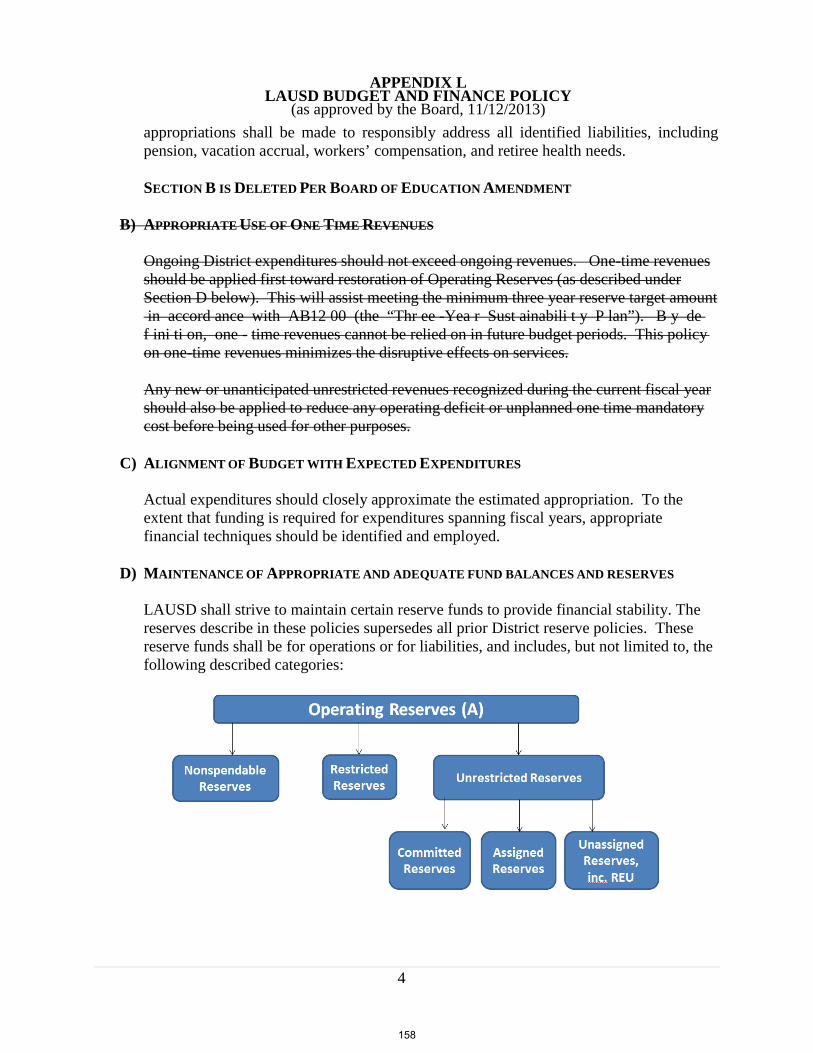
4
APPENDIX L LAUSD BUDGET AND FINANCE POLICY
(as approved by the Board, 11/12/2013)
appropriations shall be made to responsibly address all identified liabilities, including pension, vacation accrual, workers’ compensation, and retiree health needs.
SECTION B IS DELETED PER BOARD OF EDUCATION AMENDMENT
B) APPROPRIATE USE OF ONE TIME REVENUES
Ongoing District expenditures should not exceed ongoing revenues. One-time revenues should be applied first toward restoration of Operating Reserves (as described under Section D below). This will assist meeting the minimum three year reserve target amount in accord ance with AB12 00 (the “Thr ee -Yea r Sust ainabili t y P lan”). B y de f ini ti on, one - time revenues cannot be relied on in future budget periods. This policy on one-time revenues minimizes the disruptive effects on services.
Any new or unanticipated unrestricted revenues recognized during the current fiscal year should also be applied to reduce any operating deficit or unplanned one time mandatory cost before being used for other purposes.
C) ALIGNMENT OF BUDGET WITH EXPECTED EXPENDITURES
Actual expenditures should closely approximate the estimated appropriation. To the extent that funding is required for expenditures spanning fiscal years, appropriate financial techniques should be identified and employed.
D) MAINTENANCE OF APPROPRIATE AND ADEQUATE FUND BALANCES AND RESERVES
LAUSD shall strive to maintain certain reserve funds to provide financial stability. The reserves describe in these policies supersedes all prior District reserve policies. These reserve funds shall be for operations or for liabilities, and includes, but not limited to, the following described categories:
158
5
APPENDIX L LAUSD BUDGET AND FINANCE POLICY
(as approved by the Board, 11/12/2013)
A. Operating Reserves:
The purpose of operating reserves is to set aside monies and to meet the minimum reserves policy target in the Three-Year Sustainability Plan.
The current classifications of fund balances1 are as follows:
Non-spendable fund balance (inherently non-spendable) This category includes reserves for Revolving Cash, Stores, and Prepaid Expenditures
Restricted fund balance (externally enforceable limitations on use) This category includes balances related federal and state programs.
Committed fund balance (self-imposed limitations on use) Assigned fund balance (limitation resulting from intended use) Unassigned fund balance (residual resources for unrestricted use)
General Fund Balance Policy: The District shall maintain Total General Fund balances at a level which is 5 % or more of Total General Fund expenditures and net transfers out (the “5% Minimum Reserve Threshold”). This level is the minimum necessary to sustain the District’s strong credit ratings.
Reserve funding levels shall be reviewed annually and adjusted as appropriate. The reserve policy is as follows:
1. The District shall maintain at least the 5% Minimum Reserve Threshold in the
Three-Year Sustainability Plan.
2. Whenever the District projects a failure to meet the 5% Minimum Reserve Threshold, all one-time monies received shall be set-aside until the Threshold is met in each of the years.
3. In addition, other recommendations will be developed to restore reserve balances.
These recommendations will be completed within the next fiscal year.
Reserve for Economic Uncertainties: This is a legally required reserve which is currently at 1% of General Fund appropriations.
Reserves for Revolving Cash, Stores, and Prepaid Expenditures: The District’s accounting practice establishes a reserve for revolving cash, stores, and prepaid expenditures.
1 Under GASB Statement No. 54, Fund Balance Reporting and Government Fund Type Definitions
159

6
APPENDIX L LAUSD BUDGET AND FINANCE POLICY
(as approved by the Board, 11/12/2013)
B. Liability Reserves: The purpose of the Liability Reserves is to set aside monies for legal liabilities. Funding these liability reserves provides resources to help prevent disruptive reductions to LAUSD operating programs.
B.1 Liability Self-Insurance Fund: Liability Self Insurance funding will be based on the current year claims and the amount to fully fund the estimated liability as determined by a third party actuarial report.
B.2 Worker’s Compensation Fund: Worker’s Compensation funding will be based on the current year claims and the amount to fully fund the estimated liability as determined by a third party actuarial report.
B.3 Health and Welfare Fund: Health & Welfare funding will be based on the Health and Welfare Memorandum of Agreement in place.
B.4 Other Post-Employment Benefits (OPEB) Fund: The District will establish an irrevocable trust for its OPEB liability (OPEB Trust) to:
1. Minimize encroachment on the District’s operating budget; 2. Provide funding to protect retiree benefits; 3. Improve the return on investment on the Trust assets; 4. Align contributions to more adequately recover costs from federal, capital and
grant programs; 5. Provide a proactive response to address the impacts of GASB 45 on the District’s
finances; and 6. Preserve the District’s net assets.
Contributions to the Trust will be annually calculated and distributed as follows:
1. An annual per employee set aside, at rates consistent with the District’s current
budget assumptions and policies, will be contributed to the OPEB Trust on or before June 30th. Such contributions will be subject to maintaining an
160
7
APPENDIX L LAUSD BUDGET AND FINANCE POLICY
(as approved by the Board, 11/12/2013)
Unrestricted General Fund balance of 5% of the unrestricted revenue. These Trust contributions will be made from all appropriate funding sources. The annual OPEB per employee growth rates will continue until such time that the District will be able to reasonably meet its unfunded liability in accordance with GASB standards.
2. In the event that the Unrestricted General Fund is above 5% of the unrestricted
revenues (after the annual OPEB contribution has been determined), an additional contribution from the assigned OPEB reserve will be placed in the Trust.
B.5 Supplemental Pension Set-aside/Reserve Fund: Subject to the requirements of Principle Two Section B, fifty percent of any new one- time funds identified after the final budget adoption will be put into a Supplemental Pension Set-aside/Reserve Fund. This fund is established in anticipation of GASB 67 and 68.
E) REVENUE MAXIMIZATION
LAUSD receives the majority of its funding from the State of California. To supplement these funds, LAUSD shall seek additional revenues from other funding sources including the Federal Government, foundations, corporations, mandate funding, parent and community organizations, and through new and changes to funding legislations. These additional resources should be for purposes that are consistent with the District’s goals and objectives and which complement the LAUSD’s resources. LAUSD shall also seek the approval of granting agencies to provide flexibility in the use of scarce resources.
F) REVENUE AND EXPENDITURE ESTIMATION
LASUD shall strive to include in the budget all revenues that can reasonably be expected for the fiscal year. The Chief Financial Officer shall appropriate funds for expenditure based on a prudent assessment of the risks associated with each revenue source. The authority to spend in part or all of the budgeted revenue will be provided based on revenue certainty.
Reserve for Anticipated Balances: This is a non-budget add reserve requested by the Los Angeles County of Education to allow for technical adjustment for expenditure.
G) COST RECOVERY THROUGH FEES AND CHARGES
LAUSD may charge fees to recover costs of certain services, such as those provided to charter schools. LAUSD shall set fees so that they cover the entire cost of the service provided, including all direct and indirect costs subject to any legal restrictions.
161

8
APPENDIX L LAUSD BUDGET AND FINANCE POLICY
(as approved by the Board, 11/12/2013)
H) CAPITAL PLAN
LAUSD will strive to provide comprehensive planning and budgeting for its capital needs by: Developing, on a periodic basis, a Statement of Need for capital programs. Annually adopting a multi-year capital budget that identifies the projects planned,
the estimated cost of each project, the expected sources of revenue for each project, and the fiscal year or years in which project funds must be committed.
Annually presenting an analysis of the future operational impact of the capital projects.
I) ASSET MANAGEMENT
The District will strive to: Budget appropriate amounts so that physical assets are properly maintained and
replaced when needed. Maintain inventories of assets and the condition of major assets assessed on a regular
basis to develop appropriate replacement and maintenance programs. Prepare a maintenance plan to sustain the need to maintain the value of its assets and
protect the health and safety of students and employees. Annually estimate and set aside resources for preventative maintenance.
J) PRUDENT DEBT MANAGEMENT
LAUSD shall adhere to the Debt Management Policy as adopted by the Board of Education.
K) PROGRAM SUSTAINABILITY
To achieve sustainability, LAUSD should strive to: Link multi-year programs to multi-year funding. When funding is non-continuous,
the program should be identified as limited. Set parameters for multi-year programs and offices by identifying specific “sunset
dates” for program termination as well as the ending date for personnel assignments funded in the program.
Make defined fiscal commitments rather than open-ended commitments (e.g. fund health benefits at a specific cost level rather than a specific service level).
Identify impact on the budget of unfunded mandates and other spending pressures.
L) GASB STANDARDS FOR FINANCIAL ACCOUNTING AND REPORTING
The Governmental Accounting Standards Board promotes rules governing financial accounting and reporting. LAUSD shall comply with these rules. LAUSD shall strive to receive the GFOA Certificate for Excellence in Financial Reporting annually.
162

9
APPENDIX L LAUSD BUDGET AND FINANCE POLICY
(as approved by the Board, 11/12/2013)
Principle Three: The budget should be clear and easy to understand.
A broad cross-section of stakeholders in the District rely on LAUSD’s budget and related financial documents for crucial financial information. These stakeholders include parents, teachers, community groups, administrators, and oversight bodies. LAUSD’s budget should be organized and presented in such a way that both lay persons and experts can understand:
What the District intends to do and how it intends to do it The District’s overall financial condition The historical context for LAUSD programs
In addition, LAUSD should strive to develop its annual budget in a manner consistent with the GFOA standards for budget presentation. These guidelines are established to provide appropriate disclosure of financial information to the public and other interested parties, while facilitating management decisions on program expenditures.
LAUSD has identified guidelines for the presentation of budgets consistent with GFOA standards from four perspectives:
a) Policy Document b) Financial Plan c) Operations Guide d) Communications Device
Principle Four: The budget should be timely and easy to manage at the school level.
The process of managing the budget is easier for schools and offices if they have access to systems and training. The District will define the parameters under which schools and offices will manage their budgets.
Principle Five: The budget process should inform stakeholders.
Prior to the adoption of the final budget, District staff will inform stakeholders in accordance with the budget Timetable and materials will be posted to the website.
163

10
APPENDIX L LAUSD BUDGET AND FINANCE POLICY
(as approved by the Board, 11/12/2013)
III. FUND BALANCE POLICY AND PROCEDURES
A. PURPOSE
This Fund Balance Policy establishes the policy and procedures for reporting and maintaining fund balance in the District’s financial statements. The policy also authorizes and directs the Chief Financial Officer to prepare financial reports which accurately categorize fund balance as per Governmental Accounting Standards Board (GASB) Statement No. 54, Fund Balance Reporting and Government Fund Type Definitions, effective beginning the 2010-11 fiscal year.
B. GENERAL POLICY
There are five separate components of fund balance. Each component identifies the extent to which the District is bound by constraints on the specific purpose for which amounts can be spent.
Nonspendable fund balance (inherently nonspendable) Restricted fund balance (externally enforceable limitations on use) Committed fund balance (self-imposed limitations on use) Assigned fund balance (limitation resulting from intended use) Unassigned fund balance (residual resources for unrestricted use)
The first two components listed above are not addressed in this policy due to the nature of their restrictions. An example of nonspendable fund balance is inventory. Restricted fund balance is either imposed by law or constrained by grantors, contributors, or laws or regulations of other governments. This policy is focused on the last three components listed above.
The District considers restricted fund balances to have been spent first when expenditure is incurred for purposes for which both restricted and unrestricted fund balance is available. Similarly, when an expenditure is incurred for purposes for which amounts in any of the unrestricted classifications of fund balance could be used, the District considers committed amounts to be reduced first, followed by assigned amounts, and then unassigned amounts.
C. PROVISIONS
Committed Fund Balance
The Governing Board, as the District’s highest level of decision-making authority, may commit fund balances for specific purposes pursuant to constraints imposed by formal actions. Commitment of funds can be made through the adoption of the budget as long as the intent to commit the funds is specifically stated. These committed amounts cannot be used for any other purpose unless the Governing Board removes or changes the specific use through formal action. Governing Board action to commit fund balance needs to occur within the fiscal reporting period, no later than June 30. The amount which will be committed can be determined subsequently but prior to the release of the District’s financial statements.
164

11
APPENDIX L LAUSD BUDGET AND FINANCE POLICY
(as approved by the Board, 11/12/2013)
Pursuant to GASB 54, the District commits to maintaining the Deferred Maintenance and Adult Education funds to support programs for which the funds were originally established. Amounts transferred into or retained in the funds will be determined annually per Board adoption of the budget and approval of the year end unaudited actuals report.
Assigned Fund Balance
Amounts that are neither restricted nor committed may be constrained by the District’s intent to be used for specific purposes. This policy hereby delegates the authority to assign amounts to the Superintendent, or designee.
Unassigned Fund Balance
These are residual positive net resources for the General Fund in excess of what can properly be classified in one of the other four categories. There are some reserves that do not meet the requirements of the aforementioned components of fund balance. For financial statement reporting purposes, these reserves are included in the unassigned fund balance. This includes:
Reserve For Economic Uncertainty– The District will maintain an economic uncertainty reserve, consisting of unassigned amounts, of at least 1% of total General Fund expenditures and other financing uses in accordance with Section 15450 of the California Code of Regulations. The primary purpose of this reserve is to avoid the need for service level reductions in the event that an economic downturn causes revenues to be substantially lower than budgeted. In the event that the District must expend all or part of this reserve, the District will identify and implement a budgetary plan to replenish this reserve the following year. This reserve may be increased by legal requirement.
165

166
E
IS
APPENDIX M
Los Angeles Unified School District
DEBT MANAGEMENT POLICY
Prepared by:
The Office of the Chief Financial Officer
October 1, 2013
167

APPENDIX M
DEBT MANAGEMENT POLICY
Index
Background ..................................................................................................................................... 3 Article I. Purpose and Goals .................................................................................................... 4 Article II. Authorization............................................................................................................. 5
Section 2.01 Authority and Purposes of the Issuance of Debt........................................ 5 Section 2.02 Types of Debt Authorized to be Issued ....................................................... 5 Section 2.03 State Law ....................................................................................................... 7 Section 2.04 Annual Review .............................................................................................. 8
Article III. Structural Features, Legal and Credit Concerns............................................... 8 Section 3.01 Structure of Debt Issues ............................................................................... 8 Section 3.02 Sale of Securities ........................................................................................... 9 Section 3.03 Markets .......................................................................................................... 9 Section 3.04 Credit Enhancements and Derivatives........................................................ 9 Section 3.05 Impact on Operating Budget and District Debt Burden ......................... 10 Section 3.06 Debt Limitation ........................................................................................... 10 Section 3.07 Debt Issued to Finance Operating Costs................................................... 10 Section 3.08 Debt Burden Ratios and Debt Affordability Criteria.............................. 11 Section 3.09 Use of Corporations as Lessor for COPs Issues ....................................... 14
Article IV. Related Issues ...................................................................................................... 14 Section 4.01 Capital Improvement Program ................................................................. 14 Section 4.02 Reporting of Debt........................................................................................ 14 Section 4.03 Financial Disclosure.................................................................................... 15 Section 4.04 Review of Financing Proposals .................................................................. 15 Section 4.05 Establishing Financing Priorities .............................................................. 15 Section 4.06 Rating Agency and Credit Enhancer Relations ....................................... 15 Section 4.07 Investment Community Relations ............................................................. 15 Section 4.08 Refunding and Restructuring Policy......................................................... 16 Section 4.09 Investment of Borrowed Proceeds............................................................. 16 Section 4.10 Federal Arbitrage Rebate Requirement ................................................... 17 Section 4.11 Transaction Records ................................................................................... 17 Section 4.12 Financing Team Members ......................................................................... 17 Section 4.13 Special Situations ........................................................................................ 20
Appendix A LAUSD Long-Term Debt - Compliance Procedures
168

Page 3 of 34
APPENDIX M Los Angeles Unified School District DEBT MANAGEMENT POLICY October 1, 2013
The policies set forth in this Debt Management Policy (the “Policy”) have been developed to provide guidelines for the issuance of general obligation bonds, certificates of participation (“COPs”) and other forms of indebtedness by the Los Angeles Unified School District (the “District”). While the issuance of debt can be an appropriate method of financing capital projects, careful and consistent monitoring of such debt issuance is required to preserve the District’s credit strength and budget and financial flexibility. These guidelines will serve the District in determining the appropriate uses for debt financing and debt structures as well as establishing prudent debt management goals.
Background
The District enjoys some of the highest credit ratings of any major urban school district in the nation. The District’s general obligation bonds are rated Aa2 by Moody’s Investors Service and AA- by Standard & Poor’s Corporation. The District’s COPs ratings are Aa3 (Moody’s, for non- abatement leases), A1 (Moody’s, for leases subject to abatement) and A+ (Standard & Poor’s, for both lease types). These high credit ratings reduce the interest costs paid by the District on the amounts borrowed. Lower interest costs result in lower tax rates paid by the District’s taxpayers and a reduced burden on the General Fund. These debt management policies are intended to maintain the District’s high credit ratings so that access to borrowed funds is provided at the lowest possible interest rates. Additionally, these policies are intended to set forth selection criteria for certain financial consultants and attorneys which will ensure a fair and open selection process, provide opportunities for all firms (including small business enterprises) to participate in District contracts, and result in the selection of the best qualified advisors.
The District faces continuing capital infrastructure and cash requirements. In particular, the District is presently engaged in building new schools and modernizing schools with the Facilities Improvement Program to be completed over the next several years. The costs of these requirements will be met, in large part, through the issuance of various types of debt instruments and other long-term financial obligations. Under “Proposition BB”, “Measure K”, “Measure R”, “Measure Y” and “Measure Q” adopted by the voters in April 1997, November 2002, March 2004, November 2005 and November 2008, respectively, the District has already raised a combined $20.605 billion in general obligation bond authorization for its Facilities Improvement Program and other capital and General Fund relief projects. Consequently, the District has seen an increase in its historical levels of such debt and other obligations and needs to anticipate future issuance of debt obligations as well, some of which may be repaid from the District’s General Fund.1With these additional debt issuances, the effects of decisions regarding type of issue, method of sale, and payment structure become ever more critical to the District’s fiscal health. To help ensure the District’s creditworthiness, an established policy of managing the District’s debt is essential. To this end, the Board of Education of the District (the “Board”) recognizes this Policy to be financially prudent and in the District’s best economic interest. In addition, the District’s practices with respect to monitoring its outstanding debt issues for compliance with all Internal Revenue Service requirements and other transaction requirements are set forth in Appendix A to this Policy.
1 For purposes of this policy, long-term obligations such as lease payments in support of COPs will be considered “debt.”
169
Page 4 of 34
APPENDIX M Los Angeles Unified School District DEBT MANAGEMENT POLICY October 1, 2013
Article I. Purpose and Goals The purpose of the Policy is to provide a functional tool for debt management and capital planning, as well as to enhance the District’s ability to manage its debt and lease financings in a conservative and prudent manner. In following this Policy, the District shall pursue the following goals:
The District shall strive to fund capital improvements from referendum-approved bond issues
to preserve the availability of its General Funds for District operating purposes and other purposes that cannot be funded by such bond issues.
The District shall endeavor to attain the best possible credit rating for each debt issue (with or
without credit enhancement) in order to reduce interest costs, within the context of preserving financial flexibility and meeting capital funding requirements.
The District shall take all practical precautions and proactive measures to avoid any financial
decision which will negatively impact current credit ratings on existing or future debt issues.
The District shall remain mindful of debt limits in relation to assessed value growth within the school district and the tax burden needed to meet long-term capital requirements.
The District shall consider market conditions and District cash flows when timing the
issuance of debt.
The District shall determine the amortization (maturity) schedule which will best fit with the overall debt structure of the District at the time the new debt is issued.
The District shall give consideration to matching the term of the issue to the useful lives of
assets whenever practicable and economic, while considering repair and replacement costs of those assets to be incurred in future years as an offset to the useful lives, and the related length of time in the payout structure.
The District shall, when planning for the issuance of new debt, consider the impact of such
new debt on overlapping debt and the financing plans of local, state and other governments which overlap with the District.
The District shall, when issuing debt, assess financial alternatives to include new and
innovative financing approaches, including whenever feasible categorical grants, revolving loans or other State/federal aid, so as to minimize the encroachment on the District’s General Fund.
The District shall, when planning for the sizing and timing of debt issuance, consider its
ability to expend the funds obtained in a timely, efficient and economical manner.
The District shall ensure that local and emerging businesses will be considered for and utilized in lead roles and for other roles in the senior tier when appropriate.
170
Page 5 of 34
Los Angeles Unified School DistrictDEBT MANAGEMENT POLICY October 1, 2013
The key financial management tools and goals that are intrinsic to the Policy include: A. Fund Balance Policy: The District recognizes the importance of emergency reserves, including liquidity in the General Fund, that can provide a financial cushion in years of poor revenue receipts. A Reserve Fund Policy has been adopted by the Board.
B. Capital Financing Plan: The Office of the Chief Financial Officer will prepare a Capital Financing Plan in conjunction with the capital budget. The Plan will detail the sources of financing for all facilities in the capital budget, establish funding priorities and review the impact of all borrowings on the District’s long-term debt affordability ratios. The Plan will consider all potential sources of financing, including non-debt options and ensure that these financing sources are in accordance with the goals of this policy. The Office of the Chief Financial Officer will revise the Plan annually. See Articles III and IV herein.
C. Annual Debt Report: The Chief Financial Officer will annually prepare for and submit to the Superintendent and the Board a Debt Report which reviews the outstanding debt of the District as further described under Section 4.02 herein.
Article II. Authorization
Section 2.01 Authority and Purposes of the Issuance of Debt
The laws of the State of California authorize the issuance of debt by the District, and confer upon it the power and authority to make lease payments, contract debt, borrow money, and issue bonds for public improvement projects. Under these provisions, the District may contract debt to pay for the cost of acquiring, constructing, reconstructing, rehabilitating, replacing, improving, extending, enlarging, and equipping such projects: to refund existing debt; or to provide for cash flow needs.
Section 2.02 Types of Debt Authorized to be Issued
A. Short-Term: The District may issue fixed-rate and/or variable rate short-term debt which
may include tax and revenue anticipation notes (“TRANs”) when such instruments allow the District to meet its cash flow requirements. However, the District shall generally manage its cash position in a manner so that internally generated cash flow is sufficient to meet expenditures. The District may also issue commercial paper in the context of providing funding of shorter term acquisitions, such as equipment, or interim funding for capital costs that will ultimately be replaced with COPs. The District may also participate in an annual pooled financing of delinquent property taxes to the extent that the Chief Financial Officer determines such financing produces significant benefit to the District. The District may also issue bond anticipation notes (“BANs”) to provide interim financing for bond projects that will ultimately be taken out by permanent general obligation bonds.
B. Long-Term: Debt issues may be used to finance essential capital facilities, projects and
certain equipment where it is appropriate to spread the cost of the projects over more than one budget year. In so doing, the District recognizes that future taxpayers who will
171
Page 6 of 34
Los Angeles Unified School DistrictDEBT MANAGEMENT POLICY October 1, 2013
benefit from the investment will pay a share of its cost. Projects which are not appropriate for spreading costs over future years will not be financed with long-term debt. Long-term debt will, under no circumstances, be used to fund District operations. The District may issue long-term debt which may include, but is not limited to, general obligation bonds (“G. O. Bonds”). G.O. Bonds may be issued pursuant to Proposition 39 which permits bonding authorization if approved by at least 55% of voters versus the two-thirds approval requirement under other statutes. The District may also enter into long-term leases and/or COPs for public facilities, property, and equipment. In the event that lease revenue bond (“LRB”) financing costs are lower than COPs financing costs, the District may consider using a lease revenue bond structure for financing public facilities, property, and equipment. The District may issue COPs or LRBs in variable rate mode so long as the requirements in Section 3.08. (A) hereof are met.
C. Equipment Financing: Lease obligations are a routine and appropriate means of financing
capital equipment. However, lease obligations also have the greatest impact on budget flexibility. Therefore, efforts will be made to fund capital equipment with pay-as-you-go financing where feasible, and only the highest priority equipment purchases will be funded with lease obligations. With the exception of leases undertaken through the District’s standard procurement process, all equipment with a useful life of less than six years shall be funded on a pay-as-you-go basis unless the following conditions are met:
i. In connection with the proposed District budget, the Superintendent makes the
finding that there is an “economic necessity” based on a significant economic downturn, earthquake or other natural disaster and there are no other viable sources of funds to fund the equipment purchase.
ii. The Board concurs with the Superintendent’s finding in the adoption of the
budget.
iii. The various debt ceilings in Section 3.08 of this Policy are not exceeded.
D. Lease Financing of Real Property: Lease financing for facilities is appropriate for facilities for which there is insufficient time to obtain voter approval or in instances where obtaining voter approval is not feasible. Such financings will be structured in accordance with Section 3.01 of the Policy. If and when voter approved debt proceeds become available subsequently, the District will use such proceeds to take out the financing where appropriate.
E. Identified Repayment Source: The District will, when feasible, issue debt with a defined
revenue source in order to preserve the use of General Fund supported debt for projects with no stream of user-fee revenues. Examples of revenue sources include voter- approved taxes that repay general obligation or special tax bonds.
F. Use of General Obligation Bonds: Voter-approved general obligation bonds typically
provide the lowest cost of borrowing and do not impact the District’s General Fund. General obligation bond debt, to the extent authorized for the District, requires either
172
Page 7 of 34
Los Angeles Unified School DistrictDEBT MANAGEMENT POLICY October 1, 2013
two-thirds approval of the voters (in the case of traditional general obligation bonds) or 55% approval of the voters (in the case of general obligation bonds issued pursuant to Proposition 39). In recognition of the difficulty in achieving the required voter approval to issue general obligation bonds, such bonds will be generally limited to facilities and projects that provide wide public benefit and for which broad public support has been generated.
G. Use of Revenue Bonds: Revenue bonds supported solely from fees are not included when
bond rating agencies calculate debt ratios. Repayment of such bonds would rely on dedicated, pledged funds such as developer fees.. Accordingly, in order to preserve General Fund debt capacity and budget flexibility, revenue bonds will be preferred to General Fund supported debt when a distinct and identifiable revenue stream can be identified to support the issuance of bonds.
H. Use of Asset Transfer COPs: The District will restrict the use of an “asset transfer” COP
financing to finance emergency capital needs for which there are no other viable financing options. Additionally, asset transfer COPs may be used if significant savings in financing costs can be generated compared to other financing alternatives.
I. Pay-As-You-Go Financing: Except in extenuating circumstances, the District will fund
routine maintenance projects in each year’s capital program with pay-as-you-go financing. Extenuating circumstances may include unusually large and non-recurring budgeted expenditures, or when depleted reserves and weak revenues would require the delay or deletion of necessary capital projects.
J. Use of Special Financing Structures: The District may use special financing structures
permitted by the federal government if they are determined to result in significantly lower financing costs versus traditional tax-exempt bonds and/or COPs.
K. Capital Appreciation Debt: The District may issue Capital Appreciation Bonds (CABs)
pursuant to the law. However, CABs generally result in higher interest costs, reduce future flexibility, and may fail to match the cost of the project to the benefits received over the time period the CABs are outstanding. CABs will be avoided unless the Board determines it is necessary to issue CABs for urgent projects which cannot be more cost effectively financed by an alternative method.
Section 2.03 State Law
Section 18 of Article XVI of the State Constitution contains the basic “debt limitation” formula applicable to the District.
Sections 1(b)(2) and 1(b)(3) of Article XIII A of the State Constitution allow the District to issue traditional general obligation bonds and Proposition 39 bonds, respectively. The statutory authority for issuing general obligation bonds (including CABs) is contained in Section 15000 et seq. of the Education Code. Additional provisions applicable only to Proposition 39 general obligation bonds are contained in Section 15264 et seq. of the Education Code. An alternative
173

Page 8 of 34
Los Angeles Unified School DistrictDEBT MANAGEMENT POLICY October 1, 2013
procedure for issuing general obligation bonds is also available in Section 53506 et seq. of the Government Code.
The statutory authority for issuing TRANs is contained in Section 53850 et seq. of the Government Code. Authority for lease financings is found in Section 17455 et seq. of the Education Code and additional authority is contained in Sections 17400 et seq., 17430 et seq. and 17450 et seq. of the Education Code. The District may also issue Mello-Roos bonds pursuant to Section 53311 et seq. of the Government Code.
Section 2.04 Annual Review
The Policy shall be reviewed and updated at least annually and presented to the Board for approval as necessary. The Chief Financial Officer is the designated administrator of the Policy and has overall responsibility, with the Board’s approval, for decisions related to the structuring of all District debt issues. The Chief Financial Officer may delegate the day-to-day responsibility for managing the District’s debt and lease financings. The Board is the obligated issuer of all District debt and awards all purchase contracts for bonds, COPs, TRANs and any other debt issuances.
Article III. Structural Features, Legal and Credit Concerns
Section 3.01 Structure of Debt Issues
A. Maturity of Debt: The duration of a debt issue shall be consistent, to the extent possible, with the economic or useful life of the improvement or asset that the issue is financing. The final maturity of the debt shall be equal to or less than the useful life of the assets being financed, and the average life of the financing shall not exceed 120% of the average life of the assets being financed. In addition, the District shall consider the overall impact of the current and future debt burden of the financing when determining the duration of the debt issue.
i. General Obligation Bonds: The final maturity of General Obligation Bonds will
be limited to the shorter of the average useful life of the asset financed or 25 years when such bonds are issued pursuant to the Education Code. General Obligation Bonds may be structured with a term to maturity no longer than 40 years if issued pursuant to the Government Code; however, the selected term to maturity would have to be appropriate relative to the average useful lives of the assets financed. General Obligation Bond issues will generally be sized to the amount reasonably expected to be required for two year’s expenditure requirements.
ii. Lease-Purchase Obligations: The final maturity of equipment obligations will be
limited to the average useful life of the equipment to be financed. The final maturity of real property obligations will be determined, in part, by the size of the financing.
iii. Mello-Roos Obligations and Revenue Bonds: These obligations, although repaid
through additional taxes levied on a discrete group of taxpayers or from pledged developer fees and/or redevelopment funds, constitute overlapping indebtedness
174
Page 9 of 34
Los Angeles Unified School DistrictDEBT MANAGEMENT POLICY October 1, 2013
of the District and have an impact on the overall level of debt affordability. The District will develop separate guidelines for the issuance of such obligations as the need arises.
B. Debt Service Structure: The District shall design the financing schedule and repayment of debt so as to take best advantage of market conditions, provide flexibility, and, as practical, to recapture or maximize its debt capacity for future use. Annual debt service payments will generally be amortized on a level basis per component financed; however, principal amortization may occur more quickly or slowly where permissible, to meet debt repayment and flexibility goals.
C. Capitalized Interest: Unless required for structuring purposes, the District will avoid the use of capitalized interest in order to avoid unnecessarily increasing the bond size and interest expense. Certain types of financings such as COPs may require that interest on the debt be paid from capitalized interest until the District has use and possession of the underlying project. However, the District may pledge assets using an asset-transfer structure as collateral for the issue in order to eliminate the need for capitalized interest.
D. Call Provisions: The Chief Financial Officer and Controller, based upon analysis from the financial advisors of the economics of callable versus non-callable features, shall set forth call provisions for each issue.
Section 3.02 Sale of Securities
There are three methods of sale: competitive, negotiated and private placement. The preferred method of sale shall be the competitive method as it is likely to result in the lowest interest cost to the District. All three methods of sale shall be considered for all issuance of debt, however, as each method has the potential to achieve the lowest financing cost given the right conditions. Any award through negotiation shall be subject to approval by the District, generally by the Chief Financial Officer or other person designated by the Chief Financial Officer, to ensure that interest costs are in accordance with comparable market interest rates. When a competitive bidding process is deemed the most advantageous method of sale for the District, award will be based upon, among other factors, the lowest offered True Interest Cost (“TIC”). While not used as frequently as negotiated or competitive sale methods, a private placement sale would be appropriate when the financing can or must be structured for a single or limited number of purchasers or where the terms of the private placement are more beneficial to the District than either a negotiated or competitive sale.
Section 3.03 Markets
The District shall consider products and conditions in the capital markets in meeting the District’s financing needs. When practical in its financing program, the District shall consider local and regional markets as well as retail and institutional investors.
Section 3.04 Credit Enhancements and Derivatives
The District may enter into credit enhancement agreements such as municipal bond insurance, surety bonds, letters of credit, and lines of credit with commercial banks, municipal bond
175
Page 10 of 34
Los Angeles Unified School DistrictDEBT MANAGEMENT POLICY October 1, 2013
insurance companies, or other financial entities when their use is judged to lower borrowing costs, eliminate restrictive covenants, or have a net economic benefit to the financing. The credit rating of any counterparty must be at least A+ at the time of the transaction. The District shall use a competitive process to select providers of such products to the extent applicable. In order to assure that the District purchases bond insurance cost-effectively, the Chief Financial Officer will review a bond insurance break-even analysis by maturity before selecting which maturities to insure.
The District may also undertake certain hedging strategies in connection with its debt issues. Authorized strategies include interest rate caps and their variants. The Chief Financial Officer may develop an appropriate policy regarding interest rate swaps and other derivatives for approval by the Board. Such policy, if approved, will be integrated into this Policy.
Section 3.05 Impact on Operating Budget and District Debt Burden
When considering any debt issuance, the potential impact of debt service and additional operating costs induced by new projects on the operating budget of the District, both short and long-term, will be evaluated. The ratio of annual debt service to General Fund expenditures is one method as is the additional debt burden of overlapping agencies and taxpayers. The cost of debt issued for major capital repairs or replacements should be judged against the potential cost of delaying such repairs.
Section 3.06 Debt Limitation
Section 15106 of the Education Code limits the District’s total outstanding bonded debt (i.e., the principal portion only) to 2.5% of the assessed valuation of the taxable property of the District. Thus, Section 15106 of the Education Code limits the issuance of new debt when the District has total bonded indebtedness in excess of 2.5% of the assessed valuation in the District. TRANs and lease payment obligations in support of COPs generally do not count against this limit except as provided in Section 17422 of the Education Code.
Section 3.07 Debt Issued to Finance Operating Costs
The District cannot finance general operating costs from debt having maturities greater than thirteen months. However, the District may deem it necessary to finance cash flow requirements under certain conditions. Such cash flow borrowing must be payable from taxes, income, revenue, cash receipts and other moneys attributable to the fiscal year in which the debt is issued. General operating costs include, but may not be limited to, those items normally funded in the District’s annual operating budget and having a useful life of less than one year.
The CFO will review potential financing methods to determine which method results in the lowest cost to the District. Potential financing sources include Tax and Revenue Anticipation Notes (TRANs), commercial bank lines of credit, temporary borrowing from the County of Los Angeles Treasurer, and internal temporary interfund borrowing. In analyzing the impact on District cost, the CFO will consider the lost interest earnings for the District funds providing temporary borrowing capacity.
176
Page 11 of 34
Los Angeles Unified School DistrictDEBT MANAGEMENT POLICY October 1, 2013
Section 3.08 Debt Burden Ratios and Debt Affordability Criteria
A. Debt Burden Ratios: As noted in Section 3.06, the District may issue “bonds” in an amount no greater than 2.5% of taxable property within the school district. The 2.5% issuance limit is known as the District’s bonding capacity, with “bonds” referring to G.O. Bonds. Even though COPs do not technically constitute “debt” under California's Constitution and, thus, are excluded from the 2.5% bonding limit, the rating agencies and the investor community evaluate the District’s debt position based on all of its outstanding long-term obligations whether or not such obligations are repaid from taxpayer-approved tax levies, the General Fund or developer fee sources. Therefore, the debt burden ratios described below will include both G.O. Bonds and COPs obligations as “debt” in the respective calculations. This conforms with market convention for the general use of the term “debt” and “debt service” as applied to a broad variety of instruments in the municipal market, regardless of their precise legal status or source of repayment. “Debt” excludes short-term obligations such as tax and revenue anticipation notes.
The following debt burden ratios should be considered in developing debt issuance plans:
Ratio of Outstanding Debt to Assessed Value. The ratio “Direct Debt” shall be calculated
using both G.O. Bonds and COPs. In addition, the ratio “Overall Direct Debt” or “Overall Debt” shall be calculated by aggregating all debt issues attributable to agencies located in the District as presented in the California Municipal Statistics Overlapping Debt Statement. It is important to monitor the levels and growth of Direct Debt and Overall Debt as they portray the debt burden borne by the District’s taxpayers and serve as proxies for taxpayer capacity to take on additional debt in the future.
Ratio of Outstanding Debt Per Capita. The formula for this computation is Outstanding Debt
divided by the population residing within the District, based upon the most recent estimates as determined by the United States Bureau of the Census. Ratios shall be computed for both “Direct Debt Per Capita” and “Overall Debt Per Capita”.
Ratio of Annual Lease Debt Service to General Funds Expenditures. The formula for this
computation is annual lease debt service expenditures divided by General Funds (i.e., General and Debt Service Funds) expenditures (excluding interfund transfers) as reported in the most recent CAFR.
Proportion of Fixed-Rate and Variable-Rate COPs Issues. The District can benefit from
some variable rate exposure in its portfolio of COPs issues. However, the District shall keep its variable rate exposure, to the extent not hedged or swapped to fixed rate, at or below 20% of the total principal of outstanding COPs or $100 million, whichever is less. “Hedges” include unrestricted cash resources as well as interest rate products such as caps and collars. Under no circumstances will the District issue variable rate debt for arbitrage purposes. If variable rate debt is used, the Chief Financial Officer will periodically, but at least annually, determine whether it is appropriate to convert the debt to bear fixed interest rates.
177
Page 12 of 34
Los Angeles Unified School DistrictDEBT MANAGEMENT POLICY October 1, 2013
B. Debt Affordability: The determination of how much indebtedness the District should incur will be based on a Capital Financing Plan (the “Plan”) that is currently being developed by the Office of the Chief Financial Officer, which analyzes the long-term infrastructure needs of the District, and the impact of planned debt issuances on the long-term affordability of all outstanding debt. The Plan will be based on the District’s current capital plan and will include all District financings to be repaid from the General Fund, special funds or ad valorem property taxes. The affordability of the incurrence of debt will be determined by calculating various debt ratios (itemized below) which would result after issuance of the debt and analyzing the trends over time.
C. Targets and Ceilings for Debt Affordability: One of the factors contributing to the District’s high credit ratings is its moderate General Fund-supported debt level relative to other large issuers and as compared to the resources available to repay the debt. The issuance of debt to be repaid from the General Fund and other internal District resources (typically, the District’s certificates of participation) must be carefully monitored to maintain a balance between debt and said resources.
The District’s credit environment is also affected by the District’s issuance of its General Obligation Bonds paid from voter approved tax levies as well as the debt issuance activities of other agencies (for example, the City of Los Angeles, the County of Los Angeles and the Los Angeles Community College District) whose jurisdictions overlap those of the District. It is important for the District to examine debt burden ratios for such debt as well, even though such debt is not paid from the District’s General Fund or other internal resources. Further, the tax receipts used to repay the Districts General Obligation Bonds are levied and collected by the County of Los Angeles and are not controlled by the District.
Table 1 provides a listing of the debt burden factors that will be monitored by the Chief Financial Officer in the case of debt to be repaid from the General Fund or other District resources. The measured debt factors will be compared to targeted and maximum levels for those factors. The targets and ceilings are intended to guide policy. The targets and ceilings do not mean that debt issuance is automatically approved if there is room under a particular target or ceiling. On the contrary, each and every proposed debt issuance must be individually presented to and approved by the Board of Education.
Table 2 indicates the benchmark debt burden ratios to be monitored by the Chief Financial Officer that recognize the combined direct debt and overall debt of the District, as applicable. The Office of the Chief Financial Officer shall annually prepare or cause to be prepared a Debt Report providing details of the calculations of debt ratios and projections of the impact of future debt issuance on the District’s direct debt. The Office of the Chief Financial Officer shall also develop appropriate appendices to the Debt Report containing relevant information on any rating agency and/or Government Finance Officers Association debt policy guidelines with respect to debt burden ratios.
i. Debt Ratios: The following table sets forth the debt ratios to be monitored under
the Policy and their targeted levels and Policy ceilings, if applicable.
178

Page 13 of 34
Los Angeles Unified School DistrictDEBT MANAGEMENT POLICY October 1, 2013
Table 1
Debt Factor Target Ceiling
COP Debt Service Limit (gross) 2.0% of General Funds Expenditures
2.5% of General Funds Expenditures
COP Gross Annual Debt Service Cap
$105 Million
Table 2
Debt Burden Ratio Benchmark Direct Debt to Assessed Value Moody’s Median for Aa Rated School Districts With
Student Population Above 200,000 Standard & Poor’s Mean for AA Rated School Districts With Student Population Above 150,000
Overall Debt to Assessed Value Moody’s Median for Aa Rated School Districts With Student Population Above 200,000 Standard & Poor’s Mean for AA Rated School Districts With Student Population Above 150,000
Direct Debt Per Capita Standard & Poor’s Median for AA Rated School Districts With Student Population Above 150,000 Standard & Poor’s Mean for AA Rated School Districts With Student Population Above 150,000
Overall Debt Per Capita Standard & Poor’s Median for AA Rated School Districts With Student Population Above 150,000 Standard & Poor’s Mean for AA Rated School Districts With Student Population Above 150,000
“Direct Debt” includes all debt that is repaid from the General Fund or from any tax revenues deposited into special funds not supporting revenue bonds.
“Overall Debt” includes any debt that is paid from general tax revenues and special assessments by residents in the District. This includes debt issued by other agencies whose taxing boundaries overlap the District, such as the City of Los Angeles, the County of Los Angeles and the Metropolitan Water District, but excludes revenue bonds with dedicated repayment sources.
D. Monitor Impact on District Taxpayer of Voter-Approved Taxes: In addition to the analysis of the District’s debt affordability, the Plan will review the impact of debt issuance on District taxpayers. This analysis will incorporate the District’s General Obligation Bond tax levies as well as tax rates imposed by overlapping jurisdictions as reported in the District’s
179

Page 14 of 34
Los Angeles Unified School DistrictDEBT MANAGEMENT POLICY October 1, 2013
Comprehensive Annual Financial Report (CAFR). In addition, the District will monitor the performance of the actual tax levy rate per $100,000 of assessed value for each General Obligation Bond authorization versus what the tax levy rate was expected to be at the time of the original bond election and include said performance in the Debt Report. The Measure K, Measure R, Measure Y and Measure Q Bonds were each authorized with a tax levy limitation of $60 per $100,000 of assessed value to repay bonds issued under each authorization (Measure).
Section 3.09 Use of Corporations as Lessor for COPs Issues
The District has established two special purpose corporations to assist in COPs financings as lessor: the LAUSD Financing Corporation and the LAUSD Administration Building Financing Corporation. The District shall use these corporations rather than private corporations as lessor whenever feasible. The District shall maintain proper records relating to the corporations and prepare audits as required.
Article IV. Related Issues
Section 4.01 Capital Improvement Program
Planning and management of the District’s Capital Improvement Program rests primarily with the Facilities Services Division under the Superintendent’s direction, subject to review by the Bond Oversight Committee and approval by the Board of Education. The Facilities Master Plan and Strategic Execution Plans provide an overall description of the District’s current Facilities Improvement Program. The Facilities Services Division will, as appropriate, supplement and revise these plans in keeping with the District’s current needs for the acquisition, development and/or improvement of District’s real estate and facilities. The plans must include a summary of total cost of each project, schedules for the projects, the expected quarterly cash requirements, and annual appropriations, in order for the projects to be completed. The Office of the Chief Financial Officer shall prepare an annual Capital Financing Plan in conjunction with the capital program budget as part of the annual budget for the District.
Section 4.02 Reporting of Debt The Comprehensive Annual Financial Report will serve as the repository for statements of indebtedness. The annual debt statement certifies the amount of (i) new debt issued, (ii) debt outstanding, (iii) debt authorized but not issued, (iv) assessed valuation and (v) outstanding debt expressed as a percentage of assessed valuation, each as of the end of the fiscal year to which the CAFR relates. The CAFR will be posted on the District’s website, on the District’s dissemination agent’s website and on the Electronic Municipal Market Access (EMMA) website.
Section 4.03 Financial Disclosure
The CFO shall designate a Disclosure Officer for the District who shall be responsible for the District’s disclosure compliance functions, in conjunction with the Office of the General Counsel (“General Counsel”) and disclosure counsel.
The District shall prepare or cause to be prepared appropriate disclosures as required by Securities and Exchange Commission Rule 15c2-12, the federal government, the State of
180
Page 15 of 34
Los Angeles Unified School DistrictDEBT MANAGEMENT POLICY October 1, 2013
California, rating agencies, bond insurers, underwriters, bond counsel, investors, taxpayers, and other persons or entities entitled to disclosure to ensure compliance with applicable laws and regulations and agreements to provide ongoing disclosure.
The District shall make available its annual CAFRs, budgets, and Official Statements on the official District website, the District’s dissemination agent’s website, and on the Electronic Municipal Market Access (EMMA) website so that interested persons have a convenient way to locate major financial reports and documents pertaining to the District’s finances and debt.
Section 4.04 Review of Financing Proposals
All capital financing proposals involving a pledge of the District’s credit through the sale of securities, execution of loans, or lease agreements or otherwise directly or indirectly the lending or pledging of the District’s credit initially shall be referred to the Chief Financial Officer who shall determine the financial feasibility of such proposal and make recommendations accordingly to the Board.
Section 4.05 Establishing Financing Priorities
The Chief Financial Officer shall administer and coordinate the Policy and the District’s debt issuance program and activities, including timing of issuance, method of sale, structuring the issue, and marketing strategies. The Chief Financial Officer shall, as appropriate, report to the Superintendent and the Board regarding the status of the current and future year programs and make specific recommendations.
Section 4.06 Rating Agency and Credit Enhancer Relations
The District shall endeavor to maintain effective relations with the rating agencies and credit enhancers. The Chief Financial Officer along with the District’s financial advisors shall meet with, make presentations to, or otherwise communicate with the rating agencies and credit enhancers on a consistent and as appropriate basis in order to keep the agencies informed concerning the District’s capital plans, debt issuance program, and other appropriate financial information.
Section 4.07 Investment Community Relations
The District shall endeavor to maintain a positive relationship with the investment community. The Chief Financial Officer shall, as necessary, prepare reports and other forms of communication regarding the District’s indebtedness, as well as its future financing plans. This includes information presented to the media and other public sources of information. To the extent applicable, such communications shall be posted on the District’s website.
Section 4.08 Refunding and Restructuring Policy
Whenever deemed to be in the best interest of the District, the District shall consider refunding or restructuring outstanding debt when financially advantageous or beneficial for debt repayment and structuring flexibility. The Chief Financial Officer shall review a net present value analysis of any proposed refunding in order to make a determination regarding the cost-effectiveness of
181
Page 16 of 34
Los Angeles Unified School DistrictDEBT MANAGEMENT POLICY October 1, 2013
the proposed refunding. The target net present value savings as a percentage of the refunded aggregate principal amount shall be no less than 3% per maturity unless, at the discretion of the Chief Financial Officer, a lower percentage is more applicable, for situations including, but not limited to, maturities with only a few years until maturity or COPs being defeased or redeemed from proceeds of G.O. Bonds or other structuring considerations. In addition, the net present value savings must exceed any negative arbitrage associated with the refunding, subject to the Chief Financial Officer’s discretion.
The Chief Financial Officer may waive the 3% per maturity savings threshold when evaluating a fixed rate refunding of variable rate debt, as the refinancing of certain variable rate structures may provide substantial marginal benefits to the District that include, but are not limited to, elimination of interest rate risk, renewal risk, and counterparty risk.
The Chief Financial Officer shall be empowered to restructure escrow funds for the District’s refunded Bonds and COPs from time to time when savings can be achieved. The Chief Financial Officer shall review a savings analysis of any proposed restructuring in order to make a determination regarding its cost-effectiveness. The target net savings shall be no less than $1.0 million unless, at the discretion of the Chief Financial Officer, a lower amount is more appropriate given the nature of the particular escrow fund. Any savings from such restructuring shall be applied in accordance with legal and tax considerations and legal analysis at the time such savings are available.
Section 4.09 Investment of Borrowed Proceeds
The District acknowledges its on-going fiduciary responsibilities to actively manage the proceeds of debt issued for public purposes in a manner that is consistent with California law governing the investment of public funds and with the permitted securities covenants of related bond documents executed by the District. Where applicable, the District’s official investment policy shall govern specific methods of investment of bond related proceeds. The District shall competitively bid the purchase of investment securities, investment contracts, float contracts, forward purchase agreements and any other investments pertaining to its tax-exempt debt issues. A registered investment advisor or the County of Los Angeles Treasurer-Tax Collector shall solicit bids for investment products. The District’s underwriters, but not its financial advisors, may bid on investment products. Preservation of principal will be the primary goal of any investment strategy followed by the availability of funds, followed by return on investment.
The management of public funds shall enable the District to respond to changes in markets or changes in payment or construction schedules so as to (i) ensure liquidity and (ii) minimize risk.
Section 4.10 Federal Arbitrage Rebate Requirement
The District shall maintain or cause to be maintained an appropriate system of accounting to calculate bond investment arbitrage earnings in accordance with the Tax Reform Act of 1986, as amended or supplemented and applicable United States Treasury regulations related thereto.
182
Page 17 of 34
Los Angeles Unified School DistrictDEBT MANAGEMENT POLICY October 1, 2013
Section 4.11 Transaction Records The Chief Financial Officer or designee shall maintain complete records of decisions made in connection with each financing, including the selection of members of the financing team, the structuring of the financing, selection of credit enhancement products and providers, and selection of investment products. Each transaction file shall include the official transcript for the financing, the final number runs and a post-pricing summary of the debt issue. The Chief Financial Officer shall timely provide a summary of each financing to the Board.
Section 4.12 Financing Team Members
A. Retention of Consultants
i. General: All financial advisors, investment advisors, bond counsel, disclosure
counsel and underwriters will be selected from pools to be created through a Request for Proposals (RFP) or Request for Qualifications (RFQ) process, whichever is most appropriate given the circumstances. In isolated instances, such contracts may be awarded on a sole source basis if it is clear that an RFP/RFQ process would not be feasible or in the District’s interests. The District’s contracting policies will apply to all contracts with finance professionals. Generally, contracts for financial advisors, investment advisors, underwriters, and bond and disclosure counsels will be for up to five years.
Members of the financing team for each specific transaction will be identified and presented to the Board as part of the financing transaction Board report or as a separate informative. If however, an urgent financing opportunity or need arises such that there is not enough time to obtain Board approval of the financing team through the regular process, the Superintendent may authorize the appointment of the team.
ii. Underwriters: The minimum qualifications for underwriters to be considered for
work on District transactions are: the firm must have a permanent office in the State of California; the firm must have completed at least ten (10) financings in the prior two years; the firm must maintain net capital of at least $100,000 at all times; the lead investment banker must have at least three years of experience working on large, complex transactions and must be authorized to sign a bond purchase contract; the firm must hold and maintain at all times all appropriate and required Federal and State licenses and registrations; and the firm must at all times have at least one full-time professional employee with a NASD Series 53 license (Municipal Securities Principal).
Based upon evaluation of submitted statements of qualifications, underwriting firms will be assigned to one of four specific tiers:
Tier Eligible Syndicate Assignments
Senior Manager
Senior, co-senior, or co-manager on any transaction
183
Page 18 of 34
Los Angeles Unified School DistrictDEBT MANAGEMENT POLICY October 1, 2013
Co-Senior Manager
Co-senior or co-manager on any transaction; senior manager on transactions under $200 million principal amount.
Co-Manager Co-manager on any transaction.Emerging Firm
Co-manager with a reduced liability on appropriate transactions.
In the event the District issues bonds through a negotiated sale, the selection of underwriters will be based upon a mini-RFP process and will generally be for a single transaction. The mini-RFP will specify the scoring system for selection of the underwriters and will consider the following factors in decreasing order of priority:
1. Past performance on financing transactions. Exceptionally strong or
poor results on District transactions will carry extra weight.
2. Analysis of the financing need and proposed financing structure, recommended marketing plan and determination that the firm has sufficient net capital.
3. Proposed underwriting fees, including takedown, direct expenses, and the cost of underwriter’s counsel.
4. Demonstrated commitment to, track record in, and investing in the communities served by the LAUSD.
Underwriters may be selected for multiple transactions if multiple issuances are planned for the same project. In addition, the District will include at least one firm with an office within the District’s boundaries on each standard, fixed rate financing transaction.
iii. General Financial Advisor: The District will retain a general financial advisory
team to provide general advice on the District’s debt management program, financial condition, budget options and bond rating agency relations. Additionally, the general financial advisor will structure the District’s General Obligation bond issuances and may be used on an as-needed basis to structure bond issuances that do not fall into the other categories of District debt obligations. Any firm serving as general financial advisor must be registered at all times with both the Securities and Exchange Commission (SEC) and the Municipal Securities Rulemaking Board (MSRB) and must also hold any certifications and/or licenses required by the SEC and/or MSRB.
iv. As-Needed Bond Counsel: The District will select a bond counsel team to be used
on an as-needed basis to structure bond issuances which do not fall into the other categories of District debt obligations. Additionally, one or more of the firms will be selected to provide general legal advice on debt financing.
184

Page 19 of 34
Los Angeles Unified School DistrictDEBT MANAGEMENT POLICY October 1, 2013
v. Other District Bond Programs: Financial advisory and bond counsel teams will be selected for the District’s general lease financings, TRANs, Mello-Roos, special revenue bonds and any other bond program which may be created. Depending on particular expertise and consultant availability, some firms may be used on more than one program. However, efforts will be made to establish different teams to provide a number of firms the opportunity to participate in District contracts.
B. Use of Independent Financial Advisors
i. Use of Independent Financial Advisors: Any firm serving as financial advisor on
a District transaction must be registered as a municipal advisor on financings at all times with both the Securities and Exchange Commission (SEC) and the Municipal Securities Rulemaking Board (MSRB) and must also hold any certifications and/or licenses required by the SEC and/or MSRB. In recognition of the fact that in a financing the goals of the underwriters and the issuer are inherently in conflict, the District will strive to hire financial advisors who do not participate in the underwriting or trading of bonds or other securities. Under certain circumstances, however, it may be in the District’s interests to hire an investment banking firm to act as financial advisor on specific bond issues, although said firm must obey any SEC and/or MSRB rules and restrictions pertaining to broker-dealer or investment banks serving as financial advisor.
ii. Use of Investment Advisors for Investment Advice: Although, in most instances,
the Office of the Chief Financial Officer will make all investment decisions relative to temporary investments pending the expenditure of bond proceeds, an investment advisor may provide investment advice on refundings and other transactions with specialized investment needs. Any firm serving as financial advisor on a District transaction must be registered at all times as an investment advisor with both the Securities and Exchange Commission (SEC) and the Municipal Securities Rulemaking Board (MSRB), as applicable, must hold any certifications and/or licenses required by the SEC and/or MSRB, and must present its Form ADV or equivalent and written fee proposal to the District prior to commencement of any work.
C. Disclosure by Financing Team Members; Ethics
All financing team members will be required to provide full and complete disclosure, under penalty of perjury, relative to any and all agreements with other financing team members and outside parties. The extent of the disclosure may vary depending on the nature of the transaction. However, in general terms, no agreements will be permitted which would compromise a firm’s ability to provide independent advice which is solely in the best interests of the District, or which could reasonably be perceived as a conflict of interest. All financing team members shall abide by the Board’s code of ethics.
185
Page 20 of 34
Los Angeles Unified School DistrictDEBT MANAGEMENT POLICY October 1, 2013
Section 4.13 Special Situations Changes in the capital markets, District programs and other unforeseen circumstances may from time to time produce situations that are not covered by the Policy. These situations may require modifications or exceptions to achieve policy goals. Management flexibility is appropriate and necessary in such situations, provided specific authorization is received from the Board.
186
Page 21 of 34
Los Angeles Unified School DistrictDEBT MANAGEMENT POLICY October 1, 2013
APPENDIX A
LOS ANGELES UNIFIED SCHOOL DISTRICT
LAUSD LONG-TERM DEBT—COMPLIANCE PROCEDURES
Statement of Purpose
This Tax Compliance Policy (the “Policy”) sets forth specific policies of the Los Angeles Unified School District (the “District”) designed to monitor tax compliance by the District with respect to Tax-Advantaged Obligations,2 including but not limited to post-issuance tax compliance with applicable provisions of the Internal Revenue Code of 1986, as amended (the “Code”), and regulations promulgated thereunder (the “Treasury Regulations”).
This Policy is intended to document and supplement existing practices and describe
various procedures and systems implemented and to be implemented to demonstrate compliance with the requirements that must be satisfied at the time of, and subsequent to, the issuance of Tax-Advantaged Obligations. Compliance with applicable provisions of the Code and the Treasury Regulations is an on-going process and an integral component of the District’s debt management program. Accordingly, implementation of this Policy will require ongoing surveillance through, and sometimes beyond, the final maturity of the related issue of Tax- Advantaged Obligations and, likely, consultation with legal counsel beyond the initial engagement for the issuance of particular obligations.
This Policy is meant to set forth best practices and procedures and is intended to be
revised over time. The Policy is meant to be the District’s initiative to document compliance with the provisions of the Federal tax law addressing Tax-Advantaged Bonds. Given the size, scope and complexity of the District’s financings and school construction and maintenance program, strict compliance with all elements of this Policy will require ongoing review and refinement of the Policy. Any failure to conform to any component of this Policy shall in no way infer that the District is not in compliance with the provisions of the Code applicable to Tax- Advantaged Obligations of the District.
Policies and Procedures Generally
The District’s Chief Financial Officer will establish a Captial Fund Compliance Officer for monitoring tax compliance with regard to debt offerings. The CFO shall also be responsible for ensuring an adequate succession plan for transferring tax compliance responsibility when changes in staff occur.
2 The District issues (i) bonds, certificates of participation and other obligations, the interest on which is
intended to be excluded from gross income for federal income tax purposes (“Tax-Exempt Obligations”) and (ii) bonds and other obligations, which provide certain credits to bondholders in lieu of or in addition to interest payments or interest subsidy payments to issuers (e.g., Build America Bonds and Qualified School Construction Bonds), that finance property that was otherwise eligible to be financed with proceeds of Tax Exempt Obligations (“Tax Credit/Subsidy Obligations,” collectively with Tax-Exempt Obligations, “Tax-Advantaged Obligations”).
187
Page 22 of 34
Los Angeles Unified School DistrictDEBT MANAGEMENT POLICY October 1, 2013
The Capital Fund Compliance Officer should coordinate procedures for record retention and review of such records as more fully described herein and needs to gain familiarity with Internal Revenue Service (“IRS”) Forms 8038-G, 8038-B, 8038-CP, 14002, and relevant provisions of the Code and the Treasury Regulations, including but not limited to Treasury Regulations Sections 1.141-2, 1.141-3, 1.141-12, and 1.148-1 through 1.150-2.
The Capital Fund Compliance Officer needs to review tax compliance procedures and
systems on a periodic basis, but not less than annually, and consult with the District’s General Counsel, Chief Financial Officer, Chief Facilities Officer and bond counsel as appropriate and as needed.
Electronic media will be the preferred method for storage of all records maintained by the
District in connection with tax compliance. Document maintenance requirements may change over time, and the Capital Fund Compliance Officer shall consult with bond counsel to develop and maintain a comprehensive records retention policy so as to facilitate continuing compliance with the provisions of the Code applicable to the District’s Tax-Advantaged Obligations. The District will maintain the following categories of records with respect to each issue of its outstanding Tax-Advantaged Obligations:
(i) Documentation relating to the authorization, sale and issuance of Tax-Advantaged
Obligations;
(ii) Documentation setting forth the dates, amounts and purposes of each expenditure of Tax-Advantaged Obligations were expended, as more fully described under “Expenditure of Proceeds” below;
(iii) Documentation of arrangements governing the use of Property Financed with Proceeds of each issue of Tax-Advantaged Obligations, as more fully described under “Private Use and Ownership” below; and
(iv) Documentation relating to the investment of proceeds and replacement proceeds allocable to each issue of Tax-Advantaged Obligations.
The foregoing records shall be maintained by the District under the supervision of the Capital Fund Compliance Officer for a period of not less than six years after the final payment of principal on such Tax-Advantaged Obligations, provided that with respect to property financed with proceeds of Tax-Advantaged Obligations, such records shall be maintained for a period of not less than six years after the final payment of principal on such Tax-Advantaged Obligations or any Tax-Advantaged Obligations issued to refund, directly or indirectly, the issue of Tax- Advantaged Obligations that financed such property.
Issuance of Obligations
With respect to each new issue of Tax-Advantaged Obligations, the Capital Fund Compliance Officer is to (a) obtain and store a closing binder and/or CD or other electronic copy of the relevant and customary transaction documents, (b) confirm that bond counsel or tax counsel has filed with IRS Form 8038-G or Form 8038-B for such issue, and (c) coordinate receipt and retention of relevant books and records with respect to the investment and
188
Page 23 of 34
Los Angeles Unified School DistrictDEBT MANAGEMENT POLICY October 1, 2013
expenditure of the proceeds of such Tax-Advantaged Obligations. Documentation to be maintained shall include, but not be limited to:
(i) Resolutions of the District and the County authorizing the issuance of the Bonds;
(ii) Bond Purchase Agreement;
(iii) Preliminary Official Statement, Official Statement and any other documentation circulated to potential investors;
(iv) Certifications with respect to delivery of Tax-Advantaged Bonds and the receipt of the purchase price therefor;
(v) Tax Certificate or Tax Compliance Agreement (including exhibits, such as an issue price certificate of the underwriter or, in the event of a private placement, the purchaser);
(vi) Schedules prepared by the Financial Advisor or Underwriter setting forth the sources and uses of funds, projected expenditure of proceeds, projected investment earnings on proceeds and computation of yields, together with any verification reports issued in connection with the issue;
(vi) With respect to guaranteed investment agreements, or yield restricted defeasance escrows, documentation evidencing compliance with three-bid rules set forth in Treasury Regulation Section 1.148-5
(vii) Any verification reports issued with respect to the issue; and
(viii) Information reporting forms filed with the Internal Revenue Service, and proofs of filings such forms.
Expenditure of Proceeds
The administrator of each office that is responsible for spending proceeds of the District’s Tax—Advantaged Bonds will maintain records setting forth the date and amount of each disbursement of proceeds of Tax-Advantaged Obligations administered by its office, together with invoices or other proofs with respect to each disbursement, the name of the vendor or other payee, an identification of the facility or other property acquired, constructed, improved or renovated with the proceeds of such disbursement and a brief description of the actual work performed or property acquired with the proceeds of such disbursement. Within 120 days following the end of each fiscal year of the District, the administrator of each office of the District responsible for the expenditure of proceeds of the District’s Tax-Advantaged Obligations shall submit a report (each, an “Annual Expenditure Report”) to the Capital Fund Compliance Officer setting forth with respect to each disbursement of proceeds of Tax-Advantaged Obligations:
189
Page 24 of 34
Los Angeles Unified School DistrictDEBT MANAGEMENT POLICY October 1, 2013
(i) The date of such disbursement;
(ii) The amount of such disbursement;
(iii) The funding source (e.g., specific G.O. measure or COPs issue);
(iv) The location code and location name;
(v) The object of expenditure; and
(vi) The project number and description, when available, or a brief description of the type of the expenditure.
The Capital Fund Compliance Officer shall monitor the receipt of, and maintain each Annual Expenditure Report and, based upon the data set forth in the Annual Expenditure Report provided by each office of the District that is responsible for the expenditure of proceeds of Tax- Advantaged Bonds, and within 6 months after the end of each fiscal year, prepare a report setting forth the date, amount and purpose of each disbursement of proceeds of each issue of Tax- Advantaged Bonds during the prior fiscal year (the “Issue Expenditure Reports”). The term “purpose” shall mean each separate school facility financed with a disbursement or a description of other property financed with such disbursement.
Private Use and Ownership
Tax-Advantaged Obligations may lose their tax status if a bond issue meets (1) the private business use test (i.e., results in Private Use (defined below)) in Section 141(b)(1) of the Internal Revenue Code of 1986, as amended (the “Code”) and (2) (a) the private security or payment test (“Private Security or Payments”) in Section 141(b)(2) of the Code (collectively, the “Private Business Test”), or (b) the private loan financing test in Section 141(c) of the Code. The Private Business Test relates to the use of the proceeds of an issue and the test is met if more than the lesser of (1) $15,000,000 and (2) 10 percent3 of the proceeds of an issue meet both prongs of the Private Business test.
Definition of Private Payments. For purposes of this Policy, “Private Payments” means
payments derived, directly or indirectly, in respect of property used or to be used for Private Use. The District will periodically enter into arrangements that result in Private Use but will not involve any Private Payments. Except in the case of certificates of participation, which involve leases of properties that are used in a Private Use or secures obligations that financed property used in a Private Use, or loans of bond proceeds, arrangements that result in Private Use, but do not involve Private Payments, will not cause the District’s general obligation bonds to become private activity bonds.4
3 Such ten percent limitation is reduced to five percent with respect to Private Use that is either unrelated to governmental uses of proceeds of the same issue, or disproportionate to related governmental uses of proceeds of such issue. 4 Private use alone may cause the Private Business Test limitations to be exceeded in the event that the obligations to that financed the privately used property is also secured by property used in a private use. For example, certificates of participation in a lease of property that is involved in a private use that finance property that is also used in a private business use may become taxable private activity bonds even if the District receives no payments with respect to such property.
190

Page 25 of 34
Los Angeles Unified School DistrictDEBT MANAGEMENT POLICY October 1, 2013
Definition of Private Use. For purposes of this Policy, the term “Private Use” means any activity that constitutes a trade or business that is carried on by persons or entities other than state or local governmental entities (“Nongovernmental Entities”). State or local governmental entities are referred to herein as “Governmental Entities.” The United States of America is not treated as a Governmental Entity. Any activity carried on by a person other than a natural person is treated as a trade or business. Any asset financed with Tax-Advantaged Obligations not owned by a Governmental Entity will be considered to be used in a Private Use.
In most cases, Private Use will occur only if a Nongovernmental Entity has a special
legal entitlement to use the bond financed property. Such a special legal entitlement includes ownership or actual or beneficial use pursuant to a lease, management, service or incentive payment contract, output contract, research agreement or similar arrangement. Private Use may also be established solely on the basis of a special economic benefit to one or more Nongovernmental Entities.
Management and Service Contracts. With respect to management and service contracts,
the determination of whether a particular contract results in Private Use shall be based on the application of the Code and Treasury Regulations, including particularly Revenue Procedure 97- 13, 1997-1 C.B. 632, as amended by Revenue Procedure 2001-39, 2001-2 C.B. 39, a summary of which is attached hereto as Exhibit A. Such management and service contracts include, but are not limited to, operating agreements, construction management agreements, business services agreements, technical consulting services agreements and other similar agreements. Further, for purposes of determining the nature of a Private Use, any management or service contract that is properly characterized as a lease for federal income tax purposes is treated as a lease. Consequently, any such agreements, even though referred to as a management or service contract may nevertheless be treated as a lease. In determining whether a management or service contract is properly characterized as a lease, it is necessary to consider all of the facts and circumstances, including the following factors: (i) the degree of control over the property that is exercised by a nongovernmental person; and (ii) whether a nongovernmental person bears risk of loss of the financed or refinanced property.
Short-Term Use Exception. Arrangements fitting within either of the following two
exceptions will not result in Private Use.
Use Pursuant to Generally Applicable and Uniformly Applied Rates. Use pursuant to an arrangement will not result in Private Use if (A) the arrangement does not transfer ownership of the property to a nongovernmental person, (B) the term of the use under the arrangement, including all renewal options, is not longer than 100 days, and (C) compensation under the arrangement is based on generally applicable and uniformly applied rates.
Use Pursuant to Negotiated Arm’s Length Arrangements. Use pursuant to an
arrangement will not result in Private Use if (A) the arrangement does not transfer ownership of the property to a nongovernmental person, (B) the term of the use under the arrangement, including all renewal options, is not longer than 50 days, and (C) the arrangement is a negotiated arm’s-length arrangement and compensation under the arrangement is at fair market value.
191
Page 26 of 34
Los Angeles Unified School DistrictDEBT MANAGEMENT POLICY October 1, 2013
Construction Contracts and Other Purchases of Capital Assets. A contract with a nongovernmental person to construct capital assets or to sell capital assets to the District does not generally result in Private Use unless additional services are being provided by the nongovernmental person in connection with such contract, e.g., construction management or consulting services. Such services with respect to bond financed property must be analyzed for Private Use under Revenue Procedure 97-13.
Materials and Commodity Supply Contracts. A contract or purchase order for materials,
commodities, inventory or other supplies from a nongovernmental person does not generally result in Private Use unless there are additional services being provided by the nongovernmental person in connection with the contracts, e.g., consulting services. Such service arrangements with respect to bond financed property must be analyzed for Private Use under Revenue Procedure 97-13.
Ownership of bond financed property. If bond financed property is owned by a
nongovernmental person, such ownership will be considered Private Use of the asset for purposes of the Private Use rules.
Leases of bond financed property. All leases of bond financed property to a
nongovernmental person constitute Private Use of such property unless an exception for short term use is satisfied.
Nonpossessory Incidental Use. Any nonpossessory incidental use such as vending
machines, bank machines and similar uses may be excluded from the Private Use rules to the extent of 2.5% of an issue of Tax-Advantaged Obligations. Such use of bond financed property shall be tracked by Tax Compliance Designee.
Joint Ventures, Partnerships or other forms of Joint Ownership. Entry into a joint
venture, partnership or other form of joint ownership with a nongovernmental person generally gives rise to Private Use. Such arrangements with respect to bond financed property must be reviewed by bond counsel.
Special Priority Rights or Special Economic Benefits. A contract which conveys special
priority rights or special economic benefits in bond financed property to a nongovernmental person may create Private Use. In determining whether special economic benefit gives rise to Private Use of bond financed property, it is necessary to consider all of the facts and circumstances, including one or more of the following factors: (a) whether the bond financed property is functionally related or physically proximate to property used in the trade or business of a nongovernmental person; (b) whether only a small number of nongovernmental persons receive the economic benefit; and (c) whether the cost of the bond financed property is treated as depreciable by the nongovernmental person. Such arrangements with respect to bond financed property must be reviewed by bond counsel.
Compilation and Maintenance of Logs Listing Arrangements Potentially Involving
Private Trade or Business Use.
From time to time, the District enters into the following types of arrangements involving bond financed property:
192

Page 27 of 34
Los Angeles Unified School DistrictDEBT MANAGEMENT POLICY October 1, 2013
Use Agreements and Leases with Charter Schools
After School Programs
Summer Camps
Civic Center Leases
Naming Rights
Other Leases, Licenses or Use Agreements Involving Bond Financed Property
The arrangements described above will be referred to in this Policy as “Arrangements”.
The Capital Fund Compliance Officer will retain copies of the Arrangements, and maintain a log listing such Arrangements, which shall note with respect to each Arrangement (i) whether such Arrangement conforms to the Short-Term Use Exception described above, and (ii) if not, the amount of payments to be received by the District and whether such payments exceed the District’s incremental costs of operating and maintaining the subject facility arising from the Private Use of the subject property.
The Capital Fund Compliance Officer shall also compile and maintain a separate list of
each arrangement described above that will not qualify for the Short-Term Use Exception and that provides payments to the District that will exceed the District’s incremental cost of operating and maintaining the subject facility arising from the arrangement (referred to as the “Potential Private Use Contract Log”).5 Each item listed in the Private Use Contract Log shall set forth (i) the issue or issues of Tax Advantaged Bonds that financed property used in connection with such arrangement, (ii) the amount of proceeds of such issue allocable to such property, and (iii) the amount of payments expected with respect to such arrangement, net of the incremental costs incurred by the District to operate and maintain the facility as a result of such arrangement.
The Capital Fund Compliance Officer shall also compile and maintain the following logs:
Property Disposition Log. The Capital Fund Compliance Officer shall compile
and maintain a log listing all assets of the District purchased with proceeds of Tax Advantaged Obligations that have been sold or otherwise disposed by the District (each, a “Disposition”). The log should include with respect to each Disposition, the Issue of Tax-Advantaged Bonds that financed the acquisition, construction or renovation of such asset and the amount of proceeds of such issue that are allocable to such asset (the “Property Disposition Log”).
Private Loan Log. The Capital Fund Compliance Officer shall compile and
maintain a log listing all proceeds of each issue of Tax-Advantaged Obligations applied to make loans to third parties (the “Private Loan Log”).
5 Arrangements involving property that was financed with proceeds of any of the District’s certificates of participation will be listed n the Potential Private Use Contract Log regardless of whether the District is to receive any payments under such Arrangements.
193

Page 28 of 34
Los Angeles Unified School DistrictDEBT MANAGEMENT POLICY October 1, 2013
The Tax Compliance Designee shall update the respective logs at least annually.
Structuring of Arrangements to Avoid Private Use or Private Payments. It is the Policy of the District that to the extent consistent with the business objectives of the District, any potential Arrangement which might result in Private Use of bond financed property shall be structured so as to avoid or minimize Private Payments.
Dispositions. No transfer, sale or other proposed disposition of bond financed property
by the District shall take place without the prior review and approval by the General Counsel, after consultation with bond counsel.
Remedial Actions. In the event that the District is unable to satisfy the limitations with
respect to Private Use and Private Payments with respect to any issue of Tax-Advantaged Obligations, the Capital Fund Compliance Officer shall consult with the General Counsel, the Chief Financial Officer and bond counsel and work with bond counsel to effect a remedial actions or take such other actions as shall be required to maintain the tax-advantaged status of such bonds. The Capital Fund Compliance Officer shall provide any information regarding the bond financed property to effectuate such remedial action to the General Counsel and the Chief Financial Officer. The Capital Fund Compliance Officer must maintain copies of the documentation with respect to the remedial action with the Potential Private Use Contract Log and attach such copies to the transcript of closing documents it maintains with respect to each affected issue of Tax-Advantaged Obligations.
Periodic Review. Although the District will monitor Private Use of assets financed with
Tax-Advantaged Obligations and Private Payments relating to such use, the Capital Fund Compliance Officer will no less frequently than annually review and update the Potential Private Use Contract Log, the Disposition Log the Private Loan Log and the log that it maintains with respect to each issue of Tax-Advantaged Obligations. The Capital Fund Compliance Officer shall at least annually prepared a detailed calculation of all existing Private Use and Private Payments, if any, that occurred during the prior year (the “Private Use Calculation”) with respect to each issue of the District’s Tax-Advantaged Obligations. The Potential Private Use Contract Log, the Disposition Log and the Private Use calculations are referred to herein as the “Annual Reports.” The Capital Fund Compliance Officer will provide the Annual Reports, reflecting activity through the last day of each fiscal year, to the General Counsel by November 30th of the following fiscal year.
Arbitrage and Rebate
Section 148 of the Code, the regulations promulgated thereunder and the pronouncement relating thereto (the “Arbitrage Rules”) are intended to ensure that issuers, such as the District, are issuing Tax-Advantaged Obligations for the primary purpose of financing property needed by the District to carry-out its governmental purposes, and not for the purpose of taking advantage of the difference between its tax-advantaged costs of borrowing and its ability, if any, to invest proceeds of such obligations in higher yielding obligations. Continuing compliance with the Arbitrage Rules primarily involves ensuring that proceeds of Tax-Advantaged Obligations (“Proceeds”) are invested in accordance with yield limitations set forth in the Arbitrage Rules,
194
Page 29 of 34
Los Angeles Unified School DistrictDEBT MANAGEMENT POLICY October 1, 2013
except to the extent an exception to such yield limitation cannot be satisfied, and rebating certain investment earnings to the United States Treasury. With respect to certain issues of Tax- Advantaged Obligations, the District will need to ensure that all proceeds and investment earnings are either expended on qualifying projects within specified periods, or portions of such issues are timely redeemed.
Specific post-issuance procedures to effect compliance with the Arbitrage Rules are addressed below. However, the procedures set forth herein are not intended to be exhaustive and further procedures may need to be identified and implemented, in consultation with the District’s staff, bond counsel, tax counsel, if any, and the District’s financial advisors and investment advisors. Since proceeds of the District’s bond issues are deposited in a Building Fund administered and invested by the Los Angeles County Treasurer and Tax Collector (the “County Treasurer”), and the County Treasurer collects and invests moneys to be used to pay debt service on the District’s Tax-Advantaged Obligations, the County Treasurer shall also be involved in the development and implementation of this Policy insofar as this Policy relates to compliance with the Arbitrage Rules.
Procedures Generally – the following policies relate to procedures and systems for monitoring post-issuance compliance generally with the Arbitrage Rules.
(i) The Chief Financial Officer has identified an appropriate staff member
(currently the Treasurer of the District) responsible for monitoring the District’s post-issuance arbitrage compliance issues (the “Arbitrage Compliance Designee”). The Chief Financial officer of the District shall be responsible for ensuring an adequate succession plan for transferring post- issuance arbitrage compliance responsibility when changes in staff occur.
(ii) The Arbitrage Compliance Designee should coordinate procedures for
record retention and review in accordance with the provisions of this Policy described below. In addition, the Arbitrage Compliance Designee shall ensure that adequate records are established and maintained to set forth the date, amount and nature of each expenditure of proceeds of each issue of Tax-Advantaged Obligations and investment earnings thereon (the “Proceeds”). Such records shall be consistent with and may be part of the Issue Expenditure Reports described under “Expenditure of Proceeds” above. The Arbitrage Compliance Designee shall also establish and maintain a record of each investment of Proceeds, which shall include (i) the purchase date, (ii) the purchase price, (iii) information establishing that the purchase price is the fair market value as of such date (e.g., the published quoted bid by a dealer in such an investment on the date of purchase), (iv) any accrued interest paid, (v) the face amount, (vi) the coupon rate, (vii) periodicity of interest payments, (viii) disposition price, (ix) any accrued interest received, and (x) disposition date. To the extent any investment becomes allocable to Proceeds after it was originally purchased, it shall be treated as if it were acquired at its fair market value at the time it becomes allocable to Proceeds. To the extent Proceeds are maintained by the County Treasurer, the Arbitrage Compliance Designee shall advise the County Treasurer of the requirement to maintain such records with respect to each investment of Proceeds by the County Treasurer, and obtain a copy of such records from the County Treasurer at least annually.
(iii) The Arbitrage Compliance Designee should review post-issuance
195

Page 30 of 34
Los Angeles Unified School DistrictDEBT MANAGEMENT POLICY October 1, 2013
arbitrage compliance procedures and systems with bond counsel or tax counsel at least annually.
The following procedures shall be implemented with respect to the issuance of each issue of Tax-Advantaged Obligations:
(i) Following the issuance of each issue of Tax Advantaged Obligations, the
Arbitrage Compliance Designee shall confirm that the Capital Fund Compliance Officer has obtained and is maintaining each of the documents listed above under “Issuance of Obligations” including, a fully executed tax certificate with respect to such issue and any information reporting forms filed with the Internal Revenue Service with respect to each issue, together with proof of filing. A copy of such certificate and information reporting forms, together with the Timetable (as defined below), shall be provided to the County Treasurer as soon as practicable after the issue date of each issue of Tax-Advantaged Obligations.
(ii) The Arbitrage Compliance Designee should confirm that bond counsel has
filed with the Internal Revenue Service (the “IRS”) the applicable information report (e.g., Form 8038-G, Form 8038 or Form 8038-B) for such issue.
(iii) The Arbitrage Compliance Designee should coordinate receipt and
retention of relevant books and records with respect to the investment and expenditure of the proceeds of such Tax-Advantaged Obligations with other members of the District’s staff and staff of the County Treasurer.
(iv) A record should be maintained with respect to each issue of Tax-Advantaged
Obligations containing a schedule setting forth (i) the latest date such proceeds may be invested at an unrestricted yield, (ii) the benchmarks that must be satisfied in order to meet an exception to the arbitrage rebate rules, (iii) the dates on which any arbitrage rebate computations are required to be completed and arbitrage rebate is required to be paid to the United States Treasury and (iv) any date by which proceeds are required to either be expended or applied to redeem bonds and any other dates on which all or a portion of the Proceeds of such issue are required or expected to be expended (the “Timetable”)
Arbitrage – the following procedures should be carried-out from the issue date through
the final redemption date of each issue of Tax-Advantaged Obligations:.
(i) The Arbitrage Compliance Designee should coordinate the tracking of expenditures and any investment earnings with other applicable District staff, including staff of the Facilities Division. The Arbitrage Compliance Designee should obtain and review at least monthly reports of the expenditure and investment of proceeds of each issue of Tax-Advantaged Obligations that are on deposit in the District’s Building Fund. The Arbitrage Compliance Designee should maintain a procedure for the allocation of proceeds of the issue and investment earnings to expenditures, including the reimbursement of pre-issuance expenditures
(ii) The Arbitrage Compliance Designee should obtain a computation of the
yield on each issue of Tax-Advantaged Obligations from the District’s financial advisor, and obtain from bond counselor tax counsel a listing of all arbitrage yield restrictions attributable to
196
Page 31 of 34
Los Angeles Unified School DistrictDEBT MANAGEMENT POLICY October 1, 2013
Proceeds or amounts treated as proceeds of each issue. For example, with respect to each issue of qualified school construction bonds, the Arbitrage Compliance Designee should obtain from tax counsel or bond counsel the yield limitation with respect to any invested sinking fund established for such issue.
(iii) The Arbitrage Compliance Designee should monitor compliance with the
applicable “temporary period” (as defined in the Code and Treasury Regulations), and expectations for the expenditure of proceeds of the issue, and advise the County Treasurer of the need to yield restrict investments with respect to proceeds that are not eligible to be invested at an unrestricted yield pursuant to a temporary period.
(iv) The Arbitrage Compliance Designee should coordinate with the County
Treasurer and the bond trustee, if applicable, to ensure that investments acquired with proceeds of each issue of Tax-Advantaged Obligations are purchased at fair market value. In determining whether an investment is purchased at fair market value, any applicable Treasury Regulation safe harbor may be used. In the event Proceeds are invested in an investment contract or any other investment that is not traded on an established market, and for which fair market values are not continually published, the Arbitrage Compliance Designee or County Treasurer shall consult with bond counsel or tax counsel to ensure that fair market rules set forth in the Treasury Regulations are satisfied.
(v) The Arbitrage Compliance Designee should coordinate with the County
Treasurer, the Chief Facilities Executive and the applicable bond trustee to avoid formal or informal creation of funds reasonably expected to be used to pay debt service on such issue without determining in advance whether such funds must be invested at a restricted yield.
(vi) The Arbitrage Compliance Designee should consult with bond counsel or
tax counsel prior to engaging in any post-issuance credit enhancement transactions (e.g., bond insurance, letter of credit) or hedging transactions (e.g., interest rate swaps, caps).
(vii) The Arbitrage Compliance Designee should coordinate with bond counsel
to identify situations in which compliance with applicable yield restrictions depends upon later investments and monitor implementation of any such restrictions.
(viii) The Arbitrage Compliance Designee should coordinate with the arbitrage
rebate consultant, as described in (ix) below, to monitor compliance with six-month, 18-month or 2-year spending exceptions to the rebate requirement, as applicable.
(ix) The Arbitrage Compliance Designee should coordinate with Chief
Financial Officer to ensure that the District continuously engages a firm nationally recognized in the area of arbitrage rebate compliance with respect to each issue of Tax-Advantaged Obligations to arrange, as applicable, for timely computation of arbitrage rebate or arbitrage yield reduction liability and, if rebate or a yield reduction payment is due to the IRS, for timely filing of Form 8038-T and, to arrange timely payment of such rebate liability. Such arbitrage rebate consultant shall also confirm whether any of the spending exceptions to the arbitrage rebate rules are satisfied. The Arbitrage Compliance Designee should ensure that each arbitrage
197
Page 32 of 34
Los Angeles Unified School DistrictDEBT MANAGEMENT POLICY October 1, 2013
rebate consultant is provided with a copy of the Timetable with respect to each issue of Tax- Advantaged Obligations and that the contract or engagement letter with such arbitrage rebate consultant provides for such arbitrage rebate consultant to work with the District to refine the Timetable and provide timely notification to the Arbitrage Compliance Designee of each deadline set forth in the Timetable. The Arbitrage Compliance Designee shall maintain with its records with respect to each issue of Tax-Advantaged Obligations copies of each report submitted by any arbitrage rebate consultant and each Form 8038-T filed by the District.
(x) The Arbitrage Compliance Designee should, in the case of any issue of
refunding obligations, coordinate with the District’s financial advisor, the applicable bond trustee and the applicable escrow agent to arrange for the purchase of the refunding escrow securities, should obtain a computation of the yield on such escrow securities from the Treasury’s outside arbitrage rebate specialist and should monitor compliance with applicable yield restrictions. Timetables should be adjusted to reflect the termination of temporary periods, the allocation of Proceeds of the refunded bonds as transferred proceeds of the refunding bonds and other matters resulting from such refunding.
Retention of Records
Retention of Records. As described above, the District is required to prepare the Annual Reports, which summarize and analyze certain underlying documentation related to the Tax- Advantaged Obligations. In addition to the requirement to retain the Annual Report, the District will also need to retain the related underlying documentation (the “Records”) described below.
Records Required to be Retained. The Records that must be retained include, but are not
limited to, the following:
(i) All legal and accounting documents relating to proceeds of the Tax- Advantaged Obligations, including opinions of counsel and the tax certificate with respect to each issue of Tax-Advantaged Obligations.
below.
(ii) Expenditure of Proceeds of Tax-Advantaged Obligations as described
(A) Documents evidencing the expenditure of the proceeds of the Tax-
Advantaged Obligations and investment earnings thereon and the specific assets financed with such proceeds, including projected draw schedules and invoices (e.g., records with respect to the bond accounts and funds);
(B) Documents setting forth all funds and accounts relating to the Tax-
Advantaged Obligations;
(C) Documents pertaining to the investment of the proceeds of the Tax-Advantaged Obligations (e.g., records with respect to the bond accounts and funds), including the purchase and sale of securities, guaranteed investment contracts, and swap/hedge transactions;
198
Page 33 of 34
Los Angeles Unified School DistrictDEBT MANAGEMENT POLICY October 1, 2013
(D) With respect to all investments acquired in any fund or account in connection with the Tax-Advantaged Obligations, the information set forth under the heading “Arbitrage and Rebate” herein;
(iii) Documents evidencing any allocations with respect to the proceeds of the
Tax-Advantaged Obligations;
(iv) Documents evidencing the use and ownership of the bond financed property, including contracts for the use of such property (e.g., the Annual Reports, and the logs described herein, and documents evidencing the sale or other disposition of the bond financed property.
Required Retention Periods. The District will retain the Records and Reports until the
date that is six years after the complete retirement of the related Tax-Advantaged Obligations.
Form of Records. The District will keep all records in a manner that ensures complete access thereto for the applicable above described period either in hard copy or electronic format. If the records are kept in electronic format, compliance is necessary with the requirements of Revenue Procedure 97-22, 1997-1 C.B. 652, (or subsequent guidance provided by the Internal Revenue Service), which provides guidance for maintaining books and records by using an electronic storage system that either images their hardcopy books and records or transfers their computerized books and records to an electronic storage media (e.g., an electronic data compression system).
Failure to Retain Records. A failure to maintain material records required to be retained
by this Section may result in the loss of the tax status of the Tax-Advantaged Obligations and could cause additional arbitrage rebate to be owed.
Reissuance
The following policies relate to compliance with rules and regulations regarding reissuance of Tax-Advantaged Obligations issued by the District:
The CFO and the Capital Fund Compliance Officer in conjuction with the General Counsel are to (a) identify and consult with bond counsel regarding any post-issuance change to any terms of an issue of Tax-Advantaged Obligations, (b) request bond counsel to determine whether such potential change would cause the issue to be treated as “reissued” for federal income tax purposes, and (c) confirm with bond counsel whether any “remedial action” in connection with a “change in use” (as such terms are defined in the Code and Treasury Regulations) must be treated as a reissuance for tax purposes.
Training
The District shall engage its bond counsel or special tax counsel to provide a seminar at least annually, which shall be attended by the Capital Fund Compliance Officer, the Arbitrage
199

Page 34 of 34
Los Angeles Unified School DistrictDEBT MANAGEMENT POLICY October 1, 2013
Compliance Designee, representatives of the Chief Financial Officer, the General Counsel and the Chief Facilities Officer and representatives of the District’s arbitrage rebate compliance consultant. The County Treasurer should also be invited to participate in such seminar. Such seminar shall include a review of the District’s compliance initiatives during the prior twelve- month period, discussions relating to restrictions on the use of proceeds of Tax-Advantaged Bonds, arbitrage requirements and recent developments in such areas.
200
APPENDIX N
CAPITAL BUDGET
For up-to-date information about the District’s major capital programs, please visit the following District websites: Existing and New Facilities:
http://www.laschools.org/new-site/sep/
Information Technology Division:
http://askitd.net/guiding/category/3-sep
201

202
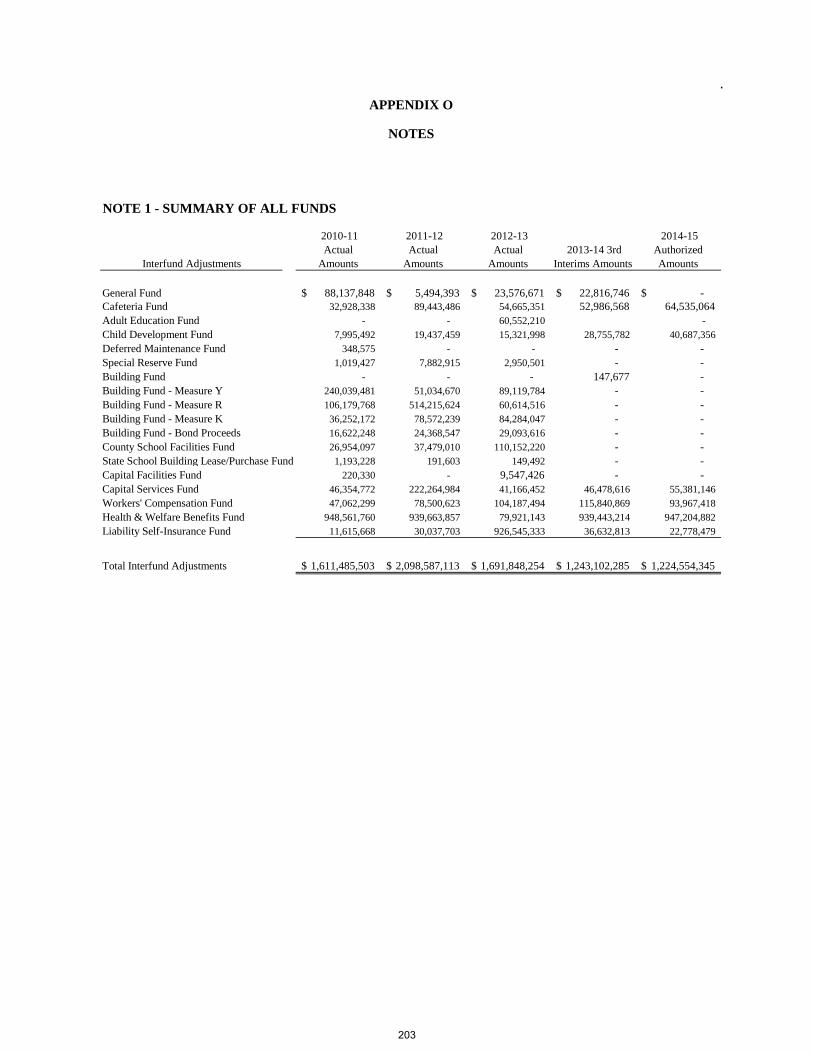
NOTE 1 - SUMMARY OF ALL FUNDS
2010-11
Actual
Amounts
2011-12
Actual
Amounts
2012-13
Actual
Amounts
2013-14 3rd
Interims Amounts
2014-15
Authorized
Amounts
General Fund 88,137,848$ 5,494,393$ 23,576,671$ 22,816,746$ -$
Cafeteria Fund 32,928,338 89,443,486 54,665,351 52,986,568 64,535,064
Adult Education Fund - - 60,552,210 -
Child Development Fund 7,995,492 19,437,459 15,321,998 28,755,782 40,687,356
Deferred Maintenance Fund 348,575 - - - -
Special Reserve Fund 1,019,427 7,882,915 2,950,501 - -
Building Fund - - - 147,677 -
Building Fund - Measure Y 240,039,481 51,034,670 89,119,784 - -
Building Fund - Measure R 106,179,768 514,215,624 60,614,516 - -
Building Fund - Measure K 36,252,172 78,572,239 84,284,047 - -
Building Fund - Bond Proceeds 16,622,248 24,368,547 29,093,616 - -
County School Facilities Fund 26,954,097 37,479,010 110,152,220 - -
State School Building Lease/Purchase Fund 1,193,228 191,603 149,492 - -
Capital Facilities Fund 220,330 - 9,547,426 - -
Capital Services Fund 46,354,772 222,264,984 41,166,452 46,478,616 55,381,146
Workers' Compensation Fund 47,062,299 78,500,623 104,187,494 115,840,869 93,967,418
Health & Welfare Benefits Fund 948,561,760 939,663,857 79,921,143 939,443,214 947,204,882
Liability Self-Insurance Fund 11,615,668 30,037,703 926,545,333 36,632,813 22,778,479
Total Interfund Adjustments 1,611,485,503$ 2,098,587,113$ 1,691,848,254$ 1,243,102,285$ 1,224,554,345$
APPENDIX O
NOTES
Interfund Adjustments
203
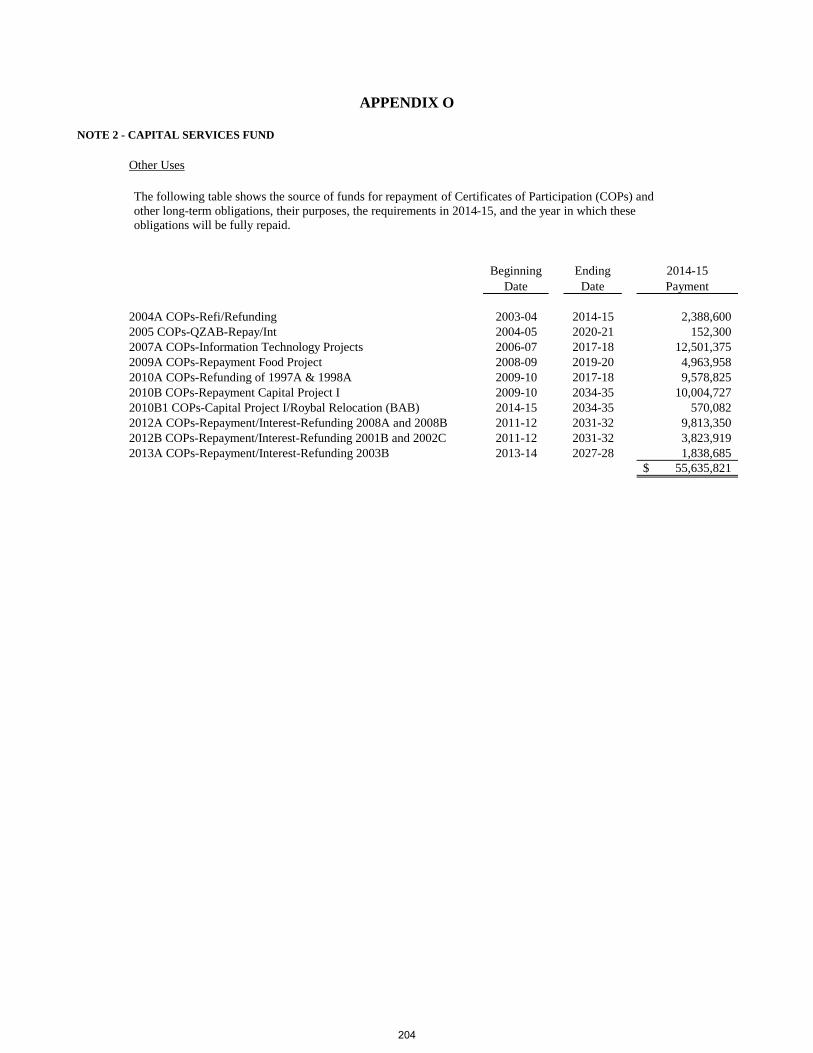
NOTE 2 - CAPITAL SERVICES FUND
Other Uses
Beginning
Date
Ending
Date
2014-15
Payment
2004A COPs-Refi/Refunding 2003-04 2014-15 2,388,600
2005 COPs-QZAB-Repay/Int 2004-05 2020-21 152,300
2007A COPs-Information Technology Projects 2006-07 2017-18 12,501,375
2009A COPs-Repayment Food Project 2008-09 2019-20 4,963,958
2010A COPs-Refunding of 1997A & 1998A 2009-10 2017-18 9,578,825
2010B COPs-Repayment Capital Project I 2009-10 2034-35 10,004,727
2010B1 COPs-Capital Project I/Roybal Relocation (BAB) 2014-15 2034-35 570,082
2012A COPs-Repayment/Interest-Refunding 2008A and 2008B 2011-12 2031-32 9,813,350
2012B COPs-Repayment/Interest-Refunding 2001B and 2002C 2011-12 2031-32 3,823,919
2013A COPs-Repayment/Interest-Refunding 2003B 2013-14 2027-28 1,838,685
55,635,821$
APPENDIX O
The following table shows the source of funds for repayment of Certificates of Participation (COPs) and other long-term obligations, their purposes, the requirements in 2005-06, and the year in which these obligations will be fully repaid.
The following table shows the source of funds for repayment of Certificates of Participation (COPs) and
other long-term obligations, their purposes, the requirements in 2014-15, and the year in which these
obligations will be fully repaid.
204
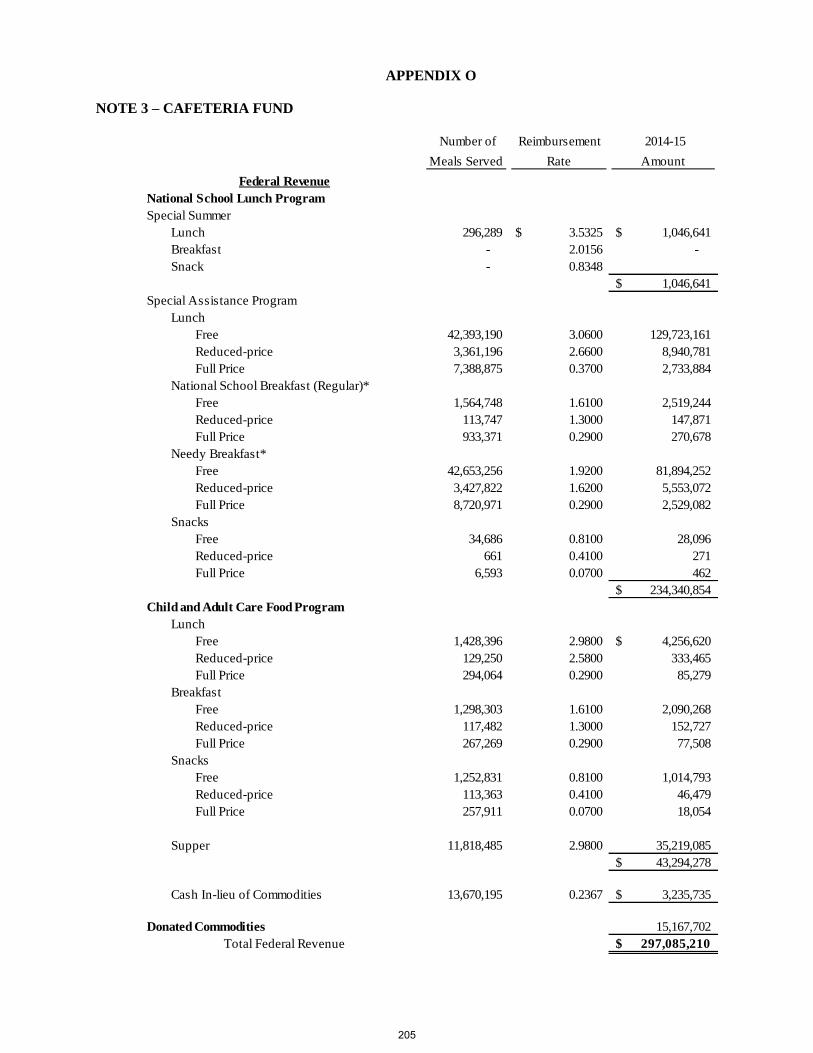
APPENDIX O
NOTE 3 – CAFETERIA FUND
Number of
Meals Served
Reimbursement
Rate
2014-15
Amount
Federal Revenue
National School Lunch Program
Special Summer
Lunch 296,289 3.5325$ 1,046,641$
Breakfast - 2.0156 -
Snack - 0.8348
1,046,641$
Special Assistance Program
Lunch
Free 42,393,190 3.0600 129,723,161
Reduced-price 3,361,196 2.6600 8,940,781
Full Price 7,388,875 0.3700 2,733,884
National School Breakfast (Regular)*
Free 1,564,748 1.6100 2,519,244
Reduced-price 113,747 1.3000 147,871
Full Price 933,371 0.2900 270,678
Needy Breakfast*
Free 42,653,256 1.9200 81,894,252
Reduced-price 3,427,822 1.6200 5,553,072
Full Price 8,720,971 0.2900 2,529,082
Snacks
Free 34,686 0.8100 28,096
Reduced-price 661 0.4100 271
Full Price 6,593 0.0700 462
234,340,854$
Child and Adult Care Food Program
Lunch
Free 1,428,396 2.9800 4,256,620$
Reduced-price 129,250 2.5800 333,465
Full Price 294,064 0.2900 85,279
Breakfast
Free 1,298,303 1.6100 2,090,268
Reduced-price 117,482 1.3000 152,727
Full Price 267,269 0.2900 77,508
Snacks
Free 1,252,831 0.8100 1,014,793
Reduced-price 113,363 0.4100 46,479
Full Price 257,911 0.0700 18,054
Supper 11,818,485 2.9800 35,219,085
43,294,278$
Cash In-lieu of Commodities 13,670,195 0.2367 3,235,735$
Donated Commodities 15,167,702
Total Federal Revenue 297,085,210$
205
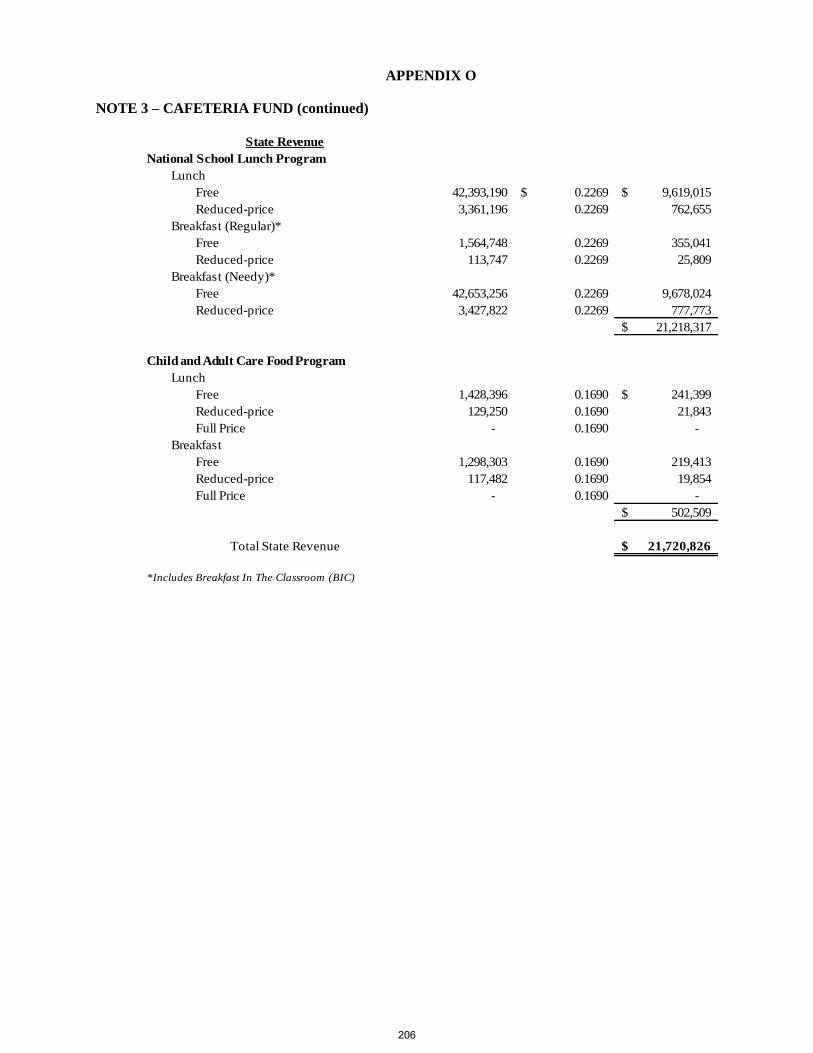
APPENDIX O
NOTE 3 – CAFETERIA FUND (continued)
State Revenue
National School Lunch Program
Lunch
Free 42,393,190 0.2269$ 9,619,015$
Reduced-price 3,361,196 0.2269 762,655
Breakfast (Regular)*
Free 1,564,748 0.2269 355,041
Reduced-price 113,747 0.2269 25,809
Breakfast (Needy)*
Free 42,653,256 0.2269 9,678,024
Reduced-price 3,427,822 0.2269 777,773
21,218,317$
Child and Adult Care Food Program
Lunch
Free 1,428,396 0.1690 241,399$
Reduced-price 129,250 0.1690 21,843
Full Price - 0.1690 -
Breakfast
Free 1,298,303 0.1690 219,413
Reduced-price 117,482 0.1690 19,854
Full Price - 0.1690 -
502,509$
Total State Revenue 21,720,826$
*Includes Breakfast In The Classroom (BIC)
206
APPENDIX P
GLOSSARY OF BUDGET TERMS AND ABBREVIATIONS
Budget Terms Abatement – A complete or partial cancellation of an expenditure or revenue item. Academic Performance Index (API) – The API measures student achievement on certain standardized tests. Several Governor’s Initative programs use schools’ API scores and their growth over time on the Index to determine funding. Accounts Payable – Amounts due and owed to private persons, business firms, governmental units, or others for goods received and/or services rendered. Includes amounts billed but not yet paid. Accounts Receivable - Amounts due and owed from private persons, business firms, governmental units, or others for goods received and/or services rendered. Includes amounts billed but not received. Accrual Basis of Accounting – An accounting method in which revenues are recorded when earned, and expenditures when a liability is incurred, regardless of when the receipt or payment of cash takes place. School districts use the accrual basis of accounting for proprietary funds such as the Cafeteria and Self-Insurance funds, and fiduciary funds such as the Annuity Reserve Fund. (See also Cash Basis of Accounting and Modified Accrual Basis of Accounting). Administered Budget – An administered budget refers to resources managed by a division but spent elsewhere. For example, Facilities Division manages the utilities budget for schools and offices, but the expenditures are attributed to schools and offices, not the Facilities Division. Administrative Service Charge – A credit (negative) amount budgeted to reflect indirect Administrative Services costs charged to certain programs. This is necessary to eliminate duplication of the cost in the total District budget. Ad Valorem Tax – A tax based on a percentage of the value of goods or services.
Arbitration – A form of alternative dispute resolution in which a third party reviews the evidence in the case and imposes a decision that is legally binding for both sides and enforceable.
Appropriation – An authorization, granted by the governing board, to make expenditures and to incur obligations for special purposes. An appropriation is usually limited in purpose, amount, and the time period during which it may be expended.
Audit – An examination of documents, records, and accounts for the purpose of (1) determining the propriety of transactions; (2) ascertaining whether transactions are recorded properly; and (3) determining whether statements drawn from accounts reflect an accurate picture of financial operations and financial status for a given period of time. Authorized Positions – Positions, both filled and vacant, for which authority is provided in the budget. All positions are budgeted as full positions, even if they provide service on a part-time basis. Average Daily Attendance – A measure of pupil attendance used as the basis for providing revenue to school districts and as a measure of unit costs. Only in-seat attendance is counted in computing ADA. Base Revenue Limit – The basic State funding to K-12 education. It is expressed either as an amount per ADA or as a dollar amount. The District’s most important funding source, Base Revenue Limit funding is comprised of a combination of State tax revenues and local property tax allocations. Base Funding – A grant allocated for each student, by grade band, via the Local Control Funding Formula. All students generate Base funding. Block Grant – A funding methodology in which the granting authority (e.g., the State) groups multiple programs into one entity for funding purposes. This is usually done for purposes of improving funding flexibility; districts may choose to
207
APPENDIX P increase or decrease funding for programs within the block grant, depending upon the perception of the individual district regarding the relative value of the individual programs. Bond – A certificate containing a written promise to pay a specified amount of money, called the face value, at a fixed time in the future, called the date of maturity, and specifying interest at a fixed rate, usually payable periodically. Budget – A plan of financial operation consisting of an estimate of proposed revenue and expenditures for a given period and purpose. The term usually indicates a financial plan for a single fiscal year. Budget Adjustment (or “Budget Transfer”) – A change among budgeted items. California State Lottery –Proposition 37, passed by the voters in November, 1984, established the California Lottery. The lottery distributes funds to school districts for instructional purposes. Lottery funds cannot be used for purchase or construction of facilities, for land, or research. Because the initiative does not define “instructional,” school districts have wide latitude in the use of lottery funds. Districts are required to utilize 50% of any increased funding above the 1997-1998 base year for instructional materials. Capital Expenditures – According to the California School Accounting Manual, capital expenditures are those “for sites, buildings, books, and equipment, including leases with option to purchase, that meet the LEA’s threshold for capitalization.” Categories of expenses recorded as capital expenditures include: land, buildings, site improvements, and some types of equipment. Equipment also includes library books, and project management costs that can be assigned to an individual capital project. Capital Outlay – Amounts paid for fixed assets or additions to fixed assets, including land or existing buildings, improvement of grounds, construction of buildings, additions to buildings, remodeling of buildings, or initial and additional equipment. Capital Project Funds – District Funds dedicated to facilities construction and repair. Carryover (or Carryforward) – Unexpended balances that are carried forward from one fiscal year to the next in accordance with programmatic or District guidelines. Funds may carry forward at a particular location or may be carried forward and redistributed as part of a new year’s allocation, depending on program guidelines. Cash Basis of Accounting – An accounting method in which revenues are recorded when cash is received and expenditures (or expenses) are recorded when cash is disbursed. School districts do not use the cash basis of accounting. (See Accrual Basis of Accounting and Modified Accrual Basis of Accounting). Categorical Programs – Programs funding activities that are supplemental to the District’s basic instructional program. These programs may be included in the General Fund Restricted, Unrestricted, or in a number of Special Funds. Certificated Salaries – Salaries paid for services that require a credential. These include teachers, counselors, assistant principals, and principals. Certificates of Participation (COPs) – A financing technique which provides funding through the sale of papers, backed by a specific capital asset, for capital cost items. Charter School – Under State law, charter schools operate semi-autonomously of the District. A “fiscally independent” charter school receives funding directly from the State and develops curriculum in compliance with state and federal guidelines. An “affiliated” charter school continues to receive funding from the District but develops curriculum that may differ from that of the District. Child Days of Enrollment – Children’s Centers generate revenue on the basis of Child Days of Enrollment, which differs from the ADA calculations used for schools.
208
APPENDIX P Civic Center Rentals - Rental of space at school sites during non-school hours by designated groups. The District is required to charge an appropriate amount for the use of the facilities. These charges become part of the District’s General Fund revenues. Classified Salaries – Salaries for services that do not require a credential, such as clerical and custodial staff. Common Core (Common Core State Standards) - Common standards across all states for English and Math. This is a change from the current state-by-state systems in place now. Instead of taking the California Standards Test in May, students will take the new test, called the Smarter Balanced Assessment. The first year of the new test will be 2014. New tests cover fewer standards but in more depth. There is less memorization and more critical thinking involved. Community Day School – A school site for service to students who have been expelled, referred by SARB, or denied attendance at a regular school site. By law, CDSs must be located on sites separated from regular District campuses. Compensatory Education – Comprised of ESEA – Title I, Economic Impact Aid, and School Improvement Programs; provides supplementary funding for schools with a specified percentage of students who qualify for funding under program guidelines. These include students receiving free or reduced price lunch and students identified as at-risk. Concentration Funding – A grant equal to 50% of the Base grant, allocated by grade span via the Local Control Funding Formula. Concentration funding is allocated for each unduplicated student, above 55% of total district enrollment, in one of three need categories: foster youth, English Learners and economicially-disadvantaged. Concept 6 Calendar – A 3-track, year-round calendar with 163 instructional days of 6.6 daily hours. Concurrently Enrolled – Students enrolled simultaneously in a K-12 school and in a Regional Occupational Center or Adult Education Program. Continuous – See “Ongoing.” Current Expense of Education – The current General Fund operating expenditures for kindergarten through grade twelve. This excludes expenditures for food services, community services, non-agency activities, fringe benefits for retired persons, acquisition and construction of facilities, and other outgo items. Debt Limit – The maximum amount of legally permitted debt. Debt Service – Expenditures for retirement of debt and interest on debt (e.g., COPS and bonds). Deficit Spending – The excess of actual expenditures over actual revenues (also referred to as an operating deficit). Designated Balance – The portion of the previous year’s ending balance committed by statute or by District policy and therefore unavailable for general purpose allocations. Developer Fees – District revenue resulting from fees levied upon new residential, commercial, or industrial development projects within the District’s boundaries in order to obtain additional funds for the construction of schools. Direct Services – Services that are delivered at the school site where the student is the direct recipient or beneficiary of the services. Examples include personnel that provide direct, hands-on instruction to students. District Defined Programs – Programs within the General Fund that are summarized as distinct programs within the budget document. District Defined Programs are selected for increased recognition in the budget because they have significant financial implications or because the Board has indicated a desire that financial information about the program be reflected in the budget document.
Elementary and Secondary Education Act (ESEA) - In 1965, President Lyndon B. Johnson passed the Elementary and Secondary Education Act as a part of the "War on Poverty." ESEA emphasizes equal access to education and establishes high
209
APPENDIX P standards and accountability. The law authorizes federally funded education programs that are administered by the states. In 2002, Congress amended ESEA and reauthorized it as the No Child Left Behind Act (NCLB).
Employee Benefits – Expenditures for employer contributions to retirement plans, for social security, workers’ compensation, unemployment insurance, health and medical benefits, and other employee “fringe benefits.” Encroachment – Costs of a District Defined Program such as Special Education that exceed the program’s earned income. Encroachment is covered through Interprogram Adjustments, usually from General Fund – Unrestricted Program resources. Encumbrance – An obligation such as a salary, purchase order, contract, or other commitment to spend, that has been recognized in the accounting records but not yet finalized as a formal expenditure. Enterprise Funds – Funds used to account for activities of an LEA that, because of their income-producing character, are similar to those found in the private sector. Entitlement – An apportionment that is based on specific qualifications or a formula defined in statute. Equalization Aid – State funds intended to equalize funding differences between districts receiving lower revenue limit amounts per-ADA and those receiving higher amounts. Equalization aid is typically provided based on the type and size of school districts. Small elementary district revenue limits are compared with other small elementary districts; large unified districts such as LAUSD are compared with other large unified districts, etc. Expenditure – The cost of goods received or services rendered. Federal Emergency Management Act – A funding source for building repairs related to the January 17, 1994 earthquake, and for hazard mitigation measures. FEMA funds may also be allocated for other natural disasters. Federal Jobs Bill - United States Senate Bill S3206, otherwise known as the Keep Our Educators Working Act of 2010, provided $23 billion to help keep teachers, principals, librarians and other school personnel employed as states faced crippling budget shortfalls. Fees – Amounts collected from or paid to individuals or groups for services or for use of a facility. Fiduciary Funds – District Funds utilized as holding accounts for amounts owed to employees under various agreements. Final Budget – The Final Budget is the District’s official operating budget upon Board adoption, which must occur prior to June 30 of the preceding budget year. The Final Budget is submitted to the Los Angeles County Office of Education (LACOE) for approval in accordance with guidelines provided in the Education Code. Fiscal Year – A period of one year, the beginning and ending dates of which are fixed by statute. The fiscal year for California school districts begins July 1st and ends on June 30th. Function – Under the Standardized Account Code Structure (SACS), function refers to activities or services performed to accomplish a goal. Fund – A sum of money or other resources set aside for the purpose of carrying on specific activities or attaining certain objectives. Fund Balance – According to the California School Accounting Manual (Procedure No. 207), the fund balance is determined by subtracting the fund’s total liabilities from the total assets. The difference is the fund balance. Fund Balance Classification - GASB 54 implements a five-tier fund balance classification that depicts the extent to which the district is bound by spending constraint imposed on the use of its resources.
Nonspendable Fund Balance consists of funds that cannot be spent due to their form. These include inventory and prepaid items or funds that are legally or contractually required to remain intact, such as the principal of a permanent endowment.
210
APPENDIX P
Restricted Fund Balance consists of funds that are subject to externally imposed and legal constraints. Committed Fund Balance consists of funds that are subject to internal policies and constraints. These policies are
self-imposed by the District’s highest level of decision making authority. . Assigned Fund Balance consists of funds that are intended to be used for a specific purpose by the district’s highest
level or an official with the authority to assign funds. Unassigned Fund Balance consists of residual fund balance that has not been classified in the previous four
categories. It represents resources available for future spending. General Fund – The Fund used to summarize costs of the District’s basic operations. The District’s General Fund includes both Restricted and Unrestricted activities. Gifted and Talented Education – A State-funded program within the General Fund that provides supplemental funding for identified qualifying students. Goal – Under SACS, a goal defines an objective or set of objectives for the LEA. It is used to account for the cost of instruction and other services by the instructional goals and objectives of an LEA. Governor’s Budget – The Governor’s Proposed State Budget, or “Governor’s Budget,” is published each January, and represents his initial public disclosure of his financial assumptions and spending priorities for the coming fiscal year. Grant – A contribution, either in money or material goods, made by one governmental agency to another. Grants may be for specific or, rarely, for general purposes. Implemented Budget – Budget for Restricted Programs that has been allocated to specific appropriations for expenditure. Indirect Cost – Elements of cost necessary in the operation of a district or in the performance of a service that are of such nature that the amount applicable to each accounting unit cannot be determined readily. It consists of those business and administrative costs (e.g., accounting, budgeting, personnel, purchasing) that benefit the entire district. Indirect Cost Rate – A method for claiming reimbursement of indirect costs from federal and state categorical funds. It is the ratio (expressed as a percentage) of the indirect costs to direct base costs. Interfund Transfers – Income and expenditures initially recorded in the General Fund and then transferred, in accordance with accounting requirements, to a Special Fund. Interim Reports – Accounting reports prepared as of a date or a period during the fiscal year. They include budgetary estimates, financial transactions during current year-to-date, and end-of-year projections. California school districts are required to publish a first interim report in December based upon October data, and a second interim report in March based on January data. A third interim report may be required by the County Office of Education if it has significant concerns regarding the financial viability of a district. Internal Service Funds – District Funds dedicated to self-insurance of costs such as employee health and medical benefits, liability insurance, and worker’s compensation. Interprogram – Costs of a District Defined Program that exceed the program’s income must be covered from other General Fund revenues. Such costs are covered through “interprogram” transfers from the General Program. LCAP – Local Control Accountability Plan – See Local Control Accountabilty Plan below. LCFF – Local Control Funding Formula – See Local Control Funding Formula below. Least Restrictive Environment (Special Education Program) – Describes the legal requirement to educate students with disabilities with their non-disabled peers to the greatest extent appropriate. Limited – See “Onetime.”
211
APPENDIX P Local Control Accountability Plan (LCAP) – A Board adopted Districtwide plan identifying the academic interventions and strategies that will be implemented to address the academic needs of students receiving supplemental and concentration funding under the Governor’s Local Control Funding Formula (LCFF). The plan as currently discussed will be a new required component of the annual District budget document adopted by each district Board of Education. Local Control Funding Formula (LCFF) – The Governor’s public education funding reform, which replaces the Revenue Limit funding formula and most state categorical sources, with a base revenue grant, and needs-based supplementatl funding based on the numbers of identified students who are English Learners, socioeconomically disadvantaged or who are in foster care. The formula also provides a concentration grant for Districts with unduplicated student counts exceeding 55% in any one of the previously mentioned supplemental funding categories. Mandated Cost Reimbursements – The California Constitution requires that the State reimburse local governmental entities, including school districts, for the cost of complying with State or court mandates. The reimbursement is known as a Mandated Cost Reimbursement. May Revision (or “May Revise”) – Published each May, this State document updates the Governor’s Budget published in January with regard to the Governor’s State revenue projections and spending priorities for the coming fiscal year. Measure K – A local school facilities bond measure, passed by the voters on November 5, 2002. Measure K proceeds may be used to repair, renovate, acquire, construct, or lease school buildings, including classrooms, libraries, restrooms, science laboratories, and other capital projects. Proceeds may also be used: to acquire instructional materials (including library books); upgrade fire/security systems; perform earthquake retrofitting; install lighting, plumbing, and heating; remove asbestos and lead paint; upgrade wiring for computers; and build new neighborhood schools to relieve overcrowding. Funds may not be used for non-Measure K-related administrative salaries. Measure Q – Passed by voters in November of 2008, this measure provides additional funding to repair and upgrade aging classrooms. Measure R – Passed by the voters in March of 2004, this measure provides additional funding to reduce school overcrowding, build new schools, repair and upgrade aging classrooms, and other facilities-related purposes. Measure Y – Passed by the voters in November of 2005; this measures provides additional funding to return all schools to a two-semester calendar, end involuntary busing, focus on critically needed schools for younger students, and ensure that every community receives its fair share of new schools and classrooms. Measure Y will continue to repair and upgrade aging and deteriorating classrooms and restrooms, build new schools, upgrade fire and safety and emergency response equipment, and eliminate asbestos and lead paint hazards. Modified Accrual Basis of Accounting – In the modified accrual basis of accounting, revenues are recognized in the period when they become available and measurable, and expenditures when a liability is incurred, regardless of when the receipt or payment of cash takes place. School districts use the modified accrual basis of accounting for operating funds such as the General Fund and Adult Education Fund. Multiyear Financial Plan – A plan that presents financial estimates of programs in tabular form for a period of years. These estimates reflect the future financial impact of current decisions. California school districts are required to publish three-year financial plans reflecting estimates for the budget year and two subsequent fiscal years. Next Generation Science Standards (NGSS) - New K–12 science standards have been developed that are rich in content and practice, arranged in a coherent manner across disciplines and grades to provide all students an internationally benchmarked science education. Ninety/Thirty (90/30) Calendar – A year-round calendar in which students are assigned for 90 schools days, off for 30, then on for 90. Norms – For most schools, the District uses Board-approved “norms” to determine the base number of teachers, school administrators, school clerical positions, and various resources at each school. Norms generally use student enrollments to
212
APPENDIX P determine the resources to be allocated to individual schools. For example, norms may dictate that schools should receive 1 teacher per 30 students, one clerical employee per 100 students, one counselor per 500 students, etc. To calculate norm allocations, the District uses the number of students enrolled at each school on “norm day,” which is generally the Friday of the fourth week of school. Other factors may also be used in norm allocations. For example, the allocation of custodians is based on a complex formula that includes the school’s square footage . The District norms are published in the form of “norm tables” which describe the factors utilized in determining the individual norms. Objects of Expenditure – California school districts are required to develop their budgets and report expenditures by “Object of Expenditure,” which reflects specific categories of cost such as Teachers’ Salaries, Textbooks, etc. Onetime – Revenue or expenditure line-items not expected to continue into the subsequent year. Ongoing – Revenue or expenditure line-items that are expected to continue into the subsequent year. Operational Budget – The positions and other resources which enable an operating unit to perform the functions for which it is responsible. Distinguished from administered budgets in that the unit controlling and benefiting from the resources are one and the same. Overdraft – The amount by which expenditures and encumbrances exceed the budget available for them. Pending Distribution – Accounts in the budget held for distribution to expendable appropriations during the course of the fiscal year. Generally, funds are placed in a Pending Distribution account because of funding uncertainty or because no spending plan has been received. Funds must be transferred from the Pending Distribution account to expendable accounts before spending may occur. Position Control – A system developed to control salary and benefit costs by comparing budgeted positions to assignments and payroll so that only employees with budgeted positions and active assignments can be paid. Preliminary Budget – The first budget published by the District annually (usually in March or April). The Preliminary Budget is intended to provide Board Members and the public information on available revenues and expenditure requirements for the coming fiscal year, in order to assist in financial planning. The Preliminary Budget is based on information from the Governor’s Proposed (January) Budget, the First Interim Financial Report, and other sources. Program Code – Five-digit code used in budgeting and controlling expenditures. Use of program codes facilitates tracking and identification of specific expenditures. Also referred to as Appropriation Code. Proposition 20 – 50% of lottery funding above the 1997-98 funding level must be used for purchase of instructional materials, in accordance with Proposition 20, passed by the voters in March, 2000. Proposition 47 - The passage of Proposition 47 in November 2002 authorized the sale of bonds to provide funding for the State School Facilities Fund, which provides for new school facility construction, modernization projects, and facility hardship grants. Proposition 49 – Passed by the voters in 2002, this program expanded existing before- and after-school programs beginning with the 2006-07 school year. Proposition 55 – The State Kindergarten-University Public Education Facilities Bond Act of 2004 was passed by the voters in March of 2004. Provides funds for locally approved bond measures for the purpose of building new schools and classrooms to relieve overcrowding. Proposition 98 – Passed by the voters in 1988, Proposition 98 provides the formula by which the amount of money to be allocated to statewide K-14 education in California is determined. Proposition BB – LAUSD facilities bond measure passed by the voters in April of 1997.
213
APPENDIX P Public Employees’ Retirement System (PERS) – Unless exempted by state law, classified employees, their district, and the State contribute to this retirement fund. Quality Education Investment Act – Funds approved as part of the settlement of the CTA v. Schwarzenegger lawsuit, intended to improve education, primarily through class-size reduction, at Decile 1 and 2 schools. Funds are provided over a seven-year period, with participating schools determined through a random lottery. Schools must meet achievement criteria in order to remain eligible for funding. Funding for this program began in 2007-08. RAB (Reserve for Anticipated Balances) – See Reserve for Anticipated Balances Regional Occupational Centers – Provide vocational training classes for high school youth and adults in a variety of occupations. Requisition – A document submitted initiating a purchase order to secure specified articles, services, or issuance of materials from stores, a warehouse, or a vendor. Reserve – An account used to earmark a portion of a Fund, to indicate that it is not currently available for expenditure or is set aside for future use at the Board’s discretion. Amounts held in reserve cannot be expended without the Board’s formal approval. Reserve for Anticipated Balances (RAB) – The Reserve for Anticipated Balances serves to identify the difference between the estimated and authorized budgeted revenues and/or authorized and estimated expenditures, in the adopted budget. Reserve for Economic Uncertainties – The District is required to maintain a 1% reserve to offset the potential impact of unanticipated overexpenditures or revenue shortfalls. Restricted – Program funding that is limited to specific students or types of expenditure. E.g., Gifted and Talented, Title I, etc. See Categorical. Also see Unrestricted. Revenue Limit – The revenue limit is the largest and most important revenue source to the General Fund. The revenue limit is funded from a combination of State funds and local property taxes, and is allocated on the basis of a rate per A.D.A. multiplied by the District’s A.D.A. The State COLA, if funded, provides the basis for increasing the revenue limit. Revenues – The funding available to an organization from outside sources. Revenues are the primary financial resource of a Fund. Routine Repair and General Maintenance Program – Provides for the repair of District buildings, equipment, and grounds, as well as for planning and implementation of alterations and improvements of existing structures. Districts are required to commit 3% of their budgeted General Fund amount for purposes of routine repair and general maintenance as a condition of participating in the State building program. The General Fund transfer to the Deferred Maintenance Fund can comprise half of one percent. Maintenance costs to other funds such as the Adult Education Fund or Child Development Fund can also be applied toward the 3% requirement. SACS-2000 – The form used by local school districts to report financial information to the County Office of Education. Replaced the J-200 reporting form. “SACS” is the abbreviation commonly used for “Standardized Account Code Structure.” Sequestration - Sequestration is the $1 trillion in savings that Congress is required to identify in the Budget Control Act of 2011. If Congress fails to make sufficient cuts, automatic budget reductions are triggered, reducing the District’s share of federal programs such as Title I (Socioeconmically Disadvantaged Students ) and Title III (English learners). Smarter Balanced Assessments - Next-generation assessments that are aligned to the Common Core State Standards (CCSS) in English language arts/literacy and mathematics for grades 3-8 and 11. The Smarter Balanced Assessment System will give parents and students more accurate and actionable information about what students are learning. Because these assessments are computer adaptive, they will also provide better information about the needs and successes of individual students.
214
APPENDIX P Special Education Program – A school based program providing instruction and support services based on an Individualized Education Program (IEP). To qualify for an IEP, a student must be assessed and determined to have a disability as defined by the Individuals with Disabilities Education Act (IDEA) and have a need for specialized services in order to access the instructional program. Special Education Local Plan Area (SELPA) – IDEA requires that each state organize in a way that allows effective programming and services be provided to students with disabilities. In the State of California, the mechanism used to meet this requirement is the Special Education Local Planning Area or SELPA. Each SELPA develops and maintains a local plan describing how special education programs and services are provided to students with disabilities within the boundaries of the SELPA. Due to its size, the Los Angeles Unified School District is a single district SELPA. Special Education – Low Incidence – In order to ensure students with certain disabilities have access to highly specialized equipment and materials, the State of California provides restricted funding to support the needs of students who are Deaf or Hard of Hearing, Blind or Visually Impaired and/or who have serious physical disability. The state refers to these disabilities as “low incidence.” Special Funds – Separate financial entities within the budget which provide for specified activities, as defined in the California Education Code. Examples are Adult Education Fund, Building Fund, Cafeteria Fund, etc. Standardized Account Code Structure (SACS) – Statewide standardization of school district budgeting and accounting codes, in order to increase uniformity of accounting and facilitate statewide data collection and analysis. State Mandated Cost Reimbursements – Revenue received by the District in reimbursement for programs or activities resulting from State mandates or court orders. The California State Constitution requires that the State reimburse local governmental agencies for mandated activities. State Teachers’ Retirement System (STRS) – State law requires certificated employees, school districts, and the state to contribute to this retirement fund. Statutory COLA – The cost of living adjustment (COLA) calculated based on the percentage change in the annual average value of the Implicit Price Deflator for State and Local Government Purchases of Goods and Services for the United States, as published by the United States Department of Commerce (Education Code §42238.1[a][2]. Student Body Fund – An agency fund to control the receipts and the disbursements of student association activities. Student body funds are not the property of the school district and are not reflected in the District budget or accounts. Student Integration Program – Combined the Court-Ordered and Voluntary Desegregation Programs to create a wide variety of programs to address the harms of racial isolation in District schools. The Crawford v. LAUSD legal decision formally created this program Supplemental Funding – A grant equal to 20% of the Base grant, allocated by grade span via the Local Control Funding Formula. Suppelemental funding is allocated for each unduplicated student in one of three need categories: foster youth, English Learners and economicially-disadvantaged. Targeted Instructional Improvement Grant – Funds the costs of ongoing desegregation efforts and, if funds remain, the needs of underachieving schools. Replaces Student Integration funding in the 2002-03 State Budget. Tax and Revenue Anticipation Notes – Short-term notes issued in anticipation of receipt of revenues, typically for cash flow purposes. Teachers As A Priority – State-funded program intended to enhance the ability of low-performing schools to attract and retain quality teaching staffs. The “Deal” – In 2004-05, in order to bring the State Budget into better balance, the Governor agreed with the Education Coalition that public education would receive $2 billion less than its Proposition 98 entitlement. The Governor indicated that public education would continue to receive its fair share of any unanticipated revenues. In 2005-06, despite substantial State
215
APPENDIX P revenue increases in both 2004-05 and 2005-06, the Governor did not provide additional funding to public education, leading to the CTA and O’Connell v. Schwarzenegger lawsuit. In the 2006-07 State budget, the lawsuit was settled out-of-court, and the Governor agreed to provide the additional funds. Undesignated Balance – The portion of the previous year’s ending balance that is uncommitted and available for discretionary use. All balances are onetime in nature. Ungraded – Some programs, such as special education, group children into classes based on ability level rather than grade level. Such programs are reflected in the “Ungraded” section of attendance/enrollment reports. Unimplemented Budget – Reflects Restricted Program income that has not yet been received but is anticipated in the budget. As grants are received during the year, the budgets of these programs will be implemented, or placed into expendable appropriations. Unrestricted – Refers to programs which provide funding that may be used for any educational purpose at the discretion of the Board of Education. Weighted Student Formula – A method of allocating resources based on the characteristics of student populations. Weighted student formulas provide a basic per pupil allocation with additional resources – based on student weights – for economically disadvantaged, English learners, special education, or other defined student populations.
216
APPENDIX P
Budget Abbreviations A&I – Alterations and Improvements of Buildings or Sites AB – Assembly Bill. Applies to State legislation (e.g., Assembly Bill 602 would be abbreviated as AB 602) ABE - Adult Basic Education Program ACA – Assembly Concurrent Amendment ACR – Assembly Concurrent Resolution ADA – Average Daily Attendance AEWC – Alternative Education and Work Center AFDC – Aid for Dependent Children AP – Advanced Placement API – Academic Performance Index AYP – Adequate Yearly Progress BA – Budget Adjustment (“Budget Transfer”) BSA – Budgeting for Student Achievement BTS – Business Tools for Schools BTSA – Beginning Teacher Support and Assessment C – Certificated Salaries CAHSEE – California High School Exit Examination CALPADS – California Longitudinal Pupil Achievement Data System CalWORKS – California Work Opportunity and Responsibility to Kids CAP (TIIG/Student Integration Program) – Capacity Adjustment Program CBEDS – California Basic Education Data System CBEST – California Basic Education Skills Test CBET – Community-Based English Tutoring Program CDE – Child Days of Enrollment (used in Child Development Fund) CDE – California Department of Education CDS – Community Day Schools COLA – Cost of Living Adjustment
217

APPENDIX P Comp Ed. – Compensatory Education COPs – Certificates of Participation CPI – Consumer Price Index CPR – California Performance Review CRA – Community Redevelopment Agency CSR – Class Size Reduction CSR – Comprehensive School Reform CST – California Standards Test CTA – California Teachers’ Association CY – Current year DDP – District-Defined Program DIS (Special Education Program) – Designated Instructional Services (or Designated Instruction and Services) DOF – California Department of Finance DRS (TIIG/Student Integration Program) – Desegregated Receiver Schools EIA – Economic Impact Aid. This program has two components: EIA-Bilingual and EIA-Compensatory Education ELAP – English Language Acquisition Program ELL – English Language Literacy Program ERAF – Education Revenue Augmentation Fund ERP – Enterprise Resource Planning ESEA – Elementary and Secondary Education Act ESL – English as Second Language FEMA – Federal Emergency Management Act, or Federal Emergency Management Agency FSEP – Federal and State Education Programs FTE – Full-time Equivalent GAAP – Generally Accepted Accounting Principles GASB – Governmental Accounting Standards Board GATE – Gifted and Talented Education Program GED – General Educational Development
218
APPENDIX P GFOA – Government and Financial Officers’ Association GO – General Obligation (Bond) IASA – Improving America’s Schools Act IDEA – Individuals with Disabilities Education Act IEP – Individualized Education Program IMA – Instructional Materials (or “Materiel”) ITD – Information Technology Division JTPA – Job Training Partnership Act KLCS – TV – The District-owned and operated television station LAAMP – Los Angeles Annenberg Metropolitan Project LACOE – Los Angeles County Office of Education LAEP – Los Angeles Educational Partnership LAO – Legislative Analyst’s Office LCI – Licensed Children’s Institution LEA – Local Educational Agency (generally refers to a local school district) LEP – Limited English Proficient or Proficiency LRE (Special Education Program) – Least Restrictive Environment NC – Non-Certificated (Classified) Salaries NCLB – No Child Left Behind NPA (Special Education Program) – Nonpublic Agency NPS (Special Education Program) – Nonpublic School NSF – National Science Foundation OASDHI - Old Age, Survivors’, Disability and Health Insurance (Social Security) OPEB – Other Post-Employment Benefits P1 – The First Principal Apportionment period (for attendance accounting and State allocation purposes) P2 – The Second Principal Apportionment period (for attendance accounting and State allocation purposes) PAR – Peer Assistance and Review PD – Pending Distribution
219
APPENDIX P PERS – Public Employees’ Retirement System PLBAO (TIIG/Student Integration Program) – Primarily Latino, Black, Asian and Other Non-Anglo. PI – Program Improvement PL – Public Law. Applies to federal legislation (e.g., Public Law 94-142 would be abbreviated as PL 94-142) PPF – Per Pupil Funding PSP (TIIG/Student Integration Program) – Priority Staffing Program PWT (TIIG/Student Integration Program) – Permits With Transportation PYA – Prior Year Adjustment QEIA – Quality Education Investment Act QZAB – Qualified Zone Academy Bonds RIF – Reduction in force ROC/P – Regional Occupational Centers/Programs ROC/SC – Regional Occupational Centers/Skills Centers RRGM – Routine Repair and General Maintenance RSP (Special Education Program) – Resource Specialist Program SACS – Standardized Account Code Structure SARB – School Attendance Review Board SARC – School Accountability Report Card SB – Senate Bill. Applies to State legislation (e.g., Senate Bill 602 would be abbreviated SB 602) SBE – State Board of Education SCA – Senate Constitutional Amendment SDC (Special Education Program) – Special Day Class SELPA – Special Education Local Plan Area SFP (or SFEP) – Specially Funded Programs (or Specially Funded Educational Programs). Now referred to as Restricted Programs. SI – School Improvement Program SRLDP (TIIG/Student Integration Program) – School Readiness Language Development Program STAR – Standardized Testing and Reporting STRS – State Teachers’ Retirement System TAP (or TAAP) – Teachers As A Priority TIIG – Targeted Instructional Improvement Grant
220

APPENDIX P TRANs – Tax and Revenue Anticipation Notes TUPE – Tobacco Use Prevention Education UCTP (TIIG/Student Integration Program) – Urban Classroom Teacher Program WIA – Workforce Investment Act YRS – Year-Round Schools
221