Embed Size (px)
Citation preview
A New Metrics for Countries’ Fitness andProducts’ ComplexityAndrea Tacchella1,2, Matthieu Cristelli2,1, Guido Caldarelli3,2,4, Andrea Gabrielli2,3 & Luciano Pietronero1,2,4
1‘‘Sapienza’’, Universita di Roma, Dip. Fisica, P.le A. Moro 2, 00185, Roma, Italy, 2ISC-CNR, Dip. Fisica ‘‘Sapienza’’, Universita diRoma, P.le A. Moro 2, 3IMT, Institute for Advanced Studies, Piazza S. Ponziano, 6, 55100 Lucca, Italy, 4London Institute forMathematical Sciences, South Street 22, Mayfair London, UK.
Classical economic theories prescribe specialization of countries industrial production. Inspection of thecountry databases of exported products shows that this is not the case: successful countries are extremelydiversified, in analogy with biosystems evolving in a competitive dynamical environment. The challenge isassessing quantitatively the non-monetary competitive advantage of diversification which represents thehidden potential for development and growth. Here we develop a new statistical approach based on couplednon-linear maps, whose fixed point defines a new metrics for the country Fitness and product Complexity.We show that a non-linear iteration is necessary to bound the complexity of products by the fitness of the lesscompetitive countries exporting them. We show that, given the paradigm of economic complexity, thecorrect and simplest approach to measure the competitiveness of countries is the one presented in this work.Furthermore our metrics appears to be economically well-grounded.
The analysis we present here has been triggered by recent studies1,2 that showed how the available data onworld trade networks defies the standard economic approach3–7. Indeed, in the standard view, the wealthiestcountries should produce only few products with a high degree of specialization. If we represent all the
trading relations in a matrix M describing the bipartite network of countries and products, we should observe(once we suitably rearrange the various rows and columns) a mostly block diagonal matrix . On the contrary, data(See Supplementary Information for details) clearly show that countries tend to produce all the possible productsthey can, given their level of technology. As a result the shape of matrix M (when appropriately reordered), isapproximately triangular (see Fig. 1 ).
A first attempt to define competitiveness in terms of diversification has been recently made by Hidalgo andHausmann (HH) in2. However, we show here that this method suffers from a number of problems both con-ceptual and practical.
In this paper we propose a novel, non-linear, iterative approach able to capture efficiently the intrinsic linkbetween the export basket of different countries and their industrial competitive-ness. We achieve this result bylooking at the binary matrix representing the export basket of each country and combining iteratively measureson its rows and columns, in a spirit assimilable to Google’s PageRank. An important difference with respect to theHH approach is that our theory is based on a highly non linear relationship to define the Complexity of productsfrom the Fitness of countries which produce them. The observation that a product is made by a developed countrygives a limited information on the complexity of the product itself because these countries export almost allproducts. On the other hand, when an underdeveloped country is able to export a given product, very likely thisproduct requires a low level of sophistication. These observations lead to the following main argument behind themathematical approach: while it is reasonable to measure the competitiveness and adaptability of a countrythrough the sum of quality and complexity of its products, it is not possible to adopt the same approach tomeasure the quality and complexity of products. In particular the complexity of a product cannot be defined as theaverage of the fitnesses of the countries producing it9. It appears therefore natural, in the definition of thecomplexity of the product, to weight the complexity of the productive systems of its exporters in a highlynonlinear way, so that the information that such a product is produced by some scarcely competitive countriesis sufficient to conclude that the complexity of the product is low. Consequently, the only possibility for a productto have a high qualitative level (or complexity) is to be produced only by highly competitive countries. Insummary our method consists in coupled non-linear maps whose fixed point defines a new metrics for theFitness of the countries and the Complexity of the products. In this method each iteration adds new informationin the system and the distributions of the two metrics become broad Pareto-like. The new metrics for countriesand products appear conceptually consistent and produce a wealth of new information in various directions.
SUBJECT AREAS:STATISTICAL PHYSICS,
THERMODYNAMICS ANDNONLINEAR DYNAMICS
THEORY AND COMPUTATION
THEORETICAL PHYSICS
APPLIED PHYSICS
Received6 June 2012
Accepted7 August 2012
Published10 October 2012
Correspondence andrequests for materials
should be addressed toG.C. (Guido.
SCIENTIFIC REPORTS | 2 : 723 | DOI: 10.1038/srep00723 1
Their comparison with standard monetary indices can be interpretedas the potential for growth. The method represents a new approach tothe fundamental analysis of countries’ productive systems and it alsointroduces a non-monetary classification of product complexity.Furthermore we can define an effective measure for the Complexityof the products filtering out monetary biases from the product com-plexity definition such as labor cost, price market speculation, eco-nomical inefficiencies of commodities pricing, etc.
ResultsThe basic idea is to define an iteration process which couples theFitness of a country Fc to the Complexity of a product Qp and thenobtain the fixed point values. For the Fitness Fc it is natural that this isproportional to the sum of the products exported weighted by theircomplexity Qp. For Qp the situation is more subtle. To a first approxi-mation, the complexity of a product is inversely proportional to thenumber of countries which export it. In addition, if a country has ahigh fitness this should reduce the weight in bounding the complex-ity of a product, and the countries with low fitness should stronglycontribute to the bound on Qp. These ideas9 are summarized in theiteration of Eqs. 1.
~F nð Þc ~
PpMcpQ n{1ð Þ
p
~Q nð Þp ~ 1P
cMcp
1
F n{1ð Þc
?
F nð Þc ~
~F nð Þc
~F nð Þc
D Ec
Q nð Þp ~
~Q nð Þp
~Q nð Þp
D Ep
8>>>>>>><>>>>>>>:
8>>>>>>><>>>>>>>:
ð1Þ
This iterative method is composed of two steps at each iteration: we
first compute the intermediate variables ~F nð Þc and ~Q nð Þ
p and then nor-
malize them. The initial conditions are ~Q 0ð Þp ~1 Vp and ~F 0ð Þ
c ~1 Vc.The elements Mcp are the elements of the binary country-productmatrix M: they are 1 if the country c exports the product p and 0otherwise (see Methods for the mathematical definition of thematrix). We have tested numerically that the fixed point of thiscoupled maps is stable and not dependent on the initial condition.
Given the fact that we want the less complex exporters to give adominant contribution to the product complexity, the non-linearityof our coupled maps is a fundamental mathematical property that isunavoidable in view of the economic diversification problem. Inparticular, the definition of Q seems to us the simplest and mostnatural way to implement the desired behavior: the sum in thedenominator is dominated by the producers with the lowest fitnessand increases as the total number of exporter increases, thus con-sidering the ubiquity of the product. Finally inverting the sum makesQ coherent with its positive meaning of complexity. In contrast,previous attempts2 were based on a linear iteration that, by construc-tion, contracts the information and is inconsistent with the economiccriteria of relating the complexity of a product to the complexity of itsproducers. The need of a non-linear framework was also preliminaryindicated in8. At the end of this section we show a detailed compar-ison between the results of the two methods run on the same dataset,and discuss how they are in favor of the non linear iterations.
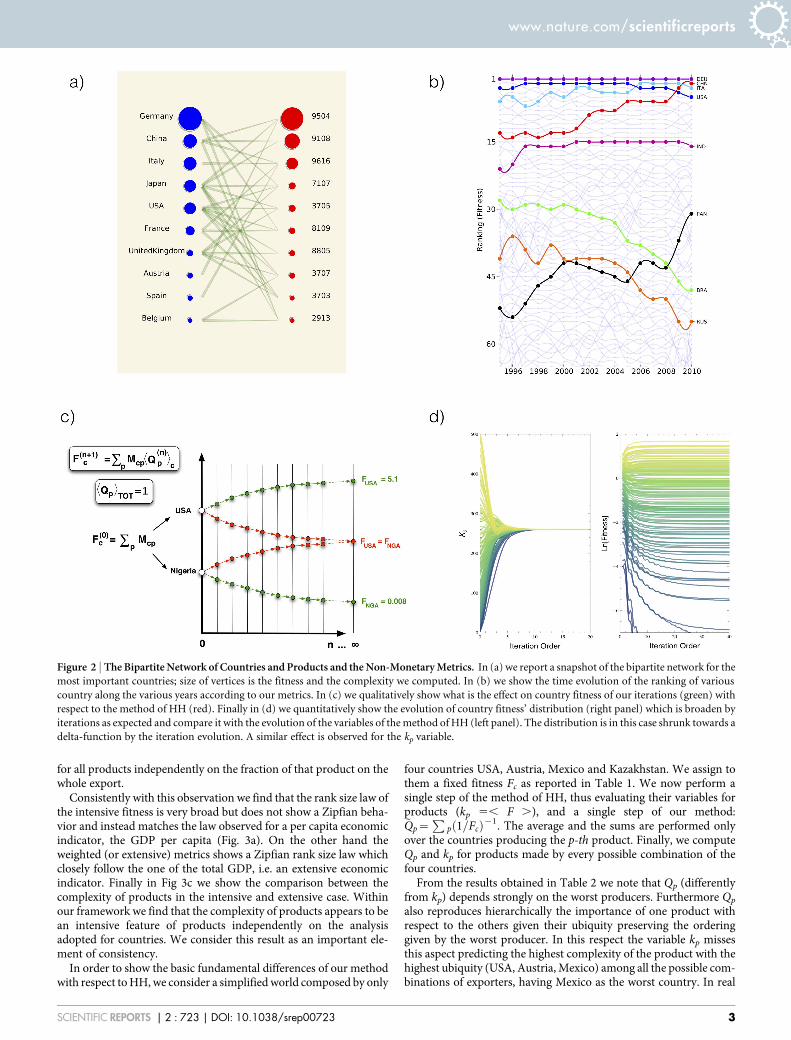
Moving to the results, a preliminary comment is to be made. Weshow mainly how our results are more consistent, compared to thoseobtained with the linear method, with the framework of economiccomplexity which Hidalgo and Hausmann proposed. This is made byboth formal arguments and a qualitative comparison to standardmacroeconomical analysis of the economy of countries. However,a systematic validation, in terms of the ability of the algorithm topredict growth as a result of development, is a complex matter whichdeals with the heterogeneous dynamics to which economies in dif-ferent phases are subject. We will enter in the details of such analysisin future works. The first result that we find through this approach isthat we can more convincingly reproduce the difference betweendifferent countries (Fig. 2d) by broadening the distribution of Fc
and Qp from the initial state towards a Pareto-like distribution asexpected from experimental observations. In fact, as exemplified bythe illustrative Fig. 2c, we expect that the iterative method, whichadds more information about the complexity of products at eachstep, will tend to separate countries with respect to the starting point,differently from the procedure of HH. As an example we can con-sider USA and Nigeria. USA has a more diversified export basketwith respect to Nigeria and likely, on average, the complexity of itsproducts is higher than the one of Nigeria. Therefore the next itera-tion should necessarily increase the gap between Nigeria and USAwith respect to the starting point. This way of reasoning holds for allthe orders of the iterative method. On this account in Fig. 2d we showthe evolution of the distributions of the variable kc (HH) and ourcountries’ fitness. It is clear that only our method is consistent withthe expected behavior shown in Fig. 2c.
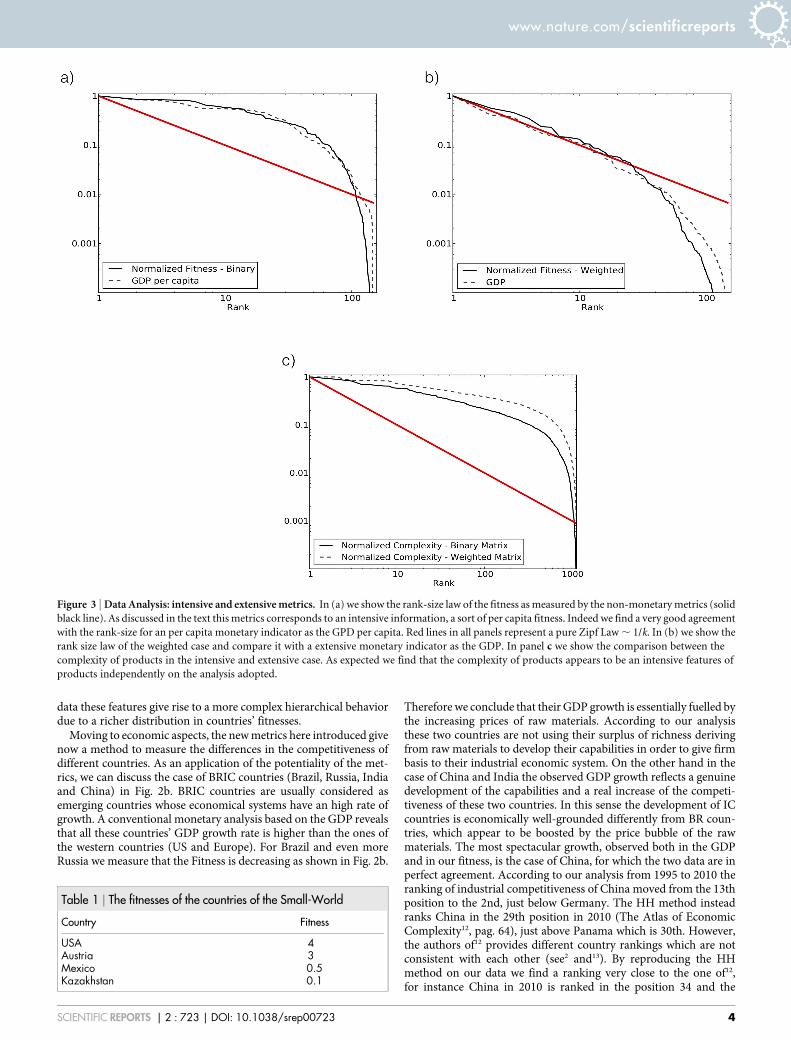
Another important element is that our method leads naturally toPareto-like (power law) distributions which are an epitome of realEconomic Complexity10,11. The fact that this type of results are anatural outcome of our theory is an important test of its validity.The Pareto-like features of our metrics are shown in Fig. 3a–b–cwhere we report the rank-size laws for the non-monetary fitnesses,the weighted fitnesses and the complexity of products in the binaryand weighted case. By weighted fitness we mean the weighted versionof our metrics which complements the results of the non-monetarycase. The weighted fitness and complexity are obtained as the non-monetary partners by iterating eqs. 1 using the matrix W instead ofM. The elements of W are defined as share of the country c of theworld export of the product p (see Materials and Methods for furtherdiscussions). We point out that, while the non-monetary metricsgives a sort of intensive (or per capita) information on the level ofcompetitiveness of a country, the weighted one instead partly repre-sents an extensive piece of information of the country. In detail thecountries are weighted according to the fraction of export within theset of exporters of a fixed product p, but we are still intensivelytreating the total export volume of different products since thesum of the weights over all the exporters of a product is equal to 1
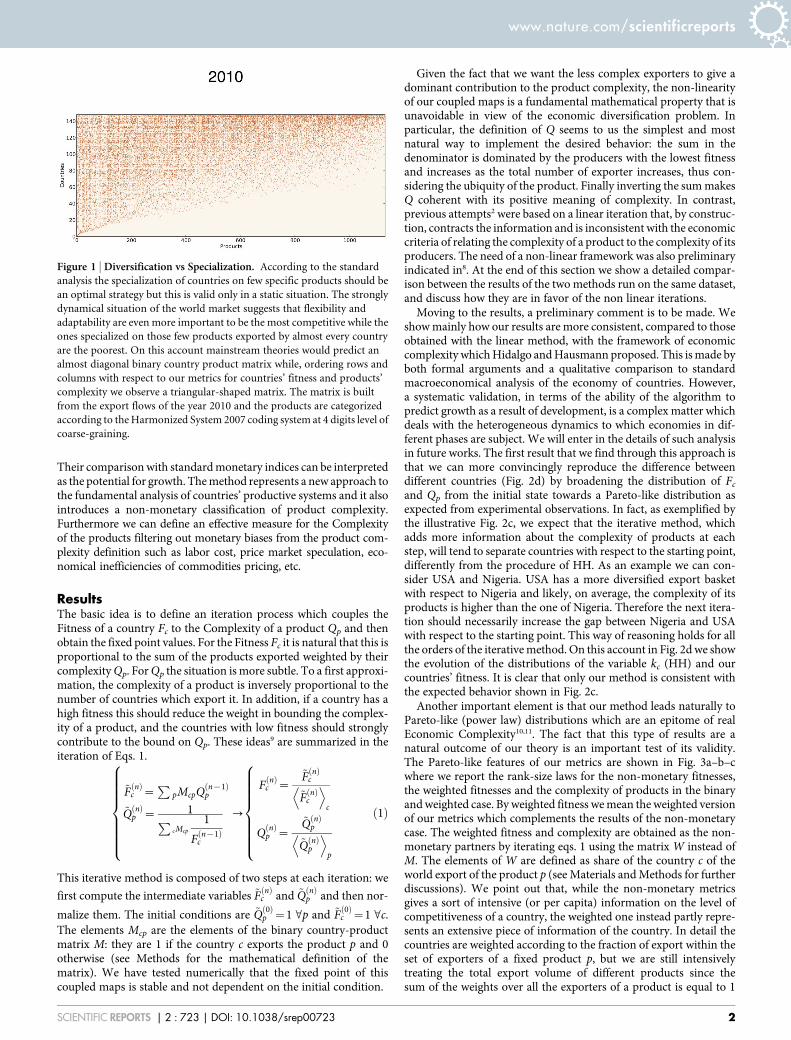
Figure 1 | Diversification vs Specialization. According to the standard
analysis the specialization of countries on few specific products should be
an optimal strategy but this is valid only in a static situation. The strongly
dynamical situation of the world market suggests that flexibility and
adaptability are even more important to be the most competitive while the
ones specialized on those few products exported by almost every country
are the poorest. On this account mainstream theories would predict an
almost diagonal binary country product matrix while, ordering rows and
columns with respect to our metrics for countries’ fitness and products’
complexity we observe a triangular-shaped matrix. The matrix is built
from the export flows of the year 2010 and the products are categorized
according to the Harmonized System 2007 coding system at 4 digits level of
coarse-graining.
www.nature.com/scientificreports
SCIENTIFIC REPORTS | 2 : 723 | DOI: 10.1038/srep00723 2
for all products independently on the fraction of that product on thewhole export.
Consistently with this observation we find that the rank size law ofthe intensive fitness is very broad but does not show a Zipfian beha-vior and instead matches the law observed for a per capita economicindicator, the GDP per capita (Fig. 3a). On the other hand theweighted (or extensive) metrics shows a Zipfian rank size law whichclosely follow the one of the total GDP, i.e. an extensive economicindicator. Finally in Fig 3c we show the comparison between thecomplexity of products in the intensive and extensive case. Withinour framework we find that the complexity of products appears to bean intensive feature of products independently on the analysisadopted for countries. We consider this result as an important ele-ment of consistency.
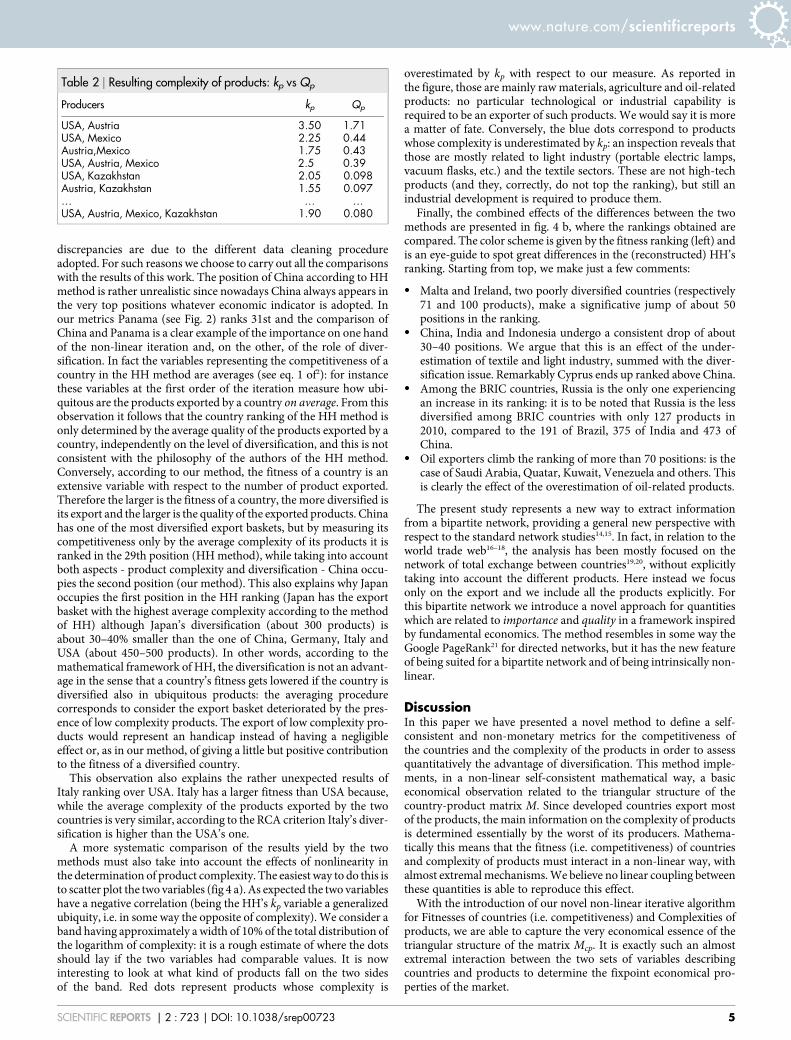
In order to show the basic fundamental differences of our methodwith respect to HH, we consider a simplified world composed by only
four countries USA, Austria, Mexico and Kazakhstan. We assign tothem a fixed fitness Fc as reported in Table 1. We now perform asingle step of the method of HH, thus evaluating their variables forproducts (kp 5, F .), and a single step of our method:~Qp~
Pp 1=Fcð Þ{1. The average and the sums are performed only
over the countries producing the p-th product. Finally, we computeQp and kp for products made by every possible combination of thefour countries.
From the results obtained in Table 2 we note that Qp (differentlyfrom kp) depends strongly on the worst producers. Furthermore Qp
also reproduces hierarchically the importance of one product withrespect to the others given their ubiquity preserving the orderinggiven by the worst producer. In this respect the variable kp missesthis aspect predicting the highest complexity of the product with thehighest ubiquity (USA, Austria, Mexico) among all the possible com-binations of exporters, having Mexico as the worst country. In real
Figure 2 | The Bipartite Network of Countries and Products and the Non-Monetary Metrics. In (a) we report a snapshot of the bipartite network for the
most important countries; size of vertices is the fitness and the complexity we computed. In (b) we show the time evolution of the ranking of various
country along the various years according to our metrics. In (c) we qualitatively show what is the effect on country fitness of our iterations (green) with
respect to the method of HH (red). Finally in (d) we quantitatively show the evolution of country fitness’ distribution (right panel) which is broaden by
iterations as expected and compare it with the evolution of the variables of the method of HH (left panel). The distribution is in this case shrunk towards a
delta-function by the iteration evolution. A similar effect is observed for the kp variable.
www.nature.com/scientificreports
SCIENTIFIC REPORTS | 2 : 723 | DOI: 10.1038/srep00723 3
data these features give rise to a more complex hierarchical behaviordue to a richer distribution in countries’ fitnesses.
Moving to economic aspects, the new metrics here introduced givenow a method to measure the differences in the competitiveness ofdifferent countries. As an application of the potentiality of the met-rics, we can discuss the case of BRIC countries (Brazil, Russia, Indiaand China) in Fig. 2b. BRIC countries are usually considered asemerging countries whose economical systems have an high rate ofgrowth. A conventional monetary analysis based on the GDP revealsthat all these countries’ GDP growth rate is higher than the ones ofthe western countries (US and Europe). For Brazil and even moreRussia we measure that the Fitness is decreasing as shown in Fig. 2b.
Therefore we conclude that their GDP growth is essentially fuelled bythe increasing prices of raw materials. According to our analysisthese two countries are not using their surplus of richness derivingfrom raw materials to develop their capabilities in order to give firmbasis to their industrial economic system. On the other hand in thecase of China and India the observed GDP growth reflects a genuinedevelopment of the capabilities and a real increase of the competi-tiveness of these two countries. In this sense the development of ICcountries is economically well-grounded differently from BR coun-tries, which appear to be boosted by the price bubble of the rawmaterials. The most spectacular growth, observed both in the GDPand in our fitness, is the case of China, for which the two data are inperfect agreement. According to our analysis from 1995 to 2010 theranking of industrial competitiveness of China moved from the 13thposition to the 2nd, just below Germany. The HH method insteadranks China in the 29th position in 2010 (The Atlas of EconomicComplexity12, pag. 64), just above Panama which is 30th. However,the authors of12 provides different country rankings which are notconsistent with each other (see2 and13). By reproducing the HHmethod on our data we find a ranking very close to the one of12,for instance China in 2010 is ranked in the position 34 and the
Figure 3 | Data Analysis: intensive and extensive metrics. In (a) we show the rank-size law of the fitness as measured by the non-monetary metrics (solid
black line). As discussed in the text this metrics corresponds to an intensive information, a sort of per capita fitness. Indeed we find a very good agreement
with the rank-size for an per capita monetary indicator as the GPD per capita. Red lines in all panels represent a pure Zipf Law , 1/k. In (b) we show the
rank size law of the weighted case and compare it with a extensive monetary indicator as the GDP. In panel c we show the comparison between the
complexity of products in the intensive and extensive case. As expected we find that the complexity of products appears to be an intensive features of
products independently on the analysis adopted.
Table 1 | The fitnesses of the countries of the Small-World
Country Fitness
USA 4Austria 3Mexico 0.5Kazakhstan 0.1
www.nature.com/scientificreports
SCIENTIFIC REPORTS | 2 : 723 | DOI: 10.1038/srep00723 4
discrepancies are due to the different data cleaning procedureadopted. For such reasons we choose to carry out all the comparisonswith the results of this work. The position of China according to HHmethod is rather unrealistic since nowadays China always appears inthe very top positions whatever economic indicator is adopted. Inour metrics Panama (see Fig. 2) ranks 31st and the comparison ofChina and Panama is a clear example of the importance on one handof the non-linear iteration and, on the other, of the role of diver-sification. In fact the variables representing the competitiveness of acountry in the HH method are averages (see eq. 1 of2): for instancethese variables at the first order of the iteration measure how ubi-quitous are the products exported by a country on average. From thisobservation it follows that the country ranking of the HH method isonly determined by the average quality of the products exported by acountry, independently on the level of diversification, and this is notconsistent with the philosophy of the authors of the HH method.Conversely, according to our method, the fitness of a country is anextensive variable with respect to the number of product exported.Therefore the larger is the fitness of a country, the more diversified isits export and the larger is the quality of the exported products. Chinahas one of the most diversified export baskets, but by measuring itscompetitiveness only by the average complexity of its products it isranked in the 29th position (HH method), while taking into accountboth aspects - product complexity and diversification - China occu-pies the second position (our method). This also explains why Japanoccupies the first position in the HH ranking (Japan has the exportbasket with the highest average complexity according to the methodof HH) although Japan’s diversification (about 300 products) isabout 30–40% smaller than the one of China, Germany, Italy andUSA (about 450–500 products). In other words, according to themathematical framework of HH, the diversification is not an advant-age in the sense that a country’s fitness gets lowered if the country isdiversified also in ubiquitous products: the averaging procedurecorresponds to consider the export basket deteriorated by the pres-ence of low complexity products. The export of low complexity pro-ducts would represent an handicap instead of having a negligibleeffect or, as in our method, of giving a little but positive contributionto the fitness of a diversified country.
This observation also explains the rather unexpected results ofItaly ranking over USA. Italy has a larger fitness than USA because,while the average complexity of the products exported by the twocountries is very similar, according to the RCA criterion Italy’s diver-sification is higher than the USA’s one.
A more systematic comparison of the results yield by the twomethods must also take into account the effects of nonlinearity inthe determination of product complexity. The easiest way to do this isto scatter plot the two variables (fig 4 a). As expected the two variableshave a negative correlation (being the HH’s kp variable a generalizedubiquity, i.e. in some way the opposite of complexity). We consider aband having approximately a width of 10% of the total distribution ofthe logarithm of complexity: it is a rough estimate of where the dotsshould lay if the two variables had comparable values. It is nowinteresting to look at what kind of products fall on the two sidesof the band. Red dots represent products whose complexity is
overestimated by kp with respect to our measure. As reported inthe figure, those are mainly raw materials, agriculture and oil-relatedproducts: no particular technological or industrial capability isrequired to be an exporter of such products. We would say it is morea matter of fate. Conversely, the blue dots correspond to productswhose complexity is underestimated by kp: an inspection reveals thatthose are mostly related to light industry (portable electric lamps,vacuum flasks, etc.) and the textile sectors. These are not high-techproducts (and they, correctly, do not top the ranking), but still anindustrial development is required to produce them.
Finally, the combined effects of the differences between the twomethods are presented in fig. 4 b, where the rankings obtained arecompared. The color scheme is given by the fitness ranking (left) andis an eye-guide to spot great differences in the (reconstructed) HH’sranking. Starting from top, we make just a few comments:
N Malta and Ireland, two poorly diversified countries (respectively71 and 100 products), make a significative jump of about 50positions in the ranking.
N China, India and Indonesia undergo a consistent drop of about30–40 positions. We argue that this is an effect of the under-estimation of textile and light industry, summed with the diver-sification issue. Remarkably Cyprus ends up ranked above China.
N Among the BRIC countries, Russia is the only one experiencingan increase in its ranking: it is to be noted that Russia is the lessdiversified among BRIC countries with only 127 products in2010, compared to the 191 of Brazil, 375 of India and 473 ofChina.
N Oil exporters climb the ranking of more than 70 positions: is thecase of Saudi Arabia, Quatar, Kuwait, Venezuela and others. Thisis clearly the effect of the overestimation of oil-related products.
The present study represents a new way to extract informationfrom a bipartite network, providing a general new perspective withrespect to the standard network studies14,15. In fact, in relation to theworld trade web16–18, the analysis has been mostly focused on thenetwork of total exchange between countries19,20, without explicitlytaking into account the different products. Here instead we focusonly on the export and we include all the products explicitly. Forthis bipartite network we introduce a novel approach for quantitieswhich are related to importance and quality in a framework inspiredby fundamental economics. The method resembles in some way theGoogle PageRank21 for directed networks, but it has the new featureof being suited for a bipartite network and of being intrinsically non-linear.
DiscussionIn this paper we have presented a novel method to define a self-consistent and non-monetary metrics for the competitiveness ofthe countries and the complexity of the products in order to assessquantitatively the advantage of diversification. This method imple-ments, in a non-linear self-consistent mathematical way, a basiceconomical observation related to the triangular structure of thecountry-product matrix M. Since developed countries export mostof the products, the main information on the complexity of productsis determined essentially by the worst of its producers. Mathema-tically this means that the fitness (i.e. competitiveness) of countriesand complexity of products must interact in a non-linear way, withalmost extremal mechanisms. We believe no linear coupling betweenthese quantities is able to reproduce this effect.
With the introduction of our novel non-linear iterative algorithmfor Fitnesses of countries (i.e. competitiveness) and Complexities ofproducts, we are able to capture the very economical essence of thetriangular structure of the matrix Mcp. It is exactly such an almostextremal interaction between the two sets of variables describingcountries and products to determine the fixpoint economical pro-perties of the market.
Table 2 | Resulting complexity of products: kp vs Qp
Producers kp Qp
USA, Austria 3.50 1.71USA, Mexico 2.25 0.44Austria,Mexico 1.75 0.43USA, Austria, Mexico 2.5 0.39USA, Kazakhstan 2.05 0.098Austria, Kazakhstan 1.55 0.097… … …USA, Austria, Mexico, Kazakhstan 1.90 0.080
www.nature.com/scientificreports
SCIENTIFIC REPORTS | 2 : 723 | DOI: 10.1038/srep00723 5
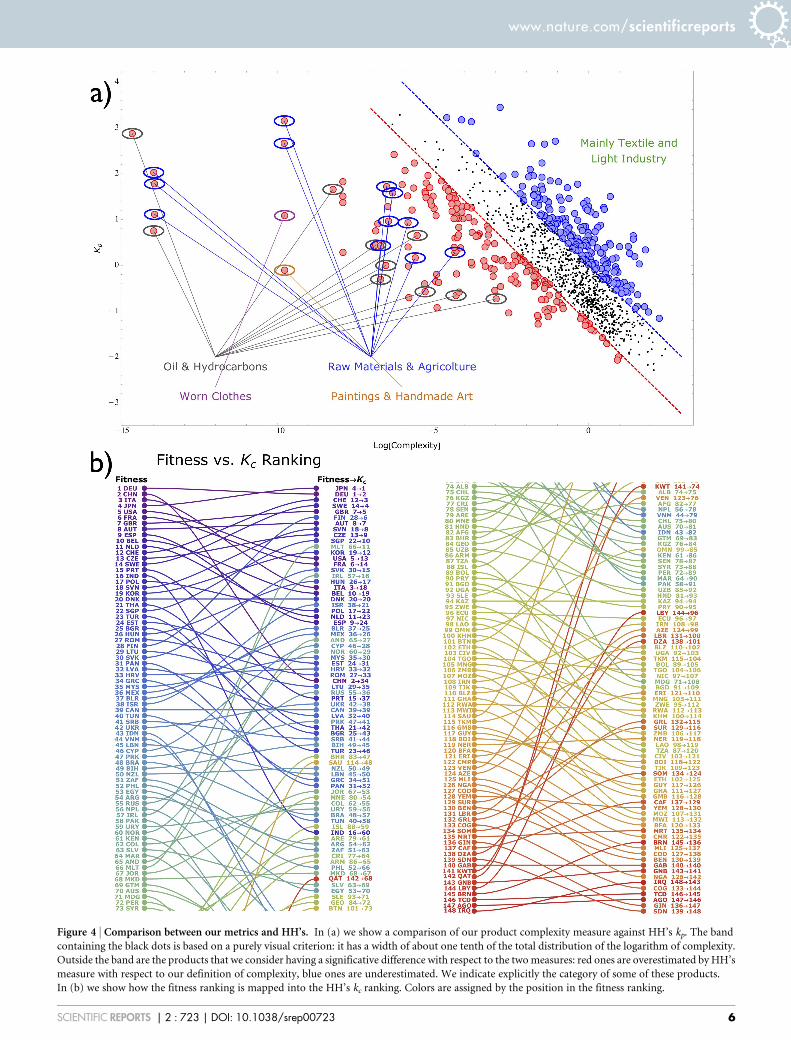
Figure 4 | Comparison between our metrics and HH’s. In (a) we show a comparison of our product complexity measure against HH’s kp. The band
containing the black dots is based on a purely visual criterion: it has a width of about one tenth of the total distribution of the logarithm of complexity.
Outside the band are the products that we consider having a significative difference with respect to the two measures: red ones are overestimated by HH’s
measure with respect to our definition of complexity, blue ones are underestimated. We indicate explicitly the category of some of these products.
In (b) we show how the fitness ranking is mapped into the HH’s kc ranking. Colors are assigned by the position in the fitness ranking.
www.nature.com/scientificreports
SCIENTIFIC REPORTS | 2 : 723 | DOI: 10.1038/srep00723 6
The new theory presented in this paper leads to a massive amountof results of which we have discussed few limited examples. All theinformation one can obtain has many other economic implicationswhich we will consider in subsequent works. We believe that thepresent methodology, or its natural variants, could be useful also ina variety of other problems, characterized by bipartite networks alsobeyond the area of economics.
MethodsDatasets. We used data extracted from the BACI dataset22. In this dataset we havetrading data about more than 200 countries and 5000 products classified according toa six digit code (categorization: Harmonized System 200723). We coarse-grained suchclassification by considering only the first 4 digits, obtaining a set of about 1200products. The matrix M, whose elements are Mpc, is then built by transforming theflows qcp of US Dollars into unweighted links between countries and products. Thecriterion adopted in order to understand whether a country can be considered or not aproducer of a particular product is the so-called Revealed Comparative Advantage(RCA)24 that is the fraction of export of the product p by country c with respect to theglobal export of p done by all countries. This quantity is then divided by the fraction ofthe total export of c with respect to the whole world export. I.e.
RCAcp~
qcp
Sc’qc’p
Sp’qcp’
Sc’p’qc’p’
ð2Þ
In order to build the binary matrix M from the RCA matrix, we consider Mcp 5 1 ifRCAcp $ 1 and zero otherwise.
As a consistency test of the robustness of this criterion, we can aggregate two ormore countries and apply the RCA criterion to this macro-country. It is found that thediversification of this macro-country, i.e. the number of products for which thethreshold condition is satisfied, is not the sum of the diversification of the single units(minus their intersection). The resulting diversification is generally of the same orderof magnitude of the most diversified unit composing the macro-country. As anexample, in 2010, by aggregating Germany, France, Italy, United Kingdom and Spainin a single country we find that this macro-nation exports about 600 products whilethe diversification of its units ranges from 400 to 500 and the simple union ofthese five countries would export almost all the products (about 950 products among1160).
The non-monetary (intensive) metrics: the non-linear relationship. The aboveproblems arise from the choice to link linearly the ubiquity of a product with thefitness of a country. A different and much more effective approach can be obtained byfollowing these statements: the fitness of a country must be related to the average levelof its products. The complexity of a product is dominated (i.e. it goes down) by lessdeveloped countries. We now deal with two sets of variables, non-linearly related, forwhich we define a metrics as the fix point solution of eqs. 1. As shown the iterativemethod is composed of two steps at each iteration, we first compute the intermediatevariables ~F nð Þ
c and ~Q nð Þp and then by normalizing them we define the countries’ fitness
and the products’ complexity for each order n of the iteration. We recall that initialconditions are ~Q 0ð Þ
p ~1 Vp and ~F 0ð Þc ~1 Vc. The variable F is named fitness and
measures the level of competitiveness of a country while the variables Q are thecomplexity of products. The elements Mcp are the elements of the binary country-product matrix M: the element Mcp is 1 if the country c exports the product p, 0otherwise. The averages at the denominators are performed on all the intermediatevalues of fitness and complexity defined by eqs. 1. At each iteration both variables(fitness and complexity) are renormalized to keep constant the total export and theaverage complexity of products respectively. We introduce this renormalizationprocedure because our non linear equations have two trivial absorbing solutions in0 and 1‘. By the renormalization of the space in which the values of fitness andcomplexity lie we are able to grasp the non trivial, self-consistent and economicallymeaningful solution.
Firstly we note that the iterations do not change the meaning of the variables, eachiteration only refines the information. As a second point, in the computation of thecomplexity of a product, the weight assigned to countries is inversely proportional tothe fitness. The countries with small fitness dominate the sum in eqs. 1 as expected. Asa final remark this version of our method can be seen as the intensive case since thematrix M is a binary matrix which does not take into account extensively the amountof export of a country. Thus the metrics deriving from the binary matrix is purelynon-monetary: this metrics intensively measures the productive power of countries.The weighted (extensive) version of the method considering a weighted country-product matrix is discussed in the next section.
The extensive metrics: the weighted country-product matrix. The extensive metricsis simply obtained by replacing in eqs. 1 the matrix M with weighted matrix W whoseelements Wcp ranges from 0 to 1 and are define as
Wcp~qcp
Scqcp: ð3Þ
According to this definition the weight Wcp is the fraction of export of product p heldby the country c.
1. Hidalgo, C. A., Klinger, B., Barabasi, A.-L. & Hausmann, R. The Product SpaceConditions the Development of Nations. Science 317, 482–487 (2007).
2. Hidalgo, C. A. & Hausmann, R. The building blocks of economic complexity.Proceedings of the National Academy of Sciences 106, 10570–10575 (2009).
3. Smith, A. The Wealth of Nations. W. Strahan and T. Cadell, London (1776).4. Ricardo, D. On the Principles of Political Economy and Taxation. John Murray
(1817).5. Romer, P. M. Endogenous technological change. Journal of Political Economy 98,
71–102 (1990).6. Grossman, G. M. & Helpman, E. Quality ladders in the theory of growth. Review of
Economic Studies 58, 43–61 (1991).7. Flam, H. & Flanders, M. J. Heckscher-Ohlin Trade Theory. Cambridge, Mass.: MIT
Press. (1991).8. Caldarelli, G. et al. A network analysis of countries’ export flows: towards non-
linear metrics. arXiv,1108.2590 (2011).9. Tacchella, A., Cristelli, M., Caldarelli, G., Gabrielli, A. & Pietronero, L. Economic
complexity: a new metric for countries’ competitiveness and products’complexity. submitted to JEDC (2012).
10. Pareto, V. Manual of Political Economy. Augustus M. Kelley Publishers, NewYork, (1906).
11. Zipf, G. K. Human Behavior and the Principle of Least Effort. Addison-Wesley,Cambridge, MA, (1949).
12. Hausmann, R. et al. The atlas of economic complexity. http://atlas.media.mit.edu/media/atlas/pdf/HarvardMIT_AtlasOfEconomicComplexity.pdf (2012).
13. Hidalgo, C. A. The Dynamics of Economic Complexity and the Product Spaceover a 42 year period. Center for International Development - Working Paper 189(2009)
14. Caldarelli, G. Scale-Free Networks: Complex Webs in Nature and Technology.Oxford University Press, Oxford (2007).
15. Barrat, A., Barthelemy, M. & Vespignani, A. Dynamical Processes on ComplexNetworks. Cambridge University Press, Cambridge (2008).
16. Serrano, M.-A. & Boguna, M. Topology of the world trade web. Physical Review E,68 015101(R) (2003).
17. Garlaschelli, D. & Loffredo, M. I. Fitness-Dependent Topological Properties of theWorld Trade Web. Phys. Rev. Lett. 93, 188701 (2004).
18. Serrano, M.-A., Boguna, M. & Vespignani, A. Patterns of dominant flows in the worldtrade web. Journal of Economic Interaction and Coordination 2, 111–124 (2007).
19. Squartini, T., Fagiolo, G. & Garlaschelli, D. Randomizing world trade. II. A binarynetwork analysis. Physical Review E 84, 046117 (2011).
20. Squartini, T., Fagiolo, G. & Garlaschelli, D. Randomizing world trade. I. Aweighted network analysis. Physical Review E 84, 046118 (2011).
21. Page, L., Brin, S., Motwani, R. & Winograd, T. The PageRank Citation Ranking:Bringing Order to the Web. Technical Report. Stanford InfoLab (1999).
22. Gaulier, G. & Zignago, S. BACI: International Trade Database at the Product-level.Centre d’Etudes Prospectives et d’Informations Internationales (2010).http://www.cepii.fr/anglaisgraph/workpap/pdf/2010/wp2010-23.pdf.
23. http://www.wcoomd.org/ (Accessed: September 2012).24. Balassa, B. Trade liberalization and ‘revealed’ comparative advantage. Manchester
School 33, 99–123 (1965).
AcknowledgmentsThis work has been partly funded and supported by Italian PNR project CRISIS-Lab andFET Open project nr. 255987 ‘‘FOC’’).
Author contributionsA.T. and M.C. carried out the numerical simulations and data analysis. All authors devisedthe research, wrote and revised the main manuscript text.
Additional informationSupplementary information accompanies this paper at http://www.nature.com/scientificreports
Competing financial interests: The authors declare no competing financial interests.
License: This work is licensed under a Creative CommonsAttribution-NonCommercial-NoDerivative Works 3.0 Unported License. To view a copyof this license, visit http://creativecommons.org/licenses/by-nc-nd/3.0/
How to cite this article: Tacchella, A., Cristelli, M., Caldarelli, G., Gabrielli, A. & Pietronero,L. A New Metrics for Countries’ Fitness and Products’ Complexity. Sci. Rep. 2, 723;DOI:10.1038/srep00723 (2012).
www.nature.com/scientificreports
SCIENTIFIC REPORTS | 2 : 723 | DOI: 10.1038/srep00723 7