Embed Size (px)
Citation preview

Anemia:Nutritional Deficiencies
Alison R. Moliterno MDJHUSOMJuly 2012
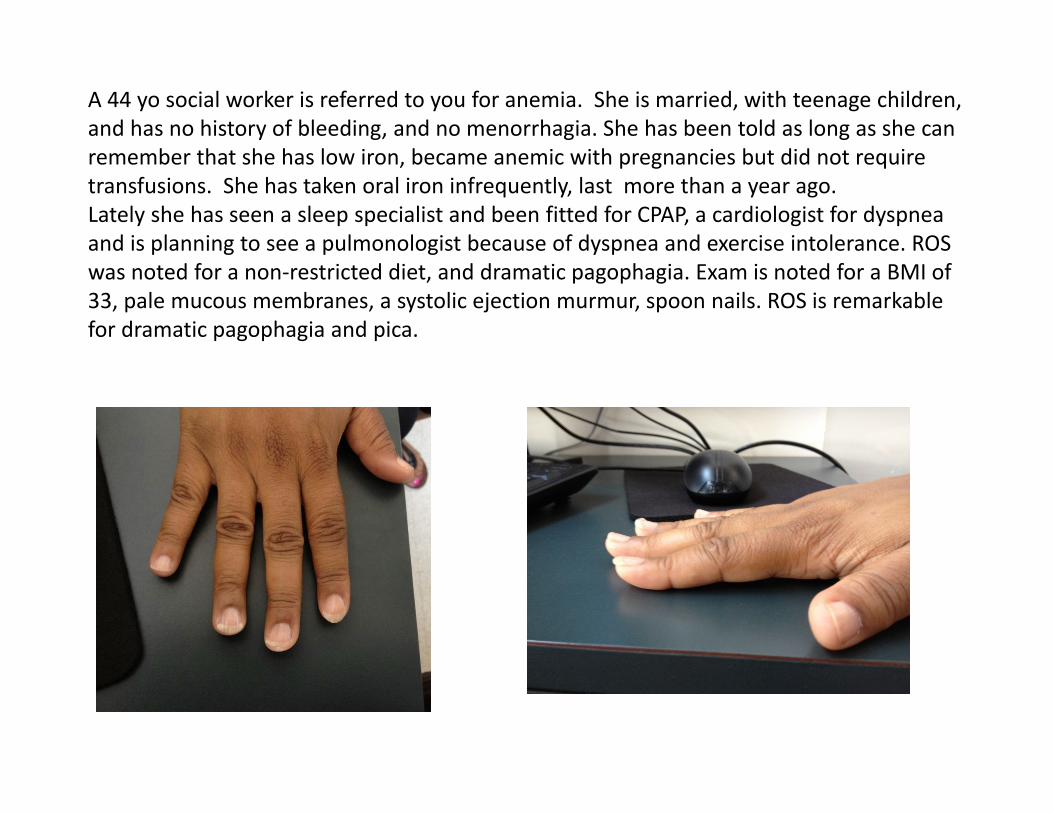
A 44 yo social worker is referred to you for anemia. She is married, with teenage children, and has no history of bleeding, and no menorrhagia. She has been told as long as she can remember that she has low iron, became anemic with pregnancies but did not require transfusions. She has taken oral iron infrequently, last more than a year ago.Lately she has seen a sleep specialist and been fitted for CPAP, a cardiologist for dyspneaand is planning to see a pulmonologist because of dyspnea and exercise intolerance. ROS was noted for a non‐restricted diet, and dramatic pagophagia. Exam is noted for a BMI of 33, pale mucous membranes, a systolic ejection murmur, spoon nails. ROS is remarkable for dramatic pagophagia and pica.

low High 2012 2008WBC 4500 11000 4000 5900Hemoglobin 12 15 8.8 10.7MCV 80 100 67 72Platelets 150 350 422 281Iron 50 170 18 24Transferrin 200 400 426 381TIBC 250 450 533 476% sat 20 55 3 5Ferrritin 13 150 10 4
Blood counts and iron studies on our 42 yo female are listed below. How would you proceed with evaluating and managing this patient:1) No further evaluation ,treat orally2) Treat orally and/or intravenously3) Refer to GI for EGD, colonoscopy4) Refer to GI for EGD, small bowel biopsies, celiac serologies5) Treat intravenously, recommend a wheat‐free diet
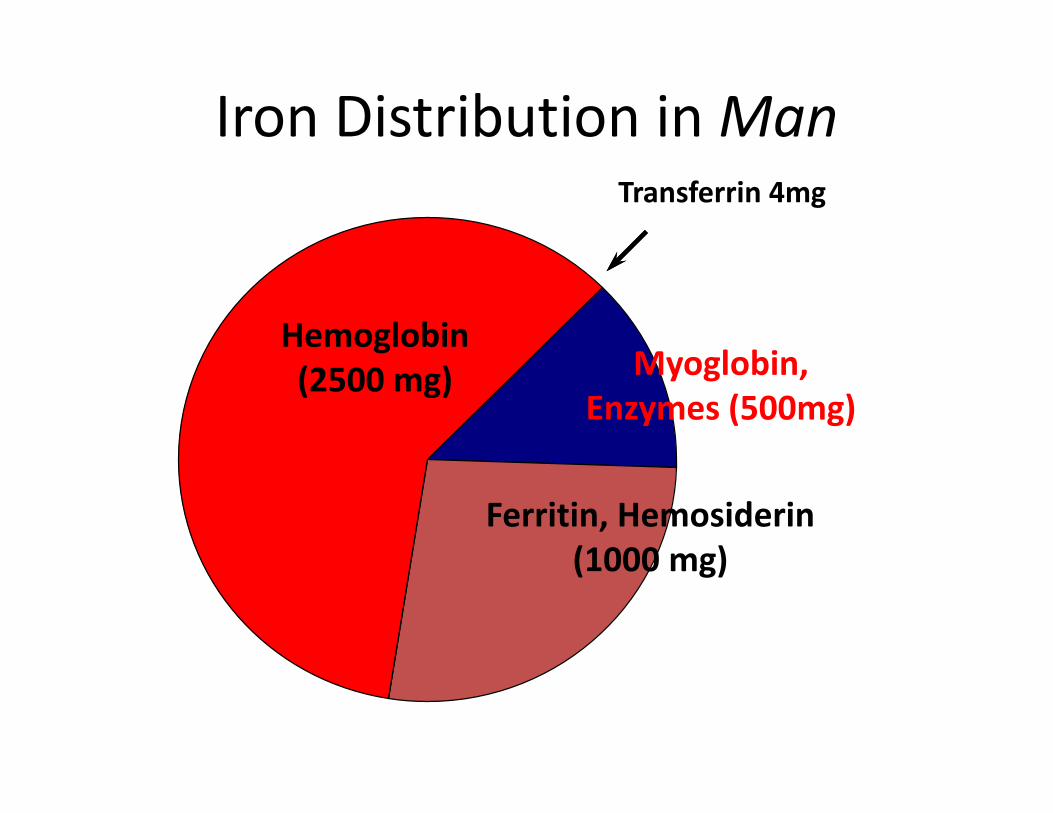
Iron Distribution in Man
Hemoglobin(2500 mg) Myoglobin,
Enzymes (500mg)
Ferritin, Hemosiderin(1000 mg)
Transferrin 4mg

Iron Absorption
• Food sources: 10 ‐ 25 mg / day
• Absorbed in the brush border of
the duodenum
• Most dietary iron is nonheme
form, <5% bioavailability
• < 10% dietary iron is heme form,
>25% bioavailability
Iron Absorption (% of dose)0 5 10 15 20 25
Veal muscleHemoglobinFish muscle
Veal liverFerritin
Soy beansWheat
LettuceCorn
Black beansSpinach
Rice
Non-hemeiron
Hemeiron

The iron cycle

Iron Storage• Ferritin
– multi‐subunit protein– primarily intracellular– some in plasma
• Hemosiderin– insoluble form of ferritin
– visible microsopically

Pathophysiology of Iron Deficiency
• Depletion of iron stores• Iron becomes a limiting factor in heme biosynthesis• Heme deficiency limits hemoglobin assembly• Hemoglobin deficiency limits red cell production• Red cells are small (microcytic, low MCV)• Red cells are deficient in hemoglobin (hypochromic, low MCH)

Iron Losses• Iron is closely conserved in humans
• <0.05% of iron is lost per day normally
• Very small amounts in urine, bile and sweat
• Cells shed from skin, intestinal and urinary tracts
• Menstrual blood loss
• Pregnancy, delivery and lactation
• Humans have NO physiologic means to excrete excess iron

Routes to Iron Deficiency
Occult or overt GI losses, traumatic or surgical losses Failure to meet increased requirements
Rapid growth in infancy and adolescence Menstruation, pregnancy, delivery
Inadequate dietary source Diet low in heme iron (vegans, impoverished)
Malabsorption Gastrointestinal disease or surgery (gastric failure,atrophicgastritis, gastric bypass, H. pylori)
Duodenal/small bowel malabsorptive disease Celiac disease, lymphoma
Chronic hemolysis PNH, march hemoglobinuria

Symptoms and signs of IDA
• Anemia symptoms – fatigue, feeling cold, dyspnea on exertion, palpitations, tinnitus
• Pica ‐ craving of nonfood substances– e.g., ice, dirt, clay, laundry starch, newspaper
• Glossitis ‐ smooth tongue• Angular stomatitis ‐ cracking of corners of mouth• Koilonychia ‐ thin, brittle, spoon‐shaped fingernails• Blue sclerae• Short term memory loss• Restless legs

Sequential Changes in IDA
NORMALDEPLETED
IRONSTORES
IRONDEFICIENCY
IRONDEFICIENCY
ANEMIA
FERRITIN
IRON SATURATION
MCV & Hb & Hct

Peripheral blood smear in IDA
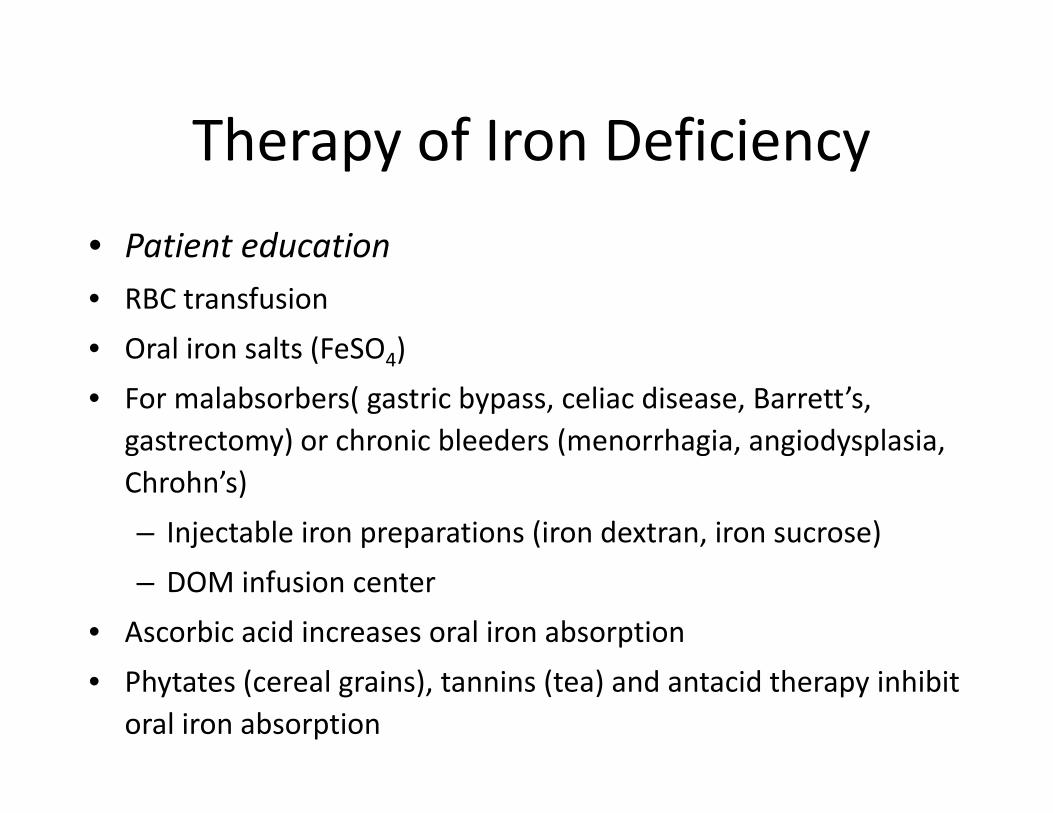
Therapy of Iron Deficiency• Patient education• RBC transfusion• Oral iron salts (FeSO4) • For malabsorbers( gastric bypass, celiac disease, Barrett’s,
gastrectomy) or chronic bleeders (menorrhagia, angiodysplasia, Chrohn’s) – Injectable iron preparations (iron dextran, iron sucrose)– DOM infusion center
• Ascorbic acid increases oral iron absorption• Phytates (cereal grains), tannins (tea) and antacid therapy inhibit
oral iron absorption

Response to Iron Therapy
• Peak reticulocyte count 7 ‐ 10 d.
• Increased Hb and Hct 14 ‐ 21 d.
• Normal Hb and Hct 2 months
• Normal iron stores 4 ‐ 5 months

ASH‐SAP• A 30 yo female presents with iron deficiency refractory to iron
supplementation. She has been amenorrheic for the past year, and runs 30 miles a week. She denies other sources of blood loss, and denies GI symptoms of any sort. She is a vegetarian. Her BMI is 18, ferritin is undetectable, and hemoglobin is 11 gm/dl. Contributors to her current clinical picture include all of the following except:– A. female sex– B. vegetarian diet– C. undiagnosed celiac disease– D. long distance running– E All of the above

A 37 year old previously healthy African American male is hospitalized for an illness characterized by high fevers, incapacitating polyarthritis and rash. He had laboratories
consistent with marked inflammation including an erythrocyte sedimentation rate of greater than 100, and a C‐reactive protein of greater than 40. In addition to his hemogram, the intern
sends iron studies and based on those results, hemochromatosis gene testing:
Patient Normal RangeWBC COUNT 36650 4500 – 11000RBC COUNT 3.00 4.50 – 5.90HEMOGLOBIN 9.1 13.9 – 16.3PACKED CELL VOLUME 27.1 41.0 – 53.0MCV 90.3 80.0 – 100.0MC HEMOGLOBIN 30.3 26.0 – 34.0MC HGB CONCENTRATION 33.6 31.0 – 37.0RBC DISTRIBUTION WIDTH 12.9 11.5 – 14.5PLATELET COUNT 443 150 – 350ABS RETIC COUNT 38.3 24.1 – 87.7
Serum iron 84 65‐170 mcg/dLTransferrin 136 200‐400 mg/dLTotal iron binding capacity 170 250‐450 mg/dL% Saturation 49 20‐55%Ferritin 19,322 10‐300 ng/mLHFE genotype C282Y Wild‐type

Patient in Hospital
Patient after 3 months of treatment NORMAL RANGE
WBC COUNT 36650 9800 4500 – 11000RBC COUNT 3.00 4.45 4.50 – 5.90HEMOGLOBIN 9.1 13.8 13.9 – 16.3PACKED CELL VOLUME 27.1 42.5 41.0 – 53.0MEAN CORPUSCULAR VOLUME 90.3 95 80.0 – 100.0
MC HEMOGLOBIN 30.3 33.0 26.0 – 34.0MC HGB CONCENTRATION 33.6 33.7 31.0 – 37.0RBC DISTRIBUTION WIDTH 12.9 12.0 11.5 – 14.5PLATELET COUNT 443 397 150 – 350SERUM IRON 84 65 – 170 mcg/dLTRANSFERRIN 136 200 – 400 mg/dLTOTAL IRON BINDING CAPACITY 170 250 – 450 mg/dL
% SATURATION 49 20 – 55%FERRITIN 19,322 213 10 – 300 ng/mL
The patient is given a course of prednisone and his rash, arthritis and fever resolve within weeks. At a follow up clinic visit his iron studies and hemogram are repeated. Did the patient suffer from iron overload? Was hemochromatosis gene testing indicated?

Anemia of inflammation
• IL‐6 and hepcidin
• Hypoferremia
• Impaired iron absorption
• Impaired iron release

Hepcidin in anemia of inflammation
Tomas Ganz, Blood 2003;102:873

IDA vs. Inflammation
Ferritin
IDA Inflammation
Serum Iron
TIBC
Both
?
?

A 50 year old African American female was brought to the emergency department by her daughter because of erratic behavior, personality changes, shortness of breath and ataxia. The
patient was dismissed by her employer due to erratic behavior. Her medical history was remarkable for a history of hypothyroidism diagnosed many years ago, but otherwise was benign.
Physical examination revealed a well nourished middle aged female in no acute distress. The patient was irritable and was vague in answering questions throughout the interview. Her
neurologic exam was noted for intact cranial nerves II‐XII. Her muscle strength was 5/5 bilaterally when tested in the supine position. She had intact sensation to light touch and pinprick, though markedly diminished proprioception. She was markedly ataxic and needed to steady herself on
the wall for added support.
50 YO FEMALE
NORMAL RANGE
WBC COUNT 3120 4500 ‐ 11000RBC COUNT 1.92 4.50 – 5.90HEMOGLOBIN 7.8 13.9 – 16.3PACKED CELL VOLUME 22.7 41.0 – 53.0MEAN CORPUSCULAR VOLUME
118.2 80.0 – 100.0
MC HEMOGLOBIN 40.6 26.0 – 34.0MC Hgb CONCENTRATION 34.4 31.0 – 37.0RBC DISTRIBUTION WIDTH 20.0 11.5 – 14.5PLATELET COUNT 123 150 – 350NUCLEATED RBC NUMBER 20 0 – 12RETICULOCYTE % 0.9 0.5‐1.8ABS RETIC COUNT 13.4 24.1 – 87.7

Milestones in Vitamin Theory and Therapeutics
1907 scurvy in guinea pigs – Vitamin C 1932 1912 vitamin(e) theory postulated 1913 growth failure in rats – Vitamin A 1937 1918 rickets in puppies 1922 therapeutic insulin preparations derived from bovine pancreas
1926 liver feeding to pernicious anemia patients 1935 liver as an iron source
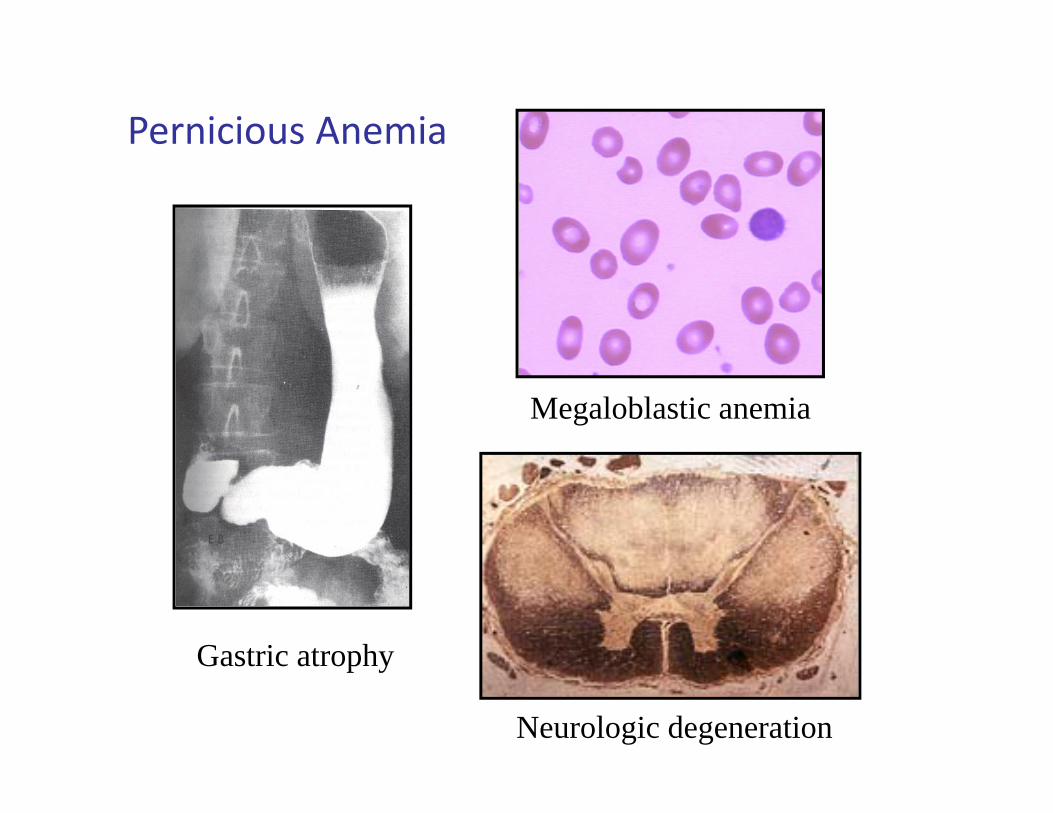
Pernicious Anemia
Megaloblastic anemia
Gastric atrophy
Neurologic degeneration

Pernicious Anemia ‐ laboratory exam• blood smear and bone marrow
• hemolysis (hyperbilirubinemia, LDH)• thrombocytopenia, leukopenia• elevated gastric pH

Study of Pernicious Anemia = B12 Identification
Responses to daily liver feeding supported the theory that a deficiency was the cause of PA.
Liver contained an “extrinsic factor” that could not be absorbed by PA patients due to loss of an “intrinsic
factor” in their gastric secretions
Identity of the extrinsic factor crystallized from liver, named vitamin B12 in 1948

Vitamin B12
Cobalamin
Coenzyme B12

Vitamin B12• synthesized only by microorganisms• dietary sources include liver, glandular tissue, muscle, eggs, dairy products, seafood
• body stores are 2‐5 mg, with the liver as the major storehouse
• daily needs are 2‐5 ug, 0.1% of the stores• B12 excreted in bile, extensive reabsorption via the enterohepatic circulation

Absorption of B12 (Cbl) from food

Causes of B12 DeficiencyCommon
Malabsorption due to:– Salivary gland dysfunction– Loss of gastric function resulting in intrinsic factor deficiency and/or loss of gastric acid secretion– Autoimmune basis– Atrophic gastritis due to H. pylori– Gastrectomy– Ageing– H2 blockers
– Pancreatic disease– Terminal ileum diseasesprue, inflammatory bowel disease

Causes of B12 Deficiencyrare to never
• Acquired deficiency states– Inadequate ingestion
– Vegans– Breast‐fed infants of vegans– Breast‐fed infants of B12 deficient mothers
• Congenital deficiency states– Transcobalamin II deficiency– Imerslund‐Grasbeck syndrome
– mutation of receptor for IF‐B12

TCI TCII
B12 B12
TCI
B12 TCII
B12
TCI
B12TCII
TCII
B12
TCII
B12
TCI
B12-analogue
B12-analogue
TCII
Measurement of serum B12 is not fool‐proof
B12

TCI TCI
B12 B12
TCI
TCI
B12
TCI
B12TCII
TCI
B12
TCII
B12
TCI
B12-analogue
TCII
Serum B12 ‐ falsely normalintestinal bacterial overgrowth, liver disease, myeloid disorde
B12-analogue
B12-analogue
B12
TCI TCII
B12 B12
TCI
B12
TCII
TCII
B12
TCII
B12
TCII
B12
B12
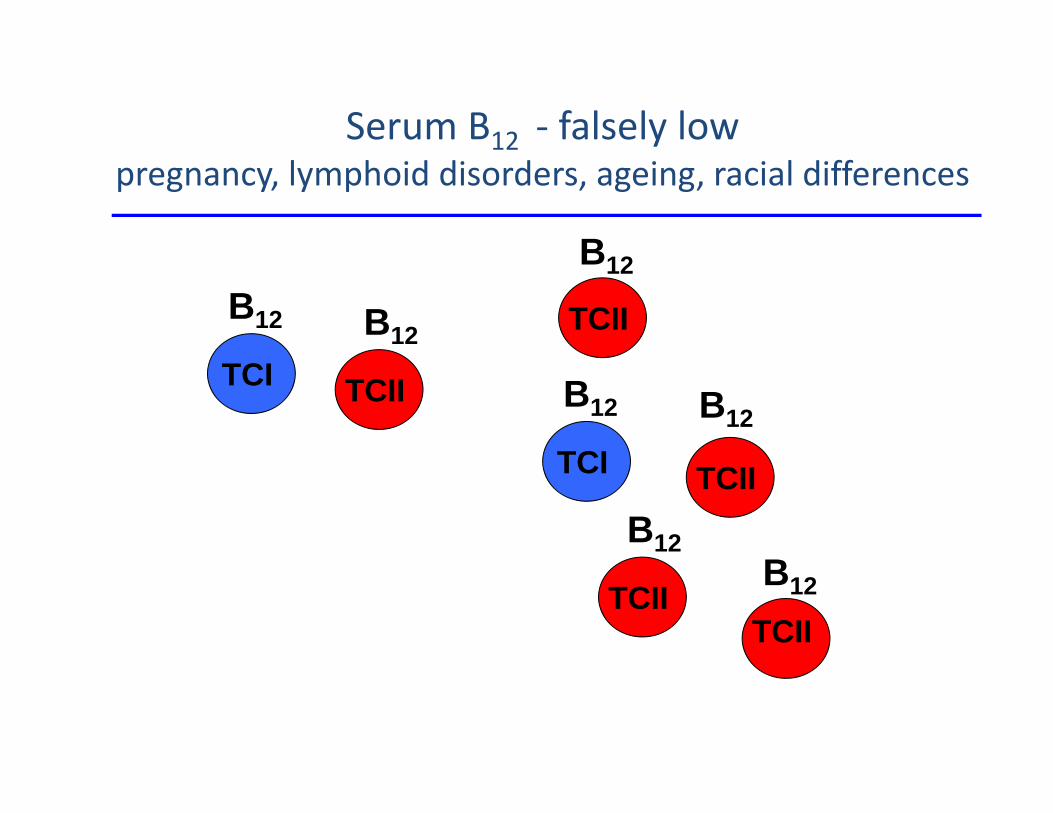
Serum B12 ‐ falsely lowpregnancy, lymphoid disorders, ageing, racial differences

100
1000
10000
100000
0 100 200 300 400
MMA90-318
B12 pg/ml
Sensitivity of methylmalonic acid in B12 deficiency

Vitamin B12 mediates 2 reactionsMethyl transfermethylation of homocysteine to generate methionine B12 is a cofactor, methyltetrahydrofolate supplies the methyl group (substrate)
B12 accelerates this reaction several thousand‐fold Tetrahydrofolate required for thymine and purinegeneration = crucial for rapidly dividing tissues
Hydrogen transfer generation of succinyl coA from methylmalonyl coA crucial for myelin maintenance

Convergence of B12 and Folic acid
Cystathionine beta synthase
Cysteine

Causes of hyperhomocysteinemia
• Cystathionine ß‐synthase
• B12 deficiency
• Folate deficiency
• Renal disease
• MTHFR gene polymorphisms
• Normal individuals
> 200 mcmol/L
20‐241
15‐50
17‐20
8‐15
4‐12

Folic Acid Overcomes Methylfolate Trap
Cystathionine beta synthase
Cysteine
Folic Acid
Dietary Folates

Many unanswered questions
• Variation in clinical presentation of B12 deficiency • Anemia and neurologic features – 30%• Anemia without neurologic symptoms – 50%• Predominantly neurologic presentations with very mild anemia or no anemia – 20%
• Basis of this variation in clinical phenotype?• Dietary methionine and folate stores, polymorphisms in enzymatic activity –hypothetical claims

50 YO FEMALE 8 MONTH OLD 60 YO MALE NORMAL RANGEWBC COUNT 3120 2990 2620 4500 ‐ 11000RBC COUNT 1.92 2.20 1.55 4.50 – 5.90HEMOGLOBIN 7.8 6.0 5.6 13.9 – 16.3PACKED CELL VOLUME 22.7 18.3 16.4 41.0 – 53.0MEAN CORPUSCULAR VOLUME
118.2 83.0 106 80.0 – 100.0
MC HEMOGLOBIN 40.6 27.3 36.1 26.0 – 34.0MC Hgb CONCENTRATION
34.4 32.0 34.1 31.0 – 37.0
RBC DISTRIBUTION WIDTH
20.0 28.3 20.0 11.5 – 14.5
PLATELET COUNT 123 91 140 150 – 350NUCLEATED RBC NUMBER
20 50 20 0 ‐ 12
RETICULOCYTE % 0.9 0.7 0.7 0.5‐1.8ABS RETIC COUNT 13.4 16.9 10.4 24.1 – 87.7
Serum B12 72 <45 65 200‐900 pg/mlHomocysteine 241 Not measured 72.6 4.0‐12.0 mcmol/LMethylmalonic acid 65,700 Not measured 2,463 90‐279 nMol/LFerritin 454 257 270 10‐300 ng/ml
You are involved in two other patients with B12 deficiency. One, an 8‐month old patient, presented with severe developmental delay. The third, a 60 year old male, presented with anemia and no neurologic symptoms. Their hemograms and laboratories are presented below. What factors may account for the variability in theirclinical presentations?

Therapy for B12 malabsorption
• Identify and correct malabsorption– Celiac disease, lymphoma, Crohn’s, H.pylori
• Supplement• Oral ‐ ? Passive transfer theory, requires monitoring• Parenteral – fool‐proof (doctors and patients), inexpensive, effective, never toxic, preferred by patients
• Duration of therapy• Dependent on clinical scenario – long term most ofthe time

• Diseases change– Atrophic gastritis
• Infectious diseases evolve• H.pylori
• Treatments evolve• H2 blockers
• Nutritional status evolves– Food fortification, Nutritional lifestyle, Obesity, Wheat genetically
modified– Populations change
– Aging of the world– Racial makeup of the US population – genomic and cultural factors
• Diagnostic testing evolves
Forces at play in nutritional anemias