Embed Size (px)
Citation preview
1
ANDREWS INC.“Always Ahead”
BOARD MEETINGMarch 10th , 2015
2
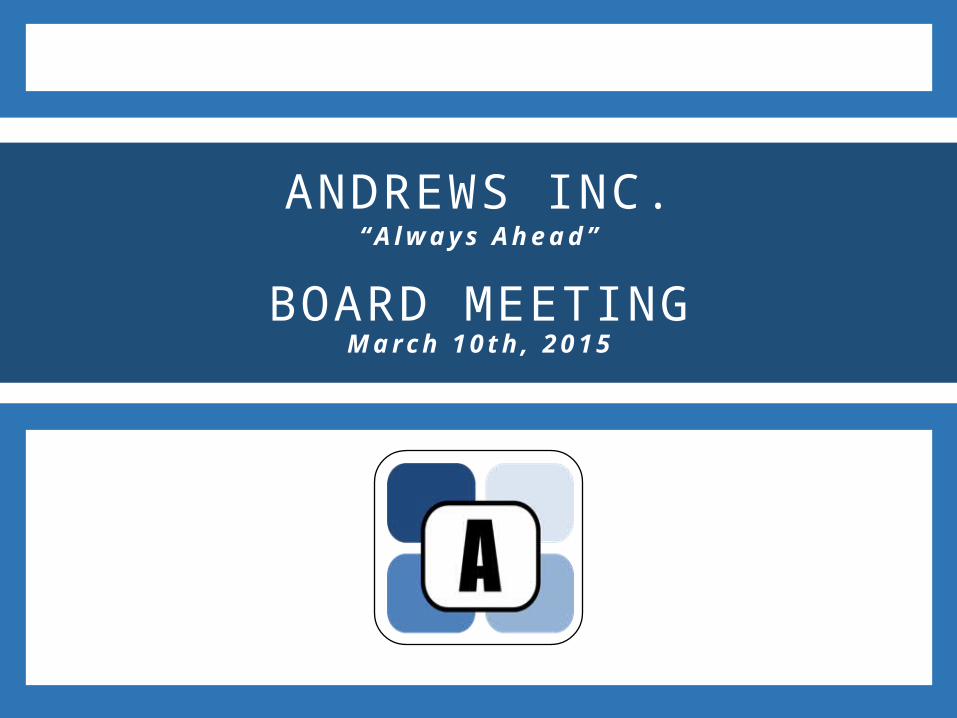
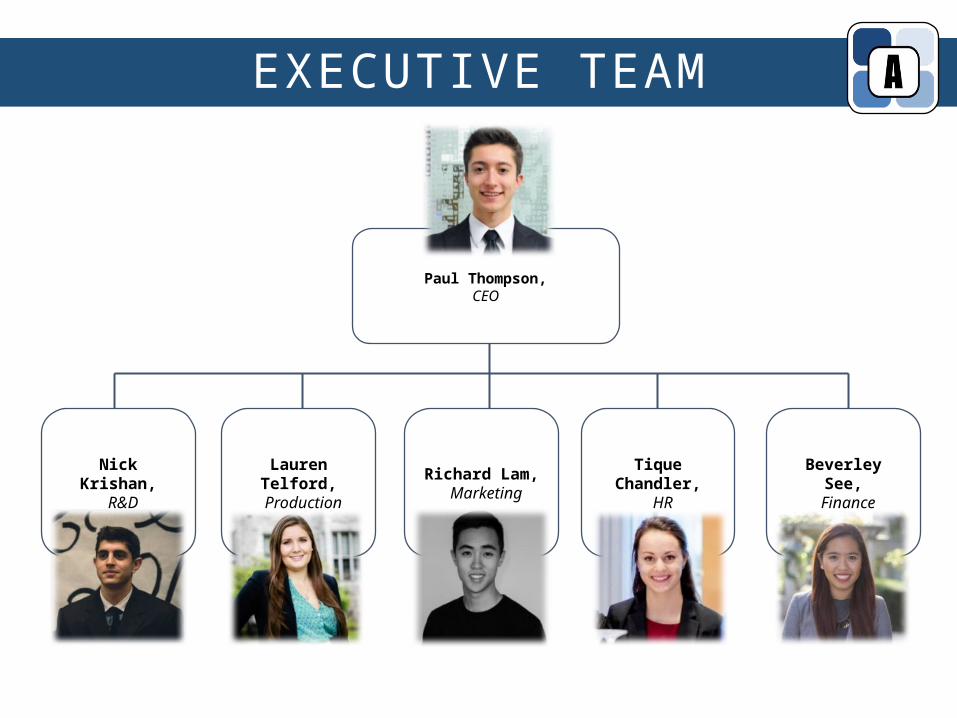
EXECUTIVE TEAM
Nick Krishan, R&D
Paul Thompson,CEO
Lauren Telford, Production
Tique Chandler, HR
Richard Lam, Marketing
Beverley See, Finance
3
EXECUTIVE SUMMARY
BUSINESS ENVIRONMENT
OPERATIONS
LOOKING FORWARD
PERFORMANCE
APPENDIX

4
BUSINESS ENVIRONMENT
5
BUSINESS ENVIRONMENT
%
5
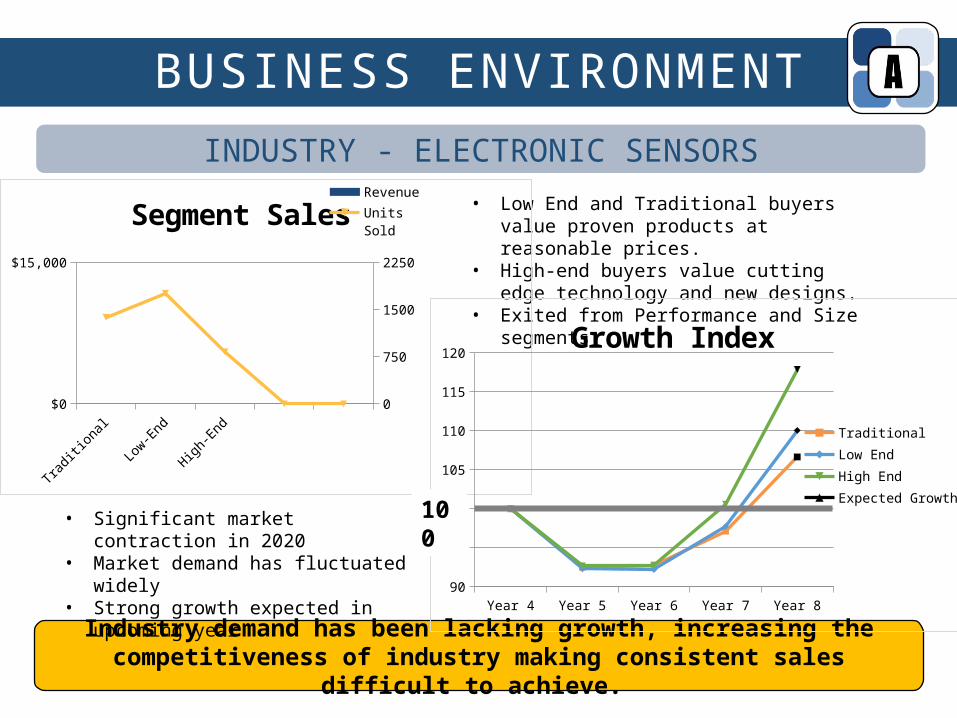
• Low End and Traditional buyers value proven products at reasonable prices.
• High-end buyers value cutting edge technology and new designs.
• Exited from Performance and Size segments.
INDUSTRY - ELECTRONIC SENSORS
Industry demand has been lacking growth, increasing the competitiveness of industry making consistent sales difficult to achieve.
• Significant market contraction in 2020• Market demand has fluctuated widely• Strong growth expected in upcoming year
Traditional Low-End High-End$0
$15,000
0
750
1500
2250
Segment Sales Revenue
Units Sold
Year 4 Year 5 Year 6 Year 7 Year 890
95
100
105
110
115
120Growth Index
Traditional Low EndHigh EndExpected Growth
100
6
BUSINESS ENVIRONMENT
10%
%
5
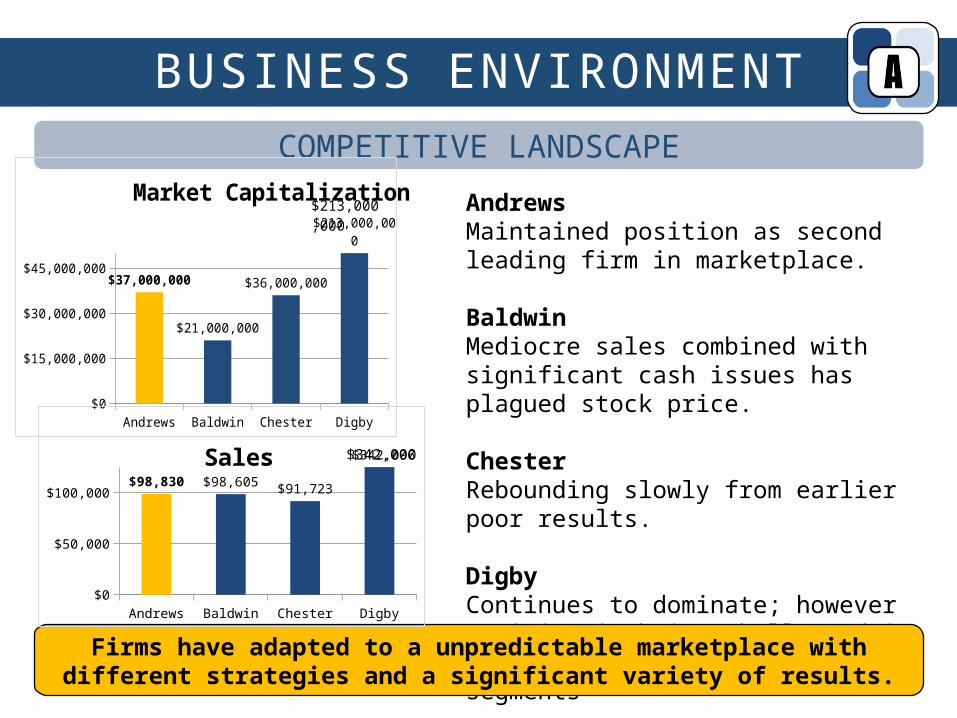
AndrewsMaintained position as second leading firm in marketplace.
BaldwinMediocre sales combined with significant cash issues has plagued stock price.
ChesterRebounding slowly from earlier poor results.
DigbyContinues to dominate; however position is being challenged in the Low, High, and Traditional segments
COMPETITIVE LANDSCAPE
Firms have adapted to a unpredictable marketplace with different strategies and a significant variety of results.
Andrews Baldwin Chester Digby$0
$15,000,000
$30,000,000
$45,000,000
$37,000,000
$21,000,000
$36,000,000
$213,000,000 Market Capitalization
$213,000,000
Andrews Baldwin Chester Digby$0
$50,000
$100,000 $98,830 $98,605 $91,723
$342,096 Sales $342,000
7
BUSINESS ENVIRONMENT
%
5
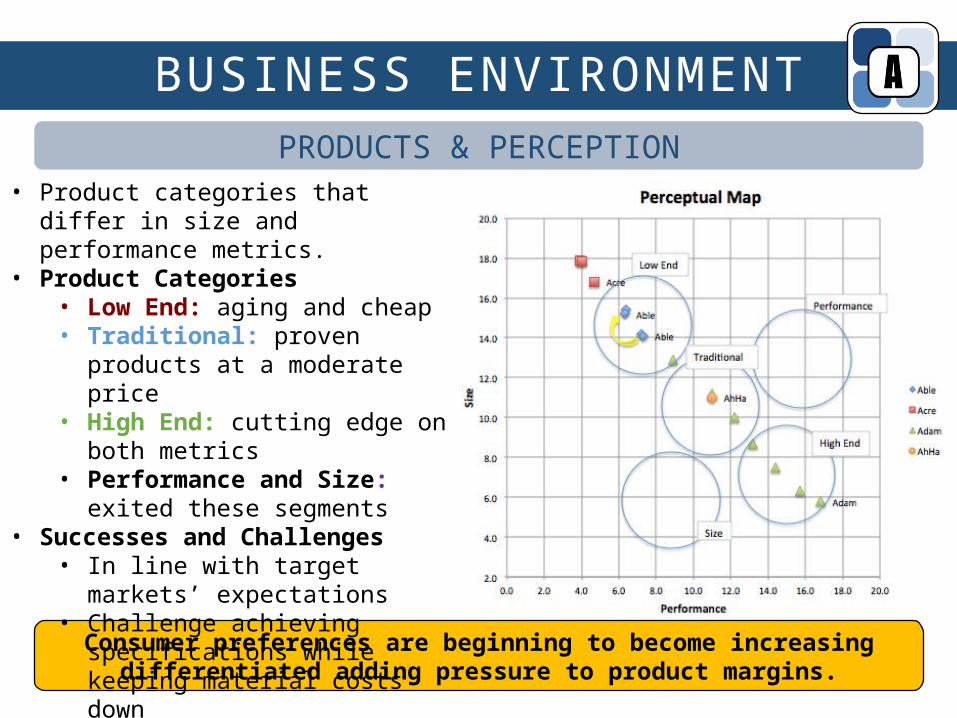
PRODUCTS & PERCEPTION
Consumer preferences are beginning to become increasing differentiated adding pressure to product margins.
• Product categories that differ in size and performance metrics.
• Product Categories• Low End: aging and cheap • Traditional: proven products at a
moderate price• High End: cutting edge on both
metrics• Performance and Size: exited these
segments• Successes and Challenges
• In line with target markets’ expectations
• Challenge achieving specifications while keeping material costs down
8
OPERATIONS
9
RESEARCH & DEVELOPMENT
5
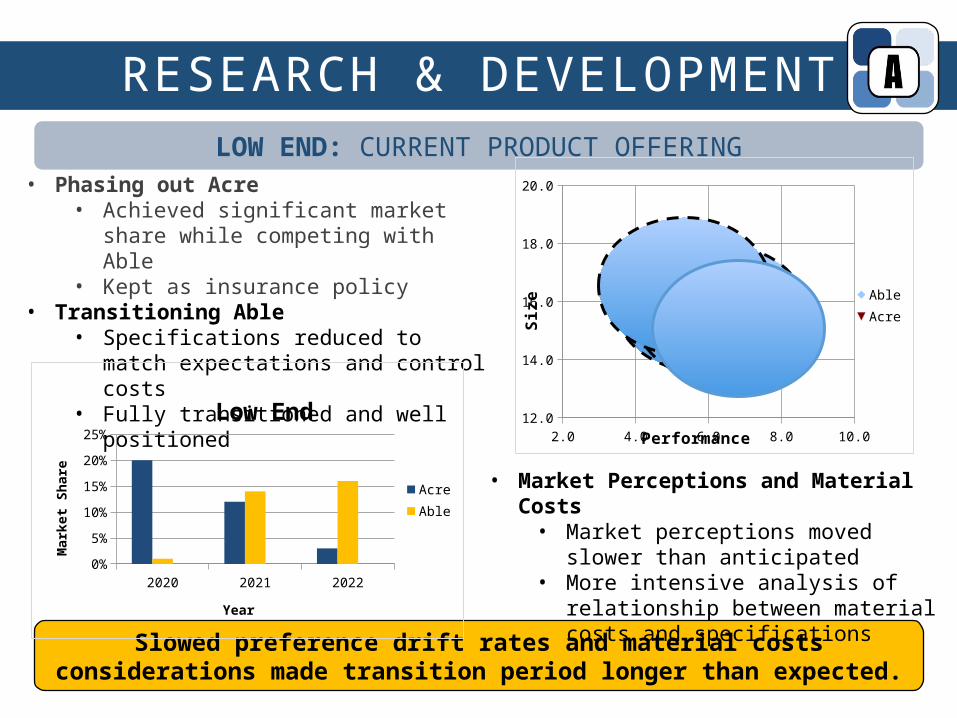
LOW END: CURRENT PRODUCT OFFERING• Phasing out Acre
• Achieved significant market share while competing with Able
• Kept as insurance policy• Transitioning Able
• Specifications reduced to match expectations and control costs
• Fully transitioned and well positioned
Slowed preference drift rates and material costs considerations made transition period longer than expected.
2.0 4.0 6.0 8.0 10.012.0
14.0
16.0
18.0
20.0
Acre
Able
Able
AbleAcre
Performance
Size
2020 2021 20220%
5%
10%
15%
20%
25%Low End
AcreAble
Year
Mar
ket S
hare • Market Perceptions and Material Costs
• Market perceptions moved slower than anticipated
• More intensive analysis of relationship between material costs and specifications
10
RESEARCH & DEVELOPMENT
5
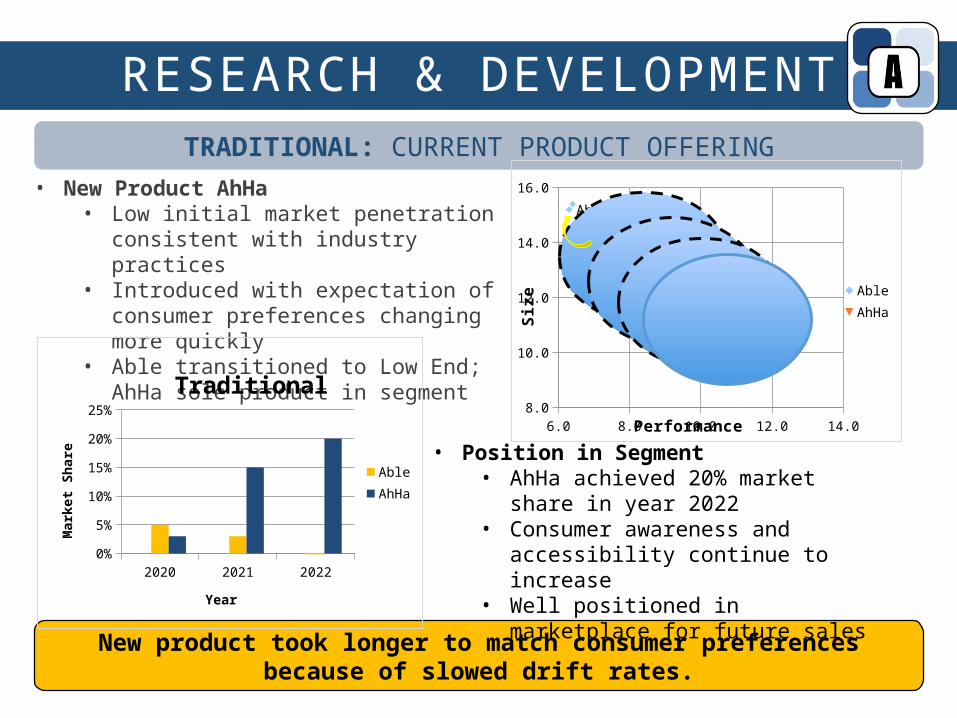
TRADITIONAL: CURRENT PRODUCT OFFERING• New Product AhHa
• Low initial market penetration consistent with industry practices
• Introduced with expectation of consumer preferences changing more quickly
• Able transitioned to Low End; AhHa sole product in segment
New product took longer to match consumer preferences because of slowed drift rates.
• Position in Segment• AhHa achieved 20% market share in year
2022• Consumer awareness and accessibility
continue to increase• Well positioned in marketplace for future
sales2020 2021 2022
0%
5%
10%
15%
20%
25%Traditional
AbleAhHa
Year
Mar
ket S
hare
6.0 8.0 10.0 12.0 14.08.0
10.0
12.0
14.0
16.0
AhHa
Able
Able
AbleAhHa
Performance
Size
11
MARKETING
%
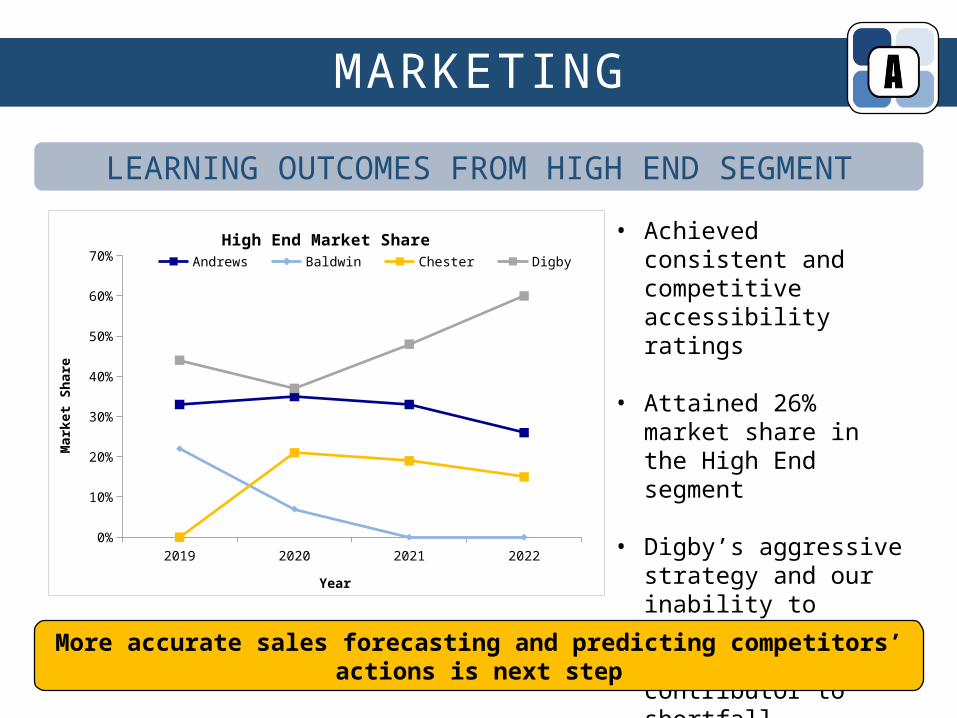
• Achieved consistent and competitive accessibility ratings
• Attained 26% market share in the High End segment
• Digby’s aggressive strategy and our inability to compete/predict was main contributor to shortfall
LEARNING OUTCOMES FROM HIGH END SEGMENT
More accurate sales forecasting and predicting competitors’ actions is next step
2019 2020 2021 20220%
10%
20%
30%
40%
50%
60%
70%High End Market Share
Andrews Baldwin Chester Digby
Year
Mar
ket
Sh
are
12
MARKETING
%
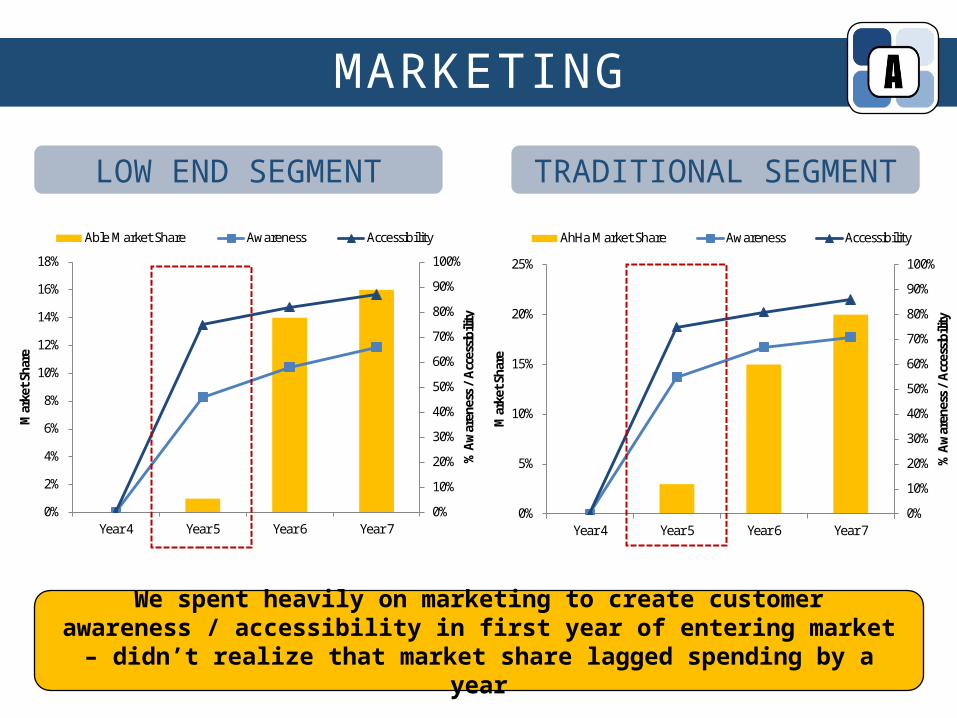
We spent heavily on marketing to create customer awareness / accessibility in first year of entering market – didn’t realize that market share lagged spending by a year
LOW END SEGMENT TRADITIONAL SEGMENT
0%
10%
20%
30%
40%
50%
60%
70%
80%
90%
100%
0%
2%
4%
6%
8%
10%
12%
14%
16%
18%
Year 4 Year 5 Year 6 Year 7
% A
war
enes
s /
Acce
ssib
ility
Mar
ket S
hare
Able Market Share Awareness Accessibility
0%
10%
20%
30%
40%
50%
60%
70%
80%
90%
100%
0%
5%
10%
15%
20%
25%
Year 4 Year 5 Year 6 Year 7
% A
war
enes
s /
Acce
ssib
ility
Mar
ket S
hare
AhHa Market Share Awareness Accessibility
13
PRODUCTION
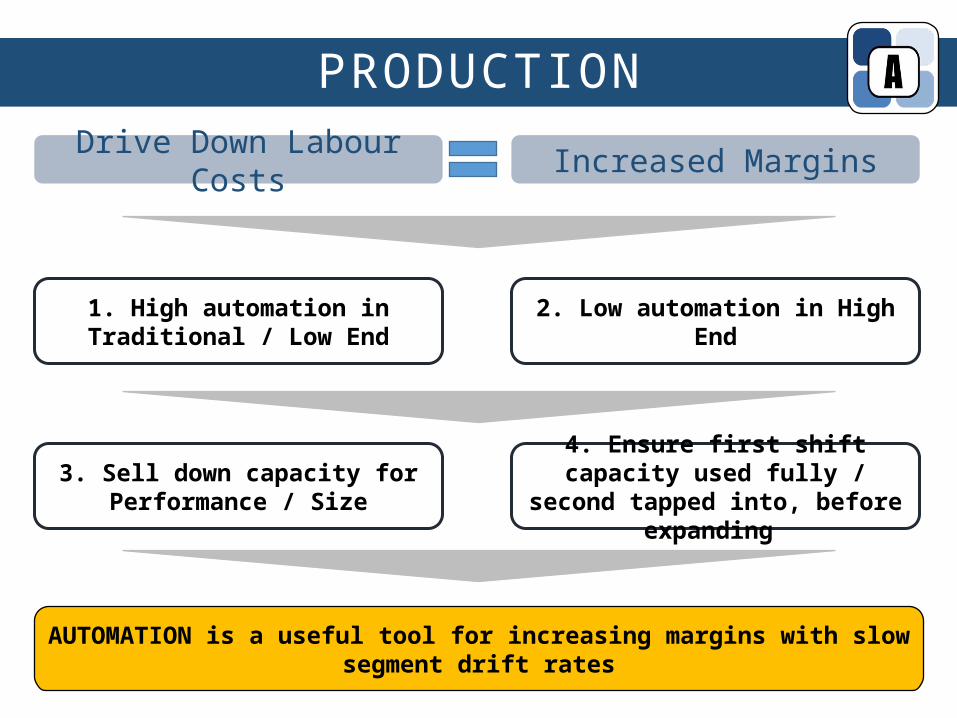
AUTOMATION is a useful tool for increasing margins with slow segment drift rates
2. Low automation in High End
Drive Down Labour Costs Increased Margins
1. High automation in Traditional / Low End
3. Sell down capacity for Performance / Size
4. Ensure first shift capacity used fully / second tapped into, before
expanding
14
PRODUCTION
10%
%
5
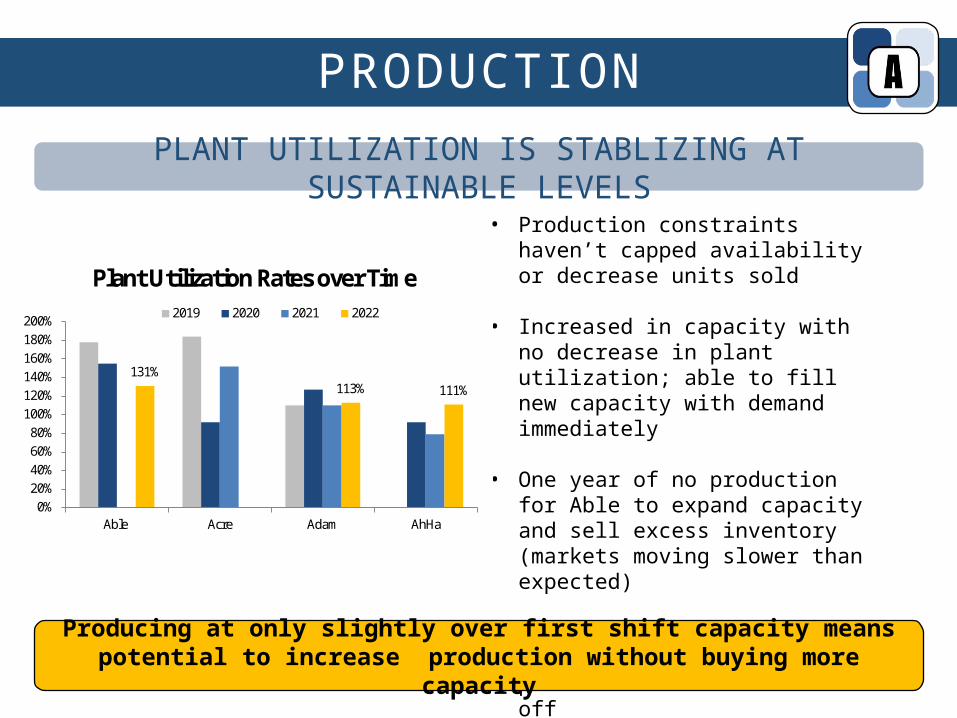
• Production constraints haven’t capped availability or decrease units sold
• Increased in capacity with no decrease in plant utilization; able to fill new capacity with demand immediately
• One year of no production for Able to expand capacity and sell excess inventory (markets moving slower than expected)
• Plant utilization back to 131% after Able adjustment; production for Low End took off
PLANT UTILIZATION IS STABLIZING AT SUSTAINABLE LEVELS
Producing at only slightly over first shift capacity means potential to increase production without buying more capacity
131%113% 111%
0%20%40%60%80%
100%120%140%160%180%200%
Able Acre Adam AhHa
Plant Utilization Rates over Time2019 2020 2021 2022
15
HUMAN RESOURCES
10%
%
5
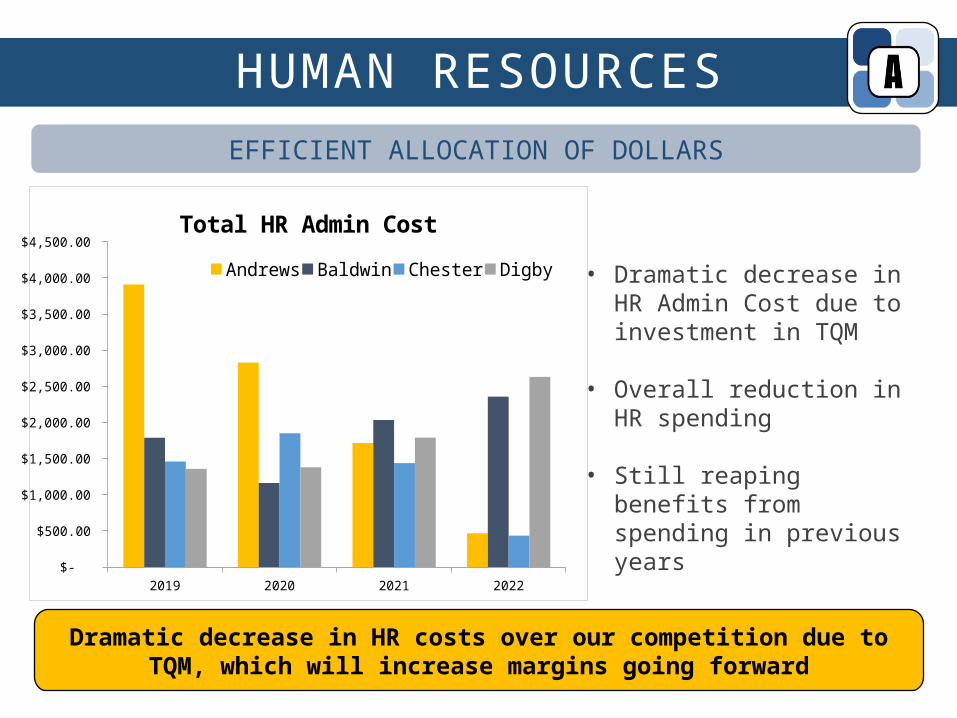
• Dramatic decrease in HR Admin Cost due to investment in TQM
• Overall reduction in HR spending
• Still reaping benefits from spending in previous years
EFFICIENT ALLOCATION OF DOLLARS
Dramatic decrease in HR costs over our competition due to TQM, which will increase margins going forward
2019 2020 2021 2022 $-
$500.00
$1,000.00
$1,500.00
$2,000.00
$2,500.00
$3,000.00
$3,500.00
$4,000.00
$4,500.00
Total HR Admin Cost
Andrews Baldwin Chester Digby
16
HUMAN RESOURCES
10%
%
5
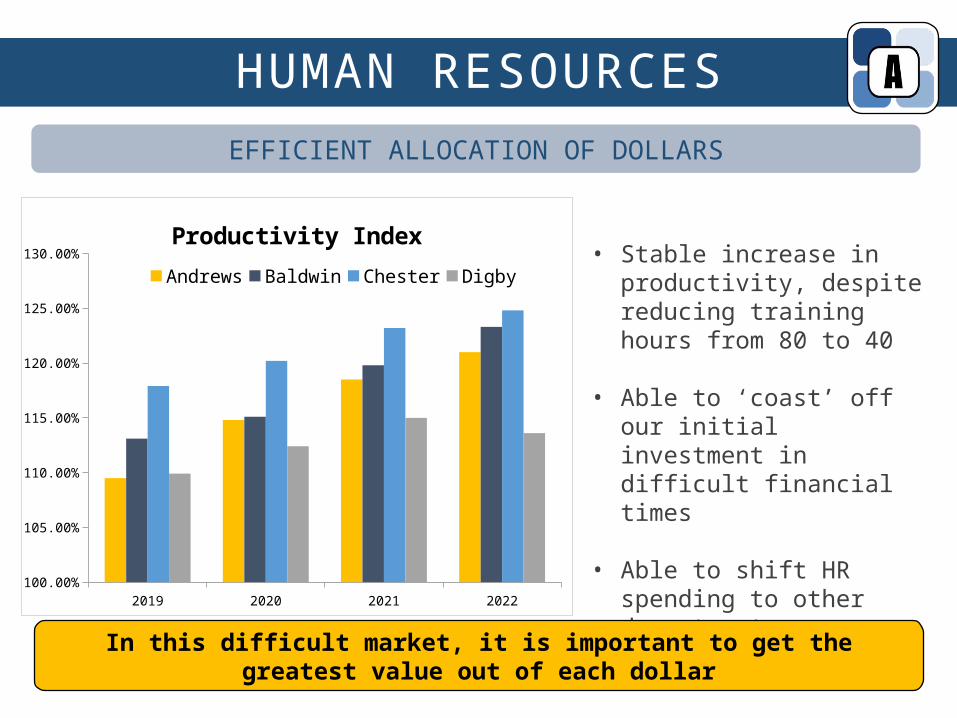
• Stable increase in productivity, despite reducing training hours from 80 to 40
• Able to ‘coast’ off our initial investment in difficult financial times
• Able to shift HR spending to other departments
EFFICIENT ALLOCATION OF DOLLARS
In this difficult market, it is important to get the greatest value out of each dollar
2019 2020 2021 2022100.00%
105.00%
110.00%
115.00%
120.00%
125.00%
130.00%
Productivity Index
Andrews Baldwin Chester Digby
17
FINANCE
10%
%
5
WORKING CAPITAL
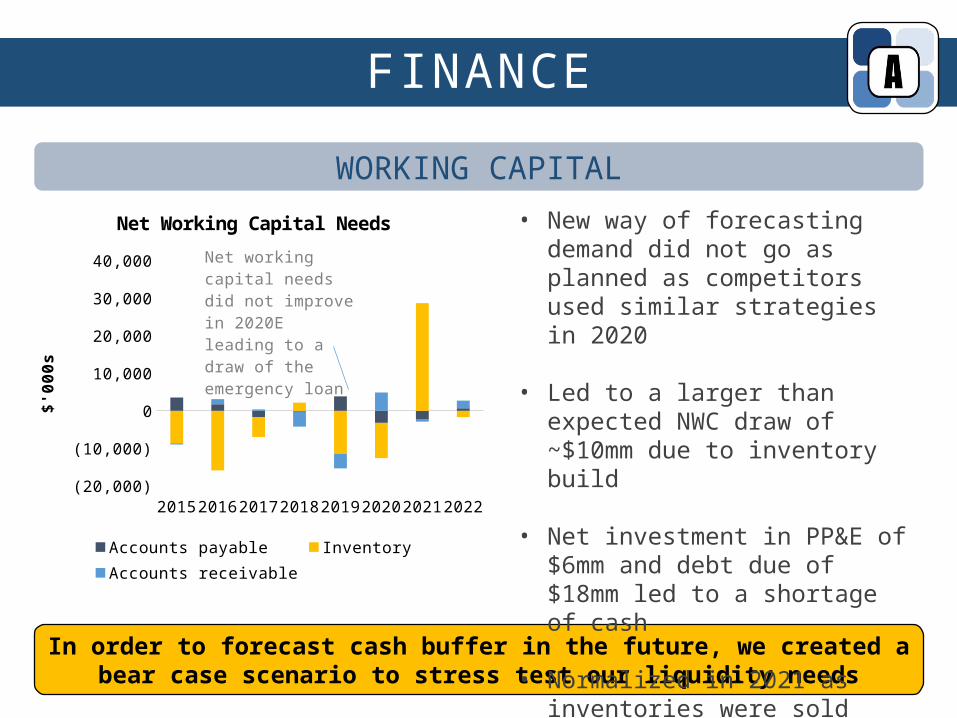
In order to forecast cash buffer in the future, we created a bear case scenario to stress test our liquidity needs
2015 2016 2017 2018 2019 2020 2021 2022(20,000)
(10,000)
0
10,000
20,000
30,000
40,000
Net Working Capital Needs
Accounts payable Inventory Accounts receivable
$'00
0s
Net working capital needs did not improve in 2020E leading to a draw of the emer-gency loan
• New way of forecasting demand did not go as planned as competitors used similar strategies in 2020
• Led to a larger than expected NWC draw of ~$10mm due to inventory build
• Net investment in PP&E of $6mm and debt due of $18mm led to a shortage of cash
• Normalized in 2021 as inventories were sold
18
FINANCE
10%
%
5
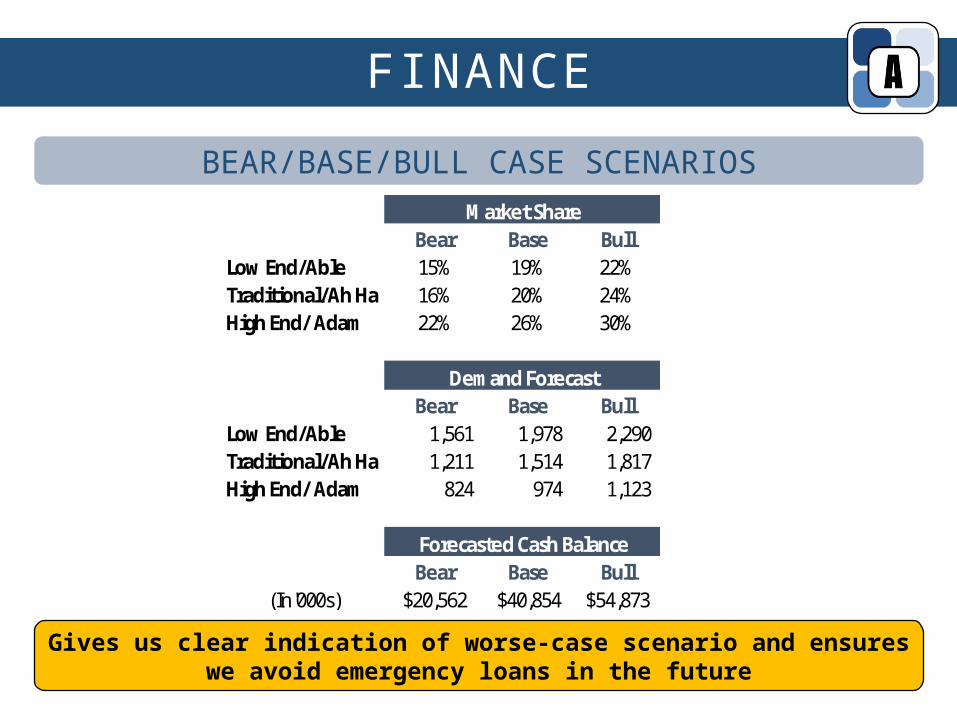
BEAR/BASE/BULL CASE SCENARIOS
Gives us clear indication of worse-case scenario and ensures we avoid emergency loans in the future
Market ShareBear Base Bull
Low End/Able 15% 19% 22%Traditional/Ah Ha 16% 20% 24%High End/ Adam 22% 26% 30%
Demand ForecastBear Base Bull
Low End/Able 1,561 1,978 2,290 Traditional/Ah Ha 1,211 1,514 1,817 High End/ Adam 824 974 1,123
Forecasted Cash BalanceBear Base Bull
(In'000s) $20,562 $40,854 $54,873
19
FINANCE
10%
%
5
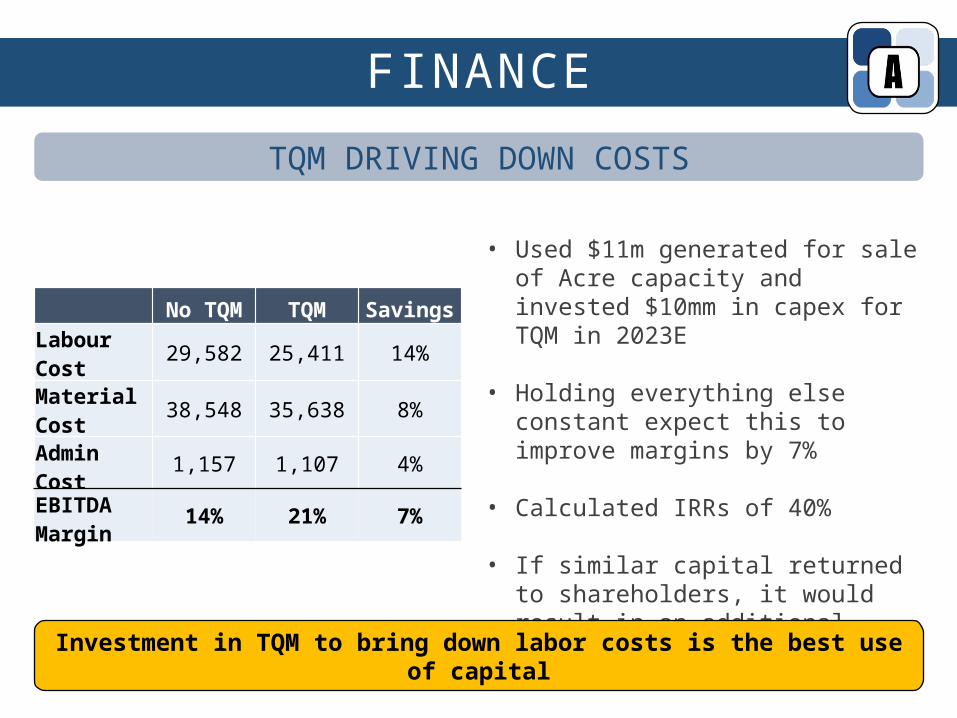
• Used $11m generated for sale of Acre capacity and invested $10mm in capex for TQM in 2023E
• Holding everything else constant expect this to improve margins by 7%
• Calculated IRRs of 40%
• If similar capital returned to shareholders, it would result in an additional upside of 27%
Investment in TQM to bring down labor costs is the best use of capital
TQM DRIVING DOWN COSTS
No TQM TQM Savings
Labour Cost 29,582 25,411 14%
Material Cost 38,548 35,638 8%
Admin Cost 1,157 1,107 4%
EBITDA Margin 14% 21% 7%
20
FINANCE
10%
%
5
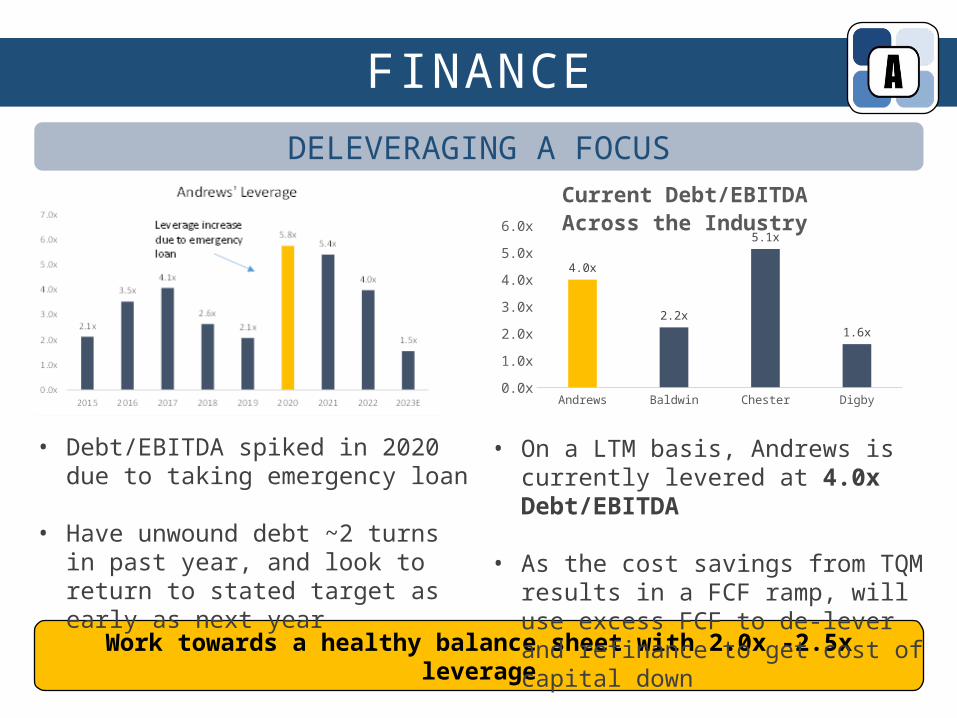
Work towards a healthy balance sheet with 2.0x -2.5x leverage
DELEVERAGING A FOCUS
Andrews Baldwin Chester Digby0.0x
1.0x
2.0x
3.0x
4.0x
5.0x
6.0x
4.0x
2.2x
5.1x
1.6x
Current Debt/EBITDA Across the Industry
• On a LTM basis, Andrews is currently levered at 4.0x Debt/EBITDA
• As the cost savings from TQM results in a FCF ramp, will use excess FCF to de-lever and refinance to get cost of capital down
• Debt/EBITDA spiked in 2020 due to taking emergency loan
• Have unwound debt ~2 turns in past year, and look to return to stated target as early as next year
21
PERFORMANCE
PERFORMANCE
22
10%
%
5
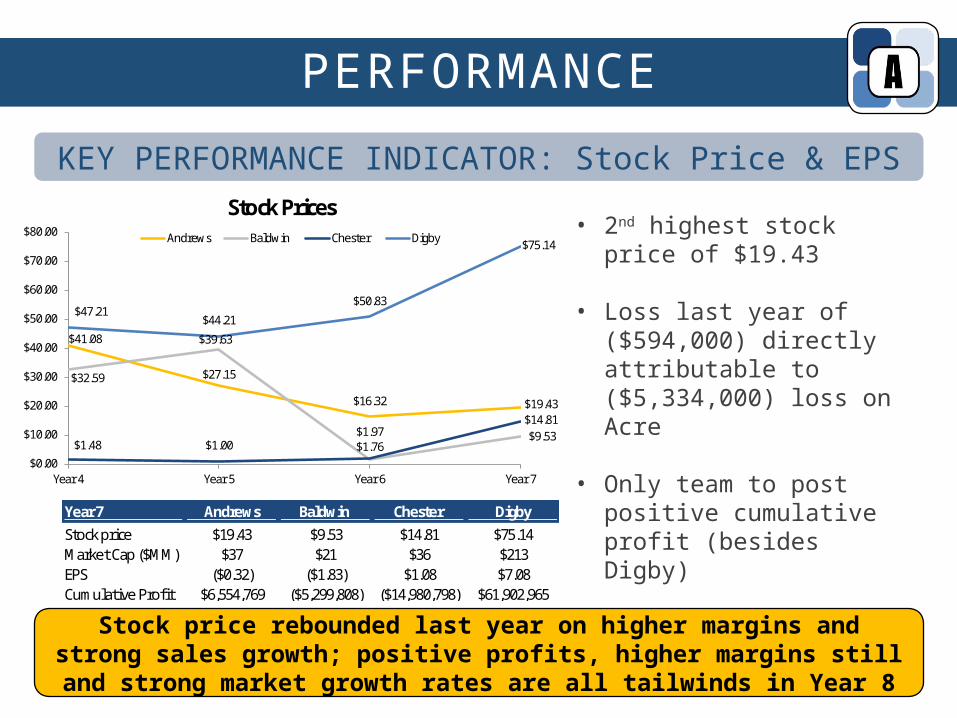
• 2nd highest stock price of $19.43
• Loss last year of ($594,000) directly attributable to ($5,334,000) loss on Acre
• Only team to post positive cumulative profit (besides Digby)
• Proforma normalized net profit of $7,199,000 in Year 8
Stock price rebounded last year on higher margins and strong sales growth; positive profits, higher margins still and strong market growth rates are all tailwinds in Year 8
KEY PERFORMANCE INDICATOR: Stock Price & EPS
$41.08
$27.15
$16.32 $19.43
$32.59
$39.63
$1.76$9.53
$1.48 $1.00$1.97
$14.81
$47.21$44.21
$50.83
$75.14
$0.00
$10.00
$20.00
$30.00
$40.00
$50.00
$60.00
$70.00
$80.00
Year 4 Year 5 Year 6 Year 7
Stock Prices Andrews Baldwin Chester Digby
Year 7 Andrews Baldwin Chester Digby
Stock price $19.43 $9.53 $14.81 $75.14Market Cap ($MM) $37 $21 $36 $213EPS ($0.32) ($1.83) $1.08 $7.08Cumulative Profit $6,554,769 ($5,299,808) ($14,980,798) $61,902,965
PERFORMANCE
23
10%
%
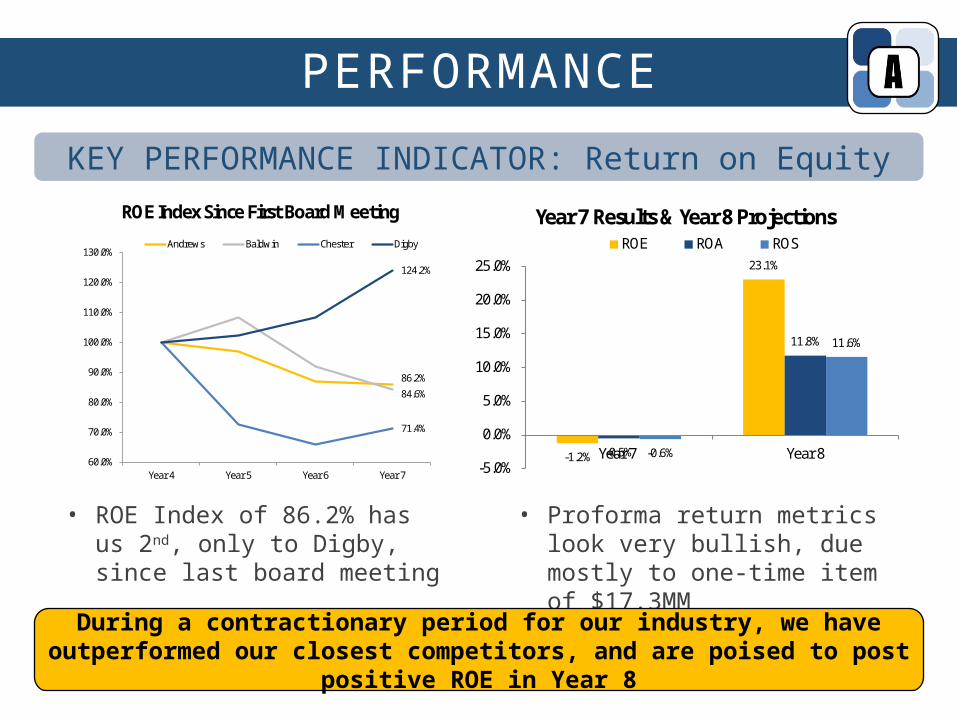
5 • Proforma return metrics look very bullish, due mostly to one-time item of $17.3MM
During a contractionary period for our industry, we have outperformed our closest competitors, and are poised to post positive ROE in Year 8
KEY PERFORMANCE INDICATOR: Return on Equity
86.2%
84.6%
71.4%
124.2%
60.0%
70.0%
80.0%
90.0%
100.0%
110.0%
120.0%
130.0%
Year 4 Year 5 Year 6 Year 7
ROE Index Since First Board Meeting
Andrews Baldwin Chester Digby
-1.2%
23.1%
-0.5%
11.8%
-0.6%
11.6%
-5.0%
0.0%
5.0%
10.0%
15.0%
20.0%
25.0%
Year 7 Year 8
Year 7 Results & Year 8 ProjectionsROE ROA ROS
• ROE Index of 86.2% has us 2nd, only to Digby, since last board meeting
PERFORMANCE
24
%
5
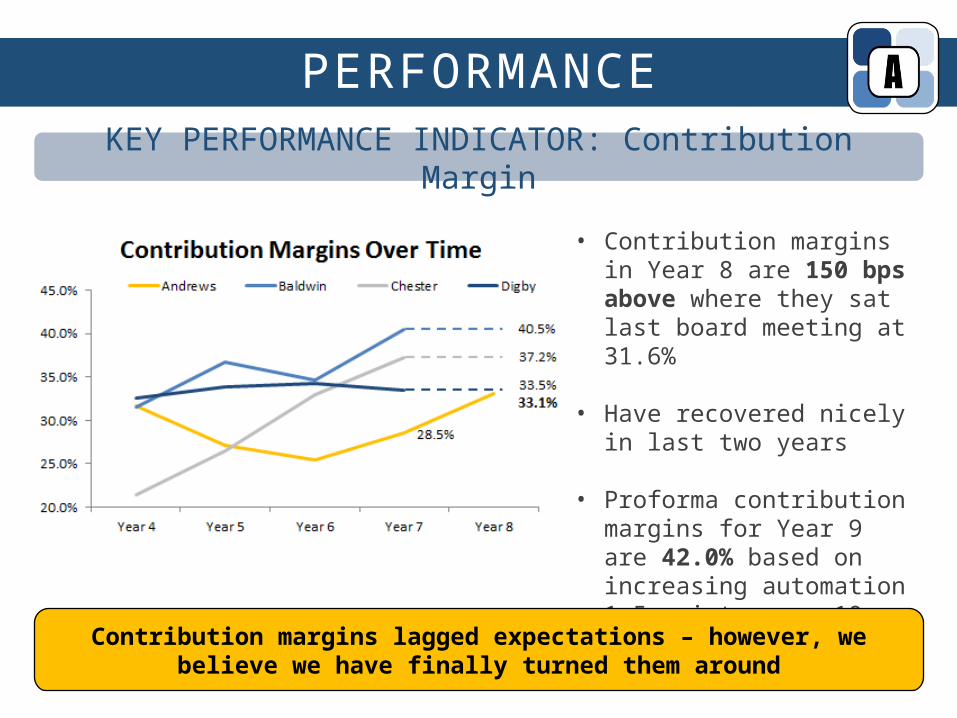
• Contribution margins in Year 8 are 150 bps above where they sat last board meeting at 31.6%
• Have recovered nicely in last two years
• Proforma contribution margins for Year 9 are 42.0% based on increasing automation 1.5 points on a 10-scale across all products
Contribution margins lagged expectations – however, we believe we have finally turned them around
KEY PERFORMANCE INDICATOR: Contribution Margin

25
LOOKING FORWARD
26
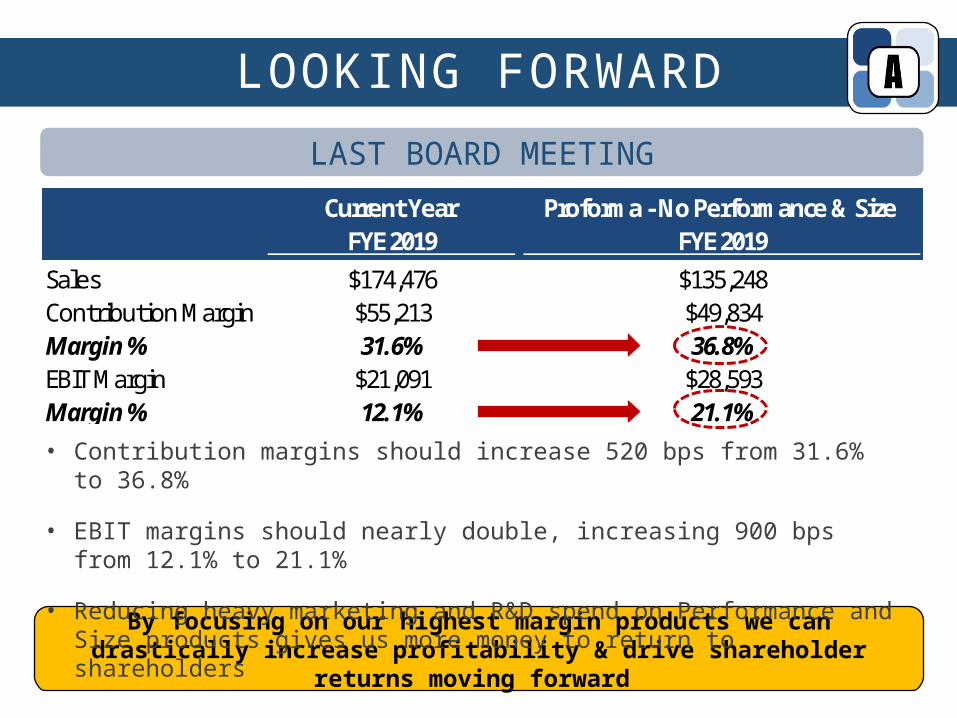
Current Year Proforma - No Performance & Size FYE 2019 FYE 2019
Sales $174,476 $135,248Contribution Margin $55,213 $49,834Margin % 31.6% 36.8%EBIT Margin $21,091 $28,593Margin % 12.1% 21.1%
LOOKING FORWARD
10%
5
By focusing on our highest margin products we can drastically increase profitability & drive shareholder returns moving forward
LAST BOARD MEETING
• Contribution margins should increase 520 bps from 31.6% to 36.8%
• EBIT margins should nearly double, increasing 900 bps from 12.1% to 21.1%
• Reducing heavy marketing and R&D spend on Performance and Size products gives us more money to return to shareholders
27
LOOKING FORWARD
10%
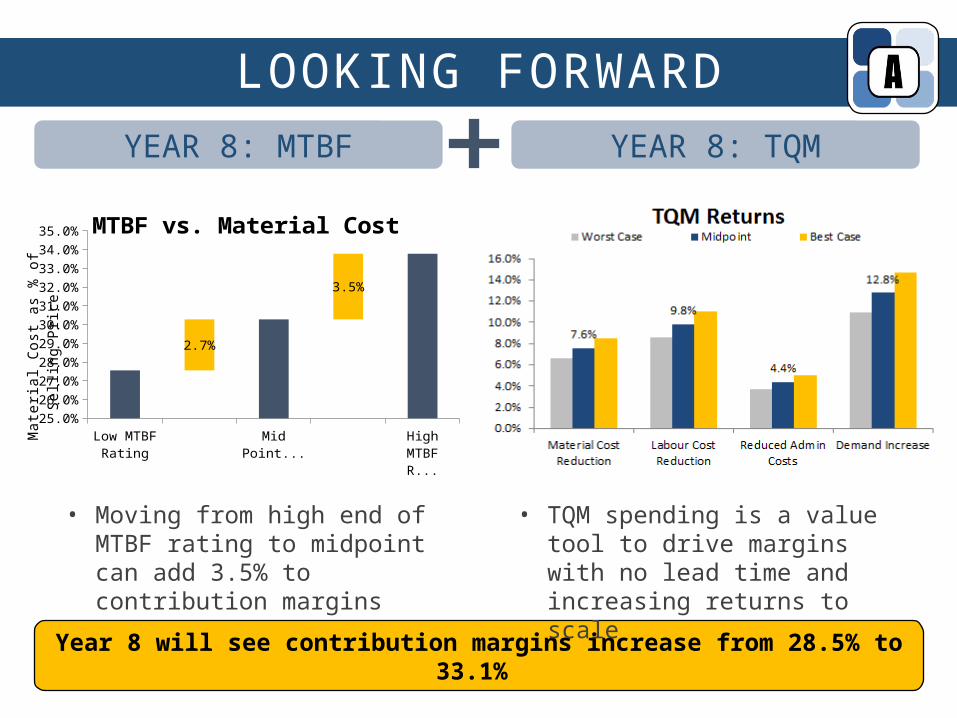
Year 8 will see contribution margins increase from 28.5% to 33.1%
YEAR 8: MTBF YEAR 8: TQM
• TQM spending is a value tool to drive margins with no lead time and increasing returns to scale
• Moving from high end of MTBF rating to midpoint can add 3.5% to contribution margins
Low MTBF Rating
Mid Point MTBF
High MTBF Rating
25.0%26.0%27.0%28.0%29.0%30.0%31.0%32.0%33.0%34.0%35.0%
2.7%
3.5%
MTBF vs. Material Cost
Mat
eria
l Cos
t as
% o
f Sel
ling
Pric
e
28
LOOKING FORWARD
10%
5
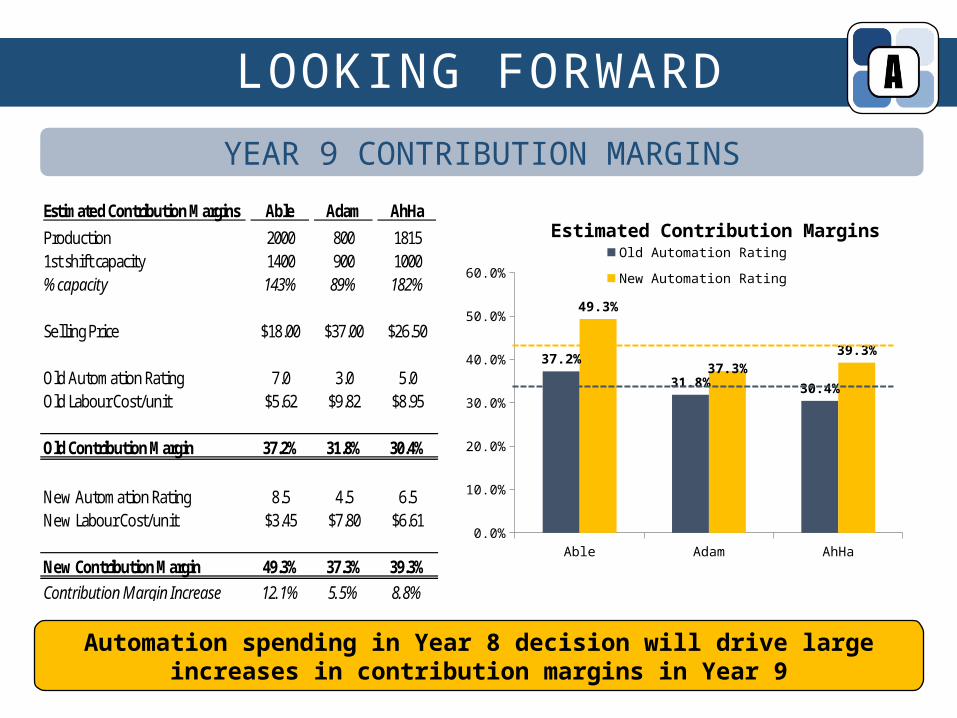
Automation spending in Year 8 decision will drive large increases in contribution margins in Year 9
YEAR 9 CONTRIBUTION MARGINS
Estimated Contribution Margins Able Adam AhHa
Production 2000 800 18151st shift capacity 1400 900 1000% capacity 143% 89% 182%
Selling Price $18.00 $37.00 $26.50
Old Automation Rating 7.0 3.0 5.0Old Labour Cost/unit $5.62 $9.82 $8.95
Old Contribution Margin 37.2% 31.8% 30.4%
New Automation Rating 8.5 4.5 6.5New Labour Cost/unit $3.45 $7.80 $6.61
New Contribution Margin 49.3% 37.3% 39.3%Contribution Margin Increase 12.1% 5.5% 8.8%
Able Adam AhHa0.0%
10.0%
20.0%
30.0%
40.0%
50.0%
60.0%
37.2%
31.8% 30.4%
49.3%
37.3%39.3%
Estimated Contribution Margins
Old Automation Rating New Automation Rating
29
SUMMARY
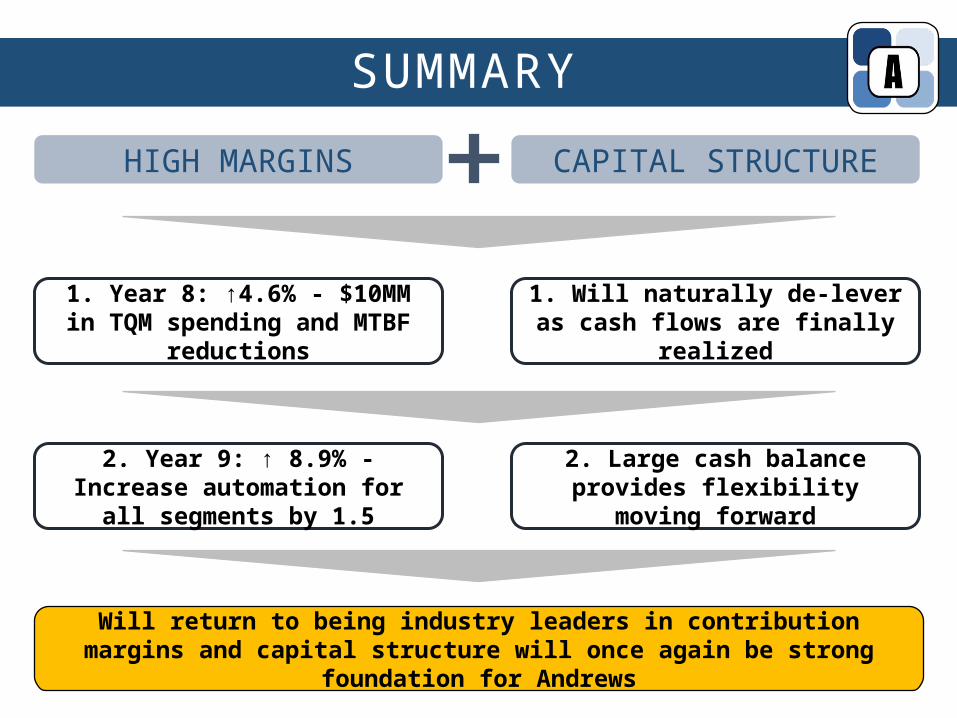
Will return to being industry leaders in contribution margins and capital structure will once again be strong foundation for Andrews
1. Will naturally de-lever as cash flows are finally realized
HIGH MARGINS CAPITAL STRUCTURE
1. Year 8: ↑4.6% - $10MM in TQM spending and MTBF reductions
2. Year 9: ↑ 8.9% - Increase automation for all segments by 1.5
2. Large cash balance provides flexibility moving forward
30
APPENDIX
31
APPENDIX
10%
%
5
BALANCE SHEET
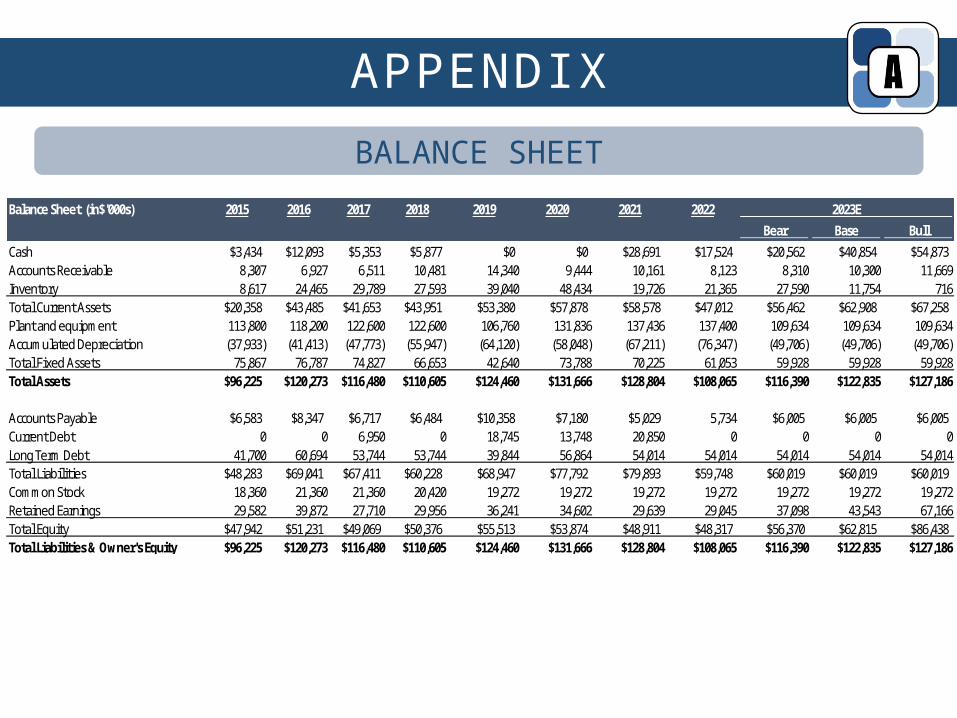
Balance Sheet (in$'000s) 2015 2016 2017 2018 2019 2020 2021 2022 2023E
Bear Base Bull
Cash $3,434 $12,093 $5,353 $5,877 $0 $0 $28,691 $17,524 $20,562 $40,854 $54,873Accounts Receivable 8,307 6,927 6,511 10,481 14,340 9,444 10,161 8,123 8,310 10,300 11,669Inventory 8,617 24,465 29,789 27,593 39,040 48,434 19,726 21,365 27,590 11,754 716Total Current Assets $20,358 $43,485 $41,653 $43,951 $53,380 $57,878 $58,578 $47,012 $56,462 $62,908 $67,258Plant and equipment 113,800 118,200 122,600 122,600 106,760 131,836 137,436 137,400 109,634 109,634 109,634Accumulated Depreciation (37,933) (41,413) (47,773) (55,947) (64,120) (58,048) (67,211) (76,347) (49,706) (49,706) (49,706)Total Fixed Assets 75,867 76,787 74,827 66,653 42,640 73,788 70,225 61,053 59,928 59,928 59,928Total Assets $96,225 $120,273 $116,480 $110,605 $124,460 $131,666 $128,804 $108,065 $116,390 $122,835 $127,186
Accounts Payable $6,583 $8,347 $6,717 $6,484 $10,358 $7,180 $5,029 5,734 $6,005 $6,005 $6,005Current Debt 0 0 6,950 0 18,745 13,748 20,850 0 0 0 0Long Term Debt 41,700 60,694 53,744 53,744 39,844 56,864 54,014 54,014 54,014 54,014 54,014Total Liabilities $48,283 $69,041 $67,411 $60,228 $68,947 $77,792 $79,893 $59,748 $60,019 $60,019 $60,019Common Stock 18,360 21,360 21,360 20,420 19,272 19,272 19,272 19,272 19,272 19,272 19,272Retained Earnings 29,582 39,872 27,710 29,956 36,241 34,602 29,639 29,045 37,098 43,543 67,166Total Equity $47,942 $51,231 $49,069 $50,376 $55,513 $53,874 $48,911 $48,317 $56,370 $62,815 $86,438Total Liabilities & Owner's Equity $96,225 $120,273 $116,480 $110,605 $124,460 $131,666 $128,804 $108,065 $116,390 $122,835 $127,186
32
APPENDIX
10%
%
5
INCOME STATEMENT
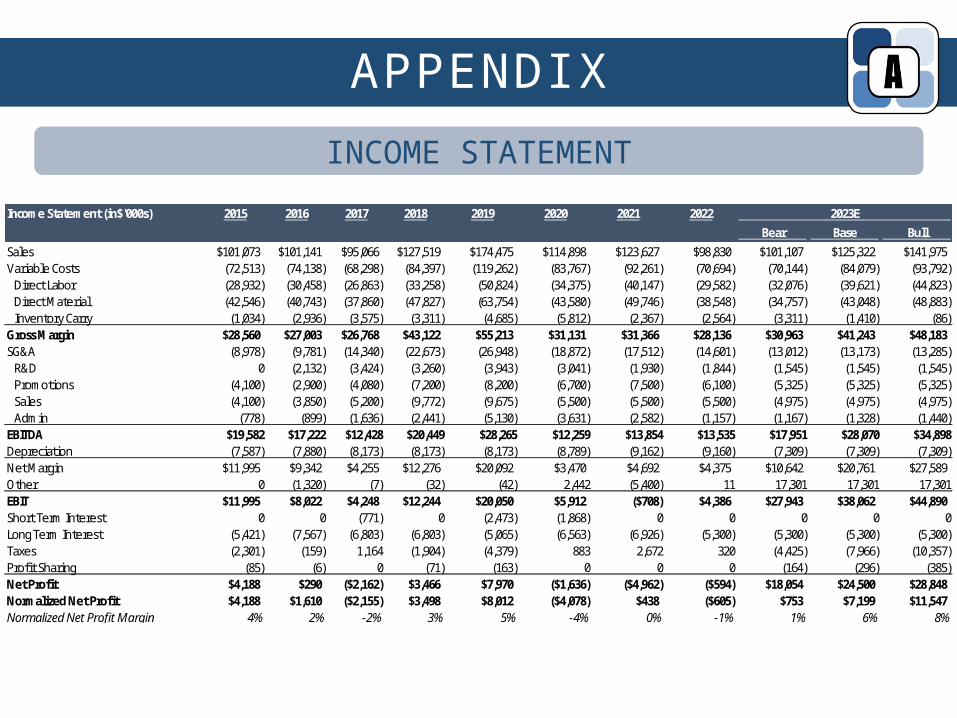
Income Statement (in$'000s) 2015 2016 2017 2018 2019 2020 2021 2022 2023E
Bear Base Bull
Sales $101,073 $101,141 $95,066 $127,519 $174,475 $114,898 $123,627 $98,830 $101,107 $125,322 $141,975Variable Costs (72,513) (74,138) (68,298) (84,397) (119,262) (83,767) (92,261) (70,694) (70,144) (84,079) (93,792)Direct Labor (28,932) (30,458) (26,863) (33,258) (50,824) (34,375) (40,147) (29,582) (32,076) (39,621) (44,823)Direct Material (42,546) (40,743) (37,860) (47,827) (63,754) (43,580) (49,746) (38,548) (34,757) (43,048) (48,883)Inventory Carry (1,034) (2,936) (3,575) (3,311) (4,685) (5,812) (2,367) (2,564) (3,311) (1,410) (86)
Gross Margin $28,560 $27,003 $26,768 $43,122 $55,213 $31,131 $31,366 $28,136 $30,963 $41,243 $48,183SG&A (8,978) (9,781) (14,340) (22,673) (26,948) (18,872) (17,512) (14,601) (13,012) (13,173) (13,285)R&D 0 (2,132) (3,424) (3,260) (3,943) (3,041) (1,930) (1,844) (1,545) (1,545) (1,545)Promotions (4,100) (2,900) (4,080) (7,200) (8,200) (6,700) (7,500) (6,100) (5,325) (5,325) (5,325)Sales (4,100) (3,850) (5,200) (9,772) (9,675) (5,500) (5,500) (5,500) (4,975) (4,975) (4,975)Admin (778) (899) (1,636) (2,441) (5,130) (3,631) (2,582) (1,157) (1,167) (1,328) (1,440)
EBITDA $19,582 $17,222 $12,428 $20,449 $28,265 $12,259 $13,854 $13,535 $17,951 $28,070 $34,898Depreciation (7,587) (7,880) (8,173) (8,173) (8,173) (8,789) (9,162) (9,160) (7,309) (7,309) (7,309)Net Margin $11,995 $9,342 $4,255 $12,276 $20,092 $3,470 $4,692 $4,375 $10,642 $20,761 $27,589Other 0 (1,320) (7) (32) (42) 2,442 (5,400) 11 17,301 17,301 17,301EBIT $11,995 $8,022 $4,248 $12,244 $20,050 $5,912 ($708) $4,386 $27,943 $38,062 $44,890Short Term Interest 0 0 (771) 0 (2,473) (1,868) 0 0 0 0 0Long Term Interest (5,421) (7,567) (6,803) (6,803) (5,065) (6,563) (6,926) (5,300) (5,300) (5,300) (5,300)Taxes (2,301) (159) 1,164 (1,904) (4,379) 883 2,672 320 (4,425) (7,966) (10,357)Profit Sharing (85) (6) 0 (71) (163) 0 0 0 (164) (296) (385)Net Profit $4,188 $290 ($2,162) $3,466 $7,970 ($1,636) ($4,962) ($594) $18,054 $24,500 $28,848Normalized Net Profit $4,188 $1,610 ($2,155) $3,498 $8,012 ($4,078) $438 ($605) $753 $7,199 $11,547Normalized Net Profit Margin 4% 2% -2% 3% 5% -4% 0% -1% 1% 6% 8%
33
APPENDIX
10%
%
5
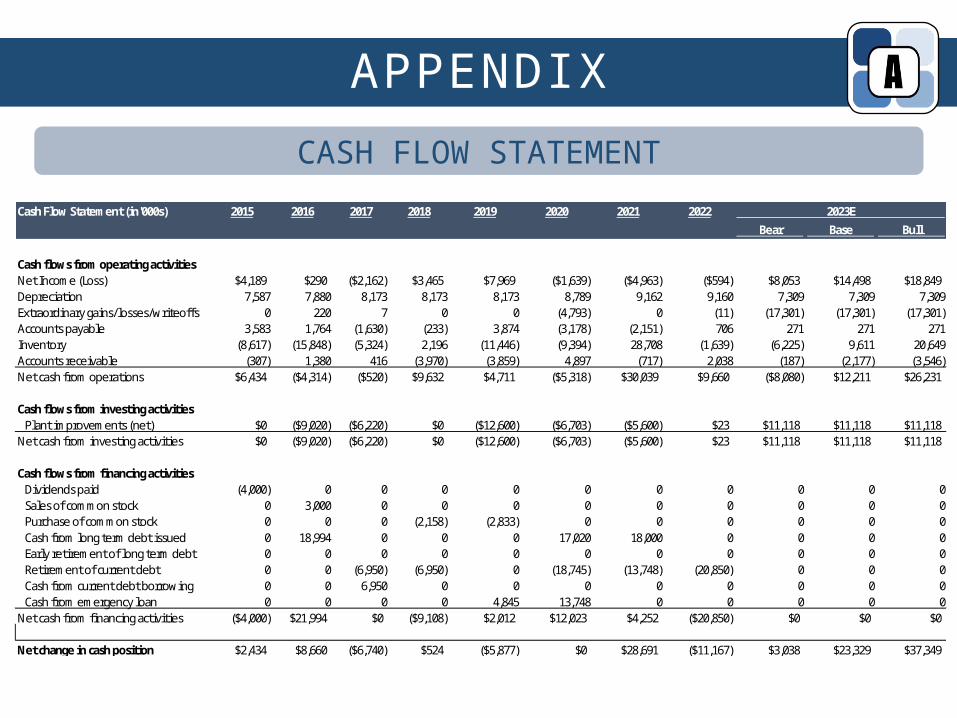
CASH FLOW STATEMENT
Cash Flow Statement (in'000s) 2015 2016 2017 2018 2019 2020 2021 2022 2023E
Bear Base Bull
Cash flows from operating activitiesNet Income (Loss) $4,189 $290 ($2,162) $3,465 $7,969 ($1,639) ($4,963) ($594) $8,053 $14,498 $18,849Depreciation 7,587 7,880 8,173 8,173 8,173 8,789 9,162 9,160 7,309 7,309 7,309Extraordinary gains/losses/writeoffs 0 220 7 0 0 (4,793) 0 (11) (17,301) (17,301) (17,301)Accounts payable 3,583 1,764 (1,630) (233) 3,874 (3,178) (2,151) 706 271 271 271Inventory (8,617) (15,848) (5,324) 2,196 (11,446) (9,394) 28,708 (1,639) (6,225) 9,611 20,649Accounts receivable (307) 1,380 416 (3,970) (3,859) 4,897 (717) 2,038 (187) (2,177) (3,546)Net cash from operations $6,434 ($4,314) ($520) $9,632 $4,711 ($5,318) $30,039 $9,660 ($8,080) $12,211 $26,231
Cash flows from investing activitiesPlant improvements (net) $0 ($9,020) ($6,220) $0 ($12,600) ($6,703) ($5,600) $23 $11,118 $11,118 $11,118
Net cash from investing activities $0 ($9,020) ($6,220) $0 ($12,600) ($6,703) ($5,600) $23 $11,118 $11,118 $11,118
Cash flows from financing activitiesDividends paid (4,000) 0 0 0 0 0 0 0 0 0 0Sales of common stock 0 3,000 0 0 0 0 0 0 0 0 0Purchase of common stock 0 0 0 (2,158) (2,833) 0 0 0 0 0 0Cash from long term debt issued 0 18,994 0 0 0 17,020 18,000 0 0 0 0Early retirement of long term debt 0 0 0 0 0 0 0 0 0 0 0Retirement of current debt 0 0 (6,950) (6,950) 0 (18,745) (13,748) (20,850) 0 0 0Cash from current debt borrowing 0 0 6,950 0 0 0 0 0 0 0 0Cash from emergency loan 0 0 0 0 4,845 13,748 0 0 0 0 0
Net cash from financing activities ($4,000) $21,994 $0 ($9,108) $2,012 $12,023 $4,252 ($20,850) $0 $0 $0
Net change in cash position $2,434 $8,660 ($6,740) $524 ($5,877) $0 $28,691 ($11,167) $3,038 $23,329 $37,349
34
APPENDIX
10%
%
5
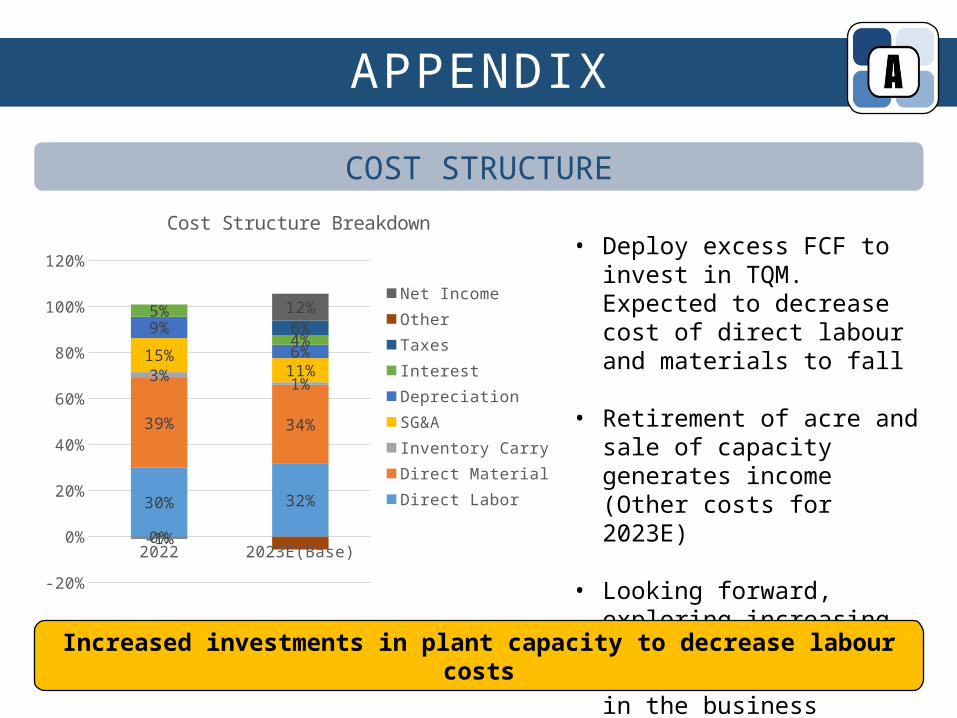
• Deploy excess FCF to invest in TQM. Expected to decrease cost of direct labour and materials to fall
• Retirement of acre and sale of capacity generates income (Other costs for 2023E)
• Looking forward, exploring increasing margins through further reinvestment in the business
COST STRUCTURE
Increased investments in plant capacity to decrease labour costs
2022 2023E(Base)
-20%
0%
20%
40%
60%
80%
100%
120%
30% 32%
39% 34%
3% 1%
15%11%
9%
6%
5%
4%
0%
6%
-1%
12%
Cost Structure Breakdown
Net IncomeOtherTaxesInterestDepreciationSG&AInventory CarryDirect MaterialDirect Labor
35
APPENDIX
10%
%
5
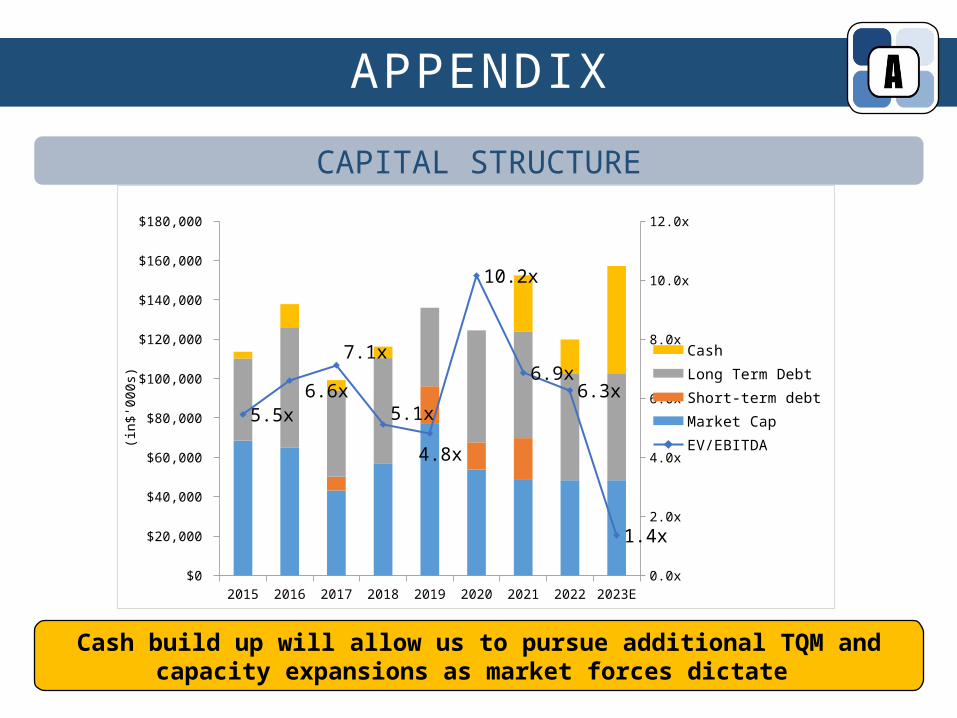
CAPITAL STRUCTURE
2015 2016 2017 2018 2019 2020 2021 2022 2023E$0
$20,000
$40,000
$60,000
$80,000
$100,000
$120,000
$140,000
$160,000
$180,000
0.0x
2.0x
4.0x
6.0x
8.0x
10.0x
12.0x
5.5x6.6x
7.1x
5.1x
4.8x
10.2x
6.9x6.3x
1.4x
CashLong Term DebtShort-term debtMarket CapEV/EBITDA(in
$'00
0s)
Cash build up will allow us to pursue additional TQM and capacity expansions as market forces dictate
36
APPENDIX
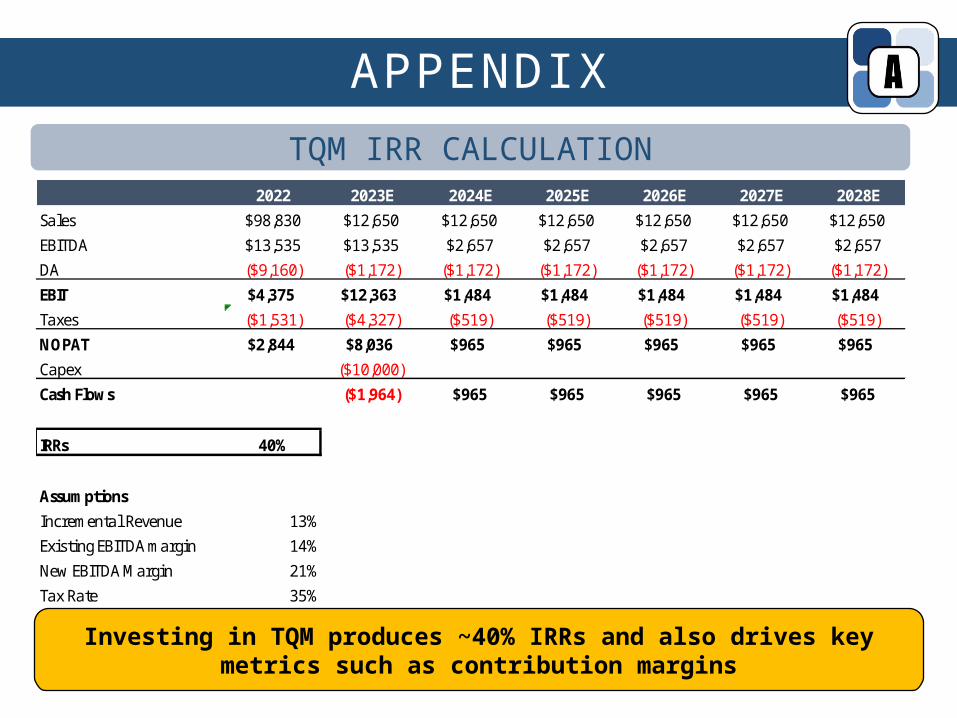
TQM IRR CALCULATION
Investing in TQM produces ~40% IRRs and also drives key metrics such as contribution margins
2022 2023E 2024E 2025E 2026E 2027E 2028E
Sales $98,830 $12,650 $12,650 $12,650 $12,650 $12,650 $12,650
EBITDA $13,535 $13,535 $2,657 $2,657 $2,657 $2,657 $2,657
DA ($9,160) ($1,172) ($1,172) ($1,172) ($1,172) ($1,172) ($1,172)
EBIT $4,375 $12,363 $1,484 $1,484 $1,484 $1,484 $1,484
Taxes ($1,531) ($4,327) ($519) ($519) ($519) ($519) ($519)
NOPAT $2,844 $8,036 $965 $965 $965 $965 $965
Capex ($10,000)
Cash Flows ($1,964) $965 $965 $965 $965 $965
IRRs 40%
Assumptions
Incremental Revenue 13%
Existing EBITDA margin 14%
New EBITDA Margin 21%
Tax Rate 35%
37
APPENDIX
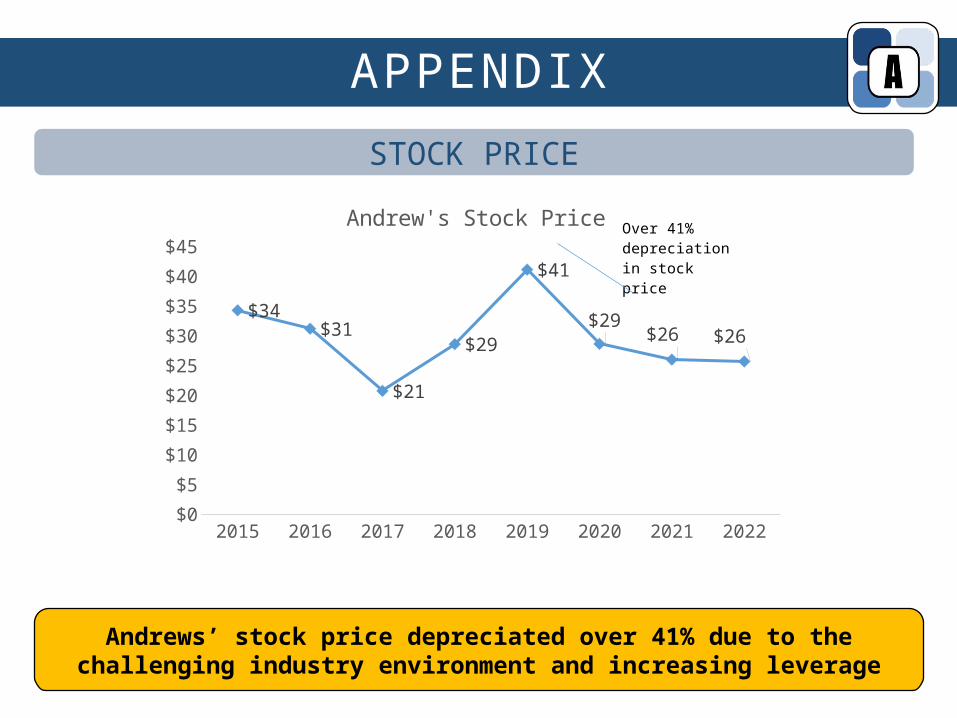
STOCK PRICE
Andrews’ stock price depreciated over 41% due to the challenging industry environment and increasing leverage
2015 2016 2017 2018 2019 2020 2021 2022$0
$5
$10
$15
$20
$25
$30
$35
$40
$45
$34$31
$21
$29
$41
$29$26 $26
Andrew's Stock PriceOver 41% depreci-ation in stock price
38
APPENDIX
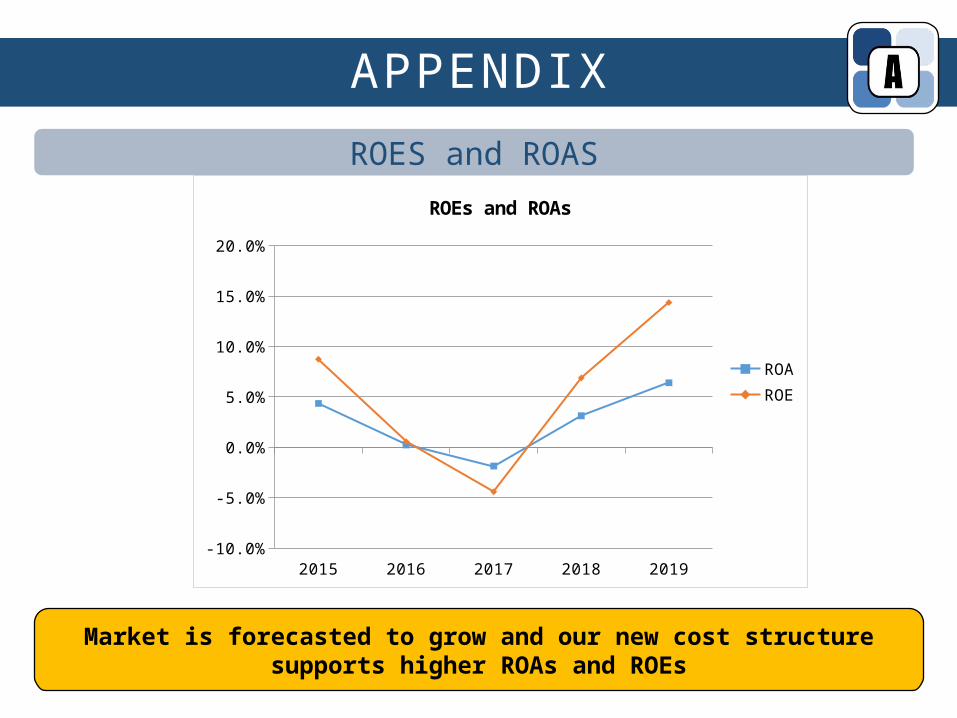
ROES and ROAS
Market is forecasted to grow and our new cost structure supports higher ROAs and ROEs
2015 2016 2017 2018 2019-10.0%
-5.0%
0.0%
5.0%
10.0%
15.0%
20.0%
ROEs and ROAs
ROAROE