Embed Size (px)
Citation preview
BIS central bankers’ speeches 1
Andrew G Haldane: The big fish small pond problem
Speech by Mr Andrew G Haldane, Executive Director, Financial Stability, of the Bank of England, at the Institute for New Economic Thinking Annual Conference, Bretton Woods, New Hampshire, 9 April 2011.
* * *
The views are not necessarily those of the Bank of England or the interim Financial Policy Committee. I am grateful to Shekhar Aiyar, Shaheen Bhikhu, Martin Brooke, Damien Charles, Spencer Dale, Andrew Hauser, Robert Hills, Glenn Hoggarth, John Hooley, Marius Jurgilas, Priya Kothari, Salina Ladha, Lara Lambert, Chris Peacock, Jonathan Rand, Maureen Snow, William Speller, Jo Spencer, Iain de Weymarn and Peter Zimmerman for comments and contributions.
1. Introduction
Global capital markets are engaged in a footrace. On the one foot, capital markets in emerging market countries are widening and deepening in order to improve domestic capital intermediation. On the other, international investors in developed countries are diversifying their portfolios in order to boost returns and spread risk. Both are typically seen as essential ingredients of global financial liberalisation and integration. Yet their implications for global financial stability are potentially quite different. The first determines the absorptive capacity of high-return, capital-recipient countries. The second defines the distributive capacity of low-return, capital-providing countries. Any imbalance between the rate at which international capital is distributed and absorbed may spillover to global capital markets. Reducing these spillovers may require a rethink of the rules of the international financial system.
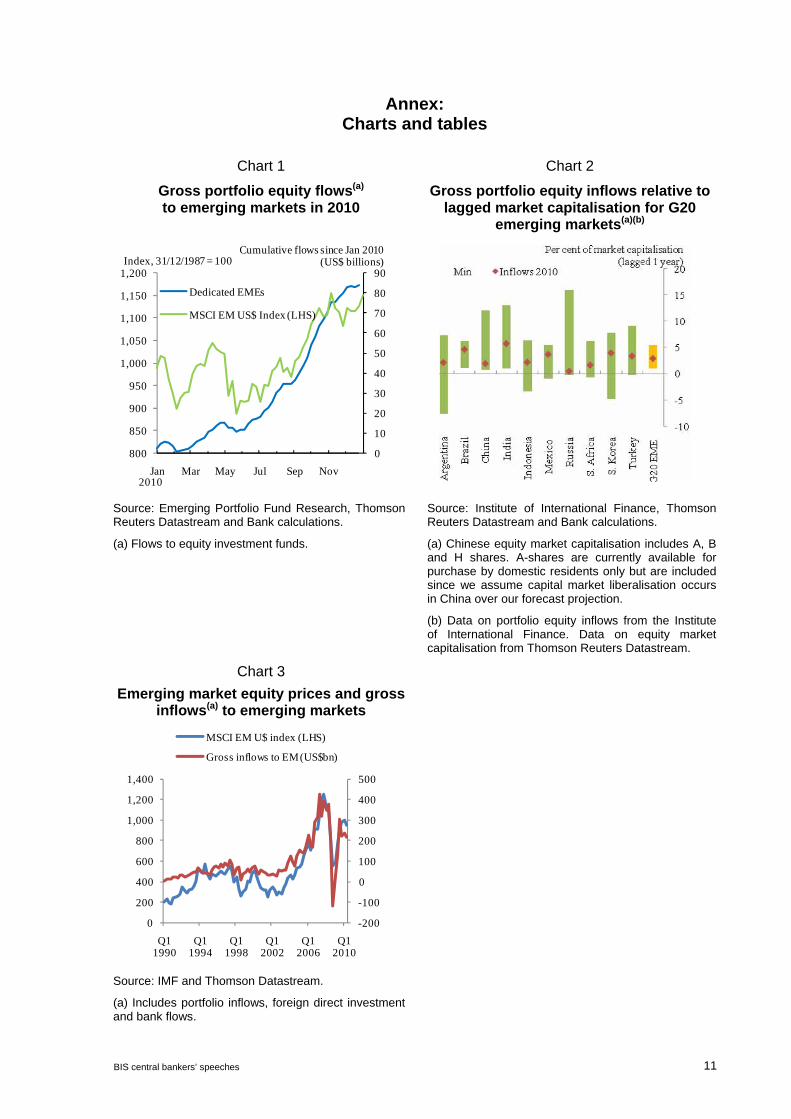
Experience during 2010 provides a good illustration. Gross portfolio equity inflows to emerging markets surged as investors substituted out of low growth developed markets (Chart 1). Gross equity inflows to certain emerging markets were large relative to domestic market capitalisation (Chart 2). The resulting indigestion problem caused bubbly behaviour in emerging asset markets. In response, a number of countries have thrown grit in the wheels of finance through macro-prudential measures or capital flow restrictions.
These surges in foreign capital flows, and associated asset market spillovers, are far from new. Through this century, a new wave of inflows to emerging markets has been building. Although halted temporarily by the financial crisis, its effect has been to buoy emerging asset prices (Chart 3). Earlier centuries have seen many similar episodes of capital flow surges into emerging markets, from the South Sea bubble in 1720 to the East Asian crisis of the 1990s (Reinhart and Rogoff (2008)).
Historically, as these waves have broken they have often caused quite a splash, with sharp capital and asset price reversals (IMF (2011)). Some commentators have called those capital reversals “sudden stops” (Dornbusch, Goldfajn and Valdés (1995)). But the underlying problem may be as much the start as the stop. The seeds of emerging market crises are sown in the build-up phase, as inflows dwarf the absorptive capacity of recipient countries’ capital markets.
Capturing that dynamic requires a different metaphor – the “Big Fish Small Pond” (BFSP) problem. The Big Fish here are the large capital-exporting, advanced countries. The Small Ponds are the relatively modest financial markets of capital-importing emerging countries. Past experience suggests that as big fish enter the small pond, this can cause ripples right across the international monetary system, never more so than in today’s financially inter-connected world.
This paper considers the BFSP problem. It plots the evolution of the international financial network over the past quarter-century. And, within that, it assesses recent shifts in portfolio
2 BIS central bankers’ speeches
choice by international investors which may have accentuated today’s BFSP problem (Section 2). More speculatively, it then considers potential future trends in portfolio choice and assesses their implications for tomorrow’s BFSP problem (Section 3).
If recent trends are continued, the BFSP problem may become more acute over time. In the race between capital market deepening in emerging markets and capital diversification in advanced economies, the latter may gain the upper hand (or foot). The BFSP problem during 2010 may have been the thin end of a sizable wedge. That, in turn, may intensify the debate on appropriate policy responses, such as the pace of capital liberalisation and the case for capital restrictions (Section 4).
2. Today’s BFSP problem
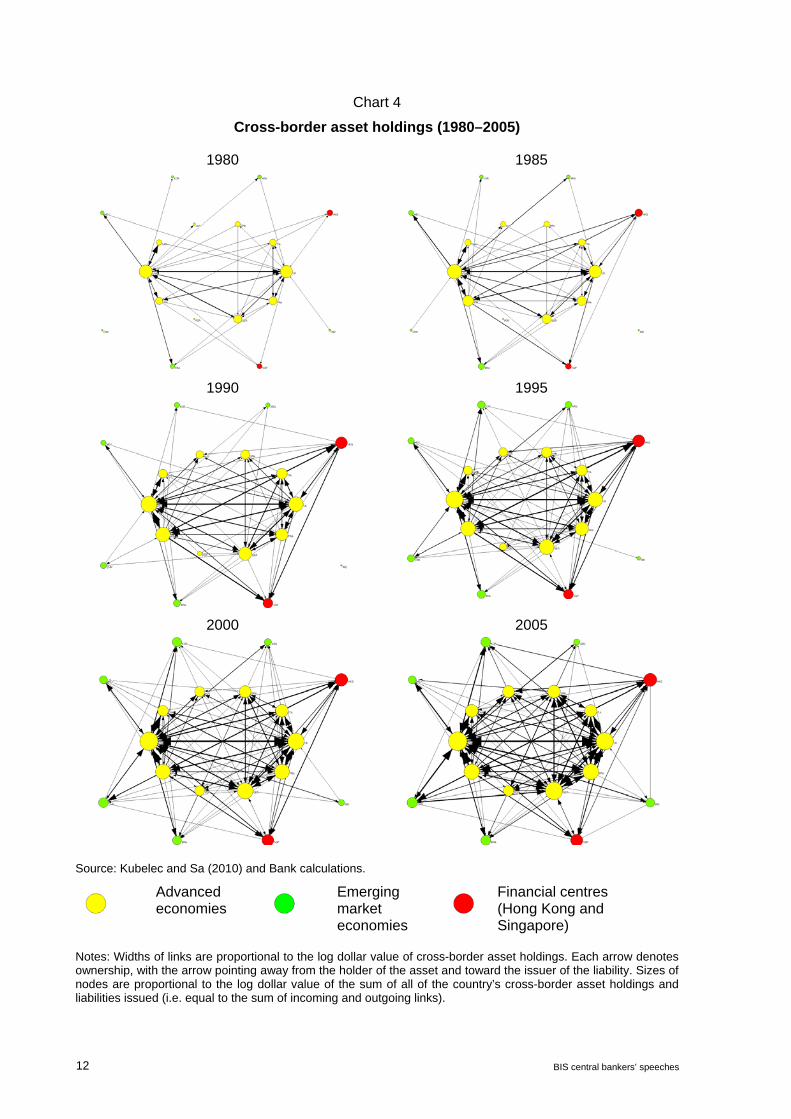
A useful panorama on financial globalisation is provided by mapping the evolution of the global financial network over time. The topology of this network provides a simple, graphical visualisation of liberalisation patterns. In particular, network graphics can be used to visualise “node size” – as a measure of the capital-absorptive capacity of emerging markets – the Small Pond; and “link scale” – as a measure of the capital distribution of advanced economies – the Big Fish.
As a first cut, we use a dataset developed at the Bank of England on stocks of cross-border capital, spanning 18 advanced and emerging economies (Kubelec and Sa (2010)).1 This enables us to track the growth in, and financial linkages between, countries over time. Chart 4 plots this international network map at five-year intervals from 1980 to 2005. The node size for each country is measured as the absolute sum of its external assets and liabilities, while the width of the links between nodes measures bilateral gross external assets. Both are in (log) dollar terms.
Taken over the past quarter-century as a whole, there is significant evidence of both capital market deepening (increased node size) and integration (increased link size). On average, total stocks of external assets have increased seventeen-fold over this period, rising from around $1.5 trillion in 1980 to $26 trillion by 2005. Relative to these countries’ GDP, they have risen from 18% in 1980 to over 70% by 2005. This is consistent with a period of intense financial globalisation.
Yet, despite this, the balance of global financial power has not altered markedly. The financial core countries at the beginning of the period (such as the US and UK) remain core at the end; the offshore financial centres (Hong Kong and Singapore) remain significant throughout; while emerging markets remain, in the main, on the financial periphery.
To illustrate that, the share of intra-advanced country external asset stocks in the global total was 77% in 1980. By 2005, that fraction had actually risen slightly to around 80%. Over the same period, the contribution of advanced to emerging market external asset stocks in the total fell from 13% to 5%, at the same time as the GDP share of emerging markets rose from 13% to 16%. So despite rising significantly in absolute terms, financial globalisation has not obviously closed the gap between core and periphery. These aggregate patterns mask two important, more recent trends. The first is the well-documented accumulation of official foreign exchange reserves by emerging market countries, in particular since 2005. The stock of global official reserves stood at $10 trillion by end-2010, having more than doubled since 2005. These flows are in some respects an oddity of international finance, with capital flowing “uphill” from emerging to advanced economies and with emerging market investors exhibiting a “foreign bias” for debt securities (Prasad, Rajan and Subramanian (2007)).
1 A similar database has been developed by Lane and Milesi-Ferretti (2007). Von Peter (2007) looks at the
pattern of the international banking network.
BIS central bankers’ speeches 3
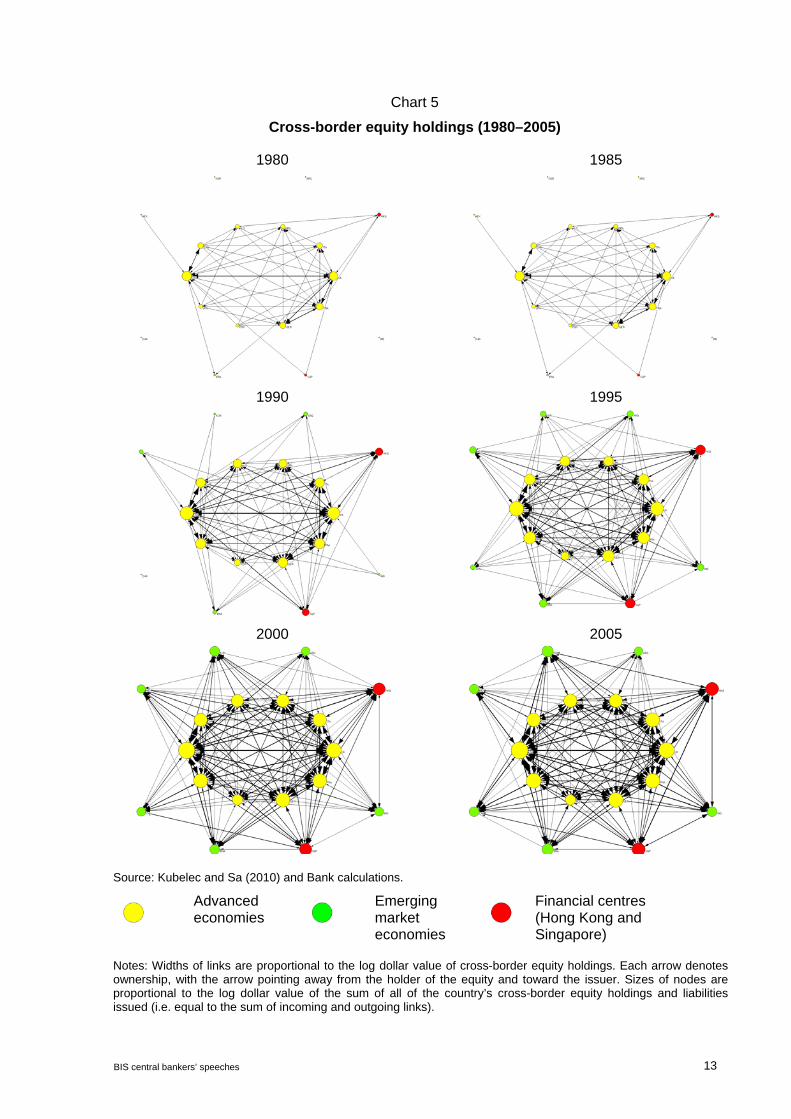
At the same time, a less well-documented trend in private-sector portfolio allocation has been acting in the exact opposite direction. This has involved capital flowing “downhill” and is associated with investors seeking instead to reduce “home bias” in their investment portfolio. To see it, Chart 5 plots the global network map focussing on a subset of external asset stocks, namely portfolio equity flows. The same pattern of intensifying global integration is evident. Indeed, the intensification is altogether more dramatic: total holdings of external equity have risen more than 200-fold over the past quarter-century, an increase of $4.6 trillion.
But unlike for total external assets, the gap between core and periphery has been closing. The relative contribution of intra-advanced country external portfolio asset stocks fell from around 99% to 84% between 1980 and 2005. Over the same period, the relative contribution of advanced to emerging market external portfolio asset stocks rose from virtually nothing to over 8%. That is a fairly dramatic shift in international investors’ portfolio choice.
What explains it? One plausible candidate is increased portfolio diversification by institutional investors in advanced countries. It is well-known that international investment portfolios exhibit an acute home bias, with portfolio shares much more heavily skewed towards the home market than would be implied by conventional asset pricing models (French and Poterba (1991), Forbes (2010)). There is a home-bias puzzle.
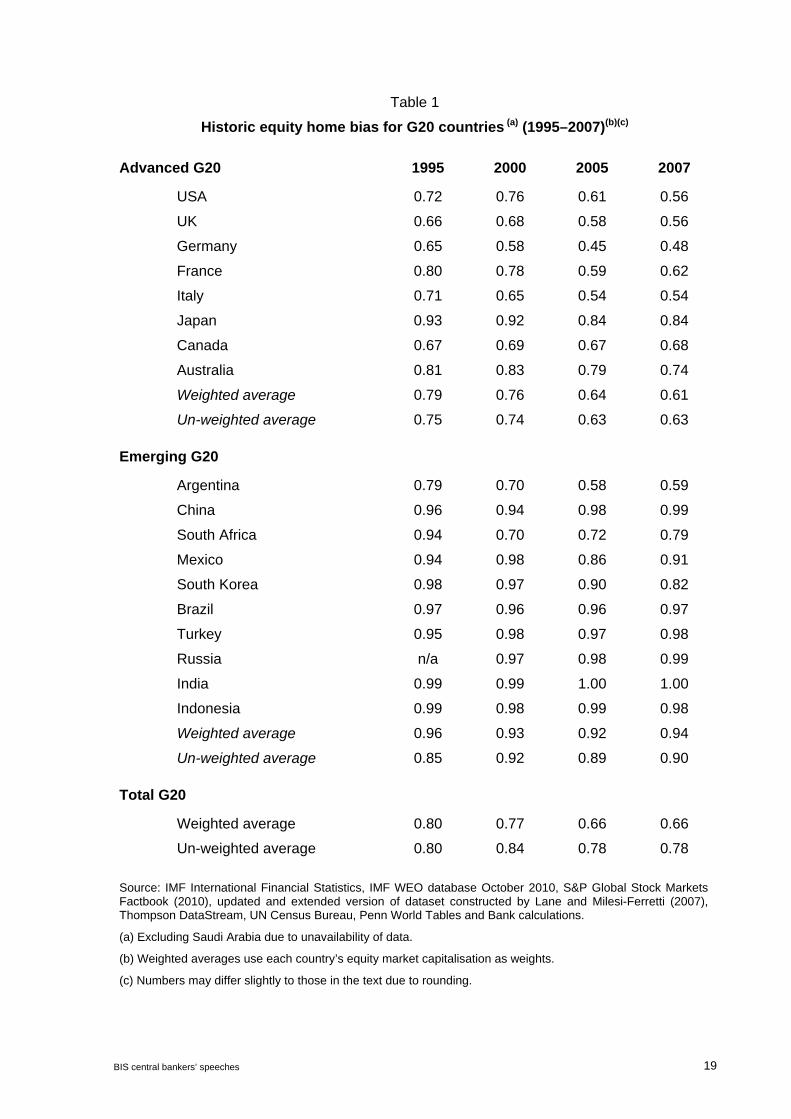
To illustrate, Table 1 constructs some equity home bias estimates for the G20 countries between 1995 and 2007. Home bias is measured here as an index lying between zero and one.2 So a value of unity indicates complete home bias – that is, a country holds no foreign equity in its investment portfolio. A value of zero, meanwhile, suggests home bias has been completely eliminated, with a country investing in proportion to the world market portfolio. Intermediate values tell us the proportion a country is underweight foreign assets relative to a world portfolio benchmark.
The following points are noteworthy:
Equity home bias remains very significant across every country in the world. The un-weighted average home bias across the G20 in 2007 was around 0.78. Weighted by market capitalisation, average home bias was 0.66. So, in weighted terms, G20 countries’ holdings of foreign equity are around a third of the value they would be in the theoretically optimum market portfolio.
This home bias is lower among advanced than emerging market economies. The un-weighted home bias index in 2007 was 0.63 for advanced countries, while for emerging market G20 economies it was 0.90. For those emerging economies which maintain capital restrictions, such as India and China, home bias remains almost complete.
On average, there has been a decline in equity home bias across G20 countries over time. Among advanced G20 economies, the un-weighted home bias index has fallen from 0.75 in 1995 to 0.63 in 2007. Weighted by market capitalisation, it has fallen from 0.79 to 0.61 over the same period. Foreign equity holdings have gone from a fifth to a third of their theoretical benchmark.
While seemingly modest in index terms, the implied portfolio reallocations amount to very sizable portfolio equity flows. That is because stocks of outstanding equity assets are enormous. For example, a fall of 0.1 in the weighted home bias index for advanced countries in 2007 relative to 2006 would have equated to a portfolio reallocation to foreign markets of around $4.5 trillion. That is a big fish. To give
2 Home bias for a given country is given by:
1 – Country’s holdings of foreign equity compared to country’s total global equity holdings Other countries’ total share of world equity market capitalisation
4 BIS central bankers’ speeches
some context, the market capitalisation of all G20 emerging market countries in 2007 was $6.8 trillion. That is a smallish pond.
For individual countries, some of the falls in home bias have been fairly dramatic – for example, in Germany, France and Italy. Changes in US patterns of home bias are also very significant in financial terms. The fall of 0.17 in measured US home bias between 1995 and 2007 corresponds to an annual average portfolio reallocation to the rest of the world of around $370 billion (or 1.4% of non-US global GDP).
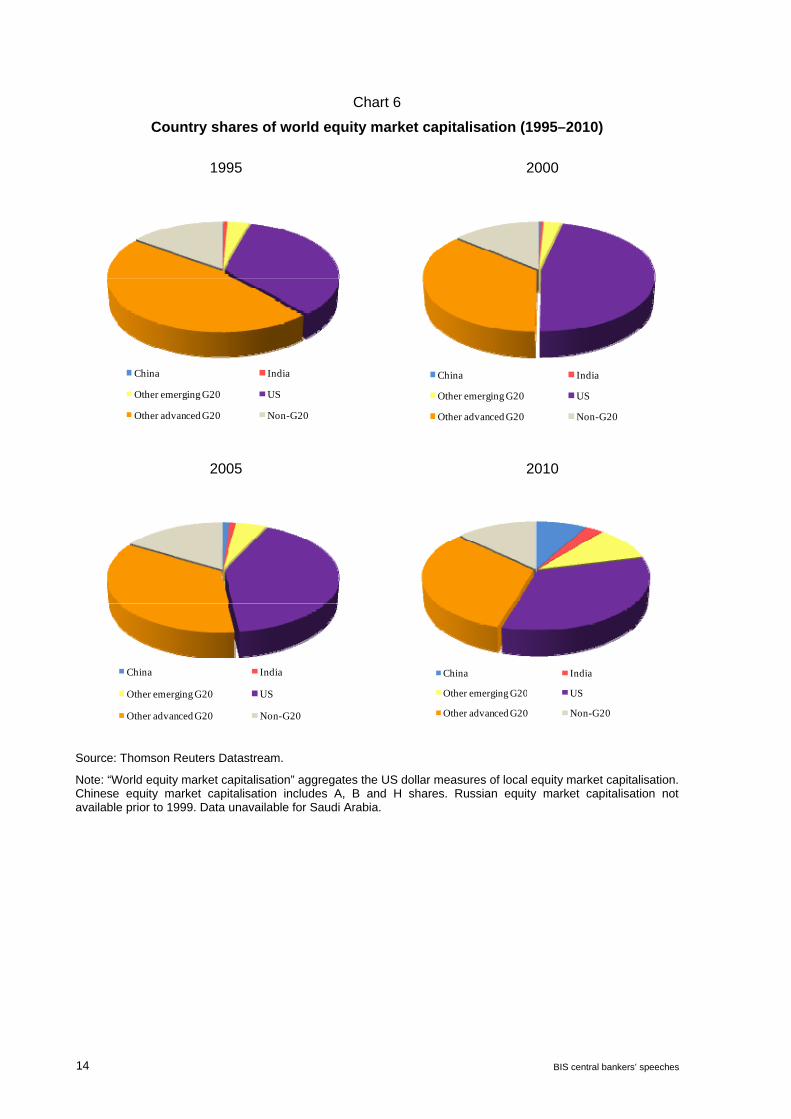
The pace at which home bias has been reduced is all the more striking because, over the same period, emerging markets have become a larger slice of the global portfolio pie. Between 1995 and 2010, the emerging G20 countries more than quadrupled their share of the world equity market portfolio, from 4% to 21% (Chart 6). Had advanced country portfolio allocations remained constant over this period, measured home bias would have risen rather than fallen.
These trends in international portfolio allocation have been a key driver behind the emerging BFSP problem during the course of this century. Portfolio reallocation by the big fish has outpaced growth in the small pond of emerging capital markets. The upshot has been large and mounting financial ripples. These strengthening waves of capital inflows have, in turn, prompted some emerging countries to construct protective policy seawalls, such as capital flow restrictions and macro-prudential policies. Recently, these measures have included:
In Hong Kong, the authorities imposed a cap on loan-to-value (LTV) ratios and a maximum loan amount on certain properties, alongside an increase in stamp duty on sales in October 2009.
The Chinese authorities in 2010 increased taxes on properties resold within five years and offered greater administrative guidance on financing, including lower LTV ratios for second and third homes and a mandated increase in mortgage rates for second homes.
In Brazil, the authorities reintroduced in October 2009 a tax on non-resident portfolio equity and debt inflows, with a broader coverage and a higher rate. They also increased the tax on the margin payments required on foreign exchange futures and other derivatives. In early 2011, reserve requirements on short foreign exchange positions were introduced.
In South Korea, four sets of measures have been introduced: stronger foreign currency liquidity standards for banks (November 2009); reduced short-term external bank debt and limiting foreign currency bank loans (June 2010); a macro-prudential stability levy, planned to be introduced in 2011, on banks’ non-deposit foreign currency liabilities (late 2010); and the reintroduction of a withholding tax on foreign purchases of treasury bonds (January 2011).
In Turkey, the central bank raised reserve requirements, and reduced policy rates, to address accelerating credit growth and financial stability.
In Thailand, a withholding tax was imposed in October 2010 on non-resident interest earnings and capital gains on state bonds.
In Indonesia, the central bank introduced in June 2010 a package of measures, including a one-month holding period requirement for central bank securities.
3. Tomorrow’s BFSP problem
From a public policy perspective, one key question is whether the frequency and amplitude of these global financial ripples will rise or fall in the period ahead. In other words, will
BIS central bankers’ speeches 5
tomorrow’s BFSP problem be greater or lesser than today’s? To answer that, we need to return to the global financial footrace. Judging that race involves balancing two powerful forces of financial liberalisation:
Portfolio diversification among advanced economies;
Financial deepening among emerging markets.
Plotting the future path of these factors is far from straightforward. But some quantitative thought-experiments can help clarify the balance of these forces. To keep these experiments as transparent as possible, consider the simplest possible one-factor model of financial liberalisation. The one factor is the level of economic development of the G20 economies, as proxied by GDP per capita.
Theoretically, we would expect financial liberalisation to be shaped by economic development. This is consistent with the economic growth literature emphasising the positive, two-way relationship between financial deepening and economic growth (Levine (2005)). The cross-section and time-series evidence presented here supports that hypothesis.
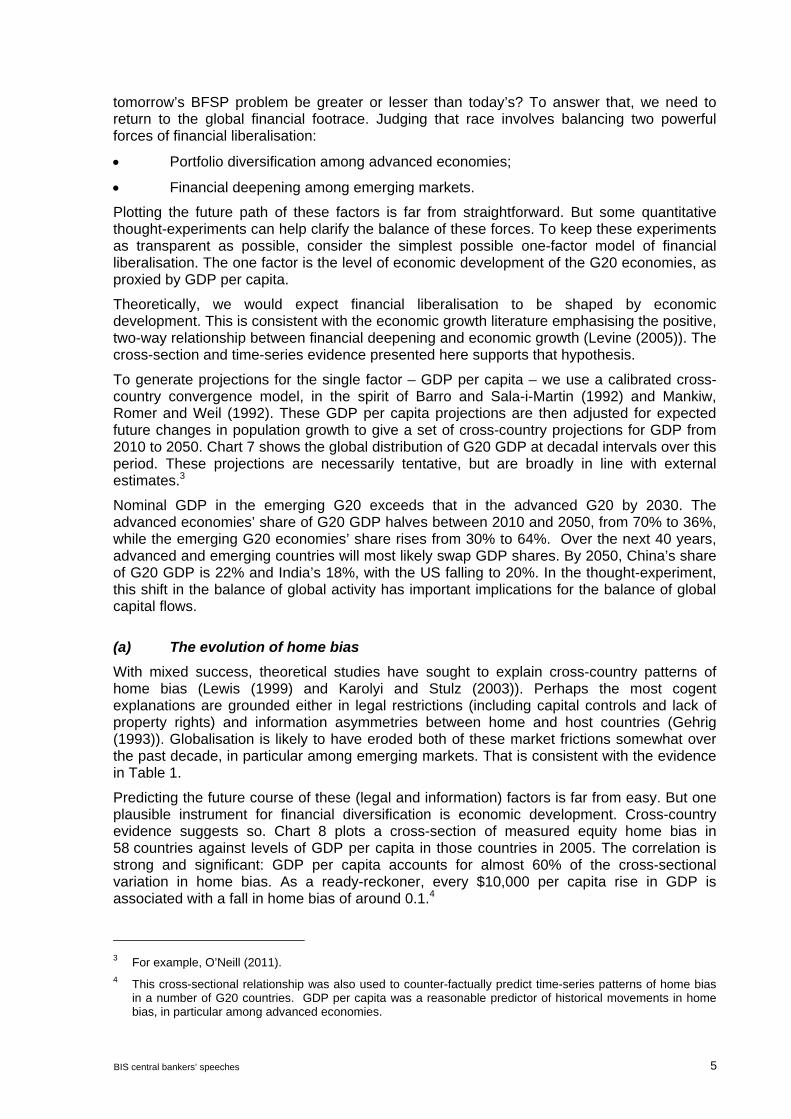
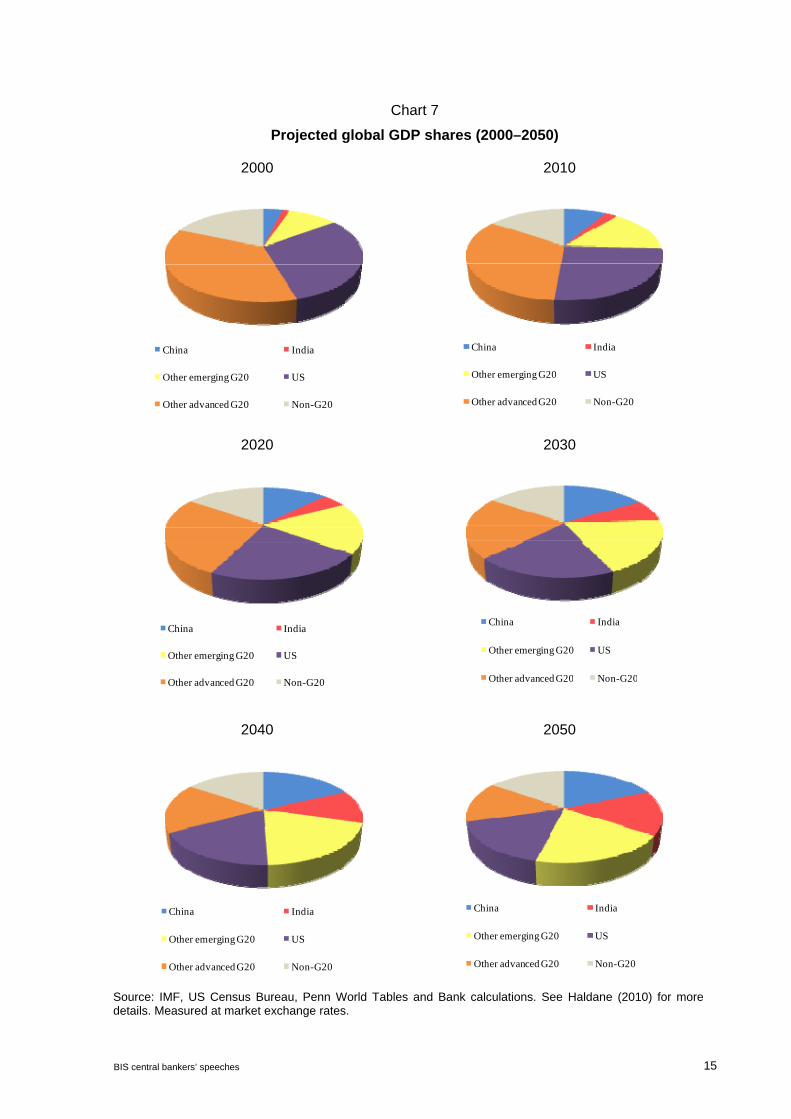
To generate projections for the single factor – GDP per capita – we use a calibrated cross-country convergence model, in the spirit of Barro and Sala-i-Martin (1992) and Mankiw, Romer and Weil (1992). These GDP per capita projections are then adjusted for expected future changes in population growth to give a set of cross-country projections for GDP from 2010 to 2050. Chart 7 shows the global distribution of G20 GDP at decadal intervals over this period. These projections are necessarily tentative, but are broadly in line with external estimates.3
Nominal GDP in the emerging G20 exceeds that in the advanced G20 by 2030. The advanced economies’ share of G20 GDP halves between 2010 and 2050, from 70% to 36%, while the emerging G20 economies’ share rises from 30% to 64%. Over the next 40 years, advanced and emerging countries will most likely swap GDP shares. By 2050, China’s share of G20 GDP is 22% and India’s 18%, with the US falling to 20%. In the thought-experiment, this shift in the balance of global activity has important implications for the balance of global capital flows.
(a) The evolution of home bias
With mixed success, theoretical studies have sought to explain cross-country patterns of home bias (Lewis (1999) and Karolyi and Stulz (2003)). Perhaps the most cogent explanations are grounded either in legal restrictions (including capital controls and lack of property rights) and information asymmetries between home and host countries (Gehrig (1993)). Globalisation is likely to have eroded both of these market frictions somewhat over the past decade, in particular among emerging markets. That is consistent with the evidence in Table 1.
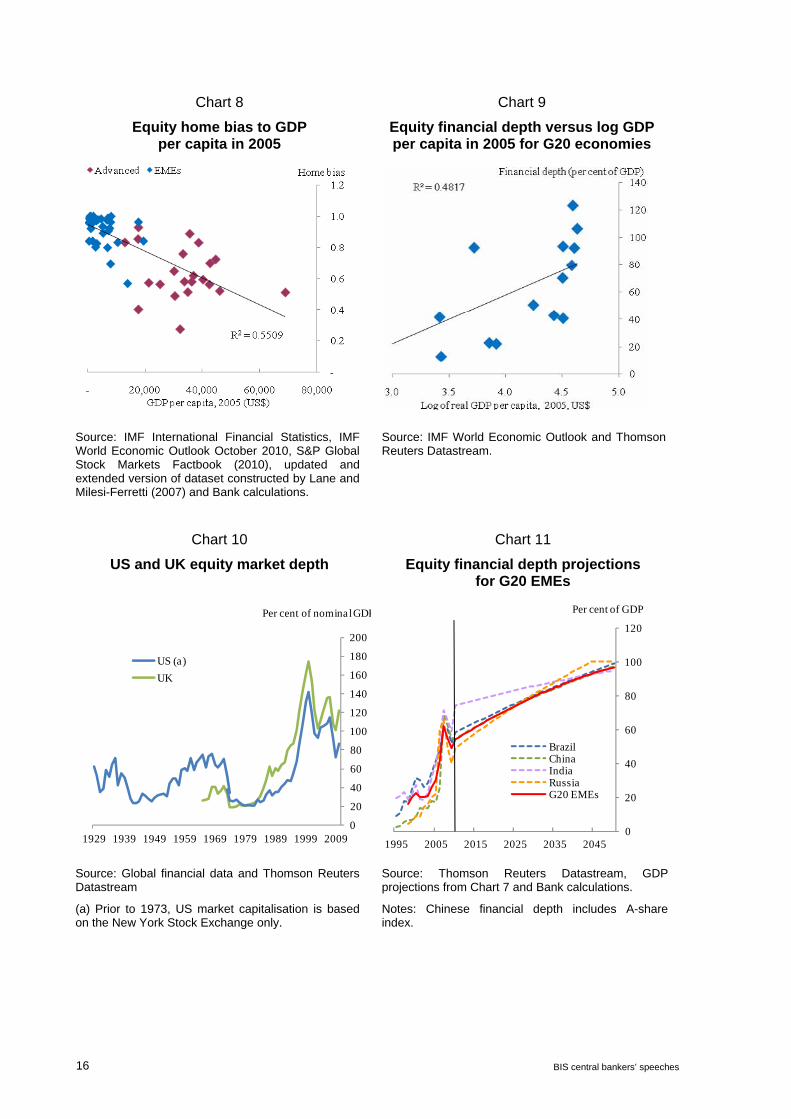
Predicting the future course of these (legal and information) factors is far from easy. But one plausible instrument for financial diversification is economic development. Cross-country evidence suggests so. Chart 8 plots a cross-section of measured equity home bias in 58 countries against levels of GDP per capita in those countries in 2005. The correlation is strong and significant: GDP per capita accounts for almost 60% of the cross-sectional variation in home bias. As a ready-reckoner, every $10,000 per capita rise in GDP is associated with a fall in home bias of around 0.1.4
3 For example, O’Neill (2011). 4 This cross-sectional relationship was also used to counter-factually predict time-series patterns of home bias
in a number of G20 countries. GDP per capita was a reasonable predictor of historical movements in home bias, in particular among advanced economies.
6 BIS central bankers’ speeches
Using economic development as an instrument for portfolio diversification, GDP per capita projections can be used to simulate the possible future course of home bias. Futurology of this kind of course comes with large caveats and confidence intervals. Given the simplicity of the model, it is a thought-experiment rather than a forecast. And underlying that experiment is an assumption that advanced countries continue to grow and diversify their equity portfolios, but at a slower rate than catch-up emerging market economies.
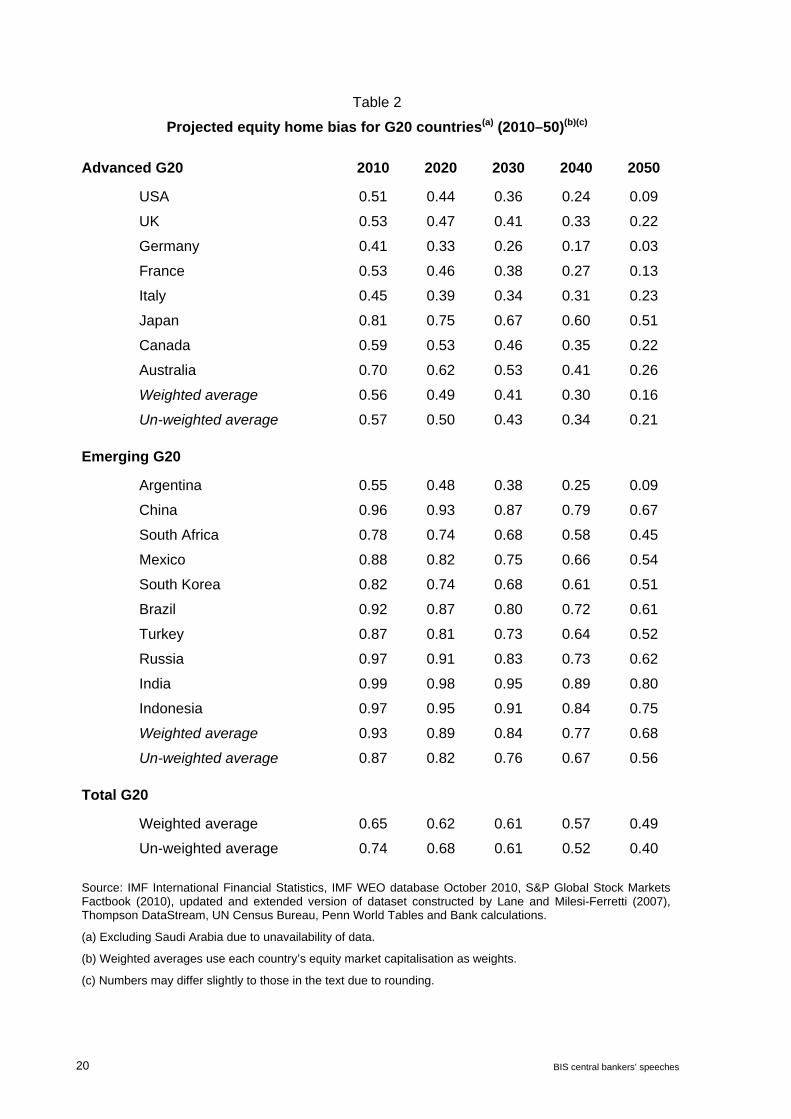
Table 2 shows the evolution of equity home bias at decadal intervals out to 2050 for the G20 in this thought-experiment. Some clear points emerge:
All G20 countries see a reduction in home bias. The un-weighted G20 average home bias index falls by 0.33 between 2010 and 2050. That is roughly the same rate of descent as over the past 10 years or so.
Among a number of advanced countries, home bias has been significantly eroded by 2050, in some cases perhaps implausibly so. For example, in the US home bias falls from 0.51 to 0.09.
Emerging market home bias remains in many cases significant even by the end of the period, reflecting their higher starting point. Average emerging market home bias in 2050 is not dissimilar to advanced country home bias in 2010.
The implied reductions in home bias would have a potentially significant impact on the pattern of global capital flows. For example, if home bias in the G20 was to fall as projected, then the sum of gross inflows to individual emerging markets – including flows from both advanced and other emerging markets – is on average $6.3 trillion per year over the period.
It would be easy to quibble with the detail of these projections. For example, cross-country information frictions, and hence home bias, may never be fully eliminated. East or West, home may remain best. Nonetheless, the slow, secular fall in this bias does not appear implausible if recent portfolio patterns are a reliable guide to the future.
(b) The evolution of financial depth
Theory would predict a positive, two-way relationship between financial depth and economic development. Not only does greater development spur the deepening of capital markets to finance investment projects, but deeper capital markets themselves may act as a spur for growth as they improve the efficiency of the financial intermediation process (Levine (2005)).
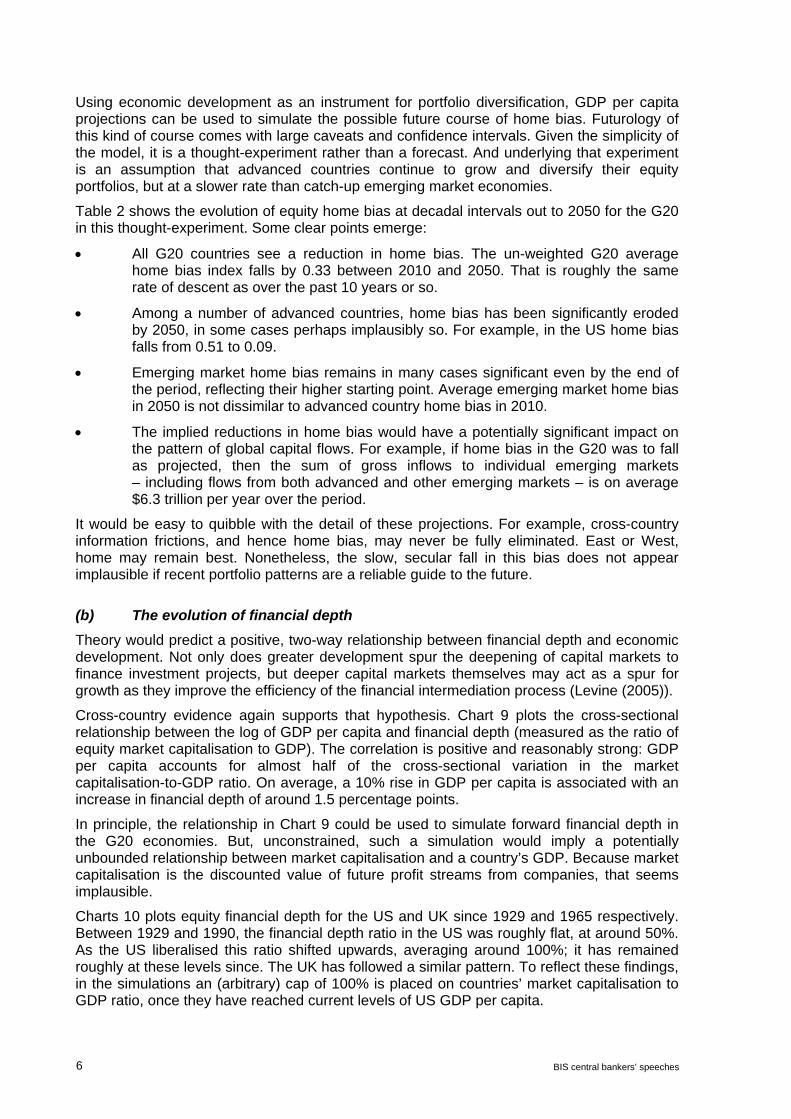
Cross-country evidence again supports that hypothesis. Chart 9 plots the cross-sectional relationship between the log of GDP per capita and financial depth (measured as the ratio of equity market capitalisation to GDP). The correlation is positive and reasonably strong: GDP per capita accounts for almost half of the cross-sectional variation in the market capitalisation-to-GDP ratio. On average, a 10% rise in GDP per capita is associated with an increase in financial depth of around 1.5 percentage points.
In principle, the relationship in Chart 9 could be used to simulate forward financial depth in the G20 economies. But, unconstrained, such a simulation would imply a potentially unbounded relationship between market capitalisation and a country’s GDP. Because market capitalisation is the discounted value of future profit streams from companies, that seems implausible.
Charts 10 plots equity financial depth for the US and UK since 1929 and 1965 respectively. Between 1929 and 1990, the financial depth ratio in the US was roughly flat, at around 50%. As the US liberalised this ratio shifted upwards, averaging around 100%; it has remained roughly at these levels since. The UK has followed a similar pattern. To reflect these findings, in the simulations an (arbitrary) cap of 100% is placed on countries’ market capitalisation to GDP ratio, once they have reached current levels of US GDP per capita.
BIS central bankers’ speeches 7
Using the relationship in Chart 9 and the GDP projections, equity financial depth in the G20 countries can be projected forward. Many of the advanced countries have only a short distance to travel to reach 100%, given their starting point. Among the emerging G20, the average financial depth ratio rises from around 50% in 2010 to around 100% by 2050 (Chart 11). In other words, the pace of financial deepening in the emerging G20 countries is rather gradual. If anything, this may understate the likely pace of change.
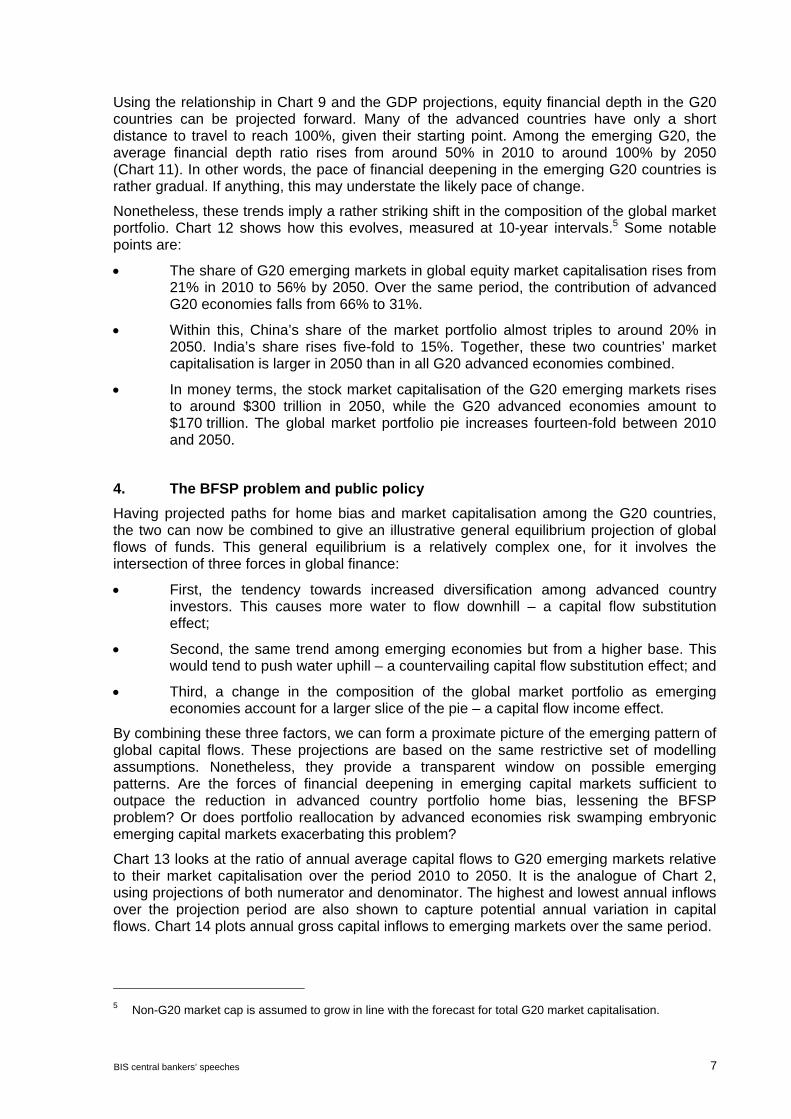
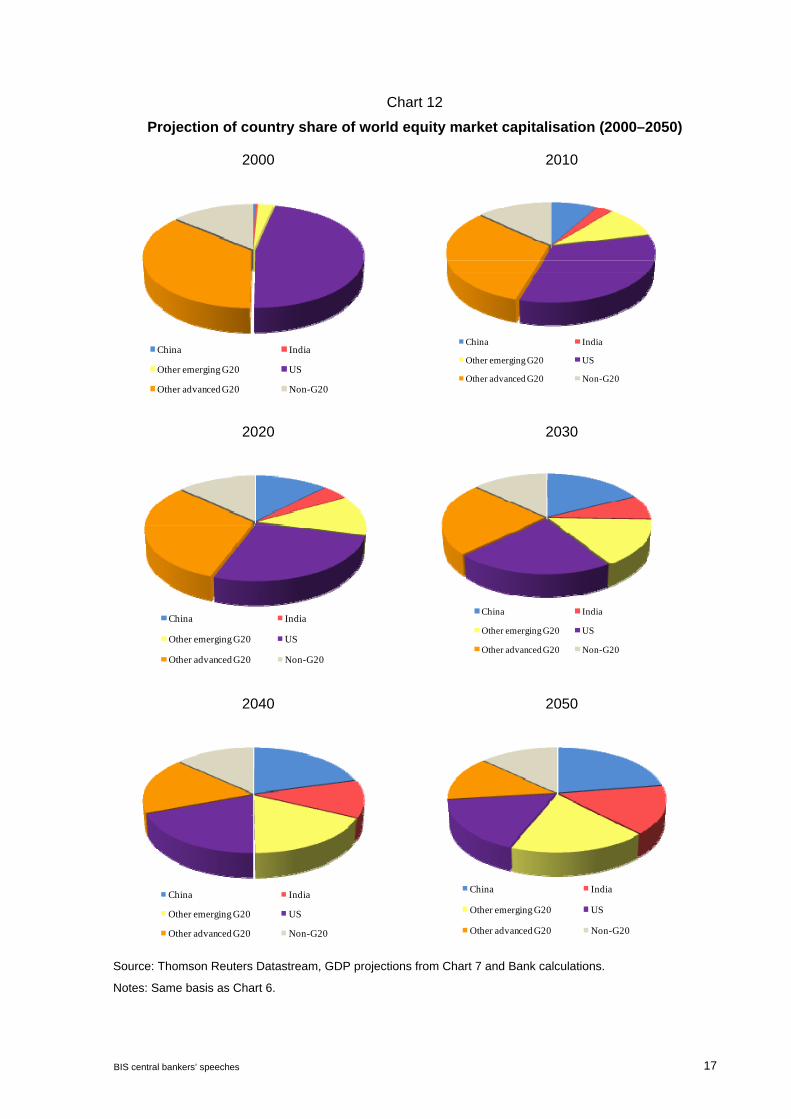
Nonetheless, these trends imply a rather striking shift in the composition of the global market portfolio. Chart 12 shows how this evolves, measured at 10-year intervals.5 Some notable points are:
The share of G20 emerging markets in global equity market capitalisation rises from 21% in 2010 to 56% by 2050. Over the same period, the contribution of advanced G20 economies falls from 66% to 31%.
Within this, China’s share of the market portfolio almost triples to around 20% in 2050. India’s share rises five-fold to 15%. Together, these two countries’ market capitalisation is larger in 2050 than in all G20 advanced economies combined.
In money terms, the stock market capitalisation of the G20 emerging markets rises to around $300 trillion in 2050, while the G20 advanced economies amount to $170 trillion. The global market portfolio pie increases fourteen-fold between 2010 and 2050.
4. The BFSP problem and public policy
Having projected paths for home bias and market capitalisation among the G20 countries, the two can now be combined to give an illustrative general equilibrium projection of global flows of funds. This general equilibrium is a relatively complex one, for it involves the intersection of three forces in global finance:
First, the tendency towards increased diversification among advanced country investors. This causes more water to flow downhill – a capital flow substitution effect;
Second, the same trend among emerging economies but from a higher base. This would tend to push water uphill – a countervailing capital flow substitution effect; and
Third, a change in the composition of the global market portfolio as emerging economies account for a larger slice of the pie – a capital flow income effect.
By combining these three factors, we can form a proximate picture of the emerging pattern of global capital flows. These projections are based on the same restrictive set of modelling assumptions. Nonetheless, they provide a transparent window on possible emerging patterns. Are the forces of financial deepening in emerging capital markets sufficient to outpace the reduction in advanced country portfolio home bias, lessening the BFSP problem? Or does portfolio reallocation by advanced economies risk swamping embryonic emerging capital markets exacerbating this problem?
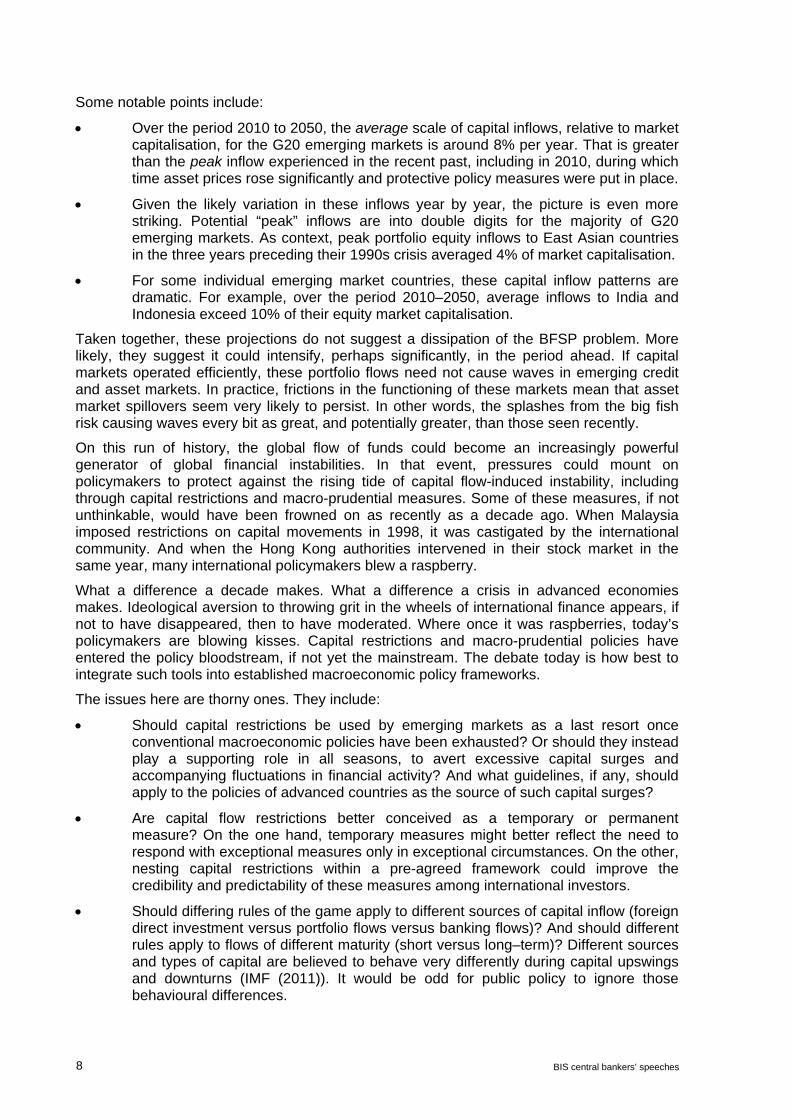
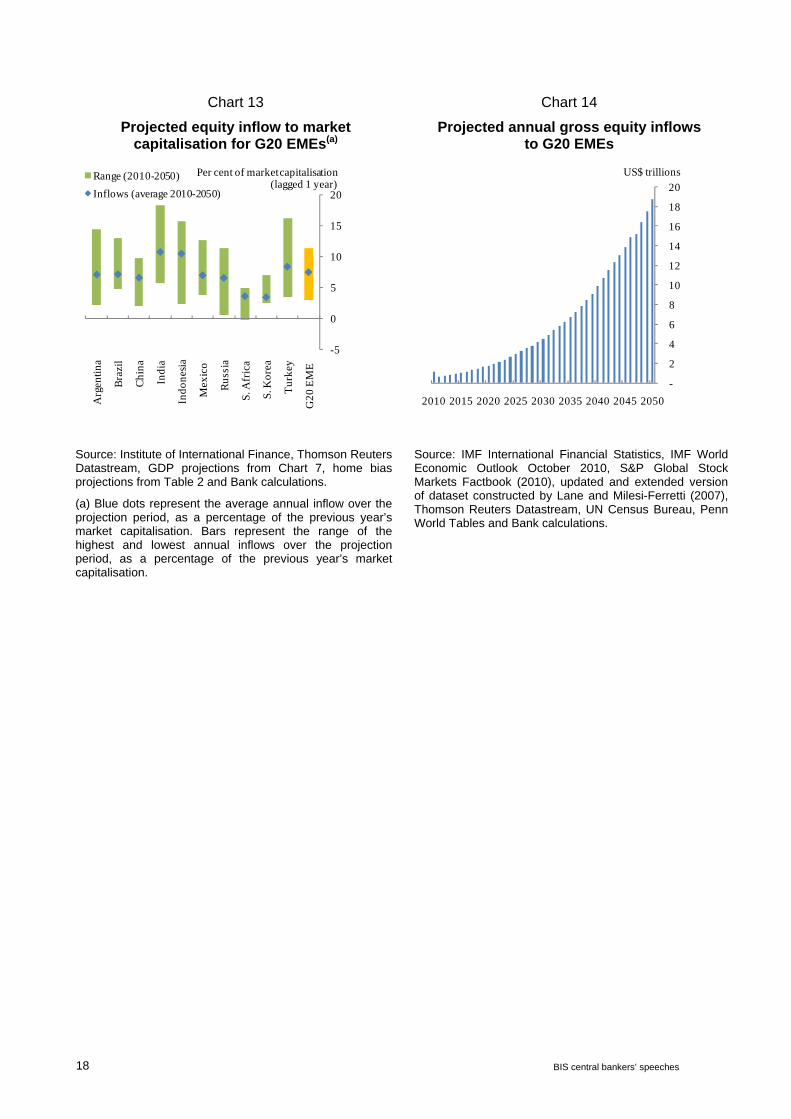
Chart 13 looks at the ratio of annual average capital flows to G20 emerging markets relative to their market capitalisation over the period 2010 to 2050. It is the analogue of Chart 2, using projections of both numerator and denominator. The highest and lowest annual inflows over the projection period are also shown to capture potential annual variation in capital flows. Chart 14 plots annual gross capital inflows to emerging markets over the same period.
5 Non-G20 market cap is assumed to grow in line with the forecast for total G20 market capitalisation.
8 BIS central bankers’ speeches
Some notable points include:
Over the period 2010 to 2050, the average scale of capital inflows, relative to market capitalisation, for the G20 emerging markets is around 8% per year. That is greater than the peak inflow experienced in the recent past, including in 2010, during which time asset prices rose significantly and protective policy measures were put in place.
Given the likely variation in these inflows year by year, the picture is even more striking. Potential “peak” inflows are into double digits for the majority of G20 emerging markets. As context, peak portfolio equity inflows to East Asian countries in the three years preceding their 1990s crisis averaged 4% of market capitalisation.
For some individual emerging market countries, these capital inflow patterns are dramatic. For example, over the period 2010–2050, average inflows to India and Indonesia exceed 10% of their equity market capitalisation.
Taken together, these projections do not suggest a dissipation of the BFSP problem. More likely, they suggest it could intensify, perhaps significantly, in the period ahead. If capital markets operated efficiently, these portfolio flows need not cause waves in emerging credit and asset markets. In practice, frictions in the functioning of these markets mean that asset market spillovers seem very likely to persist. In other words, the splashes from the big fish risk causing waves every bit as great, and potentially greater, than those seen recently.
On this run of history, the global flow of funds could become an increasingly powerful generator of global financial instabilities. In that event, pressures could mount on policymakers to protect against the rising tide of capital flow-induced instability, including through capital restrictions and macro-prudential measures. Some of these measures, if not unthinkable, would have been frowned on as recently as a decade ago. When Malaysia imposed restrictions on capital movements in 1998, it was castigated by the international community. And when the Hong Kong authorities intervened in their stock market in the same year, many international policymakers blew a raspberry.
What a difference a decade makes. What a difference a crisis in advanced economies makes. Ideological aversion to throwing grit in the wheels of international finance appears, if not to have disappeared, then to have moderated. Where once it was raspberries, today’s policymakers are blowing kisses. Capital restrictions and macro-prudential policies have entered the policy bloodstream, if not yet the mainstream. The debate today is how best to integrate such tools into established macroeconomic policy frameworks.
The issues here are thorny ones. They include:
Should capital restrictions be used by emerging markets as a last resort once conventional macroeconomic policies have been exhausted? Or should they instead play a supporting role in all seasons, to avert excessive capital surges and accompanying fluctuations in financial activity? And what guidelines, if any, should apply to the policies of advanced countries as the source of such capital surges?
Are capital flow restrictions better conceived as a temporary or permanent measure? On the one hand, temporary measures might better reflect the need to respond with exceptional measures only in exceptional circumstances. On the other, nesting capital restrictions within a pre-agreed framework could improve the credibility and predictability of these measures among international investors.
Should differing rules of the game apply to different sources of capital inflow (foreign direct investment versus portfolio flows versus banking flows)? And should different rules apply to flows of different maturity (short versus long–term)? Different sources and types of capital are believed to behave very differently during capital upswings and downturns (IMF (2011)). It would be odd for public policy to ignore those behavioural differences.
BIS central bankers’ speeches 9
What are the respective roles of capital restrictions and macro-prudential policy? At present, the two are viewed rather differently, with views on capital restrictions mixed, while macro-prudential policies are increasingly the consensus. Yet these two sets of tool may differ more in detail than in principle. Macro-prudential policies may also have a role to play in moderating credit growth in the source of capital surges – the advanced economies.
What are the respective roles of capital restrictions and financial market deepening as responses to the BFSP problem? One policy option for emerging economies is to strengthen and deepen their domestic capital market infrastructure, so that it is better able to absorb and intermediate incoming foreign capital. A reduction in those capital market frictions would tend to lower the asset market spillover costs of the BFSP problem.
Finally, what guideposts should be provided by the international community in tackling the BFSP problem? The IMF recently began to explore such a framework (IMF (2011)). This raises a set of key questions about global financial governance. Are global financial network externalities sufficiently large to justify the international community imposing rules of the financial road? And how much driver discretion should instead be left to nation states which ultimately may bear the costs of the BFSP problem?
These are big public policy questions. They are by no means new ones. If the quantitative experiments presented here are even roughly right, these questions may assume a new urgency in the period ahead. The BFSP problem is real. It may be rising. The result would be growing waves of global financial exuberance, punctuated by crashing capital busts. This roller-coaster has the potential to leave some nation states feeling queasy. They may even wish to get off. What is at stake may be more than just the future stability of the international financial system.
References
Barro, R J and Sala-i-Martin, X (1992), “Convergence”, Journal of Political Economy, Vol. 100 (2) pages 223–251.
Dornbusch, R, Goldfajn, I and Valdés, R (1995), “Currency Crises and Collapses”, Brookings Papers on Economic Activity, Vol. 26(2), pages 219–294.
French, K R and Poterba, J M (1991), “Investor Diversification and International Equity Markets”, American Economic Review, Vol. 81 (2), pages 222–226.
Forbes, K (2010), “Why Do Foreigners Invest in the United States?”, Journal of International Economics, Vol 80(1), pages 3–21.
Gehrig, T (1993), “An Information Based Explanation of the Domestic Bias in International Equity Investment”, Scandinavian Journal of Economics, Vol. 95(1), pages 97–109.
Haldane, A G (2010), “Global Imbalances in Retrospect and Prospect”, remarks given at the Global Financial Forum, Chatham House Conference on “The New Global Economic Order”, available at: http://www.bankofengland.co.uk/publications/speeches/2010/speech468.pdf
International Monetary Fund (2011) “Recent Experiences in Managing Capital Inflows – Cross-Cutting Themes and Possible Policy Framework”, available at: http://www.imf.org/external/pp/longres.aspx?id=4542
Karolyi, G A and Stulz, R M. (2003), “Are Financial Assets Priced Locally or Globally?”, in: Constantinides, G M, Harris, M and Stulz, R M (ed.), Handbook of the Economics of Finance, Vol. 1, pages 975–1020.
10 BIS central bankers’ speeches
Kubelec, C and Sa, F (2010), “The Geographical Composition of National External Balance Sheets: 1980–2005”, Bank of England Working Paper No. 384.
Lane, P and Milesi-Ferretti, G M (2007), “The External Wealth of Nations Mark II: Revised and Extended Estimates of Foreign Assets and Liabilities”, Journal of International Economics, Vol. 73, pages 223–250.
Levine, R (2005), “Finance and Growth: Theory and Evidence”, in Aghion, P and Durlauf, S, Handbook of Economic Growth, Amsterdam: Elsevier, pages 856–934.
Lewis, K K (1999), “Trying to Explain Home Bias in Equities and Consumption”, Journal of Economic Literature, Vol. 37(2), pages 571–608.
Mankiw, N G, Romer, D and Weil, D N (1992), “A Contribution to the Empirics of Economic Growth”, Quarterly Journal of Economics Vol. 107(2), pages 407–437.
O’Neill, J (2011), “It is Time to Re-define Emerging Markets”, Goldman Sachs Asset Management Strategy Series.
Prasad, E, Rajan, R and Subramanian, A (2007), “The Paradox of Capital”, Finance and Development, Vol. 44(1).
Reinhart, C M and Rogoff, K S (2008), “This Time is Different: A Panoramic View of Eight Centuries of Financial Crises,” NBER Working Paper 13882.
Von Peter, G (2007), “International Banking Centres: a Network Perspective”, BIS Quarterly Review, December, pages 33–45.
BIS central bankers’ speeches 11
Annex: Charts and tables
Chart 1
Gross portfolio equity flows(a) to emerging markets in 2010
Chart 2
Gross portfolio equity inflows relative to lagged market capitalisation for G20
emerging markets(a)(b)
800
850
900
950
1,000
1,050
1,100
1,150
1,200
0
10
20
30
40
50
60
70
80
90
Jan Mar May Jul Sep Nov
Dedicated EMEs
MSCI EM US$ Index (LHS)
Cumulative flows since Jan 2010 (US$ billions)
2010
Index, 31/12/1987 = 100
Source: Emerging Portfolio Fund Research, Thomson Reuters Datastream and Bank calculations.
(a) Flows to equity investment funds.
Source: Institute of International Finance, Thomson Reuters Datastream and Bank calculations.
(a) Chinese equity market capitalisation includes A, B and H shares. A-shares are currently available for purchase by domestic residents only but are included since we assume capital market liberalisation occurs in China over our forecast projection.
(b) Data on portfolio equity inflows from the Institute of International Finance. Data on equity market capitalisation from Thomson Reuters Datastream.
Chart 3
Emerging market equity prices and gross inflows(a) to emerging markets
-200
-100
0
100
200
300
400
500
0
200
400
600
800
1,000
1,200
1,400
Q1 1990
Q1 1994
Q1 1998
Q1 2002
Q1 2006
Q1 2010
MSCI EM U$ index (LHS)
Gross inflows to EM (US$bn)
Source: IMF and Thomson Datastream.
(a) Includes portfolio inflows, foreign direct investment and bank flows.
12 BIS central bankers’ speeches
Chart 4
Cross-border asset holdings (1980–2005)
1980 1985
1990 1995
2000 2005
Source: Kubelec and Sa (2010) and Bank calculations.
Advanced economies
Emerging market economies
Financial centres (Hong Kong and Singapore)
Notes: Widths of links are proportional to the log dollar value of cross-border asset holdings. Each arrow denotes ownership, with the arrow pointing away from the holder of the asset and toward the issuer of the liability. Sizes of nodes are proportional to the log dollar value of the sum of all of the country’s cross-border asset holdings and liabilities issued (i.e. equal to the sum of incoming and outgoing links).
BIS central bankers’ speeches 13
Chart 5
Cross-border equity holdings (1980–2005)
1980 1985
1990 1995
2000 2005
Source: Kubelec and Sa (2010) and Bank calculations.
Advanced economies
Emerging market economies
Financial centres (Hong Kong and Singapore)
Notes: Widths of links are proportional to the log dollar value of cross-border equity holdings. Each arrow denotes ownership, with the arrow pointing away from the holder of the equity and toward the issuer. Sizes of nodes are proportional to the log dollar value of the sum of all of the country’s cross-border equity holdings and liabilities issued (i.e. equal to the sum of incoming and outgoing links).
14 BIS central bankers’ speeches
Chart 6
Country shares of world equity market capitalisation (1995–2010)
1995 2000
China India
Other emerging G20 US
Other advanced G20 Non-G20
China India
Other emerging G20 US
Other advanced G20 Non-G20
2005 2010
China India
Other emerging G20 US
Other advanced G20 Non-G20
China India
Other emerging G20 US
Other advanced G20 Non-G20
Source: Thomson Reuters Datastream.
Note: “World equity market capitalisation” aggregates the US dollar measures of local equity market capitalisation. Chinese equity market capitalisation includes A, B and H shares. Russian equity market capitalisation not available prior to 1999. Data unavailable for Saudi Arabia.
BIS central bankers’ speeches 15
Chart 7
Projected global GDP shares (2000–2050)
2000 2010
China India
Other emerging G20 US
Other advanced G20 Non-G20
China India
Other emerging G20 US
Other advanced G20 Non-G20
2020 2030
China India
Other emerging G20 US
Other advanced G20 Non-G20
China India
Other emerging G20 US
Other advanced G20 Non-G20
2040 2050
China India
Other emerging G20 US
Other advanced G20 Non-G20
China India
Other emerging G20 US
Other advanced G20 Non-G20
Source: IMF, US Census Bureau, Penn World Tables and Bank calculations. See Haldane (2010) for more details. Measured at market exchange rates. e
16 BIS central bankers’ speeches
Chart 8
Equity home bias to GDP per capita in 2005
Chart 9
Equity financial depth versus log GDP per capita in 2005 for G20 economies
Source: IMF International Financial Statistics, IMF World Economic Outlook October 2010, S&P Global Stock Markets Factbook (2010), updated and extended version of dataset constructed by Lane and Milesi-Ferretti (2007) and Bank calculations.
Source: IMF World Economic Outlook and Thomson Reuters Datastream.
Chart 10
US and UK equity market depth
Chart 11
Equity financial depth projections for G20 EMEs
0
20
40
60
80
100
120
140
160
180
200
1929 1939 1949 1959 1969 1979 1989 1999 2009
US (a)
UK
Per cent of nominal GDP
0
20
40
60
80
100
120
1995 2005 2015 2025 2035 2045
BrazilChinaIndiaRussiaG20 EMEs
Per cent of GDP
Source: Global financial data and Thomson Reuters Datastream
(a) Prior to 1973, US market capitalisation is based on the New York Stock Exchange only.
Source: Thomson Reuters Datastream, GDP projections from Chart 7 and Bank calculations.
Notes: Chinese financial depth includes A-share index.
BIS central bankers’ speeches 17
Chart 12
Projection of country share of world equity market capitalisation (2000–2050)
2000 2010
China India
Other emerging G20 US
Other advanced G20 Non-G20
China India
Other emerging G20 US
Other advanced G20 Non-G20
2020 2030
China India
Other emerging G20 US
Other advanced G20 Non-G20
China India
Other emerging G20 US
Other advanced G20 Non-G20
2040 2050
China India
Other emerging G20 US
Other advanced G20 Non-G20
China India
Other emerging G20 US
Other advanced G20 Non-G20
Source: Thomson Reuters Datastream, GDP projections from Chart 7 and Bank calculations.
Notes: Same basis as Chart 6.
18 BIS central bankers’ speeches
Chart 13
Projected equity inflow to market capitalisation for G20 EMEs(a)
Chart 14
Projected annual gross equity inflows to G20 EMEs
-5
0
5
10
15
20
Arg
entin
a
Bra
zil
Chi
na
Indi
a
Indo
nesi
a
Mex
ico
Rus
sia
S. A
fric
a
S. K
orea
Tur
key
G20
EM
E
Range (2010-2050)
Inflows (average 2010-2050)
Per cent of market capitalisation (lagged 1 year)
-
2
4
6
8
10
12
14
16
18
20
2010 2015 2020 2025 2030 2035 2040 2045 2050
US$ trillions
Source: Institute of International Finance, Thomson Reuters Datastream, GDP projections from Chart 7, home bias projections from Table 2 and Bank calculations.
(a) Blue dots represent the average annual inflow over the projection period, as a percentage of the previous year’s market capitalisation. Bars represent the range of the highest and lowest annual inflows over the projection period, as a percentage of the previous year’s market capitalisation.
Source: IMF International Financial Statistics, IMF World Economic Outlook October 2010, S&P Global Stock Markets Factbook (2010), updated and extended version of dataset constructed by Lane and Milesi-Ferretti (2007), Thomson Reuters Datastream, UN Census Bureau, Penn World Tables and Bank calculations.
BIS central bankers’ speeches 19
Table 1
Historic equity home bias for G20 countries (a) (1995–2007)(b)(c)
Advanced G20 1995 2000 2005 2007
USA 0.72 0.76 0.61 0.56
UK 0.66 0.68 0.58 0.56
Germany 0.65 0.58 0.45 0.48
France 0.80 0.78 0.59 0.62
Italy 0.71 0.65 0.54 0.54
Japan 0.93 0.92 0.84 0.84
Canada 0.67 0.69 0.67 0.68
Australia 0.81 0.83 0.79 0.74
Weighted average 0.79 0.76 0.64 0.61
Un-weighted average 0.75 0.74 0.63 0.63
Emerging G20
Argentina 0.79 0.70 0.58 0.59
China 0.96 0.94 0.98 0.99
South Africa 0.94 0.70 0.72 0.79
Mexico 0.94 0.98 0.86 0.91
South Korea 0.98 0.97 0.90 0.82
Brazil 0.97 0.96 0.96 0.97
Turkey 0.95 0.98 0.97 0.98
Russia n/a 0.97 0.98 0.99
India 0.99 0.99 1.00 1.00
Indonesia 0.99 0.98 0.99 0.98
Weighted average 0.96 0.93 0.92 0.94
Un-weighted average 0.85 0.92 0.89 0.90
Total G20
Weighted average 0.80 0.77 0.66 0.66
Un-weighted average 0.80 0.84 0.78 0.78
Source: IMF International Financial Statistics, IMF WEO database October 2010, S&P Global Stock Markets Factbook (2010), updated and extended version of dataset constructed by Lane and Milesi-Ferretti (2007), Thompson DataStream, UN Census Bureau, Penn World Tables and Bank calculations.
(a) Excluding Saudi Arabia due to unavailability of data.
(b) Weighted averages use each country’s equity market capitalisation as weights.
(c) Numbers may differ slightly to those in the text due to rounding.
20 BIS central bankers’ speeches
Table 2
Projected equity home bias for G20 countries(a) (2010–50)(b)(c)
Advanced G20 2010 2020 2030 2040 2050
USA 0.51 0.44 0.36 0.24 0.09
UK 0.53 0.47 0.41 0.33 0.22
Germany 0.41 0.33 0.26 0.17 0.03
France 0.53 0.46 0.38 0.27 0.13
Italy 0.45 0.39 0.34 0.31 0.23
Japan 0.81 0.75 0.67 0.60 0.51
Canada 0.59 0.53 0.46 0.35 0.22
Australia 0.70 0.62 0.53 0.41 0.26
Weighted average 0.56 0.49 0.41 0.30 0.16
Un-weighted average 0.57 0.50 0.43 0.34 0.21
Emerging G20
Argentina 0.55 0.48 0.38 0.25 0.09
China 0.96 0.93 0.87 0.79 0.67
South Africa 0.78 0.74 0.68 0.58 0.45
Mexico 0.88 0.82 0.75 0.66 0.54
South Korea 0.82 0.74 0.68 0.61 0.51
Brazil 0.92 0.87 0.80 0.72 0.61
Turkey 0.87 0.81 0.73 0.64 0.52
Russia 0.97 0.91 0.83 0.73 0.62
India 0.99 0.98 0.95 0.89 0.80
Indonesia 0.97 0.95 0.91 0.84 0.75
Weighted average 0.93 0.89 0.84 0.77 0.68
Un-weighted average 0.87 0.82 0.76 0.67 0.56
Total G20
Weighted average 0.65 0.62 0.61 0.57 0.49
Un-weighted average 0.74 0.68 0.61 0.52 0.40
Source: IMF International Financial Statistics, IMF WEO database October 2010, S&P Global Stock Markets Factbook (2010), updated and extended version of dataset constructed by Lane and Milesi-Ferretti (2007), Thompson DataStream, UN Census Bureau, Penn World Tables and Bank calculations.
(a) Excluding Saudi Arabia due to unavailability of data.
(b) Weighted averages use each country’s equity market capitalisation as weights.
(c) Numbers may differ slightly to those in the text due to rounding.