Embed Size (px)
Citation preview
20th Annual Oklahoma Clean Lakes and Watersheds Association Conference
April 7-8, 2011
Andrew Fang, Mark Derichsweiler
Jim Patek, Monica Suarez

1. Project background
2. Project area
3. SWAT watershed model
4. BATHTUB lake model
5. Sensitivity analysis
6. Monte Carlo uncertainty analysis and MOS
7. Preliminary TMDL

SWS Lakes in Oklahoma
Sources of public or private water supply
Many of them are small municipal reservoirs with a watershed < 100 mi2
81 SWS lakes in Oklahoma
Long term average Chl-a standard of 10 µg/L
22 SWS lakes on 2008 303(d) list due to high Chl-a

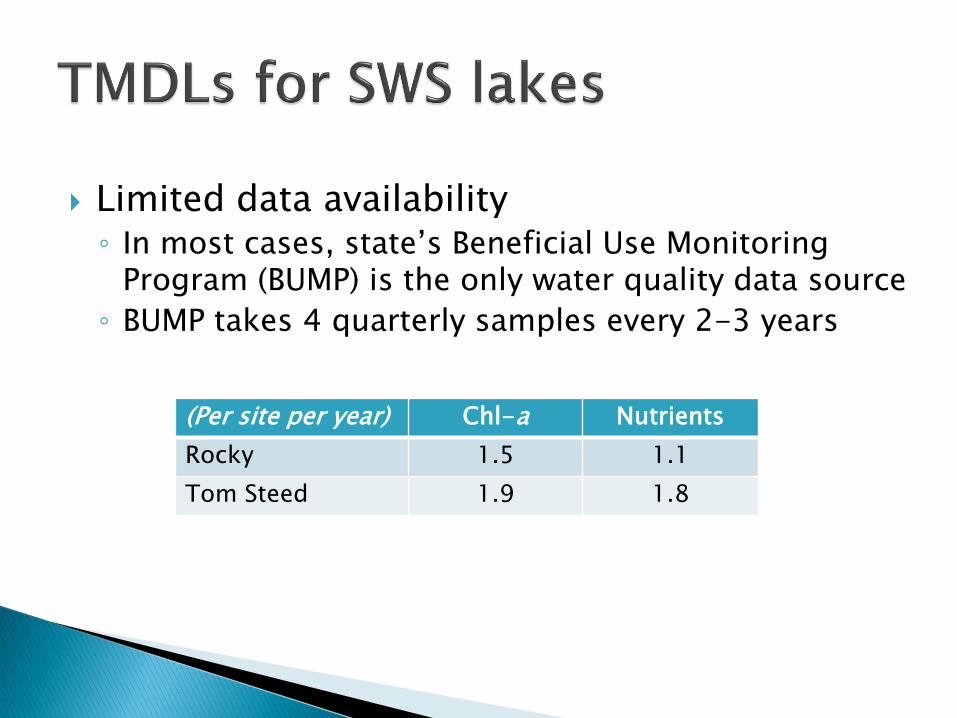
Limited data availability ◦ In most cases, state’s Beneficial Use Monitoring
Program (BUMP) is the only water quality data source
◦ BUMP takes 4 quarterly samples every 2-3 years
(Per site per year) Chl-a Nutrients
Rocky 1.5 1.1
Tom Steed 1.9 1.8
We needed an acceptable method to develop Chl-a TMDLs for the lakes
Data availability does not support complex hydrodynamic/water quality models such as EFDC
Simpler models calibrated against long-term average values of monitoring data are best fit

North Fork of the Red

Annual Climatology
Precipitation 29.7”
Temperature 60 oF
Wind speed 11 mph
Thunderstorms 44
Tornados 1

Tom Steed 119 120,176,000 25.9 4.64
Rocky 55 3,784,000 1.376 2.75

Rocky Steed
Wheat 66% 42%
Shrub 16 36
Grass 6 7
Forest 2 4

No stream monitoring stations within either of the two lake watersheds
Stations in the larger 8-digit HUC watershed: North Fork of the Red River
A SWAT model was set up for the larger watershed

Watershed Monitoring 2 USGS gage stations: 1998/2000-2008 6 TSS stations: 18-22 samples in 2 years 2 nutrients stations: 38 samples in 4 years

Flows and loadings
70 subwatersheds and 1,970 HRUs
Local pasture, wheat, and cotton operations
County level soil test P levels

0
10
20
30
40
50
60
70
80
Jan-98 Jan-99 Jan-00 Dec-00 Dec-01 Dec-02 Dec-03 Dec-04 Dec-05 Dec-06 Dec-07 Dec-08
Mo
nth
ly A
vera
ge F
low
(m
3 /s)
Date
USGS Gage 07307028 (Subbasin 63)
Observed
Modeled
ValidationCalibration
0
2
4
6
8
10
12
14
16
Jan-98 Jan-99 Jan-00 Dec-00 Dec-01 Dec-02 Dec-03 Dec-04 Dec-05 Dec-06 Dec-07 Dec-08
Mo
nth
ly A
vera
ge F
low
(m
3 /s)
Date
USGS Gage 07307010 (Subbasin 53)
Observed
ModeledValidationCalibration
Calibration Validation
Model error (annual) -12% 3%
r2 (monthly) 0.86 0.87
NSE (monthly) 0.85 0.87

TSS average at the 6 monitoring stations
0
50
100
150
200
250
20 26 51 53 24 34
Av
era
ge
TS
S C
on
cen
tra
tio
n (
mg
/L)
Subbasin
Observed
Modeled
ValidationCalibration
Error=15%
Error=0%
Error=-10%
Error=-5%
Error=13%
Error=9%

0.0
0.2
0.4
0.6
0.8
1.0
1.2
1.4
1.6
1.8
2.0
OrgP PO4 TP OrgN NH4 NOx TN
Ave
rage
Co
nce
ntr
atio
n (
mg/
L)
Parameter
Subbasin 26 - Elk Creek near Hobart
Observed
Modeled
0.0
0.2
0.4
0.6
0.8
1.0
1.2
1.4
OrgP PO4 TP OrgN NH4 NOx TN
Ave
rage
Co
nce
ntr
atio
n (
mg/
L)
Parameter
Subbasin 51 - North Fork Red River near Headrick
Observed
Modeled
Nutrients

Summary of Model Performance for Water Quality
Parameter Subbasin
Average
observed
(mg/L)
Average
modeled
(mg/L)
Error NSE r2
TSS
20 67.14 77.5 15% 0.643 0.694
24 87.42 98.8 13% 0.778 0.985
26 121.55 121.8 0% 0.869 0.921
34 180.15 197.2 9% 0.861 0.895
51 172.23 155.1 -10% 0.840 0.846
53 55.10 52.3 -5% 0.647 0.709
Total Phosphorus 26 0.226 0.186 -17% 0.744 0.803
51 0.138 0.126 -8% 0.661 0.665
Total Nitrogen 26 1.794 1.568 -13% 0.579 0.665
51 1.148 1.114 -3% 0.796 0.821
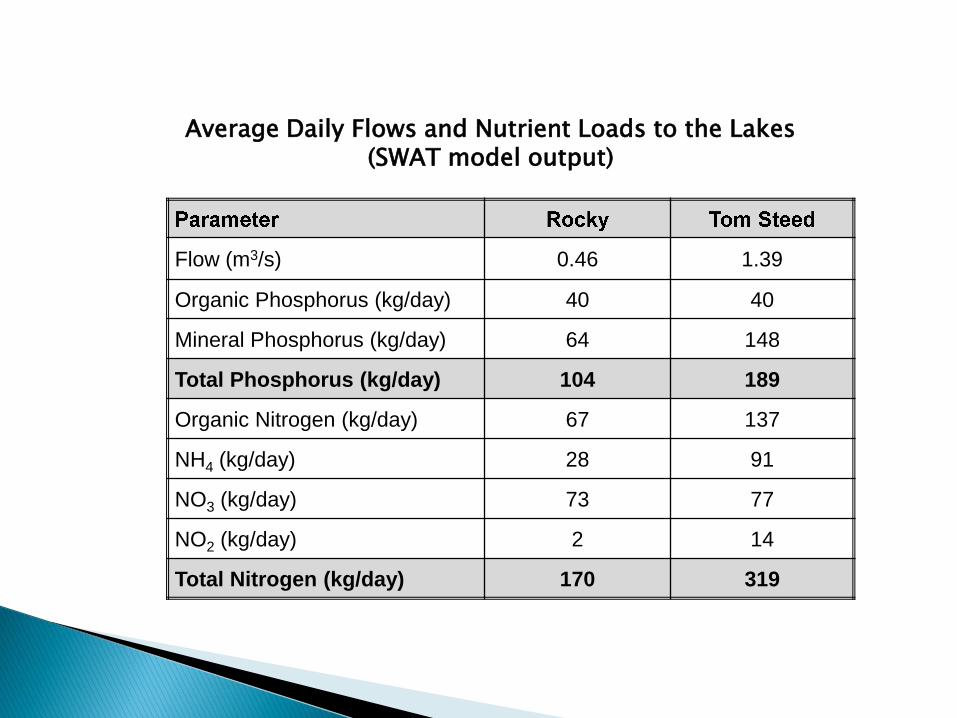
Average Daily Flows and Nutrient Loads to the Lakes (SWAT model output)
Flow (m3/s) 0.46 1.39
Organic Phosphorus (kg/day) 40 40
Mineral Phosphorus (kg/day) 64 148
Total Phosphorus (kg/day) 104 189
Organic Nitrogen (kg/day) 67 137
NH4 (kg/day) 28 91
NO3 (kg/day) 73 77
NO2 (kg/day) 2 14
Total Nitrogen (kg/day) 170 319

Calibration

Average Morphometric Characteristics
Tom Steed 120,176,000 25.9 4.64
Rocky 3,784,000 1.376 2.75
Total P (µg/L) 70.4 73.0
Total N (µg/L) 739.8 759
Chl-a (µg/L) 16.6 16.6
Secchi (meter) 0.4 0.38
Total P (µg/L) 130.2 133.0
Total N (µg/L) 1452 1519
Chl-a (µg/L) 44.9 44.9
Secchi (meter) 0.3 0.29
BATHTUB and Field Observations

How can we quantify the uncertainty associated with the limited water quality data and a non-mechanistic model?
(how confident are we when we set a load reduction goal to achieve an in-lake Chl-a level?)

“Random” values are selected for model parameters ◦ Random, but still based on the range and frequency
of possible values
The model is calculated using these values

The process is repeated hundreds or thousands of times, each time using different randomly-selected values
Results represent the range and frequency of possible model output

Monte Carlo Uncertainty Analysis for BATHTUB
Calibrate Model
Choose most sensitive parameters
Determine parameter distributions
Given a TP load reduction, run BATHTUB many times with parameter values randomly sampled from the distributions
Probability distribution of BATHTUB results
Input to TMDL

Narrow down the parameters

0.0
2.0
4.0
6.0
8.0
10.0
12.0
14.0
16.0
18.0
20.0
0% 50% 100% 150% 200%
SE
NS
ITIV
ITY
OF
RE
SU
LT
S
Maxim
um
Ch
an
ge in
Ou
tpu
t V
ari
able
of C
on
cern
Average Change in Parameter (%)
VARIABILITY IN STUDY ASSUMPTIONS AND INPUTS
total nitrogen calibration factor
total phosphorus calibration factor
annual evaporation
annual precipitation
chlorophyll-a temporal CV
inflow
chlorophyll-a flushing term
chlorophyll-a/ secchi depth slope factor
dispersion calibration factor
mixed layer depth
non-algal turbidity
chlorophyll-a calibration factor
organic nitrogen calibration factor
Secchi depth calibration factor
Sensitivity Matrix for BATHTUB Parameters for Tom Steed
• non-algal turbidity • annual average evaporation • chlorophyll-a calibration factor • inflow rate • mixed layer depth

Sensitivity Matrix for BATHTUB Parameters for Rocky
• non-algal turbidity • chlorophyll-a calibration factor • chl-a/Secchi depth slope factor • TP calculation factor • TN calculation factor
0.02.04.06.08.0
10.012.014.016.018.020.022.024.026.028.030.032.034.036.038.040.042.044.046.0
0% 50% 100% 150% 200%
Average Change in Parameter (%)
VARIABILITY IN STUDY ASSUMPTIONS AND INPUTS
SE
NS
ITIV
ITY
OF
RE
SU
LT
S
Maxim
um
Ch
an
ge i
n O
utp
ut
Vari
ab
le o
f C
on
cern
total nitrogen calibration factor
total phosphorus calibration factor
annual evaporation
annual precipitation
chlorophyll-a temporal CV
inflow
chlorophyll-a f lushing term
chlorophyll-a/ secchi depth slope factor
dispersion calibration factor
mixed layer depth
non-algal turbidity
chlorophyll-a calibration factor
organic nitrogen calibration factor
Secchi depth calibration factor

Selected Distribution of Parameters for BATHTUB Uncertainty Analysis
a Non-algal turbidity (1/m) Normal (Steed: mean = 2.21, std.dev. = 1.348;
Rocky: mean = 2.33, std.dev. = 0.65)
CB Calibration factor for chlorophyll-a Normal (Steed: mean = 1.5, std.dev. = 0.25;
Rocky: mean = 2.0, std.dev. = 0.25)
evp Annual Evaporation (m/yr) Normal (Steed: mean = 2.07, std.dev. = 0.621)
b Chl-a/Secchi depth slope factor (m2/mg) Normal (Rocky: mean = 0.025, std.dev. =
0.015)
Q Inflow (hm3/yr) Normal (Steed: mean = 45.44, std.dev. = 33.6)
zmx Mixed Layer Depth Normal (Steed: mean = 4.0, std.dev. = 1.5)
CP Total P calibration factor Normal (Rocky: mean = 0.35, std.dev. = 0.2)
CN Total N calibration factor Normal (Rocky: mean = 0.8, std.dev. = 0.5)

Monte Carlo Simulations
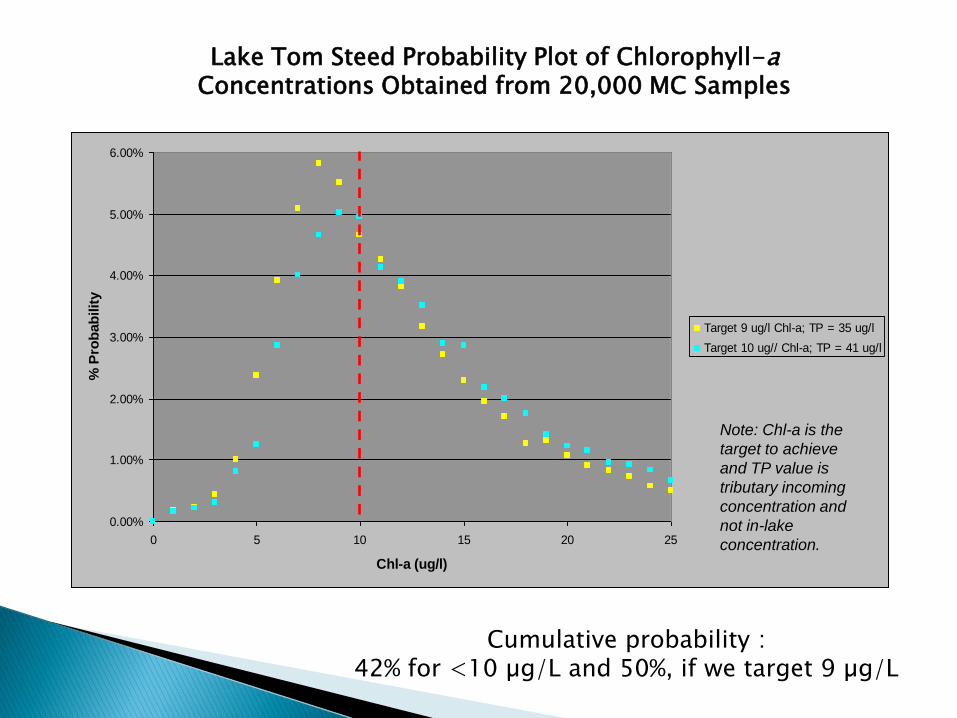
Lake Tom Steed Probability Plot of Chlorophyll-a Concentrations Obtained from 20,000 MC Samples
Cumulative probability : 42% for <10 µg/L and 50%, if we target 9 µg/L
0.00%
1.00%
2.00%
3.00%
4.00%
5.00%
6.00%
0 5 10 15 20 25
Chl-a (ug/l)
% P
rob
ab
ilit
y
Target 9 ug/l Chl-a; TP = 35 ug/l
Target 10 ug// Chl-a; TP = 41 ug/l
Note: Chl-a is the
target to achieve
and TP value is
tributary incoming
concentration and
not in-lake
concentration.

Rocky Lake Probability Plot of Chlorophyll-a Concentrations Obtained from 20,000 MC Samples
Cumulative probability : 57% for <10 µg/L and 75% if we target 9 µg/L
0.00%
2.00%
4.00%
6.00%
8.00%
10.00%
12.00%
0 5 10 15 20 25
Chl-a (ug/l)
% P
rob
ab
ilit
y
Target 9 ug/l Chl-a; TP = 18.5 ug/l
Target 10 ug/l Chl-a; TP = 20.5 ug/l
Note: Chl-a is the
target to achieve
and TP value is
tributary incoming
concentration and
not in-lake
concentration.

1. Explicit: lower target Chl-a level in the lake by a percentage (MOS) until achieving a certain target probability level (> 50%)
2. Implicit: reduction for both TP and TN

10 µg/L (WQS)
MOS: 0%
Prob: 42%
9 µg/L
MOS: 10%
Prob: 50%
8 µg/L MOS: 20%
Prob: 70%
0
5
10
15
20
25
30
35
40
45
0.00% 10.00% 20.00% 30.00% 40.00% 50.00% 60.00% 70.00% 80.00% 90.00% 100.00%
Cumulative Probability
Ch
l-a
(u
g/l)
Target 9 ug/l Chl-a; TP = 35 ug/l
Target 10 ug/l Chl-a; TP = 41 ug/l
Tom Steed Lake
10
8
9

Rocky Tom Steed
Maximum Allowable Load of TP (kg/year) 5,000 24,000
Maximum Allowable Load of TN (kg/year) 8,000 41,000
% Reduction 87% 65%
Load Reduction Goals for Both Nutrients
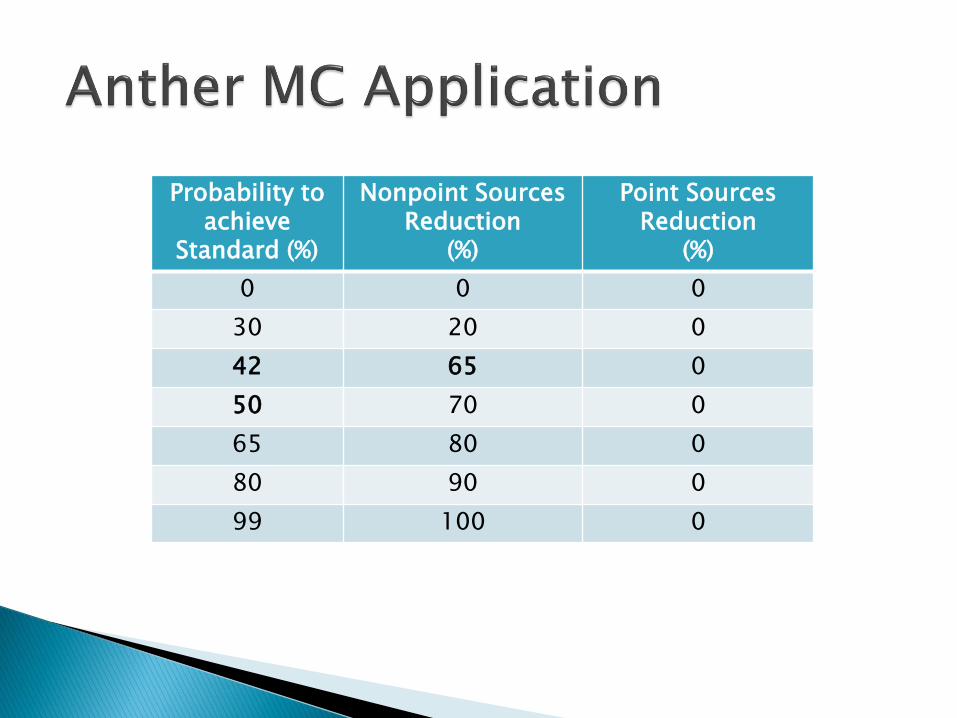
Probability to achieve
Standard (%)
Nonpoint Sources Reduction
(%)
Point Sources Reduction
(%)
0 0 0
30 20 0
42 65 0
50 70 0
65 80 0
80 90 0
99 100 0

What is the MOS?

Rocky Lake
TP 12 0 12 Implicit
TN 22 0 22 Implicit
Tom Steed Lake
TP 48 0 48 10%
TN 98 0 98 10%
Translate annual loading rates to DAILY values:
MDL = LTA x e zσ-0.5σ2


Model a larger watershed to include monitoring sites and multiple target lakes
Non-mechanistic model for lakes with limited monitoring data
Monte Carlo uncertainty analysis
Explicit and implicit MOS