Embed Size (px)
Citation preview
Validation and Calibration of a Computer Simulation Model of Pediatric HIV Infection
CitationCiaranello, A. L., B. L. Morris, R. P. Walensky, M. C. Weinstein, S. Ayaya, K. Doherty, V. Leroy, et al. 2013. “Validation and Calibration of a Computer Simulation Model of Pediatric HIV Infection.” PLoS ONE 8 (12): e83389. doi:10.1371/journal.pone.0083389. http://dx.doi.org/10.1371/journal.pone.0083389.
Published Versiondoi:10.1371/journal.pone.0083389
Permanent linkhttp://nrs.harvard.edu/urn-3:HUL.InstRepos:11879230
Terms of UseThis article was downloaded from Harvard University’s DASH repository, and is made available under the terms and conditions applicable to Other Posted Material, as set forth at http://nrs.harvard.edu/urn-3:HUL.InstRepos:dash.current.terms-of-use#LAA
Share Your StoryThe Harvard community has made this article openly available.Please share how this access benefits you. Submit a story .
Accessibility
Validation and Calibration of a Computer SimulationModel of Pediatric HIV InfectionAndrea L. Ciaranello1,3,4*, Bethany L. Morris2, Rochelle P. Walensky1,2,3,4,6, Milton C. Weinstein7, SamuelAyaya9, Kathleen Doherty2, Valeriane Leroy10, Taige Hou2, Sophie Desmonde10, Zhigang Lu2, FarzadNoubary2, Kunjal Patel8, Lynn Ramirez-Avila3,11,12, Elena Losina2,5,6,13, George R. Seage III8, Kenneth A.Freedberg1,2,3,6,7,14
1 Division of Infectious Diseases, Massachusetts General Hospital, Boston, Massachusetts, United States of America, 2 Division of General Medicine,Massachusetts General Hospital, Boston, Massachusetts, United States of America, 3 Medical Practice Evaluation Center, Massachusetts General Hospital,Boston, Massachusetts, United States of America, 4 Division of Infectious Diseases, Brigham and Women's Hospital, Boston, Massachusetts, United States ofAmerica, 5 Department of Medicine, and Department of Orthopedic Surgery, Brigham and Women's Hospital, Boston, Massachusetts, United States of America,6 The Center for AIDS Research, Harvard University, Boston, Massachusetts, United States of America, 7 The Department of Health Policy and Management,Harvard School of Public Health, Boston, Massachusetts, United States of America, 8 The Department of Epidemiology, Harvard School of Public Health,Boston, Massachusetts, United States of America, 9 Department of Child Health and Pediatrics, Moi University, Eldoret, Kenya, 10 Inserm, Unit 897, Institut deSanté Publique et de Développement, Université Bordeaux Segalen 2, Bordeaux, France, 11 Children's Hospital Boston, Boston, Massachusetts, United Statesof America, 12 Department of Pediatrics, Division of Pediatric Infectious Diseases, University of California Los Angeles, Los Angeles, California, United States ofAmerica, 13 The Department of Biostatistics, Boston University School of Public Health, Boston, Massachusetts, United States of America, 14 The Departmentof Epidemiology, Boston University School of Public Health, Boston, Massachusetts, United States of America
Abstract
Background: Computer simulation models can project long-term patient outcomes and inform health policy. Weinternally validated and then calibrated a model of HIV disease in children before initiation of antiretroviral therapy toprovide a framework against which to compare the impact of pediatric HIV treatment strategies.Methods: We developed a patient-level (Monte Carlo) model of HIV progression among untreated children <5 yearsof age, using the Cost-Effectiveness of Preventing AIDS Complications model framework: the CEPAC-Pediatricmodel. We populated the model with data on opportunistic infection and mortality risks from the InternationalEpidemiologic Database to Evaluate AIDS (IeDEA), with mean CD4% at birth (42%) and mean CD4% decline (1.4%/month) from the Women and Infants’ Transmission Study (WITS). We internally validated the model by varyingWITS-derived CD4% data, comparing the corresponding model-generated survival curves to empirical survivalcurves from IeDEA, and identifying best-fitting parameter sets as those with a root-mean square error (RMSE) <0.01.We then calibrated the model to other African settings by systematically varying immunologic and HIV mortality-related input parameters. Model-generated survival curves for children aged 0-60 months were compared, againusing RMSE, to UNAIDS data from >1,300 untreated, HIV-infected African children.Results: In internal validation analyses, model-generated survival curves fit IeDEA data well; modeled and observedsurvival at 16 months of age were 91.2% and 91.1%, respectively. RMSE varied widely with variations in CD4%parameters; the best fitting parameter set (RMSE = 0.00423) resulted when CD4% was 45% at birth and declined by6%/month (ages 0-3 months) and 0.3%/month (ages >3 months). In calibration analyses, increases in IeDEA-derivedmortality risks were necessary to fit UNAIDS survival data.Conclusions: The CEPAC-Pediatric model performed well in internal validation analyses. Increases in modeledmortality risks required to match UNAIDS data highlight the importance of pre-enrollment mortality in many pediatriccohort studies.
Citation: Ciaranello AL, Morris BL, Walensky RP, Weinstein MC, Ayaya S, et al. (2013) Validation and Calibration of a Computer Simulation Model ofPediatric HIV Infection. PLoS ONE 8(12): e83389. doi:10.1371/journal.pone.0083389
Editor: Ravi Jhaveri, University of North Carolina School of Medicine, United States of America
Received May 16, 2013; Accepted November 4, 2013; Published December 13, 2013
Copyright: © 2013 Ciaranello et al. This is an open-access article distributed under the terms of the Creative Commons Attribution License, which permitsunrestricted use, distribution, and reproduction in any medium, provided the original author and source are credited.
Funding: This work was supported by the National Institutes of Health (International Maternal Pediatric Adolescent AIDS Clinical Trials Group (IMPAACT);National Institute of Allergy and Infectious Diseases, through K01 AI078754, K24 AI062476, R01 AI058736, R01 AI093269 (RPW), U01 AI069911,U01AI09919 (IeDEA West Africa); the Harvard Center for AIDS Research); the Elizabeth Glaser Pediatric AIDS Foundation, the March of DimesFoundation, and the Massachusetts General Hospital Executive Committee on Research. Overall support for IMPAACT was provided by the NationalInstitute of Allergy and Infectious Diseases (NIAID) [U01 AI068632], the Eunice Kennedy Shriver National Institute of Child Health and HumanDevelopment (NICHD), and the National Institute of Mental Health (NIMH) [AI068632]. The content is solely the responsibility of the authors and does notnecessarily represent the official views of the NIH. This work was supported by the Statistical and Data Analysis Center at Harvard School of Public Health,under the National Institute of Allergy and Infectious Diseases cooperative agreement #5 U01 AI41110 with the Pediatric AIDS Clinical Trials Group
PLOS ONE | www.plosone.org 1 December 2013 | Volume 8 | Issue 12 | e83389
(PACTG) and #1 U01 AI068616 with the IMPAACT Group. Support of the sites was provided by the National Institute of Allergy and Infectious Diseases(NIAID) and the NICHD International and Domestic Pediatric and Maternal HIV Clinical Trials Network funded by NICHD (contract number N01-DK-9-001/HHSN267200800001C). Sophie Desmonde is a fellow of the École des Hautes Etudes en Santé Publique (EHESP), Rennes, France. The funders had norole in study design, data analysis, interpretation of results, or decision to publish.
Competing interests: The authors have declared that no competing interests exist.
* . E-mail: [email protected]
Introduction
Key clinical and operational research questions related toprevention, diagnosis, and therapy for HIV-infected childrenremain unanswered. For example, estimates of the long-termoutcomes of immediate versus deferred ART initiationstrategies for children 0-5 years of age, the cost-effectivenessof alternative first-line ART regimens, and the relative value ofearly infant diagnosis algorithms are needed to inform HIV careguidelines [1–3].
While clinical trials and cohort studies will continue toaddress these questions, computer simulation modelscomprise important adjuncts to these more traditional researchmethods. Models can integrate available data, project long-term clinical and economic outcomes beyond study periods,identify influential parameters for which additional data areneeded, and inform care and treatment guidelines [4–14]. Todate, three published analyses have reported on simulationmodels of HIV-infected children: a Markov model used toevaluate the cost-effectiveness of cotrimoxazole prophylaxisand of laboratory monitoring of ART, and a decision-analyticmodel of strategies for early infant diagnosis [15–17].
The Cost-Effectiveness of Preventing AIDS Complications(CEPAC) model is a validated, individual patient-level (MonteCarlo) simulation of HIV disease in adults that has informedHIV testing and treatment policy in the United States andinternationally [4,5,18–22]. Building on the adult CEPAC modelplatform, we developed a simulation model of HIV disease ininfants and children <5 years of age, the CEPAC-Pediatricmodel, to address policy questions related to prevention,diagnosis and treatment of pediatric HIV. The objectives of thisanalysis were to internally validate the structure of the CEPAC-Pediatric model; to calibrate the model to survival data fromuntreated HIV-infected children in sub-Saharan Africa; and todescribe this work in an open-access forum usingrecommended reporting practices [23–25].
Methods
EthicsThis work was approved by the Partners Healthcare IRB.
Analytic overviewWe developed a microsimulation model of pediatric HIV
disease progression, the CEPAC-Pediatric model. As in theadult CEPAC model, clinical events are first simulated andvalidated in the absence of ART (a "natural history" model), inorder to describe disease progression in the absence of ARTand to provide a framework against which to compare theimpact of HIV treatment [4,5]. In collaboration with the
International Epidemiologic Databases to Evaluate AIDS(IeDEA) consortium [26,27], we derived model inputparameters for the CEPAC-Pediatric model, reflectingoutcomes in HIV-infected children prior to the initiation of ART.These model input data included rates of WHO Stage 3 andStage 4 clinical events, tuberculosis (TB), and mortality [28],stratified by age and CD4%.
Internal model validation is a formal methodology to assessthe validity of model structure. In internal calibration, theempiric data values used in the modeling analysis ("modelinputs") are compared to model-generated results ("modeloutputs"), in order to assess model performance for analysesrelated to a single data set [19,24,25,29–31]. We conductedinternal model validation by comparing model-generatedresults to the clinical event and mortality risks observed in thesame IeDEA cohort that contributed model input data. Forinternal validation, selected immunologic parameters that werenot available from IeDEA were based on data from the Womenand Infants' Transmission Study (WITS) [32–34].
Model calibration is a methodology distinct from validation. Inmodel calibration, sometimes referred to as “model fitting,”investigators identify the values for key data parameters thatwill allow model projections to match empiric observations.Calibration seeks to explicitly modify model input parameters,in order to make the model useful for predicting outcomes incohorts or datasets distinct from the dataset used in internalvalidation [19,23–25,29]. The IeDEA East African cohortrepresents a highly selected population of children withexcellent access to HIV care. In order to produce analysesmore generalizable to other African settings, we identified dataparameter sets that allowed model output to match publishedsurvival curves from a pooled UNAIDS analysis of >1,300untreated, perinatally HIV-infected children in eight sub-Saharan African countries [30,35–38].
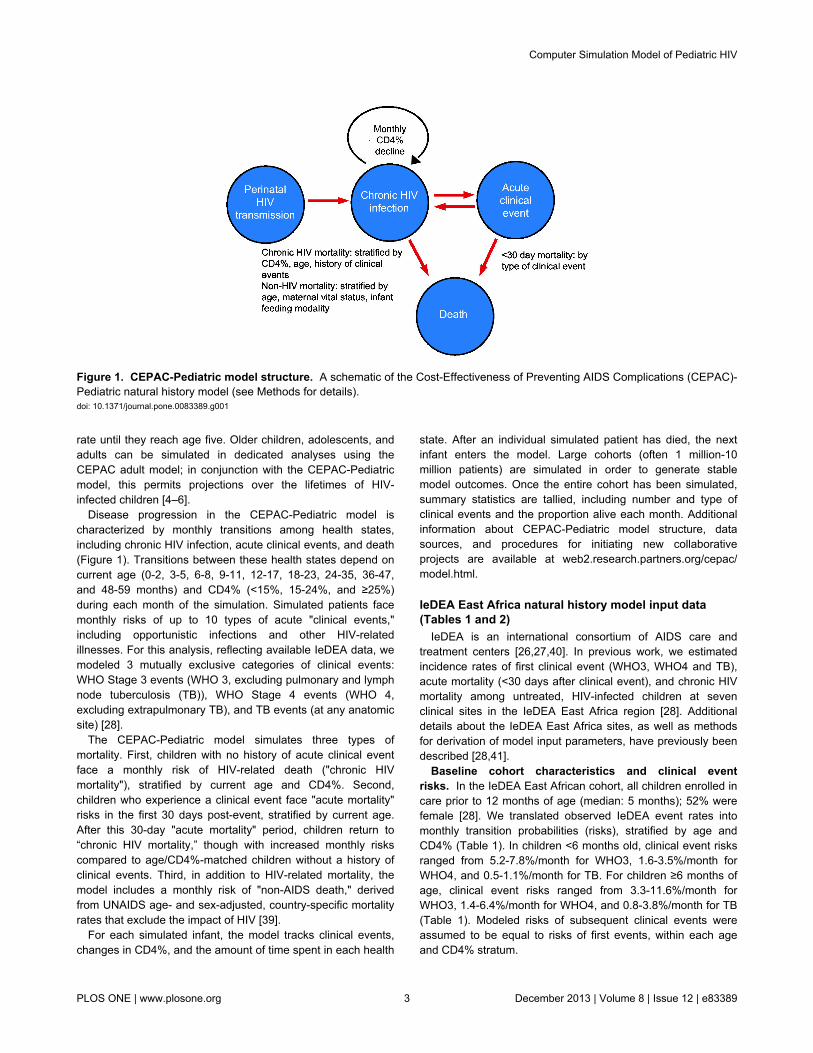
Model structureThe CEPAC-Pediatric model is a first-order, patient-level
Monte Carlo simulation model (Figure 1). Infants enter thenatural history model at birth, and are assumed to have beenHIV-infected either in utero or during delivery (intrapartum). Arandom number generator is used to draw from user-specifieddistributions of maternal HIV status (CD4 ≤350/μL or >350/μL;receiving or not receiving ART), PMTCT exposure;breastfeeding or replacement feeding; and infant CD4% at birth(percentage of total lymphocytes that are CD4+ cells). Wemodeled CD4% as the primary immunologic measure forchildren <5 years of age because absolute CD4 count declinesdramatically with age, even in the absence of HIV infection,and CD4% is therefore a more stable marker of immunefunction as children age [3]. In the absence of ART, eachsimulated child's CD4% declines monthly at a user-specified
Computer Simulation Model of Pediatric HIV
PLOS ONE | www.plosone.org 2 December 2013 | Volume 8 | Issue 12 | e83389
rate until they reach age five. Older children, adolescents, andadults can be simulated in dedicated analyses using theCEPAC adult model; in conjunction with the CEPAC-Pediatricmodel, this permits projections over the lifetimes of HIV-infected children [4–6].
Disease progression in the CEPAC-Pediatric model ischaracterized by monthly transitions among health states,including chronic HIV infection, acute clinical events, and death(Figure 1). Transitions between these health states depend oncurrent age (0-2, 3-5, 6-8, 9-11, 12-17, 18-23, 24-35, 36-47,and 48-59 months) and CD4% (<15%, 15-24%, and ≥25%)during each month of the simulation. Simulated patients facemonthly risks of up to 10 types of acute "clinical events,"including opportunistic infections and other HIV-relatedillnesses. For this analysis, reflecting available IeDEA data, wemodeled 3 mutually exclusive categories of clinical events:WHO Stage 3 events (WHO 3, excluding pulmonary and lymphnode tuberculosis (TB)), WHO Stage 4 events (WHO 4,excluding extrapulmonary TB), and TB events (at any anatomicsite) [28].
The CEPAC-Pediatric model simulates three types ofmortality. First, children with no history of acute clinical eventface a monthly risk of HIV-related death ("chronic HIVmortality"), stratified by current age and CD4%. Second,children who experience a clinical event face "acute mortality"risks in the first 30 days post-event, stratified by current age.After this 30-day "acute mortality" period, children return to“chronic HIV mortality,” though with increased monthly riskscompared to age/CD4%-matched children without a history ofclinical events. Third, in addition to HIV-related mortality, themodel includes a monthly risk of "non-AIDS death," derivedfrom UNAIDS age- and sex-adjusted, country-specific mortalityrates that exclude the impact of HIV [39].
For each simulated infant, the model tracks clinical events,changes in CD4%, and the amount of time spent in each health
state. After an individual simulated patient has died, the nextinfant enters the model. Large cohorts (often 1 million-10million patients) are simulated in order to generate stablemodel outcomes. Once the entire cohort has been simulated,summary statistics are tallied, including number and type ofclinical events and the proportion alive each month. Additionalinformation about CEPAC-Pediatric model structure, datasources, and procedures for initiating new collaborativeprojects are available at web2.research.partners.org/cepac/model.html.
IeDEA East Africa natural history model input data(Tables 1 and 2)
IeDEA is an international consortium of AIDS care andtreatment centers [26,27,40]. In previous work, we estimatedincidence rates of first clinical event (WHO3, WHO4 and TB),acute mortality (<30 days after clinical event), and chronic HIVmortality among untreated, HIV-infected children at sevenclinical sites in the IeDEA East Africa region [28]. Additionaldetails about the IeDEA East Africa sites, as well as methodsfor derivation of model input parameters, have previously beendescribed [28,41].
Baseline cohort characteristics and clinical eventrisks. In the IeDEA East African cohort, all children enrolled incare prior to 12 months of age (median: 5 months); 52% werefemale [28]. We translated observed IeDEA event rates intomonthly transition probabilities (risks), stratified by age andCD4% (Table 1). In children <6 months old, clinical event risksranged from 5.2-7.8%/month for WHO3, 1.6-3.5%/month forWHO4, and 0.5-1.1%/month for TB. For children ≥6 months ofage, clinical event risks ranged from 3.3-11.6%/month forWHO3, 1.4-6.4%/month for WHO4, and 0.8-3.8%/month for TB(Table 1). Modeled risks of subsequent clinical events wereassumed to be equal to risks of first events, within each ageand CD4% stratum.
Figure 1. CEPAC-Pediatric model structure. A schematic of the Cost-Effectiveness of Preventing AIDS Complications (CEPAC)-Pediatric natural history model (see Methods for details).doi: 10.1371/journal.pone.0083389.g001
Computer Simulation Model of Pediatric HIV
PLOS ONE | www.plosone.org 3 December 2013 | Volume 8 | Issue 12 | e83389
Mortality risks. For children with no history of clinicalevents, monthly risks of chronic HIV mortality ranged by CD4%from 0.3-0.4%. For children with a clinical event, the 30-dayrisk of acute mortality following a WHO3 or WHO4 event was3.4%, and the risk following TB events was 2.8%. After the 30-day period post-event, monthly risks of "chronic HIV mortality"ranged by CD4% from 0.4-2.4%. Non-AIDS death risks(reflecting age- and sex-adjusted mortality rates) were held atzero for internal validation analyses, since all observed deathsin the IeDEA cohort were coded as HIV-related and thus
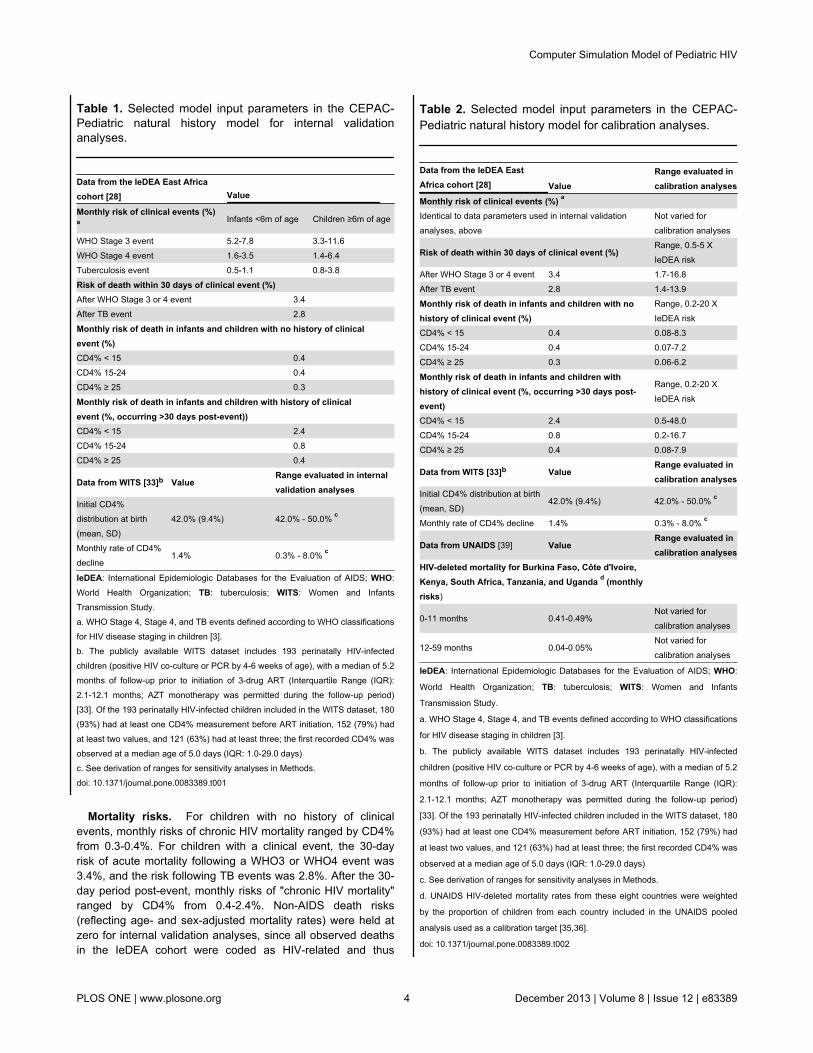
Table 1. Selected model input parameters in the CEPAC-Pediatric natural history model for internal validationanalyses.
Data from the IeDEA East Africacohort [28] Value Monthly risk of clinical events (%)a Infants <6m of age Children ≥6m of age
WHO Stage 3 event 5.2-7.8 3.3-11.6 WHO Stage 4 event 1.6-3.5 1.4-6.4 Tuberculosis event 0.5-1.1 0.8-3.8
Risk of death within 30 days of clinical event (%) After WHO Stage 3 or 4 event 3.4 After TB event 2.8
Monthly risk of death in infants and children with no history of clinicalevent (%)
CD4% < 15 0.4 CD4% 15-24 0.4 CD4% ≥ 25 0.3
Monthly risk of death in infants and children with history of clinicalevent (%, occurring >30 days post-event))
CD4% < 15 2.4 CD4% 15-24 0.8 CD4% ≥ 25 0.4
Data from WITS [33]b ValueRange evaluated in internalvalidation analyses
Initial CD4%distribution at birth(mean, SD)
42.0% (9.4%) 42.0% - 50.0% c
Monthly rate of CD4%decline
1.4% 0.3% - 8.0% c
IeDEA: International Epidemiologic Databases for the Evaluation of AIDS; WHO:
World Health Organization; TB: tuberculosis; WITS: Women and InfantsTransmission Study.a. WHO Stage 4, Stage 4, and TB events defined according to WHO classificationsfor HIV disease staging in children [3].b. The publicly available WITS dataset includes 193 perinatally HIV-infectedchildren (positive HIV co-culture or PCR by 4-6 weeks of age), with a median of 5.2months of follow-up prior to initiation of 3-drug ART (Interquartile Range (IQR):2.1-12.1 months; AZT monotherapy was permitted during the follow-up period)[33]. Of the 193 perinatally HIV-infected children included in the WITS dataset, 180(93%) had at least one CD4% measurement before ART initiation, 152 (79%) hadat least two values, and 121 (63%) had at least three; the first recorded CD4% wasobserved at a median age of 5.0 days (IQR: 1.0-29.0 days)c. See derivation of ranges for sensitivity analyses in Methods.doi: 10.1371/journal.pone.0083389.t001
Table 2. Selected model input parameters in the CEPAC-Pediatric natural history model for calibration analyses.
Data from the IeDEA EastAfrica cohort [28] Value
Range evaluated incalibration analyses
Monthly risk of clinical events (%) a
Identical to data parameters used in internal validationanalyses, above
Not varied forcalibration analyses
Risk of death within 30 days of clinical event (%)Range, 0.5-5 XIeDEA risk
After WHO Stage 3 or 4 event 3.4 1.7-16.8After TB event 2.8 1.4-13.9
Monthly risk of death in infants and children with nohistory of clinical event (%)
Range, 0.2-20 XIeDEA risk
CD4% < 15 0.4 0.08-8.3CD4% 15-24 0.4 0.07-7.2CD4% ≥ 25 0.3 0.06-6.2
Monthly risk of death in infants and children withhistory of clinical event (%, occurring >30 days post-event)
Range, 0.2-20 XIeDEA risk
CD4% < 15 2.4 0.5-48.0CD4% 15-24 0.8 0.2-16.7CD4% ≥ 25 0.4 0.08-7.9
Data from WITS [33]b ValueRange evaluated incalibration analyses
Initial CD4% distribution at birth(mean, SD)
42.0% (9.4%) 42.0% - 50.0% c
Monthly rate of CD4% decline 1.4% 0.3% - 8.0% c
Data from UNAIDS [39] ValueRange evaluated incalibration analyses
HIV-deleted mortality for Burkina Faso, Côte d'Ivoire,Kenya, South Africa, Tanzania, and Uganda d (monthlyrisks)
0-11 months 0.41-0.49%Not varied forcalibration analyses
12-59 months 0.04-0.05%Not varied forcalibration analyses
IeDEA: International Epidemiologic Databases for the Evaluation of AIDS; WHO:
World Health Organization; TB: tuberculosis; WITS: Women and Infants
Transmission Study.
a. WHO Stage 4, Stage 4, and TB events defined according to WHO classifications
for HIV disease staging in children [3].
b. The publicly available WITS dataset includes 193 perinatally HIV-infected
children (positive HIV co-culture or PCR by 4-6 weeks of age), with a median of 5.2
months of follow-up prior to initiation of 3-drug ART (Interquartile Range (IQR):
2.1-12.1 months; AZT monotherapy was permitted during the follow-up period)
[33]. Of the 193 perinatally HIV-infected children included in the WITS dataset, 180
(93%) had at least one CD4% measurement before ART initiation, 152 (79%) had
at least two values, and 121 (63%) had at least three; the first recorded CD4% was
observed at a median age of 5.0 days (IQR: 1.0-29.0 days)
c. See derivation of ranges for sensitivity analyses in Methods.
d. UNAIDS HIV-deleted mortality rates from these eight countries were weighted
by the proportion of children from each country included in the UNAIDS pooled
analysis used as a calibration target [35,36].
doi: 10.1371/journal.pone.0083389.t002
Computer Simulation Model of Pediatric HIV
PLOS ONE | www.plosone.org 4 December 2013 | Volume 8 | Issue 12 | e83389
considered either acute or chronic HIV-related mortality. Forcalibration analyses, "non-AIDS" mortality rates were fromUNAIDS HIV-deleted life tables for the eight sub-Saharancountries which were included in the study (Table 2) [35,36,39].
WITS natural history model input data (Tables 1 and 2)Immunologic data. Because IeDEA lacked adequate
longitudinal CD4 data, we derived CD4% at birth and rate ofmonthly CD4% decline from the US-based WITS, a longitudinalcohort study (1990-2006) of HIV-infected women and theirinfants during pregnancy and the post-partum period [32–34].Using a mixed effects model for the primary analysis, weestimated a mean CD4% at birth of 42.0% (standard deviation,9.4%), and a monthly CD4% decline of 1.4%/month prior toART initiation [42]. In a secondary analysis in which CD4% waspermitted to decline by different rates in months 0-2 and 3+ oflife, we estimated a mean CD4% of 50.0% at birth, monthlydecline of 6.4%/month for months 0-2, and 0.3%/month inmonths 3+. Due to high variability around the point estimate forthis latter variable, likely due to small numbers of CD4% data inolder infants, we used these results to inform the ranges ofCD4% parameters for sensitivity analyses, rather than for theprimary analysis.
Internal model validation: Comparison of model-generated results to empiric data from the IeDEA EastAfrican region
Population and follow-up time. For internal validationanalyses, we simulated a population of HIV-infected infantsfrom birth (assuming intrauterine or intrapartum infection), withclinical characteristics of patients in the IeDEA cohort. To mostclosely match the observed IeDEA data, we evaluated model-generated results for children from 5-16 months of age,reflecting a median age at enrollment in the IeDEA cohort of 5months and a median of 11 months follow-up [28].
Internal validation: survival outcomes. We comparedmodel-generated survival curves from 5 to 16 months afterbirth to Kaplan-Meier survival curves directly from the IeDEAEast African regional data. We first assessed model resultsusing base-case parameter estimates. We then performed two-way sensitivity analyses in which we simultaneously varied thetwo parameters from WITS (CD4% at birth and monthly CD4%decline). First, CD4% at birth was varied in 1.0% incrementsfrom 42% (the result in the primary WITS analysis) to 50% (theresult from the secondary WITS analysis). This range includesthe value of 47%, which was the mean percentage recorded inthe first 1-2 days of life in a study in Durban, South Africa[43,44]. Second, the monthly rate of CD4% decline was variedfrom 0.3% (the lowest value from the secondary WITSsensitivity analysis) to 8.0% (an average of published values inthe first three months of life [43–45]). To reflect observationsthat CD4% may decline more rapidly in the first few months oflife [43,44], we permitted CD4% to decline at different rates for"younger" and "older" infants. We defined "younger" and "older"age groups using threshold values of 3, 6, or 12 months of age,and examined all combinations of CD4% at birth and monthlyCD4% decline in which CD4% decline was faster in “younger”compared to “older” children.
For each parameter set, we compared model-based survivalcurves to the empiric IeDEA survival curves at each month ofthe simulation using root-mean-square error (RMSE) [30].RMSE was calculated as the square root of the average of thesquared difference between observed and projected survivalproportions at each month over the course of the simulation(5-16 months). We defined the best-fitting survival curves asthose with a RMSE <0.01. This method was chosen because itis intuitive, computationally feasible with complex models, andappropriate for data drawn primarily from a single source[23–25,30].
Internal validation: clinical event risks. In addition toexamining survival results, we also compared the model-generated rates of clinical events to the observed rates in theIeDEA cohort. Because model-based analyses do not rely on asingle convention for comparing model results to data [24,25],we defined a good-fitting result as one where model-projectedincidence rates were within 10-15% (relative) of observed data,based on previous work [5]. To reflect as closely as possiblethe IeDEA clinical cohort, simulated infants entered the modelat birth, with the initial CD4% distribution and rates of monthlyCD4% decline identified in the best-fitting parameter set in theinternal validation survival analyses described above. Model-based incidence rates for first clinical events between 5 and 16months of age were projected for infants. Number of eventsand time at risk are not stratified by CD4% in the current modeloutput, because they were not anticipated for use in futurepolicy analyses. To directly compare model output with IeDEAdata, we re-analyzed IeDEA event rates for all children(combining all CD4% strata) at ages <6 and ≥6 months of age.
Model calibration: Comparison of model-generatedresults to published pre-ART survival curves
Calibration targets, modeled population, and follow-uptime. Following internal validation of the CEPAC-Pediatricmodel, we compared model-generated results to survival datareported in a pooled UNAIDS analysis of perinatally HIV-infected children in sub-Saharan Africa [35–38]. In this UNAIDSanalysis, data were from 12 PMTCT studies in Burkina Faso,Côte d'Ivoire, Kenya, South Africa, Tanzania, Uganda,Zimbabwe and Botswana, reflecting >1,300 perinatally infectedinfants (defined by a positive PCR test before 6 weeks of age).Among untreated infants, survival was estimated by Weibullsurvival analysis to be 64% at 6 months, 49% at 12 months,35% at 24 months, 25% at 36 months, 17% at 48 months, and12% at 60 months [35–37]. To compare model-generatedresults to these data, we used the CEPAC-Pediatric model tosimulate a cohort of infants with in utero or intrapartum HIVinfection from birth through 60 months of age.
Systematic variation in model input parameters. Weanticipated that there would be substantial differences in theCD4% at birth, rate of CD4% decline, and mortality risksbetween children in the UNAIDS and IeDEA East Africacohorts. To calibrate the model against UNAIDS data, wevaried all CD4% and HIV-related mortality parameters,individually and in combination, applying multipliers of 0.2 to 20to the mortality risks observed in the IeDEA cohort (Tables 2and 3). CD4% decline was modeled to be more rapid in the first
Computer Simulation Model of Pediatric HIV
PLOS ONE | www.plosone.org 5 December 2013 | Volume 8 | Issue 12 | e83389
3 months of life, based on results of the internal validationanalysis. Monthly risks for clinical events (WHO3, WHO4, andTB) observed in the IeDEA cohort were similar to or greaterthan those reported in the literature [45–50], and weretherefore not varied in calibration analyses. Non-AIDS mortalityrates were also held constant, using a weighted average ofUNAIDS HIV-deleted mortality data for the eight countries inthe UNAIDS analysis (Table 2) [35,36,39].
Model-generated results were compared to empiric data in astep-wise fashion based on six key time points after birth (6,12, 24, 36, 48, and 60 months). We first identified allcombinations of CD4% values and mortality risk multipliers(Table 3) that led to model-generated mortality within 1% of theUNAIDS mortality estimate at 6 months of age (63-65%). Foreach of those parameter sets, multipliers were next applied to
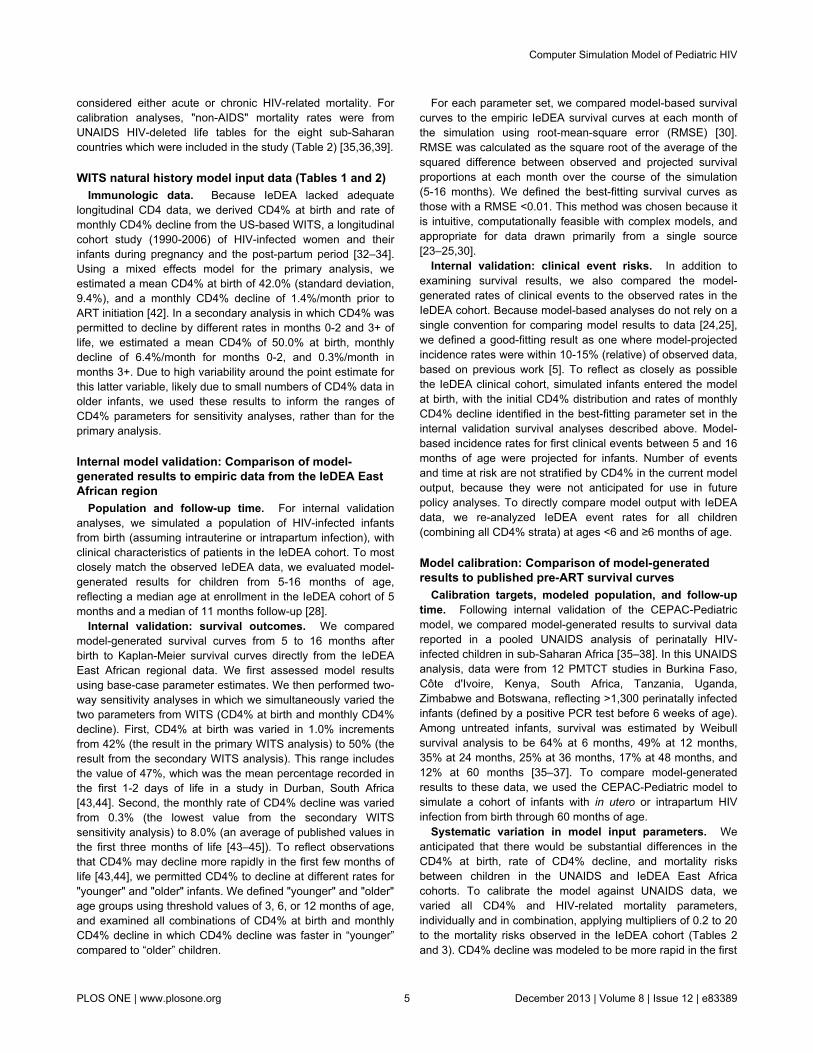
Table 3. Systematic variations in model input parametersfor calibration of CEPAC-Pediatric model.
Parameter ValuesInitial CD4% (mean % for cohort, SD = 9%)All Ages 42, 45, 47, 50
Monthly CD4% decline at each age (%) a
0-3 months 3.0, 4.0, 6.4 or 8.04-60 months 0.3, 0.5 or 1.4
Monthly risks of clinical events (%)All ages Held equal to IeDEA clinical event risks
HIV-deleted mortality risk(%)
All agesHeld equal to weighted average of HIV-deletedmortality rates from countries represented inUNAIDS cohort
Acute mortality risk (%) b
All Ages 0.5-5.0 X IeDEA risks (increments of 0.5)
Chronic HIV mortality risk c
0-6 months 1.0-20.0 X IeDEA risks (increments of 1.0)7-12 months 1.0-20.0 X IeDEA risks (increments of 1.0)13-24 months 0.5-5.0 X IeDEA risks (increments of 0.5)25-36 months 0.5-5.0 X IeDEA risks (increments of 0.5)37-48 months 0.2-2.0 X IeDEA risks (increments of 0.2)49-60 months 0.2-2.0 X IeDEA risks (increments of 0.2)
IeDEA: International Epidemiologic Database to Evaluate AIDS, East African
region. m: month.a. Values for monthly CD4% decline reflect more rapid decline in the first threemonths of life than after age three months, based on published literature [43–45],and the results of internal validation analyses.b. Acute mortality risk: risk of death within 30 days of a clinical event (WHO Stage3, WHO Stage 4, or tuberculosis; see Methods).c. Chronic HIV mortality: monthly risk of death for patients with no history of aclinical event, or for patients >30 days following a clinical event (see Methods). Inall evaluated parameter sets, multipliers for chronic HIV mortality were limited toranges in which multipliers applied at younger ages were ≥ multipliers at olderages. Risks were therefore permitted to remain constant or decrease (but notincrease) with age. This leads to a total of 294,660 parameter combinations ofchronic HIV mortality multipliers, and 141.4 million total parameter sets examined(see Methods).doi: 10.1371/journal.pone.0083389.t003
chronic HIV mortality risks for ages 7-12 months. All parametersets producing model-generated mortality risks within 1%(absolute) of the target 12-month risk (48-50%) were retainedin the next step. Chronic HIV mortality risk multipliers were thenapplied to ages 13-24 months; parameter sets leading toresults within 1% of the 24-month target (34-36%) wereretained. This process was repeated for time points of 36, 48,and 60 months. In all evaluated parameter sets, multipliers forchronic HIV mortality were limited to ranges in which multipliersapplied at younger ages were greater than or equal tomultipliers at older ages. Risks were therefore permitted toremain constant or decrease (but not increase) with age.Finally, all parameter sets leading to model results within theseranges were compared again to the UNAIDS mortality rates toidentify all parameters sets that resulted in a RMSE <0.01%.
Results
Internal model validation: Comparison of model-generated results to empiric data from IeDEA
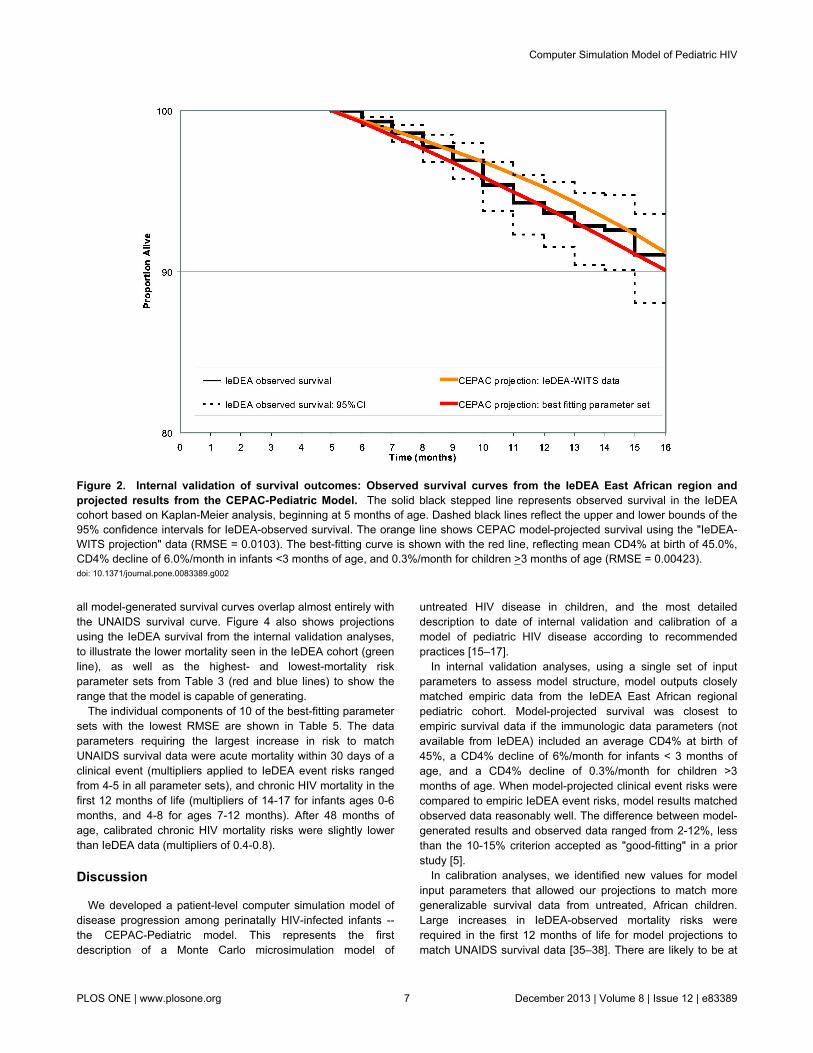
Internal validation of survival. In simulations using IeDEAclinical event risk data and WITS immunologic data ("IeDEA-WITS projections"), model-projected survival (91.2% at 16months) was slightly greater than the survival observed in theIeDEA cohort (91.1% at 16 months) (Figure 2, orange line).The RMSE for this model-generated survival curve was 0.0103,reflecting an average absolute difference of 1.03% from IeDEAobserved survival.
Systematic variation in both CD4% at birth and monthlyCD4% decline led to 3,888 evaluated parameter sets, in whichthe RMSE between model-generated and IeDEA survival datavaried widely (range, 0.00423 to 0.0798). Of these, 191parameter sets were identified as best-fitting, with a RMSE<0.01. In general, survival was overestimated in analyses inwhich CD4% at birth was high and monthly CD4% decline wasslow, and underestimated under the opposite conditions. Theparameter set with the lowest RMSE (RMSE = 0.000423)included CD4% at birth of 45.0%, monthly CD4% decline of6.0% in infants <3 months and monthly CD4% decline of 0.3%in children > 3 months (Figure 2, red line).
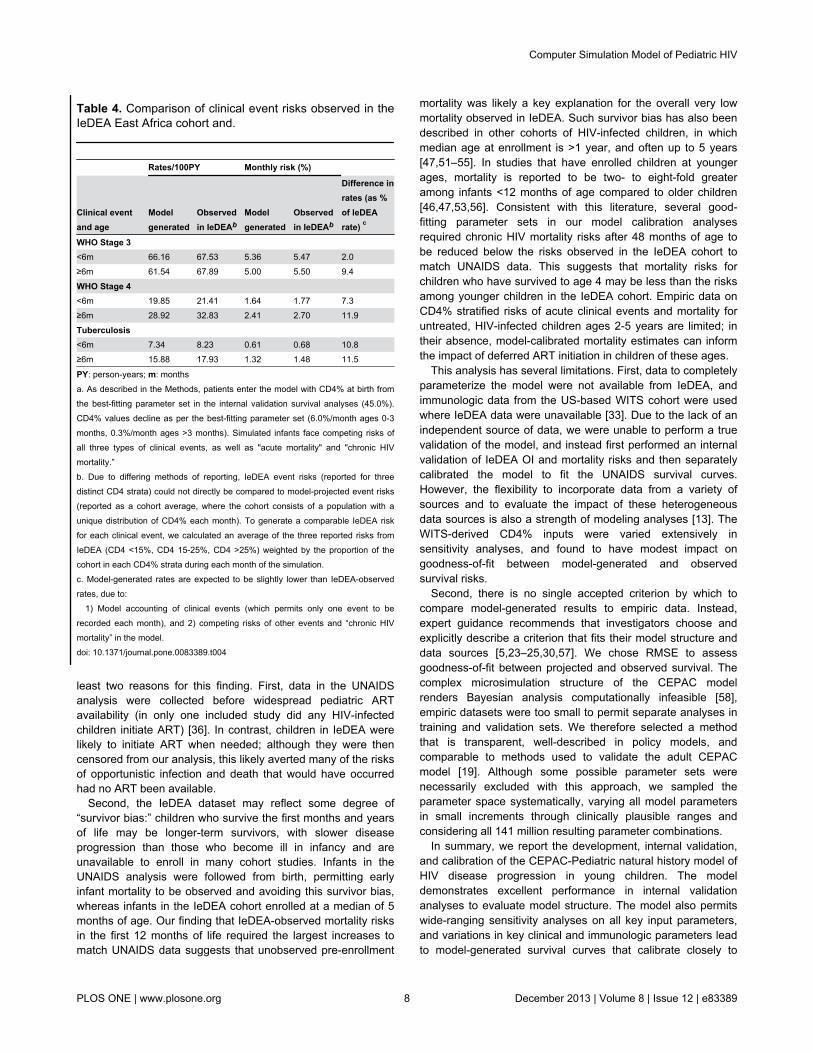
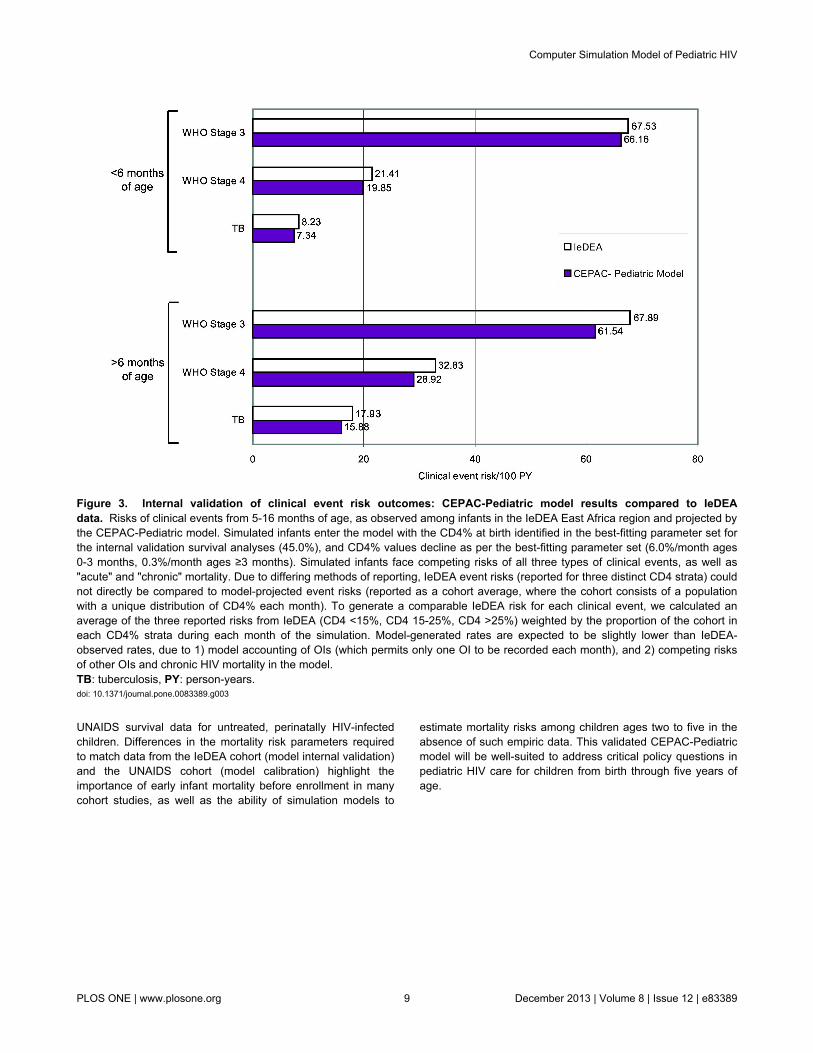
Internal validation of clinical event risks. The model alsoprojected rates of clinical events that fit IeDEA data well.Incorporating CD4% decline rates from the best-fitting internalvalidation parameter sets, as well as competing clinical eventand mortality risks from the IeDEA cohort, model-generatedincidence rates were within 2-12% of observed IeDEA rates(Table 4, Figure 3).
Model calibration: Comparison of model-generatedresults to published UNAIDS pre-ART survival curves
We examined 141 million parameter sets (all possiblecombinations from Table 3). We identified 9,943 best-fittingparameter sets through the step-wise selection process, inwhich we retained only parameter sets that led to model-generated mortality risks within ±1% of UNAIDS survival risksat key time points (RMSE <0.01). Projected survival for the 10best-fitting parameter sets with the lowest RMSE is shown inFigure 4: UNAIDS survival and is depicted as the black line and
Computer Simulation Model of Pediatric HIV
PLOS ONE | www.plosone.org 6 December 2013 | Volume 8 | Issue 12 | e83389
all model-generated survival curves overlap almost entirely withthe UNAIDS survival curve. Figure 4 also shows projectionsusing the IeDEA survival from the internal validation analyses,to illustrate the lower mortality seen in the IeDEA cohort (greenline), as well as the highest- and lowest-mortality riskparameter sets from Table 3 (red and blue lines) to show therange that the model is capable of generating.
The individual components of 10 of the best-fitting parametersets with the lowest RMSE are shown in Table 5. The dataparameters requiring the largest increase in risk to matchUNAIDS survival data were acute mortality within 30 days of aclinical event (multipliers applied to IeDEA event risks rangedfrom 4-5 in all parameter sets), and chronic HIV mortality in thefirst 12 months of life (multipliers of 14-17 for infants ages 0-6months, and 4-8 for ages 7-12 months). After 48 months ofage, calibrated chronic HIV mortality risks were slightly lowerthan IeDEA data (multipliers of 0.4-0.8).
Discussion
We developed a patient-level computer simulation model ofdisease progression among perinatally HIV-infected infants --the CEPAC-Pediatric model. This represents the firstdescription of a Monte Carlo microsimulation model of
untreated HIV disease in children, and the most detaileddescription to date of internal validation and calibration of amodel of pediatric HIV disease according to recommendedpractices [15–17].
In internal validation analyses, using a single set of inputparameters to assess model structure, model outputs closelymatched empiric data from the IeDEA East African regionalpediatric cohort. Model-projected survival was closest toempiric survival data if the immunologic data parameters (notavailable from IeDEA) included an average CD4% at birth of45%, a CD4% decline of 6%/month for infants < 3 months ofage, and a CD4% decline of 0.3%/month for children >3months of age. When model-projected clinical event risks werecompared to empiric IeDEA event risks, model results matchedobserved data reasonably well. The difference between model-generated results and observed data ranged from 2-12%, lessthan the 10-15% criterion accepted as "good-fitting" in a priorstudy [5].
In calibration analyses, we identified new values for modelinput parameters that allowed our projections to match moregeneralizable survival data from untreated, African children.Large increases in IeDEA-observed mortality risks wererequired in the first 12 months of life for model projections tomatch UNAIDS survival data [35–38]. There are likely to be at
Figure 2. Internal validation of survival outcomes: Observed survival curves from the IeDEA East African region andprojected results from the CEPAC-Pediatric Model. The solid black stepped line represents observed survival in the IeDEAcohort based on Kaplan-Meier analysis, beginning at 5 months of age. Dashed black lines reflect the upper and lower bounds of the95% confidence intervals for IeDEA-observed survival. The orange line shows CEPAC model-projected survival using the "IeDEA-WITS projection" data (RMSE = 0.0103). The best-fitting curve is shown with the red line, reflecting mean CD4% at birth of 45.0%,CD4% decline of 6.0%/month in infants <3 months of age, and 0.3%/month for children >3 months of age (RMSE = 0.00423).doi: 10.1371/journal.pone.0083389.g002
Computer Simulation Model of Pediatric HIV
PLOS ONE | www.plosone.org 7 December 2013 | Volume 8 | Issue 12 | e83389
least two reasons for this finding. First, data in the UNAIDSanalysis were collected before widespread pediatric ARTavailability (in only one included study did any HIV-infectedchildren initiate ART) [36]. In contrast, children in IeDEA werelikely to initiate ART when needed; although they were thencensored from our analysis, this likely averted many of the risksof opportunistic infection and death that would have occurredhad no ART been available.
Second, the IeDEA dataset may reflect some degree of“survivor bias:” children who survive the first months and yearsof life may be longer-term survivors, with slower diseaseprogression than those who become ill in infancy and areunavailable to enroll in many cohort studies. Infants in theUNAIDS analysis were followed from birth, permitting earlyinfant mortality to be observed and avoiding this survivor bias,whereas infants in the IeDEA cohort enrolled at a median of 5months of age. Our finding that IeDEA-observed mortality risksin the first 12 months of life required the largest increases tomatch UNAIDS data suggests that unobserved pre-enrollment
Table 4. Comparison of clinical event risks observed in theIeDEA East Africa cohort and.
Rates/100PY Monthly risk (%)
Clinical eventand age
Modelgenerated
Observedin IeDEAb
Modelgenerated
Observedin IeDEAb
Difference inrates (as %of IeDEArate) c
WHO Stage 3 <6m 66.16 67.53 5.36 5.47 2.0≥6m 61.54 67.89 5.00 5.50 9.4
WHO Stage 4 <6m 19.85 21.41 1.64 1.77 7.3≥6m 28.92 32.83 2.41 2.70 11.9
Tuberculosis <6m 7.34 8.23 0.61 0.68 10.8≥6m 15.88 17.93 1.32 1.48 11.5
PY: person-years; m: monthsa. As described in the Methods, patients enter the model with CD4% at birth fromthe best-fitting parameter set in the internal validation survival analyses (45.0%).CD4% values decline as per the best-fitting parameter set (6.0%/month ages 0-3months, 0.3%/month ages >3 months). Simulated infants face competing risks ofall three types of clinical events, as well as "acute mortality" and "chronic HIVmortality.”b. Due to differing methods of reporting, IeDEA event risks (reported for threedistinct CD4 strata) could not directly be compared to model-projected event risks(reported as a cohort average, where the cohort consists of a population with aunique distribution of CD4% each month). To generate a comparable IeDEA riskfor each clinical event, we calculated an average of the three reported risks fromIeDEA (CD4 <15%, CD4 15-25%, CD4 >25%) weighted by the proportion of thecohort in each CD4% strata during each month of the simulation.c. Model-generated rates are expected to be slightly lower than IeDEA-observedrates, due to:
1) Model accounting of clinical events (which permits only one event to berecorded each month), and 2) competing risks of other events and “chronic HIVmortality” in the model.doi: 10.1371/journal.pone.0083389.t004
mortality was likely a key explanation for the overall very lowmortality observed in IeDEA. Such survivor bias has also beendescribed in other cohorts of HIV-infected children, in whichmedian age at enrollment is >1 year, and often up to 5 years[47,51–55]. In studies that have enrolled children at youngerages, mortality is reported to be two- to eight-fold greateramong infants <12 months of age compared to older children[46,47,53,56]. Consistent with this literature, several good-fitting parameter sets in our model calibration analysesrequired chronic HIV mortality risks after 48 months of age tobe reduced below the risks observed in the IeDEA cohort tomatch UNAIDS data. This suggests that mortality risks forchildren who have survived to age 4 may be less than the risksamong younger children in the IeDEA cohort. Empiric data onCD4% stratified risks of acute clinical events and mortality foruntreated, HIV-infected children ages 2-5 years are limited; intheir absence, model-calibrated mortality estimates can informthe impact of deferred ART initiation in children of these ages.
This analysis has several limitations. First, data to completelyparameterize the model were not available from IeDEA, andimmunologic data from the US-based WITS cohort were usedwhere IeDEA data were unavailable [33]. Due to the lack of anindependent source of data, we were unable to perform a truevalidation of the model, and instead first performed an internalvalidation of IeDEA OI and mortality risks and then separatelycalibrated the model to fit the UNAIDS survival curves.However, the flexibility to incorporate data from a variety ofsources and to evaluate the impact of these heterogeneousdata sources is also a strength of modeling analyses [13]. TheWITS-derived CD4% inputs were varied extensively insensitivity analyses, and found to have modest impact ongoodness-of-fit between model-generated and observedsurvival risks.
Second, there is no single accepted criterion by which tocompare model-generated results to empiric data. Instead,expert guidance recommends that investigators choose andexplicitly describe a criterion that fits their model structure anddata sources [5,23–25,30,57]. We chose RMSE to assessgoodness-of-fit between projected and observed survival. Thecomplex microsimulation structure of the CEPAC modelrenders Bayesian analysis computationally infeasible [58],empiric datasets were too small to permit separate analyses intraining and validation sets. We therefore selected a methodthat is transparent, well-described in policy models, andcomparable to methods used to validate the adult CEPACmodel [19]. Although some possible parameter sets werenecessarily excluded with this approach, we sampled theparameter space systematically, varying all model parametersin small increments through clinically plausible ranges andconsidering all 141 million resulting parameter combinations.
In summary, we report the development, internal validation,and calibration of the CEPAC-Pediatric natural history model ofHIV disease progression in young children. The modeldemonstrates excellent performance in internal validationanalyses to evaluate model structure. The model also permitswide-ranging sensitivity analyses on all key input parameters,and variations in key clinical and immunologic parameters leadto model-generated survival curves that calibrate closely to
Computer Simulation Model of Pediatric HIV
PLOS ONE | www.plosone.org 8 December 2013 | Volume 8 | Issue 12 | e83389
UNAIDS survival data for untreated, perinatally HIV-infectedchildren. Differences in the mortality risk parameters requiredto match data from the IeDEA cohort (model internal validation)and the UNAIDS cohort (model calibration) highlight theimportance of early infant mortality before enrollment in manycohort studies, as well as the ability of simulation models to
estimate mortality risks among children ages two to five in theabsence of such empiric data. This validated CEPAC-Pediatricmodel will be well-suited to address critical policy questions inpediatric HIV care for children from birth through five years ofage.
Figure 3. Internal validation of clinical event risk outcomes: CEPAC-Pediatric model results compared to IeDEAdata. Risks of clinical events from 5-16 months of age, as observed among infants in the IeDEA East Africa region and projected bythe CEPAC-Pediatric model. Simulated infants enter the model with the CD4% at birth identified in the best-fitting parameter set forthe internal validation survival analyses (45.0%), and CD4% values decline as per the best-fitting parameter set (6.0%/month ages0-3 months, 0.3%/month ages ≥3 months). Simulated infants face competing risks of all three types of clinical events, as well as"acute" and "chronic" mortality. Due to differing methods of reporting, IeDEA event risks (reported for three distinct CD4 strata) couldnot directly be compared to model-projected event risks (reported as a cohort average, where the cohort consists of a populationwith a unique distribution of CD4% each month). To generate a comparable IeDEA risk for each clinical event, we calculated anaverage of the three reported risks from IeDEA (CD4 <15%, CD4 15-25%, CD4 >25%) weighted by the proportion of the cohort ineach CD4% strata during each month of the simulation. Model-generated rates are expected to be slightly lower than IeDEA-observed rates, due to 1) model accounting of OIs (which permits only one OI to be recorded each month), and 2) competing risksof other OIs and chronic HIV mortality in the model.TB: tuberculosis, PY: person-years.doi: 10.1371/journal.pone.0083389.g003
Computer Simulation Model of Pediatric HIV
PLOS ONE | www.plosone.org 9 December 2013 | Volume 8 | Issue 12 | e83389
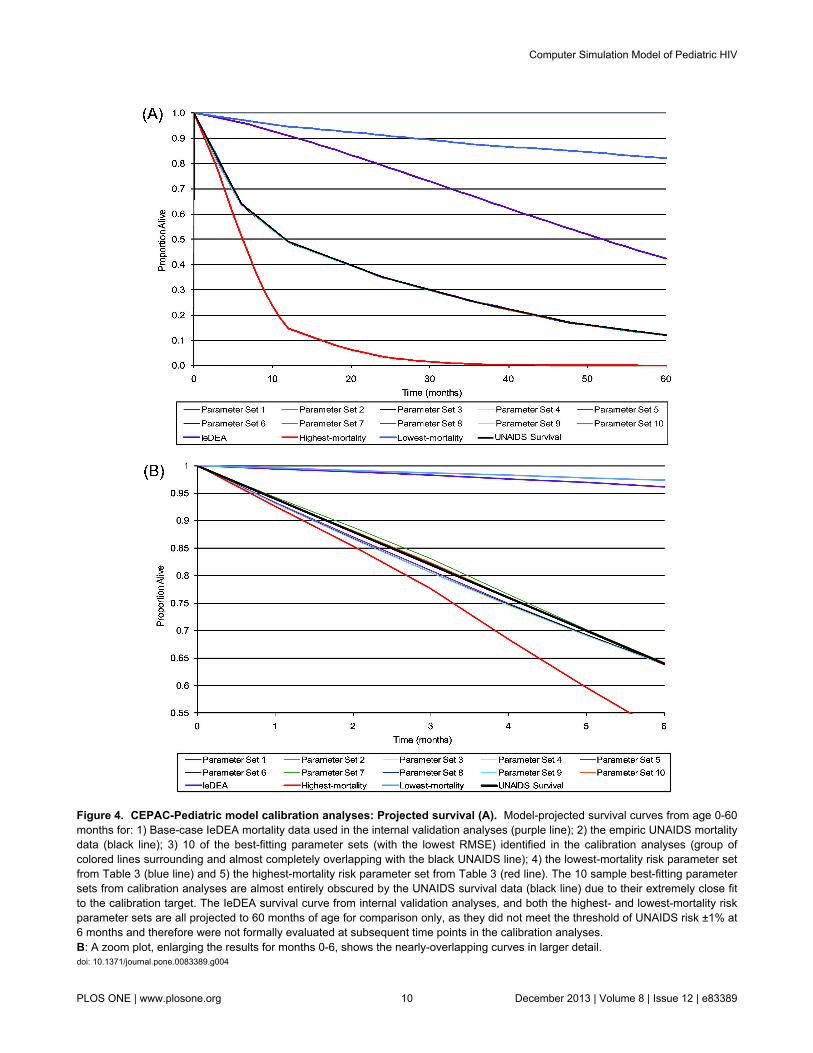
Figure 4. CEPAC-Pediatric model calibration analyses: Projected survival (A). Model-projected survival curves from age 0-60months for: 1) Base-case IeDEA mortality data used in the internal validation analyses (purple line); 2) the empiric UNAIDS mortalitydata (black line); 3) 10 of the best-fitting parameter sets (with the lowest RMSE) identified in the calibration analyses (group ofcolored lines surrounding and almost completely overlapping with the black UNAIDS line); 4) the lowest-mortality risk parameter setfrom Table 3 (blue line) and 5) the highest-mortality risk parameter set from Table 3 (red line). The 10 sample best-fitting parametersets from calibration analyses are almost entirely obscured by the UNAIDS survival data (black line) due to their extremely close fitto the calibration target. The IeDEA survival curve from internal validation analyses, and both the highest- and lowest-mortality riskparameter sets are all projected to 60 months of age for comparison only, as they did not meet the threshold of UNAIDS risk ±1% at6 months and therefore were not formally evaluated at subsequent time points in the calibration analyses.B: A zoom plot, enlarging the results for months 0-6, shows the nearly-overlapping curves in larger detail.doi: 10.1371/journal.pone.0083389.g004
Computer Simulation Model of Pediatric HIV
PLOS ONE | www.plosone.org 10 December 2013 | Volume 8 | Issue 12 | e83389
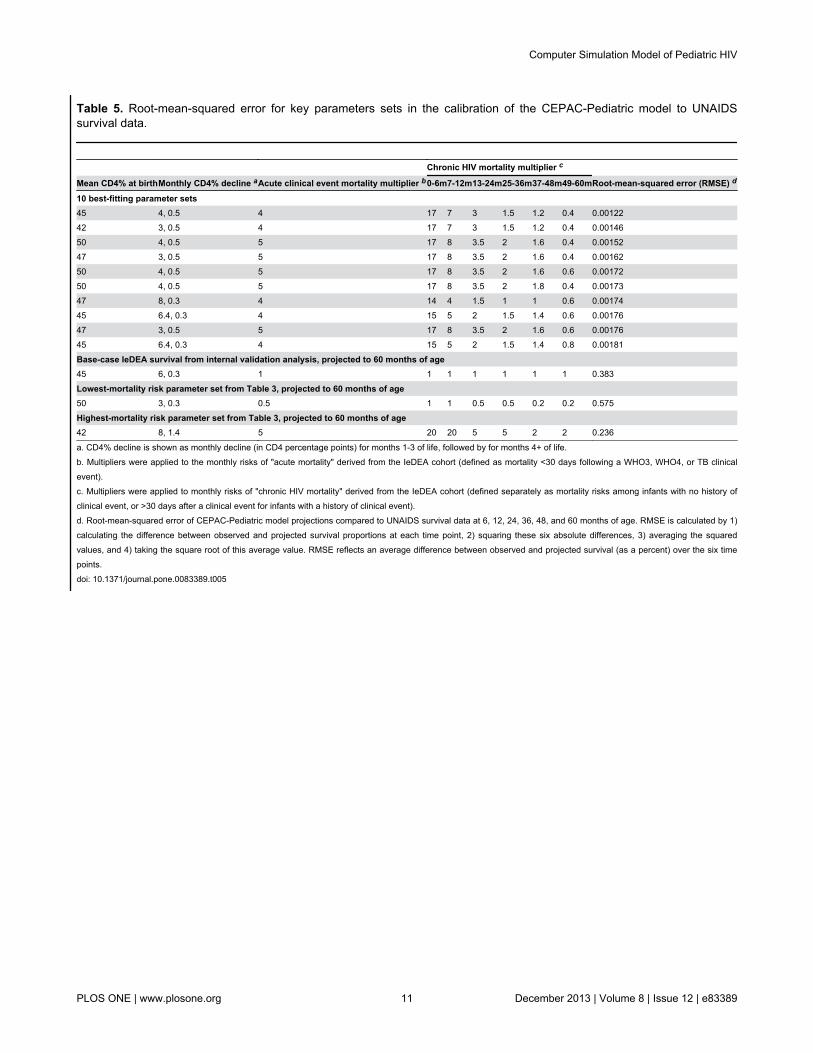
Table 5. Root-mean-squared error for key parameters sets in the calibration of the CEPAC-Pediatric model to UNAIDSsurvival data.
Chronic HIV mortality multiplier c Mean CD4% at birthMonthly CD4% decline aAcute clinical event mortality multiplier b0-6m7-12m13-24m25-36m37-48m49-60mRoot-mean-squared error (RMSE) d
10 best-fitting parameter sets45 4, 0.5 4 17 7 3 1.5 1.2 0.4 0.0012242 3, 0.5 4 17 7 3 1.5 1.2 0.4 0.0014650 4, 0.5 5 17 8 3.5 2 1.6 0.4 0.0015247 3, 0.5 5 17 8 3.5 2 1.6 0.4 0.0016250 4, 0.5 5 17 8 3.5 2 1.6 0.6 0.0017250 4, 0.5 5 17 8 3.5 2 1.8 0.4 0.0017347 8, 0.3 4 14 4 1.5 1 1 0.6 0.0017445 6.4, 0.3 4 15 5 2 1.5 1.4 0.6 0.0017647 3, 0.5 5 17 8 3.5 2 1.6 0.6 0.0017645 6.4, 0.3 4 15 5 2 1.5 1.4 0.8 0.00181
Base-case IeDEA survival from internal validation analysis, projected to 60 months of age45 6, 0.3 1 1 1 1 1 1 1 0.383
Lowest-mortality risk parameter set from Table 3, projected to 60 months of age50 3, 0.3 0.5 1 1 0.5 0.5 0.2 0.2 0.575
Highest-mortality risk parameter set from Table 3, projected to 60 months of age42 8, 1.4 5 20 20 5 5 2 2 0.236
a. CD4% decline is shown as monthly decline (in CD4 percentage points) for months 1-3 of life, followed by for months 4+ of life.b. Multipliers were applied to the monthly risks of "acute mortality" derived from the IeDEA cohort (defined as mortality <30 days following a WHO3, WHO4, or TB clinicalevent).c. Multipliers were applied to monthly risks of "chronic HIV mortality" derived from the IeDEA cohort (defined separately as mortality risks among infants with no history ofclinical event, or >30 days after a clinical event for infants with a history of clinical event).d. Root-mean-squared error of CEPAC-Pediatric model projections compared to UNAIDS survival data at 6, 12, 24, 36, 48, and 60 months of age. RMSE is calculated by 1)calculating the difference between observed and projected survival proportions at each time point, 2) squaring these six absolute differences, 3) averaging the squaredvalues, and 4) taking the square root of this average value. RMSE reflects an average difference between observed and projected survival (as a percent) over the six timepoints.doi: 10.1371/journal.pone.0083389.t005
Computer Simulation Model of Pediatric HIV
PLOS ONE | www.plosone.org 11 December 2013 | Volume 8 | Issue 12 | e83389
Acknowledgements
The authors would like to thank Kathleen Kelly for assistancewith model-based analyses and Jordan Francke for assistancewith manuscript preparation. We also gratefully acknowledgethe contributions of the entire Cost-Effectiveness of PreventingAIDS Complications-International (CEPAC-I) research team.The authors also thank Constantin Yiannoutsis and BeverlyMusick for detailed analyses of IeDEA East Africa data, as wellas the IeDEA East Africa Pediatric Working Group for theirvaluable contributions: Melanie Bacon, Winstone Nyandiko,Craig Cohen, Elizabeth Bukusi, Deo Wabwire, Pius Okong,Juliana Otieno, Geoffrey Somi, Rita Lyamuya, Batya Elul,Rachel Vreeman and Harriet Nuwagaba-Biribonwoha.
Author Contributions
Conceived and designed the experiments: ALC BLM RPW KDKF. Performed the experiments: ALC BLM KD. Analyzed thedata: ALC BLM KD RPW MCW KF EL SA. Contributedreagents/materials/analysis tools: ALC RPW KF EL SA. Wrotethe manuscript: ALC BLM KD. Critically reviewed all modelresults and contributed to drafting and revising the manuscript:ALC, BLM, RPW,MCW, SA, KD, VL, TH, SD, ZL, FN, KP, LRA,EL, GS, KF.
References
1. Prendergast A, Cotton M, Gibb DM (2008) When should antiretroviraltherapy be started for HIV-infected infants in resource-limited settings?Futures - Journal of HIV Therapy 2: 201-208.
2. Ciaranello AL, Park J, Ramirez-Avila L, Freedberg KA, Walensky RP etal. (2011) Early infant HIV-1 diagnosis programs in resource-limitedsettings: opportunities for improved outcomes and more cost-effectiveinterventions. BMC Medicine 9: 59.
3. World Health Organization (2010) Antiretroviral therapy for HIVinfection in infants and children: Recommendations for a public healthapproach.
4. Freedberg KA, Losina E, Weinstein MC, Paltiel AD, Cohen CJ et al.(2001) The cost effectiveness of combination antiretroviral therapy forHIV disease. N Engl J Med 344: 824-831.
5. Goldie SJ, Yazdanpanah Y, Losina E, Weinstein MC, Anglaret X, et al.(2006) Cost-effectiveness of HIV treatment in resource-poor settings--the case of Côte d'Ivoire. N Engl J Med 355: 1141-1153.
6. Walensky RP, Wolf LL, Wood R, Fofana MO, Freedberg KA et al.(2009) When to start antiretroviral therapy in resource-limited settings.Ann Intern Med 151: 157-166. doi:10.7326/0003-4819-151-3-200908040-00138. PubMed: 19620143.
7. Johri M, Ako-Arrey D (2011) The cost-effectiveness of preventingmother-to-child transmission of HIV in low- and middle-incomecountries: systematic review.Cost Eff Resour Alloc 9: 3. doi:10.1186/1478-7547-9-3. PubMed: 21306625.
8. Shah M, Johns B, Abimiku A, Walker DG (2011) Cost-effectiveness ofnew WHO recommendations for prevention of mother-to-childtransmission of HIV in a resource-limited setting. AIDS 25: 1093-1102.doi:10.1097/QAD.0b013e32834670b9. PubMed: 21505317.
9. Orlando S, Marazzi MC, Mancinelli S, Liotta G, Ceffa S et al. (2010)Cost- effectiveness of using HAART in prevention of mother-to-childtransmission in the DREAM-Project Malawi. J Acquir Immune DeficSyndr 55: 631-634. doi:10.1097/QAI.0b013e3181f9f9f5. PubMed:21934555.
10. Robberstad B, Evjen-Olsen B (2010) Preventing mother to childtransmission of HIV with highly active antiretroviral treatment inTanzania--a prospective cost-effectiveness study. J Acquir ImmuneDefic Syndr 55: 397-403. doi:10.1097/QAI.0b013e3181eef4d3.PubMed: 20739897.
11. Ciaranello AL, Perez F, Engelsmann B, Walensky RP, Mushavi A, et al.(2013) Cost-effectiveness of World Health Organization 2010guidelines for prevention of mother-to-child HIV transmission inZimbabwe. Clin Infect dis 56: 430-446.
12. Ciaranello A, Perez F, Keatinge J, Park J, Engelsmann B et al. (2012)What will it take to eliminate pediatric HIV? Reaching “virtualelimination” targets for prevention of mother-to-child HIV transmission(PMTCT) in Zimbabwe. PLOS Medicine 9: e1001156.
13. Weinstein MC, Siegel JE, Gold MR, Kamlet MS, Russell LB (1996)Recommendations of the Panel on Cost-effectiveness in Health andMedicine. JAMA 276: 1253-1258.
14. Hunink MGM, Glasziou PP, Siegel JE, Weeks JC, Pliskin JS et al.(2003). Decision making in health and medicine: integrating evidenceand values. Cambridge: Cambridge University Press.
15. Schneider K, Puthanakit T, Kerr S, Law MG, Cooper DA, et al. (2011)Economic evaluation of monitoring virologic responses to antiretroviraltherapy in HIV-infected children in resource-limited settings. AIDS 25:1143-1151.
16. Ryan M, Griffin S, Chitah B, Walker AS, Mulenga V et al. (2008) Thecost- effectiveness of cotrimoxazole prophylaxis in HIV-infectedchildren in Zambia.AIDS 22: 749-757. doi:10.1097/QAD.0b013e3282f43519. PubMed: 18356605.
17. Menzies NA, Homsy J, Chang Pitter JY, Pitter C, Mermin J et al. (2009)Cost- effectiveness of routine rapid human immunodeficiency virusantibody testing before DNA-PCR testing for early diagnosis of infantsin resource-limited settings. Pediatr Infect Dis J 28: 819-825. doi:10.1097/INF.0b013e3181a3954b. PubMed: 20050391.
18. Ciaranello AL, Lockman S, Freedberg KA, Hughes M, Chu J et al.(2011) First- line antiretroviral therapy after single-dose nevirapineexposure in South Africa: A cost-effectiveness analysis of the OCTANEtrial. AIDS 25: 479-492. doi:10.1097/QAD.0b013e3283428cbe.PubMed: 21293199.
19. Rydzak CE, Cotich KL, Sax PE, Hsu HE, Wang B et al. (2010)Assessing the performance of a computer-based policy model of HIVand AIDS. PLOS ONE 5: e12647. doi:10.1371/journal.pone.0012647.PubMed: 20844741.
20. Yazdanpanah Y, Losina E, Anglaret X, Goldie SJ, Walensky RP, et al.(2005) Clinical impact and cost-effectiveness of co-trimoxazoleprophylaxis in patients with HIV/AIDS in Côte d'Ivoire: a trial-basedanalysis. AIDS 19: 1299-1308.
21. Paltiel AD, Weinstein MC, Kimmel AD, Seage GR 3rd, Losina E, et al.(2005) Expanded screening for HIV in the United States--an analysis ofcost-effectiveness. N Engl J Med 352: 586-595.
22. Sax PE, Islam R, Walensky RP, Losina E, Weinstein MC et al. (2005)Should resistance testing be performed for treatment-naive HIV-infected patients? A cost-effectiveness analysis. Clin Infect Dis 41:1316-1323. doi:10.1086/496984. PubMed: 16206108.
23. Stout NK, Knudsen AB, Kong CY, McMahon PM, Gazelle GS (2009)Calibration methods used in cancer simulation models and suggestedreporting guidelines. Pharmacoeconomics 27: 13.
24. Goldhaber-Fiebert JD, Stout NK, Goldie SJ (2010) EmpiricallyEvaluating Decision-Analytic Models. Value in Health 13: 8–13. doi:10.1111/j.1524-4733.2010.00698.x
25. Eddy DM, Hollingworth W, Caro JJ, Tsevat J, McDonald KM, et al.(2012) Model transparency and validation: a report of the ISPOR-SMDM Modeling Good Research Practices Task Force--7. ValueHealth 15: 843-850.
26. Brinkhof MW, Dabis F, Myer L, Bangsberg DR, Boulle A et al. (2008)Early loss of HIV-infected patients on potent antiretroviral therapyprogrammes in lower-income countries. Bull World Health Organ 86:559-567. doi:10.2471/BLT.07.044248. PubMed: 18670668.
27. National Institute of Allergy and Infectious Disease (2012) InternationalEpidemiologic Databases to Evaluate AIDS. In: . pp. IeDEA. HomePage
28. Ciaranello A, Lu Z, Ayaya S, Losina S, Musick B et al. (2011).Incidence of WHO Stage 3 (WHO3) and 4 (WHO4) events andtuberculosis (TB) in untreated HIV-infected children enrolling in carebefore 1 year of age: an IeDEA (International Epidemiologic Databasesfor the Evaluation of AIDS) East African regional analysis; Rome, Italy.
29. Salomon JA, Weinstein MC, Hammitt JK, Goldie SJ (2002) Empiricallycalibrated model of hepatitis C virus infection in the United States. Am JEpidemiol 156: 761-773.
30. Vanni T, Karnon J, Madan J, White RG, Edmunds WJ et al. (2011)Calibrating models in economic evaluation: a seven-step approach.
Computer Simulation Model of Pediatric HIV
PLOS ONE | www.plosone.org 12 December 2013 | Volume 8 | Issue 12 | e83389
Pharmacoeconomics 29: 35-49. doi:10.2165/11584600-000000000-00000. PubMed: 21142277.
31. Ciaranello AL, Perez F, Maruva M, Chu J, Engelsmann B et al. (2011)WHO 2010 guidelines for prevention of mother-to-child HIVtransmission in Zimbabwe: Modeling clinical outcomes in infants andmothers. PLOS ONE 6: e20224. doi:10.1371/journal.pone.0020224.PubMed: 21655097.
32. Sheon AR, Fox HE, Rich KC, Stratton P, Diaz C et al. (1996) TheWomen and Infants Transmission Study (WITS) of maternal-infant HIVtransmission: study design, methods, and baseline data. Journal ofWomen's Health 5: 69-78. doi:10.1089/jwh.1996.5.69.
33. National Technical Information Service (2010) Women and InfantsTransmission Study (WITS) public database, final release, 1990-2006(issued December 10, 2010) Alexandria, VA.
34. Foca M, Moye J, Chu C, Matthews Y, Rich K et al. (2006) Genderdifferences in lymphocyte populations, plasma HIV RNA levels, anddisease progression in a cohort of children born to women infected withHIV. Pediatrics 118: 146-155. doi:10.1542/peds.2005-0294. PubMed:16818560.
35. Marston M, Becquet R, Zaba B, Moulton LH, Gray G et al. (2011) Netsurvival of perinatally and postnatally HIV-infected children: a pooledanalysis of individual data from sub-Saharan. Africa - Int J Epidemiol40: 385-396. doi:10.1093/ije/dyq255.
36. Becquet R, Marston M, Dabis F, Moulton LH, Gray G et al. (2012)Children who acquire HIV infection perinatally are at higher risk of earlydeath than those acquiring infection through breastmilk: a meta-analysis. PLOS ONE 7: e28510. doi:10.1371/journal.pone.0028510.PubMed: 22383946.
37. UNAIDS Child Survival Working Group (2010) Survival of children HIV-infected perinatally and through breastfeeding: a pooled analysis ofindividual data from resource-constrained settings. (UNAIDS report onsurvival of HIV infected children in Africa, final report). Geneva,Switzerland: UNAIDS..
38. Newell ML, Coovadia H, Cortina-Borja M, Rollins N, Gaillard P, et al.(2004) Mortality of infected and uninfected infants born to HIV-infectedmothers in Africa: a pooled analysis. Lancet 364: 1236-1243.
39. United Nations (2009) World Population Prospects: The 2008 Revision.In: Department of Economic and Social Affairs PD, editor. New York
40. Egger M, Boulle A (2008) Population effect of scaling up ART inresource-poor settings. Lancet 371: 1558-1559. doi:10.1016/S0140-6736(08)60669-8. PubMed: 18468529.
41. McIntyre JA, Martinson N, Gray GE, Hopley M, Kimura T et al. (2005).Addition of short course Combivir (CBV) to single dose Viramune(sdNVP) for the prevention of mother to child transmission (pMTCT) ofHIV-1 can significantly decrease the subsequent development ofmaternal and paediatric NNRTI- resistant virus. Rio de Janeiro.
42. Laird NM, Ware JH (1982) Random-effects models for longitudinaldata.Biometrics 38: 963-974. doi:10.2307/2529876. PubMed: 7168798.
43. Prendergast A, Mphatswe W, Tudor-Williams G, Rakgotho M, Pillay Vet al. (2008) Early virological suppression with three-class antiretroviraltherapy in HIV-infected African infants. AIDS 22: 1333-1343. doi:10.1097/QAD.0b013e32830437df. PubMed: 18580613.
44. Mphatswe W, Blanckenberg N, Tudor-Williams G, Prendergast A,Thobakgale C et al. (2007) High frequency of rapid immunologicalprogression in African infants infected in the era of perinatal HIV
prophylaxis. AIDS 21: 1253-1261. doi:10.1097/QAD.0b013e3281a3bec2. PubMed: 17545701.
45. Violari A, Cotton MF, Gibb DM, Babiker AG, Steyn J et al. (2008) Earlyantiretroviral therapy and mortality among HIV-infected infants. N EnglJ Med 359: 2233-2244.
46. Spira R, Lepage P, Msellati P, Van De Perre P, Leroy V et al. (1999)Natural history of human immunodeficiency virus type 1 infection inchildren: a five- year prospective study in Rwanda. Mother-to-ChildHIV-1 Transmission Study Group. Pediatrics 104: e56. doi:10.1542/peds.104.5.e56. PubMed: 10545582.
47. Walker AS, Mulenga V, Sinyinza F, Lishimpi K, Nunn A, et al. (2006)Determinants of survival without antiretroviral therapy after infancy inHIV-1-infected Zambian children in the CHAP Trial. J Acquir ImmuneDefic Syndr 42: 637-645
48. Chearskul S, Chotpitayasunondh T, Simonds RJ, Wanprapar N,Waranawat N et al. (2002) Survival, disease manifestations, and earlypredictors of disease progression among children with perinatal humanimmunodeficiency virus infection in Thailand. Pediatrics 110: e25. doi:10.1542/peds.110.2.e25. PubMed: 12165624.
49. Graham SM, Mtitimila EI, Kamanga HS, Walsh AL, Hart CA, et al.(2000) Clinical presentation and outcome of pneumocystis cariniipneumonia in Malawian children. Lancet 355: 369-373.
50. Adhikari M, Kauchali S, Moodley A (2006) Clinical profile and morbiditypattern of infants born to HIV infected mothers in Durban SouthAfrica.Indian Pediatr 43: 804-808. PubMed: 17033119.
51. Ferrand RA, Luethy R, Bwakura F, Mujuru H, Miller RF et al. (2007)HIV infection presenting in older children and adolescents: a caseseries from Harare, Zimbabwe. Clin Infect Dis 44: 874-878. doi:10.1086/511873. PubMed: 17304463.
52. Desmonde S, Coffie P, Aka E, Amani-Bosse C, Messou E et al. (2011)Severe morbidity and mortality in untreated HIV-infected children in apaediatric care programme in Abidjan, Cote d'Ivoire, 2004-2009. BMCInfect Dis 11: 182. doi:10.1186/1471-2334-11-182. PubMed: 21699728.
53. Hussey GD, Reijnhart RM, Sebens AM, Burgess J, Schaaf S, et al.(1998) Survival of children in Cape Town known to be vertically infectedwith HIV-1. S Afr Med J 88: 554-558.
54. Cross Continents Collaboration for Kids. (2008) (3Cs4kids) Analysisand Writing Committee (2008) Markers for predicting mortality inuntreated HIV-infected children in resource-limited settings: a meta-analysis. AIDS 22: 97-105. doi:10.1097/01.aids.0000302262.51286.a5.PubMed: 18090397.
55. Bagenda D, Nassali A, Kalyesubula I, Sherman B, Drotar D et al.(2006) Health, neurologic, and cognitive status of HIV-infected, long-surviving, and antiretroviral-naive Ugandan children. Pediatrics 117:729-740. doi:10.1542/peds.2004-2699. PubMed: 16510653.
56. Munyagwa M, Baisley K, Levin J, Brian M, Grosskurth H, et al. (2012)Mortality of HIV-infected and uninfected children in a longitudinal cohortin rural south-west Uganda during 8 years of follow-up. Trop Med IntHealth 17: 836-843.
57. Fryback DG, Stout NK, Rosenberg MA, Trentham-Dietz A,Kuruchittham V (2006) et al. Wisconsin Breast Cancer EpidemiologySimulation Model. JNCI Monographs 36: 11.
58. Spiegelhalter DJ, Best NG (2003) Bayesian approaches to multiplesources of evidence and uncertainty in complex cost-effectivenessmodelling. Stat Med 22: 3687-3709. doi:10.1002/sim.1586. PubMed:14652869.
Computer Simulation Model of Pediatric HIV
PLOS ONE | www.plosone.org 13 December 2013 | Volume 8 | Issue 12 | e83389