Embed Size (px)
Citation preview
Andean growth and monsoon winds drive landscape evolution 1
at SW margin of South America 2
3 Aurélie Coudurier-Curveur 1, 2, Robin Lacassin 1 and Rolando Armijo 1 4 5 1 Institut de Physique du Globe de Paris, Sorbonne Paris Cité, Univ. Paris Diderot, UMR 7154 6 CNRS, France. 7 2 now at Earth Observatory of Singapore (EOS), Nanyang Technological University, Singapore. 8 9 [email protected] (corresponding author) 10 11 12
ABSTRACT : 13
In the Atacama desert, the driest place on Earth located at the subduction margin of the 14
Andes, the landscape evolves very slowly and changes in tectonic or erosion processes remain 15
for a long time in the memory of topography. At latitude ~19°30’S, a threshold between 16
exoreic and endoreic drainage regimes is clearly associated with the latitudinal gradient 17
imposed by the modern monsoon (carrying humidity from the Atlantic) and disposed 18
obliquely over catchments draining the Andes to the Pacific. We summarize the geomorphic, 19
geological and climatic data in the threshold area. We then use these data to constrain 20
numerical experiments of drainage evolution. Data and experimental results are consistent 21
with the development of a flat low-energy morphology, close to sea level, interrupted at ≤10 22
Ma by tectonic uplift prevailing to the present suggesting trench-ward relief growth by 23
incorporation of the coastal Atacama region to the Andes mountain belt. 24
25
Keywords : Andes; landscape evolution; geomorphology; orogeny; river incision; tectonic uplift 26
1. INTRODUCTION 27
The landscape at the mountain belt flanks depends to a large extent on the competing effects of 28
tectonic uplift, which creates vertical relief, and climate, which mediates erosion (Whittaker, 2012; 29
Bonnet and Crave, 2003). Topography, as a filtered signal of tectonics and climate (Whittaker, 30
2012) is a particularly important feature that keeps a record of the changes affecting these two 31
processes. Recent studies have demonstrated that, under constant tectonics and climate, the 32
Manuscript in word formatClick here to view linked References
landscape retains limited information (Whittaker, 2012; Bonnet and Crave, 2003) and therefore 33
traces of past perturbations become very subtle. Long-term (>1 My) changes are commonly 34
assessed through proxies such as exhumation or sedimentary histories (e.g., for the Central Andes: 35
Schildgen et al., 2007; Uba et al., 2007). However, under the hyper-arid conditions of the Atacama 36
Desert at the west margin of the Central Andes, erosion rates are very low and time-scales of 37
landscape evolution exceed 5 My (Alpers and Brimhall, 1988; Dunai et al., 2005; Nishiizumi et al., 38
2005; Hoke et al., 2007; Kober et al., 2007; Evenstar et al., 2009; Jordan et al., 2010). As a 39
consequence, the landscape remains transient and well-preserved long-term effects of past changes 40
of tectonic and erosion rates are still measurable in the topography. 41
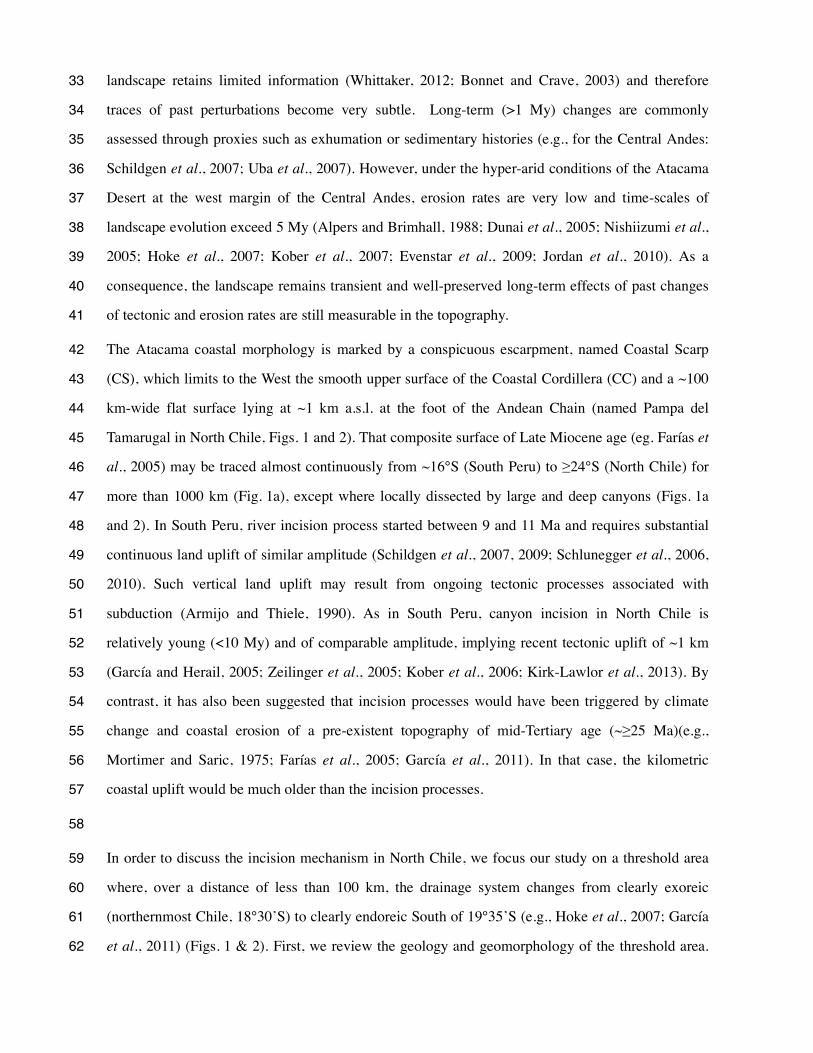
The Atacama coastal morphology is marked by a conspicuous escarpment, named Coastal Scarp 42
(CS), which limits to the West the smooth upper surface of the Coastal Cordillera (CC) and a ~100 43
km-wide flat surface lying at ~1 km a.s.l. at the foot of the Andean Chain (named Pampa del 44
Tamarugal in North Chile, Figs. 1 and 2). That composite surface of Late Miocene age (eg. Farías et 45
al., 2005) may be traced almost continuously from ~16°S (South Peru) to ≥24°S (North Chile) for 46
more than 1000 km (Fig. 1a), except where locally dissected by large and deep canyons (Figs. 1a 47
and 2). In South Peru, river incision process started between 9 and 11 Ma and requires substantial 48
continuous land uplift of similar amplitude (Schildgen et al., 2007, 2009; Schlunegger et al., 2006, 49
2010). Such vertical land uplift may result from ongoing tectonic processes associated with 50
subduction (Armijo and Thiele, 1990). As in South Peru, canyon incision in North Chile is 51
relatively young (<10 My) and of comparable amplitude, implying recent tectonic uplift of ~1 km 52
(García and Herail, 2005; Zeilinger et al., 2005; Kober et al., 2006; Kirk-Lawlor et al., 2013). By 53
contrast, it has also been suggested that incision processes would have been triggered by climate 54
change and coastal erosion of a pre-existent topography of mid-Tertiary age (~≥25 Ma)(e.g., 55
Mortimer and Saric, 1975; Farías et al., 2005; García et al., 2011). In that case, the kilometric 56
coastal uplift would be much older than the incision processes. 57
58
In order to discuss the incision mechanism in North Chile, we focus our study on a threshold area 59
where, over a distance of less than 100 km, the drainage system changes from clearly exoreic 60
(northernmost Chile, 18°30’S) to clearly endoreic South of 19°35’S (e.g., Hoke et al., 2007; García 61
et al., 2011) (Figs. 1 & 2). First, we review the geology and geomorphology of the threshold area. 62
Then, we identify and characterize key measurable elements of the landscape. We note that current 63
meteorological data (Strecker et al., 2007; Bookhagen and Strecker, 2008) indicate that the 64
latitudinal rainfall gradient, which is imposed by the modern monsoon, crosses obliquely the 65
Altiplano (AP) and the Western Cordillera (WC) (Fig. 1b) and appears to control spatial variations 66
of drainage erosion power in the threshold area. Finally, using a numerical modeling, we explore a 67
set of scenarios adopting two simple conditions: (1) the topographic relief in the threshold area has 68
experienced uniform tectonic uplift during the past 10 Ma, and (2) the actualistic hypothesis that the 69
present-day pattern of the monsoon regime can help us to explain the long-term development of 70
drainage in the threshold area. 71
72
2. GEOLOGIC, GEOMORPHIC AND CLIMATIC FRAMEWORK 73
74
2.1 Basic geology and geomorphology 75
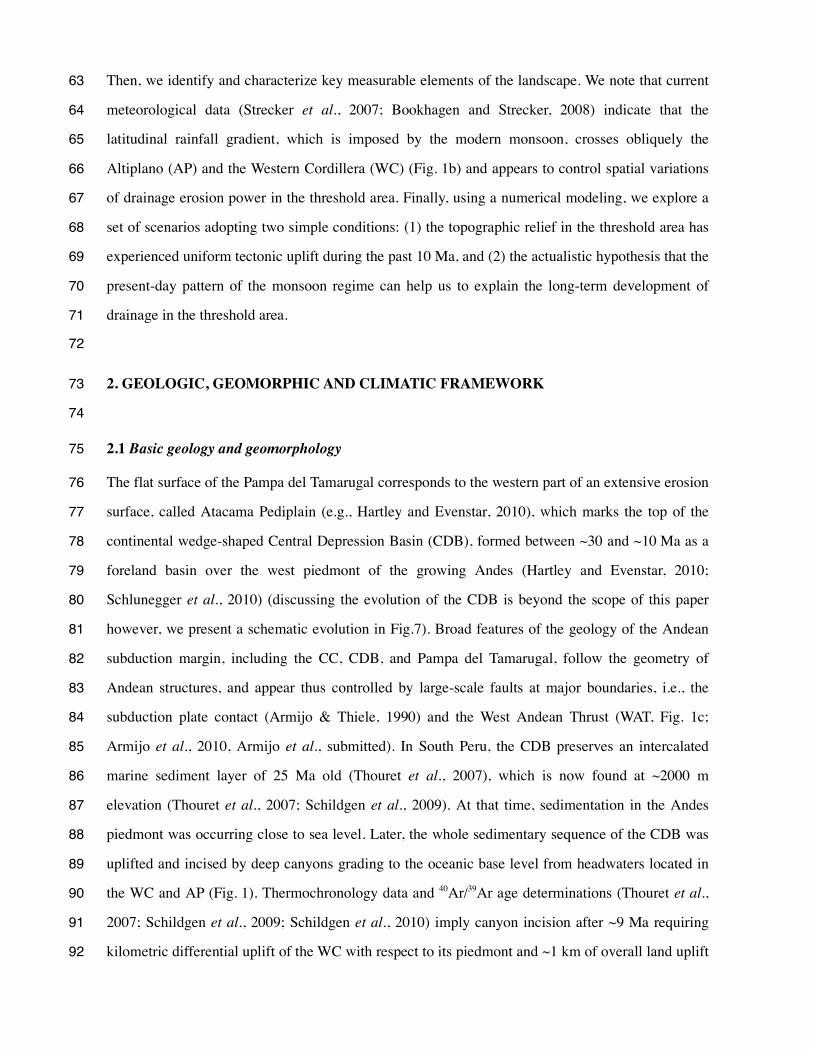
The flat surface of the Pampa del Tamarugal corresponds to the western part of an extensive erosion 76
surface, called Atacama Pediplain (e.g., Hartley and Evenstar, 2010), which marks the top of the 77
continental wedge-shaped Central Depression Basin (CDB), formed between ~30 and ~10 Ma as a 78
foreland basin over the west piedmont of the growing Andes (Hartley and Evenstar, 2010; 79
Schlunegger et al., 2010) (discussing the evolution of the CDB is beyond the scope of this paper 80
however, we present a schematic evolution in Fig.7). Broad features of the geology of the Andean 81
subduction margin, including the CC, CDB, and Pampa del Tamarugal, follow the geometry of 82
Andean structures, and appear thus controlled by large-scale faults at major boundaries, i.e., the 83
subduction plate contact (Armijo & Thiele, 1990) and the West Andean Thrust (WAT, Fig. 1c; 84
Armijo et al., 2010, Armijo et al., submitted). In South Peru, the CDB preserves an intercalated 85
marine sediment layer of 25 Ma old (Thouret et al., 2007), which is now found at ~2000 m 86
elevation (Thouret et al., 2007; Schildgen et al., 2009). At that time, sedimentation in the Andes 87
piedmont was occurring close to sea level. Later, the whole sedimentary sequence of the CDB was 88
uplifted and incised by deep canyons grading to the oceanic base level from headwaters located in 89
the WC and AP (Fig. 1). Thermochronology data and 40Ar/39Ar age determinations (Thouret et al., 90
2007; Schildgen et al., 2009; Schildgen et al., 2010) imply canyon incision after ~9 Ma requiring 91
kilometric differential uplift of the WC with respect to its piedmont and ~1 km of overall land uplift 92
of the whole coastal block (from the coast to the AP) with respect to the oceanic base-level 93
(Schildgen et al., 2009). 94
In northernmost Chile, similar canyons have been carved into the whole margin, between the AP 95
and the Pacific. The incision amplitude reaches 1 km deep across the CC and sediments of the 96
CDB. There the top of the CBD corresponds to the Miocene El Diablo formation (Charrier et al., 97
2007), likely deposited in a braided plain linking the CDB with the Pacific Ocean (Schlunegger et 98
al., 2010) and now found at elevation of ~0.6-1 km close to the coast. The topmost layers of the El 99
Diablo formation are ~8-10 Ma old (Naranjo and Paskoff, 1985; von Rotz et al., 2005; Schlunegger 100
et al., 2010). The maximum onset time of canyon incision is therefore younger than ~10 Ma (García 101
and Hérail, 2005; Schlunegger et al., 2006; Schlunegger et al., 2010; García et al., 2011). This 102
process appears associated with the presence of the 1-km-high Coastal Scarp (Figs. 1, 2, 4; Armijo 103
and Thiele, 1990) as well as with the occurence of large active normal faulting parallel to that scarp 104
(such as the Pisagua Fault, Fig. 4a). This suggests that, similar to South Peru, significant protracted 105
land uplift relative to the oceanic base level has occurred in North Chile over less than 10 Ma 106
(Armijo and Thiele, 1990; Armijo et al., submitted). 107
2.2 Main features of Tiliviche threshold. 108
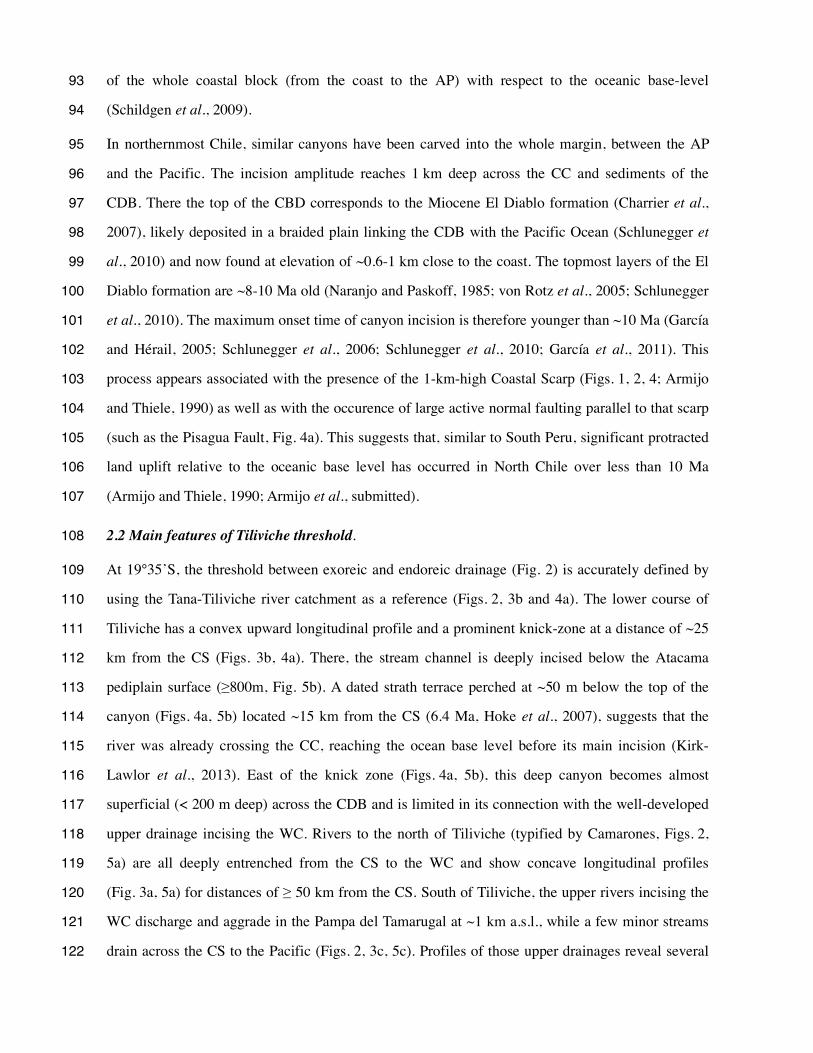
At 19°35’S, the threshold between exoreic and endoreic drainage (Fig. 2) is accurately defined by 109
using the Tana-Tiliviche river catchment as a reference (Figs. 2, 3b and 4a). The lower course of 110
Tiliviche has a convex upward longitudinal profile and a prominent knick-zone at a distance of ~25 111
km from the CS (Figs. 3b, 4a). There, the stream channel is deeply incised below the Atacama 112
pediplain surface (≥800m, Fig. 5b). A dated strath terrace perched at ~50 m below the top of the 113
canyon (Figs. 4a, 5b) located ~15 km from the CS (6.4 Ma, Hoke et al., 2007), suggests that the 114
river was already crossing the CC, reaching the ocean base level before its main incision (Kirk-115
Lawlor et al., 2013). East of the knick zone (Figs. 4a, 5b), this deep canyon becomes almost 116
superficial (< 200 m deep) across the CDB and is limited in its connection with the well-developed 117
upper drainage incising the WC. Rivers to the north of Tiliviche (typified by Camarones, Figs. 2, 118
5a) are all deeply entrenched from the CS to the WC and show concave longitudinal profiles 119
(Fig. 3a, 5a) for distances of ≥ 50 km from the CS. South of Tiliviche, the upper rivers incising the 120
WC discharge and aggrade in the Pampa del Tamarugal at ~1 km a.s.l., while a few minor streams 121
drain across the CS to the Pacific (Figs. 2, 3c, 5c). Profiles of those upper drainages reveal several 122
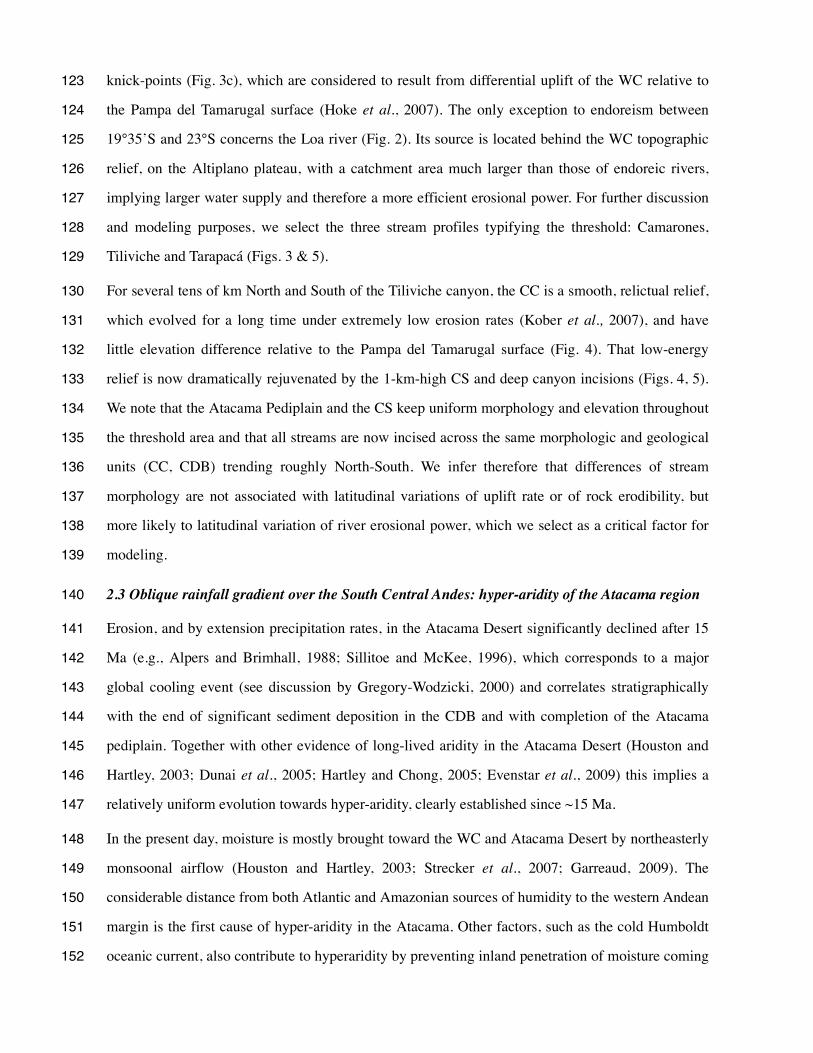
knick-points (Fig. 3c), which are considered to result from differential uplift of the WC relative to 123
the Pampa del Tamarugal surface (Hoke et al., 2007). The only exception to endoreism between 124
19°35’S and 23°S concerns the Loa river (Fig. 2). Its source is located behind the WC topographic 125
relief, on the Altiplano plateau, with a catchment area much larger than those of endoreic rivers, 126
implying larger water supply and therefore a more efficient erosional power. For further discussion 127
and modeling purposes, we select the three stream profiles typifying the threshold: Camarones, 128
Tiliviche and Tarapacá (Figs. 3 & 5). 129
For several tens of km North and South of the Tiliviche canyon, the CC is a smooth, relictual relief, 130
which evolved for a long time under extremely low erosion rates (Kober et al., 2007), and have 131
little elevation difference relative to the Pampa del Tamarugal surface (Fig. 4). That low-energy 132
relief is now dramatically rejuvenated by the 1-km-high CS and deep canyon incisions (Figs. 4, 5). 133
We note that the Atacama Pediplain and the CS keep uniform morphology and elevation throughout 134
the threshold area and that all streams are now incised across the same morphologic and geological 135
units (CC, CDB) trending roughly North-South. We infer therefore that differences of stream 136
morphology are not associated with latitudinal variations of uplift rate or of rock erodibility, but 137
more likely to latitudinal variation of river erosional power, which we select as a critical factor for 138
modeling. 139
2.3 Oblique rainfall gradient over the South Central Andes: hyper-aridity of the Atacama region 140
Erosion, and by extension precipitation rates, in the Atacama Desert significantly declined after 15 141
Ma (e.g., Alpers and Brimhall, 1988; Sillitoe and McKee, 1996), which corresponds to a major 142
global cooling event (see discussion by Gregory-Wodzicki, 2000) and correlates stratigraphically 143
with the end of significant sediment deposition in the CDB and with completion of the Atacama 144
pediplain. Together with other evidence of long-lived aridity in the Atacama Desert (Houston and 145
Hartley, 2003; Dunai et al., 2005; Hartley and Chong, 2005; Evenstar et al., 2009) this implies a 146
relatively uniform evolution towards hyper-aridity, clearly established since ~15 Ma. 147
In the present day, moisture is mostly brought toward the WC and Atacama Desert by northeasterly 148
monsoonal airflow (Houston and Hartley, 2003; Strecker et al., 2007; Garreaud, 2009). The 149
considerable distance from both Atlantic and Amazonian sources of humidity to the western Andean 150
margin is the first cause of hyper-aridity in the Atacama. Other factors, such as the cold Humboldt 151
oceanic current, also contribute to hyperaridity by preventing inland penetration of moisture coming 152
from the Pacific (Houston and Hartley, 2003; Garreaud, 2009). As a consequence, present-day 153
precipitation decreases southwestward across the AP, causing isohyets to be oblique to the Andean 154
relief south of 15°S (Houston and Hartley, 2003; Bookhagen and Strecker et al., 2008; Garreaud, 155
2009) and producing the latitudinal rainfall gradient over the western AP and WC clearly visible in 156
maps (Figs. 1, 6). In South Peru, the gradient is parallel to the coast and the WC and headwaters of 157
catchments draining to the Pacific experience precipitation rates ≥200 mm/yr (Fig. 6). In North 158
Chile, mean annual rainfall on the WC decreases southward to ≤50 mm/yr south of ~20°S (Fig. 6). 159
In both South Peru and North Chile, rainfall is almost null on the Pampa del Tamarugal and towards 160
the coast (≤5 mm/yr of precipitation). Regarding our actualistic modeling approach, we retain the 161
observed oblique spatial pattern of present-day rainfall in the WC, upstream from the three 162
catchments typifying the Tiliviche threshold. In other words, our approach assumes and tests 163
stability over the long term of oblique monsoonal conditions across the WC, which is consistent 164
with long-lived hyper-aridity in the Atacama Desert and with evidence for monsoonal conditions in 165
the eastern Andes, on the landward side of the Altiplano, since ~≥10 Ma (Uba et al., 2007; Mulch et 166
al., 2010). 167
2.4 North Chile canyon incision: climatic or tectonic driver ? 168
In contrast with the evidence summarized above and the doubtless recent uplift of coastal South 169
Peru (Schildgen et al., 2007, 2009), it has for long been considered that uplift of coastal regions in 170
North Chile would be much older than the ~<10 Ma incision of canyons (e.g., Mortimer and Saric, 171
1975; Farías et al., 2005; García et al., 2011). It has been suggested that the top surface of the CDB 172
was dammed by pre-existing CC reliefs and stood for a long time as an elevated base level not 173
connected to the ocean (e.g., Mortimer and Saric, 1975; García et al., 2011). Canyon incision, and 174
eventual connection of the drainage to the ocean, would have been recently triggered by runoff 175
increases associated with hypothetic semi-arid pulses interrupting the prevalent hyper-arid regime 176
(García et al., 2011). This transition to exoreic drainage would have been more efficient and rapid 177
in the North because of the latitudinal rainfall gradient (García et al., 2011). These authors also 178
consider that incision processes would not have been synchronous along the margin. There is no 179
compelling geological evidence for such a complex scenario and the notion of old uplift (~≥25 Ma) 180
with uncorrelated incision appears controversial (e.g. Zeilinger et al., 2005; Kober et al., 2006; 181
Schildgen et al., 2007; Schlunegger et al., 2006, 2010; Hoke et al., 2007; Jordan et al., 2010; Kirk-182
Lawlor et al., 2013). So here, we choose to retain the simplest hypothesis of relatively stable hyper-183
aridity since ~15 Ma, and to test the idea that the flat, western part of the Atacama Pediplain was 184
initially forming an Andean piedmont close to the ocean base-level (Fig.7), and that overall uplift of 185
this piedmont relative to the ocean triggered the headwards incision of canyons since ~<10Ma 186
(García and Hérail, 2005; Schildgen et al., 2007; Schlunegger et al., 2006, 2010; Kirk-Lawlor et al., 187
2013). 188
189
3. MODELING OF DRAINAGE EVOLUTION 190
3.1 Modeling strategy 191
From the descriptions and discussion detailed in Part 2, we retain several relevant statements for our 192
modeling of drainage in North Chile: (1) the uplift of the Andean piedmont starts at ~10 Ma or even 193
younger and triggered headwards incision of rivers (Fig.7) as demonstrated for canyons in South 194
Peru; (2) the first-order geomorphic and geological continuity of coastal units throughout the 195
identified drainage threshold implies that differences of stream morphology are likely associated 196
with latitudinal variation of river erosional power; (3) the threshold between exoreic and endoreic 197
drainage regimes is correlated with the latitudinal gradient imposed by the modern monsoon 198
(carrying humidity from the Atlantic); (4) the hyper-aridity on coastal North Chile and the present-199
day oblique monsoonal conditions across the WC are stable features on the long-term. We use these 200
inferences to settle a numerical model of landscape evolution using the code of [Carretier and 201
Lucazeau, 2005]. 202
3.2 The numerical landscape model APERO 203
As with other landscape evolution models (e.g. SIBERIA (Willgoose et al., 1991), CAESAR 204
(Coulthard et al., 2002) GOLEM (Tucker and Slingerland, 1994), CASCADE (Braun & Sambridge, 205
1997), CHILD (Tucker & Bras, 2000), EROS (Davy and Crave, 2000)), the APERO code models 206
landscape evolution by routing water and sediments over a grid of regular cells, starting from cells 207
at the highest elevation and moving progressively to the lowest ones. It calculates elevation changes 208
according to sediment production resulting from diffusion, alluvial transport and bedrock incision. 209
The principles of APERO (Carretier, 2002; Carretier & Lucazeau, 2005) are described here in 210
simple terms and in more detail in the Supplementary Information. 211
212
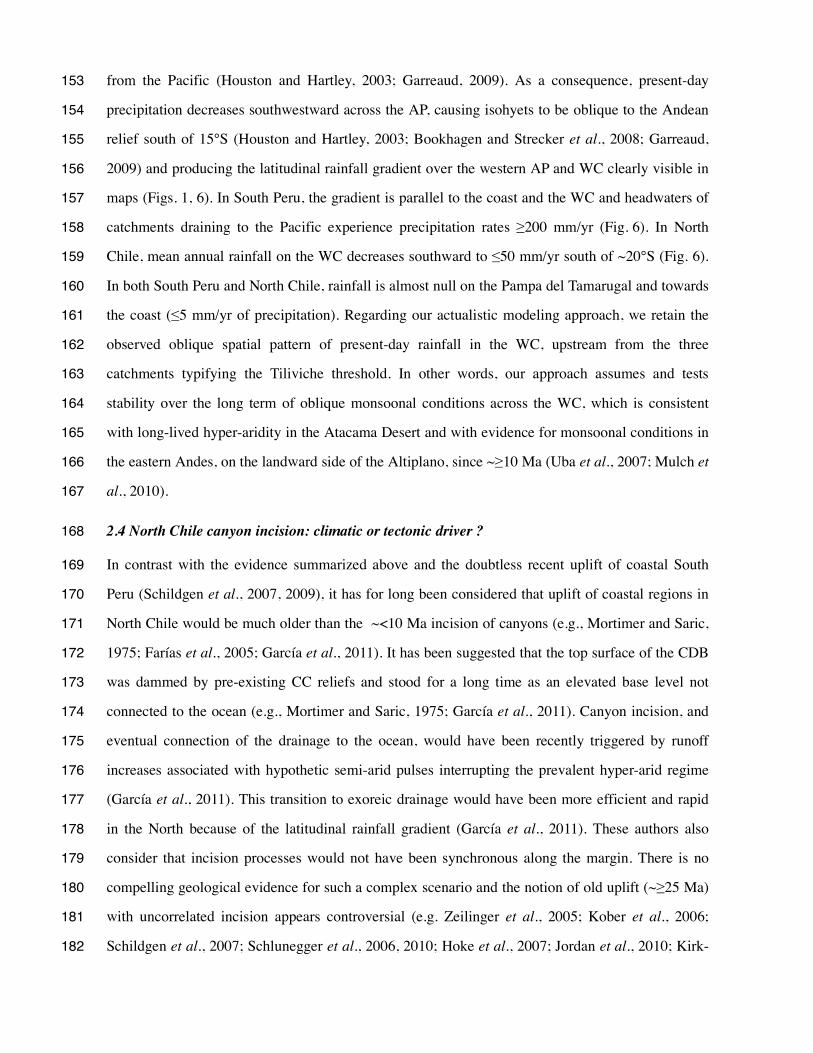
The governing equations used in APERO are the conservation equations of mass for water (Eq.1) 213
and for sediments (Eq.2) that are separately numerically solved with the finite difference method. 214
Q Q 0 (Eq.1) 215
with h the water thickness integrated over the cell size, Q the input water flux and Qthe 216
output water flux. 217
Q Q U 0 (Eq.2) 218
with h the ground elevation integrated over the cell size, Q the input sediment flux, Q the 219
output sediment flux and U, the tectonic uplift rate integrated over the cell size. In Eq.1 and Eq.2, 220
the fluxes and the uplift rate have dimensions of LT. 221
Q scales with the effective mean precipitation rate within the catchment relative to the cell (i), 222
including the cell (i) itself. 223
Q P x, yds (Eq.3) 224
P is the effective mean precipitation rate LT and A is the catchment area relative to cell i. 225
Each cell (i) interacts with its neighboring cells (j) depending on the difference in topography 226
between the two cells. We define S max0, / where is the distance between the 227
two cells. The distribution of water from cell i to cell j (QfOUTij) follows Eq.4, called multiple flow 228
algorithm: 229
Q Q∑
(Eq.4) 230
The total output flux Q is the sum over (j) of the local Q. 231
The input sediment flux Q on a cell i is the sum of the local outputs Q of sediments 232
from the upper cells which are distributed according to the following algorithm. 233
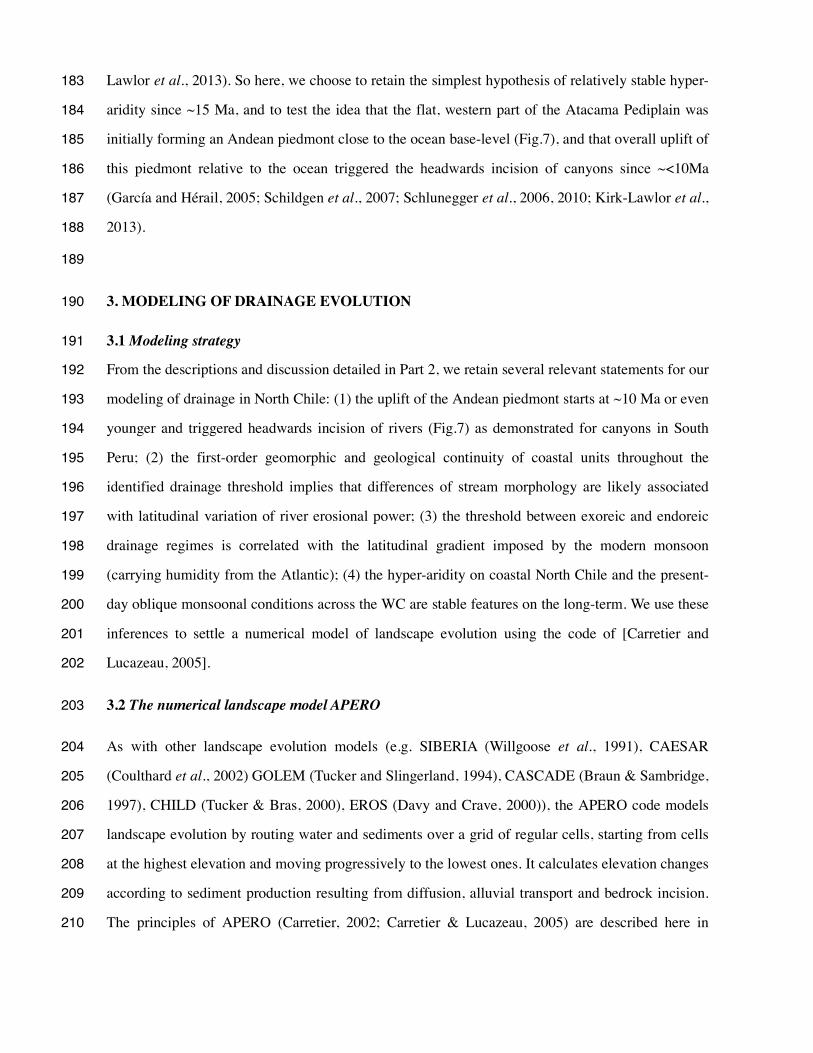
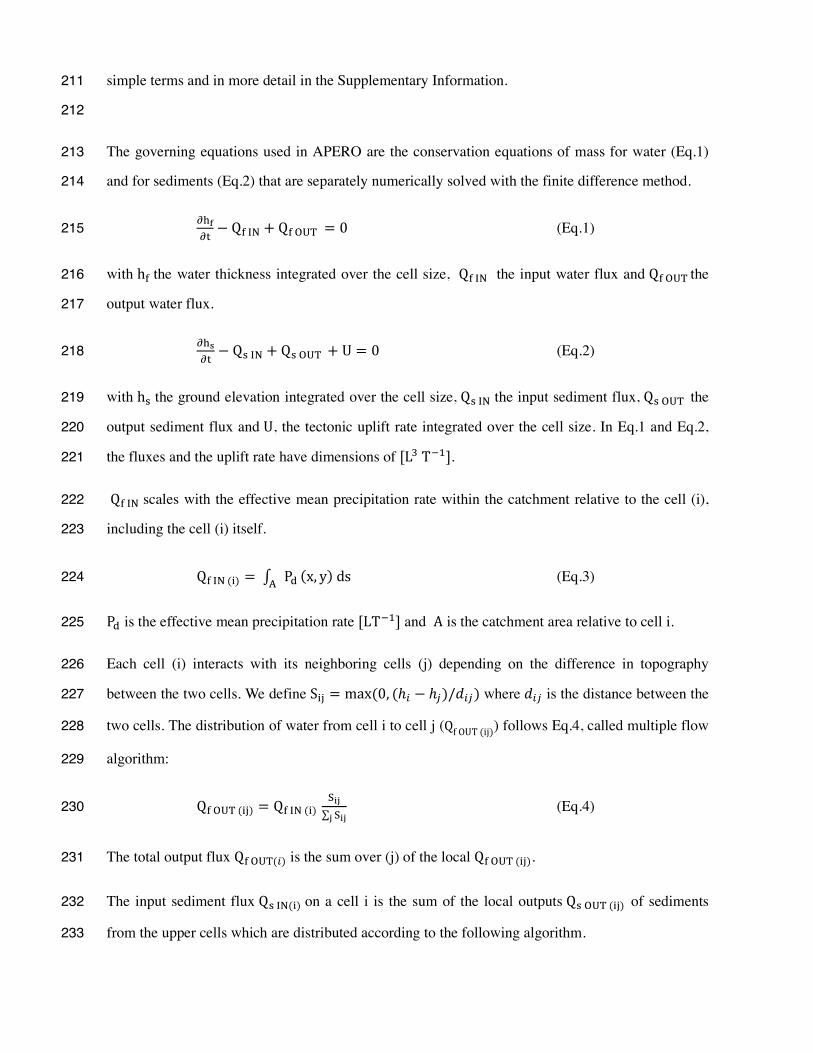
The output sediment flux QsOUTi on a cell (i) (Eq.5) corresponds to the joint action of diffusion 234
processes (Eq.6 and Eq.7), alluvial transport (Eq.8) and bedrock incision processes (Eq.9) occurring 235
on a cell, 236
Q Q Q Q (Eq.5) 237
The component of sediment output due to bedrock diffusion processes, Q or diffusive 238
transport rate (Eq.6), is written as a non-linear diffusion equation (Roering et al., 1999) (Eq.7) to 239
take into account landslide processes where: 240
Q . q (Eq.6) 241
q κ
(Eq.7) 242
with S the critical slope corresponding to the gradient of repose of sediments or bedrock and κ a 243
diffusion coefficient LT. Note that κ depends on rock type (either sediment, or bedrock or a 244
combination of the two, see Supplementary Information). 245
The alluvial transport flux, Q, and the bedrock incision flux integrated over the river width, Q, 246
are written as power-law equations: 247
Q KQS (Eq.8) 248
Q KQS (Eq.9) 249
where Kand K are positive coefficients with dimensions LT and LT. α, 250
β , m and n determine the degree of non-linearity of the two laws and m and n have values 251
comprised between 0 and 2 (Stock & Montgomery, 1999). 252
Further details on the numerical implementation and on model calibration (grid size, 253
characterization of K α, β, K , m and n , choice of parameters values, etc.) are given in the 254
Supplementary Information (SI) with pertinent references herein. 255
3.3 Model Setting 256
We ran numerical experiments of landscape evolution using the modeling code of [Carretier and 257
Lucazeau, 2005]. The experimental grid is scaled to reproduce the topography of the threshold area 258
of North Chile and to reach the present-day stage after 7 My of evolution: the minimum likely age 259
for North Chile onset time of incision. Experiments start with an initially flat, low-energy coastal 260
topography that lies at sea level. The WC-AP is a pre-existing relief (Victor et al., 2004; Hoke et al., 261
2007; Jordan et al., 2010). In agreement with the geological constraints, a value of 0.14 mm/yr is 262
used for the uplift rate at the coast rising to 0.22 mm/yr at the WC (see supplementary information 263
for a detailed discussion). Those rates remain constant during the experiment. The final modeled 264
topography compares well with the current one, including the formation of a 1-km-high CS (Figs. 7, 265
S1). Rainfall is null at the coast and on the Pampa del Tamarugal surface and is mostly localized 266
above the upper WC and AP reliefs (Fig. S1). Several values of precipitation rates were tested (from 267
20 to 200 mm/yr on the WC) to take into account the possible effect of the latitudinal rainfall 268
gradient. Infiltration and evaporation cannot be addressed by our modeling, so water flows at the 269
surface and goes out from the model grid at its left (West) boundary (Carretier and Lucazeau, 2005). 270
Refer to Supplementary Information (SI) (Table S1 and Figures S2 to S9) for a complete summary 271
of other boundary conditions. Parameters controlling the physics of the erosion processes are fixed 272
according to published values (references given in SI), or chosen among values producing the 273
observed morphology, after sensitivity analyses (see SI Part C, Table S2 and Figures S2 to S9). 274
275
4. EXPERIMENTAL MODELING RESULTS, LIMITATIONS AND IMPLICATION 276
277
4.1 Topography and river drainage evolution: model vs. natural landscape 278
We simulate the evolution of river incision onto an uplifting coastal block under three different 279
constant rainfall conditions (low, intermediate and high Precipitation Rates) during 7 My in 280
agreement with the present-day precipitation rates (PR) distribution over North Chile. Figure 8b 281
shows the modeling results of the three corresponding experiments where river long profiles can be 282
compared to the three stream profiles typifying the threshold in North Chile: Camarones, Tiliviche 283
and Tarapacá. In the experiments, dendritic drainage catchments form as the coastal topography 284
rises without being significantly eroded, except where river incision develops. 285
For the higher values of PR (Fig. 8b-top), the main streams are deeply incised in the coastal 286
topography and grade to the oceanic base level. The river profile is nearly in equilibrium for ~80 287
km from the coast up to the WC. This result is comparable to the Camarones river profile that is 288
uniformly deeply entrenched in the topography from the Altiplano plateau towards the oceanic base 289
level. Water supply appears therefore to be sufficient to allow a full river incision from high 290
elevations (4000 m) to the oceanic base level. 291
For the intermediate PR values (Fig. 8b-middle), the stream presents a concave shape; lower and 292
upper stream courses are nearly separated, with little incision in the middle course and a knick-point 293
forms at ~40 km from the coast. This concave shape means that the stream is not in equilibrium, 294
contrary to the first experiment with higher value of PR. The profile is comparable to the Tiliviche 295
river profile whose incision is five times lower in the middle of the coastal plateau than it is closer 296
to the Coastal Scarp. This implies that water supply is not high enough to enable a spatially constant 297
incision into the uplifting topography. 298
For the lower PR values (Fig. 8b-bottom), incision in the middle course of streams is replaced by 299
aggradation on top of the rising coastal topography. The water flows at the surface and drives 300
incision of the lower course and formation of a knick-point at ~20 km from the coast. This 301
numerical experiment result can be compared to the Tarapacá river incision. The stream incises only 302
the upper part of the topography, does not entrench the coastal plateau and consequently does not 303
reach the oceanic base level. 304
305
4.2 Limitations and drawbacks 306
We acknowledge that our experiments are simple first-order ones and do not take into account 307
several natural processes occurring in North Chile that may play a role on the final results. 308
However, we note that our results compare qualitatively well with the observed landscape 309
morphology and its variability. Yet, our modeling approach has some limitations that we discuss 310
here before further exploring the implications of the results. 311
First, the model involves 12 parameters for most of which there is no direct natural geological or 312
hydrological quantitative constraints. So, it has been necessary to (1) determine the dominant 313
parameter for our modeling and investigate the effects of its possible values and (2) calibrate each 314
parameter with tests within ranges of published values. Because there is little sediment cover on the 315
riverbed in North Chile, the evolution of topography is likely governed by detachment-limited 316
process justifying the choice of the bedrock incision parameter (K) as one of the main controls in 317
our modeling. As there is no specific constraint for this parameter respective to North Chile rivers, 318
we tested several values published in the literature and considered two end-members values along 319
with an intermediate one. We ran a sensitivity analysis for each of the other parameters and 320
calibrated the model with their most pertinent value (cf. SI). We present here our preferred solution 321
and we acknowledge that this is not a unique solution. 322
Second, while most authors regroup rock erodibility and climatic effects into the bedrock incision 323
parameter, an assumption that is correct for steady-state systems, we note that, in a transitory 324
regime, PR also acts in the alluvial transport process (Eq.8). This justifies our choice to use distinct 325
Kand PR. Our results imply that, for a given value of K, the threshold between exoreic and 326
endoreic drainage systems is controlled by differences in PR. However, comparable result could 327
have been obtained for other combinations of Kand PR. Increasing erodibility balances with 328
decreasing PR, and inversely (Eq.9). Our sensitivity analysis highlights this trade-off between 329
erodibility and PR (see Fig.S5 to S9). 330
Third, we use mean annual PR values derived from present day precipitation rates measured over a 331
9 years period (1998 to 2006) (data from [Bookhagen et al., 2008]). Extrapolating those present-day 332
rates over a 7 My-time scale is justified by studies of erosion, mineralization and soil development 333
carried out in the Atacama Desert that show that PR have been lower than 200 mm/yr over the last 334
20 My (Alpers and Brimhall, 1988; Rech et al., 2006). However, rainfall in the Atacama Desert area 335
occurs as infrequent distinct events of relatively large amplitude and not as continuous rainfall. 336
Bedrock incision due to such discrete events is likely higher than the incision resulting from a 337
constant mean rainfall. We used a 10-years time step in the modeling that simulates to a certain 338
degree this kind of discrete rainfall event. However, the influence of short-term (10-100 years) 339
variability of PR on the evolution of the landscape will have to be more carefully investigated for 340
further quantitative studies. 341
Other limitations come from the fact that our modeling does not allow for evaporation of 342
infiltration. In North Chile (Fig. 8a middle and bottom), part of the water flow leaks or evaporates 343
while crossing the Pampa del Tamarugal, resulting in less incised lower streams than in the 344
experiments, and knick-points closer to the coast. Another difference is that the experimental upper 345
course of catchments is also more entrenched into the WC topographic relief than in nature 346
(compare natural and experimental river profiles on Fig. 8). It is probable that part of the 347
precipitation occurring over the west AP and WC does not contribute to the surface flow and instead 348
infiltrates the bedrock causing springs to form at lower elevation on the flanks of the WC as 349
described by [Hoke et al., 2004]. Also, a thick resistant flows of Miocene ignimbrite covers the WC 350
topography and may prevent efficient erosion. In our experiments, we used a uniform bedrock 351
incision parameter over the entire box, but the effect of this ignimbritic cover may be assessed 352
looking at the sensitivity analyses for different values of K. 353
Time scaling is difficult to test with our experiments. We must acknowledge that we adjusted the 354
modeling parameter values to allow for drainage development over a 7 My-time scale, which is 355
deduced from geological observations for the onset of incision (eg. Naranjo and Paskoff, 1985; 356
Hoke et al., 2004). With this taken into account, we note that with constant uplift rate and different 357
values for PR, our model, run for 7 My, is able to reproduce the different drainage systems we 358
identified in the threshold area. 359
360
4.3 Climatic and geodynamic implications 361
From the comparison of experimental and natural drainages (Fig. 8), we deduce that retaining 362
experimental PR values in the range of present-day values is enough to explain the development of 363
that drainage, including its latitudinal variation and specifically the occurrence of the Tiliviche 364
threshold. More specifically, under constant tectonic uplift, the occurrence of that threshold requires 365
a stable latitudinal gradient of precipitation over the WC, similar to the modern one. We note that 366
the condition of keeping such stable latitudinal PR gradient needs to take into the account the trade-367
offs between the different modeling parameters and in particular the one between basement 368
erodibility and precipitation rate. This implies a set of possible stable solutions consistent with 369
monsoon regimes with different precipitation intensity (within a range of PR values), but 370
maintaining stable spatial extent and latitudinal gradient over the WC. 371
Both geological observations and model support the idea of a flat low-energy coastal morphology 372
located close to the Pacific Ocean base level as initial conditions prior to ca. 7 Ma. As there may be 373
a lag time between uplift and related incision processes, we consider the age of 7 Ma as a minimum 374
age for the onset of uplift, which could be a few millions years older. So, at ~10 Ma, in North Chile 375
and South Peru, the southwestern Andean piedmont had probably begun to experience synchronous 376
and uniform uplift triggered by a dramatic tectonic change. The uplift added ~1 km of elevation to 377
the onshore Andean subduction margin limited to the West by the Coastal Scarp (Fig. 1c). This 378
recent uplift of the coastal topography implies to consider a trench-ward enlargement of the Andean 379
topographic relief by incorporation of the coastal Atacama region to the Andes-Altiplano orogen 380
(Armijo et al., submitted). Deep crustal underplating, probably associated with fault geometrical 381
complexities at the subduction plate interface and above (Armijo and Thiele, 1990; Contreras-Reyes 382
et al., 2012), is a possible cause of coastal uplift and widening of the Andean orogen (Armijo et al., 383
submitted). Structural complexities may also control segmentation of the mechanically coupled 384
zone at the subduction interface, as recently suggested by [Béjar-Pizarro et al., 2013]. So, recent 385
(<10 Ma) Andean deformation is not only located on the eastern side of the orogen as generally 386
admitted (eg. McQuarrie et al., 2004; Oncken et al., 2006) but also proceeds by widening of the belt 387
towards the subduction, which brings new insights into the process of propagation of the 388
deformation across the entire mountain range. 389
390
5. CONCLUSIONS 391
Numerical modeling of landscape evolution in North Chile allowed us to test the hypothesis of 392
recent uniform tectonic uplift driving river incision in the past 10 My over the west Andean margin. 393
Our results offer a simple framework with a reduced number of semi-quantitative geomorphic 394
parameters, which we used to explain the modern evolution of both, morphology and tectonics, as 395
deciphered from their quantitative imprint in the present-day landscape. An important result is that 396
the latitudinal transition from exoreic to endoreic drainage systems across the Atacama Desert of 397
North Chile would be primarily controlled by a spatial gradient of precipitation rates over the 398
headwaters of rivers in the Western Cordillera. Gradient patterns required in our modeling are 399
similar to present-day conditions of precipitation rates; a result suggesting that the rainfall patterns 400
in the Western Cordillera and the Atacama Desert, largely controlled by the effect of Atlantic 401
monsoon, are long-lived features of Andean climate. 402
403
404
ACKNOWLEDGMENTS 405
Work supported by an IPGP-Univ.Paris Diderot PhD grant to A. Coudurier Curveur and funded by 406
CNRS-INSU, ANR projects SubChile and MegaChile, and the LABEX UnivEarthS (Sorbonne 407
Paris Cité). We benefited from fruitful discussions with D. Carrizo in the field and with F. Métivier 408
on the experimental approach. We thank anonymous reviewers and the editor for their very helpful 409
and constructive comments. 410
411
412
413
REFERENCES 414
415
Alpers, C. N., and G. H. Brimhall, 1988, Middle Miocene climatic-change in the Atacama Desert, 416
northern Chile - evidence from supergene mineralization at La Escondida, Geol. Soc. Am. Bull., 417
100(10), 1640-1656, doi: 10.1130/0016-7606(1988)100<1640:mmccit>2.3.co;2. 418
Armijo, R., and Thiele, R., 1990, Active faulting in northern Chile: ramp stacking and lateral 419
decoupling along a subduction plate boundary?: Earth and Planetary Science Letters, v. 98, no. 1, p. 420
40–61, doi: 10.1016/0012-821X(90)90087-E. 421
Armijo, R., Rauld, R., Thiele, R., Vargas, G., and Campos, J., Lacassin, R., and Kausel, E., 2010, 422
The West Andean Thrust, the San Ramón Fault, and the seismic hazard for Santiago, Chile: 423
Tectonics, v. 29, TC2007, doi: 10.1029/2008TC002427. 424
Armijo, R., Lacassin, R., Coudurier-Curveur, A. and Carrizo, D., 2014, Coupled tectonic evolution 425
of Andean orogeny and global climate, Tectonics, submitted. 426
Béjar-Pizarro, M., Socquet, A., Armijo, R., Carrizo, D., Genrich, J., and Simons, M., 2013, Andean 427
structural control on interseismic coupling in the North Chile subduction zone, Nature Geoscience, 428
v. 6, p. 462-467, doi: 10.1038/NGEO1802. 429
Bonnet, S., and Crave, A., 2003, Landscape response to climate change: Insights from experimental 430
modeling and implications for tectonic versus climatic uplift of topography: Geology, v. 31, no. 2, 431
p. 123–126, doi: 10.1130/0091-7613(2003)031<0123:LRTCCI>2.0.CO;2. 432
Bookhagen, B., and Strecker, M.R., 2008, Orographic barriers, high�resolution TRMM rainfall, 433
and relief variations along the eastern Andes: Geophysical Research Letters, v. 35, no. 6, L06403, 434
doi: 10.1029/2007GL032011. 435
Braun, J. and Sambridge, M., 1997, Modelling landscape evolution on geological time scales: a new 436
method based on irregular spatial discretization, Basin Research, 9: 27-52 437
Carretier, S. and Lucazeau, F., 2005, How does alluvial sedimentation at range fronts modify the 438
erosional dynamics of mountain catchments ?: Basin Research, v. 17, p. 361–381, doi: 439
10.1111/j.1365-2117.2005.00270.x 440
Charrier, R., Pinto, L., and Rodríguez, M. P., 2007, Tectonostatigraphic evolution of the Andean 441
Orogen in Chile, in The Geology of Chile, edited by T. Moreno and W. Gibbons, pp. 21–114, The 442
Geological Society, London. 443
Contreras-Reyes, E., Jara, J., Grevemeyer, I. , Ruiz, S., and Carrizo, D., 2012, Abrupt change in the 444
dip of the subducting plate beneath north Chile, Nature Geoscience, 5, 342–345, doi: 445
10.1038/ngeo1447. 446
Coulthard, T.J., Macklin, M.G. and Kirkby, M.J., 2002, A cellular model of Holocene upland river 447
basin and alluvial fan evolution, Earth Surface Processes and Landforms, v.27, n.3, p, 269-288 448
Davy, P., and Crave, A., 2000, Upscaling local-scale transport processes in large-scale relief 449
dynamics, Physics and Chemistry of the Earth, Part A: Solid Earth and Geodesy, 25(6–7), 533-541, 450
doi:10.1016/S1464-1895(00)00082-X. 451
Dunai, T.J., González López, G.A., and Juez-Larré, J., 2005, Oligocene–Miocene age of aridity in 452
the Atacama Desert revealed by exposure dating of erosion-sensitive landforms: Geology, v. 33, p. 453
321-324, doi: 10.1130/G21184.1. 454
Evenstar, L., Hartley, A., Stuart, F., Mather, A., Rice, C., and Chong, G., 2009, Multiphase 455
development of the Atacama Planation Surface recorded by cosmogenic 3He exposure ages: 456
Implications for uplift and Cenozoic climate change in western South America: Geology, v. 37, p. 457
27-30, doi: 10.1130/G25437A.1. 458
Farías, M., R. Charrier, D. Comte, J. Martinod, and G. Hérail, 2005, Late Cenozoic deformation and 459
uplift of the western flank of the Altiplano: Evidence from the depositional, tectonic, and 460
geomorphologic evolution and shallow seismic activity (northern Chile at 19°30'S), Tectonics, 24, 461
TC4001, doi:4010.1029/2004TC001667. 462
García, M., and G. Hérail, 2005, Fault-related folding, drainage network evolution and valley 463
incision during the Neogene in the Andean Precordillera of Northern Chile, Geomorphology, 65, 464
279-300. 465
García, M., Riquelme, R., Farías, M., Hérail, G., and Charrier, R., 2011, Late Miocene-Holocene 466
canyon incision in the western Altiplano, northern Chile: tectonic or climatic forcing?: Journal of 467
the Geological Society, v. 168, p. 1047–1060, doi: 10.1144/0016-76492010-134. 468
Garreaud, R.D., 2009, The Andes climate and weather: Advances in Geosciences, v. 22, p. 3–11, 469
doi: 10.5194/adgeo-22-3-2009. 470
Gregory-Wodzicki, K. M., 2000, Uplift history of the Central and Northern Andes: A review, 471
Geological Society of America Bulletin, 112(7), 1091-1105, doi: 10.1130/0016-472
7606(2000)112<1091:uhotca>2.3.co;2. 473
Hartley, A.J., Chong, G., Houston, J., and Mather, A.E., 2005, 150 million years of climatic 474
stability: evidence from the Atacama Desert, northern Chile: Journal of the Geological Society, v. 475
162, p. 421–424, doi: 10.1144/0016-764904-071. 476
Hartley, A.J., and Evenstar, L., 2010, Cenozoic stratigraphic development in the north Chilean 477
forearc: Implications for basin development and uplift history of the Central Andean margin: 478
Tectonophysics, v. 495, p. 67-77, doi: 10.1016/j.tecto.2009.05.013. 479
Hoke, G.D., Isacks, B.L., Jordan, T.E. and Yu, J.S., 2004, Groundwater sapping origin for the giant 480
quebradas of northern Chile, Geology, v. 32 (7), p. 605-608 481
Hoke, G.D., Isacks, B.L., Jordan, T.E., Blanco, N., Tomlinson, A.J., and Ramezani, J., 2007, 482
Geomorphic evidence for post-10 Ma uplift of the western flank of the central Andes 18°302−22°S: 483
Tectonics, v. 26, p. 17, doi: 10.1029/2006TC002082. 484
Houston, J., and Hartley, A.J., 2003, The central Andean west-slope rainshadow and its potential 485
contribution to the origin of hyper-aridity in the Atacama Desert: International Journal of 486
Climatology, v. 23, p. 1453–1464, doi: 10.1002/joc.938. 487
Jordan, T. E., P. L. Nester, N. Blanco, G. D. Hoke, F. Dávila, and A. J. Tomlinson, 2010, Uplift of 488
the Altiplano-Puna plateau: A view from the west, Tectonics, 29, TC5007, doi: 489
10.1029/2010TC002661. 490
Kirk-Lawlor, N. Jordan, T.E., Rech, J.A., and Lehmann, S., 2013, Late Miocene to Early Pliocene 491
paleohydrology and landscape evolution of Northern Chile, 19° to 20°S, Palaeogeography, 492
Palaeoclimatology, Palaeoecology, 387: 76-90 493
Kober, F., Schlunegger, F., Zeilinger, G., and Scheider, H., 2006, Surface uplift and climate 494
change : The geomorphic evolution of the Western Escarpment of the Andes of northern Chile 495
between the Miocene and present: GSA Special Papers 2006, v. 398, p.75-86, doi: 496
10.1130/2006.2398(05). 497
Kober, F., Ivy-Ochs, S., Schlunegger, F., Baur, H., Kubik, P., and Wieler, R., 2007, Denudation rates 498
and a topography-driven rainfall threshold in northern Chile: Multiple cosmogenic nuclide data and 499
sediment yield budgets: Geomorphology, v. 83, p. 97–120, doi: 10.1016/j.geomorph.2006.06.029. 500
McQuarrie, N., 2002, The kinematic history of the central Andean fold-thrust belt, Bolivia: 501
Implications for building a high plateau, GSA Bulletin, v. 114(8), p. 950-963 502
Mortimer, C., and Saric, R. N., 1975, Cenozoic studies in northernmost Chile: Geologische 503
Rundschau, 64, 395-420. 504
Mulch, A., Uba, C.E., Strecker, M.R., Schoenberg, R., and Chamberlain, C.P., 2010, Late Miocene 505
climate variability and surface elevation in the central Andes: Earth and Planetary Science Letters, 506
v. 290, p. 173–182, doi: 10.1016/j.epsl.2009.12.019. 507
Naranjo, J.A., and Paskoff, R., 1985, Evolución cenozoica del piedemonte andino en la Pampa del 508
Tamarugal, norte de Chile (18° -21°S): In IV Congreso Geologico Chileno, volume 4, pages 5–149 509
– 5–165. Universidad del Norte de Chile. 510
Nishiizumi, K., Caffee, M., Finkel, R., and Brimhall, G., 2005, Remnants of a fossil alluvial fan 511
landscape of Miocene age in the Atacama Desert of northern Chile using cosmogenic nuclide 512
exposure age dating. Earth and Planetary Science Letters, v. 237, 499-507, 513
doi:10.1016/j.epsl.2005.05.032 514
Oncken, O., Chong, G., Franz, G., Giese, P., Gotze, H., Ramos, V., and Strecker, M., 2006, 515
Deformation of the central andean plate system - Facts, fiction and constraints for plateau models, 516
in The Andes - Active subduction orogeny, edited by Springer, pp.3-27, Berlin-Heidelberg 517
Rech, J., Currie, B., Michalski, G. and Cowan, A., 2006, Neogene climate change and uplift in the 518
Atacama Desert, Chile, Geology, v.34(9), p. 761-764 519
Roering, J.J., Kirchner, J.W., and Dietrich, W.E., 1999, Evidence for non-linear, diffusive sediment 520 transport on hillslopes and implications for landscape morphology, Water Resources Research, v.35, 521 p.853-870 522
523 Schildgen, T., Hodges, K., Whipple, K., Reiners, P., and Pringle, M., 2007, Uplift of the western 524
margin of the Andean plateau revealed from canyon incision history, southern Peru: Geology, v. 35, 525
p. 523-526, doi: 10.1130/G23532A.1. 526
Schildgen, T. F., K. V. Hodges, K. X. Whipple, M. S. Pringle, M. C. van Soest, and K. Cornell, 527
2009, Late Cenozoic structural and tectonic development of the western margin of the central 528
Andean Plateau in southwest Peru, Tectonics, 28, TC4007, doi: 10.1029/2008TC002403. 529
Schildgen, T. F., G. Balco, and D. L. Shuster, 2010, Canyon incision and knickpoint propagation 530
recorded by apatite 4He/3He thermochronometry, Earth and Planetary Science Letters, 293(3-4), 531
377-387, doi: 10.1016/j.epsl.2010.03.009. 532
Schlunegger, F., Zeilinger, G., Kounov, A., Kober, F., and Husser, B., 2006, Scale of relief growth in 533
the forearc of the Andes of Northern Chile (Arica latitude, 18°S): Terra Nova, v. 18, p. 217–223, 534
doi: 10.1111/ter.2006.18.issue-3. 535
Schlunegger, F., F. Kober, G. Zeilinger, and R. von Rotz, 2010, Sedimentology-based 536
reconstructions of paleoclimate changes in the Central Andes in response to the uplift of the Andes, 537
Arica region between 19 and 21°S latitude, northern Chile, International Journal of Earth Sciences, 538
99(Supplement 1), 123-137, doi: 10.1007/s00531-010-0572-8. 539
Sillitoe, R. H., and E. H. McKee, 1996, Age of supergene oxidation and enrichment in the Chilean 540
porphyry copper province, Economic Geology and the Bulletin of the Society of Economic 541
Geologists, 91(1), 164-179. 542
Stock, J.D., and Montgomery, D.R., 1999, Geologic constraints on bedrock river incision using the 543
stream power law: Journal of Geophysical Research, v. 104, p. 4983–4993, doi: 544
10.1029/98JB02139. 545
Strecker, M., Alonso, R., Bookhagen, B., and Carrapa, B., 2007, Tectonics and Climate of the 546
Southern Central Andes: Annual Reviews Earth Planet. Sci, v. 35, p. 747–787, doi: 547
10.1146/annurev.earth.35.031306.140158. 548
Thouret, J.-C., G. Wörner, Y. Gunnell, B. Singer, X. Zhang, and T. Souriot, 2007, Geochronologic 549
and stratigraphic constraints on canyon incision and Miocene uplift of the Central Andes in Peru, 550
Earth and Planetary Science Letters, 263(3–4), 151–166, doi: 10.1016/j.epsl.2007.07.023. 551
Tucker, G.E., and Bras, R.L., 2000, A stochastic approach to modeling the role of rainfall variability 552
in drainage basin evolution, Water Resources Research, 36(7): 1953-1964 553
Tucker, G.E., and Slingerland, R.L., 1994, Erosional dynamics, flexural isostasy, and long-lived 554
escarpments: a numerical modeling study, Journal of Geophysical Research, 99: 12 229-12 243 555
Uba, C.E., Strecker, M.R., and Schmitt, A.K., 2007, Increased sediment accumulation rates and 556
climatic forcing in the central Andes during the late Miocene: Geology, v. 35, p. 979-982, doi: 557
10.1130/G224025A.1. 558
Victor, P., Oncken, O., and Glodny, J., 2004, Uplift of the western Altiplano plateau: Evidence from 559
the Precordillera between 20° and 21°S (northern Chile): Tectonics, v. 23, p. Tc4004, doi: 560
10.1029/2003TC001519. 561
Von Rotz, R., Schlunegger, F., Heller, F., and Villa, I., 2005, Assessing the age of relief growth in 562
the Andes of northern Chile: Magneto-polarity chronologies from Neogene continental sections: 563
Terra Nova, v. 17, p. 462–471, doi: 10.1111/j.1365-3121.2005.00634.x. 564
Whittaker, A.C., 2012, How do landscapes record tectonics and climate?: Lithosphere, v. 4, p. 160–565
164, doi: 10.1130/RF.L003.1. 566
Willgoose, G.R., Bras, R.L., Rodriguez-Iturbe, I., 1991a, A physically based coupled network 567
growth and hillslope evolution model: 1 Theory, Water Resources Research, 27(7):1671-1684 568
Zeilinger, G., Schlunegger, F., and Simpson, G., 2005, The Oxaya anticline (northern Chile): a 569
buckle enhanced by river incision ?, Terra Nova, vol. 17, p. 368-375, doi: 10.1111/j.1365-570
3121.2005.00622.x 571
572
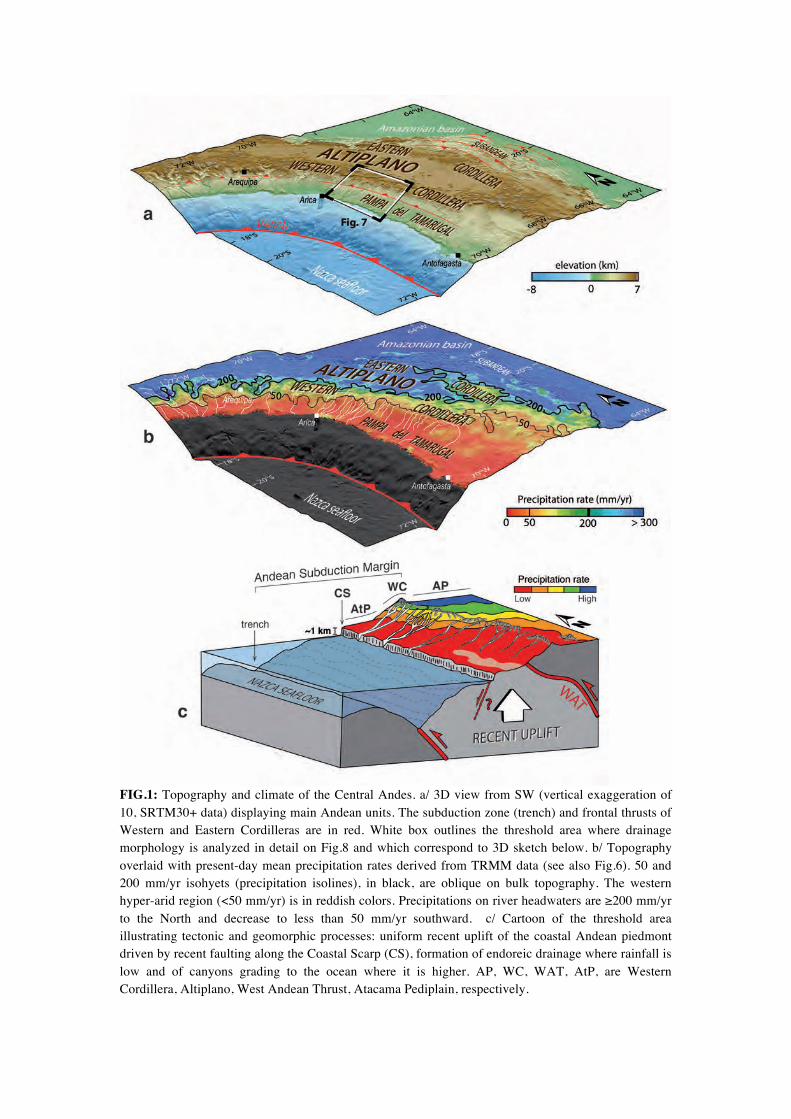
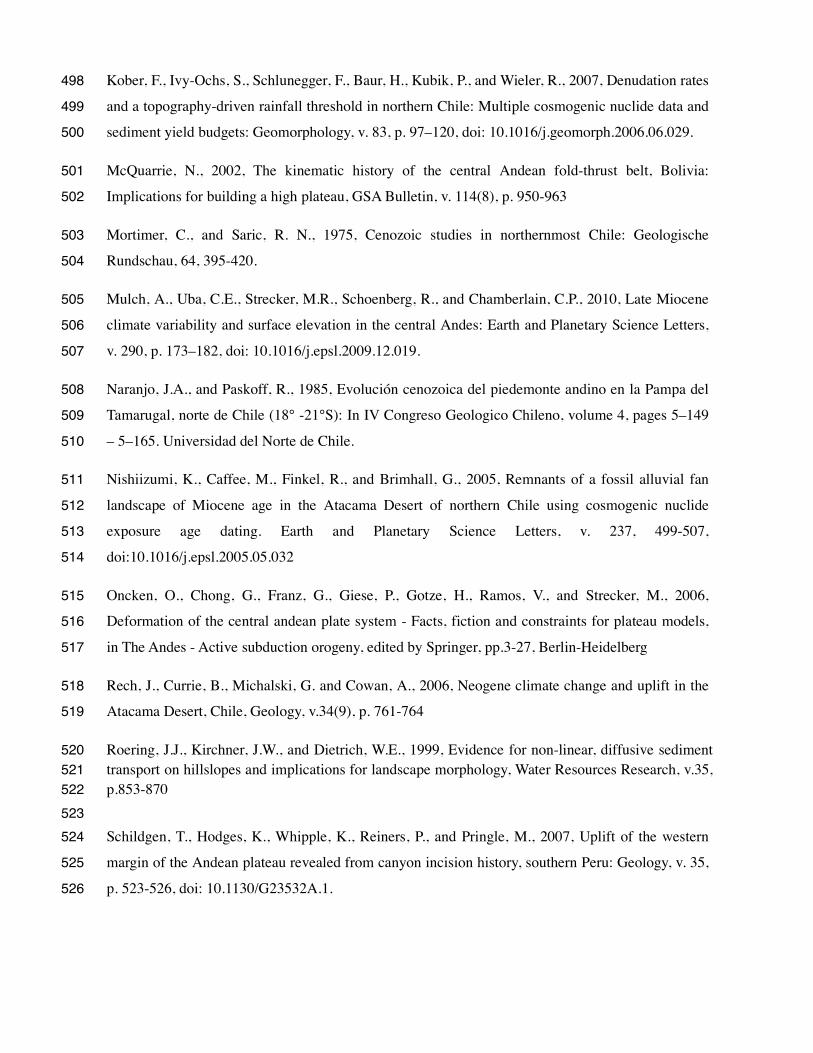
!FIG.1: Topography and climate of the Central Andes. a/ 3D view from SW (vertical exaggeration of 10, SRTM30+ data) displaying main Andean units. The subduction zone (trench) and frontal thrusts of Western and Eastern Cordilleras are in red. White box outlines the threshold area where drainage morphology is analyzed in detail on Fig.8 and which correspond to 3D sketch below. b/ Topography overlaid with present-day mean precipitation rates derived from TRMM data (see also Fig.6). 50 and 200 mm/yr isohyets (precipitation isolines), in black, are oblique on bulk topography. The western hyper-arid region (<50 mm/yr) is in reddish colors. Precipitations on river headwaters are ≥200 mm/yr to the North and decrease to less than 50 mm/yr southward. c/ Cartoon of the threshold area illustrating tectonic and geomorphic processes: uniform recent uplift of the coastal Andean piedmont driven by recent faulting along the Coastal Scarp (CS), formation of endoreic drainage where rainfall is low and of canyons grading to the ocean where it is higher. AP, WC, WAT, AtP, are Western Cordillera, Altiplano, West Andean Thrust, Atacama Pediplain, respectively. !
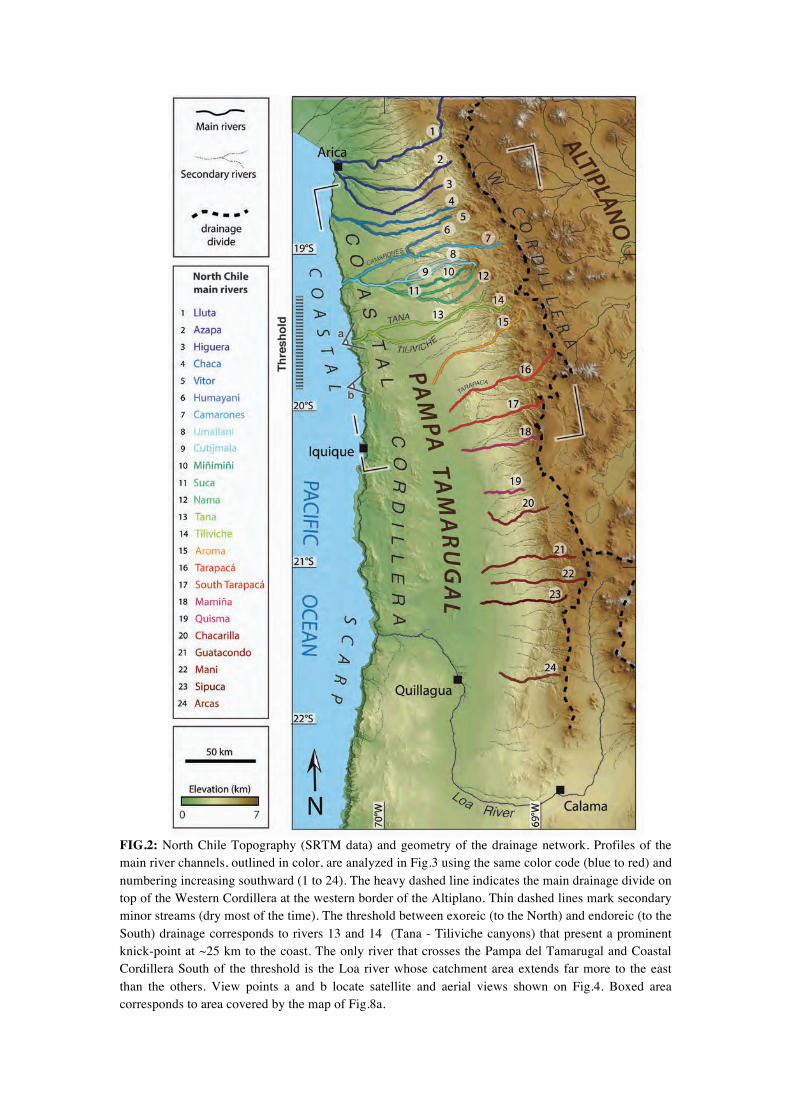
!FIG.2: North Chile Topography (SRTM data) and geometry of the drainage network. Profiles of the main river channels, outlined in color, are analyzed in Fig.3 using the same color code (blue to red) and numbering increasing southward (1 to 24). The heavy dashed line indicates the main drainage divide on top of the Western Cordillera at the western border of the Altiplano. Thin dashed lines mark secondary minor streams (dry most of the time). The threshold between exoreic (to the North) and endoreic (to the South) drainage corresponds to rivers 13 and 14 (Tana - Tiliviche canyons) that present a prominent knick-point at ~25 km to the coast. The only river that crosses the Pampa del Tamarugal and Coastal Cordillera South of the threshold is the Loa river whose catchment area extends far more to the east than the others. View points a and b locate satellite and aerial views shown on Fig.4. Boxed area corresponds to area covered by the map of Fig.8a.
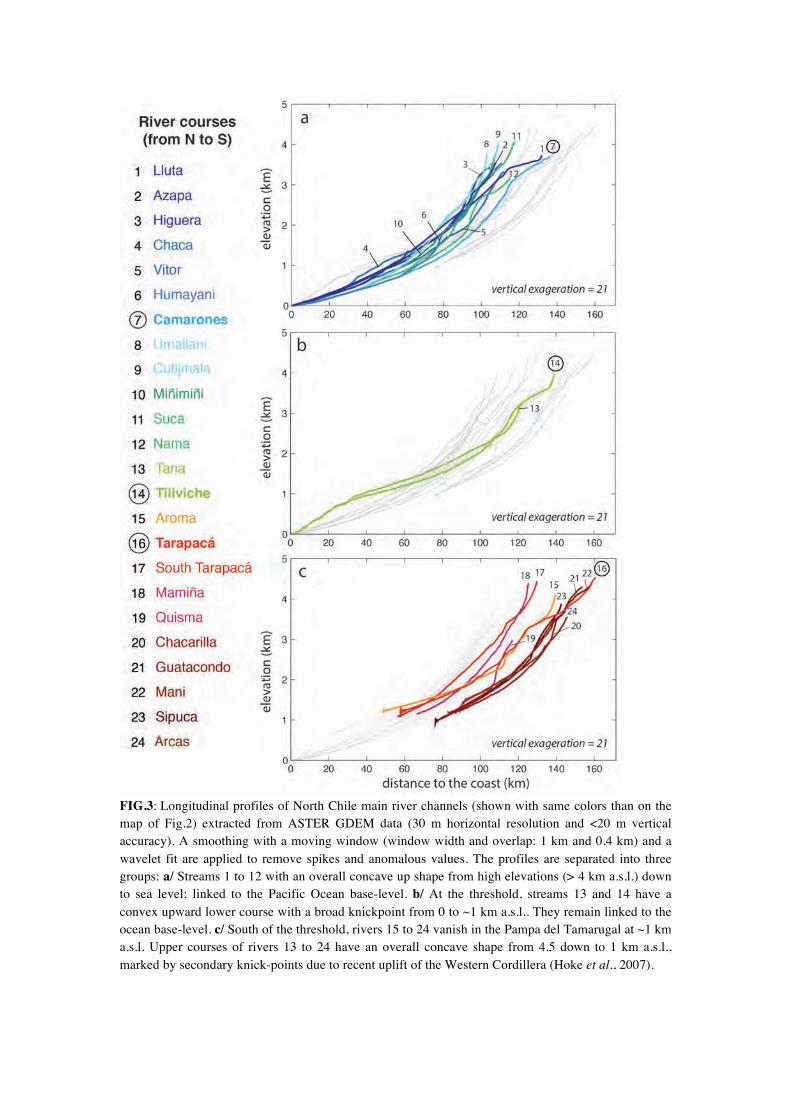
FIG.3: Longitudinal profiles of North Chile main river channels (shown with same colors than on the map of Fig.2) extracted from ASTER GDEM data (30 m horizontal resolution and <20 m vertical accuracy). A smoothing with a moving window (window width and overlap: 1 km and 0.4 km) and a wavelet fit are applied to remove spikes and anomalous values. The profiles are separated into three groups: a/ Streams 1 to 12 with an overall concave up shape from high elevations (> 4 km a.s.l.) down to sea level; linked to the Pacific Ocean base-level. b/ At the threshold, streams 13 and 14 have a convex upward lower course with a broad knickpoint from 0 to ~1 km a.s.l.. They remain linked to the ocean base-level. c/ South of the threshold, rivers 15 to 24 vanish in the Pampa del Tamarugal at ~1 km a.s.l. Upper courses of rivers 13 to 24 have an overall concave shape from 4.5 down to 1 km a.s.l., marked by secondary knick-points due to recent uplift of the Western Cordillera (Hoke et al., 2007).
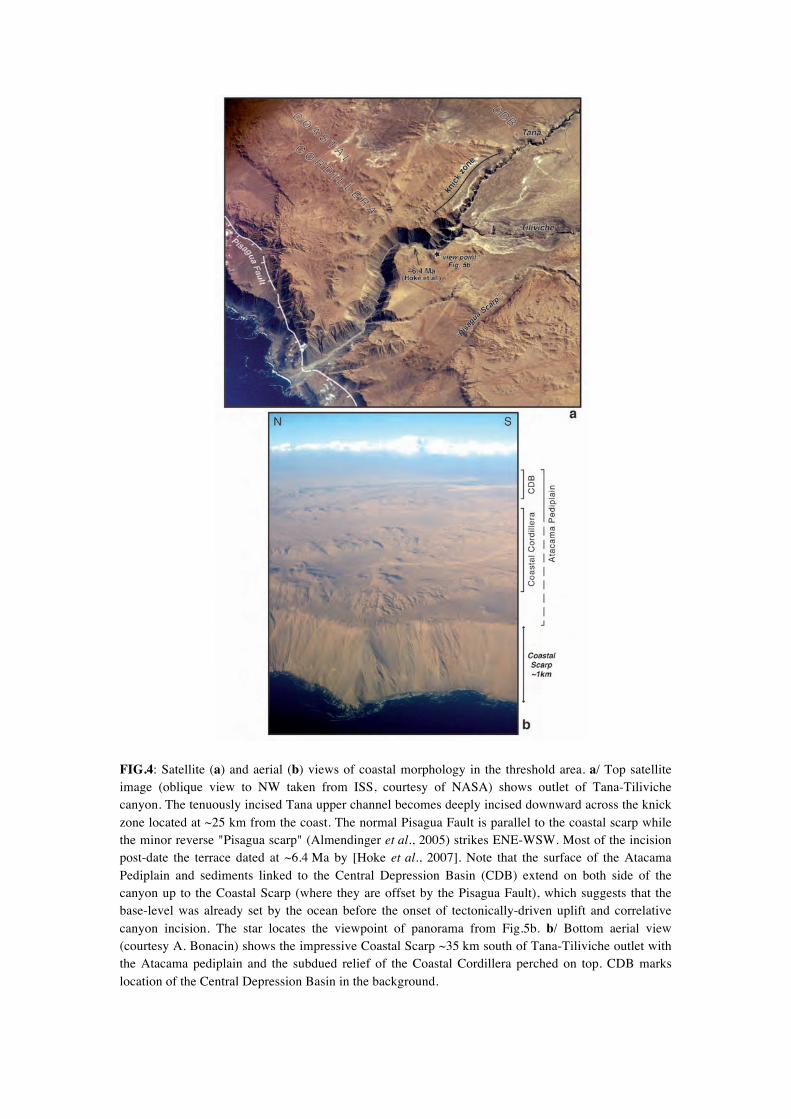
FIG.4: Satellite (a) and aerial (b) views of coastal morphology in the threshold area. a/ Top satellite image (oblique view to NW taken from ISS, courtesy of NASA) shows outlet of Tana-Tiliviche canyon. The tenuously incised Tana upper channel becomes deeply incised downward across the knick zone located at ~25 km from the coast. The normal Pisagua Fault is parallel to the coastal scarp while the minor reverse "Pisagua scarp" (Almendinger et al., 2005) strikes ENE-WSW. Most of the incision post-date the terrace dated at ~6.4 Ma by [Hoke et al., 2007]. Note that the surface of the Atacama Pediplain and sediments linked to the Central Depression Basin (CDB) extend on both side of the canyon up to the Coastal Scarp (where they are offset by the Pisagua Fault), which suggests that the base-level was already set by the ocean before the onset of tectonically-driven uplift and correlative canyon incision. The star locates the viewpoint of panorama from Fig.5b. b/ Bottom aerial view (courtesy A. Bonacin) shows the impressive Coastal Scarp ~35 km south of Tana-Tiliviche outlet with the Atacama pediplain and the subdued relief of the Coastal Cordillera perched on top. CDB marks location of the Central Depression Basin in the background.
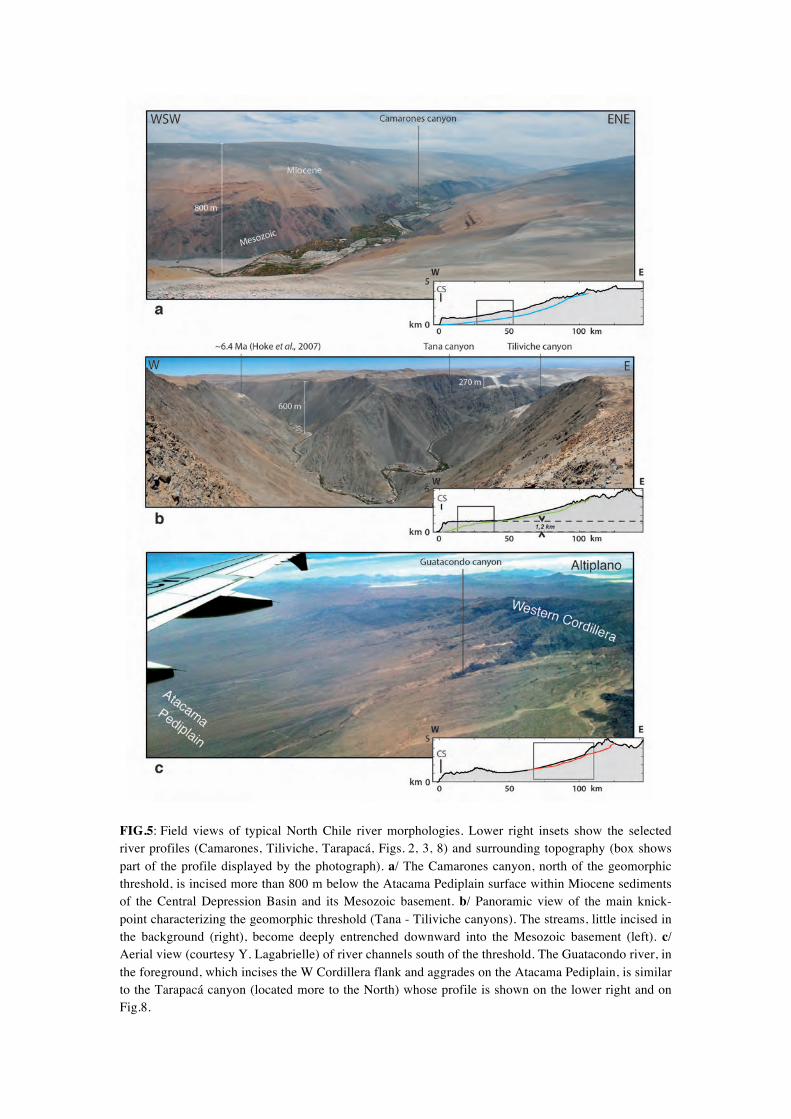
FIG.5: Field views of typical North Chile river morphologies. Lower right insets show the selected river profiles (Camarones, Tiliviche, Tarapacá, Figs. 2, 3, 8) and surrounding topography (box shows part of the profile displayed by the photograph). a/ The Camarones canyon, north of the geomorphic threshold, is incised more than 800 m below the Atacama Pediplain surface within Miocene sediments of the Central Depression Basin and its Mesozoic basement. b/ Panoramic view of the main knick-point characterizing the geomorphic threshold (Tana - Tiliviche canyons). The streams, little incised in the background (right), become deeply entrenched downward into the Mesozoic basement (left). c/ Aerial view (courtesy Y. Lagabrielle) of river channels south of the threshold. The Guatacondo river, in the foreground, which incises the W Cordillera flank and aggrades on the Atacama Pediplain, is similar to the Tarapacá canyon (located more to the North) whose profile is shown on the lower right and on Fig.8.
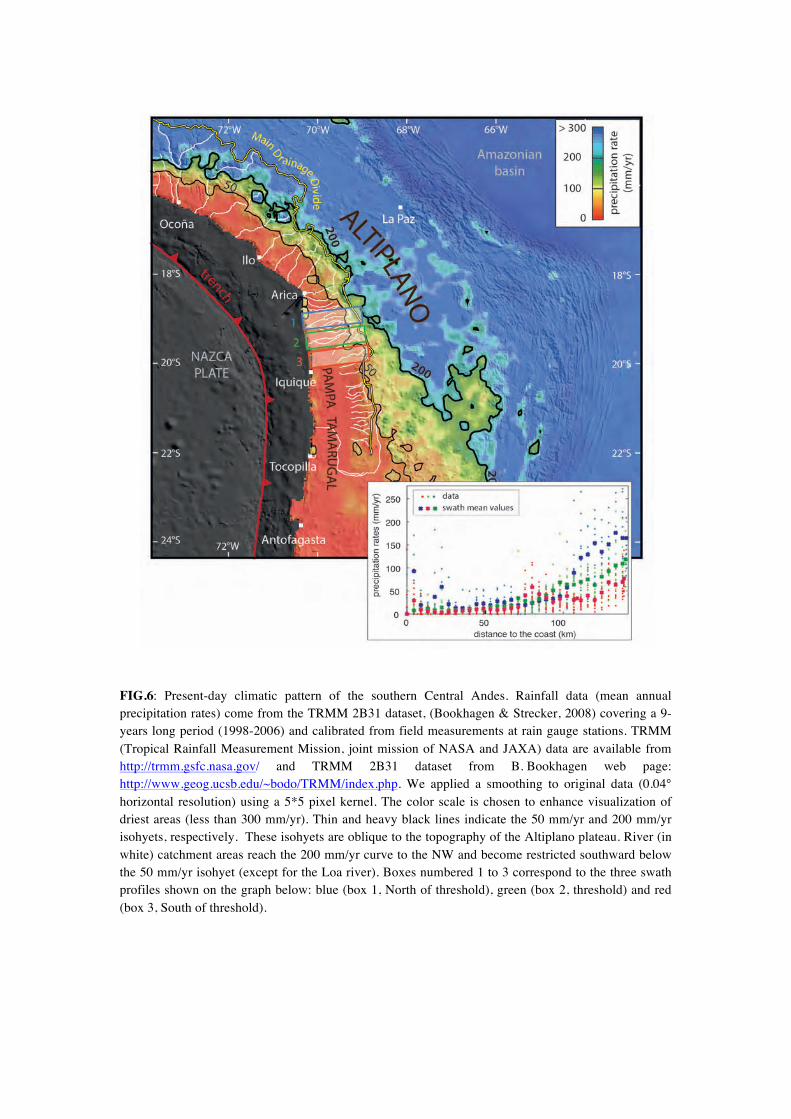
FIG.6: Present-day climatic pattern of the southern Central Andes. Rainfall data (mean annual precipitation rates) come from the TRMM 2B31 dataset, (Bookhagen & Strecker, 2008) covering a 9-years long period (1998-2006) and calibrated from field measurements at rain gauge stations. TRMM (Tropical Rainfall Measurement Mission, joint mission of NASA and JAXA) data are available from http://trmm.gsfc.nasa.gov/ and TRMM 2B31 dataset from B. Bookhagen web page: http://www.geog.ucsb.edu/~bodo/TRMM/index.php. We applied a smoothing to original data (0.04° horizontal resolution) using a 5*5 pixel kernel. The color scale is chosen to enhance visualization of driest areas (less than 300 mm/yr). Thin and heavy black lines indicate the 50 mm/yr and 200 mm/yr isohyets, respectively. These isohyets are oblique to the topography of the Altiplano plateau. River (in white) catchment areas reach the 200 mm/yr curve to the NW and become restricted southward below the 50 mm/yr isohyet (except for the Loa river). Boxes numbered 1 to 3 correspond to the three swath profiles shown on the graph below: blue (box 1, North of threshold), green (box 2, threshold) and red (box 3, South of threshold).
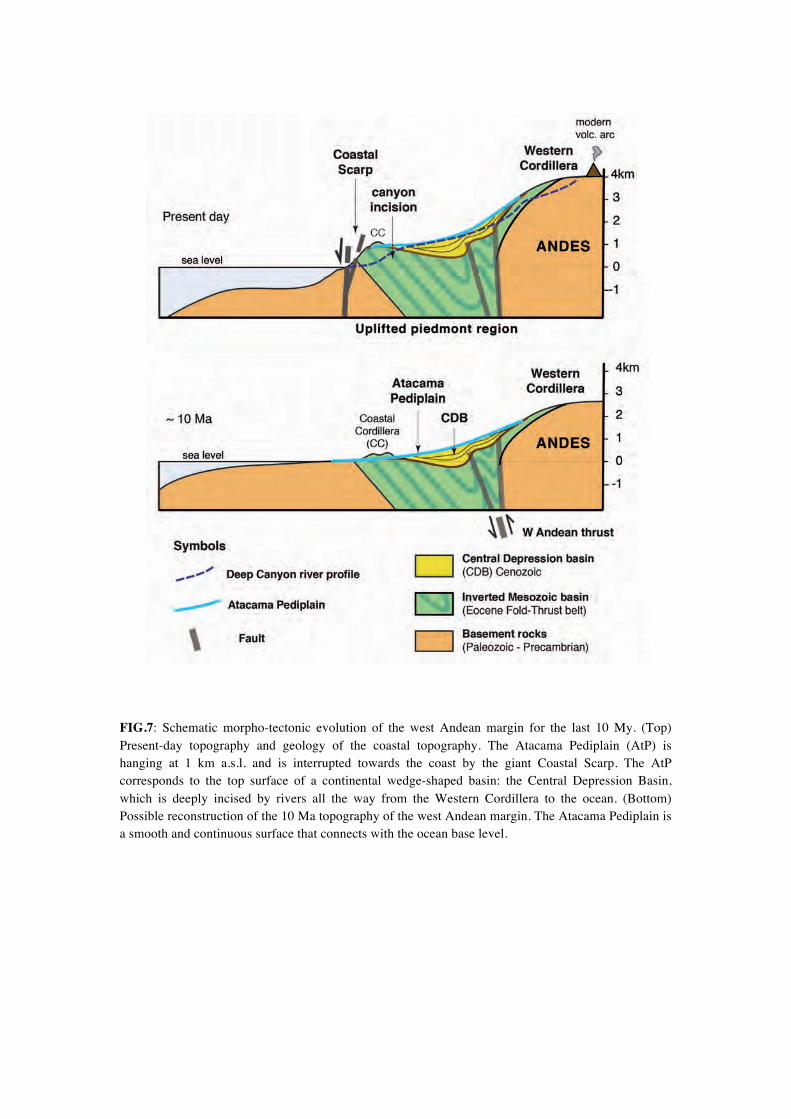
FIG.7: Schematic morpho-tectonic evolution of the west Andean margin for the last 10 My. (Top) Present-day topography and geology of the coastal topography. The Atacama Pediplain (AtP) is hanging at 1 km a.s.l. and is interrupted towards the coast by the giant Coastal Scarp. The AtP corresponds to the top surface of a continental wedge-shaped basin: the Central Depression Basin, which is deeply incised by rivers all the way from the Western Cordillera to the ocean. (Bottom) Possible reconstruction of the 10 Ma topography of the west Andean margin. The Atacama Pediplain is a smooth and continuous surface that connects with the ocean base level.
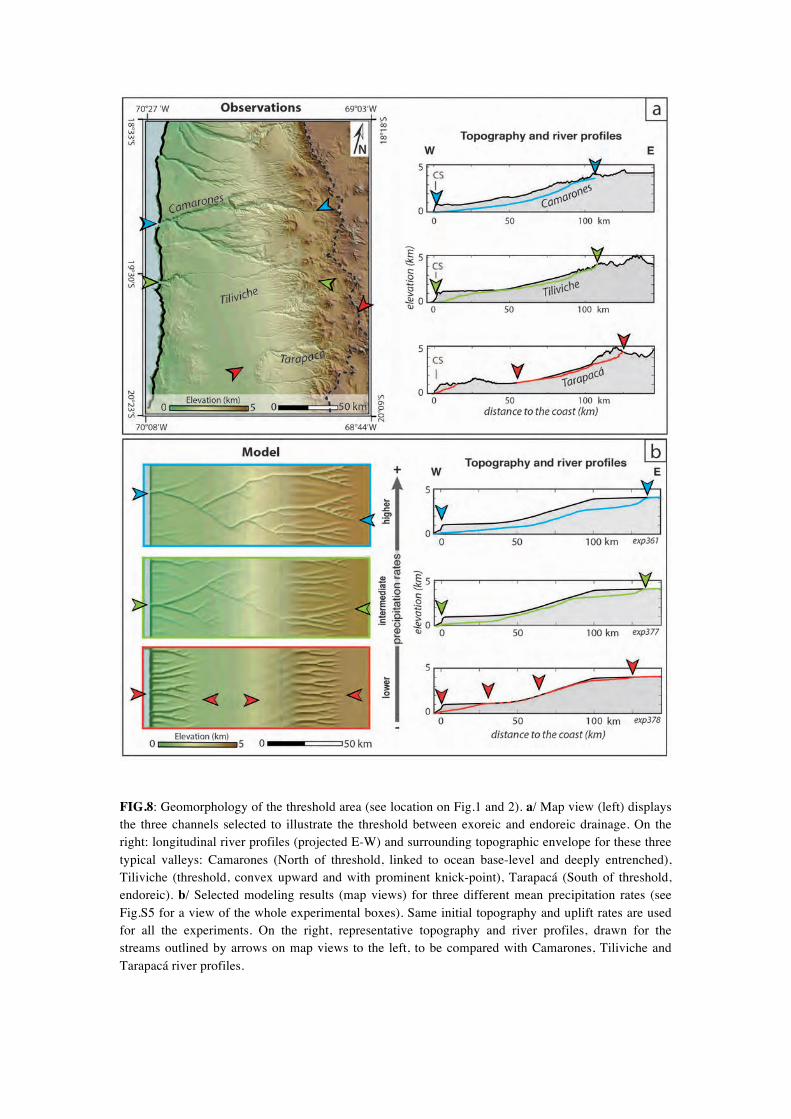
FIG.8: Geomorphology of the threshold area (see location on Fig.1 and 2). a/ Map view (left) displays the three channels selected to illustrate the threshold between exoreic and endoreic drainage. On the right: longitudinal river profiles (projected E-W) and surrounding topographic envelope for these three typical valleys: Camarones (North of threshold, linked to ocean base-level and deeply entrenched), Tiliviche (threshold, convex upward and with prominent knick-point), Tarapacá (South of threshold, endoreic). b/ Selected modeling results (map views) for three different mean precipitation rates (see Fig.S5 for a view of the whole experimental boxes). Same initial topography and uplift rates are used for all the experiments. On the right, representative topography and river profiles, drawn for the streams outlined by arrows on map views to the left, to be compared with Camarones, Tiliviche and Tarapacá river profiles. !