Embed Size (px)
Citation preview
1
ANDA Operations UPDATE
Ted Sherwood Office of Regulatory Operations
Office of Generic Drugs
2016 GPhA Fall Technical Conferenece October 25, 2016

2
What You Will Not See Today • Controlled Correspondence Backlog • Filing Backlog

3
What You Will See Today: Progress • Controlled Correspondence • Cohort of Receipt Tracking • Receipts and Actions • Prior-Approval Supplements • Program Level Data • A Peak at the Platform • The Future
4
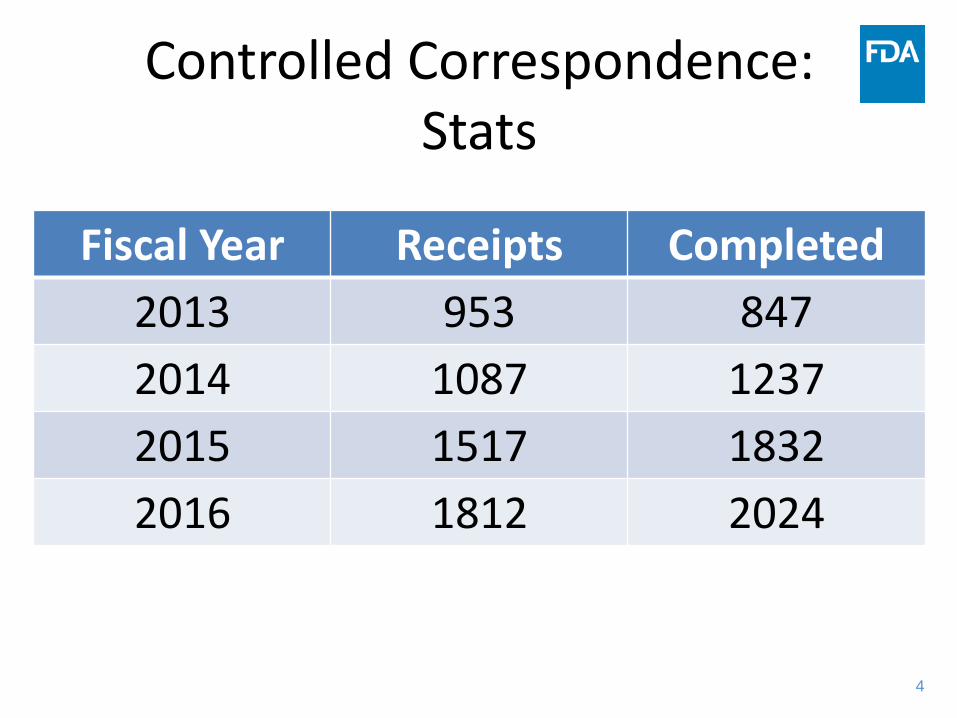
Controlled Correspondence: Stats
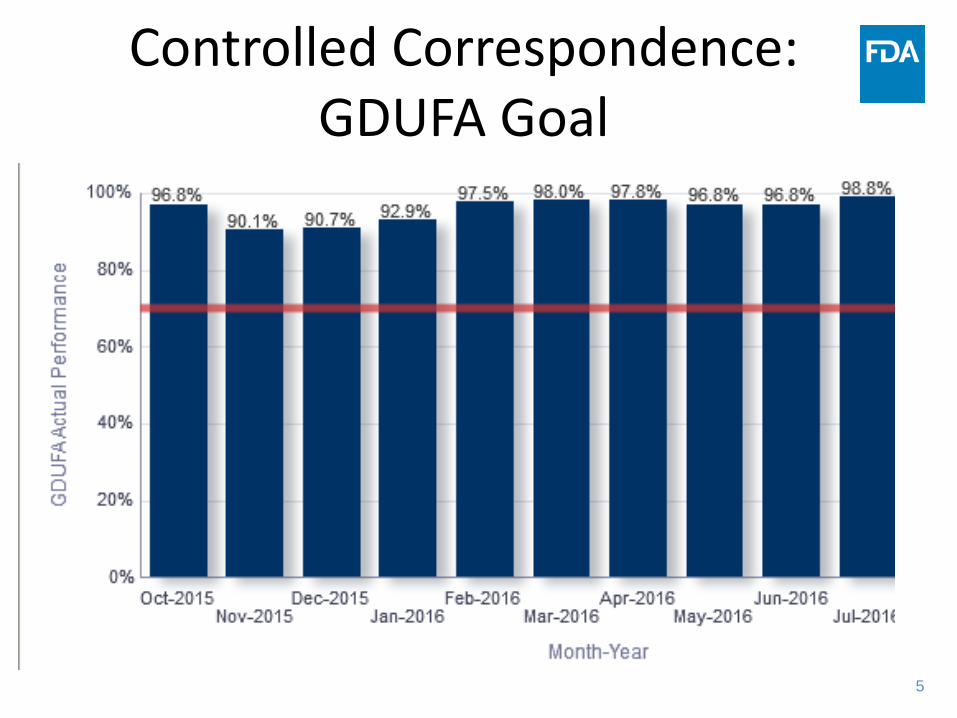
Fiscal Year Receipts Completed 2013 953 847 2014 1087 1237 2015 1517 1832 2016 1812 2024
5
Controlled Correspondence: GDUFA Goal

6
What You Will See Today: Progress • Controlled Correspondence • Cohort of Receipt Tracking • Receipts and Actions • Prior-Approval Supplements • Program Level Data • A Peak at the Platform • The Future
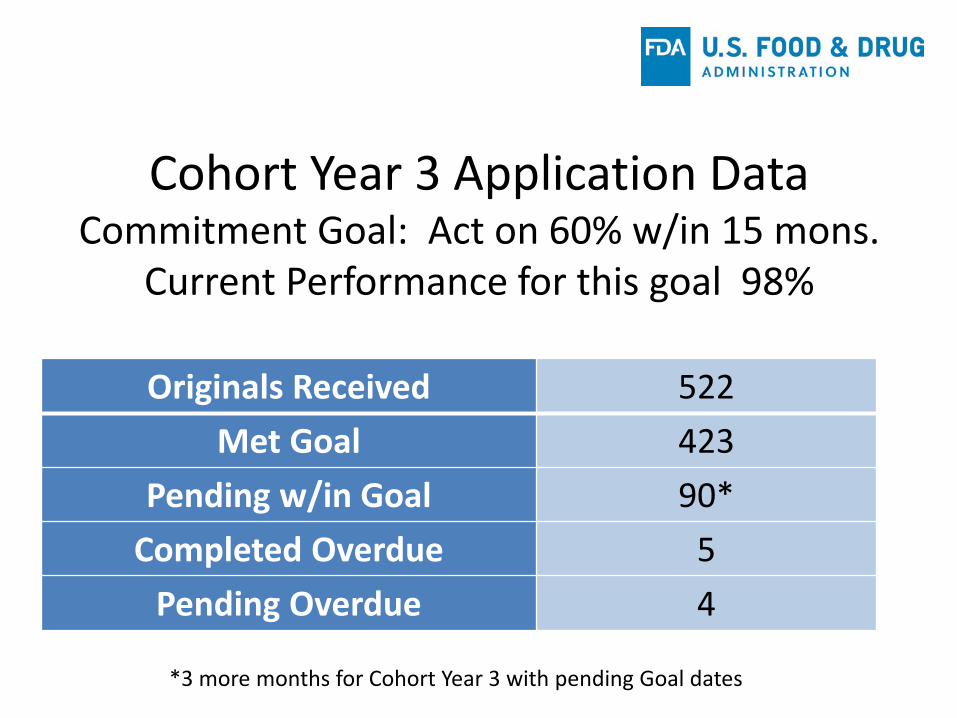
Cohort Year 3 Application Data Commitment Goal: Act on 60% w/in 15 mons.
Current Performance for this goal 98%
Originals Received 522 Met Goal 423
Pending w/in Goal 90* Completed Overdue 5
Pending Overdue 4
*3 more months for Cohort Year 3 with pending Goal dates
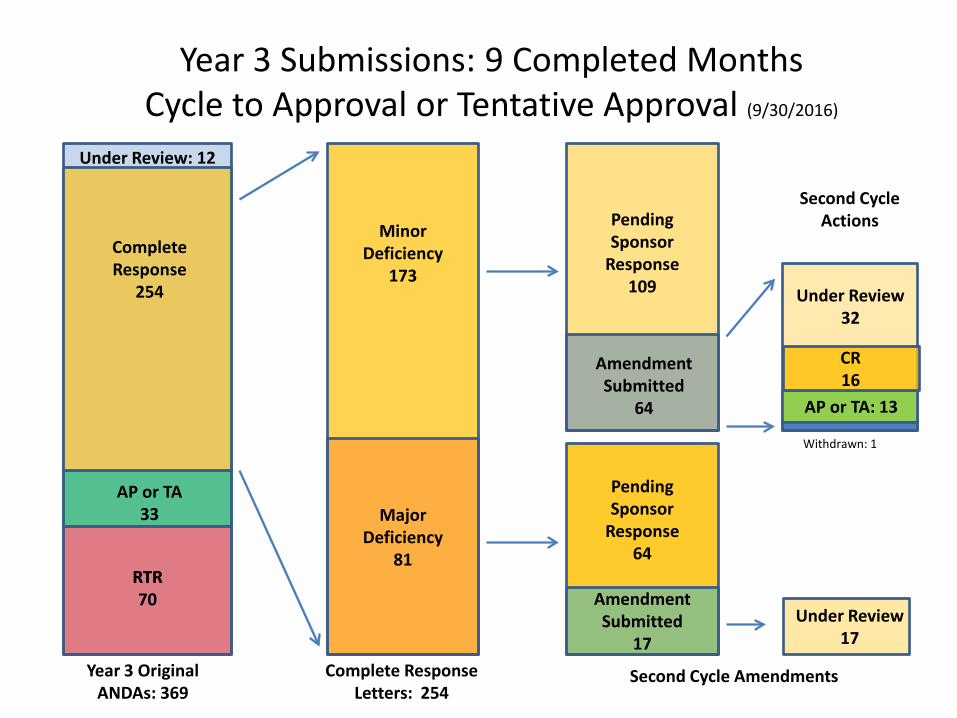
RTR 70
Under Review: 12
AP or TA 33
Complete Response
254
Year 3 Original ANDAs: 369
RTR
Minor Deficiency
173
Major Deficiency
81
Under Review 32
Under Review 17
Pending Sponsor
Response 64
Amendment Submitted
64
Pending Sponsor
Response 109
Amendment Submitted
17
CR 16
AP or TA: 13
Complete Response Letters: 254
Second Cycle Actions
Year 3 Submissions: 9 Completed Months Cycle to Approval or Tentative Approval (9/30/2016)
Second Cycle Amendments
Withdrawn: 1
9
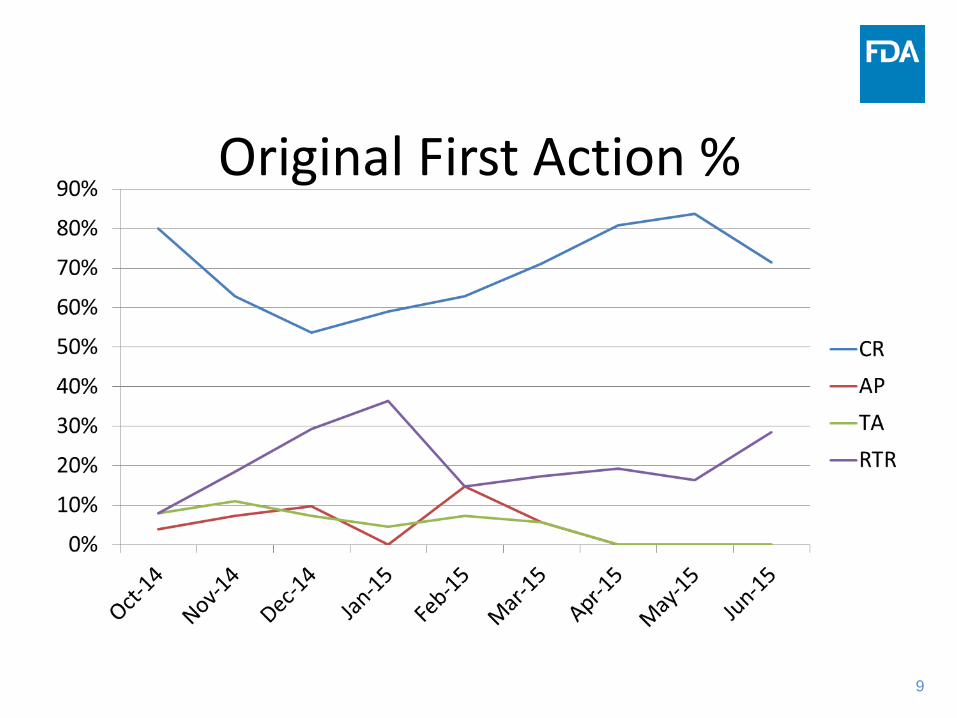
Original First Action %
10
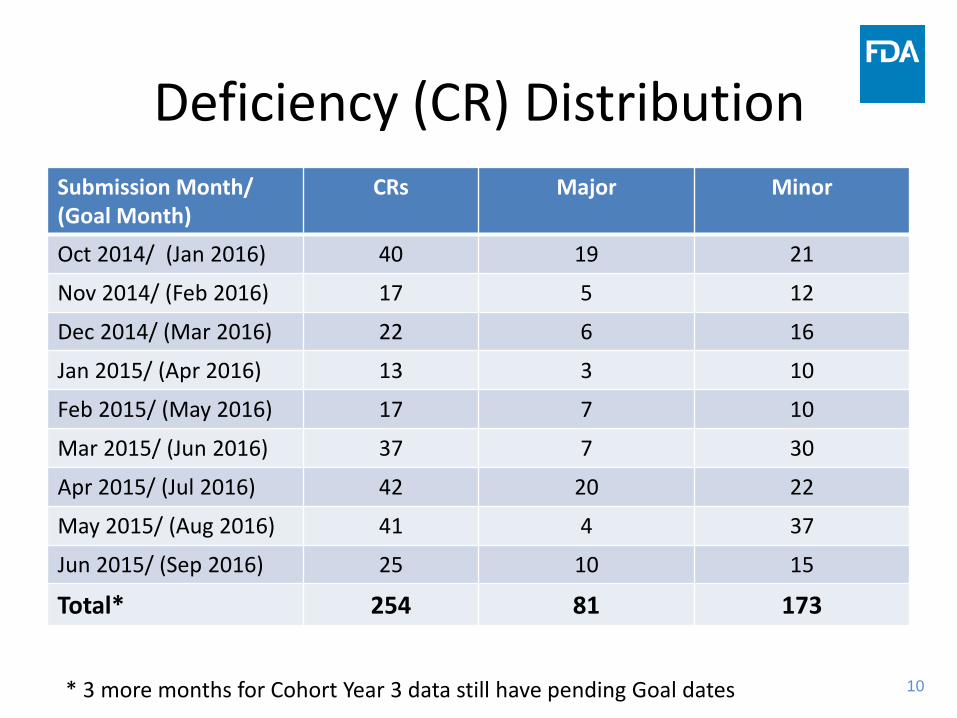
Deficiency (CR) Distribution Submission Month/ (Goal Month)
CRs Major Minor
Oct 2014/ (Jan 2016) 40 19 21
Nov 2014/ (Feb 2016) 17 5 12
Dec 2014/ (Mar 2016) 22 6 16
Jan 2015/ (Apr 2016) 13 3 10
Feb 2015/ (May 2016) 17 7 10
Mar 2015/ (Jun 2016) 37 7 30
Apr 2015/ (Jul 2016) 42 20 22
May 2015/ (Aug 2016) 41 4 37
Jun 2015/ (Sep 2016) 25 10 15
Total* 254 81 173
* 3 more months for Cohort Year 3 data still have pending Goal dates
11
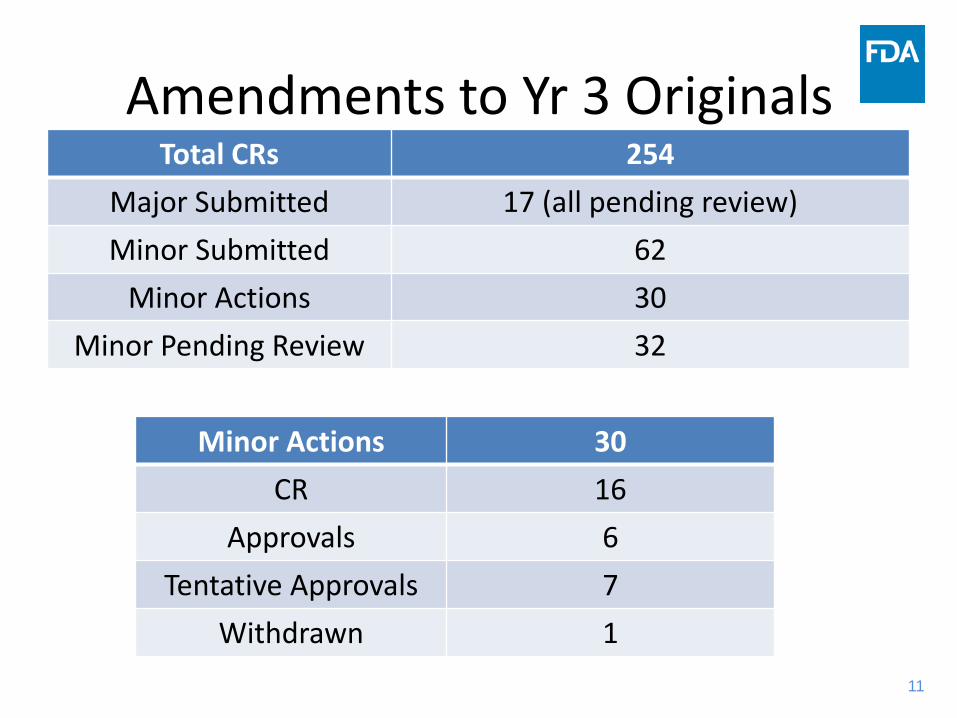
Amendments to Yr 3 Originals Total CRs 254
Major Submitted 17 (all pending review) Minor Submitted 62
Minor Actions 30 Minor Pending Review 32
Minor Actions 30 CR 16
Approvals 6 Tentative Approvals 7
Withdrawn 1
12
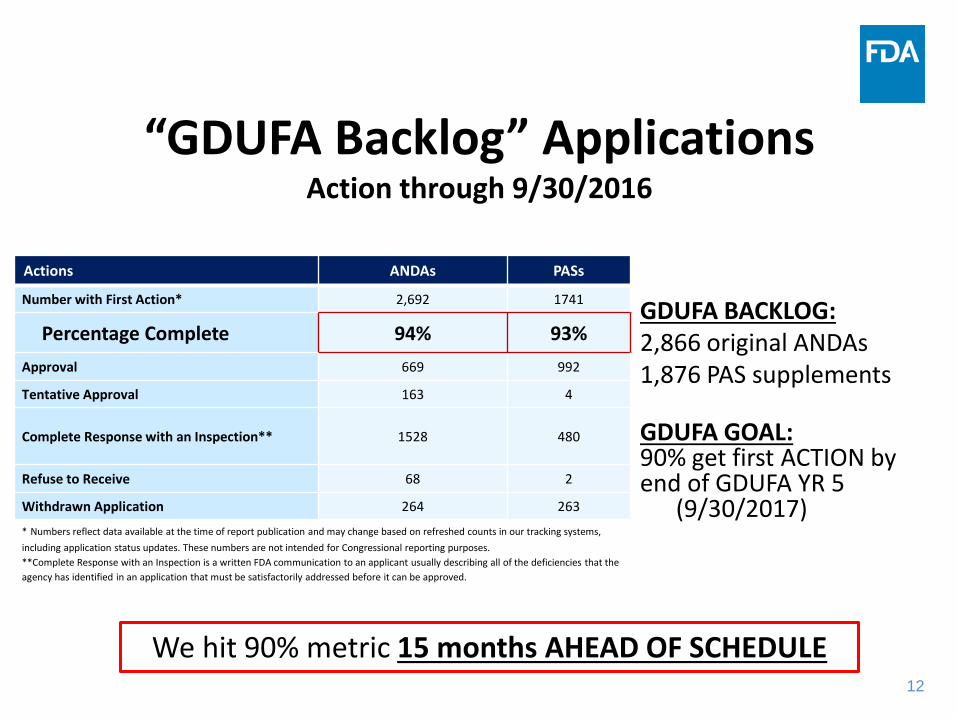
“GDUFA Backlog” Applications Action through 9/30/2016
Actions ANDAs PASs
Number with First Action* 2,692 1741
Percentage Complete 94% 93% Approval 669 992
Tentative Approval 163 4
Complete Response with an Inspection** 1528 480
Refuse to Receive 68 2
Withdrawn Application 264 263
* Numbers reflect data available at the time of report publication and may change based on refreshed counts in our tracking systems, including application status updates. These numbers are not intended for Congressional reporting purposes. **Complete Response with an Inspection is a written FDA communication to an applicant usually describing all of the deficiencies that the agency has identified in an application that must be satisfactorily addressed before it can be approved.
GDUFA BACKLOG: 2,866 original ANDAs 1,876 PAS supplements GDUFA GOAL: 90% get first ACTION by end of GDUFA YR 5
(9/30/2017)
We hit 90% metric 15 months AHEAD OF SCHEDULE
13
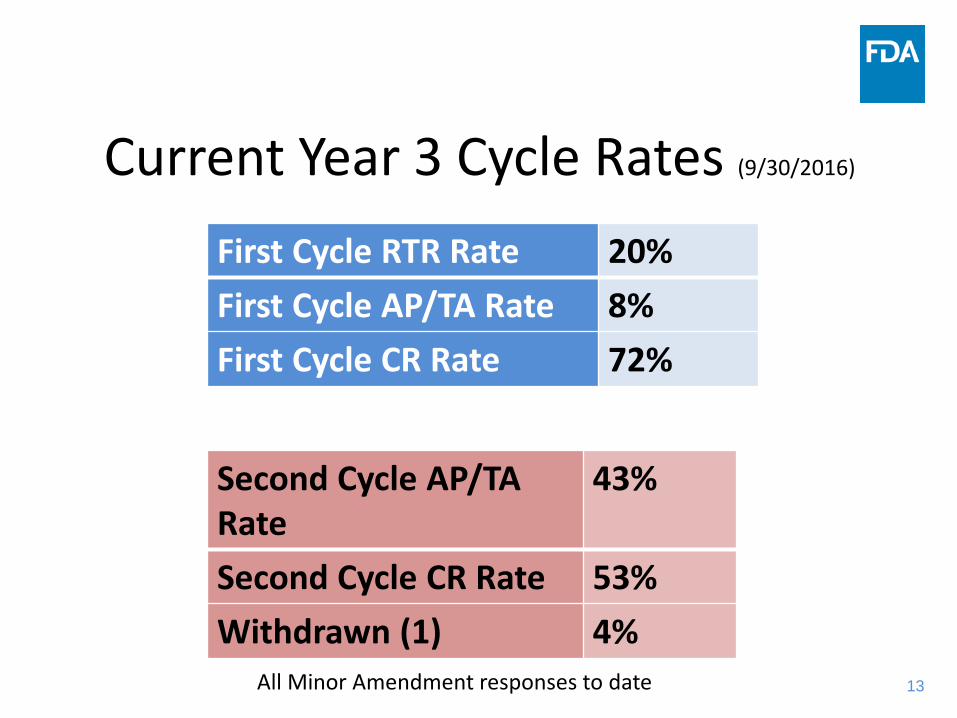
Current Year 3 Cycle Rates (9/30/2016)
First Cycle RTR Rate 20% First Cycle AP/TA Rate 8% First Cycle CR Rate 72%
Second Cycle AP/TA Rate
43%
Second Cycle CR Rate 53% Withdrawn (1) 4%
All Minor Amendment responses to date

Total Pre-Y3 Application Cohort (Since 10/1/2012)
Monthly Average (July - Sept)
FDA Snapshot
0 Pending
Filing Review
72 Filed –No Review Comm.
+ 1,372
At Least One Review Communication Issued
+
Complete Response 134
Tentative Approvals 12
Amendm
ents 85
325Info. Req. 261
Industry Snapshot
1,271 Pending Industry
Response
281 Tentative Approval
with Industry +
1,937 Approvals
Refuse to Receive 97 Resubmitted Y3/4
130 No Resubmission + 653
Withdrawals (from Cohort)
+
1,444
with FDA
=
1,552
with Industry
=
+
Current ANDA Workload of Original Applications
2,996
2,996 + = 5,813
(Status as of 10/1/2016)

Total Y3 Application Cohort (Since 10/1/2014)
FDA Snapshot
3 Pending
Filing Review
9 Filed –No Review Comm.
+ 156
At Least One Review Communication Issued
+
Complete Response 39
Tentative Approvals 1
Amendm
ents 14
35 Info. Req. 13 Industry Snapshot
193 Pending Industry
Response
22 Tentative Approval
with Industry +
20 Approvals
Refuse to Receive 32 Resubmitted in Y4
26 No Resubmission + 8
Withdrawals (from Cohort)
+
168
with FDA
=
215
with Industry
=
+
Current ANDA Workload of Original Applications
383
383 + = 469
Monthly Average (July - Sept)
(Status as of 10/1/2016)
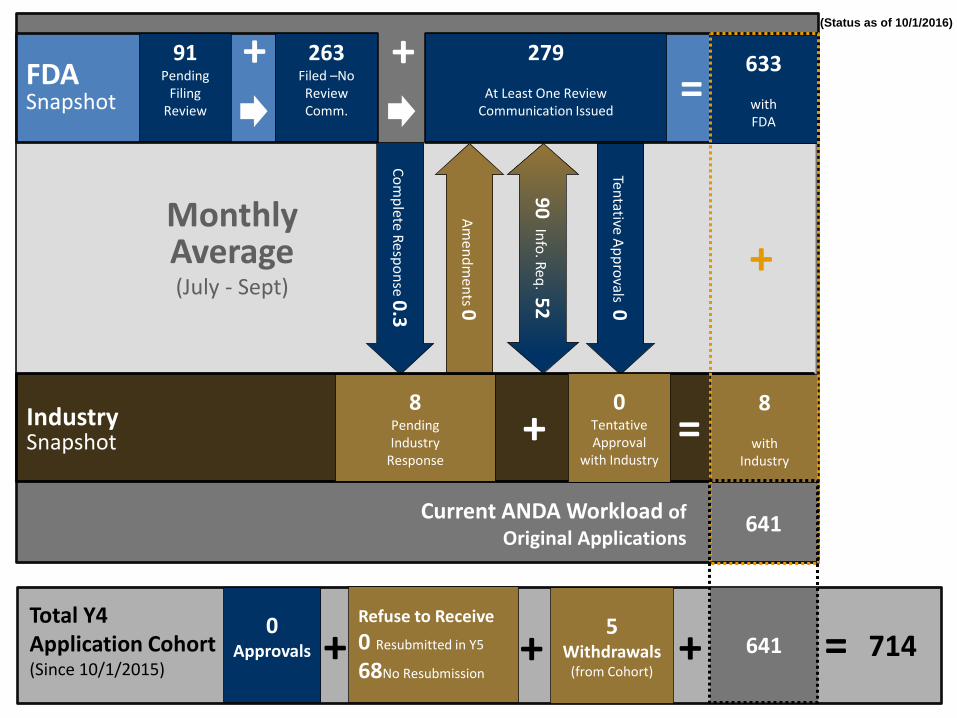
Total Y4 Application Cohort (Since 10/1/2015)
FDA Snapshot
91 Pending
Filing Review
263 Filed –No Review Comm.
+ 279
At Least One Review Communication Issued
+
Complete Response 0.3
Tentative Approvals 0
Amendm
ents 0
90 Info. Req. 52 Industry Snapshot
8 Pending Industry
Response
0 Tentative Approval
with Industry +
0 Approvals
Refuse to Receive 0 Resubmitted in Y5
68No Resubmission + 5
Withdrawals (from Cohort)
+
633
with FDA
=
8
with Industry
=
+
Current ANDA Workload of Original Applications
641
641 + = 714
Monthly Average (July - Sept)
(Status as of 10/1/2016)
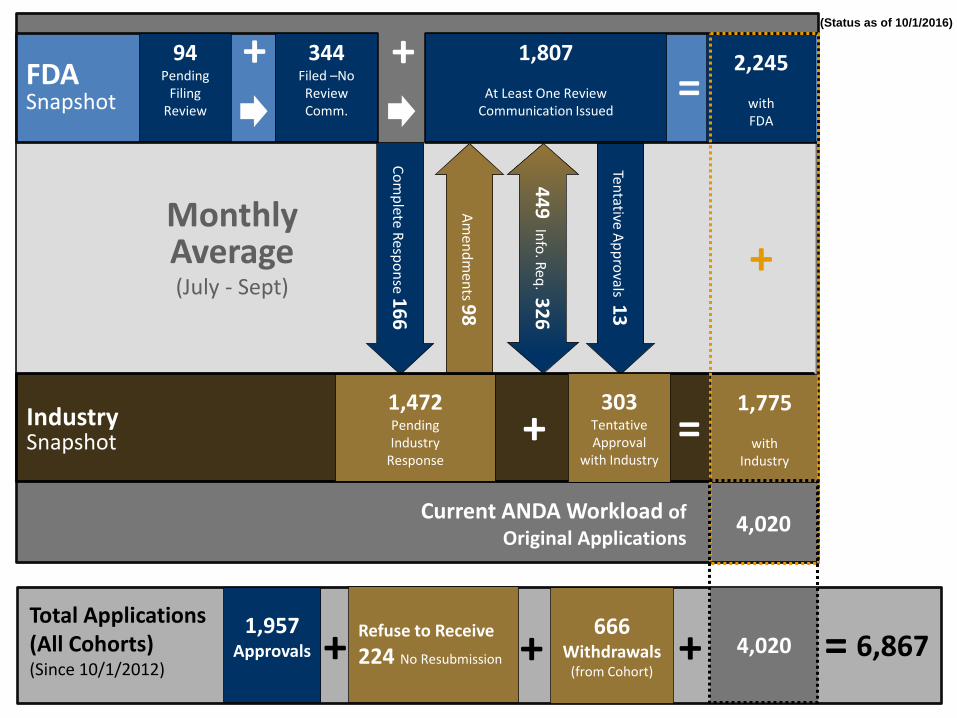
Total Applications (All Cohorts) (Since 10/1/2012)
FDA Snapshot
94 Pending
Filing Review
344 Filed –No Review Comm.
+ 1,807
At Least One Review Communication Issued
+
Complete Response 166
Tentative Approvals 13
Amendm
ents 98
449 Info. Req. 326 Industry Snapshot
1,472 Pending Industry
Response
303 Tentative Approval
with Industry +
1,957 Approvals
Refuse to Receive 224 No Resubmission + 666
Withdrawals (from Cohort)
+
2,245
with FDA
=
1,775
with Industry
=
+
Current ANDA Workload of Original Applications
4,020
4,020 + = 6,867
Monthly Average (July - Sept)
(Status as of 10/1/2016)
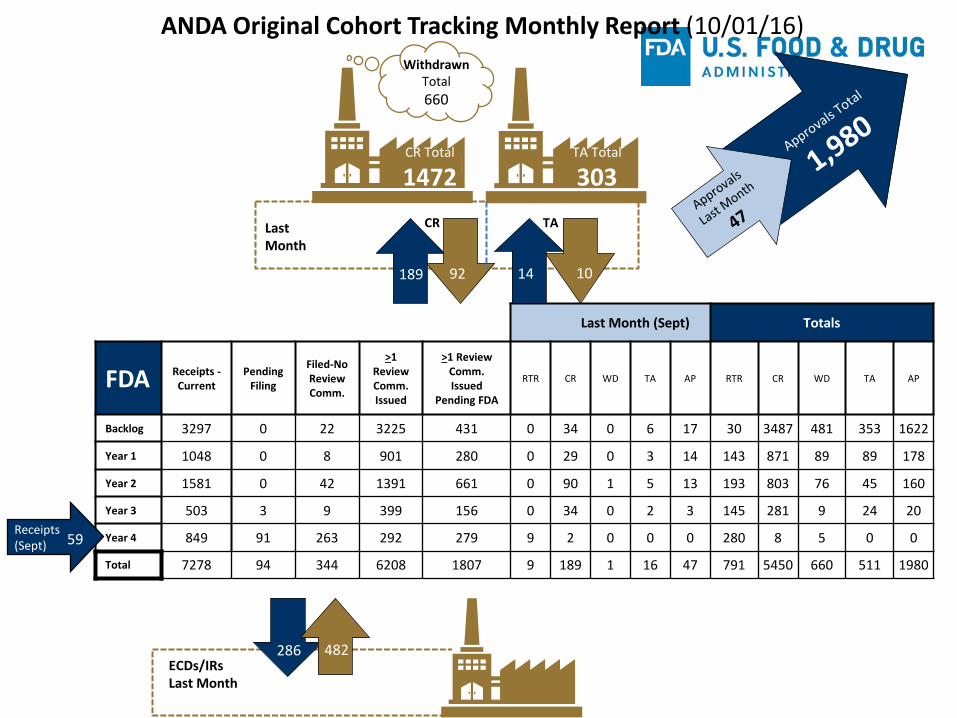
Last Month (Sept) Totals
FDA Receipts - Current
Pending Filing
Filed-No Review Comm.
>1 Review Comm. Issued
>1 Review Comm. Issued
Pending FDA
RTR CR WD TA AP RTR CR WD TA AP
Backlog 3297 0 22 3225 431 0 34 0 6 17 30 3487 481 353 1622
Year 1 1048 0 8 901 280 0 29 0 3 14 143 871 89 89 178
Year 2 1581 0 42 1391 661 0 90 1 5 13 193 803 76 45 160
Year 3 503 3 9 399 156 0 34 0 2 3 145 281 9 24 20
Year 4 849 91 263 292 279 9 2 0 0 0 280 8 5 0 0
Total 7278 94 344 6208 1807 9 189 1 16 47 791 5450 660 511 1980
Last Month
CR
CR Total
1472
Withdrawn Total 660
TA
ANDA Original Cohort Tracking Monthly Report (10/01/16)
ECDs/IRs Last Month
189 92 14 10
59 Receipts (Sept)
286 482
TA Total
303
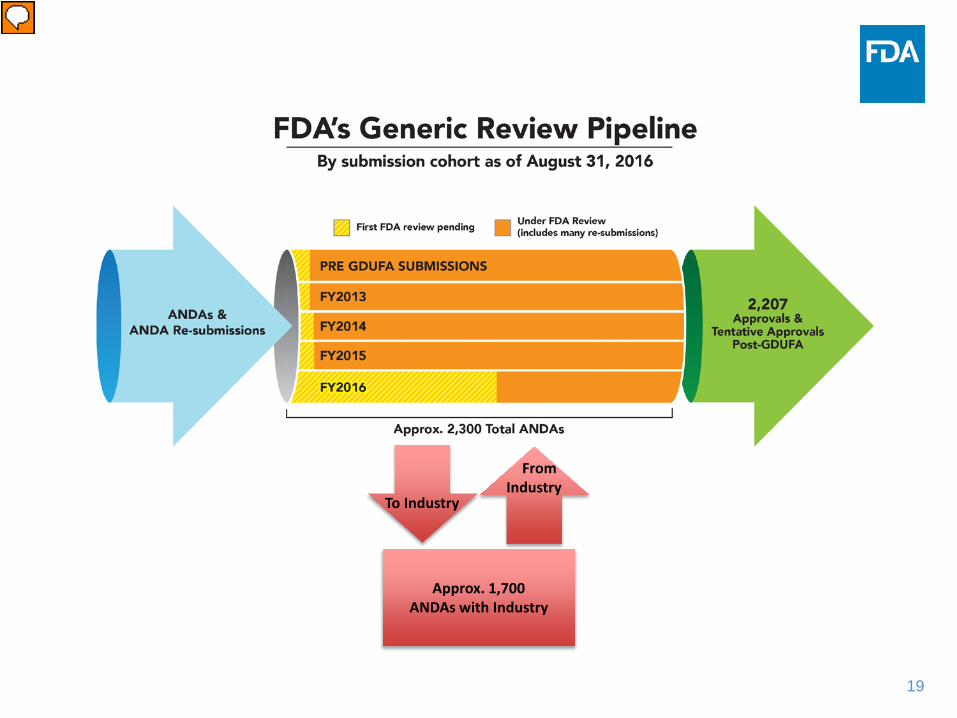
19
Approx. 1,700 ANDAs with Industry
To Industry
From Industry
20
What You Will See Today: Progress • Controlled Correspondence • Cohort of Receipt Tracking • Receipts and Actions • Prior-Approval Supplements • Program Level Data • A Peak at the Platform • The Future
21
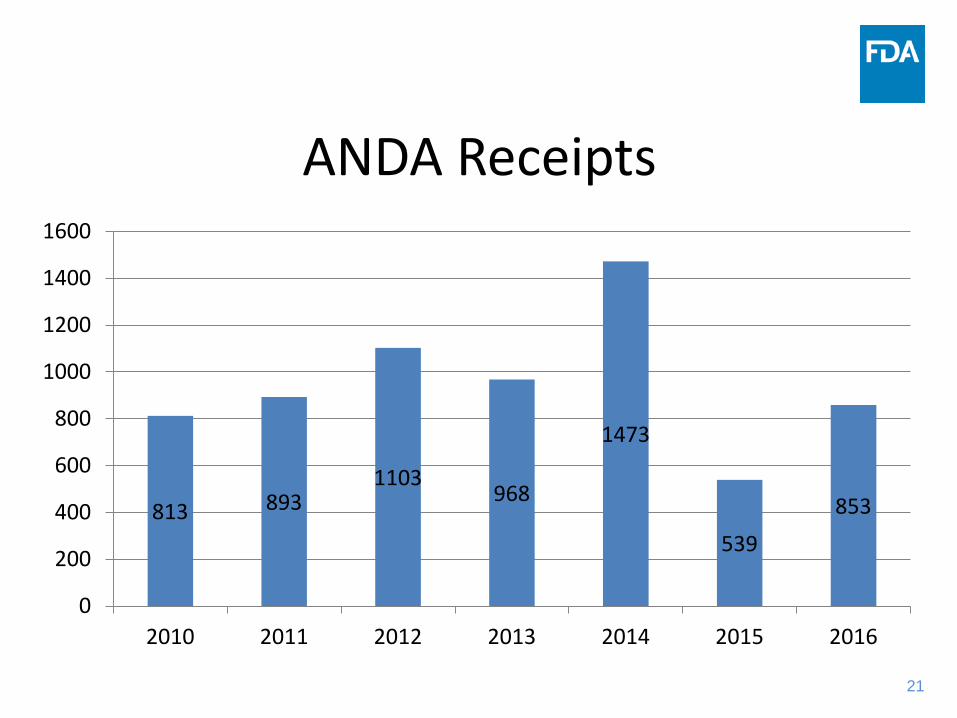
ANDA Receipts
813 893 1103
968
1473
539 853
0
200
400
600
800
1000
1200
1400
1600
2010 2011 2012 2013 2014 2015 2016
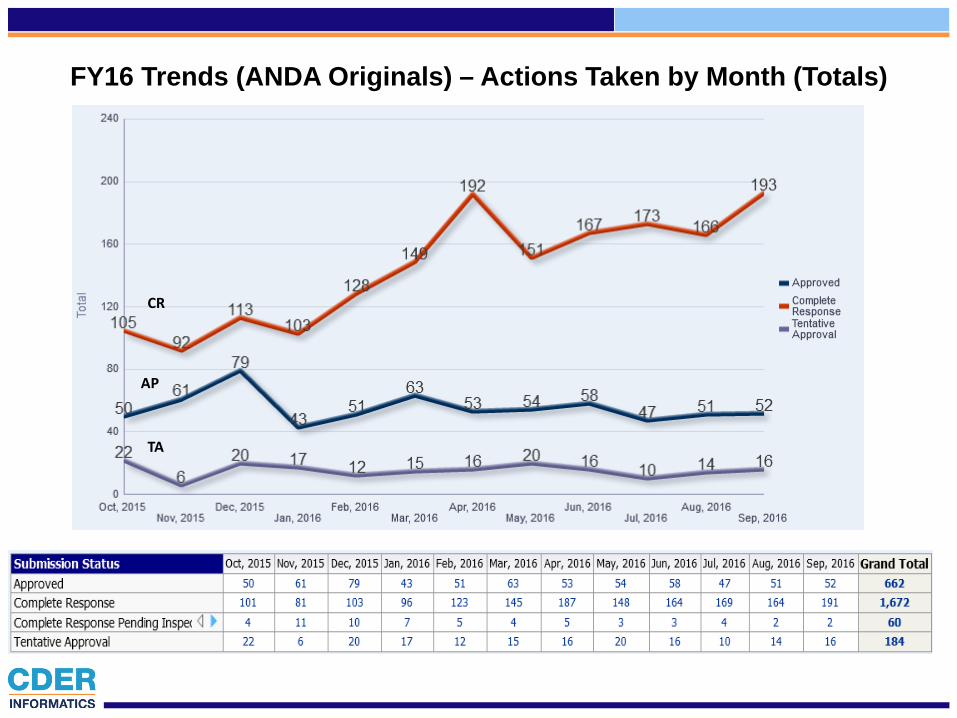
FY16 Trends (ANDA Originals) – Actions Taken by Month (Totals)
CR
AP
TA
23
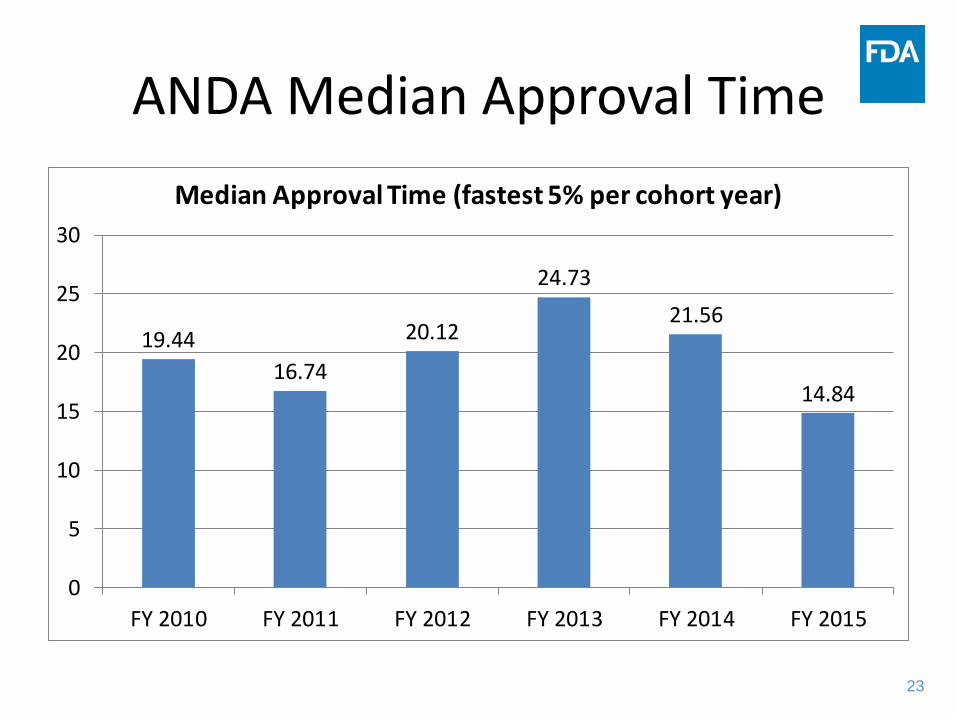
ANDA Median Approval Time
19.4416.74
20.12
24.7321.56
14.84
0
5
10
15
20
25
30
FY 2010 FY 2011 FY 2012 FY 2013 FY 2014 FY 2015
Median Approval Time (fastest 5% per cohort year)
24
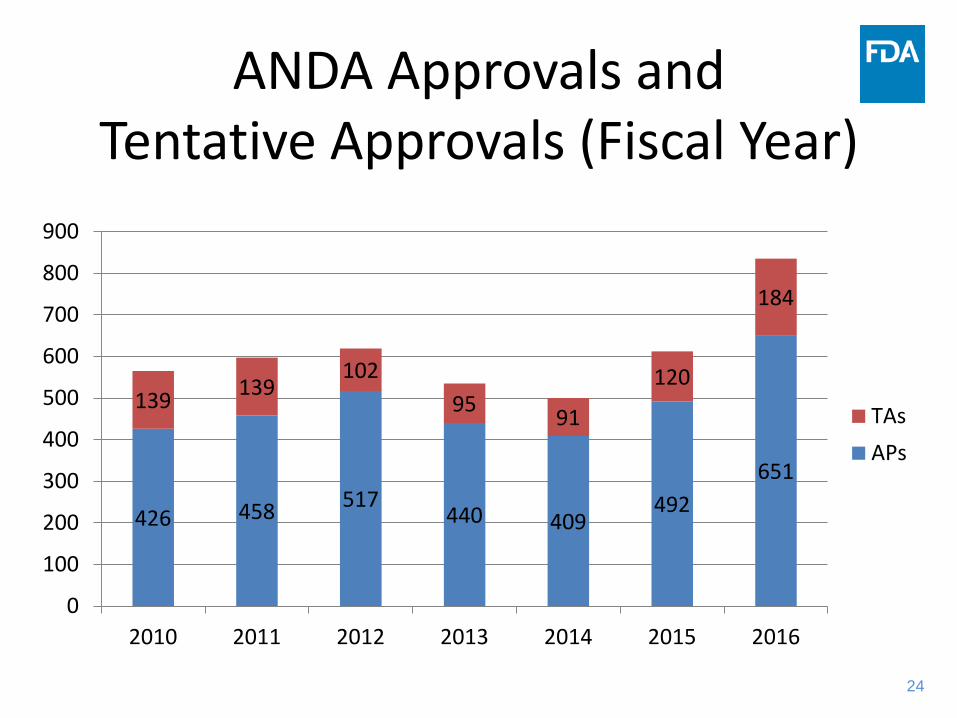
ANDA Approvals and Tentative Approvals (Fiscal Year)
426 458 517 440 409
492 651
139 139 102
95 91
120
184
0
100
200
300
400
500
600
700
800
900
2010 2011 2012 2013 2014 2015 2016
TAsAPs
25
What You Will See Today: Progress • Controlled Correspondence • Cohort of Receipt Tracking • Receipts and Actions • Prior-Approval Supplements • Program Level Data • A Peak at the Platform • The Future
26
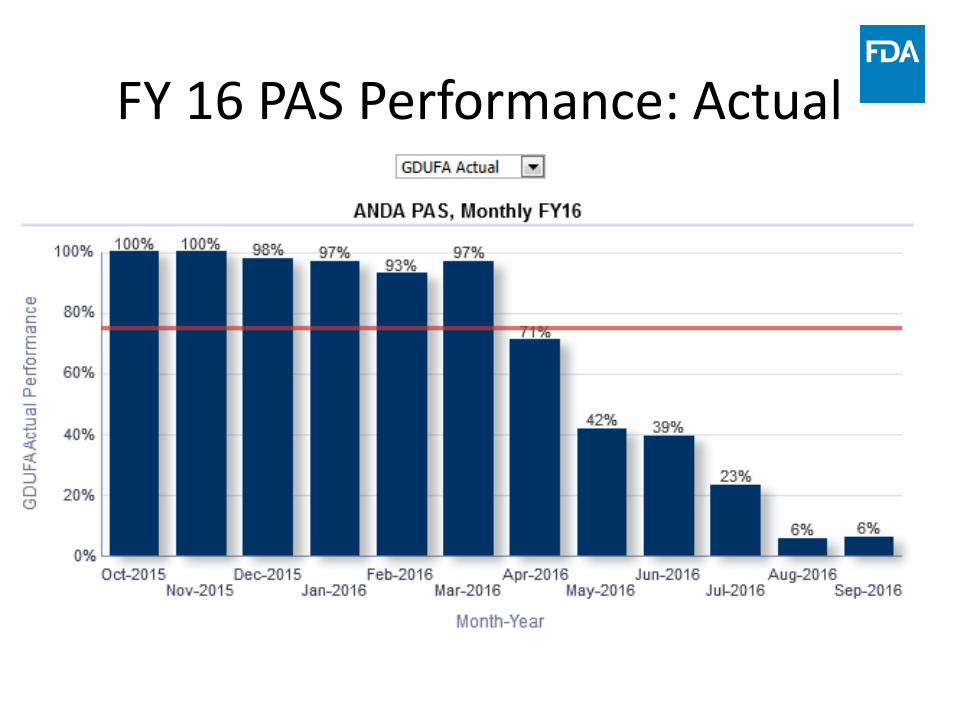
FY 16 PAS Performance: Actual
27
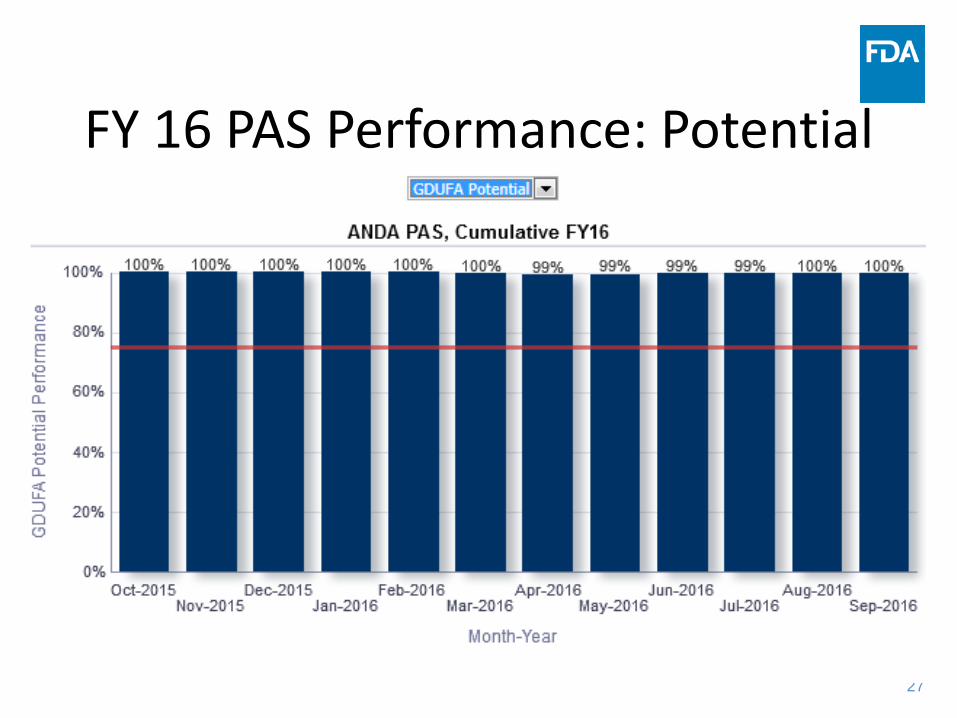
FY 16 PAS Performance: Potential
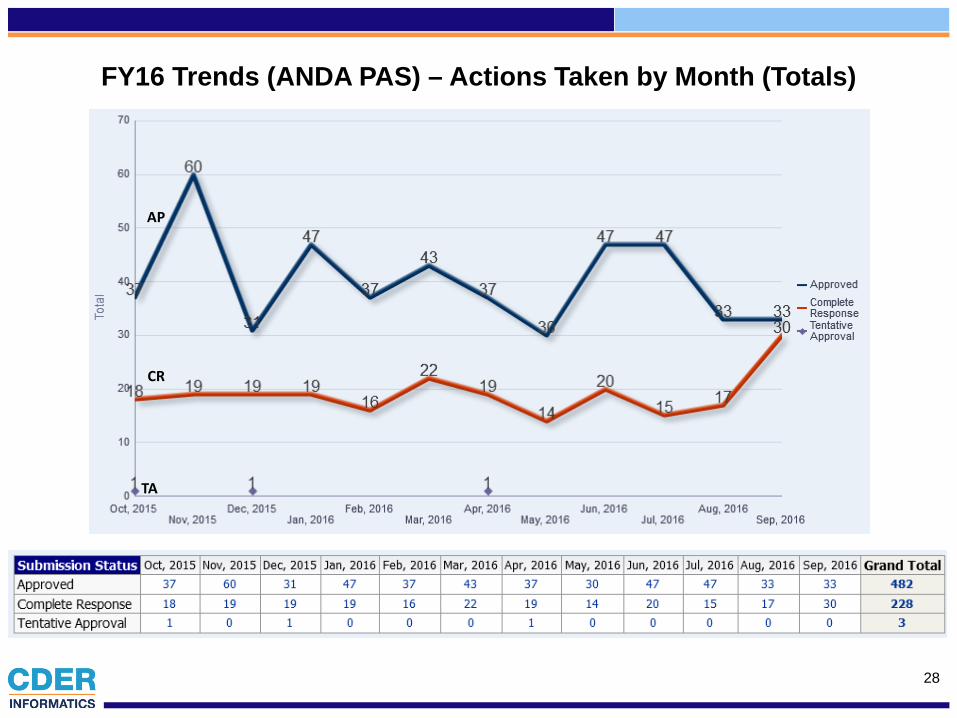
FY16 Trends (ANDA PAS) – Actions Taken by Month (Totals)
28
CR
AP
TA
29
What You Will See Today: Progress • Controlled Correspondence • Cohort of Receipt Tracking • Receipts and Actions • Prior-Approval Supplements • Program Level Data • A Peak at the Platform • The Future
30
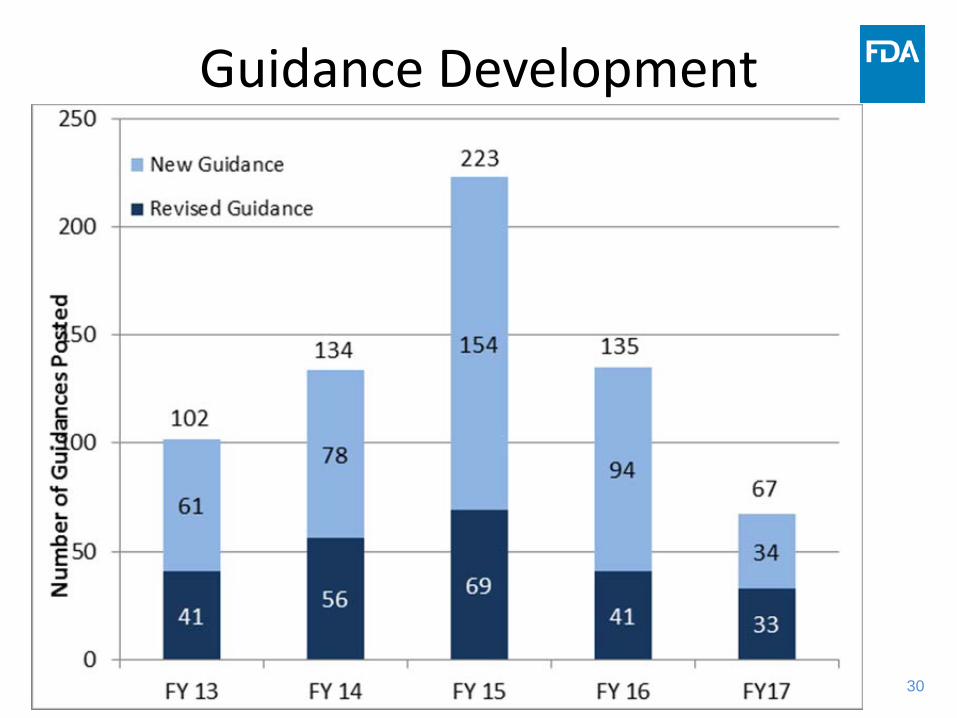
Guidance Development
31
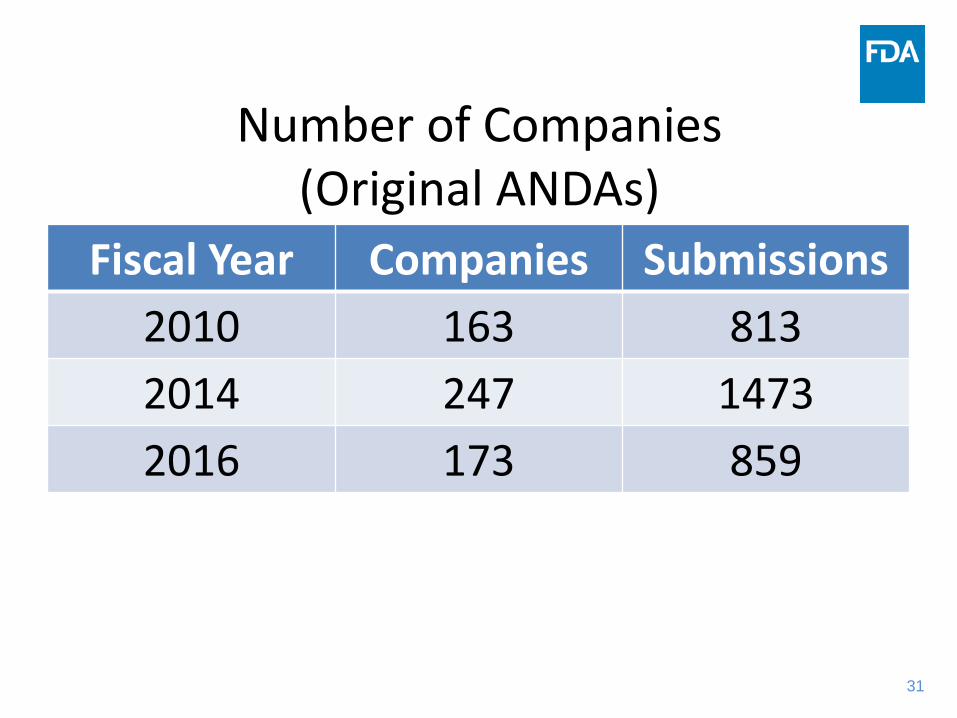
Number of Companies (Original ANDAs)
Fiscal Year Companies Submissions 2010 163 813 2014 247 1473 2016 173 859
32
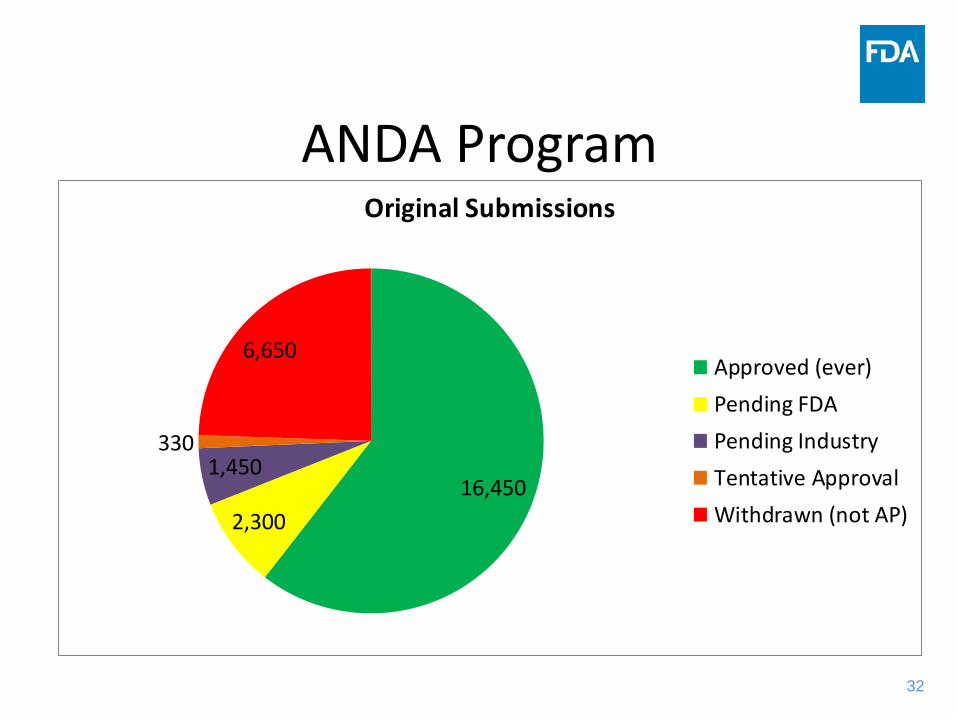
ANDA Program
16,4502,300
1,450330
6,650
Original Submissions
Approved (ever)Pending FDAPending IndustryTentative ApprovalWithdrawn (not AP)
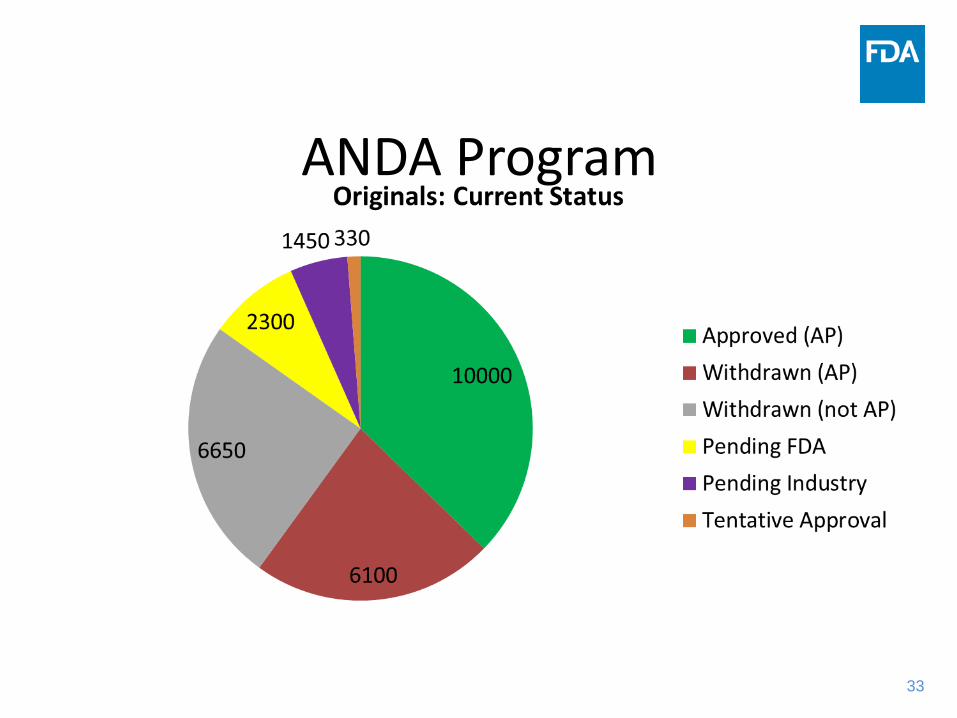
33
ANDA Program
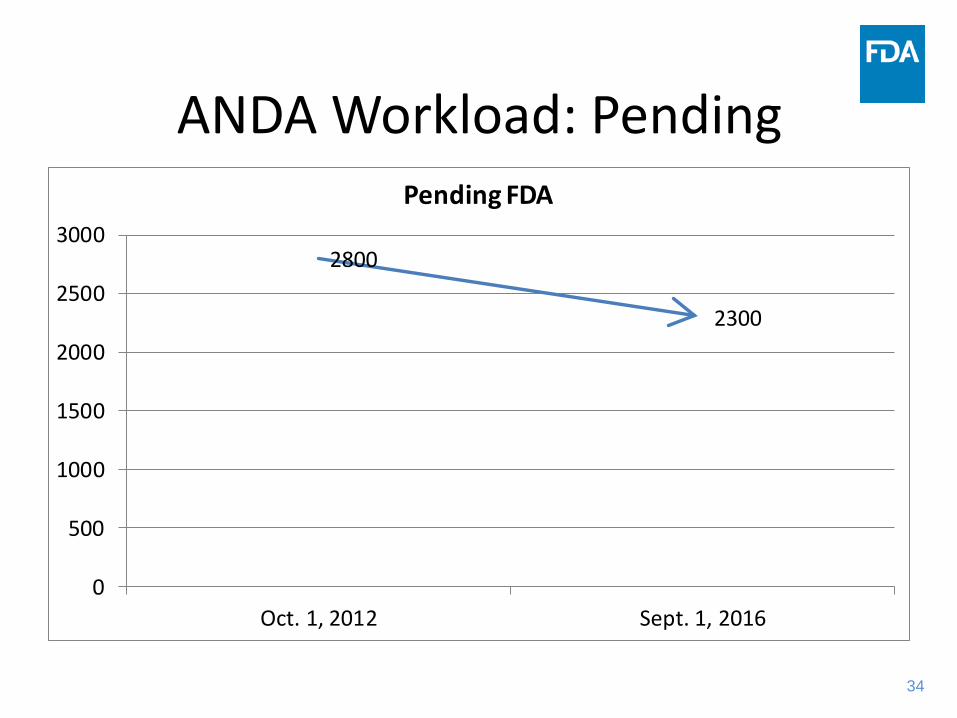
34
ANDA Workload: Pending
2800
2300
0
500
1000
1500
2000
2500
3000
Oct. 1, 2012 Sept. 1, 2016
Pending FDA

35
What You Will See Today: Progress • Controlled Correspondence • Cohort of Receipt Tracking • Receipts and Actions • Prior-Approval Supplements • Program Level Data • A Peak at the Platform • The Future
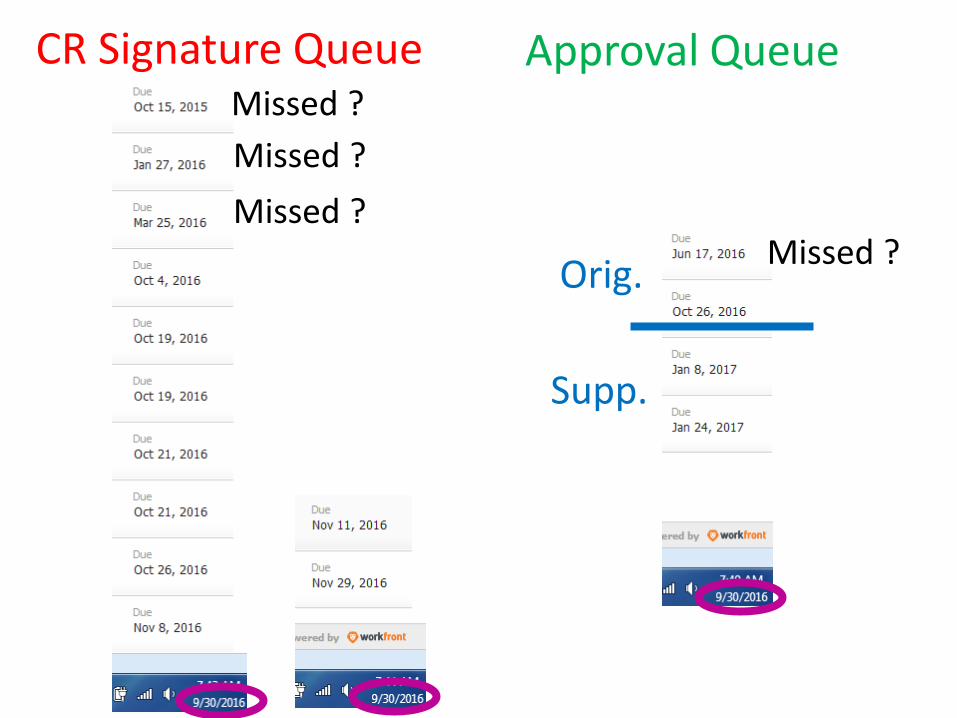
CR Signature Queue Approval Queue
Orig.
Supp.
Missed ? Missed ? Missed ?
Missed ?
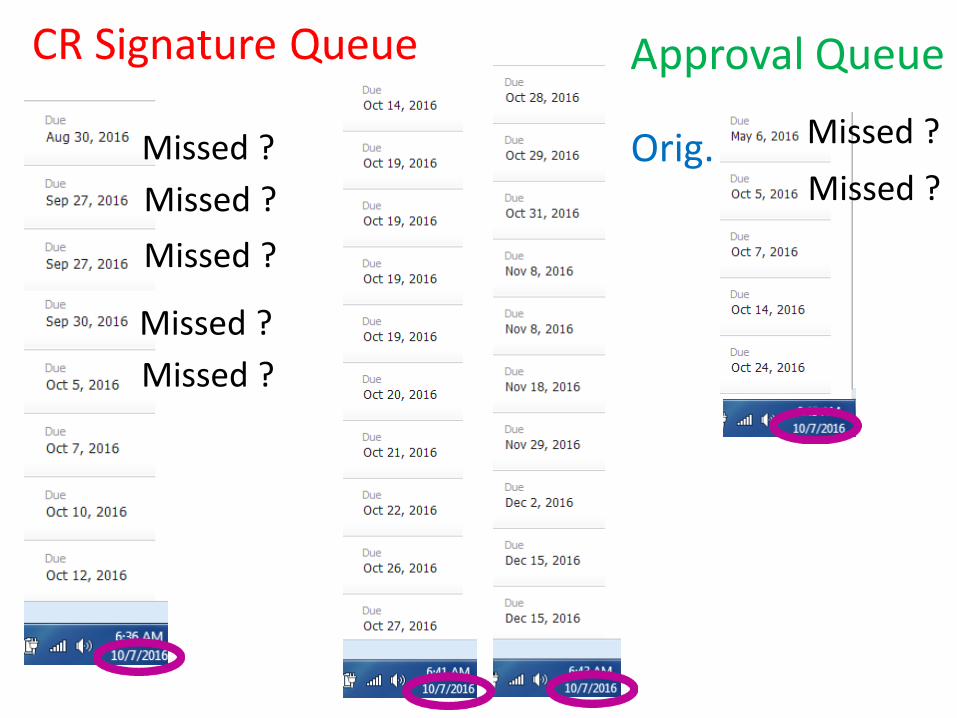
Missed ? Missed ? Missed ?
Missed ? Missed ?
Approval Queue
Orig. Missed ? Missed ?
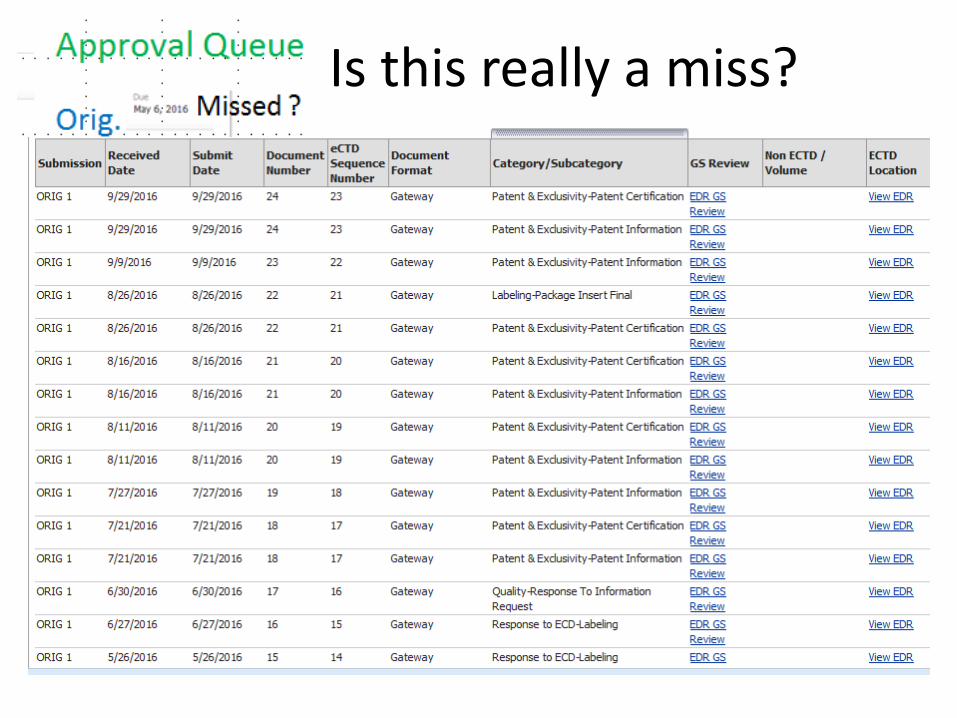
Is this really a miss?
What You Will See Today: Progress
• Controlled Correspondence • Cohort of Receipt Tracking • Receipts and Actions • Prior-Approval Supplements • Program Level Data • A Peak at the Platform • The Future
40
The Future • Continued Progress – there is still more we need
to do and achieve • Additional Data Planned for Next Year