Embed Size (px)
Citation preview
2 ALASKA ECONOMIC TRENDS APRIL 2005
Alaska EconomicTrends is a monthly
publication dealingwith a variety of
economic-relatedissues in the state.
Alaska EconomicTrends is funded by
the EmploymentSecurity Division and
published by theAlaska Department ofLabor and Workforce
Development, P.O. Box21149, Juneau, Alaska
99802-1149.
Printed and distributedby Assets, Inc., a
vocational training andemployment program,at a cost of $1.42 per
copy.
To contact us formore information,
to subscribe, or formailing list changes or
back copies, [email protected]
Material in thispublication is public
information and, withappropriate credit,
may be reproducedwithout permission.
Trends is available on the Internet.See URL above.
Contents:
The Year 2004 in Review 4Growth continues for seventeenth consecutiveyear
Benchmark 18New calculation procedures improve accuracy
Employment Scene 20February Posts Employment Gains Over Year AgoUnemployment rate is lower also
April 2005Volume 25Number 4
ISSN 0160-3345
Email Trends authors at: [email protected]
AprilTrends authors are staffwith the Research and Analysis Section,
Administrative Services Division,Alaska Department of Labor and Workforce Development.
Subscriptions:[email protected]
(907) 465-4500
Joanne Erskine, Editor
Cover design by Sam Dapcevich
Frank H. Murkowski, Governor of Alaska
Greg O’Claray, Commissioner
Alaska Department of Labor
and Workforce Development
http://almis.labor.state.ak.us
ALASKA ECONOMIC TRENDS APRIL 2005 3
The Year 2004 was oneof accomplishmentsand economic progress
by Governor Frank H. Murkowski
This Year-in-Review issue of Trends magazine reports the reassur-ing continuation of a positive trend – the seventeenth straightyear of overall job growth in Alaska. A strong construction indus-try, a rebounding oil patch, the reversal of seafood’s slump, steadyretail growth and a surging health care industry are all good newsfor our economy.
While the details are important to economists – and this issueincludes a wealth of analysis of economic activity across the state– its deeper value lies in how it affects the lives of Alaskans. Weare committed to improving life here by taking steps to improveour economy — taking responsibility today for Alaska’s tomor-row. A review of the year will illustrate our success in meeting thatcommitment.
The year brought historic progress on big-picture projects withactive negotiations on the natural gas pipeline and internationalconsultations with our Canadian neighbors on extending the AlaskaRailroad to all of North America.
We opened the new Concourse C at Ted Stevens Anchorage In-ternational Airport, showcasing Alaska’s importance to the world’stransportation system. With teams of engineers and a fleet ofheavy equipment, we are extending and improving highways, plan-ning new roads and building new connectors throughout Alaska.
In Southeast, the Juneau Access project should finally lead to aroad linking the capital with the rest of the state and the continent.In Southcentral, the Knik Arm Crossing Authority has plans toconnect Anchorage with Point MacKenzie, opening thousands ofacres for development just 15 minutes from downtown Anchor-age.
Growth and prosperity require an outstanding educational sys-tem, and in 2004, we took steps to expand educational opportuni-ties for all Alaskans. I signed legislation raising state support forpublic schools by $82 million to $777 million, the largest increasein recent memory - an average $407 more for each of our 133,000public school students.
After we helped the University of Alaska secure its largest fund-ing increase in nearly 20 years, officials report dramatic improve-
ments in just two years. It includes a 14 percent increase in highschool graduates staying in Alaska for school; a 23 percent fed-eral research funding increase; and an 11 percent overall increasein enrollment. For the first time, more than half of our college-bound graduates stay in Alaska – a good sign for our future.
As these graduates will need jobs, we worked hard to providethem opportunities for good careers at home. We saw genuineprogress this year in making our dream of a pipeline to marketAlaska’s natural gas a reality – and I look forward to achievingnew milestones this year that will result in the dramatic benefits ofconstruction and operation of this gasline to our state.
We’re seeing renewed interest in oil and gas development in BristolBay to diversify the economy, lower energy costs, and providesustainable high-paying jobs to local residents. Barriers to devel-opment of our rich mineral deposits are falling and investmentsare rising. Mineral deposits like Pogo, Pebble, Donlin Creek, andKensington will eventually become mines as well known as RedDog, bringing economic development and job opportunities toAlaskans.
Commercial fishing is rebounding as one of Alaska’s most impor-tant industries, as we achieved initiatives to restore a healthy,sustainable economy in Alaska’s coastal communities. I signedlaws allowing some 42 coastal communities to form CommunityQuota Entities and obtain state loans to buy Individual FishingQuota shares. This creates new opportunities for Alaska fisher-men to earn a living in their home waters.
We also made important progress in 2004 to revitalize Alaska’ssalmon industry, inviting industry to develop creative new waysto market wild Alaska salmon. These initiatives encouraged op-erators of all sizes to develop new products, explore new markets,and successfully sell our outstanding seafood products to a hun-gry world market.
Alaska’s progress toward a prosperous future will continue aslong as Alaskans dream of and work toward a better life. As asnapshot of our advancement toward this goal in 2004, this reportis welcome evidence that the trend continues toward increasedeconomic opportunities in this Great Land.
4 ALASKA ECONOMIC TRENDS APRIL 2005
Unemployment Rate Model ChangesThe Year 2004 in Review
Growth continues for seventeenth consecutive year
TOil employment picks up
Jobs in the oil and gas industry rebounded in 2004after falling by 1,400 from 2001 to 2003. Thenumber of oil and gas jobs averaged 8,200 in2004, an increase of just 100 from 2003, but awelcome change of direction after the previousyears’ losses.
Over the last decade, oil and gas employment hasshown a muted downward trend, interrupted byoccasional increases such as those in 2000 and2001 which were related to the opening of theNorthstar and Alpine fields. That activity led toemployment levels as high as 9,500 in 2001. Oiland gas employment had dipped to 7,900 in1999, its lowest point of the decade, just prior tothe development of Northstar and Alpine. Recordhigh oil prices in 2004 that show signs of stabilizingat high levels bode well for the industry in Alaska.
Construction stays strong
Construction growth was still strong in 2004 at 4.1percent, but it cooled slightly from 2003’s growthof 5.7 percent and 2002’s of 6.0 percent. Nearlyall of the 700 new jobs came from Fairbanks andAnchorage as military spending, low interest rates,and public sector projects from airport expansionsto new schools helped sustain a very favorable
by Dan Robinson, Neal Fried,Neal Gilbertsen, and Brigitta
Windisch-Cole, Economists
STATEWIDE by Dan Robinson
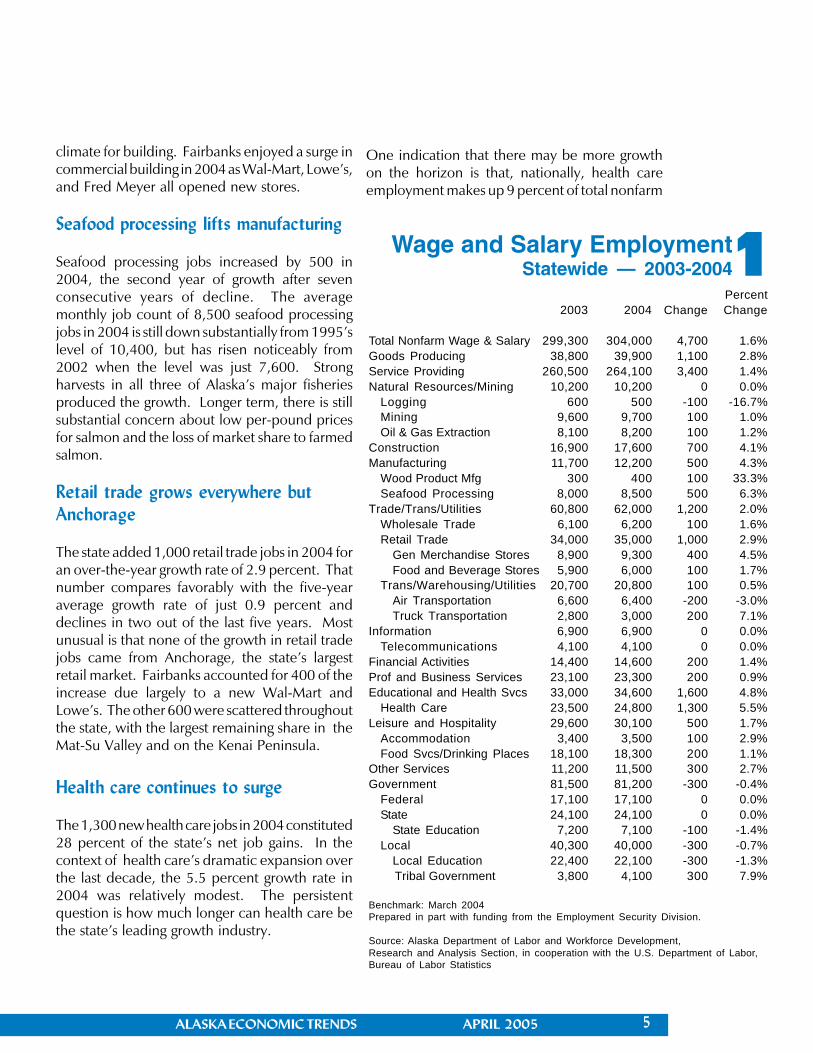
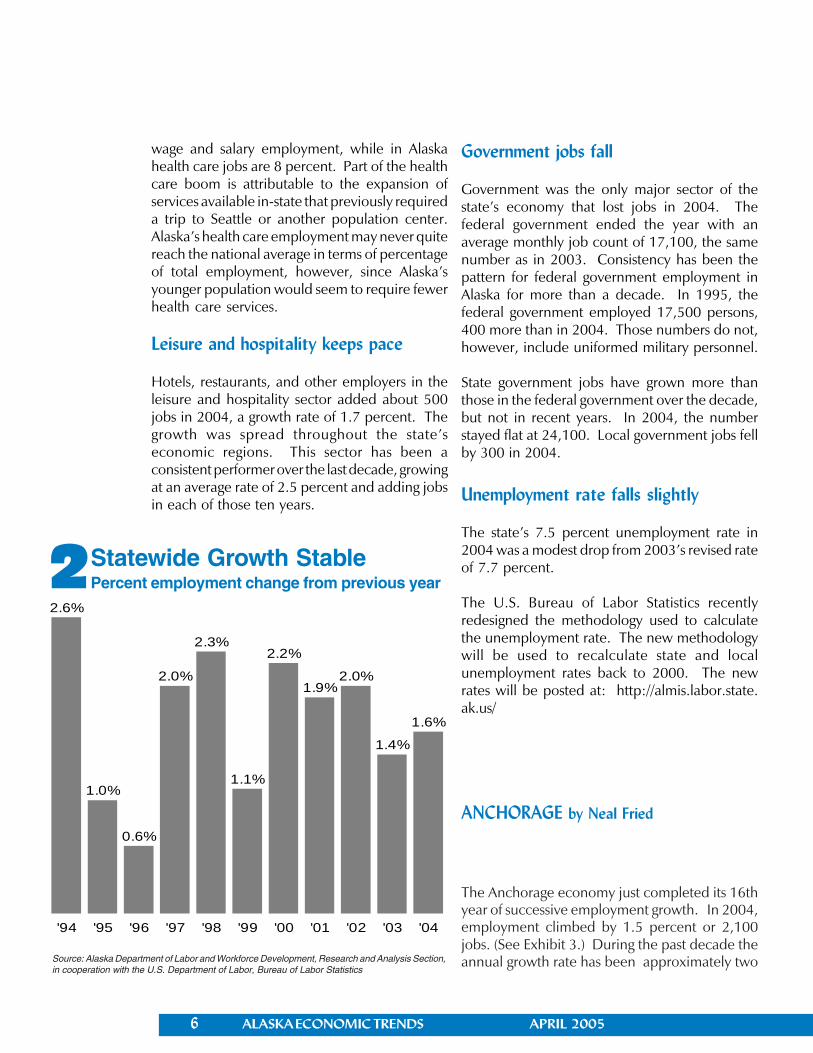
he streak goes on. For the seventeenthconsecutive year Alaska added jobs toits economy in 2004. (See Exhibits 1and 2.) The year’s average monthlyjob count of 304,000 was an increase
of 4,700 over 2003 and marked the first time thestate climbed above the 300,000 mark. A historicallook shows Alaska surpassed 200,000 jobs in 1982and 100,000 in 1972. Only three other states, allin the sun belt, can claim to have at least tripledtheir job count since 1972: Nevada, Arizona, andFlorida.
The state’s 4,700 new jobs equated to a growthrate of 1.6 percent, slightly higher than 2003, andequal to the ten-year average. Over theseventeen-year expansion, growth has averaged2.1 percent, a higher number due mostly to thestrong growth years of 1989 (4.8 percent) and1990 (4.7 percent). Growth was robust duringthat period as the state expanded its workforce toclean up after the 1989 Exxon Valdez oil spill.
In 2004, health care, retail trade, and constructionprovided the most new jobs. Seafood processingwas up for the second year in a row and oil and gasjobs increased marginally after two years of largedeclines. Very few industry sectors experiencedjob losses: government employment declined by400 jobs, air transportation by 200, and logging by100.
ALASKA ECONOMIC TRENDS APRIL 2005 5
Percent2003 2004 Change Change
Total Nonfarm Wage & Salary 299,300 304,000 4,700 1.6%Goods Producing 38,800 39,900 1,100 2.8%Service Providing 260,500 264,100 3,400 1.4%Natural Resources/Mining 10,200 10,200 0 0.0%
Logging 600 500 -100 -16.7%Mining 9,600 9,700 100 1.0%Oil & Gas Extraction 8,100 8,200 100 1.2%
Construction 16,900 17,600 700 4.1%Manufacturing 11,700 12,200 500 4.3%
Wood Product Mfg 300 400 100 33.3%Seafood Processing 8,000 8,500 500 6.3%
Trade/Trans/Utilities 60,800 62,000 1,200 2.0%Wholesale Trade 6,100 6,200 100 1.6%Retail Trade 34,000 35,000 1,000 2.9%
Gen Merchandise Stores 8,900 9,300 400 4.5%Food and Beverage Stores 5,900 6,000 100 1.7%
Trans/Warehousing/Utilities 20,700 20,800 100 0.5%Air Transportation 6,600 6,400 -200 -3.0%Truck Transportation 2,800 3,000 200 7.1%
Information 6,900 6,900 0 0.0%Telecommunications 4,100 4,100 0 0.0%
Financial Activities 14,400 14,600 200 1.4%Prof and Business Services 23,100 23,300 200 0.9%Educational and Health Svcs 33,000 34,600 1,600 4.8%
Health Care 23,500 24,800 1,300 5.5%Leisure and Hospitality 29,600 30,100 500 1.7%
Accommodation 3,400 3,500 100 2.9%Food Svcs/Drinking Places 18,100 18,300 200 1.1%
Other Services 11,200 11,500 300 2.7%Government 81,500 81,200 -300 -0.4%
Federal 17,100 17,100 0 0.0%State 24,100 24,100 0 0.0%
State Education 7,200 7,100 -100 -1.4%Local 40,300 40,000 -300 -0.7%
Local Education 22,400 22,100 -300 -1.3% Tribal Government 3,800 4,100 300 7.9%
Benchmark: March 2004Prepared in part with funding from the Employment Security Division.
Source: Alaska Department of Labor and Workforce Development,Research and Analysis Section, in cooperation with the U.S. Department of Labor,Bureau of Labor Statistics
1Wage and Salary EmploymentStatewide — 2003-2004
climate for building. Fairbanks enjoyed a surge incommercial building in 2004 as Wal-Mart, Lowe’s,and Fred Meyer all opened new stores.
Seafood processing lifts manufacturing
Seafood processing jobs increased by 500 in2004, the second year of growth after sevenconsecutive years of decline. The averagemonthly job count of 8,500 seafood processingjobs in 2004 is still down substantially from 1995’slevel of 10,400, but has risen noticeably from2002 when the level was just 7,600. Strongharvests in all three of Alaska’s major fisheriesproduced the growth. Longer term, there is stillsubstantial concern about low per-pound pricesfor salmon and the loss of market share to farmedsalmon.
Retail trade grows everywhere butAnchorage
The state added 1,000 retail trade jobs in 2004 foran over-the-year growth rate of 2.9 percent. Thatnumber compares favorably with the five-yearaverage growth rate of just 0.9 percent anddeclines in two out of the last five years. Mostunusual is that none of the growth in retail tradejobs came from Anchorage, the state’s largestretail market. Fairbanks accounted for 400 of theincrease due largely to a new Wal-Mart andLowe’s. The other 600 were scattered throughoutthe state, with the largest remaining share in theMat-Su Valley and on the Kenai Peninsula.
Health care continues to surge
The 1,300 new health care jobs in 2004 constituted28 percent of the state’s net job gains. In thecontext of health care’s dramatic expansion overthe last decade, the 5.5 percent growth rate in2004 was relatively modest. The persistentquestion is how much longer can health care bethe state’s leading growth industry.
One indication that there may be more growthon the horizon is that, nationally, health careemployment makes up 9 percent of total nonfarm
6 ALASKA ECONOMIC TRENDS APRIL 2005
Statewide Growth StablePercent employment change from previous year2
Source: Alaska Department of Labor and Workforce Development, Research and Analysis Section,in cooperation with the U.S. Department of Labor, Bureau of Labor Statistics
wage and salary employment, while in Alaskahealth care jobs are 8 percent. Part of the healthcare boom is attributable to the expansion ofservices available in-state that previously requireda trip to Seattle or another population center.Alaska’s health care employment may never quitereach the national average in terms of percentageof total employment, however, since Alaska’syounger population would seem to require fewerhealth care services.
Leisure and hospitality keeps pace
Hotels, restaurants, and other employers in theleisure and hospitality sector added about 500jobs in 2004, a growth rate of 1.7 percent. Thegrowth was spread throughout the state’seconomic regions. This sector has been aconsistent performer over the last decade, growingat an average rate of 2.5 percent and adding jobsin each of those ten years.
Government jobs fall
Government was the only major sector of thestate’s economy that lost jobs in 2004. Thefederal government ended the year with anaverage monthly job count of 17,100, the samenumber as in 2003. Consistency has been thepattern for federal government employment inAlaska for more than a decade. In 1995, thefederal government employed 17,500 persons,400 more than in 2004. Those numbers do not,however, include uniformed military personnel.
State government jobs have grown more thanthose in the federal government over the decade,but not in recent years. In 2004, the numberstayed flat at 24,100. Local government jobs fellby 300 in 2004.
Unemployment rate falls slightly
The state’s 7.5 percent unemployment rate in2004 was a modest drop from 2003’s revised rateof 7.7 percent.
The U.S. Bureau of Labor Statistics recentlyredesigned the methodology used to calculatethe unemployment rate. The new methodologywill be used to recalculate state and localunemployment rates back to 2000. The newrates will be posted at: http://almis.labor.state.ak.us/
ANCHORAGE by Neal Fried
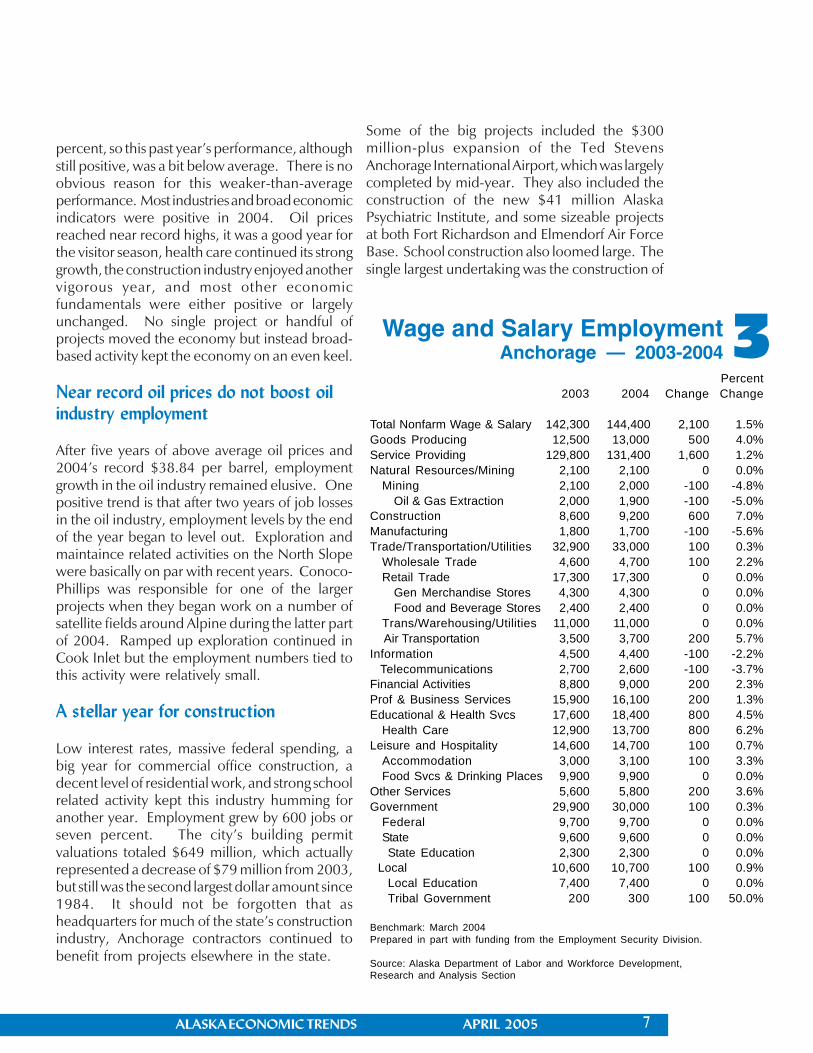
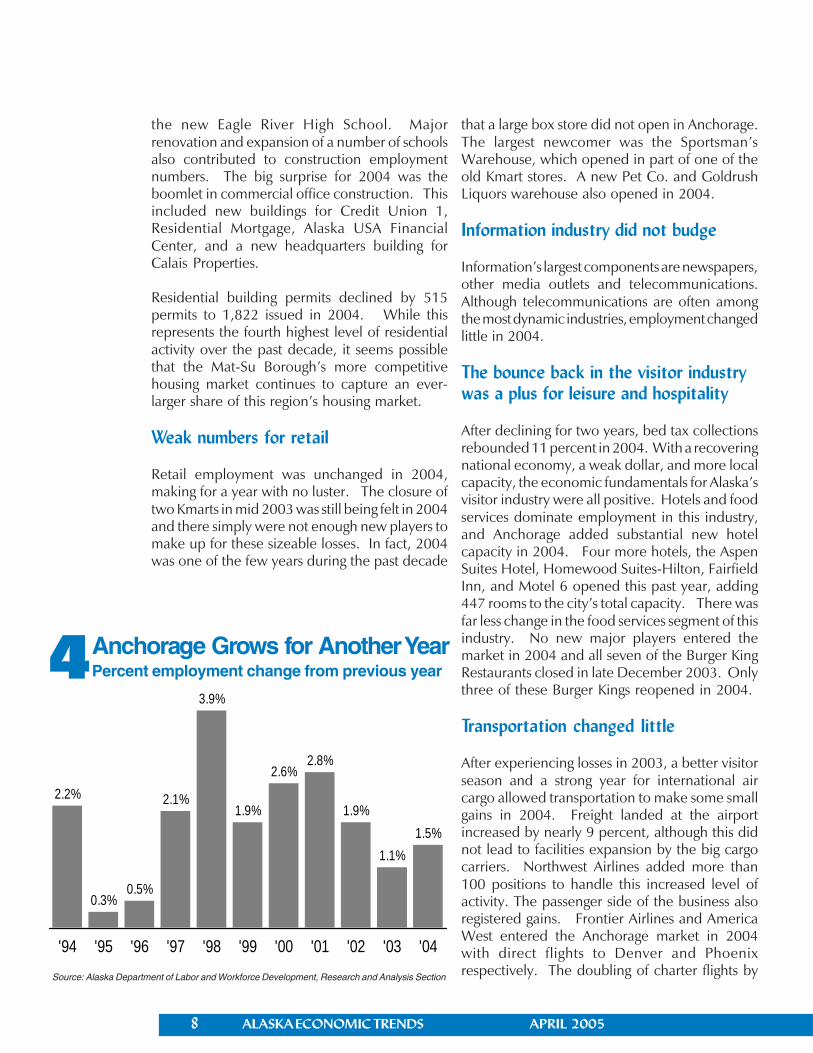
The Anchorage economy just completed its 16thyear of successive employment growth. In 2004,employment climbed by 1.5 percent or 2,100jobs. (See Exhibit 3.) During the past decade theannual growth rate has been approximately two
2.6%
1.0%
0.6%
2.0%
2.3%
1.1%
2.2%
1.9%2.0%
1.4%
1.6%
'94 '95 '96 '97 '98 '99 '00 '01 '02 '03 '04
ALASKA ECONOMIC TRENDS APRIL 2005 7
3
percent, so this past year’s performance, althoughstill positive, was a bit below average. There is noobvious reason for this weaker-than-averageperformance. Most industries and broad economicindicators were positive in 2004. Oil pricesreached near record highs, it was a good year forthe visitor season, health care continued its stronggrowth, the construction industry enjoyed anothervigorous year, and most other economicfundamentals were either positive or largelyunchanged. No single project or handful ofprojects moved the economy but instead broad-based activity kept the economy on an even keel.
Near record oil prices do not boost oilindustry employment
After five years of above average oil prices and2004’s record $38.84 per barrel, employmentgrowth in the oil industry remained elusive. Onepositive trend is that after two years of job lossesin the oil industry, employment levels by the endof the year began to level out. Exploration andmaintaince related activities on the North Slopewere basically on par with recent years. Conoco-Phillips was responsible for one of the largerprojects when they began work on a number ofsatellite fields around Alpine during the latter partof 2004. Ramped up exploration continued inCook Inlet but the employment numbers tied tothis activity were relatively small.
A stellar year for construction
Low interest rates, massive federal spending, abig year for commercial office construction, adecent level of residential work, and strong schoolrelated activity kept this industry humming foranother year. Employment grew by 600 jobs orseven percent. The city’s building permitvaluations totaled $649 million, which actuallyrepresented a decrease of $79 million from 2003,but still was the second largest dollar amount since1984. It should not be forgotten that asheadquarters for much of the state’s constructionindustry, Anchorage contractors continued tobenefit from projects elsewhere in the state.
Some of the big projects included the $300million-plus expansion of the Ted StevensAnchorage International Airport, which was largelycompleted by mid-year. They also included theconstruction of the new $41 million AlaskaPsychiatric Institute, and some sizeable projectsat both Fort Richardson and Elmendorf Air ForceBase. School construction also loomed large. Thesingle largest undertaking was the construction of
Percent2003 2004 Change Change
Total Nonfarm Wage & Salary 142,300 144,400 2,100 1.5%Goods Producing 12,500 13,000 500 4.0%Service Providing 129,800 131,400 1,600 1.2%Natural Resources/Mining 2,100 2,100 0 0.0%
Mining 2,100 2,000 -100 -4.8%Oil & Gas Extraction 2,000 1,900 -100 -5.0%
Construction 8,600 9,200 600 7.0%Manufacturing 1,800 1,700 -100 -5.6%Trade/Transportation/Utilities 32,900 33,000 100 0.3%
Wholesale Trade 4,600 4,700 100 2.2%Retail Trade 17,300 17,300 0 0.0%
Gen Merchandise Stores 4,300 4,300 0 0.0%Food and Beverage Stores 2,400 2,400 0 0.0%
Trans/Warehousing/Utilities 11,000 11,000 0 0.0% Air Transportation 3,500 3,700 200 5.7%Information 4,500 4,400 -100 -2.2% Telecommunications 2,700 2,600 -100 -3.7%Financial Activities 8,800 9,000 200 2.3%Prof & Business Services 15,900 16,100 200 1.3%Educational & Health Svcs 17,600 18,400 800 4.5%
Health Care 12,900 13,700 800 6.2%Leisure and Hospitality 14,600 14,700 100 0.7%
Accommodation 3,000 3,100 100 3.3%Food Svcs & Drinking Places 9,900 9,900 0 0.0%
Other Services 5,600 5,800 200 3.6%Government 29,900 30,000 100 0.3%
Federal 9,700 9,700 0 0.0%State 9,600 9,600 0 0.0%State Education 2,300 2,300 0 0.0%
Local 10,600 10,700 100 0.9%Local Education 7,400 7,400 0 0.0%Tribal Government 200 300 100 50.0%
Benchmark: March 2004Prepared in part with funding from the Employment Security Division.
Source: Alaska Department of Labor and Workforce Development,Research and Analysis Section
Wage and Salary EmploymentAnchorage — 2003-2004
8 ALASKA ECONOMIC TRENDS APRIL 2005
Source: Alaska Department of Labor and Workforce Development, Research and Analysis Section
Anchorage Grows for Another YearPercent employment change from previous year4
the new Eagle River High School. Majorrenovation and expansion of a number of schoolsalso contributed to construction employmentnumbers. The big surprise for 2004 was theboomlet in commercial office construction. Thisincluded new buildings for Credit Union 1,Residential Mortgage, Alaska USA FinancialCenter, and a new headquarters building forCalais Properties.
Residential building permits declined by 515permits to 1,822 issued in 2004. While thisrepresents the fourth highest level of residentialactivity over the past decade, it seems possiblethat the Mat-Su Borough’s more competitivehousing market continues to capture an ever-larger share of this region’s housing market.
Weak numbers for retail
Retail employment was unchanged in 2004,making for a year with no luster. The closure oftwo Kmarts in mid 2003 was still being felt in 2004and there simply were not enough new players tomake up for these sizeable losses. In fact, 2004was one of the few years during the past decade
that a large box store did not open in Anchorage.The largest newcomer was the Sportsman’sWarehouse, which opened in part of one of theold Kmart stores. A new Pet Co. and GoldrushLiquors warehouse also opened in 2004.
Information industry did not budge
Information’s largest components are newspapers,other media outlets and telecommunications.Although telecommunications are often amongthe most dynamic industries, employment changedlittle in 2004.
The bounce back in the visitor industrywas a plus for leisure and hospitality
After declining for two years, bed tax collectionsrebounded 11 percent in 2004. With a recoveringnational economy, a weak dollar, and more localcapacity, the economic fundamentals for Alaska’svisitor industry were all positive. Hotels and foodservices dominate employment in this industry,and Anchorage added substantial new hotelcapacity in 2004. Four more hotels, the AspenSuites Hotel, Homewood Suites-Hilton, FairfieldInn, and Motel 6 opened this past year, adding447 rooms to the city’s total capacity. There wasfar less change in the food services segment of thisindustry. No new major players entered themarket in 2004 and all seven of the Burger KingRestaurants closed in late December 2003. Onlythree of these Burger Kings reopened in 2004.
Transportation changed little
After experiencing losses in 2003, a better visitorseason and a strong year for international aircargo allowed transportation to make some smallgains in 2004. Freight landed at the airportincreased by nearly 9 percent, although this didnot lead to facilities expansion by the big cargocarriers. Northwest Airlines added more than100 positions to handle this increased level ofactivity. The passenger side of the business alsoregistered gains. Frontier Airlines and AmericaWest entered the Anchorage market in 2004with direct flights to Denver and Phoenixrespectively. The doubling of charter flights by
2.2%
0.3%0.5%
2.1%
3.9%
1.9%
2.6%2.8%
1.9%
1.1%1.5%
'94 '95 '96 '97 '98 '99 '00 '01 '02 '03 '04
ALASKA ECONOMIC TRENDS APRIL 2005 9
Minneapolis based Sun Country Airlines andJapanese carriers provided an additional industryboost. Cathay Pacific also re-entered the marketafter routing their flights around Anchorage in2003. The general increase in economic activityand a healthy construction season kept truckinggrowing.
Health care, again, created more thanhalf of the jobs
For the second year in a row, the education andhealth services sector created the largest share ofnew jobs in Anchorage’s economy. The sub-category of this sector which represents most ofthe employment, health care, was responsible fornearly all of the gains. In 2004, this sector grew by6.2 percent or by 800 jobs. All levels of healthcare made gains, including hospitals, clinics, doctoroffices and other health care providers. Thecontinued privatization and expansion of theAlaska Native Health Center provided animportant boost to this sector. Although growth inthis industry seems relentless, it is hard to believethat this year-in, year-out trend is sustainable.
Professional and business serviceschanged little
Because this is such an eclectic category, it isdifficult to discern specific trends.Healthy levels of construction activity undoubtedlyprovided demand for architectural andengineering services, which are an importantslice of this industry. It is less clear whether theother important players in this industry, such aslegal, accounting, computer and other professionalservices shared in this impetus.
Low interest rates keep financial sectorin the black
Low interest rates, strong refinancing activity, adecent securities market and a healthy real estatemarket meant employment in the financial industrykept growing in 2004. The many newheadquarters and branch office buildings thatwere built or begun in 2004 are indicators of thestrength of this industry (see construction section).
Public sector employment changed little
It was a dull year for the Anchorage public sector.Federal and state government employmentremained relatively flat in 2004, while localgovernment inched up slightly. Gains came fromsmall increases in the Municipality and theAnchorage School District.
Unemployment rate changed little in2004
Anchorage’s unemployment rate averaged 5.7percent in 2004 under the newly institutedmethodology for calculating unemployment. Thenew system produced slightly higher rates thanthe previous one, but the two should not becompared for real economic change. The newsystem will be used to recalculate unemploymentrates back to at least 2000. When available, thoserates will be posted at: http://almis.labor.state.ak.us/
FAIRBANKS by Brigitta Windisch-Cole
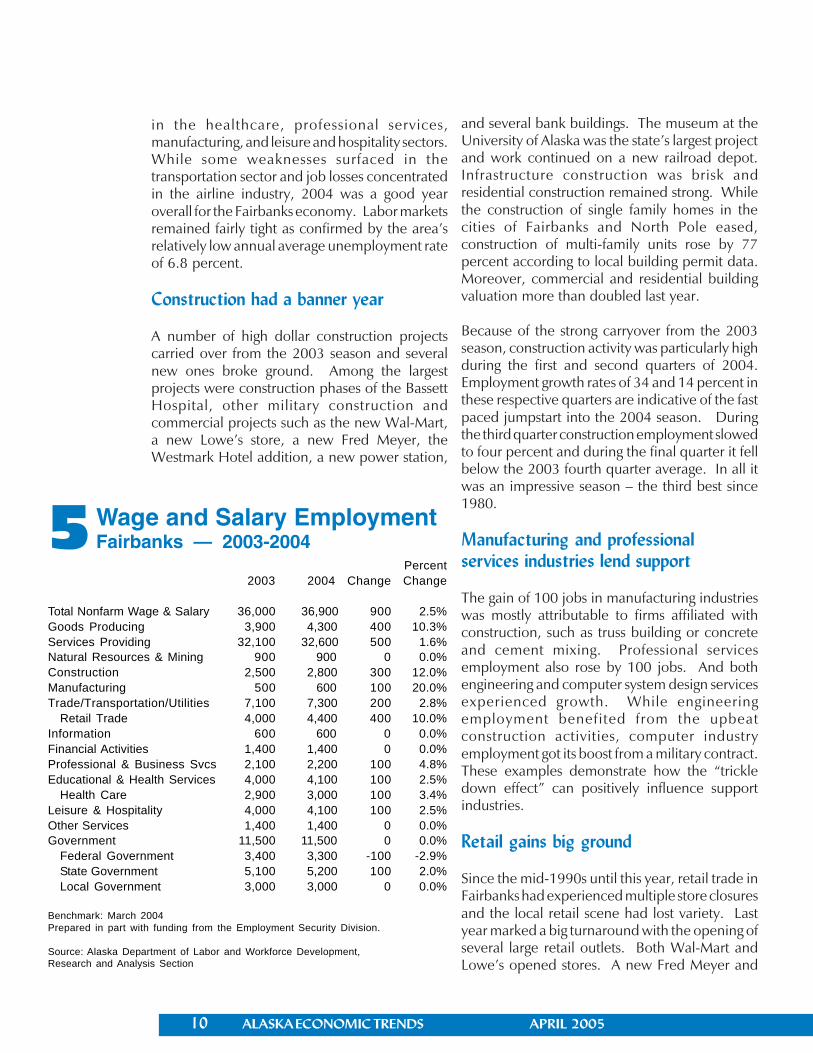
In 2004, Fairbanks was the fastest growingeconomic area in the state. Fairbanks employersadded more than 900 jobs, and the 2.5 percentrate of growth was the most robust since 1998.(See Exhibit 5.) Payrolls during the first ninemonths increased by 6.1 percent over thecomparable months of 2003, which meant thatmany of the new positions were good paying jobs.Fairbanks enjoyed a strong construction seasonwith employment levels approaching those of themid-1980s boom. Retail rebounded strongly andproduced the largest single gain among theindividual industry sectors. Employment also rose
10 ALASKA ECONOMIC TRENDS APRIL 2005
5Percent
2003 2004 Change Change
Total Nonfarm Wage & Salary 36,000 36,900 900 2.5%Goods Producing 3,900 4,300 400 10.3%Services Providing 32,100 32,600 500 1.6%Natural Resources & Mining 900 900 0 0.0%Construction 2,500 2,800 300 12.0%Manufacturing 500 600 100 20.0%Trade/Transportation/Utilities 7,100 7,300 200 2.8%
Retail Trade 4,000 4,400 400 10.0%Information 600 600 0 0.0%Financial Activities 1,400 1,400 0 0.0%Professional & Business Svcs 2,100 2,200 100 4.8%Educational & Health Services 4,000 4,100 100 2.5%
Health Care 2,900 3,000 100 3.4%Leisure & Hospitality 4,000 4,100 100 2.5%Other Services 1,400 1,400 0 0.0%Government 11,500 11,500 0 0.0%
Federal Government 3,400 3,300 -100 -2.9%State Government 5,100 5,200 100 2.0%Local Government 3,000 3,000 0 0.0%
Benchmark: March 2004Prepared in part with funding from the Employment Security Division.
Source: Alaska Department of Labor and Workforce Development,Research and Analysis Section
Wage and Salary EmploymentFairbanks — 2003-2004
in the healthcare, professional services,manufacturing, and leisure and hospitality sectors.While some weaknesses surfaced in thetransportation sector and job losses concentratedin the airline industry, 2004 was a good yearoverall for the Fairbanks economy. Labor marketsremained fairly tight as confirmed by the area’srelatively low annual average unemployment rateof 6.8 percent.
Construction had a banner year
A number of high dollar construction projectscarried over from the 2003 season and severalnew ones broke ground. Among the largestprojects were construction phases of the BassettHospital, other military construction andcommercial projects such as the new Wal-Mart,a new Lowe’s store, a new Fred Meyer, theWestmark Hotel addition, a new power station,
and several bank buildings. The museum at theUniversity of Alaska was the state’s largest projectand work continued on a new railroad depot.Infrastructure construction was brisk andresidential construction remained strong. Whilethe construction of single family homes in thecities of Fairbanks and North Pole eased,construction of multi-family units rose by 77percent according to local building permit data.Moreover, commercial and residential buildingvaluation more than doubled last year.
Because of the strong carryover from the 2003season, construction activity was particularly highduring the first and second quarters of 2004.Employment growth rates of 34 and 14 percent inthese respective quarters are indicative of the fastpaced jumpstart into the 2004 season. Duringthe third quarter construction employment slowedto four percent and during the final quarter it fellbelow the 2003 fourth quarter average. In all itwas an impressive season – the third best since1980.
Manufacturing and professionalservices industries lend support
The gain of 100 jobs in manufacturing industrieswas mostly attributable to firms affiliated withconstruction, such as truss building or concreteand cement mixing. Professional servicesemployment also rose by 100 jobs. And bothengineering and computer system design servicesexperienced growth. While engineeringemployment benefited from the upbeatconstruction activities, computer industryemployment got its boost from a military contract.These examples demonstrate how the “trickledown effect” can positively influence supportindustries.
Retail gains big ground
Since the mid-1990s until this year, retail trade inFairbanks had experienced multiple store closuresand the local retail scene had lost variety. Lastyear marked a big turnaround with the opening ofseveral large retail outlets. Both Wal-Mart andLowe’s opened stores. A new Fred Meyer and
ALASKA ECONOMIC TRENDS APRIL 2005 11
other retail space are still under construction,which will give employment additional boosts. In2004, retail added 400 new jobs in Fairbanks andfoundations have been laid for more growth.
Leisure and hospitality industrycontinues to grow
Since 2001 Fairbanks’ leisure and hospitalityindustry has continuously created jobs, 400 ofthem between 2001 and 2004, in spite of therecession in the U.S. economy. New hotelconstruction and additions have supported thisgrowth.
Fairbanks is a destination on the itinerary of cruiseship passengers, Alaska’s fastest growing visitorsegment. Fairbanks has also become a gatewayfor some tourists from abroad; Japanese andEuropean clientele pass through on theirexploration of the Interior. Last year’s season wasmarred in part by the huge wild fires that ravagedlarge parts of the Interior region during July andAugust. Some road travelers may even have cutshort their stay in Fairbanks because of thicksmoke. Yet, guestroom receipts revealed that itwas a banner season. Revenues were up nearly14 percent from the 2003 season, indicating highoccupancies. Most likely hotels also benefitedfrom the strong construction season, other businesstravel, and even fire fighting, whose crews boostedroom sales in some locations.
Health care employment advanced
Health care also contributed to employmentgrowth, adding 100 new jobs in Fairbanks.Medical services, as in most places in the state,are expanding. New medical technology andspecialized services are the impetus for much ofthis growth. As the repertoire of services widens,Fairbanks residents can increasingly expect toreceive state of the art medical treatments closeto home. The expansion at Fairbanks MemorialHospital will introduce new services in the nearfuture.
Transportation jobs turn negative
Several transportation industries could notmaintain their 2003 employment levels in 2004.Except for air transportation, which shed nearly200 jobs, the changes were small. Air trans-portation employment was affected whenregulations regarding U.S. mail delivery went intoeffect. Small carriers could no longer deliver U.S.mail to remote Interior locations without ferryingpassengers as well. Consequently, three smallcarriers lacking the required passenger capacitiesshut down and a fourth company moved to Kodiak,where it emerged as a much smaller firm. Anotherair transportation company spun off its Anchoragedivision from its Fairbanks headquarters. Thisresulted in a technical correction regarding worksite employment and additional jobs fell off theFairbanks job roster.
Several industries showed little change
Employment in several industry sectors did notchange. Job levels in financial and other servicessectors remained constant, as did overall publicsector employment. While the federal branchlost some jobs, the downturn was offset by gainsin state government, especially by growth inuniversity employment. In local government theschool district shed jobs but growth in publicadministration jobs helped to preserve 2003employment levels.
12 ALASKA ECONOMIC TRENDS APRIL 2005
Source: Alaska Department of Labor and Workforce Development, Research and Analysis Section
1.0
3.0
-0.1
0.8
-1.8
1.6
1.1
-0.8
-0.4
1.5
-1.1
'94 '95 '96 '97 98 '99 '00 '01 '02 03 '04
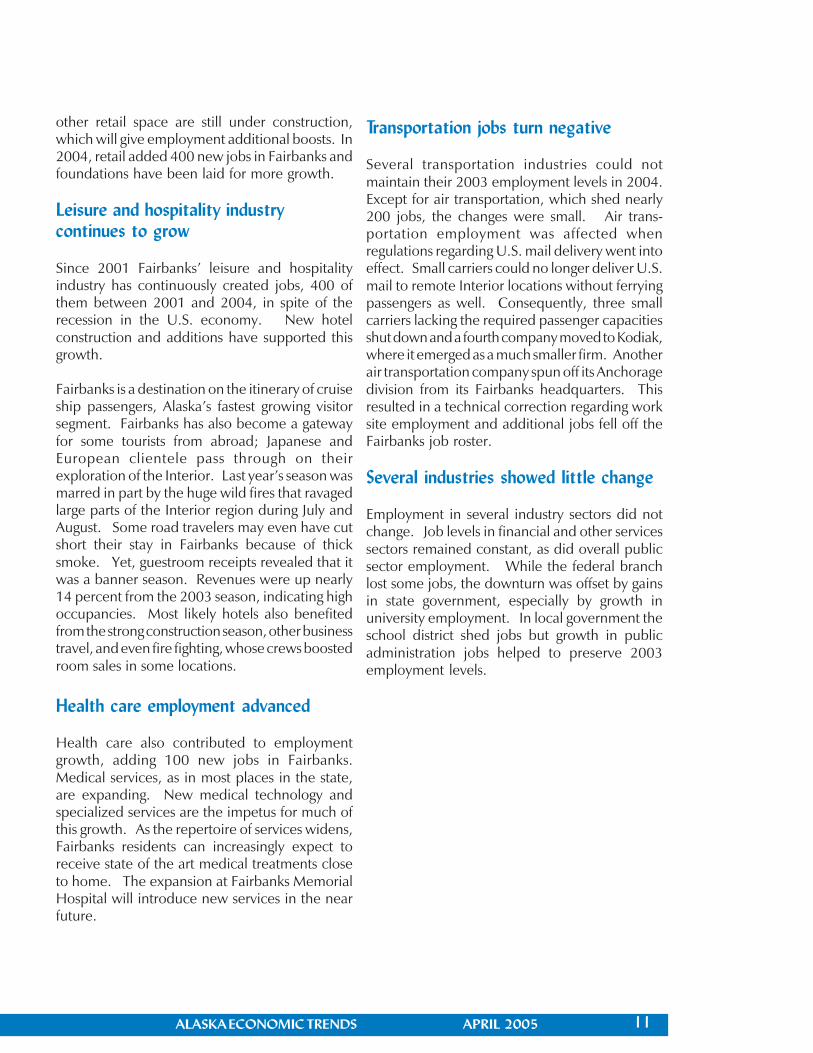
6Southeast Employment SlidesIn 2004Percent employment change from previous year
SOUTHEAST by Neal Gilbertsen
In 2004, the Southeast economy shed 400 jobsand registered a 1.1 percent decline in employ-ment. (See Exhibit 6.) This data is somewhatmisleading, however, in that approximately onehalf the overall regional decline and virtually alljob losses in the private sector can be explainedas a geographic adjustment. On the other hand,the 200-job decline in government employmentwas both real and substantial.
Technical adjustments
As most Alaskans know, many large firms performseasonal work in various regions of the state.Many short-term projects involve temporary worksites, and unless the reporting company specifieshow many individuals are working at each site, orthe Alaska Department of Labor and Workforce
Development has a basis for estimating jobdistribution, such employment is attributed tocompany headquarters. In 2004, two largecompanies saw their Southeast employmentgeographically adjusted. Some or all of theiremployment, which had been recorded inSoutheast, was transferred elsewhere in the state.This geographic adjustment does not reflect realregional decline but creates the appearance ofjob losses in Southeast and corresponding jobincreases elsewhere. When this geographicadjustment is taken into account, the apparentregional decline in private sector employmentdisappears.
Real changes
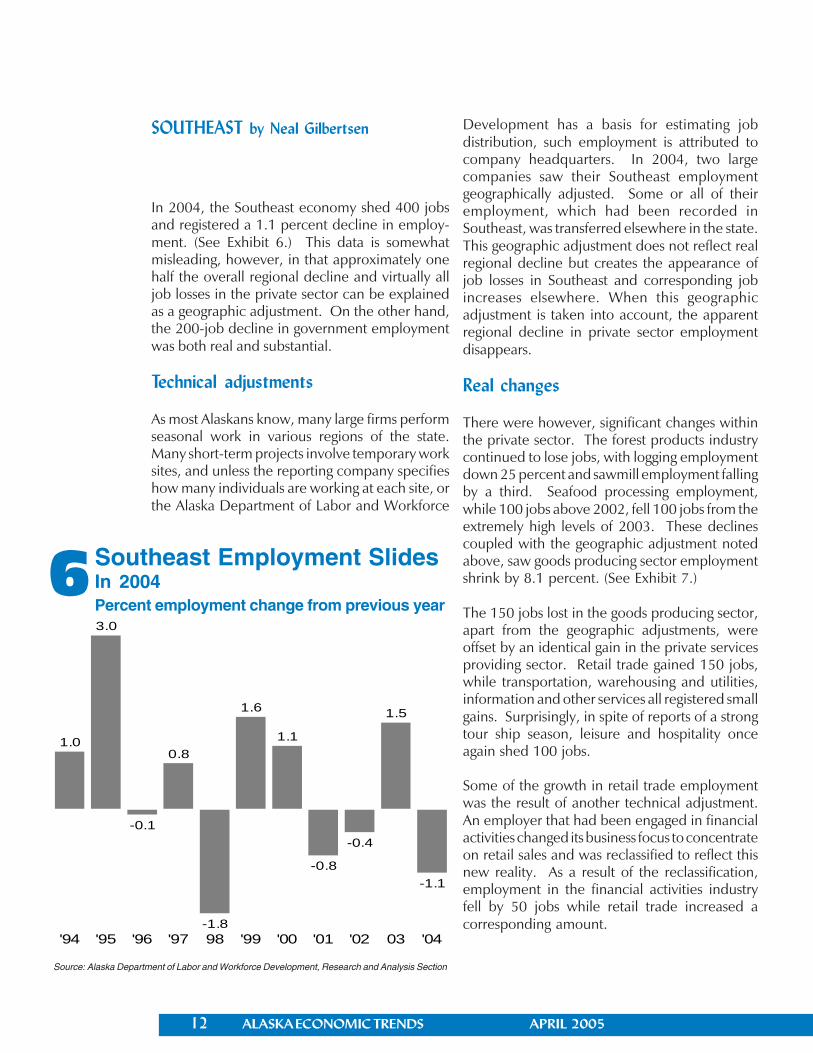
There were however, significant changes withinthe private sector. The forest products industrycontinued to lose jobs, with logging employmentdown 25 percent and sawmill employment fallingby a third. Seafood processing employment,while 100 jobs above 2002, fell 100 jobs from theextremely high levels of 2003. These declinescoupled with the geographic adjustment notedabove, saw goods producing sector employmentshrink by 8.1 percent. (See Exhibit 7.)
The 150 jobs lost in the goods producing sector,apart from the geographic adjustments, wereoffset by an identical gain in the private servicesproviding sector. Retail trade gained 150 jobs,while transportation, warehousing and utilities,information and other services all registered smallgains. Surprisingly, in spite of reports of a strongtour ship season, leisure and hospitality onceagain shed 100 jobs.
Some of the growth in retail trade employmentwas the result of another technical adjustment.An employer that had been engaged in financialactivities changed its business focus to concentrateon retail sales and was reclassified to reflect thisnew reality. As a result of the reclassification,employment in the financial activities industryfell by 50 jobs while retail trade increased acorresponding amount.
ALASKA ECONOMIC TRENDS APRIL 2005 13
7Percent
2003 2004 Change Change
Total Nonfarm 36,350 35,950 -400 -1.1%Goods Producing 4,300 3,950 -350 -8.1%Service Providing 32,050 32,000 -50 -0.2%Natural Resources/Mining 650 600 -50 -7.7% Logging 400 300 -100 -25.0% Mining 300 300 0 0.0%Construction 1,700 1,500 -200 -11.8%Manufacturing 1,950 1,850 -100 -5.1% Seafood Product Prep 1,550 1,450 -100 -6.5%Trade/Transportation/Utilities 6,950 7,150 200 2.9% Retail Trade 4,400 4,550 150 3.4%Information 550 600 50 9.1%Financial Activities 1,300 1,250 -50 -3.8%Prof and Business Services 1,350 1,350 0 0.0%Educational and Health Services 3,450 3,450 0 0.0% Health Care 2,100 2,100 0 0.0%Leisure and Hospitality 3,550 3,450 -100 -2.8%Other Services 1,150 1,200 50 4.3%Government 13,750 13,550 -200 -1.5% Federal Government 1,950 2,050 100 5.1% State Government 5,650 5,450 -200 -3.5% Local Government 6,150 6,050 -100 -1.6% Tribal Government 700 800 100 14.3%
Benchmark: March 2004Prepared in part with funding from the Employment Security Division.
Source: Alaska Department of Labor and Workforce Development,Research and Analysis Section
Wage and Salary EmploymentSoutheast — 2003-2004
The other 100 jobs gained in retail trade may wellbe tourist related. General merchandiseemployment, which includes large box stores likeWal-Mart and Fred Meyer, fell by 50 jobs, whilefood and beverage store employment increasedby an offsetting 50. This would seem to indicatethat most of overall job increase in retail trade wasdue to hiring at smaller outlets, many of whichserve the tourist trade. Even more convincing isthe fact that the industry’s employment showed ahighly seasonal pattern with May 2004 running350 jobs ahead of 2003, while June, July andAugust were all 300 above year ago levels. Januaryand December, by contrast, saw lower levels ofemployment, with 50 fewer retail jobs than 2003.
Fishing
The 2004 Southeast salmon season produced aharvest estimated at 295 million pounds with apreliminary value $58.5 million. This compareswith a 2003 harvest of 298 million pounds worth$63.7 million. Trollers saw king and coho salmonbringing higher prices than 2003, while driftnetters and seiners saw lower prices for sockeye,chum and pink salmon. Participation in both theseine and drift net fisheries continued to declinewith approximately 200 seine and 330 drift netvessels fishing in 2004. This represents a dramaticreduction in both fishing effort and employmentopportunities from 2000 when 356 seine and422 drift net permit holders harvested salmon.
Government declines
In 2004, a frugal state budget and tightenedrevenue sharing contributed to declines in bothstate and local government employment. Juneauaccounted for most of the 200 job losses in stategovernment, while the 100-job reduction in localgovernment was spread across the region. Slightlyincreased federal hiring mitigated the overalllosses.
Population also declines
Southeast has experienced job losses for three ofthe last four years. It has also been losing population.
Since 2000, the regional population has declinedby 3.4 percent, falling from 73,082 in that year to70,622 in 2004. Southern Southeast has sufferedthe greatest part of this population loss, withKetchikan, Prince of Wales-Outer Ketchikan andWrangell-Petersburg losing a combined total of2,075 residents, which amounts to 84 percent ofthe regional decline.
That this population decline took place in themost timber dependent parts of Southeast shouldcome as no surprise. But these dynamics appearto be changing and becoming more inclusive.From 2003 to 2004, the area wide population fell
14 ALASKA ECONOMIC TRENDS APRIL 2005
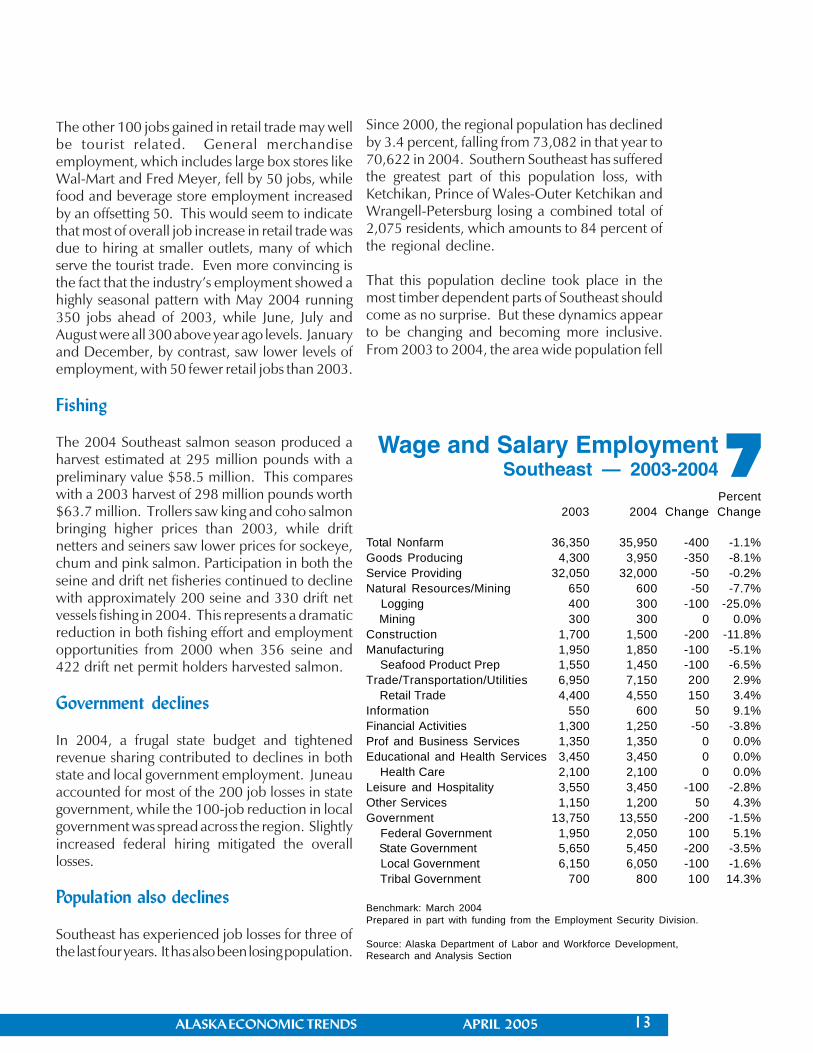
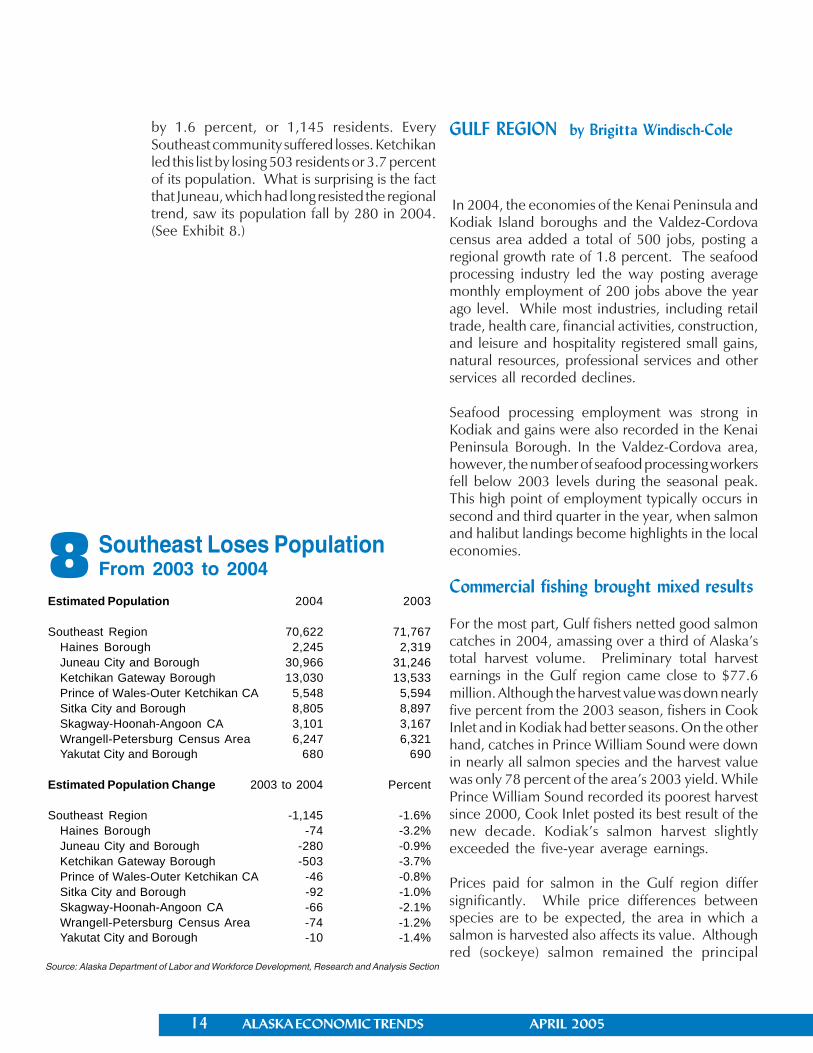
Southeast Loses PopulationFrom 2003 to 20048
Source: Alaska Department of Labor and Workforce Development, Research and Analysis Section
Estimated Population 2004 2003
Southeast Region 70,622 71,767Haines Borough 2,245 2,319Juneau City and Borough 30,966 31,246Ketchikan Gateway Borough 13,030 13,533Prince of Wales-Outer Ketchikan CA 5,548 5,594Sitka City and Borough 8,805 8,897Skagway-Hoonah-Angoon CA 3,101 3,167Wrangell-Petersburg Census Area 6,247 6,321Yakutat City and Borough 680 690
Estimated Population Change 2003 to 2004 Percent
Southeast Region -1,145 -1.6%Haines Borough -74 -3.2%Juneau City and Borough -280 -0.9%Ketchikan Gateway Borough -503 -3.7%Prince of Wales-Outer Ketchikan CA -46 -0.8%Sitka City and Borough -92 -1.0%Skagway-Hoonah-Angoon CA -66 -2.1%Wrangell-Petersburg Census Area -74 -1.2%Yakutat City and Borough -10 -1.4%
GULF REGION by Brigitta Windisch-Cole
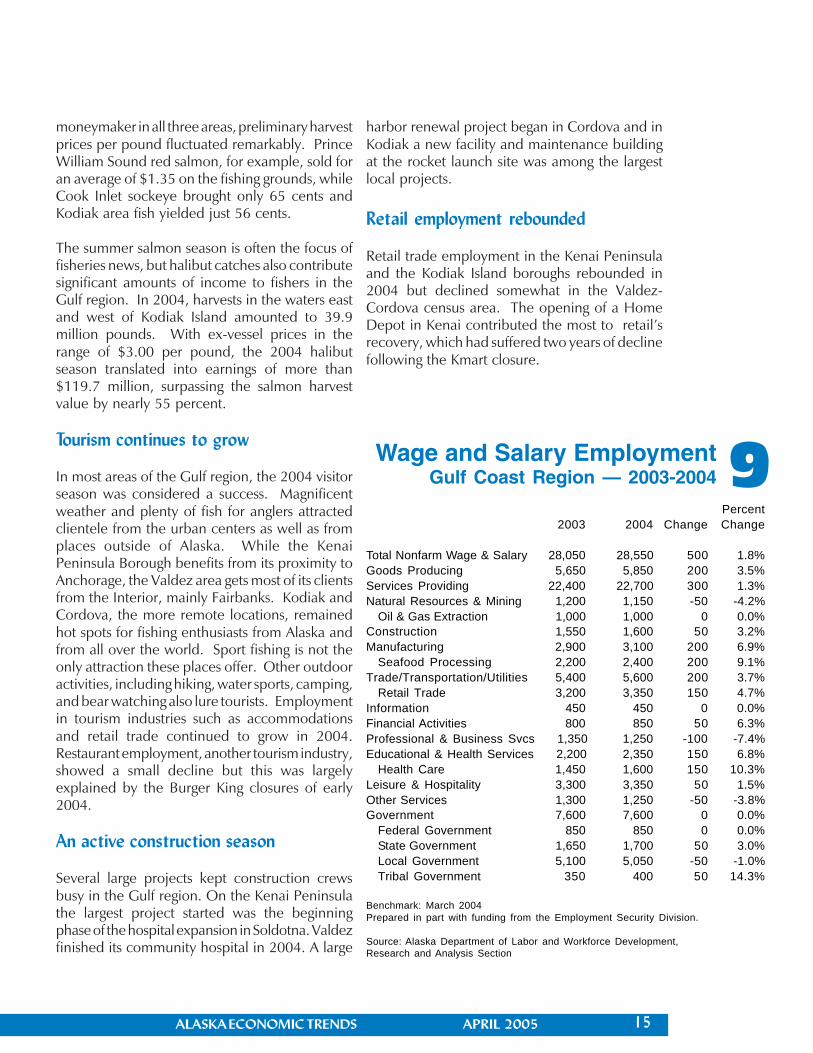
In 2004, the economies of the Kenai Peninsula andKodiak Island boroughs and the Valdez-Cordovacensus area added a total of 500 jobs, posting aregional growth rate of 1.8 percent. The seafoodprocessing industry led the way posting averagemonthly employment of 200 jobs above the yearago level. While most industries, including retailtrade, health care, financial activities, construction,and leisure and hospitality registered small gains,natural resources, professional services and otherservices all recorded declines.
Seafood processing employment was strong inKodiak and gains were also recorded in the KenaiPeninsula Borough. In the Valdez-Cordova area,however, the number of seafood processing workersfell below 2003 levels during the seasonal peak.This high point of employment typically occurs insecond and third quarter in the year, when salmonand halibut landings become highlights in the localeconomies.
Commercial fishing brought mixed results
For the most part, Gulf fishers netted good salmoncatches in 2004, amassing over a third of Alaska’stotal harvest volume. Preliminary total harvestearnings in the Gulf region came close to $77.6million. Although the harvest value was down nearlyfive percent from the 2003 season, fishers in CookInlet and in Kodiak had better seasons. On the otherhand, catches in Prince William Sound were downin nearly all salmon species and the harvest valuewas only 78 percent of the area’s 2003 yield. WhilePrince William Sound recorded its poorest harvestsince 2000, Cook Inlet posted its best result of thenew decade. Kodiak’s salmon harvest slightlyexceeded the five-year average earnings.
Prices paid for salmon in the Gulf region differsignificantly. While price differences betweenspecies are to be expected, the area in which asalmon is harvested also affects its value. Althoughred (sockeye) salmon remained the principal
by 1.6 percent, or 1,145 residents. EverySoutheast community suffered losses. Ketchikanled this list by losing 503 residents or 3.7 percentof its population. What is surprising is the factthat Juneau, which had long resisted the regionaltrend, saw its population fall by 280 in 2004.(See Exhibit 8.)
ALASKA ECONOMIC TRENDS APRIL 2005 15
9
moneymaker in all three areas, preliminary harvestprices per pound fluctuated remarkably. PrinceWilliam Sound red salmon, for example, sold foran average of $1.35 on the fishing grounds, whileCook Inlet sockeye brought only 65 cents andKodiak area fish yielded just 56 cents.
The summer salmon season is often the focus offisheries news, but halibut catches also contributesignificant amounts of income to fishers in theGulf region. In 2004, harvests in the waters eastand west of Kodiak Island amounted to 39.9million pounds. With ex-vessel prices in therange of $3.00 per pound, the 2004 halibutseason translated into earnings of more than$119.7 million, surpassing the salmon harvestvalue by nearly 55 percent.
Tourism continues to grow
In most areas of the Gulf region, the 2004 visitorseason was considered a success. Magnificentweather and plenty of fish for anglers attractedclientele from the urban centers as well as fromplaces outside of Alaska. While the KenaiPeninsula Borough benefits from its proximity toAnchorage, the Valdez area gets most of its clientsfrom the Interior, mainly Fairbanks. Kodiak andCordova, the more remote locations, remainedhot spots for fishing enthusiasts from Alaska andfrom all over the world. Sport fishing is not theonly attraction these places offer. Other outdooractivities, including hiking, water sports, camping,and bear watching also lure tourists. Employmentin tourism industries such as accommodationsand retail trade continued to grow in 2004.Restaurant employment, another tourism industry,showed a small decline but this was largelyexplained by the Burger King closures of early2004.
An active construction season
Several large projects kept construction crewsbusy in the Gulf region. On the Kenai Peninsulathe largest project started was the beginningphase of the hospital expansion in Soldotna. Valdezfinished its community hospital in 2004. A large
harbor renewal project began in Cordova and inKodiak a new facility and maintenance buildingat the rocket launch site was among the largestlocal projects.
Retail employment rebounded
Retail trade employment in the Kenai Peninsulaand the Kodiak Island boroughs rebounded in2004 but declined somewhat in the Valdez-Cordova census area. The opening of a HomeDepot in Kenai contributed the most to retail’srecovery, which had suffered two years of declinefollowing the Kmart closure.
Percent2003 2004 Change Change
Total Nonfarm Wage & Salary 28,050 28,550 500 1.8%Goods Producing 5,650 5,850 200 3.5%Services Providing 22,400 22,700 300 1.3%Natural Resources & Mining 1,200 1,150 -50 -4.2%
Oil & Gas Extraction 1,000 1,000 0 0.0%Construction 1,550 1,600 50 3.2%Manufacturing 2,900 3,100 200 6.9%
Seafood Processing 2,200 2,400 200 9.1%Trade/Transportation/Utilities 5,400 5,600 200 3.7%
Retail Trade 3,200 3,350 150 4.7%Information 450 450 0 0.0%Financial Activities 800 850 50 6.3%Professional & Business Svcs 1,350 1,250 -100 -7.4%Educational & Health Services 2,200 2,350 150 6.8%
Health Care 1,450 1,600 150 10.3%Leisure & Hospitality 3,300 3,350 50 1.5%Other Services 1,300 1,250 -50 -3.8%Government 7,600 7,600 0 0.0%
Federal Government 850 850 0 0.0%State Government 1,650 1,700 50 3.0%Local Government 5,100 5,050 -50 -1.0%Tribal Government 350 400 50 14.3%
Benchmark: March 2004Prepared in part with funding from the Employment Security Division.
Source: Alaska Department of Labor and Workforce Development,Research and Analysis Section
Wage and Salary EmploymentGulf Coast Region — 2003-2004
16 ALASKA ECONOMIC TRENDS APRIL 2005
Other industry developments
Industries such as financial activities and healthcare also contributed to regional job growth in2004. Some of the growth was supply drivenwhile some was based on increased demand.The expansion of banking services, for example,points to a high degree of competition in financialservices. Health care growth, on the other hand,would appear to be driven by consumer demand,as the demographics in most of the communitiesof the Gulf region reflect an aging population.
As mentioned earlier, some industries recordedjob losses in 2004. The workforce in logging, anatural resource industry, retrenched. In Kodiak,the Afognak logging camp changed operators andin the Kenai Peninsula the wood chip exporttrade with Korea nearly collapsed. Bothprofessional and other services employmentshowed declines but some of these were superficialand were related to changes in industryclassification.
Percent2003 2004 Change Change
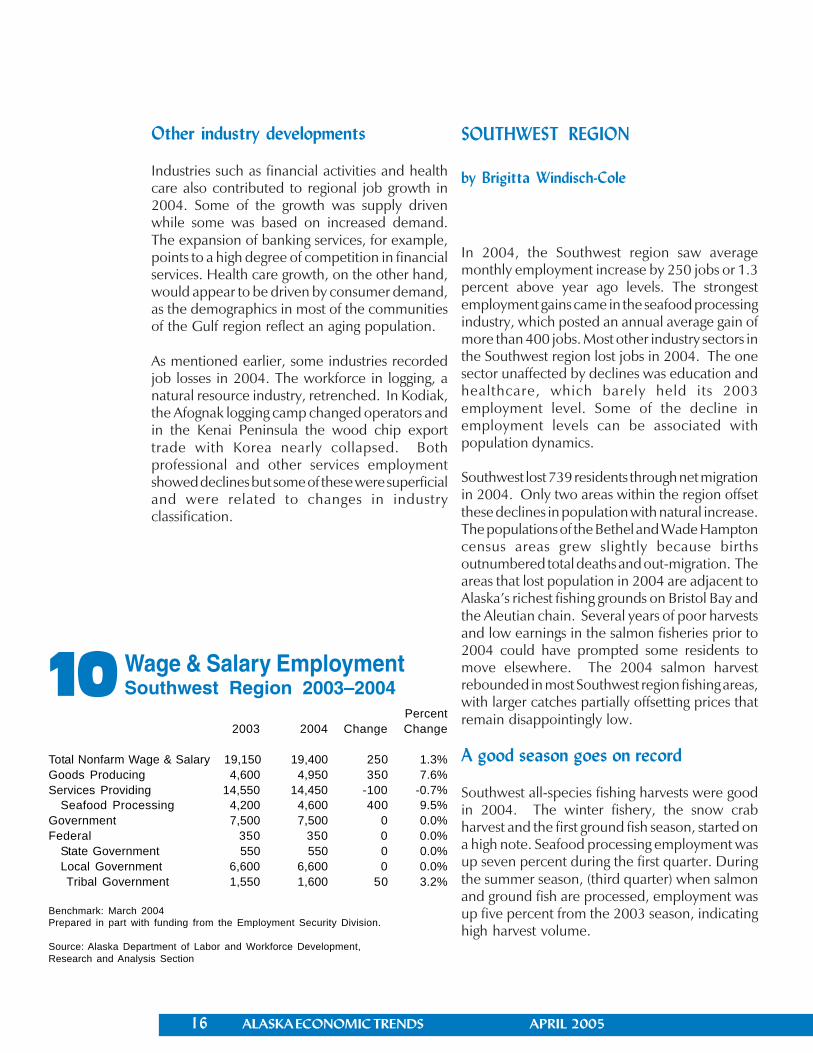
Total Nonfarm Wage & Salary 19,150 19,400 250 1.3%Goods Producing 4,600 4,950 350 7.6%Services Providing 14,550 14,450 -100 -0.7%
Seafood Processing 4,200 4,600 400 9.5%Government 7,500 7,500 0 0.0%Federal 350 350 0 0.0%
State Government 550 550 0 0.0%Local Government 6,600 6,600 0 0.0%Tribal Government 1,550 1,600 50 3.2%
Benchmark: March 2004Prepared in part with funding from the Employment Security Division.
Source: Alaska Department of Labor and Workforce Development,Research and Analysis Section
Wage & Salary EmploymentSouthwest Region 2003–200410
SOUTHWEST REGION
by Brigitta Windisch-Cole
In 2004, the Southwest region saw averagemonthly employment increase by 250 jobs or 1.3percent above year ago levels. The strongestemployment gains came in the seafood processingindustry, which posted an annual average gain ofmore than 400 jobs. Most other industry sectors inthe Southwest region lost jobs in 2004. The onesector unaffected by declines was education andhealthcare, which barely held its 2003employment level. Some of the decline inemployment levels can be associated withpopulation dynamics.
Southwest lost 739 residents through net migrationin 2004. Only two areas within the region offsetthese declines in population with natural increase.The populations of the Bethel and Wade Hamptoncensus areas grew slightly because birthsoutnumbered total deaths and out-migration. Theareas that lost population in 2004 are adjacent toAlaska’s richest fishing grounds on Bristol Bay andthe Aleutian chain. Several years of poor harvestsand low earnings in the salmon fisheries prior to2004 could have prompted some residents tomove elsewhere. The 2004 salmon harvestrebounded in most Southwest region fishing areas,with larger catches partially offsetting prices thatremain disappointingly low.
A good season goes on record
Southwest all-species fishing harvests were goodin 2004. The winter fishery, the snow crabharvest and the first ground fish season, started ona high note. Seafood processing employment wasup seven percent during the first quarter. Duringthe summer season, (third quarter) when salmonand ground fish are processed, employment wasup five percent from the 2003 season, indicatinghigh harvest volume.
ALASKA ECONOMIC TRENDS APRIL 2005 17
More than 42 percent of the state’s total 2004salmon harvest earnings was generated withinthe Southwest region. The rich fishing grounds ofBristol Bay produced nearly one third of totalearnings from the all-species salmon fishery, anddominated the red salmon catch with a 70 percentshare in volume. Earnings were up in most otherSouthwest fishing areas, and only Chignikexperienced a decline from the 2003 season.Chignik fishers landed only 62 percent of the2003 season’s volume. Overall, sockeye salmonprices held close to last year’s prices and sheervolume turned the season into a success, makingit the second best in the past five years.
NORTHERN REGION
by Brigitta Windisch-Cole
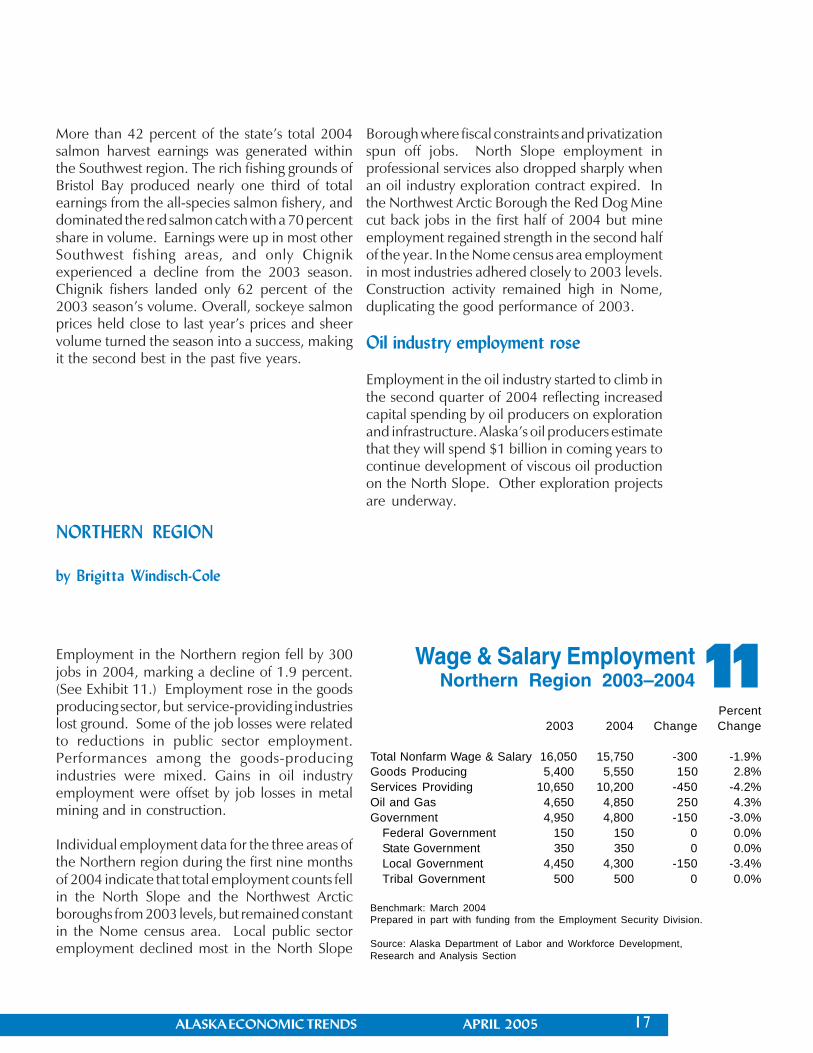
Employment in the Northern region fell by 300jobs in 2004, marking a decline of 1.9 percent.(See Exhibit 11.) Employment rose in the goodsproducing sector, but service-providing industrieslost ground. Some of the job losses were relatedto reductions in public sector employment.Performances among the goods-producingindustries were mixed. Gains in oil industryemployment were offset by job losses in metalmining and in construction.
Individual employment data for the three areas ofthe Northern region during the first nine monthsof 2004 indicate that total employment counts fellin the North Slope and the Northwest Arcticboroughs from 2003 levels, but remained constantin the Nome census area. Local public sectoremployment declined most in the North Slope
Borough where fiscal constraints and privatizationspun off jobs. North Slope employment inprofessional services also dropped sharply whenan oil industry exploration contract expired. Inthe Northwest Arctic Borough the Red Dog Minecut back jobs in the first half of 2004 but mineemployment regained strength in the second halfof the year. In the Nome census area employmentin most industries adhered closely to 2003 levels.Construction activity remained high in Nome,duplicating the good performance of 2003.
Oil industry employment rose
Employment in the oil industry started to climb inthe second quarter of 2004 reflecting increasedcapital spending by oil producers on explorationand infrastructure. Alaska’s oil producers estimatethat they will spend $1 billion in coming years tocontinue development of viscous oil productionon the North Slope. Other exploration projectsare underway.
Percent2003 2004 Change Change
Total Nonfarm Wage & Salary 16,050 15,750 -300 -1.9%Goods Producing 5,400 5,550 150 2.8%Services Providing 10,650 10,200 -450 -4.2%Oil and Gas 4,650 4,850 250 4.3%Government 4,950 4,800 -150 -3.0%
Federal Government 150 150 0 0.0%State Government 350 350 0 0.0%Local Government 4,450 4,300 -150 -3.4%Tribal Government 500 500 0 0.0%
Benchmark: March 2004Prepared in part with funding from the Employment Security Division.
Source: Alaska Department of Labor and Workforce Development,Research and Analysis Section
Wage & Salary EmploymentNorthern Region 2003–200411
18 ALASKA ECONOMIC TRENDS APRIL 2005
1
Benchmarkby
Dan Robinson Economist
Wage and Salary EmploymentAlaska 2003
Sources: Alaska Department of Labor and Workforce Development, Research and Analysis Section,in cooperation with the U.S. Bureau of Labor Statistics
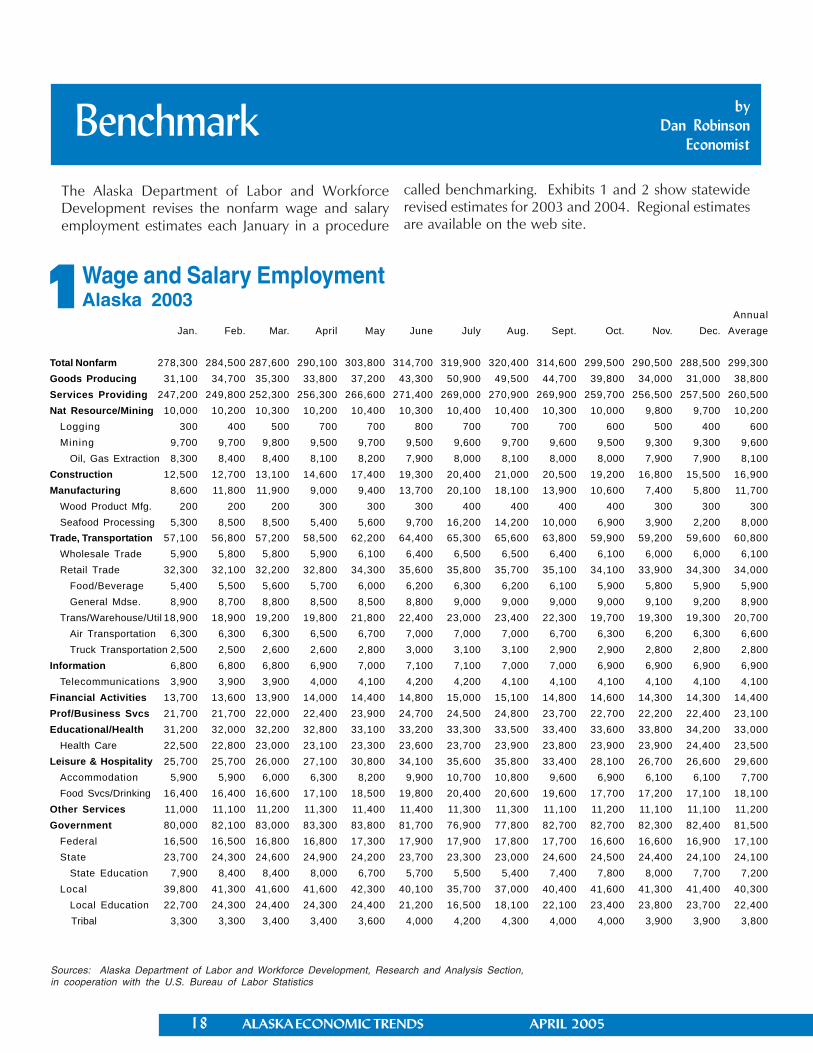
The Alaska Department of Labor and WorkforceDevelopment revises the nonfarm wage and salaryemployment estimates each January in a procedure
called benchmarking. Exhibits 1 and 2 show statewiderevised estimates for 2003 and 2004. Regional estimatesare available on the web site.
AnnualJan. Feb. Mar. April May June July Aug. Sept. Oct. Nov. Dec. Average
Total Nonfarm 278,300 284,500 287,600 290,100 303,800 314,700 319,900 320,400 314,600 299,500 290,500 288,500 299,300Goods Producing 31,100 34,700 35,300 33,800 37,200 43,300 50,900 49,500 44,700 39,800 34,000 31,000 38,800Services Providing 247,200 249,800 252,300 256,300 266,600 271,400 269,000 270,900 269,900 259,700 256,500 257,500 260,500Nat Resource/Mining 10,000 10,200 10,300 10,200 10,400 10,300 10,400 10,400 10,300 10,000 9,800 9,700 10,200
Logging 300 400 500 700 700 800 700 700 700 600 500 400 600Mining 9,700 9,700 9,800 9,500 9,700 9,500 9,600 9,700 9,600 9,500 9,300 9,300 9,600
Oil, Gas Extraction 8,300 8,400 8,400 8,100 8,200 7,900 8,000 8,100 8,000 8,000 7,900 7,900 8,100Construction 12,500 12,700 13,100 14,600 17,400 19,300 20,400 21,000 20,500 19,200 16,800 15,500 16,900Manufacturing 8,600 11,800 11,900 9,000 9,400 13,700 20,100 18,100 13,900 10,600 7,400 5,800 11,700
Wood Product Mfg. 200 200 200 300 300 300 400 400 400 400 300 300 300Seafood Processing 5,300 8,500 8,500 5,400 5,600 9,700 16,200 14,200 10,000 6,900 3,900 2,200 8,000
Trade, Transportation 57,100 56,800 57,200 58,500 62,200 64,400 65,300 65,600 63,800 59,900 59,200 59,600 60,800Wholesale Trade 5,900 5,800 5,800 5,900 6,100 6,400 6,500 6,500 6,400 6,100 6,000 6,000 6,100Retail Trade 32,300 32,100 32,200 32,800 34,300 35,600 35,800 35,700 35,100 34,100 33,900 34,300 34,000
Food/Beverage 5,400 5,500 5,600 5,700 6,000 6,200 6,300 6,200 6,100 5,900 5,800 5,900 5,900General Mdse. 8,900 8,700 8,800 8,500 8,500 8,800 9,000 9,000 9,000 9,000 9,100 9,200 8,900
Trans/Warehouse/Util 18,900 18,900 19,200 19,800 21,800 22,400 23,000 23,400 22,300 19,700 19,300 19,300 20,700Air Transportation 6,300 6,300 6,300 6,500 6,700 7,000 7,000 7,000 6,700 6,300 6,200 6,300 6,600Truck Transportation 2,500 2,500 2,600 2,600 2,800 3,000 3,100 3,100 2,900 2,900 2,800 2,800 2,800
Information 6,800 6,800 6,800 6,900 7,000 7,100 7,100 7,000 7,000 6,900 6,900 6,900 6,900Telecommunications 3,900 3,900 3,900 4,000 4,100 4,200 4,200 4,100 4,100 4,100 4,100 4,100 4,100
Financial Activities 13,700 13,600 13,900 14,000 14,400 14,800 15,000 15,100 14,800 14,600 14,300 14,300 14,400Prof/Business Svcs 21,700 21,700 22,000 22,400 23,900 24,700 24,500 24,800 23,700 22,700 22,200 22,400 23,100Educational/Health 31,200 32,000 32,200 32,800 33,100 33,200 33,300 33,500 33,400 33,600 33,800 34,200 33,000
Health Care 22,500 22,800 23,000 23,100 23,300 23,600 23,700 23,900 23,800 23,900 23,900 24,400 23,500Leisure & Hospitality 25,700 25,700 26,000 27,100 30,800 34,100 35,600 35,800 33,400 28,100 26,700 26,600 29,600
Accommodation 5,900 5,900 6,000 6,300 8,200 9,900 10,700 10,800 9,600 6,900 6,100 6,100 7,700Food Svcs/Drinking 16,400 16,400 16,600 17,100 18,500 19,800 20,400 20,600 19,600 17,700 17,200 17,100 18,100
Other Services 11,000 11,100 11,200 11,300 11,400 11,400 11,300 11,300 11,100 11,200 11,100 11,100 11,200Government 80,000 82,100 83,000 83,300 83,800 81,700 76,900 77,800 82,700 82,700 82,300 82,400 81,500
Federal 16,500 16,500 16,800 16,800 17,300 17,900 17,900 17,800 17,700 16,600 16,600 16,900 17,100State 23,700 24,300 24,600 24,900 24,200 23,700 23,300 23,000 24,600 24,500 24,400 24,100 24,100
State Education 7,900 8,400 8,400 8,000 6,700 5,700 5,500 5,400 7,400 7,800 8,000 7,700 7,200Local 39,800 41,300 41,600 41,600 42,300 40,100 35,700 37,000 40,400 41,600 41,300 41,400 40,300
Local Education 22,700 24,300 24,400 24,300 24,400 21,200 16,500 18,100 22,100 23,400 23,800 23,700 22,400 Tribal 3,300 3,300 3,400 3,400 3,600 4,000 4,200 4,300 4,000 4,000 3,900 3,900 3,800
ALASKA ECONOMIC TRENDS APRIL 2005 19
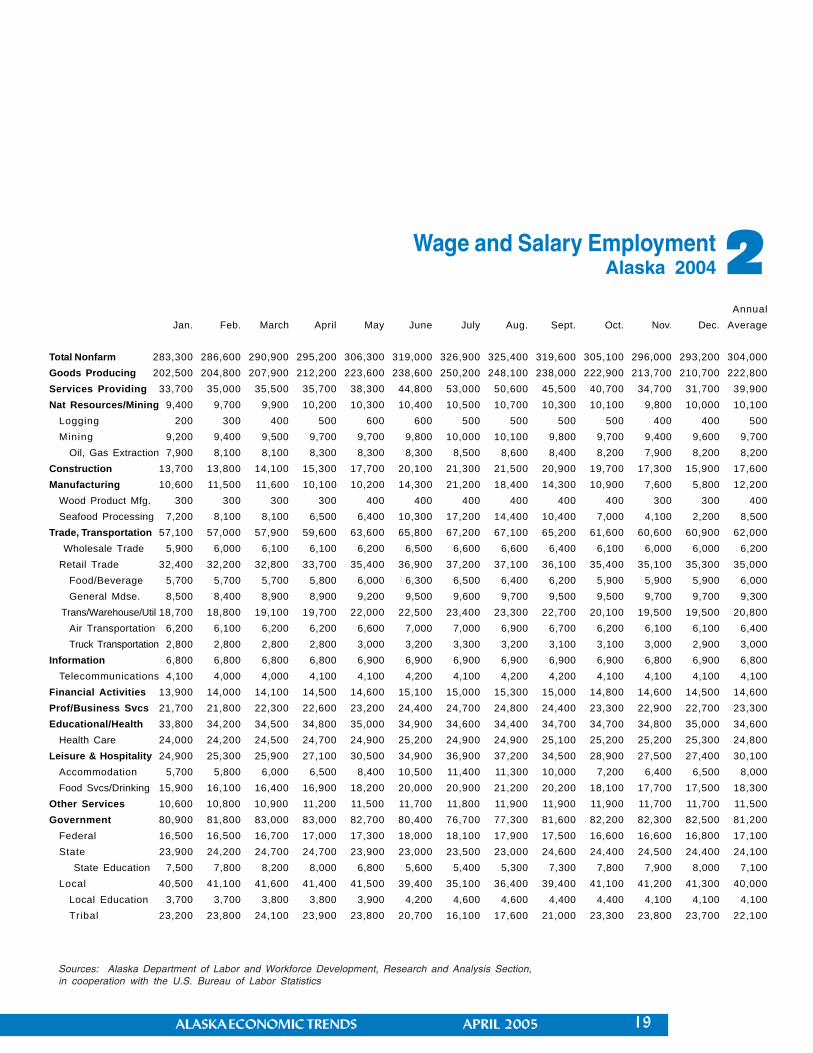
2Wage and Salary EmploymentAlaska 2004
Sources: Alaska Department of Labor and Workforce Development, Research and Analysis Section,in cooperation with the U.S. Bureau of Labor Statistics
AnnualJan. Feb. March April May June July Aug. Sept. Oct. Nov. Dec. Average
Total Nonfarm 283,300 286,600 290,900 295,200 306,300 319,000 326,900 325,400 319,600 305,100 296,000 293,200 304,000Goods Producing 202,500 204,800 207,900 212,200 223,600 238,600 250,200 248,100 238,000 222,900 213,700 210,700 222,800Services Providing 33,700 35,000 35,500 35,700 38,300 44,800 53,000 50,600 45,500 40,700 34,700 31,700 39,900Nat Resources/Mining 9,400 9,700 9,900 10,200 10,300 10,400 10,500 10,700 10,300 10,100 9,800 10,000 10,100
Logging 200 300 400 500 600 600 500 500 500 500 400 400 500Mining 9,200 9,400 9,500 9,700 9,700 9,800 10,000 10,100 9,800 9,700 9,400 9,600 9,700
Oil, Gas Extraction 7,900 8,100 8,100 8,300 8,300 8,300 8,500 8,600 8,400 8,200 7,900 8,200 8,200Construction 13,700 13,800 14,100 15,300 17,700 20,100 21,300 21,500 20,900 19,700 17,300 15,900 17,600Manufacturing 10,600 11,500 11,600 10,100 10,200 14,300 21,200 18,400 14,300 10,900 7,600 5,800 12,200
Wood Product Mfg. 300 300 300 300 400 400 400 400 400 400 300 300 400Seafood Processing 7,200 8,100 8,100 6,500 6,400 10,300 17,200 14,400 10,400 7,000 4,100 2,200 8,500
Trade, Transportation 57,100 57,000 57,900 59,600 63,600 65,800 67,200 67,100 65,200 61,600 60,600 60,900 62,000 Wholesale Trade 5,900 6,000 6,100 6,100 6,200 6,500 6,600 6,600 6,400 6,100 6,000 6,000 6,200Retail Trade 32,400 32,200 32,800 33,700 35,400 36,900 37,200 37,100 36,100 35,400 35,100 35,300 35,000
Food/Beverage 5,700 5,700 5,700 5,800 6,000 6,300 6,500 6,400 6,200 5,900 5,900 5,900 6,000General Mdse. 8,500 8,400 8,900 8,900 9,200 9,500 9,600 9,700 9,500 9,500 9,700 9,700 9,300
Trans/Warehouse/Util 18,700 18,800 19,100 19,700 22,000 22,500 23,400 23,300 22,700 20,100 19,500 19,500 20,800Air Transportation 6,200 6,100 6,200 6,200 6,600 7,000 7,000 6,900 6,700 6,200 6,100 6,100 6,400Truck Transportation 2,800 2,800 2,800 2,800 3,000 3,200 3,300 3,200 3,100 3,100 3,000 2,900 3,000
Information 6,800 6,800 6,800 6,800 6,900 6,900 6,900 6,900 6,900 6,900 6,800 6,900 6,800Telecommunications 4,100 4,000 4,000 4,100 4,100 4,200 4,100 4,200 4,200 4,100 4,100 4,100 4,100
Financial Activities 13,900 14,000 14,100 14,500 14,600 15,100 15,000 15,300 15,000 14,800 14,600 14,500 14,600Prof/Business Svcs 21,700 21,800 22,300 22,600 23,200 24,400 24,700 24,800 24,400 23,300 22,900 22,700 23,300Educational/Health 33,800 34,200 34,500 34,800 35,000 34,900 34,600 34,400 34,700 34,700 34,800 35,000 34,600
Health Care 24,000 24,200 24,500 24,700 24,900 25,200 24,900 24,900 25,100 25,200 25,200 25,300 24,800Leisure & Hospitality 24,900 25,300 25,900 27,100 30,500 34,900 36,900 37,200 34,500 28,900 27,500 27,400 30,100
Accommodation 5,700 5,800 6,000 6,500 8,400 10,500 11,400 11,300 10,000 7,200 6,400 6,500 8,000Food Svcs/Drinking 15,900 16,100 16,400 16,900 18,200 20,000 20,900 21,200 20,200 18,100 17,700 17,500 18,300
Other Services 10,600 10,800 10,900 11,200 11,500 11,700 11,800 11,900 11,900 11,900 11,700 11,700 11,500Government 80,900 81,800 83,000 83,000 82,700 80,400 76,700 77,300 81,600 82,200 82,300 82,500 81,200
Federal 16,500 16,500 16,700 17,000 17,300 18,000 18,100 17,900 17,500 16,600 16,600 16,800 17,100State 23,900 24,200 24,700 24,700 23,900 23,000 23,500 23,000 24,600 24,400 24,500 24,400 24,100
State Education 7,500 7,800 8,200 8,000 6,800 5,600 5,400 5,300 7,300 7,800 7,900 8,000 7,100Local 40,500 41,100 41,600 41,400 41,500 39,400 35,100 36,400 39,400 41,100 41,200 41,300 40,000
Local Education 3,700 3,700 3,800 3,800 3,900 4,200 4,600 4,600 4,400 4,400 4,100 4,100 4,100Tribal 23,200 23,800 24,100 23,900 23,800 20,700 16,100 17,600 21,000 23,300 23,800 23,700 22,100
20 ALASKA ECONOMIC TRENDS APRIL 2005
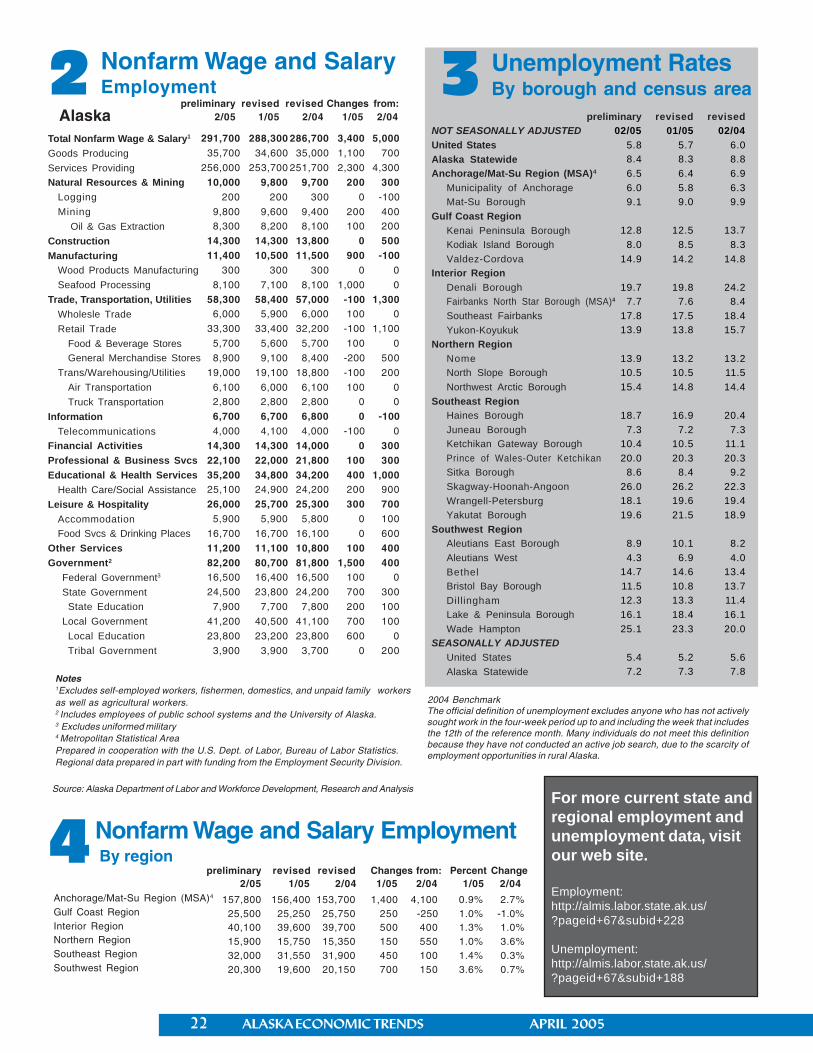
February Posts EmploymentGains Over Year Ago
AlaskaEmployment
Sceneby
Brigitta Windisch-Cole
Economist
Unemployment rate is lower also
Alaska’s February employment reportshowed an annual growth rate of 1.7percent or 5,000 more jobs than inFebruary 2004. (See Exhibit 2.) The
unemployment rate was relatively low at 8.4percent, which meant that about 28,000 Alaskaworkers were temporarily laid off or were lookingfor work. (See Exhibit 3.) This was almost 1,000fewer than February 2004.
Seasonal hiring begins
February marks the turnaround in Alaska’s seasonaleconomy, the month when many industry sectorsstart adding workers after steadily cutting backthrough fall and winter. Seven out of the state’seleven broad sectors saw at least small increasesin February, with the biggest increases coming inmanufacturing and government. In total, thestate’s workforce grew by 3,400 in February. Theincrease matches the 3,400 jobs added in February2004, but is substantially smaller than the 6,200jobs added in 2003. The main reason for thedifference is that seafood processors addedworkers earlier in 2004 and 2005 making for asmaller January to February increase.
Most industry sectors point at growth
Over-the-year balances reveal that employmenthas either grown or remained constant in most
industry sectors. Robust growth rates, rangingbetween 2.8 and 3.7 percent, were recorded inconstruction, leisure and hospitality, retail trade,natural resources (oil industry related), and otherservices. Jobs in retail trade rose by 1,100 and ledoverall job creation. Employment opportunitiesin newly constructed retail space in the FairbanksNorth Star and the Mat-Su boroughs accountedfor much of this gain.
Professional and business services, education andhealth care, and financial activities expanded at amore moderate pace, with growth rates between1.4 and 2.9 percent. While health care growthwas somewhat slower than in recent months, theindustry still added an impressive 900 jobs.Employment in both manufacturing and theinformation industries fell by 100. Governmentadded 400 jobs for a modest over-the-year growthrate of 0.5 percent. While seafood processingemployment neared 2004 levels, some of the joblosses in manufacturing were due to cutbacks atthe Nikiski chemical plant.
The winter fishery starts on a high note
As usual, the start of the winter fishery fueled theseasonal turnaround in the rest of Alaska’seconomy. The winter crab harvests and groundfishseasons require the hiring of seafood processingcrews. In February, the seafood industry
ALASKA ECONOMIC TRENDS APRIL 2005 21
Sources: U.S. Bureau of Labor Statistics
6.2%
4.6%
3.4%3.1%
2.1%
2.9%2.7%
1.5%1.5%1.0%
1.7%
2.8%
1.9%
2.7%2.6%
1990
1992
1994 199
6 19
98 2000
2002
2004
employed approximately 8,100 workers to processdeliveries from these fisheries. The snow crabseason, which lasted just five days, produced acatch of nearly 23 million pounds. Good weatherconditions and abundant and healthy stockscontributed to this success. As a result of the fleetreduction buy-back program, seventeen fewervessels participated in the 2005 crab fishery.Groundfish harvests also started in January andwill last until early spring. The pollock roe fisheryis the largest of these.
The closure of Agrium will haveconsequences
Agrium US Inc., a urea and ammonia producer,has announced it will close its Nikiski plant in thefall of 2005 because of high gas prices. This willcost the Kenai Peninsula Borough more than 200good-paying, year-round jobs. According to onestudy, the shutdown will result in a total loss of 685jobs stemming from the direct, indirect, andinduced effects of the closure. These will trickledown to former suppliers, contract partners, thepublic sector, and the rest of the Kenai Peninsulaand Alaska economy. Consultants havedetermined that this ripple effect will removeapproximately $77million from Alaska’s economy.This is about the amount Agrium spends forpurchases of feedstock and other supplies inaddition to its own payroll.
Anchorage’s consumer price indexmoderates pace
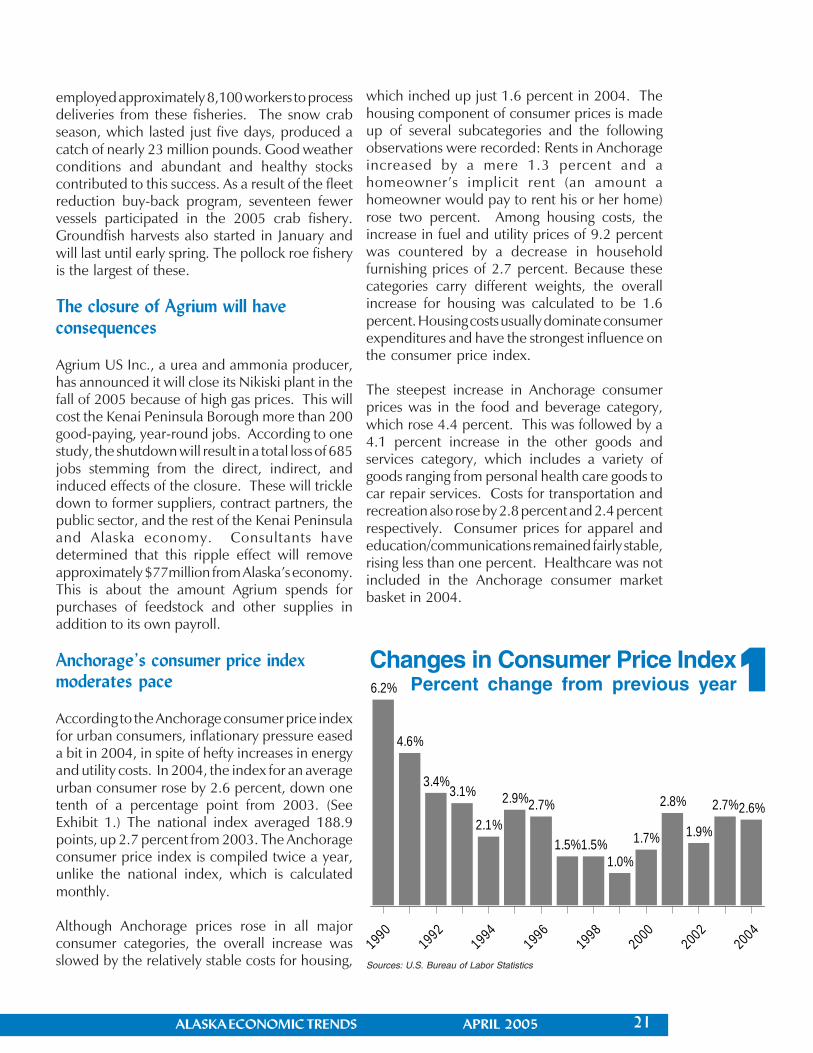
According to the Anchorage consumer price indexfor urban consumers, inflationary pressure easeda bit in 2004, in spite of hefty increases in energyand utility costs. In 2004, the index for an averageurban consumer rose by 2.6 percent, down onetenth of a percentage point from 2003. (SeeExhibit 1.) The national index averaged 188.9points, up 2.7 percent from 2003. The Anchorageconsumer price index is compiled twice a year,unlike the national index, which is calculatedmonthly.
Although Anchorage prices rose in all majorconsumer categories, the overall increase wasslowed by the relatively stable costs for housing,
which inched up just 1.6 percent in 2004. Thehousing component of consumer prices is madeup of several subcategories and the followingobservations were recorded: Rents in Anchorageincreased by a mere 1.3 percent and ahomeowner’s implicit rent (an amount ahomeowner would pay to rent his or her home)rose two percent. Among housing costs, theincrease in fuel and utility prices of 9.2 percentwas countered by a decrease in householdfurnishing prices of 2.7 percent. Because thesecategories carry different weights, the overallincrease for housing was calculated to be 1.6percent. Housing costs usually dominate consumerexpenditures and have the strongest influence onthe consumer price index.
The steepest increase in Anchorage consumerprices was in the food and beverage category,which rose 4.4 percent. This was followed by a4.1 percent increase in the other goods andservices category, which includes a variety ofgoods ranging from personal health care goods tocar repair services. Costs for transportation andrecreation also rose by 2.8 percent and 2.4 percentrespectively. Consumer prices for apparel andeducation/communications remained fairly stable,rising less than one percent. Healthcare was notincluded in the Anchorage consumer marketbasket in 2004.
1Changes in Consumer Price IndexPercent change from previous year
22 ALASKA ECONOMIC TRENDS APRIL 2005
Nonfarm Wage and SalaryEmployment2
291,700 288,300 286,700 3,400 5,00035,700 34,600 35,000 1,100 700
256,000 253,700 251,700 2,300 4,300
10,000 9,800 9,700 200 300200 200 300 0 -100
9,800 9,600 9,400 200 4008,300 8,200 8,100 100 200
14,300 14,300 13,800 0 50011,400 10,500 11,500 900 -100
300 300 300 0 0
8,100 7,100 8,100 1,000 0
58,300 58,400 57,000 -100 1,3006,000 5,900 6,000 100 0
33,300 33,400 32,200 -100 1,100
5,700 5,600 5,700 100 0
8,900 9,100 8,400 -200 500
19,000 19,100 18,800 -100 200
6,100 6,000 6,100 100 02,800 2,800 2,800 0 0
6,700 6,700 6,800 0 -1004,000 4,100 4,000 -100 0
14,300 14,300 14,000 0 30022,100 22,000 21,800 100 30035,200 34,800 34,200 400 1,00025,100 24,900 24,200 200 900
26,000 25,700 25,300 300 7005,900 5,900 5,800 0 100
16,700 16,700 16,100 0 600
11,200 11,100 10,800 100 40082,200 80,700 81,800 1,500 40016,500 16,400 16,500 100 0
24,500 23,800 24,200 700 300
7,900 7,700 7,800 200 100
41,200 40,500 41,100 700 100
23,800 23,200 23,800 600 0
3,900 3,900 3,700 0 200
Notes1Excludes self-employed workers, fishermen, domestics, and unpaid family workersas well as agricultural workers.2 Includes employees of public school systems and the University of Alaska.3 Excludes uniformed military4 Metropolitan Statistical AreaPrepared in cooperation with the U.S. Dept. of Labor, Bureau of Labor Statistics.Regional data prepared in part with funding from the Employment Security Division.
Alaskapreliminary revised revised Changes from:
2/05 1/05 2/04 1/05 2/04
Total Nonfarm Wage & Salary1
Goods ProducingServices ProvidingNatural Resources & Mining
LoggingMining
Oil & Gas ExtractionConstructionManufacturing
Wood Products ManufacturingSeafood Processing
Trade, Transportation, UtilitiesWholesle TradeRetail Trade
Food & Beverage StoresGeneral Merchandise Stores
Trans/Warehousing/UtilitiesAir TransportationTruck Transportation
InformationTelecommunications
Financial ActivitiesProfessional & Business SvcsEducational & Health Services
Health Care/Social AssistanceLeisure & Hospitality
AccommodationFood Svcs & Drinking Places
Other ServicesGovernment2
Federal Government3
State GovernmentState Education
Local GovernmentLocal EducationTribal Government
Source: Alaska Department of Labor and Workforce Development, Research and Analysis
3 Unemployment RatesBy borough and census area
preliminary revised revised02/05 01/05 02/04
5.8 5.7 6.08.4 8.3 8.86.5 6.4 6.96.0 5.8 6.39.1 9.0 9.9
12.8 12.5 13.78.0 8.5 8.3
14.9 14.2 14.8
19.7 19.8 24.27.7 7.6 8.4
17.8 17.5 18.413.9 13.8 15.7
13.9 13.2 13.210.5 10.5 11.515.4 14.8 14.4
18.7 16.9 20.47.3 7.2 7.3
10.4 10.5 11.120.0 20.3 20.3
8.6 8.4 9.226.0 26.2 22.318.1 19.6 19.419.6 21.5 18.9
8.9 10.1 8.24.3 6.9 4.0
14.7 14.6 13.411.5 10.8 13.712.3 13.3 11.416.1 18.4 16.125.1 23.3 20.0
5.4 5.2 5.67.2 7.3 7.8
NOT SEASONALLY ADJUSTEDUnited StatesAlaska StatewideAnchorage/Mat-Su Region (MSA)4
Municipality of AnchorageMat-Su Borough
Gulf Coast RegionKenai Peninsula BoroughKodiak Island BoroughValdez-Cordova
Interior RegionDenali BoroughFairbanks North Star Borough (MSA)4
Southeast FairbanksYukon-Koyukuk
Northern RegionNomeNorth Slope BoroughNorthwest Arctic Borough
Southeast RegionHaines BoroughJuneau BoroughKetchikan Gateway BoroughPrince of Wales-Outer KetchikanSitka BoroughSkagway-Hoonah-AngoonWrangell-PetersburgYakutat Borough
Southwest RegionAleutians East BoroughAleutians WestBethelBristol Bay BoroughDillinghamLake & Peninsula BoroughWade Hampton
SEASONALLY ADJUSTEDUnited StatesAlaska Statewide
2004 BenchmarkThe official definition of unemployment excludes anyone who has not activelysought work in the four-week period up to and including the week that includesthe 12th of the reference month. Many individuals do not meet this definitionbecause they have not conducted an active job search, due to the scarcity ofemployment opportunities in rural Alaska.
4Anchorage/Mat-Su Region (MSA)4
Gulf Coast RegionInterior RegionNorthern RegionSoutheast RegionSouthwest Region
157,800 156,400 153,700 1,400 4,100 0.9% 2.7%25,500 25,250 25,750 250 -250 1.0% -1.0%40,100 39,600 39,700 500 400 1.3% 1.0%15,900 15,750 15,350 150 550 1.0% 3.6%32,000 31,550 31,900 450 100 1.4% 0.3%20,300 19,600 20,150 700 150 3.6% 0.7%
preliminary revised revised Changes from: Percent Change2/05 1/05 2/04 1/05 2/04 1/05 2/04
Nonfarm Wage and Salary Employment By region
For more current state andregional employment andunemployment data, visitour web site.
Employment:http://almis.labor.state.ak.us/?pageid+67&subid+228
Unemployment:http://almis.labor.state.ak.us/?pageid+67&subid+188
ALASKA ECONOMIC TRENDS APRIL 2005 23
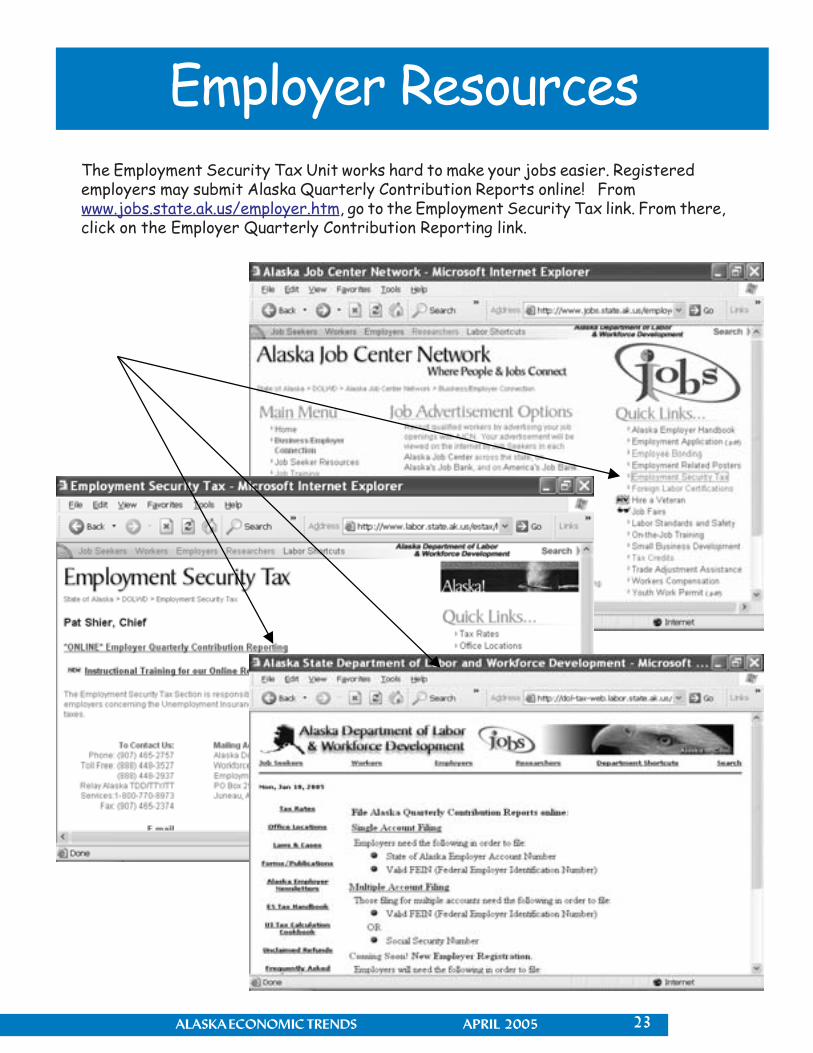
Employer Resources
The Employment Security Tax Unit works hard to make your jobs easier. Registeredemployers may submit Alaska Quarterly Contribution Reports online! Fromwww.jobs.state.ak.us/employer.htm, go to the Employment Security Tax link. From there,click on the Employer Quarterly Contribution Reporting link.