Embed Size (px)
Citation preview
REDEFINE PROPERTIES LIMITED
GROUP RESULTS and strategic review FOR THE YEAR ENDED 31 AUGUST 2015
2 Redefine Group results and strategic review for the year ended 31 August 2015
OUR CONVERSATION
Section 1 SCORECARD AND STRATEGY Andrew Konig (CEO)
Section 2 LOCAL PROPERTY PORTFOLIO David Rice (COO)
Section 3 FINANCIAL RESULTS Leon Kok (CFO)
Section 4 CONCLUSION AND PROSPECTS Andrew Konig (CEO)
Section 5 SUPPLEMENTARY INFORMATION
Section 1 SCORECARD AND STRATEGY Andrew Konig
4 Redefine Group results and strategic review for the year ended 31 August 2015
2015 LEADING FEATURES
• Relentless focus on managing the controllable variables
• revenue protection
• margin preservation
• maximising cashflow
• optimising sources of capital
• highest and best use of capital
• Continued expansion, improvement, diversification and preservation
• transformative investments of R13 billion across every asset category
• Fountainhead merger concluded through issue of R3.8 billion in shares
• development projects of R3.8 billion in progress
• Restructure largely complete except for sale of government tenanted offices
• Balance sheet strengthened despite merger activity – improved credit metrics
• “We’re not landlords. We’re people”. entrenched in Redefine’s ethos
• Investment profile raised considerably
• ESG and integrated thinking embedded in strategy to achieve sustainability
• BEE-credentials improved
A redefining year
Thibault Square, Western Cape
5 Redefine Group results and strategic review for the year ended 31 August 2015
STAND OUT ACHIEVEMENTS IN 2015
• 15th year of listing
• Establishment of the Redefine Empowerment Trust
• 90 Grayston awarded SAPOA’s Innovative Excellence in Property
Development
• Ranked sixth in EY’s Excellence in Integrated Reporting Awards 2015
• Black River Park achieved existing building six star green rating (a first in SA)
• Won the International Sponsorship category of the BASA Awards
• SACSC retail design and development awards for:
• best shopping centre development over 20 000 m² for Matlosana Mall
• best restaurant design for Nando’s at Maponya Mall
• Recognised as a Top Employer for “exceptional” employee offerings
• Redefine included in the JSE’s Top 40 index
Our vision is to be the best SA REIT
Matlosana Mall, North West
6 Redefine Group results and strategic review for the year ended 31 August 2015
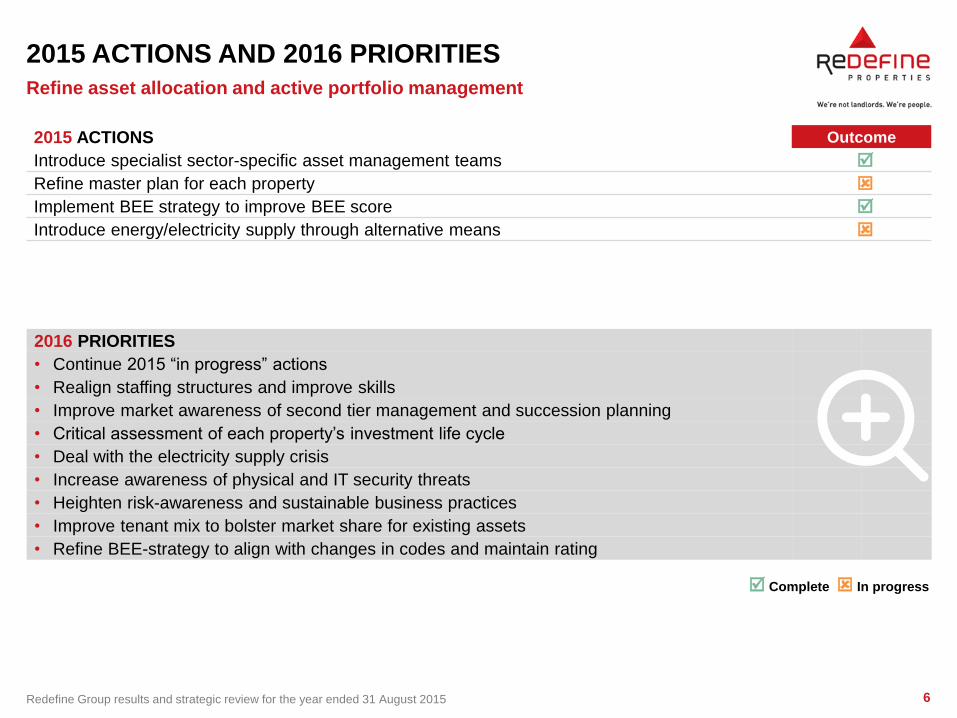
2015 ACTIONS AND 2016 PRIORITIES
Refine asset allocation and active portfolio management
2015 ACTIONS Outcome
Introduce specialist sector-specific asset management teams
Refine master plan for each property
Implement BEE strategy to improve BEE score
Introduce energy/electricity supply through alternative means
2016 PRIORITIES
• Continue 2015 “in progress” actions
• Realign staffing structures and improve skills
• Improve market awareness of second tier management and succession planning
• Critical assessment of each property’s investment life cycle
• Deal with the electricity supply crisis
• Increase awareness of physical and IT security threats
• Heighten risk-awareness and sustainable business practices
• Improve tenant mix to bolster market share for existing assets
• Refine BEE-strategy to align with changes in codes and maintain rating
Complete In progress
7 Redefine Group results and strategic review for the year ended 31 August 2015
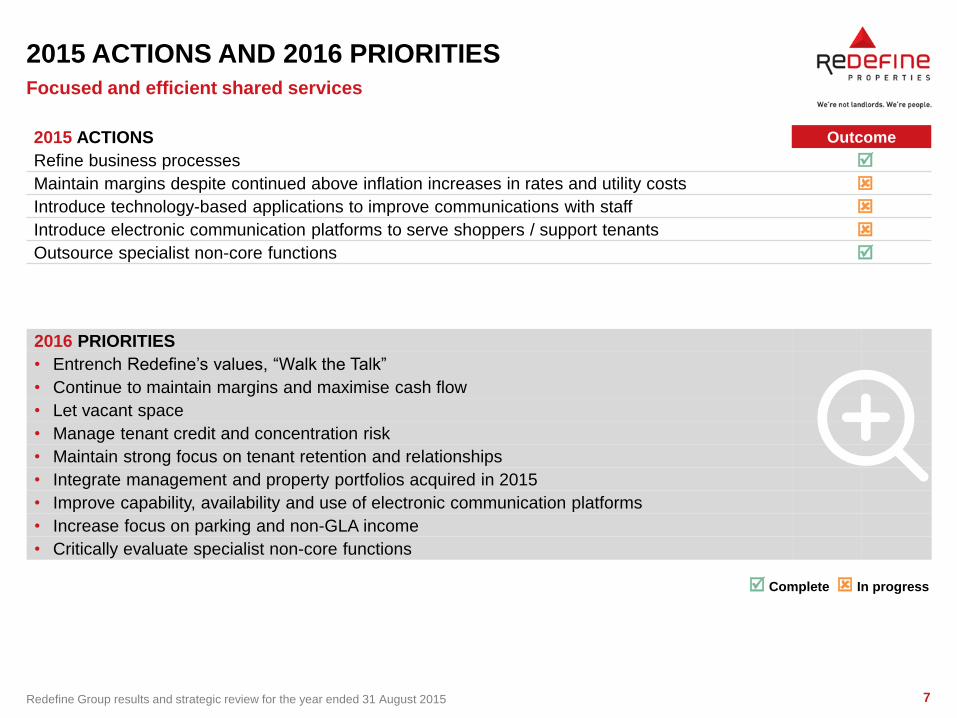
2015 ACTIONS AND 2016 PRIORITIES
Focused and efficient shared services
2015 ACTIONS Outcome
Refine business processes
Maintain margins despite continued above inflation increases in rates and utility costs
Introduce technology-based applications to improve communications with staff
Introduce electronic communication platforms to serve shoppers / support tenants
Outsource specialist non-core functions
2016 PRIORITIES
• Entrench Redefine’s values, “Walk the Talk”
• Continue to maintain margins and maximise cash flow
• Let vacant space
• Manage tenant credit and concentration risk
• Maintain strong focus on tenant retention and relationships
• Integrate management and property portfolios acquired in 2015
• Improve capability, availability and use of electronic communication platforms
• Increase focus on parking and non-GLA income
• Critically evaluate specialist non-core functions
Complete In progress
8 Redefine Group results and strategic review for the year ended 31 August 2015
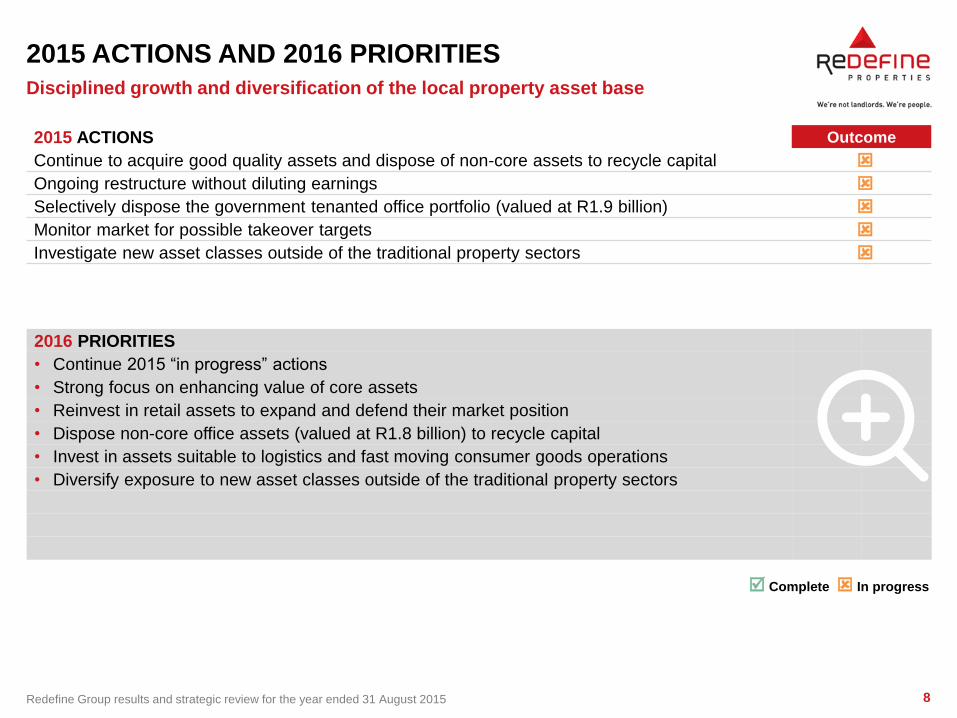
2015 ACTIONS AND 2016 PRIORITIES
Disciplined growth and diversification of the local property asset base
2015 ACTIONS Outcome
Continue to acquire good quality assets and dispose of non-core assets to recycle capital
Ongoing restructure without diluting earnings
Selectively dispose the government tenanted office portfolio (valued at R1.9 billion)
Monitor market for possible takeover targets
Investigate new asset classes outside of the traditional property sectors
2016 PRIORITIES
• Continue 2015 “in progress” actions
• Strong focus on enhancing value of core assets
• Reinvest in retail assets to expand and defend their market position
• Dispose non-core office assets (valued at R1.8 billion) to recycle capital
• Invest in assets suitable to logistics and fast moving consumer goods operations
• Diversify exposure to new asset classes outside of the traditional property sectors
Complete In progress
9 Redefine Group results and strategic review for the year ended 31 August 2015
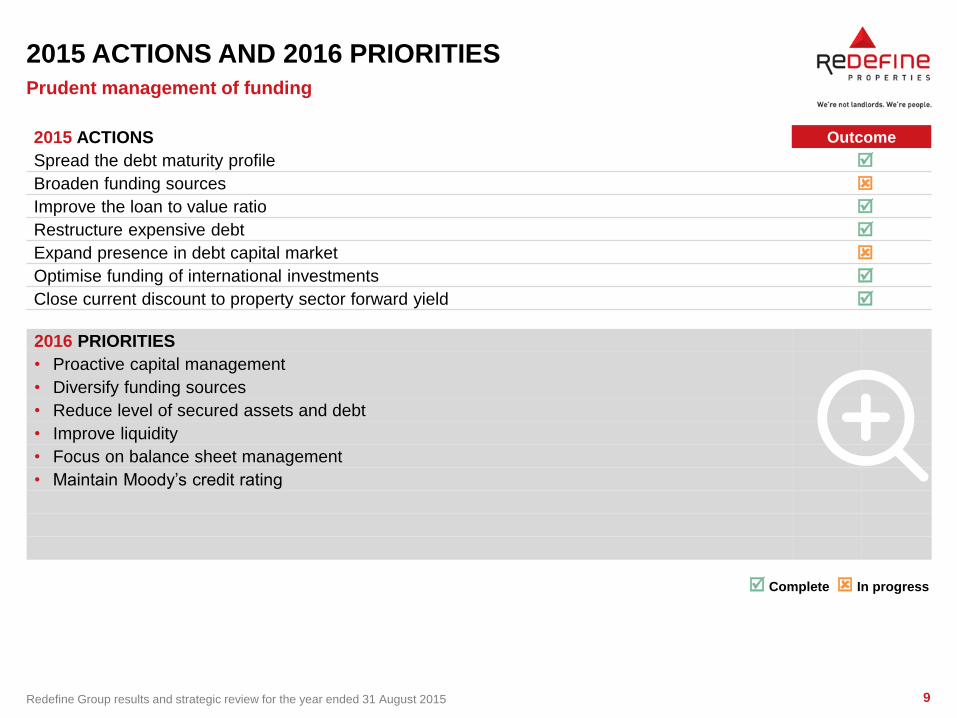
2015 ACTIONS AND 2016 PRIORITIES
Prudent management of funding
2015 ACTIONS Outcome
Spread the debt maturity profile
Broaden funding sources
Improve the loan to value ratio
Restructure expensive debt
Expand presence in debt capital market
Optimise funding of international investments
Close current discount to property sector forward yield
2016 PRIORITIES
• Proactive capital management
• Diversify funding sources
• Reduce level of secured assets and debt
• Improve liquidity
• Focus on balance sheet management
• Maintain Moody’s credit rating
Complete In progress
10 Redefine Group results and strategic review for the year ended 31 August 2015
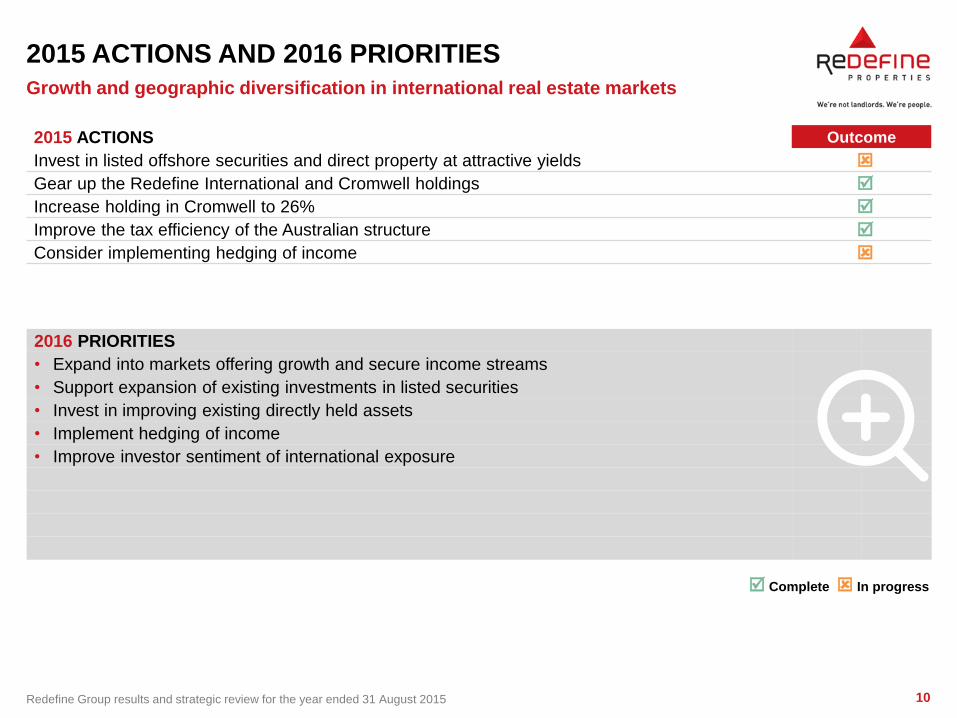
2015 ACTIONS AND 2016 PRIORITIES
Growth and geographic diversification in international real estate markets
2015 ACTIONS Outcome
Invest in listed offshore securities and direct property at attractive yields
Gear up the Redefine International and Cromwell holdings
Increase holding in Cromwell to 26%
Improve the tax efficiency of the Australian structure
Consider implementing hedging of income
2016 PRIORITIES
• Expand into markets offering growth and secure income streams
• Support expansion of existing investments in listed securities
• Invest in improving existing directly held assets
• Implement hedging of income
• Improve investor sentiment of international exposure
Complete In progress
11 Redefine Group results and strategic review for the year ended 31 August 2015
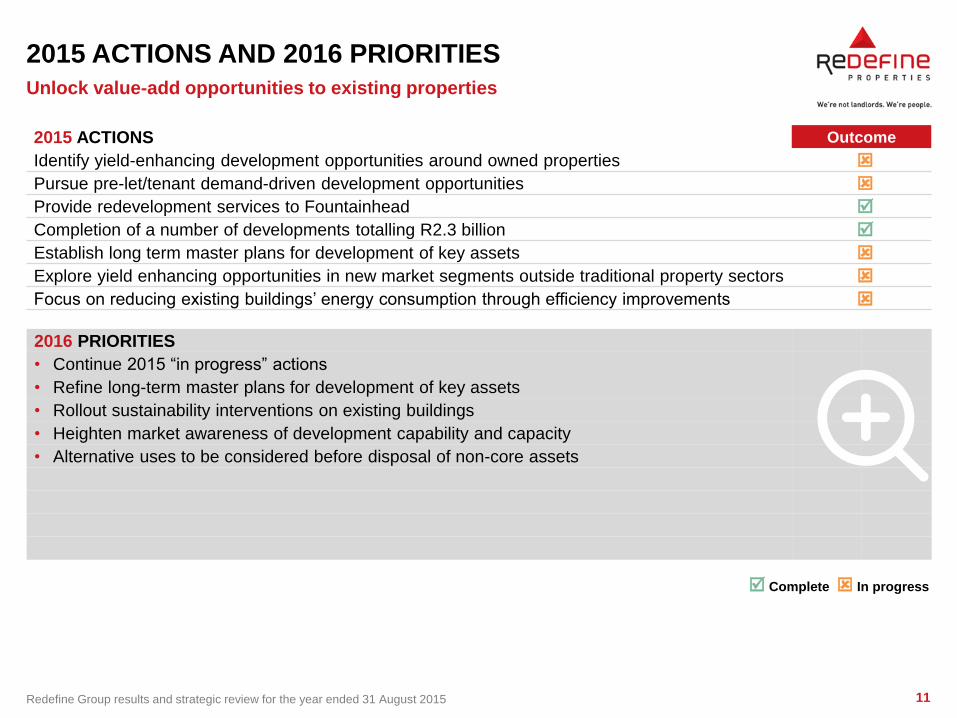
2015 ACTIONS AND 2016 PRIORITIES
Unlock value-add opportunities to existing properties
2015 ACTIONS Outcome
Identify yield-enhancing development opportunities around owned properties
Pursue pre-let/tenant demand-driven development opportunities
Provide redevelopment services to Fountainhead
Completion of a number of developments totalling R2.3 billion
Establish long term master plans for development of key assets
Explore yield enhancing opportunities in new market segments outside traditional property sectors
Focus on reducing existing buildings’ energy consumption through efficiency improvements
2016 PRIORITIES
• Continue 2015 “in progress” actions
• Refine long-term master plans for development of key assets
• Rollout sustainability interventions on existing buildings
• Heighten market awareness of development capability and capacity
• Alternative uses to be considered before disposal of non-core assets
Complete In progress
12 Redefine Group results and strategic review for the year ended 31 August 2015
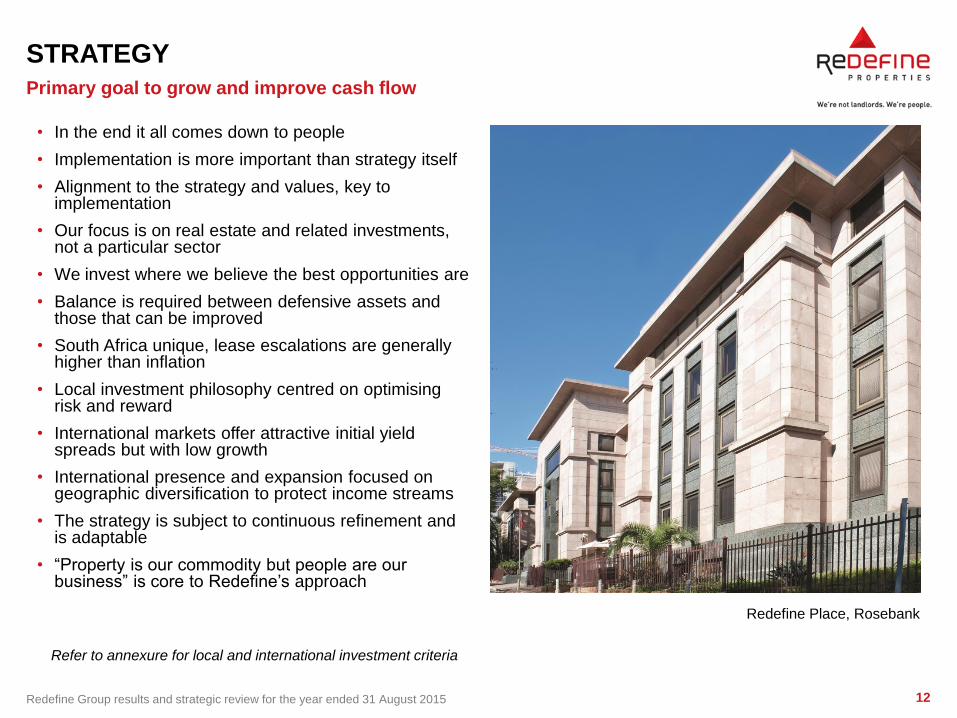
STRATEGY
• In the end it all comes down to people
• Implementation is more important than strategy itself
• Alignment to the strategy and values, key to implementation
• Our focus is on real estate and related investments, not a particular sector
• We invest where we believe the best opportunities are
• Balance is required between defensive assets and those that can be improved
• South Africa unique, lease escalations are generally higher than inflation
• Local investment philosophy centred on optimising risk and reward
• International markets offer attractive initial yield spreads but with low growth
• International presence and expansion focused on geographic diversification to protect income streams
• The strategy is subject to continuous refinement and is adaptable
• “Property is our commodity but people are our business” is core to Redefine’s approach
Primary goal to grow and improve cash flow
Refer to annexure for local and international investment criteria
Redefine Place, Rosebank
13 Redefine Group results and strategic review for the year ended 31 August 2015
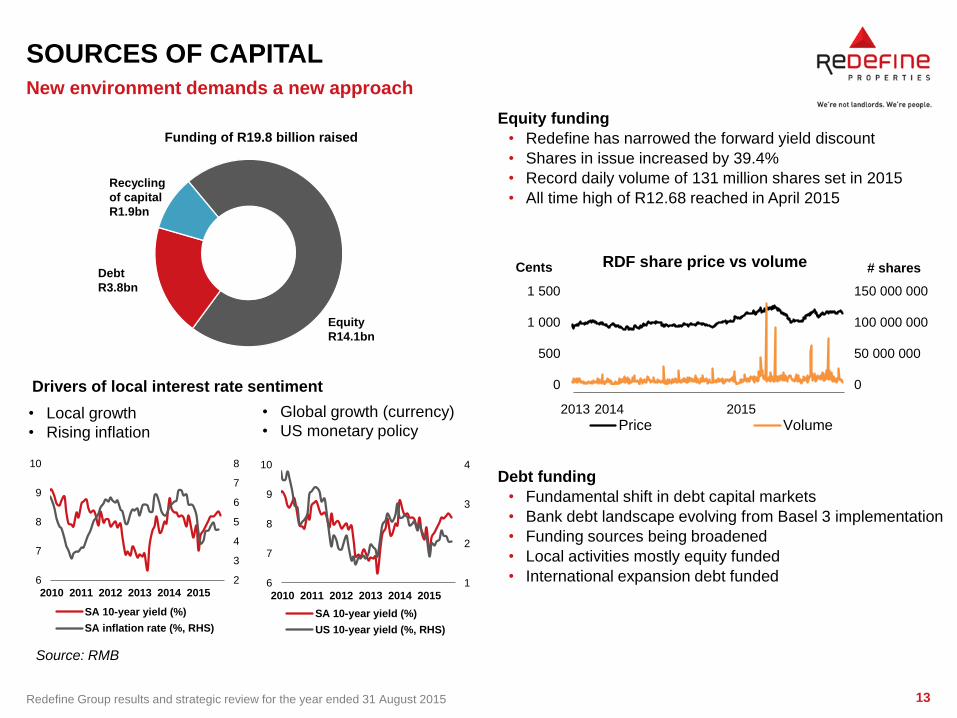
SOURCES OF CAPITAL
Funding of R19.8 billion raised
New environment demands a new approach
Equity funding
• Redefine has narrowed the forward yield discount
• Shares in issue increased by 39.4%
• Record daily volume of 131 million shares set in 2015
• All time high of R12.68 reached in April 2015
Debt funding
• Fundamental shift in debt capital markets
• Bank debt landscape evolving from Basel 3 implementation
• Funding sources being broadened
• Local activities mostly equity funded
• International expansion debt funded
Equity
R14.1bn
Debt
R3.8bn
Recycling
of capital
R1.9bn
2
3
4
5
6
7
8
6
7
8
9
10
2010 2011 2012 2013 2014 2015
SA 10-year yield (%)
SA inflation rate (%, RHS)
1
2
3
4
6
7
8
9
10
2010 2011 2012 2013 2014 2015
SA 10-year yield (%)
US 10-year yield (%, RHS)
2013 2014 2015
0
50 000 000
100 000 000
150 000 000
0
500
1 000
1 500
# shares Cents RDF share price vs volume
Price Volume
Source: RMB
Drivers of local interest rate sentiment
• Local growth
• Rising inflation
• Global growth (currency)
• US monetary policy
14 Redefine Group results and strategic review for the year ended 31 August 2015
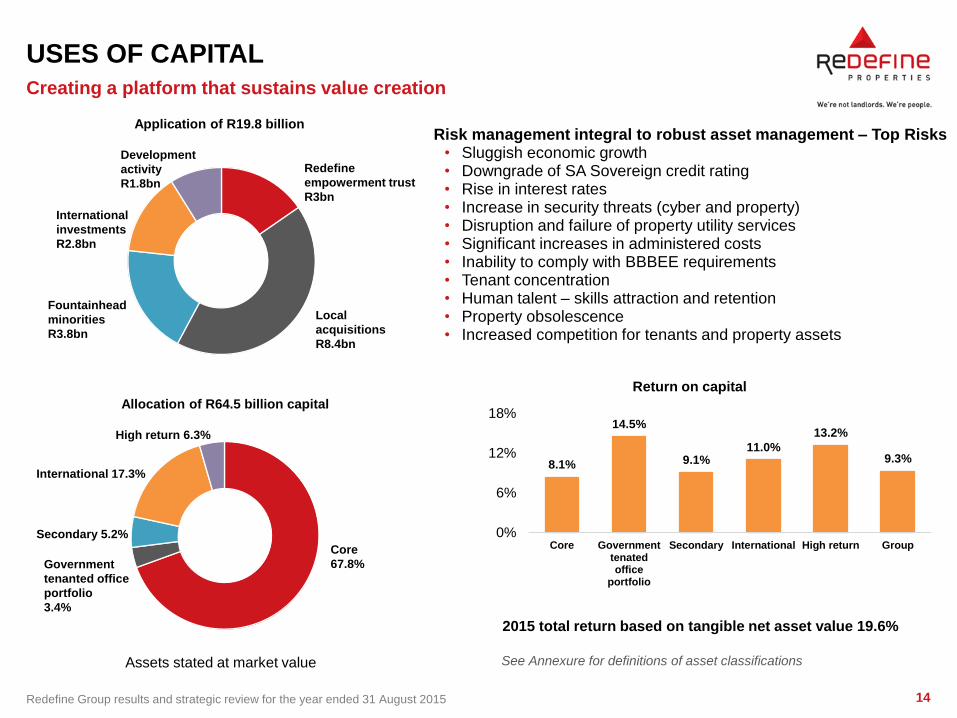
USES OF CAPITAL
See Annexure for definitions of asset classifications
Creating a platform that sustains value creation
Risk management integral to robust asset management – Top Risks • Sluggish economic growth • Downgrade of SA Sovereign credit rating • Rise in interest rates • Increase in security threats (cyber and property) • Disruption and failure of property utility services • Significant increases in administered costs • Inability to comply with BBBEE requirements • Tenant concentration • Human talent – skills attraction and retention • Property obsolescence • Increased competition for tenants and property assets
8.1%
14.5%
9.1% 11.0%
13.2%
9.3%
0%
6%
12%
18%
Core Governmenttenatedoffice
portfolio
Secondary International High return Group
Return on capital
Fountainhead
minorities
R3.8bn
Local
acquisitions
R8.4bn
International
investments
R2.8bn
Development
activity
R1.8bn
Redefine
empowerment trust
R3bn
Core
67.8% Government
tenanted office
portfolio
3.4%
Secondary 5.2%
International 17.3%
High return 6.3%
2015 total return based on tangible net asset value 19.6%
Assets stated at market value
Allocation of R64.5 billion capital
Application of R19.8 billion
15 Redefine Group results and strategic review for the year ended 31 August 2015
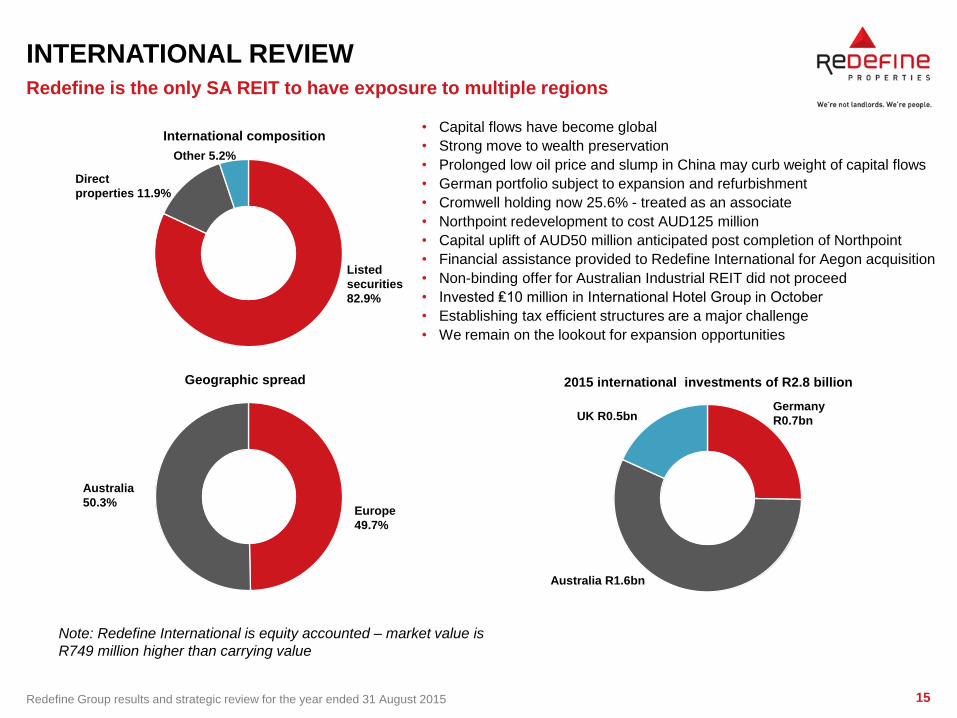
INTERNATIONAL REVIEW
International composition
Geographic spread
Redefine is the only SA REIT to have exposure to multiple regions
• Capital flows have become global
• Strong move to wealth preservation
• Prolonged low oil price and slump in China may curb weight of capital flows
• German portfolio subject to expansion and refurbishment
• Cromwell holding now 25.6% - treated as an associate
• Northpoint redevelopment to cost AUD125 million
• Capital uplift of AUD50 million anticipated post completion of Northpoint
• Financial assistance provided to Redefine International for Aegon acquisition
• Non-binding offer for Australian Industrial REIT did not proceed
• Invested ₤10 million in International Hotel Group in October
• Establishing tax efficient structures are a major challenge
• We remain on the lookout for expansion opportunities
2015 international investments of R2.8 billion
Listed
securities
82.9%
Direct
properties 11.9%
Europe
49.7%
Australia
50.3%
Germany
R0.7bn
Australia R1.6bn
UK R0.5bn
Other 5.2%
Note: Redefine International is equity accounted – market value is
R749 million higher than carrying value
16 Redefine Group results and strategic review for the year ended 31 August 2015
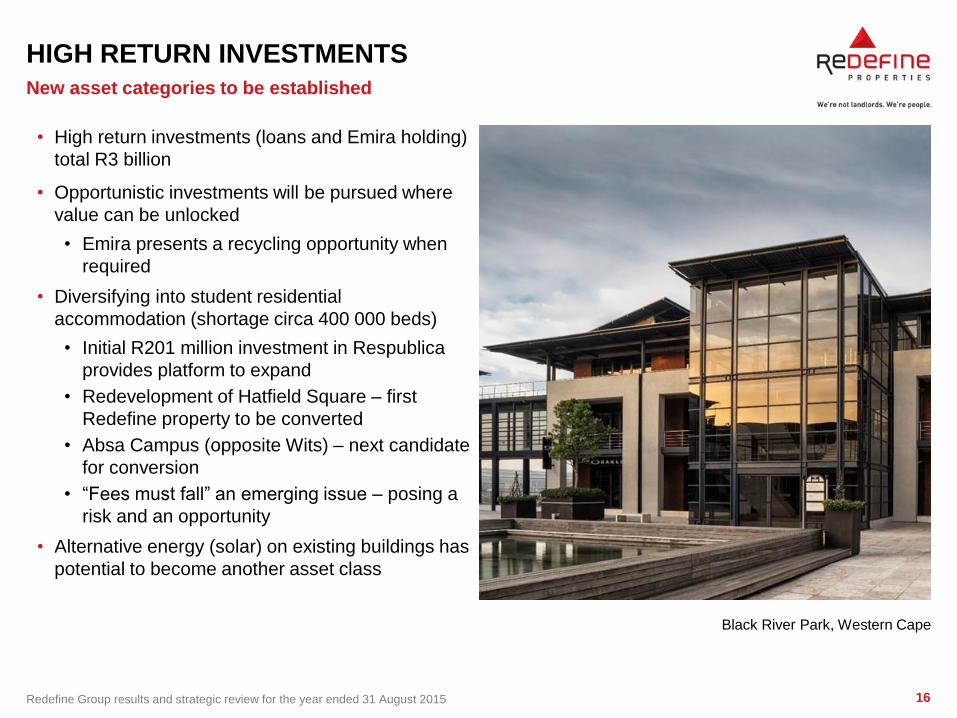
HIGH RETURN INVESTMENTS
• High return investments (loans and Emira holding)
total R3 billion
• Opportunistic investments will be pursued where
value can be unlocked
• Emira presents a recycling opportunity when
required
• Diversifying into student residential
accommodation (shortage circa 400 000 beds)
• Initial R201 million investment in Respublica
provides platform to expand
• Redevelopment of Hatfield Square – first
Redefine property to be converted
• Absa Campus (opposite Wits) – next candidate
for conversion
• “Fees must fall” an emerging issue – posing a
risk and an opportunity
• Alternative energy (solar) on existing buildings has
potential to become another asset class
New asset categories to be established
Black River Park, Western Cape
Section 2 LOCAL PROPERTY PORTFOLIO David Rice
18 Redefine Group results and strategic review for the year ended 31 August 2015
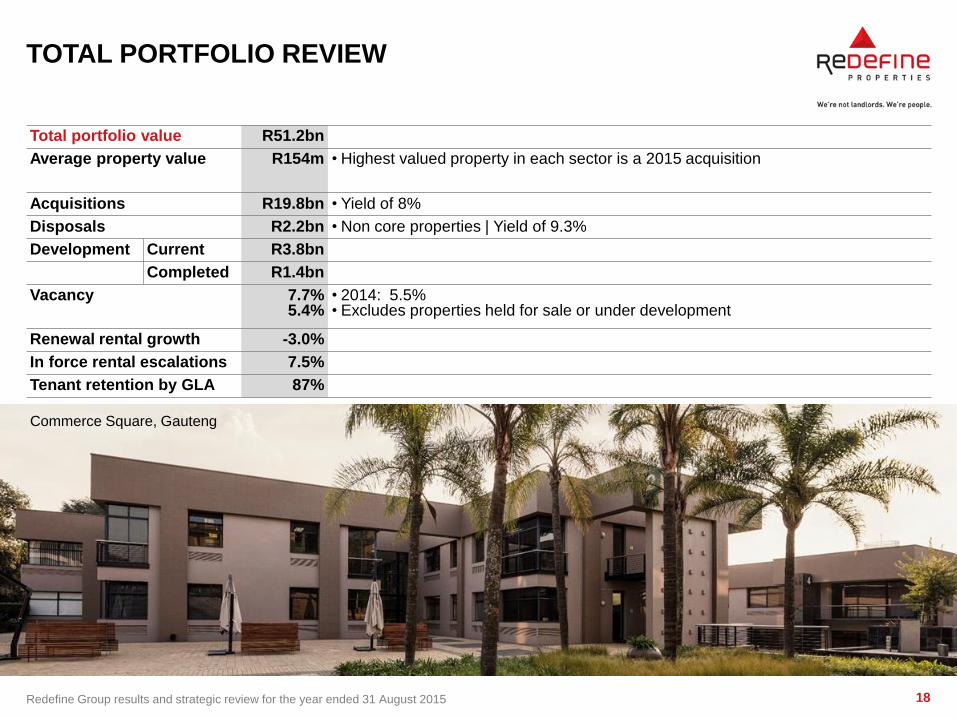
TOTAL PORTFOLIO REVIEW
Total portfolio value R51.2bn
Average property value R154m • Highest valued property in each sector is a 2015 acquisition
Acquisitions R19.8bn • Yield of 8%
Disposals R2.2bn • Non core properties | Yield of 9.3%
Development Current R3.8bn
Completed R1.4bn
Vacancy
7.7% 5.4%
• 2014: 5.5% • Excludes properties held for sale or under development
Renewal rental growth -3.0%
In force rental escalations 7.5%
Tenant retention by GLA 87%
Commerce Square, Gauteng
19 Redefine Group results and strategic review for the year ended 31 August 2015
PORTFOLIO FOCUS
• Core portfolio is valued at R45.6 billion and
non-core R5.6 billion
• intended to dispose of non-core properties over
time
• once all investment alternatives have been
exhausted
• Acquire good quality, well located and tenanted
retail and industrial properties
• Focus on enhancing the value of the portfolio by
implementation of individual property master plans
• Identify yield enhancing development and re-
development opportunities within the portfolio
• Committed to creating efficient buildings that
adhere to latest environmental responsible
technologies
• Focus on letting vacant space, tenant retention
and relationships
• Parking is our biggest “tenant”
The Boulevard, Western Cape
20 Redefine Group results and strategic review for the year ended 31 August 2015
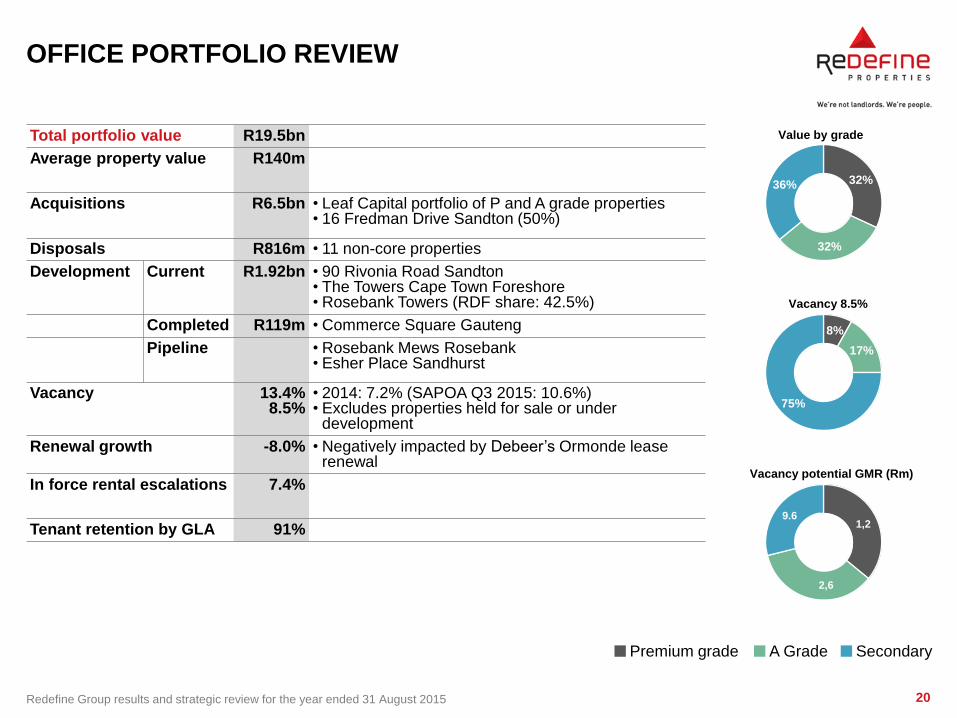
32%
32%
36%
Value by grade
OFFICE PORTFOLIO REVIEW
Total portfolio value R19.5bn
Average property value R140m
Acquisitions R6.5bn • Leaf Capital portfolio of P and A grade properties • 16 Fredman Drive Sandton (50%)
Disposals R816m • 11 non-core properties
Development Current R1.92bn • 90 Rivonia Road Sandton • The Towers Cape Town Foreshore • Rosebank Towers (RDF share: 42.5%)
Completed R119m • Commerce Square Gauteng
Pipeline • Rosebank Mews Rosebank • Esher Place Sandhurst
Vacancy
13.4% 8.5%
• 2014: 7.2% (SAPOA Q3 2015: 10.6%) • Excludes properties held for sale or under
development
Renewal growth -8.0% • Negatively impacted by Debeer’s Ormonde lease renewal
In force rental escalations 7.4%
Tenant retention by GLA 91%
Secondary Premium grade A Grade
8%
17%
75%
Vacancy 8.5%
1,2
2,6
9.6
Vacancy potential GMR (Rm)
21 Redefine Group results and strategic review for the year ended 31 August 2015
OFFICE PORTFOLIO FOCUS
• No intention to acquire office property, unless there is a compelling investment reason
• Efforts continue to dispose of government tenanted properties and other secondary non-core properties
• certain properties have been sold individually • Market musical chairs continues with the same tune • Focus:
• letting vacant space • tenant retention and relationships • reducing occupation costs through implementation
of green technologies • re-development of well located older properties
and upgrades to common areas where necessary • early renewal of major leases • market intelligence • broker tenant representative relationships • where possible ensuring properties provide
facilities such as: – data fibre
– wi-fi – gym – restaurants
– green spaces
The Towers, Western Cape
22 Redefine Group results and strategic review for the year ended 31 August 2015
INDUSTRIAL PORTFOLIO REVIEW
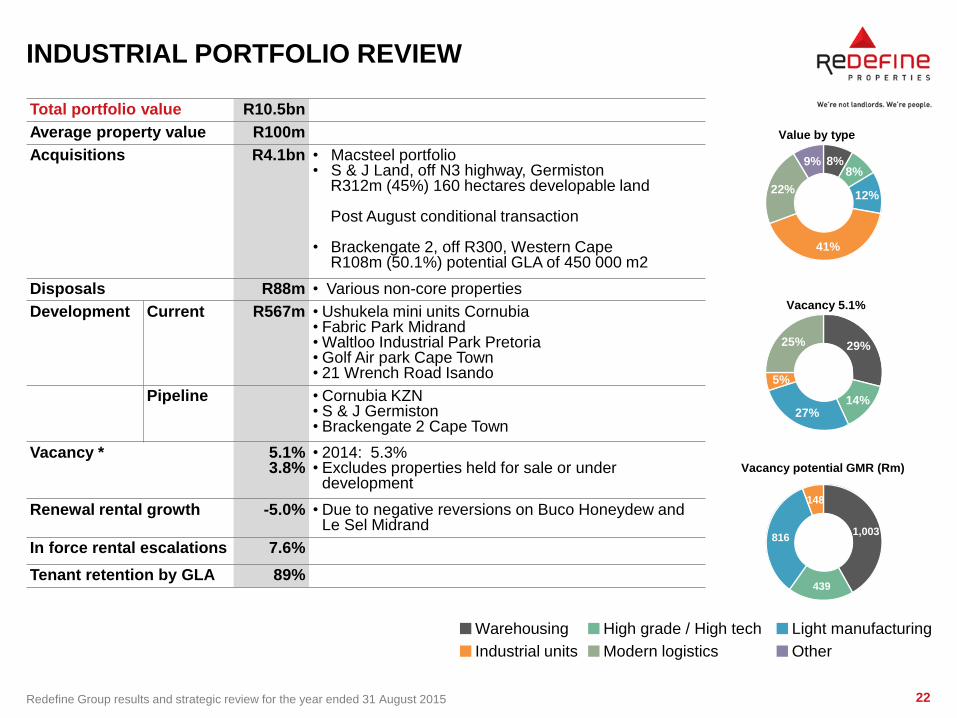
Total portfolio value R10.5bn
Average property value R100m
Acquisitions R4.1bn • Macsteel portfolio • S & J Land, off N3 highway, Germiston R312m (45%) 160 hectares developable land
Post August conditional transaction
• Brackengate 2, off R300, Western Cape R108m (50.1%) potential GLA of 450 000 m2
Disposals R88m • Various non-core properties
Development Current R567m • Ushukela mini units Cornubia • Fabric Park Midrand • Waltloo Industrial Park Pretoria • Golf Air park Cape Town • 21 Wrench Road Isando
Pipeline • Cornubia KZN • S & J Germiston • Brackengate 2 Cape Town
Vacancy *
5.1% 3.8%
• 2014: 5.3% • Excludes properties held for sale or under
development
Renewal rental growth -5.0% • Due to negative reversions on Buco Honeydew and Le Sel Midrand
In force rental escalations 7.6%
Tenant retention by GLA 89%
8% 8%
12%
41%
22%
9%
Value by type
Light manufacturing
Industrial units Other
Warehousing High grade / High tech
Modern logistics
29%
14% 27%
5%
25%
Vacancy 5.1%
1,003
439
816
148
Vacancy potential GMR (Rm)
23 Redefine Group results and strategic review for the year ended 31 August 2015
INDUSTRIAL PORTFOLIO FOCUS
• Further acquisition of high quality, well located,
modern properties
• Dispose of non-core, obsolete properties not
appropriate for redevelopment
• Development of vacant land with a focus on the
logistics and FMCG supply chain industry
• mid size multi units close to the big boxes for
supplementary businesses
• eg: material handling
• Redevelopment of existing properties
• Tenant retention and relationships
• Early renewal of appropriate leases
• Golf Air Park development pioneers new
benchmark for green property sector
Cato Ridge, KwaZulu-Natal
24 Redefine Group results and strategic review for the year ended 31 August 2015
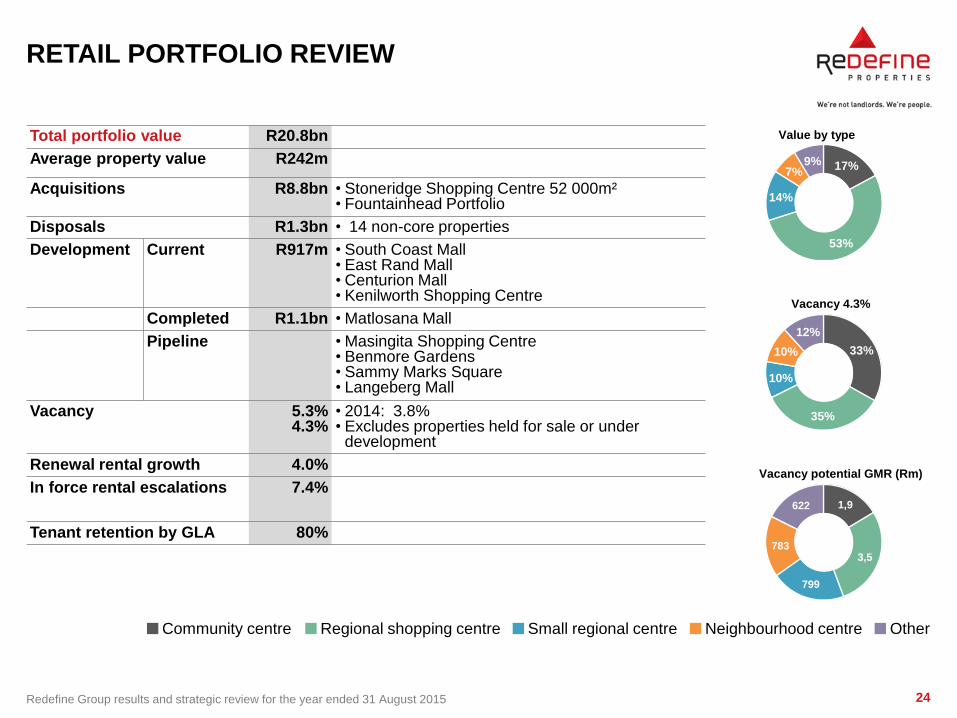
RETAIL PORTFOLIO REVIEW
Total portfolio value R20.8bn
Average property value R242m
Acquisitions R8.8bn • Stoneridge Shopping Centre 52 000m² • Fountainhead Portfolio
Disposals R1.3bn • 14 non-core properties
Development Current R917m • South Coast Mall • East Rand Mall • Centurion Mall • Kenilworth Shopping Centre
Completed R1.1bn • Matlosana Mall
Pipeline • Masingita Shopping Centre • Benmore Gardens • Sammy Marks Square • Langeberg Mall
Vacancy
5.3% 4.3%
• 2014: 3.8% • Excludes properties held for sale or under
development
Renewal rental growth 4.0%
In force rental escalations 7.4%
Tenant retention by GLA 80%
Small regional centre Neighbourhood centre Other Community centre Regional shopping centre
17%
53%
14%
7% 9%
Value by type
33%
35%
10%
10%
12%
Vacancy 4.3%
1,9
3,5
799
783
622
Vacancy potential GMR (Rm)
25 Redefine Group results and strategic review for the year ended 31 August 2015
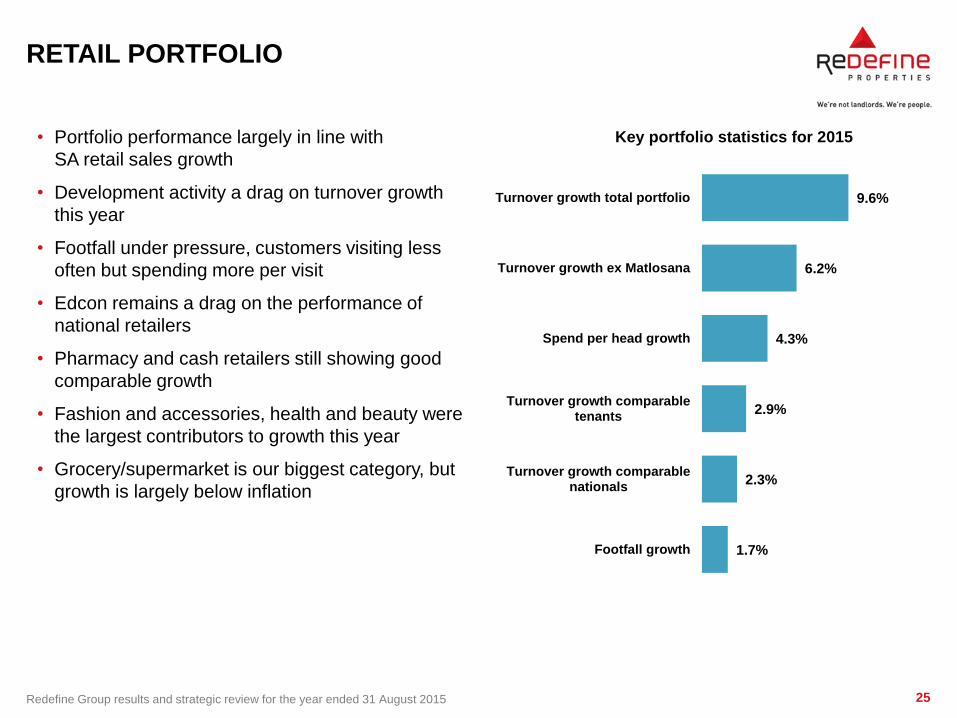
RETAIL PORTFOLIO
• Portfolio performance largely in line with
SA retail sales growth
• Development activity a drag on turnover growth
this year
• Footfall under pressure, customers visiting less
often but spending more per visit
• Edcon remains a drag on the performance of
national retailers
• Pharmacy and cash retailers still showing good
comparable growth
• Fashion and accessories, health and beauty were
the largest contributors to growth this year
• Grocery/supermarket is our biggest category, but
growth is largely below inflation
1.7%
2.3%
2.9%
4.3%
6.2%
9.6%
Footfall growth
Turnover growth comparablenationals
Turnover growth comparabletenants
Spend per head growth
Turnover growth ex Matlosana
Turnover growth total portfolio
Key portfolio statistics for 2015
26 Redefine Group results and strategic review for the year ended 31 August 2015
RETAIL CENTRE FOCUS
0%
2%
4%
6%
8%
10%
12%
14%
R 0 R 5 000 R 10 000 R 15 000 R 20 000 R 25 000 R 30 000 R 35 000 R 40 000 R 45 000 R 50 000Gro
ss R
ent
to S
ales
Rat
io (
An
nu
alis
ed
)
Annual Trading Density
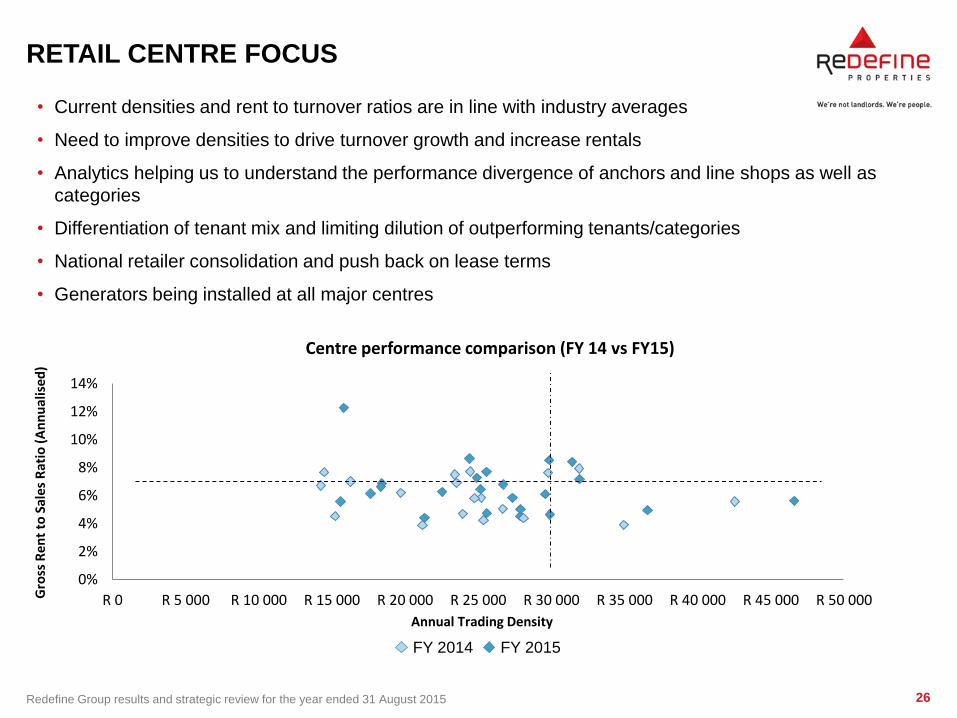
Centre performance comparison (FY 14 vs FY15)
• Current densities and rent to turnover ratios are in line with industry averages
• Need to improve densities to drive turnover growth and increase rentals
• Analytics helping us to understand the performance divergence of anchors and line shops as well as
categories
• Differentiation of tenant mix and limiting dilution of outperforming tenants/categories
• National retailer consolidation and push back on lease terms
• Generators being installed at all major centres
FY 2014 FY 2015
Section 3 FINANCIAL RESULTS
Leon Kok
28 Redefine Group results and strategic review for the year ended 31 August 2015
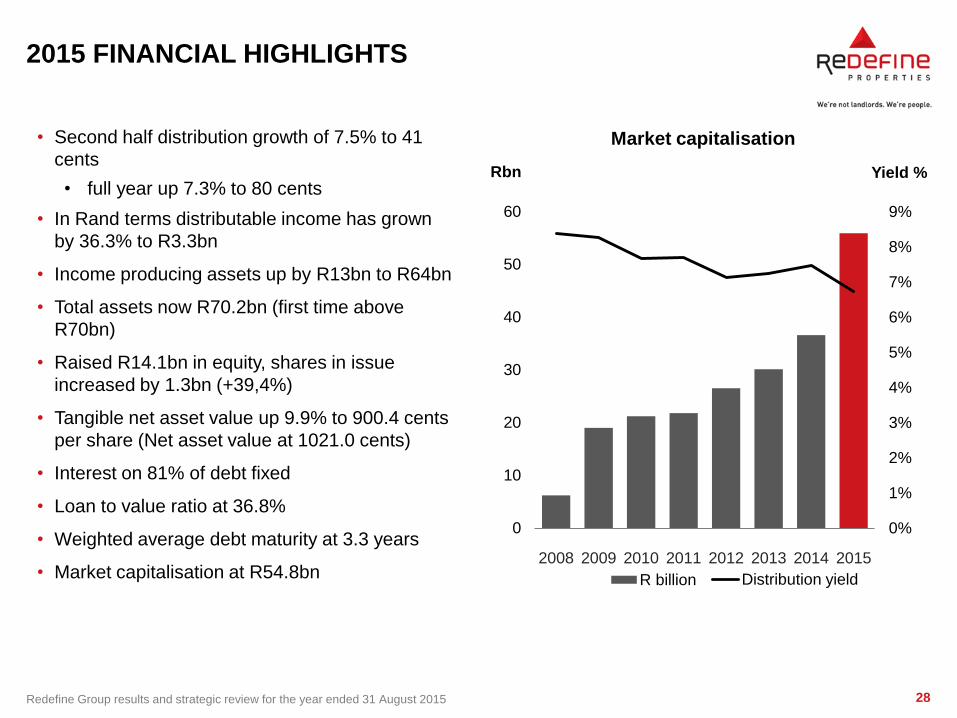
2015 FINANCIAL HIGHLIGHTS
• Second half distribution growth of 7.5% to 41
cents
• full year up 7.3% to 80 cents
• In Rand terms distributable income has grown
by 36.3% to R3.3bn
• Income producing assets up by R13bn to R64bn
• Total assets now R70.2bn (first time above
R70bn)
• Raised R14.1bn in equity, shares in issue
increased by 1.3bn (+39,4%)
• Tangible net asset value up 9.9% to 900.4 cents
per share (Net asset value at 1021.0 cents)
• Interest on 81% of debt fixed
• Loan to value ratio at 36.8%
• Weighted average debt maturity at 3.3 years
• Market capitalisation at R54.8bn
0%
1%
2%
3%
4%
5%
6%
7%
8%
9%
0
10
20
30
40
50
60
2008 2009 2010 2011 2012 2013 2014 2015
Yield % Rbn
Market capitalisation
R billion RDF (DY)Distribution yield
29 Redefine Group results and strategic review for the year ended 31 August 2015
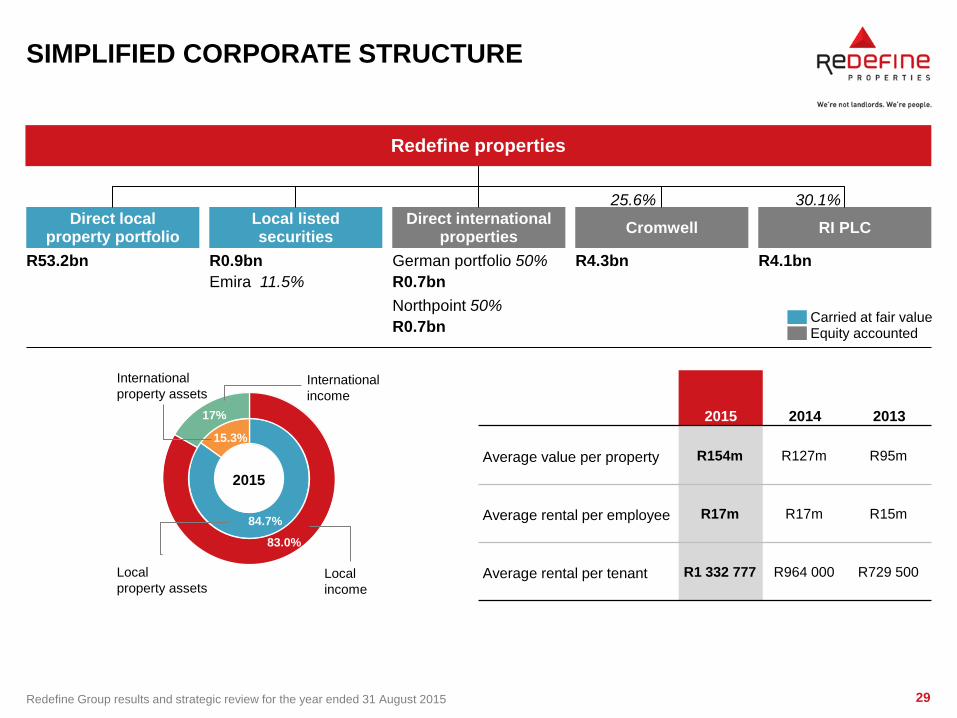
SIMPLIFIED CORPORATE STRUCTURE
2015 2014 2013
Average value per property R154m R127m R95m
Average rental per employee R17m R17m R15m
Average rental per tenant R1 332 777 R964 000 R729 500
Redefine properties
Direct local property portfolio
Local listed securities
Direct international properties
Cromwell RI PLC
R53.2bn R0.9bn
Emira 11.5%
German portfolio 50%
R0.7bn
Northpoint 50%
R0.7bn
R4.3bn R4.1bn
25.6% 30.1%
Carried at fair value Equity accounted
15.3%
17%
84.7%
83%
84.7%
15.3%
83.0%
17%
2015
International
property assets International
income
Local
property assets Local
income
30 Redefine Group results and strategic review for the year ended 31 August 2015
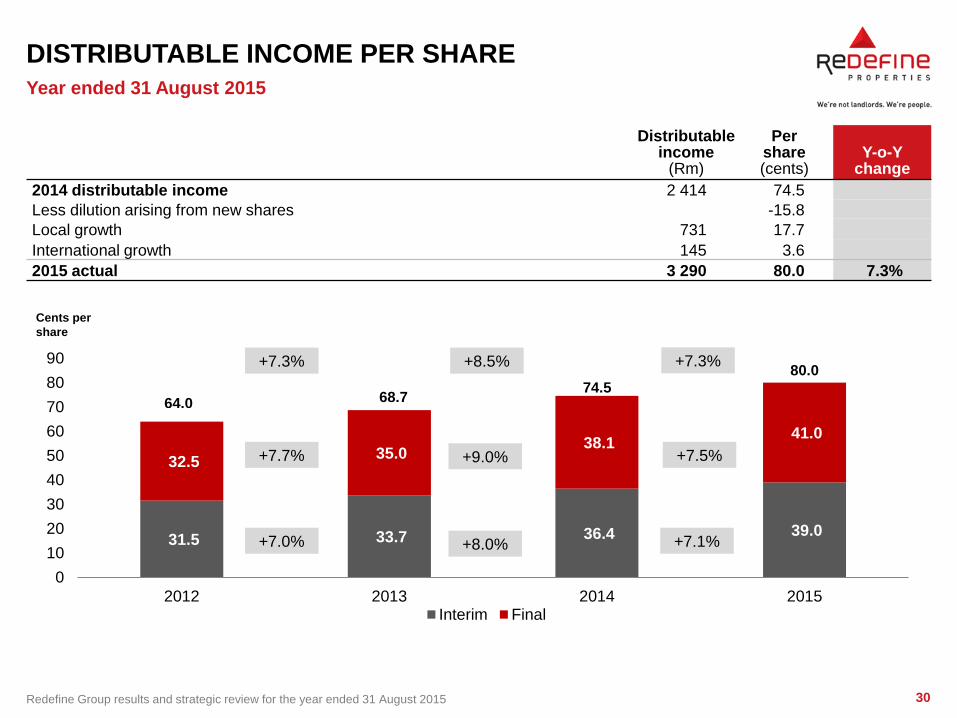
DISTRIBUTABLE INCOME PER SHARE
Distributable income
(Rm)
Per share (cents)
Y-o-Y change
2014 distributable income 2 414 74.5
Less dilution arising from new shares -15.8
Local growth 731 17.7
International growth 145 3.6
2015 actual 3 290 80.0 7.3%
Year ended 31 August 2015
Cents per
share
31.5 33.7 36.4 39.0
32.5 35.0
38.1 41.0
0
10
20
30
40
50
60
70
80
90
2012 2013 2014 2015Interim Final
64.0 74.5
68.7
80.0
+7.7%
+7.0%
+7.3% +8.5%
+9.0%
+8.0% +7.1%
+7.3%
+7.5%
31 Redefine Group results and strategic review for the year ended 31 August 2015
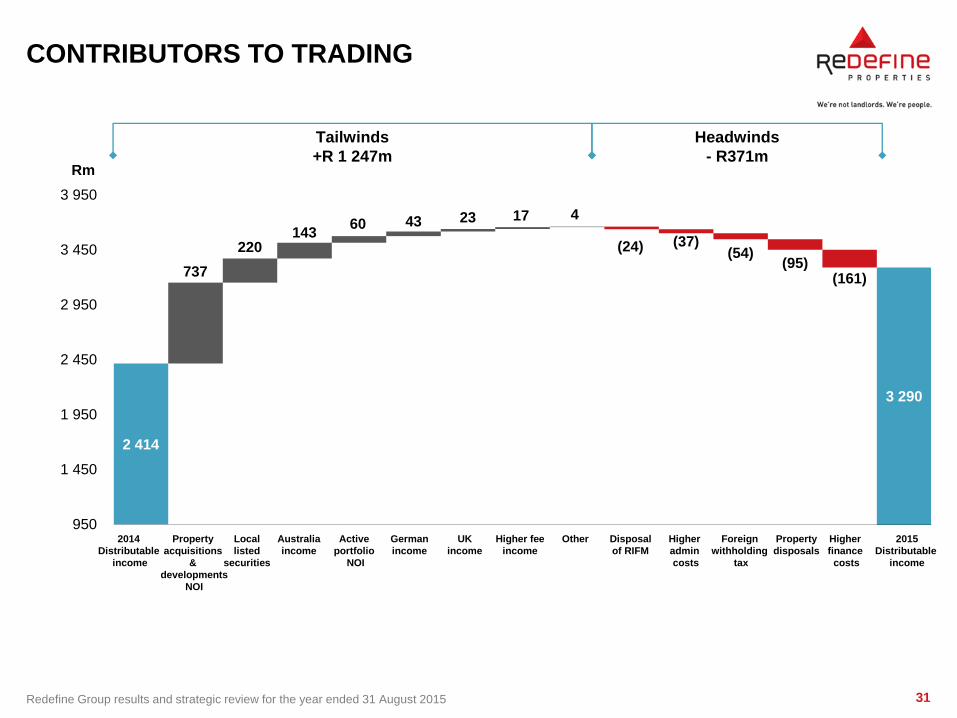
CONTRIBUTORS TO TRADING
2 414
3 290
23
(37) (54)
(95) (161) 737
220 143
60 43 17 4
(24)
950
1 450
1 950
2 450
2 950
3 450
3 950
Rm
Tailwinds
+R 1 247m
Headwinds
- R371m
2014
Distributable
income
Local
listed
securities
Australia
income
Active
portfolio
NOI
UK
income
German
income
Higher fee
income
Disposal
of RIFM
Other Foreign
withholding
tax
2015
Distributable
income
Higher
admin
costs
Property
acquisitions
&
developments
NOI
Property
disposals
Higher
finance
costs
32 Redefine Group results and strategic review for the year ended 31 August 2015
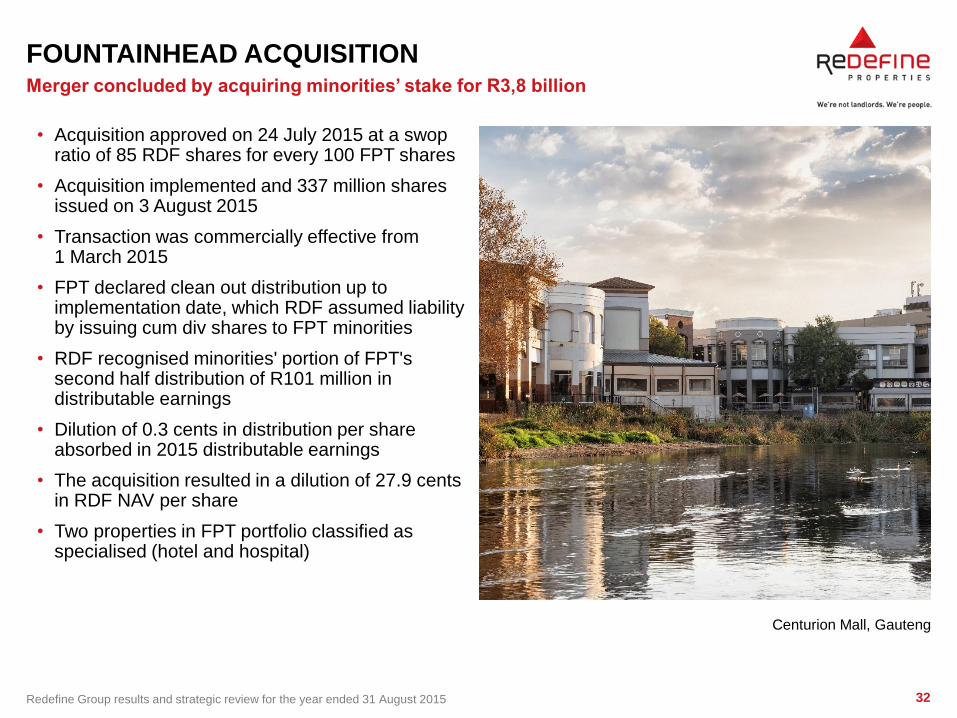
FOUNTAINHEAD ACQUISITION
• Acquisition approved on 24 July 2015 at a swop ratio of 85 RDF shares for every 100 FPT shares
• Acquisition implemented and 337 million shares issued on 3 August 2015
• Transaction was commercially effective from 1 March 2015
• FPT declared clean out distribution up to implementation date, which RDF assumed liability by issuing cum div shares to FPT minorities
• RDF recognised minorities' portion of FPT's second half distribution of R101 million in distributable earnings
• Dilution of 0.3 cents in distribution per share absorbed in 2015 distributable earnings
• The acquisition resulted in a dilution of 27.9 cents in RDF NAV per share
• Two properties in FPT portfolio classified as specialised (hotel and hospital)
Merger concluded by acquiring minorities’ stake for R3,8 billion
Centurion Mall, Gauteng
33 Redefine Group results and strategic review for the year ended 31 August 2015
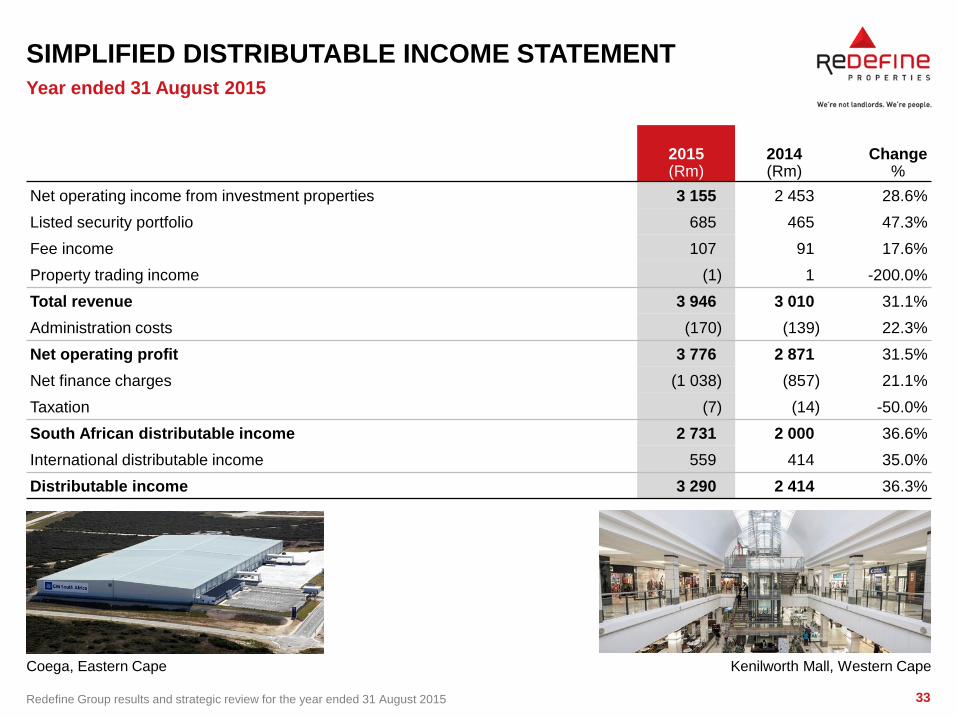
SIMPLIFIED DISTRIBUTABLE INCOME STATEMENT
Year ended 31 August 2015
2015 (Rm)
2014 (Rm)
Change %
Net operating income from investment properties 3 155 2 453 28.6%
Listed security portfolio 685 465 47.3%
Fee income 107 91 17.6%
Property trading income (1) 1 -200.0%
Total revenue 3 946 3 010 31.1%
Administration costs (170) (139) 22.3%
Net operating profit 3 776 2 871 31.5%
Net finance charges (1 038) (857) 21.1%
Taxation (7) (14) -50.0%
South African distributable income 2 731 2 000 36.6%
International distributable income 559 414 35.0%
Distributable income 3 290 2 414 36.3%
Coega, Eastern Cape Kenilworth Mall, Western Cape
34 Redefine Group results and strategic review for the year ended 31 August 2015
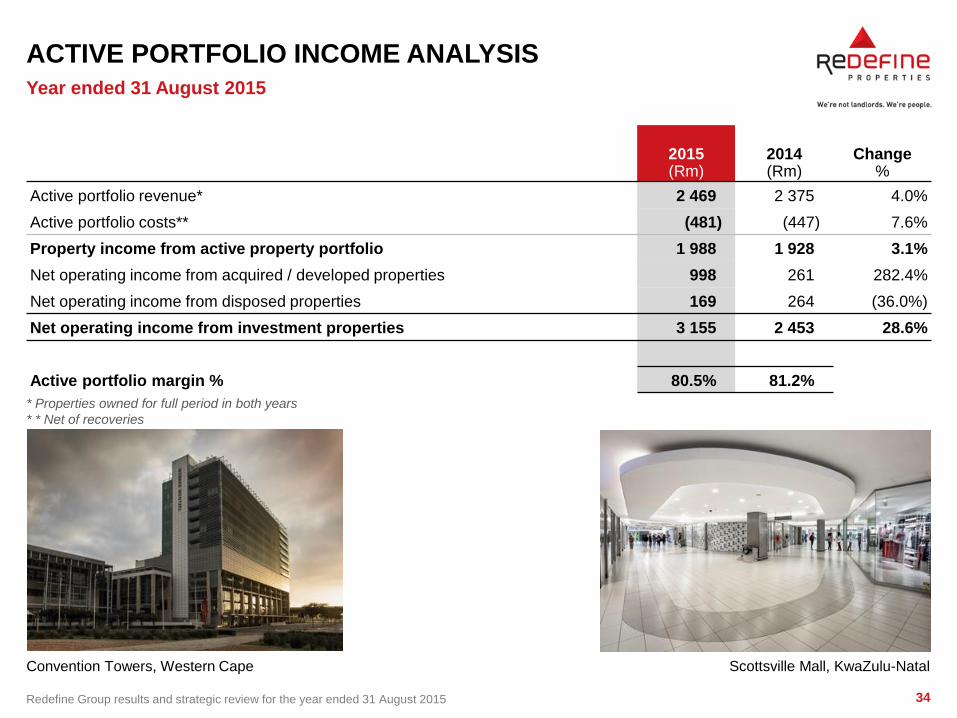
ACTIVE PORTFOLIO INCOME ANALYSIS
Year ended 31 August 2015
* Properties owned for full period in both years
* * Net of recoveries
2015 (Rm)
2014 (Rm)
Change %
Active portfolio revenue* 2 469 2 375 4.0%
Active portfolio costs** (481) (447) 7.6%
Property income from active property portfolio 1 988 1 928 3.1%
Net operating income from acquired / developed properties 998 261 282.4%
Net operating income from disposed properties 169 264 (36.0%)
Net operating income from investment properties 3 155 2 453 28.6%
Active portfolio margin % 80.5% 81.2%
Convention Towers, Western Cape Scottsville Mall, KwaZulu-Natal
35 Redefine Group results and strategic review for the year ended 31 August 2015
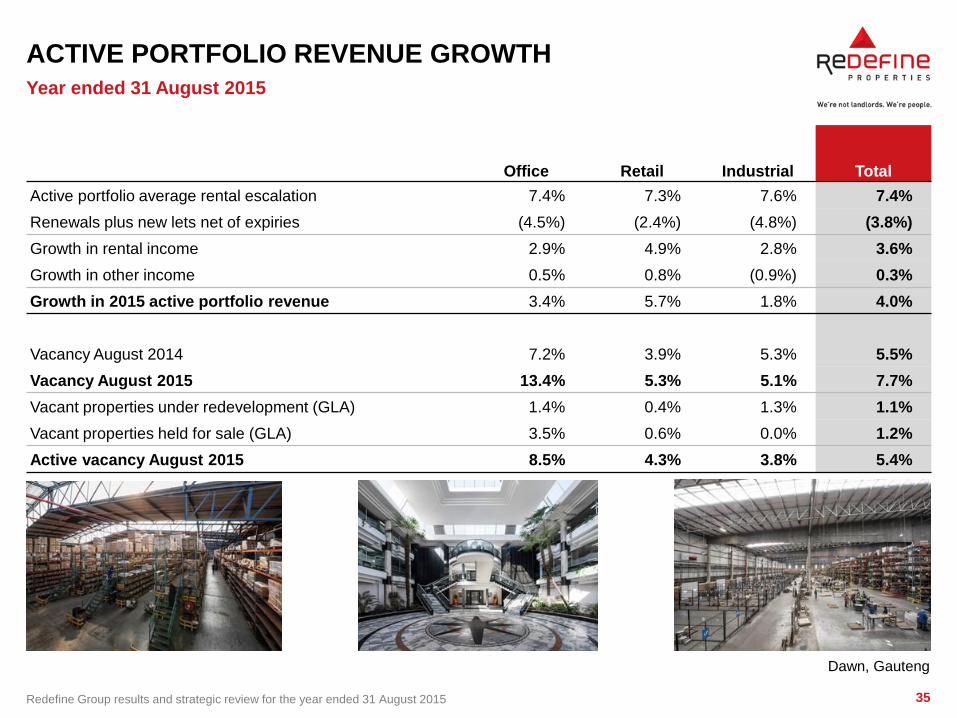
ACTIVE PORTFOLIO REVENUE GROWTH
Office Retail Industrial Total
Active portfolio average rental escalation 7.4% 7.3% 7.6% 7.4%
Renewals plus new lets net of expiries (4.5%) (2.4%) (4.8%) (3.8%)
Growth in rental income 2.9% 4.9% 2.8% 3.6%
Growth in other income 0.5% 0.8% (0.9%) 0.3%
Growth in 2015 active portfolio revenue 3.4% 5.7% 1.8% 4.0%
Vacancy August 2014 7.2% 3.9% 5.3% 5.5%
Vacancy August 2015 13.4% 5.3% 5.1% 7.7%
Vacant properties under redevelopment (GLA) 1.4% 0.4% 1.3% 1.1%
Vacant properties held for sale (GLA) 3.5% 0.6% 0.0% 1.2%
Active vacancy August 2015 8.5% 4.3% 3.8% 5.4%
Year ended 31 August 2015
Dawn, Gauteng
36 Redefine Group results and strategic review for the year ended 31 August 2015
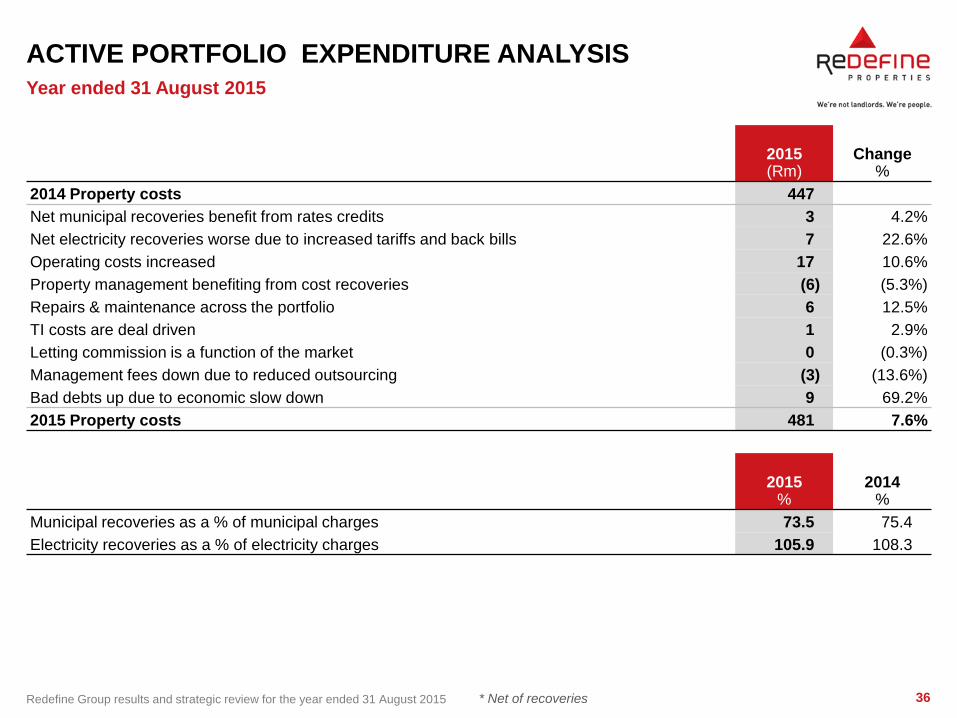
ACTIVE PORTFOLIO EXPENDITURE ANALYSIS
Year ended 31 August 2015
* Net of recoveries
2015 (Rm)
Change %
2014 Property costs 447
Net municipal recoveries benefit from rates credits 3 4.2%
Net electricity recoveries worse due to increased tariffs and back bills 7 22.6%
Operating costs increased 17 10.6%
Property management benefiting from cost recoveries (6) (5.3%)
Repairs & maintenance across the portfolio 6 12.5%
TI costs are deal driven 1 2.9%
Letting commission is a function of the market 0 (0.3%)
Management fees down due to reduced outsourcing (3) (13.6%)
Bad debts up due to economic slow down 9 69.2%
2015 Property costs 481 7.6%
2015 %
2014 %
Municipal recoveries as a % of municipal charges 73.5 75.4
Electricity recoveries as a % of electricity charges 105.9 108.3
37 Redefine Group results and strategic review for the year ended 31 August 2015
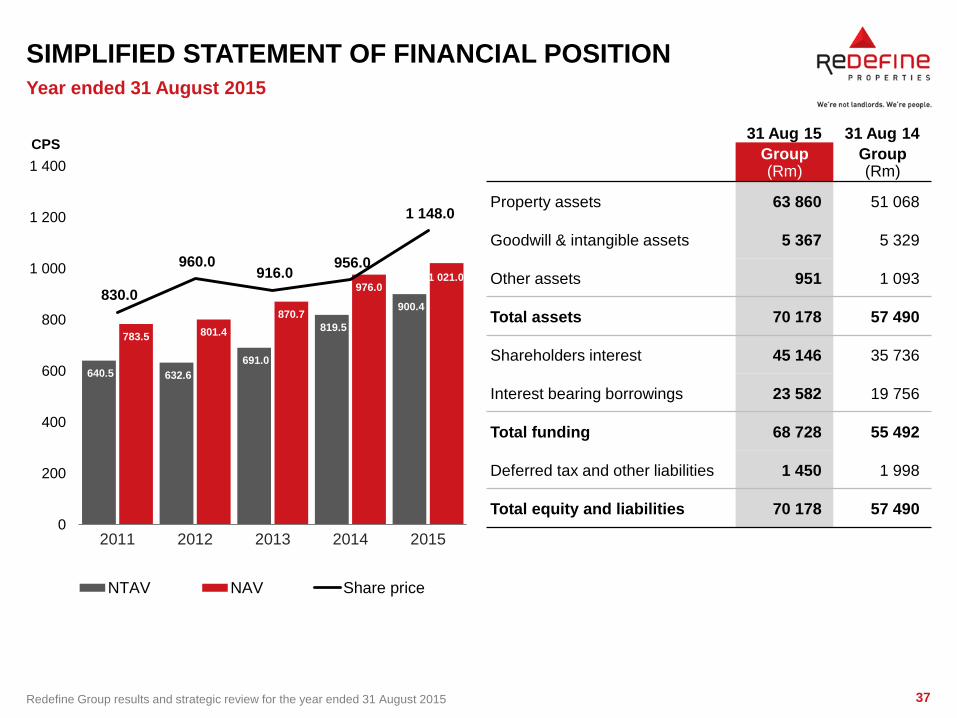
SIMPLIFIED STATEMENT OF FINANCIAL POSITION
640.5 632.6
691.0
819.5
900.4
783.5 801.4
870.7
976.0 1 021.0
830.0
960.0 916.0
956.0
1 148.0
0
200
400
600
800
1 000
1 200
1 400
2011 2012 2013 2014 2015
CPS
NTAV NAV Share price
31 Aug 15 31 Aug 14
Group (Rm)
Group (Rm)
Property assets 63 860 51 068
Goodwill & intangible assets 5 367 5 329
Other assets 951 1 093
Total assets 70 178 57 490
Shareholders interest 45 146 35 736
Interest bearing borrowings 23 582 19 756
Total funding 68 728 55 492
Deferred tax and other liabilities 1 450 1 998
Total equity and liabilities 70 178 57 490
Year ended 31 August 2015
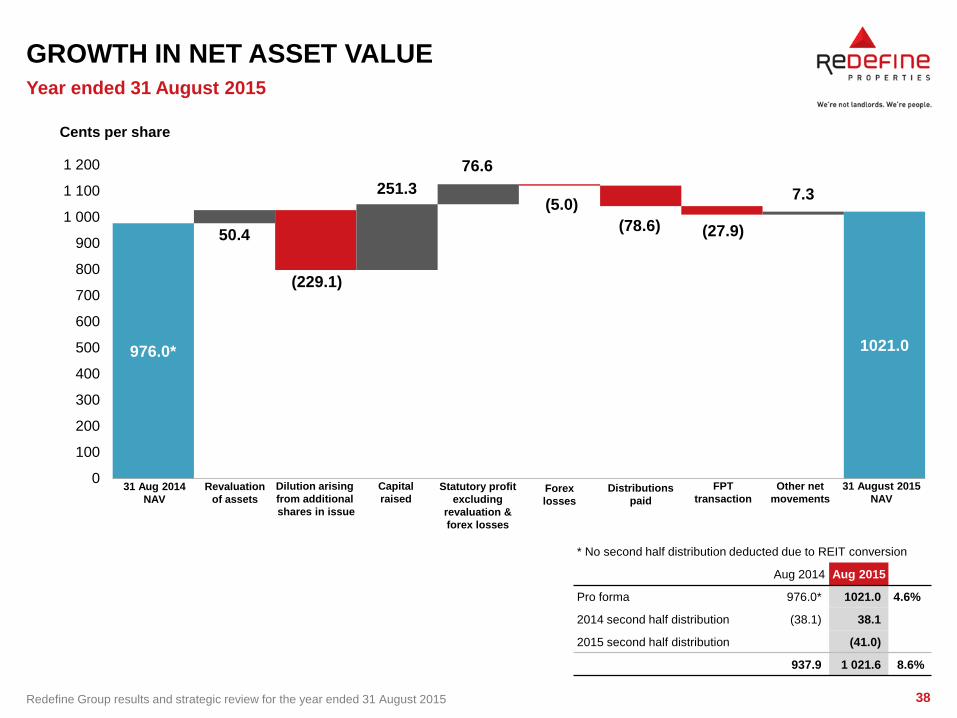
38 Redefine Group results and strategic review for the year ended 31 August 2015
976.0* 1021.0
50.4
(229.1)
251.3
76.6
(5.0)
(78.6) (27.9)
7.3
0
100
200
300
400
500
600
700
800
900
1 000
1 100
1 200
Cents per share
GROWTH IN NET ASSET VALUE
Year ended 31 August 2015
31 Aug 2014
NAV
Revaluation
of assets
Dilution arising
from additional
shares in issue
Capital
raised Statutory profit
excluding
revaluation &
forex losses
Forex
losses
Distributions
paid
Other net
movements
31 August 2015
NAV
FPT
transaction
* No second half distribution deducted due to REIT conversion
Aug 2014 Aug 2015
Pro forma 976.0* 1021.0 4.6%
2014 second half distribution (38.1) 38.1
2015 second half distribution (41.0)
937.9 1 021.6 8.6%
39 Redefine Group results and strategic review for the year ended 31 August 2015
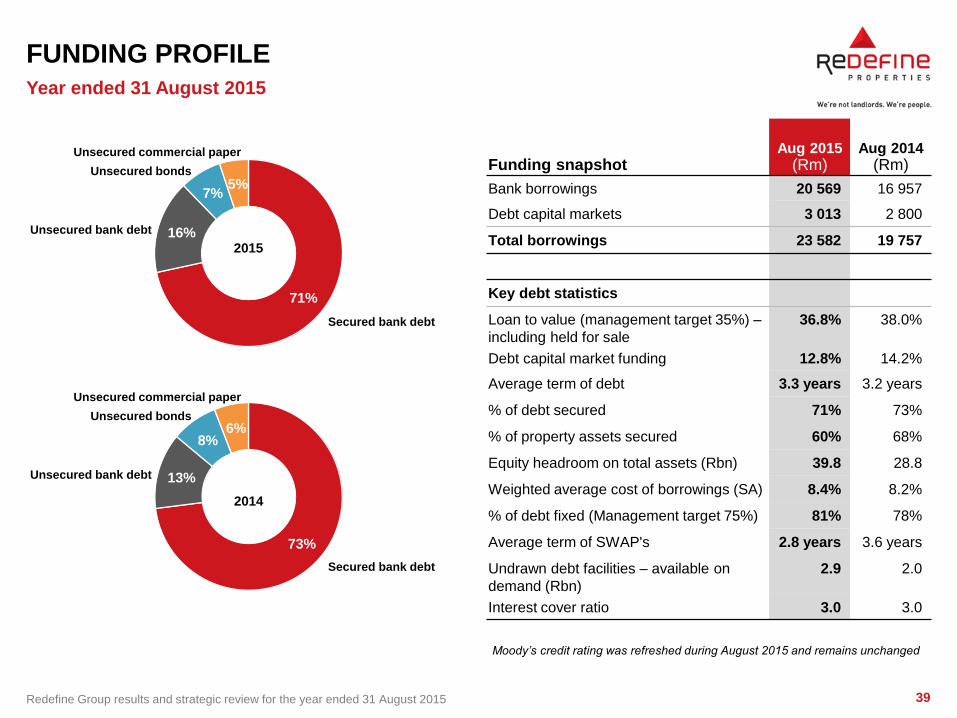
FUNDING PROFILE
Funding snapshot Aug 2015
(Rm) Aug 2014
(Rm)
Bank borrowings 20 569 16 957
Debt capital markets 3 013 2 800
Total borrowings 23 582 19 757
Key debt statistics
Loan to value (management target 35%) –
including held for sale
36.8% 38.0%
Debt capital market funding 12.8% 14.2%
Average term of debt 3.3 years 3.2 years
% of debt secured 71% 73%
% of property assets secured 60% 68%
Equity headroom on total assets (Rbn) 39.8 28.8
Weighted average cost of borrowings (SA) 8.4% 8.2%
% of debt fixed (Management target 75%) 81% 78%
Average term of SWAP's 2.8 years 3.6 years
Undrawn debt facilities – available on
demand (Rbn)
2.9 2.0
Interest cover ratio 3.0 3.0
Year ended 31 August 2015
71%
16%
7% 5%
2015
Unsecured bank debt
Secured bank debt
Unsecured bonds
Unsecured commercial paper
73%
13%
8% 6%
2014
Unsecured bank debt
Secured bank debt
Unsecured bonds
Unsecured commercial paper
Moody’s credit rating was refreshed during August 2015 and remains unchanged
40 Redefine Group results and strategic review for the year ended 31 August 2015
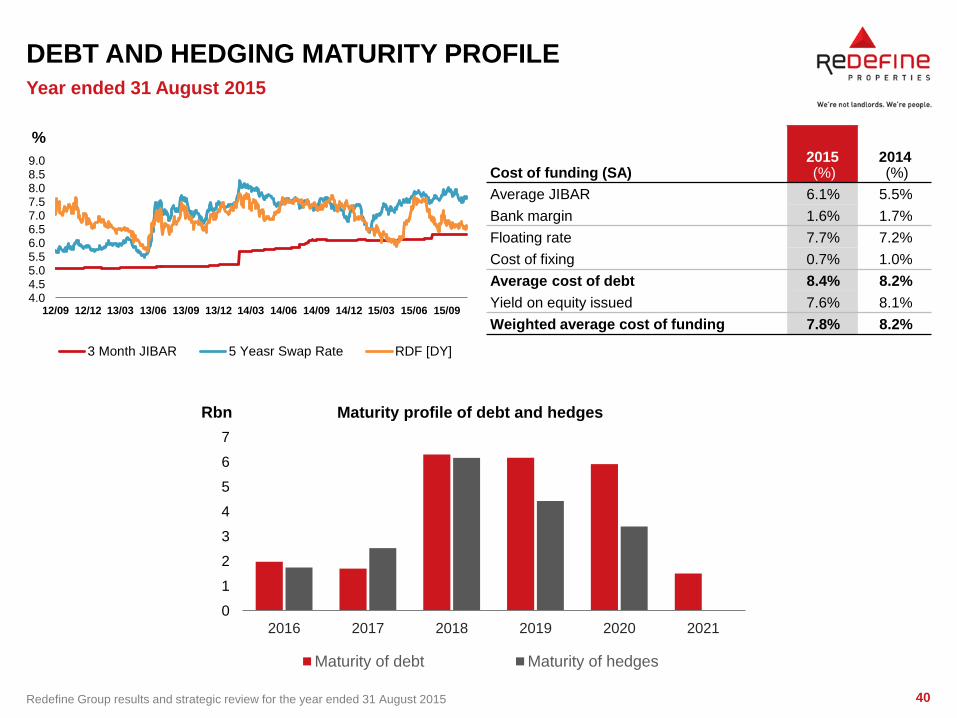
DEBT AND HEDGING MATURITY PROFILE
0
1
2
3
4
5
6
7
2016 2017 2018 2019 2020 2021
Rbn Maturity profile of debt and hedges
Maturity of debt Maturity of hedges
Cost of funding (SA) 2015 (%)
2014 (%)
Average JIBAR 6.1% 5.5%
Bank margin 1.6% 1.7%
Floating rate 7.7% 7.2%
Cost of fixing 0.7% 1.0%
Average cost of debt 8.4% 8.2%
Yield on equity issued 7.6% 8.1%
Weighted average cost of funding 7.8% 8.2%
Year ended 31 August 2015
4.04.55.05.56.06.57.07.58.08.59.0
12/09 12/12 13/03 13/06 13/09 13/12 14/03 14/06 14/09 14/12 15/03 15/06 15/09
%
3 Month JIBAR 5 Yeasr Swap Rate RDF [DY]
Section 4 CONCLUSION AND PROSPECTS
Andrew Konig
42 Redefine Group results and strategic review for the year ended 31 August 2015
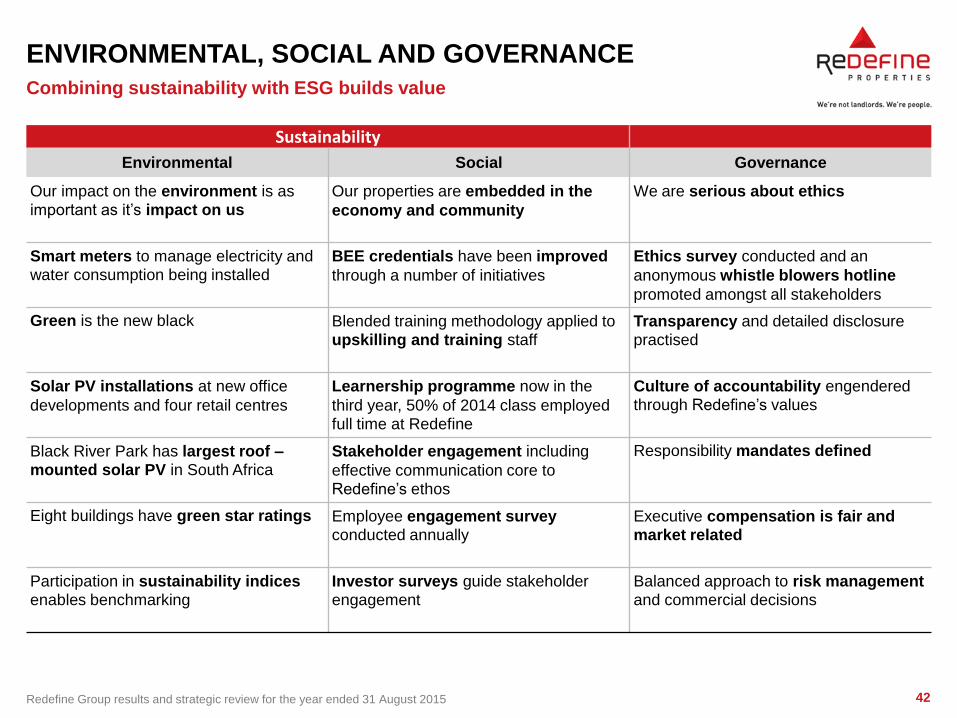
ENVIRONMENTAL, SOCIAL AND GOVERNANCE
Combining sustainability with ESG builds value
Sustainability
Environmental Social Governance
Our impact on the environment is as important as it’s impact on us
Our properties are embedded in the
economy and community
We are serious about ethics
Smart meters to manage electricity and water consumption being installed
BEE credentials have been improved
through a number of initiatives
Ethics survey conducted and an
anonymous whistle blowers hotline
promoted amongst all stakeholders
Green is the new black Blended training methodology applied to upskilling and training staff
Transparency and detailed disclosure practised
Solar PV installations at new office
developments and four retail centres
Learnership programme now in the
third year, 50% of 2014 class employed full time at Redefine
Culture of accountability engendered through Redefine’s values
Black River Park has largest roof – mounted solar PV in South Africa
Stakeholder engagement including
effective communication core to Redefine’s ethos
Responsibility mandates defined
Eight buildings have green star ratings Employee engagement survey conducted annually
Executive compensation is fair and market related
Participation in sustainability indices enables benchmarking
Investor surveys guide stakeholder engagement
Balanced approach to risk management and commercial decisions
43 Redefine Group results and strategic review for the year ended 31 August 2015
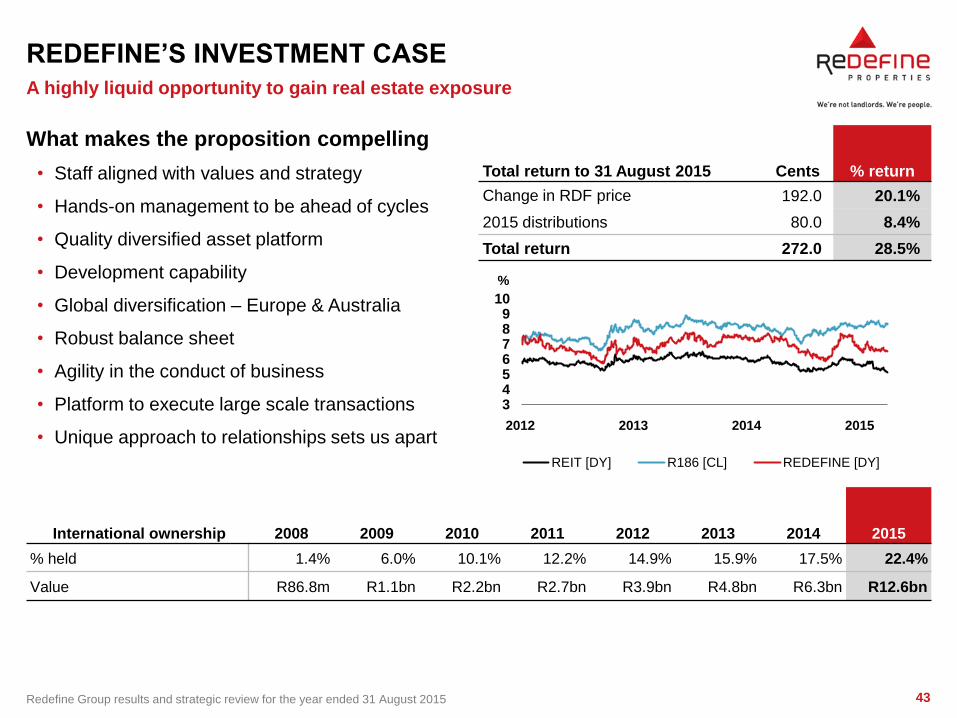
3456789
10
%
REIT [DY] R186 [CL] REDEFINE [DY]
REDEFINE’S INVESTMENT CASE
What makes the proposition compelling
• Staff aligned with values and strategy
• Hands-on management to be ahead of cycles
• Quality diversified asset platform
• Development capability
• Global diversification – Europe & Australia
• Robust balance sheet
• Agility in the conduct of business
• Platform to execute large scale transactions
• Unique approach to relationships sets us apart
International ownership 2008 2009 2010 2011 2012 2013 2014 2015
% held 1.4% 6.0% 10.1% 12.2% 14.9% 15.9% 17.5% 22.4%
Value R86.8m R1.1bn R2.2bn R2.7bn R3.9bn R4.8bn R6.3bn R12.6bn
Total return to 31 August 2015 Cents % return
Change in RDF price 192.0 20.1%
2015 distributions 80.0 8.4%
Total return 272.0 28.5%
A highly liquid opportunity to gain real estate exposure
2012 2013 2014 2015
44 Redefine Group results and strategic review for the year ended 31 August 2015
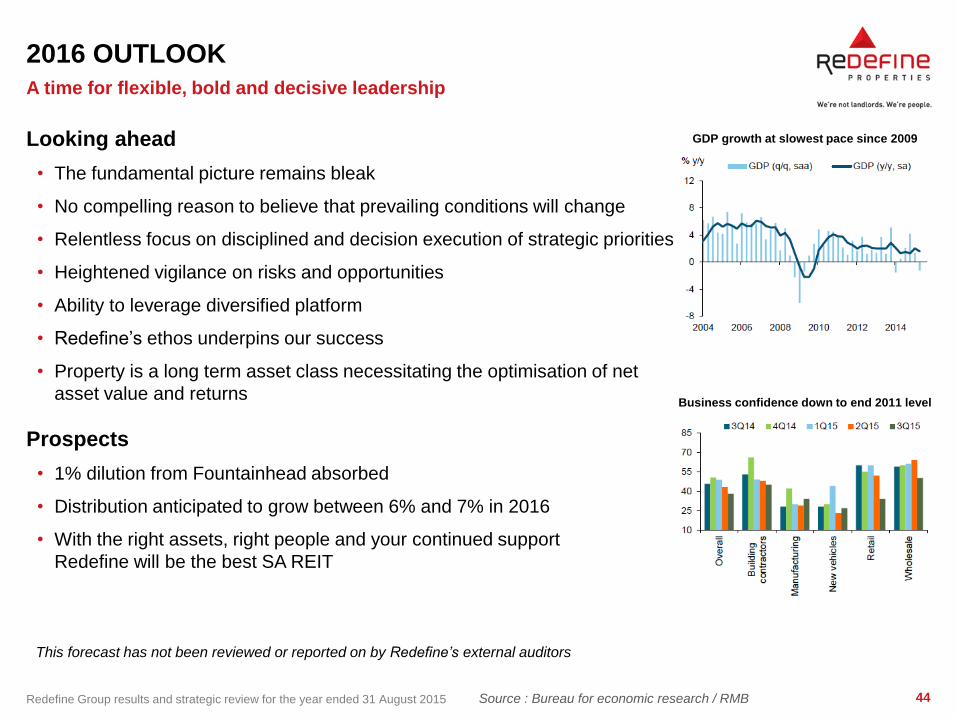
2016 OUTLOOK
Source : Bureau for economic research / RMB
Looking ahead
• The fundamental picture remains bleak
• No compelling reason to believe that prevailing conditions will change
• Relentless focus on disciplined and decision execution of strategic priorities
• Heightened vigilance on risks and opportunities
• Ability to leverage diversified platform
• Redefine’s ethos underpins our success
• Property is a long term asset class necessitating the optimisation of net
asset value and returns
Prospects
• 1% dilution from Fountainhead absorbed
• Distribution anticipated to grow between 6% and 7% in 2016
• With the right assets, right people and your continued support
Redefine will be the best SA REIT
A time for flexible, bold and decisive leadership
This forecast has not been reviewed or reported on by Redefine’s external auditors
GDP growth at slowest pace since 2009
Business confidence down to end 2011 level
Section 5 SUPPLEMENTARY INFORMATION
46 Redefine Group results and strategic review for the year ended 31 August 2015
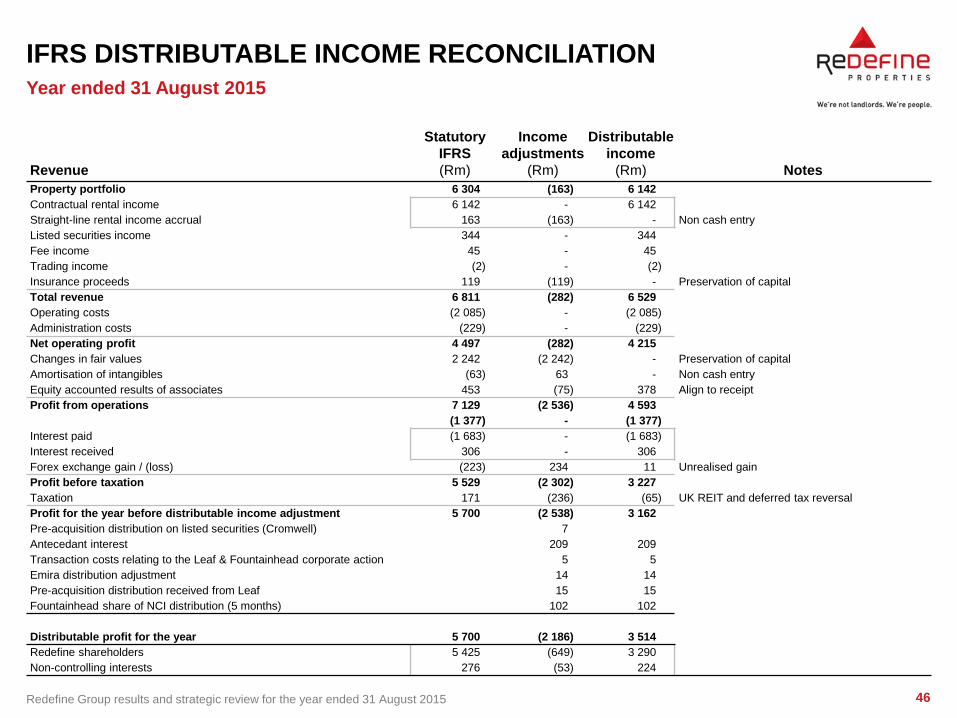
IFRS DISTRIBUTABLE INCOME RECONCILIATION
Revenue
Statutory
IFRS
(Rm)
Income
adjustments
(Rm)
Distributable
income
(Rm) Notes
Property portfolio 6 304 (163) 6 142
Contractual rental income 6 142 - 6 142
Straight-line rental income accrual 163 (163) - Non cash entry
Listed securities income 344 - 344
Fee income 45 - 45
Trading income (2) - (2)
Insurance proceeds 119 (119) - Preservation of capital
Total revenue 6 811 (282) 6 529
Operating costs (2 085) - (2 085)
Administration costs (229) - (229)
Net operating profit 4 497 (282) 4 215
Changes in fair values 2 242 (2 242) - Preservation of capital
Amortisation of intangibles (63) 63 - Non cash entry
Equity accounted results of associates 453 (75) 378 Align to receipt
Profit from operations 7 129 (2 536) 4 593
(1 377) - (1 377)
Interest paid (1 683) - (1 683)
Interest received 306 - 306
Forex exchange gain / (loss) (223) 234 11 Unrealised gain
Profit before taxation 5 529 (2 302) 3 227
Taxation 171 (236) (65) UK REIT and deferred tax reversal
Profit for the year before distributable income adjustment 5 700 (2 538) 3 162
Pre-acquisition distribution on listed securities (Cromwell) 7
Antecedant interest 209 209
Transaction costs relating to the Leaf & Fountainhead corporate action 5 5
Emira distribution adjustment 14 14
Pre-acquisition distribution received from Leaf 15 15
Fountainhead share of NCI distribution (5 months) 102 102
Distributable profit for the year 5 700 (2 186) 3 514
Redefine shareholders 5 425 (649) 3 290
Non-controlling interests 276 (53) 224
Year ended 31 August 2015
47 Redefine Group results and strategic review for the year ended 31 August 2015
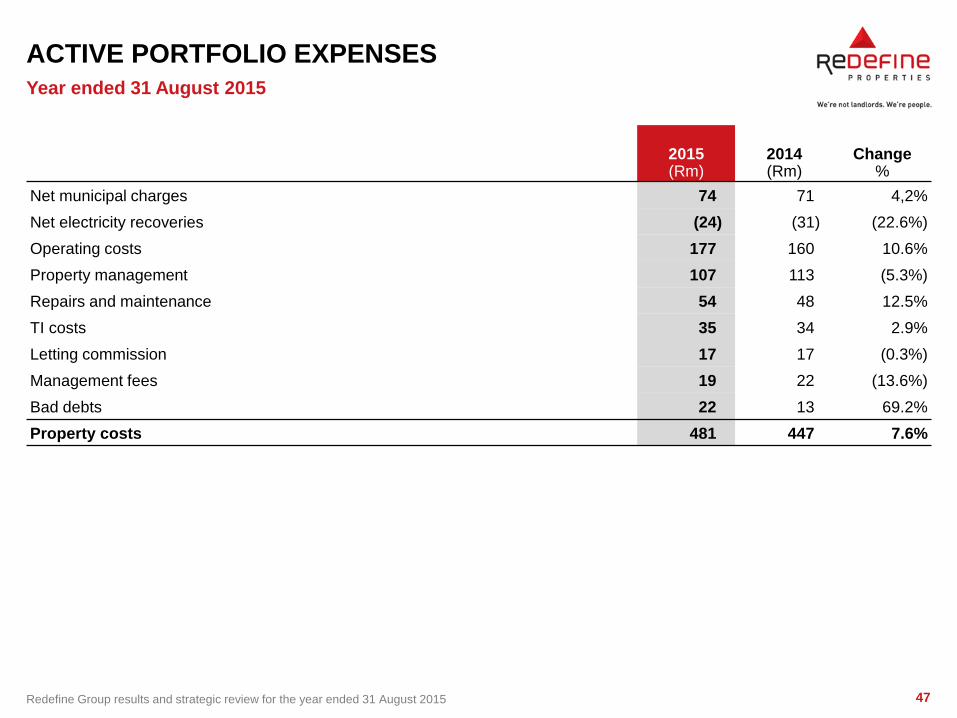
ACTIVE PORTFOLIO EXPENSES
Year ended 31 August 2015
2015 (Rm)
2014 (Rm)
Change %
Net municipal charges 74 71 4,2%
Net electricity recoveries (24) (31) (22.6%)
Operating costs 177 160 10.6%
Property management 107 113 (5.3%)
Repairs and maintenance 54 48 12.5%
TI costs 35 34 2.9%
Letting commission 17 17 (0.3%)
Management fees 19 22 (13.6%)
Bad debts 22 13 69.2%
Property costs 481 447 7.6%
48 Redefine Group results and strategic review for the year ended 31 August 2015
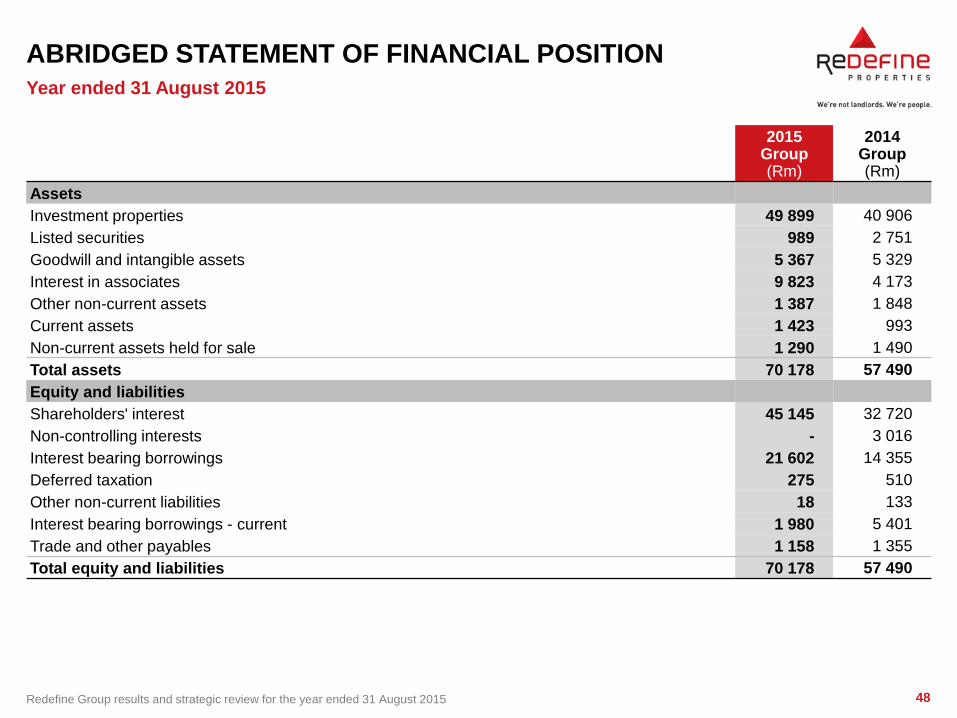
ABRIDGED STATEMENT OF FINANCIAL POSITION
Year ended 31 August 2015
2015 Group (Rm)
2014 Group (Rm)
Assets
Investment properties 49 899 40 906
Listed securities 989 2 751
Goodwill and intangible assets 5 367 5 329
Interest in associates 9 823 4 173
Other non-current assets 1 387 1 848
Current assets 1 423 993
Non-current assets held for sale 1 290 1 490
Total assets 70 178 57 490
Equity and liabilities
Shareholders' interest 45 145 32 720
Non-controlling interests - 3 016
Interest bearing borrowings 21 602 14 355
Deferred taxation 275 510
Other non-current liabilities 18 133
Interest bearing borrowings - current 1 980 5 401
Trade and other payables 1 158 1 355
Total equity and liabilities 70 178 57 490
49 Redefine Group results and strategic review for the year ended 31 August 2015
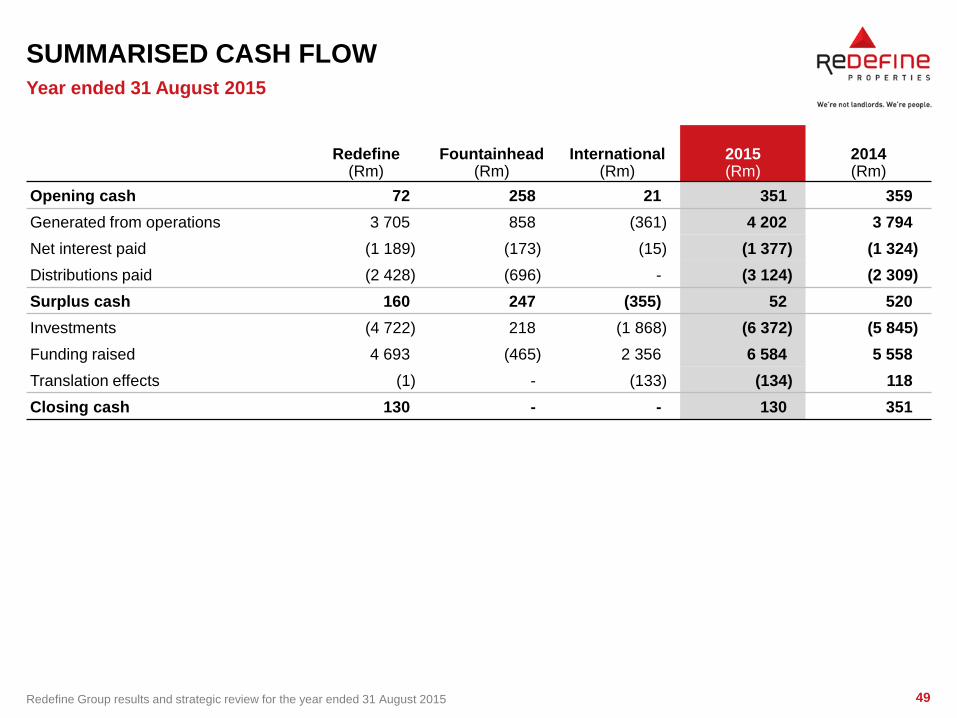
SUMMARISED CASH FLOW
Year ended 31 August 2015
Redefine
(Rm) Fountainhead
(Rm) International
(Rm) 2015 (Rm)
2014 (Rm)
Opening cash 72 258 21 351 359
Generated from operations 3 705 858 (361) 4 202 3 794
Net interest paid (1 189) (173) (15) (1 377) (1 324)
Distributions paid (2 428) (696) - (3 124) (2 309)
Surplus cash 160 247 (355) 52 520
Investments (4 722) 218 (1 868) (6 372) (5 845)
Funding raised 4 693 (465) 2 356 6 584 5 558
Translation effects (1) - (133) (134) 118
Closing cash 130 - - 130 351
50 Redefine Group results and strategic review for the year ended 31 August 2015
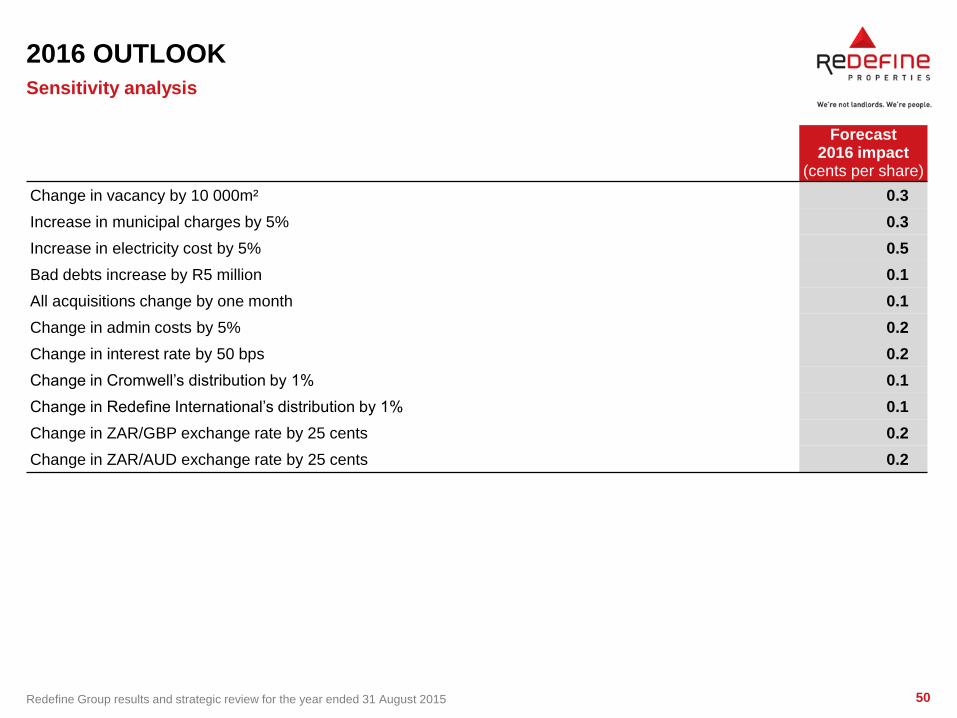
2016 OUTLOOK
Forecast 2016 impact
(cents per share)
Change in vacancy by 10 000m² 0.3
Increase in municipal charges by 5% 0.3
Increase in electricity cost by 5% 0.5
Bad debts increase by R5 million 0.1
All acquisitions change by one month 0.1
Change in admin costs by 5% 0.2
Change in interest rate by 50 bps 0.2
Change in Cromwell’s distribution by 1% 0.1
Change in Redefine International’s distribution by 1% 0.1
Change in ZAR/GBP exchange rate by 25 cents 0.2
Change in ZAR/AUD exchange rate by 25 cents 0.2
Sensitivity analysis
51 Redefine Group results and strategic review for the year ended 31 August 2015
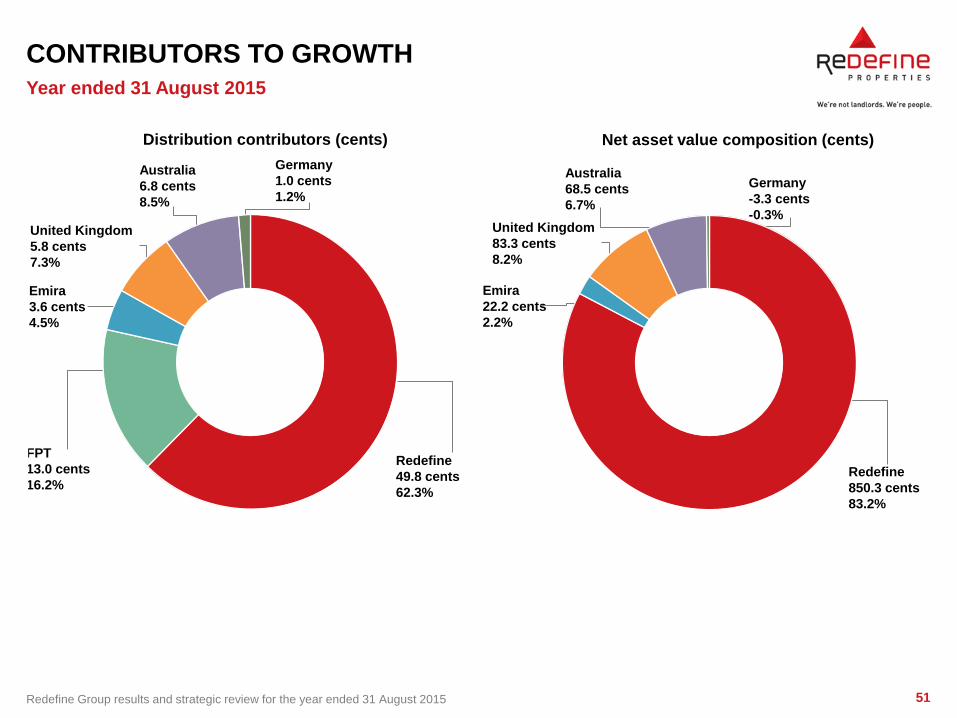
CONTRIBUTORS TO GROWTH
Year ended 31 August 2015
United Kingdom
5.8 cents
7.3%
FPT
13.0 cents
16.2%
Redefine
49.8 cents
62.3%
Emira
3.6 cents
4.5%
Australia
6.8 cents
8.5%
Germany
1.0 cents
1.2%
Redefine
850.3 cents
83.2%
Emira
22.2 cents
2.2%
United Kingdom
83.3 cents
8.2%
Australia
68.5 cents
6.7%
Germany
-3.3 cents
-0.3%
Net asset value composition (cents) Distribution contributors (cents)
52 Redefine Group results and strategic review for the year ended 31 August 2015
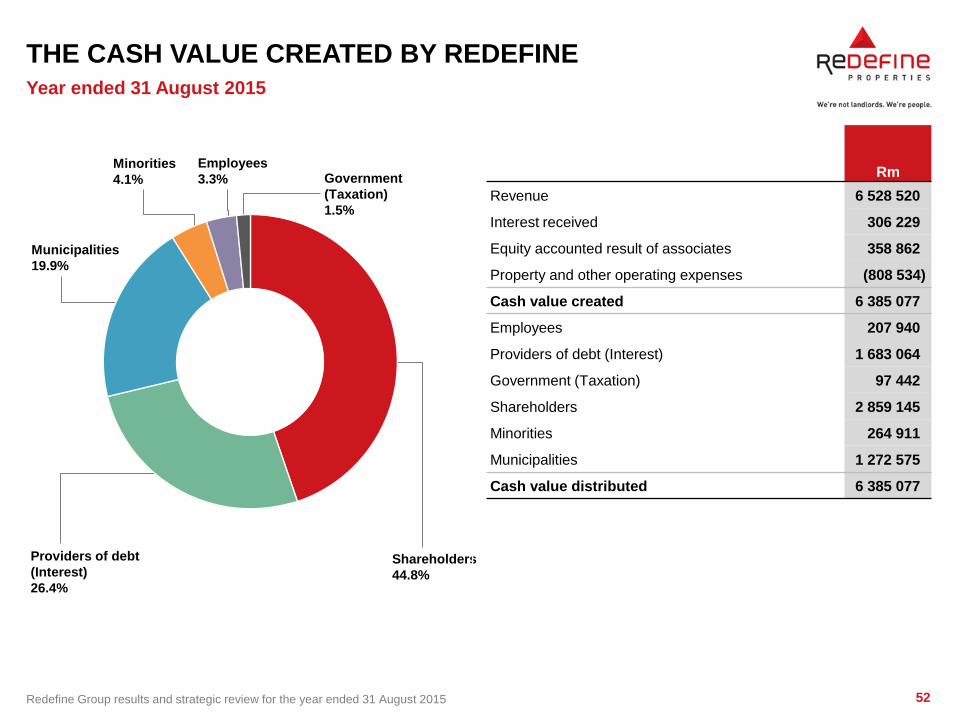
THE CASH VALUE CREATED BY REDEFINE
Rm
Revenue 6 528 520
Interest received 306 229
Equity accounted result of associates 358 862
Property and other operating expenses (808 534)
Cash value created 6 385 077
Employees 207 940
Providers of debt (Interest) 1 683 064
Government (Taxation) 97 442
Shareholders 2 859 145
Minorities 264 911
Municipalities 1 272 575
Cash value distributed 6 385 077
Year ended 31 August 2015
Minorities
4.1%
Employees
3.3% Government
(Taxation)
1.5%
Municipalities
19.9%
Providers of debt
(Interest)
26.4%
Shareholders
44.8%
53 Redefine Group results and strategic review for the year ended 31 August 2015
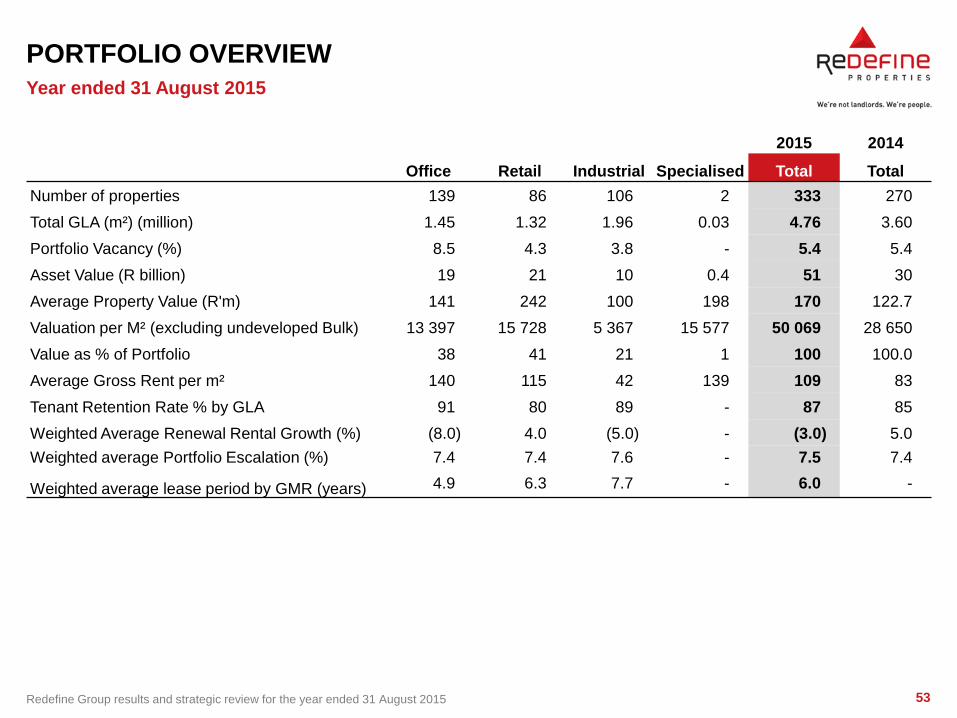
PORTFOLIO OVERVIEW
2015 2014
Office Retail Industrial Specialised Total Total
Number of properties 139 86 106 2 333 270
Total GLA (m²) (million) 1.45 1.32 1.96 0.03 4.76 3.60
Portfolio Vacancy (%) 8.5 4.3 3.8 - 5.4 5.4
Asset Value (R billion) 19 21 10 0.4 51 30
Average Property Value (R'm) 141 242 100 198 170 122.7
Valuation per M² (excluding undeveloped Bulk) 13 397 15 728 5 367 15 577 50 069 28 650
Value as % of Portfolio 38 41 21 1 100 100.0
Average Gross Rent per m² 140 115 42 139 109 83
Tenant Retention Rate % by GLA 91 80 89 - 87 85
Weighted Average Renewal Rental Growth (%) (8.0) 4.0 (5.0) - (3.0) 5.0
Weighted average Portfolio Escalation (%) 7.4 7.4 7.6 - 7.5 7.4
Weighted average lease period by GMR (years) 4.9 6.3 7.7 - 6.0 -
Year ended 31 August 2015
54 Redefine Group results and strategic review for the year ended 31 August 2015
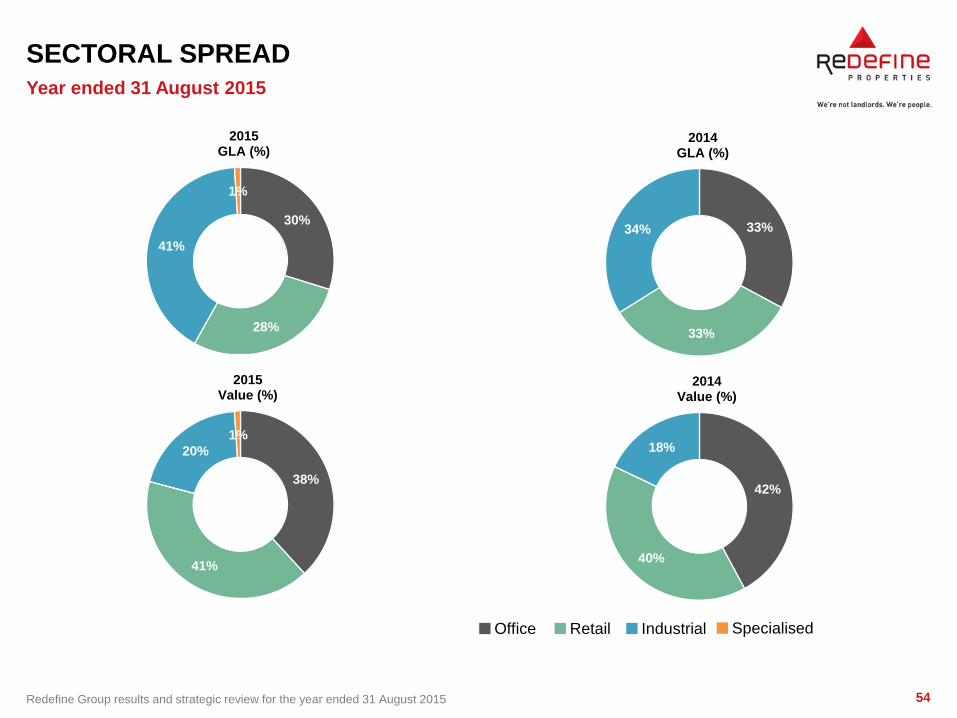
SECTORAL SPREAD
Year ended 31 August 2015
Office Retail Industrial Specialised
30%
28%
41%
1%
2015 GLA (%)
33%
33%
34%
2014 GLA (%)
38%
41%
20%
1%
2015 Value (%)
42%
40%
18%
2014 Value (%)
55 Redefine Group results and strategic review for the year ended 31 August 2015
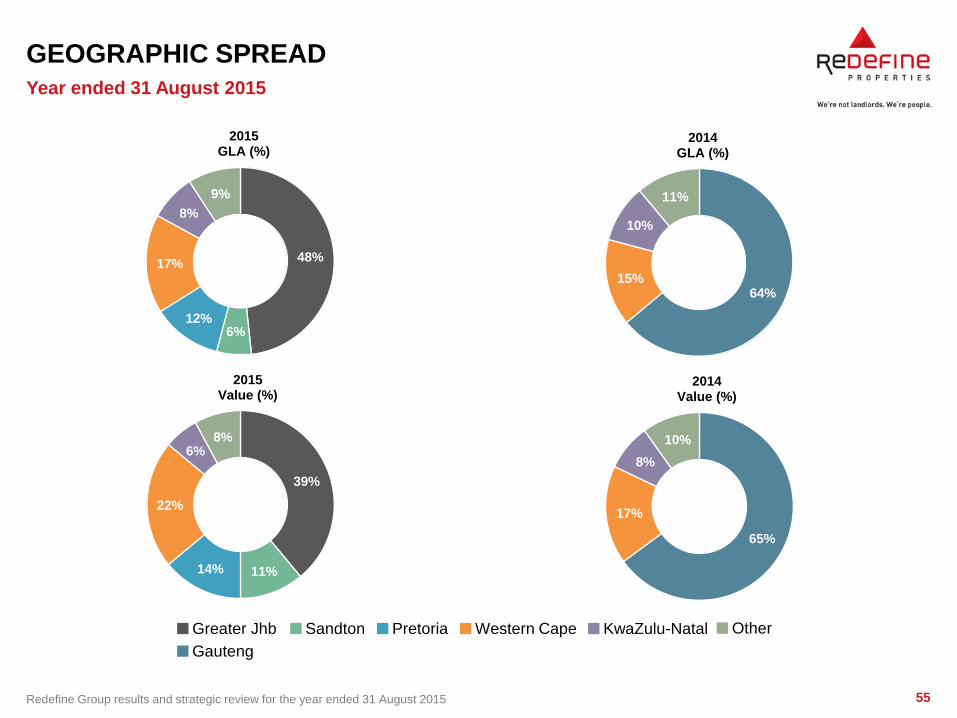
GEOGRAPHIC SPREAD
Year ended 31 August 2015
Pretoria Western Cape KwaZulu-Natal Other
48%
6% 12%
17%
8%
9%
2015 GLA (%)
Greater Jhb Sandton
39%
11% 14%
22%
6% 8%
2015 Value (%)
64% 15%
10%
11%
2014 GLA (%)
Gauteng
65%
17%
8%
10%
2014 Value (%)
56 Redefine Group results and strategic review for the year ended 31 August 2015
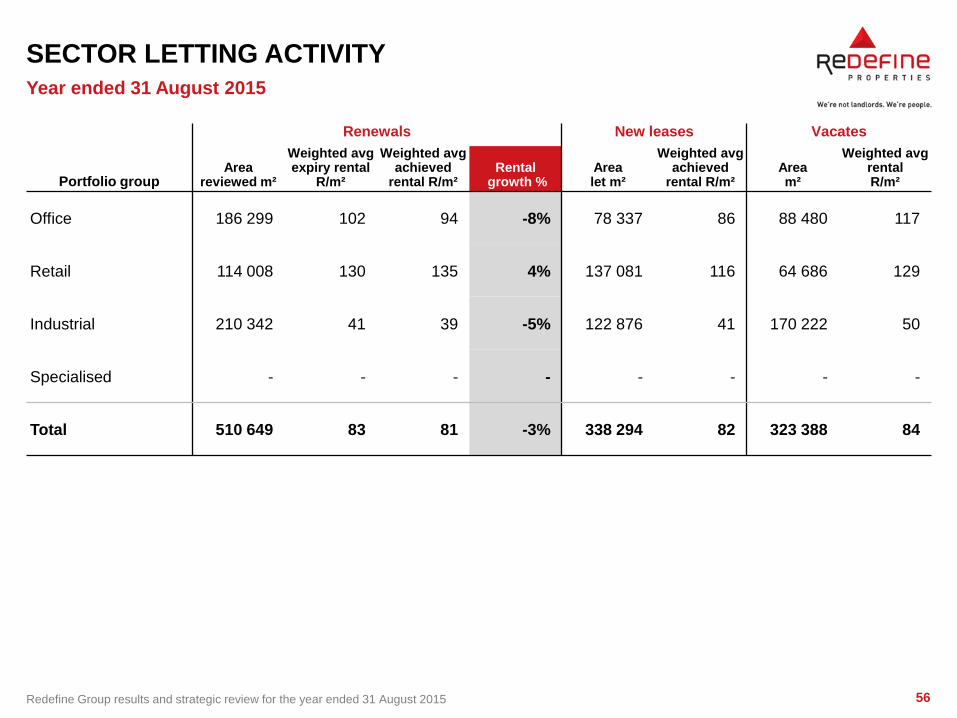
SECTOR LETTING ACTIVITY
Renewals New leases Vacates
Portfolio group Area
reviewed m²
Weighted avg expiry rental
R/m²
Weighted avg achieved
rental R/m² Rental
growth % Area let m²
Weighted avg achieved
rental R/m² Area m²
Weighted avg rental R/m²
Office 186 299 102 94 -8% 78 337 86 88 480 117
Retail 114 008 130 135 4% 137 081 116 64 686 129
Industrial 210 342 41 39 -5% 122 876 41 170 222 50
Specialised - - - - - - - -
Total 510 649 83 81 -3% 338 294 82 323 388 84
Year ended 31 August 2015
57 Redefine Group results and strategic review for the year ended 31 August 2015
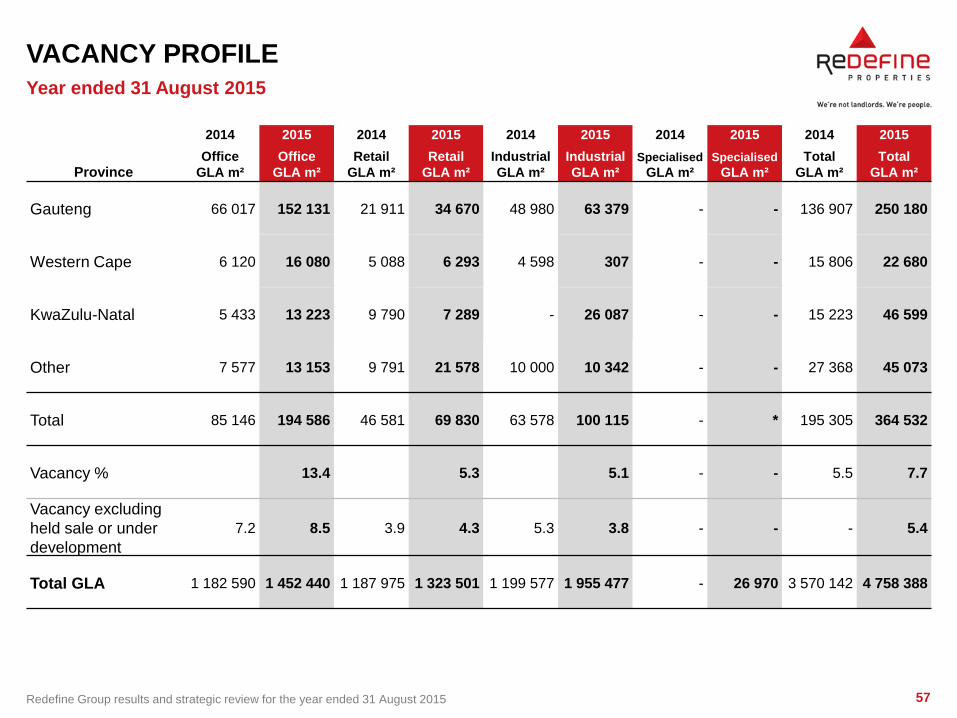
VACANCY PROFILE
2014 2015 2014 2015 2014 2015 2014 2015 2014 2015
Province Office
GLA m²
Office
GLA m²
Retail
GLA m²
Retail
GLA m²
Industrial
GLA m²
Industrial
GLA m²
Specialised
GLA m²
Specialised
GLA m²
Total
GLA m²
Total
GLA m²
Gauteng 66 017 152 131 21 911 34 670 48 980 63 379 - - 136 907 250 180
Western Cape 6 120 16 080 5 088 6 293 4 598 307 - - 15 806 22 680
KwaZulu-Natal 5 433 13 223 9 790 7 289 - 26 087 - - 15 223 46 599
Other 7 577 13 153 9 791 21 578 10 000 10 342 - - 27 368 45 073
Total 85 146 194 586 46 581 69 830 63 578 100 115 - * 195 305 364 532
Vacancy % 13.4 5.3 5.1 - - 5.5 7.7
Vacancy excluding
held sale or under
development
7.2 8.5 3.9 4.3 5.3 3.8 - - - 5.4
Total GLA 1 182 590 1 452 440 1 187 975 1 323 501 1 199 577 1 955 477 - 26 970 3 570 142 4 758 388
Year ended 31 August 2015
58 Redefine Group results and strategic review for the year ended 31 August 2015
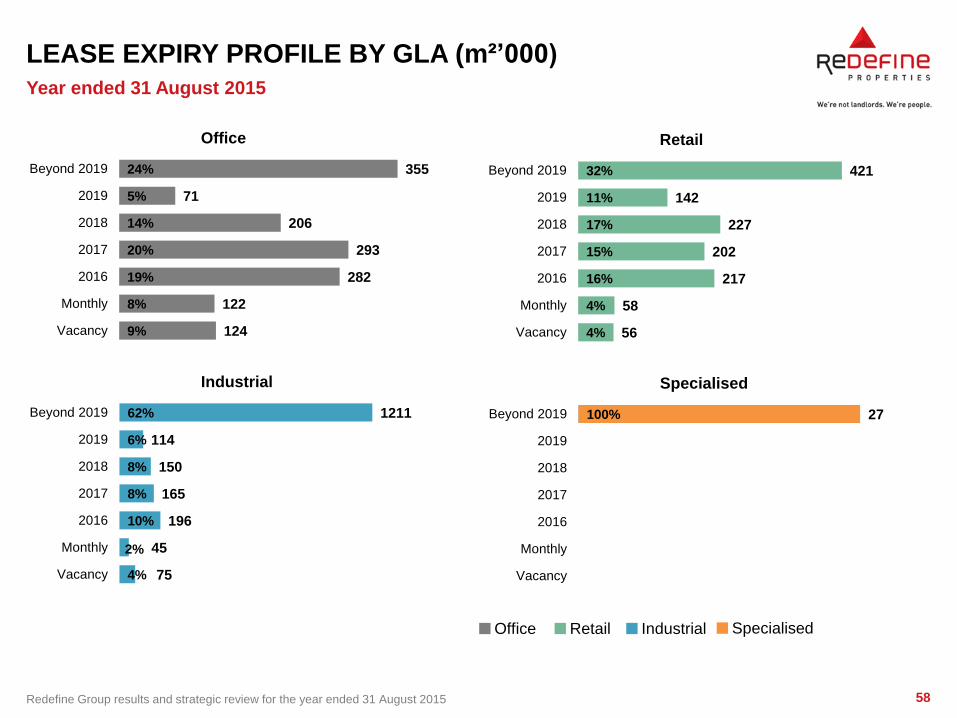
LEASE EXPIRY PROFILE BY GLA (m²’000)
9%
8%
19%
20%
14%
5%
24%
124
122
282
293
206
71
355
Vacancy
Monthly
2016
2017
2018
2019
Beyond 2019
Office
4%
2%
10%
8%
8%
6%
62%
75
45
196
165
150
114
1211
Vacancy
Monthly
2016
2017
2018
2019
Beyond 2019
Industrial
Year ended 31 August 2015
4%
4%
16%
15%
17%
11%
32%
56
58
217
202
227
142
421
Vacancy
Monthly
2016
2017
2018
2019
Beyond 2019
Retail
100% 27
Vacancy
Monthly
2016
2017
2018
2019
Beyond 2019
Specialised
Office Retail Industrial Specialised
59 Redefine Group results and strategic review for the year ended 31 August 2015
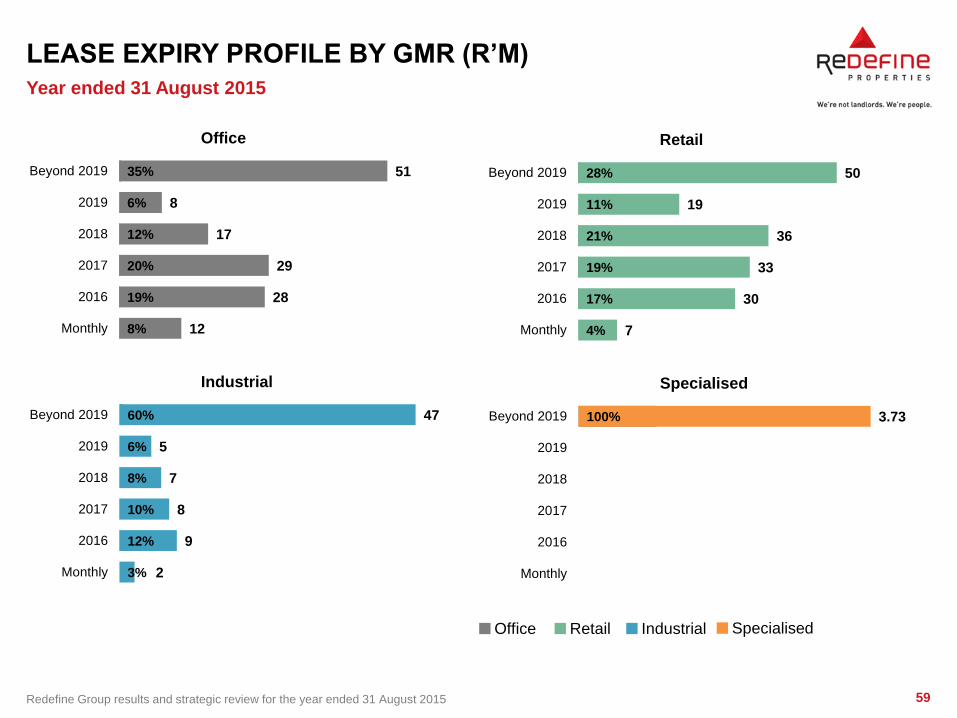
LEASE EXPIRY PROFILE BY GMR (R’M)
8%
19%
20%
12%
6%
35%
12
28
29
17
8
51
Monthly
2016
2017
2018
2019
Beyond 2019
Office
3%
12%
10%
8%
6%
60%
2
9
8
7
5
47
Monthly
2016
2017
2018
2019
Beyond 2019
Industrial
Year ended 31 August 2015
4%
17%
19%
21%
11%
28%
7
30
33
36
19
50
Monthly
2016
2017
2018
2019
Beyond 2019
Retail
100% 3.73
Monthly
2016
2017
2018
2019
Beyond 2019
Specialised
Office Retail Industrial Specialised
60 Redefine Group results and strategic review for the year ended 31 August 2015
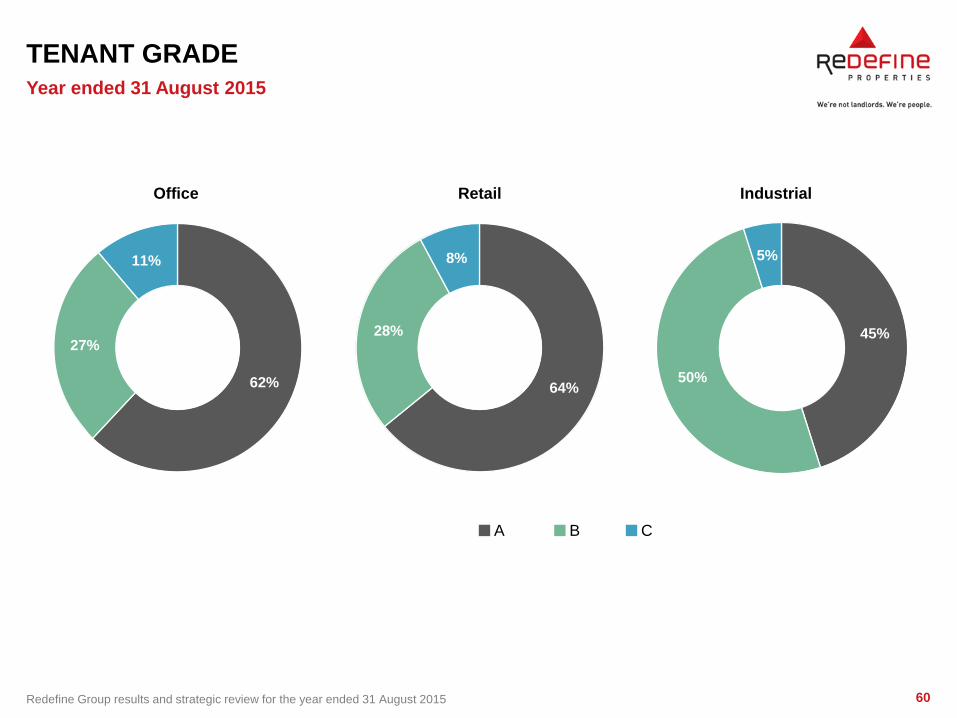
TENANT GRADE
62%
27%
11%
Office
64%
28%
8%
Retail
45%
50%
5%
Industrial
Year ended 31 August 2015
A B C
61 Redefine Group results and strategic review for the year ended 31 August 2015
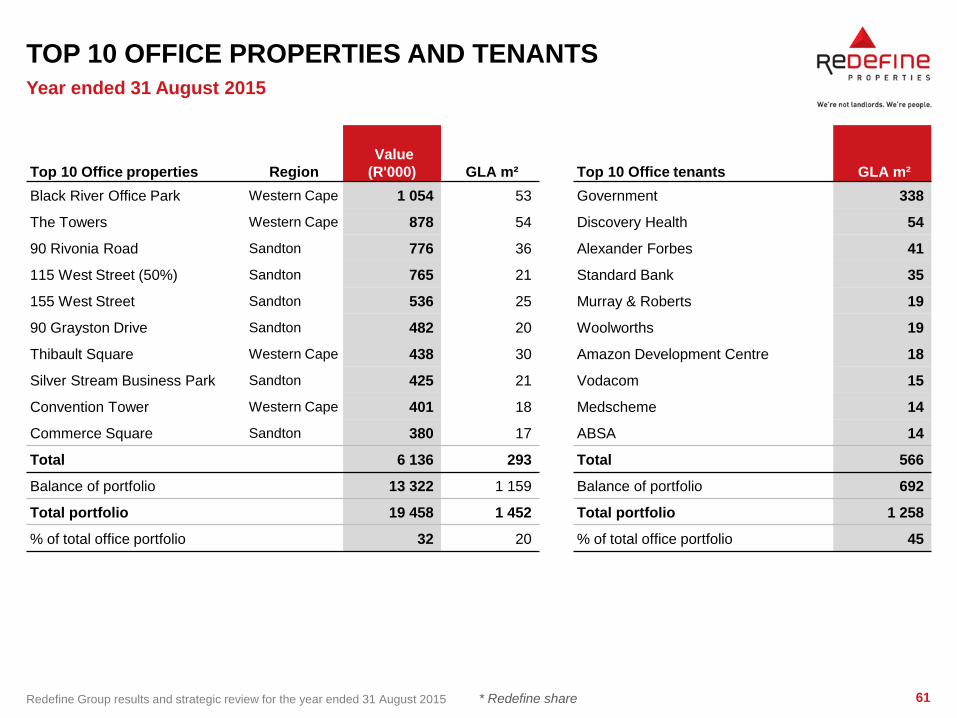
TOP 10 OFFICE PROPERTIES AND TENANTS
* Redefine share
Top 10 Office properties Region
Value
(R'000) GLA m² Top 10 Office tenants GLA m²
Black River Office Park Western Cape 1 054 53 Government 338
The Towers Western Cape 878 54 Discovery Health 54
90 Rivonia Road Sandton 776 36 Alexander Forbes 41
115 West Street (50%) Sandton 765 21 Standard Bank 35
155 West Street Sandton 536 25 Murray & Roberts 19
90 Grayston Drive Sandton 482 20 Woolworths 19
Thibault Square Western Cape 438 30 Amazon Development Centre 18
Silver Stream Business Park Sandton 425 21 Vodacom 15
Convention Tower Western Cape 401 18 Medscheme 14
Commerce Square Sandton 380 17 ABSA 14
Total 6 136 293 Total 566
Balance of portfolio 13 322 1 159 Balance of portfolio 692
Total portfolio 19 458 1 452 Total portfolio 1 258
% of total office portfolio 32 20 % of total office portfolio 45
Year ended 31 August 2015
62 Redefine Group results and strategic review for the year ended 31 August 2015
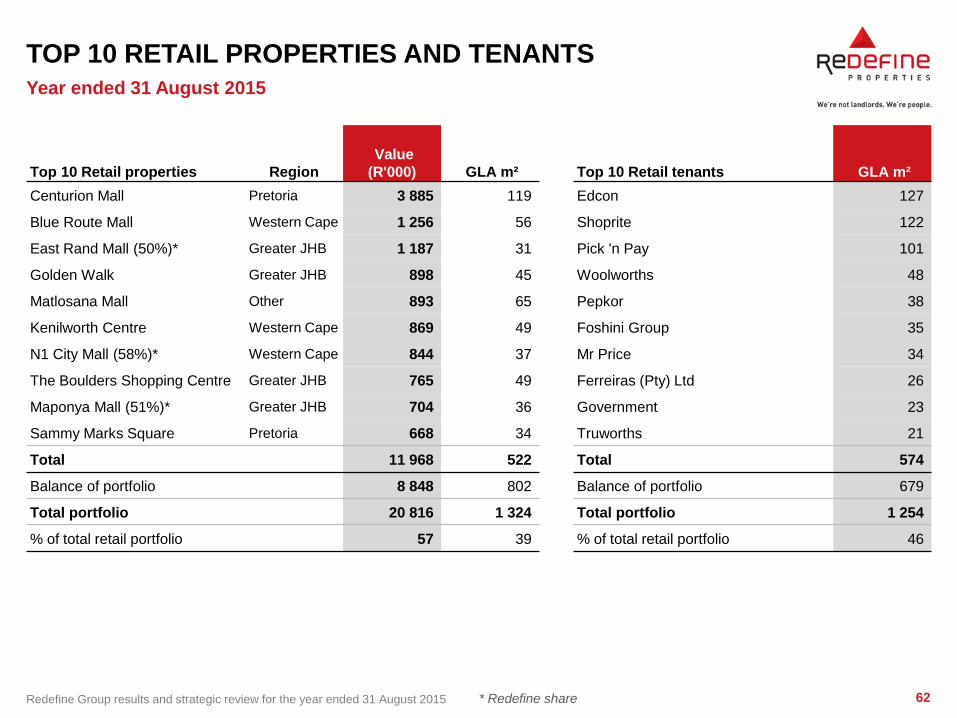
TOP 10 RETAIL PROPERTIES AND TENANTS
* Redefine share
Top 10 Retail properties Region
Value
(R'000) GLA m² Top 10 Retail tenants GLA m²
Centurion Mall Pretoria 3 885 119 Edcon 127
Blue Route Mall Western Cape 1 256 56 Shoprite 122
East Rand Mall (50%)* Greater JHB 1 187 31 Pick 'n Pay 101
Golden Walk Greater JHB 898 45 Woolworths 48
Matlosana Mall Other 893 65 Pepkor 38
Kenilworth Centre Western Cape 869 49 Foshini Group 35
N1 City Mall (58%)* Western Cape 844 37 Mr Price 34
The Boulders Shopping Centre Greater JHB 765 49 Ferreiras (Pty) Ltd 26
Maponya Mall (51%)* Greater JHB 704 36 Government 23
Sammy Marks Square Pretoria 668 34 Truworths 21
Total 11 968 522 Total 574
Balance of portfolio 8 848 802 Balance of portfolio 679
Total portfolio 20 816 1 324 Total portfolio 1 254
% of total retail portfolio 57 39 % of total retail portfolio 46
Year ended 31 August 2015
63 Redefine Group results and strategic review for the year ended 31 August 2015
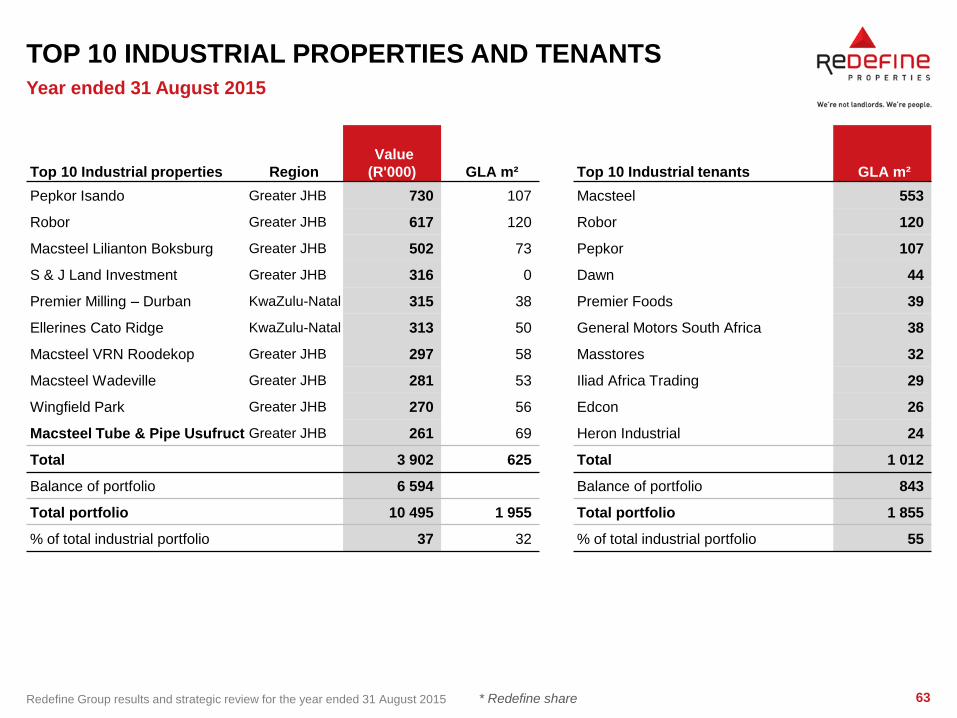
TOP 10 INDUSTRIAL PROPERTIES AND TENANTS
* Redefine share
Top 10 Industrial properties Region
Value
(R'000) GLA m² Top 10 Industrial tenants GLA m²
Pepkor Isando Greater JHB 730 107 Macsteel 553
Robor Greater JHB 617 120 Robor 120
Macsteel Lilianton Boksburg Greater JHB 502 73 Pepkor 107
S & J Land Investment Greater JHB 316 0 Dawn 44
Premier Milling – Durban KwaZulu-Natal 315 38 Premier Foods 39
Ellerines Cato Ridge KwaZulu-Natal 313 50 General Motors South Africa 38
Macsteel VRN Roodekop Greater JHB 297 58 Masstores 32
Macsteel Wadeville Greater JHB 281 53 Iliad Africa Trading 29
Wingfield Park Greater JHB 270 56 Edcon 26
Macsteel Tube & Pipe Usufruct Greater JHB 261 69 Heron Industrial 24
Total 3 902 625 Total 1 012
Balance of portfolio 6 594 Balance of portfolio 843
Total portfolio 10 495 1 955 Total portfolio 1 855
% of total industrial portfolio 37 32 % of total industrial portfolio 55
Year ended 31 August 2015
64 Redefine Group results and strategic review for the year ended 31 August 2015
LOCAL INVESTMENT CRITERIA
• Continued expansion across traditional sectors
• Focus on younger (more efficient), bigger and better quality projects
• Diversify into higher yielding non-traditional asset classes
• Opportunistic investments will be pursued where value can be unlocked or for a strategic foothold
• Adding value through redevelopments high on the agenda
• Speculative developments limited to no more than 5% of property assets
• Non-core (incapable of alternative use) assets to be disposed of include:
• government tenanted office portfolio
• management intensive, older, inefficient (mostly office) properties
65 Redefine Group results and strategic review for the year ended 31 August 2015
INTERNATIONAL INVESTMENT CRITERIA
• Invest in international markets where:
• we have local partner representation
• interests with local partners aligned
• tax regime and rules of law sophisticated
• Co-invest with Redefine International and Cromwell (and other credible partners) where opportunities
exceed their risk criteria
• Certainty of income and Rand hedge a trade off with growth
66 Redefine Group results and strategic review for the year ended 31 August 2015
PROPERTY ASSET CLASSIFICATIONS
• Core represents local property assets that meet Redefine’s investment criteria with strong lease
covenants to be held long term
• International is listed and direct offshore real estate investments that provide reliable income streams
with a Rand hedge in line with Redefine’s international investment criteria
• Secondary are local properties that are high yielding (in line with their risk profile) which are nearing the
end of their investment life cycle and are candidates for recycling by way of disposal or redevelopment
• High return investments represent Redefine’s developments and diversification into higher yielding assets
outside the traditional sectors i.e student accommodation, loan funding to joint venture partners and
residential conversions of secondary properties