Embed Size (px)
Citation preview

Full Terms & Conditions of access and use can be found athttp://www.tandfonline.com/action/journalInformation?journalCode=ulrm20
Download by: [University of Wisconsin] Date: 03 April 2017, At: 11:47
Lake and Reservoir Management
ISSN: 1040-2381 (Print) 2151-5530 (Online) Journal homepage: http://www.tandfonline.com/loi/ulrm20
Relevance of lake physical habitat indices to fishand riparian birds
Philip R. Kaufmann, Robert M. Hughes, Thomas R. Whittier, Sandra A. Bryce& Steven G. Paulsen
To cite this article: Philip R. Kaufmann, Robert M. Hughes, Thomas R. Whittier, Sandra A. Bryce& Steven G. Paulsen (2014) Relevance of lake physical habitat indices to fish and riparian birds,Lake and Reservoir Management, 30:2, 177-191, DOI: 10.1080/10402381.2013.877544
To link to this article: http://dx.doi.org/10.1080/10402381.2013.877544
Published online: 02 May 2014.
Submit your article to this journal
Article views: 230
View related articles
View Crossmark data
Citing articles: 1 View citing articles

Lake and Reservoir Management, 30:177–191, 2014C© Copyright by the North American Lake Management Society 2014ISSN: 1040-2381 print / 2151-5530 onlineDOI: 10.1080/10402381.2013.877544
Relevance of lake physical habitat indicesto fish and riparian birds
Philip R. Kaufmann,1,∗ Robert M. Hughes,2 Thomas R. Whittier,3 Sandra A. Bryce,4
and Steven G. Paulsen1
1US Environmental Protection Agency, Office of Research and Development, National Healthand Environmental Effects Research Laboratory, Western Ecology Division, 200 SW 35th St,
Corvallis, OR 973332Amnis Opes Institute and Oregon State University Department of Fisheries & Wildlife, 200
SW 35th St, Corvallis, OR 973333Department of Forest Ecosystems and Society, Oregon State University, Corvallis, OR 97331
4Dynamac Corporation, 200 SW 35th St, Corvallis, OR 97333
Abstract
Kaufmann PR, Hughes RM, Whittier TR, Bryce SA, Paulsen SG. 2014. Relevance of lake physical habitat indicesto fish and riparian birds. Lake Reserv Manage. 30:177–191.
Despite the historical focus on water quality, it is becoming increasingly evident that physical habitat conditionsalso significantly affect lake biota. We examined associations between fish and bird assemblages and lake physicalhabitat based on relatively rapid assessments of Northeast US lakes. Richness of intolerant fish species declined,and that of tolerant fish species increased across regional gradients of increasing shoreline human development anddecreasing abundance and structural complexity of riparian vegetation and littoral cover. Breeding bird assemblagesobserved in the nearshore littoral and riparian area of these lakes were similarly affected by disturbance and habitatsimplification. The percentage of native neotropical migrant birds declined, and the percent of tolerant bird speciesincreased across the same gradients. We conclude that our relatively rapid physical habitat assessments producebiologically relevant metrics useful for evaluating lake physical habitat condition and potential impacts on lake biotain regional and national lake assessments.
Key words: bird–habitat relationships, fish–habitat relationships, habitat complexity, habitat structure, lakedisturbances, lake habitat, lake monitoring, physical habitat, riparian disturbance
In lakes, as in streams, the distribution and abundance oflentic organisms are influenced by physical, chemical, hy-drological, and biological attributes that collectively com-prise habitat. There is growing recognition of the importanceof near-shore physical habitat structure for understandingdifferences in lake biotic assemblages (Allen et al. 1999,Whittier et al. 2002b, USEPA 2009). Information concern-ing the multiple dimensions of physical and chemical habi-tat is necessary to interpret biological information and as-sess ecological condition in lakes. Evaluation of near-shorehabitat structure is particularly important because the phys-ical and chemical exchange, nutrient cycling, and energy
∗Corresponding author: E-mail: [email protected] versions of one or more of the figures in the article can befound online at www.tandfonline.com/ulrm.
dissipation that occur there are especially vulnerable to an-thropogenic perturbation (Schindler and Scheuerell 2002,Strayer and Findlay 2010, Hampton et al. 2011).
Littoral structure and complexity have long been knownto influence lake fish populations and assemblages (e.g.,Eschmeyer 1936, Tarzwell 1936). Littoral woody structure(large woody debris, or LWD) and aquatic macrophytes pro-vide refuge from predation and affect nutrient cycling andlittoral production (Wege and Anderson 1979, Lynch andJohnson 1989, Savino and Stein 1989). Many sport fish se-lectively use complex habitat structure and cover in lakes(Sass et al. 2006), and the maintenance of diverse fish as-semblages requires heterogeneity in littoral physical habi-tat structure and cover (Tonn and Magnuson 1982, Eadieand Keast 1984, Benson and Magnuson 1992, Taillon andFox 2004). Similarly, riparian and littoral habitat complexity
177

Kaufmann et al.
are associated with increased diversity in periphyton andmacroinvertebrate assemblages (Smokorowski et al. 2006,Brauns et al. 2007, Butler and deMaynadier 2008, Remsburgand Turner 2009).
Riparian faunas are also influenced by near-shore terres-trial and aquatic habitat structure in lakes (e.g., O’Connoret al. 2000). More bird taxa inhabit less-modified near-shore zones that have greater riparian vegetation complexity(MacArthur and MacArthur 1961) and more abundant anddiverse littoral aquatic macroinvertebrate prey (Larsen et al.2010). The anthropogenic simplification of riparian vege-tation structure and composition favors habitat generalistsand invasive alien bird species (O’Connor et al. 2000, Bryceet al. 2002).
Habitat complexity, expressed as the density of riparian treesand littoral coarse wood, is greatly reduced where there is alarge amount of lakeshore residential development (Chris-tensen et al. 1996, Francis and Schindler 2006, Kaufmannet al. 2014b). Whole-lake experiments manipulating coarsewood loadings have shown that the ecological effects ofhabitat simplification can be severe and difficult to reverse(e.g., Sass et al. 2006, 2012). Lake shoreline human distur-bances are among the most extensive stressors in lakes ofthe Northeastern US, and they are associated with reducedcomplexity of riparian and littoral habitat structure (Whittieret al. 2002b).
Many aspects of shoreline development can have detrimen-tal effects on fish habitat (Halliwell 2007, 2008). For ex-ample, developed shorelines had decreased woody struc-ture (snag habitat), increased sandy shorelines, increasedsubmerged aquatic macrophyte cover, or decreased emer-gent and floating-leaf aquatic macrophytes. Such changesreduced habitat complexity in lakes of Vermont (Merrellet al. 2009), the Upper Midwest (Radomski and Geoman2001, Jennings et al. 2003, Hatzenbeler et al. 2004), Maine(Ness 2006), and Germany (Brauns et al. 2007).
Changes in biotic composition and ecosystem function areassociated with reduced habitat complexity caused by hu-man activities along lakeshores. In many of the previ-ous studies, marked reductions in habitat structural com-plexity deleteriously affected fish and other aquatic biota(e.g., Wagner et al. 2006, Taillon and Fox 2004, Engel andPederson 1998, Whittier et al. 2002a, 2002b). Wagner et al.(2006) reported negative effects of residential lakeshore de-velopment on littoral fishes resulting from reductions in theuse of disturbed and simplified near-shore habitat for nest-ing, foraging, and refuge. Brauns et al. (2007) reported thattaxa richness and diversity of littoral aquatic macroinver-tebrates in lowland German lakes were significantly lowerin simplified littoral habitats near disturbed shorelines thanin more complex natural littoral areas. In Northeast US
lakes, shoreline disturbance was associated with reducedspecies richness of native minnows and increased nonna-tive piscivorous fish species (Whittier et al. 1997a). Jen-nings et al. (1999) also reported negative effects on fishassemblages as riparian alteration increased in Midwest USlakes.
Kaufmann and Whittier (1997) developed a rapid, semi-quantitative approach for evaluating near-shore human dis-turbances and physical habitat structure, including cover andcomplexity in littoral and riparian habitats. The US Environ-mental Protection Agency (EPA) Environmental Monitor-ing and Assessment Program (EMAP) piloted that approachin its 1992–1994 Northeastern Lake Survey (EMAP-NE).Since then, many elements of the EMAP approach for eval-uating lake physical habitat structure were adapted for moni-toring by the European Union’s Water Framework Directive(Rowan et al. 2006) and also were applied in a multi-yearstudy of Brazilian reservoirs (Molozzi et al. 2011, Macedoet al. 2012). The EPA modified the EMAP methods for usein its 2007 National Lakes Assessment (NLA; USEPA 2007,2009, Kaufmann et al. 2014a, 2014b); however, the biolog-ical relevance of the EPA habitat assessment approach hasnot been formally evaluated.
In this study we evaluate the biological relevance of the EPAlake physical habitat assessment approach by examining as-sociations of biota with habitat metrics derived using thisapproach. Our objectives were to determine if the taxa rich-ness and structure of fish and near-shore bird assemblageswere associated with indices of habitat condition. We ex-pected that simplification of littoral and riparian structureassociated with increased human disturbance of lakes wouldincrease the richness of tolerant fish species and decrease therichness of intolerant fish species. Similarly, we expectedthat human activity and simplification of near-shore habitatwould increase the proportion of tolerant birds and decreasethe proportion of sensitive native taxa, such as neotropicalmigrant birds, in the lake near-shore area.
Study sites and methodsSample lakes
The EMAP-NE was conducted as a pilot survey to test de-signs and methods for application at regional and nationalscales (Larsen and Christie 1993, Whittier et al. 2002b).We examined data from 179 lakes sampled during sum-mers 1992 to 1994 (Larsen and Christie 1993, Larsen et al.1994; Fig. 1). The population of interest for EMAP-NE wasall lakes in the Northeast US with an open water surfacearea of 1–10,000 ha (0.01–100 km2) and a depth ≥1 m.The survey employed a spatially balanced, probability se-lection of lakes from an explicitly defined sampling frame,the Digital Line Graph (DLG) version of the US Geological
178
Lake habitat structure influences fish and birds
Figure 1. EMAP Northeastern Lake Survey 1992–1994 samplelakes. In the text we refer to the combination of Omernik’s (1987)N.E. Highlands and Adirondacks ecoregions as the NE Highlands.
Survey 1:100,000 map series. Surveyed water bodies in-cluded natural lakes without anthropogenic modifications,ponded wetlands, human-constructed lakes, and run-of-the-river reservoirs. We report findings for the Northeast regionas a whole and for 2 subregions: the NE Lowlands and the
NE Highlands (Fig. 1). The NE Highlands is an aggregationof the Adirondack Mountains and the Omernik (1987) NEHighlands Level III ecoregions.
Physical habitat observations and metricdefinitions
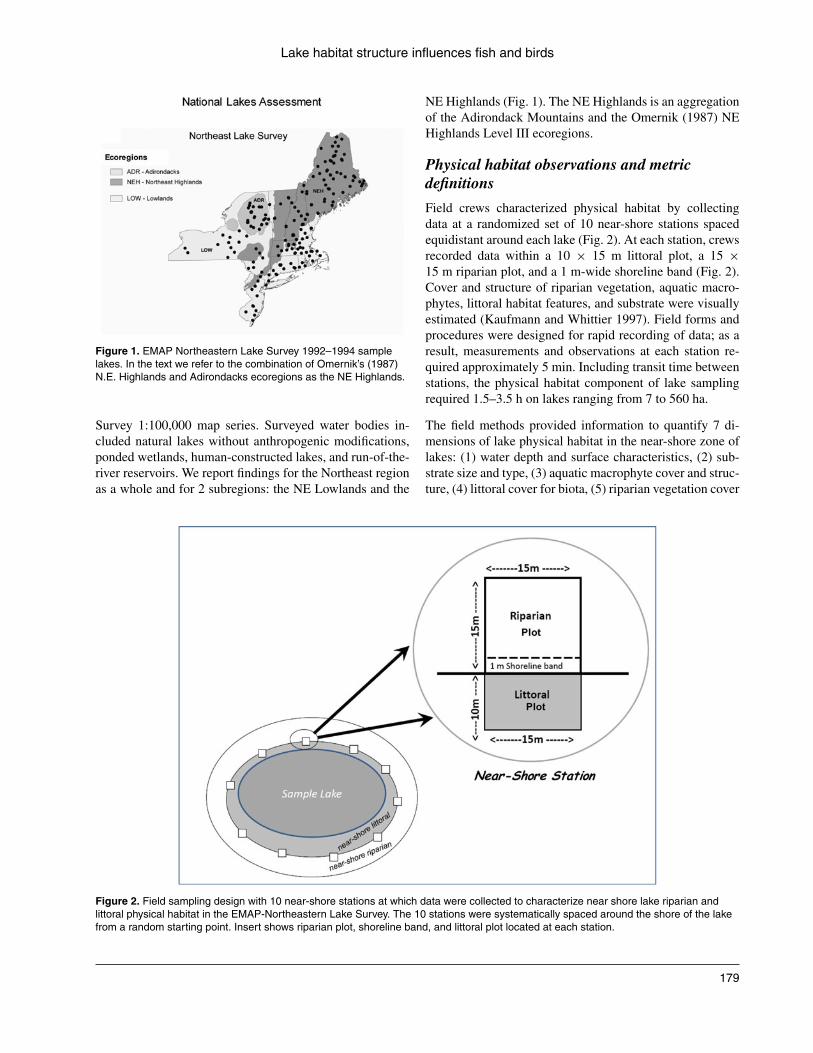
Field crews characterized physical habitat by collectingdata at a randomized set of 10 near-shore stations spacedequidistant around each lake (Fig. 2). At each station, crewsrecorded data within a 10 × 15 m littoral plot, a 15 ×15 m riparian plot, and a 1 m-wide shoreline band (Fig. 2).Cover and structure of riparian vegetation, aquatic macro-phytes, littoral habitat features, and substrate were visuallyestimated (Kaufmann and Whittier 1997). Field forms andprocedures were designed for rapid recording of data; as aresult, measurements and observations at each station re-quired approximately 5 min. Including transit time betweenstations, the physical habitat component of lake samplingrequired 1.5–3.5 h on lakes ranging from 7 to 560 ha.
The field methods provided information to quantify 7 di-mensions of lake physical habitat in the near-shore zone oflakes: (1) water depth and surface characteristics, (2) sub-strate size and type, (3) aquatic macrophyte cover and struc-ture, (4) littoral cover for biota, (5) riparian vegetation cover
Figure 2. Field sampling design with 10 near-shore stations at which data were collected to characterize near shore lake riparian andlittoral physical habitat in the EMAP-Northeastern Lake Survey. The 10 stations were systematically spaced around the shore of the lakefrom a random starting point. Insert shows riparian plot, shoreline band, and littoral plot located at each station.
179

Kaufmann et al.
and structure, (6) near-shore human land use and distur-bances, and (7) bank characteristics that indicate water levelfluctuations and terrestrial-aquatic interaction (Paulsen et al.1991, Kaufmann 1993). Kaufmann et al. (2014a) describethe calculations we used to reduce data collected at the 10littoral-riparian stations to a set of metrics describing near-shore habitat characteristics for each sample lake; they alsoquantify the precision of those metrics.
Composite habitat quality indices
We calculated 5 composite habitat indices as described indetail by Kaufmann et al. (2014b) for EPA’s NLA. Thehabitat indices used here were modified slightly from thosebecause the survey on which we based our results, con-ducted in 1992–1994, used an earlier version of the EPAfield measurement protocols that was slightly different fromthose used in the NLA:
1. The lakeshore human disturbance index incorporatedmeasures of the extent and intensity of 12 predefinedtypes of near-shore human land use activities (commer-cial development, buildings, roads/railroads, row crops,orchards, pastures, landfill/trash, lawns, developed parks,utility lines, bulkheads/revetments, and docks/boats), andwas scaled from 0 (absence of any human disturbance)to 1 (extremely high disturbance).
2. The riparian cover index characterized the cover andstructural complexity of the 3-layer (canopy, mid, andground) lakeshore riparian vegetation, including inun-dated upland or wetland vegetation. Each contributingmetric was scaled from 0 to 1, and metrics were aver-aged, yielding an index that varied from 0 to 1.
3. The littoral cover index characterized the cover, struc-ture, and variety of the 8 littoral fish cover elements:woody snags, brush, overhanging vegetation, inundatedtrees, inundated nonwoody vegetation, boulders, rockledges, anthropogenic structures, and 3 aquatic macro-phyte cover types (floating, emergent, and submerged).We incorporated both the amount of cover and the varietyof cover types into the littoral cover index because webelieve that both influence the number of individual fishpresent, as well as the richness of species present and thevariety of guilds represented. Like the previous indices,the subcomponents and final index were scaled from 0 to1.
4. The littoral-riparian complexity index expresses theamount and structural complexity of the combinedlittoral-riparian zone and was calculated by averagingthe riparian and littoral cover indices.
5. Finally, the overall lakeshore habitat quality index wascalculated by averaging the 3 primary indices: ripariancover, littoral cover, and [lack of] lakeshore human dis-turbance.
The first 4 of these indices are nearly exact analogues ofthe 4 habitat condition indices used in USEPA’s (2009)NLA.
GIS-derived lake and landscape metrics
In addition to the field data, a number of GIS-based land-scape metrics were calculated for each lake. Lake elevationand the total drainage area contributing to the lake (basedon topography) were extracted from the National Eleva-tion Dataset. Mean annual precipitation at each lake wasestimated using PRISM data gridded at a 2 km resolution(Daly and Taylor 2002). Percent watershed area with urban,agricultural, and forest cover were derived from the Na-tional Land Cover Dataset (Vogelmann et al. 2001; availableat http://landcover.usgs.gov/natllandcover.php). Populationdensity (individuals/km2) was estimated for the contributingwatershed for each lake based on data from the US CensusBureau (1990, 2001). We calculated road density (m/ha)from digital road data (TIGER 1990) in the drainage areaof each lake. Road density serves as an efficient surrogatefor catchment-scale anthropogenic disturbances (Kaufmannand Hughes 2006).
Fish and riparian bird assemblage samplingand analysis
Field crews sampled fish assemblages overnight in July andAugust at a set of randomly selected sites stratified by macro-habitat, based on level of human activity, quantity and type ofcover, and substrate (Baker et al. 1997, Whittier et al. 1997b).The potential number of fish species present in a given lakeincreases with lake size (Tonn and Magnuson 1982, Whittieret al. 1997a, 1997b, Vaux et al. 2000); therefore, depend-ing on lake size, 3 to 26 sites were selected. Gear includedpelagic gill net sets, littoral trap net and minnow trap sets,evening seining, and littoral gill net sets in large lakes. Inaddition, crews used best professional judgment to locate1–2 sites based on microhabitat (e.g., stream inlet, macro-phyte patch, and rock outcrop). These lake-size–adjustedfield sampling methods were designed to capture >80% ofthe lake species pool and adequate numbers of individualsfor stable estimates of proportional abundances (Whittierand Kincaid 1999, Vaux et al. 2000). Data for all gear werecombined into a single lake value for each fish assemblagemetric (Baker et al. 1997, Whittier et al. 1997a, 1997b).
Field crews surveyed riparian breeding birds from 0.5 h be-fore sunrise to 4 h after sunrise on days with little wind orprecipitation between late May and early July (Baker et al.1997, Allen et al. 1999). Observations were made from ca-noes at stations every 200 m along a transect 10 m fromand parallel to the lake shore. Crews recorded all terrestrial
180

Lake habitat structure influences fish and birds
and aquatic individuals seen or heard within a radiusof approximately 100 m around the station during a 5 minperiod. For lake perimeters >5 km, 24 stations were allo-cated in proportion to the extent of lake shore habitat types.
We examined the associations of 2 fish assemblage metricsand 2 riparian breeding bird assemblage metrics with the 5near-shore habitat indices and catchment road density. Weclassified fish and riparian bird species according to theirtolerance to general human disturbance (Hughes et al. 1993,Whittier and Hughes 1998) and their feeding habits, habitatpreferences, life history, and reproductive guild membership(Hughes et al. 1993, O’Connor et al. 2000). Note that onlynative taxa were included as intolerant, and the total taxa listincluded species not classified as tolerant or intolerant. Wewanted to show the associations (and possible causal effect)of habitat condition on tolerant and intolerant fishes andbirds. Among the 4 possible metrics for each of these (rich-ness vs., % of taxa, and richness vs.% of individuals), wechose the form of the biotic assemblage metric that showedthe clearest association with habitat and disturbance.
We chose 2 fish assemblage metrics: richness of native intol-erant species and richness of tolerant species. To account forspecies–area relationships, these fish metrics were expressedas residuals from regressions predicting species richness asa function of log10 lake surface area. Both metrics are com-monly used for assessing the condition of lotic ecosystems,either alone (Whittier et al. 2007, Segurado et al. 2011) or inmultimetric indices (Roset et al. 2007, Whittier et al. 2007).
We characterized bird assemblages in our analysis with 2assemblage metrics: the proportion of total individual birdsobserved that are native neotropical migrant species, and theproportion of total bird species that are tolerant of anthro-pogenic disturbances. These bird assemblage proportionalmetrics did not require adjustment for lake or basin size.O’Connor et al. (2000) found similar bird assemblage met-rics to be responsive to human disturbances around lakes.Croonquist and Brooks (1993), Bryce et al. (2002), andBryce (2006) also used similar metrics to assess the condi-tion of riparian bird assemblages along streams.
ResultsAssociations between biota and physical habitat
After scaling the fish assemblage metrics for lake size(surface area), no other natural landscape attributes werestrongly correlated with either biotic or physical habitat in-dices in the EMAP-NE, except for negative correlations be-tween elevation and the tolerant fish (r = −0.50; Bonferroni-adjusted p < 0.02) and tolerant bird indices (r = −0.40;Bonferroni-adjusted p < 0.02; Table 1). Basin road density
was consistently related to the habitat and biotic indices aswell as basin-scale land uses (Table 1). Road density wasmoderately correlated with near-shore human disturbance(r = 0.58; Bonferroni-adjusted p < 0.02) and the lakeshorehabitat quality index (r = −0.55; Bonferroni-adjustedp < 0.02).
Fish assemblages
In agreement with our expectations, we found higher intol-erant fish taxa richness and smaller proportions of tolerantgeneralist species in relatively undisturbed lakes with com-plex physical habitat. The number of intolerant fish species(adjusted for lake area) was weakly associated with catch-ment road density (r = −0.29) near-shore human distur-bance (r = −0.26), with riparian cover (r = 0.21), littoralcover (r = 0.09), combined littoral-riparian habitat com-plexity (r = 0.18), and the lakeshore habitat quality index(r = 0.27) (Fig. 3). In the NE Highlands, higher than ex-pected numbers of intolerant fish species were found only inrelatively undisturbed lakes with high littoral-riparian habi-tat cover and complexity (Fig. 3F). Although intolerant fishspecies in NE Lowlands lakes showed slight increases withlittoral cover complexity (Fig. 3D), few were observed inthose lakes, regardless of habitat complexity or near-shoredisturbance levels.
Also in agreement with our expectations, the number of gen-erally tolerant fish species (adjusted for lake area) was pos-itively correlated with road density and near-shore humandisturbance (r = 0.49 and 0.47, respectively; Fig. 4A and4B), and negatively correlated with riparian cover, littoralcover, and littoral-riparian habitat complexity (r = −0.40to −0.43; Fig. 4C–4E). The weakest association betweentolerant fish species and habitat was with littoral cover (r= −0.32) for all lakes combined (Fig. 4D). The strongestassociation with tolerant fish species was with the lakeshorehabitat quality index in the Northeastern United States (r =−0.53), and this moderate decline in tolerant species withhabitat quality was evident in both the NE Highlands andNE Lowlands ecoregions (compare grey and black symbolsin Fig. 4F).
Riparian breeding bird assemblages
In agreement with our expectations, the percent of neotrop-ical migrants in the bird counts were higher (generally>50%) at lakes with low levels of human disturbancesand high levels of habitat complexity, and lower (gener-ally <20%) in disturbed lakes with low habitat complexity.The proportion of neotropical migrant birds declined withincreasing road density (r = −0.44) and near-shore humandisturbances (r = −0.50; Fig. 5A and 5B). The proportionof neotropical migrants was positively (weakly) correlated
181

Tab
le1.
Cor
rela
tions
ofE
MA
PN
orth
east
Lake
Sur
vey
biot
icm
etric
san
dha
bita
tind
ices
with
catc
hmen
tlan
dus
ean
dge
oclim
atic
varia
bles
.Spe
arm
anr
with
abso
lute
valu
es>
0.30
have
p<
0.00
01(B
onfe
rron
i-adj
uste
dp
<0.
0015
);th
ose
betw
een
0.25
and
0.30
have
p<
0.00
1(a
djus
ted
p<
0.15
).P
aren
thes
esde
note
rva
lues
befo
rew
ater
shed
area
corr
ectio
n.D
ata
from
US
EPA
’sE
MA
Ppr
obab
ility
surv
eyof
185
lake
sdu
ring
the
sprin
g(b
irds)
and
sum
mer
(fish
and
habi
tat)
seas
ons
of19
92–1
994
(179
lake
sw
ithco
mpl
ete
seto
fvar
iabl
esus
edhe
re).
Cor
rela
tions
>|0
.40|
are
bold
.
Cat
chm
ent
vari
able
s
Res
idu
alIn
tole
ran
tF
ish
spec
ies
rich
nes
s
Res
idu
alTo
lera
nt
fish
spec
ies
rich
nes
s
Neo
tro
pic
alM
igra
nt
Bir
ds
(%in
div
idu
als)
Tole
ran
tB
ird
Sp
ecie
s(%
of
tota
lsp
ecie
s)
Lak
esh
ore
Hu
man
Dis
turb
ance
Ind
ex
Rip
aria
nC
over
Ind
ex
Lit
tora
lC
over
Ind
ex
Lit
tora
l-R
ipar
ian
Hab
itat
Co
mp
lexi
tyIn
dex
Lak
esh
ore
Hab
itat
Qu
alit
yIn
dex
Roa
dde
nsity
−0.2
90.
49−0
.44
0.70
0.58
−0.3
3−0
.20
−0.3
1−0
.55
Popu
latio
nde
nsity
−0.1
40.
31−0
.41
0.49
0.42
−0.2
3−0
.19
−0.2
5−0
.41
Hou
sede
nsity
−0.1
20.
26−0
.35
0.41
0.37
−0.1
8−0
.17
−0.2
1−0
.36
Num
ber
poin
tsou
rces
−0.1
70.
40−0
.32
0.53
0.29
−0.1
9−0
.17
−0.2
2−0
.30
%U
rban
−0.1
50.
30−0
.46
0.52
0.43
−0.2
1−0
.19
−0.2
4−0
.42
%A
gric
ultu
re−0
.14
0.38
−0.1
20.
210.
10−0
.19
−0.0
6−0
.16
−0.1
3%
Fore
st0.
15−0
.41
0.40
−0.4
4−0
.32
0.20
0.16
0.22
0.33
%W
etla
nd−0
.01
−0.1
70.
00−0
.23
−0.1
70.
19−0
.01
0.10
0.19
%D
istu
rban
ce−0
.20
0.49
−0.4
00.
510.
35−0
.29
−0.1
8−0
.28
−0.3
8lo
g10
(lak
ear
ea)
0(0.
36)
0(0.
17)
0.03
−0.1
6−0
.10
0.00
−0.2
6−0
.17
−0.0
2D
rain
age
area
−0.0
60.
310.
09−0
.01
0.01
−0.0
8−0
.15
−0.1
5−0
.08
Ele
vatio
n0.
29−0
.50
0.29
−0.4
0−0
.21
0.08
0.38
0.33
0.31
Prec
ipita
tion
−0.2
90.
17−0
.05
0.27
0.07
−0.1
4−0
.15
−0.1
8−0
.14
Lon
gte
rmru
noff
−0.0
2−0
.25
0.23
−0.2
5−0
.24
0.12
0.01
0.07
0.19
Ret
entio
ntim
e0.
08−0
.16
0.00
0.02
−0.0
9−0
.04
0.00
−0.0
2−0
.07
Shor
elin
ege
om.d
evel
.−0
.20
0.21
−0.0
6−0
.01
−0.0
4−0
.06
−0.1
4−0
.13
−0.0
4D
ista
nce
from
ocea
n0.
37−0
.33
0.19
−0.3
4−0
.20
0.17
0.30
0.28
0.28
182

Lake habitat structure influences fish and birds
Figure 3. Intolerant fish species richness vs. catchment road density and 5 physical habitat indices. Species richness expressed asresiduals of the number of species regressed against log10 lake area. Grey dots = NE Highlands; black dots = NE Lowlands (Fig. 1).
with both littoral and riparian cover (r = 0.29 and 0.25;Fig. 5C and 5D) and with combined littoral-riparian habitatcomplexity (r = 0.33; Fig. 5E). The strongest and region-ally most consistent association with neotropical migrantbirds was with the lakeshore habitat quality index (r = 0.51)and was evident in both NE Highlands and NE Lowlandsecoregions (Fig. 5F).
Also as expected, the proportion of bird species toler-ant to human disturbance was strongly correlated withroad density and near shore disturbance (r = 0.69 and0.70; Fig. 6A and 6B). Tolerant birds were moderatelynegatively correlated with the habitat cover and com-plexity indices that omitted direct measures of humandisturbance (r = −0.45 to −0.31, Fig. 6C–6E) and
183

Kaufmann et al.
Figure 4. Tolerant fish species richness vs. catchment road density and 5 physical habitat indices. Species richness expressed asresiduals of the number of species regressed against log10 lake area. Grey dots = NE Highlands; black dots = NE Lowlands (Fig. 1).
strongly negatively correlated with the lakeshore habi-tat quality index (r = −0.70). Associations between tol-erant bird species and lakeshore habitat indices wereconsistently evident in both NE Highlands and NE Low-lands ecoregions (Fig. 6). Among the 4 biotic assemblage
metrics we examined, the proportion of bird taxa toler-ant to human disturbance had the strongest, most lin-ear, and most regionally consistent association with the5 near-shore habitat indices (compare panels B–F acrossFig. 4–6).
184

Lake habitat structure influences fish and birds
Figure 5. Proportion of observed individual birds that are neotropical migrant species vs. catchment road density and 5 physical habitatindices. Grey dots = NE Highlands; black dots = NE Lowlands (Fig. 1).
DiscussionWe developed the lake physical habitat field methods and de-fined habitat metrics and indices to assess many of the habitatfeatures important to faunal assemblages, including riparianbirds and lentic fish and macroinvertebrates. The associa-tions we observed between lake fauna and habitat indices
in the EMAP-NE data indicate that those indices provideuseful explanatory information regarding habitat suitabilityfor fish and birds. Similarly, our human disturbance indexwas correlated with increases in the proportions or rich-ness of fish and bird taxa tolerant of human disturbance anddecreases in taxa intolerant of human disturbances. Thosecorrelations indicate that the index quantifies aspects of
185

Kaufmann et al.
Figure 6. Proportion of total bird species that are tolerant species vs. catchment road density and 5 physical habitat indices. Grey dots =NE Highlands; black dots = NE Lowlands (Fig. 1).
human activities and physical habitat alterations relevantto those assemblages.
Of the 5 habitat and disturbance metrics we evaluated, the4 biological metrics were most strongly correlated with thelakeshore habitat quality index that combined littoral andriparian cover complexity with near-shore disturbance data.
The lakeshore habitat quality index was also related to dis-turbances at a larger scale, with moderate correlations withbasin-scale road density, human population density, and per-cent urban land use (Table 1). Thus, if the aim is to usea single metric of lake physical habitat condition to linkbiological responses with basin-scale human pressures, anecoregionally adjusted version of this overall lakeshore
186

Lake habitat structure influences fish and birds
habitat quality index would be our recommendation. SinceKarr’s (1981) introduction of the Index of Biotic Integrity(IBI), multimetric indices have been found useful for assess-ing and reporting on biological condition at multiple scalesand on multiple continents (Hughes and Oberdorff 1999,Roset et al. 2007). The same may be true for physical habi-tat assessment and reporting, but further studies are neededto affirm these patterns.
Although fish and birds were not assessed in the EPA’s NLA,other biotic assemblages sampled in that assessment were as-sociated with near-shore physical habitat condition. The rel-ative risk for impairment of phytoplankton and zooplanktontaxa richness was approximately 3 times greater in lakes thathad poor physical habitat condition than in lakes with fair orgood condition, as measured by the NLA habitat conditionindices (USEPA 2009, Van Sickle 2013). The relative riskto planktonic assemblages from near-shore habitat degrada-tion was greater than that for excessive nutrients (USEPA2009), implying that littoral features such as aquatic macro-phytes, snags, and coarse substrates increase littoral habitatcomplexity and provide important substrate and cover forphyoplankton and zooplankton, just as they do for fish. Fur-thermore, lake riparian and littoral cover and complexity canbuffer anthropogenic nutrients, sediments, and toxic inputsfrom upland areas just as they do along streams (Carpenterand Cottingham 1997, Strayer and Findlay 2010).
We found that habitat simplification in lakes was associ-ated with anthropogenic disturbance, as reported by Whittieret al. (2002b) and other researchers. Furthermore, extensiveand intensive shoreline human activities simplified habitatstructure and increased the abundance and richness of toler-ant taxa, reducing the richness of intolerant bird and fish taxaand generally reducing native taxa richness. The EMAP-NEphysical habitat field protocol and indicators aided us inassessing such associations. Those associations were con-sistent with the interpretation that complex, multi-layerednear-shore riparian vegetation and abundant, complex lit-toral cover foster native fish and bird assemblage richness.
In a previous study of the same lakes, the number of na-tive minnow species was negatively associated with shore-line disturbance, whereas the number of alien predator fishspecies increased (Whittier et al. 1997a). Likewise, EMAP-NE impoundments had greater shoreline disturbance, moretolerant fish species and individuals, and more nonnativefish species and individuals than did natural lakes (Whit-tier et al. 2002a, 2002b). Using similar protocols, Molozziet al. (2011) found increased proportions of tolerant ben-thic macroinvertebrate taxa and individuals with increasednear-shore anthropogenic disturbance, and Sanches (2011)and Terra and Araujo (2011) reported similar relationshipsfor fish. Lindsay et al. (2002) found that abundance, rich-
ness and diversity of birds increased with moderate levelsof lakeshore human development in a mixed northern for-est. This pattern is relatively common at intermediate levelsof disturbance, reflecting the replacement of intolerant taxaby tolerant taxa as food supplies increase with disturbance-associated increases nutrients. Lindsay et al. (2002) fur-ther reported that traditional ecological measures of birdassemblages (abundance, richness, and species diversity)failed to reveal subtle but important changes in responseto habitat alteration. Their reported decreases in insectiv-orous and ground-nesting birds (generally intolerant taxa)and increases in ground-feeding seed eaters (tolerant taxa)and deciduous tree nesters with anthropogenic disturbanceare similar to our observations on bird assemblages of thenear-shore lake environment.
Demonstration of strong associations between biota andhabitat indicate potential control of biota by habitat. In mostecosystems there are aspects of physical habitat that ex-ert natural controls and limitations on the composition andabundance of organisms present. Monitoring programs aretypically interested in changes in biota that result from an-thropogenic alteration of habitat. Although we were able todemonstrate relatively strong correlations between biota andhabitat in this survey, observations of weak or null correla-tions between habitat and biota do not preclude strong causalcontrol by habitat characteristics, which can be explained byat least 3 reasons. First, the lack of variation in some habi-tat characteristic over time or across the lakes of a regionresults in reduced statistical correlation between biota andthat habitat characteristic. Habitat characteristics that changelittle over time, or that vary little spatially, may still exert im-portant controls over biota over longer timescales and largerspatial scales (Ligeiro et al. 2013). Second, low precision andlow regional variation of the biological metrics relative tomeasurement “noise” also limit their potential correlationswith environmental predictor variables (Hughes et al. 1998,Kaufmann and Hughes 2006, Stoddard et al. 2008, Kauf-mann et al. 2014a). Third, associations with habitat will notbe strong or even readily detectable if other types of controlsare limiting, which is frequently the case in nature (Mebaneet al. 2003, Bryce et al. 2008, 2010, Steel et al. 2010, Ligeiroet al. 2013). For example, fish in lakes respond to physicalhabitat, water chemistry, zoogeography, biological interac-tions, and fishery management (Tonn 1990). Quantitativeevaluation of physical habitat structure, however, helps dis-criminate its probable importance from these other limitingfactors, as suggested by Platts et al. (1983).
In the strictest sense, “cause and effect” can only beproven on the basis of rigorous experimental results(i.e., randomized treatments with causal agent). Under thisstrict interpretation, no monitoring of any sort could everestablish cause and effect; however, much of the monitoring
187

Kaufmann et al.
by State, Federal and Tribal agencies can help establish cau-sation by strong inference in a weight of evidence approach.Establishing strong inference for causal linkage via moni-toring requires 4 criteria (Diamond 1986, Lloyd 1988): (1)plausible mechanisms for the relationship based on ecolog-ical first principles; (2) evidence in the literature supportingthese mechanisms; (3) a demonstrated, statistically signif-icant association present in the monitoring results; and (4)alternative mechanisms and explanations must be examinedand found unlikely. Our demonstration of correlations be-tween human disturbances and alteration of habitat com-plexity and biotic assemblage composition contribute to theweight of evidence for causal linkages when coupled withother information.
AcknowledgmentsMost EMAP-NE data were collected by student employeesof the State University of New York–College of Forestry andEnvironmental Sciences under the direction of N. Ringlerand D. Halliwell. The NLA data were collected by State co-operators, US EPA regional staff, and TetraTech, GLEC andDynamac crews. Bird data were provided by R. O’Connorand A. Moors (University of Maine, Orono). C. Burch-Johnson prepared the maps and T. Kincaid assisted withstatistical analyses and guidance. Our manuscript was im-proved by reviews from J. Kurtenbach, D. P. Larsen, R.Ozretich, E. McGoff, and C. Hawkins. This article was sub-jected to the National Health and Environmental EffectsResearch Laboratory’s Western Ecology Division and ap-proved for publication. Approval does not signify that thecontents reflect the view of the US EPA, nor does mention oftrade names or commercial products constitute endorsementor recommendation for use.
FundingFunding for data analysis and manuscript preparation werelargely from the US EPA Office of Research and Devel-opment in support of the Environmental Monitoring andAssessment Program (EMAP) and the EPA Office of Wa-ters National Lakes Assessment through cooperative agree-ment #CR-818606 with Oregon State University and con-tract #68040019 with ManTech Corporation. Bob Hugheswas supported in manuscript preparation during sabbaticalin Brazil by grant 00011/09 from Fundacao de Amparo aPesquisa do Estado de Minas Gerais (FAPEMIG), and Com-panhia Energetica deMinas Gerais (CEMIG).
ReferencesAllen AP, Whittier TR, Kaufmann PR, Larsen DP, O’Conner
RJ, Hughes RM, Stemberger RS, Dixit SS, Brinkhurst RO,Herlihy AT, Paulsen SG. 1999. Concordance of taxonomic
richness patterns across multiple assemblages in lakes ofthe northeastern United States. Can J Fish Aquat Sci. 56:739–747.
Baker JR, Peck DV, Sutton DW, editors. 1997. EnvironmentalMonitoring and Assessment Program - Surface Waters: fieldoperations manual for lakes. Washington (DC): US Environ-mental Protection Agency, Office of Research and Develop-ment; EPA/620/R-97/001.
Benson BJ, Magnuson JJ. 1992. Spatial heterogeneity of lit-toral fish assemblages in lakes: relation to species diver-sity and habitat structure. Can J Fish Aquat Sci. 49:1493–1500.
Brauns M, Garcia XF, Walz N, Pusch MT. 2007. Effects of hu-man shoreline development on littoral macroinvertebrates inlowland lakes. J Appl Ecol. 44:1138–1144.
Bryce SA. 2006. Development of a bird integrity index: measur-ing avian response to disturbance in the Blue Mountains ofOregon, USA. Environ Manage. 38:470–486.
Bryce SA, Hughes RM, Kaufmann PR. 2002. Development of abird integrity index: using bird assemblages as indicators ofriparian condition. Environ Manage. 30:294–310.
Bryce SA, Lomnicky GA, Kaufmann PR, McAllister LS, Ernst TL.2008. Development of biologically-based sediment criteria inmountain streams of the western United States. N Am J FishManage. 28:1714–1724.
Bryce SA, Lomnicky SG, Kaufmann PR. 2010. Protectingsediment-sensitive aquatic species in mountain streamsthrough the application of biologically based streambed sed-iment criteria. J N Am Benthol Soc. 29:657–672.
Butler RG, deMaynadier PG. 2008. The significance of littoral andshoreline habitat integrity to the conservation of lacustrinedamselflies (Odonata). J Insect Conserv. 12:23–36.
Carpenter SR, Cottingham KL. 1997. Resilience and restorationof lakes. Conserv Ecol. 1(1); [cited 12 Sept 2011]. Availablefrom: http://www.consecol.org/vol1/iss1/art2
Christensen DL, Herwig BR, Schindler DE, Carpenter SR.1996. Impacts of lakeshore residential development oncoarse woody debris in north temperate lakes. Ecol Appl.6:1143–1149.
Croonquist MJ, Brooks RP. 1993. Effects of habitat disturbance onbird commu-nities in riparian corridors. J Soil Water Conserv.48:65–70.
Daly C, Taylor GH. 2002. Development of new spatial grids of Rfactor and 10-yr EI30 for the conterminous United States. Cor-vallis (OR): Oregon State University, Spatial Climate AnalysisService; Internal EPA Report, NERL-LV.
Diamond J. 1986. Overview: Laboratory experiments, field ex-periments, and natural experiments. In: Diamond J, Case TJ,editors. Community Ecology. New York: Harper and Row. p.3–22.
Eadie JMA, Keast A. 1984. Resource heterogeneity and fish speciesdiversity in lakes. Can J Zool. 62:1689–1695.
Engel S, Pederson J. 1998. The construction, aesthetics, and effectsof lakeshore development: a literature review. Wisconsin.Madison (WI): Dept. of Natural Resources, Report 177; [cited12 Mar 2014]. Available from: http://digital.library.wisc.edu/1711.dl/EcoNatRes.DNRRep177
Eschmeyer RW. 1936. Essential considerations for fish manage-ment in lakes. In: Proceedings from the North American
188

Lake habitat structure influences fish and birds
Wildlife Conference. Washington (DC): US GovernmentPrinting Office. p. 332–229.
Francis TB, Schindler DE. 2006. Degradation of littoral habitats byresidential development: woody debris in lakes of the PacificNorthwest and Midwest, United States. Ambio. 35:274–280.
Halliwell D. 2007. Lake habitat measures. New England Chapter ofthe North American Lake Management Society. New EnglandLake News. 2(2):1–4.
Halliwell D. 2008. Lake habitat measures. Out of the Blue. VermontAgency of Natural Resources Department of EnvironmentalConservation. Water Quality Division newsletter. 33:8–9.
Hampton, SE, Fradkin SC, Leavitt PR, Rosenberger EE. 2011.Disproportionate importance of nearshore habitat for thefood web of a deep oligotrophic lake. Mar Freshw Res.62:350–358.
Hatzenbeler GR, Kampa JM, Jennings MJ, Emmons EE. 2004.A comparison of fish and aquatic plant assemblages to as-sess ecological health of small Wisconsin lakes. Lake ReservManage. 20:211–218.
Hughes RM, Burch-Johnson C, Dixit SS, Herlihy AT, Kauf-mann PR, Kinney WL, Larsen DP, Lewis PA, McMullenDM, Moors AK, et al. 1993. Development of lake con-dition indicators for EMAP 1991 Pilot. In: Larsen DP,Christie SJ, editors. EMAP-Surface Waters 1991 Pilot Report.Washington (DC): US Environmental Protection Agency,Office of Research and Development; EPA/620/R-93/003.p. 7–90.
Hughes RM, Kaufmann PR, Herlihy AT, Kincaid TM, ReynoldsL, Larsen DP. 1998. A process for developing and evaluatingindices of fish assemblage integrity. Can J Fish Aquat Sci.55:1618–1631.
Hughes RM, Oberdorff T. 1999. Applications of IBI concepts andmetrics to waters outside the United States and Canada. In:Simon TP, editor. Assessing the Sustainability and BiologicalIntegrity of Water Resources using Fish Assemblages. BocaRaton (FL): Lewis. p. 79–93.
Jennings MJ, Bozek MA, Hatzenbeler GR, Emmons EE, StaggsMD. 1999. Cumulative effects of incremental shoreline habi-tat modification on fish assemblages in north temperate lakes.N Am J Fish Manage. 19:18–27.
Jennings MJ, Emmons EE, Hatzenbeler GR, Edwards C, BozekMA. 2003. Is littoral habitat affected by residential develop-ment and land use in watersheds of Wisconsin lakes? LakeReserv Manage. 19:272–279.
Karr JR. 1981. Assessment of biotic integrity using fish communi-ties. Fisheries. 6(6):21–27.
Kaufmann PR. 1993. Physical habitat. In: Hughes RM, editorStream Indicator and Design Workshop. Corvallis (OR):US Environmental Protection Agency; EPA/600/R-93/138. p.59–69.
Kaufmann PR, Hughes RM. 2006. Geomorphic and anthropogenicinfluences on fish and amphibians in Pacific Northwest coastalstreams. In: Hughes RM, Wang L, Seelbach PW, editors.Landscape influences on stream habitat and biological assem-blages. American Fisheries Society Symposium 48; Bethesda(MD). p. 429–455.
Kaufmann PR, Hughes RM, Van Sickle J, Whittier TR, SeeligerCW, Paulsen SG. 2014a. Lake shoreline and littoral habitat
structure: a field survey method and its precision. Lake ReservManage. 30:157–176.
Kaufmann PR, Peck DV, Paulsen SG, Seeliger CW, Hughes RM,Whittier RR, Kamman NC. 2014b. Lakeshore and littoralphysical habitat structure in a national lake assessment. LakeReserv Manage. 30:192–215.
Kaufmann PR, Whittier TR. 1997. Habitat assessment. In: BakerJR, Peck DV, Sutton DW, editors. Environmental Monitor-ing and Assessment Program – Surface Waters: field opera-tions manual for lakes. Washington (DC): US Environmen-tal Protection Agency, Office of Research and Development;EPA/620/R-97/001. p. 5–1 to 5–26.
Larsen DP, Christie SJ, editors. 1993. EMAP-Surface Waters 1991Pilot Report. Washington (DC): US Environmental ProtectionAgency, Office of Research and Development; EPA/620/R-93/003.
Larsen S, Sorace A, Mancini L. 2010. Riparian bird communitiesas indicators of human impacts along Mediterranean streams.Environ Manage. 45:261–273.
Larsen DP, Thornton KW, Urquhart NS, Paulsen SG. 1994. Therole of sample surveys for monitoring the condition of theNation’s lakes. Environ Monit Assess. 32:101–134.
Ligeiro R, Hughes RM, Kaufmann PR, Macedo DR, Firmiano KE,Ferreira WR, Oliveira D, Melo AS, Callisto M. 2013. Definingquantitative stream disturbance gradients and the additive roleof habitat variation to explain macroinvertbrate taxa richness.Ecol Indic. 25:45–57.
Lindsay AR, Gillum SS, Meyer MW. 2002. Influence of lakeshoredevelopment on breeding bird communities in a mixed north-ern forest. Biol Conserv. 107:1–11.
Lloyd EA. 1988. The structure and confirmation of evolutionarytheory. New York: Greenwood Press.
Lynch WE Jr, Johnson DL. 1989. Influences of interstice size,shade, and predators on the use of artificial structures bybluegills. N Am J Fish Manage. 9:219–225.
MacArthur RH, MacArthur JW. 1961. On bird species diversity.Ecology. 42:351–364.
Macedo DR, Ligeiro R, Ferreira WR, Junqueira NT, Sanches BO,Silva DRO, Alves CBM, Hughes RM, Kaufmann PR, PompeuPS, et al. 2012. Parametros biologicos e de habitats fısicos paraavaliacao de bacias no Sudeste do Brasil. Acao Ambiental.47:15–18.
Mebane CA, Maret TR, Hughes RM. 2003. An index of biologicalintegrity (IBI) for Pacific Northwest rivers. T Am Fish Soc.132:239–261.
Merrell K, Howe E, Warren S. 2009. Examining shorelines, lit-torally. Lakeline. 29:1.
Molozzi J, Franca JS, Araujo TLA, Viana TH, Hughes RM, Cal-listo M. 2011. Diversidade de habitats fısicos e sua relacaocom macroinvertebrados bentonicos em reservatorios ur-banos. Iheringia Ser Zool. 101:191–199.
Ness KL. 2006. The effects of shoreline development on lake lit-toral and riparian habitats: are shoreline protection regula-tions enough? [masters thesis]. [Orono (ME)]: University ofMaine.
O’Connor RJ, Walls TE, Hughes RM. 2000. Using multiple tax-onomic groups to index the ecological condition of lakes.Environ Monit Assess. 61:207–228.
189

Kaufmann et al.
Omernik JM. 1987. Ecoregions of the conterminous United States.Ann Assoc Am Geogr. 77:118–125.
Paulsen SG, Larsen DP, Kaufmann PR, Whittier TR, Baker JR,Peck DV, Mcgue J, Stevens D, Stoddard J, Hughes RM,et al. 1991. Environmental Monitoring and Assessment Pro-gram (EMAP) – Surface Waters monitoring and researchstrategy. Washington (DC): US Environmental ProtectionAgency, Office of Research and Development; EPA/600/3-91/022.
Platts WS, Megahan WF, Minshall GW. 1983. Methods for evalu-ating stream, riparian and biotic conditions. Ogden (UT): USForest Service, Intermountain Forest and Range ExperimentStation, Gen. Tech. Rep. INT-138.
Radomski P, Geoman TJ. 2001. Consequences of human lakeshoredevelopment on emergent and floating-leaf vegetation abun-dance. N Am J Fish Manage. 21:41–46.
Remsburg AJ, Turner MG. 2009. Aquatic and terrestrial driversof dragonfly (Odonata) assemblages within and among north-temperate lakes. J N Am Benthol Soc. 28:44–56.
Roset N, Grenouillet G, Goffaux D, Pont D, Kestemont P. 2007.A review of existing fish assemblage indicators and method-ologies. Fish Manage Ecol. 14:393–405.
Rowan JS, Carwardine J, Duck RW, Bragg OM, Black AR, CutlerJEJ, Soutar I, Boon PJ. 2006. Development of a techniquefor Lake Habitat Survey (LHS) with applications for the Eu-ropean Union Water Framework Directive. Aquat Conserv.16:637–657.
Sanches BO. 2011. Variacoes espaciais na estrutura da comunidadede peixes do reservatorio de Nova Ponte (Rio Araguari, ba-cia do alto Parana) [dissertation]. [Belo Horizonte (Brazil)]:Pontifıcia Universidade Catolica de Minas Gerais.
Sass GG, Carpenter SR, Gaeta JW, Kitchell JF, Ahrenstorff TD.2012. Whole-lake addition of coarse woody habitat: responseof fish populations. Aquat Sci. 74:255–266.
Sass GG, Kitchell JE, Carpenter SR, Hrabik TR, Marburg AE,Turner MG. 2006. Fish community and food web responsesto a whole-lake removal of coarse woody habitat. Fisheries.31:321–330.
Savino JR, Stein RA. 1989. Behavior of fish predators and theirprey: habitat choice between open water and dense vegetation.Environ Biol Fish. 24:287–293.
Schindler DE, Scheuerell MD. 2002. Habitat coupling in lakeecosystems. Oikos. 98:177–189.
Segurado P, Santos JM, Pont D, Melcher A, Garcia Jalon D,Hughes RM, Ferreira MT. 2011. Estimating species toleranceto human perturbation: expert judgment versus quantitativeapproaches. Ecol Indic. 11:1623–1635.
Smokorowski KE, Pratt TC, Cole WG, McEachern LJ, MalloryEC. 2006. Effects on periphyton and macroinvertebrates fromremoval of submerged wood in three Ontario lakes. Can J FishAquat Sci. 63:2038–2049.
Steel A, Hughes RM, Schmutz S, Muhar S, Poppe M, TrautweinC, Fukushima M, Shimazaki H, Young J, Feist B, FullertonA, Sanderson B. 2010. Meeting the challenges of landscapescale riverine research: a review. Living Rev Landscape Res.4:1–60.
Stoddard JL, Herlihy AT, Peck DV, Hughes RM, Whittier TR,Tarquinio E. 2008. A process for creating multi-metric in-
dices for large-scale aquatic surveys. J N Am Benthol Soc.27:878–891.
Strayer DL, Findlay SEG. 2010. Ecology of freshwater shorezones. Aquat Sci. 72:127–163.
Taillon D, Fox MG. 2004. The influence of residential andcottage development on littoral zone fish communities ina mesotrophic north temperate lake. Environ Biol Fish.71:275–285.
Tarzwell CM. 1936. Lake and stream improvement in Michigan.In: Proceedings from the North American Wildlife Confer-ence. Washington (DC): US Government Printing Office. p.429–434.
Terra BF, Araujo FG. 2011. A preliminary fish assemblage in-dex for a transitional river—reservoir system in southeasternBrazil. Ecol Indic. 11:874–881.
TIGER. 1990. Modified topologically integrated geographic en-coding and referencing system; [cited Apr 2011]. Availablefrom: http://www.census.gov/geo/www/tiger
Tonn WM. 1990. Climate change and fish communities: a concep-tual framework. T Am Fish Soc. 119:337–352.
Tonn WM, Magnuson JJ. 1982. Patterns in the species compositionand richness of fish assemblages in northern Wisconsin lakes.Ecology. 63:1149–1166.
US Census Bureau. 1990. TIGER Line Maps: 1990 U.S. Counties.Washington (DC): US Department of Commerce, US CensusBureau.
US Census Bureau. 2001. US Census Bureau Online Information.Washington (DC): US Department of Commerce, US CensusBureau; [cited 17 Apr 2011]. Available from: http://www.census.gov/main/www/cen2000.html
[USEPA] US Environmental Protection Agency. 2007. Survey ofthe nation’s lakes. Field operations manual. Washington (DC):US Environmental Protection Agency; EPA 841-B-07-004.
[USEPA] US Environmental Protection Agency. 2009. NationalLakes Assessment – a collaborative survey of the Nation’slakes. Washington (DC): USEPA Office of Water; EPA 841-R-09-001.
Van Sickle J. 2013. Estimating the risks of multiple, covaryingstressors in the National Lakes Assessment. Freshwater Sci.32:204–216.
Vaux PD, Whittier TR, DeCesare G, Kurtenbach JP. 2000. Eval-uation of a backpack electrofishing unit for multiple lakesurveys of fish assemblage structure. N Am J Fish Manage.20:168–179.
Vogelmann JE, Howard SM, Yang L, Larson CR, Wylie BK, VanDriel JN. 2001. Completion of the 1990’s national land coverdata set for the conterminous United States. Photogram EngRemote Sens. 67:650–662.
Wagner T, Jubar AK, Bremigan MT. 2006. Can habitat alterationand spring angling explain largemouth bass nest success? TAm Fish Soc. 135:843–852.
Wege GJ, Anderson RO. 1979. Influence of artificial structureson largemouth bass and bluegills in small ponds. In JohnsonDL, Stein RA, editors. Response of fish to habitat structure instanding water. Bethesda (MD): American Fisheries SocietySpecial Publication 6. p. 59–69.
Whittier TR, Halliwell DB, Paulsen SG. 1997a. Cyprinid distri-butions in Northeast USA lakes: evidence of regional-scale
190

Lake habitat structure influences fish and birds
minnow biodiversity losses. Can J Fish Aquat Sci. 54:1593–1607.
Whittier TR, Hughes RM. 1998. Evaluation of fish species tol-erances to environmental stressors in lakes of the north-eastern United States. N Am J Fish Manage. 18:236–252.
Whittier TR, Hughes RM, Lomnicky GA, Peck DV. 2007. Fishand amphibian tolerance values and an assemblage toleranceindex for streams and rivers in the western USA. T Am FishSoc. 136:254–271.
Whittier TR, Kincaid TM. 1999. Introduced fish in NortheasternUSA lakes: regional extent, dominance, and effect on nativespecies richness. T Am Fish Soc. 128:769–783.
Whittier TR, Larsen DP, Peterson SA, Kincaid TM. 2002a. Acomparison of impoundments and natural drainage lakes inthe northeast USA. Hydrobiologia. 470:157–171.
Whittier TR, Paulsen SG, Larsen DP, Peterson SA, Herlihy AT,Kaufmann PR. 2002b. Indicators of ecological stress and theirextent in the population of northeastern lakes: a regional-scaleassessment. BioScience. 52:235–247.
Whittier TR, Vaux P, Merritt GD, Yeardley RB. 1997b. Fish Sam-pling. in Baker JR, Peck DV, Sutton DW. (editors). Environ-mental Monitoring and Assessment Program -Surface Waters:field operations manual for lakes. Washington, (DC): US En-vironmental Protection Agency, Office of Research and De-velopment; EPA/620/R-97/001. p. 6–1 to 6–57.
191