Embed Size (px)
Citation preview

Doc 9969
FINANCIAL STATEMENTS
REPORTS OF THE EXTERNAL AUDITOR AND
FOR THE FINANCIAL PERIOD ENDING 31 DECEMBER 2010
DOCUMENTATIONfor the 38th Session of the Assembly in 2013
INTERNATIONAL CIVIL AVIATION ORGANIZATION

�������

Doc 9969
FINANCIAL STATEMENTS
REPORTS OF THE EXTERNAL AUDITOR AND
FOR THE FINANCIAL PERIOD ENDING 31 DECEMBER 2010
DOCUMENTATIONfor the 38th Session of the Assembly in 2013
INTERNATIONAL CIVIL AVIATION ORGANIZATION

Published in separate English, Arabic, Chinese, French, Russian and Spanish editions by the INTERNATIONAL CIVIL AVIATION ORGANIZATION 999 University Street, Montréal, Quebec, Canada H3C 5H7 For ordering information and for a complete listing of sales agents and booksellers, please go to the ICAO website at www.icao.int Doc 9969, Financial Statements and Reports of the External Auditor for the financial period ending 31 December 2010 Order Number: 9969 Not for sale © ICAO 2011 All rights reserved. No part of this publication may be reproduced, stored in a retrieval system or transmitted in any form or by any means, without prior permission in writing from the International Civil Aviation Organization.

FINANCIAL STATEMENTS AND REPORTS OF THE EXTERNAL AUDITOR FOR THE YEAR ENDED 31 DECEMBER 2010


INTERNATIONAL CIVIL AVIATION ORGANIZATION
FINANCIAL STATEMENTS AND REPORTS OF THE EXTERNAL AUDITOR
FOR THE YEAR ENDED 31 DECEMBER 2010
TABLE OF CONTENTS
PAGE PART I PRESENTATION BY THE SECRETARY GENERAL
I - 1
PART II OPINION OF THE EXTERNAL AUDITOR
II - 1
PART III
FINANCIAL STATEMENTS
Statement I Statement of Financial Position III - 1Statement II Statement of Financial Performance III - 2Statement III Statement of Changes in Net Assets III - 3Statement IV Statement of Cash Flow III - 4Statement V Statement of Comparison of Budget and Actual Amounts III - 5 Notes to the Financial Statements III - 6 PART IV: TABLES
Table A Regular Activities by Fund IV - 1Table B Aviation Security Trust Funds IV - 3Table C Regular Programme – Assessments Receivable from Contracting States IV - 4Table D Technical Co-operation Project Activities by Group of Funds IV - 7Table E Technical Co-operation Project Activities by Trust Funds and Management
Service Agreements IV - 8
Table F Technical Co-operation Project Activities - Civil Aviation Purchasing Service Funds
IV - 10
PART V REPORT OF THE EXTERNAL AUDITOR TO THE ASSEMBLY ON
THE AUDIT OF THE FINANCIAL STATEMENTS OF THE INTERNATIONAL CIVIL AVIATION ORGANIZATION FOR THE FINANCIAL PERIOD ENDED 31 DECEMBER 2010
PART VI SECRETARIAT ACTION PLAN IN RESPONSE TO THE REPORT OF
THE EXTERNAL AUDITOR


PART I: PRESENTATION BY THE SECRETARY GENERAL


I - 1
INTERNATIONAL CIVIL AVIATION ORGANIZATION
PART I: PRESENTATION BY THE SECRETARY GENERAL 1. INTRODUCTION 1.1 The International Civil Aviation Organization (ICAO) is a specialized agency of the United Nations and was created with the signing in Chicago, on 7 December 1944, of the Convention on International Civil Aviation. ICAO is the permanent body charged with the administration of the principles laid out in the Convention. It sets the standards for aviation safety, security, efficiency and regularity, as well as for aviation environmental protection, and encourages their implementation. 1.2 ICAO’s membership comprises 190 Contracting States. Its headquarters are in Montreal and it has regional offices in Bangkok, Cairo, Dakar, Lima, Mexico City, Nairobi and Paris. 1.3 ICAO has a sovereign body, the Assembly, and a governing body, the Council. The Assembly, composed of representatives from all Contracting States, meets every three years, reviews in detail the complete work of the Organization, sets policy for the coming years and approves financial statements issued since the last Assembly. It also decides on the triennial budget. The Assembly last met in October 2010. 1.4 The Council, composed of representatives from 36 States, is elected by the Assembly for a three-year term and provides continuing direction to the work of ICAO. The Council is assisted by the Air Navigation Commission, the Air Transport Committee, the Finance Committee, the Committee on Unlawful Interference, Human Resource Committee, the Committee on Joint Support of Air Navigation Services and the Technical Co-operation Committee. 1.5 The Secretariat has five main divisions: the Air Navigation Bureau, the Air Transport Bureau, the Technical Co-operation Bureau, the Legal Bureau, and the Bureau of Administration and Services. The Finance Branch and Evaluation and Internal Audit Office are also part of the Secretariat and report to the Secretary General. The regional offices, working under the direction of Headquarters, are primarily responsible for maintaining liaison with States to which they are accredited and with other appropriate organizations, regional civil aviation bodies and the United Nations Regional Economic Commissions. The regional offices promote implementation of ICAO policies, decisions, Standards and Recommended Practices (SARPs) and regional air navigation plans and provide technical assistance when requested. 1.6. In accordance with Article 12.4 of the Financial Regulations, I have the honour to submit to the Council for consideration and recommendation to the Assembly the financial statements of ICAO for the year ended 31 December 2010. As required by Financial Regulation 13.3, the External Auditor’s opinion and his report on the 2010 financial statements are also submitted to the Council and Assembly as well as my comments (reflected in the Secretariat Action Plan) thereon. 1.7 Unless otherwise indicated, the financial statements and the accompanying note disclosures, which form an integral part of these financial statements, and this report are presented in thousands of Canadian Dollars (CAD), rounded to the nearest thousand.

I - 2 2. FINANCIAL REPORTING AND BUDGET PERFORMANCE HIGHLIGHTS
Adoption of International Public Sector Accounting Standards (IPSAS) 2.1 As reported in Note 1 to the financial statements, ICAO has fully applied IPSAS in 2010 for the first time. These standards have been adopted by the United Nations organizations to replace the United Nations System Accounting Standards (UNSAS). ICAO is one of the first UN organizations to fully apply IPSAS. One organization applied IPSAS in 2008 and other organizations plan to implement these standards from 2010 to 2014. IPSAS are a set of independently developed accounting standards, which require adoption of accounting on a “full accrual” basis. Full accrual is considered best accounting practice by international organizations for the public as well as the private sector. IPSAS include detailed requirements and guidance, which provide support for financial statements’ consistency and comparability. The Notes to the financial statements provide an overview of the impact of IPSAS adoption on the content and presentation of the financial statements. 2.2 ICAO’s implementation of IPSAS represents a significant achievement considering the detailed requirements of IPSAS and the nature of ICAO’s activities. ICAO adopted all applicable standards issued by the IPSAS Board. ICAO was not required to adopt all these standards in 2010 as some of these standards have their corresponding effective dates falling in 2011 and 2013. Nonetheless, those standards were also applied prior to their effective date for increased accountability. The IPSAS Board, the body that issues IPSAS, encourages early adoption of these standards. 2.3 In accordance with IPSAS 1, Presentation of Financial Statements, comparative information is encouraged to be disclosed in the financial statements on the first year of IPSAS adoption when practicable. ICAO has presented comparatives in the Statement of Financial Position which are represented by the restated opening balances at 1 January 2010. Note 9 to the financial statements provides the detail of the adjustments to opening balances in order to present the financial position on a comparable basis. Comparatives were not provided in the Statements of Financial Performance and Cash Flow. 2.4 IPSAS 17 allows for a grace period of up to five years prior for full recognition of Property, Plant and Equipment (PP&E). ICAO has invoked this transitional provision and has presented for information purpose and for more transparency, unrecorded PP&E in the notes to the financial statement. Nonetheless, PP&E purchased subsequent to the first adoption date of IPSAS on 1 January 2010 are recognized and capitalized in accordance with IPSAS without taking into consideration any transitional provisions. With regard to IPSAS 31, Intangible Assets, there is no grace period. This standard requires that the application be made prospectively. Accordingly, all additions pertaining to intangible assets acquired before 1 January 2010 are expensed and there are no retroactive adjustments to record acquisitions prior to that date. 2.5 Employee benefits liabilities pertaining to after service health insurance (ASHI) benefits, annual leave and repatriation benefits represent the most important adjustment caused by the application of IPSAS. Advice from independent actuaries in valuating these liabilities has been taken into consideration.

I - 3
Financial Statements
2.6 The following financial statements have been prepared in accordance with IPSAS:
• Statement I: Financial Position; • Statement II: Financial Performance; • Statement III: Changes in Net Assets; • Statement IV: Cash Flow; and • Statement V: Comparison of Budget and Actual Amounts.
2.7 Also in accordance with IPSAS, the financial statements include Notes that provide narrative descriptions and disaggregation of items disclosed in the financial statements and information about items that do not qualify for recognition in the statements. The Notes also include the presentation of major activities of ICAO by segment as required by IPSAS. It was determined that two segments would be included in the audited financial statements. The first segment covers on-going regular activities of the Organization, such as the Regular Programme, the revenue generating activities and the administration and support of the technical co-operation programme. The second segment covers the activities of all technical co-operation projects, generally conducted by ICAO at the request of individual States. 2.8 Tables are not part of the audited financial statements. However, since these tables offer more detailed information and support the combined figures to the audited financial statements, they are included in Part IV of this document. 2.9 The following paragraphs summarize the key information on the financial situation and performance of the Organization for 2010. 2.10 Statement I presents the financial position of the Organization. Assets totalling CAD 239.3 million at 31 December 2010 are mainly composed of cash and cash equivalents amounting to CAD 210.9 million and of assessments and other amounts receivable totalling CAD 23.7 million. New assets are recognized for the first time on this statement with the application of IPSAS, namely the inventory of publications (CAD 787 thousand added to this account), fixed assets (CAD 699 thousand) and intangible assets (CAD 92 thousand) acquired during the year. Total liabilities amounts to CAD 269.0 million, of which an amount of CAD 163.4 million represents advance receipts mostly for technical co-operation projects, and a long-term liability of CAD 76.9 million for employee benefits recognized for the first time on this statement with the application of IPSAS. 2.11 Statement I also shows an accumulated deficit of CAD 29.7 million, caused by the need to record the employee benefit liabilities under IPSAS. The impact of the application of IPSAS on Net Assets (Accumulated Deficit) is provided in Statement III and in Note 9 and is further explained below. Nonetheless, since current assets exceed current liabilities by an amount of CAD 42.0 million, it is not foreseen that additional funding will be necessary on a short term basis to cover the accumulated deficit. 2.12 Statement II presents the financial performance for the year 2010. There were significant changes made to this statement this year to comply with IPSAS. Revenue from project agreement previously recorded on a cash basis is now recognized on the basis of services rendered and goods delivered to technical co-operation projects. Sales of publications are also recorded on the accrual basis of accounting, when publications are delivered. There is also a temporary adjustment made to assessed contributions revenue for an amount of CAD 0.4 million during 2010 to take into account the

I - 4 impact of the recognition of long-term receivables at fair value as required by IPSAS. Total 2010 deficit amounts to CAD 11.8 million. Table A shows the deficit by Fund or Group of Funds for regular activities. Expenses include an amount of $7.0 million recorded in the Revolving Fund to recognize employee benefits expense (ASHI, annual leave and repatriation benefits) on an accrual basis. In previous years, most of these benefits were recorded on a cash basis. In 2010, CAD 2.8 million was paid for those benefits and this amount is presented in the Revolving Fund as a funding source from other Funds. The difference of CAD 4.2 million between benefits accrued and benefits paid is included in the deficit for the year for that Fund. Explanations on the financial results and deficit of the General Fund of the Regular Programme (CAD 3.2 million) and the AOSC Fund (CAD 0.8 million) are provided in the following paragraphs. 2.13 With regard to the net deficit of other Funds (CAD 3.6 million), the main reason is a timing difference in the recognition of revenue and expenses. Under IPSAS, under certain conditions, revenue may be recognized before the related expenses are incurred, more particularly with regard to revenue from non-exchange transactions such as voluntary contributions and donations. The 2010 deficit in other Funds of the Regular Activities segment was funded by surplus recognized in prior years and, therefore, will not require additional funding. 2.14 With regard to the Technical Co-operation Projects segment, there is no annual surplus or deficit for the year 2010 because revenue is recognized based on the stage of completion of projects, which is generally determined based on the costs incurred in each project. The cost of administration, operation and support to these projects is recognized in each project and the recovery of these administrative fees is recognized as revenue in the AOSC Fund. 2.15 Statement III provides changes in net assets during the year. The balance of Net Assets including reserves at the beginning of the year amounted to CAD 63.8 million. This amount has been reduced by an amount of CAD 72.0 million to comply with IPSAS bringing the restated opening balance to an accumulated deficit of CAD 8.2 million at 1 January 2010. The main impact is the recognition of employee benefits on the accrual basis. Other amendments were also required to comply with IPSAS, namely the need to discount long-term receivables to present those accounts at fair value and to record an allowance for a doubtful account. Further explanations are provided in the Notes. 2.16 Statement IV gives the breakdown of the variation of cash flow from CAD 215.9 million on 1 January 2010 to CAD 210.9 million at 31 December 2010. As permitted by IPSAS, the indirect method is used which is also the method adopted by ICAO in previous years. 2.17 Statement V shows a comparison between the budget (Regular Programme) and actual amounts. This statement is required under IPSAS because the approved budget and the financial statements are not prepared on the same basis as explained in Note 4 to the financial statements. This Statement also reflects the status of appropriations required by Financial Regulation 12.1.

I - 5
3. BUDGET PERFORMANCE AND FINANCIAL HIGHLIGHTS
Appropriations for Regular Programme 3.1 The 36th Session of the Assembly in 2007, under Clause C of Resolution A36-29, voted appropriations in the amount of CAD 85 507 thousand for the year 2010. Details of appropriations, transfers, actual expenditures and unobligated balances of appropriations by Strategic Objective and Supporting Implementation Strategies are given in Statement V. 3.2 The budgetary result for 2010, in thousands of Canadian dollars, is summarized as follows:
Original appropriations 85 507
Carried over from 2009 13 934 Decrease in appropriations ( 345) Approved Revised Appropriations 99 096
2010 Outstanding commitments (8 611) Carried over to 2011 (2 840) Revised 2010 Appropriations 87 645
3.3 Carry over from 2009. In accordance with Financial Regulation 5.6 and 5.7, an amount of CAD 13 934 thousand was approved by Council to supplement the 2010 appropriations, primarily for outstanding commitments and for mandatory and other mission-critical activities that were not budgeted for in 2010.
3.4 Decrease in Appropriations. The appropriation was reduced by transfers of appropriations in an amount of CAD 345 thousand to other funds as follows:
a) CAD 205 thousand to the Group on International Aviation and Climate Change (GIACC) – Environmental Fund; and
b) CAD 140 thousand to the Temporary Staff Salaries Fund (TSSF) for language requirements.
3.5 2010 Outstanding Commitments. The value of purchase obligations entered into in 2010 but delivery against which is only expected in 2011, is CAD 7 679 thousand. Employee entitlements in an amount of CAD 932 thousand consisting primarily of accrued leave and repatriation benefits are foreseen to be paid to staff separating from ICAO in 2011. Therefore, an amount of CAD 8 611 thousand (Figure 1, column (e) below), has been reserved and carried forward to 2011, pursuant to Financial Regulation 5.7, to clear the obligation incurred during 2010.

I - 6 3.6 Transfers. In compliance with Financial Regulation 5.9, the Secretary General authorized transfer of the appropriations between one Strategic Objective (SO) or Supporting Implementation Strategy (SIS) to another up to 10 per cent of the annual appropriation for each of the SO or SIS to which the transfer is made. 3.7 Carry-over to 2011. Under Financial Regulation 5.6, the Secretary General authorized to carry-over unspent appropriations, not exceeding 10 per cent per appropriation for each SO or SIS. The amount of CAD 2 840 thousand is within this limit. The amount being carried forward is to finance all of the initiatives mandated by the High Level Safety Conference and a smaller portion for other mission-critical activities not budgeted for in 2011. No part of the carry-over is to be utilized for non-programme activities. 3.8 As a result of the increases and transfers outlined in the preceding paragraphs, the final approved revised appropriation for the year amounted to CAD 87 645 thousand. 3.9 Comparison of Regular Programme Budget and Actual Amounts. Statement V shows no difference between revised budget/appropriations and actual amounts since appropriations are revised to take into consideration timing difference in the recognition of expenses under IPSAS and also because revised appropriations are compared to expenditures at budget rate in that statement. 3.10 The key factors that generated an actual deficit of CAD 3 151 thousand in 2010 for the Regular Programme Fund were the following:
• Timing difference in appropriations: CAD 2 484 • Transfer of expense to other Funds: (CAD 345) • Difference in revenue on an actual basis: CAD 1 012
3.11 The following figure provides a comparison between the approved budget and actual revenues and expenses by nature for 2010 (in thousands of CAD).

I - 7
FIGURE 1
3.12 Explanation of Differences – Revenues. The overall budget of CAD 85 507 thousand (column (a)) refers to the three main funding sources of the Regular Programme Budget for 2010: Assessed Contributions, ARGF Surplus, and Miscellaneous Income. For the Assessed Contributions, the difference of CAD 0.4 million pertains to the discounted amount of the long-term contribution receivable. For Miscellaneous Revenue, the lower receipt of CAD 1.4 million than expected is due to low interest rates during the triennium - thus resulting to a much lower interest income earned. 3.13 Explanation of Differences – Expenses. Actual staff salaries and employee benefits were lower than budgeted due to a lower post adjustment than budgeted. Actual expenses for Supplies, consumables and others and General Operating Expense exceeded the budgets mainly because of additional funding provided to high-priority ICT requirements such as replacement of aging IT infrastructure, modernization of RO IT equipment, and improvement of IT security, and funded by overall savings of the Organization. Travel expenses were lower than budgeted, mainly due to the amendment of travel policy on stop-over entitlement and postponement/cancellation of some missions. 3.14 Budget Exchange. For the first time in 2010, Member States were invoiced partly in USD and partly in CAD. The USD/CAD exchange rate on 1 January 2010 (the date when invoices were raised in USD) was lower than the rate used in developing the 2010 budget causing a reduction to total assessed contributions of CAD 2 144 thousand (column (c)). The difference has been added to actual expenditure in order to restate it to the budget rate (column (d)). In this manner, the budgetary savings i.e. difference between budget and actual expenses, have been appropriately adjusted (reduced).
2010Budget Actual1
Budget Exchange
Actualat Budget Rate2
2010Outstanding
Commitments Total Difference(a) (b) (c) (d)
= (b)+(c)(e) (f)
= (d)+(e)(g)
= (f) - (a)REVENUE $
Assessed Contributions 79 204 77 483 2 144 79 627 79 627 423Other Revenue 0
ARGF 4 386 4 386 4 386 4 386 -Miscellaneous 1 917 482 482 482 (1 435)
85 507 82 351 2 144 84 495 - 84 495 (1 012)
EXPENSESStaff salaries and employment benefits 75 393 66 881 2 069 68 950 3 324 72 274 (3 119)Supplies, consumables and others 296 274 274 238 512 216General operating expense 16 214 12 386 75 12 461 5 027 17 488 1 274Travel 4 435 3 914 3 914 3 914 ( 521)Meetings 2 438 2 029 2 029 22 2 051 ( 387)Other expenses 320 311 311 311 ( 9)Currency exchange difference ( 294) ( 294) ( 294) ( 294)
99 096 85 501 2 144 87 645 8 611 96 256 (2 840)
1From Table A, Financial Statements2Includes Budget Exchange loss of $2.14 million due to impact of US dollar transactions budgeted at USD1.00=CAD1.15

I - 8
Assessment and Reporting Currencies 3.15 Assessments on Contracting States and other estimated sources of revenue were established in Canadian dollars for 2008 and for 2009. In 2010 a split assessment was introduced with about three quarters payable in Canadian dollars and one quarter payable in U.S. dollars. To ensure consistency and comparability between the approved budgets and the Accounts and Funds of the Organization, transactions are reflected in Canadian dollars and the financial statements are presented in Canadian dollars from 2008 onwards. This change is applicable to most of the Funds of the Organization for regular activities presented in Segment 1, while Funds presented in Segment 2 related to Technical Co-operation Projects (TCP) are recorded in U.S. dollars, but presented in Canadian dollars in the financial statements. During 2010 the fluctuation of the Canadian dollar against the U.S. dollar was CAD 1.038 at the beginning of the year and CAD 1.000 at the end of the year.
Assessments and Other Voluntary Contributions 3.16 During the year 2010 assessments totalling CAD 73 453 thousand were received and a balance of CAD 3 639 thousand remained outstanding at the year-end against the current year’s assessments. At the beginning of the year, CAD 13 031 thousand was receivable from States in respect to 2009 and prior years; payment of CAD 4 055 thousand was received, leaving a balance outstanding of CAD 8 976 thousand. The assessments receivable for all years totalled CAD 12 614 thousand as at 31 December 2010 (including the Working Capital Fund). Details are provided in Table C of Part III to this document. The percentage of receipts of contributions for the last four years in relation to the amount assessed averaged 94 per cent. Figure 2 shows the status of the assessed contributions receivable at the end of each year since 2004.
FIGURE 2
Assessments Receivable from Contracting States as at 31 December 2010 3.17 Of the total outstanding contributions of CAD 12 614 thousand at 31 December 2010 (CAD 12 612 thousand excluding the Working Capital Fund), CAD 850 thousand pertained to States represented on the Council. The following figure provides detail of the assessments receivable in thousands of CAD, by group of States.
12.6 12.3
20.0
11.212.3
13.0 12.6
7.0 6.6 6.76.1 5.9 5.9
4.13.8 4.0 3.83.2
3.84.4 4.8
0.0
5.0
10.0
15.0
20.0
25.0
2004 2005 2006 2007 2008 2009 2010
(in m
illio
ns o
f CA
D d
olla
rs)
Total Outstanding for all States Total of Group A States Total of Group B States

I - 9
FIGURE 3
Number of States
2010
Amount outstanding as
at 31 December 2010
Number of States
2009
Amount outstanding as
at 31 December 2009
Group A: States that have concluded agreements with the Council to liquidate their arrears over a period of years
17 4 105
26 5 932
Group B: States with contributions in arrears of three full years or more that have not concluded agreements with the Council to liquidate their arrears
12
4 795
10
4 407
Group C: States with contributions in arrears for less than three full years
12 1 135
14 1 291
Group D: States with contributions outstanding only for the current year
45 2 076
27 894
Sub-total
86 12 111 77 12 524
The Former Socialist Federal Republic of Yugoslavia
- 501
- 501
Total Outstanding Contributions 86 12 612 77 13 025 3.18 As at 31 December 2010, 17 States had concluded agreements to liquidate their arrears over a period of years. The agreements provide for these States to effect payment of the current year's contribution as well as an annual instalment payment towards the prior year’s arrears. The note on Table C of Part IV to this document, indicates the States that had not complied with the terms of their agreements at 31 December 2010. 3.19 Major contributions (*) received for the Regular Programme and other Funds in Segment 1 for 2010 are summarized in thousands of CAD below.
FIGURE 4
Contributions In-Kind
Contributions in Cash and In
Kind
Assessment Contracting State Received (Premises) AVSEC Total
Canada 1 815 20 033 475 22 323 United States of America 19 265 1 939 21 204 Japan 9 055 422 9 477 Germany 5 279 143 5 422 France 3 853 766 690 5 309 United Kingdom 4 423 147 4 570 China 2 828 573 3 401 Italy 2 054 268 2 322 Republic of Korea 1 826 118 1 944 Spain 1 772 1 772 Thailand 416 1 300 1 716 Netherlands 1 464 31 1 495 Total 54 050 22 099 4 806 80 955
(*) Twelve highest contributions

I - 10 3.20 Total expenses in 2010, including those for seconded staff and premises provided without charge, by Strategic Objective and Strategic Implementation Strategy (SIS) and for other activities are shown in thousands of CAD below:
FIGURE 5
Safety Security Environment SIS Other (2) Total Regular Budget 19 646 7 070 1 844 34 941 22 000 85 501 Voluntary Funds 2 827 3 208 703 19 027 7 132 32 897 Premises 22 627 22 627 Seconded Staff (in-kind) (1)
China 8 27 282 317 Cuba 96 4 100 France 215 144 278 637 Italy 268 268 Japan 4 130 134 Malaysia 191 6 197 Saudi Arabia 143 48 191 Singapore 187 8 195 Switzerland 196 196 United States 120 13 203 336 Others 178 424 602 Subtotal seconded staff
1 142
952
1 079
3 173
Total Expenses
23 615
11 230
2 547
76 595
30 211
144 198
(1): 10 highest contributions by alphabetical order (2): Other strategic objectives
Cash Surplus 3.21 The cumulative surplus excluding reserves in Net Assets for the Regular Programme Budget at 31 December 2010 reflected in Table A of Part IV to this document amounted to CAD 12 073 thousand. Cumulative surplus less assessments receivable from Contracting States of CAD 12 614 thousand resulted in a cash deficit of CAD 541 thousand at 31 December 2010.
Ancillary Revenue Generation Fund (ARGF)
3.22 ARGF generated a surplus of CAD 4 927 thousand of which CAD 4 386 thousand was transferred to the General Fund in 2010. Since the expenditures under the Ancillary Revenue Generation Fund are volume driven, a comparison with a static budget is not meaningful.

I - 11 3.23 The following figure presents ARGF revenue and expenses by business activities for 2010 in thousands of CAD.
FIGURE 6
Revenue Expense Net Surplus Publications, Distribution & Printing (including dangerous goods)
8 448
4 310
4 138
Delegation & Conference Services & Rental 2 809 2 446 363 Events & Symposia 1 238 547 691 Periodicals 840 636 204 Commissariat 618 532 86 Websites 417 250 167 Licensing Agreements & Partnerships in Statistics 413 175 238 ARGF Governance, Training and Other Activities 330 1 290 (960) Total 15 113 10 186 4 927
Administrative and Operational Services Cost Fund (AOSC)
3.24 The AOSC Fund is established to meet the cost of administration and operation of the Technical Co-operation Programme (TCP), and is primarily financed from administrative overhead charges on UNDP, CAPS, Trust Fund and MSA projects. The financial results for the AOSC Fund are reported in Table A of Part IV to this document and the budgetary comparison is presented in the following figure in thousands of CAD.
FIGURE 7
AOSC Fund Budget and Expenditures for 2010
Submitted
to the Assembly
Revised Budget 20102
Actual Expenditure/
Income 20103
Balance of
Revised Budget
Appropriation/Expenditure Major Programme
9 3041
9 714
9 064
650
Income
9 736
8 252
Excess/(Deficit) of Income over Expenditure
22
(813)
1 Approved by the Assembly in 2007 (A36). Amounts converted to CAD at 2010 UN Average Rate of Exchange of
1 USD = 1.036 CAD. 2 Noted by the Council at its 191st Session (C-WP/13461). 3 Details do not add to totals due to rounding. 3.25 As indicated above, the Assembly approved the Indicative Budget Estimates (expenditure) of the AOSC Fund amounting to CAD 9 304 thousand for the financial year 2010. During the year, pursuant to Financial Regulation 9.5, the Secretary General submitted to the Council an update of the 2010 Budget Estimates (expenditure) for 2010 in C-WP/13641. The revised estimated expenditures for 2010 amounted to CAD 9 714 thousand and the estimated income to CAD 9 736 thousand.

I - 12 3.26 There is a shortfall of CAD 1.5 million in AOSC income versus budget mainly because of the expected implementation of USD 180 million in TC projects in 2010, implementation of 25% or USD 45 million did not materialize during the year yielding a shortage in forecasted income. On the expenditure side, staff costs savings amount to CAD 297 thousand. However, this saving is partially offset by a loss of CAD 136 thousand due to the rejection of a claim for loss of business due to a flood in 2009 and some other smaller variances in expenditures for an overall positive variance of CAD 138 thousand. The above result in a total negative variance of CAD 1.3 million in income and expenditures which is partially offset by a foreign exchange gain of CAD 511 thousand for a total net deficit of CAD 0.8 million. 3.27 The following figure reports on the trend in the annual excess (shortfall) over the last ten years in millions of CAD. FIGURE 8 AOSC Fund Surplus and Shortfall as at 31 December 3.28 During the 35th Session of the Assembly, the Administrative Commission recommended that the question of sharing costs between the Regular Programme and the Technical Co-operation Programme be reported to the Council for review. The Council has considered this issue and instructed the Secretary General to progressively allocate the identifiable costs to the AOSC Fund and the Regular Programme, as appropriate, in order to minimize the amount of cross-funding that was occurring between these Funds. 3.29 Technical Co-operation Programme. The Technical Co-operation Bureau (TCB) manages the Technical Co-operation Programme, a permanent priority activity of ICAO as stated in Assembly Resolution A36-17, which complements the role of the Regular Programme by supporting Member States in their implementation of ICAO regulations, policies and procedures. Through this Programme, ICAO provides a broad spectrum of services, including assistance to States in the review of
2.3
-0.9
0.1
0.80.5
0.1
-0.2 -0.3
-2.8
-0.8
-3.5
-2.5
-1.5
-0.5
0.5
1.5
2.5
2001 2002 2003 2004 2005 2006 2007 2008 2009 2010
(in m
illion
s of
Can
adia
n do
llars
)

I - 13 the structure and organization of national civil aviation institutions, updating the infrastructure and services of airports, facilitating technology transfer and capacity building, promoting ICAO Standards and Recommended Practices (SARPs), Air Navigation Plans (ANPs) and supporting remedial action resulting from the Universal Safety Oversight Audit Programme (USOAP) and the Universal Security Audit Programme (USAP) audits. 3.30 ICAO took steps aimed at increasing TCB's efficiency and quality of services, operational and financial controls and to improve the Bureau's working methodologies aligned with ICAO's Strategic Objectives. Accordingly, all key management positions, including the posts of Director, Deputy Director, Chief, Field Operations Section and Chief, Procurement Section, have been filled as a matter of priority. Furthermore, with a view to better support least developed countries requiring ICAO assistance to correct audit-related deficiencies and with the identification of funding, a new Project Financing and Development Section in TCB has been established. 3.31 Action has also been initiated to recruit Technical Co-operation officers in five of the seven regional offices and an assessment will be made on the need for officers in the two remaining offices. A Secretariat Working Group has been established to develop new coordination procedures between TCB and the Regional Offices. A Management Plan for the Technical Co-operation Bureau has been prepared in close coordination with the Technical Cooperation Committee, describing the goals and objectives for 2011 as well as specific planned actions aimed at increasing efficiencies and quality of services. Further efforts are required to improve the AOSC financial situation through a review of the TCB organizational structure, staffing levels, cost savings and efficiency measures. It should also be noted that the Agresso system has been implemented for TCB which will allow for more timely and transparent financial reporting.

I - 14 3.32 Technical co-operation projects represent one of the main activities of the Organization. Projects are financed by voluntary contributions and the inflows and outflows of financial resources totalled CAD 124.5 million in 2010. Tables D to F in Part IV of this document provides more detail on these projects, summarized by the following figures in thousands of CAD.
FIGURE 9
FIGURE 10
13,230 13,077 21,162
77,007
0
10,000
20,000
30,000
40,000
50,000
60,000
70,000
80,000
90,000
Field Operations Section ‐ Asia and
Pacific (FAP)
Field Operations Section ‐ Africa (FAF)
Field Operations Section ‐ Europe and Middle East (FEM)
Field Operations Section ‐ The Americas
(FAM)
Technical Co‐operation Project Expenses by Geographic Region
13,563
89,974
14,714
5,377 845
0
10,000
20,000
30,000
40,000
50,000
60,000
70,000
80,000
90,000
100,000
CAPS Fund MSA Funds Trust Funds UNDP executing Others
Technical Co‐operation Project Expenses by Type of Project


PART II: OPINION OF THE EXTERNAL AUDITOR


II - 2

PART III: FINANCIAL STATEMENTS


Note2010 Opening Balance
01.01. 2010 (Restated)
ASSETS
CURRENT ASSETSCash and cash equivalents 2.1 210 915 215 870
2.2 6 693 5 151 Receivables and advances 2.3 12 579 29 778 Inventories 2.4 987 990 Others 2.3 2 960 3 132
234 134 254 921
NON-CURRENT ASSETS2.2 3 863 5 117
Receivables and advances 2.3 521 543 Property, plant and equipment 2.5 699 Intangible assets 2.6 92 Derivative assets 2.7 650
5 175 6 310
TOTAL ASSETS 239 309 261 231
LIABILITIES
CURRENT LIABILITIESAdvanced receipts 2.8 163 356 161 282 Accounts payable and accrued liabilities 2.9 22 289 33 713 Employee benefits 2.10 4 612 4 691 Credits to contracting/servicing governments 2.11 1 528 2 516 Deferred revenue 2.12 343 585
192 128 202 787
NON-CURRENT LIABILITIESEmployee benefits 2.10 76 900 66 668
76 900 66 668
TOTAL LIABILITIES 269 028 269 455
NET ASSETSAccumulated deficit 2.13 (35 416 ) (24 859 )Reserves 2.13 5 697 16 635
NET ASSETS (ACCUMULATED DEFICIT) (29 719 ) (8 224 )
TOTAL LIABILITIES AND NET ASSETS 239 309 261 231
The accompanying notes are an integral part of the financial statements.
III - 1
Assessed contributions receivable from Member States
INTERNATIONAL CIVIL AVIATION ORGANIZATION
STATEMENT ISTATEMENT OF FINANCIAL POSITION
AT 31 DECEMBER 2010(in thousands of Canadian dollars)
Assessed contributions receivable from Member States

Note 2010
REVENUE
Contributions for project agreements 122 847 Assessed contributions 77 483 Other revenue producing activities 3.2 13 173 Other voluntary contributions 5 976 Other revenue 3.2 3 798
TOTAL REVENUE 223 277
EXPENSES
137 359 67 796
General operating expenses 17 098 Travel 7 940 Meetings 2 128 Training 1 173 Grants and other transfers 440 Other expenses 762 Currency exchange difference 393
TOTAL EXPENSES 235 089
DEFICIT FOR THE YEAR (11 812 )
The accompanying notes are an integral part of the financial statements.
III - 2
STATEMENT II
INTERNATIONAL CIVIL AVIATION ORGANIZATION
Staff salaries and employee benefitsSupplies, consumables and others
STATEMENT OF FINANCIAL PERFORMANCE FOR THE YEAR ENDED 31 DECEMBER 2010
(in thousands of Canadian dollars)

Note
Net Assets Beginning of the Year
Deficitof the Year Reserves
Net Assets End
of the Year
Balance at 31 December 2009 48 982 14 827 63 809
Change in accounting policies and other adjustments to net assets 2.13
Initial recognition of property, plant and equipment (1 145) (1 145)
Initial recognition of employee benefits (70 611) (70 611)
Initial recognition of inventories 759 759
Initial recognition of discount of long outstanding receivables (2 256) (2 256)
Initial recognition of provision of long outstanding receivables ( 501) ( 501)
Translation adjustment 1 808 1 808
Other adjustments ( 87) ( 87)
Total changes to net assets (73 841) 1 808 (72 033)
Restated Opening Balance 1 January 2010 (24 859) 16 635 (8 224)
Movements in fund balances and reserves in 2010
Transfer from net assets to liabilities 7 (1 180) (1 180)
Variation to carry forward balance 2.13 2 483 (2 483)
Variation to derivative assets 2.7 ( 650) ( 650)
Actuarial loss 2.10 (5 881) (5 881)
Other reclassifications and transfers ( 48) ( 6) ( 54)
Translation adjustment (1 918) (1 918)
Deficit of the year (11 812) (11 812)
Total movements during the year 1 255 (11 812) (10 938) (21 495)
Balance at 31 December 2010 (23 604) (11 812) 5 697 (29 719)
The accompanying notes are an integral part of the financial statements.
III - 3
INTERNATIONAL CIVIL AVIATION ORGANIZATION
STATEMENT OF CHANGES IN NET ASSETSFOR THE YEAR ENDED 31 DECEMBER 2010
(in thousands of Canadian dollars)
STATEMENT III

Note 2010
CASH FLOWS FROM OPERATING ACTIVITIES:
Deficit for the year ( 11 812)
(Increase) decrease in contributions receivable 2.2 ( 1 542)
(Increase) decrease in receivables and advances 2.3 17 199
(Increase) decrease in inventories 2.4 3
(Increase) decrease in other assets 2.3 172
(Increase) decrease in non-current contributions receivable (net of discount) 2.2 1 254
(Increase) decrease in non-current receivables and advances 2.3 22
Increase (decrease) in advanced receipts 2.8 2 074
Increase (decrease) in accounts payable and accrued liabilities 2.9 ( 11 424)
Increase (decrease) in short-term employee benefits 2.10 ( 79)
Increase (decrease) in credits to contracting/servicing governments 2.11 ( 988)
Increase (decrease) in deferred revenue 2.12 ( 242)
Increase (decrease) in long-term employee benefits 2.10 10 232
Actuarial loss reflected in reserves 2.10 ( 5 881)
Interest income ( 373)
Depreciation and amortization 90
Disposal of property, plant and equipment ( 19)
Foreign currency translation adjustment ( 1 918)
NET CASH FLOWS FROM OPERATING ACTIVITIES ( 3 232)
CASH FLOWS FROM INVESTING ACTIVITIES:
Acquisition of property, plant and equipment and Intangibles 2.5 & 2.6 ( 881)
Proceeds of disposal of property, plant and equipment 19
Interest income 373
NET CASH FLOWS FROM INVESTING ACTIVITIES ( 489)
CASH FLOWS FROM FINANCING ACTIVITIES:
Transfers from net assets to liabilities and other transfers ( 1 234)
NET CASH FLOWS FROM FINANCING ACTIVITIES ( 1 234)
NET INCREASE (DECREASE) IN CASH AND CASH EQUIVALENTS ( 4 955)
CASH AND CASH EQUIVALENTS AT BEGINNING OF THE YEAR 215 870
CASH AND CASH EQUIVALENTS AT END OF THE YEAR 210 915
The accompanying notes are an integral part of the financial statements.
III - 4
INTERNATIONAL CIVIL AVIATION ORGANIZATION
STATEMENT IVSTATEMENT OF CASH FLOW
FOR THE YEAR ENDED 31 DECEMBER 2010
(in thousands of Canadian dollars)

Original Carried over Decrease of 2010 2010 Transfers Carried over 2010 BudgetStrategic Objective / A36-29 from Prior Yeara Appropriationsa Appropriations Outstanding among SO/SISc to Following Appropriations Exchange At Budget RateSupporting Implementation Strategy Before Transfers Commitmentsb Yeard Revised Total Difference2 of Exchange
A. Safety 16 185 3 920 - 20 105 (1 610) 1 619 - 20 114 19 646 468 20 114 -
B. Security 8 778 206 - 8 984 ( 138) (1 491) ( 122) 7 233 7 070 163 7 233 -
C. Environment 1 755 472 ( 205) 2 022 ( 316) 163 - 1 869 1 844 25 1 869 -
D. Efficiency 21 304 2 540 - 23 844 (1 389) 64 (2 000) 20 519 19 695 824 20 519 -
E. Continuity 2 046 111 - 2 157 ( 61) ( 280) ( 200) 1 616 1 502 114 1 616 -
F. Rule of Law 790 16 - 806 ( 3) 10 - 813 803 10 813 -
Sub-Total 50 858 7 265 ( 205) 57 918 (3 517) 85 (2 322) 52 164 50 560 1 604 52 164 -
III - 5
INTERNATIONAL CIVIL AVIATION ORGANIZATION
STATEMENT VSTATEMENT OF COMPARISON OF BUDGET AND ACTUAL AMOUNTS
FOR THE YEAR ENDED 31 DECEMBER 2010
(in thousands of Canadian Dollars)
REGULAR PROGRAMME GENERAL FUND
Appropriations Expenditures1
Balance
Sub-Total 50 858 7 265 ( 205) 57 918 (3 517) 85 (2 322) 52 164 50 560 1 604 52 164 -
Management & Administration 19 638 4 006 - 23 644 (4 327) 1 714 ( 200) 20 831 20 511 320 20 831 -
Programme Support 14 871 2 663 - 17 534 ( 767) (1 799) ( 318) 14 650 14 430 220 14 650 -
Sub-Total 34 509 6 669 - 41 178 (5 094) ( 85) ( 518) 35 481 34 941 540 35 481 -
Total 85 367 13 934 ( 205) 99 096 (8 611) - (2 840) 87 645 85 501 2 144 87 645 -
Organizational Realignment 140 - ( 140) - - - - - - - - -
TOTAL 85 507 13 934 ( 345) 99 096 (8 611) - (2 840) 87 645 85 501 2 144 87 645 -
a Approved by Council at its 190th session (C-DEC 190/3)
c Approved by the Secretary General, Fin. Regulation 5.9d Approved by the Secretary General, Fin. Regulation 5.6
2 Budget exchange difference due to impact of US dollar transactions budgeted at USD1.00 = CAD 1.15Material differences between 2010 Appropriations before Transfers and Total Expenditures are explained in the Presentation by the Secretary General.The accompanying notes are an integral part of the financial statements.
b Financial Regulation 5.7
1 Expenditures other than Canadian dollars are reflected at the UN rate of Exchange and include currency exchange differences such as the revaluation of balance sheet items and forward exchange gains/losses.

III-6
INTERNATIONAL CIVIL AVIATION ORGANIZATION Notes to the Financial Statements
31 December 2010
NOTE 1: ACCOUNTING POLICIES
Basis of Preparation
1. The financial statements of the International Civil Aviation Organization (ICAO) have been prepared on the accrual basis of accounting in accordance with the International Public Sector Accounting Standards (IPSAS).
2. These are the first set of financial statements prepared fully in accordance with IPSAS. The adoption of IPSAS has required changes to be made to the accounting policies previously followed by ICAO. This includes the preparation of financial statements on a full accrual basis, most notably the recognition of end-of-service and post-retirement benefits and revenue from voluntary contributions for Technical Co-operation projects previously recorded on a cash basis. The adoption of the new accounting policies has resulted in changes to the assets and liabilities recognized in the Statement of Financial Position. Accordingly, the audited Statement of Financial Position, dated 31 December 2009, has been restated and the resulting changes are reported in the Statement of Changes in Net Assets. The revised 31 December 2009 Statement of Financial Position is presented in these financial statements as the Opening Balance 1 January 2010 (Restated). The net effect of the changes brought about by the adoption of IPSAS in the Statement of Financial Position amounted to a decrease in total net assets of CAD 72.0 million on 1 January 2010.
3. As permitted on the initial adoption of IPSAS, transitional provisions have been applied in the following areas: i) comparative information has not been provided in the Statements of Financial Performance and Cash Flow (IPSAS 1) and ii) the initial recognition of property, plant and equipment (PP&E) (IPSAS 17) including those under finance leases acquired before 1 January 2010 are not reflected on the face of the financial statements, but in the Notes to the Financial Statements for information purposes.
4. The following Accounting Standards have been adopted prior to their required implementation dates: Employee Benefits (IPSAS 25); Intangible Assets (IPSAS 31); Financial Instruments: Presentation (IPSAS 28), Recognition and Measurement (IPSAS 29) and Disclosures (IPSAS 30).
5. Except as otherwise stated in these statements, the measurement basis used in preparing the financial statements is the amortized cost. The Cash Flow Statement (Statement IV) is prepared using the indirect method.
6. The reporting currency of ICAO is the Canadian dollar (CAD). The functional currency of ICAO regular activities is the CAD. The functional currency of the Technical Cooperation Projects (TCP) is the United States dollar (USD) because these activities are generally carried out in USD. Transactions in currencies other than CAD, and other than the USD for TCP, are translated at the prevailing United Nations Operational Rates of Exchange (UNORE) at the time of transaction. Monetary assets and liabilities in currencies other than CAD, and other than USD for the TCP, are translated at the prevailing UNORE at year-end closing rate, which reasonably approximates the spot rate. Resulting gains or losses are accounted for in the Statement of Financial Performance except for differences arising from the translation of TCP activities into CAD for presentation purposes which are reflected in Reserves in the Statement of Financial Position.

III-7
Cash and Cash Equivalents
7. Cash and cash equivalents comprise cash on hand, cash at banks and short-term deposits.
8. Interest revenue is recognized as it accrues, taking into account the effective yield.
Financial Instruments
9. Financial instruments are recognized when ICAO becomes a party to the contractual provisions of the instrument until such time as when the rights (or the obligation) to receive (to pay) cash flows from those assets (liabilities) have expired or have been transferred (settled).
10. Receivables are non-derivative financial assets with fixed or determinable payments that are not quoted in active markets. Receivables include contributions receivable in cash and other receivables. Long term receivables, including assessments receivable, are stated at amortized cost using the effective interest method.
11. Except for assessed contributions received in advance, all liabilities are derived from exchange transactions. All non-derivative financial liabilities are recognized initially at fair value and, when applicable, subsequently measured at amortized cost using the effective interest method.
Inventories
12. Publications and Commissariat items on hand at the end of the financial period are recorded as inventories. Publications are valued at the lower of cost and current replacement cost and commissariat inventory is valued at the lower of cost and net realizable value.
13. The cost of publications includes purchase cost and all other costs incurred in bringing the publications to a saleable or distributable state. The cost of Commissariat items represents the purchase price. Cost is determined on the weighted average basis.
14. Publications and other documents for internal use are expensed when produced.
Receivables and Revenue
15. Assessed contributions represent a legal obligation of Contracting States. These contributions are revenue from non-exchange transactions recognized in the year for which the assessments are levied. Contributions for Technical Co-operation Project (TCP) activities are revenues from exchange transactions which are determined by the stage of completion of projects based on the delivery of goods or rendering of services as specified in the signed project agreements. Other voluntary contributions are generally non-exchange transactions recognized as revenue when confirmed in writing by donors, or otherwise when received.
16. Administrative fees recovered on Technical Co-operation projects are presented as revenue in the Administrative and Operational Services Cost (AOSC) Fund and as expenses in the respective projects. In accordance with IPSAS, revenue from administrative fees generated by TC projects is recognized based on the stage of completion. The stage of completion is estimated as follows:
Ninety percent of the fee is recognized when a purchase order for equipment is issued and the remaining 10 percent is recognized upon delivery; and
For services, the administrative fee is recognized on the basis of cost incurred.

III-8
17. Other revenues are exchange transactions and balances receivable are presented in receivables and advances.
18. Contributions receivable are shown net of allowances related to reductions in contribution revenue, doubtful accounts and amortization (discount):
allowance for reductions in voluntary contribution revenue are reductions of contributions receivable and revenue when the funding is no longer needed by the project to which the contributions was directed or is otherwise unavailable;
allowance for doubtful accounts on assessed contributions is based on historical experience and on events that would indicate that a Contracting State is not capable of discharging its obligation; and
discounted long-term contributions receivable represent the outstanding balance of assessed contributions for which States have concluded agreements to liquidate their arrears over a period of years. Discounting is also applied to a number of other long outstanding contributions considering the probability that such agreements will be concluded to liquidate arrears.
19. In-kind contributions are presented at fair value. Donated goods that directly support approved operations and activities and can be reliably measured are recognized in the accounts. Services provided without charges are not recognized in the accounts, but are presented in the Notes to the Financial Statements for information purposes. These contributions include use of premises, transport and personnel.
Property, Plant and Equipment
20. Property, Plant and Equipment (PP&E) are stated at historical cost less accumulated depreciation and any impairment losses. Depreciation is provided for PP&E over their estimated useful life using the straight line method, except for land which is not subject to depreciation. The estimated useful life for PP&E classes is as follows:
21. Property, plant and equipment are capitalized if their cost is greater or equal to the threshold limit set at CAD 3 thousand and CAD 25 thousand in the case of leasehold improvements. The threshold level is reviewed periodically. Leasehold improvements are valued at cost and depreciated over the lesser of the remaining useful life of the improvements or the lease term.
22. Impairment reviews are undertaken for all PP&E at least annually and any impairment losses are recognized in the Statement of Financial Performance. Impairment indicators include the obsolescence and deterioration of PP&E as well as the cash flow generated by PP&E utilized to generate revenue from a commercial activity.
Intangible Assets
23. Intangible assets are stated at historical cost less accumulated amortization and any impairment losses. Intangible asset recognition requires meeting strict criteria with respect to being identifiable, being under ICAO’s control and contributing future economic benefits or service potential which can be reliably measured. Remaining useful life is also a consideration. Specific criteria were also developed to exclude items acquired below a cost of CAD 5 thousand, and CAD 25 thousand for internally developed assets due to the difficulty to
Class Estimated Useful Life (Years)
Buildings 5-50 Information Technology (IT) and Office Equipment 3-7 Furniture, Fixtures and Fittings 5-12 Telecommunication and Printing Equipment 3-7 Motor Vehicles 3-10

III-9
measure with precision internal operational and research costs to be expensed and development costs to be capitalized. As permitted under IPSAS 31, this standard has been applied prospectively effective 1 January 2010.
24. Amortization is provided over the estimated useful life using the straight line method. The estimated useful life for intangible asset classes is as follows:
Class Estimated Useful Life (Years)
Software Acquired Externally 3-6 Software Internally Developed 3-6 Licenses and Rights and Other Intangible Assets 2-6
Copyrights 3-10
25. Licenses, rights and copyrights are amortized over the licenses, rights and copyrights periods.
26. Impairment reviews are undertaken for all intangible assets at least annually and any impairment losses are recognized in the Statement of Financial Performance. Impairment indicators include the obsolescence and the deterioration of intangibles as well as the cash flow generated by intangibles when utilized to generate revenue from a commercial activity.
Employee Benefits
27. ICAO recognizes the following accrued employee benefits:
short-term employee benefits which are expected to be settled wholly within twelve months after the end of the accounting period in which employees render the related service;
post-employment benefits; and
other long-term employee benefits such as end-of-service benefits.
28. Most employees of ICAO are members of the United Nations Joint Staff Pension Fund (UNJSPF). The Pension Fund is a multi-employer funded, defined benefit plan. UNJSPF is not in a position to identify and allocate each participant’s share of the underlying financial position and performance of the plan on an IPSAS 25 basis with sufficient reliability for accounting purposes and, therefore, as permitted by IPSAS this plan is treated as if it were a defined contribution plan.
29. ICAO uses a reserve account in Net Assets to record actuarial gains and losses related to after-service heath insurance benefits (ASHI).
Provisions and Contingent Liabilities
30. Provisions are made for future liabilities and charges where ICAO has a present legal or constructive obligation as a result of past events and it is probable that ICAO will be required to settle the obligation.
31. Other commitments, which do not meet the recognition criteria for liabilities, are disclosed in the notes to the financial statements as contingent liabilities when their existence will be confirmed only by the occurrence or non-occurrence of one or more uncertain future events which are not wholly within the control of ICAO.

III-10
Segment Reporting and Fund Accounting
32. A fund is a self-balancing accounting entity established to account for the transactions relating to a specified purpose or objective. Funds are segregated for the purpose of conducting specific activities or attaining certain objectives in accordance with special regulations, restrictions or limitations. The financial statements are prepared on a fund accounting basis, showing at the end of the period the consolidated position of all ICAO funds. Fund balances represent the accumulated residual of revenue and expenses.
33. A segment is a distinguishable group of activities for which financial information is reported separately in order to evaluate an entity’s past performance in achieving its objectives and for making decisions about the future allocation of resources. ICAO classifies all projects, operations and fund activities into two segments: i) Regular activities and ii) Technical Co-operation Project activities. ICAO reports on the transactions of each segment during the financial period, and the balances held at the end of the period. Inter-segment charges are based on project agreements.
34. The Regular Activities segment includes the General Fund, the Working Capital Fund of the Regular Programme, special accounts and funds administered for aviation safety, security, environmental and other supporting activities of the Organization. Unutilized appropriations voted for the Regular Programme Budget of the General Fund may be brought forward to the following financial year under certain conditions. Specific funds and special accounts are established by the Assembly or Council under Financial Regulation 7.1 mainly for special contributions or monies earmarked for specific activities, the balances of which may be brought forward to the succeeding financial period. The main funding sources of this segment are assessed contributions, revenue producing activities, other voluntary contributions and administrative fees.
35. The Regular Activities segment includes the following Funds or groups of Funds: The Regular Budget Fund comprises:
• The General Fund financed by assessed contributions from Contracting States according to
the scale of assessments determined by the Assembly, by miscellaneous income, by the Ancillary Revenue Generation Fund (ARGF) surplus, and by any advances made from the Working Capital Fund, established by the Assembly for the purpose of making (repayable) advances as necessary to the General Fund to finance budgetary appropriations pending receipt of contributions from Contracting States and to other Funds in specific cases.
Funds related to Regular Activities comprise the following:
• Capital Fund established for the purpose of recording the acquisitions of property, plant and equipment and intangible assets for the General Fund of the Regular Programme.
• Revolving Fund established for the purpose of recording the transactions relating to After-Service Health Insurance (ASHI) including unfunded liabilities and other specific liabilities in order to present these transactions separately within the Regular Activities segment.
• Ancillary Revenue Generation Fund (ARGF) established to hold revenue generating and cost recovery activities in one Fund. Special Accounts and Funds within the ARGF are established by the Secretary General under Financial Regulation 7.2 to record all revenues and expenditures relating to self-financing activities. Any surplus not projected to be committed or expensed may be transferred to the General Fund and the balances may be brought forward to the succeeding financial period. The main funding sources of this segment are the sales of publications, data and services.

III-11
• Administrative and Operational Services Cost (AOSC) Fund established under Financial
Regulation 9.4. The AOSC Fund recovers the costs of administration, operation and support of TC projects. In the event that the AOSC operation in any given year ends in a financial deficit, such deficit is first to be met from the accumulated surplus of the AOSC Fund and, as a last resort, from the Regular Programme Budget. The AOSC Fund is primarily financed from administrative overhead charges to Technical Co-operation projects including UNDP projects.
• Aviation Security (AVSEC) Plan of Action (ASPA) which includes earmarked funds as well as Special Accounts/Funds established to reflect Council approval of the Aviation Security Plan of Action (ASPA), comprising projects to be financed from funds within the Aviation Security Trust Funds. Activities relating to the ASPA projects are funded from general and earmarked contributions and by services in kind as indicated in Note 3.1.
• The Comprehensive Regional Implementation Plan for Aviation Safety in Africa (AFI
Plan) established to increase ICAO leadership and accountability in programme co-ordination and management across the AFI Region and to ensure effective implementation to rectify safety and infrastructure deficiencies.
• The Joint Finance Funds comprise Danish and Icelandic Joint Financing Agreements,
which reflect the transactions of the Funds established to report on ICAO supervision of the operation of air navigation services provided by the Government of Iceland, and in Greenland by the Government of Denmark, the costs of which are recovered by the service providers through user charges and assessments on Contracting governments. User charges are collected by the United Kingdom and are due and directly remitted to the Governments of Iceland and Denmark. Assessments are levied and collected by ICAO for remittance to the servicing governments. Therefore, these transactions are reflected in the accounts as assets and liabilities in the Statement of Financial Position. Also included is the North Atlantic Height Monitoring System Fund (HMU) to account for the financial transactions made under the provisions of the Arrangement on the Joint Financing of a North Atlantic Height Monitoring System. The operation and maintenance costs are recovered by the service providers through user charges on civil aircraft making crossings over the North Atlantic. User charges collected by ICAO are directly payable to service providers and are therefore reflected as assets and liabilities in the accounts.
• Incentive for the Settlement of Long-outstanding Arrears Account established to present in a separate account a portion of a payment of certain assessments in arrears from Contracting States to finance particular activities of the Organization.
• Information and Communication Technology (ICT) Fund established to finance improvements to information and communication systems of the Organization.
• Public Key Directory Fund (PKD), a cost-recovery fund, established by the Council to report on the activities of a project to support interoperability of electronic-enhanced machine readable passports. The operations are financed by voluntary contributions and, in accordance with the agreement, the balance of the Fund is recorded as an amount due to the participating States.
• International Financial Facility for Aviation Safety Fund (IFFAS) established by the
Council in accordance with the principles and guidelines contained in Assembly Resolution A33-10, with the objective of financing safety related projects for which States cannot otherwise provide or obtain the necessary financial resources. On 17 November 2010, ICAO’s Council dissolved the IFFAS. The utilization of the remaining assets is disclosed in Note 7.
• Temporary Staff Salaries Fund (TSSF) set up to refinance the posts which were initially cut in the Triennium Budget 2008 – 2010.

III-12
• Other Funds. Under an agreement with the European Civil Aviation Conference (ECAC), composed of a number of ICAO’s Members States, ICAO provides certain secretariat services. Disbursements are financed initially from ECAC’s revenue collected by ICAO and, when necessary from the General Fund of the Regular Programme funds, which are reimbursed to ICAO. The net amount receivable or payable for all transactions effected on ECAC’s behalf is included in the amount due from or payable to regional bodies.
• The Administrative Fee for Joint Financing, the Universal Safety Oversight Audit Programme Fund, the Environmental Fund, the International Registry Fund and France Co-operation Fund and other Funds or special accounts are also included in other Funds.
36. The Technical Co-operation Project Activities segment comprises Technical Co-operation (TC) project funds established by the Secretary General under Financial Regulation 9.1 to administer programmes of technical co-operation. The main funding sources of this segment are contributions for project agreements.
37. The TC projects include UNDP arrangements and projects managed under Trust Funds agreements, Management Service Agreements (MSA) and Civil Aviation Purchasing Services Agreements (CAPS). The financial transactions relating to the UNDP arrangements comply with both ICAO and UNDP directives. Trust Funds and MSAs are designed to cover a broad range of technical co-operation services and the CAPS agreements are designed to provide procurement services. ICAO also enters into Technical Co-operation agreements referred to as Lump Sum Contracts with Contracting States. These contracts differ from MSA and Trust Fund agreements in that they are for a short duration and for a fixed contract amount. Under or over recovery of actual expenditure is reflected in the AOSC Fund.
NOTE 2: ASSETS AND LIABILITIES
Note 2.1: Cash and Cash Equivalents
38. Funds are deposited in banks on a pooled investment basis and funds not needed for immediate requirements are invested in term deposits. Balances at 31 December 2010 and 1 January 2010 are composed of:
31 December
2010
Opening Balance 1 January 2010
(Restated)
In thousands of CAD
Cash in banks 87 802 94 518 Term deposits 123 113 121 352 Total Cash and Cash Equivalents 210 915 215 870
39. As at 31 December 2010, the term deposits had an average interest rate of 0.27 percent (0.47 percent on 1 January 2010) and an average term maturity of 70 days (52 days in 2009). Cash in banks at year end includes an amount of CAD 1 966 thousand held on behalf of ECAC.
Note 2.2: Contributions Receivable
40. The net assessed contributions receivable balances as at 31 December 2010 and 1 January 2010 are composed of:

III-13
31 December
2010
Opening Balance 1 January 2010
(Restated)
In thousands of CAD Current 6 693 5 151 Discounted non-current 3 863 5 117 Total Net Contributions Receivable 10 556 10 268
41. Current contributions receivable are for contributions that are due within twelve months while non-current contributions receivable are those that are due or foreseen to be paid after 12 months from the date of the financial statements as described in the accounting policies for Receivables and Revenue. The gross and net amounts of contributions receivable are as follows:
31 December 2010
Opening Balance 1 January 2010
(Restated)
In thousands of CAD Assessed Contributions – Regular Programme 12 614 13 031 Assessed Contributions – Joint Financing Agreements 79 (226)
Total Contributions Receivable before allowances and amortization
12 693 12 805
Less: Allowance for doubtful accounts (501) (501) Discount on long-term receivables (1 636) (2 036) Total Net Contributions Receivable 10 556 10 268
42. The following table illustrates the composition of assessed contributions receivable for the Regular Programme.
31 December 2010
Opening Balance 1 January 2010
(Restated)
In thousands of
CAD % In thousands of CAD %
Year of Assessment 2010 3 639 28.9 - - 2009 1 227 9.7 2 390 18.3 2008 920 7.3 1 216 9.3 2007 440 3.5 697 5.4 2006 and earlier 6 388 50.6 8 728 67.0 Total 12 614 100.0 13 031 100.0

III-14
43. There were no movements of the allowance for doubtful accounts during 2010.
Opening Balance
1 January 2010
(Restated)
Utilization
Increase/ (Decrease)
31 December
2010 In thousands of CAD
Total Allowance for Doubtful Accounts 501 - - 501
The amount of CAD 501 thousand represents the full amount owing to ICAO by the former Socialist Federal Republic of Yugoslavia, the resolution of which remains under active discussion at the United Nations General Assembly where there is an expectation that successor States will cover the debt.
44. There were no write-offs of contributions receivable during 2010. An increase or decrease in the allowance for doubtful accounts represents an expense for the period and is reported in the Statement of Financial Performance.
45. There was no balance in the allowance for reductions in contribution revenue during 2010.
46. The movements of the discounted long-term contributions receivables during 2010 are as follows:
47. The discount on long-term contributions receivable represents the amount which is required to adjust the receivable balance to fair value upon initial recognition. Since the non-current portions are not due to be collected for more than one year, they are discounted at an interest rate. This amount is reflected as a reduction of the long-term receivable balance. This difference is then gradually recognized as revenue over the life of the receivable. The discount is computed by applying the rate of 4.3 percent to the scheduled future instalment payments for all Group A States and a number of Group B States.
Opening Balance
1 January 2010
(Restated)
Utilization
Increase/ (Decrease)
Ending Balance
31 December 2010
In thousands of CAD Discounted Long-Term Contributions Receivable 5 117 (1 654) 400 3 863

III-15
48. The discounted long-term contributions relate to assessments receivable from States in Group A that have concluded agreements with the Council to liquidate their arrears over a period not exceeding twenty years, without interest and States in Group B without agreements with outstanding assessments exceeding five years. Utilization of CAD 1 654 thousand includes payments received during the course of the year from States which concluded agreements with ICAO. The increase of CAD 400 thousand is the discount of the long-term accounts receivable balance which has been recognized in revenue for the period ended 31 December 2010. There were no new agreements entered into during the course of the year and a number of States with concluded agreements with ICAO at the beginning of the year provided payments which exceeded the repayment terms of their respective agreements.
Note 2.3: Receivables, Advances and Other Assets
49. Receivables and advances:
50. Advances to employees are for education grants, rental subsidies, travel and other staff entitlements.
51. Receivables from UN Agencies are related to other international organizations, mainly United Nations organizations.
52. Miscellaneous receivables include amounts due from clients for services provided under special accounts and accrued interest receivable.
53. The non-current portion of Receivables and Advances is composed of an amount due from the African Civil Aviation Commission (AFCAC), a regional body. This amount results from negotiations and discussions between ICAO and AFCAC for the settlement of amounts owed by AFCAC to the Organization. Effective 1 January 2007, AFCAC assumed full responsibility for financial transactions and operations previously performed by ICAO on its behalf. The undiscounted receivable amounts to CAD 943 thousand. The discounted amount due from AFCAC reflected in the accounts totals CAD 760 thousand, of which an amount of CAD 521 thousand represents the non-current portion of the receivable (CAD 543 thousand on 1 January 2010).
31 December 2010
Opening Balance 1 January 2010
(Restated) In thousands of CAD
Advances to Employees 1 361 894 Receivables from United Nations Agencies 1 906 1 663 Others 9 312 27 221
Total: 12 579 29 778

III-16
54. Other Current Assets are comprised of:
Note 2.4: Inventories
55. ICAO inventories include the stock of published documents which are printed in house for sale to the worldwide civil aviation community and the stocks of duty free items held by the Commissariat Store for sale to individuals having diplomatic status. In the 31 December 2009 Financial Statements, commissariat inventory was recorded in the accounts and publications inventory in the Notes. Effective 1 January 2010, publications inventory is also recorded in the accounts.
56. The table below shows the total value of inventories as presented in the Statement of Financial Position.
31 December
2010
Opening Balance 1 January 2010
(Restated)
In thousands of CAD
Publications on hand –finished goods 652 759
Raw material and work in process 135 -
Total Publications 787 759
Total Commissariat Items 200 231
Total Inventories 987 990
57. Further detail is shown below on the reconciliation of publication and commissariat inventories to reflect the opening balance and the additions during the period reduced by the value of inventories sold and impairment allowance made during the year.
31 December 2010
Opening Balance 1 January 2010
(Restated) In thousands of CAD
Recoverable Provincial Sales Tax 1 667 1 768 Recoverable Federal Sales Tax 738 757 Prepaid Expenses 329 512 Recoverable United States Income Tax 163 18
Recoverable France Sales Tax 57 69
Others 6 8
Total 2 960 3 132

III-17
31 December 2010
Publications Reconciliation: In thousands of CAD Opening Balance 759
Direct Material 807 Direct Labour 1 682 Indirect Costs 183 Total Inventory Purchased and Produced 3 431 Less: Cost of Publications Sold (2 581) Less: Impairments (63) Closing Balance 787
31 December
2010 Commissariat Items Reconciliation: In thousands of CAD Opening Balance 231
Inventory Purchased 443 Total Inventory Purchased 674
Less: Cost of Items Sold (474)
Closing Balance 200
58. Publications and commissariat items and quantities derived from ICAO’s inventory tracking systems are validated by physical stock count.
59. Inventories are valued net of any identified impairments. During 2010, impaired publication inventory valued at CAD 63 thousand was identified and removed from the inventory records. This write-off represents an expense for the period and is included in the “supplies, consumables and others” line item in the Statement of Financial Performance.
Note 2.5: Property Plant & Equipment
60. The cost of property, plant and equipment (PP&E) includes items held at ICAO Headquarters (HQ) in Montreal as well as those held at the seven Regional Offices. These items provide benefits or service potential to the Organization which exercises full control over their acquisition, physical location, use and disposal.
61. As noted in Note 1 and as permitted on the initial adoption of IPSAS, transitional provisions have been applied to the initial recognition of PP&E. Therefore, the following table presents only PP&E acquired in 2010 and capitalized in the accounts in accordance with IPSAS.
Acquisitions
during the Year Accumulated Depreciation
Closing Balance 31 December 2010
In thousands of CAD Furniture and Fixtures 25 1 24 IT and Office Equipment 538 59 479 Motor Vehicles 142 18 124 Leasehold Improvement 75 3 72 Total 780 81 699

III-18
62. No impairment of PP&E was identified in 2010.
63. Prior to 1 January 2010, the cost of non-expendable property, which comprises furniture, vehicles, computers and other office equipment, was charged to expenditure in the year the items were ordered, in conformity with paragraph 43 of UNSAS. These assets as well as other PP&E, under finance leases, acquired before 1 January 2010 have not been capitalized and will be presented in the Statement of Financial Position during the transitional period (2011-15) as permitted under IPSAS 17. Commitments related to leases are presented in Note 6.
64. The HQ property – Maison de l’OACI was constructed in 1995 and is owned by a private sector organization. This property is leased by the Government of Canada for a duration of 20 years, until 2016. Under a Supplementary Agreement between the Government of Canada and ICAO, the property is occupied in its entirety by ICAO, which reimburses 25 percent of the rental and operating costs to the Government of Canada. The Government of Canada assumes 75 percent of the rental and operating costs, 100 percent of the property taxes and has the option to purchase the building at the end of the lease term at a favourable price and, if accepted by ICAO, must transfer 25 percent of the ownership on the basis that ICAO would reimburse 25 percent of the cost of the purchase option. If the option is not exercised by the Government of Canada for itself, ICAO has the right to request the Government of Canada to exercise the option on its behalf and to transfer ownership of the building. This scenario requires that ICAO would reimburse 100 percent of the cost of the purchase option and any cost associated with the transaction itself and that it would occupy the building for its own use during a minimum period of twenty (20) years. The cost of the property is estimated at CAD 116 million and the purchase option exercisable in 2016 amounts to CAD 23.45 million. As permitted by IPSAS, the portion of the rental costs charged to ICAO is expensed and the portion financed by the Government of Canada represents contributions related to services in kind as shown in Note 3.1.
65. ICAO also owns 47 percent of the property of the EURNAT Regional Office in Paris at an original cost of CAD 1 145 thousand and the remaining 53 percent of the property is under a nominal finance lease, which represents contributions for services in kind as shown in Note 3.1. As noted in paragraph 63, assets acquired before 1 January 2010 will be capitalized during the transitional period (2011-15). Other buildings occupied by ICAO are under operating leases or nominal leases.
66. The non-capitalized PP&E are presented at cost less the accumulated depreciation as if they were depreciated since their acquisition date. Since the internal records do not separately provide the cost of the building and land in Paris acquired in earlier years, the cost of the land is considered immaterial at the acquisition date and is included in Property, which is fully depreciated. The following table presents PP&E including finance leases acquired prior to 1 January 2010, which are not capitalized in the accounts, as ICAO applies the IPSAS transitional provisions as mentioned above and in Note 1.
Opening Balance 1 January 2010
Accumulated Depreciation
Closing Balance31 December
2010 In thousands of CAD
1Property 1 145 1 145 - Furniture and Fixtures 94 50 44 IT & Office Equipment 2 500 2 292 208 Motor Vehicles 459 346 113 Equipment Under Finance Leases 461 108 353
Total 4 659 3 941 718
1 Property excludes HQ property noted in paragraph 64.

III-19
67. The minimum future annual payments from 2011 to 2014 under finance lease obligations for equipment amount to CAD 108 thousand for a total minimum payment of CAD 351 thousand, less interest of CAD 32 thousand for a capital lease obligation of CAD 319 thousand. The obligations under ICAO Headquarters lease is presented in Note 6.
Note 2.6: Intangible Assets
68. Intangible assets acquired during the year 2010 comprise software purchased externally at a cost of CAD 101 thousand less accumulated amortization of CAD 9 thousand for a net value of CAD 92 thousand as at 31 December 2010.
69. Following the review of intangibles to identify any impairment in their value, it was determined that no intangibles were impaired during the year.
Note 2.7: Derivative Assets
2.7.1 Nature of Derivative Assets
70. There were no derivative assets at 31 December 2010 (CAD 650 thousand on 1 January 2010).
71. Accounting policies on financial instruments are set out in Note 1. Financial assets of ICAO are categorized as loans and receivables (no investments and saleable financial assets) and amount to CAD 26 616 thousand which is composed of:
31 December 2010 1 January 2010
(Restated) In thousands of CAD
Composition:
Assessed contributions receivable (current) 6 693 5 151
Assessed contributions receivable (non-current) 3 863 5 117
Receivables and advances (current) 12 579 29 778
Receivables and advances (non-current) 521 543
Other assets 2 960 3 132 Total Financial Assets 26 616 43 721
All material financial liabilities are financial instruments stated at amortized cost.
72. ICAO is exposed to financial risks summarized in the following paragraphs.
2.7.2 Credit Risk
73. ICAO’s credit risk is spread widely and ICAO’s risk management policies limit the amount of credit exposure to any one counter party and include minimum credit quality guidelines.
74. Credit risk and liquidity risk associated with cash and cash equivalents is minimized substantially by ensuring that these financial assets are placed in highly liquid and diversified money market funds with major financial institutions that have been accorded strong investment grade ratings by a primary rating agency and/or with other credit worthy counterparties.

III-20
75. Contributions receivable comprise primarily amounts due from sovereign nations. Details of contributions receivable are provided in Note 2.2. As noted in Note 1 and 2.2, long term contributions are stated at discounted cost using the effective interest method. Since these receivables do not bear interest, the interest rate used to calculate the discounted cost is the rate applicable for long-term Canadian government bonds.
2.7.3 Interest Rate Risk
76. ICAO is exposed to interest rate risk through term-deposits. In 2010, the average interest rate and term maturity are provided in Note 2.1. Due to the current low interest rate level risk is minimal.
2.7.4 Foreign Currency Risk
77. At 31 December 2010, cash, cash equivalent and investments are denominated in CAD (12 percent) and in USD (80 percent) which is the base currencies used by the Organization (9 percent in the CAD and 79 percent in USD base currencies at 1 January 2010). Non-CAD or USD holdings have the primary objective of supporting operating activities in other currencies than CAD. In addition, 32 percent of contributions receivable are denominated in CAD and 68 percent in USD base currencies (28 percent in CAD and 72 percent in USD base currencies at 1 January 2010).
78. In previous years, the organization entered into derivative financial instruments in the form of forward currency contracts to manage the foreign exchange exposure so as to stabilize costs at the budgeted rate of exchange. The difference between the United Nations Operational Rate of Exchange (UNORE) and the forward purchase contract rate was charged to expenditure when the contracts were exercised. At the end of the year, no forward contracts were held for hedging purposes. Accordingly, there are no derivative assets as at 31 December 2010.
79. In early 2008, ICAO entered into forward purchase contracts for the purchase of USD 54.6 million for the 2008 to 2010 triennium at an average exchange rate of USD 0.995 to CAD 1.00 and for the purchase of Euros. These contracts led to realized gains/losses in 2010. Of the forward currency purchase contracts, USD 18.3 million (CAD 19.0 million) were received at an actual cost of CAD 18.3 million in 2010 contributing to a realized gain of CAD 0.7 million. In addition, EURO 2.3 million (CAD 3.2 million) were received at an actual cost of CAD 3.5 million, contributing to a realized loss of CAD 0.3 million. These exchange differences are reflected in the expenditure lines (prorated) in the Statement of Financial Performance.
80. Starting in 2010, in order to minimize the exposure of the USD fluctuation, the Organization moved to a split assessment system under which Member States are assessed partly in USD and partly in CAD based on foreseen needs of both currencies. With the adoption of the split assessment system, management believes that there is no need to enter into forward exchange contracts for the purchase of USD.
81. Purchase Orders pertaining to Technical Co-operation projects are sometimes denominated in currencies other than the CAD or USD. In order to limit exposure to currency fluctuations, a policy on hedging has been adopted, whereby funds are purchased in the currency of the commitment at the time the Purchase Order is issued, in cases where currency fluctuation could have a material impact on the financial position of the project. An exchange gain or loss is recognized equivalent to the difference between the UNORE and the spot rate in effect on the date that the funds are purchased.

III-21
2.7.5 Liquidity Risk
82. A Working Capital Fund in the amount of USD 6 million is established by the Assembly for the
purpose of making advances as necessary to the General Fund to finance budgetary appropriations pending receipt of contributions from Contracting States and other Funds in specific cases. Also, funds are deposited in banks on a pooled investment basis and funds not needed for immediate requirements are invested in term deposits.
Note 2.8: Advance Receipts
83. Advance receipts comprise:
31 December
2010
Opening Balance 1 January 2010
(Restated) In thousands of CAD
Voluntary Contributions for TC Projects 156 769 157 737 Assessed Contributions 1 784 801 Other Advances 4 803 2 744 Total 163 356 161 282
84. Advance receipts comprise voluntary contributions for Technical Co-operation projects for which funding are received in advance. Revenue is only recognized when goods are delivered or when services are rendered by ICAO as per the terms of the agreements signed between ICAO and contributors. This liability also includes any balance of unutilized contributions to be remitted to contributors.
85. Assessed contributions represent payments received from States before the year to which they relate.
86. Other advances include an amount of CAD 1 181 thousand due to IFFAS contributors (Note 7), CAD 1 446 thousand for advance receipts from a Member State (France), an amount of CAD 1 040 thousand for advance payments received from publication sales and other advances.
Note: 2.9: Accounts Payables and Accruals
87. Accounts payable and accruals are composed of the following:
31 December 2010
Opening Balance 1 January 2010
(Restated) In thousands of CAD
Suppliers Payables 16 923 27 864 Accruals and Other Payables 5 366 5 849 Total 22 289 33 713
88. Accounts payable to suppliers relate to amounts due for goods and services for which invoices have been received. Accruals are liabilities for goods and services that have been received or provided to ICAO during the period and which have not been invoiced.

III-22
89. ICAO provides certain secretariat services for the European Civil Aviation Conference (ECAC). The net amount payable for all transactions effected on ECAC’s behalf during the year is included in Accruals and Other Payables.
31 December 2010
In thousands of CAD
Opening balance at 1 January 3 737
Receipts during the year 8 501
Subtotal: 12 238 Less: disbursements during the year 10 272 Closing balance at 31 December 1 966
Note 2.10: Employee Benefits
90. Employee benefits liabilities comprise After Service Health Insurance (ASHI) benefits, end of service benefits for annual leave, repatriation benefits payable and other short term amounts.
31 December 2010
Opening Balance 1 January 2010
(Restated)
In thousands of CAD Composition:
Current 4 612 4 691 Non-current 76 900 66 668 Total 81 512 71 359
2.10.1 Valuation of Employee Benefit Liabilities
91. Employee benefit liabilities are determined by professional actuaries or calculated by ICAO based on personnel data and past payment experience.
2.10.2 Valuations of Post-Employment and Other Separation Related Benefits
92. Liabilities arising from end of service benefits, annual leave and repatriation benefits, and post-employment benefits (ASHI) are determined by independent consulting actuaries. These employee benefits are established for staff members in Headquarters and Regional Offices who are covered by ICAO Staff Rules.
93. Under IPSAS 25, actuarial gains or losses for post-employment benefits can be recognized over time using the reserve approach. Under the reserve approach, actuarial gains/losses are presented under Net Assets and not recognized as revenue or expense so as to consider the reasonable possibility that gains/losses will be revised over time. For other separation-related benefits, actuarial gains and losses are recognized immediately and reflected in the Statement of Financial Performance.
94. Other employee benefits comprise estimated repatriations benefits and annual leave due to Technical Co-operation project staff on separation. Such project staff benefits are not covered

III-23
by the UN Staff Regulations and Rules, but by specific conditions under technical co-operation projects.
95. The movement of employee benefits liabilities during 2010 is as follows:
Opening Balance 1 January 2010
(Restated) Utilization Increase/
(Decrease)
Ending Balance 31 December
2010
Actuarial Loss/(Gain)
In thousands of CAD
Post-Retirement Plan (ASHI) 56 324 (1 156)
4 788 5 881 65 837
End of Service - Annual Leave 4 867 ( 816) 560 665 5 276
End of Service - Repatriation Benefits 8 664 ( 810) 999 (17) 8 836 Other Employee Benefits for International Experts 1 504 ( 474) 533
-1 563
Total Employee Benefits Liabilities 71 359 (3 256) 6 880 6 529 81 512
96. The utilization column represents payments made during the year. The increase of CAD 4 788 thousand for ASHI represents current service costs (CAD 2 292 thousand) and interest cost (CAD 2 496 thousand) charged to 2010 expenses. The actuarial loss of CAD 5 881 thousand is recorded in a reserve account against net assets. The increase for annual leave of CAD 560 thousand is composed of current service cost (CAD 353 thousand) and interest cost (CAD 207 thousand). The actuarial loss of CAD 665 thousand is charged to 2010 expense. The increase for repatriation benefits comprises current service cost (CAD 617 thousand) and interest cost (CAD 382 thousand). The actuarial gain of CAD 17 thousand is charged against 2010 expense.
2.10.3 Effect of Increase (Decrease) of One Point in Trend Assumption
97. IPSAS require that the impact of one point in trend assumption be disclosed in the financial statements:
Current Service Cost Minus one percentage point: decrease of CAD 893 thousand
Plus one percentage point: increase of CAD 1 162 thousand
Accrued Benefit Obligation
Minus one percentage point: decrease of CAD 10 149 thousand Plus one percentage point: increase of CAD 12 868 thousand
2.10.4 Actuarial Assumptions and Methods
98. Each year, ICAO reviews and selects assumptions and methods that will be used by the actuaries in the year-end valuation to determine the expense and contribution requirements for ICAO’s after-service benefit plans (post-employment benefits and other separation-related benefits). For the 2010 valuation, the assumptions and methods used are described in the following table which also indicates the changes in the assumptions and methods used in comparison with the 2009 valuation which has been used to restate the 1 January 2010 figures.

III-24
99. The assumptions and methods adopted for the 31 December 2010 actuarial valuation resulted in an increase in the liability for post-employment and end of service related benefits in the total amount of CAD 10.2 million, including net actuarial losses of CAD 6.5 million.
100. ICAO is using the Canadian government bonds rate to discount the liability related to staff benefits. In some jurisdictions, there is no deep market for government bonds or government bonds are more risky than high quality corporate bonds. In such cases the use of the corporate bond rate would be more appropriate, being closer to a risk free rate. This matter was considered by ICAO’s actuaries and it was determined that in the case of ICAO the use of the Canadian bond rate is more appropriate than the corporate bond rate for the reasons provided under paragraph 94 of IPSAS 25 and because of existence of a deep market for government bonds in Canada. Therefore ICAO has continued to use the government bond rate to discount the liability. Had ICAO used the corporate bond rate (5.4 percent at 31 December 2010), ICAO’s liability at 31 December 2010 for ASHI, annual leave and repatriation benefits would have been reduced by 25 percent (CAD 20 million) and the 2010 expense by 11 percent (CAD 800 thousand).
101. Actuarial assumptions are required to be disclosed in the financial statements in accordance with IPSAS 25. In addition, each actuarial assumption is required to be disclosed in absolute terms. The following key assumptions and methods have been used to determine the value of post-employment and other separation-related employee liabilities for ICAO at 1 January 2010, using projections to estimate the liability at 31 December 2010.

III-25
Assumptions Used for ASHI Plan:
Actuarial Method ASHI: The projected unit credit cost method, prorated on years of service, up to the age
the employee is fully eligible for retirements benefits.
Discount Rate 3.50 percent for accounting and funding (4.30 percent in 31 December 2009 valuation).
Medical and Dental Trend Rates Drugs and other health care from 10 percent to 4 percent over a period of 20 years, dental 4 percent for 20 years.
Expected Return on Assets Not applicable as plans are treated as unfunded.
Exchange Rate Used USD 1.00 for CAD 1.00. (CAD 1.038 in prior valuation).Medical and Dental Claims Cost Average annual costs per person at age 60 are CAD 1.407 thousand for drug costs, from
USD 0.2 thousand to CAD 0.7 thousand for dental costs and CAD 0.3 thousand for other health care costs.
Age Variation of Medical and Dental Costs
For drugs in Canada from 5.8 percent at age 40 to 0 percent at age 85 and up. For health care in Canada, from 2.0 percent up to age 59 to 0.75 percent at age 85 and up. Health care outside Canada from 2.7 percent at age 40 to 0 percent at age 90 and up. Dental care minus 0.5 percent per year. Reduction of drug cost at age 65 for those covered by a public drug plan in Canada, 50 percent in Quebec and 65 percent in other provinces.
Annual Administrative Costs Included in annual costs per person.Mortality Table Up to 94, projected 2020.
Withdrawal Rates From age 20 to 55 and up: 15 percent to 0 percent.Retirement Age Employee hired prior to 1 January 1990: age 59, on or after this date at age 62. Coverage of Dependents at Retirement
70 percent. Wives are assumed to be five years younger than their male spouses. No children per family at retirement age.
Assumptions Used for Annual Leave and Repatriation Benefits:
Actuarial Method Annual leave and repatriation grant: actuarial present value of future benefits with salary projections.
Discount Rate 3.50 percent per year (4.30 percent in prior valuation).
Salary Increase 3.25 percent per year.
Net Accrual in Annual Leave Balance
From 8 days during the first year to none for 35 years of service and more, up to a maximum of 90 days.
Withdrawals Due to Voluntary Leave
10 percent.
Removal of Effects on Repatriation
CAD 12.5 thousand per employee with annual increase of 3.25 percent per year.
Travel Costs CAD 5.0 thousand per employee with annual increase at 3.25 percent per year.

III-26
2.10.5 United Nations Joint Staff Pension Fund
102. ICAO is a member organization participating in the United Nations Joint Staff Pension Fund (UNJSPF), which was established by the United Nations General Assembly to provide retirement, death, disability and related benefits. The pension fund is a funded multi-employer defined benefit plan. As specified by Article 3 (b) of the Regulations of the Fund, membership in the Fund shall be open to the specialized agencies and to any other international, intergovernmental organization which participates in the common system of salaries, allowances and other conditions of service of the United Nations and the specialized agencies.
103. The actuarial method adopted for the UNJSPF is the Open Group Aggregate method to determine whether the present and estimated future assets of the Fund will be sufficient to meet its present and estimated future liabilities, using various sets of assumptions as to future economic and demographic developments. The actuarial study is carried out at least once every three years; a review of the 2009 annual report of the UNJSPF reveals that an actuarial valuation has been carried out every two years from as early as 1997. The United Nations Board of Auditors carries out an annual audit of the UNJSPF and reports to the United Nations Joint Staff Pension Board on the audit every two years. The most recent actuarial valuation at the time of preparing these accounts was the one carried out at 31 December 2009 and reveals an actuarial deficit of 0.38 percent of pensionable remuneration, the first deficit since 31 December 1995 and is largely attributable to investment performance in recent years. As part of the normal actuarial valuation cycle, during 2011, the Pension Board will review an analysis of the actuarial assumptions and methods to be used for the next actuarial valuation at 31 December 2011. In addition, during 2011, a special study called an asset liability management study is also being completed. This study provides a sophisticated statistical analysis of projected plan liabilities compared to plan assets over the next 60 years.
104. At 31 December 2009, the funded ratio, assuming zero pension adjustments was 139 percent (146.9 percent two years earlier) while the funded ratio which takes the rate of pension adjustment into account, and is based on a real interest rate (i.e., net of nominal interest assumption and assumed rate of pension adjustment) of 3.5 percent, was below 100 percent.
105. The UNJSPF publishes quarterly reports on its investments and these are publicly available.
106. ICAO’s financial obligation to the UNJSPF consists of its mandated contribution at the rate established by the United Nations General Assembly, currently at 7.9 percent for the participants and 15.8 percent for member organizations, respectively, of the applicable pensionable remuneration, together with its share of any actuarial deficiency payments under Article 26 of the Regulations of the Pension Fund.
107. Such deficiency payments are payable only if and when the United Nations General Assembly has invoked the provision of Article 26, following determination that there is a requirement for deficiency payments based on an assessment of the actuarial sufficiency of the Pension Fund as of the valuation date. Each member organization shall contribute to this deficiency an amount proportionate to the total contributions which each paid during the three years preceding the valuation date. At the time of this report, the United Nations General Assembly had not invoked this provision.
108. The plan exposes participating organizations to actuarial risks associated with the current and former employees of other organizations, with the result that there is no consistent and reliable basis for allocating the obligation, or plan assets to participating organizations in the plan. ICAO, as well as other participating organizations, is not in a position to identify its share of the underlying financial position and performance of the plan with sufficient reliability for accounting purposes, and hence has accounted for this plan as if it were a defined contribution plan in line with IPSAS 25, Employee Benefits.

III-27
109. During 2010, contributions paid to UNJSPF amounted to USD 17.7 million (equivalent to CAD 18.3 million). Two thirds of these amounts are the employer share of contributions.
2.10.6 Social Security Arrangements for Employees under Service Contracts
110. ICAO employees under service contracts are usually entitled to social security based on local conditions and norms. ICAO however, has not undertaken any global arrangement for social security under service contracts. Social security arrangements can either be obtained from national social security system, private local schemes or as cash compensation for own scheme. The provision of proper social security in line with local labour legislation and practice is a key requirement of the service contract. Service contract holders are not ICAO staff members and are not entitled to the normal staff member benefits.
Note 2.11: Credits to Contracting/Servicing Governments
111. The credits comprise amounts assessed from contracting governments and collected by ICAO on behalf of servicing governments under the Danish and Icelandic Joint Financing Agreements, which are to be remitted to contracting/servicing governments. Also included in the liability, are user charges collected by ICAO on behalf of service governments under the Joint Financing of a North Atlantic Height Monitoring System. Credits amounted to CAD 581 thousand and CAD 947 thousand respectively as at 31 December 2010 (CAD 2 516 thousand at 1 January 2010).
Note 2.12: Deferred Revenue
112. Deferred revenue totaling CAD 343 thousand (CAD 585 thousand at 1 January 2010) under a professional liability insurance arrangement will be recognized upon substantial completion of the related technical co-operation projects.

III-28
Note 2.13: Net Assets (Fund Balances) by Segment and Reserves
113. The information contained in Statement III is further presented by segment and line detail in the table below:
Regular Activities
Net
Accumulated Reserves
Technical Co-Operation
Projects Reserves
Total
In thousands of CAD
Balance at 31 December 2009
48 982 14 827 -
63 809
Restatements (Note 9)
(73 841) - 1 808
(72 033)
Restated Balance 1 January 2010
(24 859) 14 827
1 808 (8 224)
Deficit for the Year
(11 812)
-
-
(11 812)
Subtotal
(36 671) 14 827
1 808 (20 036) Movements during the Year:
Transfer from Net Assets to Liabilities (1 180) -
- (1 180) Variation to Carry Over Balance 2 483 (2 483)
-
-
Variation to Derivative Assets - (650) - (650)
Actuarial Loss - (5 881) - (5 881)
Other Reclassifications and Transfers (48) (6)
- (54)
Translation Adjustment
-
2
(1 920)
(1 918)
Total movements during the Year
1 255 (9 018)
(1 920) (9 683)
Closing Balance at 31 December 2010
(35 416) 5 809
(112) (29 719)
114. Closing balances are ICAO’s residual interest in the assets after deducting all its liabilities. Since liabilities exceed assets, it is anticipated that future funding will cover the accumulated deficit.
115. Included in the Regular Activities segment is the Regular Budget carry-over of CAD 11 451 thousand for the year ending 31 December 2010 (CAD 13 934 thousand as of 31 December 2009). Other amounts included in the reserve account are incentive funds reserved for special projects of CAD 237 thousand and ASHI actuarial loss of CAD 5 881 thousand at 31 December 2010.
116. Included in the Technical Co-operation Project Activities Reserves is the translation adjustment from USD to CAD to reflect the Technical Cooperation Project Activities in the reporting currency. The balance of CAD 112 thousand represents the translation adjustment of the balance sheet items at the 31 December rate and revenue/expense items at the average rate.

III-29
NOTE 3: REVENUES AND EXPENSES Note: 3.1 Contributions – Services in Kind
117. Under separate agreements between the Governments of Canada, Egypt, France, Peru, Senegal,
Thailand and Mexico and the Organization, these Governments undertake to bear all or part of the costs of the rental of the premises located in their respective countries. The Government of Canada also bears the major part of the operational and maintenance costs of the Headquarters premises. Contributions in kind are not recorded in the accounts, but presented for information purposes in notes below.
118. The estimated fair value of the contributions in kind provided to regular activities based on the lease contracts or on the estimated market value when there is no lease is as follows:
119. Included in the above contribution in kind from Canada, is an amount equivalent to
CAD 1 929 thousand (CAD 1 909 thousand in 2009) from the Government of Quebec towards the provision of premises in the Bell Tower office in Montreal provided for the Technical Co-operation Bureau.
120. Staff services and travel are also provided free of charge by States for regular activities. These contributions are valued based on the cost to the donating State for each of the following activities:
121. Also, the Government of Mexico provides a contribution in cash towards the rental of the
Regional Office in Mexico City. The contribution in 2010 amounted to CAD 107 thousand (CAD 112 thousand in 2009) and is included in revenue.
2010 2009
In thousands of CAD
Canada 20 033 19 453 Egypt 146 134 France 766 784Peru 296 260
Senegal 86 54
Thailand 1 300 1 220
Total 22 627 21 905
2010 2009
In thousands of CAD
Aviation Security 952 429
Aviation Safety 1 142 1 135

III-30
Note: 3.2 Other Revenue
122. The following are the details for Other Revenue Producing Activities:
31 December 2010
In thousands of CAD Publication Sales and Printing Services 4 845 Delegation Services 2 423 Events and Symposia 1 227 Royalties 854 Dangerous Goods Licensing Fee 726 Periodicals 839 Commissariat Sales 617 Websites 407 Licensing Agreements 413 Training/Courses 407 Others 415 Total 13 173
123. Other Revenue comprises the following:
31 December 2010
In thousands of CAD Administrative Fee 480 Professional Liability Insurance Fee 399 Expert Rent 314 Travel Agent Fee 334 Interest – Income and Exchange Gain 1 360 Others 911 Total 3 798

III-31
NOTE 4: STATEMENT OF COMPARISON OF BUDGET AND ACTUAL AMOUNTS
124. ICAO’s financial statements and the approved Regular Programme budget are not presented on the same basis. In the Statement of Financial Performance, expenses cover all Funds of the Organization and are classified based on their nature. Expenses in the Statement of Comparison of Budget and Actual Amounts are classified by Strategic Objective and Supporting Implementation Strategy for the Regular Programme General Fund. The other approved publicly available budget relates to the AOSC Fund of the Technical Co-operation Programme.
125. The Assembly authorizes, separately for each year of a triennium, the expenditure in Canadian dollars for the Regular Programme and approves the total indicative budget estimates of the AOSC fund. Budgets may be subsequently amended by the Council or through the exercise of delegated authority.
126. As required by IPSAS, a reconciliation between the actual amounts on a comparable basis in the Statement of Comparison of Budget and Actual Amounts (Statement V) and the actual amounts in the Statement of Cash Flow (Statement IV) for the period ended 31 December 2010 is presented below.
Year Ended 31 December 2010
Operating Investing Financing Total
In thousands of CAD Actual Amount on Comparable Basis (Statement V) (87 645) - - (87 645)
Basis Differences – Exchange Rate 2 144 - - 2 144 Presentation Differences 88 520 67 (4 006) 84 581 Entity Differences (6 251) (556) 2 772 (4 035) Actual Amounts in the Statement of Cash Flow (Statement IV) (3 232) (489) (1 234) (4 955)
127. Basis differences occur when an approved budget is prepared on a basis other than the accounting basis used to prepare the financial statements. For ICAO, a notable difference may occur when the rate of exchange used to prepare the Canadian dollar budget differs from the monthly UN rates of exchange. The Status of Appropriation, as presented in the Statement of Comparison of Budget and Actual Amounts (Statement V) provides reconciliation between approved appropriations of the Regular Programme Budget and the corresponding expenses incurred by the General Fund of the Regular Programme at the UNORE and at the budget rate of exchange.
128. Timing differences occur when the budget period differs from the reporting period reflected in the financial statements. For the purposes of comparison of budget and actual amounts, there are no timing differences for ICAO.
129. Presentation differences are due to differences in the format and classification schemes adopted for presentation of Statement of Cash Flows and Statement of Comparison of Budget and Actual Amounts. The Statement of Cash Flows reflects the net impact of receipts and disbursements and the Statement of Comparison of Budget and Actual Amounts present actual expenditures authorized through appropriations.

III-32
130. Entity differences occur when the budget omits programmes or entities that are part of the entity for which the financial statements are prepared. Entity differences represent cash flows of those Funds that are reported in the financial statements, form part of ICAO activities, are funded by extra-budgetary resources, but are excluded from the Regular Programme budgetary process. These relate to other regular activities and technical co-operation project activities.
131. With regard to the AOSC Fund, budgeted figures represent indicative budget estimates only. Total indicative budget estimates for the AOSC Fund is compared to actual amount in the Presentation of the Secretary General. Also, included in the Presentation of the Secretary General on the financial statements are explanations of material differences between the original budget and final budget, and the actual amounts.
NOTE 5: SEGMENT REPORTING
Note 5.1: Statement of Financial Position and Financial Performance by Segment
132. Segment reporting is required under IPSAS and is described in Note 1. Financial Position by segment is shown in the next table followed by the Statement of Financial Performance by Segment. Some activities between the two segments lead to accounting transactions that create inter-segment revenue and expense balances in the financial statements. Inter-segment transactions are reflected in the above tables to accurately present these accounting transactions and then eliminated to reconcile with Statement I and II.
133. The Regular Activities segment includes revenue from contributions for project agreement totaling CAD 7.2 million charged by the AOSC Fund to Technical Co-operation projects. An equivalent amount is included as administrative overhead charges in the Technical Co-operation projects segment. Also included in TCP segment, is an amount of CAD 567 thousand representing contributions to TCP by IFFAS. The amount due to Technical Co-operation projects by the Regular Activities segment at 31 December 2010 amounted to CAD 3 060 thousand (CAD 1 080 thousand restated as of 1 January 2010). These amounts are eliminated for presentation purposes.

201001.01.2010 Restated 2010
01.01.2010 Restated 2010
01.01.2010 Restated 2010
01.01.2010 Restated
ASSETS
CURRENT ASSETSCash and cash equivalents 2.1 51 686 55 104 159 229 160 766 210 915 215 870
2.2 6 693 5 151 6 693 5 151 Inter-segment balances 28 987 3 032 93 (3 060 ) (1 080 )Receivables and advances 2.3 5 762 7 364 6 817 22 414 12 579 29 778 Inventories 2.4 987 990 987 990 Others 2.3 2 732 2 901 228 231 2 960 3 132
67 888 72 497 169 306 183 504 (3 060 ) (1 080 ) 234 134 254 921
NON-CURRENT ASSETSInvestments
2.2 3 863 5 117 3 863 5 117 Receivables and advances 2.3 521 543 521 543 Property, plant and equipment 2.5 699 699 Intangible assets 2.6 92 92 Derivative assets 2.7 650 650
5 175 6 310 5 175 6 310
TOTAL ASSETS 73 063 78 807 169 306 183 504 (3 060 ) (1 080 ) 239 309 261 231
LIABILITIES
CURRENT LIABILITIESAdvanced receipts 2.8 6 664 3 689 156 692 157 593 163 356 161 282 Accounts payable and accrued liabilities 2.9 11 054 11 124 11 235 22 589 22 289 33 713 Employee benefits 2.10 3 121 3 255 1 491 1 436 4 612 4 691 Inter-segment balances 3 060 1 002 78 (3 060 ) (1 080 )Credits to contracting/servicing governments 2.11 1 528 2 516 1 528 2 516 Deferred revenue 2.12 343 585 343 585
25 770 22 171 169 418 181 696 (3 060 ) (1 080 ) 192 128 202 787
NON-CURRENT LIABILITIESEmployee benefits 2.10 76 900 66 668 76 900 66 668
76 900 66 668 76 900 66 668
TOTAL LIABILITIES 102 670 88 839 169 418 181 696 (3 060 ) (1 080 ) 269 028 269 455
NET ASSETSAccumulated deficit 2.13 (35 416 ) (24 859 ) (35 416 ) (24 859 )Reserves 2.13 5 809 14 827 ( 112 ) 1 808 5 697 16 635
NET ASSETS (ACCUMULATED DEFICIT) (29 607 ) (10 032 ) ( 112 ) 1 808 (29 719 ) (8 224 )
TOTAL LIABILITIES AND NET ASSETS 73 063 78 807 169 306 183 504 (3 060 ) (1 080 ) 239 309 261 231
III - 33
NOTE 5.2
Elimination Total
Assessed contributions receivable from Member States
Assessed contributions receivable from Member States
Regular ActivitiesTechnical Co-operation
Project Activities
INTERNATIONAL CIVIL AVIATION ORGANIZATION
FINANCIAL POSITION BY SEGMENTAT 31 DECEMBER 2010
(in thousands of Canadian dollars)

Note Total
2010 2010 2010 2010
REVENUE
Contributions for project agreements 278 123 136 ( 567) 122 847Assessed contributions 77 483 77 483Other revenue producing activities 3.2 13 173 13 173Other voluntary contributions 5 976 5 976Administrative fee revenue 7 216 (7 216)Other revenue 3.2 2 460 1 338 3 798
106 586 124 474 (7 783) 223 277
EXPENSES
93 417 43 942 137 359 444 67 352 67 796
General operating expenses 15 381 1 717 17 098Travel 5 424 2 516 7 940Meetings 2 128 2 128Training 1 173 1 173Grants and other transfers 1 007 ( 567) 440Administrative overhead charges 7 247 (7 247)Other expenses 571 191 762Currency exchange difference 26 336 31 393
118 398 124 474 (7 783) 235 089
DEFICIT FOR THE YEAR (11 812) (11 812)
III - 34
Supplies, consumables and othersStaff salaries and employee benefits
Regular Activities Elimination
Technical Co-operationProject Activities
INTERNATIONAL CIVIL AVIATION ORGANIZATION
FINANCIAL PERFORMANCE BY SEGMENTFOR THE YEAR ENDED 31 DECEMBER 2010
(in thousands of Canadian dollars)
NOTE 5.3

III-35
NOTE 6: COMMITMENTS AND CONTINGENCIES
Note 6.1: Commitments
134. Lease commitments mainly pertain to ICAO Headquarters (HQ) premises and office equipment.
31 December
2010 In thousands of CAD
Minimum obligations for HQ property leases: 1 – 5 years 13 945Beyond 5 years 2 324
Total Property Leases Obligations 16 269
135. The lease at HQ expires on 30 November 2016 and includes a purchase option at that date. Building lease costs are reimbursed by the host governments at the rate of 75 percent for the HQ building and 100 percent for the Bell Tower which is also part of HQ. Lease commitments therefore apply to the 25 percent portion of the lease payable by ICAO to the host government. There is no financial commitment included in the Table above for the Paris office, since as noted in Note 2.5 a portion of the Paris office is owned by ICAO and the remaining portion is owned by France and leased to ICAO at nominal value.
136. Future year obligations related to non-property leases (including finance leases) amounted to CAD 381 thousand (CAD 495 thousand at 31 December 2009). The non-property leases mainly represent the rental of photocopiers and printing equipment, as reported in Note 2.5.
137. The future minimum lease revenues under non-cancellable operating leases total CAD 1.6 million for 2011. These lease revenues comprise rental of premises to Delegations.
Note 6.2: Legal or Contingent Liabilities and Contingent Assets
138. There are no material contingent liabilities arising from legal actions and claims that are likely to result in a significant liability to ICAO.
139. A number of legal actions and claims have been brought against the Organization in relation to Technical Co-operation Projects in South America. These are mainly claims by individuals demanding additional payments under local labour laws beyond what was provided for under their contract of employment. The total of such claims is USD 1.1 million (USD 1.0 million at 31 December 2009). It has been assessed as unlikely that ICAO would incur financial liabilities given that the Governments concerned have committed in the underlying project agreements to absorb any financial liabilities which may arise from such claims.
140. There are also cases pending before the Advisory Joint Appeals Board and the United Nations Appeals Tribunal, amounting to approximately CAD 3.5 million, which would not represent a liability at this time. In the opinion of management, the final outcome of these claims is not determinable and, accordingly, these items are not recorded in the accounts. Settlements, if any, resulting from the resolution of these claims will be accounted for in the year in which the liability is determined.

III-36
NOTE 7: DISSOLUTION OF IFFAS
141. As indicated in Note 1, IFFAS was dissolved during 2010 and as per the IFFAS Administrative Charter in such a situation, contributors to IFFAS have the option to recover the remaining assets which were recorded in Net Assets before dissolution. As at 31 December 2010, the assets were composed of cash amounting to CAD 1.6 million of which CAD 1.2 million were recoverable by contributors, and the balance owned by ICAO based on the dissolution clause. In early 2011, a number of contributors requested that their part be refunded for a total of CAD 0.6 million and others indicated that their part totaling CAD 0.4 million be utilized to finance ICAO’s projects. The balance representing other contributors’ shares (CAD 0.2 million) and ICAO’s own contribution (CAD 0.4 million) will be utilized in accordance with the IFFAS Charter and ICAO’s Council decision expected to be taken in 2011.
NOTE 8: RELATED PARTY AND SENIOR MANAGEMENT DISCLOSURE
Note 8.1: Key Management Personnel
142. Key management personnel includes members of the Senior Management Group (SMG) of the Secretariat, which comprises the Secretary General, Directors and Chiefs reporting directly to the Secretary General. Senior managers have the authority and responsibility for planning, directing and controlling the activities of ICAO. Key management personnel also include the President of Council and Chiefs who can influence decisions made by senior management. The Council consists of 36 Member States without personal appointment.
143. The aggregate remuneration paid to key management personnel includes: net salaries, post adjustment, entitlements such as representation allowance and other allowances, education grant, rental subsidy, and also employer pension and current health insurance contributions. Entitlements and total remuneration include outstanding advances against entitlements, which are composed of education grant advances.
144. Key management personnel also qualify for post-employment benefits (Note 2.10) at the same level as other employees. These benefits cannot be reliably quantified, thus are not included in the above table.
145. Key management personnel are ordinary members of UNJSPF with the exception of D-2 level and above who do not participate in the UNJSPF. Amounts paid by ICAO in lieu of contributions to the plan, which represents 15.8 percent of the pensionable remuneration, are included in total remuneration.
Note 8.2: Related Party Transactions
146. Except as otherwise noted in these statements for revenue from non-exchange transactions including contributions in kind, all transactions made with third parties, including United Nations organizations occur at fair value within a normal relationship of supplier or client and at arm’s-length terms and conditions.
Number of Individuals
Compensation and Post
Adjustment
Entitlements
Pension and
Health Plans
Total
Remuneration
Outstanding Advances Against
Entitlements
Out- standing
Loans In thousands of CAD
Key Manage-ment Personnel, 2010 11 2 063 126 554 2 743 68 -

III-37
NOTE 9: OPENING BALANCES ADJUSTMENTS (RESTATEMENTS)
31 December
2009 (Audited)
Adjustments
Opening Balances
1 January 2010 (Restated)
In thousands of CADASSETS Current Assets Cash and Cash Equivalents 212 069 3 801 215 870 Assessed Contributions Receivable from Contracting States 13 031 (7 880) 5 151 Receivables and Advances 53 189 (23 411) 29 778 Inventories 231 759 990 Receivable from Regional Bodies: ECAC 416 (416) Receivable from Regional Bodies: AFCAC 1 084 (1 084) Others 3 794 (662) 3 132
283 814 (28 893) 254 921
Non-Current Assets Assessed Contributions Receivable from Member States 5 117 5 117 Receivables and Advances 543 543 Property, Plant and Equipment 1 145 (1 145) Derivative Assets 650 650 1 795 4 515 6 310 TOTAL ASSETS 285 609 (24 378) 261 231
LIABILITIES Current Liabilities Contributions Received in Advance 801 (801) Accounts Payable and Accrued Liabilities 32 592 1 121 33 713 Employee Benefits 4 691 4 691 Credits to Contracting\Servicing Governments 17 519 (15 003) 2 516 Advanced Receipts 161 692 (410) 161 282 Deferred Revenue 7 245 (6 660) 585 Others 1 951 (1 951)
221 800 (19 013) 202 787
Non-Current Liabilities
Employee Benefits 66 668 66 668
66 668 66 668
TOTAL LIABILITIES 221 800 47 655 269 455
NET ASSETS
Accumulated Surplus/(Deficit) 48 982 (73 841) (24 859) Reserves 14 827 1 808 16 635
TOTAL NET ASSETS (ACCUMULATED DEFICIT) 63 809 (72 033) (8 224)
TOTAL LIABILITIES AND NET ASSETS 285 609 (24 378) 261 231

III-38
147. Opening balances represent the 2009 audited Statement of Assets, Liabilities and Fund Balances which have been restated to incorporate adjustments made due to changes in accounting policies and other adjustments made with the adoption of IPSAS effective 1 January 2010.
148. The net financial impact of IPSAS adoption on opening balances amounting to
CAD 72.0 million as of 1 January 2010 mainly applies to the Regular Activities segment. The recognition of education grant, ASHI, annual leave and repatriation benefits liabilities on the accrual basis amounting to CAD 71.4 million as at that date is the main factor that caused a decrease in net assets. The following other adjustments to opening balances also pertain to the adoption of IPSAS:
- reclassification of cash balance held on behalf of a regional body;
- reclassification of long-term assessments to non-current assets, discounting long-term assessments receivable and establishment of a provision for a doubtful account;
- reduction of amounts receivable against credits to Contracting/Servicing Governments and deferred revenue;
- establishment of inventories of publications;
- reclassification of receivables from regional bodies;
- adjustment of the carrying amount of a property previously reported without depreciation, which recognition is falling under the transitional provision of IPSAS 17;
- translation difference between functional currencies and reporting currencies; and
- ARGF publication receivable recognized on an accrual basis.
NOTE 10: EVENTS AFTER THE REPORTING DATE
149. ICAO’s reporting date is 31 December 2010. On the date of signing of these financial statements by the Secretary General, no material events, favourable or unfavourable, incurred between the balance sheet date and the date when the financial statements have been authorized for issue that would have impacted these statements.

PART IV: TABLES
(UNAUDITED)


Table A
Regular Budget
Capital Fund Revolving Fund
Administrative/Operational
Services Cost Fund
AFI Plan Fund
Ancillary Revenue
Generation Fund
AVSEC Activities
France Fund
IFFASFund
ASSETS
CURRENT ASSETSCash and cash equivalents 22 182 1 400 2 463 1 418 6 178 6 053 1 395 1 584Assessed contributions receivable from Member States 6 613Receivables and advances 1 793 1 363 1 796 96Inventories 987Others 2 684 39 3 7
33 272 1 400 3 864 1 418 8 964 6 156 1 395 1 584
NON-CURRENT ASSETSAssessed contributions receivable from Member States 3 863Receivables and advances 521Property, plant and equipment 622 23Intangible assets 18 40
4 384 639 23 40
TOTAL ASSETS 37 656 639 1 400 3 887 1 418 9 004 6 156 1 395 1 584
LIABILITIES
CURRENT LIABILITIESAdvanced receipts 1 851 736 1 088 1 446 1 181Accounts payable and accrued liabilities 9 936 285 50 514 28Employee benefits 3 050 71Inter-fund balances 2 345 584 131Deferred revenue 343
14 132 3 050 2 019 50 1 733 28 1 446 1 181
NON-CURRENT LIABILITIESEmployee benefits 76 900
76 900
TOTAL LIABILITIES 14 132 79 950 2 019 50 1 733 28 1 446 1 181
NET ASSETS
Accumulated surplus/(deficit) 12 073 639 (72 669) 1 868 1 368 7 271 6 128 ( 53) 403Reserves 11 451 (5 881) 2
NET ASSETS (ACCUMULATED DEFICIT) 23 524 639 (78 550) 1 868 1 368 7 271 6 128 ( 51) 403
TOTAL LIABILITIES AND NET ASSETS 37 656 639 1 400 3 887 1 418 9 004 6 156 1 395 1 584
REVENUEContributions for project agreements 13Assessed contributions 77 483Other revenue producing activities 4 14 845Other voluntary contributions 5 103 2 399 148Administrative fee revenue 7 215Other revenue 4 859 706 2 781 1 023 5 267 150 5
TOTAL REVENUE 82 351 706 2 781 8 252 108 15 113 2 550 153
EXPENSES
Staff salaries and employee benefits 66 881 6 995 8 732 864 5 521 1 171 67Supplies, consumables and others 274 9 3 157 1General operating expenses 12 386 67 694 126 8 962 62Travel 3 914 44 421 169 306Meetings 2 029 7 15 2Grants and other transfers 1 007Other expenses 311 10 243 2 Currency exchange difference ( 294) ( 415) 89 36 238 77
TOTAL EXPENSES 85 501 67 6 995 9 064 1 520 15 102 1 782 1 150
NET SURPLUS/(DEFICIT) FOR THE YEAR (3 151) 639 (4 214) ( 813) (1 412) 11 768 ( 997)
* IFFAS Financial Statements are approved by the Secretary and IFFAS Governing Body.Details may not add to totals due to rounding
IV - 1
(in thousands of Canadian dollars)
INTERNATIONAL CIVIL AVIATION ORGANIZATION
REGULAR ACTIVITIES BY FUNDASSETS, LIABILITIES, NET ASSETS AT 31 DECEMBER 2010 AND
REVENUE, EXPENSES AND SURPLUS (DEFICIT) FOR 2010

Table A(continued)
Incentive for Settlement of
Arrears Account
Information and Communication
Technology (ICT) Fund
Joint Finance Funds
Public Key Directory TSSF Other Funds Total Elimination 2010
ASSETS
CURRENT ASSETSCash and cash equivalents 2 702 2 158 1 389 397 1 036 1 335 51 686 51 686Assessed contributions receivable from Member States 79 6 693 6 693Inter-fund balances 28 28 28Receivables and advances 59 9 ( ) 647 5 762 5 762Inventories 987 987Others 2 734 2 732
2 702 2 158 1 528 406 1 036 2 009 67 888 67 888NON-CURRENT ASSETS
Assessed contributions receivable from Member States 3 863 3 863Receivables and advances 521 521Property, plant and equipment 54 699 699Intangible assets 34 92 92
89 5 175 5 175
TOTAL ASSETS 2 702 2 158 1 528 406 1 036 2 098 73 063 73 063
LIABILITIES
CURRENT LIABILITIESAdvanced receipts 306 57 6 665 6 664Accounts payable and accrued liabilities 5 10 100 6 119 11 054 11 054Employee benefits 3 121 3 121Inter-fund balances 3 060 3 060Credits to contracting/service governments 1 528 1 528 1 528Deferred revenue 343 343
5 10 1 528 406 6 176 25 770 25 770
NON-CURRENT LIABILITIESEmployee benefits 76 900 76 900
76 900 76 900
TOTAL LIABILITIES 5 10 1 528 406 6 176 102 670 102 670
NET ASSETSAccumulated surplus/(deficit) 2 460 2 148 1 030 1 922 (35 416) (35 416)Reserves 237 5 809 5 809
NET ASSETS (ACCUMULATED DEFICIT) 2 697 2 148 1 030 1 922 (29 607) (29 607)
TOTAL LIABILITIES AND NET ASSETS 2 702 2 158 1 528 406 1 036 2 098 73 063 73 063
REVENUE
Contributions for project agreements 266 278 278Assessed contributions 77 483 77 483Other revenue producing activities 261 15 110 (1 938) 13 173Other voluntary contributions 1 055 150 2 116 5 976 5 976Administrative fee revenue 7 215 7 216Other revenue 4 6 3 2 4 1 284 11 100 (8 640) 2 460
TOTAL REVENUE 4 6 3 1 323 154 3 661 117 163 (10 578) 106 586
EXPENSES
Staff salaries and employee benefits 525 4 1 243 1 134 2 961 96 198 (2 781) 93 417Supplies, consumables and others 444 444General operating expenses 168 60 3 414 22 941 (7 560) 15 381Travel 5 165 22 378 5 424 5 424Meetings 1 74 2 128 2 128Grants and other transfers 1 007 1 007Administrative overhead charges 237 237 ( 237)Other expenses 1 3 1 571 571Currency exchange difference 113 100 ( 87) ( 3) 79 91 26 26
TOTAL EXPENSES 119 957 ( 80) 1 323 1 216 4 157 128 976 (10 578) 118 398
NET SURPLUS/(DEFICIT) FOR THE YEAR ( 115) ( 951) 83 (1 062) ( 495) (11 812) (11 812)
Details may not add to totals due to rounding
IV - 2
(in thousands of Canadian dollars)
INTERNATIONAL CIVIL AVIATION ORGANIZATION
REGULAR ACTIVITIES BY FUNDASSETS, LIABILITIES, NET ASSETS AT 31 DECEMBER 2010 AND
REVENUE, EXPENSES AND SURPLUS (DEFICIT) FOR 2010

Table B
Earmarked Training
ProgrammeEnhanced
Mechanism United Kingdom United States
Awareness Training
ProgrammeNational Projects
Standardized Training
Programme2010
ASSETS
CURRENT ASSETSCash and cash equivalents 800 4 039 16 70 520 232 375 6 053Receivables and advances 20 76 96Others 7 7
800 4 067 16 146 520 232 375 6 156
TOTAL ASSETS 800 4 067 16 146 520 232 375 6 156
LIABILITIES
CURRENT LIABILITIESAccounts payable and accrued liabilities 17 12 ( 1) 28
17 12 ( 1) 28
TOTAL LIABILITIES 17 12 ( 1) 28
NET ASSETS
Accumulated surplus/(deficit) 800 4 050 16 133 521 232 375 6 128
NET ASSETS (ACCUMULATED DEFICIT) 800 4 050 16 133 521 232 375 6 128
TOTAL LIABILITIES AND NET ASSETS 800 4 067 16 146 520 232 375 6 156
REVENUE
Other revenue producing activitiesOther voluntary contributions 1 619 184 463 133 2 399Other revenue 2 146 1 1 150
TOTAL REVENUE 2 1 766 185 463 1 134 2 550
EXPENSES
Staff salaries and employee benefits 970 185 15 1 171Supplies, consumables and others 1 1General operating expenses 62 62Travel 277 16 12 306Meetings 2 2Other expenses 2 2Currency exchange difference 29 173 3 10 3 9 11 238
TOTAL EXPENSES 29 1 487 3 195 19 9 39 1 782
NET SURPLUS/(DEFICIT) FOR THE YEAR ( 27) 279 ( 3) ( 11) 444 ( 8) 94 768
Details may not add to totals due to rounding
ASSETS, LIABILITIES, NET ASSETS AT 31 DECEMBER 2010 AND
(in thousands of Canadian dollars)
AVIATION SECURITY TRUST FUNDS
INTERNATIONAL CIVIL AVIATION ORGANIZATION
IV - 3
REVENUE, EXPENSES AND SURPLUS (DEFICIT) FOR 2010
REGULAR ACTIVITIES

IV - 4 TABLE C
Contracting States Assembly Resolutions A37-26 and A37-27
Scales 2010
Assessments2010
Contributions Received for 2010
Balance of Assessments
Receivable for 2010
Balance of Prior Years'
Assessments Receivable
Balance of Advances due to
the Working Capital Fund
Total Balances Receivable **
Contributions Received in
Advance
AFGHANISTAN 0.06 46 46 77 124 ALBANIA 0.06 46 46 4 ALGERIA 0.08 62 62 ANDORRA 0.06 46 46 36 82 ANGOLA 0.06 46 46
ANTIGUA AND BARBUDA 0.06 46 46 624 1 671 ARGENTINA 0.31 239 238 1 1 ARMENIA 0.06 46 46 AUSTRALIA 1.71 1 318 1 318 AUSTRIA 0.71 547 547
AZERBAIJAN 0.06 46 46 BAHAMAS 0.06 46 46 46 BAHRAIN 0.09 69 51 18 18 BANGLADESH 0.08 62 62 69 130 BARBADOS 0.06 46 34 12 12
BELARUS (*) 0.06 46 46 85 131 BELGIUM 0.80 616 616 BELIZE 0.06 46 46 BENIN 0.06 46 46 BHUTAN 0.06 46 46 46
BOLIVIA 0.06 46 2 44 44 BOSNIA AND HERZEGOVINA 0.06 46 46 44 90 BOTSWANA 0.06 46 46 BRAZIL 0.89 686 686 BRUNEI DARUSSALAM 0.06 46 46
BULGARIA 0.06 46 13 34 34 BURKINA FASO 0.06 46 46 BURUNDI 0.06 46 12 34 34 CAMBODIA 0.06 46 46 147 147 CAMEROON 0.06 46 46
CANADA 2.39 1 842 1 842 1 357 CAPE VERDE 0.06 46 46 CENTRAL AFRICAN REPUBLIC 0.06 46 46 CHAD 0.06 46 46 9 CHILE 0.25 193 193
CHINA 3.67 2 828 2 828 COLOMBIA 0.20 154 154 COMOROS 0.06 46 46 CONGO 0.06 46 46 COOK ISLANDS 0.06 46 46 69 69
COSTA RICA 0.06 46 46 1 COTE D'IVOIRE 0.06 46 46 CROATIA 0.06 46 34 12 12 CUBA 0.07 54 54 1 CYPRUS 0.06 46 46
CZECH REPUBLIC 0.22 170 170 DEMOCRATIC PEOPLE'S REPUBLIC OF KOREA 0.06 46 12 34 34 DEMOCRATIC REPUBLIC OF THE CONGO (*) 0.06 46 46 469 516 DENMARK 0.54 416 416 DJIBOUTI 0.06 46 46 640 687
DOMINICAN REPUBLIC 0.06 46 46 ECUADOR 0.06 46 46 1 EGYPT 0.16 123 123 7 EL SALVADOR 0.06 46 46 EQUATORIAL GUINEA 0.06 46 46
ERITREA 0.06 46 34 12 12 ESTONIA 0.06 46 46 1 ETHIOPIA 0.06 46 34 12 12 FIJI 0.06 46 45 1 1 FINLAND 0.47 362 362
FRANCE 5.00 3 853 3 853 GABON 0.06 46 46 GAMBIA (*) 0.06 46 46 322 368 GEORGIA 0.06 46 46 288 288 GERMANY 6.85 5 279 5 279
INTERNATIONAL CIVIL AVIATION ORGANIZATION
REGULAR PROGRAMMEASSESSMENTS RECEIVABLE FROM CONTRACTING STATES
AND CONTRIBUTIONS RECEIVED IN ADVANCEAS AT 31 DECEMBER 2010
(in thousands of Canadian dollars)
General Fund

IV -5 TABLE C(continued)
Contracting States Assembly Resolutions A37-26 and A37-27
Scales 2010
Assessments2010
Contributions Received for 2010
Balance of Assessments
Receivable for 2010
Balance of Prior Years'
Assessments Receivable
Balance of Advances due to
the Working Capital Fund
Total Balances Receivable **
Contributions Received in
Advance
GHANA 0.06 46 46 GREECE 0.44 339 339 GRENADA (*) 0.06 46 46 280 327 GUATEMALA 0.06 46 46 GUINEA 0.06 46 46 146 146
GUINEA-BISSAU 0.06 46 46 GUYANA 0.06 46 46 HAITI 0.06 46 46 HONDURAS 0.06 46 46 HUNGARY 0.19 146 146 183
ICELAND 0.06 46 46 INDIA 0.55 424 424 INDONESIA 0.28 216 160 56 56 IRAN (ISLAMIC REPUBLIC OF) 0.19 146 146 5 151 IRAQ 0.06 46 46 912 912
IRELAND 0.50 385 385 ISRAEL 0.45 347 347 5 ITALY 3.59 2 766 2 054 713 713 JAMAICA 0.06 46 46 JAPAN 11.75 9 055 9 055
JORDAN 0.06 46 46 KAZAKHSTAN 0.06 46 24 22 22 KENYA 0.06 46 46 43 90 KIRIBATI 0.06 46 46 89 135 KUWAIT 0.18 139 103 36 36
KYRGYZSTAN 0.06 46 46 126 126 LAO PEOPLE'S DEMOCRACTIC REPUBLIC 0.06 46 12 34 34 LATVIA 0.06 46 46 LEBANON 0.06 46 46 LESOTHO 0.06 46 3 44 44
LIBERIA 0.06 46 46 201 201 LIBYAN ARAB JAMAHIRIYA 0.06 46 46 1 1 LITHUANIA 0.06 46 46 1 LUXEMBOURG 0.36 277 206 71 71 MADAGASCAR 0.06 46 46
MALAWI (*) 0.06 46 46 324 371 MALAYSIA 0.55 424 424 MALDIVES 0.06 46 46 46 MALI 0.06 46 46 MALTA 0.06 46 12 34 34
MARSHALL ISLANDS 0.06 46 46 194 240 MAURITANIA 0.06 46 46 MAURITIUS 0.06 46 46 MEXICO 1.63 1 256 1 256 MICRONESIA (FEDERATED STATES OF) 0.06 46 46 92 138
MONACO 0.06 46 46 MONGOLIA 0.06 46 12 34 34 MONTENEGRO 0.06 46 46 89 135 MOROCCO 0.08 62 62 MOZAMBIQUE 0.06 46 15 31 31
MYANMAR 0.06 46 46 1 1 NAMIBIA 0.06 46 46 46 NAURU 0.06 46 46 483 530 NEPAL 0.06 46 46 3 50 NETHERLANDS 1.90 1 464 1 464
NEW ZEALAND 0.36 277 277 NICARAGUA 0.06 46 46 NIGER 0.06 46 46 NIGERIA 0.06 46 46 NORWAY 0.55 424 424
OMAN 0.11 85 22 63 63 PAKISTAN 0.16 123 73 50 50 PALAU 0.06 46 46 220 266 PANAMA 0.06 46 29 18 18 PAPUA NEW GUINEA 0.06 46 46 46
REGULAR PROGRAMMEASSESSMENTS RECEIVABLE FROM CONTRACTING STATES
AND CONTRIBUTIONS RECEIVED IN ADVANCEAS AT 31 DECEMBER 2010
INTERNATIONAL CIVIL AVIATION ORGANIZATION
(in thousands of Canadian dollars)
General Fund

IV - 6 TABLE C(continued)
Contracting States Assembly Resolutions A37-26 and A37-27
Scales 2010
Assessments2010
Contributions Received for 2010
Balance of Assessments
Receivable for 2010
Balance of Prior Years'
Assessments Receivable
Balance of Advances due to
the Working Capital Fund
Total Balances Receivable **
Contributions Received in
Advance
PARAGUAY 0.06 46 12 34 34 PERU 0.10 77 77 5 PHILIPPINES 0.17 131 131 5 POLAND 0.41 316 316 174 PORTUGAL 0.45 347 347
QATAR 0.24 185 48 137 137 REPUBLIC OF KOREA 2.37 1 826 1 826 REPUBLIC OF MOLDOVA 0.06 46 46 102 102 ROMANIA 0.08 62 62 RUSSIAN FEDERATION 0.79 609 609
RWANDA (*) 0.06 46 46 4 50 SAINT KITTS & NEVIS 0.06 46 46 163 209 SAINT LUCIA 0.06 46 29 17 17 SAINT VINCENT AND THE GRENADINES 0.06 46 46 6 52 SAMOA 0.06 46 46
SAN MARINO 0.06 46 46 SAO TOME AND PRINCIPE (*) 0.06 46 46 576 622 SAUDI ARABIA 0.69 532 532 SENEGAL 0.06 46 46 23 SERBIA 0.06 46 12 34 34
SEYCHELLES 0.06 46 46 SIERRA LEONE 0.06 46 46 219 219 SINGAPORE 1.20 925 925 SLOVAKIA 0.06 46 46 SLOVENIA 0.07 54 54
SOLOMON ISLANDS (*) 0.06 46 32 14 79 93 SOMALIA 0.06 46 46 693 1 740 SOUTH AFRICA 0.45 347 257 89 89 SPAIN 2.30 1 772 1 772 SRI LANKA 0.08 62 62
SUDAN 0.06 46 46 80 126 SURINAME (*) 0.06 46 46 283 329 SWAZILAND 0.06 46 34 12 12 SWEDEN 0.75 578 578 SWITZERLAND 0.97 747 747
SYRIAN ARAB REPUBLIC 0.06 46 46 49 95 TAJIKISTAN 0.06 46 41 5 5 THAILAND 0.54 416 416 1 the former Socialist Federal Republic of Yugoslavia (1) 501 501 THE FORMER YUGOSLAV REPUBLIC OF MACEDONIA 0.06 46 46
TIMOR-LESTE 0.06 46 46 89 135 TOGO 0.06 46 46 TONGA 0.06 46 34 12 12 TRINIDAD AND TOBAGO 0.06 46 46 TUNISIA 0.06 46 46
TURKEY 0.43 331 331 TURKMENISTAN 0.06 46 34 12 12 UGANDA 0.06 46 46 UKRAINE 0.06 46 46 UNITED ARAB EMIRATES 0.88 678 678
UNITED KINGDOM 5.74 4 423 4 423 UNITED REPUBLIC OF TANZANIA 0.06 46 46 2 UNITED STATES OF AMERICA 25.00 19 265 19 265 1 1 URUGUAY 0.06 46 34 12 12 UZBEKISTAN 0.06 46 46 1
VANUATU 0.06 46 40 6 6 VENEZUELA 0.15 116 116 4 VIET NAM 0.09 69 18 51 51 YEMEN 0.06 46 46 ZAMBIA 0.06 46 46 35 82
ZIMBABWE 0.06 46 46 18 64
TOTAL ** 100.00 77 061 73 422 3 639 8 973 2 12 614 1 784
Note 1 : The devolution of the amount owing by the former Socialist Federal Republic of Yugoslavia is to be ascertained.* States which had not met their obligations according to the terms of their agreements as at 31 December 2010.** Details may not add to totals due to rounding.
INTERNATIONAL CIVIL AVIATION ORGANIZATION
REGULAR PROGRAMME
General Fund
ASSESSMENTS RECEIVABLE FROM CONTRACTING STATESAND CONTRIBUTIONS RECEIVED IN ADVANCE
AS AT 31 DECEMBER 2010
(in thousands of Canadian dollars)

Table D
Trust Funds andUnited Nations Management Civil AviationDevelopment Service Purchasing Services TotalProgramme Agreements Funds 2010
ASSETS
CURRENT ASSETSCash and cash equivalents (2 921) 143 505 18 645 159 229Inter-fund balances 3 032 3 032Receivables and advances 2 854 2 793 1 170 6 817Others 75 153 228
TOTAL ASSETS 3 039 146 451 19 816 169 306
LIABILITIES
CURRENT LIABILITIESAdvanced receipts 1 716 135 394 19 583 156 692Accounts payable and accrued liabilities 1 435 9 566 233 11 235Employee benefits 1 491 1 491
TOTAL LIABILITIES 3 151 146 451 19 816 169 418
NET ASSETSReserves ( 112) ( 112)
NET ASSETS (ACCUMULATED DEFICIT) ( 112) ( 112)TOTAL LIABILITIES AND NET ASSETS 3 039 146 451 19 816 169 306
REVENUE
Contributions for project agreements 5 375 104 305 13 457 123 136Other revenue 1 232 106 1 338
TOTAL REVENUE 5 375 105 536 13 563 124 474
EXPENSES
Staff salaries and employee benefits 2 911 40 839 192 43 942Supplies, consumables and others 1 432 52 959 12 960 67 352General operating expenses 250 1 445 22 1 717Travel 177 2 319 21 2 516Training 68 1 105 1 173Administrative overhead charges 532 6 417 297 7 247Other expenses 7 182 2 191Currency exchange difference ( 3) 271 69 336
TOTAL EXPENDITURE 5 375 105 536 13 563 124 474
SURPLUS/(DEFICIT) FOR THE YEAR
Details may not add to totals due to rounding
IV - 7
INTERNATIONAL CIVIL AVIATION ORGANIZATION
REVENUE, EXPENSES AND SURPLUS (DEFICIT) FOR 2010(in thousands of Canadian dollars)
ASSETS, LIABILITIES, NET ASSETS AT 31 DECEMBER 2010 AND TECHNICAL CO-OPERATION PROJECT ACTIVITIES BY GROUP OF FUNDS

Table E
Transfer UnrealizedType Balance Interest from or Refund Exchange Balance
of as at and Other Project Administrative to Other of Gain or as atFund Fund 01-Jan-2010 Adjustment Contributions(1) Income Costs Overhead Funds Contributions Loss 31-Dec-2010
Afghanistan MSA 6 545 1 821 29 5 047 447 600 ( 20) 3 481Andorra MSA 1 0 0Angola MSA 28 0 28Argentina MSA 14 547 14 711 150 18 834 908 ( 74) ( 150) ( 232) 9 210Azerbaijan TF 0 0Bahamas TF 24 0 19 2 0 3Bangladesh TF 17 0 0 16Barbados TF 49 0 3 0 46Bhutan MSA 2 0 2Bolivia MSA 1 283 ( 500) 3 393 1 2 524 216 ( 169) ( 5) 0 1 264Bolivia TF 12 0 296 27 ( 311)Bosnia and Herzegovina TFBotswana TF 461 1 283 28 0 150Brazil MSA 4 932 404 2 228 81 96 3 124Cambodia MSA 1 1Cameroon MSA 80 0 1 0 0 79Cape Verde MSA 62 648 1 2 0 35 743Chad MSA 30 1 95 9 0 ( 73)China TF 38 0 0 37Colombia MSA ( 2) 101 5 85 4 6 22Comoros MSA 9 0 9Costa Rica MSA 1 473 2 80 32 ( 0) 1 363Costa Rica TF 4 0 4Cuba TF 0 0Cyprus MSA 15 0 15Cyprus TF ( 0) 0Czech Republic MSA 35 0 35Côte d'Ivoire TF 3 0 3Democratic Republic of the Congo MSA 11 0 27 3 0 ( 18)Djibouti MSA 836 1 0 0 102 ( 674) 265Dominican Republic MSA 254 91 1 111 9 ( 18) ( 2) 206EAST TIMOR TF 0 0 0Ecuador TF 1 ( 0) ( 0) 1Egypt MSA 83 50 ( 0) 25 3 0 106El Salvador TF 0 0 0Equatorial Guinea MSA ( 0) 1 834 2 405 41 0 1 391Ethiopia MSA 15 0 13 1 0 1Fiji MSA 26 0 26Fiji TF 1 0 0Finland MSA 3 0 3Gabon MSA 756 1 520 52 ( 29) 156Ghana MSA 1 0 1Greece MSA 106 767 8 743 82 0 56Guatemala MSA 2 695 3 1 277 84 ( 1) 1 336Guyana TF 7 0 0 7Haiti MSA ( 0) 0 0 0 0 ( 1)Haiti TF 64 0 8 1 0 55INTER-REGIONAL TF 276 0 1 1 275Iceland MSA 27 1 23 2 0 2India MSA 3 532 28 6 1 100 92 0 2 375Indonesia MSA 3 208 3 122 6 1 249 125 ( 0) 4 961Iraq MSA 43 0 0 43Iraq TF 39 0 39Jamaica TF 6 0 6Jordan TF 1 1Lao People's Democratic Republic MSA ( 2) ( 2)Latvia TF 11 0 3 0 8Lebanon MSA 787 1 106 11 400 0 1 072Lesotho TF 130 0 0 130Liberia MSA 8 0 8Libyan Arab Jamahiriya MSA 51 0 18 2 0 31Libyan Arab Jamahiriya TF 1 0 1Lithuania TF 0 0 0Macao Special Administrative Region of China MSA 242 0 175 17 0 50
(1): On a cash basis
TECHNICAL CO-OPERATION PROJECT ACTIVITIES
IV - 8
INTERNATIONAL CIVIL AVIATION ORGANIZATION
Receipts Expenses
TRUST FUNDS AND MANAGEMENT SERVICE AGREEMENTSRECEIPTS, EXPENSES AND BALANCE OF ADVANCE RECEIPTS
FOR THE YEAR ENDED 31 DECEMBER 2010(in thousands of United States dollars)

Table E TECHNICAL CO-OPERATION PROJECT ACTIVITIES (Continued)
Transfer UnrealizedType Balance Interest from or Refund Exchange Balance
of as at and Other Project Administrative to Other of Gain or as atFund Fund 01-Jan-2010 Adjustment Contributions(1) Income Costs Overhead Funds Contributions Loss 31 December 2010
Mauritius MSA 6 0 0 0 0 6Mexico MSA 37 62 0 60 3 0 36Mexico TF 80 0 0 0 79Morocco TF 70 0 0 70Mozambique MSA 63 0 0 63Namibia MSA 644 3 468 ( 9) 923 87 115 3 208Nauru TF ( 3) ( 3)Nepal MSA 8 303 0 151 15 0 146Nicaragua MSA 36 0 23 2 ( 0) 11Nigeria MSA 543 1 061 2 264 35 ( 40) 0 1 267Nigeria TF 9 0 0 9Oman MSA 15 0 0 15Oman TF 368 610 1 497 47 0 435Pakistan MSA 55 0 0 0 55Panama MSA 12 892 939 11 10 146 159 0 3 537Panama TF 17 824 26 308 46 5 738 815 ( 50) ( 115) 0 37 459Paraguay MSA 40 0 2 1 ( 32) 0 5Peru MSA 19 311 28 808 38 23 906 1 076 ( 100) ( 13) 0 23 061Philippines MSA 39 0 39Philippines TF 3 037 774 ( 3) 1 983 253 2 1 573Portugal TF ( 1) ( 1)Qatar MSA 9 73 ( 0) 36 4 0 42REGIONAL FOR AFRICA MSA 4 158 0 944 27 1 714 132 ( 1 030) ( 64) 2 190REGIONAL FOR AFRICA TF 2 0 1REGIONAL FOR ASIA MSA 266 684 5 348 11 154 ( 24) ( 25) 701REGIONAL FOR ASIA TF 1 905 1 522 7 1 543 201 ( 4) 1 684REGIONAL FOR EUROPE MSA 94 0 0 0 0 94REGIONAL FOR EUROPE TF 35 50 0 63 6 0 16REGIONAL FOR EUROPE AND MIDDLE EAST MSA 319 976 1 536 54 0 706REGIONAL FOR LATIN AMERICA MSA 66 376 0 300 11 3 0 135REGIONAL FOR LATIN AMERICA TF 2 673 ( 231) 1 455 11 2 317 142 92 ( 30) 1 511Republic of Korea MSA 46 23 0 0 68Romania MSA 35 0 35Russian Federation MSA 2 0 0 0 0 2Rwanda MSA 14 27 ( 0) 21 2 0 19Saudi Arabia MSA 1 826 10 667 305 8 031 464 ( 320) 1 3 985Seychelles MSA 102 0 23 2 0 78Singapore MSA 43 88 0 6 1 0 124Singapore TF 4 223 0 101 10 115Somalia TF 10 825 5 513 15 0 0 ( 6 000) 10 352South Africa MSA 207 0 0 0 206Sri Lanka MSA 213 0 11 1 ( 0) 201Sri Lanka TF 9 0 0 9Sudan MSA 38 794 1 278 28 0 528Syrian Arab Republic MSA 174 0 14 2 0 158Thailand MSA 167 486 1 31 17 0 606Thailand TF 7 25 0 0 31Trinidad and Tobago TF 8 0 0 8UN DEPARTMENT OF PEACEKEEPING OPERATION MSA 3 3UNITED NATIONS MISSION IN KOSOVO MSA 487 0 ( 6) ( 1) ( 494)Uganda MSA 52 0 1 0 0 51United Republic of Tanzania MSA ( 6) 0 ( 0) ( 5)Uruguay MSA 8 543 1 139 455 46 15 ( 587) 8 609Uruguay TF 5 5Venezuela (Bolivarian Republic of) MSA ( 872) 1 018 1 101 235 0 ( 189)Viet Nam MSA 7 0 7Viet Nam TF 14 0 14Yemen MSA 51 0 17 2 32Others ( 51) 51Lump-Sum Contracts LS 353 447 7 574 47 276 ( 164) 1 298
Total 121 089 ( 731) 123 024 2 234 95 455 6 200 ( 124) ( 7 671) ( 772) 135 394
(1): On a cash basisDetails may not add to totals due to rounding
TRUST FUNDS AND MANAGEMENT SERVICE AGREEMENTS
IV - 9
Receipts Expenses
INTERNATIONAL CIVIL AVIATION ORGANIZATION
RECEIPTS, EXPENSES AND BALANCE OF ADVANCE RECEIPTSFOR THE YEAR ENDED 31 DECEMBER 2010
(in thousands of United States dollars)

Table F
Transfer UnrealizedBalance Interest from or Refund Exchange Balance
as at and Other Project Administrative to Other of Gain or as atFund 01-Jan-2010 Adjustment Contributions(1) Income Costs Overhead Funds Contributions Loss 31-Dec-2010
Afghanistan 2 095 2 297 27 ( 600) 1 1 175Algeria ( 0) 0 0 0 0 ( 0)Angola ( 11) 2 3 ( 0) ( 16)Bahamas 0 9 1 0 ( 10)Bangladesh 246 0 247Bolivia 5 0 5BrazilCanada 38 0 0 38Cape Verde 39 0 8 1 31Costa Rica 8 161 116 875 49 ( 13) 7 340Cuba 26 3 0 25 1 0 3Democratic People's Republic of Korea 6 0 6Egypt ( 2) ( 2)Ethiopia 4 171 4 2 605 7 0 1 564Fiji 3 70 0 22 22 0 29Guinea 43 0 43India 24 0 0 23Lebanon 7 789 10 3 497 ( 0) ( 400) 0 3 902Lesotho 131 1 43 16 0 73Libyan Arab Jamahiriya 64 0 1 1 62Lithuania ( 4) ( 4)Macao Special Administrative Region of China 360 0 274 0 0 86Mozambique 20 0 0 20Myanmar 573 1 3 0 570Nigeria 73 7 0 6 ( 0) 0 74Oman ( 0) 750 0 4 25 0 721Pakistan 4 867 60 0 4 846 45 0 35Papua New Guinea ( 0) ( 0)Philippines 14 2 578 3 20 81 0 2 493Republic of Moldova 2 0 0 0 0 2Russian Federation 50 0 16 2 33Rwanda 4 0 3Seychelles 196 33 198 4 ( 85) ( 58)Sudan 98 0 0 98Suriname 6 0 0 6Syrian Arab Republic 808 1 ( 13) 796Trinidad and Tobago 163 0 0 6 169UNITED NATIONS MISSION IN KOSOVO 30 0 ( 29) ( 0) 0Uruguay 62 0 ( 55) 7Yemen 17 0 17
Total 30 166 3 468 175 12 750 287 ( 1 055) ( 29) ( 104) 19 583
(1): On a cash basis
Details may not add to totals due to rounding
IV - 10
Receipts Expenses
INTERNATIONAL CIVIL AVIATION ORGANIZATION
CIVIL AVIATION PURCHASING SERVICE FUNDSRECEIPTS, EXPENSES AND BALANCE OF ADVANCE RECEIPTS
FOR THE YEAR ENDED 31 DECEMBER 2010(in thousands of United States dollars)
TECHNICAL CO-OPERATION PROJECT ACTIVITIES

INTERNATIONAL CIVIL AVIATION ORGANIZATION PART V: REPORT OF THE EXTERNAL AUDITOR TO THE ASSEMBLY ON THE AUDIT OF THE FINANCIAL STATEMENTS OF THE INTERNATIONAL CIVIL AVIATION ORGANIZATION FOR THE FINANCIAL PERIOD ENDED 31 DECEMBER 2010


ANN
NUAL
Ex
REPOR
FIN
xternal audCivil Av
RT OF
NANCI
ditor of theiation Orga
THE E
IAL YE
e Internatioanisation
EXTERN
AR 20
onal
NAL A
010
UDITO
OR –

V-2
TABLE OF CONTENTS
1. Introduction ..................................................................................................................................... 4
1.1. Audits carried out by the External Auditor ....................................................................................... 4
1.2. Summary of main observations ........................................................................................................ 5
2. Certification of the accounts – budgetary and financial position of ICAO .......................................... 8
2.1. External Auditor’s opinion on the financial statements for 2010 .................................................... 8
2.2. Financial position of ICAO ................................................................................................................. 9
2.3. Budget position of ICAO ................................................................................................................. 11
2.3.1. Execution of the 2008‐2010 triennial budget......................................................................... 11
2.3.2. Preparation of the 2011‐2013 triennial budget ..................................................................... 13
3. Human resources management and Information Technology ......................................................... 15
3.1. Relative weight of ICAO expenditure broken down into broad categories ................................... 15
3.2. Human Resources ........................................................................................................................... 17
3.2.1. Budgeted staff and actual staff .............................................................................................. 18
3.2.2. Distribution of staff ................................................................................................................ 21
3.2.3. Service Code ........................................................................................................................... 24
3.3. IT ..................................................................................................................................................... 26
3.3.1. IT costs .................................................................................................................................... 26
3.3.2. Staff in charge of IT functions ................................................................................................. 28
3.3.3. Organization of ICT Section .................................................................................................... 29
3.3.4. Technical support ................................................................................................................... 30
3.3.5. IT strategy ............................................................................................................................... 31
4. Regional Offices ............................................................................................................................. 33

V-3
4.1. Budgetary and financial matters .................................................................................................... 33
4.2. Role of Regional Directors .............................................................................................................. 40
4.3. Role of technical officers ................................................................................................................ 42
4.4. Role of administrative services ....................................................................................................... 43
4.5. Observations relating to Planning and Implementation Regional Groups (PIRGs) ........................ 44
4.5.1. Accreditation and participation in PIRGs ................................................................................ 45
4.5.2. Observations relating to certain regional deficiency databases ............................................ 45
5. Technical Cooperation ................................................................................................................... 49
5.1. Scope of the audit ........................................................................................................................... 49
5.2. Selection criteria for the projects to be audited ............................................................................ 49
5.3. Projects audited .............................................................................................................................. 50
5.4. General observations arising from review of project selected ...................................................... 51
5.4.1. Ambiguities in ICAO's role as "authorized purchaser" ........................................................... 51
5.4.2. Compliance with the principle of self‐financing of technical cooperation activities ............. 52
5.5. Specific observations arising from review of projects selected ..................................................... 56
5.5.1. Choice of supplier differs from that selected by TCB ............................................................. 56
5.5.2. Government employees on international contracts under technical cooperation agreements ............................................................................................................................................. 57
5.5.3. Insurance and liability cover related to TCB activity .............................................................. 59

V-4
The present annual report describes the various audits carried out by the External Auditor on the activity, accounts and management of ICAO during the financial period 2010. It is based on a preliminary report sent to ICAO on 26 April 2011, modified in the light of ICAO's comments and a draft Secretariat Action Plan in response to each draft recommendation, which were sent to External Auditor on 6 May 2011.
1. INTRODUCTION
1.1. Audits carried out by the External Auditor
1. Since his appointment on 28 September 20081, the External Auditor has performed 19 on-site audits at headquarters and the regional offices, as a result of which 11 specific reports have been presented to the Council, 11 management letters2 have been sent to the Secretary General, and this annual report has been prepared for the Council.
2. The table below shows the chronology of these audits. It can be seen that the present report to the Council covers seven audits performed during 2010 and early 2011:
Table 1: Activities by the External Auditor since the inception of his term of office
Subject Report to the Council Management letter
Submitted Examined Process by which Jean Renaud and Félicien Souka came to ICAO Sept. 2008 24/9/08
No
Paris Office Oct. 2008
26/6/09 Dakar Office Nov. 2008 Travel expenses for ICAO international staff Feb. 2009 Certification of 2008 accounts June 2009 Lima Office
Oct. 2009 6/11/09 Bangkok Office TCB Recruitment of international officers to ICAO May 2010 31/5/10 May 2010 Certification of the 2009 financial statements May 2010 Mexico Office Annual
Report 28/6/11 Jul. 2010 Cairo Office Sept. 2010 Implementation of IPSAS-compatible rules - - Nov. 2010 ACIP Dec 2010 16/3/11 Dec. 2010 Nairobi Office
Annual Report 28/6/11
March 2011 Audit of a panel of 10 technical cooperation projects May 2011 Human resources No IT May 2011 Certification of the 2010 financial statements May 2011
1 Term of office renewed on 7 October 2010 for the 2011-2013 triennium. 2 It was agreed that management letters would be sent to the Secretary General starting in 2010 in response to an Advisory Group on Evaluation and Audit (AGEA) request aimed at dealing separately with recommendations that require Council decisions and these recommendations that can be addressed directly within the services.

V-5
1.2. Summary of main observations
The main observations and recommendations in this report are as follows: 3. Financial position as at 31 December 2010. An analysis of ICAO’s balance sheet
certified as at 31 December 2010 shows that, by the end of the current triennium (2013), for regular budget activities, the commitments shown as liabilities will exceed by 3.1 million Canadian dollars the available resources shown as short-term assets: the difference will be made up by budget resources for the 2011, 2012 and 2013 financial periods. Preparing three-year cash forecasts would make it easier to anticipate the financial constraints on the organization and would support management decision-making, particularly in the fields of human resources, debt recovery and, where appropriate, physical premises.
4. 2011-2013 triennium budget balance. In view of the conditions under which the resources allocated to ICAO and the mandatory programmes assigned to the services were reconciled, there is no certainty that the resources provided for the 2011-2013 triennium (assessed contributions, ARGF and AOSC resources, hoped-for voluntary contributions) will, at constant productivity levels, finance in full the 27 programmes provided for in the budget. Only significant productivity improvements will enable the triennium budget to be executed. However, at ICAO there is currently no tool for measuring productivity. Without greater productivity, commitments can be adjusted in practice only by reducing and/or spreading out the programmes taken on for the triennium.
5. Human resources. Approximately two fifths of staff with ICAO contracts are currently financed from resources other than Member States’ assessed contributions. As part of the envisaged growth in activities financed by voluntary contributions (an objective recalled during the 192nd session of the Council), it would be appropriate to provide for a contribution to be made from the corresponding funds to the regular budget under the revolving fund (the fund covering employee benefit costs and their financing) so as to finance the benefit costs accruing from these activities; - The documents on which the 2011/2013 triennium budget is based implicitly presuppose a reduction in the unit cost of staff on ICAO contract and a simultaneous increase in the ratio of Professional/General Service staff. This apparent contradiction shows that some budgetary data presentations could be improved.
6. IT: the External Auditor observed that, concerning IT: - There is not yet a stable, formalized view of the balance to be achieved between the functions requiring in-house competencies and the functions that can be outsourced without risk or even that it would be desirable and worthwhile to outsource. This is particularly the case for everything to do with the core of the service support function, the Service Desk. A specialist external audit of the user support function (Service Desk), including a cost-benefit analysis, would provide a better understanding of the quality of service being given to users, identify their needs and define a better balance between in-house functions and outsourced services. - From a more general point of view, IT is currently dispersed throughout ICAO despite the recent strengthening of the role of the Information and Communication Technology (ICT) Section. While this gives user services a certain amount of flexibility, it has the threefold disadvantage of a lack of coherence between actions

V-6
undertaken, a lack of overall monitoring of IT at ICAO (the ICT Section is constantly responding to emergency needs without a medium- to long-term vision), and a lack of security of some databases developed by various services within ICAO. The External Auditor recommends that the Council request from the Secretary General, and approve, a draft medium-term IT master plan identifying and prioritizing all of ICAO’s IT projects, combined with a financial evaluation and an implementation schedule.
7. Regional offices: - Two approaches could lead to a better assessment of the balance between the specialist staff assigned to the regional offices and the resources at their disposal to ensure that the countries in the region benefit fully from their expertise, namely: • The relative share of the budgets allotted to missions and travel out of the total
resources of the regional offices; • the number of official visits made annually for each speciality to each country in
each region. These two approaches are worth looking into in more detail for the purpose of defining, justifying and validating quantitative targets for budgetary resources, technical staff and number of missions (particularly official visits, by speciality and by region) to be given to the regional directors, after reconciling the objectives set and the resources available. If necessary, the regional offices manual should be amended accordingly. - The roles and activities of the regional directors and their deputies vary widely from one office to another. Since they are small offices (with around 20 staff per office, except for Paris, which has around 40), it is inevitable that the specific profile of each regional director plays a decisive role in determining how the regional office functions, though this certainly does so more than it should at present. In particular, the distribution of the budgetary resources between the regional director on the one hand and the technical officers on the other, or vice versa, does not always appear balanced. In addition to the theoretical standards in the regional offices manual, the Council should ask the Secretary General to put forward specific measures to standardize the regional directors’ activities, obviously taking account of their individual profiles, but also taking greater account of specific regional needs, notably by laying down rules, region by region, for sharing budget consumption between the directors and the technical staff and country missions in each technical field. - The geographical logic of having or not having technical officers representing certain specialities (particularly air transport and cooperation) at each regional office is not clear. In some cases, the workload and actual activity of some technical officers is not readily apparent. Without making any judgment on individual local situations, this issue should be the subject of a systematic critical review of the activity of each technical officer, by the managers of the regional programme and/or by internal audit, so that any necessary adjustments can be made. - As far as administrative support is concerned, the main problem seems to be the critical size of the regional offices. With around 20 staff per office, it is difficult to envisage a significant drop in the ratio of administrative to operational staff. In view of the overall level of ICAO resources and their trends, this probably means that, strictly from a management point of view, and therefore without taking into

V-7
account the problem of geographical coverage, the current figure of seven regional offices constitutes the maximum. - The External Auditor observes the lack in Nairobi/Dakar of a database systematically and reliably recording deficiencies in terms of air navigation safety; he questions the effectiveness of arrangements in the AFI zone for recording incidents, in view of the small number of deficiencies reported and the obvious lack of effective follow-up. The setting up of computer databases in Mexico/Lima, Cairo and Paris constitutes progress and should be extended to Nairobi/Dakar and Bangkok. The coexistence of two different software solutions (Mexico/Lima and Cairo/Paris have developed two different local computer systems for recording deficiencies) is undoubtedly not the best solution. Steps should be taken to ensure that uniform methodology is actually used, by bringing practices up to standard, particularly in the AFI zone, and by generalizing the maintenance keeping computerized databases with appropriate new procedures.
8. Technical cooperation: - From his review of 10 projects, and within the limits of due diligence, the External Auditor cannot guarantee that ICAO, in the exercise of its function of authorized buyer for certain countries, is not actually being used in some cases merely to rubber stamp pre negotiated operations; - Recent trends show a decrease in the ratio of overhead fees to the value of technical cooperation projects. ICAO does not have any current management tool to provide break-even estimates for each project being negotiated; in addition, AOSC is not a reliable instrument for measuring the financial outcome of technical cooperation activities. Consequently, the External Auditor is of the opinion that, to enable ICAO to ensure that TCB’s technical cooperation activity breaks even, detailed consideration is required of the method of setting tariffs for technical cooperation, of the reliability of the AOSC Fund as a monitoring tool, and lastly of the now lacking management tools that should be developed; - ICAO’s liability in TCB activities is supposedly covered by various contractual clauses included in each project and by an overall professional liability insurance (PLI) policy. No evaluation of this protection as regards the legal risks being taken has been carried out. The External Auditor believes that, when extensions or additions are made to old Management Service Agreements (MSA). ICAO should make sure that a hold harmless clause is included and, if necessary, should renegotiate certain agreements to this effect. The terms of the Lloyds PLI policy should also be regularly reviewed and checked to ensure that they are appropriate for the various risks incurred. More generally, the External Auditor suggests that ICAO should conduct a legal assessment of the adequacy and robustness of measures currently in place to limit its legal liability.

V-8
2. CERTIFICATION OF THE ACCOUNTS – BUDGETARY AND FINANCIAL POSITION OF ICAO
2.1. External Auditor’s opinion on the financial statements for 2010
The External Auditor's opinion was issued on 31 March 2011 in the following terms:
AUDIT OPINION
We have audited the financial statements of the International Civil Aviation Organization (ICAO), for the 12 month period ended 31 December 2010. These financial statements include a statement of financial position at 31 December 2010, a statement of financial performance, a statement of cash flow, a statement of changes in net assets, a statement of comparison of budgetary and actual amounts for the period ended 31 December 2010 and notes including a summary of the accounting policies and other information.
Within the general framework of Article 61 of the Chicago Convention and by virtue of Article XII of the ICAO Financial Regulations, the Secretary General of ICAO is responsible for preparing and presenting the financial statements. These statements are in conformity with the International Public Sector Accounting Standards (IPSAS). This responsibility includes the design, implementation and monitoring of internal control procedures to ensure the preparation and the fair presentation of financial statements, free of significant misstatements, resulting from either fraud or error. This responsibility also includes the determination of fair accounting estimates adapted to the circumstances.
Our responsibility is to express an opinion on these financial statements based on our audit. We have conducted our audit in accordance with the International Standards on Auditing (ISA). These Standards require us to comply with the ethical rules and to plan and perform our audit in order to obtain a reasonable assurance that the financial statements are free from material misstatements.
An audit consists in implementing audit procedures in order to collect audit evidence regarding the amounts and the information presented in the financial statements. The design of the audit procedures is based on the External Auditor’s professional judgement, as well as the risk evaluation that the financial statements include significant misstatements, resulting from either fraud or error. In the context of this risk evaluation, the Auditor considers the internal control in place for the preparation and presentation of the financial statements, in order to design appropriate audit procedures and not in order to express any opinion on the internal control. An audit also consists in determining that the accounting method applied and the presentation of the financial statements are appropriate and that the significant accounting estimates are reasonable.
We believe that the audit evidence collected is sufficient and appropriate to constitute a reasonable basis for our opinion.
Based on our audit, the financial statements give a fair view of the financial position of ICAO at 31 December 2010, as well as the financial performance, cash flow and comparison of budget and actual amounts for the 12 month period ended 31 December 2010 in conformity with IPSAS.
Without wishing to detract from the above-expressed opinion, we draw the Assembly’s attention to Notes 1.2, 1.3, 1.4, 2.10 and 9 that describe the impact of the change in accounting methods resulting from the first implementation of IPSAS in 2010. The main impact is the recognition of a non-current employee benefit liability amounting to Canadian dollars 76.9 million. This amount was evaluated based on the assumptions described in Note 2.10.
(signed) DIDIER MIGAUD

V-9
2.2. Financial position of ICAO 9. The financial statements for the 2010 financial period are the first to be presented in
accordance with the International Public Sector Accounting Standards (IPSAS). The use of these standards allows a more precise picture to be presented of ICAO’s true financial position, by providing a more exhaustive inventory of its assets and liabilities and by emphasizing the economic reality of transactions over how they appear legally. ICAO has thus acknowledged in its liabilities the long-term commitment to its staff for end-of-career allowances, repatriation allowances and medical cover during retirement, amounting to $76.9 million as at 31 December 2010 (figures are given in Canadian dollars unless otherwise stated).
10. The switch to IPSAS explains most of the deterioration in net assets in 2010, from the positive sum of $63.8 million as at 31 December 2009 under UNSAS to the negative sum of $29.7 million as at 31 December 2010 under IPSAS. Most of this deterioration (liabilities of $79.7 million) is due to the change in accounting standards (impact of the switch to IPSAS), while the balance is linked to activity in 2010 (loss of $3.8 million):
(In millions of CAD) Net assets as at 31 Dec. 2009 (UNSAS) $ 63.8 Impact of switch to IPSAS Non‐current employee liabilities ‐76.9 Depreciation of the Paris office building ‐1.1 Updating of long term claims on Member States ‐1.8 Accounting of publication stocks +0.7 Write off of exchange rate differences ‐0.6 Total impact of switch IPSAS ‐79.7 Other movements of net assets Result for the 2010 financial period ‐11.8 Dissolution of the IFFAS ‐1.2 Depreciation of the debt of the former Yugoslavia ‐0.5 Correction of charges registered in advance from 2007 $ ‐0.2 Exchange rate differences ‐0.1 All other movements ‐13.8 ‐‐‐‐‐‐‐‐‐‐‐‐‐‐‐‐‐‐ Net assets as at 31 Dec. 2010 (IPSAS) ‐29.7
11. This position translates into smaller financial margins for ICAO which, regardless of the flows produced by activity in the 2011, 2012 and 2013 periods, for all its activities (regular budget programme, other ‘proprietary’ activities and technical cooperation) will have to honour the following financial commitments during the next triennium budget:

V-10
(In millions of CAD) • Payment of current liabilities 192.1 • Employee liabilities for 2011, 2012 and 20133 9.7 • Liabilities for office rental 9.6 m Total financial commitments over next 3 years’ 211.4
12. To meet these commitments, regardless of the amounts that will be covered by the budgets adopted for the 2011, 2012 and 2013 periods, ICAO has on hand the following resources:
(In millions of CAD) • Cash 210.9 • Other current assets 23.2 Total short‐term financial resources on the balance sheet 234.1
13. The position is even less favourable if this analysis is applied to the position combining both the regular budget and the revolving fund, which meets the non-current employee liabilities:
(In millions of CAD) • Payment of current liabilities 17.2 • Employee liabilities for 2011, 2012 and 2013 9.7 • Liabilities for office rental 9.6 Total financial commitments over next 3 years 36.5
14. To meet these commitments, regardless of the amounts that will be covered by the budgets adopted for the 2011, 2012 and 2013 periods, the regular budget combination has the following resources:
(In millions of CAD) • Cash 23.6 • Other current assets 9.8 Total short‐term financial resources on the balance sheet 33.4
15. Over the three years, short-term financial resources, not counting amounts provided by the budgets adopted for the 2011 to 2013 periods, appear to be $3.1 million less than commitments.
16. It can be seen that the outstanding contributions of Member States are shown as assets in the amount of $13.5 million, $12.6 million of which is owed in contributions to the regular budget. Of this amount, $9.4 million has been outstanding for over one year, $6 million for over five years and $4.3 million for over 10 years. The 15 States that owe the highest amounts account for 57 per cent of the total owed, 69 per cent of sums outstanding for over one year, 77 per cent of sums outstanding for over five years and 75 per cent of sums outstanding for over 10 years. Of these, six are on the list of States that have signed an agreement with ICAO to repay the debt, generally over a period of 20 years.
3 Data taken from the report by the actuary AON Hewitt of 11 March 2011.

V-11
Observation 1: Even if short-term financial resources appear to be slightly higher than liabilities for ICAO’s activities as a whole, this is not the case for activities solely under the regular budget (including staff costs): consequently, the commitments taken on by ICAO at the end of 2010 will be financed partially by the budgets adopted for 2011, 2012 and 2013.
Recommendation 1: In view of the limited room for manoeuvre characteristic of ICAO’s short-term financial position, which has become clearer with the application of IPSAS, it would be useful to prepare three-year cash forecasts so that the consequent financial constraints can be assessed more accurately. A tool of this kind would support management decision-making by providing a precise picture of the financial margin for manoeuvre, and would facilitate decision-making, particularly as regards policy on human resources, debt recovery and, where necessary, physical premises.
In the draft Secretariat Action Plan related to the present report, this recommendation is not accepted, as ICAO considers that "the risk of running out of cash is present only if ICAO were to overspend its appropriation or if a major contributor defaulted on its payment. ICAO's expenditure is very strictly monitored against appropriation. If the past is an indication, there is always unspent appropriation at year-end that is available to be carried over. On non-payment of dues, if a large contributor would default, it would immediately come to notice. Therefore, we believe that making cash forecasts simply adds to the administrative burden without adding value".
The External Auditor was not thinking of a "risk of running out of cash" and shares on that point ICAO's analysis, but merely suggested that an introduction of cash forecast tools might be useful for decision-making, being a more precise approach than simply relying on the vague empirical rule according to which "there is always unspent appropriation at year-end that is available to be carried over".
2.3. Budget position of ICAO 17. Financially, the preferred instrument of the Assembly and the Council for monitoring
ICAO’s activity is the triennial budget. Since 2008, in application of the results-based budgeting (RBB) approach adopted by organizations within the United Nations system, this budget has been structured according to strategic objectives.
2.3.1. Execution of the 20082010 triennial budget 18. The table below summarizes, in accounting terms, the budgetary expenditure totals in
the previous triennium (2008-2010).
Table 2: Expenditure executed under the 2008-2010 budget (In thousands of CAD) 2008 2009 2010 TOTAL
Safety 13,908 14,409 19,646 47,963 Security 3,451 4436 7,070 14,957 Environment 1,313 1,384 1,844 4,541 Efficiency 20,330 19,596 19,695 59,621 Continuity 1,617 1,568 1,502 4,687 Rule of law 744 1,047 803 2,594 Management and administration
16,155 20,278 20,511 56,944

V-12
2008 2009 2010 TOTAL Programme support 12,959 13,105 14,430 40,494 Exchange rate gains and losses
-900 - 2,144 1,244
TOTAL 69,577 75,823 87,645 233,045 (Data taken from Statement IV for the 2008 and 2009 financial periods and Statement V for the 2010 financial period.)
19. From the same source (Statement IV for the 2008/2009 period and Statement V for 2010), the following table can be produced showing the budget carry-overs from one period to the next:
Table 3: Budget carry-overs from 2007 to 2011 (In thousands of CAD)
1
Original budget
2 Carry‐over from n‐1
3 Transfers to other funds
4 Purchase orders
issued but not paid
5 Remainder of carry‐over from
previous triennium
6 Operations carried over
7 Uncommitted carry‐overs approved at
n+1
Exchange rate
difference linked to split
assessment
Revised budget
2008 79,951 9,137 ‐8,187 ‐1,167 ‐4,195 ‐1,975 ‐3,987 ‐ 69,577
2009 80,085 11,324 ‐1,652 ‐4,771 ‐3,056 ‐59 ‐6,048 ‐ 75,823
2010 85,507 13,934 ‐345 ‐8,611 ‐ ‐ ‐2,840 ‐2,142 85,503
2011 87,594 11,451 Not known Not known Not known Not known Not known Not known Not
known
20. Column 1 shows for each financial period the budget adopted by the Assembly. Column 3 shows amounts appropriated from the regular budget to replenish other funds.
21. Columns 4 to 6 show carry-overs that can be considered to be ‘committed’: - Because they are for purchase orders that have been issued but not paid for during the period (column 4) – the effect of the IPSAS expenditure accounting rules is to increase the overall total; - Because not all of the remaining carry-over from the previous triennium has been used up (column 5) – this is notably the case for credits for the ACIP, AVSEC, TSSF and Environment funds; - Or because the Council has explicitly decided to carry over certain operations (column 6) clearly therefore it will not question their financing from the budget.
22. Column 7 shows ‘uncommitted’ appropriations carried over, in the sense that they have been approved, depending on volume, by the Secretary General or the Council, but that it would theoretically have been possible not to reallocate them to the later period because they do not correspond to any pre-existing formal commitment.
23. The sum of columns 4 to 7 represents all of the appropriations carried over from one financial period to the next (this amount therefore appears in column 2 of the next period).
24. The adjustment for exchange rate difference that appears in 2010 is due to the introduction of the split assessment – this is accounted for in Statement V of the accounts for the 2010 period in order to reconcile the figures in the right-hand column (executed budget) with the charges appearing in the performance statement under the ‘regular budget’ heading.

V-13
25. The table (column 2) shows that budget carry-overs increased in 2008 and 2009 and decreased in 2010: budget consumption was below annual budget allocations in the first two years of the triennium, then it suddenly caught up in 2010 at the end of the triennium. During the various management audits in 2010, the External Auditor was able to note various effects of this catching up in practice: a large increase in staff costs for almost constant staff numbers in 2010, after a period of stability; temporary recruitment (on contracts expiring on 31 December 2010) of technical officers for technical cooperation in the regional offices; provision of CAD 2 million in additional funds for new projects by the ICT Section; an increase of CAD 2 million for consultants (mainly for ANB and the ICT Section), etc. These points will be discussed in more detail in the observations on human resources, IT and the regional offices below.
2.3.2. Preparation of the 20112013 triennial budget
26. Table 4 shows the forecast budget expenditures for the current triennium (2011-2013):
Table 4: Forecast of expenditures for the 2011-2013 budget (in thousands of CAD)
2011 2012 2013 TOTAL Safety 22,815 23,437 24,913 71,165 Security 13,403 13,771 13,866 41,040 Environment and sustainable development 11,431 11,843 12,311 35,585 Programme support 19,748 20,714 22,143 62,605 Management and administration of services 13,265 13,475 14,080 40,820 Management and administration of legislative bodies
6,932 7,004 7,951 21,887
TOTAL 87,594 90,244 95,264 273,102 (Data taken from the triennium budget adopted by the Assembly.)
27. A comparison with table 2 shows that the budget structure has changed considerably compared with the previous triennium: instead of six there are now three strategic objectives4 (excluding support); the rules for apportioning programme support costs have changed significantly; management and administration costs for the legislative bodies have now been separated out, etc. The External Auditor will not go into detail about these readjustments, which are amply explained in documents submitted to the Council and Assembly in the second half of 2010.
28. As far as the level of budget allocations in the new triennium is concerned, the Charter letter addressed by the President of the Council on Member States’ behalf to the Secretary General on 27 March 2009 stated “you will be charged with ensuring that the Secretariat achieve delivery of the ICAO Strategic Objectives through a zero nominal growth budget proposal”. The same letter further stated that: “the actual amount of the budget should be the result of the process, not the starting point”.
29. In practice, the budget was decided on a significantly different basis from the principles laid down in the engagement letter. An examination of the many documents exchanged between the Secretariat services and the Council or the Finance
4 Safety, security and environment

V-14
Committee (FIC) shows that the sum of $273 million in budget appropriations allocated for the 2011-2013 triennium was actually the result of all the negotiations between the Secretary General’s demands and what the Member States were prepared to pay in assessed contributions: the lowest figure was the ‘ZNG’ (zero nominal growth) option mentioned in the engagement letter but adjusted to $256 million5, while the highest figure was $293 million, which was the Secretariat’s estimate of the resources necessary to complete all the programmes requested by the Council for the triennium. The negotiations between the Secretary General and FIC led to the proposal of an intermediate option. This ultimately led to the compromise amount of $273 million, which was slightly below the halfway point between the highest figure and the lowest figure.
30. This final option was described as the ‘ZRG’ (zero real growth) option, not because it was the result of a hypothesis for inflation being applied to zero nominal growth, but because it was considered to be approximately equivalent to the amount that would have been obtained by applying certain inflation and pay increase hypotheses to a ZNG budget.
31. All in all, the negotiations described above replaced the principles set out in the engagement letter of 27 March 2009, and the sum of $273 million does not appear to be the result but rather the starting point for constructing the budget. The Financial Services Section highlighted certain stumbling blocks, in particular: - The fact that the $11 million adjustment to the ZNG option was probably an underestimate of the resources needed to keep the AVSEC programme running at its current level, because in reality some posts were financed by the TSSF, which was not included in the $11 million; - The fact that the Council had decided to launch new programmes that the Secretary General was committed to financing through productivity gains: in practice, the scope of some programmes was reduced, others were spread over a longer period, and others were based on the hope that staff would be made available by some Member States, while ATB and the ADB saw their budgets decrease.
32. The above comment corroborates the financial analysis presented earlier, based only on an examination of the balance sheet as at 31 December 2010, which shows that, within three years, there would be a $3 million shortfall in short-term financial resources compared with liabilities.
33. This is particularly worrying because ICAO has no performance indicators for the programmes taken on: the indicators envisaged in the 2008-2010 triennial budget have not been introduced, and the 2011-2013 triennium budget has abandoned all references to quantitative indicators.
Observation 2: The way in which the 2011-2013 triennial budget was decided in the second half of 2010 deviated significantly from the guidelines laid down in the letter addressed to the Secretary General on 27 March 2009, which clearly stipulated reconciliation of the resources allocated to ICAO and the programmes the services were expected to deliver. All in all, it seems likely that the resources allocated (assessed contributions, ARGF and AOSC resources, hoped-for
5 The amount for the 2008‐2010 triennium had been $245 million, but the inclusion of a number of voluntary contributions in the regular budget had caused this to grow by $11 million.

V-15
voluntary contributions) will not permit the 27 programmes provided for in the budget to be completed at constant productivity levels. Only significant productivity gains are likely to allow the budget to be executed as adopted in the autumn of 2010: in management terms this will require efforts to improve productivity, although there is currently no tool for measuring productivity at ICAO. Without greater productivity, the adjustment can be made in practice only by reducing or slowing down the programmes taken on for the triennium.
Recommendation 2: The External Auditor recommends that productivity measurement tools be developed, as the only means of setting and monitoring targets for improving productivity, which are essential for the nominal execution of the 2011-2013 triennial budget.
In its response to the preliminary report, ICAO indicates it is implementing a project management and reporting tool, the ICAO Knowledge Sharing Network (IKSN), and considers that this tool will make it possible to follow-up on project status in terms of deliverables and timelines. Not having audited this tool, the External Auditor cannot tell whether it will also enable ICAO to follow up and monitor its productivity gains.
3. HUMAN RESOURCES MANAGEMENT AND INFORMATION TECHNOLOGY
3.1. Relative weight of ICAO expenditure broken down into broad categories
34. From an audit point of view, the budget data outlined above produce an image that is only approximate, partial and difficult to use, since: - They only cover part of ICAO’s activities, namely, the part related to the four general budget programme funds (funds 1101, 1102, 1104 and 1604), and do not cover expenditure from other funds, which nonetheless, either directly or indirectly, account for nearly two fifths of ICAO staff costs, which alone consume nearly 80 per cent of the organization’s total expenditure; - They are not consistent over time – the major changes made to the budget structure between the 2008/2010 and the 2011/2013 trienniums described above show that the basic concept, in an RBB, of a “strategic objective”, together with the rules for allocating overheads according to objectives, are currently based on parameters that fluctuate too broadly from one triennium to the next for them to be used as the basis for a coherent analysis of ICAO’s expenditure structure; - Lastly, they are not very reliable – the size and volatility of budget carry-overs, which, as mentioned above, accounted for between 13.39 and 17.10 per cent of budget allocations each year during the 2008/2010 triennium, show that the forecasts for the 2011/2013 triennium shed little light on trends in the cost structure.
35. However, notwithstanding the different methodologies used due to the switch from UNSAS to IPSAS, ICAO’s accounts do afford a more coherent base for analyzing the expenditure structure.
36. Table 5 deviates slightly from the presentation of expenditure proposed in Financial Statement II (Performance statement), to separate out or group together certain expenditure items that, in management terms, form more or less homogeneous blocks

V-16
(for instance, “meetings” and ‘travel” both come under “missions”, so IT expenditure, has been separated out, etc.) :
Table 5: Breakdown of accounting categories in the
regular budget by object of expenditure
(in thousands of CAD) 31/12/08 31/12/09 31/12/10 Salaries and other staff costs 57,416 83% 59,977 79% 66,881 78% Missions (travel and meetings) 2,800 4% 3,711 5% 5,943 7% IT expenditure 945 1% 3,030 ,4% 2,685 3% Other expenditure 8,411 12% 9,105 12% 9,992 12% Total 69,572 100% 75,823 100% 85,501 100%
(Source: Agresso)
37. The table shows the relative size of the broad categories of expenditure relative to activities under ICAO’s regular budget. It reveals: - A net escalation in total expenditure under the regular budget for the period, following a slow down imposed at the beginning of the triennium: while expenditure under the regular budget had, at first sight, fallen by 7.70 per cent between 2007 and 2008 (expenditure for the financial year 2007 amounted to USD 75,374,000, although the apparent decrease recorded in 2008 was more than offset by the transfer of staff from the regular budget to the ARGF and AOSC funds, as will be explained below), it rose by nearly 9 per cent in 2009, and then by nearly 13 per cent in 2010; over the same period, income from activities under the regular budget dropped considerably, from +14.4 million Canadian dollars (2008) to -7.303 million Canadian dollars (2010, revolving fund included); - A relative reduction in staff costs as a proportion of ICAO expenditure, from 83 to 78 per cent of expenditure between 2008 and 2010; - An increase in the proportion of missions (travel and meetings), from 4 to 7 per cent of total expenditure over the 2008-2010 triennium; - An increase in IT costs, up from 1 per cent to 3-4 per cent of total expenditure between 2008 and 2010. The increase is even higher given that, under “Other expenditure”, there are large amounts also spent on IT: it will be seen below, in the section on IT management, that in reality expenditure on IT (including expenditure relative to IT staff), amounted to $3.9 million in 2008, $6.1 million in 2009 and $5.5 million in 2010, i.e. between 6 and 8 per cent of total spending on activities that come within the scope of ICAO’s regular budget, which currently makes it the second largest block of expenditure, following staff costs and before missions.
38. It is on this basis, and recalling that “Missions” were already audited by the External Auditor in October 2008, that the External Auditor submits to the Council, within the framework of his first consolidated annual report, an analysis of trends and management relative to: - Human resources; and - IT.

V-17
3.2. Human Resources 39. HR management during the 2008 – 2010 triennium was the object of an audit in
Montreal from 17 to 28 January 2011. 40. As indicated above, human resources are by far the largest expenditure item in
ICAO’s regular budget. In the 2008-2010 triennium, 80 per cent of regular budget resources was allocated to staff costs:
Table 6: Staff costs as a proportion of the budget for the 2008-2010 triennium (In thousands of CAD 2008/2010 Regular budget 245,543
Staff costs paid from regular budget (a) 195,193
% staff costs/regular budget 79.49%(a) Staff costs include salary costs as well as discretionary staff costs (e.g. training, staff welfare, etc.)
41. In actual expenditure terms, the data are as follows:
Table 7: Staff costs as a proportion of actual expenses for the 2008-2010 triennium Financial statements, RB only
(In thousands of CAD ) Staff salaries and costs
2008 57,766 2009 59,977 2010 66,881
184,624 All expenses
2008 69,577 2009 75,823 2010 85,501
230,901 Ratio 79.96%
42. A comparison of the above two tables shows that, in its execution of the budget for the 2008-2010 triennium, ICAO used 94 per cent of the original appropriations and maintained the ratio of staff costs to other expenditure within the initially budgeted limits.
43. This generally satisfactory management of staff costs in relation to the initial budget must not, however, obscure a striking trend: in 2010, staff costs rose by 11.51 per cent, while number of staff recorded in the regular budget rose by 5.3 per cent. Even including the impact of such an increase in staff numbers, the following items in particular visibly increased in 2010: - Total staff costs for GS staff, rose by 10.7 percent (from $11.2 million to $12.4), while total staff costs for “Professional” staff rose less (+4percent); - Additional salary payments (“post adjustment”), rose by 20.6 per cent (from $8.7 million to $10.5 million);

V-18
- Consultancy costs rose by 76 per cent in 2010 (from $2.8 million to $4.9 million); - Annual home leave costs rose by 85 per cent (from $0.7 million to $1.3 million).
44. Finally, outside its regular budget, during the 2008-2010 triennium, ICAO paid staff costs totalling nearly $73 million from non-budget resources (voluntary contributions, transfer from the regular budget of reserves build-up in previous periods, commercial income, technical cooperation fees, etc.). Consequently, total staff costs, excluding certain consultants and field officers (the latter being paid out of technical cooperation funds), disbursed by ICAO from all resources, came to a little over $257 million during the 2008-2010 triennium.
3.2.1. Budgeted staff and actual staff 45. The following information aims to provide an overview of how human resources were
managed
Table 8: Trends in regular budget posts 31/12/2007 31/12/2010
Number of established (budgeted) posts in the regular budget
613 503
Of which P 269 247
G 344 256 Total number of staff charged against the regular
budget 581 518
Of which P 249 239
G 332 279
46. The table shows that staff budget for the 2008-2010 triennium relied on the dual principle of an overall reduction in the number of posts and an increase in the proportion of P category posts to G category posts.
47. Concerning the total number of posts financed from the regular budget, the number of posts originally planned for the 2008-2010 triennium was to have been 110 lower than in 2007, dropping from 613 to 503 posts.
48. In reality, the initial actual number of posts, at 31 December 2007, was less than the number presented to the Council in the budget assumption used (581 posts as against of 613), and the number of posts at the end of the triennium was higher than the target originally announced (518 posts as against of 503). However, the transfer of nearly 20 staff from AOSC to the regular budget in 2010 had not been anticipated when the budget 2008-2010 triennium was drawn up should be taken into account (the AOSC reimbursed to the regular budget an amount equal to the corresponding payroll costs). Without this transfer, whereas the reduction agreed by the Council was 110 established posts, the actual reduction was only 85 posts.
49. Concerning adjustment of the balance between P and G posts (the target presented in support of the triennium budget was 247 P staff to 256 G staff by the end of 2010, or 49 per cent P staff), the budget target for staff reductions in the 2008-2010 triennium was not achieved (239 P staff to 279 G staff, i.e. 46 per cent P staff).
50. The budget assumption for staff costs was worked out by applying the standard salary costs to established (budgeted) posts, broken down by specific categories (D, P and

V-19
GS) and grade level 1, 2, etc. As was seen above, this assumption does not necessarily reflect reality in terms of the posts held by ICAO staff.
51. Once the budget isadopted by the Assembly and the Council, the services, as far as their budget appropriations permit, have some flexibility and can use the funds for established (budgeted) posts to recruit staff to posts that do not appear on this list: these posts are then described as ‘non-established’. For information, the table below shows for the last two trienniums the discrepancy this flexibility gives rise to between the assumptions presented to the Council in support of the regular budget and their actual implementation by the services:
Table 9: Differences between budget assumptions and their implementation: 2005 2006 2007 2008 2009 2010 Established/budgeted posts forecast in
the regular budget 627 618 613 503 500 503
Occupied posts
Established posts 571 549 530 453 452 470 Non established’ 29 49 54 29 43 48
Total regular budget 600 598 584 482 495 518
52. It can be seen that the number of non-established posts, nevertheless financed by the regular budget has increased during each triennium, with the following triennium being based on a new budget assumption scale that takes account of this deviation.
53. For the previous two trienniums (2005-2007 and 2008-2010) the assumptions for the number of established posts presented in support of the budgets are higher than the actual number of staff funded by established posts. The difference is partially offset by the presence of staff on non-established posts but, during the triennium it tends to grow, with the number of actual posts deviating further from the number of established posts (the number of staff in non-established posts increases while the number of staff in established posts decreases).
54. Apart from this discrepancy between assumptions and actual numbers, the number of staff on ICAO staff contracts is much higher than the number of staff financed from the regular budget:
Table 10: Staff on ICAO staff contracts at 31 December 2010 Staff financed from 2005 2006 2007 2008 2009 2010
Regular budget 600 598 584 482 495 518AOSC 77 79 90 91 87 75Other funds 84 70 69 144 135 126Total staff at 31/12 761 747 743 717 717 719
55. At 31 December 2010, in addition to the 719 staff holding ICAO contracts in the above table, ICAO had 83 consultants on Special Service Agreements (SSAs) financed from the regular budget as well as other proprietary funds: in total, ICAO therefore had 802 individuals with staff and non-staff contracts (excluding field staff for technical cooperation) financed from all sources of funds.
56. Furthermore, this table shows that, at the end of 2010, 201 staff with ICAO staff contracts were not charged to the regular budget. The number of posts not charged to the regular budget increased at the start of the 2008-2010 triennium, by 75 staff, not

V-20
including AOSC, for the most part due to the setting up of ARGF. Conversely, from 2010, the transfer of around 20 staff from AOSC to the regular budget (offset by charging an equivalent amount to AOSC) led to a corresponding reduction in posts not charged to the regular budget.
57. The total number of posts for all staff during the 2008-2010 triennium remained very stable, even though the Council had decided to reduce the number of staff with ICAO staff contracts by 58 (110 posts being removed from the regular budget, of which 52 would be transferred to ARGF with effect from 1 January 2008).
58. The table below shows that, at 31 December 2009, 65 posts were actually funded by ARGF, reflecting an increase in revenue-generating activities and staff, compared with the transfer of 52 posts from the regular budget originally forecast:
Table 11: Financing of staff with ICAO staff contracts not charged to the regular budget
Fund 9.B AOSC ARGF AVSEC ECAC Environment ICT Other TOTAL2007 ‐ 90 ‐ 1 13 ‐ 6 49 159 2008 ‐ 91 63 ‐ 11 3 12 55 235 2009 2 87 65 ‐ 14 3 4 47 222 2010 2 75 65 3 13 3 3 37 201
59. Regardless of the reasons for the individual situation of the funds concerned, this table shows that the funds not financed from the regular budget (i.e. funds financed by carry-overs or reserves constituted from prior assessed contributions, by voluntary contributions, by commercial income or by fees from technical cooperation) together form a system of link-ups with the regular budget. Regardless of the decisions taken by the Assembly and the Council to reduce the number of posts, the actual number of staff with ICAO staff contracts during the 2008-2010 triennium was stable at around 717 to 719, some 30 staff less than at the end of the previous triennium.
60. As long as these other sources of finance are maintained at a sufficiently high level, this situation, which allows the volume of ICAO’s activities to be maximized despite tight limitations on assessed contributions, does not in itself cause a problem in principle.
61. However, promoting activities financed by voluntary resources can, over time, lead to pressure for them to be incorporated into the regular budget: the line between voluntary funding and assessed contributions is not watertight. An inverse link-up phenomenon to the one described above (the transfer of posts from the regular budget to externally financed funds) is illustrated at the end of 2010 by the Council’s decision to incorporate into the regular budget 28 staff recruited or to be recruited under ACIP (1 post), AVSEC (8 posts), Environment (6 posts) and TSSF (13 posts).
62. From this point of view, the coexistence of activities financed by assessed contributions (regular budget) and voluntary funding (other proprietary funds) runs the risk, where the voluntarily funded activities represent a large share of the total activity, of these activities ‘contaminating’ the activities financed by assessed contributions. The greater the proportion of posts with ICAO staff contracts not financed from the regular budget, the greater this risk is. This proportion is currently 2/5.

V-21
63. Finally, account should also be taken of the end of services liabilities accumulated in respect of staff ‘outside’ the regular budget. The end of services liabilities for all staff (719 staff with ICAO staff contracts at 31 December 20106) was estimated by AON Hewitt actuaries, in application of the IPSAS standards, to be CAD 76.9 million as of 31 December 2010.
64. Based on the current ratio of 200 staff outside the regular budget to just over 500 staff under the regular budget, and assuming that the average position of ICAO staff outside the budget is the same as that of ICAO staff within the budget in terms of accumulated social welfare entitlements (specifically ASHI), these costs build up proportionately 2/5 for the activity of non-regular budget staff. If these external resources should dry up (voluntary contributions, technical cooperation, commercial income of ARGF, etc.), ICAO could of course consider making the necessary adjustments to staff numbers and bring the corresponding activities to an end. Yet it would have to cover the social welfare costs arising from activities outside the budget from its own resources (i.e. from assessed contributions), in the same way as for activities within the budget.
Observation 3: The creation of various proprietary funds benefiting from external resources – voluntary contributions, technical cooperation fees, commercial income, recycling of reserves constituted in or recovered from previous periods, etc. – from the point of view of human resources management has the advantage of cushioning the effects of Member States’ desire to limit their assessed contributions. But if the current proportion was maintained over time (approximately two fifths of personnel with ICAO staff contracts are currently financed from external resources), on the one hand there would probably be pressure for the gradual incorporation of the main activities financed voluntarily into the regular budget and, on the other hand, the social welfare entitlements acquired by ICAO staff not financed from the regular budget would accumulate in proportion with the staff numbers concerned. Unlike direct payroll costs, which can, at least in theory, be controlled in the short term by adjusting staff numbers, these costs, once constituted, remain payable by ICAO even if its non-budget resources dry up.
Recommendation 3: Within the framework of the planned development of activities financed by voluntary contributions (an objective recalled during the 192nd session of the Council), arrangements should be made for the corresponding funds to pay the regular budget a contribution to the revolving fund to finance the social welfare costs accumulated in this way.
In its response to the External Auditor’s preliminary report, ICAO states “charging an administrative fee to voluntary funds to pay to the regular budget an appropriate contribution to the revolving fund to finance the social welfare costs will be considered.”
3.2.2. Distribution of staff 65. Concerning the distribution of staff with ICAO staff contracts between the various
services, at 31 December 2010 the situation was as follows:
6 7O6 excluding 13 ECAC staff with ICAO staff status who are not covered by the social welfare insurance of ICAO staff.

V-22
Table 12: Distribution of staff in ICAO organization chart (Acronyms represent the different services)
President OSG ADB ANB ATB RCC RO LEB FIN EAO TCB Total 2 3 226 110 70 8 168a) 14 45 5 68 719
a) Includes ECAC staff with ICAO staff status: regional offices alone account for 149 persons.
66. Based on this table, 375 ICAO staff may be considered “operational”: - ICAO’s current ‘strategic objectives’ are the direct responsibility of ANB and ATB: these two offices have a total staff of 180 people; - In the regional offices, as shown by past audits by the External Auditor, approximately 66 per cent of the staff in post, participated in the achievement of the strategic objectives, which represents approximately 120 additional people, with the remainder being support staff; - The ADB office directly provides nearly 75 staff for operational activities (see below); - At present, technical cooperation is not really integrated into the achievement of the strategic objectives. It therefore comes under neither the strategic objectives nor support for the strategic objectives, and the 68 technical cooperation staff can therefore be considered neutral in relation to the strategic objectives and support for them.
67. On the other hand, around 300 may be considered support staff: around two thirds of ADB (to take account of language staff, who, it has been agreed to consider directly operational), one third of the regional offices, and all the financial services.
68. It may thus be estimated that, in terms of human resources, there are around three support staff at OACI for just under every four operational staff.
69. With regard to the age pyramid, the table below shows the distribution and the number of staff who were less than 5 years from the theoretical retirement age (62 years according to the ICAO Service Code) during the previous triennium from 31 December 2007 to 31 December 2010, and trends in the average age of all staff with ICAO contracts during the same period:
Table 13: Change in average age of staff
31/12/2007 31/12/2010 Total staff with ICAO contracts 743 719 60 years of age and over 46 6.2% 42 5.8% 57 to 60 years of age 96 12.9% 100 13.9% Total less than 5 years from retirement 142 19.1% 142 19.7 Average age of staff 48.8 years 48.8 years
70. This table shows that the age pyramid at ICAO is fairly stable, and the large number of staff who are less than five years from retirement (nearly 20 per cent) is probably structural in ICAO owing to the specialized nature of its job profiles which require the recruitment of seasoned experts. Nothing in the past would suggest staff cost savings linked to a reduction in the average age of staff due to the rate of turnover.

V-23
71. The provision for the 2011-2013 triennium for the 530.5 posts within the regular budget (see document “Supplementary information to A37-WP/43 draft Budget of the Organization for 2011, 2012 and 2013”, and taking into account that the figure 551 includes 20.5 posts funded by the inter-fund transfers), is the amount of $66,090,000 (on average CAD 124,580 per post per annum), compared with $63,969,000 for the 503 posts during the previous triennium (on average $127,175 per post per annum): the implicit budget assumption is therefore that the standard unit cost of the established posts in the 2008-2010 triennium will fall by 2 per cent in the 2011-2013 triennium, which presupposes that there will be a general drop in the salary level of ICAO staff.
72. However, one of the targets for the new triennium is to increase the P/G ratio7 which, with a stable age pyramid, would automatically increase rather than decrease the unit cost of established posts: in his preliminary report, the External Auditor made a draft observation suggesting that the recruitment policy should be adjusted as from the current triennium in order to solve this contradiction. In its draft Secretariat Action Plan, ICAO rejected that draft recommendation, stating that: “a comprehensive review of the recruitment policy was undertaken in connection with the revised ICAO Service Code which was approved by Council for implementation effective 1 January 2011. The primary consideration for the appointment and promotion of staff shall be the necessity for securing the highest standards of efficiency, competence and integrity. In addition, due regard is to be paid to the importance of recruiting staff on as wide a geographical basis as possible and ensuring equal gender representation […] The [draft] recommendation has been noted by the Secretariat […]”. Commenting on the apparent contradiction of recruiting at higher level staff while lowering the average standard unit cost of the established posts, which is the implicit hypothesis of the above-mentioned budgetary document, ICAO suggests that “if the purpose is to detemine whether or not the P/G ratio [target] in the current triennium is achievable, then we should not compare the average post cost for the 2010 budget against that of the 2011 budget. Instead we should be comparing actual average post cost in 2010 with the budget for 2011 […].” On that basis, the actual average cost in 2010 recalculated by ICAO is $115,231. The budgetary hypothesis for the 2011-2013 triennium, at $124,580, corresponds to a rise of 8 per cent in average post costs.
Observation 4: The underlying assumption for the 2011/2013 triennial budget, of a fall in the unit cost of staff with ICAO staff contracts and a simultaneous rise in the P/G ratio is at first sight contradictory. This contradiction is removed since the established posts presented in the budgetary documents are theoretical and never coincide with the actual posts financed by the regular budget.
Recommendation 4: When presenting budgetary hypothesis related to established posts to the Council, the Secretary General should systematically indicate the actual posts charged to the regular budget.
7 Cf doc. WP 43, para 9-a: “There should be greater focus on direct delivery by frontline Professional staff and hence an increase in the ratio of P to G staff over the triennium within a constant headcount.”

V-24
3.2.3. Service Code
73. The Service Code was revised during 2010 and approved by the Council for implementation on 1 January 2011. The new Code takes account of the recommendations made by the Auditor in his report on the recruitment of international staff to ICAO, in particular:
74. Concerning recruitment: - The new Article 4.10 does not repeat the principle that the President must approve all recruitment of staff in categories P4 and P58; - The Council could set up a Human Resources Committee charged with advising the Secretary General on appointments of D employees reporting directly to him (i.e. D2 staff and some D1 staff), and immediately informing the Council, which may oppose the proposed recruitment. This system satisfies recommendations 3, 4 and 6 of the aforementioned External Auditor’s report; - From now on, the Secretary-General is assisted by a Panel of Directors for D1 posts, by Appointment and Promotion Board I for P posts and by Appointment and Promotion Board II for G posts. This system confirms the merger of the former Review Panel and the Promotion Board recommended by the External Auditor (Recommendation 3); - If the Secretary General's appointment decision differs from the ranking order of the Appointment Board, he must inform the Chairman in writing of the reasons for his decision. This point also responds to Recommendation 3.
75. The External Auditor had also recommended the use of external recruitment agencies to recruit D2 staff 9 . This recommendation has not been followed, but for the recruitment of the new director of the Technical Cooperation Bureau, a pilot project was conducted in which a specialist firm was asked, not to perform a pre-selection, but to analyse the profiles of the candidates shortlisted by ICAO. This experiment was repeated when the post of Director of the Air Transport Bureau was reopened.
76. The External Auditor observes that most of his recommendations have been taken into account in the recent revision of ICAO’s Service Code.
77. Concerning the type and duration of contracts, the new Service Code makes provision for three types of contracts: - Temporary appointments for a period normally not exceeding one year, non-renewable apart from exceptions which cannot exceed 24 months; - Fixed-term appointments for a period of one to five years, “with no expectancy of renewal”, although they may be renewed indefinitely if ICAO so decides; - Continuing appointments lasting an indefinite period, which may be given to staff who have served on ICAO contracts for a minimum of five years. This third form of
8 Recommendation 2: “One simplification that could be considered would be to end the exceptional mechanism introduced on 20 January 2009 (Decision C-DEC 186/1) whereby the written approval of the Chairman of the Council is required for the hiring and appointment of P4 and P5 employees”. 9 Recommendation 5: “To ensure candidates are selected objectively based on their skills, while taking account of a good regional balance of directors, the Auditor recommends that specialist headhunting firms, which will be informed of the Council’s desired regional and gender balance, be used to preselect candidates for D2 posts, and that these submit a shortlist to the Chairman and the Secretary General together with an analysis of the selected profiles and a proposed classification.”

V-25
appointment has not yet been approved by the United Nations, and is therefore not currently used.
78. In practice, the standard form of appointment of ICAO staff is the fixed-term appointment.
79. However, although permanent appointments have disappeared from the new Service Code, ICAO has inherited a number of staff with this type of appointment from the past. The table below shows the gradual reduction in the number of staff with permanent appointments, which have not been granted since 2003:
Table 14: Permanent staff with less than 5 years until retirement
31/12/2007 31/12/2010Total staff with permanent appointments 410 298 Total less than 5 years from retirement 75 64
80. It can be observed that, for all staff on ICAO contracts, the change in the appointments structure (gradual replacement of permanent appointments with fixed-term appointments) has had little effect to date on the average time spent under contract at ICAO from first appointment, as the table below shows:
Table 15: Term of contracts
31/12/2007 31/12/2010Average time spent at ICAO from first appointment 13.5 years 13 years
81. This reflects the fact that one of the main determinants of the duration of careers at ICAO is the retirement age: in 2010, out of 39 G staff who left ICAO, 19 retired. Dismissals play a very marginal role. In his report on the recruitment of international staff, the External Auditor observed in 2009 that, for the P and D staff covered by his audit, out of 32 staff who left ICAO, there was only 1 case of dismissal. Approximately the same proportion of departures instigated by ICAO can be seen for G staff where, in 2010, out of 39 departures, there was only 1 dismissal.
82. Approximately one third of the ‘room for manoeuvre’ expected as a result of the gradual disappearance, due to natural departures, of staff on permanent appointments granted until 2003, was absorbed during the previous triennium without generating: - A lower average age among ICAO staff (which remained, as seen above, at 48.8 years during the period); - A significant reduction in the average time spent at ICAO by staff present at 31 December 2010 (13 years) compared with the time spent at ICAO by staff present at 31 December 2007 (13.5 years).
83. From this point of view, the new types of appointment in the Service Code should not in themselves be expected to change ICAO’s special situation, characterized by high employee inertia, both generally and individually.

V-26
3.3. IT
84. The External Auditor performed a review of IT within ICAO in Montreal from 17 to 28 January 2011. The aim was, on the one hand, to check whether the information provided to the Council in this area through the triennial budget and associated documents is correct and, on the other, to determine the extent to which the IT function, which is still very scattered throughout the Organization, meets ICAO’s needs economically and efficiently and, if necessary, to make recommendations.
3.3.1. IT costs
85. The budget for information and communication technologies (ICT) is included in management and administration support expenses. It was $18.6 million for the 2008-2010 triennium and $14.2 million for the 2011-2013 triennium, with the following annual breakdown:
Table 16: ICT Allotments 2008-2011 (Fund 1101 only)
Year Initial
allotments
Balance of annual
allotment
Increase/transfers
Carryover from prior year
Total Salary costs
TOTAL
(excludes salary costs)
2008 1,546,382 359,585 510,860 2,416,827 2,035,647 4,452,474
2009 1,878,757 836,050 109,375 1,232,354 3,837,786 2,134,183 5,971,969
2010 1,851,967 898,015 2,614,972 782,118 6,147,072 2,077,652 8,224,724
2011 2,581,690 2,973,667 2,103,730 7,659,087
86. The overall 23.7 per cent reduction in the budget assigned to ICT between the two trienniums, reflects various movements, which are explained below.
87. In 2008-2010, these budget allotments represented 7.1 per cent of ICAO’s regular budget and 17.8 per cent of the appropriations for management, administration and programme support. For the 2011-2013 triennium, these allotments represent 5.2 per cent of the budget and 11.3 per cent of all appropriations for management and administration, which cover a substantially different perimeter from the previous triennium.
88. From 2011, the allotments for IT are split between three main support function categories (Programme Support (PS) with 60 per cent of IT appropriations; Management and Administration (MAA), with 35 per cent; and Management and Administration – Governing Bodies (MAA GB), with 5 per cent).
89. The budgets are not directly comparable between the two trienniums because the methods of allocating the Organization’s general costs between the programmes and support functions have changed.
90. In addition, for the 2008-2010 triennium, the budget reflects a set of estimated IT-related expenses (including staff costs), whether or not controlled by the ICT Section, while from 2011 the budget reflects the expenses of the ICT Section alone. The perimeter of the Organization’s IT expenses and that of the direct expenses of the ICT

V-27
Section therefore did not match up in 2010, since other management services could incur IT expenditure.
91. The expenses identified as IT-related for accounting purposes represented $15.5 million in the 2008-2010 triennium. This is less than the budget estimates but does not include IT-related expenses that are unliquidated obligations in the triennium.
Table 17: Accounting expenditure (Regular budget (In thousands of Canadian dollars)
2008 2009 2010 Total IT expenditure entered into the accounts Of which ICT Section
3 905 2 888
6 113 5 151
5 518 4 379
(Provisional data at 31/12/2010, unclosed accounts)
92. In 2010, the dispersal of IT expenditure among the organizational structures is explained by the role played by the ICT Section, which currently provides technical support without actually controlling all IT at headquarters and the regional offices. It plays the role of facilitator, without having a direct influence on decisions about the content of the tools provided at the users’ request. It thus does not control all of ICAO’s IT expenditure, as the table below shows:
Table 18: Breakdown of IT accounting expenditure by cost centre (regular budget) (In thousands of Canadian dollars)
Cost centre 2008 2009 2010 ICT Section % of total IT expenditure 73.9 % 84.2 % 79.3 % 7 regional offices % of total IT expenditure 18.2 % 10.5 % 14.2 % Other headquarters cost centres % of total IT expenditure 7.9 % 5.3 % 6.5 %
(Data at 31/12/2010 provisional, unclosed accounts)
93. The new budget presentation shows only the estimated budget of the ICT Section. It therefore does not include such IT-related expenditure as: - Salaries of IT staff at the regional offices (eight at present); - Salaries of staff at headquarters technical bureaux who have IT responsibilities but are not at the disposal of the ICT Section; - IT expenditure disbursed from the budget lines of the bureaux programmes for the implementation of specific IT applications or the outsourcing of IT services.
94. As from 2011, IT expenditure is grouped into a Supporting Implementation Strategy managed by the ICT Section, and therefore requires budgetary authorization from the Section manager before being committed. This new approach is accompanied by the allocation of IT expenditure to a single cost centre, which should improve the visibility of this activity in the budget and allow responsibility for the distribution of appropriations allocated to IT to be concentrated in one place.
95. The new budget presentation covers only appropriations from the regular budget. For a complete picture it would be necessary to take account of any IT appropriations allocated to funds not specifically dedicated to IT10 as well as any expenditure made from the ICT Fund set up by Assembly resolutions A33/24 and 135/32, which
10 However, ICT expenditure entered in the accounts of the AOSC Fund as such (hardware and software) did not exceed $86,000 in 2008-2010.

V-28
receives supplementary financing in addition to that from the regular budget, for the modernization of ICAO’s IT and financial systems. At present this Fund finances only the structural financial systems improvement project known as IRIS (Agresso integrated management software). Expenditure from this Fund was $3.7 million in the last triennium and the budget is $2.1 million for the 2011-2013 triennium. The table below shows actual expenditure from this Fund for the period 2008-2010 and allotments to the Fund for the period 2011-2013:
Table 19: ICT Fund (In thousands of Canadian dollars)
2008 2009 2010a) 2011 2012 2013 Expenditure 1 355 1 504 867 Budget estimate 1 679 200 200
a) As of 25 Jan. 2011 (provisional)
96. During the period 2008-2010, most of the supplementary finance was managed not by the ICT Section (which had 18 per cent of the total at its disposal in 2010), but rather by the Regional Coordination and Communications Office (53.8 per cent), the Financial Services Section (10.9 per cent), Human Resources (10.2 per cent) and the Field Personnel Section of the Technical Cooperation Bureau (6.8 per cent). From 2011, however, the team dedicated to setting up Agresso will revert to the ICT Section and will be in charge of technical support there.
97. In conclusion: - The cost to ICAO of IT services is difficult to evaluate precisely because the IT function is scattered among ICAO’s organizational structures. However, it can be considered to have accounted in 2010 for an annual expenditure, including staff costs, of around $6.3 million (including the ICT Fund), of which $4.3 million was under the ICT Section’s control. - Although the new budget presentation, which includes only the budget of the ICT Section and the ICT Fund, could restrict the Council’s view of all IT expenditure wherever made, the External Auditor is of the opinion that, in view of the final breakdown of expenses by organizational structure observed in 2010 (80 per cent of the expenditure already made by the ICT Section) and the planned re-centralization of IT expenditure from 201111, this lack of transparency does not relate to an amount large enough to question the pertinence of the information given to the Council on the Organization’s IT expenditure.
3.3.2. Staff in charge of IT functions
98. At 31 December 2010, the ICT Section had 18 staff with ICAO contracts, including 13 P staff and 5 GS staff. They accounted for 2.5 per cent of the Organization’s staff with ICAO contracts and an annual payroll cost of CAD 2 million. This figure is 10 per cent lower than in the 2008-2010 triennium.
99. These resources are supplemented by: 11 By decision of FSMG on 24 September 2010, the regional offices should refer to the ICT Section for all ICT expenditure to encourage the standardization of software and equipment.
V-29
- Three G5 staff financed by the ICT Fund, working in the finance and human resources services to set up the IRIS management software. They will fall under the ICT Section budget from 2011; - The staff in charge of IT under the budgets of each of the regional offices; there are 8 such staff.
100. In addition, at 31 December 2010 there were 13 consultants working for the Section, representing 15.6 per cent of the consultants within the Organization.
101. The budget estimate for the outsourcing of IT services (including consultants) grew by 93.7 per cent in real terms in the 2008-2010 triennium.
Table 20: Estimated budget and expenditure related to outsourcing (In Canadian dollars)
Allotment for outsourcing Accounting expenditure in the year (including payments for obligations from the previous year)
Percentage of total accounting expenditure for the year
2008 888,950 244,710 8.4 2009 1,419,808 1,138,549 22 2010 1,722,591 668,936 a) 15.2 2011 852,314 b) unknown unknown
a) At 25 January 2010, unclosed accounts. b) Initial allotment only.
102. The outsourcing budget grew substantially over the triennium and represents a significant, though variable, part of IT expenditure, fluctuating between 8 and 22 per cent. This is probably a sign of growing stress on the ICT Section’s resources in implementing most of the Organization’s projects with an IT component without additional resources available in terms of permanent staff or any real picture of the medium-term needs of user services.
103. At the end of 2010, 41.9 per cent of staff responsible for IT were temporary consultants employed to perform ongoing functions, including the essential tasks of server and database maintenance. This could be an indicator of excessive stress on the human resources assigned to IT, since only three consultants were employed by the ICT Section at the end of 2008 and 2009, but this number had more than quadrupled by the end of 2010.
3.3.3. Organization of ICT Section
104. Despite the current centralization of IT budget appropriations in the ICT Section, the role of the Section has not been strengthened, since it is not directly responsible for all actions with an IT component financed from the regular budget or the various funds. Each bureau or regional office could therefore as in the past, still develop on its own projects with a large IT component12, maintain databases13 or even buy IT
12 For example, EDRMS (Electronic Documents and Record Management System) and IKSN (Information Knowledge System Network) are not managed by the ICT Section. 13 The FSIX (Flight Safety Information Exchange) website, for example, which is run by the Air Navigation Bureau; the USOAP database hosted on a private server under an outsourcing contract run by the same Bureau; the MANDD database for deficiencies identified in the Middle East region, managed by the Cairo office.

V-30
equipment using the budgets of programmes or the offices. These IT expenditures not made in the ICT Section would therefore not stand out as IT expenditures (corresponding to time spent by staff not classed as IT staff) or would be buried in the operational expenditures of programmes.
105. The risks inherent in this are twofold: - Firstly they affect the coherency of the projects implemented. At 31 December 2010 there were at least 48 public websites, 272 intranet sites and 146 portals, in addition to the websites and applications developed by the regional offices and technical bureaux; - They also have a potentially negative impact on the security of the information available to the different users (the IT security roadmap covers only the infrastructure of projects maintained by the ICT Section).
106. In conclusion, the centralization of budgetary responsibility for IT from 2011 still seems to be dissociated from functional responsibility for projects. A number of structural projects, as well as some projects of a more technical nature run by the Air Navigation Bureau and the Air Transport Bureau, do not fall under the explicit responsibility of the ICT Section and were not even defined in association with it.
3.3.4. Technical support
107. In addition to all the IT infrastructure maintenance and development projects, the ICT section is responsible for providing permanent technical support, primarily via a Service Desk which in 2010 responded to 8,271 service requests (by intranet or email; filtered by level of difficulty).
108. The technical support service has a manager, an assistant and two technical consultants (supported on an ad hoc basis by two technicians responsible in particular for equipment installation and server maintenance). The system, developed by ICAO in 1999, is currently being replaced by an ITIL-compatible system, Microsoft System Center Service Manager (SCSM). Performance monitoring at present consists mainly of calculating a user satisfaction ratio, which reveals little since 84 per cent of users did not answer the question asked (15 per cent said they were satisfied or very satisfied, less than 1 per cent were unhappy).
109. Furthermore, since 2008 the Section has continuously outsourced a number of services related to server maintenance (for an average annual cost of $125,000), portable equipment (average annual cost of $15,000), infrastructure expertise ($60,000) and security (external backup for $8,000 and anti-spam and anti-virus service for $15,000).
110. The reduction of its permanent staff in early 2011 to 18 staff members, 2 less than in 2009 together with a drastic increase in the number of consultants (10 more SSA contracts at the end of December 2010 compared with the 3 consultant contracts at the end of 2009) reflects significant stress on the Section’s resources, causing the ICT Section to think that all the applications for ICAO’s core activity and all of its IT systems were totally under the control of consultants, to the extent that what is at stake is not just a single weak point or staffing problem, since in fact most of the core functions are at risk in terms of keeping knowledge in-house.

V-31
Observation 5: There is still no stable, formalized view of the balance to be achieved between the functions requiring on-going in-house competencies and the functions that can be outsourced without risk or even that it would be desirable and worthwhile to outsource. This is particularly the case for all aspects of the core service support function (Service Desk).
Recommendation 5: A specialist consultancy study should be undertaken of the user support function (Service Desk), comprising a cost-benefit analysis, to gain a better understanding of the quality of service rendered to users, identify their needs and work out a better balance between in-house functions and outsourcing.
In its response to the preliminary report, ICAO indicates that “a service management specialist consultancy will be contracted to assess the ICAO user support functions and the balance between in-house functions and outsourced services, provided the necessary resources can be found”.
3.3.5. IT strategy
111. The observations on budget matters (dispersion of the IT function), human resources matters (increasing proportion of outsourcing) and organizational matters (dispersion of responsibilities according to the nature of IT projects) are largely derived from the lack of a unified overall IT strategy.
112. The ICT Section is the main entity capable of implementing IT projects. Contrary to what its name suggests, the Information and Communication Technology Section is responsible only for technical aspects (IT and telecommunications infrastructure and applications). Neither information (in the sense of information management) nor internal and external communication form part of its responsibilities.
113. Although a new vision for IT constructed around the principle of building "One ICAO-ICT" was drawn up in the second half of 2010, it is not based on the Organization-wide identification or prioritization of the specific needs of user services or on overall consideration of the volume and structure of the resources deployed to meet these needs. This confirms in practice the dispersion of IT observed in budgetary matters, particularly in terms of project management.
114. Since 2009, a process of reflection on the role and activity of the ICT Section has begun, traces of which are found in a number of the documents mentioned below. A list of strategic objectives and actions, along with a calendar, was presented to the Full Senior Management Group (FSMG) on 24 September 2010, following the provision of an increase of 2 million Canadian dollars for new projects by the ICT Section. This document recommended: - Enhancing service quality to all bureaux; - Building "One ICAO-ICT" infrastructure; - Developing an enterprise service support model; - A high-availability IT infrastructure; - An office automation process – paperless office; - Development of a series of eICAO online services: enterprise web management and strategy, information management and governance bodies, ERP post implementation support, EDRMS enterprise content management.

V-32
115. A document issued after the FSMG meeting, entitled “IT Strategy Planning”, describes an IT strategy for the 2011-2013 triennium with three main objectives: - Objective 1: Implement IT solutions that align with the ICAO business environment, policy, goals and statutory requirements; - Objective 2: Deliver and maintain a robust, flexible, secure and efficient technology portfolio; - Objective 3: Enhance the overall management of information technology and customer service delivery.
116. This strategy is also presented in a business plan and an operational plan. But these plans were drawn up without systematic user consultation, and therefore without taking account of the changing priorities of the ICT user services.
117. At the time of the audit, no stable strategic framework nor any IT master plan had been prepared with the technical bureaux that would enable the Organization to define the priorities resulting from trade-offs made by the Secretary General based on resources available, and provide an overview of the medium-term objectives for IT. The lack of any such master plan, which could be decided only at the level of the Secretary General with the involvement of all users and the ICT Section, most of the time means that the users and ICT Section run their various projects in the dark, to the detriment of any rational, controlled organization of the IT function.
118. Thus the Air Navigation Bureau is preparing a project to harmonize the safety and air navigation databases made available to external users (Safety Web project). This project, which is of strategic importance in view of the forthcoming 12th Conference on Air Navigation planned for November 2012, was not as such part of the IT strategy at the end of 2010, though the strategy does include a web management project (consolidation of all ICAO’s websites and intranet sites by the end of 2013), which overlaps it partially.
119. Consequently the ICT Section was unable to devote to the Safety Web project the resources necessary from 2011 for the complete overhaul of the internet architecture. A decision taken belatedly meant that a special dynamic website for safety issues would be set up, on top of existing structures. Consequently, for at least two years, two parallel projects will coexist, one on safety websites, the other on all the Organization’s websites, and there is at present no joint steering committee to guarantee their cohesion.
120. Moreover, the systematic lack of feasibility studies and cost-benefit analyses before launching new IT projects means that there is no guarantee that adjudication between the various demands made by the services is based on the best cost or properly assessed priorities.
Observation 6: The IT function is currently scattered across ICAO, in spite of the recent strengthening of the ICT Section’s role. This situation undoubtedly has the advantage of providing a certain degree of flexibility for the user services. It does, however, have the two-fold disadvantage of a lack of consistency in the actions undertaken and of overall mastery of the IT function at ICAO, with the result that the ITC section is consistently called on to resolve crises.
Recommendation 6: In view of the financial amounts involved (nearly 7 per cent of regular budget appropriations), the Council should request and approve a medium-term IT master plan identifying and prioritizing all IT projects, combined with a financial evaluation and an

V-33
implementation schedule. The Secretary General would have an important catalyst role to play, being the only person able to mobilize all the user services and the ICT Section and to make trade-offs when needed, between priorities and resources available.
The ICAO draft Secretariat Action Plan states that an: “IT medium-term master plan will be produced".
4. REGIONAL OFFICES
121. The purpose of the audits carried out by the External Auditor at the Regional Offices since 2008 has been to examine activity and management in terms of both "regularity" and "performance"14. The audits were carried out in accordance with the provisions set out in Articles 13.4 and 13.5 of ICAO Financial Rules, and Article 6 of Appendix B, and concerned the following offices in chronological order: - Dakar (WACAF - West and Central Africa), 13-23 May 2008. Created in 1963, this office is accredited to 24 States. - Paris (EURNAT - Europe North Atlantic), 9-17 June 2008. Created in 1947, this is the oldest of ICAO's Regional Offices. It is accredited to 56 States. - Lima (SAM - South America), 9-20 March 2009. This office was created in 1948 and is accredited to 13 States. - Bangkok (APAC - Asia-Pacific), 15-26 June 2009. Created in 1955, this office is accredited to 38 States. - Mexico City (NACC - North America Central and Caribbean), 18-28 May 2010. The regional office in Mexico City was set up in 1957. It covers a region comprising 21 States and 11 Territories. - Cairo (MID – Middle East), 14-25 June 2010. The MID regional office was created in 1953 and is accredited to 15 States, 3 of which are in Africa and 12 in Asia. - Nairobi (ESAF - East & South Africa), 11-22 October 2010. Created in 1983, the Nairobi office is the most recent of ICAO's regional offices. It covers a region comprising 22 States and 1 Territory.
122. The time-lag between the first and last regional office audits is quite long (29 months) and it must be noted that, following AGEA's proposal made during a meeting held in Paris at mid-point (20 January 20 2010) to concentrate RO audits on substantial rather than on formal issues, the terms of reference of RO audits had to be modified, and the present report is an attempt to synthesize the results of a series of audits performed on partly different bases. A general comprehensive questionnaire was addressed to all ROs by mid-2010 to ensure data consistency.
4.1. Budgetary and financial matters
123. In 2009, the regional offices accounted for 23 per cent of ICAO's regular budget (18.56 million Canadian dollars) or nearly a quarter share of the organization, apart from technical cooperation.
14 As defined in the INTOSAI Lima declaration, section 4. In particular, as regards performance audit, para. 3 refers to the "3Es" (Economy, Efficiency and Effectiveness).

V-34
124. Overall figures for budget allocation and actual spending of the regional offices are as follows:
Table 21: Budget allocation and actual spending (In thousands of Canadian dollars and percentage)
Financial period 2008 2009 2010 Triennium Bangkok
Allocated 2 772 2 862 3 556 2197 Actual use 2 627 2 517 2 832 1982 % allocated budget used 94.76% 87.94% 79.63% 86.79%
Nairobi
Allocated 2 433 2 484 3 173 1097 Actual use 2 280 2 202 3 056 545 % allocated budget used 93.69% 88.65% 96.31% 93.18%
Paris
Allocated 3 821 3 899 4 200 1930 Actual use 3 652 3 794 3 819 2274 % allocated budget used 95.57% 97.30% 90.93% 94.51
Cairo
Allocated 1 897 2 024 2 259 1185 Actual use 1 621 1 536 1 812 1972 % allocated budget used 85.46% 75.92% 80.22% 80.40
Mexico
Allocated 2 405 2 486 3 106 1004 Actual use 2 010 2 050 2 635 701 % allocated budget used 83.60% 82.49% 84.83% 83.72
Lima
Allocated 2 333 2 466 3 015 821 Actual use 2 207 2 203 2 574 990 % allocated budget used 94.62% 89.37% 85.38% 89.38
Dakar
Allocated 2 251 2 338 2 765 1360 Actual use 2 077 1 864 2 376 1322 % allocated budget used 92.28% 79.73% 85.96% 85.90
(Source: ICAO Financial Statements)
125. Although this table gives figures provided by the Finance Branch in March 2011, Mexico RO claims that its own report indicates that “92 of the 2010 budget was spent”.
126. Lima RO stresses that, to interpret correctly its percentage in 2009, account must be taken of the transition period of the Regional Director and his Deputy. Although the above figures were given to the External Auditor by the Finance Branch, the same Regional Office indicates "we are surprised at the percentage in the use of funds

V-35
shown in the chart" and refers to "an attached report taken from Agresso" which was not, in fact, attached to the comments on the External Auditor's preliminary report15.
127. In fact, the discrepancies between the figures provided by the Finance Branch and reports of regional directors are due to the fact that the latter include not only expenditures but also commitments (purchase orders, SSAs, etc.).
128. Table 21 shows that, apart from Paris and Nairobi, budget allocations for regional offices were well in excess of the amounts actually used, particularly in the case of Mexico City and Dakar. This point should no doubt be examined more closely to optimize the organization's budget resource allocation. Dakar insists on the fact that "a significant proportion of outstanding expenses planned for the period was related to new Regional Office premises to be provided by the host State, Senegal. The project commenced in 2004 but was delivered only in December 2010".
129. In the following table, the actual expenditure of regional offices charged to the regular budget is broken down into broad categories (staff costs, travel expenses, other expenditure). The figures are based on 2009 data as the final 2010 figures were unavailable at the time expenditure was broken down into the broad categories shown in the table.
Table 22: Regional office expenditure in 2009 (In thousands of Canadian dollars)
Canadian dollars thousands
Bangkok Nairobi Paris Cairo Mexico City Lima Dakar Total
Staff costs 2 179 1 665 2 882 1 616 1 970 1 929 1 798 14 038Travel expenses 136 138 190 76 117 62 143 863 Other expenditure 547 682 828 333 399 475 397 3 660
Ratio b+c/a 31% 49% 35% 25% 26% 28% 30% 32% Total 2 862 2 484 3 890 2 025 2 486 2 466 2 338 18 561
Source: Agresso
130. During the audit of the AFI Comprehensive Implementation Programme (ACIP), carried out by the External Auditor at the same time as the Nairobi office audit, and on which a report was examined by the Council on 16 March 2011, the person in charge of the AFI plan pointed out that, according to one of his management criteria, based on personal professional experience, 65 per cent could be considered an “optimal” ratio of missions to staff costs and other expenditures within the context of regional coordination activities, in that it was considered to reflect an 85 per cent rate for occupation of the management team and technical officers in a region. Based on the figures in the table, the average ratio is only 32 per cent which is well below the criterion mentioned above.
131. The External Auditor is, however, unable to confirm objectively whether the 65 per cent ratio, determined empirically within the context of ACIP and which cannot therefore constitute an auditable standard, is based on objective criteria and can be transposed to all the regional offices. Moreover, in ICAO's general comments on the External Auditor's preliminary report, Dakar insists on the fact that "ACIP was a programme addressing safety,
15 In its comment on the preliminary report, the Lima Regional Office also heavily insists on mentioning that the 2010 figures include an early 2010 CAD 270,000 assignment "which HQ failed to inform [the Regional Office] about". Although this clear criticism of HQ addressed to the External Auditor by a Regional Office maybe interesting in itself, it must be remembered that, when auditing Regional Offices, the Auditor's aim was not to be a "referee" in internal battles between Regional Offices and HQ, but to base his judgment solely on the overall performance of the organization.

V-36
with a specific mandate for a defined period. The same context may not fit the Regional Offices (Nairobi/Dakar) in which it has been integrated since January 2011". Consequently, the relatively low ratio observed above can only be regarded as a possible indicator of suboptimal use of the human and budgetary resources allocated to the regional offices.
132. During his last three assignments, however, in Mexico City, Cairo and Nairobi, the External Auditor raised this point systematically with each Director, Deputy Director and technical officer, from which it emerged that a 65 per cent ratio was, indeed, considered desirable in practice. Dakar underlines that "this may have been the case at the time, but might need to be reconsidered in view of changing annual/triennial priorities and strategies (e.g. introduction of ICAO Coordinated Validation Missions (ICVMs) in the 2011/2013 triennium, integration of AFI Plan in WACAF/ESAF offices, more role the Regional Offices in TCB activities, etc."
133. More importantly, however, another approach emerged from these discussions. It relates to “State missions”, that is to say missions aimed at discussing various matters with the national authorities of the region relating to the application of annexes and SARPs: - First, according to article 2.10.2.1 of the Regional Office Manual, each regional office should carry out an annual State mission to each State in the region. Although this article of ROM is no longer in force, it gives an idea of the target set by ICAO ; - Second, most technical officers interviewed replied, when asked explicitly, that in their specialist field, an average of one State mission per triennium to each State in the region seemed a professionally reasonable target. The specialist fields represented at the offices are Air Traffic Management (ATM), Flight Safety (FS), Communications and Navigation Systems (CNS), Airports and Ground Aids (AGA), Aviation Security (AVSEC), Meteorology (MET) and Technical Cooperation (TC)16. The following table shows optimal and actual figures based on these fields and data available for 2009, and assuming an “optimal” value of one mission per specialist field, per triennium, to each State in the region.
Table 23: “Optimal” and actual number of State missions per year (2009) APAC ESAF EURNAT MID NACC SAM WACAF Total A. Number of specialist fields 7 7 4 4 5 4 6 B. Number of States and Territories in the region 38 23 56 15 32 13 24 201
C. Optimal number of State missions per year = (AxB)/3 89 54 75 25 53 17 48 361
D Actual number of State missions in 2009 11 12 16 5 10 17 7 78
% of missions compared with the “optimal” number 12% 22% 21% 14% 19% 100% 17% 21%
134. In ICAO's comments, Paris RO "considers this table as misleading: the rationale linking the so-called "specialist fields" with the number of annual visits (State missions) is flawed and irrelevant. The visits/missions are planned and performed based on specific needs/objectives identified through various mechanisms (requests from States, identified safety deficiencies)". Yet, Paris RO does not propose any alternative approach to devising a basic indicator for the optimal and actual number of State missions.
16 Paris RO indicates that these technical fields do not "reflect the situation in Paris Office, where most of the job descriptions are defined as Air Navigation Services Implementation (ANS-IMP), which covers more than one specialization, although one can be predominant (e.g. ATM, CNS, MET, etc.)."

V-37
135. In the same response, Dakar RO comments, about the seven missions in 2009, “it should be noted some State missions are multidisciplinary, involving more than one expert or technical field, and could hence be viewed as multiple missions”, without proposing any form of calculations.
136. Under the earlier target set by ICAO (Art. 2.10.2.1 of the Regional Office Manual, no longer valid), the offices should, overall, make 201 visits per year (one annual visit per State/Territory to which ROs are accredited). Using theoretical “optimal” (one annual visit per specialist field per State/Territory), the total increases to 361. In reality, subject to the above-mentioned comments, they make 78 visits per year.
137. Mexico RO notes that “Territories have a lower priority than States for ICAO RO missions, and are therefore rarely visited. They should therefore not be considered in the analysis for the North American and Caribbean Region and number would drop to 20 from 32.
138. Based on the same table, the difference between the “optimal” value or Regional Office Manual standard value and reality (except for Lima in 2009) is so great that it raises doubts as to whether the theoretical target of one State visit every three years, for each specialist field represented at the office and for each State in the region is realistic. It raises the same doubts concerning the standard value given in the Regional Office Manual which, in fact, does not specify which technical areas should be given priority during these missions. This is confirmed, in the case of Cairo, by a remark from MID office included in ICAO's comments on the preliminary report: "Please note that the optimal number of missions that are required from the MID Office per year is not reasonable. To achieve this figure, each one of our Regional Officers will have to conduct approximately two missions per month. In real life, this is not possible, as it does not take into account the meetings/workshops/seminars that are conducted yearly. It also gives no time for the Officers to cater to the day-to-day technical needs that have to be undertaken in the Office. And in addition, it means that the Officers cannot take annual leave, sick leave, or any other kind of time off.”
139. While the suggested quantitative approach per technical area may seem rational, several qualitative considerations should definitely be factored in. Although they are not covered in the Regional Office Manual they should be appraised by ANB, ATB and TCB as set out below: - Some priority should be given in each region to States with the greatest need for ICAO assistance, based on objective data from USOAP audits, regional deficiencies databases, available gap analyses, etc.; - Priority should also be given to one or another particular specialist field at each office, according to regional requirements and based on the same data; - In some cases, allowance should be made for the possibility of merging several State visits into a single mission.
140. The External Auditor observed that Regional Directors did, in practice, consider these issues with varying degrees of pragmatism when planning missions for themselves or their teams. Nevertheless, the very approximate figures given above would seem to confirm that inadequate resources are devoted to missions in general and State missions in particular. That being the case, a more systematic and documented approach should be recommended to assign precise, measurable quantitative targets to Regional Directors, clearly equating the objectives to the financial and human resources required to achieve them, for what is the purpose of a team of technical officers if they are not given the means to put their

V-38
professional skills to work? Unfortunately, without pointing any fingers, the External Auditor did observe some local situations where this was the case.
141. However, the External Auditor wishes to consider a remark, in ICAO’s general comment on the preliminary report, made by the Paris RO, to the effect that “it looks like the Auditor failed to understand that travel expenses budget covers several types of travels/missions other than the so-called Country missions. In the case of the Paris Office, these other missions count for most of the travel budget.” The Paris remark is correct in that, in general observation N° 7 below, the External Auditor has widened the scope to all travel and missions, whatever their purpose: but Paris sidesteps the question that arises from the overall figures, which is, based on the foregoing, whether the total number of technical officers in the ROs and the volume of budgetary resources available for travel and missions in general match up. The present report merely reiterates a question that was raised in the same terms by a number of technical officers and some deputy directors during the interviews held by the External Auditor during the 2010 period (i.e., as mentioned in the introduction to the present section, after the terms of reference of RO audits where modified following the meeting held on 20 January 2010 in Paris with AGEA). The Paris RO’s criticism concerning the “failure to understand what the travel expenses budget covers” should clearly to be directed not at the External Auditor, but at their colleagues in the ROs that were audited during 2010.
Observation 7: Following a series of discussions with Regional Directors, Deputy Directors and technical officers, the External Auditor observed that two approaches could be adopted to achieve a better balance between the specialized staff assigned to regional offices and the resources available to them, thus allowing States in the region to make full use of their skills:
- The relative share of total resources allocated to missions and travel;
- The number of State visits made to each State in each region, for each specialist field.
The resulting raw data, which do not, however, take into account of significant qualitative factors, would indicate some adjustment is called for between available staff and the resources assigned for the performance of their duties.
Recommendation 7: The External Auditor suggests that the Council should request the Secretary General to examine these two approaches further in order to define, justify and validate quantitative targets in terms of budgetary resources, technical staff and number of missions (particularly country missions, per specialist field and per region) to be set for Regional Directors, having first matched targets to available resources. If necessary, the Regional Office Manual should be amended accordingly.
The draft Secretariat Action Plan accepts this recommendation.
142. With these resources, the regional offices fulfil two main functions: - An ICAO regional representation role: Regional Office Directors represent the Secretary General, and more broadly, ICAO, in the countries to which they are accredited and at the various international organizations present in the regions concerned. They report directly to the Secretary General. They all have a deputy. - A technical role: Technical officers at the regional offices report to the Regional Directors and their deputies but coordinate mostly with ANB (for safety and air navigation matters relating to regional navigation plans), more occasionally with ATB (for security,

V-39
environment and air transport matters) or more rarely (once), with TCB (for matters pertaining to technical cooperation). Within this context, they act as intermediaries between headquarters and various regional public or private air navigation and air transport entities involved, through individual or collective contacts. In the latter case, they play a vital role in promoting air navigation Planning and Implementation Regional Groups (PIRGs).
143. The above short description of the role of ROs is the result of discussions with several regional directors and their deputies. It also corresponds to the action on this subject by the Regional Coordination and Communications Office to the External Auditor at a meeting held in Montreal on 27 January 2011. So the External Auditor can only share with these experts the following criticism made by Paris RO, in the response to the preliminary report: “this paragraph [i.e. para. 143] reveals a significant lack of understanding regarding the role and functions of the Regional Offices”. One can only regret that the Paris Regional Director does not offer any alternative whatsoever, which would certainly be of great help in enlightening his colleagues, headquarters, and thus the whole organization and its External Auditor.
144. In its response to the External Auditor’s preliminary report, ICAO stresses the fact that the role of the regional offices is evolving significantly. This includes the increased involvement of the Regional Offices in the field of aviation safety (in particular the creation of Regional Aviation Safety Groups), the Continuous Monitoring Approach (CMA) process, security, sustainability and technical cooperation. This is taking place in a context where emphasis is put on ensuring a consistent response from ICAO no matter whether the response is provided by HQ or a Regional Office. This evolution of the role of the Regional Office has an impact on the responsibility of the Regional Directors and on the tasks undertaken by the regional technical officers. The Regional Director job description has been amended recently and reflects some of the changes”.
145. Secretaries working as assistants are assigned to Regional Directors, their deputies and technical officers. A secretary-assistant would usually serve several technical officers. The Regional Offices also have the necessary staff working with the headquarters finance department (budget and accounting) and ADB (human resources and IT). In all, the Regional Offices employed 165 staff as at the end of 2010 (or 149, excluding ECAC staff).
146. At headquarters, the head of the Regional Coordination and Communications Office assists the Secretary General in monitoring Regional Office activity. As this position has almost no operational component vis-à-vis regional office activity, the External Auditor did not examine this function as part of the Regional Office audit.
147. The audit of Regional Office activity focused on:
- The Regional Directors' role: representation, management and leadership; - The role of Regional Office technical officers; - The administrative support function at Regional Offices.
148. The audit also provided an opportunity to observe the activity of certain PIRGs, led by Regional Offices, as a result of which the External Auditor made some observations concerning the regional deficiencies database that PIRGs are supposed to monitor and update.

V-40
4.2. Role of Regional Directors
149. Regional Directors have a representative function that they generally perform directly, as well as office management and coordination functions that they share to a varying extent with their deputies.
150. As part of their representative function, Regional Directors contact and take part in meetings with State authorities, international organizations and representative service provider associations involved in civil aviation active in the regions. Two full Senior Management Group (FSMG) meetings are planned annually at headquarters which they also attend. Notes on these activities are produced with the exception of FSMG which is held at HQ and attended by all senior staff, during which a report is produced and decisions are taken.
151. This representative function can be measured in quantitative terms through the Regional Directors' actual travel expenses. The following figures differ slightly from those given in table 22 above, as they do not include travel expenses charged to the headquarters' budget:
Table 24: Regional Directors' actual travel expenses in 2009 (In Canadian dollars)
Office State missions
Of which Director %
Other missions and
meetings
Of which Director %
Total travel
expenses Of which Director %
Bangkok 130 607 37 794 29% 31 928 0 0% 162 535 37 794 23% Nairobi 114 515 61 195 53% 65 842 5 627 9% 180 357 66 822 37% Paris 162 814 47 005 29% 74 109 2 174 3% 236 923 49 179 21% Cairo 32 368 25 060 77% 17 932 2 687 15% 50 300 27 747 55% Mexico 75 504 45 713 61% 48 602 23 996 49% 124 107 69 708 56% Lima 63 226 11 741 19% 45 749 0 0% 108 975 11 741 11%a) Dakar 104 101 47 495 46% 33 499 2 502 7% 137 600 49 998 36% Total 683 136 276 003 40% 317 661 36 995 12% 1 00 796 312 988 31%
a) Following the departure of the Director of the Lima Regional Office in 2009, the post was left vacant for a period before a new Regional Director was appointed. Neither Regional Director had much occasion to travel during the period preceding and following the new appointment. Source: Agresso
152. The table above shows that Regional Directors used more than 40 per cent of budgetary resources devoted to State missions, with significant differences from one Director to another (ranging from 19 per cent in Lima to 77 per cent in Cairo).
153. In the response to the External Auditor’s preliminary report, Cairo makes the following remark: Missions are undertaken by the Regional Office, staff including the Regional Director, for the following purposes: a) To conduct State missions to discuss regional matters of mutual interest in air navigation, air transport, technical cooperation and other fields of concern to ICAO with official government services; b) To service regional ICAO meetings which are not held in the Regional Office; c) To attend meetings of international organizations on regional issues which are not held in the Regional Office;

V-41
d) To conduct State Missions when requested by headquarters to establish official government contacts; e) To attend meetings which are not held in the Regional Office at the request of headquarters; Please refer to Regional Offices Manual dated 5 March 2010, para.1.6.11. As can be seen, the travel is missions and not State missions which is purely for a visit to State(s)”.
154. To the extent that he understands the scope of this remark, the External Auditor: a) Admits, of course, that there is no clear line between “missions” and “travel expenses”, but recalls that the data in the above table were provided by ICAO under these two separate headings. If there is a problem of definition, it is for ICAO to solve. The External Auditor can base his analysis only on the data and definitions provided for by the organization itself; b) Recalls that the point relates not to the content of travels and/or missions, but rather the proportion of the budget for missions and travel of Regional Offices used by the Regional Directors – Cairo’s remark does not address that point.
155. In all cases, a significant share of State mission expenses was actually taken up by the Directors' two annual trips to headquarters to attend FSMG meetings. In Cairo, for example, this represented a cost of $16 218, or roughly half the total State mission expenditure for the Office.
156. In its response to the External Auditor’s preliminary report, ICAO underlines that “State missions cannot be considered in isolation, as they are only one of the tools that the organization is using to assess the level of implementation of SARPs and Regional Air Navigation Plans in States and to support their implementation. We are moving toward a system whereby visits to States, whether for State missions, ICVM, audit or any other purpose and whether they are conducted by the Regional Office or HQ, are: - Planned based on a risk-and-needs model, and not on a fixed pattern; - Prepared and coordinated to maximize benefits including the fact that the ICAO officer undertaking the visit may be asked to undertake tasks beyond his or her field of activity. This arrangement guarantees that ICAO resources are deployed where they are the most needed and in the most efficient way”.
157. During the Regional Offices audit, and throughout the systematic interviews with technical officers and final discussions with Regional Directors and Deputy Directors, the picture appeared less idyllic – the general impression resulting from these interviews is that in some cases the interlocutors felt that coverage of regional needs was insufficient, and no evidence was produced that, with the same level of resources, it could not be significantly improved. The most frequently raised question was that of the need to balance fairly the overall travel and mission budget in general and more specifically resources for State missions, between Regional Directors and technical Officers.
158. The External Auditor tried, in several cases, to get qualitative information on this question through the various mission reports available, but this approach was not conclusive. That is why the External Auditor finally focused his analysis on a purely quantitative approach, recognizing its limitations.
159. Apart from travel and missions, the breakdown of tasks between the Regional Director and his Deputy varies considerably. For example, a comparison of just the last three offices audited shows that in one case the Regional Director fulfilled the

V-42
representation function as well as the management of technical and administrative teams, leaving the Deputy on the sidelines. In another office, the Regional Director was frequently away on business, so the Deputy took charge of day-to-day management of technical officers and administrative staff. In the last case, the Deputy was, in fact, a promoted technical officer who continued for the most part working in his specialist field.
Observation 8: The role and activity of Regional Directors and their Deputies vary considerably from one office to another. As regional offices are lightweight organizations (each office employs a staff of 20 or so), the personal profile of each Regional Director will inevitably have a strong impact on how Regional Offices work. Nevertheless, this impact is definitely excessive at present. In particular, the balance between the budgetary resources used by the Regional Director and by the technical officers is at times skewed in one direction or the other.
Recommendation 8: Following on from the previous recommendation, the Council should request the Secretary General to propose concrete steps to standardize the activity of Regional Directors, above and beyond the theoretical standards defined in the Regional Office Manual, taking into account their personal profiles, but giving greater consideration to specific regional requirements, in particular, by defining standards in each region for distributing budgetary resources between management and technical officers and State missions by technical field.
The draft Secretariat Action Plan accepts this recommendation and indicates that “the job description for Regional Director has been amended recently and reflects some of the changes”. It adds “ICAO will review the evolving role of the Regional Offices and the responsibilities and accountabilities of the Regional Directors. This includes the clarification of their role in assessing deficiencies in the regions (infrastructure, ATM and compliance with SARPS) and in working with States for their resolution"
4.3. Role of technical officers
160. The External Auditor familiarized himself with various Council activities, in particular those arising from the decision of 23 October 2009 to carry out a Working Group on Efficiency (WGOE) organizational review of ICAO's Regional Programme, for which a working paper (C-WP/13403) was issued on 27 August 2009. He also looked at more recent work on the Regional Programme and Regional Offices (C-WP/13403 and C-WP/13664). These documents systematically review the technical action undertaken with respect to old and new strategic objectives. The External Auditor therefore considered that he should not examine the implementation of ICAO's Regional Programme, but rather focus instead on the day-to-day activity of technical officers at Regional Offices. The following table provided by headquarters and corrected by Paris (it appeared the initial figures given by headquarters on Regional Office staff, and reproduced in the External Auditor’s preliminary report, wrongly included ECAC staff in the EUR/NAT Regional Office 17 ) shows the distribution of technical officers among the seven regional offices:
17 Again, the critical note for the Paris Regional Director should be redirected to headquarters, which provided the original figures, in the official response to External Auditor’s questionnaire about Regional Office staff: “the Auditor

V-43
Table 25: Distribution of technical officers among the 7 regional offices (As at 30 June 2010)
As at 30 June 2010
APAC ESAF EUR/NAT MID NACC SAM WACAF ACIP TOTAL
ATM 1 2 4 2 2 2 2 0 15 FS 1 1 1 1 1 0 2 0 7 CNS 2 1 0 1 1 1 1 0 7 AGA 1 1 0 1 1 1 0 1 6 AVSEC 1 1 1 0 1 0 1 0 5 MET 1 0 1 0 0 1 1 0 4 Transport 0 0 0 0 0 0 1 0 1 TC 0 1 0 0 0 0 0 0 1 Admin. 1 1 1 1 1 1 1 0 7 TOTAL 8 8 8 6 7 6 9 1 53 TOTAL RO 22 19 25 18 20 20 22 3 149
161. The table giving the distribution by specialist field of the 46 technical officers at the regional offices clearly shows that air navigation (and more especially air traffic management) is the primary technical specialist field in the regional offices. At the other extreme, meteorology, air transport and technical cooperation are not represented in all offices. Between these two extremes, safety is represented in five out of seven offices.
162. The External Auditor interviewed each of the technical officers in Mexico City, Cairo and Nairobi, leading to the following observation and recommendation:
Observation 9: The geographical logic behind the presence or absence of technical officers in certain specialist areas of air transport and technical cooperation is not clear, not even to those directly concerned. In some cases, the work schedule and actual activity of some technical officers are not clear.
Recommendation 9: It is not for the External Auditor to judge individual local situations. Nevertheless, it does seem that the activity of each technical officer present should undergo a systematic critical review by the regional programme managers and/or internal audit so that the necessary adjustments may be made.
The draft Secretariat Action Plan accepts this recommendation and adds that ICAO will “review the role and responsibilities of the regional technical officers to ensure that they remain in line with the evolving responsibilities of the Regional Offices".
4.4. Role of administrative services
163. The administrative services represent a relatively large proportion of the total regional office staff and therefore also of the budget. Over all, out of a total regional office
failed to understand the specific arrangements in Paris and wrongly included the ECAC staff in the census. ECAC staff, although employed under ICAO staff rules, are not ICAO employees, they have a separate and independent budget under no ICAO control”. Again, the External Auditor did not “include” anything in the figures on Regional Office staff provided by headquarters.

V-44
staff of 165, nearly 90 employees are assigned to administrative services, the rest being made up of directors, their deputies and the technical officers/assistants, which means that the ratio is slightly higher than one administrative staff for each operational staff.
164. It is difficult to determine whether this ratio is currently at a suitable level, based on the actual local situations observed. Considering the example of the last three regional offices audited, where ratios were comparable, the administrative services fulfilled their functions correctly in two cases (Mexico City and Cairo), while in the third case deficiencies were evident (Nairobi)18.
165. During the last regional office audits (Mexico, Cairo and Nairobi), the Agresso software was still not operational locally, and the end of June 2010 deadline was not met19. Consequently, this matter cannot be reviewed until the next audits.
Observation 10: The critical mass of regional offices seems to be the chief problem in terms of administrative support. With a staff of 20 or so per office (Paris apart), it is hard to envisage any significant drop in the administrative-to-operational staff ratio.
Recommendation 10: Given current ICAO resources and future trends, this probably means that, from a strictly management perspective and thus regardless of any question of geographical coverage, there can be no more than seven regional offices.
ICAO’s draft Secretariat Action Plan states: “the number of Regional Offices is established to meet the needs of States accredited thereto. The needs of States constantly evolve and ICAO must have the flexibility to respond appropriately”.
The External Auditor is aware that the needs evolve constantly: his remark was aimed only at underlining that, insofar the size of the present seven Regional Offices will not permit them to improve the support/operational activities ratio (a volume of 20 to 25 persons being well under the necessary “critical mass”), from a strictly management perspective, the number of 7 to cover the planet is excessive rather than insufficient – if the needs increase, this means that it would be better to increase the size of the existing Regional Offices rather than increase the number of undersized offices.
This pure management remark does not take into account, of course, any political considerations about the localization of Regional Offices, (but this point is not mentioned in the response given in draft Secretariat Action Plan).
4.5. Observations relating to Planning and Implementation Regional Groups (PIRGs)
166. Air navigation Planning and Implementation Regional Groups (PIRGs) are established by ICAO Council decisions and are not separate legal entities. Their main purpose is to prepare and update, as necessary, regional air navigation plans and
18 It is true that the special circumstances in the ESAF office put it at a disadvantage: the post of administrative officer, which had been vacant for a long period, was then filled by an officer hired on the basis of fake diplomas, whose contract had to be terminated following the audit. The situation should improve when a new officer is hired. 19 On this matter, the response to the External Auditor’s preliminary report contains the following remark from Dakar: “the training of Regional Office staff was conducted at HQ in May/June 2010 and the system was implemented and became operational [in Dakar] from July 2010.”

V-45
detect and rectify any shortcomings relating to air navigation. Their reports are presented to the Air Navigation Commission and, on request, to the Council. The terms of reference of PIRGs are reviewed and adopted by the Council (C-DEC 183/9 of 27 June 2008).
4.5.1. Accreditation and participation in PIRGs
167. All ICAO Contracting States which are air navigation service providers in a region and part of that region's air navigation plan have the right to be members of that region's PIRG. Furthermore, user States are entitled to participate in the meetings of another PIRG, but not as members. International organizations recognized by the Council may be invited as necessary to attend PIRG meetings as observers.
168. ICAO Member States have now formed six regional groups on this general basis. The secretariat and leadership functions of these groups are, for the most part, provided by ICAO's seven regional offices. The following table illustrates their geographical distribution:
Table 26: PIRGs and ROs PIRG RO(s) concerned
EANPG – European Air Navigation Planning Group EURNAT NAT-SPG – North Atlantic Safety Planning Group GREPECAS – Caribbean and South America Planning and Implementation Regional Group
NACC SAM
MIDANPIRG – Middle East Navigation Planning and Implementation Regional Group MID
APIRG – African Implementation and Planning Regional Group ESAF WACAF
APANPIRG – Asia and Pacific Navigation Implementation and Planning Regional Group APAC (Source: ICAO)
4.5.2. Observations relating to certain regional deficiency databases
169. On 30 November 2001, the ICAO Council agreed to a “uniform methodology” for the identification, assessment and follow-up of air navigation deficiencies.
170. Users' organizations (such as IATA or IFALPA) regularly report deficiencies observed by their members to the ICAO Regional Offices. Technical officers then verify the reported deficiencies, which means that it is up to the Regional Offices to determine whether a deficiency is covered or not in the regional navigation plan, the recommendations set out in the annexes and/or SARPs.
171. The regional offices must inform the States concerned that the reported deficiencies have been entered in a database and must be corrected. The States are supposed to confirm the recognized deficiencies and set up corrective action plans (CAPs).
172. Within this general framework, the External Auditor verified whether PIRG deficiency databases actually existed and, if so, how effective follow-up is. Mexico City/Lima
173. An online database called GANDD (i.e. the GREPECAS Air Navigation Deficiencies
Database) keeps track of the situation in the various States to monitor compliance with standards (annexes and practices documents).

V-46
174. Examination of this database shows that, unlike the observations of the USOAP centralized procedure, based on a high-level audit of State compliance with civil aviation obligations, the GANDD deficiency lists are very specific and more concerned with the activity of service providers and other parties involved: poor equipment performance at airports, unsuitable communication procedures, incorrect equipment maintenance, or failure to comply with procedures. Despite this fundamentally different approach, Mexico City technical officers observe that the lack of a link between the USOAP audit findings and GANDD deficiencies is sometimes hard to explain to national authorities in the region. According to some officers, the ongoing development of a continuous monitoring approach (CMA) should provide an opportunity to solve the problem, as it would involve closer cooperation between specialist teams at the Regional Office and auditors at headquarters.
Cairo
175. MIDANPIRG administers the online MIDANPIRG Air Navigation Deficiencies
Database (MANDD). The inputs to this database are provided chiefly by airlines (through IATA) and pilots (through IFALPA).
176. The Cairo database included, as at 23 June 2010, a total of 228 deficiencies for the 14 MIDANPIRG members. It contained 81 deficiencies in the “urgent” deficiencies category alone, including 4 that date from 1995, which would seem to indicate that it is more a “claims file”, rather than a follow-up and audit tool. Finally, as for the nature of the deficiencies, a third concern ATM, a quarter concern aerodromes, a quarter AIS and the remainder (16 per cent mainly involve aeronautical telecommunications, meteorology being marginal (2 per cent).
177. MANDD is accessible online, and since 2009, MIDANPIRG Member States, as well as four third-party users (Eurocontrol, IATA, IFALPA and Jeppesen) have been authorized to input directly the deficiencies they have observed. The database has retrieved all the deficiencies previously recorded manually. In practice, taking into account that the online request procedure is relatively recent, technical officers in the Cairo Office continue to enter deficiencies, generally based on requests expressed orally by IFALPA or IATA, after consulting the States concerned to ensure that the deficiencies have been validated.
178. As at 23 June 2010, MANDD deficiencies were distributed among the countries in the region as follows:
Table 27: Number of deficiencies by MIDANPIRG country as at 23 June 2010 Country Total deficiencies Including “Urgent”
Israel 35 17 Iraq 29 12 Syria 26 9 Egypt 20 8 Jordan 16 6 Yemen 18 5 Iran 12 4 Kuwait 10 4 Lebanon 13 4

V-47
Oman 12 3 Qatar 10 3 United Arab Emirates 9 3 Saudi Arabia 14 2 Bahrain 4 1 TOTAL 228 81 (Source: ICAO)
179. According to the technical officers consulted by the External Auditor, the above table in no way reflects the level of compliance of the States in the region with the standards in question. The procedure followed (registration of the request by a technical officer, discussion by MIDANPIRG sub-groups according to the nature of the deficiency involved, validation of a deficiency in plenary session of MIDANPIRG, sending of a letter to notify the State concerned and to ask what corrective action it plans to take) is considered purely administrative and is not based on an audit. However, these deficiencies are sometimes validated on the occasion of missions to States.
180. Accordingly, the number of deficiencies reported for a given country for the most part reflects the number of requests received from airlines or pilots, which depends on a wide range of factors (traffic volume, reporting culture of the pilots and airlines using the air infrastructure in the countries concerned, etc.). When putting the question to some technical officers in Cairo, the External Auditor was told that the regional office simply keeps the “claims file” and does not perform any independent audit on the spot or have such an audit performed. Nevertheless, ICAO's response to the External Auditor’s preliminary report, states that this answer "is not correct, we receive for example many reports from IFALPA, and only a small number are validated by the regional office as a deficiency pending further approval by MIDANPIRG sub-groups".
181. Some countries with the greatest number of deficiencies in the database recorded, take part in MIDANPIRG discussions and those of its sub-groups only rarely. Since this is only a matter of entering claims, it was agreed to consider their non-participation as an acknowledgement or confirmation of deficiencies. This illustrates the drawback mentioned earlier, namely that the map of PIRG Member States does not coincide with that of the regional office accreditations to these Member States. This is particularly the case for Israel, which, at the time of the audit (June 2010) was accredited to EURNAT and listed in the MID ANP and thus was a member of MIDANPIRG, but was transferred to the European ANP on 13 January 2011, and then became member of EANPG. It will be interesting to see whether the transfer has an effect on the relative number of deficiencies related to that country.
Nairobi/Dakar
182. APIRG was created in 1980. Its functions include identifying various air navigation
problems and putting forward solutions. 183. The APIRG database, which theoretically receives most of its input from pilots, does
not actually exist in Nairobi or Dakar. Some deficiencies are currently identified from declarations made by States in response to a questionnaire. At the time of the audit,

V-48
51 out of the 53 States in the AFI region declared no deficiencies, which seems surprising from the statistical viewpoint given the number of deficiencies reported in the MANDD and GANDD databases. In ICAO's response to the External Auditor’s preliminary report, the Nairobi Regional Office points out that "APIRG maintains a list of deficiencies manually which is revised from time to time", and states that, at its 17th meeting, APIRG adopted a decision to develop the AFI web-based Air Navigation Deficiency Database, which is implemented with the support of the Cairo Office.
184. Some APIRG sub-groups do, however, follow up certain deficiencies reported in a given technical sector; particularly air traffic management (ATM). A comparison of the progress made in implementing the conclusions and decisions 16th (November 2007) and 17th (August 2010) of the APIRG ATM sub-group meetings shows progress in 17 out of a total of 69 items (i.e. 24 per cent).
Bangkok
185. In accordance with APANPIRG rules, the Bangkok office keeps a regional deficiency
database and has introduced information and follow-up procedures as defined in the uniform methodology.
186. This database was not examined during the audit of the Asia Pacific office.
Observation 11: The External Auditor notes that there is no database in Nairobi/Dakar to provide systematic and reliable records of deficiencies. He also questions the effectiveness of the incident-reporting system set up in the AFI region in view of the low deficiency rate reported and the obvious lack of effective follow-up. The online databases set up in Mexico City/Lima, Cairo and Paris are a step forward and should be extended to Nairobi, Dakar and Bangkok. The coexistence of two software applications (two online deficiency reporting systems have been developed locally, one by Mexico/Lima and the other by Cairo/Paris) is certainly not the ideal solution. This point was mentioned earlier in the observations on IT management at ICAO.
Recommendation 11: Care should be taken to implement the uniform methodology effectively, by upgrading all practices - especially in the APIRG region - and extending the maintenance of online databases with new improved procedures. In ICAO's response to the External Auditor's preliminary report, the Lima Regional Office notes that the "GANDD database will also need to be upgraded to introduce the new deficiency methodology”.
In its draft Secretariat Action Plan, ICAO states that it fully agrees with the need to collect information on regional air navigation deficiencies in a more comprehensive and consistent way and to ensure that they are used in a systematic way to assess safety risk and to correct deficiencies and specifies what actions it intends to take in that domain, including interoperability of the regional databases.

V-49
5. TECHNICAL COOPERATION
5.1. Scope of the audit
187. An initial audit of ICAO’s Technical Cooperation Bureau (TCB) was performed at the Organization’s headquarters in March and April 2009. The purpose of this initial assignment was to study possible risk factors arising from the organization and function of this office. Following discussions with the Secretariat, the audit conclusions were presented to the Council, which adopted its main conclusions and recommendations on 6 November 2009.
188. The purpose of the present audit, carried out in Montreal from 15 to 26 November 2010, is to examine a sample of current technical cooperation projects to identify possible difficulties specific to current projects and, as appropriate, make general recommendations concerning TCB management tools and methods.
189. In the context of the audit, the External Auditor considered that it was not his responsibility to question the basis generally offered for ICAO's technical cooperation activity, which derives from a broad interpretation of article 44 of the Chicago Convention, which states, “The aims and objectives of the Organization are […] to foster […] development of international air transport […].” While this very general objective does not specifically include technical cooperation, the External Auditor notes that it does not exclude it either and that on various occasions and particularly by Resolution A36-17, which “reaffirmed that the Technical Co-operation Programme, observing the rules, regulations and procedures of ICAO is a permanent priority activity of ICAO,” most members of the General Assembly accept that ICAO should be involved in this activity, with the sole reservation that it be financed with overhead fees from beneficiary States and/or third-party donors. More recently, the Auditor notes that on 4 October 2010 the Executive Committee expressed the considered view that the Technical Co-operation Programme was one of the pillars of the Organization in providing support to States in the implementation of their civil aviation infrastructures […]. It was therefore generally acknowledged that the TCB should continue to be an integral part of the Organization.”
5.2. Selection criteria for the projects to be audited
190. As a guide for selecting the project sample for analysis, the External Auditor pragmatically classified the activities conducted by ICAO as part of the technical cooperation effort through TCB into five areas, namely, banker, authorized purchaser, consultancy, training provider and temporary employment agency.
191. In almost all projects, ICAO plays a banking role, in that, before committing any expense to a given project, TCB must receive funds from States using its services in the amount of the commitments made20. Following project launch, with the issue of an initial purchase order (PO), TCB then debits the deposit of the State concerned to pay experts, suppliers and service providers (including payment of ICAO overhead fees to the Administrative and Operational Services Cost (AOSC) Fund). The only exception
20 ICAO Procurement Code, art. 8-3: “Contracts or purchase orders shall not be issued to suppliers without the prior certification of the availability of funds by FIN through the ICAO financial system.”

V-50
to this role of banker concerns a limited number of projects for which the partner State elects to pay the suppliers and service providers selected by TCB on its behalf directly, paying TCB only the overhead fees due to ICAO.
192. TCB acts as authorized purchaser for States that have chosen to authorize ICAO to represent them in preparing and executing various public purchases of civil aviation equipment and services . This authorization may take, with regard to a State, the form of a general Civil Aviation Purchasing Service (CAPS) agreement, but may also be granted to ICAO as part of a Management Service Agreement (MSA). Projects of this type that were reviewed included PHI/08/701 (purchase of an instrument landing system for the Philippines), PER/08/802 (purchase of radars for Peru), ETH/04/701 (purchase of radars for Ethiopia); and COS/06/803 (purchase of master plan and feasibility study for 24 airports in Costa Rica).
193. TCB's role is that of a consultancy firm when it provides, under MSAs, technical expertise for construction (construction control) or the design and installation of national administrative structures for civil aviation. The file examined for this purpose was Project PAN/03/902 (construction control assistance for waste water disposal at Tocumen airport).
194. Also within the MSA framework, TCB may play a training role by organizing various training programmes adapted to the specific requirements of certain States. A project of this type was chosen for the audit sample, namely BRA/01/801 (MSA covered, among other things, various training operations for employees of the Brazilian national civil aviation agency).
195. Finally, in a more limited number of cases, TCB acts as a temporary employment agency, since some projects make ICAO responsible for hiring and paying national staff selected by States to work with the national civil aviation administration. Project BRA/01/801 mentioned above also includes temporary employment of national staff, as do Projects BOL/09/801 for Bolivia and PER/07/801 for Peru, also part of the audit sample.
5.3. Projects audited
196. In total, the sample analysed by the External Auditor included the following 10 projects:
BRA/01/801 PAN/03/902 ETH/04/701
VEN/04/801, 04/806 and 05/801 COS/06/803
PER/07/801 and 08/802 BOL/09/801

V-51
5.4. General observations arising from review of project selected
5.4.1. Ambiguities in ICAO's role as "authorized purchaser"
197. In its role as authorized purchaser of civil aviation equipment and services, TCB's specific contribution lies in its professional skill at defining technical and commercial conditions for tender solicitation with suppliers of technically sophisticated equipment and services to be delivered to States, within the framework of transparent and rigorously controlled tender procedures. In most of the cases examined, this was not the principal concern for the authorizing State, which was rather the security of having an international organization conduct purchase operations, and the concomitant guarantee of transparency. This would not necessarily be the case with an open bidding process directed by national authorities, or a contract negotiated directly by the latter.
198. From this perspective, there are limites to TCB’s involvement in four areas: 199. First, a State, after receiving the results of a tender may not accept TCB’s choice. This
was the case for the contract to supply and install primary and secondary surveillance radars for the Ethiopian Civil Aviation Authority in 2008 (Project ETH/04/701), (see below).
200. Second, concerning costs, TCB’s role is limited in all cases to monitoring that the tender process results in the offer with the lowest cost for the best proposition. On the other hand, TCB can not play the role of a clearing-house which, because of the number of similar contracts with the same firms, would be able to negotiate better conditions and volume discounts. More generally, the tender system as practised in the framework of TCB project, does not permit any price negotiation. On this point, paradoxically, TCB’s “interest” is not necessarily to obtain the lowest price on behalf of the project State, since its overhead fee is based on the amount of the purchase.
201. Third, suppliers of certain standard equipment (such as radars) in TCB projects are limited in number. The files indicate that the same firms often bid for multiple contracts, as seen with various projects audited involving the purchase of radar (PER/08/802, ETH/04/701, etc.). The External Auditor acknowledges that projects reviewed might be special cases and that the overall number of registered suppliers could be higher. Nevertheless, one cannot completely exclude, even if TCB provides instances of claims from losing firms, the possibility that a small number of firms, accustomed to bidding on similar contracts, might be tempted, collectively, to avoid lowering the overall terms offered in these repetitive bid solicitations.
202. Finally, correspondence attached to purchase files examined by the External Auditor show that these firms have extensive direct contacts with States, outside TCB, and there is no guarantee that the contracts are limited to letters copied to TCB. It cannot be excluded that such contacts can also influence, but not necessarily lower, price levels in the bidding process, or even that the formally transparent bidding process used by ICAO does not result in endorsing a pre-existing choice by the State hosting the project.
203. One particular case illustrates these limits, which are sometimes cumulative: a training programme in Brazil that is part of Project BRA 01-801. The director of ICAO’s project in Brazil was requested by the Brazilian National Civil Aviation Agency (ANAC) to implement a safety training programme for $82,080 with

V-52
additional expenses (trainer travel, equipment, etc.) of $33,844 for a total of $116,000. A bid was made by JAA, a training company based in the Netherlands. The project director sought the agreement of TCB. TCB’s response was to note that the Procurement Code (art 6.2) requires a “request for quotation” in this case (for contracts ranging from $2,500 to $100,000). Seven firms, including JAA, were contacted. Two of the firms declined, and four others did not respond. Only JAA responded with an offer that was identical to its initial offer, and thus won the contract. ICAO issued PO 22500943 on 1 November 2010.
204. In this specific example, recourse to a limited bidding procedure was purely formal, and, in view of the selection, may bring into question then the silence or intentional non-participation of the six other firms approached, thus leaving the firm which was originally proposed by the Brazilian administration with the support of the local ICAO representative in a position to win a contract under the original conditions. In this case, it is entirely clear that TCB’s involvement was to rubber-stamp a predetermined choice.
Observation 12: the External Auditor cannot guarantee that purchase operations that he audited, which ICAO sanctioned by organizing a formally transparent bidding process, necessarily led to the best supplier and/or lowest cost for the public administrations concerned. Under current procedures, the audit cannot guarantee that ICAO, in its authorized purchaser role, did not ultimately in certain cases endorsed excessive profit margins resulting from agreements of which it was unaware.
Recommendation 12: In order to limit this risk, the role of “authorized purchaser” currently exercised by TCB should not be limited, as it is today, to formal application of rigorous administrative tendering procedures, but should also rely on better price analysis.
The draft Secretariat Action Plan does not comment on this recommendation.
5.4.2. Compliance with the principle of selffinancing of technical cooperation activities
205. A review of projects in the audited sample shows that over the range of technical cooperation activities, the technical cooperation “turnover” is not, for a given financial period, equal to total payments in respect of technical cooperation projects. This figure corresponds in large part to the “banking” activity of depository/payer performed by ICAO21, but is limited, in the payments, to overhead fees received by ICAO and credited, for this purpose, to the AOSC Fund, while these fees are supposed to cover all costs paid by ICAO for technical cooperation.
206. Before analysing the project sample, the External Auditor sought to know how the ratio of “overhead fee/volume of operations handled” was evolving for the entire technical cooperation effort. The following table, which uses data from the Agresso database for all payments made for all technical cooperation projects (funds) and all overhead fees received under this heading since 2008, reveals the trends:
21 No charges are levied for ICAO’s banking role as all investment income remains the property of the depositer State.

V-53
Table 28: TCB “turnover” (In USD)
Year 2008 2009 2010 TCB payments for projects a) 73,824,047.20 100,916,942.94 118,395,783.33Turnover = TCB overhead fees b) 6,871,182.71 7,526,939.70 6,985,495.16%Turnover/volume transactions 9.31% 7.46% 5.90%
a) Total of accounts class 5 to 8 for all technical cooperation funds. b) Total of accounts 75405 and 75410 for all technical cooperation funds. (Source: Agresso general ledger)
207. For the last three years, this table shows a sharp drop in total overhead fees collected by ICAO in relation to the overall volume of projects handled, with the ratio decreasing from 9.31 per cent to 5.90 per cent during 2008-2010. Taken alone, this cannot be used to draw conclusions on the break-even point for projects since a large operation with a low rate of overhead fees may break even better than a small operation with a high share of overhead fees.
208. ICAO’s overhead fees, deducted from the deposits of States when POs are issued, are credited to the AOSC Fund22 in accordance with rules that vary by type of activity (purchase, expertise, training, consulting, etc.). Amounts deducted for various services other than overhead fees and billed to States are also credited to AOSC23.
209. For its part, the regular budget fund debits the AOSC Fund for various general costs paid by its services. Basically salaries and salary-related charges24, as well as various other charges25 including office supplies, office automation, equipment, telephone, furniture, information technology, subcontracting, exchange-rate differences, travel and other general expenses.
210. In terms of monitoring income and expenditure flows for each project (i.e., the basic objective set by the General Assembly is to balance expenditure and overhead fees), the various cases examined in the audited sample include an indicative budget in the appendix which provides an estimate of overhead fees (fee rates are also included in the appendix) and the amount of services that will be directly charged to the account of the signatory State, as well as charges outside ICAO. A priori, these estimates are reliable, except in case of subsequent renegotiation of the cost of the project, which is discussed below. On the other hand, the budgets appended to projects contain no indication of ICAO’s own costs. In the indicative project budgets, these costs are conventionally assumed to be equal to the overhead fees, but in practice, since application of a fee grid has no analytical basis, as indicated above, this tends to result in a decrease in overhead fees over time, as seen in table 28.
211. This situation is aggravated when ICAO agrees to apply reduced overhead fee rates compared with the standard on the basis of a “business” approach to negotiating with
22 AOSC accounts 44105 to 45125. 23 These amounts are tracked in accounts 48310 to 48345 of the AOSC Fund, the balance of public liability insurance (difference between the premiums paid to Lloyds and the amounts received for this purpose from the States) is booked to account 48310. 24 AOSC accounts 50105 to 55410. 25 AOSC accounts 65105 to 81505.

V-54
States, even though TCB itself admits to having no idea, even approximately, of ICAO’s corresponding project management cost.
212. Finally, beyond the individual projects, the lack of cost accounting also makes it impossible to ascertain whether the regular budget debits from the AOSC Fund an overall amount that is equal to, greater, or less than the resources actually dedicated by ICAO to TCB activities, not only by project, as indicated above, but also for the entire technical cooperation effort as a whole. As indicated in the External Auditor’s opinion on the 2009 financial statements, it is impossible, given ICAO’s failure to collect and adequately process data for the technical cooperation effort, to determine if transfers between the regular budget and AOSC funds faithfully reflect the amount of resources actually dedicated to technical cooperation. With this significant reservation, the AOSC Fund accounts show, as has been well known since 2008, a negative balance:
Table 29: “Margin” of TCB activity (In Canadian dollars)
Year 2008 2009 2010 TCB overhead fees + re-invoiced services a) 8,816,563.60 9,194,207.33 8,251,837.43Regular budget costs b) 10,147,001.52 10,067,396.85 9,575,735.13Exchange rate loss (-) or gain c) +999,020.10 -1,977,104.06 +511,269.76
Income -331,417.82 -2,850,293.58 -812,627.94a) Accounts for Funds 2101 and 2201, class 4 + Account 81120; b) Accounts for Funds 2101 and 2201, 50000 to 89999; c) Accounts for Funds 2101 and 2201, 30130 and 30135. (Source: Agresso)
213. Since 2008, AOSC’s accounts have been kept in Canadian dollars: if they were still in US dollars, the income for technical cooperation would have had a very different profile, with respectively -$1,403,142.29 in 2008, -$65,705.04 in 2009, and -$1,279,128.20 in 2010, which somewhat changes the apparent improvement seen in 2010: independently of the currency used for accounting purposes, debits from the AOSC Fund are mainly in Canadian dollars while credits are mainly in US dollars, implying a foreign exchange risk. In 2008 and 2009, credits in US dollars did not entail the purchase of Canadian dollars, resulting in exchange rate differences that were due not to TCB activity, but to management of exchange rate risk by the Finance Branch, resulting in an exchange surplus of 999,000 Canadian dollars in 2008 and an exchange rate loss of 1,977,000 Canadian dollars in 2009. Beginning in 2010, the Finance Branch decided on a monthly provision in Canadian dollars for AOSC income, which led to a significant, albeit lower, exchange rate difference in 2010 (surplus of 511,000 Canadian dollars).
214. Moreover, when certifying the financial statements for 2010, the External Auditor found that over half the technical cooperation fees for the financial year 2010 had been entered in the accounts during the last few weeks of 2010. This phenomenon is partly related to the budget constraints of contracting Member States, which, at the beginning of the year Y+1, have appropriations carried over that they can allocate to CAPS projects. However, contrary to its own accounting rules applicable to income,

V-55
ICAO in the financial year 2010, recorded 90 per cent of the fees related to purchase orders (or POs) issued in January 2011: without this exceptional manoeuvre (which the auditor identified as part of his “cut-off” tests, during the audit, and which led him to enter a note regarding uncorrected differences – since the income cannot be entered in the accounts until confirmation of the State’s approval of such a payment has been received), the situation of the AOSC Fund would have shown a further loss of $443,000 in 2010.
215. Bearing in mind the above comments, disregarding exchange rate differences and in strict application of the cut-off rules, 2010 was the worst year for the AOSC Fund in the last three years.
216. A month after the External Auditor’s inspection, the Finance Branch undertook an analysis of the average level of fees received in relation to the average volume of technical cooperation projects. This analysis covered the first nine months of the financial year 2010; as requested by the External Auditor, the Finance Branch updated this analysis in March 2011 to cover the entire financial year 2010. The analysis, the results of which have not been checked by the External Auditor, encompassed 450 projects and found that: - Excluding purchase orders, the Finance Department identified 15 different types of contract, accounting for 30 per cent of all the fees received by the AOSC Fund, with an average fee rate of around 10 per cent with little variation between regions, and average regional rates ranging between a low of 9.37 per cent (Americas) and a high of 10.87 per cent (Asia/Pacific); - On the other hand, the average fee rate for purchase orders (CAPS projects), which make up 70 per cent of AOSC income, was only around 3.55 per cent
217. On this basis, the Finance Branch believes that, to restore a balance, the average fee rate for purchase orders needs to be around 7 per cent all things being equal, in other words double the current rate. It suggests therefore that TCB should re-align its fee schedule, which it is hoped will help the AOSC Fund achieve equilibrium, within the next three or four years (bearing in mind the inertia effect of ongoing projects).
218. Subject to the accuracy of the data identified by the Finance Branch, which back up his own findings, the External Auditor agrees with this conclusion, while emphasizing the following: - Even if the CAPS fees rate were doubled, there are still doubts as to the reliability of the data relative to expenditure recorded for the AOSC fund (is the expenditure recorded equal, higher or lower than the expenditure actually paid out for technical cooperation activities?), so it will still be impossible to state with any certainty whether technical cooperation produces profits, losses or breaks even; - Doubling the fees, as suggested by the Finance Branch, could lead to a general drop in the number and volume of CAPS projects, which, given the scale of fixed overheads entailed in such activities, could jeopardize the desired restoration of technical cooperation equilibrium. Viewed from this angle, the main issue then is to ascertain whether or not the added value provided by ICAO is really worth a commission of 7 per cent to the customer States, and, if it is, bearing in mind the finding mentioned above regarding the actual content of certain projects, to ascertain what, for these States, the “added value” provided by ICAO actually consists of.

V-56
219. To summarize these developments: 1) Over the period 2008-2010 there has been a significant deterioration in average fees in relation to the average volume of projects, while the average cost per project is assumed to remain nearly constant; 2) Due to the lack of cost accounting, which ICAO has consistently found inappropriate given the burden and cost involved, the type, quantity and cost of resources actually dedicated to a given project are still unknown. As a result, TCB’s managers do not know, even after the fact, if a project did, is to or will break even, or show a profit, or a loss; 3) The same observation is valid for the entire technical cooperation effort: in this instance, the unknown element covers the entirety of ICAO expenditure charged to the AOSC Fund. Currently, nothing guarantees that the balance of this account faithfully reflects the real results of technical cooperation activity.
Observation 13: Self-financing of activity has long constituted a precondition imposed by the Assembly and the Council for pursuing technical cooperation activity. Recent trends show a decrease in the ratio of overhead fees/value of technical cooperation projects. In this context, neither TCB nor the Finance Branch currently has a management tool to provide break-even estimates for each project being negotiated; in addition, AOSC is not a reliable instrument for measuring the financial outcome of the technical cooperation effort. Taken together, this constitutes a major financial risk for ICAO, which currently lacks a concrete plan for its control.
Recommendation 13: So that ICAO can maintain the break-even point in TCB's technical cooperation effort, consideration must be given to:
- Rate-setting for technical cooperation;
- The reliability of the AOSC Fund as a monitoring tool;
- What management tools that are now lacking should be developped.
The draft Secretariat Action Plan accepts this recommendation, adding that "TCB does not employ a true cost accounting method to determine the real cost to TCB of executing a project. In the absence of such a method, TCB is reviewing and formulating a new methodology determining the appropriate overhead rates to be applied in order to fully recover its direct and indirect cost for AOSC. A new Project Portfolio Management (PPM) tool is in its developmental phase to address various issues such as reporting, risks and key performance indicators to properly measure TCB's output."
5.5. Specific observations arising from review of projects selected
5.5.1. Choice of supplier differs from that selected by TCB 220. The project to supply and install primary and secondary surveillance radars for the
Ethiopian Civil Aviation Authority (ECAA) (Project ETH/04/701) had already been examined by the External Auditor in his March-April 2009 audit.

V-57
221. This audit showed that: - The initial tender was organized with three firms, Indra, Selex and Thales; - ICAO concluded its evaluation of proposals in a note dated 25 January 2008, from TCB’s Director addressed to ECAA’s Director General. This evaluation recommended that Indra be awarded the contract; - During 2008, ECAA performed additional analyses and evaluations that resulted in a different choice. In a letter dated 29 September 2008 addressed to the Director of TCB, ECAA’s Director General reported the conclusions of the national committee, which led to Selex being awarded the contract; - ECAA justified the choice, which differed from TCB's, on Indra's recent agreement with Northrop Grumman to produce the equipment jointly, and the Ethiopian authorities made known their reticence to be the first to try the new alliance. The rationale was officially notified to TCB, which took action in consequence in an interoffice memorandum of 6 November 2008 noting that the contract had been given to Selex, for whom TCB should issue a PO.
222. In his report the External Auditor recommended “...clearly setting out, in the Procurement Code, what rules should be applied when the customer contests the vendor chosen by ICAO.”
223. The present audit has revealed that the new Procurement Code, dated 1 November 2010, includes a provision that allows ICAO, when the partner State holds a different view, to withdraw from the advisory procedure while retaining the overhead fees for the work performed26.
5.5.2. Government employees on international contracts under technical cooperation agreements
224. Projects BOL/09/801 (MSA providing financing through ICAO, up to approximately 80 per cent of the amount of the contract, for Bolivian administrative staff assigned to the Bolivian civil aviation authority over the period 2009-2012) and PER/07/801 (MSA providing, in similar fashion, the same service for the Peruvian civil aviation authority, as well as Project BRA/01/801 to modernize and improve civil aviation in Brazil, are examples of ICAO taking on the role of temporary employment agency.
225. In its initial phase, the purpose of Project BRA/01/801 was to recruit Brazilian staff designated by the Brazilian Government, to posts funded by ICAO on an international basis and scale. The Brazilian Government used this arrangement to bypass Brazilian civil service pay limits which at that time did not attract candidates with the required technical and linguistic skills in the field of civil aviation.
226. These contracts excluded any contribution to social welfare programmes, particularly retirement benefits. This did not prevent some employees at the end of their contracts from requesting retirement benefits from their original government agencies even though they had not contributed. The Brazilian Constitution provides that every Brazilian employee has a right to retirement benefits. When the Brazilian Government refused to pay these benefits, ICAO could have found itself in difficulties. No appeals
26 Art. 7-5: “If no agreement can be reached with the contract State/customer regarding the evaluation carried out by ICAO, then ICAO shall not proceed further with the procurement. The corresponding funds shall be returned to the customer, with due regard to ICAO’s fees for the procurement process. Otherwise, once the approval from the customer is received, the negotiation or award process may commence.”

V-58
were successful, and the recruitment of Brazilian nationals for this project was halted. This case nevertheless reveals an important risk when local citizens are employed on international contracts.
227. Current projects with Bolivia BOL/09/801 and Peru PER/07/801 rely on the same logic. Pay levels and benefits (immunity, etc.) are intended to encourage hiring of the best staff.
228. The contracts present a possible difficulty for ICAO in that the country chooses its own candidates. To ensure that they meet the profiles and skills needed, TCB must be especially watchful, since in the past it has had to refuse to hire staff that were not suitable for a project, but were nevertheless put forward by the Government. In certain cases, TCB observed that certain posts were unrelated to civil aviation, or that the employees hired at the Government’s request did not have the necessary skills profile.
229. In addition, the past example of Brazil shows that, for all MSAs, it is essential that ICAO be forewarn itself against subsequent litigation by indicating clearly the exceptional nature of international contracts given to nationals. The MSA signed with Bolivia included a clause of this type (2.4.2). On the other hand, there is no evidence of this in the MSA signed with Peru. Special attention must be paid to this point.
230. Finally, the logic of such cooperation require that it should be terminated quickly to avoid prolonging exceptional situations. With Brazil, there have been no more contracts of this type not so much because of the legal risk arising from retirement plans but because the court cases showed that the Brazilian civil service pay scale now includes a suitable salary level for civil aviation specialists.
Observation 14: To circumvent national rules for paying civil servants considered incompatible with the level required for recruiting national civil aviation specialists, various contracts provide recourse for ICAO, which plays the role of a temporary employment agency that pays higher rates. It is not the External Auditor’s role to assess the correctness of this procedure with regard to the national laws of the States concerned. On the other hand, the External Auditor points out that there are risks:
- If ICAO is not sufficiently attentive, States may propose candidates that lack the skills and background that correspond to the functions to be exercised and ICAO could find itself involuntarily supporting favouritism;
- When this practice results in ICAO paying salaries to employees over a long period, the latter may consider that they are entitled to retirement benefits, which the Brazilian project has shown to be a real risk.
Recommendation 14:
- When projects involve assigning government staff to international posts, TCB should systematically ensure, by inserting appropriate clauses in the MSA, that the staff cannot later make any claims against it, including for retirement benefits;
- In all cases, this type of contract constitutes only a temporary solution, and ICAO should set timelimits for this practice, and avoid automatic renewal of this type of contract (for the projects in Peru and Bolivia that were examined, the renewal period is three years).
The draft Secretariat Action Plan accepts this recommendation. ICAO adds the following comment: "the recruitment of this category of personnel is done under Special Service Agreements in order to perform specific functions. Under the provisions of the agreement, they are not in any

V-59
way considered ICAO staff. Furthermore the terms and conditions of Special Services Agreements clearly stipulate that the personnel are not entitled to pension after separation. Both the current and draft revised MSA include the hold harmless clause. The draft revision has further strengthened it in stipulating that the obligation does not lapse upon termination or completion of the agreement."
5.5.3. Insurance and liability cover related to TCB activity
231. The External Auditor has been informed that coverage of any liability incurred by ICAO in the execution of mandates secured by TCB is assured at three levels:
232. The first level is contractual and concerns the relationship between ICAO and the State with which the cooperation agreement is signed. It consists in specifying, in a standard clause included in all contracts signed by TCB, that ICAO's role is to act as mandatary, and that the Government which confers this mandate indemnify, hold harmless and protect ICAO from any claim. This is the “hold harmless” clause which is now inserted in all MSAs which link ICAO and States in cooperation programmes. This clause is contained in article 17 in the template contract used for negotiating all MSAs. A clause of this type is also included in MSA application agreements27.
233. The second level is also contractual, and is part of the same template contracts which provide in article 11 for a procedure for resolving conflicts that may arise, in particular with firms that act as suppliers. It concerns the arbitration procedure offered to parties referred thereto by the United Nations Commission on International Trade Law (UNCITRAL). Such a procedure has never been used by ICAO, and the only such litigation, which involved delivery of a lighting system to Viet Nam dating back to the early 1990s, was resolved amicably between the Australian supplier, ICAO and the Vietnamese Government. In this case, the additional payment to the manufacturer as a result of the amicable settlement was accepted by Viet Nam, as currently required under the provisions of project contracts..
234. The third level is financial. Each contractual commitment, once the PO is issued, includes professional liability insurance (PLI) underwritten by Lloyd’s, through the broker, AON. This insurance covers litigation and claims by a third party (for example, contractors). In the case of a claim, the deductible is USD 250,000 and maximum coverage is USD 5 million. To date, there have been no claims. This insurance policy has not been evaluated or reviewed recently by Legal Affairs.
235. The cost of this insurance is invoiced to the State for each contract at a fixed rate of one half of one per cent of the contract total: USD 364,339 was collected by ICAO for this purpose in 2009 28 . ICAO for its part pays a single annual premium that
27 A) Art. 17 “The <Country> shall indemnify and hold harmless ICAO, including its personnel from any and all actions, claims or other demands arising out of any act performed by ICAO on behalf of the <Country> pursuant to this agreement.” B) “This Contract is entered into between the International Civil Aviation Organization (ICAO) acting on behalf of and as mandatary for the Government of <COUNTRY>, specifically the (<GOVERNMENT ENTITY>) of <COUNTRY>, and <CONTRACTOR>. In entering into this Contract, ICAO acts solely for and/or on behalf of <GOVERNMENT ENTITY>, and the Government of <COUNTRY> has agreed to indemnify and hold harmless ICAO, including its personnel, from any and all actions, claims or other demands arising out of any act performed by ICAO in relation to the Contract.” 28 This amount is the sum of account 80735 for all technical cooperation funds for the 2009 reporting period.

V-60
amounted to USD 72,50029 for the 2009 reporting period (CAD 83,593 recorded for this purpose in the AOSC Fund for the 2009 reporting period). The difference between the amount collected from the one half of one per cent and the single fixed premium paid, or USD 291,839, constitutes income to the AOSC Fund to be recorded in 2010. This difference, which is justified as constituting a form of ICAO self-insurance to cover deductibles (is approximately equal to the deductible for a single claim during the year)and remains in AOSC if there is no litigation.
236. The “hold harmless” clause was not always systematically inserted and does not appear in the oldest MSAs still in effect. The limited duration of contracts signed under MSAs means that few of them lack this clause and, at any rate, they will gradually come to an end. It is thus not necessary to renegotiate them. On the other hand, some may be prolonged, extended or supplemented. In this case, it is necessary to amend the original text and insert a no liability clause.
Observation 15: ICAO’s responsibility for TCB's activities is assumed to be covered by various contractual clauses and by PLI. No risk protection assessment was provided to the External Auditor.
Recommendation 15: ICAO should:
- When extending, prolonging, or supplementing old MSAs, include a hold harmless clause, as provided by Article 17 of the template contract and, if necessary, renegotiate the agreement for this purpose;
- Regularly examine and review the terms of the Lloyds PLI contract and ensure that it is in line with the various risks incurred;
- More generally, conduct a legal assessment of the adequacy and robustness of the liability protection measures currently in place.
The draft Secretariat Action Plan accepts this observation, repeating that "both the current and the draft revised MSA include the hold harmless clause", but adds that "certain States in the past did not agree with it and requested that the clause be removed. When renegotiating with theses States, FOS will ensure that the clause is reintroduced into the agreements"
Concerning PLI, ICAO makes the following comment: "PLI is an insurance covering procurement only. PRO is currently preparing a call for tender for a new insurance broker that will be engaged to handle insurance for all of ICAO (not just PLI). PRO shall submit the terms of reference to LEB for review and request their participation in the evaluation of submissions.
29 The corresponding amount in Canadian dollars, $83,592, appears in account 80735 of the AOSC Fund.
INTERNATIONAL CIVIL AVIATION ORGANIZATION PART VI: SECRETARIAT ACTION PLAN IN RESPONSE TO THE REPORT OF THE EXTERNAL AUDITOR

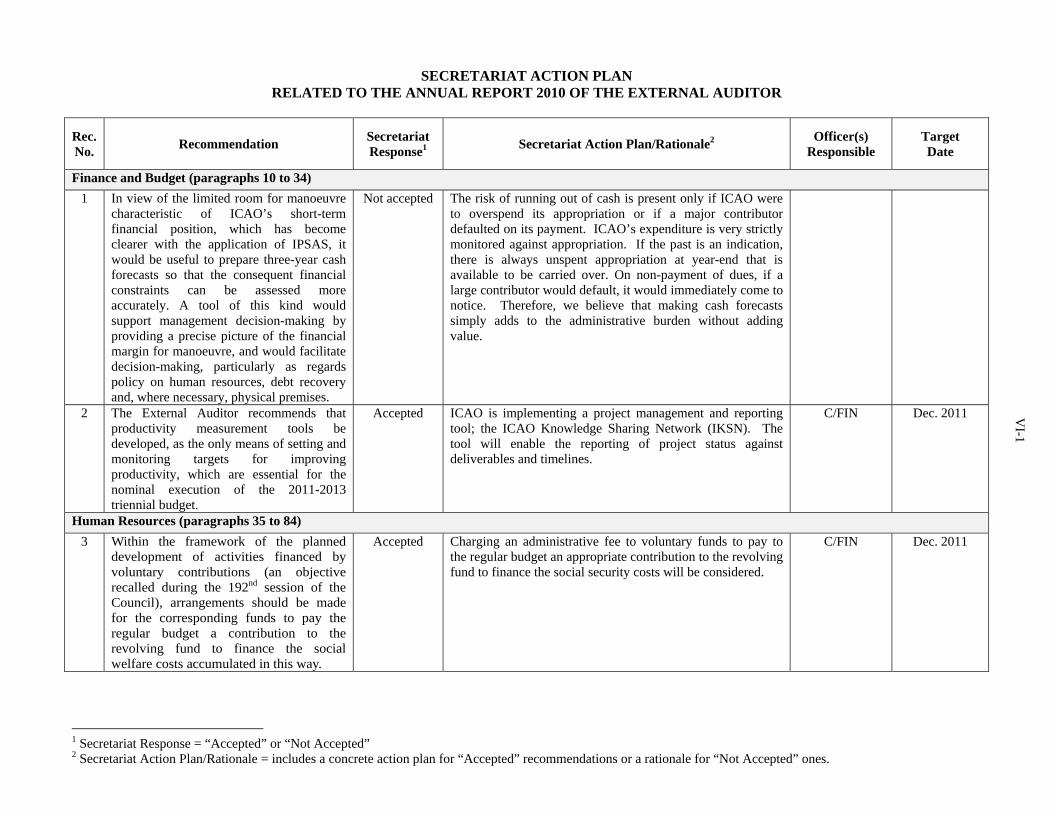
SECRETARIAT ACTION PLAN RELATED TO THE ANNUAL REPORT 2010 OF THE EXTERNAL AUDITOR
Rec. No. Recommendation Secretariat
Response1 Secretariat Action Plan/Rationale2 Officer(s) Responsible
Target Date
Finance and Budget (paragraphs 10 to 34) 1 In view of the limited room for manoeuvre
characteristic of ICAO’s short-term financial position, which has become clearer with the application of IPSAS, it would be useful to prepare three-year cash forecasts so that the consequent financial constraints can be assessed more accurately. A tool of this kind would support management decision-making by providing a precise picture of the financial margin for manoeuvre, and would facilitate decision-making, particularly as regards policy on human resources, debt recovery and, where necessary, physical premises.
Not accepted The risk of running out of cash is present only if ICAO were to overspend its appropriation or if a major contributor defaulted on its payment. ICAO’s expenditure is very strictly monitored against appropriation. If the past is an indication, there is always unspent appropriation at year-end that is available to be carried over. On non-payment of dues, if a large contributor would default, it would immediately come to notice. Therefore, we believe that making cash forecasts simply adds to the administrative burden without adding value.
2 The External Auditor recommends that productivity measurement tools be developed, as the only means of setting and monitoring targets for improving productivity, which are essential for the nominal execution of the 2011-2013 triennial budget.
Accepted ICAO is implementing a project management and reporting tool; the ICAO Knowledge Sharing Network (IKSN). The tool will enable the reporting of project status against deliverables and timelines.
C/FIN Dec. 2011
Human Resources (paragraphs 35 to 84) 3 Within the framework of the planned
development of activities financed by voluntary contributions (an objective recalled during the 192nd session of the Council), arrangements should be made for the corresponding funds to pay the regular budget a contribution to the revolving fund to finance the social welfare costs accumulated in this way.
Accepted Charging an administrative fee to voluntary funds to pay to the regular budget an appropriate contribution to the revolving fund to finance the social security costs will be considered.
C/FIN Dec. 2011
1 Secretariat Response = “Accepted” or “Not Accepted” 2 Secretariat Action Plan/Rationale = includes a concrete action plan for “Accepted” recommendations or a rationale for “Not Accepted” ones.
VI-1

Rec. No. Recommendation Secretariat
Response1 Secretariat Action Plan/Rationale2 Officer(s) Responsible
Target Date
4 When presenting budgetary hypothesis related to established posts to the Council, the Secretary General should systematically indicate the actual posts charged to the regular budget.
Accepted In future, C/FIN will provide in the budget an indication of the actual headcount compared to the budgeted headcount.
C/FIN To be presented with the Triennial
Budget.
Information Technology (paragraphs 85 to 121) 5 A specialist consultancy study should be
undertaken of the user support function (Service Desk), comprising a cost-benefit analysis, to gain a better understanding of the quality of service rendered to users, identify their needs and work out a better balance between in-house functions and outsourcing.
Accepted A Service Management specialist consultancy will be contracted to assess the ICAO user support functions and the balance between in-house functions and outsourced services, provided the necessary resources can be found.
D/ADB with C/EAO
June 2012
6 In view of the financial amounts involved (nearly 7 per cent of regular budget appropriations), the Council should request and approve a medium-term IT master plan identifying and prioritizing all IT projects, combined with a financial evaluation and an implementation schedule. The Secretary General would have an important catalyst role to play, being the only person able to mobilize all the user services and the ICT Section and to make trade-offs when needed, between priorities and resources available.
Accepted IT medium-term Master Plan will be produced. D/ADB June 2012
Regional Offices (paragraphs 122 to 186) 7 Following a series of discussions with
Regional Directors, Deputy Directors and technical officers, the External Auditor observed that two approaches could be adopted to achieve a better balance between the specialized staff assigned to regional offices and the resources available to them, thus allowing States in the region to make full use of their skills: - The relative share of total resources allocated to missions and travel; - The number of State visits made to each
Accepted a) Roles of the Regional Directors and Technical Officers.
The role of the regional offices is evolving significantly. This includes the increased involvement of the Regional Offices in the field of aviation safety (in particular the creation of Regional Aviation Safety Groups), CMA process, security, sustainability and Technical Cooperation. This is also taking place in a context where emphasis is put on ensuring a consistent response from ICAO no matter whether the response is provided by HQ or a Regional Office. This evolution of the role of the Regional Office has an impact on the responsibility and accountability of the Regional
VI-2

Rec. No. Recommendation Secretariat
Response1 Secretariat Action Plan/Rationale2 Officer(s) Responsible
Target Date
State in each region, for each specialist field. The resulting raw data, which do not, however, take into account of significant qualitative factors, would indicate some adjustment is called for between available staff and the resources assigned for the performance of their duties. The External Auditor suggests that the Council should request the Secretary General to examine these two approaches further in order to define, justify and validate quantitative targets in terms of budgetary resources, technical staff and number of missions (particularly country missions, per specialist field and per region) to be set for Regional Directors, having first matched targets to available resources. If necessary, the Regional Office Manual should be amended accordingly.
Directors and on the tasks undertaken by the regional Technical Officers. The job description for Regional Director has been amended recently and reflects some of the changes.
b) State missions
State missions cannot be considered in isolation as they are only one of the tools that the organization is using to assess the level of implementation of SARPS and Regional Air Navigation Plans in States and to support their implementation. We are moving toward a system whereby visits to States, whether for State mission, ICVM, Audit or any other purpose and whether they are conducted by the Regional Office or HQ, are:
i. Planned based on a risk and needs model and not on a fixed schedule.
ii. Prepared and coordinated to maximize benefit including the fact that the ICAO officer undertaking the visit may be asked to undertake tasks beyond his or her field of activity
This is ensuring that ICAO resources are deployed where they are the most needed and in the most efficient way.
8 Following on from the previous recommendation, the Council should request the Secretary General to propose concrete steps to standardize the activity of Regional Directors, above and beyond the theoretical standards defined in the Regional Office Manual, taking into account their personal profiles, but giving greater consideration to specific regional requirements, in particular, by defining standards in each region for distributing budgetary resources between management and technical officers and State missions by technical field.
Accepted ACTION
a) ICAO will review the evolving role of the Regional Offices and of the responsibilities and accountabilities of the Regional Directors. This includes the clarification of their role in assessing deficiencies in the regions (infrastructure, ATM and compliance with ICAO SARPS) and in working with States for their resolution. b) Review of the role and responsibilities of the Regional Technical Officers to ensure that they remain in line with the evolving responsibilities of the Regional Offices. c) Continue the training visits of Regional Officers to Headquarters and associated activities to review post descriptions while they are in HQ.
D/ANB, ICAORDs, D/ATB and
C/RCC
D/ANB, ICAORDs and
D/ATB
D/ANB, ICAORDs and
D/ATB
June 2012
June 2012
June 2012
VI-3

Rec. No. Recommendation Secretariat
Response1 Secretariat Action Plan/Rationale2 Officer(s) Responsible
Target Date
9 It is not for the External Auditor to judge individual local situations. Nevertheless, it does seem that the activity of each technical officer present should undergo a systematic critical review by the regional programme managers and/or internal audit so that the necessary adjustments may be made.
Accepted d) Strengthening the coordination among Regional Offices and between Regional Offices and Headquarters (IKSN in collaborative work programme development between ROs and HQ Missions to States. e) Amendment of the Regional Office Manual to reflect the changes above. This will take place whenever the various elements above are validated and supporting procedures are tested and confirmed.
D/ANB, ICAORDs and
D/ATB
C/RCC
June 2012
June 2013
10 Given current ICAO resources and future trends, this probably means that, from a strictly management perspective and thus regardless of any question of geographical coverage, there can be no more than seven regional offices.
Not Accepted The number of Regional Offices is established to meet the needs of States to which they are accredited. The needs of States constantly evolve and ICAO must have the flexibility to respond appropriately.
11 Care should be taken to implement the uniform methodology effectively, by upgrading all practices - especially in the APIRG region - and extending the maintenance of online databases with new improved procedures. In ICAO's response to the External Auditor's preliminary report, the Lima Regional Office notes that the "GANDD database will also need to be upgraded to introduce the new deficiency methodology”.
Accepted We fully agree with the need to collect information on regional air navigation deficiencies in a more comprehensive and consistent way and to ensure that they are used in a systematic way to assess safety risk and to correct deficiencies.
ACTION
a) Improvement of the quality, scope, consistency and interoperability of the databases on regional deficiencies;
b) Systematic analysis and use of the information which is collected, to support ICAO safety strategy, the CMA process and the prioritization of the activities and priorities of the Regional Offices.
D/ANB, D/ADB and ICAORDs
June 2012
Technical Cooperation (paragraphs 187 to 236) 12 In order to limit this risk, the role of
“authorized purchaser” currently exercised by TCB should not be limited, as it is today, to formal application of rigorous administrative tendering procedures, but should also rely on better price analysis.
Accepted In the example under the External Auditor’s comment 202, TCB applied the procurement code rigorously. The open competitive tendering provided for the validation of the price, which is precisely the purpose under the procurement code. In fact in the example cited, other companies had the possibility to bid and potentially make better offers. I would also remark that as pointed out by the Auditor, there is no means available to confirm whether there were prior agreements leading to excessive profits of the one bid received. However the open tendering process determined that there was no better proposal on the market at that time. The market in fact decided.
D/TCB Implemented
VI-4

Rec. No. Recommendation Secretariat
Response1 Secretariat Action Plan/Rationale2 Officer(s) Responsible
Target Date
Notwithstanding the above, in 2010, a reform of the Procurement Section was undertaken based on a common UN procurement certification scheme. This reform saw a revised procurement code, the development of Procurement Procedures Manual and UNDP Procurement Certification through the United Kingdom’s Chartered Institute of procurement and supply (CIPS), to address amongst others cost analysis. With specific relation to the External Auditor’s comments that TCB should perform a cost analysis, the following should be noted : 1. The role of TCB is to seek out competitive proposals
from the largest pool available in the marketplace. Consequently a web based tendering system has also been put in place as part of its reform, which provides an open tendering process whereby any company from any providence, may bid without limitations, therefore diminishing any risk of collusion.
2. In accordance with UN guidelines and those of CIPS, Evaluation methods are performed on a lowest cost compliant proposal for goods and a weighted scoring method when services are procured.
These two (2) evaluation methods are used for attaining competitive and best value procurement. When there is no competition (such as a sole source or when only one proposal has been received (cited case by the Auditor), and as per the UN Guidelines, procedures exist for performing a cost analysis as recommended by the Auditor. TCB must ensure that the price the organization is paying is fair and reasonable. This is typically done by TCB, as indicated in the Procurement Procedure Manual (Document No. P-PRO-100, Article 4.4, Receipt of only One Tender).
More specifically TCB will look at :
• Market price, e.g. via consulting market publications • Catalogue or list price • Historical price, i.e. obtain information on how the
current price compares to a price paid in the past for the
V1-5

Rec. No. Recommendation Secretariat
Response1 Secretariat Action Plan/Rationale2 Officer(s) Responsible
Target Date
same or similar goods or services by the organization or by another UN organization
• is the offer the same as for another comparable customer
• obtain breakdown of cost information from the supplier.
Furthermore all proposals are subject to both a technical and commercial evaluation which addresses cost analysis.
13 So that ICAO can maintain the break-even point in TCB's technical cooperation effort, consideration must be given to: - Rate-setting for technical cooperation; - The reliability of the AOSC Fund as a monitoring tool; - What management tools that are now lacking should be developped.
Accepted TCB does not employ a true cost accounting method to determine the real cost to TCB of executing a project. In the absence of such a method, TCB is reviewing and formulating a new methodology in determining the appropriate Overhead rates to be applied in order to fully recover its direct and indirect cost for the AOSC. A new Project Portfolio Management (PPM) tool is in its developmental phase to address various issues such as reporting, risks and key performance indicators to properly measure TCB’s outputs.
D/TCB Dec. 2011
14 - When projects involve assigning government staff to international posts, TCB should systematically ensure, by inserting appropriate clauses in the MSA, that the staff cannot later make any claims against it, including for retirement benefits; - In all cases, this type of contract constitutes only a temporary solution, and ICAO should set timelimits for this practice, and avoid automatic renewal of this type of contract (for the projects in Peru and Bolivia that were examined, the renewal period is three years).
Accepted The recruitment of this category of personnel is done under Special Service Agreements in order to perform specific functions. Under the provisions of the agreement, they are not considered in any respect as being a staff member of ICAO. Furthermore the terms and conditions of Special Services Agreements clearly stipulate that the personnel are not entitled to pension after separation. - Both the current and draft revised MSA include the hold harmless clause. The draft revision has further strengthened it in stipulating that the obligation does not lapse upon termination or completion of the agreement. - Extensions of contracts for this category of personnel are being done after break in service.
D/TCB Implemented
15 ICAO should: - When extending, prolonging, or supplementing old MSAs, include a hold harmless clause, as provided by Article 17 of the template contract and, if necessary, renegotiate the agreement for this purpose; - Regularly examine and review the terms of the Lloyds PLI contract and ensure that it is in line with the various risks incurred;
Accepted Both the current and draft revised MSA include the hold harmless clause. The draft revision has further strengthened it in stipulating that the obligation does not lapse upon termination or completion of the agreement. Certain States in the past did not agree with it and requested that the clause be removed. When renegotiating with these States, FOS will ensure that the clause is reintroduced into the agreements. PLI is an insurance covering procurement only. PRO is
D/TCB
Implemented
V1-6

Rec. No. Recommendation Secretariat
Response1 Secretariat Action Plan/Rationale2 Officer(s) Responsible
Target Date
- More generally, conduct a legal assessment of the adequacy and robustness of the liability protection measures currently in place.
currently preparing a call for tender for a new insurance broker that will be engaged to handle insurance for all of ICAO (not just PLI). PRO shall submit the Terms of Reference to LEB for review and request their participation in the evaluation of submissions.
D/TCB
Dec. 2011
— END —
V1-7

�������

�������

�������