Embed Size (px)
Citation preview

An Investigation of Staphylococcus aureus
and Related Species From Flood Affected
and Other Environmental Sources
A Thesis in Molecular Microbiology
by
Nadeesha Samanmalee Jayasundara
BSc (Environmental Conservation & Management)
School of Biomedical Science, Institute of Health & Biomedical Innovation Queensland University of Technology
Brisbane, Australia
Thesis submitted to Queensland University of Technology in fulfilment of the requirements for the degree of Masters of Applied Science (Research)
May 2014

2

3
Abstract
The genus Staphylococcus consists of 45 species and is widely distributed across
environments such as skin and mucous membranes of humans and animals, as well as in soil,
water and air. S. aureus and S. epidermidis are the most commonly associated species with
human infections. Hence, most studies have focused on clinical and clinically sourced
staphylococci. In addition, S. haemoliticus, S. intermidius, S. delphini, and S. saprophiticus
are also considered potentially pathogenic members of the genus. Although staphylococci are
distributed in various environments, there have been very few studies examining residential
air as a reservoir of clinically significant pathogens, particularly Staphylococcus species. As a
result, airborne transmission of staphylococci, and associated health risks, remains unclear.
This study included not only residential air but also air samples from flood affected houses.
Flood water can be considered as a potential carrier of pathogenic bacteria, because flood
water can be affected by residential septic systems, municipal sanitary sewer systems,
hospital waste, agricultural lands/operations and wastewater treatment plants. Even after the
flood waters recede, microorganisms that are transported in water can remain in soil, in or on
plant materials and on numerous other surfaces. Therefore, there is a great concern for use of
previously flooded indoor and outdoor areas. Bacteria can be released into the air by various
human activities (talking, coughing, sneezing, walking, cooking, and cleaning) as well as by
natural wind flow. Finally, as a consequence of flooding, indoor and outdoor bacterial
concentrations in air can be affected.
This study aimed to determine the total bacterial load in residential air samples taken from
both flood affected and non-flooded houses after the Brisbane major flood event in January
2011. The mean total culturable bacterial concentrations in indoor and outdoor air of flood
affected houses were 203 cfu/m3 and 110 cfu/m3 respectively, and the respective mean values
for non-flooded houses were 221 cfu/m3 and 121 cfu/m3. The p value for indoor and outdoor
total bacteria colony counts in flood affected houses was 0.0006 and 0.0109 for non-flooded
houses, implying that the indoor and outdoor total bacteria colony counts were significantly
different. On the other hand, when comparing total bacteria colony count data in flood
affected and non-flooded houses, the difference was not statistically different and the
respective p values for flood affected was 0.5956 and 0.6036 for non-flooded houses.
4
Mean values of biochemically defined (presumptive) Staphylococcus sp. concentrations in
indoor and outdoor air of flood affected houses were 28 cfu/m3 and 11 cfu/m3 respectively.
Non-flooded indoor and outdoor mean values of presumptive staphylococcal isolates were 20
cfu/m3 and 8 cfu/m3, respectively. Statistical analysis of presumptive Staphylococcus sp. data
also showed a similar trend to that of the total bacterial colony count results. In fact, indoor
(p= 0.006) and outdoor (0.105) data was statistically different, whereas flood affected
(0.5760) and non-flooded (0.1899) data was not statistically different. In general, statistically
significant differences in indoor vs. outdoor bacteria as well as staphylococcal isolates
indicates the presence of an indoor source for these organisms. The lack of statistical
significance between flood affected and non-flooded houses implies the absence of a
measurable effect that the 2011 flood event had on airborne bacteria and Staphylococcus sp.
In addition, this study also aimed to identify and isolate Staphylococcus sp. in residential air
samples using DNA-based methods and S. epidermidis, S. carnosus, S. saprophyticus, S.
sciuri and S. succinus were the detected species. A particular focus of this study was to
determine the prevalence of methicillin resistance in staphylococci sourced from air. A major
finding of this study was the diverse population structure of airborne staphylococci as well as
the high rate of methicillin resistance amongst these isolates. In fact, of 129 staphylococcal
isolates 103 (~80%) were methicillin-resistant strains. It is well known that S. aureus is a
highly pathogenic organism and it harbours an array of antibiotic-resistant genes, in particular
methicillin resistance. However, almost all studies on staphylococcal antibiotic resistance are
related to clinical or hospital environmental isolates. This is the first study to investigate the
prevalence of methicillin resistance harboured by Staphylococcus sp. isolated from residential
air samples in Brisbane. By determining the genetic relatedness of residential air sourced
staphylococci, a potential source for pathogenic strains can be identified.

5
Keywords Airborne bacteria Flood
Residential air
Genus Staphylococcus
Molecular identification
Methicillin resistance

6
Table of Contents Abstract ............................................................................................................................................. 3
Keywords .......................................................................................................................................... 5
Table Of Contents ............................................................................................................................. 6
List Of Figures .................................................................................................................................. 8
List O F Tables .................................................................................................................................. 9
List Of Abbreviations ...................................................................................................................... 10
Declaration ...................................................................................................................................... 11
Acknowledgement…………………………………………………………………………………….12
1. Updated Literature Review........................................................................................... 15
1.1 Introduction ..................................................................................................................... 15
1.2 Flood ............................................................................................................................... 17
1.3 Microbiology of Air (Aeromicrobiology) ......................................................................... 18
1.4 Airborne Transmission of Microorganisms ....................................................................... 20 1.4.1 Transmission of Staphylococcus aureus ..................................................................................... 23
1.5 Genus Staphylococcus (Taxonomy) .................................................................................. 24 1.5.1 Staphylococcus aureus ............................................................................................................... 28 1.5.2 Genome of Staphylococcus aureus ............................................................................................. 30 1.5.3 Antibiotic Resistance of Staphylococcus aureus ......................................................................... 31
1.6 Identification Methods for Staphylococcus species ........................................................... 34 1.6.1 Biochemical methods................................................................................................................. 34 1.6.2 Molecular Methods .................................................................................................................... 35 i. Polymerase Chain Reaction (PCR) ................................................................................................. 36 ii. PCR Restriction Fragment Length Polymorphism (PCR-RFLP)...................................................... 37 1.6.3 Target genes for characterisation of Staphylococcus species ....................................................... 37
1.7 Project Hypothesis and Specific Aims .............................................................................. 40
2. Methods and Materials ................................................................................................. 44
2.1 Study Design and Limitations........................................................................................... 44
2.2 Sample Collection ............................................................................................................ 45
2.3 Isolation and Phenotypic Identification of S. aureus from Residential Air Samples ........... 54
2.4 DNA Extraction ............................................................................................................... 57
2.5 Identification of Isolates as S. aureus using species-specific PCR ..................................... 58
2.6 Identification of Methicillin-resistant S. aureus (MRSA) and Related Species .................. 58
2.7 PCR Amplification of the pta Gene .................................................................................. 59
2.8 DNA Sequencing (16S rDNA and tuf gene) ...................................................................... 60
3. Results ......................................................................................................................... 65

7
3.1 Total Bacterial Colony Count Results ............................................................................... 65
3.2 Identification of Isolates Using Biochemical Tests ............................................................ 75
3.3 Identification of Isolates Using Molecular Based Methods ................................................ 81
3.4 pta Gene Amplification and Enzyme Digestion ................................................................ 81
3.5 16S rDNA and tuf Gene Sequencing Results .................................................................... 82
3.6 Identification of Methicillin-resistant Isolates ................................................................... 88
4. General Discussion ...................................................................................................... 94
4.1 Total Bacterial Colony Counts.......................................................................................... 94
4.2 Analysis of Biochemically Defined Staphylococcus aureus and Related Species............... 96
4.3 Molecular Identification of Staphylococcus aureus and Related Species ........................... 98
4.4 Methicillin-resistant Staphylococci in Residential Air ..................................................... 102
4.5 Overall Summary ........................................................................................................... 104
4.6 Future Directions ........................................................................................................... 105
5. References ................................................................................................................. 109
6. Appendix ................................................................................................................... 127
(A) Total Bacteria Colony Count Data………………………………………………….………125 (B) Biochemical and Molecular Test Results Analysis…………………...………………….…135 (C) Molecular Test Results………………..……………………………………………….……151

8
List of Figures Figure 1 : Life cycle of microorganisms in the atmosphere............................................................... 23
Figure 2 : Overview of genus Staphylococcus .................................................................................. 27
Figure 3: Increasing burden of S. aureus resistance .......................................................................... 33
Figure 4: 16SrRNA gene illustrating the conserved (green) and variable (grey) regions.................... 37
Figure 5 : Map of sampling locations for all Flood affected houses. ................................................. 46
Figure 6 : Map of sampling locations for all Non-flood affected houses. .......................................... 49
Figure 7 : Bacterial colonies on TSA strips ...................................................................................... 54
Figure 8 : Presumptive S. aureus on Mannitol Salt Agar (MSA)....................................................... 55
Figure 9 : Inoculated DNase agar plate ............................................................................................ 56
Figure 10 : Work flow diagram for bacterial isolation ...................................................................... 62
Figure 11 : Distribution of total bacterial colony count (cfu/m3) results in flood affected houses...... 68
Figure 12 : Distribution of total bacterial colony count (cfu/m3) results in non-flood houses ............. 68
Figure 13 : Average indoor & outdoor total bacterial colony counts in flood affected houses............ 72
Figure 14 : Average indoor & outdoor total bacterial colony counts in non-flooded houses .............. 73
Figure 15 : Presumptive staphylococcus isolates obtained from flood affected houses ...................... 80
Figure 16 : Presumptive staphylococcus isolates obtained from non-flooded houses ......................... 80
Figure 17: Agarose gel image of enzyme digested pta gene.............................................................. 81
Figure 18 : Phylogenetic tree base on the tuf gene sequences of Staphylococcus species .................. 84
Figure 19 : Phylogenetic tree based on the 16S rRNA gene sequences of Staphylococcus species..... 85
Figure 20 : Methicillin-resistant staphylococcus isolates from flood affected houses ........................ 90
Figure 21 : Methicillin-resistant staphylococcus isolates from non-flooded houses ........................... 90

9
List of Tables Table 1 : Summary of previous literature on indoor bacterial identification to the genus level .......... 19
Table 2 : List of airborne pathogenic bacteria causing diseases in humans and animals .................... 22
Table 3: Three major groups of Staphylococci based on DNA-DNA hybridization studies ............... 25
Table 4 : Sampling locations and collection dates for flooded houses ............................................... 52
Table 5 : Sampling locations and dates for non-flooded houses ........................................................ 53
Table 6 : Primer sequences for nucA, mecA, tuf, pta and 16S rDNA genes ....................................... 61
Table 7 : Averages of total bacterial colony counts (cfu/m3) for flood affected houses ...................... 65
Table 8 : Averages of total bacterial colony counts (cfu/m3) for non-flooded houses ........................ 66
Table 9 : Analysis of distribution of total bacterial colony count results (cfu/m3) .............................. 67
Table 10 : t- test results for total bacterial colony count data comparing bedroom, living room and
outdoor ............................................................................................................................. 69
Table 11 : Indoor and outdoor colony count ratios of flood affected houses (indoor vs. outdoor) ...... 70
Table 12 : Indoor and outdoor colony count ratios of non-flooded houses (indoor vs outdoor) .......... 71
Table 13 : p values for flood affected vs. non flooded indoor and outdoor total bacterial colony count
results ............................................................................................................................... 74
Table 14 : t-test results for presumptive staphylococcus colony results comparing bedrooms, living
rooms and outdoors .......................................................................................................... 76
Table 15 : Presumptive staphylococcus colonies obtained from air of flood affected houses after
biochemical testing (indoor: outdoor) ................................................................................ 77
Table 16 : Presumptive staphylococcus colonies obtained from air of non-flooded houses after
biochemical testing (indoor: outdoor) ................................................................................ 78
Table 17 : p-values for flood affected vs. non-flooded indoor and outdoor presumptive staphylococcus
colony results ................................................................................................................... 79
Table 18 : Species identification based on tuf gene sequences and abundance of each species .......... 82
Table 19 : Species identification based on 16S rDNA sequences and the abundance of each species 83
Table 20 : Sample identification (ID) corresponding to each number shown in the phylogenetic tree 86
Table 21 : Methicillin-resistant staphylococcus isolates obtained from air of flood affected houses .. 88
Table 22 : Methicillin-resistant staphylococcus isolates obtained from air of non-flooded houses ..... 89
Table 23 : Methicillin-resistant Staphylococcus species ................................................................... 91
10
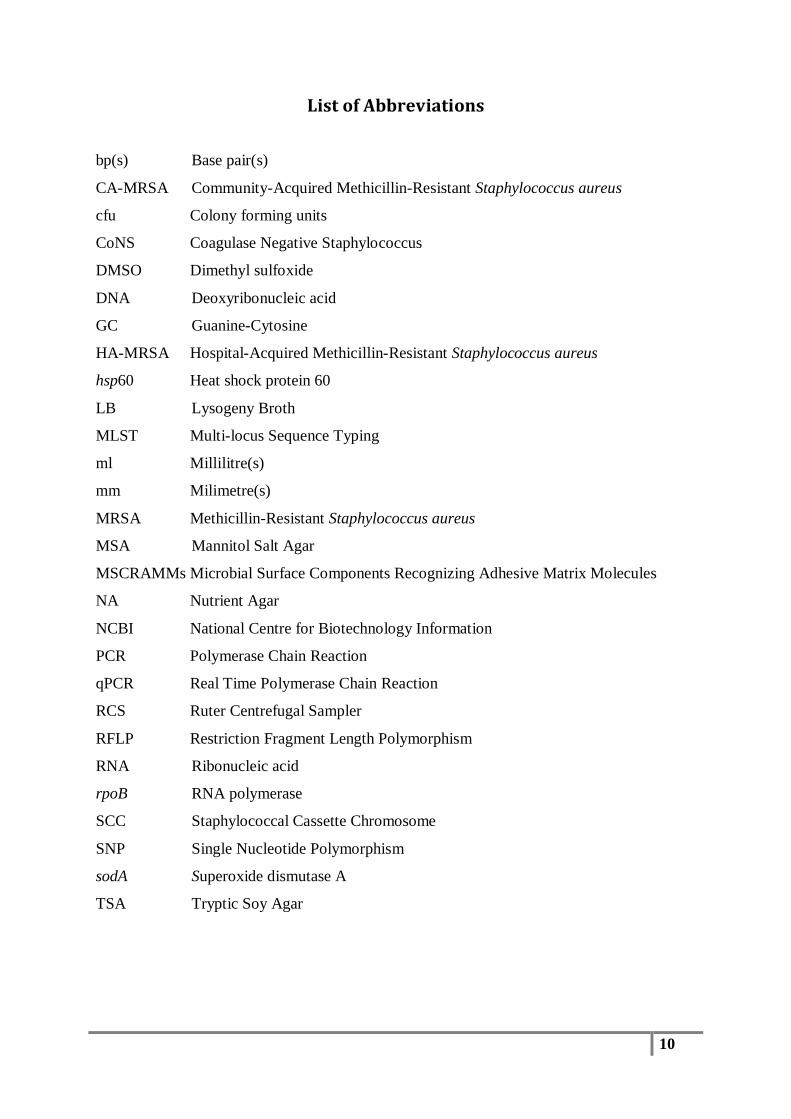
List of Abbreviations
bp(s) Base pair(s)
CA-MRSA Community-Acquired Methicillin-Resistant Staphylococcus aureus
cfu Colony forming units
CoNS Coagulase Negative Staphylococcus
DMSO Dimethyl sulfoxide
DNA Deoxyribonucleic acid
GC Guanine-Cytosine
HA-MRSA Hospital-Acquired Methicillin-Resistant Staphylococcus aureus
hsp60 Heat shock protein 60
LB Lysogeny Broth
MLST Multi-locus Sequence Typing
ml Millilitre(s)
mm Milimetre(s)
MRSA Methicillin-Resistant Staphylococcus aureus
MSA Mannitol Salt Agar
MSCRAMMs Microbial Surface Components Recognizing Adhesive Matrix Molecules
NA Nutrient Agar
NCBI National Centre for Biotechnology Information
PCR Polymerase Chain Reaction
qPCR Real Time Polymerase Chain Reaction
RCS Ruter Centrefugal Sampler
RFLP Restriction Fragment Length Polymorphism
RNA Ribonucleic acid
rpoB RNA polymerase
SCC Staphylococcal Cassette Chromosome
SNP Single Nucleotide Polymorphism
sodA Superoxide dismutase A
TSA Tryptic Soy Agar

11

12
Acknowledgement
First and foremost, I would like to thank my principal supervisor Associate Professor Flavia Huygens
for her excellent academic guidance, encouragement, understanding, patience and kindness
throughout the whole journey. I cannot express enough gratitude to her for all the support not only in
terms of academic guidance but also the guidance during hard times of my life. Thank you so much
for all the time and effort you have put into my research project and this project would not have been
possible without her help.
Secondly, I would like to thank my associate supervisor Adjunct Associate Professor Megan
Hargreaves for her great support, guidance and encouragement though out my candidature. I consider
it an honour to have worked with my team of supervisors.
Thirdly, I would like to acknowledge all my colleagues specially, Irani Rathnayake, Annabelle Watts
and Imalka Tennakoon and many more who have been sharing their knowledge, ideas and skills.
From the beginning of my masters I had to work in different laboratories and I would like to thank all
the laboratory staff members who have been supporting me in various ways to make this project a
success. Special notes of thanks to Sue Gill, Marysia Wachtel and Vincent Chand for their kind help
in providing guidance during the laboratory work.
I would not have survived without my husband, Charith and his amazing help in every way. You were
my strength and thank you for your unconditional love and understanding during this journey. I am
indebted to my husband for all these achievements. I have no words to express my gratitude to my
parents and my in-laws who have always given me advice to face life and encouraging me to continue
my Masters journey.
I acknowledge that this project would not have been successful without all these people and many
more. I really appreciate their wonderful support and encouragement which made my Masters
candidature an enriching experience.

13

14
Chapter One
Literature Review
15
1. Updated Literature Review
1.1 Introduction Staphylococci are one of the major pathogens that cause both nosocomial and community
acquired infections throughout the world (Bannerman, 2003). They can be found mainly as
inhabitants of the skin and the mucosal membranes of warm blooded animals. Furthermore,
they can be found in water, air, soil and on/in food materials as well (LeChevallier and
Seidler, 1980, Lighthart and Stetzenbach, 1994, Levin-Edens et al., 2011, Kateete et al.,
2010). The genus Staphylococcus consists of 45 species, and among them S. aureus, S.
epidermidis, and S. saprophyticus (Iorio et al., 2007) are the most common pathogenic
species. Although they can survive in many environments (Nováková et al., 2010), the
majority of studies have focused on clinical isolates and hospital environments. Being one of
the major pathogens responsible for food poisoning, studies have also focused on the
prevalence of staphylococci in food (Silva et al., 2013, Akbar and Anal, 2013, Wendlandt et
al., 2013). As yet, there have been very few studies on residential air as a reservoir of
clinically significant microbial pathogens, particularly Staphylococcus species. The majority
of residential air studies have focused on problems caused by molds and fungi (Hyvärinen et
al., 2001, Miller et al., 2000, Smith et al., 1992, Verhoeff and Burge, 1997), whereas the role
of airborne bacteria and their pathogenicity has remained unclear.
An international survey of infections due to Staphylococcus sp. has found that S. aureus is the
most prevalent cause of hospital and community-acquired bloodstream, skin-soft tissue and
lower respiratory infections (Pfaller et al., 1999). Initially the main concern was relevant to
hospital acquired Methicillin-Resistant S. aureus (MRSA) infections, but according to recent
findings, it is apparent that Community-Acquired MRSA (CA-MRSA) infections are more
common and is a serious health problem (Elston, 2007, Heikens et al., 2005). A lack of
understanding of the pathogenicity of CA-MRSA makes the situation even more severe
(Martineau et al., 2001). Important questions remain whether environmental/ airborne
staphylococci could be the source for community acquired infections.
When considering the potential mechanisms for the dispersal of bacteria in air, water can be
considered as a good conduit. In particular, flood waters can be considered as a very good
medium not only for the transport and spread of bacteria, but also for the spread of viruses,
protozoa and helminths which can directly impact on human health (Centers for Disease
Control and Prevention, 2011). The microbial load of flood water can vary depending on the

16
source of contamination and the volume of water. Increased levels of microbes in
floodwaters increase the risk of human exposure and the likelihood for infection. Several
studies have shown an elevation of microbial contaminants in the environment after a major
flood event (Pardue et al., 2005, Ross et al., 2000, Fabian et al., 2005, Hoppe et al., 2012). In
addition, previous studies have described a link between the presence of molds, fungi and
bacteria in water-damaged buildings and associated health problems (Nevalainen and Seuri,
2005, Andersson et al., 1997, Peltola et al., 2001).
Taking all these facts into account, it is important to observe the total bacterial population in
terms of colony count units in flood affected houses compared to non-flood affected houses.
Since the airborne transmission of S. aureus is also an open question, this study further
investigates S. aureus and related species isolated from residential air samples. In January
2011, about 94 suburbs, including the Brisbane city area, experienced a major flood event
from flood waters of the Brisbane River. The primary objective of this study was to
determine the prevalence of S. aureus and related species using molecular methods and to
determine the prevalence of methicillin-resistant staphylococci in residential air.
This project forms part of a larger study investigating fungi and particulate matter in post-
flooded homes conducted by the International Laboratory for Air Quality and Health
(ILAQH) at QUT. One of the first outcomes of this major project has been the publication of
a paper entitled “The Impact of Flood and Post Flood Cleaning on Airborne Microbiological
and Particle Contamination in Residential Houses” which was published in Environment
International in April 2014. In addition, part of this work has been presented at the “10th
International Healthy Buildings Conference 2012” in July 2012 held in Brisbane,
Queensland.

17
1.2 Flood
Flood is a common natural disaster that accounts for 40%-50% of deaths caused by all natural
disasters worldwide (Clauss et al., 2013, Noji, 1991). The frequency and intensity of flood
events are expected to increase as a result of climate change, altered precipitation patterns
and rises in sea levels (Browder et al., 1965, Kumar, 2008). In addition to loss of lives and
property damages, flood events raise the risk of waterborne diseases (including typhoid,
diarrhoea, cholera) vector-borne diseases and many other health problems (Bannoehr et al.,
2007, Kloos et al., 1998). Flood water is a potential carrier of pathogenic bacteria as well as
many other chemical materials at elevated concentrations. It can be contaminated by
agricultural lands, industrial areas, breakdown of sewage lines, animal faecal matter etc. All
these pollutants together represent a huge risk to human health (Centre for Disease Control
and Prevention, 2002, Wade et al., 2004) not only from direct contact with flood waters but
also from contaminated surfaces and soil, even after a period of time following the flood
event. Chemical and biological pollutants that are carried by flood water can shed to the
surrounding atmosphere mainly from contaminated soil, plant materials and other
contaminated surfaces such as house walls, carpets etc. Moreover, flooded areas can become
a source and reservoir for pathogens, which can impact on the health of residents through
various transmission pathways (Taylor et al., 2011). One of the transmission pathways is
aerosolization of part or all of the micro-organisms into the indoor air.
Many studies mainly focus on investigating only flood water, however, little is known about
the spread and proliferation of bacteria in air following flood events. An area can be
inundated only for short period of time, but the biological and chemical pollutants brought
about by flood water can have long term implications on water bodies, soil and air. Surfaces
that come into contact with polluted flood water can be contaminated, and a portion of
pollutants can be retained even after flood waters have receded. Flood water contains large
amounts of nutrients that support the growth of microorganisms. Wind has been identified as
a potential aerosolization mechanism for viable microorganisms in wastewater (Jensen et al.,
1994). Bacteria in flood water transfer to soil, and when disturbed, these bacteria can be
aerosolized and can be inhaled and cause health problems. Therefore it is important to study
the prevalence of potentially pathogenic bacteria in residential air samples following major
flood events.

18
In 2010 December-2011 January, Queensland experienced a major flood event due to
extensive rain fall and more than 78% of the state was declared a disaster zone. Thirty-three
people died and over 2.5 million people were affected. According to the Queensland
Reconstruction Authority estimation, the cost of this flood event will be in excess of $5
billion (Queensland Floods Commission of Inquiry, 2012). Although this was an unfortunate
event, the situation provided a rare opportunity to study the impact of the flood on airborne
bacterial concentrations in residential indoor and outdoor environments.
1.3 Microbiology of Air (Aeromicrobiology)
In addition to gases, dust particles and water vapour, air also contains microorganisms such
as bacteria, fungi, pollen, algae, yeasts and protozoans (Elston, 2007, Hargreaves et al.,
2003). The study of these microbes suspended in air is known as Aeromicrobiology. Since we
all breathe air, the microbial population in air is in constant interaction with human and
animal life, both directly as a source of pathogenic and beneficial microbes (Kellogg and
Griffin, 2006) and indirectly through biological effects on atmospheric processes
(Deguillaume et al., 2008). They can cause infectious diseases such as tuberculosis
(Hauschild et al., 2010), Legionnaire’s disease (Al Masalma et al., 2010), various forms of
bacterial pneumonia, influenza (Bergeron et al., 2011), measles (Yuan et al., 2007), as well as
some non-infectious diseases such as asthma, allergies (Hoppe et al., 2012, Heederik and
Douwes, 1997, Taylor et al., 2011) and sick building syndrome etc. Among all of the
aforementioned groups of microorganisms, bacteria and fungi are of great concern as the
leading airborne pathogens that can lead to large economical as well as ecological
consequences (McCartney et al., 2003). Despite these public health concerns and the
environmental implications, microbial characterizations of the atmosphere, in particular
residential indoor and outdoor air, have been poorly investigated.
There are many inconsistencies with regards to the current understanding of atmospheric
chemistry or the microbial characterization of aquatic and terrestrial environments (Womack
et al., 2010, Peccia and Hernandez, 2006). Residential or domestic indoor and outdoor
environments are places where people spend the greatest proportion of their time (Awad and
Farag, 1999, U.S. Environmental Protection Agency, 1989). Thus, this is of special
importance as it could be a good source of dispersal for disease causing agents. Therefore,

19
indoor and outdoor air can be monitored for particular pathogenic bacteria or fungi and their
concentrations, susceptibility to available antibiotics, types of virulence profiles, organism’s
active factor dose or the organism reactions. When analysing these factors it would be
possible to predict the risks to human health (Safatov et al., 2008).
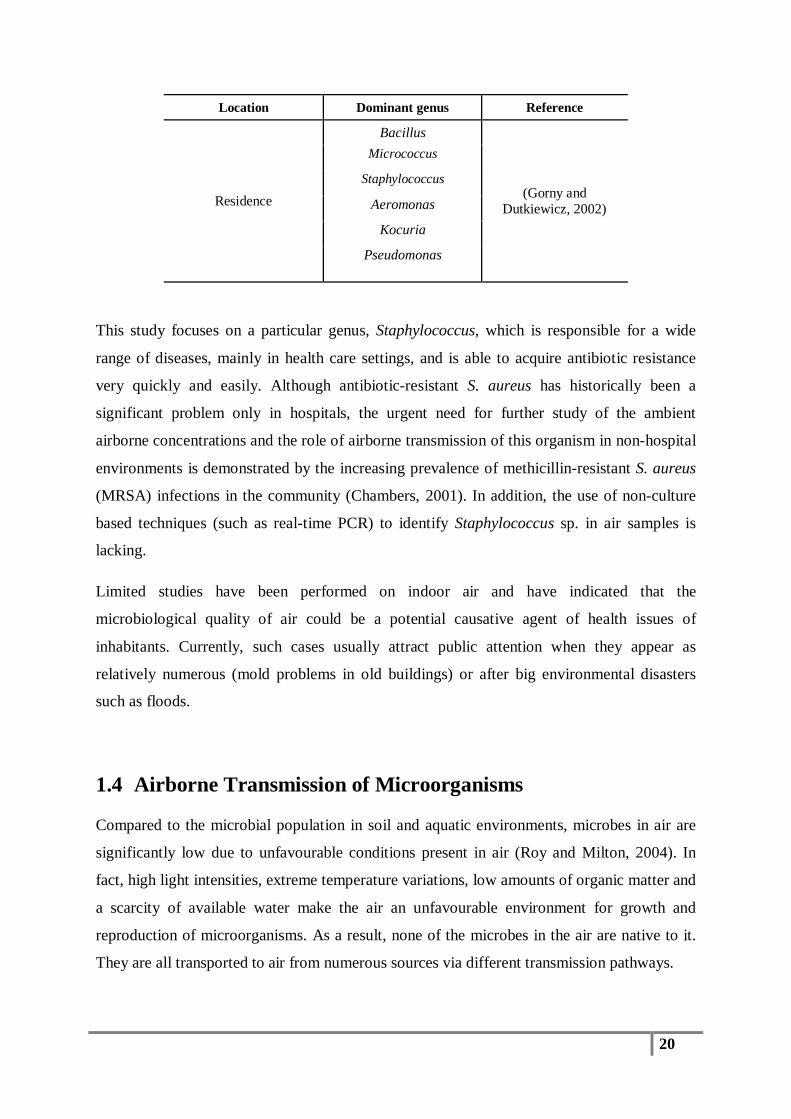
According to the literature, typical and the most important bacterial genera found in the
indoor environment are Staphylococcus, Bacillus, Micrococcus, Streptococcus, and
Pseudomonas (Stellman, 1998, Freney et al., 1999). Table 1 summarises previous studies on
airborne bacteria in various indoor environments and the dominant genera found in each
study. Not only that, there are evidences showing that the bacteria in cloud droplets are also
capable of growth and reproduction (Sattler et al., 2001, Amato et al., 2007)
Table 1 : Summary of previous literature on indoor bacterial identification to the genus level
Location Dominant genus Reference
Hospital (Pulmonary units)
Bacillus
(Gilbert et al., 2010) Micrococcus
Staphylococcus
Hospital (main lobby, ICU, surgical ward and biomedical laboratory)
Bacillus
(Kim et al., 2010) Micrococcus
Staphylococcus
Corynebacterium
Museum
Bacillus
(Niesler et al., 2010) Micrococcus
Staphylococcus
Corynebacterium
Museum
Bacillus
(Chen et al., 2010)
Micrococcus
Staphylococcus
Pseudomonas
Arthrobacte
Office
Bacillus
(Zhu et al., 2003) Micrococcus
Staphylococcus
Office
Micrococcus (Tsai and Macher,
2005) Staphylococcus
20
Location Dominant genus Reference
Residence
Bacillus
(Gorny and Dutkiewicz, 2002)
Micrococcus
Staphylococcus
Aeromonas
Kocuria
Pseudomonas
This study focuses on a particular genus, Staphylococcus, which is responsible for a wide
range of diseases, mainly in health care settings, and is able to acquire antibiotic resistance
very quickly and easily. Although antibiotic-resistant S. aureus has historically been a
significant problem only in hospitals, the urgent need for further study of the ambient
airborne concentrations and the role of airborne transmission of this organism in non-hospital
environments is demonstrated by the increasing prevalence of methicillin-resistant S. aureus
(MRSA) infections in the community (Chambers, 2001). In addition, the use of non-culture
based techniques (such as real-time PCR) to identify Staphylococcus sp. in air samples is
lacking.
Limited studies have been performed on indoor air and have indicated that the
microbiological quality of air could be a potential causative agent of health issues of
inhabitants. Currently, such cases usually attract public attention when they appear as
relatively numerous (mold problems in old buildings) or after big environmental disasters
such as floods.
1.4 Airborne Transmission of Microorganisms
Compared to the microbial population in soil and aquatic environments, microbes in air are
significantly low due to unfavourable conditions present in air (Roy and Milton, 2004). In
fact, high light intensities, extreme temperature variations, low amounts of organic matter and
a scarcity of available water make the air an unfavourable environment for growth and
reproduction of microorganisms. As a result, none of the microbes in the air are native to it.
They are all transported to air from numerous sources via different transmission pathways.
21
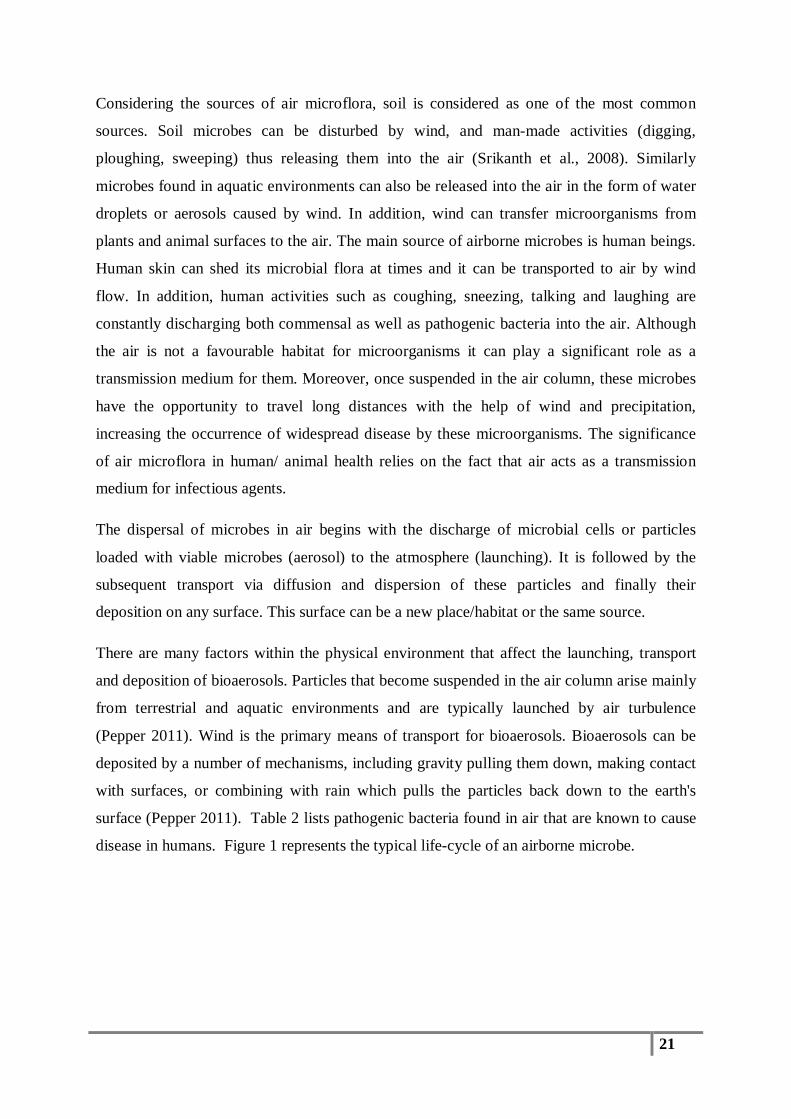
Considering the sources of air microflora, soil is considered as one of the most common
sources. Soil microbes can be disturbed by wind, and man-made activities (digging,
ploughing, sweeping) thus releasing them into the air (Srikanth et al., 2008). Similarly
microbes found in aquatic environments can also be released into the air in the form of water
droplets or aerosols caused by wind. In addition, wind can transfer microorganisms from
plants and animal surfaces to the air. The main source of airborne microbes is human beings.
Human skin can shed its microbial flora at times and it can be transported to air by wind
flow. In addition, human activities such as coughing, sneezing, talking and laughing are
constantly discharging both commensal as well as pathogenic bacteria into the air. Although
the air is not a favourable habitat for microorganisms it can play a significant role as a
transmission medium for them. Moreover, once suspended in the air column, these microbes
have the opportunity to travel long distances with the help of wind and precipitation,
increasing the occurrence of widespread disease by these microorganisms. The significance
of air microflora in human/ animal health relies on the fact that air acts as a transmission
medium for infectious agents.
The dispersal of microbes in air begins with the discharge of microbial cells or particles
loaded with viable microbes (aerosol) to the atmosphere (launching). It is followed by the
subsequent transport via diffusion and dispersion of these particles and finally their
deposition on any surface. This surface can be a new place/habitat or the same source.
There are many factors within the physical environment that affect the launching, transport
and deposition of bioaerosols. Particles that become suspended in the air column arise mainly
from terrestrial and aquatic environments and are typically launched by air turbulence
(Pepper 2011). Wind is the primary means of transport for bioaerosols. Bioaerosols can be
deposited by a number of mechanisms, including gravity pulling them down, making contact
with surfaces, or combining with rain which pulls the particles back down to the earth's
surface (Pepper 2011). Table 2 lists pathogenic bacteria found in air that are known to cause
disease in humans. Figure 1 represents the typical life-cycle of an airborne microbe.

22
Table 2 : List of airborne pathogenic bacteria causing diseases in humans and animals
Human Disease Pathogen
Pulmonary tuberculosis Mycobacterium tuberculosis
Pneumonia Klebsiella pneumoniae
Pulmonary anthrax Bacillus anthracis
Legionellosis Legionella sp.
Whooping cough Bordetella pertussis
Diphtheria Corynebacterium diphtheriae
Brucellosis Brucella melitensis
Respiratory infections Streptococcus pyogenes, Staphylococcus aureus
Meningococcal infection Neisseria meningitidis
Tuberculosis Mycobacterium bovis
Brucellosis Brucella sp.
Salmonellosis Salmonella sp.
Source: (Elston, 2007, Salgado et al., 2003)

23
http://microbewiki.kenyon.edu/index.php/Aeromicrobiology
Figure 1 : Life cycle of microorganisms in the atmosphere
Microbes are emitted from surfaces of water, soil, vegetation. They are airborne and transported upward by turbulent fluxes. They are subject to environmental conditions such as UV, extreme temperature variations, desiccation etc. and finally, they can colonise new or the same environment that they emitted from via wet or dry deposition (Amato, 2012).
1.4.1 Transmission of Staphylococcus aureus
Individuals shed staphylococci into their surrounding environment and the extent to which a
carrier sheds their strain into the environment varies. When the individual is colonized with
large quantities of staphylococci, they are considered as a “cloud adult”. This is seen in
individuals with an upper respiratory tract infection or those with exfoliative skin conditions
(Dancer, 2008). Airborne transmission of S. aureus, and associated health risks, remains
debatable. Many microbiologists argue that patients are more likely to acquire the organism
from the hands of health-care workers rather than directly from the air.
Although many bacteria have traditionally been considered to be involved in disease
transmission only via large droplets over short distances or through contact with
contaminated surfaces, it has been suggested that this paradigm must be questioned to

24
improve prevention of aerosol-acquired disease (Roy and Milton, 2004) Recent findings
suggest that aerosolized MRSA have a role in nosocomial infections(Layer et al., 2007,
Shiomori et al., 2001).
Many S. aureus studies include isolates from clinical and clinically sourced environments.
Very little information is available on environmental isolates of S. aureus and related species,
particularly in residential air. Although, the indoor air quality especially from the microbial
perspective has not been studied much, it is very important to determine the presence of
staphylococci that could pose a threat to the occupant’s health and wellbeing. Usually, a dry
environment is considered as a battle ground for bacteria to survive. Conversely, an
environment with high humidity and moist levels provides more favourable conditions for
extensive growth of bacteria. This in turn would increase the bacterial population inside
flooded houses, and this hypothesis has not yet been tested before.
1.5 Genus Staphylococcus (Taxonomy)
According to the current knowledge, including the newly described species published in
2009–2010, the genus Staphylococcus consists of 45 species and 21 subspecies (Al Masalma
et al., 2010, Hauschild et al., 2010, Nováková et al., 2010, Riesen and Perreten, 2010, Supré
et al., 2010). Based on comparative 16S rRNA gene sequence studies, the genus
Staphylococcus belongs to the phylum Firmicutes (Gram-positive bacteria) with a low DNA
G+C content of <50 mol% (Schleifer, 2009). It is closely related to bacilli and other members
of the phylum Firmicutes such as macrococci, enterococci, streptococci, lactobacilli, and
listeria (Schleifer, 2009). The nearest relative of Staphylococcus appears to be the relatively
novel genus Macrococcus which was proposed in 1998 (Mathema et al., 2009).
Staphylococci are Gram-positive, nonmotile microbes forming cells of 0.5 – 1.5 µm in
diameter. The cell wall contains peptidoglycan and teichoic acid. The cells are resistant to
lysis by the lysozyme enzyme (Bera et al., 2007) but susceptible to lysis by lysostaphin (HP
and WA, 1965, Kumar, 2008)
Staphylococcal species are widely distributed in various environments: the skin and mucous
membranes of warm blooded animals as well as in soil, sand, water and air. Some
staphylococcal species such as S. xylosus and S. carnosus are used as starter cultures for

25
sausage manufacturing in the food industry (Corbiere Morot-Bizot et al., 2007), whereas
others are mainly associated with human and animal diseases. Of the 45 species and 21
subspecies, only half have been cultured from human specimens.
According to Bergey’s manual (Schleifer, 2009) staphylococci can be divided into three
major groups as described in Table 3 below:
Table 3: Three major groups of Staphylococci based on DNA-DNA hybridization studies
(Freney et al., 1999, Vernozy-Rozand et al., 2000, Supré et al., 2010, Lambert et al., 1998, Al Masalma et al., 2010, Pantůček et al., 2005)
Coagulase Negative Coagulase Positive
Novobiocin-susceptible species
Novobiocin-resistant species Novobiocin-susceptible species
S. epidermidis S. saprophyticus subsp. saprophyticus
S. aureus
S. capitis subsp. capitis S. saprophyticus subsp. bovis S. aureus subsp. anaerobius
S. capitis subsp. urealyticus S. cohnii subsp. cohnii S. delphini
S. caprae S. cohnii subsp. urealyticus S. intermedius
S. haemolyticus S. sciuri subsp. sciuri S. lugdunensis
S. hominis S. sciuri subsp. carnaticus S. lutrae
S. saccharolyticus S. lentus S. pseudintermedius
S. warneri S. vitulinus S. schleiferi
S. simulans S. xylosus
S. carnosus S. arlettae
S. auricularis S. equorum
S. condiment S.fleurettii
S. chromogenes S. gallinarum
S. devriesei S. kloosii
S. felis S. nepalensis
S. massiliensis S. succinus

26
Coagulase Negative
Coagulase Positive
Novobiocin-susceptible species
Novobiocin-resistant species Novobiocin-susceptible
species
S. microti S. stepanovicii
S. nuscae
S. pasteuri
S. pettenkoferi
S. pulvereri
S. piscifermentans
S. rostri
S. simiae
27
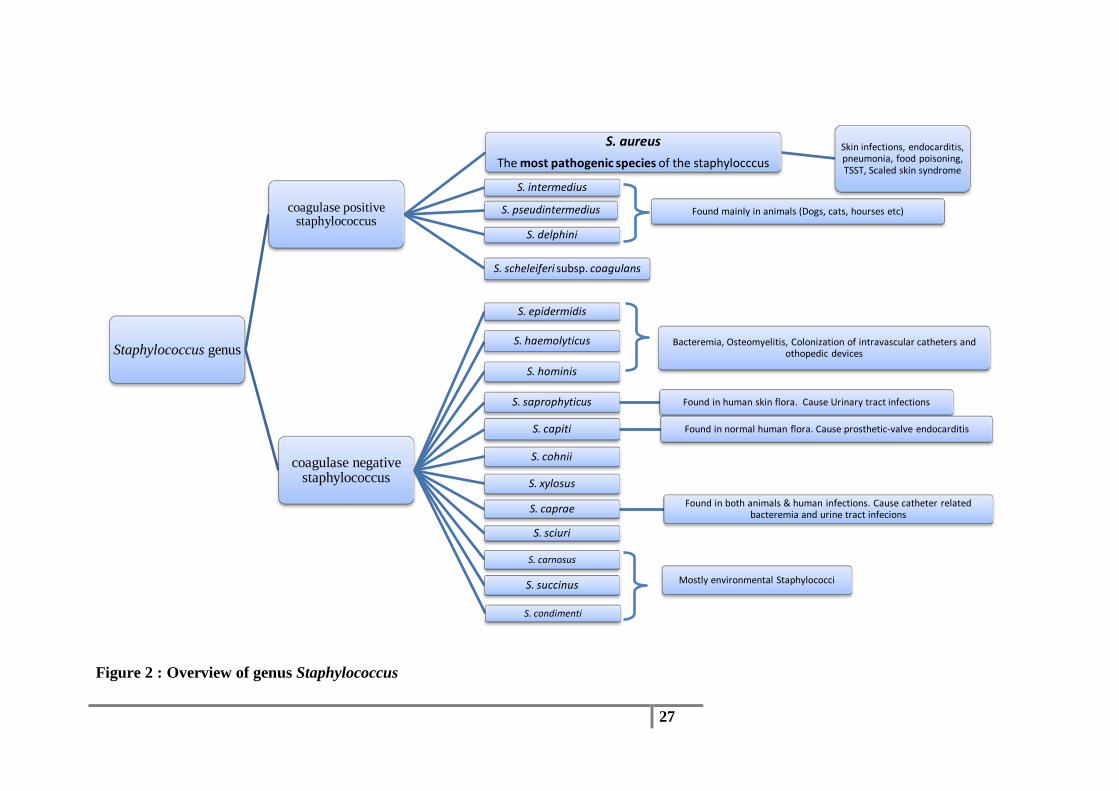
Figure 2 : Overview of genus Staphylococcus
Staphylococcus genus
coagulase positive staphylococcus
S. aureus The most pathogenic species of the staphylocccus
Skin infections, endocarditis, pneumonia, food poisoning, TSST, Scaled skin syndrome
S. intermedius
S. pseudintermedius
S. delphini
S. scheleiferi subsp. coagulans
coagulase negative staphylococcus
S. epidermidis
S. haemolyticus
S. hominis
S. saprophyticus Found in human skin flora. Cause Urinary tract infections
S. capiti Found in normal human flora. Cause prosthetic-valve endocarditis
S. cohnii
S. xylosus
S. caprae Found in both animals & human infections. Cause catheter related bacteremia and urine tract infecions
S. sciuri
S. carnosus
S. succinus
S. condimenti
Found mainly in animals (Dogs, cats, hourses etc)
Bacteremia, Osteomyelitis, Colonization of intravascular catheters and othopedic devices
Mostly environmental Staphylococci
28
1.5.1 Staphylococcus aureus
Domain – Bacteria Kingdom – Eubacteria Phylum – Firmicutes Class – Bacilli Family – Staphylococcaceae Genus – Staphylococcus Species - aureus S. aureus is one of the most common causes of life-threatening bacterial infections. Every
year in the United States, roughly 400,000 hospital patients are infected by S. aureus and
approximately 100,000 of these patients die from complications due to S. aureus infections
(Freeman-Cook and Freeman-Cook, 2005).
S. aureus is a Gram-positive, facultative anaerobic bacterium which forms golden coloured
colonies due to the production of carotenoid pigments. The cell division of this microbe takes
place in more than one plane thus, the colonies resemble grape like clusters. The diameter of
a cell varies from 0.5-1.5µm (Harris et al., 2002). Moreover, S. aureus is a non-flagellated,
non-motile and non-spore forming microbe and produces both catalase and coagulase
enzymes (Ryan et al., 2004). The basis of differentiation of S. aureus from other
Staphylococcus species is its ability to ferment mannitol and production of a yellow zone
around the colony on Mannitol Salt Agar (MSA) medium. Other than mannitol, S. aureus is
able to metabolize other carbohydrates such as glucose, , lactose, sucrose and maltose
(Crossley et al., 2009). They are oxidase-negative and require complex nutrients such as
many amino acids and vitamin B for their growth.
Although 37 species of Staphylococcus are described in Bergey's Manual of Systematic
Microbiology (Schleifer, 2009), only a few species, in particularly S. aureus and S.
epidermidis are significant in their interactions with humans. Historically, S. aureus has been
recognized as an important cause of disease around the world and it has become a major
pathogen associated with both hospital and community- acquired infections (Palavecino,
2007). The majority of the other species belonging to this genus are harmless and are
considered members of the skin and mucous flora of humans and other animals. S. aureus can
frequently be found as a part of human microflora, acting as a pathogen only when the
immune system becomes compromised. Although S. aureus can be found in/on different parts
of the body, the anterior nares are their primary ecological niche in humans (Shittu et al.,
2007) and this colonization leads to increased risk of infection when the host defences are
29
compromised. One-third of humans harbor S. aureus in their nares, which serve as a reservoir
for the spread and infection of this pathogen (Peacock et al., 2001, Persing and Tenover,
2004). The population can be divided into three types based on the pattern of nasal carriage
of S. aureus as persistent carriers (20%), intermittent carriers (70%) and non-carriers (30%)
(Peacock et al., 2001, Kluytmans et al., 1997)
S. aureus is capable of growing at a wide pH range (4.8-9.4), can survive at high
temperatures such as 60 0C for 30 min and are resistant to desiccation(Crossley et al., 2009).
Moreover, this organism can tolerate 7.5- 10% of salt concentration due to the production of
osmoprotectants (Graham and Wilkinson, 1992). If conditions for growth are not favourable,
S. aureus can enter into a dormant stage and can survive for years until conditions become
favourable. In fact, the ability to survive under extreme environmental conditions is an
advantage enabling the bacteria to become a life-threatening pathogen. In addition, the
extremely thick cell wall of this bacterium helps it to exist with the highest internal pressure
compared to any type of bacteria (Freeman-Cook and Freeman-Cook, 2005).
S. aureus is one of the most clinically significant pathogens identified, and causes a very
broad range of infections including impetigo, folliculitis, superficial and deep skin abscesses,
wound infections, osteomyelitis, suppurative arthritis, pneumonia, pleural emphysema,
meningitis, septicemia and endocarditis, toxic shock syndrome, scalded skin syndrome, and
food poisoning (Crossley et al., 2009, Whitt and Salyers, 2002). The SENTRY Surveillance
Program investigating worldwide S. aureus infections during a two-year period has revealed
that this pathogen is the leading cause of bloodstream, lower respiratory tract and skin/soft
tissues infections in all regions surveyed (Diekema et al., 2001).
There are two types of S. aureus strains, Methicillin-Susceptible S. aureus (MSSA) and
Methicillin-Resistant S. aureus (MRSA). MRSA can again be divided into two types, namely,
Community-Acquired Methicillin-Resistant S. aureus (CA-MRSA) and Hospital-Acquired
Methicillin-Resistant S. aureus (HA-MRSA) (Lindsay, 2008). A major habitat for MRSA are
hospital environments and they are considered a serious hospital-acquired pathogen because
they can cause large outbreaks that are frequently difficult to treat using antibiotics (Lindsay,
2008). In 1974, MRSA infections accounted for 2% of the total number of staphylococcal
infections; in 1995 it was 22% and in 2004 it was 63%. In addition, the occurrences of staph
infections in general have been increasing every year for the past decade (Enright et al.
2002).

30
CA-MRSA strains were initially phenotypically and genetically distinct from those
established in healthcare settings. Over the past decade, CA-MRSA has emerged as a major
cause of disease in the general population with no or lack of health care exposure or known
classical risk factors for MRSA infections (Levin-Edens et al., 2011). More recently, MRSA
strains have been isolated from marine water and intertidal sand samples from five beaches in
Washington State, USA (Soge et al., 2009). Although, the source of S. aureus and MRSA
contamination in marine environments have yet to be characterized (Levin-Edens et al.,
2011), two researches, Elmir et al. (2007) and Plano et al. (2011) have suggested that bathers
are a potential source, indicating that the S. aureus shedding rate of the average person is 105-
106 cfu /ml within the first 15 minutes of water immersion.
1.5.2 Genome of Staphylococcus aureus
The S. aureus genome consists of a circular chromosome of approximately 2.8 million base
pairs (Mb) in size, with a G+C content of about 33% (Crossley et al., 2009). The
chromosome encodes approximately 2700 CDSs (protein coding sequences) as well as
structural and regulatory RNAs (Lindsay, 2008). Genes governing virulence and resistance to
antibiotics are found on the chromosome as well as the extra chromosomal elements and
hence, the S. aureus genome is composed of a core genome and an accessory components.
The backbone of the genome is determined by the core genes and the organization of these
core genes is highly conserved. Both in silico and microarray analysis have determined that
approximately 75% of the S. aureus genome is considered core sequence due to high
conservation rates within the species (Lindsay and Holden, 2004). The majority of core
genes are associated with fundamental categories of housekeeping functions and central
metabolism (Konrad Plata et al., 2009). The accessory components typically consist of
mobile genetic elements such as pathogenicity islands, genomic islands, prophages,
chromosomal cassettes and transposons (Lindsay and Holden, 2004).
Pathogenicity Islands (SaPI – S. aureus Pathogenicity Islands)
Pathogenicity islands often carry superantigen genes, such as the toxic shock syndrome toxin
and enterotoxins B and C (Lindsay and Holden, 2004). Seven SaPIs in human isolates
(SaPIn1, SaPIm1, SaGIm, vSa3 (MW2), SaPI1, SaPI3 and SaPI4) and two in bovine isolates

31
(SaPIbov and SaPIbov2) have now been sequenced. To date, very little is known about the
pathogenicity, antibiotic resistance and virulence of airborne staphylococci in particularly
derived from residential air.
1.5.3 Antibiotic Resistance of Staphylococcus aureus
i. Penicillin Resistance
The discovery of penicillin by Alexander Fleming (Fleming, 1929) was a great advantage to
the medical industry because of its clinical use as it greatly improved the prognosis for
patients with severe staphylococcal infections (Palavecino, 2007). Before the availability of
antibiotics, invasive infections caused by S. aureus were often fatal. Penicillin is a β-lactam
antibiotic, that has a bactericidal effect by inhibiting Penicillin Binding Proteins (PBP) which
are involved in a vital stage of cell wall biosynthesis (Lyon and Skurray, 1987). Eventually
the bacteria die due to osmosis.
However, soon after the implementation of penicillin into clinical practice, Kirby discovered
in the mid-1940s that penicillin was destroyed by penicillin-resistant strains of S. aureus.
These penicillin- resistant strains were first reported in hospitals and in other communities
(Kirby, 1944). S. aureus becomes resistant to penicillin due to the production of β-lactamase,
an extracellular enzyme, which is capable of hydrolysing the β-lactam ring rendering the β-
lactam inactive. The gene responsible for the resistance determinant linked to β -lactamase
expression is encoded by the blaZ gene maintained on a transposable element of a large
plasmid (Lowy, 2003).
ii. Methicillin Resistance
Methicillin, a semi-synthetic β-lactam antibiotic, was formulated in 1959, as a result of
efforts made to synthesise penicillin derivatives that are able to withstand the activity of β-
lactamase enzymes (Jevons et al., 1961). Methicillin is the first semi-synthetic β-lactamase-
resistant penicillin which was introduced for use in 1961. Methicillin is resistant to β-
lactamases by producing a steric hindrance around the amide bond of the methoxy group of
the molecule, thereby reducing its affinity for staphylococcal β-lactamases (Stapleton and
Taylor, 2002).

32
However, soon after the introduction of methicillin for clinical use, S. aureus strains resistant
to methicillin also evolved. The first MRSA was recorded in the early 1960s in a European
hospital and thereafter these strains have spread worldwide not only in hospital environments
but also in other communities (Stewart and Holt, 1963, Chambers, 1997).
The mechanism for methicillin resistance was not due to the expression of a methicillin-
hydrolysing β-lactamase but through the expression of an altered form of Penicillin Binding
Protein 2a (PBP2a or PBP2') (Stapleton and Taylor, 2002). The mecA gene, which was
acquired from S. sciuri, is responsible for the synthesis of PBP2a, a 78-kDa protein. PBP2a is
also an extracellular enzyme that is required to catalyse the transpeptidation reaction during
biosynthesis of the bacterial cell wall. The advantage of the modified PBP is its low affinity
to β-lactam antibiotics while allowing the transpeptidation reaction. Thus, S. aureus is
capable of surviving high concentrations of methicillin as well as all other β-lactam
antibiotics (Lowy, 2003).
iii. Vancomycin Resistance
Vancomycin, a glycopeptide antibiotic, acts primarily as an inhibitor of cell wall synthesis by
binding to the acetyl-D-alanyl-D-alanine terminus of peptidoglycan subunits (Barna and
Williams, 1984). Since this mechanism of action is distinct from that of β-lactam antibiotics,
vancomycin has been used for the treatment of severe infections caused by methicillin- and β-
lactam-resistant staphylococci. For the last few decades, vancomycin has been the drug of
choice for the treatment of infections caused by MRSA and other Gram-positive bacteria.
The extensive use of the antibiotic has promoted the evolution of resistant microorganisms,
such as vancomycin-resistant Enterococcus species (Oliveira et al., 2001). However, the first
vancomycin- resistant clinical isolate was reported in a strain of S. haemolyticus (Schwalbe et
al., 1987) and in 1997, Vancomycin Intermediate-resistant S. aureus (VISA) was recorded in
Japan (Hiramatsu et al., 1997). Since then, vancomycin-resistant S. aureus strains have been
documented from many other countries (Smith et al., 1999, Tenover et al., 2004, Tiwari and
Sen, 2006).
Two forms of S. aureus resistance to vancomycin have now been identified (Walsh and
Howe, 2002). One has been identified in a vancomycin-intermediate resistant (VISA) strain
which has minimal inhibitory concentration (MIC) to vancomycin of 8-16 µg/ml and the

33
other form identified demonstrated complete vancomycin resistance, VRSA strain, with
MICs of ≥ 128 µg/ml (Palavecino, 2007).
Furthermore, the reduced susceptibility to vancomycin has appeared as a result of changes in
peptidoglycan biosynthesis. The VISA strains are able to synthesise additional quantities of
peptidoglycan with an increased number of D-Ala-D-Ala residues, which can bind to
vancomycin, preventing the molecule from getting to its bacterial target (Palavecino, 2007).
The other form of vancomycin-resistance, VRSA strains are completely resistant to
vancomycin as a result of the acquisition of the vanA operon from an Enterococcus species
that allows synthesis of a cell wall precursor that ends in D-Ala-D-Lac which has
dramatically reduced affinity for vancomycin compared to D-Ala-D-Ala (Wood and Murray,
2000).
Figure 3: Increasing burden of S. aureus resistance
(Henry and Frank, 2009)

34
1.6 Identification Methods for Staphylococcus species
Biochemical assays are routinely used for the identification and characterisation of
staphylococci. Such tests include catalase, coagulase (free coagulase and bound coagulase),
mannitol fermentation; deoxyribonuclease and thermostable endonuclease are some of the
tests that are used to identify Staphylococcus sp. (Winn and Koneman, 2006).
In addition, several manual and automated phenotypic identification systems are also
available for the identification of Staphylococcus sp., such as the ID32 STAPH® strips, the
VITEK 2 GP® identification card and the PID 61 Phoenix system. However, a major
shortcoming of these methods is that they have been designed and their performance
evaluated mainly focusing on the most frequently encountered species isolated from human
clinical samples. Therefore, the sensitivity and specificity of these assays for rare species or
atypical species is not known. In addition, studies have demonstrated that these systems are
incapable of identifying all Staphylococcus sp. (Delmas et al., 2008, Kim et al., 2008, Layer
et al., 2006).
1.6.1 Biochemical methods
i. Mannitol Salt Agar (MSA)
MSA is a selective and differential media which is used for the isolation of pathogenic
staphylococci in particular, S. aureus. This media contains a high salt concentration (7.5% of
NaCl) which inhibits the growth of the majority of other bacterial species except for
Staphylococcus sp. Staphylococci are able to withstand the osmotic pressure upon exposure
to 7.5% NaCl. In addition, MSA contains phenol red as a pH indicator which changes to
yellow at pH values below 6.9 and remains red at pH values above 6.9. When bacteria
ferment mannitol they produce an acidic by-product which in turn drops the pH of the media
and finally changes the colour of the media to yellow. S. aureus is able to grow on MSA
plates and can ferment mannitol. Therefore, the colour around a S. aureus colony changes to
yellow. According to Bergey’s manual (Schleifer, 2009) 19 species show a positive reaction
for mannitol fermentation and some of these are S. capitis subsp. capitis, S. carnosus subsp.
carnosus, S. condiment, S. delphini, S. kloosii, S. saprophyticus subsp. bovis, S. succinus S.
sciuri (Schleifer, 2009).

35
ii. Deoxyribonuclease Test (DNase Test)
In 1956, Weckman and Catlin showed a correlation between increased DNase activities of S.
aureus and positive coagulase activity (Weckman and Catlin, 1957) and they suggested that
DNase activity could be used to identify potentially pathogenic staphylococci.
A deoxyribonuclease (DNase) is any enzyme that catalyses the hydrolytic cleavage of
the phosphodiester linkages in the DNA backbone. Therefore, DNase enzyme producing
organisms depolymerise the DNA molecules into nucleotides when they are cultured on a
media which consists of polymerised DNA. In order to detect this biochemical property,
depolymerised nucleotides dissolve in 1M Hydrochloric acid (HCL) solution. As a result it
forms a clear zone around the inoculum of the DNase positive organisms whereas in DNase
negative organisms, the surrounding media will remain opaque (white halo). Table VII in the
Appendix shows the biochemical characteristics for staphylococcal species. This test is a
simple, inexpensive and rapid method to identify Staphylococcus sp. with greater sensitivity
(Kateete et al., 2010).
1.6.2 Molecular Methods
Recent reports (Blaiotta et al., 2004, Cooper and Feil, 2006, Lindsay and Holden, 2004,
Sasaki et al., 2007) suggest that phenotypic methods have inherent weaknesses due to the
variability in expression of phenotypic characteristics by isolates belonging to the same
species and their reliance on subjective interpretation of test results that can also introduce
variability. Blaiotta and co-workers reported that 25% of staphylococci isolated from
fermented sausages were not identifiable using phenotypic methods (Blaiotta et al., 2004).
Most phenotypic identification systems have been developed for human isolates and
validated using clinical isolates obtained from human infections (Cooper and Feil, 2006,
Sasaki et al., 2007).
Genotypic methods are reported to have higher discriminatory power, reproducibility and
typeability compared to phenotypic methods (Lindsay and Holden, 2004, Sasaki et al.,
2007).Several approaches are available for genotyping bacterial isolates including AFLP
(amplified fragment length polymorphism), ribotyping, Polymerase Chain Reaction -
Restriction Fragment Length Poloymorphism (PCR-RFLP), PCR reactions targeting specific
sequences and DNA sequencing (Geraghty et al., 2013). Several PCR sequencing-based
methods have been developed for the identification of Staphylococcus sp.: 16S rRNA

36
(Becker et al., 2004, Gribaldo et al., 1997), heat shock protein 60 (hsp60) (Goh et al., 1996,
Kwok et al., 1999), superoxide dismutase A (soda) (Poyart et al., 2001), RNA polymerase B
(rpoB) (Drancourt and Raoult, 2002, Mellmann et al., 2006), femA (Vannuffel et al., 1999),
tuf (Heikens et al., 2005) (Martineau et al., 2001), and gap (Layer et al., 2007, Yugueros et
al., 2001) genes have been used as targets. Many studies have demonstrated that genotypic
methods are superior to phenotypic methods (Heikens et al., 2005, Layer et al., 2007).
However, the sequences of some genes are not sufficiently discriminatory to differentiate
closely related Staphylococcus sp., and databases only include a limited number of species
(Bergeron et al., 2011).
i. Polymerase Chain Reaction (PCR)
Polymerase chain reaction (PCR) is an enzymatic reaction in which a sequence of DNA
(usually a specific gene or portion of a gene) is selected and large quantities of copies
produced (Singh et al., 2006). Template DNA, two complementary oligonucleotide primers
and a heat stable DNA polymerase are basic components that are required for conducting a
PCR reaction. Using carefully designed DNA primers, a genetic sequence representing a
specific microorganism, a group of microorganisms, or a microbial function can be targeted,
amplified and quantified. Amplification of target sequence occurs in cycles usually 30-40
cycles and each amplification cycle consists of three phases as described below;
Denaturation – during this phase double-stranded DNA is melted into single
strands
Annealing - primers bind to the target sequence of single-strand DNA
Extension - DNA synthesis proceeds from the primer binding site along the
template strand and generates copies of the original double-stranded DNA
molecule.
PCR can only be performed on DNA sequences. RNA amplification is achieved by first
converting RNA to DNA through a reverse transcriptase process and then PCR amplifying
the resultant DNA.
37
ii. PCR Restriction Fragment Length Polymorphism (PCR-RFLP)
Restriction Fragment Length Polymorphism (RFLP) is identifies differences in homologous
DNA sequences that can be detected by the presence of fragments of different lengths after
digestion of the target DNA fragment with a specific restriction enzyme (restriction
endonuclease) (Nevalainen and Seuri, 2005). Usually this method consists of a PCR reaction
which amplifies a target gene or part of the gene followed by digestion of the PCR product
with a specific restriction endonuclease, which recognizes specific sequences of nucleotides
and produces a double-stranded cut in the DNA (Bannoehr et al., 2009) . Finally an
electrophoretic analysis is performed in order to visualise the resulting DNA fragments of
different lengths. This method therefore can be used to differentiate species and strains of
microorganisms. PCR–RFLP has been described as a fast, simple, accurate and highly
reproducible low cost molecular tool for the identification of bacteria in clinical and
environmental samples (Kim et al., 2008).
1.6.3 Target Genes for Characterisation of Staphylococcus Species
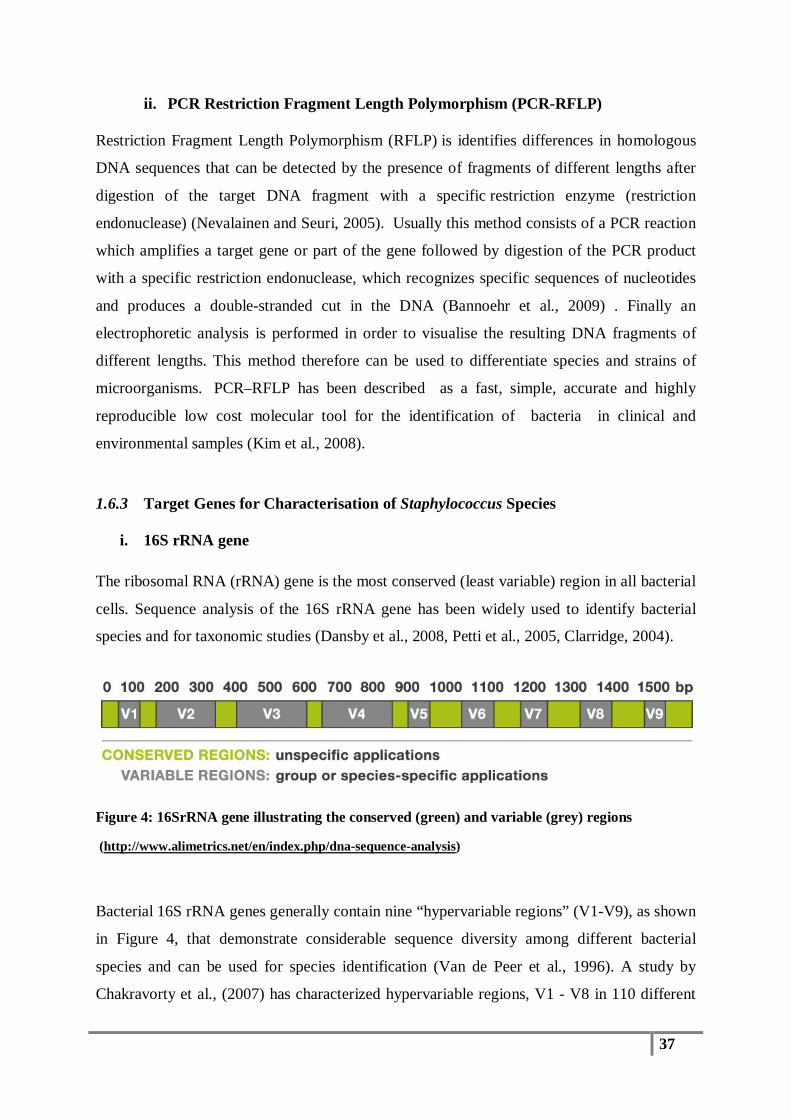
i. 16S rRNA gene
The ribosomal RNA (rRNA) gene is the most conserved (least variable) region in all bacterial
cells. Sequence analysis of the 16S rRNA gene has been widely used to identify bacterial
species and for taxonomic studies (Dansby et al., 2008, Petti et al., 2005, Clarridge, 2004).
Figure 4: 16SrRNA gene illustrating the conserved (green) and variable (grey) regions
(http://www.alimetrics.net/en/index.php/dna-sequence-analysis)
Bacterial 16S rRNA genes generally contain nine “hypervariable regions” (V1-V9), as shown
in Figure 4, that demonstrate considerable sequence diversity among different bacterial
species and can be used for species identification (Van de Peer et al., 1996). A study by
Chakravorty et al., (2007) has characterized hypervariable regions, V1 - V8 in 110 different

38
bacterial species including common blood borne pathogens, CDC-defined select agents and
environmental microflora. In fact they revealed that the V1 region could be used to
distinguish common pathogenic Streptococcus sp. and to differentiate between S.aureus and
coagulase-negative Staphylococcus (CONS) species. Moreover, an alignment of a shorter 28
nucleotide region within V1 spanning nucleotides 70 to 97 (numbering based on S. aureus
16S rRNA gene) for 122 sequences from 31 Staphylococcus species showed that the S.
aureus 16S rRNA gene sequence contained at least 4 unique single nucleotide
polymorphisms (SNPs) in this short region compared to other CONS species at positions
(numbering based on S. aureus 16S rRNA gene) 73, 80, 89 and 90 (except for S. equorum
and S. schleiferi which were identical at position 73 and S. lentus, S. pulvereri and S. sciuri,
which were identical at positions 80, 89 and 90). S. aureus differed from the latter three
CONS species at positions 73 and 76 in the V1 region; therefore, this short sequence is ideal
for designing S. aureus specific probes.
The advantage of sequencing the 16S rRNA gene is that this method has been applied to
characterize a very large number of bacterial species. In fact, there is no other gene that has
been as well characterized in as many bacterial species. Sequences from tens of thousands of
clinical and environmental isolates are available from the National Centre for Biotechnology
Information (www.ncbi.nlm.nih.gov) and the Ribosomal Database Project
(http://rdp.cme.msu.edu/).
ii. nucA gene
S. aureus secretes extracellular thermostable nucleases, known as thermonuclease (TNase),
which is a calcium-dependent enzyme that catalyses the hydrolysis of both DNA and RNA at
the 5' position of the phosphodiester bond yielding 3'-mononucleotides and dinucleotides
(Madison and Baselski, 1983). Therefore, the nucA gene, which encodes the TNases, has
been identified as a reliable target gene for the speciation of S. aureus from other
staphylococci. Until now, this gene has been widely used for the speciation of S. aureus from
different sources (Madison and Baselski, 1983).

39
iii. pta gene
The pta gene which encodes the enzyme phosphoacetyltransferase is present in
Staphylococcus sp. and can be used to differentiate very closely related staphylococcal
species. Bannoehr and his group (2009) have developed a PCR-RFLP diagnostic test for the
differentiation of S. pseudintermedius from S. aureus, S. intermedius and S. delphini based
on the presence of a specific enzyme restriction site, MboI (Bannoehr et al., 2009).
iv. tuf gene
The tuf gene, which encodes the elongation factor (EF-Tu) which is involved in peptide chain
formation and is a part of the core genome (Schmitt et al., 1996). PCR-based assays targeting
the tuf gene have been developed for different bacterial genera, such as genus Enterococcus
(Ke et al., 1999), Mycobacterium sp. (Mignard and Flandrois, 2007), Mycoplasma
fermentans, Mycoplasma pneumoniae sp. and Staphylococcus sp. (Martineau et al., 2001).
Heikens et al., (2005) first proposed partial amplification and sequencing of the tuf gene as a
reliable and reproducible method for the identification of species of staphylococci (Heikens
et al., 2005). Subsequent studies by Hwang et al., (2005) and Loonen et al., (2012) have
confirmed tuf gene sequencing as an accurate method for speciating coagulase-
negative staphylococci (Hwang et al., 2011, Loonen et al., 2012).

40
1.7 Project Hypothesis and Specific Aims
Project Hypothesis:
That S. aureus and related species in air of flood affected and non-flooded houses can be
isolated, quantified and further characterized to species level using genotyping methods.
These methods can define the diversity of different Staphylococcus sp. present in indoor and
outdoor residential air samples from flood affected and non-flooded houses.
Aim 1
Isolation of total culturable bacteria from air of flood affected and non-flooded houses
Objectives:
(A) Determining the total bacterial colony count in both indoor and outdoor air
samples from flood affected and non-flooded houses.
(B) Determining the ratio of indoor vs. outdoor total bacteria colony counts obtained
from air of flood affected and non-flooded houses.
(C) Isolation and identification of S. aureus and related species from indoor and
outdoor air of flood affected and non-flooded houses using phenotypic methods.
(D) Determining the ratio of indoor vs. outdoor S. aureus and related staphylococcal
species isolated from air of flood affected and non-flooded houses.
Aim 2
Genotyping of S. aureus and related species from air of flood affected and non-flooded
houses
Objectives:
(A) Establishing the genus identification of test isolates using the nucA gene and
Real Time PCR
41
(B) Differentiation of S. aureus from S. intermedius, S. delphini, S. pseudintermedius
using PCR and restriction enzyme analyses of the pta gene.
(C) Application of tuf and 16S rDNA sequencing for further speciation of
staphylococcus isolates derived from air samples
Aim 3
Determination of the prevalence of methicillin-resistant S. aureus and related staphylococcal
species isolated from residential air samples.
Objectives:
(A) Application of Real Time PCR for the detection of the mec gene in staphylococcal
species isolated from air of flood affected and non-flooded houses.
(B) Determining the ratio of indoor vs. outdoor methicillin-resistant Staphylococcus
and related species.

42

43
Chapter Two
Methods and Materials
44
2. Methods and Materials 2.1 Study Design and Limitations
This project formed part of a larger study which was conducted by the International
Laboratory for Air Quality and Health (ILAQH) at QUT. This study was aimed at gaining an
understanding of the effect of flooding on the air quality of residential houses in Brisbane.
After sending invitation letters and announcements via QUT’s media office, 41 house owners
were enrolled in the study. Air samples were collected from these houses including 25 flood
affected and 16 non-flooded houses. The project was granted ethics approval, approval
number 1100000117 under the project title of “A Research Project Addressing Air Quality in
Brisbane Homes After the Flood Disaster”. Sampling was started two months after the flood
event of January 2011, and this was the earliest possible time that the study could begin. I
was responsible for all the aerosol sampling, laboratory experiments and the analysis with
regards to the airborne bacteria. Several limitations were identified in this study as described
below.
• All the flood affected houses which agreed to conduct air sampling had already
undergone cleaning and repair processes. Therefore, it was not possible to include a
“baseline house” that was flooded but not cleaned.
• The air sampling of this study was limited to three locations which are living room,
bedroom and outdoor area. Other areas, such as bathroom and kitchen, were not
considered during this study.
• Information about the number of occupants/ pet animals in each house as well as the
occupant’s health was not recorded.
• Information about the cleanliness of the houses was also not available.
• Information about household items/ indoor settings was not available.
• Although the study aimed to culture all the culturable bacteria in the air, did not
include bacteria which require special growth conditions such as high or low
temperatures and different oxygen requirements.
• For the preliminary sampling, Tryptic Soy Agar (TSA) was used since it is a general
media which allows the growth of most bacteria. However, even this general non
selective media will not allow the growth of all bacterial species present in the air. For
instance TSA doesn’t support the growth of fastidious bacteria such as Neisseria
gonorrhoeae.
45
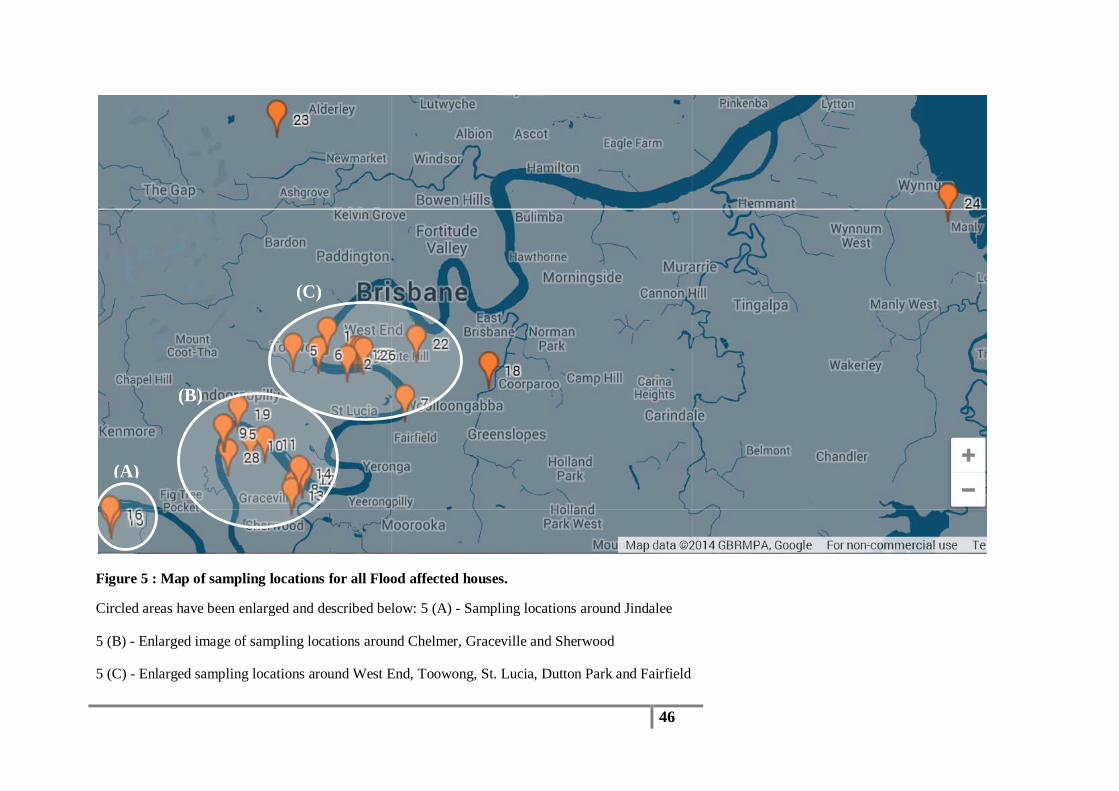
2.2 Sample Collection
Air samples were collected from 25 flood affected houses (Figure 5) and 16 non-flooded
houses (Figure 6) in several suburbs of Brisbane after the January 2011 flood event. Two
rounds of sampling were performed, the first round was done two months after the flood,
March to May 2011 and the second round, was done six months after the flood, July 2011.
All the sampling locations and sampling dates for the flood affected houses are listed in Table
4, and Table 5 which provides information for the non-flooded houses.
46
Figure 5 : Map of sampling locations for all Flood affected houses.
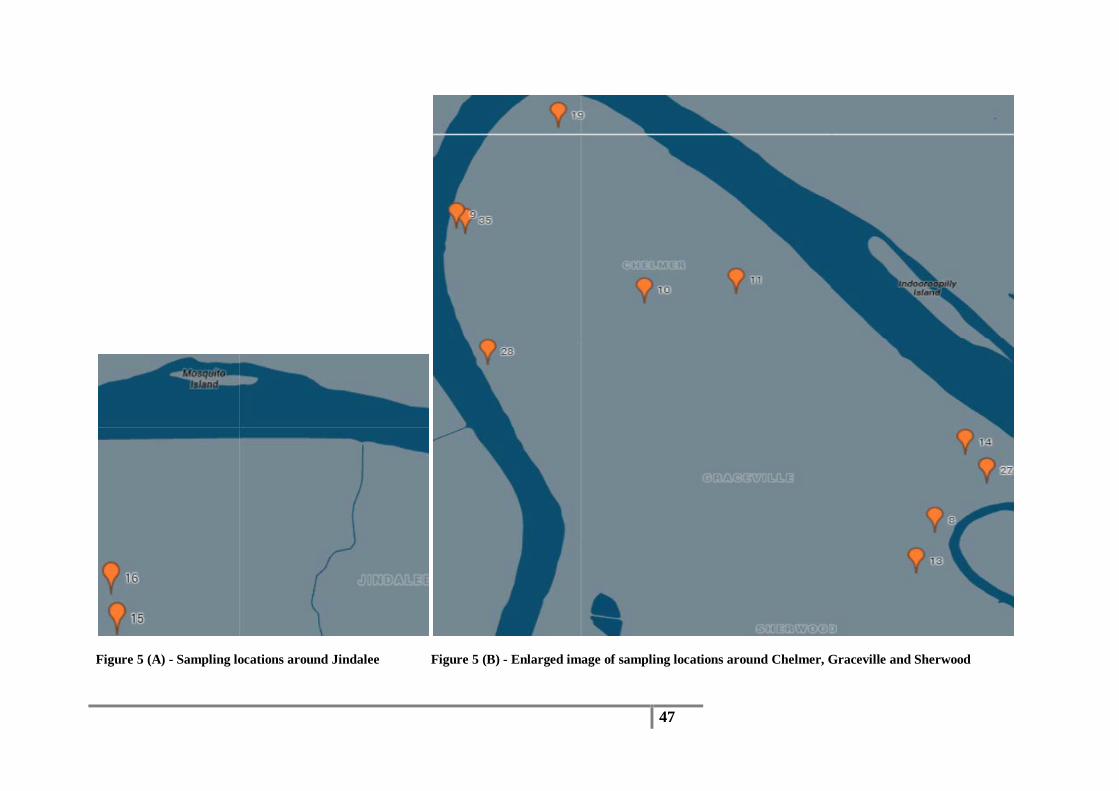
Circled areas have been enlarged and described below: 5 (A) - Sampling locations around Jindalee
5 (B) - Enlarged image of sampling locations around Chelmer, Graceville and Sherwood
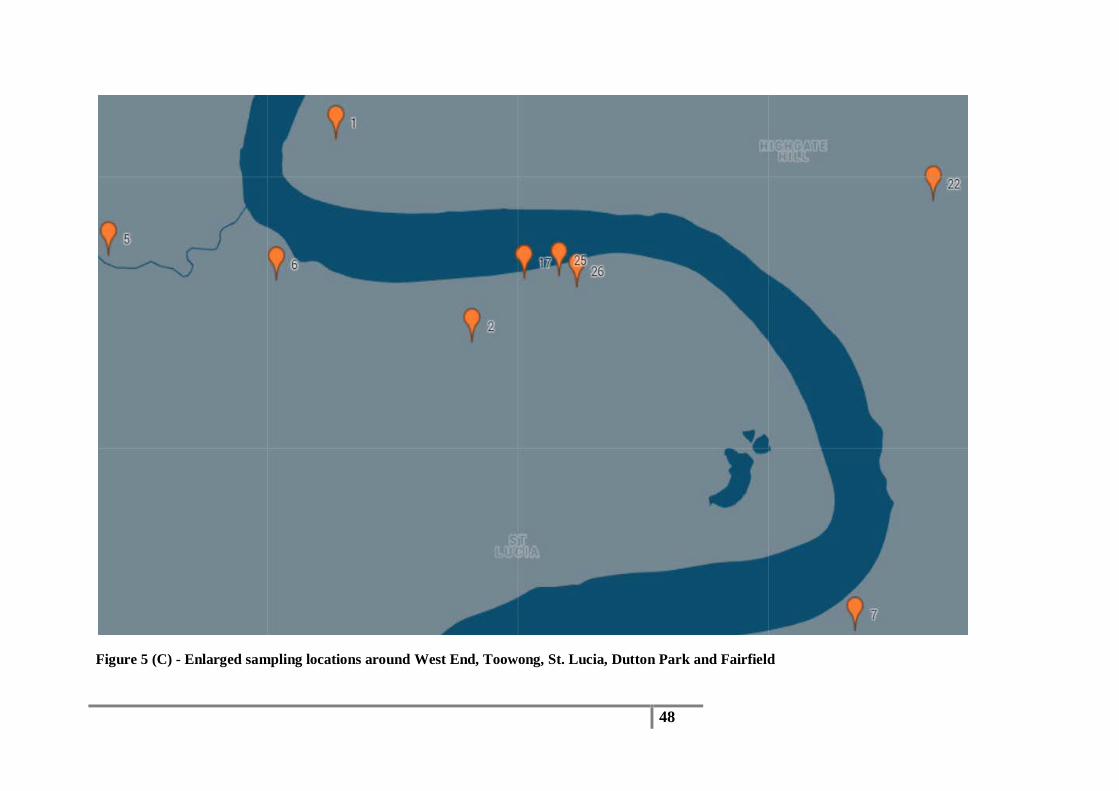
5 (C) - Enlarged sampling locations around West End, Toowong, St. Lucia, Dutton Park and Fairfield
(A)
(B)
(C)
47
Figure 5 (A) - Sampling locations around Jindalee Figure 5 (B) - Enlarged image of sampling locations around Chelmer, Graceville and Sherwood
48
Figure 5 (C) - Enlarged sampling locations around West End, Toowong, St. Lucia, Dutton Park and Fairfield

49
Figure 6 : Map of sampling locations for all
Non-flood affected houses.
Circled area has been enlarged and image 6
(A) shows the enlarged image of sampling
locations around Highgate Hill, St. Lucia,
Sherwood, Graceville, Yeronga, Fairfield
and Annerley
- Locations of non-flooded houses
(A)

50
Figure 6(A) - Enlarged images of sampling locations around Highgate Hill, St. Lucia, Sherwood, Graceville, Yeronga, Fairfield and Annerley
(i) Enlarged image of three sampling locations which were located in Fairfield.
(I)
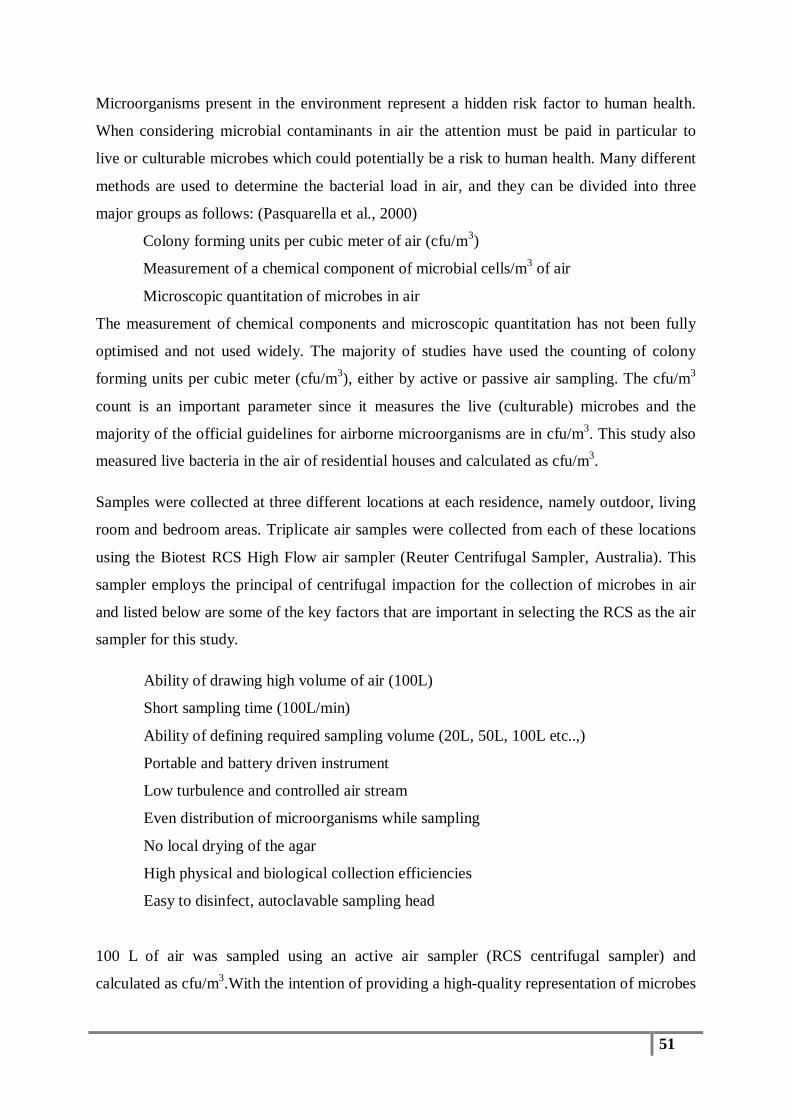
51
Microorganisms present in the environment represent a hidden risk factor to human health.
When considering microbial contaminants in air the attention must be paid in particular to
live or culturable microbes which could potentially be a risk to human health. Many different
methods are used to determine the bacterial load in air, and they can be divided into three
major groups as follows: (Pasquarella et al., 2000)
Colony forming units per cubic meter of air (cfu/m3)
Measurement of a chemical component of microbial cells/m3 of air
Microscopic quantitation of microbes in air
The measurement of chemical components and microscopic quantitation has not been fully
optimised and not used widely. The majority of studies have used the counting of colony
forming units per cubic meter (cfu/m3), either by active or passive air sampling. The cfu/m3
count is an important parameter since it measures the live (culturable) microbes and the
majority of the official guidelines for airborne microorganisms are in cfu/m3. This study also
measured live bacteria in the air of residential houses and calculated as cfu/m3.
Samples were collected at three different locations at each residence, namely outdoor, living
room and bedroom areas. Triplicate air samples were collected from each of these locations
using the Biotest RCS High Flow air sampler (Reuter Centrifugal Sampler, Australia). This
sampler employs the principal of centrifugal impaction for the collection of microbes in air
and listed below are some of the key factors that are important in selecting the RCS as the air
sampler for this study.
Ability of drawing high volume of air (100L)
Short sampling time (100L/min)
Ability of defining required sampling volume (20L, 50L, 100L etc..,)
Portable and battery driven instrument
Low turbulence and controlled air stream
Even distribution of microorganisms while sampling
No local drying of the agar
High physical and biological collection efficiencies
Easy to disinfect, autoclavable sampling head
100 L of air was sampled using an active air sampler (RCS centrifugal sampler) and
calculated as cfu/m3.With the intention of providing a high-quality representation of microbes
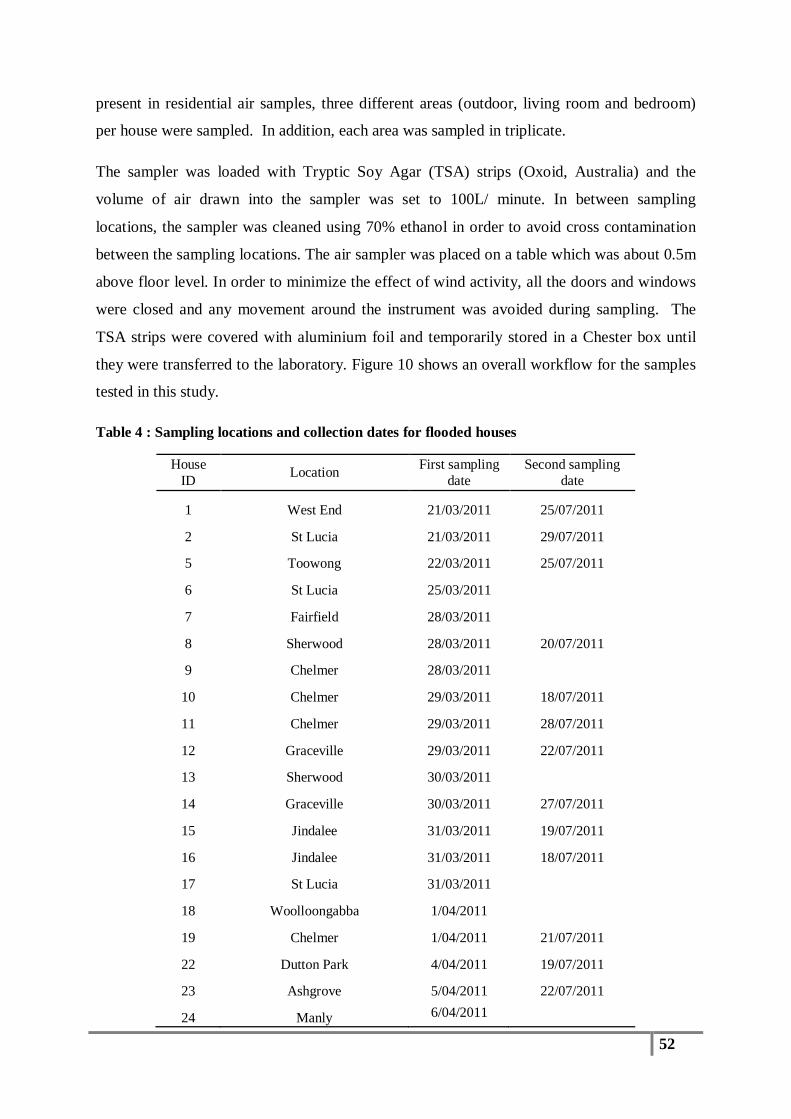
52
present in residential air samples, three different areas (outdoor, living room and bedroom)
per house were sampled. In addition, each area was sampled in triplicate.
The sampler was loaded with Tryptic Soy Agar (TSA) strips (Oxoid, Australia) and the
volume of air drawn into the sampler was set to 100L/ minute. In between sampling
locations, the sampler was cleaned using 70% ethanol in order to avoid cross contamination
between the sampling locations. The air sampler was placed on a table which was about 0.5m
above floor level. In order to minimize the effect of wind activity, all the doors and windows
were closed and any movement around the instrument was avoided during sampling. The
TSA strips were covered with aluminium foil and temporarily stored in a Chester box until
they were transferred to the laboratory. Figure 10 shows an overall workflow for the samples
tested in this study.
Table 4 : Sampling locations and collection dates for flooded houses
House ID Location First sampling
date Second sampling
date
1 West End 21/03/2011 25/07/2011
2 St Lucia 21/03/2011 29/07/2011
5 Toowong 22/03/2011 25/07/2011
6 St Lucia 25/03/2011
7 Fairfield 28/03/2011
8 Sherwood 28/03/2011 20/07/2011
9 Chelmer 28/03/2011
10 Chelmer 29/03/2011 18/07/2011
11 Chelmer 29/03/2011 28/07/2011
12 Graceville 29/03/2011 22/07/2011
13 Sherwood 30/03/2011
14 Graceville 30/03/2011 27/07/2011
15 Jindalee 31/03/2011 19/07/2011
16 Jindalee 31/03/2011 18/07/2011
17 St Lucia 31/03/2011
18 Woolloongabba 1/04/2011
19 Chelmer 1/04/2011 21/07/2011
22 Dutton Park 4/04/2011 19/07/2011
23 Ashgrove 5/04/2011 22/07/2011
24 Manly 6/04/2011
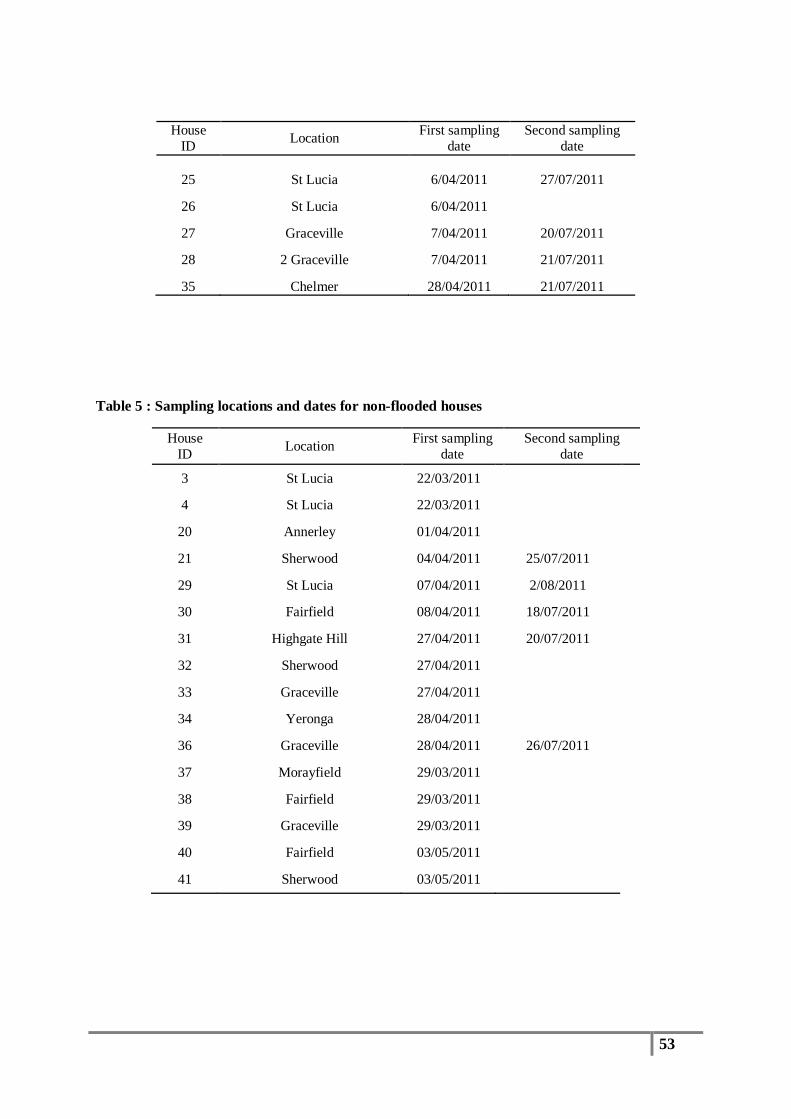
53
Table 5 : Sampling locations and dates for non-flooded houses
House ID Location First sampling
date Second sampling
date
3 St Lucia 22/03/2011 4 St Lucia 22/03/2011
20 Annerley 01/04/2011 21 Sherwood 04/04/2011 25/07/2011
29 St Lucia 07/04/2011 2/08/2011
30 Fairfield 08/04/2011 18/07/2011
31 Highgate Hill 27/04/2011 20/07/2011
32 Sherwood 27/04/2011 33 Graceville 27/04/2011 34 Yeronga 28/04/2011 36 Graceville 28/04/2011 26/07/2011
37 Morayfield 29/03/2011 38 Fairfield 29/03/2011 39 Graceville 29/03/2011 40 Fairfield 03/05/2011 41 Sherwood 03/05/2011
House ID Location First sampling
date Second sampling
date
25
St Lucia 6/04/2011 27/07/2011
26 St Lucia 6/04/2011
27 Graceville 7/04/2011 20/07/2011
28 2 Graceville 7/04/2011 21/07/2011
35 Chelmer 28/04/2011 21/07/2011

54
Total Bacterial Colony Count
At the laboratory, the Tryptic Soy Agar (TSA) strips were incubated at 32 0C for 48 hours
and the total numbers of bacterial colonies were counted after incubation. Since the
organisms were originated from ambient air, most of the culturable bacteria in the air samples
would be mesophilic. Thus the optimum temperature would be between 30 -37 0C. Therefore
32 0C was used as the incubation temperature for TSA strips. When performing total bacteria
count colony morphologies such as colony size, margins were used to differentiate the
bacteria and yeast colonies. However, a parallel study was performed specifically for the
identification and quantification of fungal and yeast colonies in the domestic air.
Figure 7 : Bacterial colonies on TSA strips
Growth of bacterial colonies after 48h incubation of TSA strips
2.3 Isolation and Phenotypic Identification of S. aureus from Residential Air Samples
Mannitol fermentation tested using Mannitol Salt Agar (MSA)
Each strip was divided into four using the grids on the strip and from each division two well
defined bacterial colonies were selected. Not all the Staphylococcus species are yellow in
morphology eight colonies were randomly selected from each TSA strip and inoculated onto
MSA plates (Oxoid, Australia). Since this test aimed to culture Staphylococcus species the
MSA plates were incubated at 370C for 24 hours and yellow growth is considered positive for
S. aureus (Schleifer, 2009). S. aureus NCTC 6571 was used as the positive control and S.
epidermidis ATCC12228 was used as the negative control. All MSA-positive isolates were
subcultured onto Nutrient Agar1 (NA; Oxoid, Australia) using the 16-streak method to obtain
single colonies. A single colony was inoculated into 5ml of sterilized Lysogeny Broth2 (LB;
Oxoid, Australia) followed by overnight incubation at 370C. All these isolates (n= 1026) were
stored at -80 0C using 30% glycerol solution. All the samples were labelled considering the
ID of the house and the sampling location inside the house as described below;
Bacterial colonies
Tryptic Soy Agar strip (TSA)
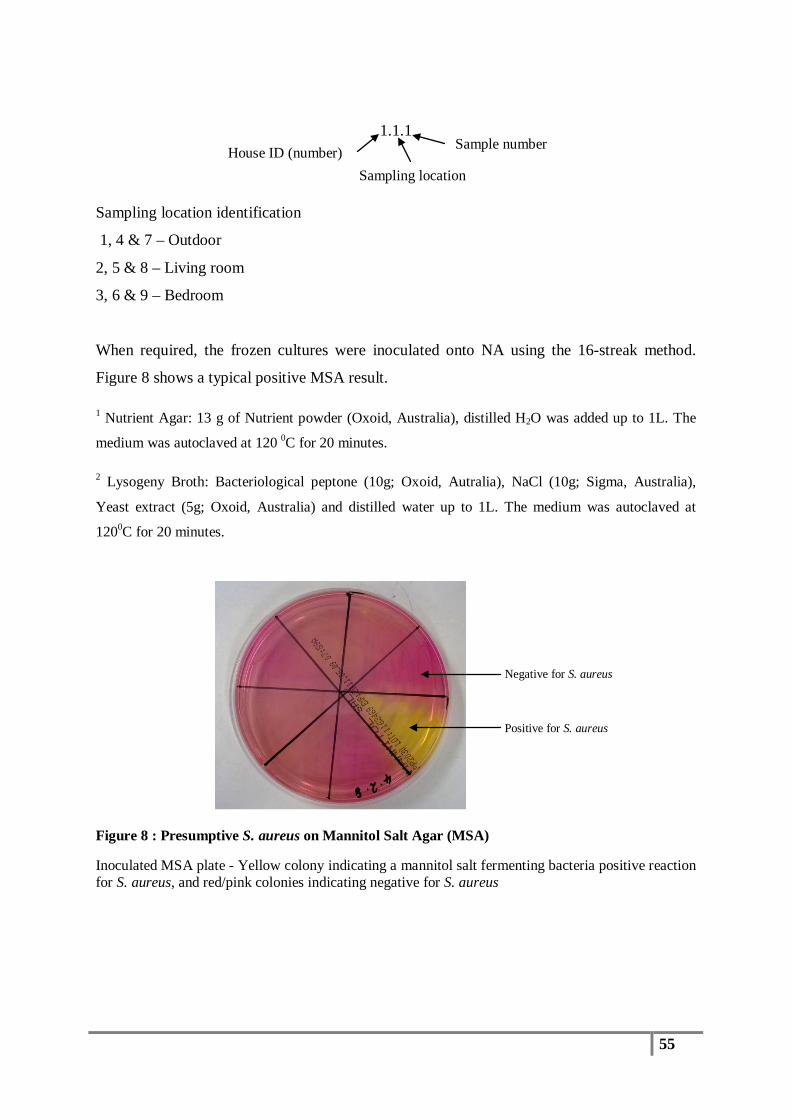
55
1.1.1
Sampling location identification
1, 4 & 7 – Outdoor
2, 5 & 8 – Living room
3, 6 & 9 – Bedroom
When required, the frozen cultures were inoculated onto NA using the 16-streak method.
Figure 8 shows a typical positive MSA result.
1 Nutrient Agar: 13 g of Nutrient powder (Oxoid, Australia), distilled H2O was added up to 1L. The
medium was autoclaved at 120 0C for 20 minutes.
2 Lysogeny Broth: Bacteriological peptone (10g; Oxoid, Autralia), NaCl (10g; Sigma, Australia),
Yeast extract (5g; Oxoid, Australia) and distilled water up to 1L. The medium was autoclaved at
1200C for 20 minutes.
Figure 8 : Presumptive S. aureus on Mannitol Salt Agar (MSA)
Inoculated MSA plate - Yellow colony indicating a mannitol salt fermenting bacteria positive reaction for S. aureus, and red/pink colonies indicating negative for S. aureus
Negative for S. aureus
Positive for S. aureus
House ID (number) Sampling location
Sample number

56
Dioxyribonuclease production on DNase agar
The DNase agar test was used as an additional phenotypic identification test and only MSA
positive isolates (n= 1026) were tested on DNase agar (Oxoid, Australia). DNase agar
contains 0.2% deoxyribonucleic acid (DNA). To detect DNase production, the plate was
inoculated with MSA positive isolates and incubated overnight (18-42 h) at 37 0C. The plate
was flooded with 1M Hydrochloric acid (HCl) solution and interpreted after 5 minutes.
DNase positive colonies show a distinct clear zone around the inoculation point, whereas a
negative test is where no clear zone is visible. Positive and negative controls used were S.
aureus NCTC 6571 and S. epidermidis ATCC12228 respectively.
DNase is an extracellular enzyme that is capable of depolymerisation of DNA into
nucleotides which are soluble in HCl solution. Therefore, DNase producing organisms can be
identified with the development of the clear zone around the growth area. In contrast, the
organisms that are unable to secrete the DNase enzyme, are unable to depolymerise DNA in
the medium and as a result polymerised DNA creates a precipitate with HCL making the
medium opaque. Figure 9 shows a DNase positive result typical for S. aureus.
Figure 9 : Inoculated DNase agar plate
DNase plate after 24h incubation and flooded with 1M HCL solution. Cleared area around the colonies indicates DNase producing bacteria (S. aureus and related species) and white halo indicates non-DNase forming bacteria
DNase negative
DNase positive: S. aureus

57
2.4 DNA Extraction
Bacterial Culture
For DNA extraction 313 isolates (which were identified as presumptive Staphylococcus sp.
by biochemical tests), 211 from flood affected houses and 102 from non-flooded houses were
selected from the glycerol stock culture collection and 16-streaked onto NA plates. The plates
were incubated overnight at 37 0C and 12-15 single colonies were suspended in 200 µl of
40µg/ml lysostaphin (Sigma, Australia) solution and incubated for 30 minutes at room
temperature.
DNA extraction was performed using an automated system, the Corbett-X tractor Gene,
automated DNA extraction system as described by Stephens et al. (Stephens et al., 2007). 200
µl of DNase/RNase free water (Invitrogen, Australia) was used for the final elution and the
DNA extracts were stored at -20 0C until further use.
The quality and quantity of the DNA was evaluated using the NanoDrop ND-1000 UV-Vis
spectrophotomer (NanoDrop, USA). Since the purity of DNA was lower than the acceptable
level (260/280 < 1.8) for 208 of the samples, a second round of DNA extraction was done
using the QIagen DNeasy Blood and Tissue Kit (Qiagen, Australia) as per the manufacturer’s
instructions, specifically using the extraction protocol for Gram-positive bacteria. The
extracted DNA concentration and purity was measured using the NanoDrop ND-1000 UV-
Vis spectrophotomer (NanoDrop, USA) and the extracts were stored at -20 0C.
DNA amplification and Analysis
All the real time-PCR reactions were performed on the Rotor-Gene 6000 (Corbett, Australia
in 0.1 ml PCR tubes and all the data generated was analysed using the Rotor-Gene 6000
(version 7.1) software. Conventional PCR reactions were conducted on a MJ Research PTC-
200 Peltier Thermal Cycler (Genesearch, Australia) using 0.2 ml tubes. PCR products were
detected by agarose gel electrophoresis (as detailed below).

58
2.5 Identification of Isolates as S. aureus using species-specific PCR
In order to confirm the isolates as S. aureus, real-time PCR amplification of the nucA gene
was performed on all phenotypically characterised S. aureus isolates. Positive and negative
controls used were S. aureus NCTC 6571 and S. epidermidis ATCC12228 respectively. All
the qPCR reactions were done in duplicate containing 10 µl of Platinum SYBR Green qPCR
SuperMix-UDG (Life Technologies, Australia), 0.25 µl of both forward and reverse primer
(20 µM) (Sigma Aldrich, Australia), 4 µl of DNA template and made to a final volume of
20µl with DNase and RNase free water. The amplification of the nucA gene was done by a
three step temperature cycling procedure as follows: hold at 50 0C for 2 minutes with a
second hold at 95 0C for 2 min followed by 40 cycles of 95 0C 15s, 56 0C for 20s, 72 0C for
35s and melting between 72 0C and 95 0C rising by 1 0C.
Amplification curve results were validated by analysing melting curves and the threshold
melting temperature was set to ±0.5 with respect to the reference sample. This step further
reduces the number of non-specific products or false-positives.
2.6 Identification of Methicillin-resistant S. aureus (MRSA) and Related Species
To identify isolates resistant to methicillin, real-time PCR targeting the mecA gene was used
to screen all isolates. S. aureus ATCC 49476 (mecA positive) was used as the positive
control and S. aureus NCTC 6571 was used as the mecA negative control. Each 20 µl
reaction was done in duplicate and contained 10 µl of Platinum SYBR Green qPCR
SuperMix-UDG (Life Technologies, Australia), 0.25 µl of both forward and reverse primer
(20 µM) (Sigma Aldrich, Australia), 4 µl of DNA template and 5.5 µl DNase and RNase free
water. The PCR reaction conditions for mecA gene amplification consists of two holds, the
first one at 50 0C for 2min and the second hold at 95 0C for 2 min followed by 40 cycles of 95 0C 15s, 56 0C for 20s, 72 0C for 35s and finally melting between 72 0C and 95 0C rising by 1 0C.

59
2.7 PCR Amplification of the pta Gene
pta gene amplification was performed by conventional PCR and each reaction contained 10
µl of MyTaq Red Reaction Buffer (Bioline, Australia), 1 µl of each forward and reverse
primer (10 µM) (Sigma Aldrich, Australia), 0.5 µl of MyTaq HS DNA Polymerase (Bioline,
Australia), 2 µl of DNA template and 35.5 µl of DNase and RNase free water. PCR cycling
conditions consisted of 950C for 5 min followed by 34 cycles of 1 min at 95 0C, 1 min at 53 0C, 1 min at 72 0C and final extension at 72 0C for 10 min. After amplification, 10 µl of PCR
product was electrophoresed on a 2% agarose gel for 40-50 min at 100 V using a molecular
weight marker VIII (Roche Diagnostics, Australia). Bands at 320 bp length were detected on
Gel Doc system (ChemiDoc XRS; Bio-Rad Laboratories, USA) using Quantity One software
(v 4.6.3; Bio-Rad Laboratories, USA).
Restriction enzyme digestion
Restriction enzyme digestion was performed only for pta positive isolates. 25 µl of PCR
product (pta gene) was digested with 1 µl of MboI (5u) enzyme and 5 µl of 5x buffer
solution. After 2 h of digestion, 25 µl of digestion mixture was run on a 2% agarose gel for
40 min at 100 V with a molecular weight marker VIII (Roche, Australia). Finally the
expected restriction fragments for different species were detected on the Gel Doc system
(ChemiDoc XRS; Bio-Rad Laboratories, USA) using the Quantity One software program (v
4.6.3; Bio-Rad Laboratories, USA). The expected restriction fragments are as follows
(Bannoehr et al., 2009);
Staphylococcus species Lengths of the resulting DNA fragments
S. pseudintermedius 213 and 107 bp
S. aureus 156 and 164 bp
S. intermedius MboI restriction site is absent
S. delphini
PCR amplification of the tuf gene
tuf gene amplification was performed by conventional PCR and each reaction contained 5 µl
of MyTaq Red Reaction Buffer (Bioline, Australia), 2 µl of each forward and reverse primer
(10 µM) (Sigma, Australia), 0.1 µl of MyTaq HS DNA Polymerase (Bioline, Australia), 2 µl
of DNA template and with a final volume of 50 µl by adding DNase and RNase free water.
The PCR cycling conditions were as follows: 95 0C for 5 min, followed by 34 cycles of 95 0C
60
for 1 min, 55 0C for 1 min and 72 0C for 1 min and final extension at 72 0C for 10 min . To
detect the amplified gene fragment at 412 bp, 10 µl of PCR product was electrophoresed on a
2% agarose gel for 40-50 min at 100 V using a molecular weight marker VIII (Roche
Diagnostics, Australia). Bands were detected on the Gel Doc system (ChemiDoc XRS; Bio-
Rad Laboratories, USA) using the Quantity One software program (v 4.6.3; Bio-Rad
Laboratories, USA).
2.8 DNA Sequencing (16S rDNA and tuf gene)
The tuf gene PCR products were purified using the QIAquick PCR purification kit (Qiagen,
Victoria, Australia) according to manufacturer’s instructions. The quality of the purified PCR
product was tested on a 2% agarose gel with the Roche VIII DNA molecular weight marker
(Roche Diagnostics, Australia). The 16S rDNA sequencing primers (listed in table 6) used
for species validation, target the V3-V4 region of the 16S rDNA gene. These PCR products
were also purified and checked for quality as stated above. All sequencing procedures were
adapted from The Griffith University DNA Sequencing Facility (GUDSF) protocol. Each 20
µL sequencing reaction contained 0.5 µL Big Dye Terminator (v3.1) (Applied Biosystems,
USA), 3 µL sequencing buffer (Applied Biosystems, USA), 1 µL of either forward or
reverse primer (3.2 pmol) (Sigma Aldrich, Australia), 1 µL of template (10 ng/µL) and 14.5
µL of RNAase/DNAase free water (Roche, Australia). Sequencing reactions were done on a
MJ Research PTC-200 Peltier Thermal Cycler (Genesearch, Australia) with the following
cycling conditions: 96 °C for 1 min, followed by 30 cycles of 96 °C for 10 s, 50 °C for 5 s
and 60 °C for 4 min.
The PCR products were subjected to post-sequence cleanup using the GUDSF protocol
(http://www.griffith.edu.au/science-aviation/dna-sequencing facility/pdf/ethanoledtaprotocol.pdf).
Following post-sequence clean-up, samples were submitted to the QUT Molecular Genetics
Research Facility for analysis using the 3500 series Genetic Analyser instrument (Applied
Biosystems, USA).

61
Table 6 : Primer sequences for nucA, mecA, tuf, pta and 16S rDNA genes
Locus Primer Name Primer Sequence (5' - 3') Amplicon
size (bp)
nucA nucA F* GCG ATT GAT GGT GAT ACG GTT
nucA R** AGC CAA GCC TTG ACG AAC TAA AGC 274
mecA mecA F* GAT CGC AAC GTT CAA TTT AAT TTT G
mecA R** GCT TTG GTC TTT CTG CAT TCC T 273
tuf tuf F* GCC AGT TGA GGA CGT ATT CT
tuf R** CCA TTT CAG TAC CTT CTG GTA A
412
pta pta F* AAA GAC AAA CTT TCA GGT AA
pta R** GCA TAA ACA AGC ATT GTA CCG
320
16S rDNA 347 F* GGA GGC AGC AGT RRG GAA T
803 R** CTA CCR GGG TAT CTA ATC C
456
coa coa F* GGT GAA ATC GTT CAA GGT CC
coa R** GGT CTC GCT TCA TAT CCA AAT GT 344
*Forward primer **Reverse primer
nucA – Thermostable nuclease gene tuf – Elongation factor Tu
mecA – Methicillin resistance gene pta – Phosphate acetyltransferase gene
coa – Coagulase gene
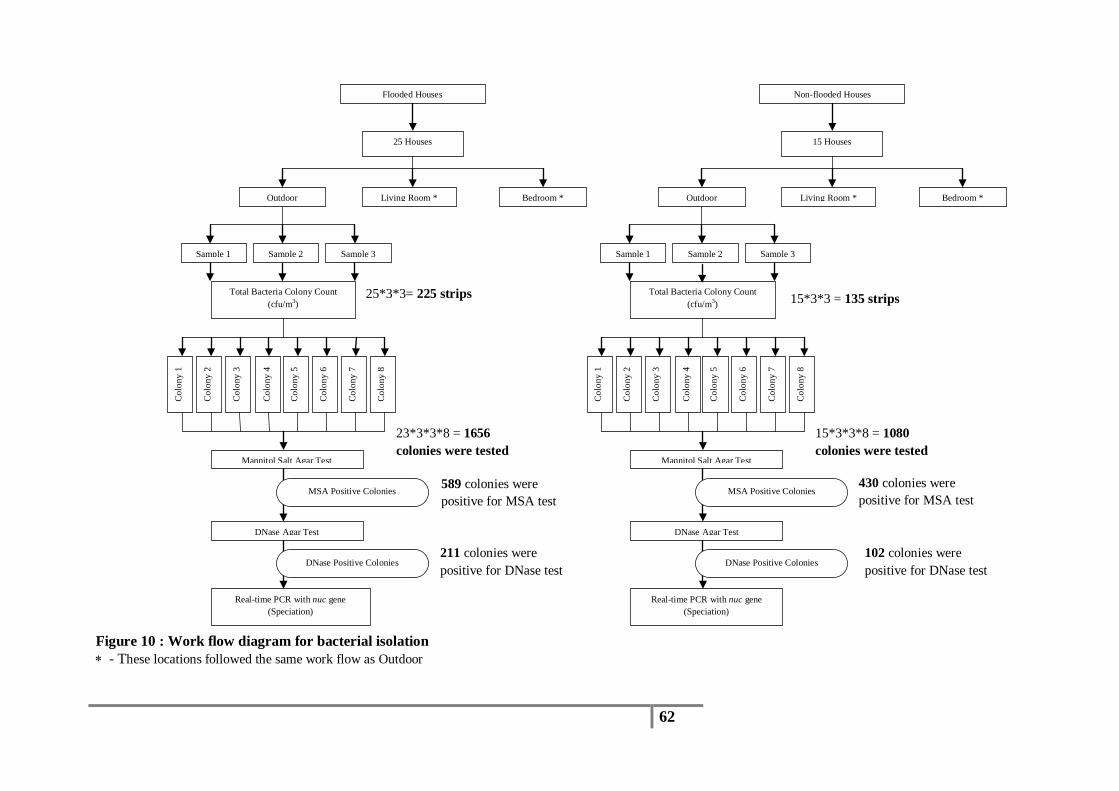
62
Figure 10 : Work flow diagram for bacterial isolation ∗ - These locations followed the same work flow as Outdoor
Sample 1 Sample 2 Sample 3
25*3*3= 225 strips
23*3*3*8 = 1656 colonies were tested
589 colonies were positive for MSA test
211 colonies were positive for DNase test
Colo
ny 1
Colo
ny 2
Colo
ny 3
Colo
ny 4
Colo
ny 5
Colo
ny 6
Colo
ny 7
Colo
ny 8
Mannitol Salt Agar Test
Total Bacteria Colony Count (cfu/m3)
DNase Agar Test
MSA Positive Colonies
DNase Positive Colonies
Real-time PCR with nuc gene (Speciation)
Outdoor Living Room * Bedroom *
Flooded Houses
25 Houses
15*3*3 = 135 strips
15*3*3*8 = 1080 colonies were tested
430 colonies were positive for MSA test
102 colonies were positive for DNase test
Co
lony
1
Colo
ny 2
Colo
ny 3
Colo
ny 4
Colo
ny 5
Colo
ny 6
Colo
ny 7
Colo
ny 8
Mannitol Salt Agar Test
Total Bacteria Colony Count (cfu/m3)
DNase Agar Test
MSA Positive Colonies
DNase Positive Colonies
Real-time PCR with nuc gene (Speciation)
Sample 1 Sample 2 Sample 3
Outdoor Living Room * Bedroom *
Non-flooded Houses
15 Houses

63

64
Chapter Three
Results
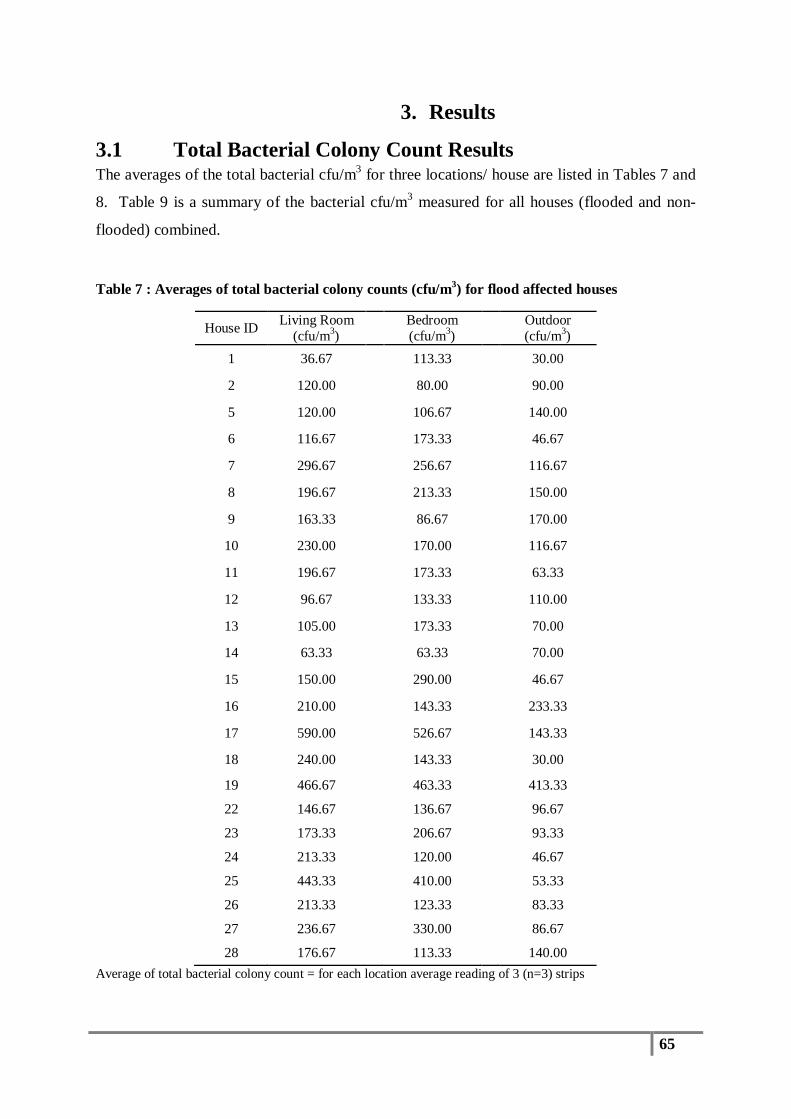
65
3. Results
3.1 Total Bacterial Colony Count Results The averages of the total bacterial cfu/m3 for three locations/ house are listed in Tables 7 and
8. Table 9 is a summary of the bacterial cfu/m3 measured for all houses (flooded and non-
flooded) combined.
Table 7 : Averages of total bacterial colony counts (cfu/m3) for flood affected houses
House ID Living Room (cfu/m3)
Bedroom (cfu/m3)
Outdoor (cfu/m3)
1 36.67 113.33 30.00
2 120.00 80.00 90.00
5 120.00 106.67 140.00
6 116.67 173.33 46.67
7 296.67 256.67 116.67
8 196.67 213.33 150.00
9 163.33 86.67 170.00
10 230.00 170.00 116.67
11 196.67 173.33 63.33
12 96.67 133.33 110.00
13 105.00 173.33 70.00
14 63.33 63.33 70.00
15 150.00 290.00 46.67
16 210.00 143.33 233.33
17 590.00 526.67 143.33
18 240.00 143.33 30.00
19 466.67 463.33 413.33
22 146.67 136.67 96.67
23 173.33 206.67 93.33
24 213.33 120.00 46.67
25 443.33 410.00 53.33
26 213.33 123.33 83.33
27 236.67 330.00 86.67
28 176.67 113.33 140.00 Average of total bacterial colony count = for each location average reading of 3 (n=3) strips

66
Table 8 : Averages of total bacterial colony counts (cfu/m3) for non-flooded houses
House ID Living Room
(cfu/m3) Bedroom
(cfu/m3) Outdoor (cfu/m3)
3 96.67 120.00 50.00
4 103.33 90.00 53.33
20 163.33 286.67 100.00
21 103.33 123.33 60.00
29 290.00 500.00 96.67
30 350.00 240.00 230.00
31 140.00 183.33 196.67
32 220.00 250.00 185.00
33 230.00 230.00 63.33
34 310.00 306.67 50.00
36 193.33 133.33 113.33
37 520.00 460.00 100.00
38 190.00 190.00 130.00
39 126.67 203.33 73.33
40 266.67 210.00 93.33
41 - 120.00 333.33 Average of total bacterial colony count = for each location average reading of 3 (n=3) strips
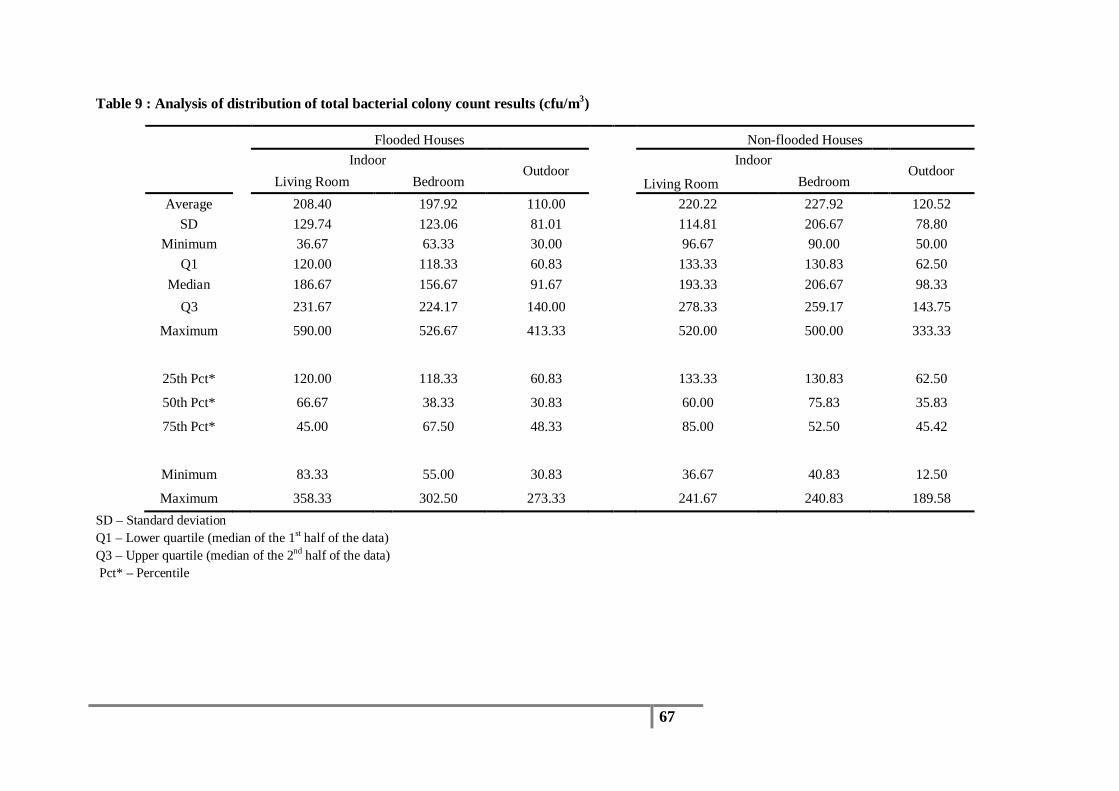
67
Table 9 : Analysis of distribution of total bacterial colony count results (cfu/m3)
Flooded Houses
Non-flooded Houses
Indoor Outdoor Indoor
Outdoor
Living Room Bedroom Living Room Bedroom
Average 208.40 197.92 110.00 220.22 227.92 120.52 SD 129.74 123.06 81.01 114.81 206.67 78.80
Minimum 36.67 63.33 30.00 96.67 90.00 50.00 Q1 120.00 118.33 60.83 133.33 130.83 62.50
Median 186.67 156.67 91.67 193.33 206.67 98.33 Q3 231.67 224.17 140.00 278.33 259.17 143.75
Maximum 590.00 526.67 413.33 520.00 500.00 333.33
25th Pct* 120.00 118.33 60.83 133.33 130.83 62.50
50th Pct* 66.67 38.33 30.83 60.00 75.83 35.83
75th Pct* 45.00 67.50 48.33 85.00 52.50 45.42
Minimum 83.33 55.00 30.83 36.67 40.83 12.50
Maximum 358.33 302.50 273.33 241.67 240.83 189.58 SD – Standard deviation Q1 – Lower quartile (median of the 1st half of the data) Q3 – Upper quartile (median of the 2nd half of the data) Pct* – Percentile
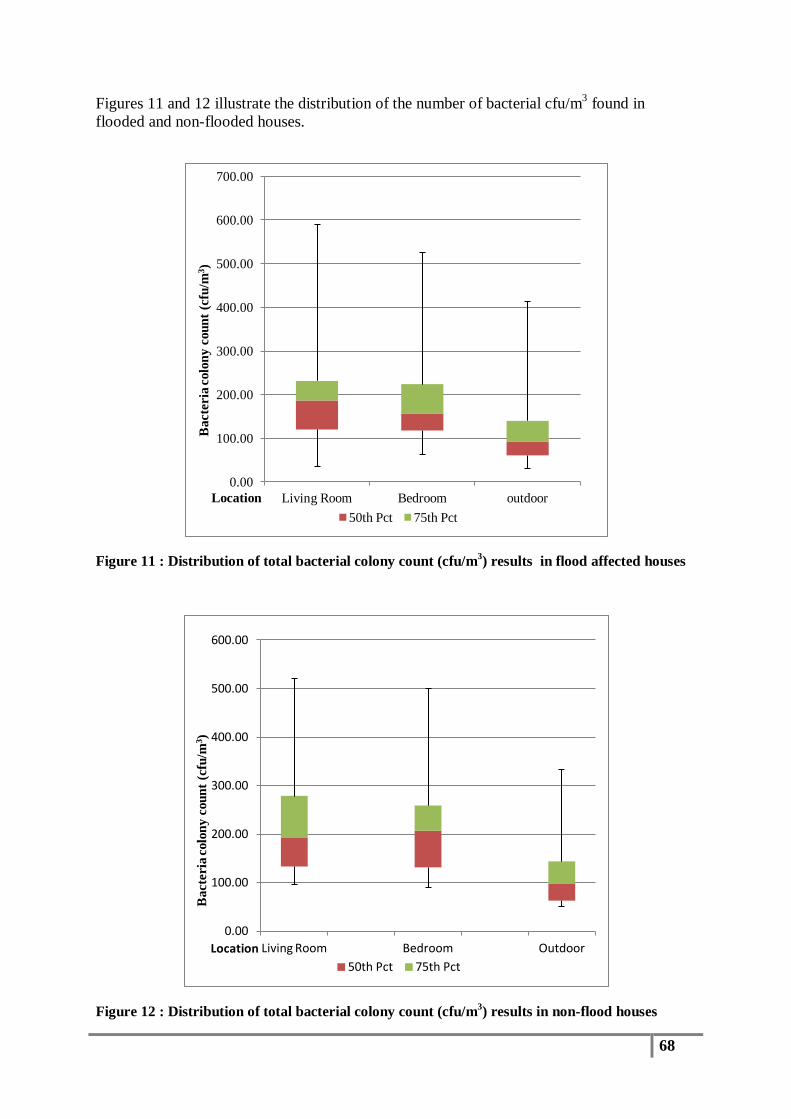
68
Figures 11 and 12 illustrate the distribution of the number of bacterial cfu/m3 found in flooded and non-flooded houses.
Figure 11 : Distribution of total bacterial colony count (cfu/m3) results in flood affected houses
Figure 12 : Distribution of total bacterial colony count (cfu/m3) results in non-flood houses
0.00
100.00
200.00
300.00
400.00
500.00
600.00
700.00
Living Room Bedroom outdoor
Bac
teri
a col
ony
coun
t (cf
u/m
3 )
Location 50th Pct 75th Pct
0.00
100.00
200.00
300.00
400.00
500.00
600.00
Living Room Bedroom Outdoor
Bac
teri
a col
ony
coun
t (cf
u/m
3 )
Location 50th Pct 75th Pct
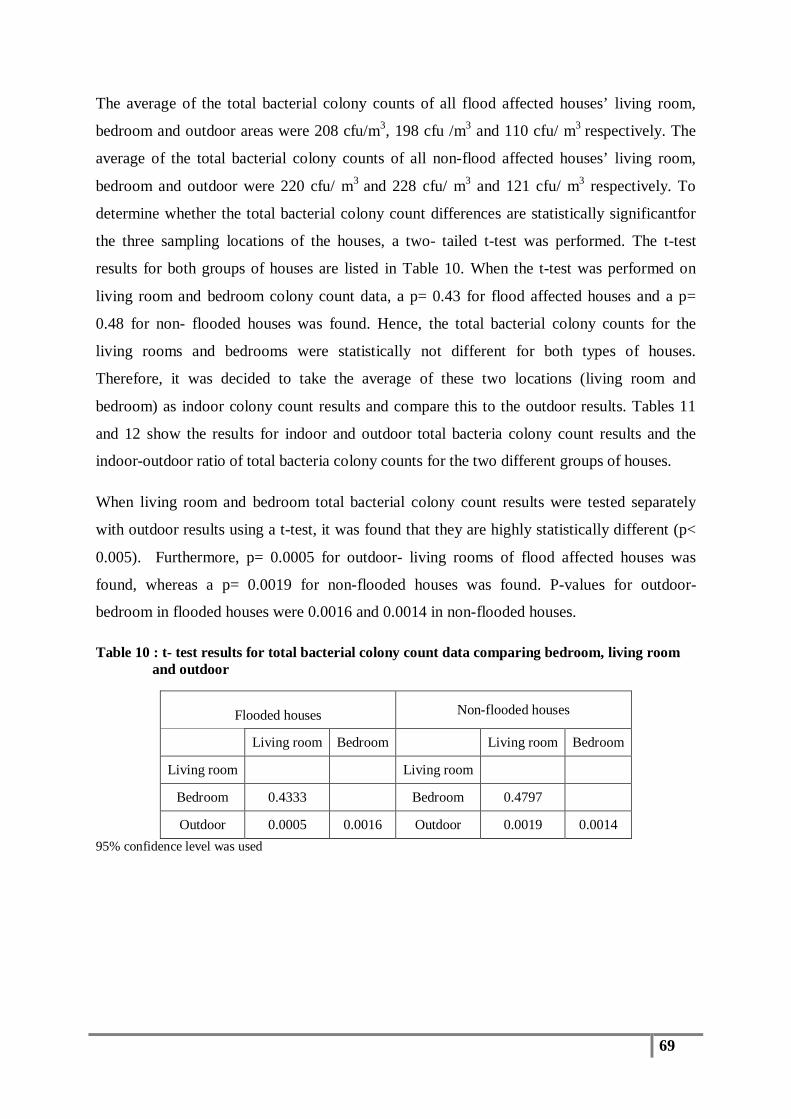
69
The average of the total bacterial colony counts of all flood affected houses’ living room,
bedroom and outdoor areas were 208 cfu/m3, 198 cfu /m3 and 110 cfu/ m3 respectively. The
average of the total bacterial colony counts of all non-flood affected houses’ living room,
bedroom and outdoor were 220 cfu/ m3 and 228 cfu/ m3 and 121 cfu/ m3 respectively. To
determine whether the total bacterial colony count differences are statistically significantfor
the three sampling locations of the houses, a two- tailed t-test was performed. The t-test
results for both groups of houses are listed in Table 10. When the t-test was performed on
living room and bedroom colony count data, a p= 0.43 for flood affected houses and a p=
0.48 for non- flooded houses was found. Hence, the total bacterial colony counts for the
living rooms and bedrooms were statistically not different for both types of houses.
Therefore, it was decided to take the average of these two locations (living room and
bedroom) as indoor colony count results and compare this to the outdoor results. Tables 11
and 12 show the results for indoor and outdoor total bacteria colony count results and the
indoor-outdoor ratio of total bacteria colony counts for the two different groups of houses.
When living room and bedroom total bacterial colony count results were tested separately
with outdoor results using a t-test, it was found that they are highly statistically different (p<
0.005). Furthermore, p= 0.0005 for outdoor- living rooms of flood affected houses was
found, whereas a p= 0.0019 for non-flooded houses was found. P-values for outdoor-
bedroom in flooded houses were 0.0016 and 0.0014 in non-flooded houses.
Table 10 : t- test results for total bacterial colony count data comparing bedroom, living room and outdoor
Flooded houses Non-flooded houses
Living room Bedroom Living room Bedroom
Living room Living room Bedroom 0.4333 Bedroom 0.4797 Outdoor 0.0005 0.0016 Outdoor 0.0019 0.0014
95% confidence level was used

70
Table 11 : Indoor and outdoor colony count ratios of flood affected houses (indoor vs. outdoor)
House ID
Total bacterial colony count
Ratio (Indoor: Outdoor) Indoor*
(cfu/m3) Outdoor (cfu/m3)
1 75 30 5:2
2 100 90 10:9
5 113 140 113:140
6 145 47 145:47
7 277 117 69:29
8 205 150 41:30
9 125 170 25:34
10 200 117 50:29
11 185 63 185:63
12 115 110 23:22
13 139 70 139:70
14 63 70 9:10
15 220 47 110:23
16 177 233 177:233
17 558 143 558:143
18 192 30 192:30
19 465 413 465:413
22 142 97 47:32
23 190 93 190:93
24 167 47 83:23
25 427 53 427:53
26 168 83 168:83
27 283 87 283:87
28 145 140 29:28
Total 203 110 203:110 Indoor* = (Living room + Bedroom) / 2
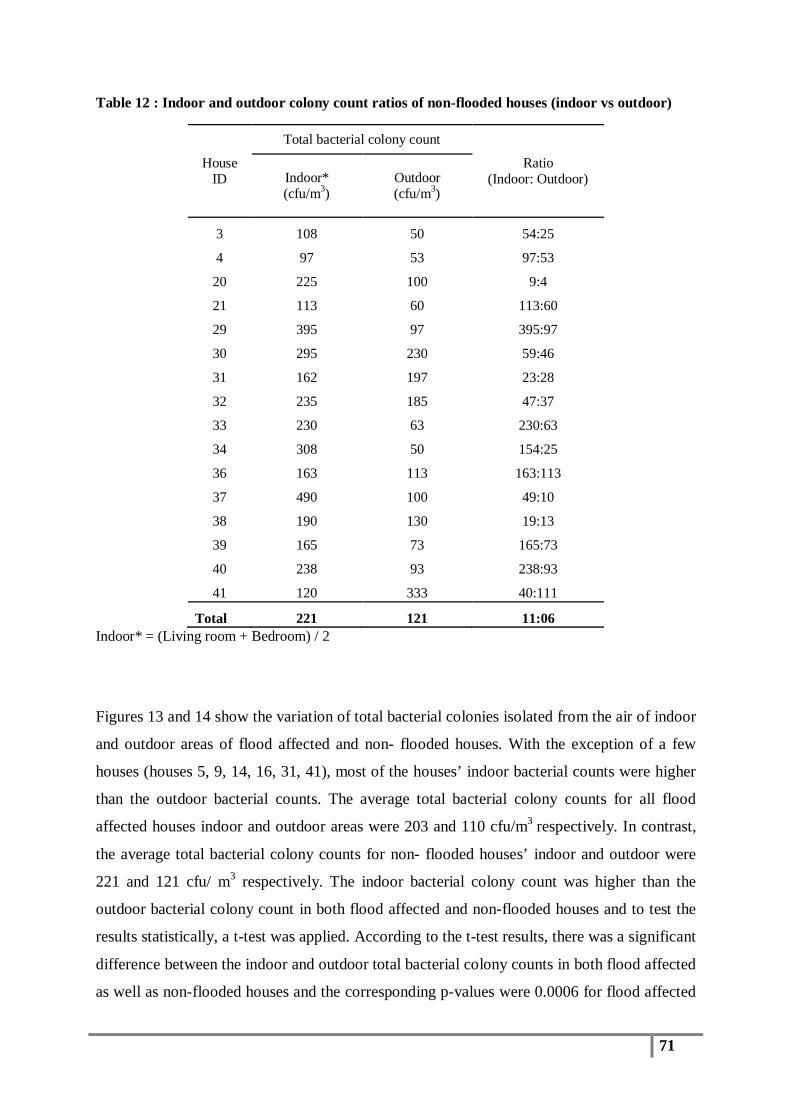
71
Table 12 : Indoor and outdoor colony count ratios of non-flooded houses (indoor vs outdoor)
House ID
Total bacterial colony count
Ratio (Indoor: Outdoor) Indoor*
(cfu/m3) Outdoor (cfu/m3)
3 108 50 54:25
4 97 53 97:53
20 225 100 9:4
21 113 60 113:60
29 395 97 395:97
30 295 230 59:46
31 162 197 23:28
32 235 185 47:37
33 230 63 230:63
34 308 50 154:25
36 163 113 163:113
37 490 100 49:10
38 190 130 19:13
39 165 73 165:73
40 238 93 238:93
41 120 333 40:111
Total 221 121 11:06 Indoor* = (Living room + Bedroom) / 2
Figures 13 and 14 show the variation of total bacterial colonies isolated from the air of indoor
and outdoor areas of flood affected and non- flooded houses. With the exception of a few
houses (houses 5, 9, 14, 16, 31, 41), most of the houses’ indoor bacterial counts were higher
than the outdoor bacterial counts. The average total bacterial colony counts for all flood
affected houses indoor and outdoor areas were 203 and 110 cfu/m3 respectively. In contrast,
the average total bacterial colony counts for non- flooded houses’ indoor and outdoor were
221 and 121 cfu/ m3 respectively. The indoor bacterial colony count was higher than the
outdoor bacterial colony count in both flood affected and non-flooded houses and to test the
results statistically, a t-test was applied. According to the t-test results, there was a significant
difference between the indoor and outdoor total bacterial colony counts in both flood affected
as well as non-flooded houses and the corresponding p-values were 0.0006 for flood affected

72
and 0.0109 for non- flooded houses. The significant difference in indoor vs. outdoor total
bacterial colony counts in flood affected houses was larger than the difference in non-flooded
houses. In fact, indoor and outdoor bacterial population results for flood affected houses were
highly statistically different (p= 0.0006 < 0.005).
Figure 13 : Average indoor & outdoor total bacterial colony counts in flood affected houses With a few exceptions, the majority of houses’ indoor bacterial colony counts were higher than the outdoor bacterial colony counts. The highest indoor colony count was 558 cfu/ m3 which was observed in house 17 and the lowest was 63 cfu/ m3 in house 14.
0.00
100.00
200.00
300.00
400.00
500.00
600.00
1 2 5 6 7 8 9 10 11 12 13 14 15 16 17 18 19 22 23 24 25 26 27 28 35
Tot
la b
acte
ria
colo
ny c
ount
(cfu
/m3 )
House ID Average Indoor Average Outdoor
Too
man
y to
cou
nt
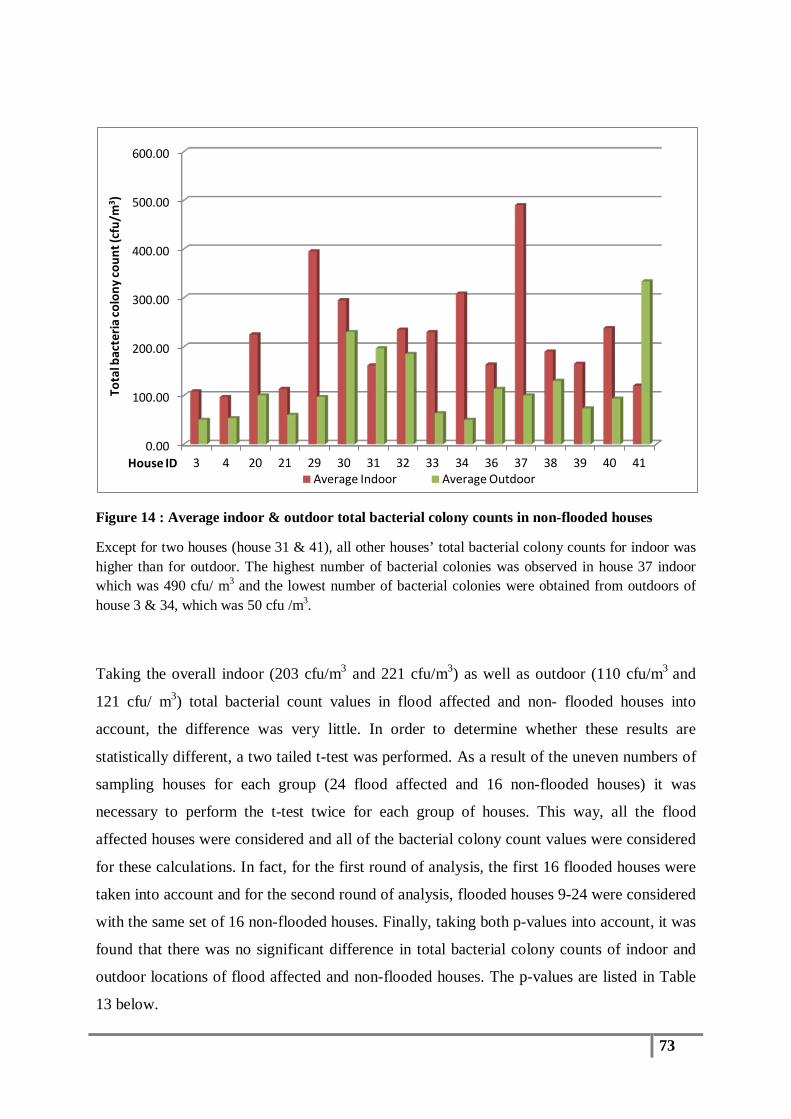
73
Figure 14 : Average indoor & outdoor total bacterial colony counts in non-flooded houses
Except for two houses (house 31 & 41), all other houses’ total bacterial colony counts for indoor was higher than for outdoor. The highest number of bacterial colonies was observed in house 37 indoor which was 490 cfu/ m3 and the lowest number of bacterial colonies were obtained from outdoors of house 3 & 34, which was 50 cfu /m3.
Taking the overall indoor (203 cfu/m3 and 221 cfu/m3) as well as outdoor (110 cfu/m3 and
121 cfu/ m3) total bacterial count values in flood affected and non- flooded houses into
account, the difference was very little. In order to determine whether these results are
statistically different, a two tailed t-test was performed. As a result of the uneven numbers of
sampling houses for each group (24 flood affected and 16 non-flooded houses) it was
necessary to perform the t-test twice for each group of houses. This way, all the flood
affected houses were considered and all of the bacterial colony count values were considered
for these calculations. In fact, for the first round of analysis, the first 16 flooded houses were
taken into account and for the second round of analysis, flooded houses 9-24 were considered
with the same set of 16 non-flooded houses. Finally, taking both p-values into account, it was
found that there was no significant difference in total bacterial colony counts of indoor and
outdoor locations of flood affected and non-flooded houses. The p-values are listed in Table
13 below.
0.00
100.00
200.00
300.00
400.00
500.00
600.00
3 4 20 21 29 30 31 32 33 34 36 37 38 39 40 41
Tota
l bac
teria
colo
ny co
unt (
cfu/
m3 )
House ID Average Indoor Average Outdoor

74
Table 13 : p values for flood affected vs. non flooded indoor and outdoor total bacterial colony count results
Indoor Outdoor
Flood (House1-16) & non flooded (House1-16) 0.3031 0.4526
Flood (House 9-24) & non flooded (House1-16) 0.8882 0.7547
95% confidence level was used.
75
3.2 Identification of Isolates Using Biochemical Tests Bacterial colonies were picked off from the TSA strips after two days incubation. These
colonies were streaked onto Mannitol Salt Agar (MSA) plates, which are commonly used for
the identification/isolation of S. aureus. It was important to remove bacterial colonies at the
two day incubation time in order to minimise fungal overgrowth on the TSA strips. However,
in some cases, for example, TSA strips from houses 14 and 40 were overgrown with fungi.
As a result of over growth of bacteria colonies in strips of house 35, it was unable to separate
bacterial colonies from fungi. In total, 2736 bacterial colonies were tested on MSA media and
of these, 1019 (37.24%) were mannitol salt fermenting bacteria. 589 isolates were from
flooded houses and 430 from non-flooded houses.
The MSA medium contains mannitol, a carbohydrate (that can be used by some bacteria as a
carbon source), 7.5% NaCl (high salt concentration) and phenol red as a pH indicator. Due to
the high salt concentration, this media serves to inhibit the growth of the majority of bacterial
species, except staphylococci. While most of the Staphylococcus sp. are able to tolerate high
salt concentrations and grow on MSA, S. aureus has the ability to ferment mannitol and
produces an acidic by product. As a consequence of the acidic by product, the pH drops in the
medium turning phenol red into yellow. Therefore, the MSA medium acts as a good initial
screen test selective for S. aureus, and is particularly useful when a large number of isolates
need to be tested. Before proceeding to molecular based identification of all the MSA
positive isolates, each isolate was tested for its ability to produce the enzyme, DNase. S.
aureus is known to produce the DNase enzyme, and hence this test can be used as a further
confirmation for S. aureus.
The averages of presumptive staphylococcus isolates obtained from air of flood affected
living rooms, bedrooms and outdoors were 30.96 cfu/ m3, 25.89 cfu/ m3 and 11.24 cfu/ m3
respectively. For non- flooded houses, presumptive staphylococcus isolates for each location
was 16.04 cfu/ m3 from living rooms, 23.71 cfu/ m3 from bedrooms and 7.55 cfu/ m3 from
outdoors. For both types of houses, the lowest number of presumptive staphylococcus
colonies was detected from the outdoor environment. A two-tailed t- test was applied in order
to determine whether the obtained numbers are statically significant. The outcome of the t-
tests are listed Table 14.
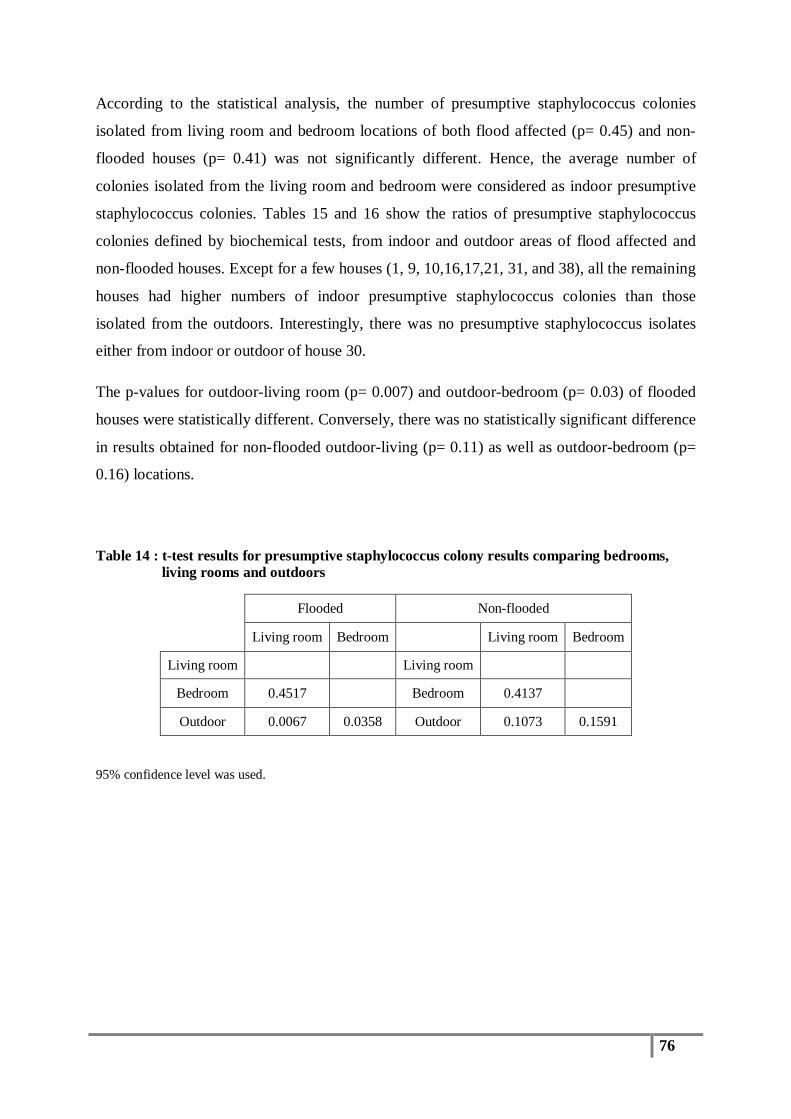
76
According to the statistical analysis, the number of presumptive staphylococcus colonies
isolated from living room and bedroom locations of both flood affected (p= 0.45) and non-
flooded houses (p= 0.41) was not significantly different. Hence, the average number of
colonies isolated from the living room and bedroom were considered as indoor presumptive
staphylococcus colonies. Tables 15 and 16 show the ratios of presumptive staphylococcus
colonies defined by biochemical tests, from indoor and outdoor areas of flood affected and
non-flooded houses. Except for a few houses (1, 9, 10,16,17,21, 31, and 38), all the remaining
houses had higher numbers of indoor presumptive staphylococcus colonies than those
isolated from the outdoors. Interestingly, there was no presumptive staphylococcus isolates
either from indoor or outdoor of house 30.
The p-values for outdoor-living room (p= 0.007) and outdoor-bedroom (p= 0.03) of flooded
houses were statistically different. Conversely, there was no statistically significant difference
in results obtained for non-flooded outdoor-living (p= 0.11) as well as outdoor-bedroom (p=
0.16) locations.
Table 14 : t-test results for presumptive staphylococcus colony results comparing bedrooms, living rooms and outdoors
Flooded Non-flooded
Living room Bedroom Living room Bedroom
Living room Living room Bedroom 0.4517 Bedroom 0.4137 Outdoor 0.0067 0.0358 Outdoor 0.1073 0.1591
95% confidence level was used.
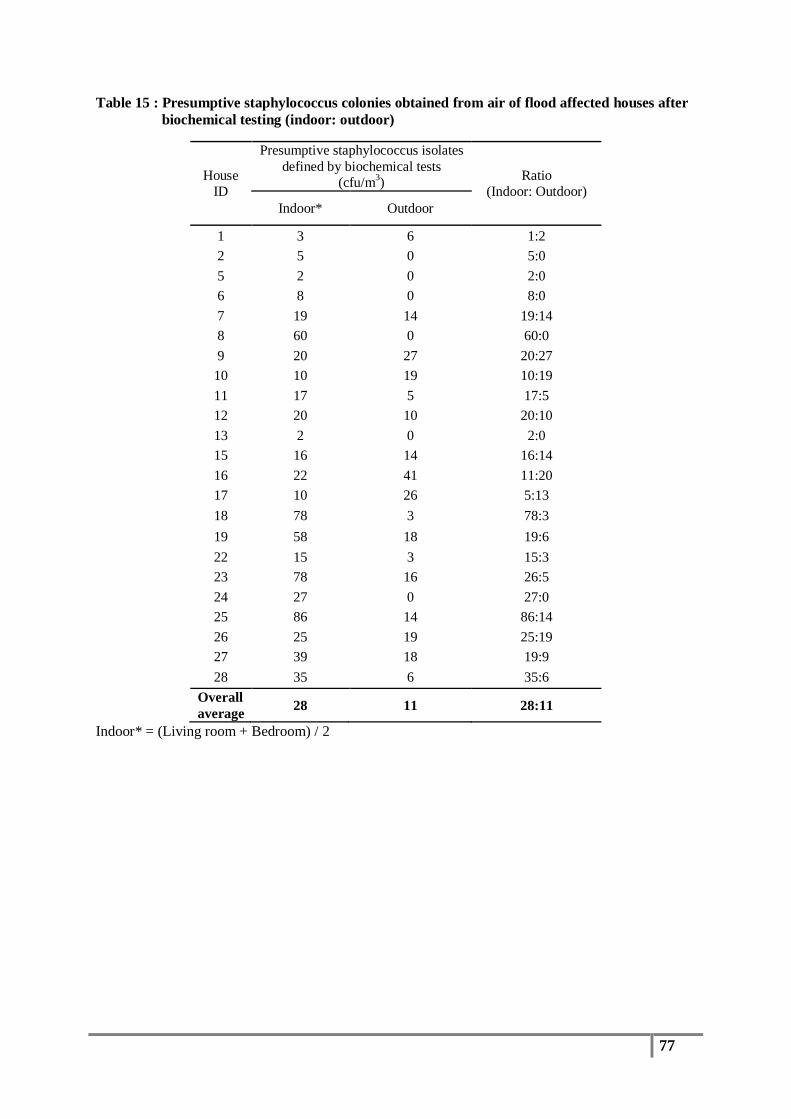
77
Table 15 : Presumptive staphylococcus colonies obtained from air of flood affected houses after biochemical testing (indoor: outdoor)
House ID
Presumptive staphylococcus isolates defined by biochemical tests
(cfu/m3) Ratio (Indoor: Outdoor)
Indoor* Outdoor
1 3 6 1:2 2 5 0 5:0 5 2 0 2:0 6 8 0 8:0 7 19 14 19:14 8 60 0 60:0 9 20 27 20:27 10 10 19 10:19 11 17 5 17:5 12 20 10 20:10 13 2 0 2:0 15 16 14 16:14 16 22 41 11:20 17 10 26 5:13 18 78 3 78:3 19 58 18 19:6 22 15 3 15:3 23 78 16 26:5 24 27 0 27:0 25 86 14 86:14 26 25 19 25:19 27 39 18 19:9 28 35 6 35:6
Overall average 28 11 28:11
Indoor* = (Living room + Bedroom) / 2
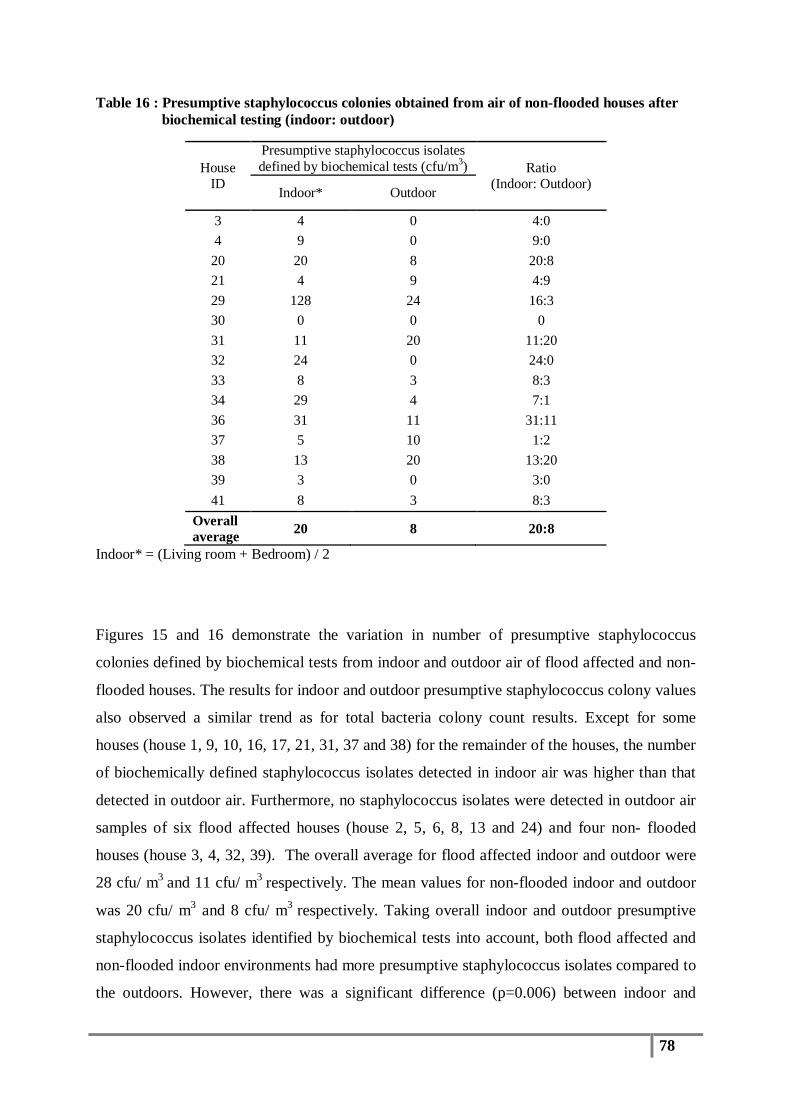
78
Table 16 : Presumptive staphylococcus colonies obtained from air of non-flooded houses after biochemical testing (indoor: outdoor)
House ID
Presumptive staphylococcus isolates defined by biochemical tests (cfu/m3) Ratio
(Indoor: Outdoor) Indoor* Outdoor
3 4 0 4:0 4 9 0 9:0 20 20 8 20:8 21 4 9 4:9 29 128 24 16:3 30 0 0 0 31 11 20 11:20 32 24 0 24:0 33 8 3 8:3 34 29 4 7:1 36 31 11 31:11 37 5 10 1:2 38 13 20 13:20 39 3 0 3:0 41 8 3 8:3
Overall average 20 8 20:8
Indoor* = (Living room + Bedroom) / 2
Figures 15 and 16 demonstrate the variation in number of presumptive staphylococcus
colonies defined by biochemical tests from indoor and outdoor air of flood affected and non-
flooded houses. The results for indoor and outdoor presumptive staphylococcus colony values
also observed a similar trend as for total bacteria colony count results. Except for some
houses (house 1, 9, 10, 16, 17, 21, 31, 37 and 38) for the remainder of the houses, the number
of biochemically defined staphylococcus isolates detected in indoor air was higher than that
detected in outdoor air. Furthermore, no staphylococcus isolates were detected in outdoor air
samples of six flood affected houses (house 2, 5, 6, 8, 13 and 24) and four non- flooded
houses (house 3, 4, 32, 39). The overall average for flood affected indoor and outdoor were
28 cfu/ m3 and 11 cfu/ m3 respectively. The mean values for non-flooded indoor and outdoor
was 20 cfu/ m3 and 8 cfu/ m3 respectively. Taking overall indoor and outdoor presumptive
staphylococcus isolates identified by biochemical tests into account, both flood affected and
non-flooded indoor environments had more presumptive staphylococcus isolates compared to
the outdoors. However, there was a significant difference (p=0.006) between indoor and
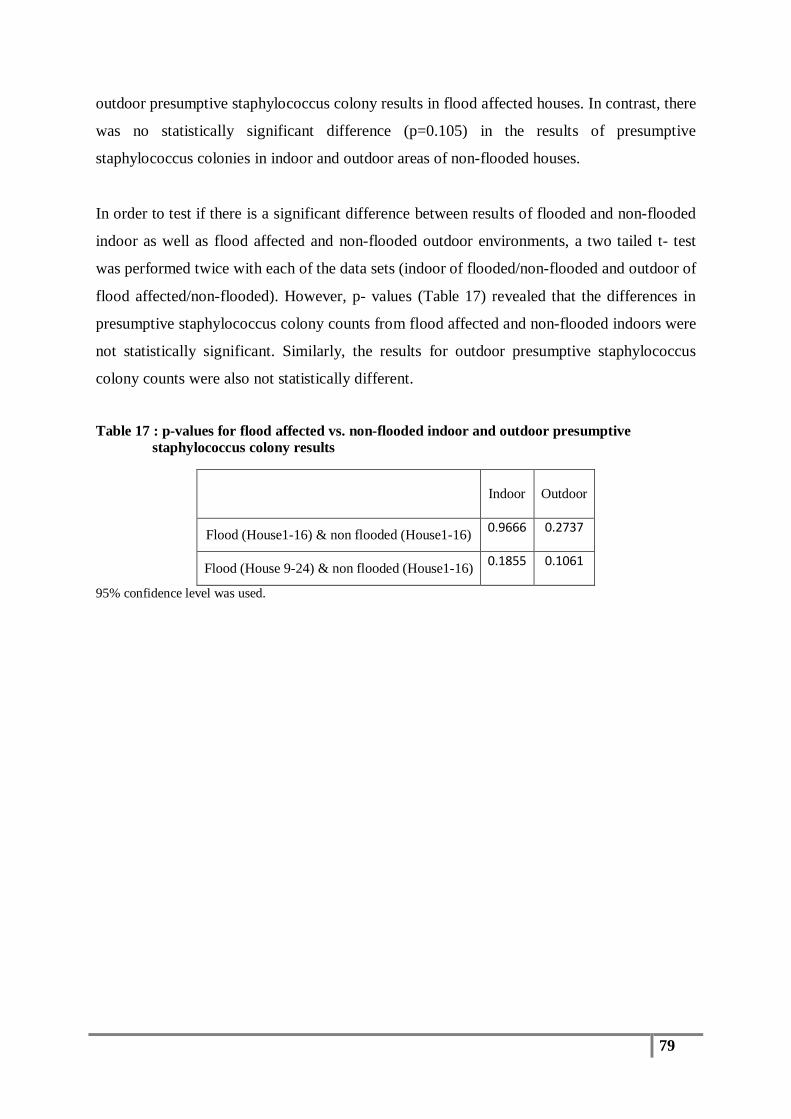
79
outdoor presumptive staphylococcus colony results in flood affected houses. In contrast, there
was no statistically significant difference (p=0.105) in the results of presumptive
staphylococcus colonies in indoor and outdoor areas of non-flooded houses.
In order to test if there is a significant difference between results of flooded and non-flooded
indoor as well as flood affected and non-flooded outdoor environments, a two tailed t- test
was performed twice with each of the data sets (indoor of flooded/non-flooded and outdoor of
flood affected/non-flooded). However, p- values (Table 17) revealed that the differences in
presumptive staphylococcus colony counts from flood affected and non-flooded indoors were
not statistically significant. Similarly, the results for outdoor presumptive staphylococcus
colony counts were also not statistically different.
Table 17 : p-values for flood affected vs. non-flooded indoor and outdoor presumptive staphylococcus colony results
Indoor
Outdoor
Flood (House1-16) & non flooded (House1-16) 0.9666 0.2737
Flood (House 9-24) & non flooded (House1-16) 0.1855 0.1061
95% confidence level was used.
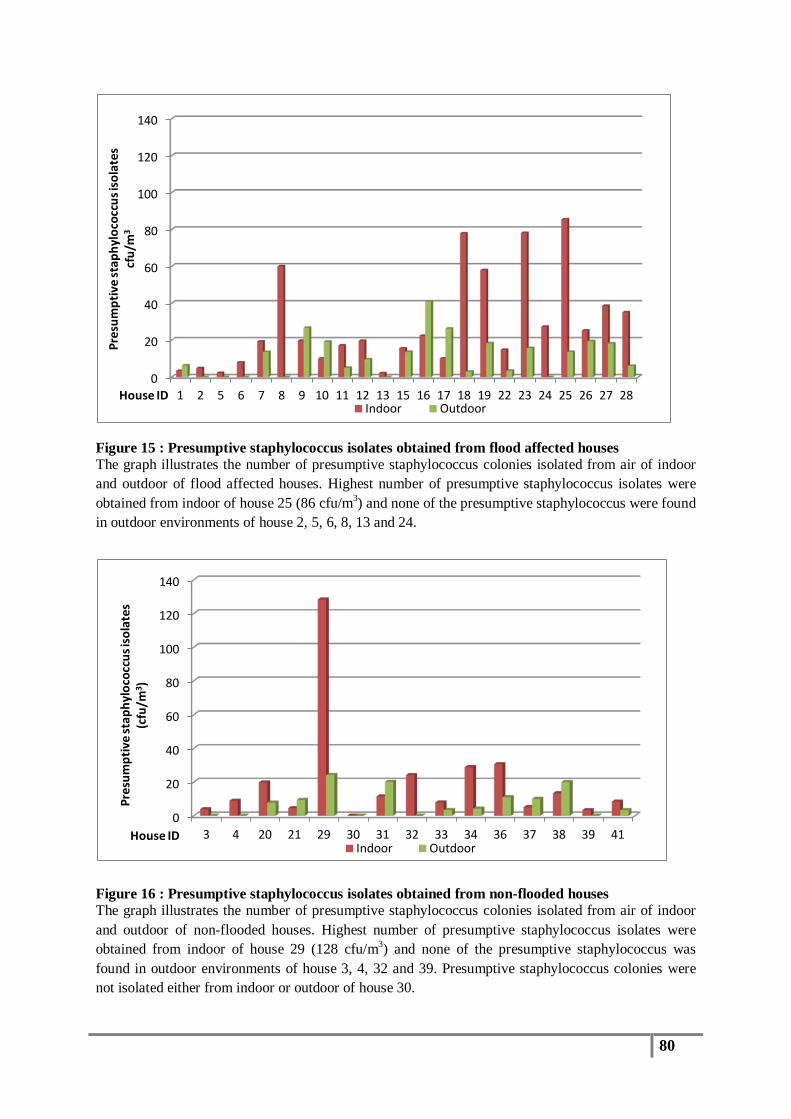
80
Figure 15 : Presumptive staphylococcus isolates obtained from flood affected houses The graph illustrates the number of presumptive staphylococcus colonies isolated from air of indoor and outdoor of flood affected houses. Highest number of presumptive staphylococcus isolates were obtained from indoor of house 25 (86 cfu/m3) and none of the presumptive staphylococcus were found in outdoor environments of house 2, 5, 6, 8, 13 and 24.
Figure 16 : Presumptive staphylococcus isolates obtained from non-flooded houses The graph illustrates the number of presumptive staphylococcus colonies isolated from air of indoor and outdoor of non-flooded houses. Highest number of presumptive staphylococcus isolates were obtained from indoor of house 29 (128 cfu/m3) and none of the presumptive staphylococcus was found in outdoor environments of house 3, 4, 32 and 39. Presumptive staphylococcus colonies were not isolated either from indoor or outdoor of house 30.
0
20
40
60
80
100
120
140
1 2 5 6 7 8 9 10 11 12 13 15 16 17 18 19 22 23 24 25 26 27 28
Pres
umpt
ive
stap
hylo
cocc
us is
olat
es
cfu/
m3
House ID Indoor Outdoor
0
20
40
60
80
100
120
140
3 4 20 21 29 30 31 32 33 34 36 37 38 39 41
Pres
umpt
ive
stap
hylo
cocc
us is
olat
es
(cfu
/m3 )
House ID Indoor Outdoor
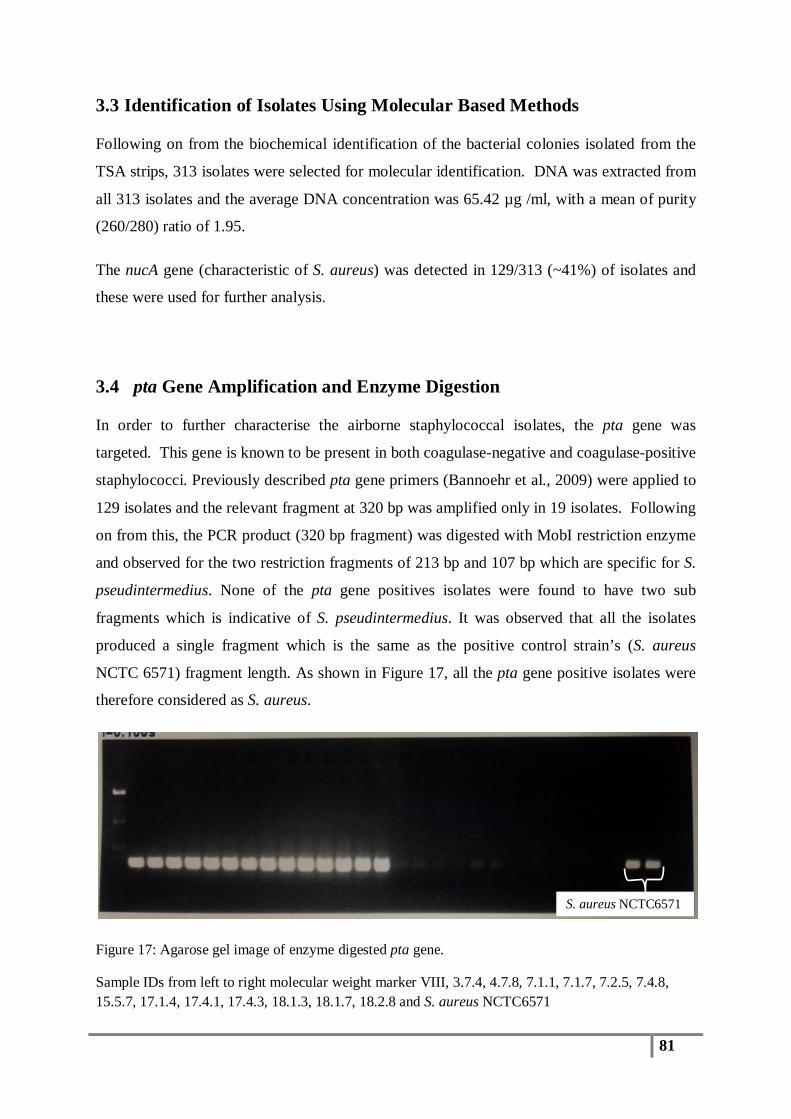
81
3.3 Identification of Isolates Using Molecular Based Methods
Following on from the biochemical identification of the bacterial colonies isolated from the
TSA strips, 313 isolates were selected for molecular identification. DNA was extracted from
all 313 isolates and the average DNA concentration was 65.42 µg /ml, with a mean of purity
(260/280) ratio of 1.95.
The nucA gene (characteristic of S. aureus) was detected in 129/313 (~41%) of isolates and
these were used for further analysis.
3.4 pta Gene Amplification and Enzyme Digestion
In order to further characterise the airborne staphylococcal isolates, the pta gene was
targeted. This gene is known to be present in both coagulase-negative and coagulase-positive
staphylococci. Previously described pta gene primers (Bannoehr et al., 2009) were applied to
129 isolates and the relevant fragment at 320 bp was amplified only in 19 isolates. Following
on from this, the PCR product (320 bp fragment) was digested with MobI restriction enzyme
and observed for the two restriction fragments of 213 bp and 107 bp which are specific for S.
pseudintermedius. None of the pta gene positives isolates were found to have two sub
fragments which is indicative of S. pseudintermedius. It was observed that all the isolates
produced a single fragment which is the same as the positive control strain’s (S. aureus
NCTC 6571) fragment length. As shown in Figure 17, all the pta gene positive isolates were
therefore considered as S. aureus.
Figure 17: Agarose gel image of enzyme digested pta gene.
Sample IDs from left to right molecular weight marker VIII, 3.7.4, 4.7.8, 7.1.1, 7.1.7, 7.2.5, 7.4.8, 15.5.7, 17.1.4, 17.4.1, 17.4.3, 18.1.3, 18.1.7, 18.2.8 and S. aureus NCTC6571
S. aureus NCTC6571

82
3.5 16S rDNA and tuf Gene Sequencing Results
The final step in characterising the airborne staphylococci was to subject selected strains to
16S rDNA and tuf gene sequencing. From each residence, one isolate was selected randomly
and subjected to both forward and reverse sequencing of the tuf gene. In total, 36 isolates,
including the S. aureus ATCC6571control isolate, was sequenced for the tuf gene. Each tuf
gene sequence was analysed using the BlastN algorithm which is available on the NCBI
website and subsequently, a phylogenetic tree was generated using the Geneious® 6.0.6
software program. DNA sequences of two isolates were discarded due to the low quality of
the data and Table 18 describes the abundance of each identified species using the tuf gene
sequences. Figure 18 show the phylogenetic tree generated using the tuf gene sequences.
Table 18 : Species identification based on tuf gene sequences and abundance of each species
Species identification Number of isolates Prevalence (%)
S. haemolyticus 1 3%
S. capitis 7 22%
S. sciuri 1 3%
S. carnosus 2 6%
S. condimenti 4 12%
S. xylosus 2 6%
M. caseolyticus 15 47%
A total of 67 isolates, including the S. aureus ATCC6571 control isolate were subjected to
16S rDNA sequencing (both forward and reverse directions). From each house, a minimum
of two isolates were randomly selected where possible. The DNA sequences were analysed
with the
BlastN algorithm on the NCBI website and a phylogenetic tree was constructed using the
Geneious® software program version 6.0.6. Prior to generating a phylogenetic tree, the
sequences were aligned using ClustalW Alignment (Figure 20). Each number in the
phylogenetic tree represents an isolate and the isolate number is provided in Table 20. 16S
rDNA DNA sequences for two isolates were discarded due to the low quality of the sequence
data. Speciation and prevalence of the remaining isolates are listed in Table 19.
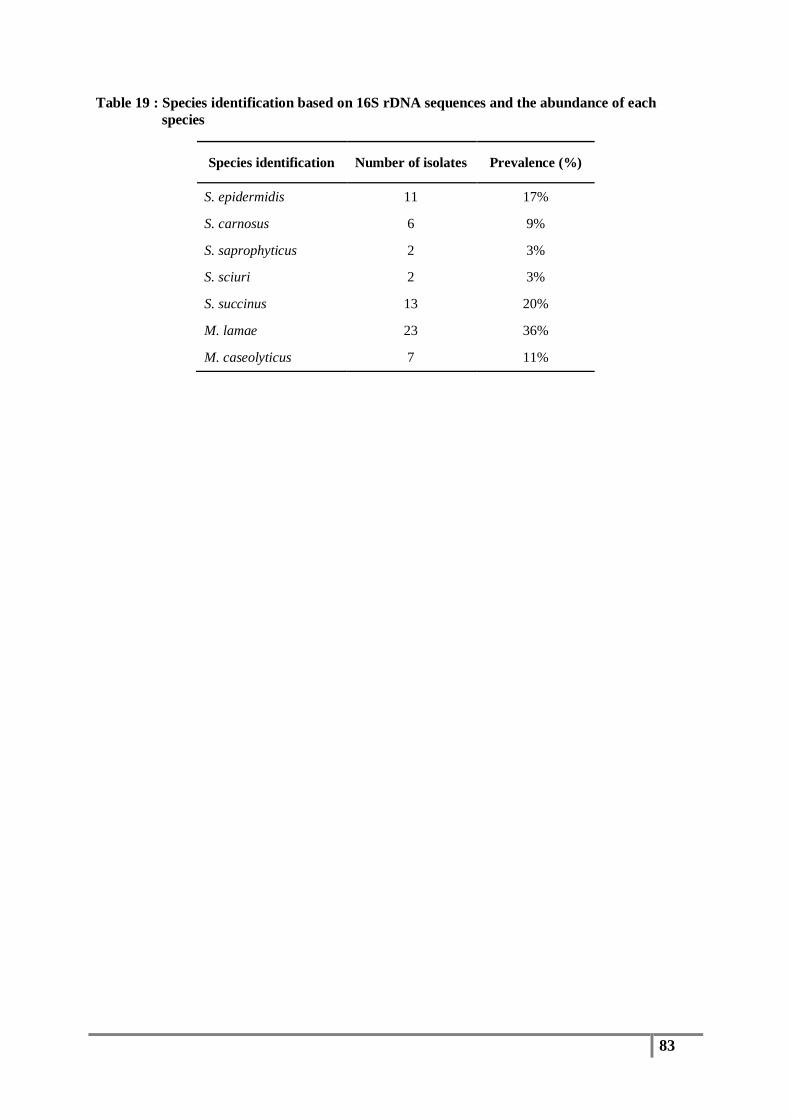
83
Table 19 : Species identification based on 16S rDNA sequences and the abundance of each species
Species identification Number of isolates Prevalence (%)
S. epidermidis 11 17%
S. carnosus 6 9%
S. saprophyticus 2 3%
S. sciuri 2 3%
S. succinus 13 20%
M. lamae 23 36%
M. caseolyticus 7 11%
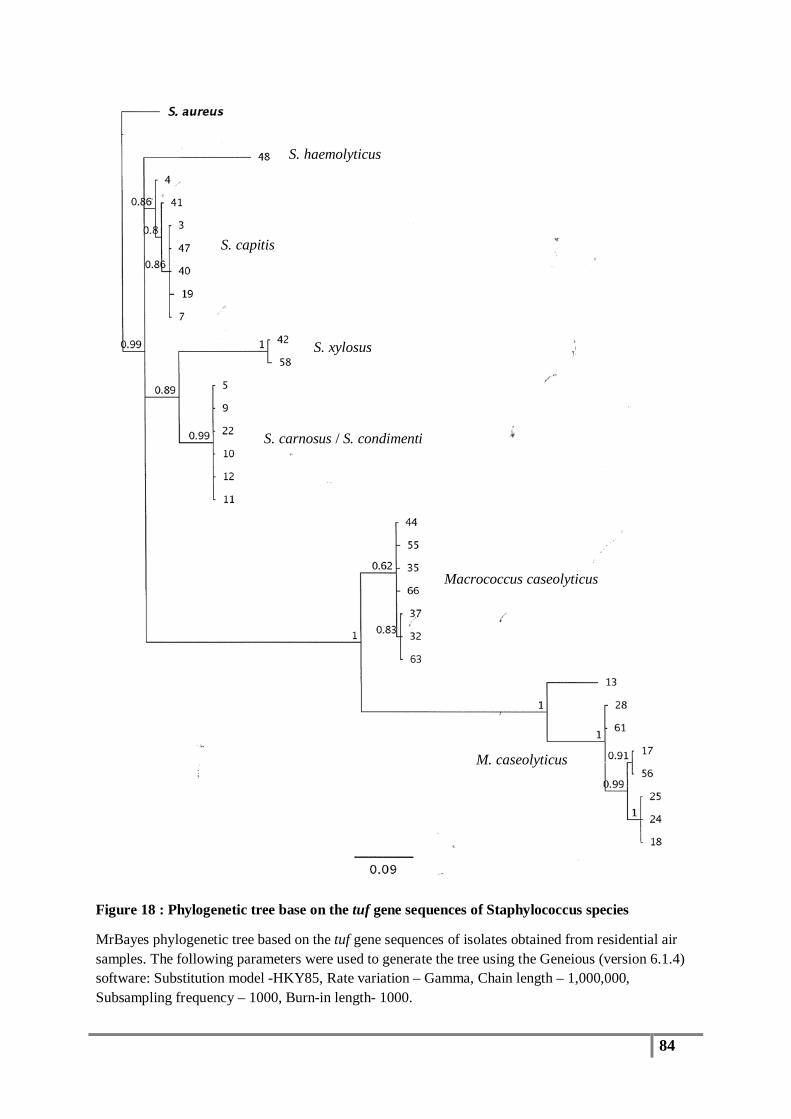
84
Figure 18 : Phylogenetic tree base on the tuf gene sequences of Staphylococcus species
MrBayes phylogenetic tree based on the tuf gene sequences of isolates obtained from residential air samples. The following parameters were used to generate the tree using the Geneious (version 6.1.4) software: Substitution model -HKY85, Rate variation – Gamma, Chain length – 1,000,000, Subsampling frequency – 1000, Burn-in length- 1000.
S. haemolyticus
S. capitis
S. xylosus
S. carnosus / S. condimenti
Macrococcus caseolyticus
M. caseolyticus

85
Figure 19 : Phylogenetic tree based on the 16S rRNA gene sequences of Staphylococcus species
MrBayes phylogenetic tree based on the 16S rRNA gene sequences of isolates obtained from residential air samples. The following parameters were used to generate the tree using Geneious (version 6.1.4) software: Substitution model -HKY85, Rate variation – Gamma, Chain length – 1,000,000, subsampling frequency – 1000, Burn-in length- 1000.
S. epidermidis
S. carnosus
S. saprophyticus
S. sciuri
S. succinus
M. lamae M. lamae
M. lamae
M. caseolyticus
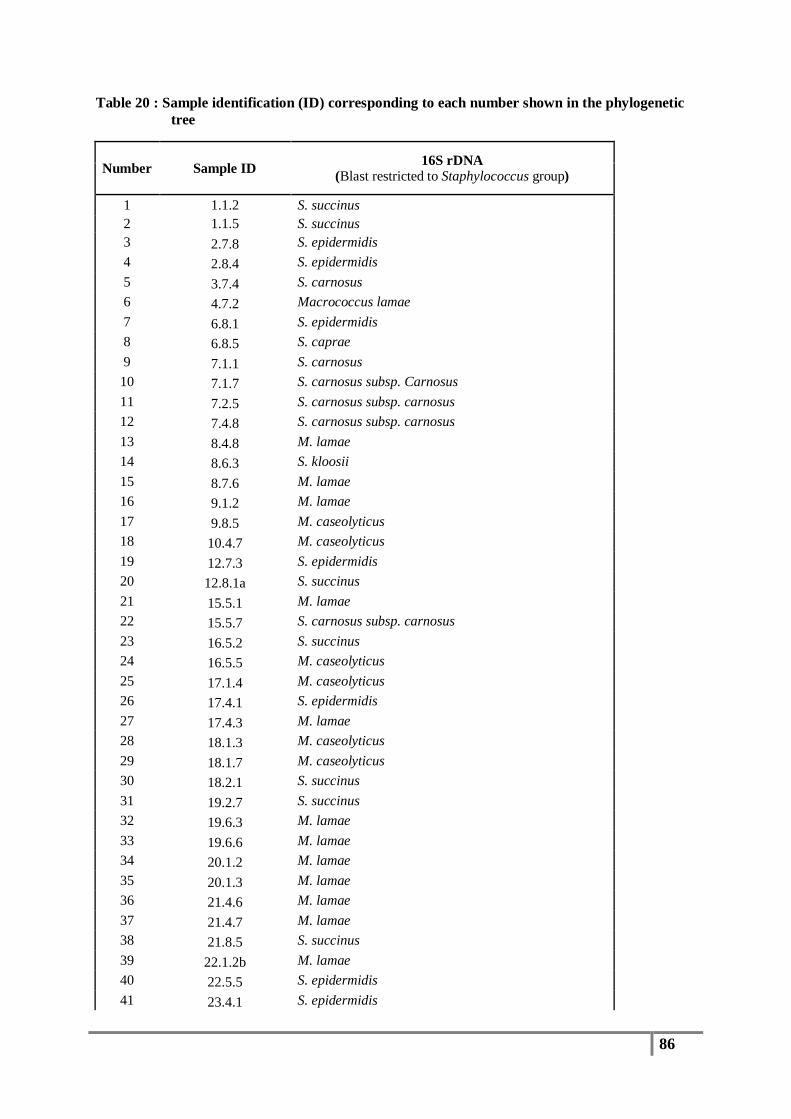
86
Table 20 : Sample identification (ID) corresponding to each number shown in the phylogenetic tree
Number Sample ID 16S rDNA (Blast restricted to Staphylococcus group)
1 1.1.2 S. succinus 2 1.1.5 S. succinus 3 2.7.8 S. epidermidis 4 2.8.4 S. epidermidis 5 3.7.4 S. carnosus 6 4.7.2 Macrococcus lamae 7 6.8.1 S. epidermidis 8 6.8.5 S. caprae 9 7.1.1 S. carnosus 10 7.1.7 S. carnosus subsp. Carnosus 11 7.2.5 S. carnosus subsp. carnosus 12 7.4.8 S. carnosus subsp. carnosus 13 8.4.8 M. lamae 14 8.6.3 S. kloosii 15 8.7.6 M. lamae 16 9.1.2 M. lamae 17 9.8.5 M. caseolyticus 18 10.4.7 M. caseolyticus 19 12.7.3 S. epidermidis 20 12.8.1a S. succinus 21 15.5.1 M. lamae 22 15.5.7 S. carnosus subsp. carnosus 23 16.5.2 S. succinus 24 16.5.5 M. caseolyticus 25 17.1.4 M. caseolyticus 26 17.4.1 S. epidermidis 27 17.4.3 M. lamae 28 18.1.3 M. caseolyticus 29 18.1.7 M. caseolyticus 30 18.2.1 S. succinus 31 19.2.7 S. succinus 32 19.6.3 M. lamae 33 19.6.6 M. lamae 34 20.1.2 M. lamae 35 20.1.3 M. lamae 36 21.4.6 M. lamae 37 21.4.7 M. lamae 38 21.8.5 S. succinus 39 22.1.2b M. lamae 40 22.5.5 S. epidermidis 41 23.4.1 S. epidermidis
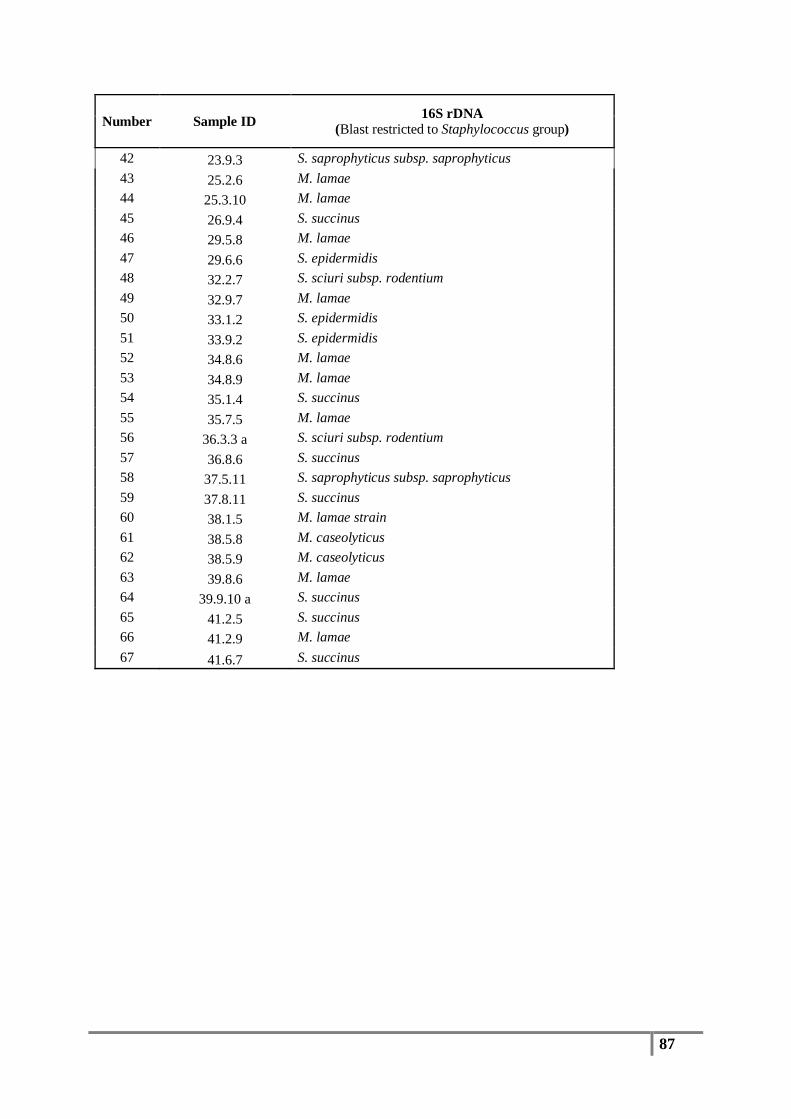
87
Number Sample ID 16S rDNA (Blast restricted to Staphylococcus group)
42 23.9.3 S. saprophyticus subsp. saprophyticus 43 25.2.6 M. lamae 44 25.3.10 M. lamae 45 26.9.4 S. succinus 46 29.5.8 M. lamae 47 29.6.6 S. epidermidis 48 32.2.7 S. sciuri subsp. rodentium 49 32.9.7 M. lamae 50 33.1.2 S. epidermidis 51 33.9.2 S. epidermidis 52 34.8.6 M. lamae 53 34.8.9 M. lamae 54 35.1.4 S. succinus 55 35.7.5 M. lamae 56 36.3.3 a S. sciuri subsp. rodentium 57 36.8.6 S. succinus 58 37.5.11 S. saprophyticus subsp. saprophyticus 59 37.8.11 S. succinus 60 38.1.5 M. lamae strain 61 38.5.8 M. caseolyticus 62 38.5.9 M. caseolyticus 63 39.8.6 M. lamae 64 39.9.10 a S. succinus 65 41.2.5 S. succinus 66 41.2.9 M. lamae 67 41.6.7 S. succinus

88
3.6 Identification of Methicillin-resistant Isolates
Of the 129 isolates characterised as Staphylococcus species by the nucA gene, 103 (~80%)
isolates were identified as methicillin-resistant staphylococci. These isolates were found to
harbour the mecA gene. S. aureus ATCC 49476 was used as a mecA positive control and S.
aureus NCTC 6571 was used as a mecA negative control. The amplification results were
validated using melting temperature with respect to the S. aureus positive control.
Table 21 : Methicillin-resistant staphylococcus isolates obtained from air of flood affected
houses
House ID
Methicillin-resistant isolates Ratio (Indoor: Outdoor) Indoor Outdoor
1 1 3 1:3 2 1 0 1:0 5 0 0 0 6 2 0 2:0 7 0 0 0 8 3 0 3:0 9 1 0 1:0 10 1 0 1:0 11 0 0 0 12 2 1 2:1 13 0 0 0 15 3 1 3:1 16 1 0 1:0 17 0 1 0:1 18 0 8 0:8 19 1 1 1:1 22 1 1 1:1 23 1 0 1:0 24 0 0 0 25 0 3 0:3 26 1 0 1:0 27 0 0 0 28 0 0 0
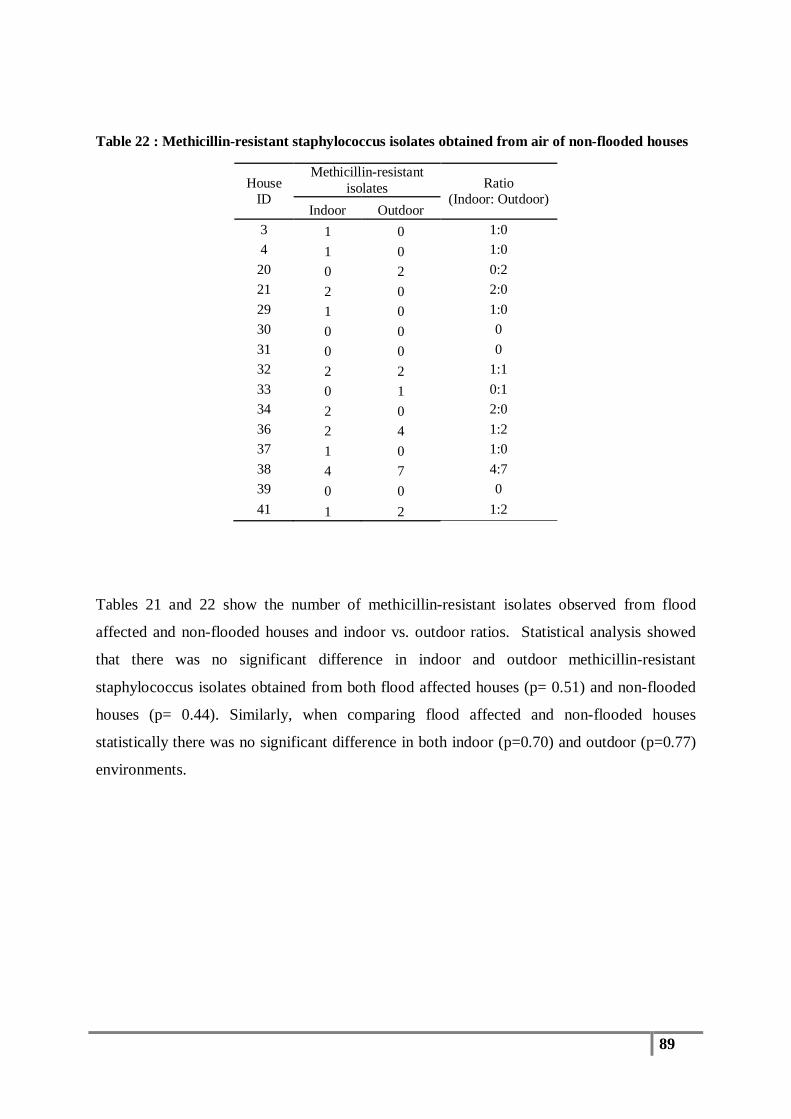
89
Table 22 : Methicillin-resistant staphylococcus isolates obtained from air of non-flooded houses
House ID
Methicillin-resistant isolates Ratio
(Indoor: Outdoor) Indoor Outdoor
3 1 0 1:0 4 1 0 1:0 20 0 2 0:2 21 2 0 2:0 29 1 0 1:0 30 0 0 0 31 0 0 0 32 2 2 1:1 33 0 1 0:1 34 2 0 2:0 36 2 4 1:2 37 1 0 1:0 38 4 7 4:7 39 0 0 0 41 1 2 1:2
Tables 21 and 22 show the number of methicillin-resistant isolates observed from flood
affected and non-flooded houses and indoor vs. outdoor ratios. Statistical analysis showed
that there was no significant difference in indoor and outdoor methicillin-resistant
staphylococcus isolates obtained from both flood affected houses (p= 0.51) and non-flooded
houses (p= 0.44). Similarly, when comparing flood affected and non-flooded houses
statistically there was no significant difference in both indoor (p=0.70) and outdoor (p=0.77)
environments.

90
Figure 20 : Methicillin-resistant staphylococcus isolates from flood affected houses
Highest number of methicillin-resistant isolates was obtained from outdoor of house 18 (8 isolates). Methicillin-resistant staphylococcus were not isolated either from indoor or outdoor of house 5, 7, 11, 13,24,27,28.
Figure 21 : Methicillin-resistant staphylococcus isolates from non-flooded houses
Highest number of methicillin-resistant isolates was obtained from outdoor of house 38 (7 isolates). Methicillin-resistant staphylococcus were not isolated either from indoor or outdoor of house 30, 31, 39.
0
1
2
3
4
5
6
7
8
1 2 5 6 7 8 9 10 11 12 13 15 16 17 18 19 22 23 24 25 26 27 28 35
Met
hici
llin
resi
stan
t iso
late
s (cf
u/m
3 )
Methicillin resistant isolates Indoor Methicillin resistant isolates outdoor
0
1
2
3
4
5
6
7
8
3 4 20 21 29 30 31 32 33 34 36 37 38 39 41
Met
hici
llin
resi
stan
t iso
late
s (cf
u/m
3 )
Methicillin resistant isolates Indoor Methicillin resistant isolates outdoor
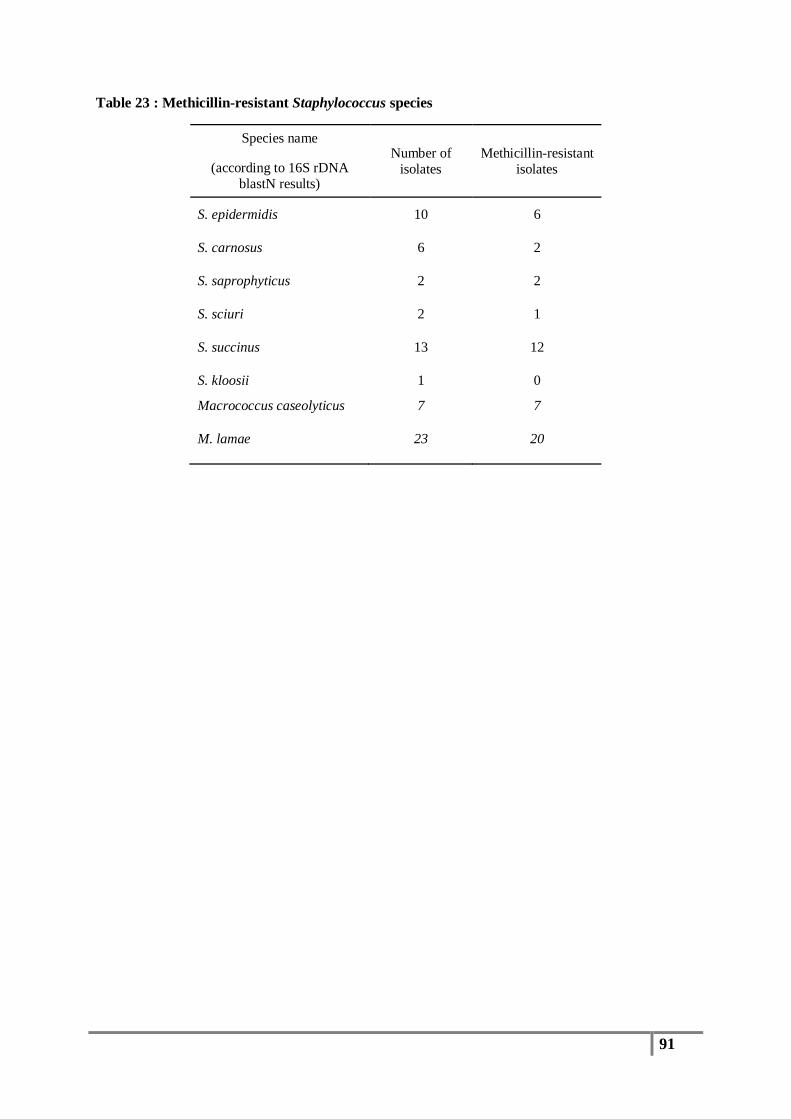
91
Table 23 : Methicillin-resistant Staphylococcus species
Species name
(according to 16S rDNA blastN results)
Number of isolates
Methicillin-resistant isolates
S. epidermidis 10 6
S. carnosus 6 2
S. saprophyticus 2 2
S. sciuri 2 1
S. succinus 13 12
S. kloosii 1 0
Macrococcus caseolyticus 7 7
M. lamae 23 20

92

93
Chapter Four
General Discussion & Future Directions

94
4. General Discussion
Staphylococci are one of the species that can be found in normal microbial flora of air.
Previous studies have identified these organisms in aerosols of different environments such as
hospitals, class rooms, offices, childcare centres and in residences. However, no studies on
identifying staphylococcus species in residential air using molecular methods have been
published to date. In this study, both biochemical and molecular methods were applied to
identify staphylococcus species derived from residential air samples including flood affected
environments.
4.1 Total Bacterial Colony Counts During March 2011 to May 2011 air samples were collected from 41 houses in the
surrounding Brisbane city area, of which 25 houses were affected by the major flood event in
January 2011. Residential air was collected at three different locations, namely the living
room, bedroom and outdoor area of each house. Total bacterial colony counts were
performed for each sample.
Taking all the statistical analysis results into account total bacterial colony count results in
living room and bedroom were not statistically different. This trend was observed in both
flood affected as well as non-flooded houses. Therefore, in all situations, the average of
living room and bedroom results were considered as indoor and was compared to outdoor
data. Since both of these rooms are located inside the house, it is evident that factors that can
affect the number of bacteria present in the air are more or less similar. Comparing outdoor
bacterial colony count results to living room and bedroom, results were highly statistically
different (p< 0.005) in both flood affected and non-flooded houses. The p-values were
0.0005, 0.002, 0.002, 0.001 for flooded outdoor-living room, outdoor-bedroom, non-flooded
outdoor-living room and outdoor-bedroom respectively. This finding is supported by
previous studies by Fabian et al., (2004) and Gandara et al., (2006) (Gandara et al., 2006)
(Fabian et al., 2005).
Analysing indoor-outdoor total bacterial colony count data, it was statistically different in
both flood affected and non-flooded houses. In fact, the average colony count in indoors was
higher than in the outdoor environment. The air environment is not a favourable place for
bacterial survival and the outdoor environment is even worse, mainly due to rapid air flow,

95
UV radiation etc. Compared to the outdoors, the inside of a house has less UV radiation,
more human activities and less air flow which, in other words, are more favourable
conditions for the survival of bacteria. In addition, outdoor bacterial populations mainly
depend on soil and plant materials in the vicinity whereas in the indoor environment, human
and animal activities are the major factors that influence bacterial populations. Therefore, the
data presented in this study provides evidence for an indoor source for culturable bacteria in
houses.
Considering the geographical location of the flood affected houses, the average total bacterial
count was highest in the indoor areas of houses 17 (558 cfu/m3), 19 (465 cfu/m3) and 25 (427
cfu/m3). Houses 17 (0.035 Km) and 25 (0.046 Km) were located on blocks of land within
close proximity to each other (approximately 152m distance) and all three houses (17, 19 and
25) were close to the Brisbane river. In fact, the distances from the river to houses 17, 19 and
25 were 35m, 220m and 46m respectively. The lowest total bacterial count for outdoor areas
were found for houses 1 (30 cfu/m3), 18 (30 cfu/m3), 6 (47 cfu/m3) and 24 (47 cfu/m3), and
these houses were located in West End, St. Lucia, Woolloongabba and Manly suburbs. In fact
these houses were located in geographically distant places. Compared to the location of house
1, the distance to house 24 was 18.4 Km and for house 37 was 38.6 Km. Except for these two
houses, the distances between house 1 and all the other houses were between 0.6 Km – 8.2
Km. However, the geographical locations of the houses were distributed across a wide area.
Hence, a trend relating to geographical positioning of the houses was not observed.
However, when comparing the colony count results in flood affected and non-flooded houses,
the p-values indicate that there is no significant difference between the two groups of houses,
in fact, the difference between the airborne bacterial count in flood affected and non-flooded
houses is minor. This could be due to a natural decline in the bacterial population in air over
time and also as a result of the massive cleaning process after the flood event in January
2011. Due to the absence of a “baseline house” which was flooded but cleaned at the time of
sampling, the effectiveness of the cleaning process cannot be evaluated. As discussed in
section 4.2 below, other factors such as human and animal presence as well as their
movements can contribute to the abundance of total bacteria in air. Furthermore, a similar
trend has been observed for fungal count analysis which was performed as separate part of
this project (see appendix material for details).
96
4.2 Analysis of Biochemically Defined Staphylococcus aureus and Related
Species After completing the bacterial colony counts for both flooded and non-flooded houses,
bacterial colonies were selected from the TSA strips and subjected to MSA and DNase
testing. These two biochemical tests were performed on 1656 and 1080 colonies from flooded
houses and non-flooded houses respectively. MSA and DNase are considered as preliminary
identification tests for the identification/isolation of staphylococcal species and are used
routinely. Generally, for the precise identification of S. aureus isolates, a battery of tests are
required, and this is both costly and time consuming. Several studies have shown that no
single phenotypic test can guarantee reliable results for the identification of S. aureus
(Kateete et al., 2010) isolates in particular. Of the 1656 colonies from flooded houses, 589
(~35%) were positive for the MSA test. From non-flooded houses, 430 of the 1080 isolates
(~40%) were positive for the MSA test. The DNase testing of these isolates revealed that 211
(~12%) and 102 (~9%) isolates from flooded and non-flooded houses respectively were
positive. Finally, after these preliminary screening tests, a total of 313 isolates were identified
as potentially S. aureus or staphylococcal species.
Similar to the total bacterial colony count data, no significant differences were found for
living rooms and bedrooms for presumptive staphylococcus colony data. Therefore, the
average of living room and bedroom colony counts were considered as indoor presumptive
staphylococcus species. According to the statistical analysis, the number of presumptive
staphylococcus isolates obtained from indoor and outdoor areas, was statistically significantly
different. In fact, higher values for presumptive staphylococci were observed in indoor
compared to outdoor environments for most of the flood affected houses. In contrast, there
was no significant difference in the numbers of colonies isolated from indoor and outdoor
areas of non-flooded houses. When considering the sources of staphylococci in air, they can
originate from human activities (coughing, sneezing, talking, food preparation, house or floor
cleaning), skin shedding as well as companion animals, which can also be considered as a
reservoirs of staphylococcus species (Vannuffel et al., 1999). Air sampling can be influenced
by temperature, humidity, wind velocity as well as time of day. If the air sampling was
carried out early in the morning when there’s more human activity, there is a possibility of
obtaining higher numbers of bacteria. Even though all movement was avoided during
sampling periods, it takes a while for bacteria to settle out of the air after all activities have
ceased.
97
Biochemically defined staphylococcus results in indoor environments of flood affected and
non-flooded houses were not significantly different. A similar trend was observed in outdoor
environments as well. In fact, this result implies that the air of flood affected houses was not
that much different to non-flooded houses. Moreover, staphylococcus species are considered
as environmentally hardy microorganisms (Davis et al., 2012) and they could remain viable
in dry environments for at least a week to three months or longer (Beard-Pegler et al., 1988,
Boyce, 2007, Dietze et al., 2001). Thus, the lack of significant results for staphylococcus
observed in flood affected and non-flooded houses could be highly likely due to the efficient
cleaning process after the flood event. However, their survival seems to be dependent on
several factors such as dust composition, temperature, humidity and strain of the organism
(Boyce, 2007, Dietze et al., 2001, Lidwell and Lowbury, 1950). Therefore, in order to obtain
a better understanding of the effect of flooding on airborne staphylococci, all the above
mentioned factors needs to be considered.
In summary, statistically significant differences in Staphylococcus sp. isolated from indoors
and outdoors of both types of houses, indicate an indoor source for Staphylococcus sp. The
lack of significant difference in flood affected and non-flooded houses could be attributed to
both environments being similar after the flood event. In fact, flooding seems to have had no
influence on airborne Staphylococcus sp. in domestic air.

98
4.3 Molecular Identification of Staphylococcus aureus and Related Species In order to further characterise the staphylococcal isolates, genetic assays were applied.
DNA was extracted from the 313 isolates phenotypically identified as staphylococcal species.
Three different genes were targeted nucA, tuf and pta for the speciation of isolated
presumptive staphylococcus species from residential air samples.
The nucA gene was targeted as a staphylococcal-specific marker, using real-time PCR. The
nucA gene was detected in 129 isolates (41%). nucA positive isolates were found in both
flooded (74) and non-flooded houses (55). The fact that isolates harbour the nucA gene
indirectly provides a clue about the coagulase activity of these isolates (Madison and
Baselski, 1983). In other words, these isolates are potentially coagulase-positive. The isolates
used for 16S rRNA gene sequencing were screened for the coagulase gene and 31 out of 67
isolates harboured the coagulase gene. In addition, there is some evidence of the presence of
the nucA gene in Staphylococcus Intermedius Group (SIG), that is, S. intermedius, S. delphini
and S. pseudintermedius. Furthermore, there have been six species of coagulase-positive
staphylococci described other than S. aureus, namely, S. intermedius, S. delphini, S. lutrae,
S. schleiferi subsp. coagulans, S. hyicus and S. pseudintermedius (Schleifer, 2009, Devriese
et al., 2005, Freney et al., 1999). For further differentiation of coagulase-positive species,
especially SIG strains, it was decided to apply a PCR-RFLP method which determines the
presence of an enzyme restriction site in the pta gene (Bannoehr et al., 2009). The pta PCR
product was amplified only in 19 isolates and when the restriction enzyme digestion was
performed, none produced the characteristic fragments for S. pseudintermedius, which consist
of the presence of two DNA fragments, one 213 bp in length and another 107 bp in length.
Hence, it was concluded that none of the 19 staphylococcal isolates were S.
pseudintermedius.
Several studies have shown that biochemically, S. pseudintermedius can easily be
misidentified as S. aureus (Bannoehr et al., 2007, Boyen et al., 2009, Devriese et al., 2005).
Moreover, S. pseudintermedius is one of the most common pathogens isolated from skin and
ear infections in dogs thus, there is a possibility of isolating S. pseudintermedius in residential
air as well. So as to further identify and characterise the airborne staphylococcal isolates,
previously described tuf gene (Hwang et al., 2011) primers were applied to all of the isolates.
The tuf gene was amplified according to the conditions described by Hwang et al. (2011) and
it was found that 97 of these isolates harbour the tuf gene. Where possible, at least one

99
staphylococcal isolate from each house was subjected to sequencing of the tuf gene and the
resulting sequences were analysed using the NCBI database. It was found that the maximum
identification value varied between 78-100%. The phylogenetic tree constructed using the
tuf gene sequences, showed the following six clusters of staphylococcal species namely; S.
haemolyticus, S. capitis, S. sciuri, S. carnosus and S.condimenti, S. xylosus. Interestingly,
some of the isolates were characterised as Macrococcus caseolyticus and they were mainly
divided into two clusters. Macrococcus is most closely related to the Staphylococcus genus.
Initially, this genus was classified as part of the Staphylococcus genus and only recently has
been classified into a separate group. In 1982, Macrococcus caseolyticus was named
Staphylococcus caseolyticus by Schleifer et al., (1982) and it received its current designation
in 1998 by Kloos et al., (Kloos et al., 1998).
As 16S rDNA sequencing is considered the “Gold Standard” for bacterial speciation, it was
decided to apply 16S rDNA sequencing to the same set of isolates. Nucleotide sequences
were analysed with the NCBI database and a phylogenetic tree which was constructed based
on the 16S rDNA sequences. According to the 16S rDNA phylogenetic tree, five clusters of
staphylococci were found, identifying S. epidermidis, S. carnosus, S. saprophiticus, S. sciuru
and S. succinus. Other than five Staphylococcus species, two species of Maccrococcus
namely M. lamae and M. caseolyticus were also identified by the 16S rDNA. In total all of
the Macrococcus species created four clusters, three separate clusters of M. lamae and a
single cluster byof M. caseolyticus. When comparing the phylogenetic trees generated from
sequencing the tuf gene to that of the 16S rDNA, it was found that more staphylococcal
species were able to be identified by 16S rDNA sequencing.
For a given isolate the speciation by tuf gene sequences and 16S rRNA gene sequences does
not necessarily match with each other. Some examples are as follows; isolate 1 (2.7.8), 2
(2.8.4), 5 (6.8.1), 13 (12.7.3), 21 (22.5.5), 22 (23.4.1) and 26 (29.6.6) were all identified as S.
capitis by tuf gene sequencing whereas they were identified as S. epidermidis by 16S rDNA
sequencing. Similarly, for isolate 8 (7.2.5), 9 (7.4.8), 14 (15.5.7) tuf BlastN sequence analysis
identified these as S. condimenti whereas all these isolates were identified as S. carnous
subsp. carnosus by 16S rDNA gene sequencing. The isolates identified as S. xylosus by tuf
gene sequences were identified as S. saprophyticus subsp. saprophyticus by 16s rDNA. Some
previous studies have found that the tuf gene as a good target for speciation of staphylococcus

100
species (Hwang et al., 2011, Bergeron et al., 2011). However, all the above mentioned results
indicate that it is not necessarily the case when it comes to staphylococcus isolates from air.
Considering the mixed identification of isolates by the two different genes, this is likely due
to the large proportion of staphylococcus species sequences based on 16S rDNA compared to
lower numbers of tuf gene sequences in the NCBI database. Another issue of using the tuf
gene for speciation of staphylococci is that the phylogenetic tree data demonstrates a mixture
of species in each cluster. For example S. carnosus and S. condimenti were clustered together
and the phylogenetic tree shows the similarity between isolates as 100%. In contrast, when
considering the same set of isolates with the 16S rDNA based phylogenetic tree, there was no
mix clustering observed and all of the 35 isolates were clustered appropriately.
When comparing tuf gene and 16S rDNA sequencing results, tuf gene sequencing was unable
to identify any isolate as S. epidermidis and M. lamae. All the isolates which were identified
as S. epidermidis by 16S rDNA have been identified as S. capitis with tuf gene sequences. tuf
gene sequences recognise only M. caseolyticus and none were identified as M. lamae. In
contrast 16S rDNA was unable to identify any isolate as S. xylosus, S. condimenti or S.
capitis. Given the above results, neither one of the target genes (tuf or 16S rDNA) sequencing
can be considered as the most reliable nor the robust method for speciation of airborne
staphylococcus species. Therefore, the recommendation is that sequencing of a combination
of gene targets for complete characterisation of staphylococcus species derived from air
samples is required.
However, according to both tuf and 16S rDNA species identification, all the strains isolated
were coagulase-negative, including Staphylococcus (CoNS) and Macrococcus sp.
Macrococcus sp. were the most prevalent species in residential air samples. So far, seven
species are included in this genus: M. bovicus, M. carouselicus, M. caseolyticus, M.
equipercicus, M. brunensis, M. hajekii and M. lamae (Mannerová et al., 2003). M.
caseolyticus is the most commonly isolated species among them, which has been isolated
from animal skin and food products such as milk and meat (Baba et al., 2009, Kloos et al.,
1998). However, until now, there are no reports of Macrococcus sp. causing diseases in
humans (Baba et al., 2009).
Finally, when considering the difficulty in identifying these species, these “confused”
patterns of molecular identification highlight the difficulty in assigning species originating
from environmental sources, and in particular, bacteria in air. This is largely due to the lack

101
of environmental bacterial sequence information. In fact, all the publicly available bacterial
speciation databases mostly contain sequences sourced from clinical and clinically sourced
isolates. It is a well-known fact that environmental organisms have to adapt differently
compared to clinical strains which translates into differences in their genetic makeup. Thus,
these findings reinforce the importance of applying molecular based methods to study
environmental strains of staphylococci. Furthermore, these results demonstrate the need to
identify reliable and robust gene/s for staphylococcal speciation, especially for
environmentally sourced strains particularly in air.

102
4.4 Methicillin-resistant Staphylococci in Residential Air To determine whether any of the airborne staphylococci were methicillin-resistant, i.e.
whether they carried the mecA gene, all 129 nucA positive isolates were subjected to real time
PCR using mecA specific primers. Interestingly, 103 (80%) isolates harboured the mecA
gene, which is a very significant finding of this study. This is the first time that methicillin-
resistant airborne staphylococcus have been isolated and characterised from residential air
samples using molecular methods. Previous studies by Hernando et al., (2011) and Gandara
et al., (2006) have identified methicillin-resistant S. aureus from residential air (Gandara et
al., 2006, Perez et al., 2011). Both of the studies used one selective medium (Chapmen Stone
medium) and the coagulase test for the identification and speciation of bacterial isolates as S.
aureus. There has only been one study published to date that describes the presence of
“livestock-associated” MRSA in a piggery (Clauss et al., 2013).
Interestingly, all the isolates identified as M. caseolyticus showed methicillin resistance and
20 (87%) isolates of M. lamae were also methicillin-resistant. Taking all of the macrococci
into account, 90% (27/30) were found to harbor the mecA gene. Methicillin resistance has
been identified in Macrococcus sp. previously (Baba et al., 2009), however, these isolates
originated from a skin swab of an animal (chicken). A recent study has revealed that the
mecA gene which is responsible for methicillin resistance acquisition, is carried on a plasmid
(pMCCL2) and not on the chromosome (Ah Tow and Cowan, 2003), which is in stark
contrast to the way that methicillin resistance is carried in clinical S. aureus isolates.
According to 16S rDNA species identification, 92% (12/13) of S. succinus isolates were
methicillin-resistant but very few studies have recorded methicillin resistance in S. succinus.
To our knowledge there is no record of methicillin resistance in S. succinus originating from
residential air samples.
Unlike most other CoNS, S. saprophyticus is rarely resistant to antibiotics active against
gram-positive organisms (Hwang et al., 2011) and there are only a few reports of methicillin-
resistant S. saprophyticus isolates. However, all of the recorded methicillin-resistant strains
have been isolated from human specimens (Geraghty et al., 2013) and very limited data on
methicillin-resistant S. saprophyticus from residential air is available.
Predictably, more than half (60%) of the S. epidermidis were also methicillin-resistant. S.
epidermidis is the most frequently isolated methicillin-resistant coagulase negative
103
staphylococcus (MR-CoNS) species and it has been recognized as an important cause of
nosocomial infections (Emori and Gaynes, 1993). A previous study by Lilenbaum et al.,
(Lilenbaum et al., 1998) has identified S. epidermidis in homes of persons having contact
with a hospital environment and 40% of them were methicillin-resistant.
When considering the statistical analysis of methicillin-resistant airborne Staphylococcus sp.
there was no significant difference in either indoor vs. outdoor or flood affected vs. non-
flooded houses. Overall, these results show that the flood event had no significant impact on
the indoor or outdoor environment with regards to the presence of methicillin-resistant
Staphylococcus species.

104
4.5 Overall Summary
Staphylococcus sp. are widely distributed in different environments. S. aureus and S.
epidermidis are considered as the major pathogenic members of the genus. This study
focused on Staphylococcus sp. isolated from residential air samples including 25 flood
affected residential air samples in Brisbane suburbs. Overall, the total bacterial colony count
results and the Staphylococcus sp. Identification results indicate an indoor source for bacteria
and staphylococci. This study demonstrated that the Brisbane flood in 2011 did not have a
significant impact on airborne bacteria or Staphylococcus sp. in residences. Finally,
molecular identification of isolates found that residential air samples have a very diverse
staphylococcal population consisting of numerous species including S. epidermidis, S.
carnosus, S. saprophyticus, S. sciuri and S. succinus. The most significant finding of this
study was the high incidence (80%) of methicillin-resistant isolates. This is the first study
describing the prevalence of methicillin-resistant staphylococcus in residential air in
Brisbane. This finding is quiet alarming, these “environmental” methicillin-resistant
staphylococci could be considered as a major health risk with respect to the spread and
transmission of resistance to human and animal staphylococcal strains. Our observation of the
significant presence of methicillin-resistant Staphylococcus sp. in the culturable bacterial
population derived from residential air samples indicates the need to understand the
mechanisms by which antibiotic-resistant organisms enter the residential air.
105
4.6 Future Directions
In this study, only a representative number of DNA sequences, considered as a representative
of all the isolates were studied mainly due to the high costs associated with sequencing.
Therefore applying 16S rDNA sequencing to the remaining nucA gene positive isolates is
recommended. This will enhance our understanding of Staphylococcus sp.
diversity/prevalence in residential air on a larger scale. In addition, future investigations can
be performed to determine the presence of virulence genes in these isolates, which can be
compared to clinical strains. Comparing pathogenicity profiles of airborne vs. clinical strains
of Staphylococcus sp. would be important as this would provide an insight into the potential
health risks associated with exposure to virulent airborne staphylococci.
Considering the methicillin-resistant strains found in this study, it would be important to
determine the Staphylococcal Cassette Chromosome mec (SCCmec) type and compare these
types to those of clinical isolates. Studies on clinical isolates have found a diverse
arrangement of SCCmec types that are indicative of whether these strains cause community-
acquired or hospital-acquired staphylococcal infections. Therefore, a comparative study
investigating the SCCmec types of airborne Staphylococcus sp. would provide further
evidence of the diversity of SCCmec types in this genus.
Initially, for this study, we obtained 1019 Mannitol fermenting isolates which were stored in
30% glycerol solution at -80 0C. As all these isolates were derived from residential air,
further investigations can be carried out to characterise the other bacterial species isolated
from residential air, and therefore, a more comprehensive view of the bacterial diversity of
residential air can be obtained. Hence, this sample collection is a highly valuable resource
for QUT.
Instead of culture based methods, direct DNA extraction from liquid samples obtained by a
liquid impinger (SKC, USA) can be used for the investigation of the bacterial diversity in air
samples. When using direct DNA extracted from air samples, special attention needs to be
taken with respect to PCR inhibitors, which need to be minimised or eliminated.
Although we all interact each and every second with the atmosphere, information about the
microbial population in air is very limited. This study was limited only to test for culturable
staphylococcal species, however there are many other species of bacteria present in the
atmosphere. Information about the diversity/ prevalence of each species or genus present in

106
the residential air is lacking. There are several ongoing projects related to microbial diversity;
rainforest insect microbiology, Cyanobacterial blooming in dam water, industrial wastewater
microbiology, microbiology of hypersaline environments, microbiology of fermented foods
of Asia-Pacific, microbiology of the Great Artesian Basin of Australia to name a few only.
Finally, Next Generation Sequencing technologies could be applied to investigate the
microbiology of air, as this system is proving to be very useful in understanding the total
microbiome of not only the human body and its systems, but also of environmental water.

107

108
Chapter Five
References
109
5. References
Ah Tow, L. & Cowan, D. A. 2003. Non-specificity of Staphylococcus generic primers.
Microbiology, 149, 1605-1607.
Akbar, A. & Anal, A. K. 2013. Prevalence and antibiogram study of Salmonella and
Staphylococcus aureus in poultry meat. Asian Pacific Journal of Tropical Biomedicine, 3,
163-168.
Al Masalma, M., Raoult, D. & Roux, V. 2010. Staphylococcus massiliensis sp. nov., isolated
from a human brain abscess. International Journal of Systematic and Evolutionary
Microbiology, 60, 1066-1072.
Amato, P. 2012. Clouds Provide Atmospheric Oases for Microbes. Microbe American
Society for Microbiology.
Amato, P., Demeer, F., Melaouhi, A., Fontanella, S., Martin-Biesse, A. S., Sancelme, M.,
Laj, P. & Delort, A. M. 2007. A fate for organic acids, formaldehyde and methanol in cloud
water: their biotransformation by micro-organisms. Atmospheric Chemistry and Physics
Discuss., 7, 5253-5276.
Andersson, M. A., Nikulin, M., Köljalg, U., Andersson, M. C., Rainey, F., Reijula, K.,
Hintikka, E. L. & Salkinoja-Salonen, M. 1997. Bacteria, molds, and toxins in water-damaged
building materials. Applied and Environmental Microbiology, 63, 387-93.
Awad, A. H. A. & Farag, S. A. 1999. An indoor bio-contaminants air quality. International
Journal of Environmental Health Research, 9, 313-319.
Baba, T., Kuwahara-Arai, K., Uchiyama, I., Takeuchi, F., Ito, T. & Hiramatsu, K. 2009.
Complete Genome Sequence of Macrococcus caseolyticus Strain JSCS5402, Reflecting the
Ancestral Genome of the Human-Pathogenic Staphylococci. Journal of bacteriology, 191,
1180-1190.
Bannerman, T. L. 2003. Staphylococcus, Micrococcus, and other catalase-positive cocci tht
grow aerobically. In: R. Murray, E. J. Baron, J. H. Jorgensen, M. A. Pfaller, A. & Yolken, R.
H. (eds.) Manual of clinical microbiology. 8th ed ed. Washington, DC.: ASM Press.

110
Bannoehr, J., Ben Zakour, N. L., Waller, A. S., Guardabassi, L., Thoday, K. L., van den
Broek, A. H. M. & Fitzgerald, J. R. 2007. Population Genetic Structure of the Staphylococcus
intermedius Group: Insights into agr Diversification and the Emergence of Methicillin-
Resistant Strains. Journal of bacteriology, 189, 8685-8692.
Bannoehr, J., Franco, A., Iurescia, M., Battisti, A. & Fitzgerald, J. R. 2009. Molecular
Diagnostic Identification of Staphylococcus pseudintermedius. Journal of Clinical
Microbiology, 47, 469-471.
Barna, J. C. J. & Williams, D. H. 1984. The Structure and Mode of Action of Glycopeptide
Antibiotics of the Vancomycin Group. Annual Review of Microbiology, 38, 339-357.
Beard-Pegler, M. A., Stubbs, E. & Vickery, A. M. 1988. Observations on the resistance to
drying of staphylococcal strains. Journal of Medical Microbiology, 26, 251-255.
Becker, K., Harmsen, D., Mellmann, A., Meier, C., Schumann, P., Peters, G. & von Eiff, C.
2004. Development and Evaluation of a Quality-Controlled Ribosomal Sequence Database
for 16S Ribosomal DNA-Based Identification of Staphylococcus Species. Journal of Clinical
Microbiology, 42, 4988-4995.
Bera, A., Biswas, R., Herbert, S., Kulauzovic, E., Weidenmaier, C., Peschel, A. & Götz, F.
2007. Influence of Wall Teichoic Acid on Lysozyme Resistance in Staphylococcus aureus.
Journal of bacteriology, 189, 280-283.
Bergeron, M., Dauwalder, O., Gouy, M., Freydiere, A. M., Bes, M., Meugnier, H., Benito,
Y., Etienne, J., Lina, G., Vandenesch, F. & Boisset, S. 2011. Species identification of
staphylococci by amplification and sequencing of the tuf gene compared to the gap gene and
by matrix-assisted laser desorption ionization time-of-flight mass spectrometry. European
Journal of Clinical Microbiology & Infectious Diseases, 30, 343-354.
Blaiotta, G., Pennacchia, C., Villani, F., Ricciardi, A., Tofalo, R. & Parente, E. 2004.
Diversity and dynamics of communities of coagulase-negative staphylococci in traditional
fermented sausages. Journal of applied microbiology, 97, 271-284.
Boyce, J. M. 2007. Environmental contamination makes an important contribution to hospital
infection. Journal of Hospital Infection, 65, Supplement 2, 50-54.

111
Boyen, F., Eeckhaut, V., Van Immerseel, F., Pasmans, F., Ducatelle, R. & Haesebrouck, F.
2009. Quorum sensing in veterinary pathogens: Mechanisms, clinical importance and future
perspectives. Veterinary microbiology, 135, 187-195.
Browder, H. P., Zygmunt, W. A., Young, J. R. & Tavormina, P. A. 1965. Lysostaphin:
Enzymatic Mode Of Action. Biochemical and Biophysical Research Communnications, 19,
383-9.
Centers for Disease Control and Prevention, C. 2011. Guidance on Microbial Contamination
in Previously Flooded Outdoor Areas [Online]. Atlanta, G.A. Available:
http://www.cdc.gov/nceh/ehs/Publications/Guidance_Flooding.htm.
Centre for Disease Control and Prevention. 2002. Tropical Storm Allison rapid needs
assessment--Houston, Texas, June 2001. 51.
Chambers, H. 1997. Methicillin resistance in staphylococci: molecular and biochemical basis
and clinical implications. Clin. Microbiol. Rev., 10, 781-791.
Chambers, H. F. 2001. The changing epidemiology of Staphylococcus aureus. Emerging
Infectious Diseases, 7, 178-182.
Chen, Y.-P., Cui, Y. & Dong, J.-G. 2010. Variation of airborne bacteria and fungi at Emperor
Qin's Terra-Cotta Museum, Xi'an, China, during the “Oct. 1” Gold Week Period of 2006.
Environmental Science and Pollution Research, 17, 478-485.
Clarridge, J. E. 2004. Impact of 16S rRNA Gene Sequence Analysis for Identification of
Bacteria on Clinical Microbiology and Infectious Diseases. Clinical Microbiology Reviews,
17, 840-862.
Clauss, M., Schulz, J., Stratmann-Selke, J., Decius, M. & Hartung, J. 2013. Reduction of
livestock-associated methicillin-resistant Staphylococcus aureus (LA-MRSA) in the exhaust
air of two piggeries by a bio-trickling filter and a biological three-step air cleaning system.
Berliner und Munchener tierarztliche Wochenschrift, 126, 137-42.
Cooper, J. E. & Feil, E. J. 2006. The phylogeny of Staphylococcus aureus – which genes
make the best intra-species markers? Microbiology, 152, 1297-1305.
112
Corbiere Morot-Bizot, S., Leroy, S. & Talon, R. 2007. Monitoring of staphylococcal starters
in two French processing plants manufacturing dry fermented sausages. Journal of applied
microbiology, 102, 238-244.
Crossley, K. B., Archer, G. L. & Jefferson, K. K. 2009. Staphylococci in Human Disease,
Hoboken, John Wiley & Sons, Inc.
Dancer, S. J. 2008. Importance of the environment in meticillin-resistant Staphylococcus
aureus acquisition: the case for hospital cleaning. The Lancet infectious diseases, 8, 101-113.
Dansby, W., Purdue, G., Hunt, J., Arnoldo, B., Phillips, D., Moody, B., Kemp, D., Byrd, L.,
Walter, P. & Luby, J. 2008. Aerosolization of methicillin-resistant Staphylococcus aureus
during an epidemic in a burn intensive care unit. Journal of burn care & research : official
publication of the American Burn Association, 29, 331-7.
Davis, M. F., Iverson, S. A., Baron, P., Vasse, A., Silbergeld, E. K., Lautenbach, E. &
Morris, D. O. 2012. Household transmission of meticillin-resistant Staphylococcus aureus
and other staphylococci. The Lancet infectious diseases, 12, 703-716.
Deguillaume, L., Leriche, M., Amato, P., Ariya, P. A., Delort, A., Pschl, U., Chaumerliac, N.,
Bauer, H., Flossmann, A. I. & Morris, C. E. 2008. Microbiology and atmospheric processes:
chemical interactions of primary biological aerosols. Biogeosciences, 5, 1073-1084.
Delmas, J., Chacornac, J. P., Robin, F. d. r., Giammarinaro, P., Talon, R. g. & Bonnet, a. R.
2008. Evaluation of the Vitek 2 system with a variety of Staphylococcus species. Journal Of
Clinical Microbiology, Vol. 46, No. 1, p. 311–313.
Devriese, L. A., Vancanneyt, M., Baele, M., Vaneechoutte, M., De Graef, E., Snauwaert, C.,
Cleenwerck, I., Dawyndt, P., Swings, J., Decostere, A. & Haesebrouck, F. 2005.
Staphylococcus pseudintermedius sp. nov., a coagulase-positive species from animals.
International Journal of Systematic and Evolutionary Microbiology, 55, 1569-1573.
Diekema, D. J., Pfaller, M. A., Schmitz, F. J., Smayevsky, J., Bell, J., Jones, R. N. & Beach,
M. 2001. Survey of Infections Due to Staphylococcus Species: Frequency of Occurrence and
Antimicrobial Susceptibility of Isolates Collected in the United States, Canada, Latin
America, Europe, and the Western Pacific Region for the SENTRY Antimicrobial
Surveillance Program, 1997–1999. Clinical Infectious Diseases, 32, S114-S132.

113
Dietze, B., Rath, A., Wendt, C. & Martiny, H. 2001. Survival of MRSA on sterile goods
packaging. Journal of Hospital Infection, 49, 255-261.
Drancourt, M. & Raoult, D. 2002. rpoB Gene Sequence-Based Identification of
Staphylococcus Species. Journal of Clinical Microbiology, 40, 1333-1338.
Elston, D. M. 2007. Community-acquired methicillin-resistant Staphylococcus aureus.
Journal of the American Academy of Dermatology, 56, 1-16.
Emori, T. G. & Gaynes, R. P. 1993. An overview of nosocomial infections, including the role
of the microbiology laboratory. Clinical Microbiology Reviews, 6, 428-442.
Fabian, M. P., Miller, S. L., Reponen, T. & Hernandez, M. T. 2005. Ambient bioaerosol
indices for indoor air quality assessments of flood reclamation. Journal of Aerosol Science,
36, 763-783.
Fleming, A. 1929. On the Antibacterial Action of Cultures of a Penicillium, with Special
Reference to Their Use in the Isolation of B. influenzae. The British Journal of Experimental
Pathology, V.10, 226-236.
Freeman-Cook, L. & Freeman-Cook, K. D. 2005. Staphylococcus aureus infections (Deadly
disease and epidemics), Chelsea House Publishers.
Freney, J., Kloos, W. E., Hajek, V., Webster, J. A., Bes, M., Brun, Y. & Vernozy-Rozand, C.
1999. Recommended minimal standards for description of new staphylococcal species.
International Journal of Systematic Bacteriology, 49, 489-502.
Gandara, A., Mota, L. C., Flores, C., Perez, H. R., Green, C. F. & Gibbs, S. G. 2006.
Isolation of Staphylococcus aureus and Antibiotic-Resistant Staphylococcus aureus from
Residential Indoor Bioaerosols. Environtal Health Perspective, 114.
Geraghty, L., Booth, M., Rowan, N. & Fogarty, A. 2013. Investigations on the efficacy of
routinely used phenotypic methods compared to genotypic approaches for the identification
of staphylococcal species isolated from companion animals in Irish veterinary hospitals. Irish
Veterinary Journal, 66, 7.
Gilbert, Y., Veillette, M. & Duchaine, C. 2010. Airborne bacteria and antibiotic resistance
genes in hospital rooms. Aerobiologia, 26, 185-194.

114
Goh, S. H., Potter, S., Wood, J. O., Hemmingsen, S. M., Reynolds, R. P. & Chow, A. W.
1996. HSP60 gene sequences as universal targets for microbial species identification: studies
with coagulase-negative staphylococci. Journal of Clinical Microbiology, 34, 818-23.
Gorny, R. L. & Dutkiewicz, J. 2002. Bacterial and fungal aerosols in indoor environment in
Central and Eastern European countries. Annals Agricultural and Environmental Medicine, 9,
17-23.
Graham, J. E. & Wilkinson, B. J. 1992. Staphylococcus aureus osmoregulation: roles for
choline, glycine betaine, proline, and taurine. Journal of bacteriology, 174, 2711-6.
Gribaldo, S., Cookson, B., Saunders, N., Marples, R. & Stanley, J. 1997. Rapid identification
by specific PCR of coagulase-negative staphylococcal species important in hospital infection.
Journal of Medical Microbiology, 46, 45-53.
Hargreaves, M., Parappukkaran, S., Morawska, L., Hitchins, J., He, C. & Gilbert, D. 2003. A
pilot investigation into associations between indoor airborne fungal and non-biological
particle concentrations in residential houses in Brisbane, Australia. Science of The Total
Environment, 312, 89-101.
Harris, L. G., Foster, S. J. & Richards, R. G. 2002. An introduction to Staphylococcus aureus,
and techniques for identifying and quantifying S. aureus adhesins in relation to adhesion to
biomaterials: review. European Cells and Materials (ECM), 4, 39-60.
Hauschild, T., Stepanović, S. & Zakrzewska-Czerwińska, J. 2010. Staphylococcus
stepanovicii sp. nov., a novel novobiocin-resistant oxidase-positive staphylococcal species
isolated from wild small mammals. Systematic and Applied Microbiology, 33, 183-187.
Heederik, D. & Douwes, J. 1997. Towards an occupational exposure limit for endotoxins ?
Annals of Agriculture and Environmental Medicine, 4, 17-19.
Heikens, E., Fleer, A., Paauw, A., Florijn, A. & Fluit, A. C. 2005. Comparison of Genotypic
and Phenotypic Methods for Species-Level Identification of Clinical Isolates of Coagulase-
Negative Staphylococci. Journal of Clinical Microbiology, 43, 2286-2290.
Henry, F. C. & Frank, R. D. 2009. Waves of resistance: Staphylococcus aureus in the
antibiotic era. Nature Reviews Microbiology, 7, 629-641.
115
Hiramatsu, K., Hanaki, H., Ino, T., Yabuta, K., Oguri, T. & Tenover, F. C. 1997. Methicillin-
resistant Staphylococcus aureus clinical strain with reduced vancomycin susceptibility.
Journal of Antimicrobial Chemotherapy, 40, 135-136.
Hoppe, K. A., Metwali, N., Perry, S. S., Hart, T., Kostle, P. A. & Thorne, P. S. 2012.
Assessment of airborne exposures and health in flooded homes undergoing renovation.
Indoor Air, 22, 446-456.
HP, B. & WA, Z. 1965. Lysostaphin: Enzymatic Mode Of Action. Biochemical and
biophysical research communications, 19, 383-389.
Hwang, S. M., Kim, M. S., Park, K. U., Song, J. & Kim, E.-C. 2011. tuf Gene Sequence
Analysis Has Greater Discriminatory Power than 16S rRNA Sequence Analysis in
Identification of Clinical Isolates of Coagulase-Negative Staphylococci. Journal of Clinical
Microbiology, 49, 4142-4149.
Hyvärinen, A., Vahteristo, M., Meklin, T., Jantunen, M., Nevalainen, A. & Moschandreas, D.
2001. Temporal and Spatial Variation of Fungal Concentrations in Indoor Air. Aerosol
Science and Technology, 35, 688-695.
Iorio, N. L. P., Ferreira, R. B. R., Schuenck, R. P., Malvar, K. L., Brilhante, A. P., Nunes, A.
P. F., Bastos, C. C. R. & dos Santos, K. R. N. 2007. Simplified and Reliable Scheme for
Species-Level Identification of Staphylococcus Clinical Isolates. Journal of Clinical
Microbiology, 45, 2564-2569.
Jensen, P., Lighthart, B., Mohr, A. J. & Shaffer, B. 1994. Instrumentation Used with
Microbial Bioaerosols. In: Lighthart, B. & Mohr, A. (eds.) Atmospheric Microbial Aerosols.
Springer US.
Jevons, M. P., Rolinson, G. N. & Knox, R. 1961. "Celbenin"-Resistant Staphylococci. The
British Medical Journal, 1, 124-126.
Kateete, D. P., Kimani, C. N., Katabazi, F. A., Okeng, A., Okee, M. S., Nanteza, A., Joloba,
M. L. & Najjuka, F. C. 2010. Identification of Staphylococcus aureus: DNase and Mannitol
salt agar improve the efficiency of the tube coagulase test. Annals of Clinical Microbiology
and Antimicrobials, Volume 9.
116
Ke, D., Picard, F. J., Martineau, F., Ménard, C., Roy, P. H., Ouellette, M. & Bergeron, M. G.
1999. Development of a PCR Assay for Rapid Detection of Enterococci. Journal of Clinical
Microbiology, 37, 3497-3503.
Kellogg, C. A. & Griffin, D. W. 2006. Aerobiology and the global transport of desert dust.
Trends in Ecology and Evolution, 21, 638-644.
Kim, K. Y., Kim, Y. S. & Kim, D. 2010. Distribution Characteristics of Airborne Bacteria
and Fungi in the General Hospitals of Korea. Industrial Health, 48, 236-243.
Kim, M., Heo, S. R., Choi, S. H., Kwon, H., Park, J. S., Seong, M.-W., Lee, D.-H., Park, K.
U., Song, J. & Kim, E.-C. 2008. Comparison of the MicroScan, VITEK 2, and Crystal GP
with 16S rRNA sequencing and MicroSeq 500 v2.0 analysis for coagulase-negative
Staphylococci. BMC Microbiology, 8:233.
Kirby, W. M. M. 1944. Extraction Of A Highly Potent Penicillin Inactivator From Penicillin
Resistant Staphylococci. Science, 99, 452-453.
Kloos, W. E., Ballard, D. N., George, C. G., Webster, J. A., Hubner, R. J., Ludwig, W.,
Schleifer, K. H., Fiedler, F. & Schubert, K. 1998. Delimiting the genus Staphylococcus
through description of Macrococcus caseolyticus gen. nov., comb. nov. and Macrococcus
equipercicus sp. nov., Macrococcus bovicus sp. nov. and Macrococcus carouselicus sp. nov.
International Journal of Systematic Bacteriology, 48, 859-877.
Kluytmans, J., van Belkum, A. & Verbrugh, H. 1997. Nasal carriage of Staphylococcus
aureus: epidemiology, underlying mechanisms, and associated risks. Clinical Microbiology
Reviews, 10, 505-520.
Konrad Plata, Rosato, A. E. & Węgrzyn, G. 2009. Staphylococcus aureus as an infectious
agent: overview of biochemistry and molecular genetics of its pathogenicity. Acta
Biochemica Polonica, Vol. 56, 597–612.
Kumar, J. 2008. Lysostaphin: an antistaphylococcal agent. Applied Microbiology and
Biotechnology, 80, 555-561.
Kwok, A. Y. C., Su, S.-C., Reynolds, R. P., Bay, S. J., Av-Gay, Y., Dovichi, N. J. & Chow,
A. W. 1999. Species identification and phylogenetic relationships based on partial HSP60

117
gene sequences within the genus Staphylococcus. International Journal of Systematic
Bacteriology, 49, 1181-1192.
Lambert, L. H., Cox, T., Mitchell, K., Rosselló-Mora, R. A., Del Cueto, C., Dodge, D. E.,
Orkand, P. & Cano, R. J. 1998. Staphylococcus succinus sp. nov., isolated from Dominican
amber. International Journal of Systematic Bacteriology, 48, 511-518.
Layer, F., Ghebremedhin, B., König, W. & König, B. 2007. Differentiation of
Staphylococcus spp. by terminal-restriction fragment length polymorphism analysis of
glyceraldehyde-3-phosphate dehydrogenase-encoding gene. Journal of Microbiological
Methods, 70, 542-549.
Layer, F., Ghebremedhin, B., Moder, K.-A., König, W. & König, B. 2006. Comparative
Study Using Various Methods for Identification of Staphylococcus Species in Clinical
Specimens. Journal of Clinical Microbiology, 44, 2824-2830.
LeChevallier, M. W. & Seidler, R. J. 1980. Staphylococcus aureus in Rural Drinking Water.
Applied and environmental microbiology, 39, 739-742.
Levin-Edens, E., Bonilla, N., Meschke, J. S. & Roberts, M. C. 2011. Survival of
environmental and clinical strains of methicillin-resistant Staphylococcus aureus [MRSA] in
marine and fresh waters. Water Research, 45, 5681-5686.
Lidwell, O. M. & Lowbury, E. J. 1950. The Survival of Bacteria in Dust: II. The Effect of
Atmospheric Humidity on the Survival of Bacteria in Dust. The Journal of Hygiene, 48, 21-
27.
Lighthart, B. & Stetzenbach, L. 1994. Distribution of Microbial Bioaerosol. In: Lighthart, B.
& Mohr, A. (eds.) Atmospheric Microbial Aerosols. Springer US.
Lilenbaum, W., Nunes, E. L. C. & Azeredo, M. A. I. 1998. Prevalence and antimicrobial
susceptibility of staphylococci isolated from the skin surface of clinically normal cats. Letters
in Applied Microbiology, 27, 224-228.
Lindsay, J. A. 2008. Staphylococcus : molecular genetics, Norfolk, UK, Caister Academic
Press.

118
Lindsay, J. A. & Holden, M. T. G. 2004. Staphylococcus aureus: superbug, super genome?
Trends in Microbiology, 12, 378-385.
Loonen, A. J. M., Jansz, A. R., Bergland, J. N. B., Valkenburg, M., Wolffs, P. F. G. & van
den Brule, A. J. C. 2012. Comparative Study Using Phenotypic, Genotypic, and Proteomics
Methods for Identification of Coagulase-Negative Staphylococci. Journal of Clinical
Microbiology, 50, 1437-1439.
Lowy, F. D. 2003. Antimicrobial resistance: the example of Staphylococcus aureus. The
Journal of Clinical Investigation, 111, 1265-1273.
Lyon, B. & Skurray, R. 1987. Antimicrobial Resistance of Staphylococcus aureus: Genetic
Basis. Microbiological Reviews Vol. 51, 88-134.
Madison, B. M. & Baselski, V. S. 1983. Rapid identification of Staphylococcus aureus in
blood cultures by thermonuclease testing. Journal of Clinical Microbiology, 18, 722-724.
Mannerová, S., Pantůček, R., Doškař, J., Švec, P., Snauwaert, C., Vancanneyt, M., Swings, J.
& Sedláček, I. 2003. Macrococcus brunensis sp. nov., Macrococcus hajekii sp. nov. and
Macrococcus lamae sp. nov., from the skin of llamas. International Journal of Systematic
and Evolutionary Microbiology, 53, 1647-1654.
Martineau, F., Picard, F. J., Ke, D., Paradis, S., Roy, P. H., Ouellette, M. & Bergeron, M. G.
2001. Development of a PCR Assay for Identification of Staphylococci at Genus and Species
Levels. Journal of Clinical Microbiology, 39, 2541-2547.
Mathema, B., Mediavilla, J. R., Chen, L. & Kreiswirth, B. N. 2009. Evolution and Taxonomy
of Staphylococci. Staphylococci in Human Disease. Wiley-Blackwell.
McCartney, H. A., Foster, S. J., Fraaije, B. A. & Ward, E. 2003. Molecular diagnostics for
fungal plant pathogens. Pest Management Science, 59, 129-142.
Mellmann, A., Becker, K., von Eiff, C., Keckevoet, U., Schumann, P. & Harmsen, D. 2006.
Sequencing and staphylococci identification. Emerging infectious diseases, 12, 333-336.
Mignard, S. & Flandrois, J.-P. 2007. Identification of Mycobacterium using the EF-Tu
encoding (tuf) gene and the tmRNA encoding (ssrA) gene. Journal of Medical Microbiology,
56, 1033-1041.

119
Miller, J. D., Haisley, P. D. & Reinhardt, J. H. 2000. Air Sampling Results in Relation to
Extent of Fungal Colonization of Building Materials in Some Water-Damaged Buildings.
Indoor Air, 10, 146-151.
Nevalainen, A. & Seuri, M. 2005. Of microbes and men. Indoor Air, 15, 58-64.
Niesler, A., Górny, R., Wlazło, A., Łudzeń-Izbińska, B., Ławniczek-Wałczyk, A., Gołofit-
Szymczak, M., Meres, Z., Kasznia-Kocot, J., Harkawy, A., Lis, D. & Anczyk, E. 2010.
Microbial contamination of storerooms at the Auschwitz-Birkenau Museum. Aerobiologia,
26, 125-133.
Noji, E. K. 1991. Natural disasters. Critical Care Clinics, 7, 271-92.
Nováková, D., Pantůček, R., Hubálek, Z., Falsen, E., Busse, H.-J., Schumann, P. & Sedláček,
I. 2010. Staphylococcus microti sp. nov., isolated from the common vole (Microtus arvalis).
International Journal of Systematic and Evolutionary Microbiology, 60, 566-573.
Oliveira, G. A., Dell’Aquila, A. M., Masiero, R. L., Levy, C. E., Gomes, M. S., Cui, L.,
Hiramatsu, K. & Mamizuka, E. M. 2001. Isolation in Brazil of Nosocomial Staphylococcus
aureus with Reduced Susceptibility to Vancomycin •. Infection Control and Hospital
Epidemiology, 22, 443-448.
Palavecino, E. 2007. Clinical, Epidemiological, and Laboratory Aspects of Methicillin-
Resistant Staphylococcus aureus (MRSA) Infections.
Pantůček, R., Sedláček, I., Petráš, P., Koukalová, D., Švec, P., Štětina, V., Vancanneyt, M.,
Chrastinová, L., Vokurková, J., Růžičková, V., Doškař, J., Swings, J. & Hájek, V. 2005.
Staphylococcus simiae sp. nov., isolated from South American squirrel monkeys.
International Journal of Systematic and Evolutionary Microbiology, 55, 1953-1958.
Pardue, J. H., Moe, W. M., McInnis, D., Thibodeaux, L. J., Valsaraj, K. T., Maciasz, E., van
Heerden, I., Korevec, N. & Yuan, Q. Z. 2005. Chemical and Microbiological Parameters in
New Orleans Floodwater Following Hurricane Katrina. Environmental Science &
Technology, 39, 8591-8599.
Pasquarella, C., Pitzurra, O. & Savino, A. 2000. The index of microbial air contamination.
Journal of Hospital Infection, 46, 241-256.
120
Peacock, S. J., de Silva, I. & Lowy, F. D. 2001. What determines nasal carriage of
Staphylococcus aureus? Trends in Microbiology, 9, 605-610.
Peccia, J. & Hernandez, M. 2006. Incorporating polymerase chain reaction-based
identification, population characterization, and quantification of microorganisms into aerosol
science: A review. Atmospheric Environment, 40, 3941-3961.
Peltola, J., Andersson, M. A., Haahtela, T., Mussalo-Rauhamaa, H., Rainey, F. A.,
Kroppenstedt, R. M., Samson, R. A. & Salkinoja-Salonen, M. S. 2001. Toxic-Metabolite-
Producing Bacteria and Fungus in an Indoor Environment. Applied and Environmental
Microbiology, 67, 3269-3274.
Perez, H. R., Johnson, R., Gurian, P. L., Gibbs, S. G., Taylor, J. & Burstyn, I. 2011. Isolation
of Airborne Oxacillin-Resistant Staphylococcus aureus from Culturable Air Samples of
Urban Residences. Journal of Occupational and Environmental Hygiene, 8, 80-85.
Persing, D. H. & Tenover, F. C. 2004. Molecular microbiology: diagnostic principles and
practice, Washington, D.C, ASM Press.
Petti, C. A., Polage, C. R. & Schreckenberger, P. 2005. The role of 16S rRNA gene
sequencing in identification of microorganisms misidentified by conventional methods. J
Clinical Microbiology, 43, 6123-5.
Pfaller, M. A., Jones, R. N., Doern, G. V., Sader, H. S., Kugler, K. C. & Beach, M. L. 1999.
Survey of blood stream infections attributable to gram-positive cocci: frequency of
occurrence and antimicrobial susceptibility of isolates collected in 1997 in the United States,
Canada, and Latin America from the SENTRY antimicrobial surveillance program.
Diagnostic microbiology and infectious disease, 33, 283-297.
Poyart, C., Quesne, G., Boumaila, C. & Trieu-Cuot, P. 2001. Rapid and Accurate Species-
Level Identification of Coagulase-Negative Staphylococci by Using the sodA Gene as a
Target. Journal of Clinical Microbiology, 39, 4296-4301.
Queensland Floods Commission of Inquiry 2012. Queensland Floods Commission of Inquiry
- Final Report. Brisbane.

121
Riesen, A. & Perreten, V. 2010. Staphylococcus rostri sp. nov., a haemolytic bacterium
isolated from the noses of healthy pigs. International Journal of Systematic and Evolutionary
Microbiology, 60, 2042-2047.
Ross, M. A., Curtis, L., Scheff, P. A., Hryhorczuk, D. O., Ramakrishnan, V., Wadden, R. A.
& Persky, V. W. 2000. Association of asthma symptoms and severity with indoor
bioaerosols. Allergy, 55, 705-711.
Roy, C. J. & Milton, D. K. 2004. Airborne Transmission of Communicable Infection — The
Elusive Pathway. New England Journal of Medicine, 350, 1710-1712.
Ryan, K. J., Ray, C. G. & Sherris, J. C. 2004. Sherris medical microbiology: an introduction
to infectious diseases, New York, McGraw-Hill.
Safatov, A. S., Andreeva, I. S., Belan, B. D., Buryak, G. A., Emel'yanova, E. K., Jaenicke, R.,
Panchenko, M. V., Pechurkina, N. I., Puchkova, L. I., Repin, V. E., Saranina, I. V. &
Sergeev, A. N. 2008. To What Extent Can Viable Bacteria in Atmospheric Aerosols be
Dangerous for Humans? Clean - Soil, Air, Water, 36 564-571.
Salgado, C. D., Farr, B. M. & Calfee, D. P. 2003. Community-acquired methicillin-resistant
Staphylococcus aureus: a meta-analysis of prevalence and risk factors. Clinical Infectious
Diseases, 36, 131-9.
Sasaki, T., Kikuchi, K., Tanaka, Y., Takahashi, N., Kamata, S. & Hiramatsu, K. 2007.
Reclassification of Phenotypically Identified Staphylococcus intermedius Strains. Journal of
Clinical Microbiology, 45, 2770-2778.
Sattler, B., Puxbaum, H. & Psenner, R. 2001. Bacterial growth in supercooled cloud droplets.
Geophysical Research Letters, 28, 239-242.
Schleifer, K.-H. 2009. Phylum XIII. Firmicutes Gibbons and Murray 1978, 5 Firmacutes [sic]
Gibbons and Murray 1978, 5. In: DE Vos, P., Garrity, G., Jones, D., Krieg, N., Ludwig, W.,
Rainey, F., Schleifer, K.-H. & Whitman, W. (eds.) Bergey’s Manual® of Systematic
Bacteriology: Volume 3: The Firmicutes. Springer.

122
Schmitt, E., Guillon, J. M., Meinnel, T., Mechulam, Y., Dardel, F. & Blanquet, S. 1996.
Molecular recognition governing the initiation of translation in Escherichia coli. A review.
Biochimie, 78, 543-554.
Schwalbe, R. S., Stapleton, J. T. & Gilligan, P. H. 1987. Emergence of Vancomycin
Resistance in Coagulase-Negative Staphylococci. New England Journal of Medicine, 316,
927-931.
Shiomori, T., Miyamoto, H. & Makishima, K. 2001. Significance of Airborne Transmission
of Methicillin-Resistant Staphylococcus aureus in an Otolaryngology-Head and Neck
Surgery Unit. Arch Otolaryngol Head Neck Surgery, 127, 644-648.
Shittu, A. O., Udo, E. E. & Lin, J. 2007. Insights on virulence and antibiotic resistance: A
review of the accessory genome of Staphylococcus aureus. Wounds-a Compendium of
Clinical Research and Practice, 19, 237-244.
Silva, N. C. C., Guimarães, F. F., Manzi, M. P., Budri, P. E., Gómez-Sanz, E., Benito, D.,
Langoni, H., Rall, V. L. M. & Torres, C. 2013. Molecular characterization and clonal
diversity of methicillin-susceptible Staphylococcus aureus in milk of cows with mastitis in
Brazil. Journal of dairy science.
Singh, A., Goering, R. V., Simjee, S., Foley, S. L. & Zervos, M. J. 2006. Application of
Molecular Techniques to the Study of Hospital Infection. Clinical Microbiology Reviews, 19,
512-530.
Smith, J. E., Anderson, J. G., Lewis, C. W. & Murad, Y. M. 1992. Cytotoxic fungal spores in
the indoor atmosphere of the damp domestic environment. FEMS Microbiology Letters, 100,
337-343.
Smith, T. L., Pearson, M. L., Wilcox, K. R., Cruz, C., Lancaster, M. V., Robinson-Dunn, B.,
Tenover, F. C., Zervos, M. J., Band, J. D., White, E. & Jarvis, W. R. 1999. Emergence of
Vancomycin Resistance in Staphylococcus aureus. New England Journal of Medicine, 340,
493-501.
Soge, O. O., Meschke, J. S., No, D. B. & Roberts, M. C. 2009. Characterization of
methicillin-resistant Staphylococcus aureus and methicillin-resistant coagulase-negative
123
Staphylococcus spp. isolated from US West Coast public marine beaches. Journal of
Antimicrobial Chemotherapy, 64, 1148-1155.
Srikanth, P., Sudharsanam, S. & Steinberg, R. 2008. Bio-aerosols in indoor environment:
composition, health effects and analysis. Indian Journal of Medical Microbiology, 26, 302-
12.
Stapleton, P. D. & Taylor, P. W. 2002. Methicillin resistance in Staphylococcus aureus:
mechanisms and modulation. Science Progress, 85, 57-72.
Stellman, J. M. 1998. Encyclopaedia of occupational health and safety [Guides, Indexes,
Directory], Geneva, Internat. Labour Office.
Stephens, A. J., Huygens, F. & Giffard, P. M. 2007. Systematic Derivation of Marker Sets for
Staphylococcal Cassette Chromosome mec Typing. Antimicrobial agents and chemotherapy,
51, 2954-2964.
Stewart, G. T. & Holt, R. J. 1963. Evolution Of Natural Resistance To The Newer Penicillins.
The British Medical Journal, 1, 308-311.
Supré, K., De Vliegher, S., Cleenwerck, I., Engelbeen, K., Van Trappen, S., Piepers, S.,
Sampimon, O. C., Zadoks, R. N., De Vos, P. & Haesebrouck, F. 2010. Staphylococcus
devriesei sp. nov., isolated from teat apices and milk of dairy cows. International Journal of
Systematic and Evolutionary Microbiology, 60, 2739-2744.
Taylor, J., Lai, K. m., Davies, M., Clifton, D., Ridley, I. & Biddulph, P. 2011. Flood
management: Prediction of microbial contamination in large-scale floods in urban
environments. Environment International, 37, 1019-1029.
Tenover, F. C., Weigel, L. M., Appelbaum, P. C., McDougal, L. K., Chaitram, J., McAllister,
S., Clark, N., Killgore, G., O'Hara, C. M., Jevitt, L., Patel, J. B. & Bozdogan, B. 2004.
Vancomycin-Resistant Staphylococcus aureus Isolate from a Patient in Pennsylvania.
Antimicrobial Agents and Chemotherapy., 48, 275-280.
Tiwari, H. & Sen, M. 2006. Emergence of vancomycin resistant Staphylococcus aureus
(VRSA) from a tertiary care hospital from northern part of India. BMC Infectious Diseases, 6,
156.
124
Tsai, F. C. & Macher, J. M. 2005. Concentrations of airborne culturable bacteria in 100 large
US office buildings from the BASE study. Indoor Air, 15, 71-81.
U.S. Environmental Protection Agency 1989. Report to Congress on indoor air quality.
Washington, DC: EPA/400/1-89/001C.
Van de Peer, Y., Chapelle, S. & De Wachter, R. 1996. A Quantitative Map of Nucleotide
Substitution Rates in Bacterial rRNA. Nucleic acids research, 24, 3381-3391.
Vannuffel, P., Heusterspreute, M., Bouyer, M., Vandercam, B., Philippe, M. & Gala, J.-L.
1999. Molecular characterization of femA from Staphylococcus hominis and Staphylococcus
saprophyticus, and femA-based discrimination of staphylococcal species. Research in
microbiology, 150, 129-141.
Verhoeff, A. P. & Burge, H. A. 1997. Health Risk Assessment of Fungi in Home
Environments. Annals of Allergy, Asthma & Immunology, 78, 544-556.
Vernozy-Rozand, C., Mazuy, C., Meugnier, H., Bes, M., Lasne, Y., Fiedler, F., Etienne, J. &
Freney, J. 2000. Staphylococcus fleurettii sp. nov., isolated from goat's milk cheeses.
International Journal of Systematic and Evolutionary Microbiology, 50 Pt 4, 1521-7.
Wade, T. J., Sandhu, S. K., Levy, D., Lee, S., LeChevallier, M. W., Katz, L. & Colford, J. M.
2004. Did a Severe Flood in the Midwest Cause an Increase in the Incidence of
Gastrointestinal Symptoms? American Journal of Epidemiology, 159, 398-405.
Walsh, T. R. & Howe, R. A. 2002. The Prevalence And Mechanisms Of Vancomycin
Resistance In Staphylococcus Aureus. Annual Review of Microbiology, 56, 657-675.
Weckman, B. G. & Catlin, B. W. 1957. Deoxyribonuclease Activity Of Micrococci From
Clinical Sources. Journal of bacteriology, 73, 747-753.
Wendlandt, S., Schwarz, S. & Silley, P. 2013. Methicillin-Resistant Staphylococcus aureus:
A Food-Borne Pathogen? Annual Review of Food Science and Technology, 4, 117-139.
Whitt, D. D. & Salyers, A. A. 2002. Bacterial pathogenesis: a molecular approach,
Washington, D.C, ASM Press.

125
Winn, W. C. & Koneman, E. W. 2006. Koneman's color atlas and textbook of diagnostic
microbiology, Philadelphia, Lippincott Williams & Wilkins.
Womack, A. M., Bohannan, B. J. M. & Green, J. L. 2010. Biodiversity and biogeography of
the atmosphere. Philosophical Transactions of the Royal Society B: Biological Sciences, 365,
3645-3653.
Wood, A. J. J. & Murray, B. E. 2000. Vancomycin-Resistant Enterococcal Infections. New
England Journal of Medicine, 342, 710-721.
Yuan, I., Xu, J., Millar, B. C., Dooley, J. S. G., Rooney, P. J., Alexander, H. D. & Moore, J.
E. 2007. Molecular identification of environmental bacteria in indoor air in the domestic
home: Description of a new species of Exiguobacterium. International Journal of
Environmental Health Research, 17, 75-82.
Yugueros, J., Temprano, A., Sánchez, M. a., Luengo, J. M. a. & Naharro, G. 2001.
Identification of Staphylococcus spp. by PCR-Restriction Fragment Length Polymorphism of
gapGene. Journal of Clinical Microbiology, 39, 3693-3695.
Zhu, H., Phelan, P., Duan, T., Raupp, G., Fernando, H. S. & Che, F. 2003. Experimental
study of indoor and outdoor airborne bacterial concentrations in Tempe, Arizona, USA.
Aerobiologia, 19, 201-211.
126
Appendix
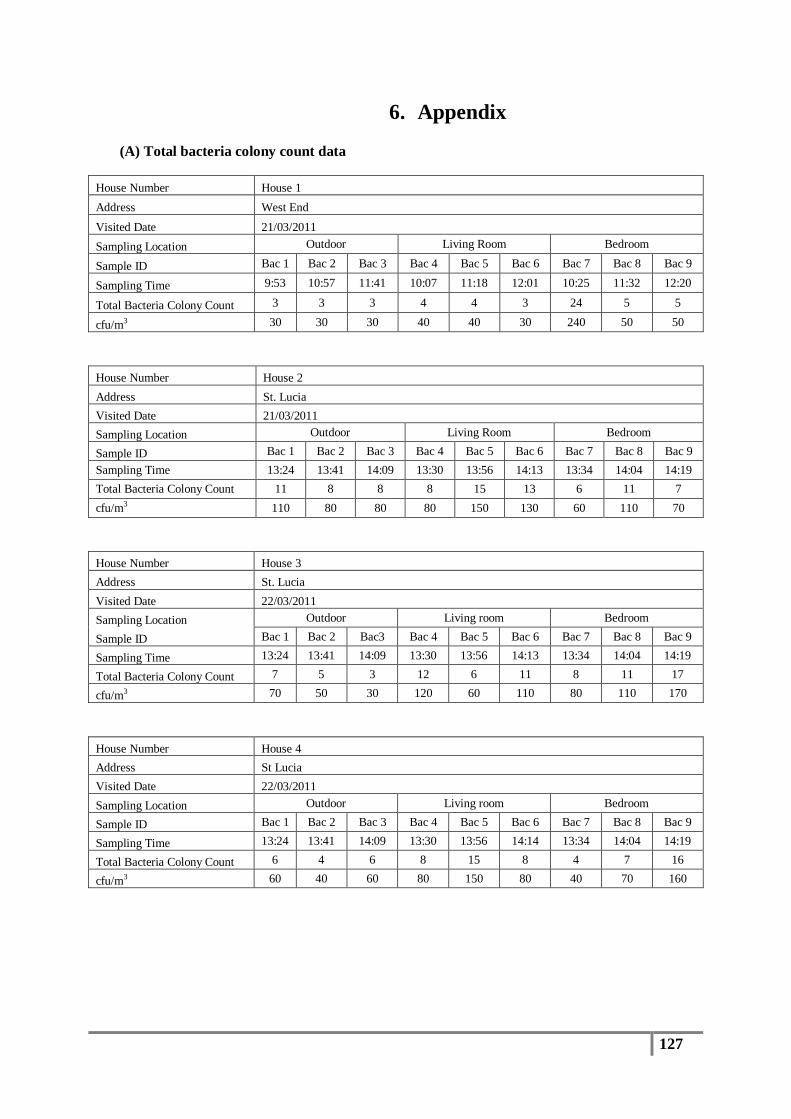
127
6. Appendix
(A) Total bacteria colony count data
House Number House 1 Address West End Visited Date 21/03/2011 Sampling Location Outdoor Living Room Bedroom
Sample ID Bac 1 Bac 2 Bac 3 Bac 4 Bac 5 Bac 6 Bac 7 Bac 8 Bac 9
Sampling Time 9:53 10:57 11:41 10:07 11:18 12:01 10:25 11:32 12:20
Total Bacteria Colony Count 3 3 3 4 4 3 24 5 5
cfu/m3 30 30 30 40 40 30 240 50 50 House Number House 2 Address St. Lucia Visited Date 21/03/2011 Sampling Location Outdoor Living Room Bedroom
Sample ID Bac 1 Bac 2 Bac 3 Bac 4 Bac 5 Bac 6 Bac 7 Bac 8 Bac 9 Sampling Time 13:24 13:41 14:09 13:30 13:56 14:13 13:34 14:04 14:19 Total Bacteria Colony Count 11 8 8 8 15 13 6 11 7 cfu/m3 110 80 80 80 150 130 60 110 70 House Number House 3 Address St. Lucia Visited Date 22/03/2011 Sampling Location Outdoor Living room Bedroom
Sample ID Bac 1 Bac 2 Bac3 Bac 4 Bac 5 Bac 6 Bac 7 Bac 8 Bac 9
Sampling Time 13:24 13:41 14:09 13:30 13:56 14:13 13:34 14:04 14:19
Total Bacteria Colony Count 7 5 3 12 6 11 8 11 17
cfu/m3 70 50 30 120 60 110 80 110 170 House Number House 4 Address St Lucia Visited Date 22/03/2011 Sampling Location Outdoor Living room Bedroom
Sample ID Bac 1 Bac 2 Bac 3 Bac 4 Bac 5 Bac 6 Bac 7 Bac 8 Bac 9
Sampling Time 13:24 13:41 14:09 13:30 13:56 14:14 13:34 14:04 14:19
Total Bacteria Colony Count 6 4 6 8 15 8 4 7 16
cfu/m3 60 40 60 80 150 80 40 70 160
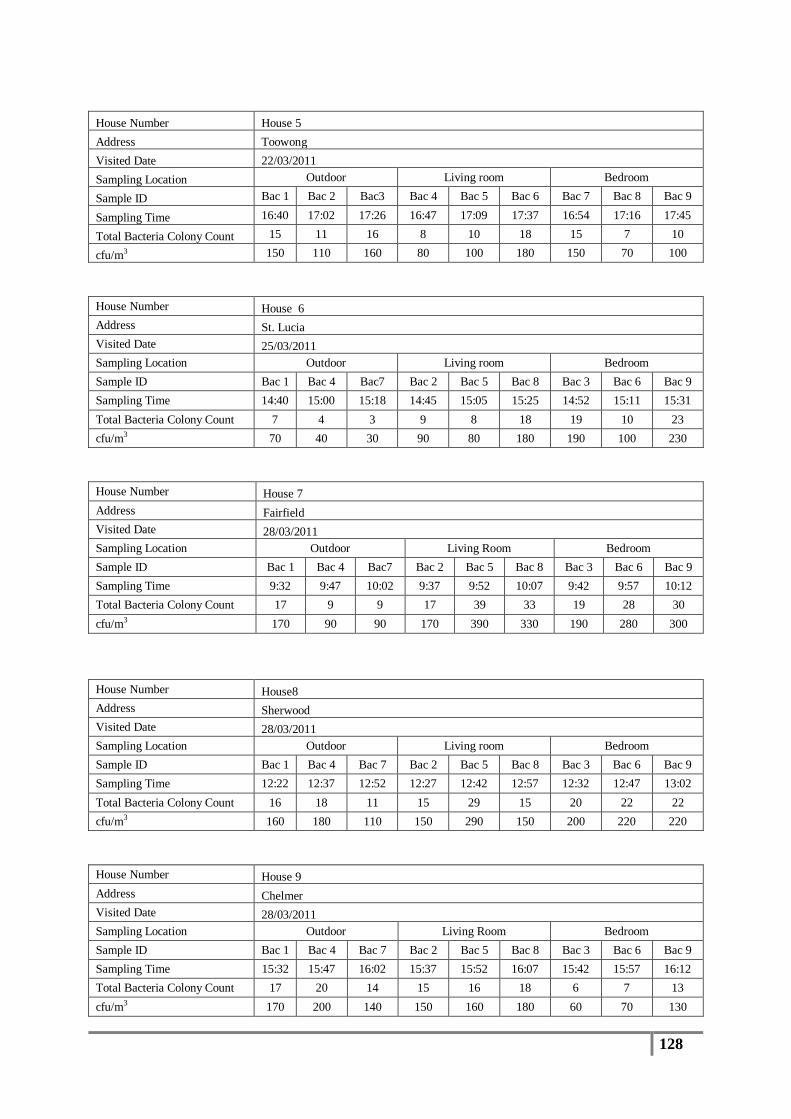
128
House Number House 5 Address Toowong Visited Date 22/03/2011 Sampling Location Outdoor Living room Bedroom
Sample ID Bac 1 Bac 2 Bac3 Bac 4 Bac 5 Bac 6 Bac 7 Bac 8 Bac 9
Sampling Time 16:40 17:02 17:26 16:47 17:09 17:37 16:54 17:16 17:45
Total Bacteria Colony Count 15 11 16 8 10 18 15 7 10
cfu/m3 150 110 160 80 100 180 150 70 100 House Number House 6 Address St. Lucia Visited Date 25/03/2011 Sampling Location Outdoor Living room Bedroom Sample ID Bac 1 Bac 4 Bac7 Bac 2 Bac 5 Bac 8 Bac 3 Bac 6 Bac 9 Sampling Time 14:40 15:00 15:18 14:45 15:05 15:25 14:52 15:11 15:31 Total Bacteria Colony Count 7 4 3 9 8 18 19 10 23 cfu/m3 70 40 30 90 80 180 190 100 230 House Number House 7 Address Fairfield Visited Date 28/03/2011 Sampling Location Outdoor Living Room Bedroom Sample ID Bac 1 Bac 4 Bac7 Bac 2 Bac 5 Bac 8 Bac 3 Bac 6 Bac 9 Sampling Time 9:32 9:47 10:02 9:37 9:52 10:07 9:42 9:57 10:12 Total Bacteria Colony Count 17 9 9 17 39 33 19 28 30 cfu/m3 170 90 90 170 390 330 190 280 300 House Number House8 Address Sherwood Visited Date 28/03/2011 Sampling Location Outdoor Living room Bedroom Sample ID Bac 1 Bac 4 Bac 7 Bac 2 Bac 5 Bac 8 Bac 3 Bac 6 Bac 9 Sampling Time 12:22 12:37 12:52 12:27 12:42 12:57 12:32 12:47 13:02 Total Bacteria Colony Count 16 18 11 15 29 15 20 22 22 cfu/m3 160 180 110 150 290 150 200 220 220 House Number House 9 Address Chelmer Visited Date 28/03/2011 Sampling Location Outdoor Living Room Bedroom Sample ID Bac 1 Bac 4 Bac 7 Bac 2 Bac 5 Bac 8 Bac 3 Bac 6 Bac 9 Sampling Time 15:32 15:47 16:02 15:37 15:52 16:07 15:42 15:57 16:12 Total Bacteria Colony Count 17 20 14 15 16 18 6 7 13 cfu/m3 170 200 140 150 160 180 60 70 130
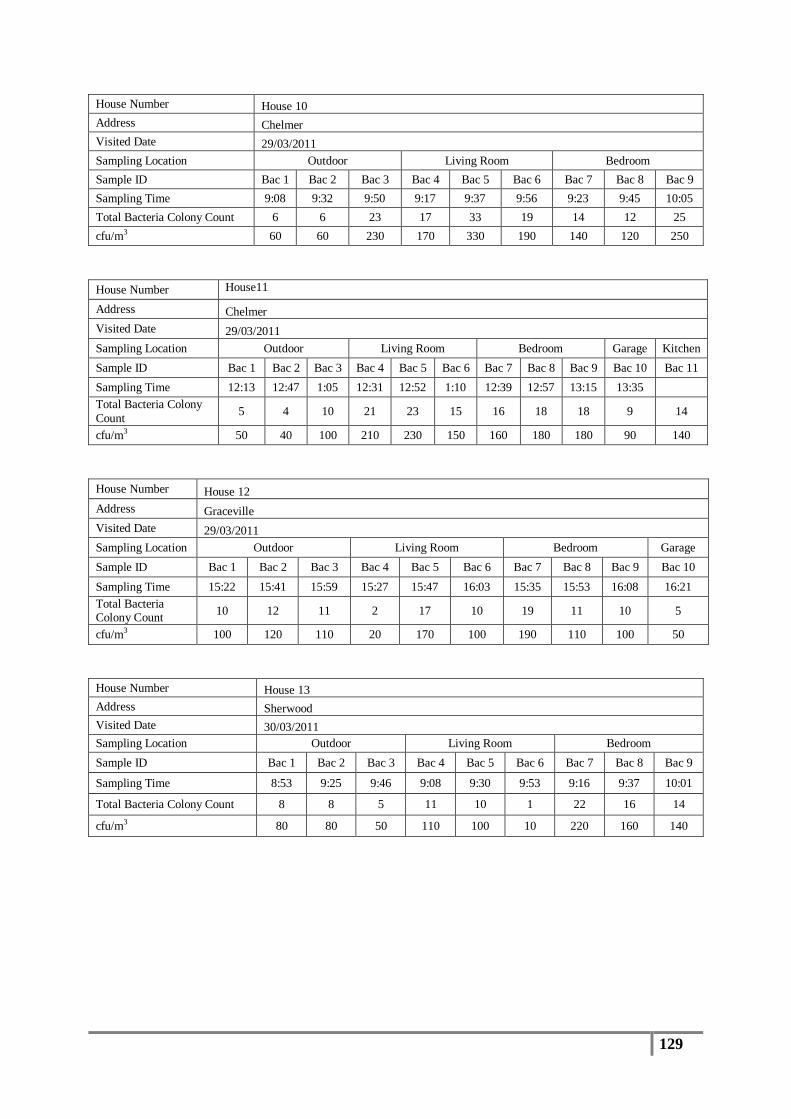
129
House Number House 10 Address Chelmer Visited Date 29/03/2011 Sampling Location Outdoor Living Room Bedroom Sample ID Bac 1 Bac 2 Bac 3 Bac 4 Bac 5 Bac 6 Bac 7 Bac 8 Bac 9 Sampling Time 9:08 9:32 9:50 9:17 9:37 9:56 9:23 9:45 10:05 Total Bacteria Colony Count 6 6 23 17 33 19 14 12 25 cfu/m3 60 60 230 170 330 190 140 120 250 House Number House11
Address Chelmer Visited Date 29/03/2011 Sampling Location Outdoor Living Room Bedroom Garage Kitchen Sample ID Bac 1 Bac 2 Bac 3 Bac 4 Bac 5 Bac 6 Bac 7 Bac 8 Bac 9 Bac 10 Bac 11 Sampling Time 12:13 12:47 1:05 12:31 12:52 1:10 12:39 12:57 13:15 13:35 Total Bacteria Colony Count 5 4 10 21 23 15 16 18 18 9 14
cfu/m3 50 40 100 210 230 150 160 180 180 90 140 House Number House 12 Address Graceville Visited Date 29/03/2011 Sampling Location Outdoor Living Room Bedroom Garage Sample ID Bac 1 Bac 2 Bac 3 Bac 4 Bac 5 Bac 6 Bac 7 Bac 8 Bac 9 Bac 10 Sampling Time 15:22 15:41 15:59 15:27 15:47 16:03 15:35 15:53 16:08 16:21 Total Bacteria Colony Count 10 12 11 2 17 10 19 11 10 5
cfu/m3 100 120 110 20 170 100 190 110 100 50 House Number House 13 Address Sherwood Visited Date 30/03/2011 Sampling Location Outdoor Living Room Bedroom Sample ID Bac 1 Bac 2 Bac 3 Bac 4 Bac 5 Bac 6 Bac 7 Bac 8 Bac 9
Sampling Time 8:53 9:25 9:46 9:08 9:30 9:53 9:16 9:37 10:01
Total Bacteria Colony Count 8 8 5 11 10 1 22 16 14
cfu/m3 80 80 50 110 100 10 220 160 140
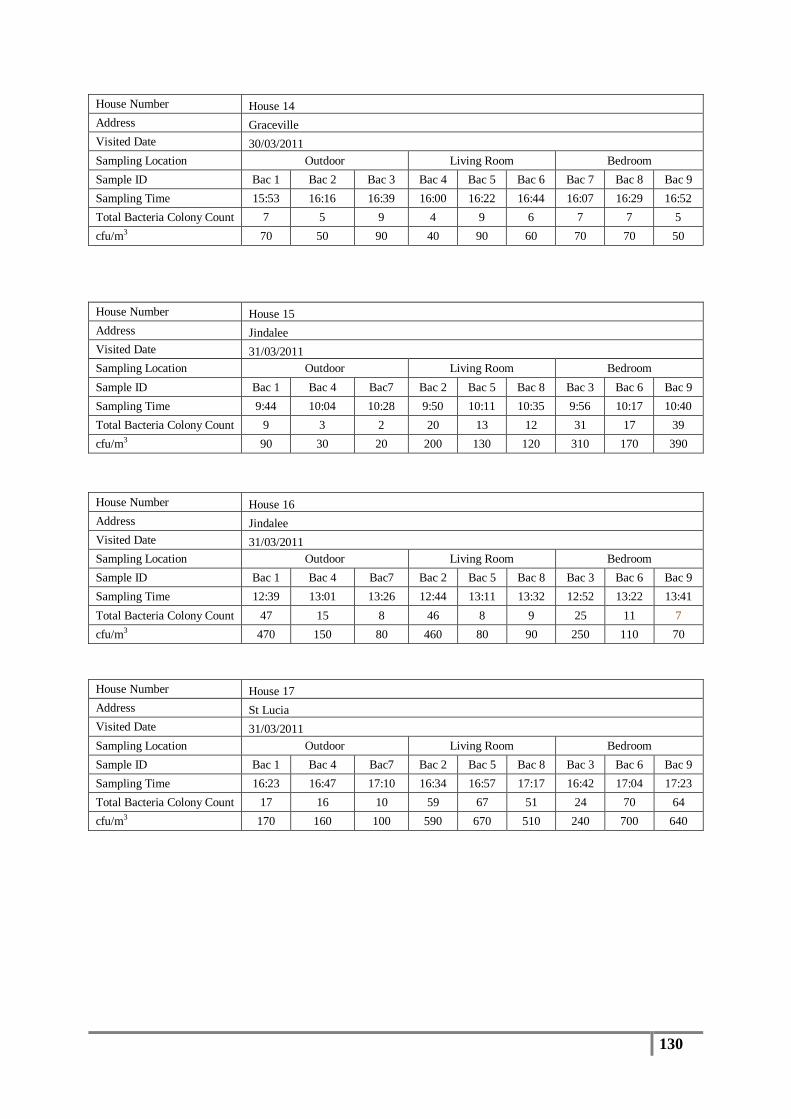
130
House Number House 14 Address Graceville Visited Date 30/03/2011 Sampling Location Outdoor Living Room Bedroom Sample ID Bac 1 Bac 2 Bac 3 Bac 4 Bac 5 Bac 6 Bac 7 Bac 8 Bac 9 Sampling Time 15:53 16:16 16:39 16:00 16:22 16:44 16:07 16:29 16:52 Total Bacteria Colony Count 7 5 9 4 9 6 7 7 5 cfu/m3 70 50 90 40 90 60 70 70 50
House Number House 15 Address Jindalee Visited Date 31/03/2011 Sampling Location Outdoor Living Room Bedroom Sample ID Bac 1 Bac 4 Bac7 Bac 2 Bac 5 Bac 8 Bac 3 Bac 6 Bac 9 Sampling Time 9:44 10:04 10:28 9:50 10:11 10:35 9:56 10:17 10:40 Total Bacteria Colony Count 9 3 2 20 13 12 31 17 39 cfu/m3 90 30 20 200 130 120 310 170 390 House Number House 16 Address Jindalee Visited Date 31/03/2011 Sampling Location Outdoor Living Room Bedroom Sample ID Bac 1 Bac 4 Bac7 Bac 2 Bac 5 Bac 8 Bac 3 Bac 6 Bac 9 Sampling Time 12:39 13:01 13:26 12:44 13:11 13:32 12:52 13:22 13:41 Total Bacteria Colony Count 47 15 8 46 8 9 25 11 7 cfu/m3 470 150 80 460 80 90 250 110 70 House Number House 17 Address St Lucia Visited Date 31/03/2011 Sampling Location Outdoor Living Room Bedroom Sample ID Bac 1 Bac 4 Bac7 Bac 2 Bac 5 Bac 8 Bac 3 Bac 6 Bac 9 Sampling Time 16:23 16:47 17:10 16:34 16:57 17:17 16:42 17:04 17:23 Total Bacteria Colony Count 17 16 10 59 67 51 24 70 64 cfu/m3 170 160 100 590 670 510 240 700 640
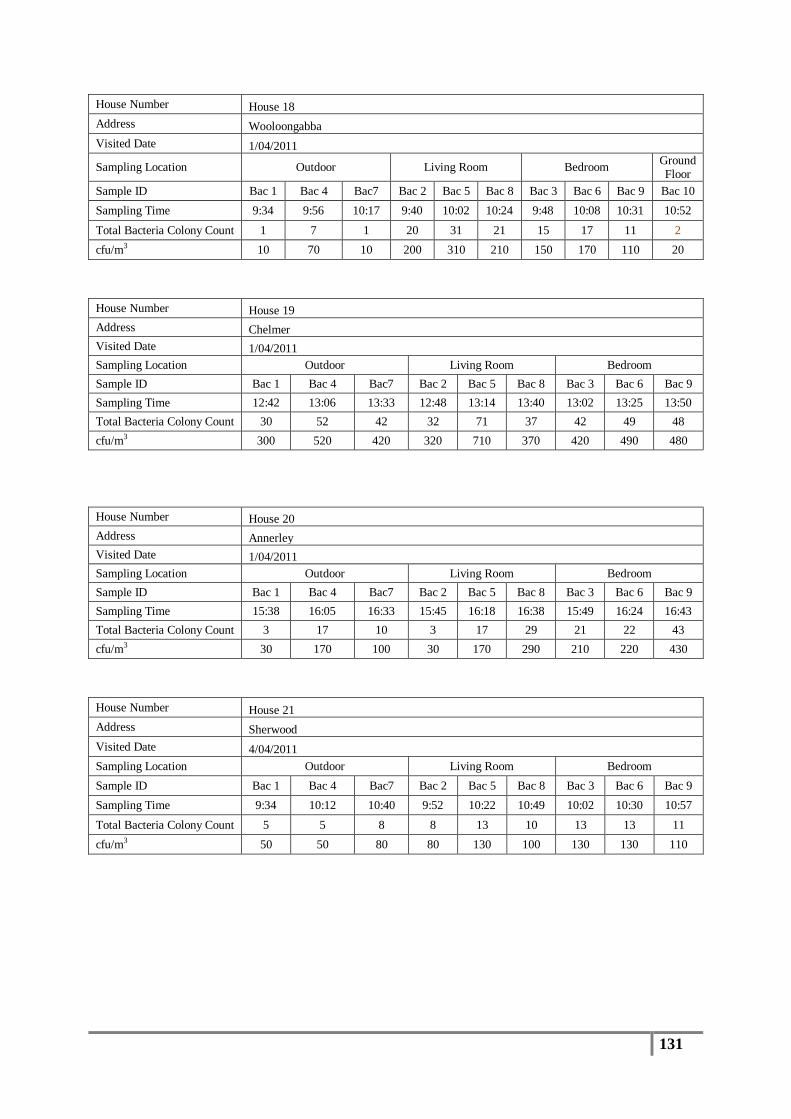
131
House Number House 18 Address Wooloongabba Visited Date 1/04/2011
Sampling Location Outdoor Living Room Bedroom Ground Floor
Sample ID Bac 1 Bac 4 Bac7 Bac 2 Bac 5 Bac 8 Bac 3 Bac 6 Bac 9 Bac 10 Sampling Time 9:34 9:56 10:17 9:40 10:02 10:24 9:48 10:08 10:31 10:52 Total Bacteria Colony Count 1 7 1 20 31 21 15 17 11 2 cfu/m3 10 70 10 200 310 210 150 170 110 20 House Number House 19 Address Chelmer Visited Date 1/04/2011 Sampling Location Outdoor Living Room Bedroom Sample ID Bac 1 Bac 4 Bac7 Bac 2 Bac 5 Bac 8 Bac 3 Bac 6 Bac 9 Sampling Time 12:42 13:06 13:33 12:48 13:14 13:40 13:02 13:25 13:50 Total Bacteria Colony Count 30 52 42 32 71 37 42 49 48 cfu/m3 300 520 420 320 710 370 420 490 480
House Number House 20 Address Annerley Visited Date 1/04/2011 Sampling Location Outdoor Living Room Bedroom Sample ID Bac 1 Bac 4 Bac7 Bac 2 Bac 5 Bac 8 Bac 3 Bac 6 Bac 9 Sampling Time 15:38 16:05 16:33 15:45 16:18 16:38 15:49 16:24 16:43 Total Bacteria Colony Count 3 17 10 3 17 29 21 22 43 cfu/m3 30 170 100 30 170 290 210 220 430 House Number House 21 Address Sherwood Visited Date 4/04/2011 Sampling Location Outdoor Living Room Bedroom Sample ID Bac 1 Bac 4 Bac7 Bac 2 Bac 5 Bac 8 Bac 3 Bac 6 Bac 9 Sampling Time 9:34 10:12 10:40 9:52 10:22 10:49 10:02 10:30 10:57 Total Bacteria Colony Count 5 5 8 8 13 10 13 13 11 cfu/m3 50 50 80 80 130 100 130 130 110

132
House Number House 22 Address Dutton Park Visited Date 4/04/2011 Sampling Location Outdoor Living Room Bedroom Sample ID Bac 1 Bac 4 Bac7 Bac 2 Bac 5 Bac 8 Bac 3 Bac 6 Bac 9 Sampling Time 13:26 13:51 14:15 13:35 14:01 14:22 13:41 14:07 14:30 Total Bacteria Colony Count 9 12 8 8 17 19 11 26 4 cfu/m3 90 120 80 80 170 190 110 260 40 House Number House 23 Address Ashgrove Visited Date 5/04/2011 Sampling Location Outdoor Living Room Bedroom Sample ID Bac 1 Bac 4 Bac7 Bac 2 Bac 5 Bac 8 Bac 3 Bac 6 Bac 9 Sampling Time 9:35 10:01 10:26 9:46 10:09 10:35 9:53 10:18 10:41 Total Bacteria Colony Count 10 11 7 16 8 28 17 19 26 cfu/m3 100 110 70 160 80 280 170 190 260 House Number House 24 Address Manly Visited Date 6/04/2011 Sampling Location Outdoor Living Room Bedroom Sample ID Bac 1 Bac 4 Bac7 Bac 2 Bac 5 Bac 8 Bac 3 Bac 6 Bac 9 Sampling Time 9:38 9:59 10:18 9:47 9:52 10:10 Total Bacteria Colony Count 3 6 5 14 19 31 15 7 14 cfu/m3 30 60 50 140 190 310 150 70 140 House Number House 25 Address St. Lucia Visited Date 6/04/2011 Sampling Location Outdoor Living Room Bedroom Sample ID Bac 1 Bac 4 Bac7 Bac 2 Bac 5 Bac 8 Bac 3 Bac 6 Bac 9 Sampling Time 12:43 13:09 13:30 12:59 13:15 13:38 13:04 13:20 13:43 Total Bacteria Colony Count 4 6 6 43 49 41 31 46 46 cfu/m3 40 60 60 430 490 410 310 460 460 House Number House 26 Address St. Lucia Visited Date 6/04/2011 Sampling Location Outdoor Living Room Bedroom Sample ID Bac 1 Bac 4 Bac7 Bac 2 Bac 5 Bac 8 Bac 3 Bac 6 Bac 9 Sampling Time 16:09 16:34 16:54 16:18 16:39 17:03 16:26 16:48 17:11 Total Bacteria Colony Count 4 6 15 25 22 17 11 11 15 cfu/m3 40 60 150 250 220 170 110 110 150
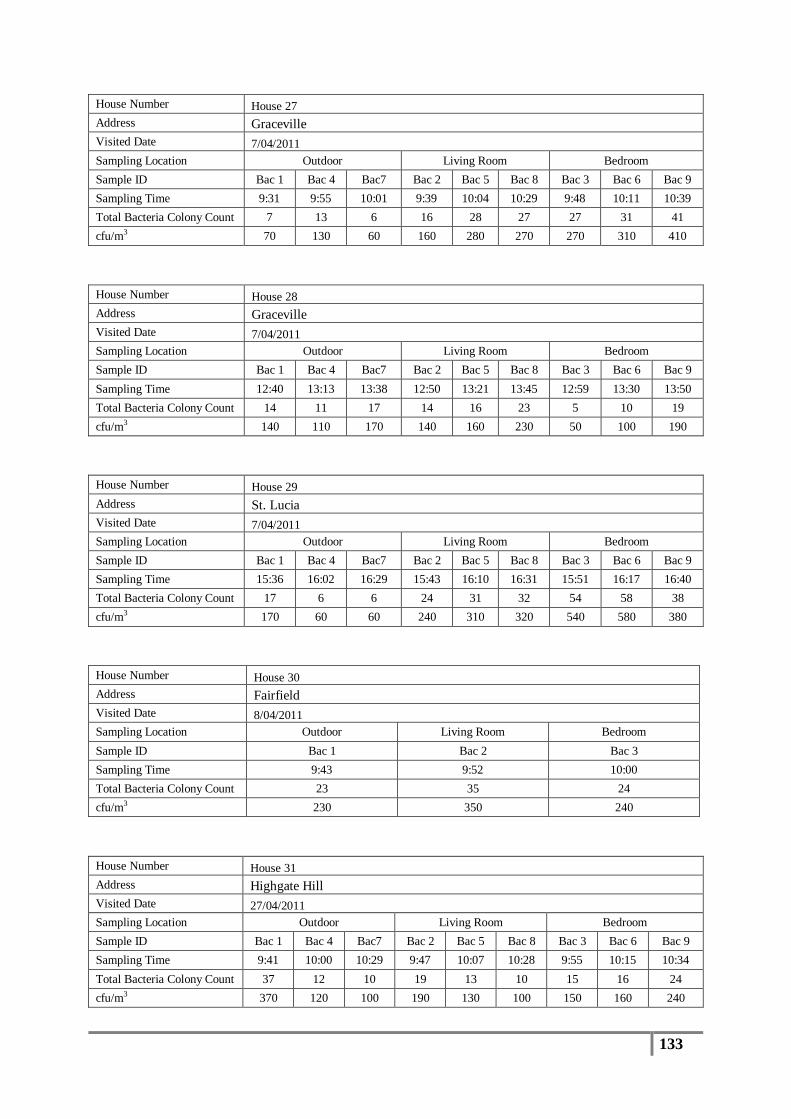
133
House Number House 27 Address Graceville Visited Date 7/04/2011 Sampling Location Outdoor Living Room Bedroom Sample ID Bac 1 Bac 4 Bac7 Bac 2 Bac 5 Bac 8 Bac 3 Bac 6 Bac 9 Sampling Time 9:31 9:55 10:01 9:39 10:04 10:29 9:48 10:11 10:39 Total Bacteria Colony Count 7 13 6 16 28 27 27 31 41 cfu/m3 70 130 60 160 280 270 270 310 410 House Number House 28 Address Graceville Visited Date 7/04/2011 Sampling Location Outdoor Living Room Bedroom Sample ID Bac 1 Bac 4 Bac7 Bac 2 Bac 5 Bac 8 Bac 3 Bac 6 Bac 9 Sampling Time 12:40 13:13 13:38 12:50 13:21 13:45 12:59 13:30 13:50 Total Bacteria Colony Count 14 11 17 14 16 23 5 10 19 cfu/m3 140 110 170 140 160 230 50 100 190 House Number House 29 Address St. Lucia Visited Date 7/04/2011 Sampling Location Outdoor Living Room Bedroom Sample ID Bac 1 Bac 4 Bac7 Bac 2 Bac 5 Bac 8 Bac 3 Bac 6 Bac 9 Sampling Time 15:36 16:02 16:29 15:43 16:10 16:31 15:51 16:17 16:40 Total Bacteria Colony Count 17 6 6 24 31 32 54 58 38 cfu/m3 170 60 60 240 310 320 540 580 380 House Number House 30 Address Fairfield Visited Date 8/04/2011 Sampling Location Outdoor Living Room Bedroom Sample ID Bac 1 Bac 2 Bac 3 Sampling Time 9:43 9:52 10:00 Total Bacteria Colony Count 23 35 24 cfu/m3 230 350 240 House Number House 31 Address Highgate Hill Visited Date 27/04/2011 Sampling Location Outdoor Living Room Bedroom Sample ID Bac 1 Bac 4 Bac7 Bac 2 Bac 5 Bac 8 Bac 3 Bac 6 Bac 9 Sampling Time 9:41 10:00 10:29 9:47 10:07 10:28 9:55 10:15 10:34 Total Bacteria Colony Count 37 12 10 19 13 10 15 16 24 cfu/m3 370 120 100 190 130 100 150 160 240
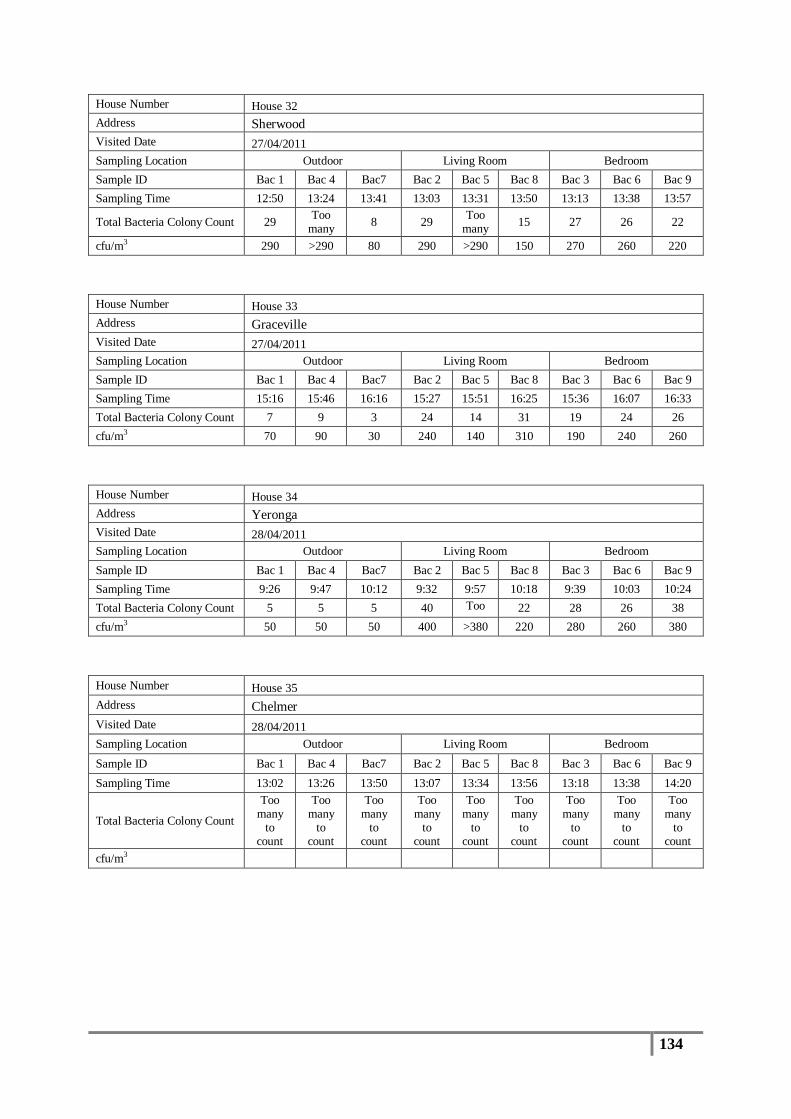
134
House Number House 32 Address Sherwood Visited Date 27/04/2011 Sampling Location Outdoor Living Room Bedroom Sample ID Bac 1 Bac 4 Bac7 Bac 2 Bac 5 Bac 8 Bac 3 Bac 6 Bac 9 Sampling Time 12:50 13:24 13:41 13:03 13:31 13:50 13:13 13:38 13:57
Total Bacteria Colony Count 29 Too many
8 29 Too many
15 27 26 22
cfu/m3 290 >290 80 290 >290 150 270 260 220 House Number House 33 Address Graceville Visited Date 27/04/2011 Sampling Location Outdoor Living Room Bedroom Sample ID Bac 1 Bac 4 Bac7 Bac 2 Bac 5 Bac 8 Bac 3 Bac 6 Bac 9 Sampling Time 15:16 15:46 16:16 15:27 15:51 16:25 15:36 16:07 16:33 Total Bacteria Colony Count 7 9 3 24 14 31 19 24 26 cfu/m3 70 90 30 240 140 310 190 240 260 House Number House 34 Address Yeronga Visited Date 28/04/2011 Sampling Location Outdoor Living Room Bedroom Sample ID Bac 1 Bac 4 Bac7 Bac 2 Bac 5 Bac 8 Bac 3 Bac 6 Bac 9 Sampling Time 9:26 9:47 10:12 9:32 9:57 10:18 9:39 10:03 10:24 Total Bacteria Colony Count 5 5 5 40 Too
22 28 26 38 cfu/m3 50 50 50 400 >380 220 280 260 380 House Number House 35 Address Chelmer Visited Date 28/04/2011 Sampling Location Outdoor Living Room Bedroom Sample ID Bac 1 Bac 4 Bac7 Bac 2 Bac 5 Bac 8 Bac 3 Bac 6 Bac 9 Sampling Time 13:02 13:26 13:50 13:07 13:34 13:56 13:18 13:38 14:20
Total Bacteria Colony Count
Too many
to count
Too many
to count
Too many
to count
Too many
to count
Too many
to count
Too many
to count
Too many
to count
Too many
to count
Too many
to count
cfu/m3

135
House Number House 36 Address Graceville Visited Date 28/04/2011 Sampling Location Outdoor Living Room Bedroom Sample ID Bac 1 Bac 4 Bac7 Bac 2 Bac 5 Bac 8 Bac 3 Bac 6 Bac 9 Sampling Time 15:42 16:06 16:26 15:51 16:12 16:36 15:57 16:18 16:46 Total Bacteria Colony Count 5 10 19 15 18 25 15 13 12 cfu/m3 50 100 190 150 180 250 150 130 120 House Number House 37 Address Morayfield Visited Date 29/04/2011 Sampling Location Outdoor Living Room Bedroom Sample ID Bac 1 Bac 4 Bac7 Bac 2 Bac 5 Bac 8 Bac 3 Bac 6 Bac 9 Sampling Time 9:00 9:19 9:44 9:58 9:29 9:51 9:13 9:36 9:57 Total Bacteria Colony Count 14 5 11 46 57 53 51 40 47 cfu/m3 140 50 110 460 570 530 510 400 470 House Number House 38 Address Fairfield Visited Date 29/04/2011 Sampling Location Outdoor Living Room Bedroom Sample ID Bac 1 Bac 4 Bac7 Bac 2 Bac 5 Bac 8 Bac 3 Bac 6 Bac 9 Sampling Time 12:30 12:58 13:22 12:38 13:09 13:29 12:42 13:14 13:38 Total Bacteria Colony Count 14 19 6 21 20 16 19 20 18 cfu/m3 140 190 60 210 200 160 190 200 180 House Number House 39 Address Graceville Visited Date 29/04/2011 Sampling Location Outdoor Living Room Bedroom Sample ID Bac 1 Bac 4 Bac7 Bac 2 Bac 5 Bac 8 Bac 3 Bac 6 Bac 9 Sampling Time 15:04 15:29 15:52 15:15 15:36 15:57 15:21 15:46 16:04 Total Bacteria Colony Count 3 8 11 12 7 19 9 21 31 cfu/m3 30 80 110 120 70 190 90 210 310

136
House Number House 40 Address Fairfield Visited Date 3/05/2011
Sampling Location Outdoor Living Room Bedroom Kitchen Inside
Sample ID Bac 1 Bac 4 Bac7 Bac 2 Bac 5 Bac 8 Bac 3 Bac 6 Bac 9 Bac 10 Sampling Time 9:58 10:25 10:48 10:07 10:36 10:56 10:19 10:41 11:03 15:10
Total Bacteria Colony Count 8 11 9 28 26 26 24 16 23
Too many
to count
cfu/m3 80 110 90 280 260 260 240 160 230 >430 House Number House 41 Visited Date 3/05/2011
Sampling Location Office Indoor
Office Outdoor
(rear side)
Office Indoor
Office Outdoor
Office Indoor
Office Outdoor
(rear side)
Office Basement
Electrical Workshop
Close to
Creek
Sample ID Bac 1 Bac 2 Bac3 Bac 4 Bac 5 Bac 6 Bac 7 Bac 8 Bac 9 Sampling Time 13:39 13:46 13:53 14:01 14:08 14:19 14:25 14:51 15:57 Total Bacteria Colony Count 7 43 19 26 10 31 13 37 12 cfu/m3 70 430 190 260 100 310 130 370 120

137
(B) Biochemical Test Results Analysis
Table I: Mannitol Salt fermenting airborne microorganisms present in flood affected houses
House ID
Living Room Bedroom Outdoor
(cfu/m3) (%) (cfu/m3) (%) (cfu/m3) (%)
1 7.50 20.45 16.25 14.34 11.25 37.50
2 6.25 5.21 22.50 28.13 6.67 7.41
5 41.67 34.72 48.33 45.31 80.42 57.44
6 15.00 12.86 12.50 7.21 5.83 12.50
7 72.50 24.44 67.92 26.46 58.75 50.36
8 67.50 34.32 60.83 28.52 32.92 21.94
9 57.08 34.95 32.08 37.02 40.00 23.53
10 100.00 43.48 25.42 14.95 47.92 41.07
11 45.42 23.09 41.67 24.04 10.00 15.79
12 15.42 15.95 40.83 30.63 42.92 39.02
13 8.33 7.94 20.00 11.54 0.00 0.00
14 12.92 20.39 0.00 0.00 0.00 0.00
15 93.33 62.22 27.08 9.34 20.42 43.75
16 59.58 28.37 50.83 35.47 57.08 24.46
17 80.08 13.57 144.50 27.44 52.50 36.63
18 215.00 89.58 110.83 77.33 0.83 2.78
19 143.33 30.71 274.17 59.17 73.33 17.74
22 62.08 42.33 55.58 40.67 17.08 17.67
23 123.33 71.15 107.04 51.79 19.58 20.98
24 101.67 47.66 49.17 40.97 2.50 5.36
25 304.92 68.78 208.14 50.77 11.67 21.88
26 37.50 17.58 52.92 42.91 35.00 42.00
27 118.33 50.00 189.58 57.45 29.17 33.65
28 115.74 65.51 40.83 36.03 36.25 25.89
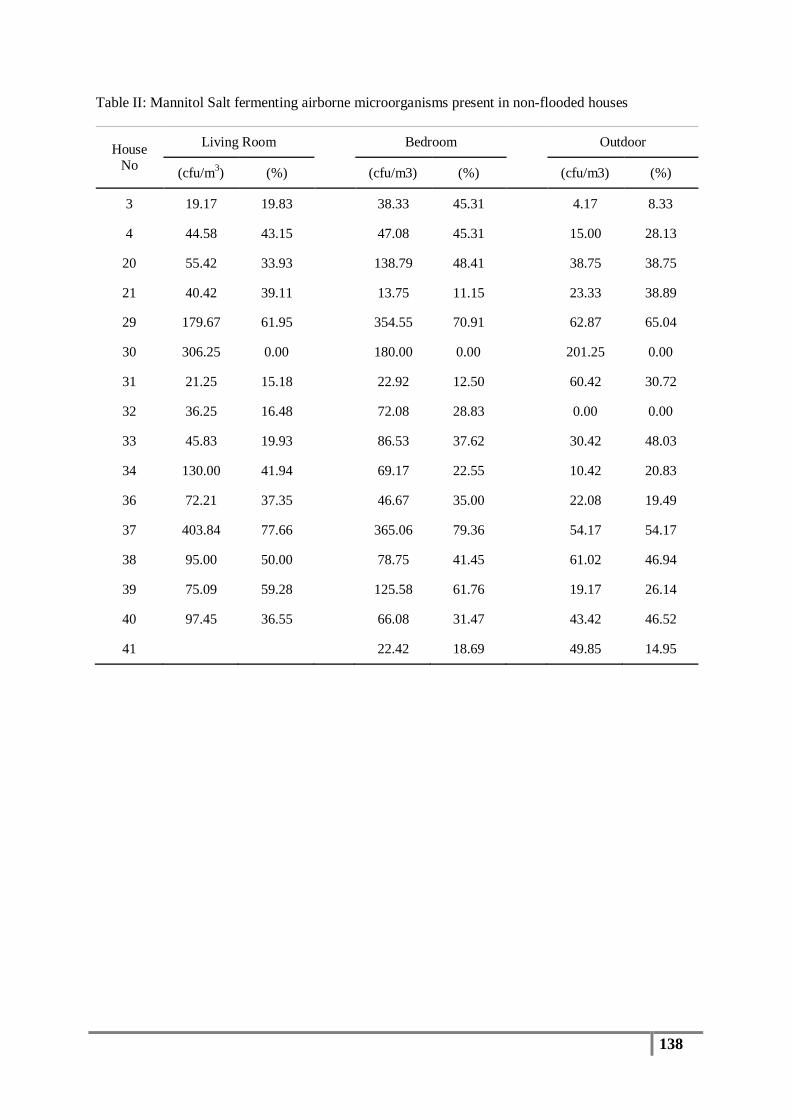
138
Table II: Mannitol Salt fermenting airborne microorganisms present in non-flooded houses
House No
Living Room Bedroom Outdoor
(cfu/m3) (%) (cfu/m3) (%) (cfu/m3) (%)
3 19.17 19.83 38.33 45.31 4.17 8.33
4 44.58 43.15 47.08 45.31 15.00 28.13
20 55.42 33.93 138.79 48.41 38.75 38.75
21 40.42 39.11 13.75 11.15 23.33 38.89
29 179.67 61.95 354.55 70.91 62.87 65.04
30 306.25 0.00 180.00 0.00 201.25 0.00
31 21.25 15.18 22.92 12.50 60.42 30.72
32 36.25 16.48 72.08 28.83 0.00 0.00
33 45.83 19.93 86.53 37.62 30.42 48.03
34 130.00 41.94 69.17 22.55 10.42 20.83
36 72.21 37.35 46.67 35.00 22.08 19.49
37 403.84 77.66 365.06 79.36 54.17 54.17
38 95.00 50.00 78.75 41.45 61.02 46.94
39 75.09 59.28 125.58 61.76 19.17 26.14
40 97.45 36.55 66.08 31.47 43.42 46.52
41 22.42 18.69 49.85 14.95
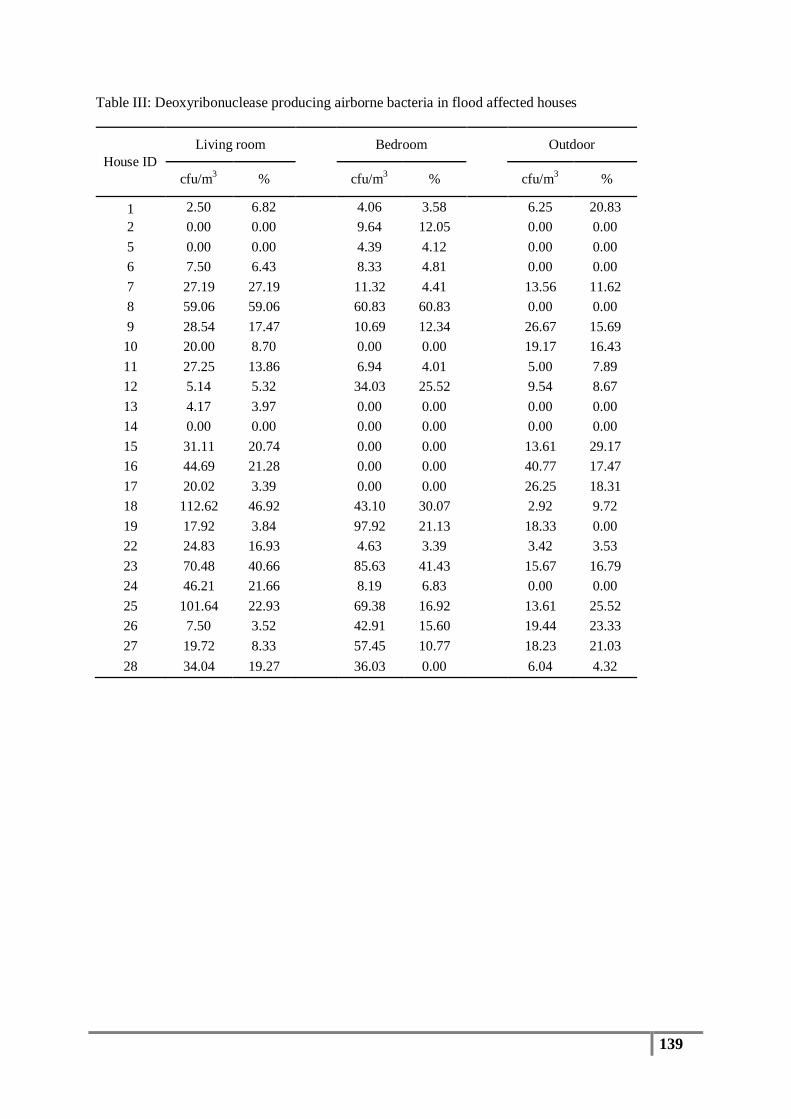
139
Table III: Deoxyribonuclease producing airborne bacteria in flood affected houses
House ID Living room Bedroom Outdoor
cfu/m3 % cfu/m3 % cfu/m3 %
1 2.50 6.82 4.06 3.58 6.25 20.83 2 0.00 0.00 9.64 12.05 0.00 0.00 5 0.00 0.00 4.39 4.12 0.00 0.00 6 7.50 6.43 8.33 4.81 0.00 0.00 7 27.19 27.19 11.32 4.41 13.56 11.62 8 59.06 59.06 60.83 60.83 0.00 0.00 9 28.54 17.47 10.69 12.34 26.67 15.69 10 20.00 8.70 0.00 0.00 19.17 16.43 11 27.25 13.86 6.94 4.01 5.00 7.89 12 5.14 5.32 34.03 25.52 9.54 8.67 13 4.17 3.97 0.00 0.00 0.00 0.00 14 0.00 0.00 0.00 0.00 0.00 0.00 15 31.11 20.74 0.00 0.00 13.61 29.17 16 44.69 21.28 0.00 0.00 40.77 17.47 17 20.02 3.39 0.00 0.00 26.25 18.31 18 112.62 46.92 43.10 30.07 2.92 9.72 19 17.92 3.84 97.92 21.13 18.33 0.00 22 24.83 16.93 4.63 3.39 3.42 3.53 23 70.48 40.66 85.63 41.43 15.67 16.79 24 46.21 21.66 8.19 6.83 0.00 0.00 25 101.64 22.93 69.38 16.92 13.61 25.52 26 7.50 3.52 42.91 15.60 19.44 23.33 27 19.72 8.33 57.45 10.77 18.23 21.03 28 34.04 19.27 36.03 0.00 6.04 4.32

140
Table IV: Deoxyribonuclease producing bacteria present in the aerosols of non-flooded house
House No
Living room Bedroom outdoor
cfu/m3 % cfu/m3 % cfu/m3 %
3 0.00 0.00 7.67 6.39 0.00 0.00 4 4.95 4.79 12.84 14.27 0.00 0.00 20 22.17 13.57 17.35 6.05 7.75 7.75 21 8.98 8.69 0.00 0.00 9.33 15.56 29 69.87 24.09 186.60 37.32 24.18 25.01 30 0.00 0.00 0.00 0.00 0.00 0.00 31 0.00 0.00 22.92 12.50 20.14 10.24 32 17.26 7.85 30.89 12.36 0.00 0.00 33 0.00 0.00 15.73 6.84 3.38 5.34 34 57.78 18.64 0.00 0.00 4.17 8.33 36 26.26 13.58 35.00 26.25 11.04 9.74 37 6.67 1.28 3.33 0.72 10.00 10.00 38 16.67 8.77 10.00 5.26 20.00 15.38 39 3.33 2.63 3.33 1.64 0.00 0.00 40 6.67 2.50 10.00 4.76 3.33 3.57

141
Figure I: Averages of total bacteria colony Count (cfu/m3) in flood affected living room, bedroom and outdoor locations
Figure II: Averages of total bacteria colony count (cfu/m3) in non-flooded houses living room, bedroom and outdoor locations
0
100
200
300
400
500
600
700
1 2 5 6 7 8 9 10 11 12 13 14 15 16 17 18 19 22 23 24 25 26 27 28
Tot
al B
acte
ria
Col
ony
Cou
nt c
fu/m
3 )
House ID
Flooded - Outdoor Flooded - Living Room Flooded - Bedroom
0
100
200
300
400
500
600
3 4 20 21 29 30 31 32 33 34 36 37 38 39 40 41
Tot
al B
acte
ria
Col
ony
Cou
nt (c
fu/m
3 )
House ID
Non-flooded - Outdoor Living Room Bedroom

142
Figure III: Total bacteria colony count in flood affected and non-flooded bedrooms
Figure IV: Total bacteria colony count results in flood affected and non-flooded outdoor areas
0.00
50.00
100.00
150.00
200.00
250.00
300.00
350.00
400.00
450.00
500.00
550.00
1 3 5 7 9 11 13 15 17 19 21 23 25 27 29 31 33 35 37 39 41
Tot
al b
acte
ria
colo
ny c
ount
(cfu
/m3)
House ID
Flooded - Bedroom Non-flooded Bedroom
0.00
50.00
100.00
150.00
200.00
250.00
300.00
350.00
400.00
450.00
1 3 5 7 9 11 13 15 17 19 21 23 25 27 29 31 33 35 37 39 41
Tot
al b
acte
ria
colo
ny c
ount
(cfu
/m3 )
House ID
Flooded - Outdoor Non-flooded - Outdoor
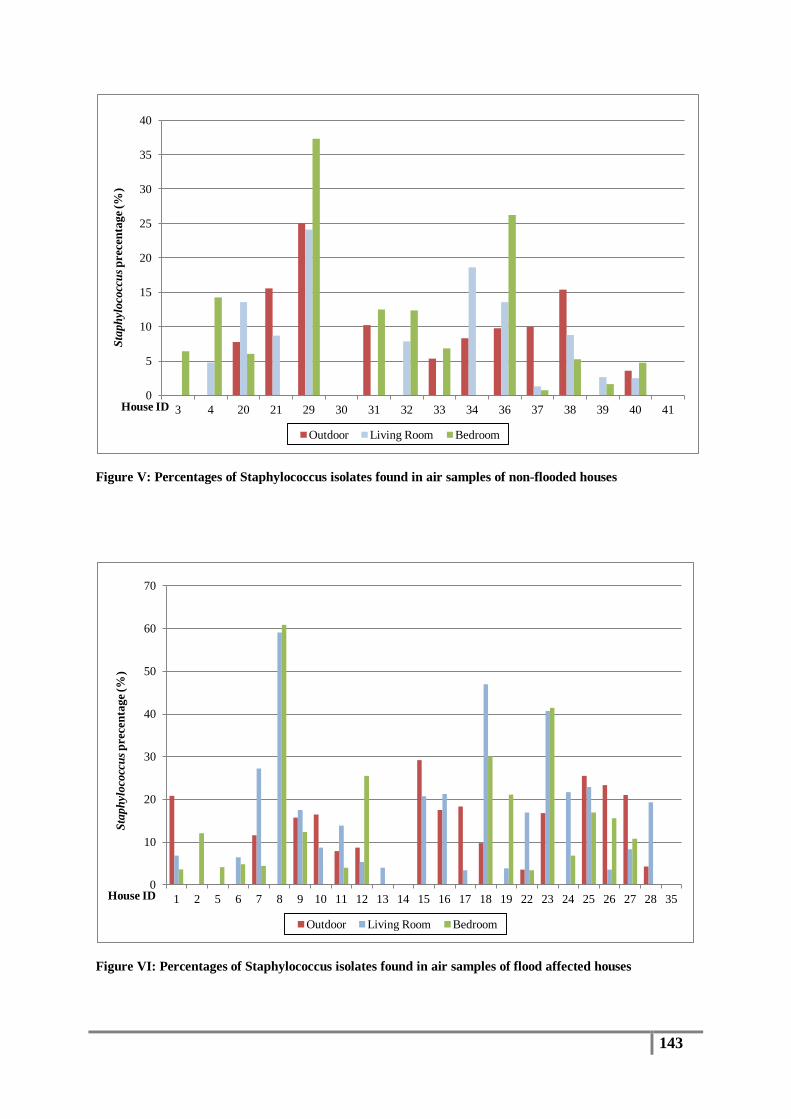
143
Figure V: Percentages of Staphylococcus isolates found in air samples of non-flooded houses
Figure VI: Percentages of Staphylococcus isolates found in air samples of flood affected houses
0
5
10
15
20
25
30
35
40
3 4 20 21 29 30 31 32 33 34 36 37 38 39 40 41
Stap
hylo
cocc
us p
rece
ntag
e (%
)
House ID
Outdoor Living Room Bedroom
0
10
20
30
40
50
60
70
1 2 5 6 7 8 9 10 11 12 13 14 15 16 17 18 19 22 23 24 25 26 27 28 35
Stap
hylo
cocc
us p
rece
ntag
e (%
)
House ID
Outdoor Living Room Bedroom
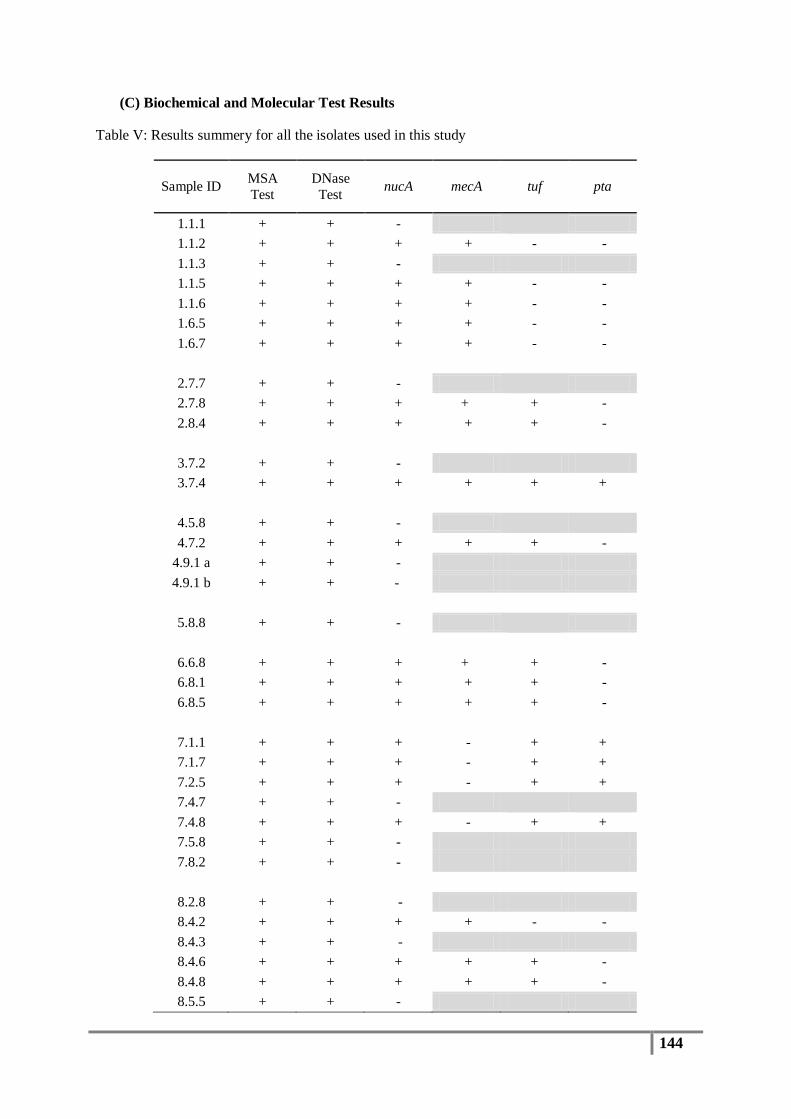
144
(C) Biochemical and Molecular Test Results
Table V: Results summery for all the isolates used in this study
Sample ID MSA Test
DNase Test nucA mecA tuf pta
1.1.1 + + - 1.1.2 + + + + - - 1.1.3 + + - 1.1.5 + + + + - - 1.1.6 + + + + - - 1.6.5 + + + + - - 1.6.7 + + + + - -
2.7.7 + + - 2.7.8 + + + + + - 2.8.4 + + + + + -
3.7.2 + + - 3.7.4 + + + + + +
4.5.8 + + - 4.7.2 + + + + + -
4.9.1 a + + - 4.9.1 b + + -
5.8.8 + + -
6.6.8 + + + + + - 6.8.1 + + + + + - 6.8.5 + + + + + -
7.1.1 + + + - + + 7.1.7 + + + - + + 7.2.5 + + + - + + 7.4.7 + + - 7.4.8 + + + - + + 7.5.8 + + - 7.8.2 + + -
8.2.8 + + - 8.4.2 + + + + - - 8.4.3 + + - 8.4.6 + + + + + - 8.4.8 + + + + + - 8.5.5 + + -

145
Sample ID MSA Test
DNase Test nucA mecA tuf pta
8.6.3 + + + - - - 8.7.1 + + - 8.7.3 + + + + + - 8.7.6 + + + + + - 8.7.7 + + + - + - 8.8.8 + + - 8.9.1 + + -
9.1.2 + + + - - - 9.1.6 + + - 9.2.7 + + - 9.3.8 + + - 9.6.2 + + - 9.6.3 + + - 9.6.5 + + - 9.7.7 + + + - + - 9.8.5 + + + + + - 9.9.8 + + -
10.3.1 + + - 10.3.2 + + - 10.4.7 + + + + + - 10.5.5 + + -
11.1.3 + + - 11.2.2 + + - 11.4.4 + + - 11.5.3 + + - 11.5.7 + + - 11.7.3 + + -
12.2.2 + + + + - - 12.3.1 + + - 12.6.4 + + - 12.7.2 + + - 12.7.3 + + + + + -
12.8.1 a + + + + - 12.8.1 b + + + + - 12.8.4 + + + + + -
15.1.5 + + + + - -
15.2.4 b + + - 15.4.1 a + + + + - -
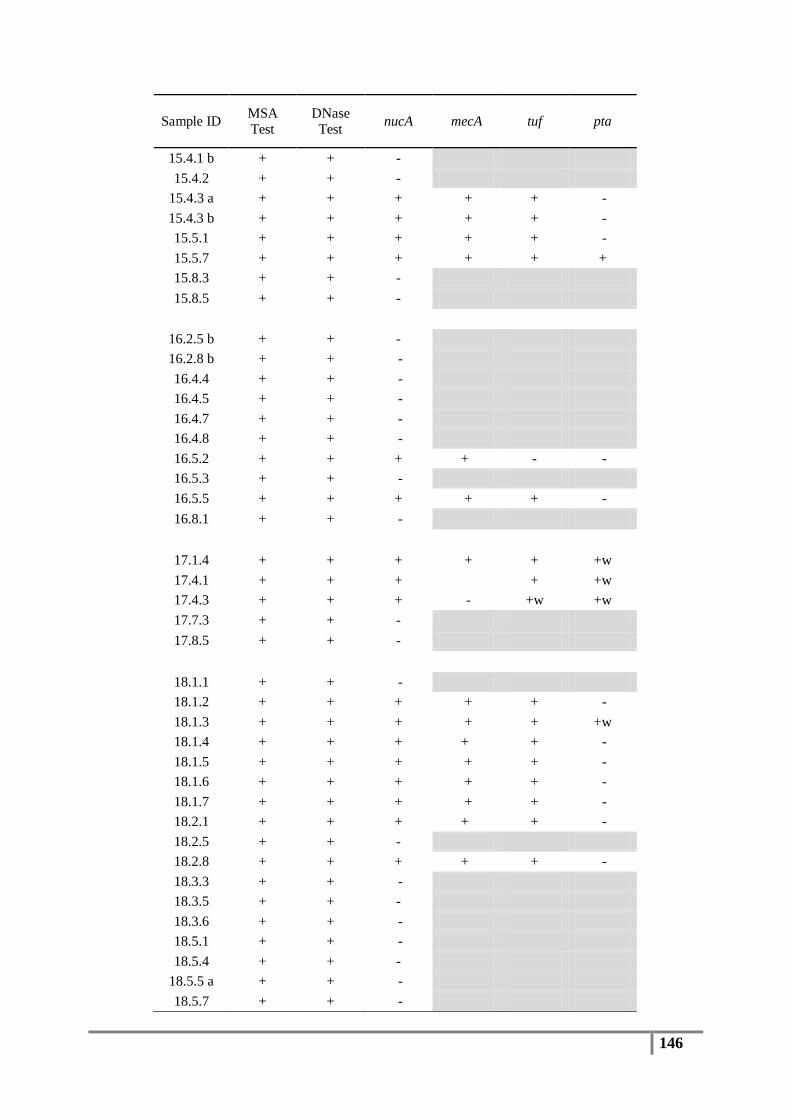
146
Sample ID MSA Test
DNase Test nucA mecA tuf pta
15.4.1 b + + - 15.4.2 + + -
15.4.3 a + + + + + - 15.4.3 b + + + + + - 15.5.1 + + + + + - 15.5.7 + + + + + + 15.8.3 + + - 15.8.5 + + -
16.2.5 b + + - 16.2.8 b + + - 16.4.4 + + - 16.4.5 + + - 16.4.7 + + - 16.4.8 + + - 16.5.2 + + + + - - 16.5.3 + + - 16.5.5 + + + + + - 16.8.1 + + -
17.1.4 + + + + + +w 17.4.1 + + + + +w 17.4.3 + + + - +w +w 17.7.3 + + - 17.8.5 + + -
18.1.1 + + - 18.1.2 + + + + + - 18.1.3 + + + + + +w 18.1.4 + + + + + - 18.1.5 + + + + + - 18.1.6 + + + + + - 18.1.7 + + + + + - 18.2.1 + + + + + - 18.2.5 + + - 18.2.8 + + + + + - 18.3.3 + + - 18.3.5 + + - 18.3.6 + + - 18.5.1 + + - 18.5.4 + + -
18.5.5 a + + - 18.5.7 + + -

147
Sample ID MSA Test
DNase Test nucA mecA tuf pta
18.5.8 b + + - 18.6.7 + + - 18.8.4 + + - 18.8.8 + + - 18.9.4 + + - 18.9.6 + + -
19.2.7 + + + + - - 19.6.3 + + + - + - 19.6.6 + + + + + -
19.9.5 a + + + + - - 19.9.5 b + + -
20.1.2 + + + + + - 20.1.3 + + + + + - 20.3.3 + + -
20.6.7 b + + - 20.8.1 + + -
21.1.2 + + - 21.1.9 + + - 21.4.6 + + + + + - 21.4.7 + + + + + - 21.8.5 + + + + - - 21.8.8 + + -
22.2.4 + + - 22.5.5 + + + + + - 22.5.6 + + - 22.5.8 + + -
22.9.8 a + + -
23.2.3 + + -
23.2.7 a + + - 23.2.7 b + + - 23.3.3 + + - 23.3.6 + + - 23.3.8 + + - 23.4.1 + + + - + - 23.4.7 + + + - + - 23.5.1 + + - 23.6.3 + + - 23.6.8 + + -
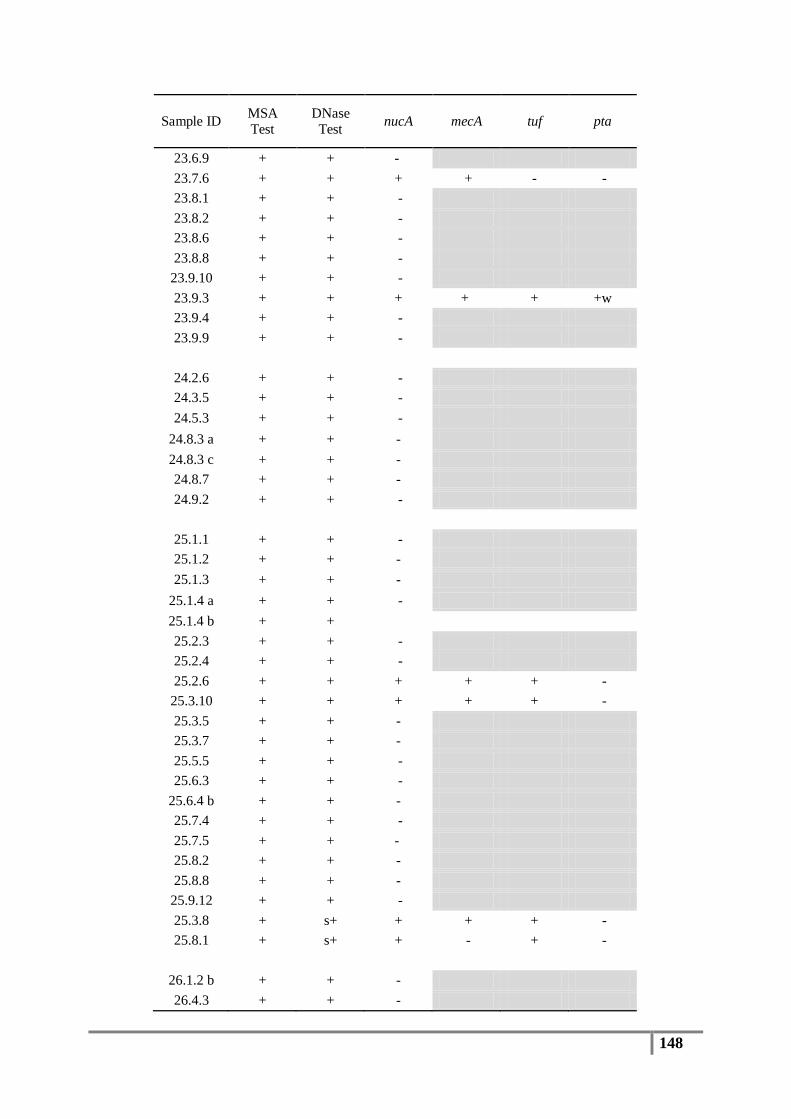
148
Sample ID MSA Test
DNase Test nucA mecA tuf pta
23.6.9 + + - 23.7.6 + + + + - - 23.8.1 + + - 23.8.2 + + - 23.8.6 + + - 23.8.8 + + - 23.9.10 + + - 23.9.3 + + + + + +w 23.9.4 + + - 23.9.9 + + -
24.2.6 + + - 24.3.5 + + - 24.5.3 + + -
24.8.3 a + + - 24.8.3 c + + - 24.8.7 + + - 24.9.2 + + -
25.1.1 + + - 25.1.2 + + - 25.1.3 + + -
25.1.4 a + + - 25.1.4 b + + 25.2.3 + + - 25.2.4 + + - 25.2.6 + + + + + - 25.3.10 + + + + + - 25.3.5 + + - 25.3.7 + + - 25.5.5 + + - 25.6.3 + + -
25.6.4 b + + - 25.7.4 + + - 25.7.5 + + - 25.8.2 + + - 25.8.8 + + - 25.9.12 + + - 25.3.8 + s+ + + + - 25.8.1 + s+ + - + -
26.1.2 b + + - 26.4.3 + + -
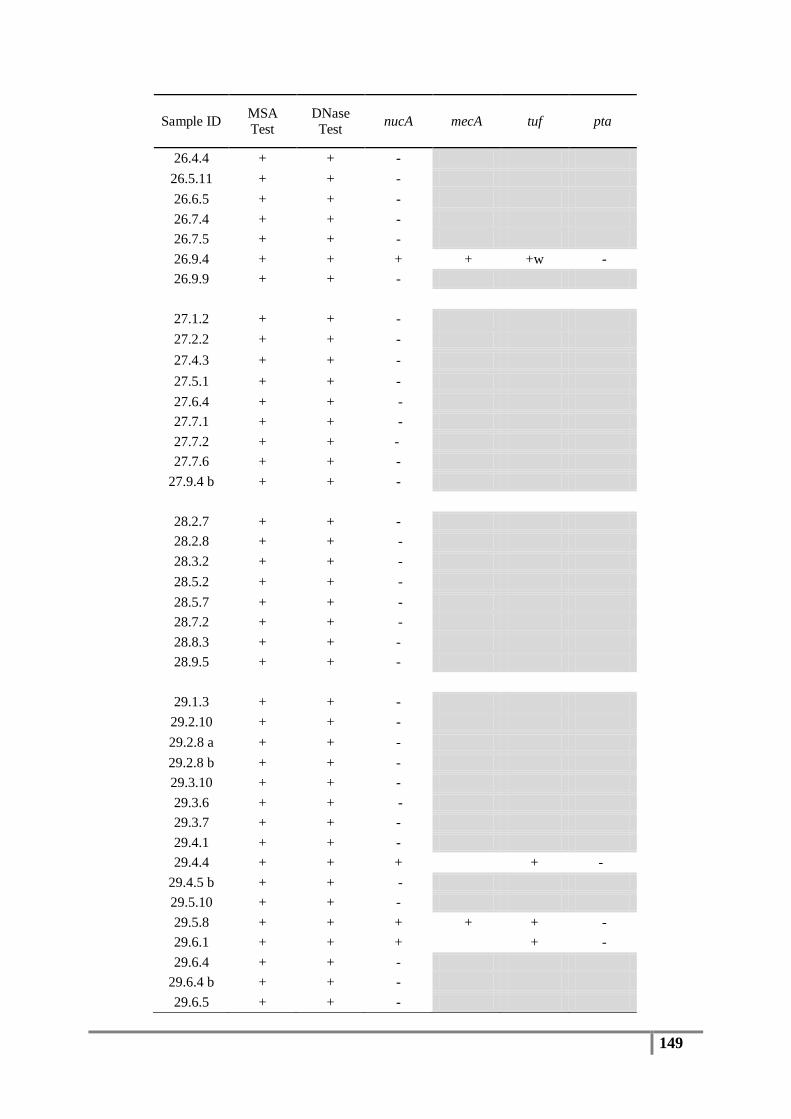
149
Sample ID MSA Test
DNase Test nucA mecA tuf pta
26.4.4 + + - 26.5.11 + + - 26.6.5 + + - 26.7.4 + + - 26.7.5 + + - 26.9.4 + + + + +w - 26.9.9 + + -
27.1.2 + + - 27.2.2 + + - 27.4.3 + + - 27.5.1 + + - 27.6.4 + + - 27.7.1 + + - 27.7.2 + + - 27.7.6 + + -
27.9.4 b + + -
28.2.7 + + - 28.2.8 + + - 28.3.2 + + - 28.5.2 + + - 28.5.7 + + - 28.7.2 + + - 28.8.3 + + - 28.9.5 + + -
29.1.3 + + - 29.2.10 + + - 29.2.8 a + + - 29.2.8 b + + - 29.3.10 + + - 29.3.6 + + - 29.3.7 + + - 29.4.1 + + - 29.4.4 + + + + -
29.4.5 b + + - 29.5.10 + + - 29.5.8 + + + + + - 29.6.1 + + + + - 29.6.4 + + -
29.6.4 b + + - 29.6.5 + + -
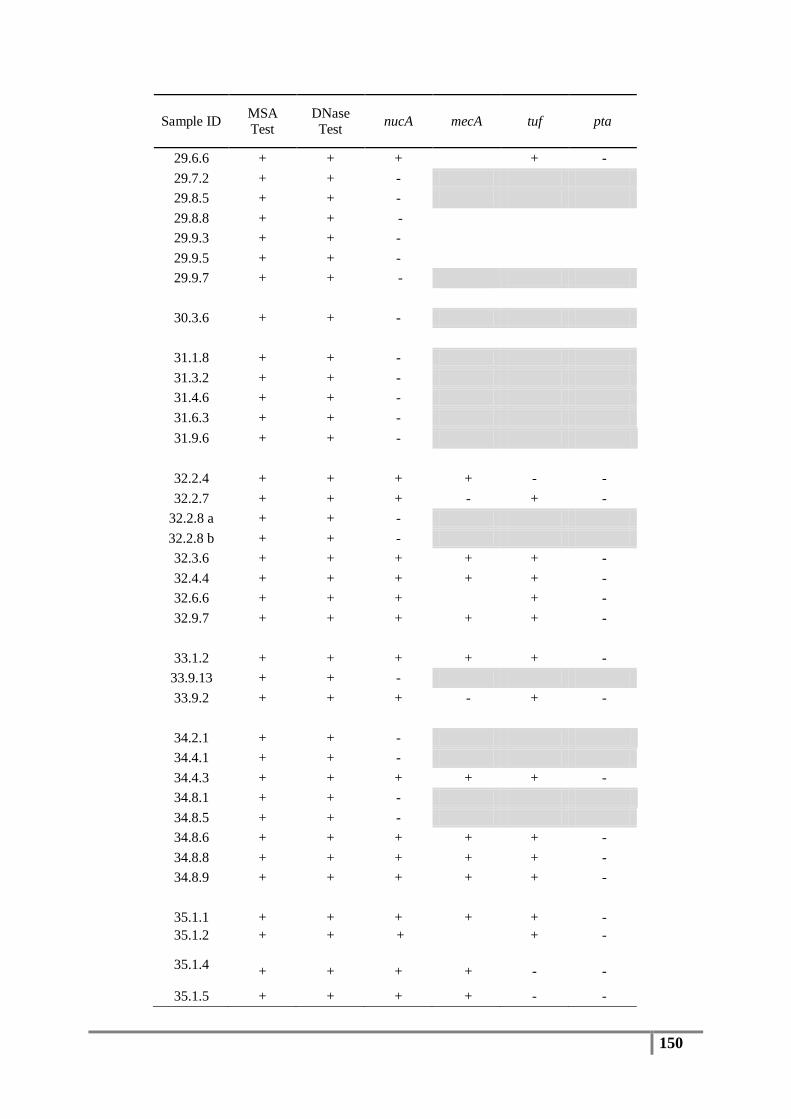
150
Sample ID MSA Test
DNase Test nucA mecA tuf pta
29.6.6 + + + + - 29.7.2 + + - 29.8.5 + + - 29.8.8 + + - 29.9.3 + + - 29.9.5 + + - 29.9.7 + + -
30.3.6 + + -
31.1.8 + + - 31.3.2 + + - 31.4.6 + + - 31.6.3 + + - 31.9.6 + + -
32.2.4 + + + + - - 32.2.7 + + + - + -
32.2.8 a + + - 32.2.8 b + + - 32.3.6 + + + + + - 32.4.4 + + + + + - 32.6.6 + + + + - 32.9.7 + + + + + -
33.1.2 + + + + + - 33.9.13 + + - 33.9.2 + + + - + -
34.2.1 + + - 34.4.1 + + - 34.4.3 + + + + + - 34.8.1 + + - 34.8.5 + + - 34.8.6 + + + + + - 34.8.8 + + + + + - 34.8.9 + + + + + -
35.1.1 + + + + + - 35.1.2 + + + + -
35.1.4 + + + + - -
35.1.5 + + + + - -

151
Sample ID MSA Test
DNase Test nucA mecA tuf pta
35.1.6 + + + + +w - 35.1.8 + + 35.3.1 + + + + + - 35.7.1 + + + + + - 35.7.2 + + + + + - 35.7.5 + + + + + - 35.9.2 + + - 35.9.3 + +
36.1.3 + + + + + - 36.3.2 + + + + + -
36.3.3 a + + + + + - 36.3.3 b + + + + + - 36.3.6 + + + - + - 36.3.8 + + + - + - 36.7.3 + + + + + - 36.8.2 + + - 36.8.4 + + + + + - 36.8.5 + + + + + - 36.8.6 + + + + + -
37.1.5 + + 37.5.11 + + + + + - 37.7.6 + + 37.8.11 + + + + + - 37.9.16 + + -
38.1.2 + + + + + - 38.1.3 + + + - + - 38.1.4 + + + + + - 38.1.5 + + + + + - 38.1.7 + + + + + - 38.3.3 + + + + + - 38.3.7 + + + + + - 38.3.8 + + + + + - 38.4.8 + + + + - - 38.5.10 + + + + + - 38.5.8 + + + + + - 38.5.9 + + + + + - 38.8.3 + + + + + - 38.8.5 + + + + + -
39.8.6 + + + + + -
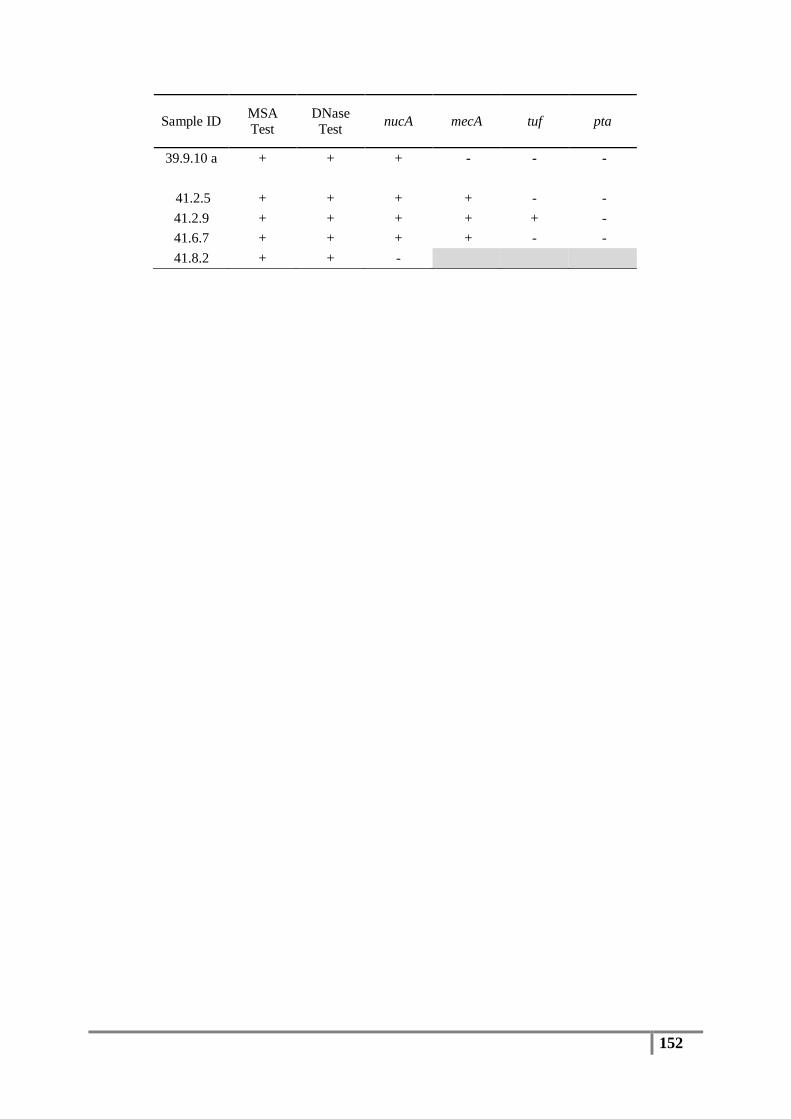
152
Sample ID MSA Test
DNase Test nucA mecA tuf pta
39.9.10 a + + + - - -
41.2.5 + + + + - - 41.2.9 + + + + + - 41.6.7 + + + + - - 41.8.2 + + -

153
Table VI: Results summery for sequenced isolates (tuf and 16SrRNA genes)
Sample ID
MSA Test
DNase Test
nucA gene
mecA gene tuf gene pta gene coa
gene tuf gene blast result 16SrDNA blast resluts
1.1.2 + + + + - - + S. succinus
1.1.5 + + + + - - + S. succinus
2.7.8 + + + + + - + S. capitis S. epidermidis
2.8.4 + + + + + - + S. capitis S. epidermidis
3.7.4 + + + + + + + S. condimenti S. carnosus
4.7.2 + + + + + - + S. caprae Macrococcus lamae
6.8.1 + + + + + - - S. capitis S. epidermidis
6.8.5 + + + + + - + S. caprae
7.1.1 + + + - + + - S. carnosus S. carnosus
7.1.7 + + + - + + - S. carnosus S. carnosus subsp. Carnosus
7.2.5 + + + - + + - S. condimenti S. carnosus subsp. carnosus
7.4.8 + + + - + + - S. condimenti S. carnosus subsp. carnosus
8.4.8 + + + + + - - Macrococcus caseolyticus Macrococcus lamae
8.6.3 + + + - - - - S. kloosii
8.7.6 + + + + + - - Macrococcus lamae
9.1.2 + + + - - - - Macrococcus lamae
9.8.5 + + + + + - + Macrococcus caseolyticus Macrococcus caseolyticus
10.4.7 + + + + + - - Macrococcus caseolyticus Macrococcus caseolyticus
12.7.3 + + + + + - - S. capitis S. epidermidis
12.8.1a + + + + - - S. succinus
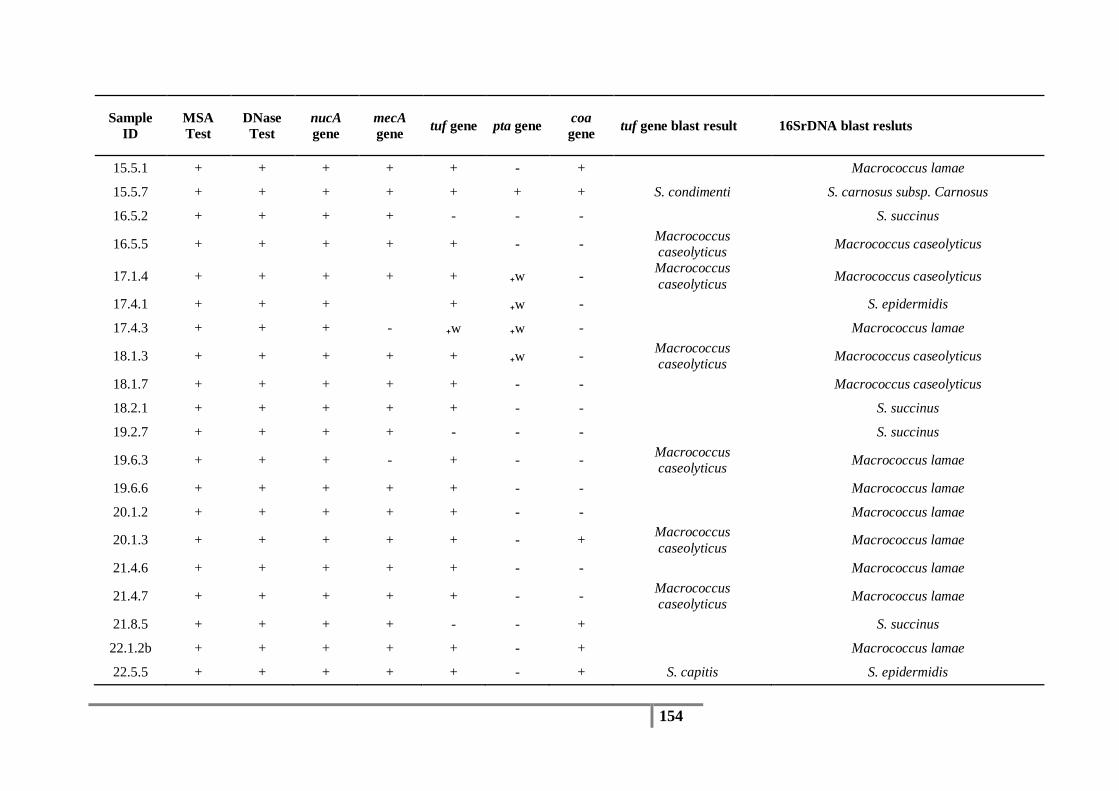
154
Sample ID
MSA Test
DNase Test
nucA gene
mecA gene tuf gene pta gene coa
gene tuf gene blast result 16SrDNA blast resluts
15.5.1 + + + + + - + Macrococcus lamae
15.5.7 + + + + + + + S. condimenti S. carnosus subsp. Carnosus
16.5.2 + + + + - - - S. succinus
16.5.5 + + + + + - - Macrococcus caseolyticus Macrococcus caseolyticus
17.1.4 + + + + + ₊w - Macrococcus caseolyticus Macrococcus caseolyticus
17.4.1 + + +
+ ₊w -
S. epidermidis
17.4.3 + + + - ₊w ₊w -
Macrococcus lamae
18.1.3 + + + + + ₊w - Macrococcus caseolyticus Macrococcus caseolyticus
18.1.7 + + + + + - - Macrococcus caseolyticus
18.2.1 + + + + + - - S. succinus
19.2.7 + + + + - - - S. succinus
19.6.3 + + + - + - - Macrococcus caseolyticus Macrococcus lamae
19.6.6 + + + + + - - Macrococcus lamae
20.1.2 + + + + + - - Macrococcus lamae
20.1.3 + + + + + - + Macrococcus caseolyticus Macrococcus lamae
21.4.6 + + + + + - - Macrococcus lamae
21.4.7 + + + + + - - Macrococcus caseolyticus Macrococcus lamae
21.8.5 + + + + - - + S. succinus
22.1.2b + + + + + - + Macrococcus lamae
22.5.5 + + + + + - + S. capitis S. epidermidis
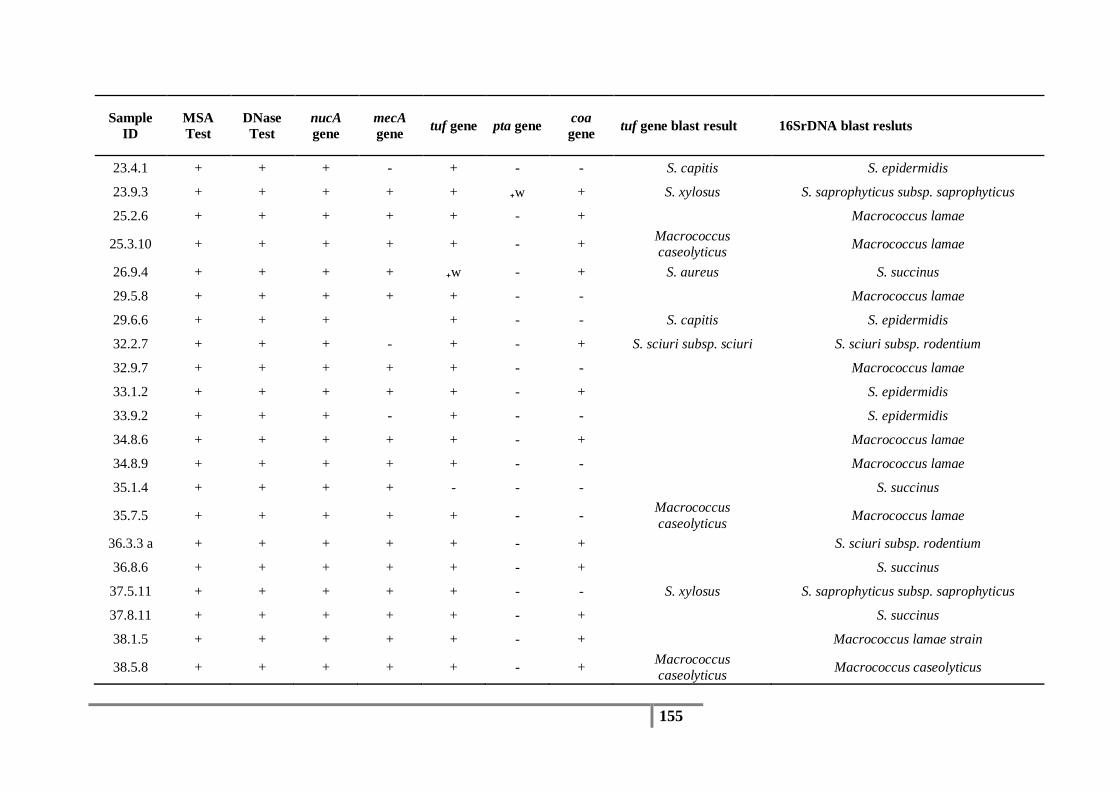
155
Sample ID
MSA Test
DNase Test
nucA gene
mecA gene tuf gene pta gene coa
gene tuf gene blast result 16SrDNA blast resluts
23.4.1 + + + - + - - S. capitis S. epidermidis
23.9.3 + + + + + ₊w + S. xylosus S. saprophyticus subsp. saprophyticus
25.2.6 + + + + + - + Macrococcus lamae
25.3.10 + + + + + - + Macrococcus caseolyticus Macrococcus lamae
26.9.4 + + + + ₊w - + S. aureus S. succinus
29.5.8 + + + + + - - Macrococcus lamae
29.6.6 + + + + - - S. capitis S. epidermidis
32.2.7 + + + - + - + S. sciuri subsp. sciuri S. sciuri subsp. rodentium
32.9.7 + + + + + - - Macrococcus lamae
33.1.2 + + + + + - + S. epidermidis
33.9.2 + + + - + - - S. epidermidis
34.8.6 + + + + + - + Macrococcus lamae
34.8.9 + + + + + - - Macrococcus lamae
35.1.4 + + + + - - - S. succinus
35.7.5 + + + + + - - Macrococcus caseolyticus Macrococcus lamae
36.3.3 a + + + + + - + S. sciuri subsp. rodentium
36.8.6 + + + + + - +
S. succinus
37.5.11 + + + + + - - S. xylosus S. saprophyticus subsp. saprophyticus
37.8.11 + + + + + - +
S. succinus
38.1.5 + + + + + - +
Macrococcus lamae strain
38.5.8 + + + + + - + Macrococcus caseolyticus Macrococcus caseolyticus

156
Sample ID
MSA Test
DNase Test
nucA gene
mecA gene tuf gene pta gene coa
gene tuf gene blast result 16SrDNA blast resluts
38.5.9 + + + + + - + Macrococcus caseolyticus
39.8.6 + + + + + - + Macrococcus caseolyticus Macrococcus lamae
39.9.10 a + + + - - - - S. succinus
41.2.5 + + + + - - + Micrococcus luteus
41.2.9 + + + + + - + Macrococcus caseolyticus Macrococcus lamae
41.6.7 + + + + - - + S. capitis S. succinus

157
Table VII: Biochemical characteristics of Staphylococcus species (Schleifer, 2009)
Species Name
Aer
obic
pr
oduc
tion
of a
cid
from
: Man
nito
l
Deo
xyrib
onuc
leas
e (D
Nas
e ag
ar )
Hea
t-sta
ble
nucl
ease
s
Clu
mpi
ng fa
ctor
Coa
gula
se
S. aureus subsp. aureus + + + + +
S. aureus subsp. anaerobius - + + - +
S. arlettae + - - - -
S. auricularis - w - - -
S. capitis subsp. capitis + w - - -
S. capitis subsp. urealyticus + ND - - -
S. caprae d + - - -
S. carnosus subsp. carnosus + w d - -
S. carnosus subsp. utilis - ND ND ND -
S. chromogenes d w w - -
S. cohnii subsp. cohnii d w - - -
S.cohnii subsp. urealyticus d w - - -
S. condimenti + ND ND ND -
S. delphini + w - - +
S. epidermidis - w w - -
S. equorum subsp. equorum + - - - -
S. equorum subsp. linens ND ND ND ND ND
S. felis d ND w - -
S. fleurettii ND ND - - -
S. gallinarum + ND - - -
S. haemolyticus d d - - -
S. hominis subsp. hominis - w - - -
S. hominis subsp. novobiosepticus - ND ND - -
S. hyicus - + + - d
S. intermedius (d) + + d +
S. kloosii + - - - -
S. lentus + ₊w ND - -
S. lugdunensis - ND - + -
S. lutrae ND w ND - +
S. muscae - ND - v -
S. nepalensis + ND - - -
S. pasteuri d - - - -

158
Species Name
Aer
obic
pr
oduc
tion
of a
cid
from
: Man
nito
l
Deo
xyrib
onuc
leas
e (D
Nas
e ag
ar )
Hea
t-sta
ble
nucl
ease
s
Clu
mpi
ng fa
ctor
Coa
gula
se
S. piscifermentans d ND ND ND -
S. pulvereri d ND ND - -
S. saccharolyticus - ND ND - - S. saprophyticus subsp.saprophyticus d - - - -
S. saprophyticus subsp. Bovis + ND - - -
S. schleiferi subsp. Schleiferi - ND + + -
S. schleiferi subsp. Coagulans d ND + - +
S. sciuri subsp. Sciuri + ₊w - - -
S. sciuri subsp. carnaticus + ND - dr -
S. scuri subsp. rodentium + ND - + -
S. simulans + w w - -
S. succinus subsp. succinus + ND ND ND ND
S. succinus subsp. casei + ND ND ND ND
S. vitulinus + ND - d -
S. warneri d d - - -
S. xylosus d w - - - Symbols: + 90% or more strains positive; – 90% or more strains negative; d 11–89% strains positive; ( ) delayed reaction; w weak reaction; –w negative to weak reaction; +w positive to weak reaction; ND not determined.

159
Table VIII: Summary of the general house information
ID House Type Flood Affected Age Wall/Floor Material
1 House Yes 8 Timber/ Carpet
2 House NO 100 Timber/ Carpet
3 House NO 13 Timber/ Carpet
4 House NO 18 Timber/ Timber
5 House NO 50 Timber/Timber r
6 House Yes 60 Timber/Timber
7 House Yes 40 Brick/Carpet
9 House Yes 60 Timber/Timber
10 Unit/Flat Yes 9 Brick/Timber /
11 Townhouse Yes 22 Brick/Tile
12 Townhouse Yes 20 Timber/Tile
13 House Yes 40 Timber/Timber
14 House Yes 40 Timber/Tile
15 House Yes 5 Brick/tile
16 House Yes 7 Brick/Tile
18 House Yes 2 Brick/Timber
19 House Yes 20 Brick/tile
20 House Yes 56 Timber/Timber
21 House Yes 30 Timber/Tile
22 House Yes 10 Timber/Timber
23 Townhouse Yes 12 Timber/Carpet
24 Unit/Flat Yes 40 Brick/Carpet
25 Unit/Flat NO 33 Brick/Tile
26 House Yes 52 Timber/Timber
27 Unit/Flat Yes 40 Brick/Tile
28 Unit/Flat NO 30 Brick/Carpet
29 Unit/Flat NO 10 Brick/Carpet
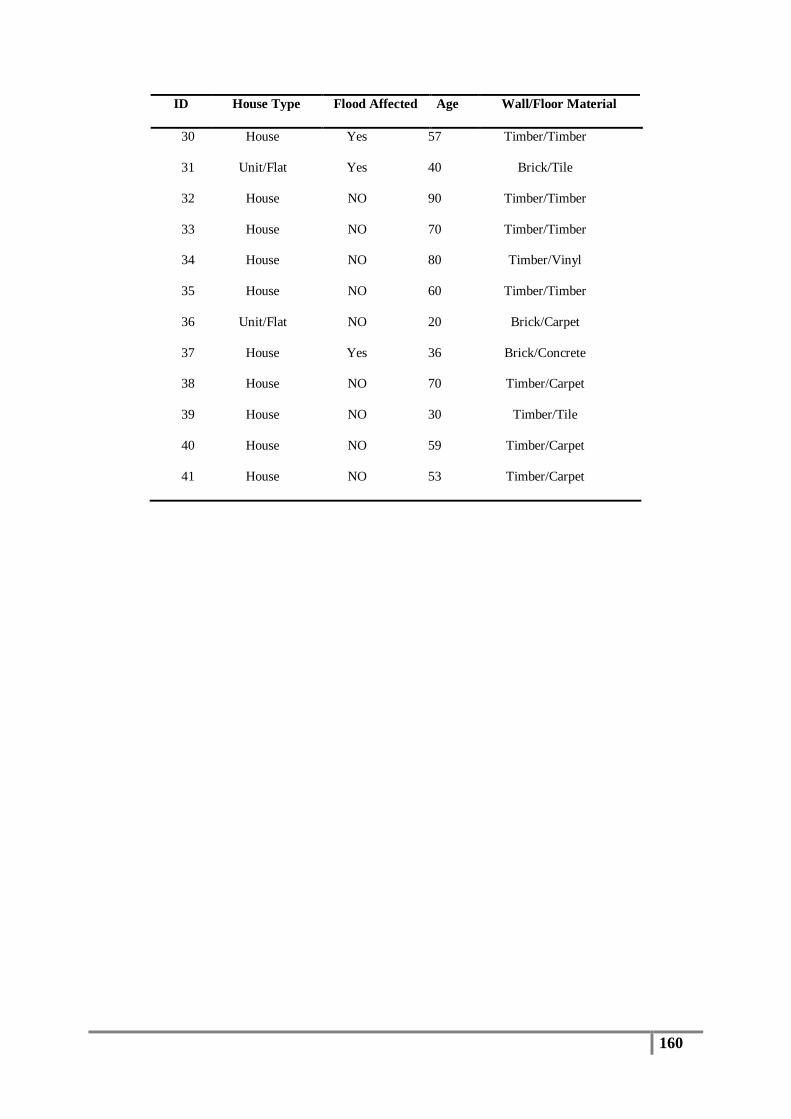
160
ID House Type Flood Affected Age Wall/Floor Material
30 House Yes 57 Timber/Timber
31 Unit/Flat Yes 40 Brick/Tile
32 House NO 90 Timber/Timber
33 House NO 70 Timber/Timber
34 House NO 80 Timber/Vinyl
35 House NO 60 Timber/Timber
36 Unit/Flat NO 20 Brick/Carpet
37 House Yes 36 Brick/Concrete
38 House NO 70 Timber/Carpet
39 House NO 30 Timber/Tile
40 House NO 59 Timber/Carpet
41 House NO 53 Timber/Carpet

161

162
Conference presentation of part of this study (10th International Healthy Buildings Conference 2012 in July 2012 held in Brisbane, QLD)
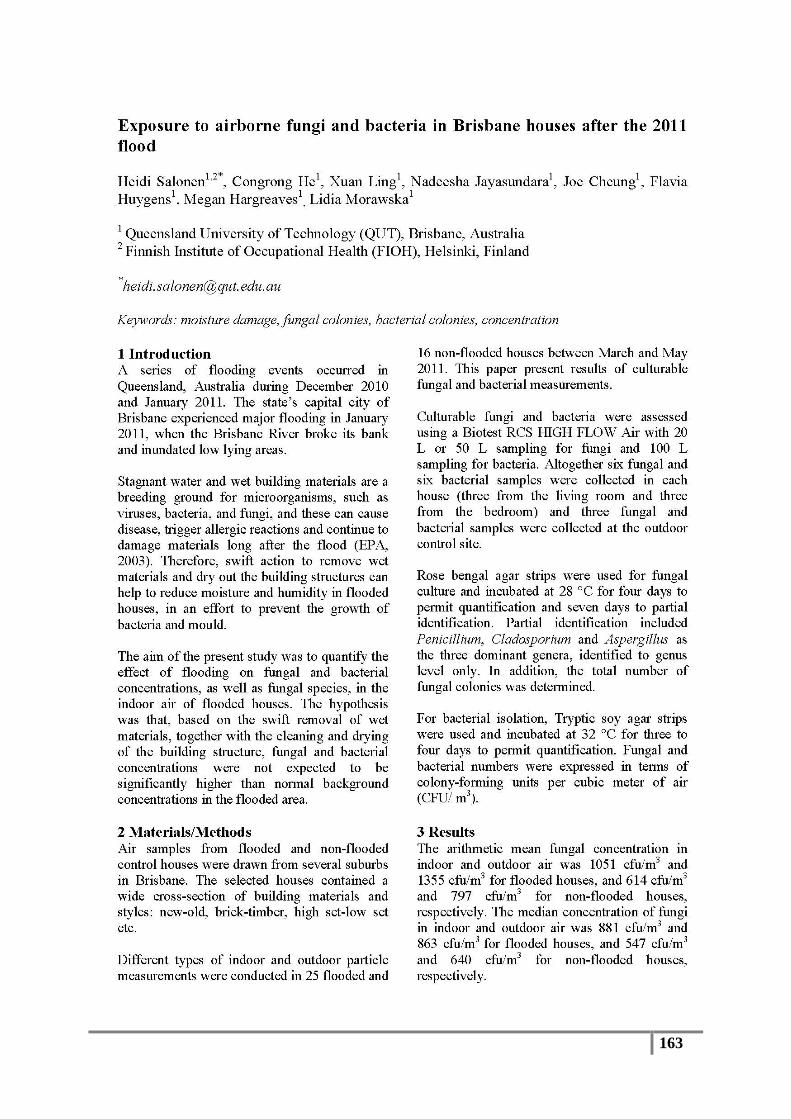
163

164