Embed Size (px)
Citation preview

Summary:This report describes changes made to the JSNA development process and provides a summary of new priorities emerging from key population highlights from reports, audits, briefings, chapter summaries and needs assessments as well as case studies from the Kent whole population cohort model.
The Kent Health and Wellbeing Board is asked to comment and endorse the following recommendations:
To adopt a broader consistent structure for outlining priorities for population health improvement, encompassing: primary prevention (lifestyle modification) for the whole population; secondary prevention (early diagnosis and treatment) for those at risk of LTCs e.g Cancer and Mental Health; and tertiary prevention (recovery, rehabilitation and reablement of patient with complex needs), ensuring better quality of care.
Greater investment from the STP delivery board and KCC is required on primary prevention services such as smoking cessation and weight management integrated directly into local care and acute care models of the Kent & Medway STP.
Emphasis should be placed on Making Every Contact Count for workforce planning and understand more in detail how frontline NHS and social care staff can incorporate key principles such as better identification of risky behaviour, brief advice and onward referrals for lifestyle modification.
Industrialise social prescribing from primary care and onward referral to district and other public-sector services such as Fire and Rescue safe and well visits, Warm Home interventions to tackle fuel poverty and other home improvements to reduce unintentional injuries such as slips trips and falls.
Industrialise the use of risk profiling tools in primary care to identify
From: Peter Oakford Cabinet Member for Strategic Commissioning and Public Health
Andrew Scott-Clark, Director of Public Health
To: Kent Health and Wellbeing Board
Date: March 2018
Subject: Kent Joint Strategic Needs Assessment Exceptions Report 2017/18
Classification: Unrestricted

patients at high risk of rehospitalization who may benefit from social prescribing. Improve existing tools by incorporating more information on social determinants of health, such as information on housing insulation and enable better governance arrangements to allow district officers and NHS clinicians to work together to access such tools.

1 Introduction
1.1 The Kent JSNA development process is undergoing significant changes in light of changing organisation and system priorities, particularly Kent & Medway STP. Several papers to the Kent Health & Wellbeing Board in the last few years have highlighted gaps and challenges to the current process and the need to incorporate more complex analytics and locally linked datasets for robust forward planning, not just examination of historical trend analyses on population need and health inequalities.
1.2 At the same time, capacity for the JSNA development has been trimmed down in light of current organisation restructures. Some of the regular JSNA outputs such as the three yearly JSNA overview report, the annual JSNA chapter summaries and the Health and Social Care maps will either be discontinued or reduced significantly.
1.3 A small JSNA programme management team based within Public Health has been tasked to prioritise and complete a limited number of JSNA related reports and analyses. For example, a set of infographics shown in Appendix A lists keys indicators and information of health and wellbeing data in a simple format, easily accessible for the general public, structured around the three main areas - Starting well, Living well & Ageing well. Further changes and improvements are expected for the next JSNA refresh in 18/19.
1.4 As part of the vision for developing a ‘JSNA plus’ to support forward planning and commissioning, a Kent whole population cohort model is being tested and co-designed with local stakeholders to determine how it can help towards future scenario planning.
1.5 As discussed at the March 2017 Kent HWBB, use of local datasets such as Kent Integrated Dataset (KID) has helped considerably towards such as advanced analytics and has given new insight on data quality improvement back to local providers. Examples include population segmentation analyses to identify cohorts with high spend and high needs, variation in health and social care provision, estimating average and total health and care costs and complex care evaluation of local services (such as Kent Fire & Rescue Safe and Well Visits) have already been carried out, stimulating local discussion and service planning priorities.
2 Notable analyses carried out / commissioned by Kent County Council Public Health
2.1 The following analyses and reports have been completed or commissioned by the Public Health team in the last year:
• Maternity needs assessment• Obesity in reception year – short briefing• Obesity in year 6 – short briefing• Inequalities in Obesity & Excess Weight in Childhood, NCMP:
Kent 2016/17 update

• Baseline data for Healthy Child Programme (years 0-4)• Hospital admissions for substance misuse in 15-24year olds• Starting Well: Summary of demography and health statistics in
children 0-19 years in Kent districts• Adult Lifestyle Weight Management• Health Checks Equity Audit• Pharmaceutical Needs assessment• Excess Winter Deaths• Smoking and Tobacco Control• Prevention and healthy behaviour change in families-
Stakeholder Voice Report by Activmob• The impact of socioeconomic deprivation on per capita health
and social care costs in Kent• Mental Health Needs assessment: Analytical report • Emotional and Mental Health Needs Assessment for Children
and Young People in Kent
2.2 System modelling projects done in Kent:
o Weight management model – a summary of work to model the impact of changes in demand for tier 3 and 4 weight management services (2016).
o Estimating health and care capacity for older people in NHS West Kent CCG (October 2016) – full report
o Modelling the development of adult health improvement services in Kent (October 2016) – project report and model user guide
o Kent & Medway Adult Mental Health Services capacity modeling (July 2016) – project report
o West Kent Adult Mental Health Services and the impact of New Primary Care (2017) – project report
o Encompass Anticipatory Care (Nov 2017) – model report and user guide
o Warm Homes (Feb 2018) – ‘using a simulation and modelling approach to inform local strategies for addressing fuel poverty’ report as part of an Open Data Institute funded project
2.2 Key highlights of these outputs are summarised in later sections of this report together with excerpts from the Kent & Medway Case for Change refresh in December 2017. Data described represent indicators changes in the last year unless stated otherwise.
3 Emerging Issues
3.1 Planned housing developments are expected to increase migration to Kent considerably. The greatest increases in housing are predicted in Dartford and Maidstone, a large proportion will be to the new town in Ebbsfleet. This growth will place pressure on health and social care services, particularly maternity and children’s services. Latest population projections using housing-led forecasts estimate Kent’s population to grow by 99,600 (6.3% increase) from 2018 to 2023. This projection is an increase compared to previous year.

3.2 Older people are the fastest growing group of people; from 2018 to 2023 Kent’s population aged 65 years and over is estimated to grow at a faster rate (11.4%) compared to those aged less than 65 years (5.0%), which represents an increase from last year’s projection. This is an age group with a high rate of limiting long-term illness and high service utilisation compared to other age groups, particularly hospital admissions and use of community services.
3.3 In 2016 the biggest causes of death to Kent residents were from long-term conditions, many of which are preventable: cancer (28.4%), circulatory (24.8%) and respiratory (14.1%). Combined, they equated to 67.3% of all Kent resident deaths. There are an estimated 163,500 (12.9%) people across Kent and Medway aged over 16 who have a treatable common mental illness (depression and/or anxiety). People living in the most deprived areas are disproportionately affected. Suicide rates in Kent are significantly higher than the national average 2014-16 (11.6 vs 9.9/100 000).
3.4 Alcohol and/or substance misuse commonly occurs together. In Kent there are more people in contact with mental health services when they access services for drug or alcohol misuse than on average in England. An analysis of Kent primary care data suggest that is most commonly younger adults (<35 years) in the most deprived communities that are reported by their GP as excess drinker and having a serious mental illness.
3.5 Perinatal mental illness affects up to 20% of women and rates of maternal deaths from psychiatric causes have been increasing for several years. The population of women of child bearing age in Kent has been rising and is estimated to increase further; however, currently there are insufficient data collection systems in place to capture local data on perinatal mental health.
3.6 National estimates derived from surveys conducted in 2014 indicate that around 10% of children aged 5-16 years in Kent are believed to have a diagnosable emotional or behavioural mental health condition, a percentage which is estimated to have increased since. There also appears to be a short fall in access to and utilisation of services for mild to moderate mental health needs in Kent. The number of deaths by suicide amongst children and young people under 18 is significantly lower than that of adults and has remained stable from 2006-2016. In 2017 however, there was a stepped increase in deaths by suicide.
3.7 In Kent 13.8% of women respectively smoked during pregnancy 2016/17, and increase from 13.0% in 2015/16 and significantly higher than the national average of 10.7%. Over half of all expecting mothers in Kent are overweight or obese, which can complicate pregnancy, labour and delivery. In addition, 38% of pregnant women (38%) have at least one long term conditions, 21% have mental health conditions and 15% respiratory conditions. Studies have shown that such mothers are also more likely to have overweight or obese adolescent offspring.

Figure 1 shows the percentage of obese or overweight women, measured 12 months prior to pregnancy
3.8 In many areas of Kent significantly more children are overweight or obese compared with England overall and in almost half of all districts the number of children living in poverty is higher than the national average. Also of concern is that the number of hospital admissions substance misuse in 15-24-year olds is 13% higher in Kent than the national benchmark.
3.9 There are challenges in maintaining and recruiting workforce to general practice; half of the CCGs in Kent have low numbers of GPs and practice nurses compared to the national average, with particularly low levels of GPs and practice nurses in Thanet and Swale, a shortage which results in long waiting times, later identification of disease and inadequate monitoring of chronic conditions. These lead to low patient satisfaction and increased hospital admissions.
3.10 In hospital trusts across Kent and Medway many specialities fail to meet 90% of national standards (see Figure 2). Stroke services fail to meet 67% of standards across every trust in Kent and Medway. Cancer services are also facing issues; the percentage of cancers detected at an early stage is generally lower in Kent and Medway resulting in 1-year survival rates significantly lower than the national average in Medway, Swale and Thanet.

Figure 2 Source ‘Kent and Medway Case for Change’

0% 10% 20% 30% 40% 50% 60% 70% 80% 90% 100%
No other LTC 1 other LTC 2 other LTCs 3 other LTCs 4 other LTCs5+ other LTCs
Percentage of stroke patients in Kent who also have another LTC
0 10 20 30 40 50 60 70 80 90 100
Learning disabilityCancer
Mental HealthRheumatoid Arthritis
EpilepsyHeartfailure
Peripheral Arterial DiseaseOsteoporosis
DementiaCOPD
Asthma Coronary Heart Disease
DepressionChronic Kidney Disease
Atrial FibrillationDiabetes
ObesityHypertension
Percentage of stroke patients with other LTC
Othe
r LTC
3.11 Over 3,000 people are treated in Kent and Medway for a stroke every year at six acute hospitals, however these are not operated by specialist staff 24 hrs a day, seven days a week as evidence for best practice suggests. Therefore, plans for an addition of three hyper acute stroke units’ to existing ‘acute’ stroke units in Kent and Medway have been developed. Across Kent the overall prevalence of stroke is higher as are recorded prevalence of risk factors for stroke- atrial fibrillation and hypertension- in comparison to England in 2015 to 2016, indicating the need for further investment and integrating services for prevention. The vast majority of stroke patients in Kent have another underlying LTC such as obesity and diabetes (Figure 3). The extent and impact multi-morbidity on stroke management needs to be considered when redesigning services.
Figure 3 Distribution of underlying co-morbidities for Stroke patients in Kent (n=14,523) Data from Kent Public Health Observatory, LTC= Long-term condition
3.12 There are key equity issues associated with access to the NHS Health Checks Programme in Kent. Several population groups are less likely to complete a Health Check including males, mixed/multiple ethnic groups and less affluent groups. Access issues to the Health Checks programme might be improved for people who have the most to benefit from cardiovascular preventive action.
3.13 A study was conducted to establish the impact of deprivation on per capita health and care service utilisation costs using KID. It showed that in over 50-year olds, after adjusting for age and gender, those living in the most deprived quintile areas in Kent had annual per capita healthcare costs that were £437 higher than those in the least deprived quintile areas, (95% CI: £399 - £474). The difference is mostly due to the increased morbidity in deprived populations, and could be mitigated through action to prevent the onset of ill-health in these groups. These findings suggest that reducing health inequalities would substantially reduce costs on the NHS and social care.
4 Stakeholder Insight
4.1 Activmobs was commissioned by KCC Public Health to carry out an in-depth study on lay public views to understand factors influencing lifestyle behaviours.
4.2 Interviews with families were carried out in areas with high levels of deprivation and / or health inequalities (Thanet, Maidstone and DGS CCG areas). Forty-nine families (131 respondents) shared their experiences and views on the health and wellbeing of their family and what impacts on adopting positive lifestyles and stopping negative ones, their perception of what is healthy, how they could improve their overall health, wellbeing and happiness, their priorities and what changes they and their family might like to make in the future.
4.3 Key themes emerging to date included perceptions on life style behaviours impacting on health including smoking, drinking, diet and exercise and views on the support provided by the wider system (health and local government) (See Appendix B). These emerging themes indicate the strong need for a ‘whole system thinking’ approach to change the environment around families to empower them to adopt a healthy life style. Engagement with families across the system needs to be consistently supportive and constructive. Recommendations to improve interactions and ensure effective frontline staff engagement with patients and clients, particularly addressing sensitive issues confidently and identification of missed opportunities for positive intervention and support.
5 JSNA population cohort model
5.1 The JSNA Cohort Model uses ‘Systems Dynamics’ a well-established research methodology that uses a ‘Stock Flow’ approach to model impact of key policy and service capacity changes. Two linked prototype

cohort models (Adult and Children & Young People (CYP)) have been developed to predict future heath and care needs for the Kent population, and to test the potential impact of ‘what if’ scenarios focusing on additional investment on prevention. It seeks to integrate and synthesise best estimates from a variety of sources to reliably estimate the extent to which a range of factors, acting in combination, explain or predict certain health outcomes. Key model outputs include projected incidence, prevalence of long term conditions as well as population cohorts relevant for the Kent & Medway STP. It uses epidemiological information to estimate the impacts of changes in population-level risk factors and changes in the uptake of prevention interventions on the level of transition between cohorts. The outputs from the model include cohort incidence, prevalence, mortality and resource use. The model is split into two sections, children and young people (under 18 years, or under 25 years for selected conditions) and adults (18 years and over). Several case examples are shown in Appendix C Within the CYP model, ‘Adverse Child Experience’ (ACE), which describes vulnerable children by including significant social factors has been incorporated into a dynamic approach to population segmentation
5.2 The above work has resulted in the setting up of a ‘Community of Practice’ or peer support group, funded by the Health Foundation, to develop local skills and competencies among senior analysts and commissioners around the use of modelling and simulation methods for capacity planning and service demand modelling. The project is expected to last for 18 months or longer and will engage local organisations among the Kent & Medway STP. A number of modelling projects are expected to be initiated to support and influence STP priorities and decision making as well as contribute to the JSNA development process in general.
6 Recommendations
6.1 The Kent Health and Wellbeing Board is asked to comment and endorse the following recommendations:
6.2 To adopt a broader consistent structure for outlining priorities for population health improvement, encompassing: primary prevention (lifestyle modification) for the whole population; secondary prevention (early diagnosis and treatment) for those at risk of LTCs eg: Cancer and Mental Health; and tertiary prevention (recovery, rehabilitation and reablement of patient with complex needs), ensuring better quality of care.
6.3 Greater investment is required on prevention services such as smoking cessation and weight management integrated directly into local care and acute care model of the Kent & Medway STP.
6.4 Emphasis should be placed on Making Every Contact Count for workforce planning and understand more in detail how frontline NHS and social care staff can incorporate key principles such as better

identification of risky behaviour, brief advice and onward referrals for lifestyle modification.
6.5 Industrialise social prescribing from primary care and onward referral to district and other public-sector services Fire and Rescue safe and well visits, Warm Home interventions to tackle fuel poverty and other home improvements to reduce unintentional injuries such as slips trips and falls.
6.6 Industrialise the use of risk profiling tools in primary care to identify patients at high risk of rehospitalization who may benefit from social prescribing. Improve existing tools by incorporating more information on social determinants of health, such as information on housing insulation and enable better governance arrangements to allow district officers and NHS clinicians to work together to access such tools.
7 Contact DetailsReport Author:
Dr Abraham GeorgeConsultant in Public [email protected]
Relevant Director:Andrew Scott-ClarkDirector of Public [email protected]

APPENDICES
Appendix A: Infographics


Appendix B: Key emerging themes from stake holder interviews
• Alcohol the new ‘crutch’ for dealing with stress but not discussed openly • Smoking the behaviour to stop with clear understanding of why • Exercise/ healthy eating and weight are behaviours families feel they need to do
something about but struggle with low commitment and lack of awareness of what to do ‘what is enough’
• Wellbeing (including relationships, children having friends and being happy) top priority for families ‘at all costs’.
• Families said the ‘system’ is bad at engaging with families on their health and wellbeing: Experiences include feeling judged, many missed opportunities, feeling let down and fearful.

Appendix C: JSNA Cohort model -case studies
Kent County Council JSNA – cohort model insight1
Case study 1: Stroke The questionThe development of effective and efficient stroke services for the population of Kent is the subject of current consultation and business case development across Kent. We have therefore used the JSNA cohort model to ask the following question:What levels of need is likely for stroke services over the medium to long term (10-20yrs) for the Kent population?The cohort model includes the following information, derived from the KID, with respect to the prevalence of the population who will have experienced a stroke in any one year:
It has a separate cohort for stroke incidence for people who have no other health or care needs, as defined in the cohort model segmentation approach, which in 2017 is estimated at 8,800;
There are a further 13,250 people who have a stroke alongside another long-term condition and 3,600 who are also frail, making a total of 25,600;
Expected stroke prevalence in 2017 using QoF is 27,400.The needs of these three different groups within the overall stroke cohort will differ significantly. This initial report focusses on the former as an illustration of the potential to use the cohort model to inform future plans for Stroke services.
The outputs from the modelThe model has been used to develop three scenarios for the prevalence of stroke as a single condition cohort (i.e. a sub-set of the whole stroke prevalence). The number of attendances to A&E from this cohort (for all reasons) has also been derived from the model, which in this case is informed by KID analysis for the cohort in question and their risk of attending A&E in any one year. The single condition stroke prevalence over the period 2017 to 2037 has been modelled for:
Demographic change only, applying risk factors for incidence and use of A&E as at 2017;
Demographic change plus trends in underlying risk factors, in this case the fact that changes in levels of smoking, physical inactivity, blood pressure, cholesterol and BMI within the population are all changing;
An additional reduction in the percentage of untreated hypertension (currently estimated at 50%) by 30% between 2018 and 2024.
We have not made any assumptions about changes in the rate of access to services by the cohort in question, only the factors that change the size of the cohort. Changes in access to
1 The cohort model was commissioned by the Kent Health & Wellbeing Board to complement existing JSNA reporting through the development of a single ‘whole-population’, prospective perspective on understanding and addressing the health and care needs of the local population. It has been informed by the Kent Integrated Dataset (KID) and other national studies of incidence, prevalence and mortality and has been build using System Dynamics software. The model can be accessed from the KCC JSNA home page (link).

services would represent a change in the service model, which would be modelled over a shorter term with more detail reflecting service pathways. The result is shown in Figure 1.
Figure 1The prevalence of the single condition stroke cohort under the scenarios described above
Exporting the data for cohort size, and for one example of service access, i.e. A&E attendances, shows the scale of the impact of changes in underlying risk factors, as shown in Figure 2. The difference, over 20 years, between a 38% and an 8% increase for the single condition stroke cohort is striking, and is reflected in changes in rates of A&E attendance.
Figure 2 Changes in cohort size and attendances at A&E
A further scenario, this time based on levels of unscheduled admissions for the single condition stroke cohort, identifies changes over the period 2017 to 2037 of 36%, 13% and -1% respectively, with the latter figure reflecting improvements in all the five underlying risk factors.
Insights & further considerationsThe cohort model clearly demonstrates the potential variation in needs for the single condition stroke cohort, and its sensitivity toward underlying risk factors in the population. It therefore has the potential to inform decisions about both risk reduction strategies and future capacity planning for the health sector. A similar application to the other stroke cohorts can be developed to consider the overall future needs for the cohort of people who have
experienced a stroke, taking account of the different levels of risk due to comorbidities. To inform the future capacity requirements relating specifically to stroke then further analysis would be required to derive stroke-specific activity from the KID.
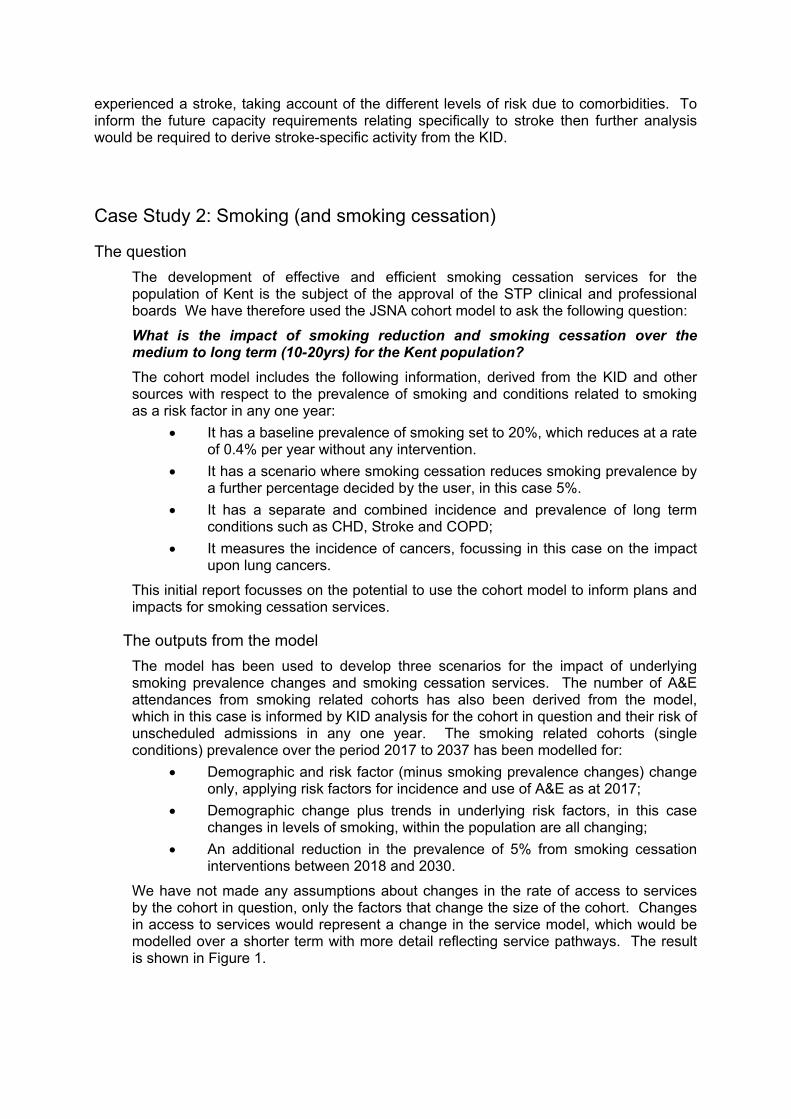
Case Study 2: Smoking (and smoking cessation)
The questionThe development of effective and efficient smoking cessation services for the population of Kent is the subject of the approval of the STP clinical and professional boards We have therefore used the JSNA cohort model to ask the following question:What is the impact of smoking reduction and smoking cessation over the medium to long term (10-20yrs) for the Kent population?The cohort model includes the following information, derived from the KID and other sources with respect to the prevalence of smoking and conditions related to smoking as a risk factor in any one year:
It has a baseline prevalence of smoking set to 20%, which reduces at a rate of 0.4% per year without any intervention.
It has a scenario where smoking cessation reduces smoking prevalence by a further percentage decided by the user, in this case 5%.
It has a separate and combined incidence and prevalence of long term conditions such as CHD, Stroke and COPD;
It measures the incidence of cancers, focussing in this case on the impact upon lung cancers.
This initial report focusses on the potential to use the cohort model to inform plans and impacts for smoking cessation services.
The outputs from the modelThe model has been used to develop three scenarios for the impact of underlying smoking prevalence changes and smoking cessation services. The number of A&E attendances from smoking related cohorts has also been derived from the model, which in this case is informed by KID analysis for the cohort in question and their risk of unscheduled admissions in any one year. The smoking related cohorts (single conditions) prevalence over the period 2017 to 2037 has been modelled for:
Demographic and risk factor (minus smoking prevalence changes) change only, applying risk factors for incidence and use of A&E as at 2017;
Demographic change plus trends in underlying risk factors, in this case changes in levels of smoking, within the population are all changing;
An additional reduction in the prevalence of 5% from smoking cessation interventions between 2018 and 2030.
We have not made any assumptions about changes in the rate of access to services by the cohort in question, only the factors that change the size of the cohort. Changes in access to services would represent a change in the service model, which would be modelled over a shorter term with more detail reflecting service pathways. The result is shown in Figure 1.
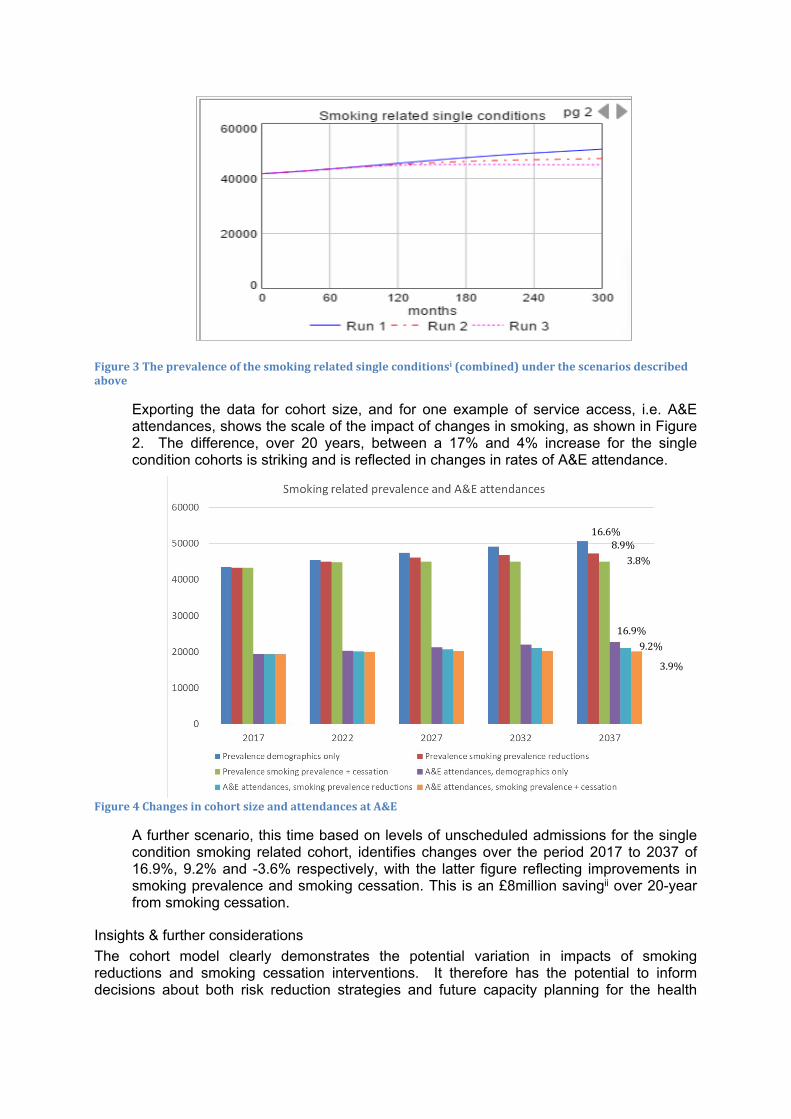
Figure 3 The prevalence of the smoking related single conditionsi (combined) under the scenarios described above
Exporting the data for cohort size, and for one example of service access, i.e. A&E attendances, shows the scale of the impact of changes in smoking, as shown in Figure 2. The difference, over 20 years, between a 17% and 4% increase for the single condition cohorts is striking and is reflected in changes in rates of A&E attendance.
Figure 4 Changes in cohort size and attendances at A&E
A further scenario, this time based on levels of unscheduled admissions for the single condition smoking related cohort, identifies changes over the period 2017 to 2037 of 16.9%, 9.2% and -3.6% respectively, with the latter figure reflecting improvements in smoking prevalence and smoking cessation. This is an £8million savingii over 20-year from smoking cessation.
Insights & further considerationsThe cohort model clearly demonstrates the potential variation in impacts of smoking reductions and smoking cessation interventions. It therefore has the potential to inform decisions about both risk reduction strategies and future capacity planning for the health
16.9%9.2%
3.9%
16.6%8.9%
3.8%

sector. A similar application to the other health and care service contacts can be developed to consider the overall future impacts of smoking
i Single conditions = CHD, COPD and Stroke
ii Average cost of admission = £1500.
Case study 3: Fuel Poverty
The questionThe impact of fuel poverty upon health outcomes and health and care activity rates is of interest across Kent. We have therefore used the JSNA cohort model to ask the following question:What are the health impacts of reversing fuel poverty upon the health of children and older people and their utilisation of hospital services (e.g. emergency admissions) over the medium to long term (10-20yrs) for the Kent population?The cohort model includes the following information, derived from the KID and other sources, with respect to the prevalence of the population who will have experienced a health problem relative to fuel poverty in any one year:
It has a baseline prevalence of fuel povertyii of 17% for children under 17 years and 14% for people aged 65 years and over, which is above the Kent average of households which stands at c.10%;
It includes a scenario where fuel poverty is reduced by 50% for both children and older people;
The incidence and prevalence of conditions relative to fuel poverty and the impact of reversing the effects of fuel poverty on the progression of these conditions;
The impacts upon health and care contacts for cause specific admissions, particularly respiratory related emergency admissions;
Seasonal variations in mortality for the Kent population. This initial report focusses on illustrating of the potential to use the cohort model to inform policies to ameliorate fuel poverty in Kent.
The outputs from the modelThe model has been used to develop three scenarios for the impact of fuel poverty for children and adults. The number of unscheduled admissions for respiratory conditions (for all reasons) has also been derived from the model, which in this case is informed by KID analysis for each cohort and the risk of unscheduled admissions relative to fuel poverty in any one year. The impact of fuel poverty over the period 2017 to 2037 has been modelled for:
Demographic change plus trends in underlying risk factors, in this case the fact that levels of smoking, physical inactivity, blood pressure, cholesterol and BMI within the population are all changing;
An additional reduction in the percentage fuel poverty for children (currently estimated at 17%) by 50% between 2018 and 2024;
An additional reduction in the percentage fuel poverty for older people (currently estimated at 14%) by 50% between 2018 and 2024.
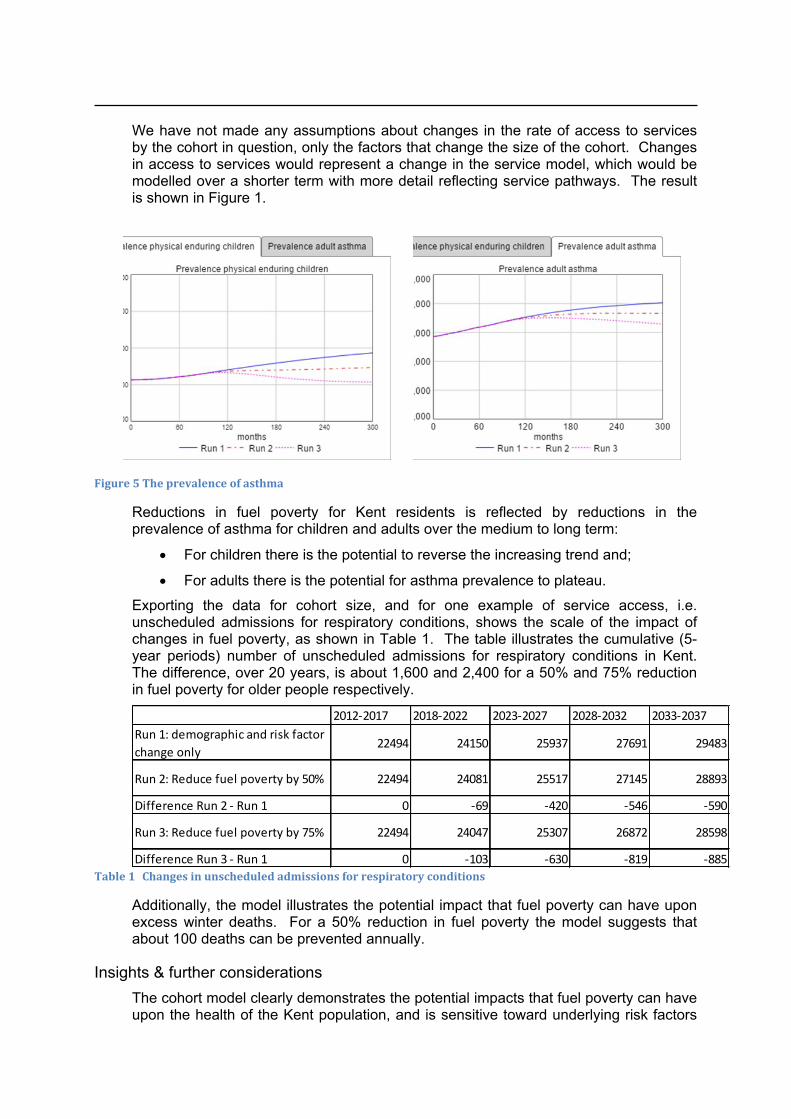
We have not made any assumptions about changes in the rate of access to services by the cohort in question, only the factors that change the size of the cohort. Changes in access to services would represent a change in the service model, which would be modelled over a shorter term with more detail reflecting service pathways. The result is shown in Figure 1.
Figure 5 The prevalence of asthma
Reductions in fuel poverty for Kent residents is reflected by reductions in the prevalence of asthma for children and adults over the medium to long term:
For children there is the potential to reverse the increasing trend and;
For adults there is the potential for asthma prevalence to plateau.Exporting the data for cohort size, and for one example of service access, i.e. unscheduled admissions for respiratory conditions, shows the scale of the impact of changes in fuel poverty, as shown in Table 1. The table illustrates the cumulative (5-year periods) number of unscheduled admissions for respiratory conditions in Kent. The difference, over 20 years, is about 1,600 and 2,400 for a 50% and 75% reduction in fuel poverty for older people respectively.
2012-2017 2018-2022 2023-2027 2028-2032 2033-2037Run 1: demographic and risk factor change only
22494 24150 25937 27691 29483
Run 2: Reduce fuel poverty by 50% 22494 24081 25517 27145 28893
Difference Run 2 - Run 1 0 -69 -420 -546 -590
Run 3: Reduce fuel poverty by 75% 22494 24047 25307 26872 28598
Difference Run 3 - Run 1 0 -103 -630 -819 -885Table 1 Changes in unscheduled admissions for respiratory conditions
Additionally, the model illustrates the potential impact that fuel poverty can have upon excess winter deaths. For a 50% reduction in fuel poverty the model suggests that about 100 deaths can be prevented annually.
Insights & further considerationsThe cohort model clearly demonstrates the potential impacts that fuel poverty can have upon the health of the Kent population, and is sensitive toward underlying risk factors

in the population. It therefore has the potential to inform decisions about both risk reduction strategies and future capacity planning for the health sector. A similar application to include further fuel poverty impacts can be developed to consider the overall future impact of fuel and other poverty measures. Similarly, further model outputs can help illustrate which cohorts should be targeted for fuel poverty interventions.