Embed Size (px)
Citation preview
AND PETROLEUM PRODUCTION
~9................................. sao,agA Uo!SaaAUOD pug S*!UYI ’saauaaajalI ’sUoI]g!AaaqqV
09 .............................................. k6-966t s.toanpo.tdl tunoio.ilOcI pus [e.~OU!l< I~dpu,~.tcIg
~......so.tv luotuu.toaoD ieao~I Aq ~t~no[o.tlod pu~ sls.tou,~lpV jo onieA pus Al~luen~3 ~
~> ............................................... so!a!pomtuoD .to{~IA[ po~aoiog jo onleA pu~. ~il!lu~n~g
99....................................................... mnolo.~lOd pu~ SlSaOu,~I~ jo onI~A pu~. Xl!lu~n{3[
{[......................... ~.*lsnpuI ~u,*u!~ oR1 ~u!laojjV s.tola~.d l~a~.l~,[OcI pu~ [~!aog
9 ............................................ ~.~lsnpuI ~u,~u!!N otI1 ~u!l,oojjV s.tola~I a!tuouoaE
~.......................... ituouoai~ u~!ie.~lsnV pu~. u~!i~.~lsnv u.~olSOA~ oql jo axo.~ao}I
~NIIiIIaINIORIANIR ~IVIDOS (INIV.[
(I~IOPA.~IIIO~I
LI T OF FIGUR
Figures
1.2
1.3
1.4
2.1
2.2
2.3
2.4
2.5
2.6
2,7
2.8
2.9
2.10
2.11
2.12
2.13
2.14
2.15
2.16
2.17
2.18
2.19
2.20
2.21
2.22
2.23
2.24
2.25
2.26
2.27
4.1
4.2
4.3
0.1
0,2
Page
Exchange Rate: AS/YEN .................................................................................5
Exchange Rate: A$/$US ..................................................................................5
Local Government Boundaries (map) ........................................................18
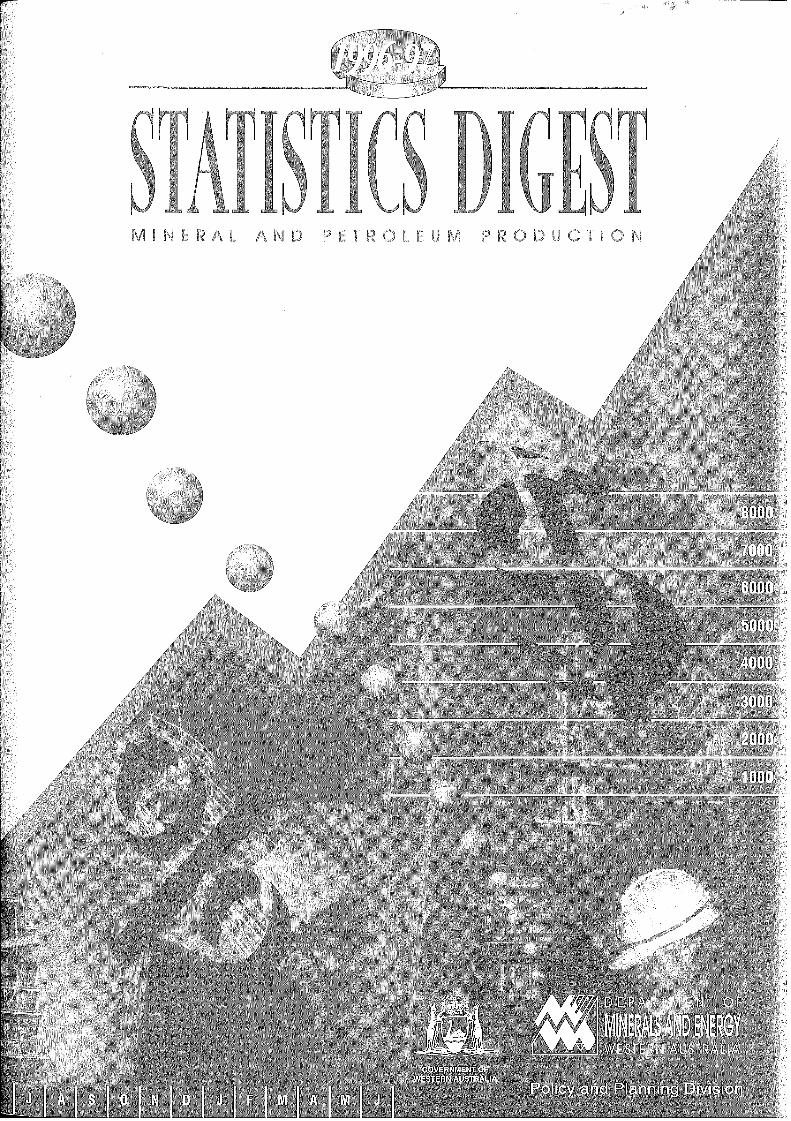
Major Mineral and Petroleum Projects in Western Australia ...................19
Petroleum Exports .........................................................................................21
Oil and Condensate: Quarterly Production & Value .................................21
Crude Oil and Condensate Production .......................................................21
Crude Oil Price ..............................................................................................22
Gold Quarterly Production & Value ............................................................23
Gold Production ............................................................................................24
Gold Exports ..................................................................................................24
Gold Price .....................................................................................................25
Cumulative Gold Production ........................................................................25
Iron Ore Quarterly Production & Value .....................................................27
Iron Ore Price ................................................................................................27
Iron Ore Production ......................................................................................28
Iron Ore Exports ............................................................................................28
Alumina Quarterly Production & Value ......................................................30
Alumina Production ......................................................................................30
Alumina Exports ............................................................................................31
Alumina Price .................................................................................................31
Nickel Quarterly Production & Value .........................................................32
Nickel Price ....................................................................................................33
Nickel Production ..............................................................~ ...........................33
Nickel Exports ................................................................................................33
Heavy Mineral Sand Exports ........................................................................36
Heavy Mineral Sands Price Index ................................................................36
Ilmenite Quarterly Production & Value ......................................................36
IlInenite Production .......................................................................................37
Selected WA Mineral Commodities Relative to World Production ..........41
Estimates of Mineral & Petroleum Value of Production to Year 2000-01., 41
Value of WA Mineral and Petroleum Exports ............................................45
WA Merchandise Exports 1996-97 ...............................................................45
WA Merchandise Exports : Destination 1996-97 ........................................45
Comparative Value of Production - 1991-92 and 1996-97 ......................50
Comparative Royalty Receipts - 1991-92 and 1996 - 97 ...........................57
Department of Minerals and Energy
.~aX aa!gsaaans puoaas aql aoj
alms ~u!anpoad i!o lsa~a~I s,g!i~algnvs~ gnl~!g gl! pau!~laa s~q’XI~tg%*dans 1oN "UO!lanpoad X~aaua pu~ Faa .trgu jo anna s,al~lg
aaom sluasaadaa axou aolaas aq& u~aX ~ u.~ lanpoad jo uo!ii.,m 000’gSVU~q!
aaom aanpoad o! Xa!snptq lga!j g,al~!g aql a! ap~m g~q aolaas mnaloalad
a~ans panm.luoa aqa; ’a!~guaptloa pu~ s~ ’i!o aoj 1as spaoaaa uo!lanpoad
q!.~a~’k6/9661 u! palq~!Iq~!q m.~ s~at mnaloalad jo aaumaodm!
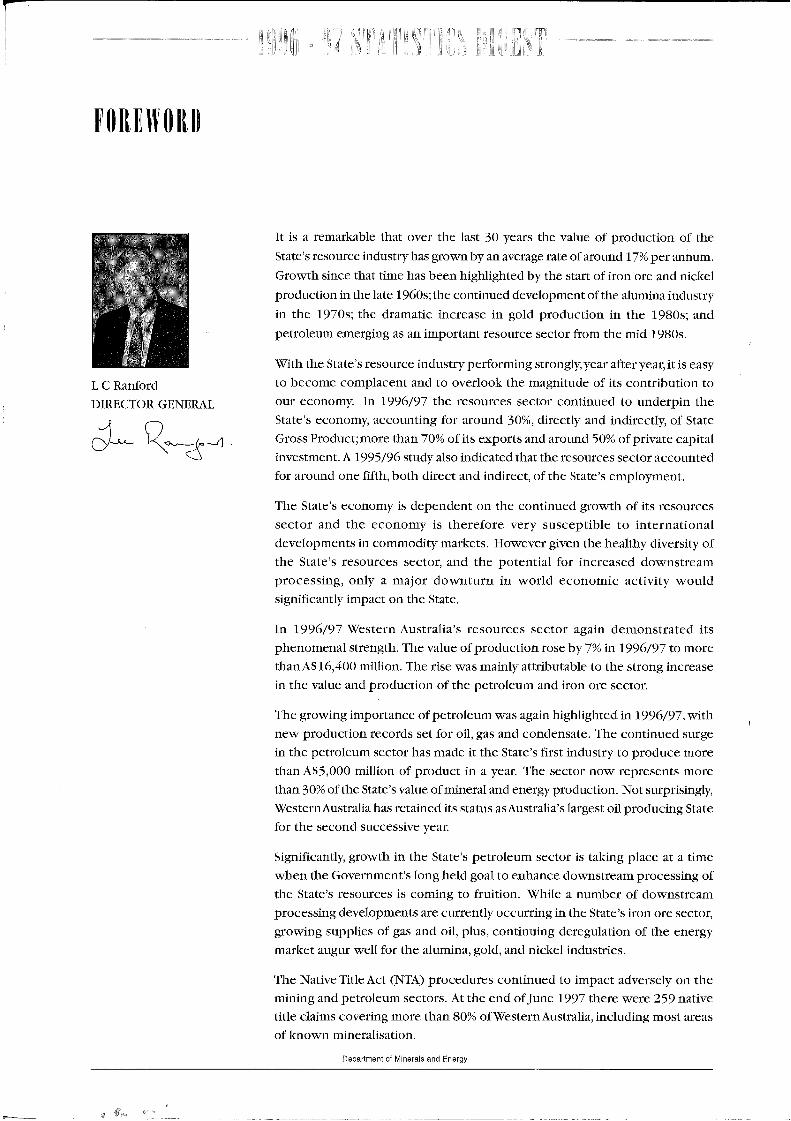
aolaag aao uoa! pue mnaloalad aql jo uo!lanpoad pu~ anFa aql m.ag~aaau! ~uoals aql ol alqmnq.~a!!~ Xlm.~m s~ax as!a aqj~ ’uo.q .lgU 00F9Iaaom m k6/966~ u! %/_ Xq asoa uo!lanpoadjo anFa aq~ "ql~uaalg Fuamouaqdgl.t pal~alsuomap u!~ aolaag saaanosaa s,~!i~alsn¥ uaa!SaA~ k6/966I u1
’al~lg aql uo la~dug.plno~ X!!a.~la~ a!mouoaa plao~ tL~ uanlu~op ao{etu ~ XlUO ’~u!ssaaoadmgaa!st~op pas~aaau.~ aoj i~!lualod aq! pu~ ’aoaaas saaanogaa g,al~!gjo XlFaaa!p XqlFaq aql uaa!~ aaaaaxoH "sla~ta~m X!.~pommoa u! sluamdolaaapIguo.~lguaalu! ol alq!ldaasns Xaaa aaojaaaql s.~ Xmouoaa aq! pug aolaasgaaanosaa sa.t jo tll~aoa~ panm.moa aql uo mapuadap s! Xmouoaa s,all~lg
¯ mamXoldma s,almg aql jo ’laaa!pu! pu~ laaa!p q!oq ’ql~.J auo punoa~ aojpalunoaag aolaag saaanosaa aql lgql pa!~a!p~q osI~ Xpn!s 96/g661 V ’luamlgaau~.Im!d~a al~a!ad jo %0g punoa~ pu~ glaodxa Sl.~ jo %05 ul~q! aaom ~lanpoad ssoaoa!~lg jo ’Xllaaa!pu! pu~ Xllaaa!p ’%0{ punoa~ .~o1 ~u.nunoaa~ ’Xmouoaa g,al~lgaql u!d.,apun ol panuBuoa aolaas saaanosaa aql k6/966I uI "Xmouoaa anool uo.~mq!amoa g!! 1o apnl!u~em aq! ~toolaaao ol pu~ maaNdmoa amoaaq olXs~a g.~ 1.~ ’.t~aX aalj~ a~aX’Xl~UOalS ~t .woa.IOjaad Xalsnpm. aaanosaa s, alglg aql q!.~A~
’s086I p!m aql moa~ aolaas aaanosaa lumaodm! ue s~ ~u!&~atua mnaloaladpu~ {s0g6I aql u! uo!lanpoad plo~ u! ag~aaau.~ a.~l~m~ap aql ’.g0k6I aql u!Xalgnpu.~ gu!tunF aql jo luamdolaaap panm.moa aql’.g096I algI aql m. uo!lanpoadia~tag~ pue aao uoa! jo la~ls aql Xq palq~!Iq~!q uaaq s~q attq111~ql aauF qlaxoa9¯ tunuu~ aad %l-I punoae jo a!~a a~aaa~ ue Xq ua~oa~ gl~q Xalsnpu! aaanosaa s,all~lgaq! jo uo!lanpoad jo anFa aq! ga~aX 0{ !gN aql aaao leq! alq~taemaa ~ s! 11
Tv~Ii/N.qD IlOKDRItI(Ipaoju~lt D ~I
IHOAAgHO

In September 1997 the Federal Government introduced the Native Title Bill1997 into the Federal Parliament. The Bill incorporates a number of amendmentswhich are designed to streamline the native title process to make it moreworkable. The outcome of the Native Title Bill is crucial to the long term futureof the industry in Western Australia. Unless we can achieve more workableprocedures there will be an inevitable decline in exploration with adverseconsequences for future mineral and petroleum production in this State.
The matters referred to above are described in some detail within this Digest.The information and statistics were assembled by the Department with assistancefrom the Australian Bureau of Statistics, Australian Bureau of Agricultural andResource Economics and resource companies. I thank these organisations fortheir cooperation and help; it would be impossible to present such acomprehensive pnblication without their assistance.
Lee RanfordDIRECTOR GENERAL
Department of Minerals and Energy

"8661 tu. %g’g ol %g punoae !~ lg~aaaoj g!qlmoao "86/L661 aaAo ttattl~t/aalg ii!~ uo!ldtunsuoa al~at.ad 1~ql pa!aadxa s! !I
’%I’Iol %g’g tuoaj lsBaaaoj qlmoa~ L661 sl! spJ~AXUAxop pas!aaa s~q ’sgalaqlauou’aI ’86//66I Jo jl~q lgat.J aq! ti! aaoadm! ’tIo!ldtunguoa al~a!ad ~lIOa!g jo ~Ia~qaql uo ’I1!~ Xtuouoaa asau~d~f attl saaa.qaq pun~I XamauolN FuoIl~UaaluI aq.l.
’86/L66I 5o JI~q asa~.J aq! m. panpqns m.~tuaa o1 suo!l!puoa ssau!snqaaadxa sa.m~duaoa 8tqama~snu~tu ~!q 1~q! sa!~a!pu! luatu!luas ssam.snqso xapu!tI~)lU~j, aiD s~u!!!ag Aa.qod a.m~ouoaa luaaana s,lt~attruaaAoo aq! jo spa~axaaaql d~aa uoos Ilpa u~d~f 1~ql papnlauOa s~q (L66I aaqtualdag) Aaaans u~d~f5o }Iu~t ~ algtAk ’luatu!luas ssau!snq ~u!la~dtu! Alasaaap~ aa~ uo!lNn~aaapo! SaAOtU panu!ll~Oa sa! g~ IIa~a s~ g~U!alaS Aa!lod Fas!J lq~!t s,luatuuaaaoo aq~
"L6/9661 tq %I’S Xq axaa~ d(IO ’atuoamo aala~nb L661 d(IO aunfaood aql al!dsa(I ’uo!ldtunsuoa aa~a!ad tO. IF5 aql ao5 patu~Iq ~aaq s~q L66II!ad¥ u! %g o1%{ tuoaj xm uo!ldtunsuoa aq! tq as~aaau.~ aq~ ’uo!ldtunsuoaa!~a!ad pu~ luatulsaau! ~u!snoq pu~ ssau!gnq u! IFJ ~ ol anp AIa~aNatuoalno aqj~ ’~iaoqs l~.O lsa!5 g,plaoax aq! ~upaOllOJ ’#L6I 5o aalaenb lga!Jaau!s aan~!j qlmoa~ Alaaaa~nb !sao~ aq! s~ax %6"g sn .ugu jo atuoalno d(ID aq.l."m~p qlmoa8 a.mlouoaa L661 aalamtb aunf aql 5o as~alaa aql tI1!~ pa!~ao!aalapg~q ’la)Ia~tu aaodxa lga~a~I g,al~lg aql ’u~d~f ao5 )Ioollno a!tuouoaa aq.l~
¯ OlqV.moa#fa.~ o4oan~u.~ guo!l.~puoo o.~utouoo~
tunuu~ aad %9’g 5° ql~oa8 aSeaaa~ una-~uoIspaaaxa s!q~ "/66t u! %g’{ Xq axoa8 ol palaadxa s! Xtuouoaa aq~ "suo!l!puoapu~map a!lsatuop lu~Xonq Xq XI!aetut.ad uaa!ap ~u!aq tll~Oa8 ql!~ ’XI~UOalStuaosaad ol sanu!luoa Xu~ouoaa gfl aq! 1~ql lsa~ns saol~a!pu! a!tuouoaa
slaodxa X{~jatIa pu~ [~aauItU S,all~lg aql jo spJ!q! o~al ueql aaotu~twA. ~1 la)ta~tu laodxa lu~ .uguopaad g,al~lg aid gu!~tuaa l~!g¥ ’slaodxa I1~!ol jo %04tI~ttl aaotu aoj lunoaa~ ol anu!luoa slaodxa XSaaua pu~ Faau.rm g,a!~lg
’uo! .lIgU 00g’gISVpmto.t~ !~ pools gnldans ap~al as.~pu~qaaam s,a!~lS aql’sgal Allu~a~ .ffga~!s pa!aodttt!1! uaa!8 pu~ ’!anpoadso qlaoaX UO.qI~tU 0~g’6[ $¥palaodxa al~lg aq! 16/966I uI
’XlI~aaua8~!Falsnv ao5 u~q! suo!l!puoa a!tuouoaa pIaoax uo lu~!laa aaotu ’aaosaaaqlg!aadsoad ltlmoa~ aanlnj s,almg aqL ’~!Fa!snyaoj %gI punoa~ o! paa~dmoa ~*tuouoaa s,~!Falsnyuaaasa?ASo %�{ aoj palunoaa~ sl.todxa uS!aaoj/6/966I uI
cno.fao~I £u~ouoa~t pl.~odi I’I
¯ u.,#gaooun s., u~d~[aOf alOOflno o!zuouooa aqZ
’Vg;1 acfl aof sloodso.~4
qlmo,�R olq#.moat~d
"UO!ll!U¢ OO g’g l S V1~ snlc[.ms ap~2l s, og~gS
J A gWA OHIAA 9 IVI )OS IIA V )IWOA O )9 ’I
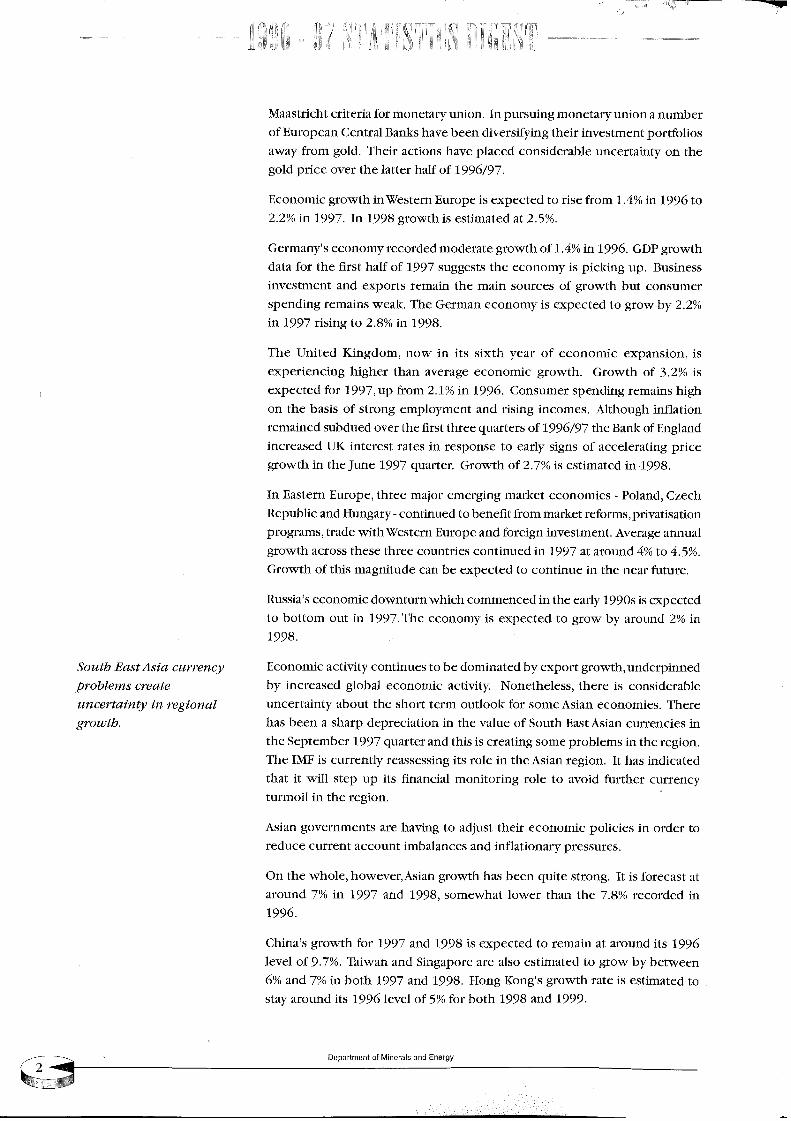
South East Asia currencyproblems createuncertainty in regionalgrowth.
Maastricht criteria for monetary union. In pursuing monetary union a numberof European Central Banks have been diversifying their investment portfoliosaway from gold. Their actions have placed considerable uncertainty on thegold price over the latter half of 1996/97.
Economic growth inWestern Europe is expected to rise from 1.4% in 1996 to2.2% in 1997. In 1998 growth is estimated at 2.5%.
Germany’s economy recorded moderate growth of 1.4% in 1996. GDP growthdata for the first half of 1997 suggests the economy is picking up. Businessinvestment and exports remain the main sources of growth but consumerspending remains weak. The German economy is expected to grow by 2.2%in 1997 rising to 2.8% in 1998.
The United Kingdom, now in its sixth year of economic expansion, isexperiencing higher than average economic growth. Growth of 3.2% isexpected for 1997, up from 2.1% in 1996. Consumer spending remains highon the basis of strong employment and rising incomes. Although inflationremained subdued over the first three quarters of 1996/97 the Bank of Englandincreased UK interest rates in response to early signs of accelerating pricegrowth in the June 1997 quarter. Growth of 2.7% is estimated in .1998.
In Eastern Europe, three major emerging market economies - Poland, CzechRepublic and Hungary- continued to benefit from market reforms, privatisationprograms, trade withWestern Europe and foreign investment. Average annualgrowth across these three countries continued in 1997 at around 4% to 4.5%.Growth of this magnitude can be expected to continue in the near future.
Russia’s economic downturn which commenced in the early 1990s is expectedto bottom out in 1997.The economy is expected to grow by around 2% in1998.
Economic activity continues to be dominated by export growth, underpinnedby increased global economic activity. Nonetheless, there is considerableuncertainty about the short term outlook for some Asian economies. Therehas been a sharp depreciation in the value of South East Asian currencies inthe September 1997 quarter and this is creating some problems in the region.The IMF is currently reassessing its role in the Asian region. It has indicatedthat it will step up its financial monitoring role to avoid further currencyturmoil in the region. "
Asian governments are having to adjust their economic policies in order toreduce current account imbalances and inflationary pressures.
On the whole, however, Asian growth has been quite strong. It is forecast ataround 7% in 1997 and 1998, somewhat lower than the 7.8% recorded in1996.
China’s growth for 1997 and 1998 is expected to remain at around its 1996level of 9.7%. Taiwan and Singapore are also estimated to grow by between6% and 7% in both 1997 and 1998. Hong Kong’s growth rate is estimated tostay around its 1996 level of 5% for both 1998 and 1999.
Department of Minerals and Energy

"ZO0~ o! ~’d %~’~ s! q!~oa~ pIJo~ jo ls~3aJoj mJal ra!!pare
ql~oa~ plao~ lg~aaaoj ggq (5661 aaqmaldag) punk Xamauo~ I~UOll~mamI
’9661 pue L661 qloq m. %g ol %0"~at lstaaaoj s! sdjjN s,altlg aql u! qa~oa~ a.mJouoa.q ’alqtanoAtJ aq Ol anm.luoa’slaodxa k6/9661 s,almg aql jo saalatnb-aaaql punoat aoj palunoaa~ qa!q~’(sdJJ~) sJau!al;d ~u!ptal gI .io{tm s,t.li~alsnvll.talsaAXti!, suo!l!pttoa a!ttlouoa}~
"uo!II!q I SgKl punoa~ aq lI~.~lgo.tlnq.t.IlUOa s,~!igalsnyXia:~..i s! 1F q!!~ papaaaoad JI ’~!sauopuI aoj punjanasaa ~ ~u!aap!suoa ogle aaa~ ~Iu~{{ plaopApu~ dINI aq! L66I aaqolao a!~I uI
put aaodg~u!g jo 1~ql sFnba t~o!II!q I $SFI to ~Jo!mq!aauoa s,~!Falsn¥ ’Xalunoaaaq!o Xug utql sam!l aaom anoj ’uo!Ii!q }$gLl ~u!lnq!amoa s! ~Jtdtf ’tto!ii!q9I SgFl ~u.qImoa punj anasaa t pas!u~ao s~q pranj XamauoIN I~UO!a~uaaluI’&ttouoaa aq! as!i!qms ol aapao uI "966I m. papaoaaa %5"9 aql moa1*a~aop’9661put 566I qloq u! %{ pu~ %g’g ~Jaa~alaq aq o! palaadxa s! q!~oa~ s,pu~p.~qj,¯ putI!eqj~ uo latdm! aaal~as Xia~ina!latd ~ p~q aa~tt smalqoad Xauaaana
’%I’9 1~ !staaaoj ql~oa~ ql!~ 866Im. uaq!~uaals ii!a~ ~{mouoaa aql ltql palaadxa s! !! ql~oa~ laodxaolu.~ saa!I!J tlOI.l.ISOd aa!!!ladmoa paaoadm! sl.t s¥ ’/66I u! %{’g Ol 966I u! %I’kmoat lI~J ol palaadxa s! ql~oa~ sl! ’maal laoqs aql u! uo!!~!aaadap XauaaJnas!! jo llnsaa t s~ aaoadm! o! palaadxa s! ssauaa!l!ladmoa s,taao~ qlnog aI!q?A
Australia’s and Western
Australia’s growth
moderated in 1996/9Z
State business investn2ent
down, but, expected to
rebound in 199 7/98.
Inflation under control.
Lower official interestrates.
Continued improvementin Australia’s balance ofpayments and Budgetdeficit positions.
1.2 Review of the Western Australian and AustralianEconomy
The Australian national economy’s growth moderated to 2.8% in 1996/97.This was lower than the 3.25% growth rate estimated in the 1997/98Commonwealth Budget, delivered in May 1997. Nonetheless, the 1996/97GDP outcome represents the sixth sustained year of Australia’s economicrecovery. Despite this, the average unemployment rate has been stuck at anunacceptably high level. Indeed, it rose marginally in 1996/97 to 8.7%.
Following the strong rates of economic growth of the past 3 years,WesternAustralia’s growth moderated to 3.1% in 1996/97. This outcome was weakerthan the 5% forecast in the 1997/98 State Budget, delivered inApri11997. Themain causes for the State’s lower than expected 1996/97 growth were thesluggish growth in the State’s retail sales, lower than expected businessinvestment and higher imports.
Surprisingly, business investment fell by a modest 2.1% in 1996/97. This fallwas largely the result of the 7.5% decrease in business investnlent in the June1997 quarter. The main reason for the fall was the timing of investment. Stronggrowth in imports of investment goods in the June 1997 quarter are consistentwith a substantial pickup in investment spending in the first half of 1997/98.This suggests the original investment profile underlying the 1997/98 StateBudget investment profile remains accurate but has been moved back onequarter. This is likely to have been the result of unexpected delays in theconstruction of some of the State’s large resource projects.
On a positive note there are tentative signs that housing activity, which hasbeen falling over the last two years, is beginning to recover. Despite falling by0.1% in 1996/97 dwelling investment activity increased in the latter half of1996/97 to reach its highest level since March 1995.
WesternAustralia’s employment growth increased from 1.8% in 1995/96 to2.3% in 1996/97. WesternAustralia’s average unemployment rate in 1996/97remained at around its 1995/96 level of 7.5%, still the lowest rate inAustralia.
In 1996/97 Australia’s headline inflation rate increased by 1.3%. Australianaverage weekly earnings for full time employees also rose by 3.9%. Growth inWestern Australia’s headline inflation rate and average weeMy earnings forfull time employees eased over the second half of 1996/97 with the finaloutcomes being 1.4% and 2.3% respectively.
On the back of a low inflationary environment, favourable wages growth andconcerns over Australia’s high level of unemployment, the Reserve Bank ofAustralia initiated four cuts in official interest rates in 1996/97. Official interestrates were cut by another 0.55 percentage points in July 1997. Reflecting theofficial interest rate cuts the yield on 90-day bank bills has fallen from around7.6% in June 1996 to 4.9% inAugust 1997.
In 1996/97 there has been a substantial improvement inAustralia’s balance ofpayments as well as in the Commonwealth Government’s budget deficitposition. In 1996/97 Australia’s current account deficit totalled A$16,500million, downA$4,000 million on 1995/96. Whilst this accounted for 3.2% ofAustralia’s GDP in 1996/97, significantly lower than the 5.8% figure recorded
Department of Minerals and Energy
Z6-uep96-1n1’96-uep£6-1npOZ
O8
~BJeu~3 pue SlmeU!~ Jo ~uauJiJede(3
~’L eJn6!=lU~elln8 Mua8 eAJesaEI :aomo£
Z6-uep96-1nf’96-uep£6-1np
N::IA/$V BlVI:I :IONVHOXB
o£
O9
O2.
08
06
00~
’fi6/566I m. %gL’~ aq ol pal3adxa ql~oJ~ qlDx ~m.~gJno3uo ~agaog s~dso~d tll~o~ ~tI~ ~iFgI!uqS ’tO/O00g ol 86/L661 moaj mnuug ~od
%9 pu~ %~ u~nxl~q ~u~J ol pm~dx~ s! q!~xoJ~ ~lm~ ’86//661 u! dn
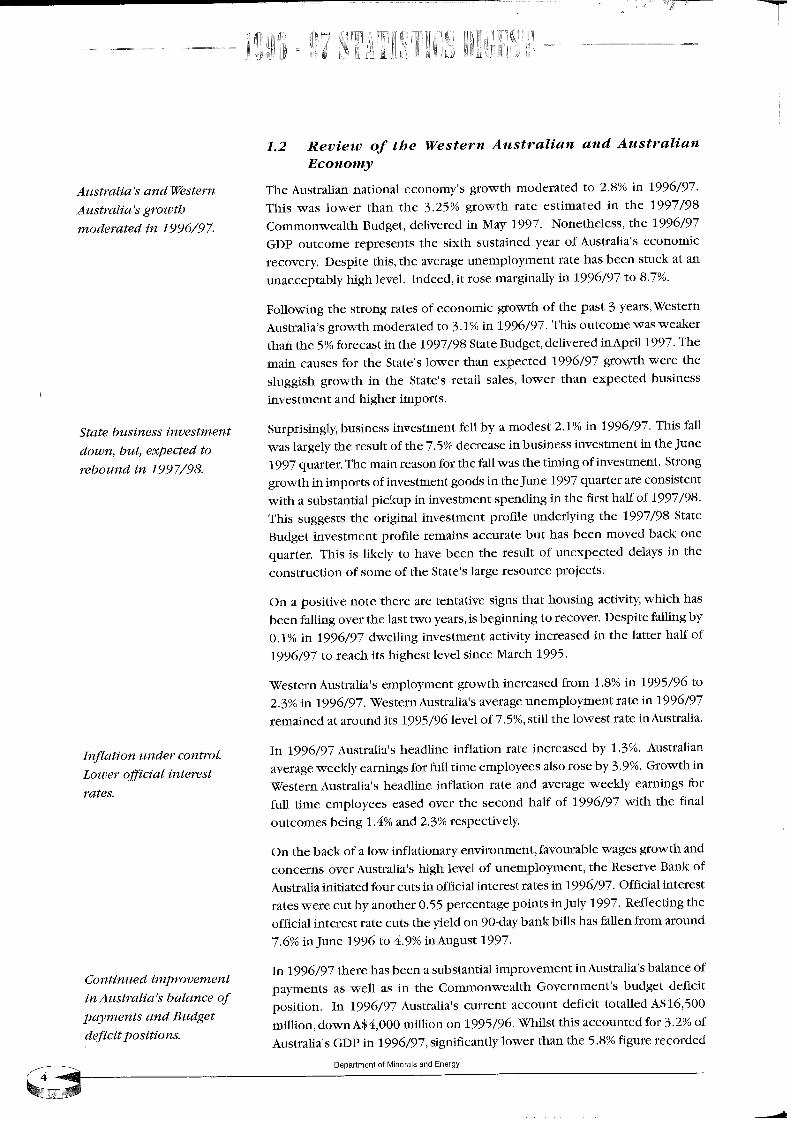
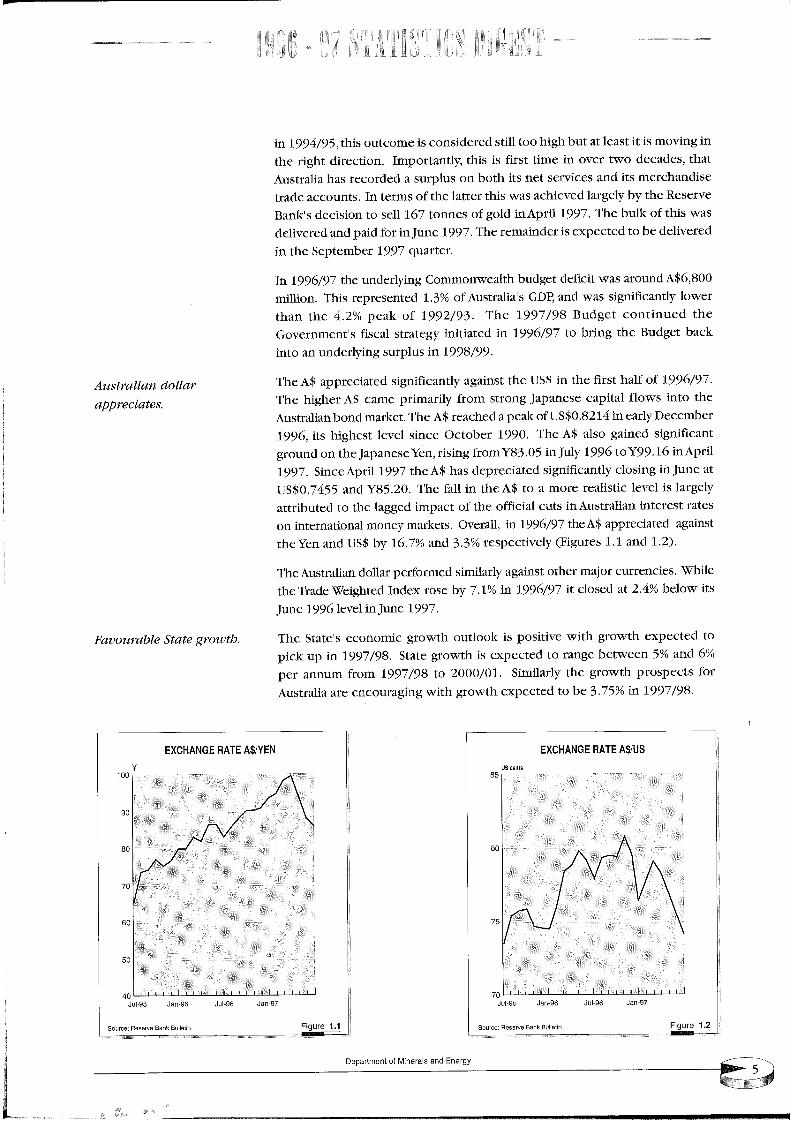
’/66[ aunf m. Iaaa19661 aunf
sl! aXolaq %}’~ le pasola !! 16/9661 m. %1’l XqalgtAk ’sa!auaaana ao[em aaqlo lsm.e~l; Xlae .l!m!s patu.*ojaad aeI[Op ue!Iealsnv aqz
"(UI pue 1"I saan~!a) ~Iaa!laadsaa %~’~ pue %l"9I Xq SSFI pue uaxaqllsu!e~e pale!aaadde svaql L6/966I u! ’IFaaaO ’gla}laeEI ~auottI IeUO!lemalu! uosalea lgaaalu! t~e!Fa!snvu! gma F.*a!jjo aql jo laedttq, pa~eI aql o! palnq!a!!~~ia~aei s! iaaaI a!!s!Faa aaom e ol SV aql u! IFJ aq3~ "0UgSX pue1~ aunf m. ~u!sola Xlluea!~u~!s pal~!aaadap seq SV aql k661 p.adv aau!s ’k66Ii!adv u! 91’66X ol 9661 ~Inf u! g0’ {R_&moa~I ~u!s!a ’uaxasaued~f aq! uo punoa~luea!~u~!s pam.e~ ogle SV aq~ ’066I aaqolao aau!s IaaaI !satI~.rq sl! ’966[aaqmaaa(I Alaea tq. ~1 ER’0$SFIJO ~tead e paqaeaa SV aq.l, ’la}Iaem puoq ue!Falsnvaql or!! S~OlJ Im!d~a asauedef ~uoals moaj XI!.,em!ad atu~a SV aaq~!q aqiL
’k6/9661 ~o JI~q asa!~ aql u! ~gFl aql lsu!~e Xllu~a!~u~!s pale!aaadde ~V
"66/8661 u! snldans ~u!Xlaapun ue oltq.~Iaeq la~pn{t atI1 ~m.aq ol /6/9661 m. pa!~!l!u.~ !~aleals IeaSg s,!tlatuuaaAooaq! panu!luoa la~pn{[ g6/k661 aq& ’{6/~661 jo )lead %g’} aql u~tt!ila_~xoI .~iltleat .oqti~!g geax pue aGO s,e!FalsnvJo %{’1 pamasaadaa g!q~ ’uo.qI!m008’9$vpunoae seax l!a!jap la~pnq 41Ieaaxuotuu~oD ~m.~I.*apun aql L6/9661 u1
aala~nb/66I aaqmaldaspaaaa!iap aq o! palaadxa s! aaptq.emaa att~ ’k661 aunf u! aoj p!ed pue paaaa!Iapgl~ax S!ql jo ~nq aq~ "L661 I!advtq. PIaaaasa~[ aq! Aq Ala~aeI paaa!qae seas g!q! aalleI aql jo smaa! uI ’sltlnoaae apealas!pueqaaam sl! pue saa!aaas latl!~ql ’sapeaap o~al aaao m. amp lsa!ju! ~m.aom s! 1! lgeaI le lnq q~!q oo!
’Wmo.~ al~g~ alq~.¢noa~zt
’sa.w.~oaaddt~.WllOp ZW!l#&*snv

Commodity prices mixed,gold and nickel down,petroleum and iron oreup.
Favourable 1998commodity priceoutlook.
1.3 Economic Factors Affecting the Mining Industry
A major factor affecting the economics of mining and petroleum extractionare the demand prices received for the resources extracted. While demandfor most mineral and energy commodities was strong in 1996/97, in terms ofcommodity prices received, producers’ fortunes in 1996/97 depended onwhich market they were in.
Gold, for example, performed poorly. While the average gold price fell toUS$364 per ounce in 1996/97, down from US$390 per ounce in 1995/96,continued market concerns over gold stocks held and speculative gold salesby Central Banks, saw the gold price fall to US$317 per ounce on July 9,1997,its lowest level in four years.
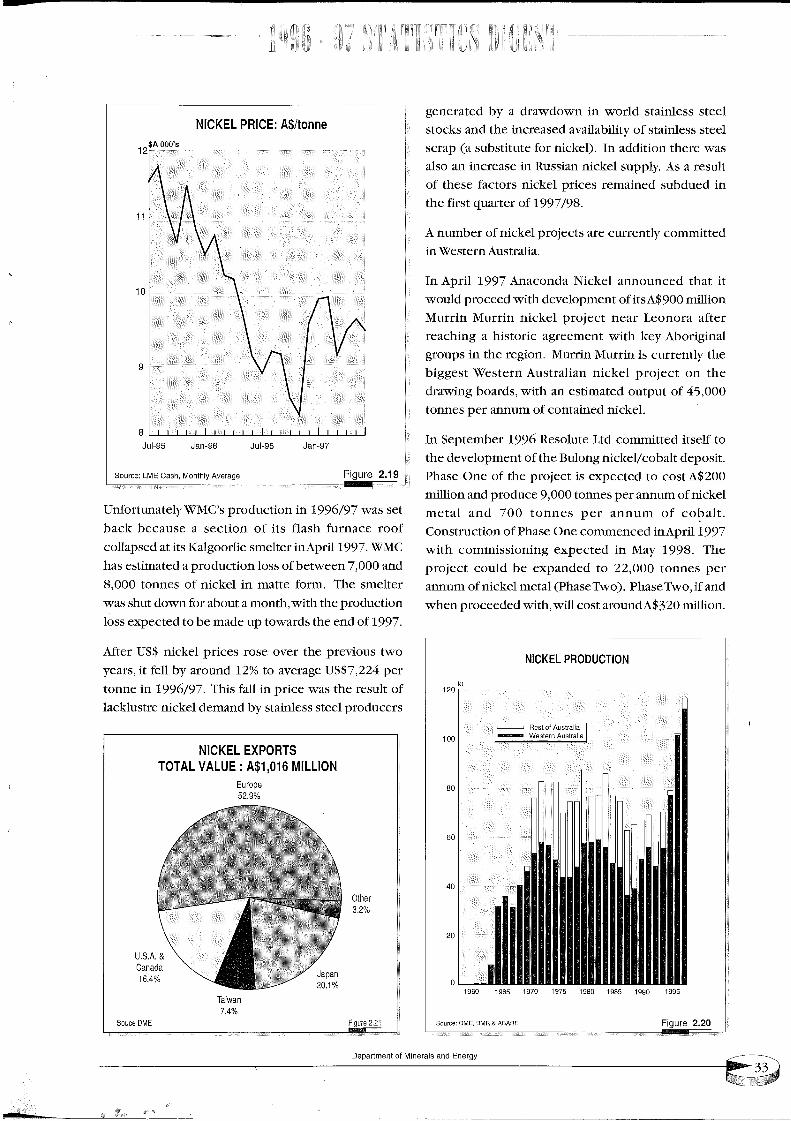
After US$ nickel prices rose over the previous two years, the price fell byaround 12% in 1996/97. This fall in price was the result of lacklustre nickeldemand by stainless steel producers generated by a drawdown in worldstainless steel stocks and the increased availability of stainless steel scrap (asubstitute for nickel).
Petroleum products on the other hand were the best performing commodityin 1996/97, with oil prices reaching a six-year high in December and January1997, trading above US$26/barrel. This outcome was primarily the result ofcold weather concerns in Europe and low inventories. By end June 1997,however, petroleum product prices fell to around US$21. Overall petroleumproduct prices rose by 18% in 1996/97.
Australian negotiated iron ore prices also recorded a 6% increase in 1996/97.
Aluminium prices are showing signs of recovery. While they fell by 9% in
1996/97 aluminium prices recovered in the first half of 1997. In 1997/98they are expected to be 6% higher than the 1995/96 level.
With strong growth expected to continue in most of Asia and major OECDcountries the outlook for commodity prices is favourable. On the back ofcontinuing rising demand and the supply of a number of minerals constrainedin the shorter term by capacity, ABARE predicts average prices for mostAustralian minerals and energy commodities will rise by between 3% and13% in calender year 1998.
For the 1997/98 financial year, however, ABARE has forecast a 2.4% rise inA$average prices received byAustralian mineral and energy exporters. Strongeraverage 1997/98A$ mineral and metal export prices (up 6.8%) are offset by lowerenergy export prices (down 3.7%). The subdued overall 1997/98 outcome,therefore, comes from the anticipated 3.8% 1997/98 depreciation in the US$/
On the back of a 5.4% rise in Australian mine production, ABARE expectsmineral and energy exports to grow by 5.7% in 1997/98 to a new record ofA$38,550 million.
A positive development emerging for mineral commodity markets is that Sovietstockpiles appear to be depleted and there are early signs that pressure on
Department of Minerals and Energy
’866I Xa~nusf I moaj f±o~z: ol paanpaa aq llJ.~ ploqsaaq! s!q~L ’aa!oqaa!aql jo aa.~ddns ss~ aql q!!a~ Xllaaa!p lasaluoa ol alq~ uaaq aastI uo!laatmoaai~u.~g s q~noaql mnuus aad f~00g lssa| 16 ~uPt~l gaamolsna gs~/-66[[ moa~l "saamolsna s~ a~asI .,oj auHad!d ss~ Is.,nlsu Xanqunlt ol aa!dtu~(Iaq! ol gsaaas m. ~u!ssqd jo tusa~oad aql jo uo!lsnm.luoa pus 966[ aaqolaom. pauado XlF!a!jjo ssnx qa!qax amI. ad!d ssO splagploO aq! jo uo!laldmoapapnpu! s!qj~ ’k6/9661 u! la~t.T~m X~aaua aql jo uo!lsln~aaap aaqlanJ aq!aaoadm! ol panu!moa ssauaa!l!ladtuoa Xalgnpu! ~u!m.m g,~!tsa!gnv u.ta!saAk
q!isa~auommoD ao alslg aql aaql!a Aq ua~Isl saansgam jo aaqmnu V
’ql~oa~ a!tuottoaa s,~!lSalsnvuaalgaAk ol slu!od
}’I pps plnoak qlaxoa~ aFJJOUOaa g,u~dsf m. agsaaau! m!od a~muaaaad 0’[g 1~ql palgm!lga uaaq gsq !! ’aldmsxa ao~I "lusa!j!.u~!g aa~ gd~lNguo!l!puoa a.wJouoaa alqsanoasj jo Xmouoaa g,alslg aq!jo lgaa aql aoj glaajja
aa~O-IlJ.dg aqj~ ’gaalaodxa jo la~am u!~m aq! u!~maa llDX pus glaodxapus Faau.rtu g,aaslg aql jo spa!q1 o2A1 usq! aaom ga~lsl Xlluaaana
¯ 2LTlgnpu! ~u!u!m g,aa~lg aql !!jauaq o! anu!luoa plnoqg sa.uuouoaa
aoj ~oollno a.waouoaa aa!lFod aqj~ "pu~map I~!mmgqng ap!aoad o! anm.moa
(sd~IN) saaulasd ~u.tpsa! .Io[gm ’aglna!!agd u! ’saam.m us!isa!snv uaalsaAk ao~I
a~usqaxa u~!aaojjo qaasag u! ga.~l!pommoa jo sad!n [is 1o ~u!dmnp a!lauaaJ pajama!a1 ~ISSflaqlJo asdNloa aql sa~aX luaaaa aaaO "papua s~q ~u.~dmnp la!aog moaj gaa!ad
"uo.~g~ln,ga¢ap(C~.¢ouo ~q polsooq
ssouoa!g!la4utoo
’alOOl!no oa!g!sorf ap!ao.cds.¢oul.w4 8u!p~.q aof~w
Hilmer reforms provide
benefits.
Commonwealth
Government targets the
Diesel Fuel Rebate
Scheme (DFRS) forrevenue savings.
Section 23 (pa)exemption from income
tax for prospectorsremoved.
1997/98 CommomvealtbBudget.
In addition to the developments in the gas market, the State Government is’phasing in access for large electricity producers and consumers to WesternPower’s high voltage electricity transmission and distribution systems. Openaccess is to be provided to large electricity consumers according to a schedulewhich commenced from 1 January 1997. Deregulation of access toWesternPower’s systems is expected to create competitive pressures betweenelectricity generators which should ultimately lead to the supply of cheaperelectricity, providing in turn a further boost to economic development.
More generally, the market framework within which the mining industryoperates had its competitiveness enhanced with all States and Territoriesenacting legislation which subjected their public enterprises to the provisionsof the Trade Practices Act (TPA) from 21 July 1996. This was a major step inNational Competition Policy resulting from the Commonwealth, State andTerritory governments endorsing the 1993 Commonwealth IndependentCommittee of Inquiry into National Competition Policy (the Hilmer Report")and subsequent signing of agreements inApri11995 to put into effect variousmicroeconomic reforms.
As a means to address DFRS’s rising revenue cost, in October 1996 theCommonwealth Government proposed a number of amendments to theScheme. The amendments, amongst others, will make diesel used in all vehiclesunder 3.5 tonnes which are suitable/capable for use on public roads ineligiblefor the rebate. The Bill is being debated in the Commonwealth Parliament.
WesternAustralia is already the State most affected by the proposed October1996 legislative changes to DFRS as its mining industry relies more on dieselfuel than in other States. Any additional changes to DFRS, such as capping itsfuture cost, would further impact on the international competitiveness of theState’s resources sector.
On August 25 1997 the Commonwealth Parliament passed an amendmentwhich removed the exemption previously provided under paragraph 23 (pa)of the Income Tax Assessment Act 1936 to income derived by bona fideprospectors from the sale, transfer or assignment of rights to mine for gold orany other prescribed metal or mineral. Removal of the exemption is beingphased in over the period 19August 1996 to 19August 2001. Over this periodonly the increase in value of mining rights is taxable. The value accrued to 19August 1996 remains exempt until 19 August 2001. After this date theexemption will be completely removed and total value taxable.
The 1997/98 Commonwealth Budget brought down in May 1997 was essentiallya "steady as you go - hands off" approach which, unlike the 1996/97 Budget,inflicted minimal additional pain on business and the community in general.The massive 1996/97 Budget cuts to Government expenditure and industryincentive schemes, such as the reduction in the premium rate of deductionfor research and development expenditures from 150% to 125%, are now havingfull effect. The resultant increased revenue growth is the key factor to theCommonwealth’s expected budgetary improvement for 1997/98 and return tosurplus in 1998/99.
Department of Minerals and Energy

paaa~!al geax lanoD q~!H
qa!qax luatua~ueaae lau Xlajes e atuoatq ,galmg aql laaaoad oa~ ’uo!II!m 000’g$¥punoae PalImO! ga!l~lg II1~ so5 ssoI anuaaaa aqJ~ ’la~pnq g3~!II~algn¥ uaalsa~~ lINaaoqs uo!II.~tu 009~¥ e paa~aaa Alaa!laaJJa uo!s!aap s,aanoD q~!H aqJ~
’ttlaql laaHoa ol ~u~.~.tl II!lg tI! lt~.od alal!I g~x aaaql lgq! paaa~e galelglie ,AiluanbaguoD .ltulqnop geax aonb!I pu~ Ianj uo sd~I~ 5o A!!p!Iea aql leqllueatu Ogle uo!g!aap aql leql pas!~pe Xlluanbagqng IeJauaD gaol!aRog "ga!aol~.aJaJ~pue gaaelg lie uo pala~dm! uo!s!aap s,lanoD q~!H aqJ~ ’p!Ieam. aaa~ Xaql as~.axaue ~aI o! q!I~a~auotuvaoD aql gaxolI~ AlUO uo!ln!t.lguoD aql jo 06 uo!laag geaaojaaaql pue as!axa ue gem g~I~I~ oaaeqo! aqa leql palna AII~!luassa aanoD q~!H
aql leql eH pue puotutueH ga A~gN ~. palna lanoD q~!H aq! L66[ asn~n¥ g uO
~U!l~.qs 5o Aa!Iod sl! gant~.ltloa qlleaaxuotutuoD aq! J1 ’uo.qI!tU I g I ~¥ s! aaeqs
g,e!i~algn¥ u.talga~ ’tuea~oad uo!lanpaa lqap g,qlleaaxuomrttloD aql spae~ol
saeaX aaaqa aaao Ielo1 ~ uo!II!ttt 6gg’I $¥aanq!aluoa o1 paa!nbaa aae sa!aol!aaa~Lptt~ ,gal~lg aq! ttlleaaxuottrttIoD aql q!!ax lua~uaaa~e 9661 ~ aapun ’uo!l!ppe u1
’L6/966I u! %6’0 jo ma Ieaa ~ saXOlIO5 s!q& ’96/L66I aoj sa!aol!aaa&pue sa!~lg aql ol slu~a~ qlleaaxuotutuoD u! lna Ieaa %>’0 ~ 5o aauaaajuoDsaa!tuaad L66I aq! jo atuoalno aql paleaodaoau! la~pn~ aq~ ’sa!aol!aaa&ptle sa!~lg aql oluo lqap gl! ~U!l~.qs Xq s~Iooq ga! ~u!au~Ieq s! q!IeaaxuotutuoDaql aeqa axa!a s,alelg aql gtua!Suoa aa~pn{t q!IeaaxuotmuoD 96/L661 aqj~g&gpnq qgltaOmuoututoD
sagod.,nd uo!lanpaa lqap qlleaaxuotmuoD
Aia~sei pasn aq lI!aX Wjptgax aql leql palea!pu! s~q luatuUaaAO9 q!Iea~uottw~oDaqJ~ ’aoj pala~pnq uo!II!tu 000’95¥ aql paaaxa o! palaadxa aa!adsales Ie!ol aql ql!~x ea!sla.l.Jo ales {/[ aql tttoaJ IIeSpuDx luea!~u~!s ~ aa!aapii~.~ q!ieaaxuoml~oD aqa leql AIa~I!I saeadde 1! la~pn~ aql uaxop ~u!pueq aau!g
CommonwealthGovernment foreshadowsmajor tax reform.
State Governmentintroduces a gold royalty.
The calls for a newAustralian industrypolicy.
Windfall Tax to apply on any refunds of past BFFs paid by companies to theStates. This would prevent companies from undertaking court action to recoverpast BFF payments.
On a positive note the High Court’s decision has provided the CommonwealthGovernment with a catalyst for a wide ranging inquiry into tax reform. Theinquiry will develop tax reform options that the Government can take to theFederal election, due at the latest, in March 1999. The Prime Minister hasindicated that the guiding principles for reform are to include considerationof a broad based indirect tax; reform of Commonwealth/State relations;reductions in personal income tax; and no increase in the overall tax burden.
A priority outcome for the States from the reform of Commonwealth/Statefinancial will be to reduce the States’ dependence on Commonwealth grantsfor their funding. This dependence was further exacerbated by the HighCourt’s decision.
From a State perspective the optimal outcome of the tax inquiry would bethe adoption of a more efficient and effective tax system, one that does notunduly penaliseAustralia’s export sector, as is the case with current tax system.It has been estimated thatAustralia’s existing indirect tax system (ie.wholesalesales tax, diesel fuel excise etc) imposes an additional cost of 5% (i.e. aboutA$3,800 million) on exporters.
In the 1997/98 State Budget, brought down inApril 1997, the Government’schallenge was to meet the State’s revenue shortfall resulting from the continuedcuts in Commonwealth grants to Western Australia. The State Governmentfaced difficult fiscal decisions and this has led to the gradual removal of theexemption from royalty payments on gold production.
The 1997/98 State Budget indicated that a gold royalty option was beingexamined but the final makeup of the royalty was still subject to industryconsultation.
After consulting with industry groups the final makeup of the royalty wasdecided by Cabinet and announced on 28 July 1997.
The royalty will now commence from 1 July 1998 at a rate of 1.25%. The fullroyalty of 2.5% has also been delayed until 1 July 2000 and will be conditionalon the gold price exceeding an average A$450 for the quarter. The royaltywill be unconditional from 2005. These concessions are worth aboutA$ 56 million over the next three years, and up toA$160 million over the nextseven years.
The State’s gold royalty is also deductible for Federal company tax purposes.At 1.25% and 2.5% the effective rate of gold royalty translates to 0.8% and1.6% respectively.
Over the last five years the consensus among industry is that Commonwealthgovernments have lacked an industry policy direction. Industry believes thatthe lack of a coordinated industry policy will impact onAustralla’s internationalcompetitiveness in the near future.
Department of Minerals and Energy
’%gI ~q osad
sau!ddR!qd aqa put %11 ~q a!~m.a ug!SAglgla~ aq~’.%LI Aq qg!dna ug!sauopuIaqa :%{{ Aq ualIgJ sgtI lqgg pugI!gq& aql L661 lsn~n¥ o1 L66I Alnf moaeI
¯ Xa!lod Xalsnpu! aa!laajja put luaaaqoasl! ~ slaodaa asaql ~m.aap!suoa Xlmaaana s! mamuaaao9 qlFa~t~ommoD
X~OlOUtpa! uo!lgm.*oju!jo luamdolaaap put qaagasaa uo uo!ssaanoa xgl %00g g aoj [gsodoadg ~u!pnlau! ’aa!laa!qo s!ql aaa!tpg ol suo!ssaauoa xm aoDm spuammoaaa1I ’.4~o[otlqaal uo!lgmaojtI! u! tlo!lgaouu! jo alga g,~.~I~a!sn¥ aaoadm! olX~algals ~ ql!~ mammaao9 sap!aoad (5661 lsn~n¥) laoda}t ~qlaoaxsplo9 aqj~
"L6/9661 u! glaodaa jo aaqmnt~g pat~o!ss!mmoa luamuaaao9 qllga~t, ommoD aq! pt~noa~Iagq s!ql lsu!g~V
Minin8 outlook isfavourable.
According toAustralian Bureau of Statistics (ABS) data mining profits growthfell from 27% in 1995/96 to 2.5% in 1996/97. Profitability levels in the miningindustry are expected to improve in 1998.
TheABS’sAustralian Business Expectations Survey suggests that mining profitsare expected to be around 35% higher in the September quarter 1998compared with the September quarter 1997. This suggests that most miningcompanies responding to the survey expect a more favourable internationaleconomic climate and commodity price outlook in 1998. It is also expectedthat Australia’s new mining investment will rise by 19% in 1997/98.
Department of Minerals and Energy
,~6Jeuq pue sleJeU!lAI ~.o ~ueLuiJede(]
¯aanpaaoad alg!lo~au ol lq~!a
aaao suo!lga!Iddg lIg ’sasgaI asodand Faaua~ pug sasgaI ~t .mqm jo asga aql uI
’aanpaaoad
alg!lo~att ol lq~!a aql tD!aX aaugpaoaag tq paaaoad !snm aallgtu aql uaql’QLJ~NNI)Funq!a£ al!!J~ aa!lgNI Iguo!lgNI aql Aq plaqdn s! uo!laa!qo aqa pugail!l aa!agu pa.*aas!~aa g Aq apgm s! aanpaaoad pa!!padxa aq! ol uo!aaa[qo
’paltlga~ S! lUamauaa aq! po!aad uo!lgag!.!ou qluom-o~!
sa!lagd lugaalaa pug (~I~(1) X~aault pug SlgaatqIN jo auatulagda(I aql Xq pas!laaapgaag stIO!lga!Iddg alt!1 IIg ’sasgaaoad ¥&N aqa o! Salad ~tn.u!tu pug uo!lgaoldxa
69L’8 atuos paaaajaa pgq luamlagda(I aq! L66I asn~n¥ EI oz ’g661 qaagIN 9Ijo uo!s!aap lanoD q~!H aq! aau!s (¥&N) aagall!&aa!lgN s,luamuaaaoD Igaapa~
aql ql!~ ltlals!sttoa saanpaaoad pgq sgq luamttaaAoD ug!Igalsn¥ tlaalSaAk aqj~
pa~poI sru!gp axau I8 aaam aaaqa L6/966I u1 ’uoIlgs!Faa .ugu u~omIjo sgaJg lsolxt ~Lqpniau! g!lgalsnv uaalSaAk jo %08 aaAO ~U!JaaOa sm!gla 011!1aa!lgu 6gE aaa~ aaaq! L661 aunfjo pua aql !¥ ’saolaas mnaloalad pug ~u!tn.maql uo lagdm! sl! pug ai1!1
"so.mpoooadol~.~logou ol ¢q~ta
~(Tq &, plaq suo!¢vO.Zl&[Vos~ol ~tqu.~Ig
¯ uaoouoo ~ u.toutaa
Three NTA ruling in1996/9 7 will furtherimpact on the number oftenements the State cangrant.
During 1996/97 there were three significant decisions which had a detrimentalimpact on the number of tenements which could be granted under the State’sMining Act 1978.
First,inAugust 1996 the NNTT found that theWesternAustralian Government
had not fulfilled its obligations to negotiate in"good faith" and as a result over900 mining lease applications subject to the NNTT’s right to negotiate at thetime of the ruling have had to restart their progress through the negotiationprocess.
Secondly, on 23 December 1996 the ttigh Court provided its long awaitedruling (Wik decision) on the key issue forWesternAustralia of whether pastoralleases extinguish native title. Despite the Court’s ruling this remains largelyunresolved. The High Court ruled that pastoral leases in CapeYork in northernQueensland did not necessarily extinguish the native title claimed by theWikpeople. It concluded that, because the nature of theWik people’s native titleclaim had not yet been determined and because the pastoral lease in questionwas a limited grant of rights, there was potential for native and pastoral rightsto co-exist. Therefore, the lease may not have extinguished native title. It alsoruled that where the rights under a pastoral lease were inconsistent withthose of native title, the rights of pastoral leases would prevail.
CommonwealthGovernment moves toamend the NTA.
Thirdly, on 8 May 1997 the Federal Court (the Dann decision) upheld that theNNTT should consider the rights bestowed by the grant of a tenement, ratherthan the intended use of the tenement by the applicant, when making adecision as to whether the expedited procedure (or fast tracldng) shouldapply. As a result of this, if a native title party objects to the expeditedprocedure applying to any exploration title then the full right to negotiateprocess will apply.
WesternAustralian officials have been working with the Commonwealth andother States in an attempt to identify amendments to the NTA which wouldmake the system more workable.
In October 1996 the Prime Minister announced a number of proposedamendments to the Native Title Act 1993. Those amendments aimed tostreamline the NTA so as to make it more workable by, amongst others, makingall native title claims subject to a threshold test so as to determine theirlegitimacy; allowing once-only right to negotiate for mining companies anddevelopers; and excluding exploration companies and prospectors from rightto negotiate obligations.
On 28April 1997 the Prime Minister announced a 10 pointWik plan strategy.While the strategy does not extinguish native title on pastoral leases it attemptsto define those pastoral activities which are viewed as being inconsistentwith native title rights.
In September 1997 the Federal Government introduced the Native Title Bill1997 into the Federal Parliament. The Bill incorporates the proposed October1996 NTA amendments and the so calledWik 10 point strategy.
Department of Minerals and Energy
suo.~!~aap!st, oa lt~att~dolaaap ttsql aaqll;a uo!laaloadspa~o!’asnoquaaa~ se qans ’sanss! lu~laodm.~ uo sal~qap paaxa~Is luamuaaao~sno!aaad aq! 11~ql ja!Iaq sl! s! qa~oadd~ s,luamuaaaoD luasaad aql m. l!a!IdtuI¯ saa!aaa[qo luamdolaaap pu~ I~luamuoa!Aua aaueI~q-aa o! ~tL~ldmaale uaaqauamuaaaoD qlleaaxuomtuoD axau aq! 966I qaa~lR m. aaaxod ol ~ .u~oa
"slo,~luoo
sax~laa qllPamuoututoD
s!~as a.~aqla~im o! alqs aaaax ’asnoH aaddfl aq! ol palaala saaqmam axau aql uaq~’k66IA~ Ig uo laajja ~IOOl s!qa. ’Aaols!q Sl.t tl.t am!l lsa!j aql aoj asnoH aadd~l atI!jo ioaluoa 1goI t~o!l!lgoD aqa uo!laaI~ a!l;lg 9661 aql jo atuoalno aql ~u!aaalJa~d
"966I.taqutaoa~I u.~ uo.~g.tlVOO
’VAN lUaaana aq! aapun slusm!sla ql!axaas!lo~au o! anu!luoa ol paau ii.~ax Xalsnpm. aq! uaql I!lUfl ’(paaaa{aa ao) passsdass sluatttpuams VAN aql aaojaq attt!l attlos aq pInoa !! s.~olsuaS luapuadapu!Oral ao/pus sa!!asd aou.m~ aql jo laoddns aq! saa!nbaa uo!lsls!~al aDDaa!lsu s,luattn~aaaoD qllsaaxuommoD aq! jo a~ssssd aq! lsq! t~aa!~’ssalaqlauoN
sa~aA aananj u!~ padoIaaap aq
aaom ~ 1~q! Xl!lT.q!ssod atttos aajjo Aaq.l~ "luam~!Ia~d qlI~aaxuomt~oD aql aaojaq
AllUaaana VJAI aq! ol sluampuatt~ L66I aql slaoddns Xip~oaq

position was dealt a major blow when Japan, which had been previouslyreceptive to Australia’s position, called for a 5% reduction in greenhouse gasesbelow 1990 levels. It therefore remains to be seen what the outcome of furthernegotiation will be.
1992 NationalGreenhouse Response
Strategy to be revamped.
Australia has, in the past, attempted to contribute in a fair and equitable wayto the international response on greenhouse. In 1992 a National GreenhouseResponse Strategy (NGRS) was adopted byAustralian governments. Followinga 1996 review of the strategy it was concluded that governments, stakeholdersgroups and the community need to do more to reduceAustralia’s greenhousegas emissions and to prepare for the potential impacts of climate change.
In 1997 a discussion paper - Future Directions for Australia’s GreenhouseStrategy - was released for public comment by the IntergovernmentalCommittee on Ecologically Sustainable Development. The paper providespossible actions across a range of industry sectors and sets out potentialmeasures on community information and education with the aim of reducinggreenhouse gas emissions.
Nonetheless, as of September 1997, the suggestions contained in the paperhave not been formally considered by Australian governments. The NGRS isexpected to be finalised later this year but it may need to be modified toincorporate Kyoto outcomes.
WA Government giveslegislative backing to itsMat’ine Parks policy.
The State Government has continued its policy of balancing environmentaland development objectives.
In November 1994 the State Government outlined its new policy for managingthe marine environment in a policy document titled"New Horizons in MarineManagement". As part of the process of framing the policy the Governmentannounced that year that future drilling exploration in the Ningaloo MarinePark was prohibited.
Key elements of the marine management strategy include: the provision ofclear access guidelines for petroleum explorers and developers in marineconservation reserves; a three-tiered approach to marine conservation reservecategories; and the establishment of a Marine ParksAuthority in which marineconservation reserves will be vested under the Conservation and LandManagementAct.
A key aspect of the policy was that the Minister for the Environment wouldobtain the consent of the Minister for Mines before creating any marine reserveor management zone within a reserve that would preclude petroleumexploration and development activities.
The November 1994 policy has been given legislative backing by amendments
to the Conservation and Land(CALM)Act and theWesternAustralian Petroleum
Acts. These amendments, applying both to petroleum and mineral exploration
and development,were proclaimed on 29August 1997. Drilling and sea floor
sampling is now prohibited in Marine Nature Reserves and Recreation and
some special purpose zones of Marine Parks.
sau!iap!n~ dn axaap 1! ’aaojaq ugql aaqlga’aaltg ~m.llnSuoa sg~a Dd.qN aq! lgql pau!gldtuoa pgq AalsnpuI ’Dd~N aq! Xquo!lgllnguoa aa!laq aot ’Xalgnpu!. ~u!u!m aql ~u!pnpu! ’Xalgnpu! moaj aanggaad~ttoalg pa~olIoJ g!q~ ’sINdRN aanlnt jo luamggagsg a!mouoaa pug’ImUamuoa!aua aql aot gau!iap!n~ uo pug gaanggam IgUO!lgu uoggau!gnq pug ~h!unmmoa aoj gloao!oad paaoaddg pug gal!gjo lttattlggaggg uo IA~d~N ~au g palg!l.m! ogle I!aunoa aq~ ’Xaoluaau! luglnllodiguo!lgtt g .toj (INd,[N) aanggam uo!laaload luamuoa!aua Igtlo!lgu g dolaaap o!paaYag 966I aaqmaaoN t~ Dd~IN aqlJo ~tn.laaKt V ’uo!lglg!~aI Imuamuoa!.aua~Iao~atttg.~j lualg!guoa ~ ap!aoad ol aaqla~Ol ~u.~f.to~ gaalg!u!m lUatuuoa!aua!~ol!aaa~pug almg ’l~aapa~I 1o slg!guoa Dd~IN aq~ ’~poq iguo!lgu Xpu! g 1!’966I aaqmaldag u! (Dd}tN) I!aunoD uo!laalOad luamuoa!auR IgUO!lgN aq! pau!o[
i!aunoD Ig!aals!m.I~pug luamuoa!au~qang’VH~agaaotaq’!Insaa g g¥ ’/-66I aaqmaldag ~;I uo pau~!g gg~ (VI-I~{Ig) gaaya~m!aaH
’Houno~9 uo!gaogo.tdll~guoutuo2,~au~
l~UO!l~N aql su.~of VAt
ala*aCl~ aql
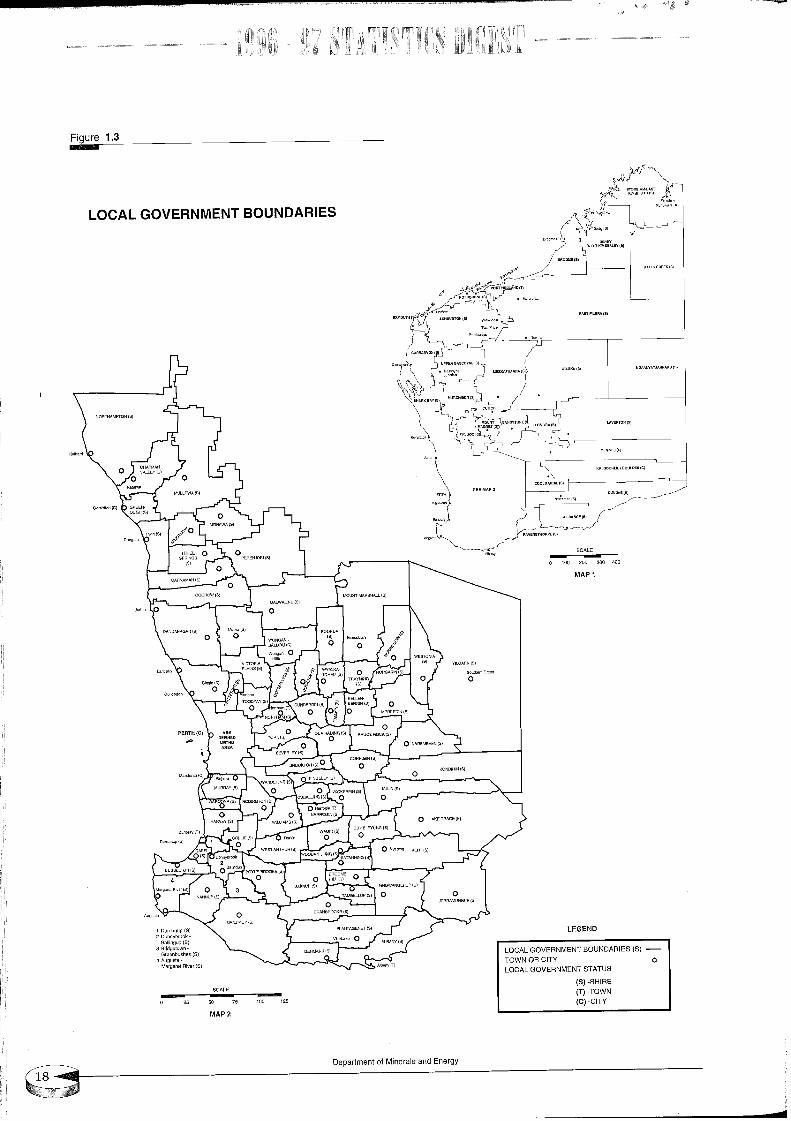
Figure 1.3
LOCAL GOVERNMENT BOUNDARIES
SCALE
0 25 5O 75
MAP 2
100 125
SCALE
MAP 1
LEGEND
LOCAL GOVERNMENTBOUNDARtES (S) --TOWN OR CITY OLOCAL GOVERNMENT STATUS
(S) -SH~RE(T) -TOWN(C) -CITY
Department of Minerals and Energy

OleluJn!ql!’l - uJnlm, Uel - U!l
lies
NOI991~10 L$V =10 $S3OX3 NI NOI/ORC]Ot:::ld 90 9RqVA 9VIqNNV NV H/I/W
Vl-IVl=llSrlv N~1~3133/~ NISlO=lrOHd INn=l’101d13d QNV "IVIg=INIIN ~IOPVIN

REVIEW OF MAJOR MINERALS AND PETROLEUM IN WA
2.1 Overview and Outlook
The value of mining and petroleum productionincreased by 7.0% in 1996/97 toA$16.4 billion.
The key sector contributing to this growth waspetroleum (upA$965 million) and iron ore (upA$235million). Commodity prices were mixed in theirmovements over 1996/1997, but the appreciation intheA$ over the year uniformly eroded the returns formost of the State’s mineral and energy producers.
Undoubtedly the highlight of 1996/97 was thecontinued surge in the petroleum sector, making itthe State’s first industry to produce more thanA$ 5,000million of product in a year. The petroleum industryhas entrenched its position as the State’s leadingresource industry and it now produces more than 30%of the State’s total value of mineral and petroleumproduction. Against this background it is notsurprising that Western Australia has maintained itsposition for the second consecutive year asAustralia’slargest oil producer.
Conditions in world iron markets improved in thelatter half of 1996/97 and this was reflected in a 8.1%rise in the value of iron ore. The gathering pace ofdownstream processing and increasing prominenceof newAsian markets augur well for an exciting future.
After alumina spot prices fell by 34% in 1996 priceshave firmed over the first half of 1997. Ironically theState’s alumina sector was protected from the eventsin world spot alumina markets because of highercontract prices settled prior to the 1996 drop in spotprices. As a result the value of the State’s aluminaproduction increased by 2% in 1996/97, due largelyto a 1.4% increase in production. The State’s goldindustry also increased its value of production by 1%,but this was achieved through higher output tocounteract a year of lower prices and a higherA$.
Other sectors were mixed. The nickel industrysuffered from lower prices, while buoyant marketshelped mineral sands to increase its value by 3.3%despite mineral sands production falling.
Deregulation of the gas market, commencement ofgas deliveries via the Goldfields Gas Pipeline coupledwith, in general, a favourable outlook forAsian growth
and commodity prices all suggest that the outlookfor WesternAustralia’s mineral and petroleum sectorsis bright.
Western Australia is expected to continue to be asignificant world player on many internationalcommodity markets. In 1996/97, Western Australiasupplied (by quantity) around 14% of the world’s ironore production, 10% of its gold production, 7% to 10%of its LNG production, 18% of its alumina production,12% of its nickel production; 32% of its zirconproduction and 30% to 40% of its diamond production(Figure 2.26).
The State’s prominence on the international mineralsscene is expected to be maintained well into the 21stcentury.
As of the June quarter 1997 the value of State miningand petroleum projects under construction was morethan A$5,000 million. In addition, as of June 1997,more than A$30,000 million worth of resourceprojects were either under consideration or listed asa possibility for Western Australia.
The Department of Minerals and Energy (Februaw 1997)has estimated that the value of the State’s mineraland energy industry is estimated to be in the rangeof AS21 -AS 24 billion in 2000/01. This translates intoan average annual rate of growth in production from1995/96 to 2000/01 of 7% to 9%. These forecasts areof course predicated on particular price assumptionsand most importantly, on the likelihood of newprojects advancing. For example, the value of aluminaproduction in a low growth scenario is estimated toincrease at an average annual rate of 6% based oncurrent facilities and production levels. However, ina high growth scenario, where it is assumed that allnew expansion plans reach fruition, the averageannual growth rate to 2000/01 for the value ofalumina output could be around 13% (Figure 2.27).
Department of Minerals and Energy

£6~eu3 pue SleJeU!lR ~o ;uetu#eda(]
~’~ oJn6!-Iaurar ~, u~a ’alaa :aoJnos
08
NOIIONOOEIa =IlVSN=IONOO ON~ 710 =IONEIO
%6’8%~,’L
%k’g JeqlopueleeZ
~eN
%L’69ued~r
NOl’l’lll/! I.SI.’t;$V : ~Q’IVA "lV.LO.LSIHOdX=I INn=JTOl:ll~]d
aseaaatq, a~aeI g!q£ "%gg punoae dn gem lndlno joanleA slI "lanpoad luea~u~F 1sore aql sgm’uo~I~[{ [ 6’ I SVPale~!sa u~ qlaom’uo~lanpoad I~O apnaD
’({’Z ~ Z’g
uo~lanpoad se~ s,~Wa!snvJo %0g punoa~ saanpoadOgle al~!g aql glsa~ns el~p 9661 aaqmaaaO¯ uo~!anpoad alesuapuoa pue Ho apnaas,~iealsnV jo %gg Xlale~!xoadd~ aoj palunoaaeal~lg aR! L6/966[ u1 ’aaanpoad E~naloalad
papnIau~ L6/966I aaao Aalsnpu!mnaioalad ue!iealgnV uaalga#A aq! jo glqS!IqS!H
oo£
slqo~!lqo~!H rdqsnlauI u;nalo.qad Z6/966I
"(I’E: aan~!~ (%6) ueax!e~ pue (%09) uedef 8u!aqguoIleU!lsap .~o{et[t aql qlDa slanpoad mnaloa!ad joqlao~a uo!II!tU [ g I ’{ $¥pmaodxa rams aqa’k6/9661 uI
uo!lanpoad u~naloalad
paluagaadaa g!q~£ ’uO!IlgU g{0’g$¥ qaeaa o! %~ Aq~u!g!a L6/966I u! mdlno jo anlea aq! qlpApue se~ ’I!o aoj lag aaa~ gpaoaaa alea uo!lanpoad
oR1 uaaq geq tunaloalad ~m.uuna aeaA pa!ql aq! ao~I
utnalo.,lad ~’~
CRUDE OIL PRICE: A$/bbl
33
32
31
29
27 II
26
!
24
Jul-95 Jan-96 Jul-96 Jan-97
Source: Brent Spot, Monthly Average Figu re 2.4
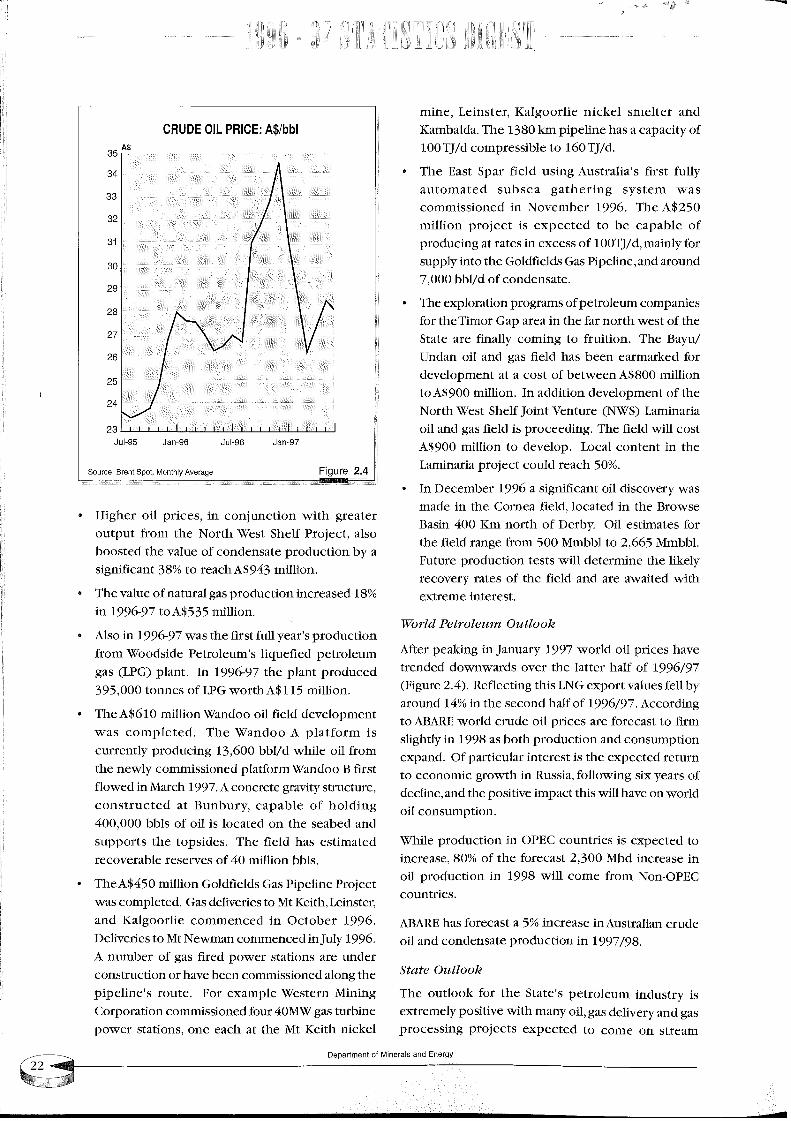
¯ Higher oil prices, in conjunction with greateroutput from the North West Shelf Project, alsoboosted the value of condensate production by asignificant 38% to reachA$943 million.
¯ The value of natural gas production increased 18%in 1996-97 toA$535 million.
¯ Also in 1996-97 was the first full year’s productionfrom Woodside Petroleum’s liquefied petroleumgas (LPG) plant. In 1996-97 the plant produced395,000 tonnes of LPG worth A$115 million.
° TheA$610 millionWandoo oil field developmentwas completed. The Wandoo A platform iscurrently producing 13,600 bbl/d while oil fromthe newly commissioned platformWandoo B firstflowed in March 1997. A concrete gravity structure,constructed at Bunbury, capable of holding400,000 bbls of oil is located on the seabed andsupports the topsides. The field has estimatedrecoverable reserves of 40 million bbls.
TheA$450 million Goldfields Gas Pipeline Projectwas completed. Gas deliveries to Mt Keith, Leinster,and Kalgoorlie commenced in October 1996.Deliveries to Mt Newman commenced in July 1996.A number of gas fired power stations are underconstruction or have been commissioned along thepipeline’s route. For example Western MiningCorporation commissioned four 40MW gas turbinepower stations, one each at the Mt Keith nickel
mine, Leinster, Kalgoorlie nickel smelter andKambalda. The 1380 km pipeline has a capacity of100 TJ/d compressible to 160 TJ/d.
The East Spar field using Australia’s first fullyautomated subsea gathering system wascommissioned in November 1996. The A$250million project is expected to be capable ofproducing at rates in excess of 100TJ/d, mainly forsupply into the Goldfields Gas Pipeline, and around7,000 bbl/d of condensate,
¯ The exploration programs of petroleum companiesfor theTimor Gap area in the far north west of theState are finally coming to fruition. The Bayu/Undan oil and gas field has been earmarked fordevelopment at a cost of between A$800 millionto A$900 million. In addition development of theNorth West Shelf Joint Venture (NWS) Laminariaoil and gas field is proceeding. The field will costA$900 million to develop. Local content in theLaminaria project could reach 50%.
¯ In December 1996 a significant oil discovery wasmade in the Cornea field, located in the BrowseBasin 400 Km north of Derby. Oil estimates forthe field range from 500 Mmbbl to 2,665 Mmbbl.Future production tests will determine the likelyrecovery rates of the field and are awaited withextreme interest.
World Petroleum Outlook
After peaking in January 1997 world oil prices havetrended downwards over the latter half of 1996/97(Figure 2.4). Reflecting this LNG export values fell byaround 14% in the second half of 1996/97. Accordingto ABARE world crude oil prices are forecast to firmslightly in 1998 as both production and consumptionexpand. Of particular interest is the expected returnto economic growth in Russia, following six years ofdecline, and the positive impact this will have on worldoil consumption.
While production in OPEC countries is expected toincrease, 80% of the forecast 2,300 Mbd increase inoil production in 1998 will come from Non-OPECcountries.
ABARE has forecast a 5% increase inAustralian crudeol and condensate production in 1997/98.
State Outlook
The outlook for the State’s petroleum industry isextremely positive with many oil, gas delivery and gasprocessing projects expected to come on stream
Department of Minerals and Energy

~6JaU3 pue SleJaU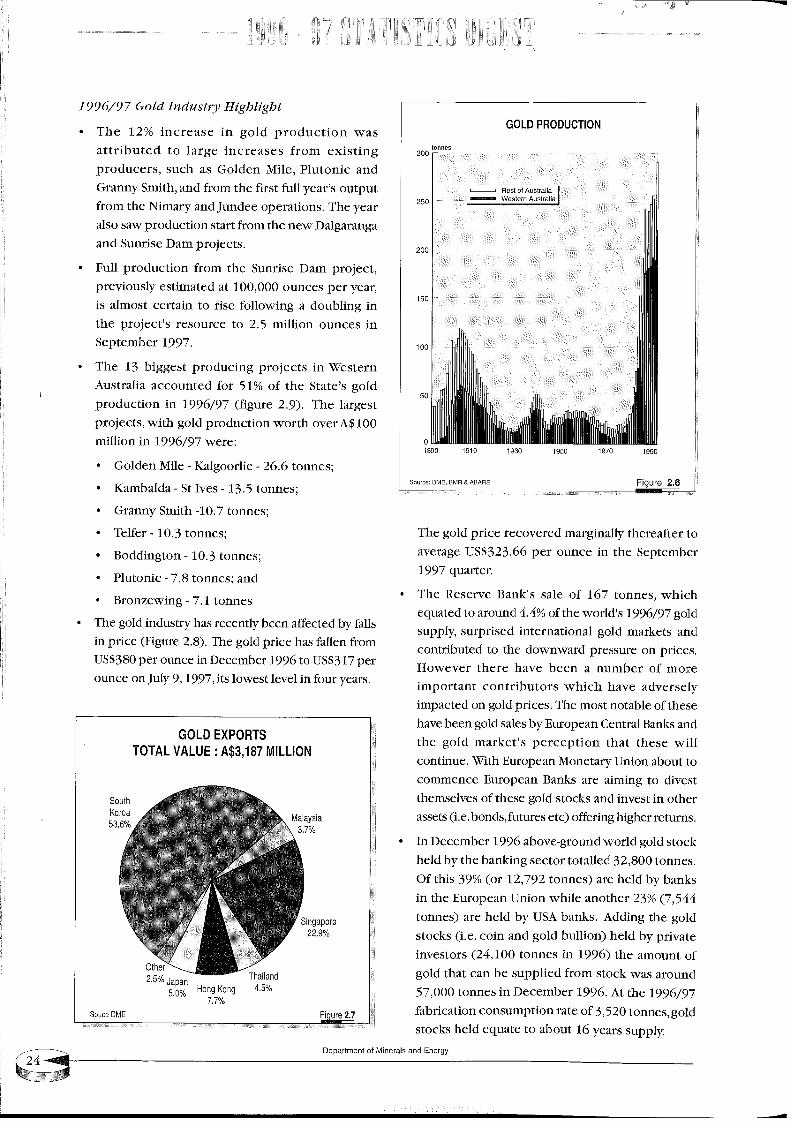
I9~96/9 7 Gold Industry Highlight
¯ The 12% increase in gold production wasattributed to large increases from existingproducers, such as Golden Mile, Plutonic andGranny Smith, and from the first full year’s outputfrom the Nimary and Jundee operations. The yearalso saw production start from the new Dalgarangaand Sunrise Dam projects.
¯ Full production from the Sunrise Dam project,previously estimated at 100,000 ounces per year,is almost certain to rise following a doubling inthe project’s resource to 2.5 million ounces inSeptember 1997.
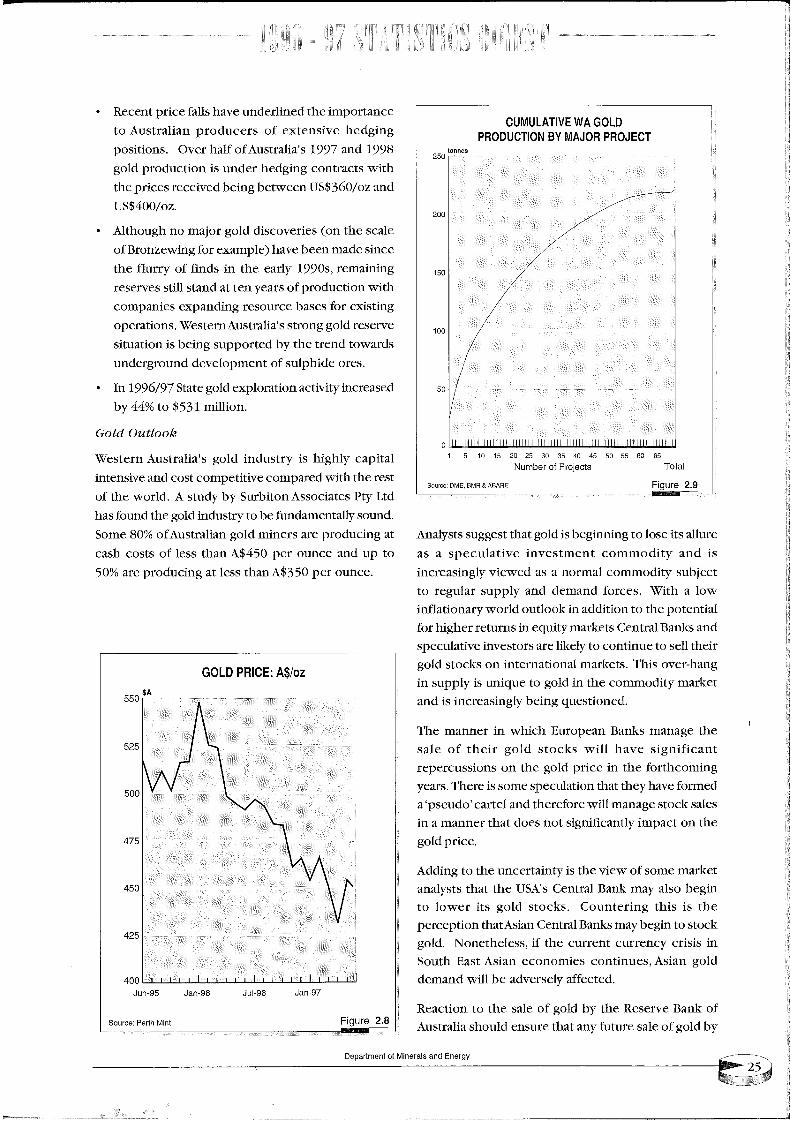
The 13 biggest producing projects in WesternAustralia accounted for 51% of the State’s goldproduction in 1996/97 (figure 2.9). The largestprojects, with gold production worth over AS 100million in 1996/97 were:
¯ Golden Mile - Kalgoorlie - 26.6 tonnes;
° Kambalda - St 1yes - 13.5 tonnes;
tonnes3OO
GOLD PRODUCTION
250
200
150
lO0
5O
o189o 191o 193o 195o 197o 199o
Source: DME, BMR & ABARE Figure 2.6
° Granny Smith -10.7 tonnes;¯ Teller- 10.3 tonnes;¯ Boddington- 10.3 tonnes;° Plutonic - 7.8 tonnes; and° Bronzewing - 7.1 tonnes
The gold industry has recently been affected by fallsin price (Figure 2.8). The gold price has fallen fromUS$380 per ounce in December 1996 to US$317 perounce on July 9, 1997, its lowest level in four years.
GOLD EXPORTSTOTAL VALUE : A$3,187 MILLION
SouthKorea53.6%
Malaysia3.7%
Singapore22.9%
OthE2.5% Japan
5.0% Hong Kong7.7O/o
Souce DME
Thailand4.5%
The gold price recovered marginally thereafter toaverage US$323.66 per ounce in the September1997 quarter.
The Reserve Bank’s sale of 167 tonnes, whichequated to around 4.4% of the world’s 1996/97 goldsupply, surprised international gold markets andcontributed to the downward pressure on prices.However there have been a number of moreimportant contributors which have adverselyimpacted on gold prices. The most notable of thesehave been gold sales by European Central Banks andthe gold market’s perception that these willcontinue. With European Monetary Union about tocommence European Banks are aiming to divestthemselves of these gold stocks and invest in otherassets (i.e. bonds, futures etc) offering higher returns.
In December 1996 above-ground world gold stockheld by the banking sector totalled 32,800 tonnes.Of this 39% (or 12,792 tonnes) are held by banksin the European Union while another 23% (7,544tonnes) are held by USA banks. Adding the goldstocks (i.e. coin and gold bullion) held by privateinvestors (24,100 tonnes in 1996) the amount ofgold that can be supplied from stock was around57,000 tonnes in December 1996. At the 1996/97fabrication consumption rate of 3,520 tonnes, goldstocks held equate to about 16 years supply.
Department of Minerals and Energy
~6Jeu~ pue Sl£Jeu!~ JO ;UaLU#edeG
6"~ eJn6!-I
lelO/£1oe[oJd ~o JeqLunN
Illl+lllllllHlllHIlillllllllllllllIIIllllltlllllll[litllttllllll[tll
seuuo
/O:lrOSd 8orvR h8 NOI/OllOOSd0"109 VA~ :IAI/V’IN~NO
o£
OOb
0£~
00~
8’g eJn6!-IlU!~ qpad :aoJnos
Z6-uep96-1np96-uep£6-unp00#
00£
¯ aauno aad 0g{$vu~ql ssaI 1~ ~u!anpoad aat %0go1 dn put aauno aad 0g>$V utq! ssaI jo slsoa qs~a1~ ~u!anpoad aa~ saau!m plo~ ut!Falsnyjo %08 amos¯ punos XIItluammptlrU aq o! !~iasnput. pio~ aql punoj s~q
PYl Ald sale!aossvuo!!q.mg Aq Apnls ¥ ’pFo~a aqa jolsaa aql q!!~ paatdmoa aa!l!ladmoa lsoa pu~ aA!sualu!.i~l!dta Xlq~!q s! Xalsnpu! p[o~ s,~!ltalsnv uaalsaAk
alOOllnO plOD
’zo/oo~$gIq_put zo/09~ $SI1 uaaaxaaq ~u!aq palqaaas saa,adql!~ sla~aluoa ~u!~paq aapun s! uo!lanpoad plo~~66I pu~ L66I s,t!I~alsnvJo JFR aaaO "stto!!!sod~u!~paq aA!suaaxa jo saaanpoad u~!Italsn¥ olaaumaodm! aql pau!Fapun aatq SlFJ aa!ad luaaaH
major Central Banks will be done in coordinatedmanner so as to reduce the current volatility in worldgold prices. It is not in the interests of Central Banksto dump gold haphazardly on international marketsas this could open them up to huge losses if the priceof gold were to fall significantly from current levels.World gold market analysts are uniting in their viewthat Central Banks have fixed an unofficial ceilingprice on gold of around US$330 per ounce. Australianproducers are cushioned somewhat from this lowergold price through the AS depreciation in 1997/98.
The likelihood of European Central Banks’ managingthe sale of their gold stocks is further strengthenedby the international market reaction to an October1997 report commissioned by Switzerland’s FinancialMinistry. The Report recommended the sale of 1,400tonnes of gold over a 10 year period commencing1999. While it is only a recommendation, which is yetto be formally considered by the Swiss Governmentand its Central Bank, the Report triggered a fall inthe gold price to US$307/oz in late October 1997,its lowest level in 12 years.
With international markets already concerned over theimpact on Australia’s growth of Asia’s currency crisis,the Report contributed to the AS falling belowUS$0.70. As a result the AS gold price remainedrelatively unchanged with gold trading at aroundA$450/oz in late October 1997.
According to ABARE in 1998 world gold productionis expected to rise by 3.8% to 2,502 tonnes. Demandis forecast to rise by 5.2% to 3,701 tonnes. The supply/demand imbalance will be made up from the sale ofstocks. The price of gold is expected to increase by2,7% to US$345 per ounce in 1998. Nonetheless,ABARE’s forecasts were done prior to the release ofthe Report by the Swiss Financial Ministry.
Despite a low gold price Australian gold productionis forecast byABARE to rise by 5.2% to 314.4 tonnesin 1997/98. A 3.8% depreciation in the US$/A$ will inpart recoup some of the gold price losses recorded inthe second half of 1996/97.
Growth over the next three years will be primarilyderived from existing gold projects and committednew projects. This expected production growth isthe result of several historical factors. Most importantwas the rapid increase in exploration expenditure,which to a large extent brought about the
development of a number of newly discovereddeposits such as Bronzewing (WA), Jundee (WA),Nimary (WA) and Cadia Hill (NSW).
The high levels of exploration expenditure, largelydriven by excellent cash margins, resulted inAustralia’s demonstrated resources ol~gold expandingfrom 2,129 tonnes in 1990 to more than 4,200 tonnesin 1996 - resources on which pr0ductlon growth inthe next three years will be principally based.
Despite the positive short term production outlook,
the Australian gold industry seems to have entered a
period of rising costs. This is a reversal of the early
1990s experience where production costs were falling.
Factors contributing to increasing costs include:
¯ a greater proportion of production being drawnfrom underground and deeper open cutoperations;
¯ increasing depth of operations result inincreased proportion of sulphide ore processedwhich raises processing costs; and
¯ likely increase in depth of new discoveries,raising exploration and mine developmentcosts.
These factors, together with a lower real gold price,are expected to result in a margin squeeze. ABAREforecasts suggest real cash margins for the Australiangold industry will fall byA$40 fromA$131 in 1996 toA$91 in 2002.
The changing world market trading environment forgold is likely, in future, to lead to further amalgamationswithin the Australian gold industry. By doing so theindustry will be able to enjoy better economies ofscale, hence lower production costs. If this strategyis pursued by the industryABARE’s real cash marginforecasts to 2002 are unlikely to eventuate. To date,the most significant amalgamation is betweenNormandy Mining and Great Central Mines. Underan August 1997 deal Normandy Mining will bankrolltwo separate takeover bids by Central Mines worthA$350 million (A$240 million for Eagle Mining andA$110 million for Wiluna Mines Ltd). In return,Normandy will acquire a 25% stake in Central Mines.If Great Central’s takeover bids of Eagle and Wilunaare successful the "amalgamated" company wouldbecome one the world’s largest gold producers. Asof 31 October 1997 the deal was as yet to becompleted.
Department of Minerals and Energy
"/-661 Alaea tu. paauattraxoaApnls Xl.q.tq.~s~aj-aad uo!IlgU OgSVV "mntm~ aadsauuol uo! .lI~tU gI ol dn aanpoad plnoaaa&qt aqo~t Aq ’uo!iI!m 000’I$¥Jo !goa g lg’a.~sodap s~ia~uV lSaA~ aql jo luamdolaaap
:apnptqasaq~ "~!I~alsnv uaalSaOA u.~ uo!!~aap!suoa aapun aopa!!.tmmoa Almaaana aa~ slaa!oad aao uo~jo aaqtunu V
¯ paa!nbaa osF s.~ L!!a~d~a ~u!p~oI pu~ ~uT.I!d~Iaolsaao jo uo!su~dxa aaaqax ’aa!dm~(I jo laodol a .trgu oopu~aa~l~ luasaad aq! moaj :$*O~AlaU~r4.1s!xa aql Jo tlo!sualxa ttDt£}I ~ snId Jlasl! au.tmaq! aq lI.~ax lsoa laa[oad aq! ~o luauodtuoa u!~tu aqx’666I u.t oa~aals uo amoa o! palaadxa s! aao uoa! jotuntra~ aad atraol UO!l~.m ~ I ~anpoad laa[oad uo.q .I~gOkSVaq~ ’sagqI!d aql u.~ au!m aao uoa! gu!~ooa!pugxaql doIaaap plno~ 1! !~ql paaunouu~ UOalXalsaatu~H ~66I aaqmaldas tq punoa$~Ia~q s!q!
’aIqranoag, IXlamaaaxa s.~ Xaasnpu! aao uoa! S,alglg aql aoj~tOOlmO aql’e.tsVaOJ Alaglna!aaed’sagaA aA.tj 1xagt aq! aojls~aaaoj la~ta~ttt Iaals 8m.uoaSanq ~ ql.DA "adoan,q o!sao~ aapm.~tuaa aql al!q~ g!svaoJ pau.tlsap aag slaodxa
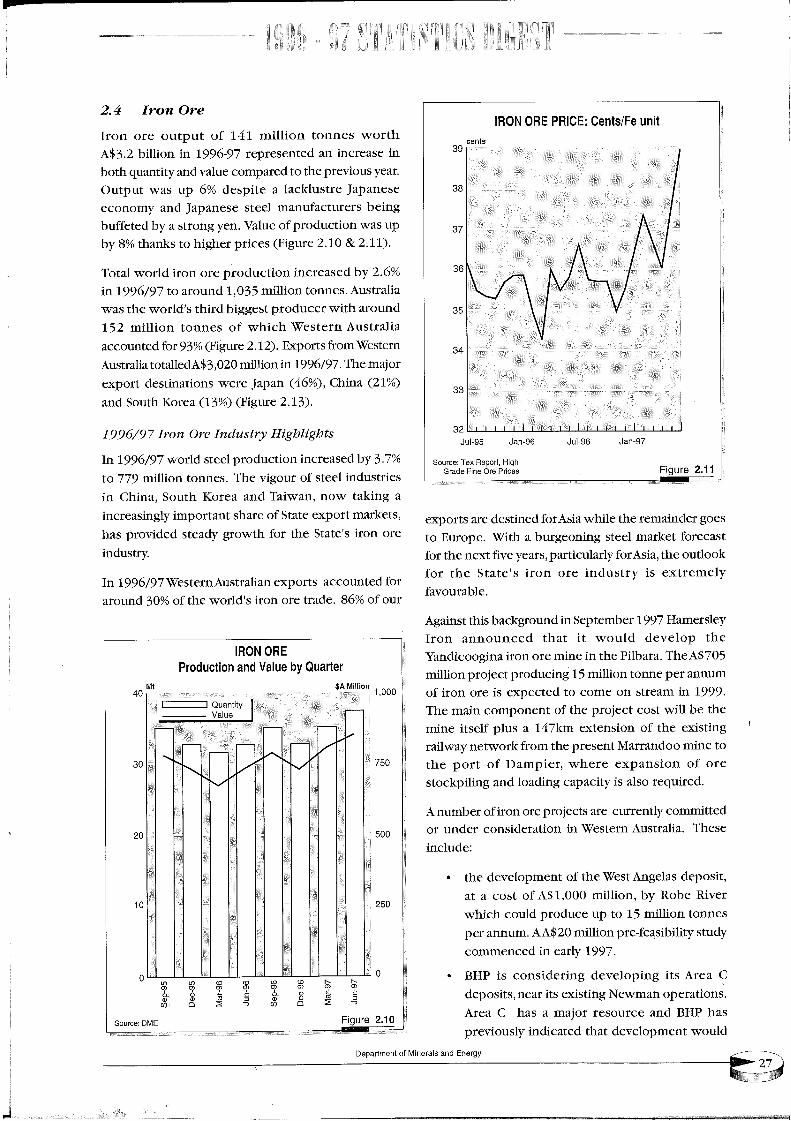
qf!H ’#odekl xe± :aoJnoS
Z6-uep96-1np96-uep£6-1np
9~
L~
8~
l!un e-I/s|ueo :~OIEld iiIElO NOEII
6~
~ I.’~ eJn6H
SIUaO
o
o£g
0SL I
O~
o~
o~
000’ ~UO!ll!~l V$
~a|~eno ~q anle^ pue uo!lonpoM~]l:lO NOEII
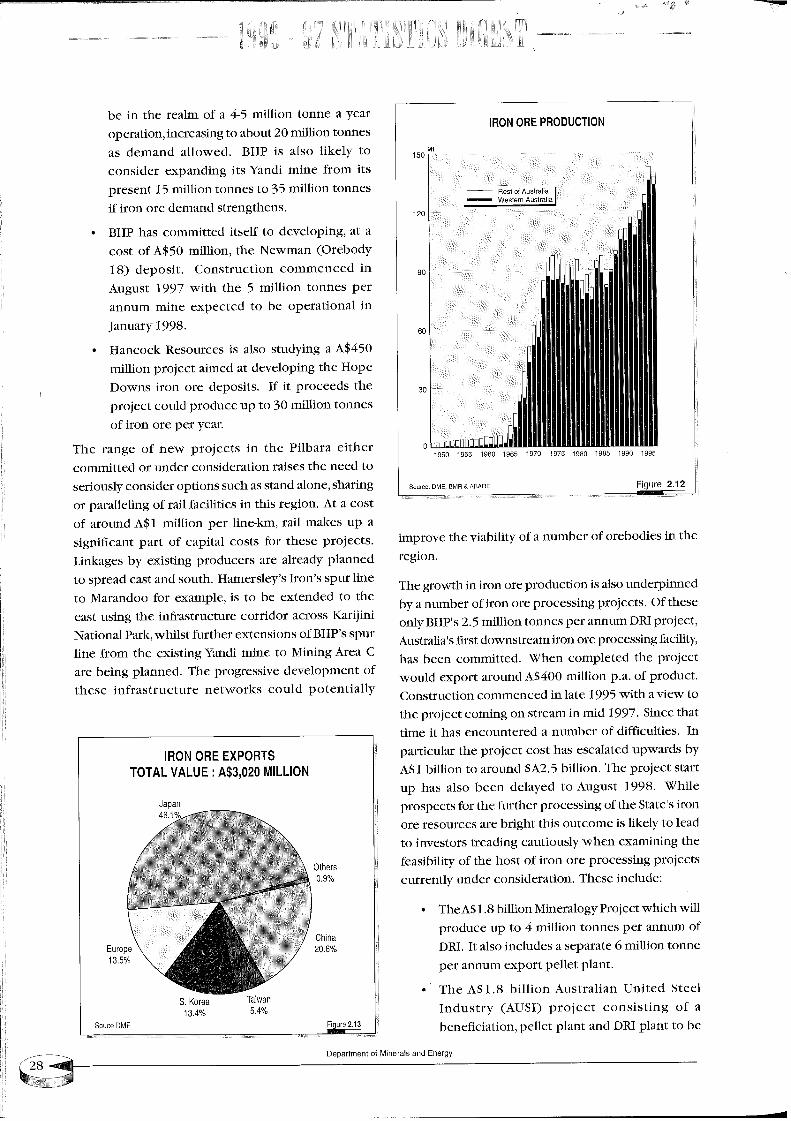
ano ~o %98 ’apgal aao uoa.~ s,pIao~ aq! jo %0{ punoagaoj palunoaa~ slaodxa ug!IgalsnvuaalSaAk k6/966T uI
’Aalsnpm.aao uo.q s,al~lg aql itoJ ql~xoa~’sla~la~m laodxa al~lg jo aa~qs lt,~laodtu.~g ~u!:,Iga ~ou ’ug~x!g~L pug gaao2,I qanos ’gu!qDsa!.ugnpu! iaaas jo ano~!a atlZ ’gauuo! uo!I .lYtU
%L’{ Xq pagga.I~u! uo!aanpoad iotas plao~/_6/966t uI
slqCd.zlqcd.ZH £zlsnpuI aaO uoaI Z6/9661
’({T’Z aan~H) (%{T) gaao2� qlnos pug(%TE) g~qD ’(%9~) ugdgf aaaax suo!lgu!lsap !aodxaao!~m at[L ’L6/966T m. uo!ii.~tu O~0’{$¥PalimO!uaalsaA~ moa~ slaodx.q "(~’Z aan~!~ %{6 aoj palunoaa~g!lgalsnv uaa!saAk qa!qax jo sauuol UO!lI!m EgTpunoae ql!ax aaanpoad !sa~!q pa.~q! s,plaom aqleWalsnv "gauuoa uo! .llFtU g{O’[ punoa~ ol L6/966I
%9"g Xq pag~aaau! uo!lanpoad aao uoa.t plaom ImOX
’Q T’E :~ OT’Z aan~.EI) saa!ad aaq~!q o1 s~tugqa %8 Xqdn sgax uo!aanpoad jo anFA "uaA ~uoals g Xq paaajjnq~u!aq saaanla~jnu~tu Iaaas asauedef pue Xmouoaaasauedef aalsnppeI ~ a!!dsap %9 dn s~ax lndlno:¢~aX sno!aaad aql o1 paaedmoa anFa pue Xl!ltr~nb qaoq~ as~aaau.t u~ paauasaadaa L6-966I u.t UO!lI!q ~’{$Vqlao~a sauuol tIo!lI!tt~ I}[ jo lndlno aao uoaI
/
be in the realm of a 4-5 million tonne a yearoperation, increasing to about 20 million tonnesas demand allowed. BHP is also likely toconsider expanding its Yandi mine from itspresent 15 million tonnes to 35 million tonnesif iron ore demand strengthens.
¯ BHP has committed itself to developing, at acost of AS50 million, the Newman (Orebody18) deposit. Construction commenced inAugust 1997 with the 5 million tonnes perannum mine expected to be operational inJanuary 1998.
° Hancock Resources is also studying a A$450million project aimed at developing the HopeDowns iron ore deposits. If it proceeds theproject could produce up to 30 million tonnesof iron ore per year.
The range of new projects in the Pilbara eithercommitted or under consideration raises the need toseriously consider options such as stand alone, sharingor paralleling of rail facilities in this region. At a costof around A$1 million per line-km, rail makes up asignificant part of capital costs for these projects.Linkages by existing producers are already plannedto spread east and south. Hamersley’s Iron’s spur lineto Marandoo for example, is to be extended to theeast using the infrastructure corridor across KarijiniNational Park, whilst further extensions of BHP’s spurline from the existing Yandi mine to Mining Area Care being planned. The progressive development ofthese infrastructure networks could potentially
IRON ORE EXPORTSTOTAL VALUE : A$3,020 MILLION
Japan46.1
Others0,9%
ChinaEurope 20.6%13.5%
S. Korea Taiwan13.4% 5.4%
Souoe DME ~ I
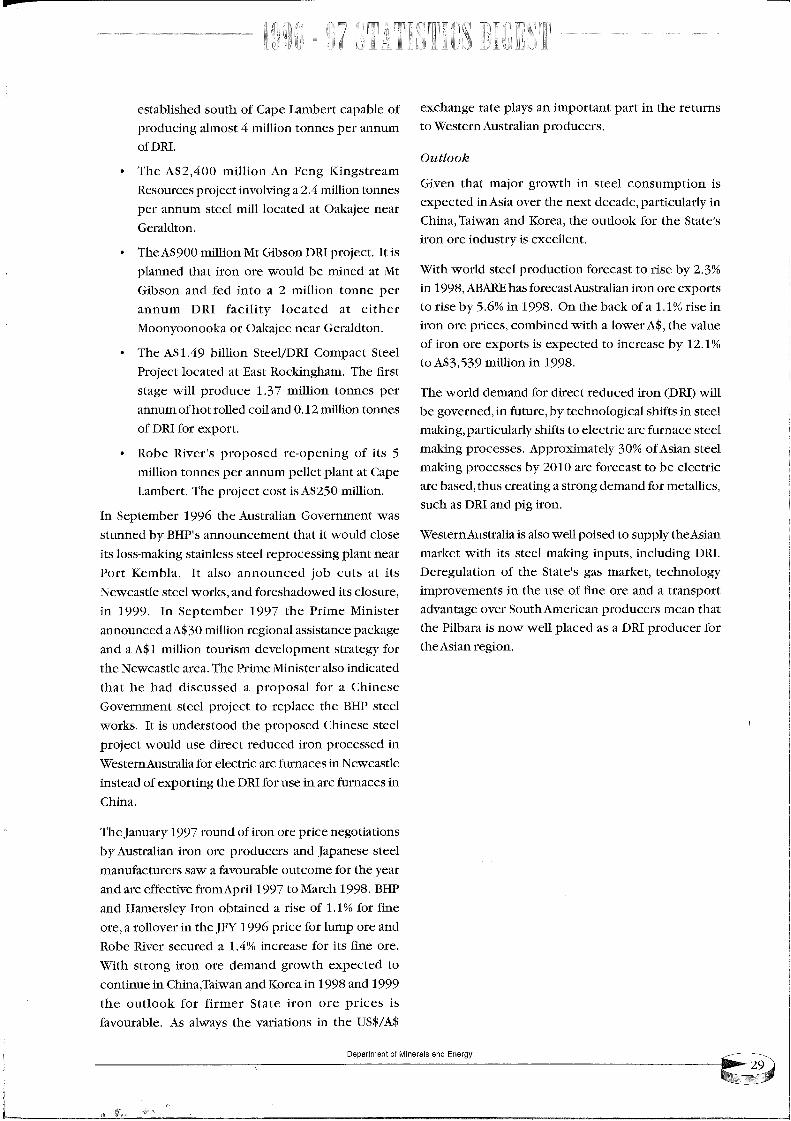
IRON ORE PRODUCTION
Mt150
~ Rest of Australia
90
60
1950 1955 1960 1965 1970 1975 1980 1985 1990 1995
Seurce: DME, BMR & ABARE Figure 2.12
improve the viability of a number of orebodies in theregion.
The growth in iron ore production is also underpinnedby a number of iron ore processing projects. Of theseonly BHP’s 2.5 million tonnes per annum DRI project,Australia’s first downstream iron ore processing facility,has been committed. When completed the projectwould export around A$400 million p.a. of product.Construction commenced in late 1995 with a view tothe project coming on stream in mid 1997. Since thattime it has encountered a number of difficulties. Inparticular the project cost has escalated upwards byA$1 billion to around $A2.5 billion. The project startup has also been delayed to August 1998. Whileprospects for the further processing of the State’s ironore resources are bright this outcome is likely to leadto investors treading cautiously when examining thefeasibility of the host of iron ore processing projectscurrently under consideration. These include:
The AS 1.8 billion Mineralogy Project which willproduce up to 4 million tonnes per annum ofDR[. It also includes a separate 6 million tonneper annum export pellet plant.
The A$1.8 billion Australian United SteelIndustry (AUSI) project consisting of abeneficiation, pellet plant and DR[ plant to be
Department of Minerals and Energy
uoa! ~!d pus RIO ss qans
a!alaala aq ol lssaaaoj aas 010g Aq sassaaoad ~UplStU
Iaals us!sVJO %0{ Xlalstu.~oaddv ’sassaaoadIaals aasua~g aas a!aaaala o1 slj!.qs Alaslna!aasd’~uptstu
Iaaas u! slj!qs Isa!~olouqaal Aq ’aanlnj tg. ’pau.taao~ aqII!ax (Pd(I) uoa! paanpaa laaa!p aoj pustuap pIaom
"g661 u! uo!II!m 6{g’{$V o1%I’E[ Xq assaaau! ol palaadxa s! slaodxa aao uoa! joanFa aq!’$Vaaa~oI g t[l!~ pau!qmoa ’saa!ad aao uoa!tq asia %I’I s jo ~tasq aq! uo "8661 m. %9’g Aq as!a olslaodxa aao uo.q tts.qsalsnvlsgaaaoJ sgq ~IV~V ’866[ u~.%{’g Aq asia ol lssaaaoj uo!lanpoad iaals plaoat ql!Ak
lUallaaXa s! Xalsnpu! aao uoa!s,almS aq! ao3 ~IooDno aq! ’saaoN put ug~!s~’su!qDu! Xlaslna!lagd’apgaap lxau aql aaao s!s¥ u! palaadxas! uo!ldmnsuoa Iaals m. q!a~oa~ ao!gm 1gill tlaA!9
alOoHno
saaanpoad lIs!lgalsnv IIJalSa~ O1
sttanlaa aql u! lasd ltIg!aodttt! US SXsld alga a~usqaxa
~o ;uemlJede(]
s! saa!ad aao uoa! alslS aamaU aoj ~toollno
666I pus 866[ u! saaoN pus usax!ga;’s .uvqD m. an~luoaol paDadxa q!axoa~ pustuap aao uoa! ~uoals ql!A~¯ aao atttj Sl! aoj assaaau! %}’1 s paanaas aaapd aqo11put aao dtunI aoj aa!ad 966I Adf aq! u! aaaOllOa s ’aaoatu./aoj %I’I jo asia s pau!glqo uoaI XalSaamSH pusdHIt "866t qa.~slN o!/66I F.advtuoaj aa!laajja aag putasaA aq! aoj atuoamo alqsanoaN s axes saaanlaNnustuiaals asausdsf pus saaanpoad aao uoa! us!Isalsnv Xqsuo!lsDo~au aa!ad aao uo.q jo punoa k661 Msnugf atlj;
laodxa aoj I~I(I josatmol uo! .llgU EI’0 put l!.Oa PallOa lOqjO tuntrugaad sauuol uo!II!tu k{’I aanpoad II!ax1sag aR~ ’tugtI~Uppol[ lss~ ls palsaoI laa!oadIaalg lasdmoD Ilt(I/Iaalg uo!II!q 6}’15V atI~;
¯ uolpFaa9 asau aa!s~FO ao s~IoouooXuoo!Naaql!a ls palsaoI Al!I!aSJ Ilt(1 tunuusaad auuo! uo!II!tU E s olu! paj pus uosq!91IN ls pau!m aq pinata aao uoaj. tstll patmglds! 1I ’laa[oad Pd(I uosq!9 1IN uo..gl!tu 006$vaq~ ¯
’uolplgaa9
mgaals~u!N ~Uad uv uo!IlIm O0~’gSV aq~L
"I11(Uou~nuus aad satmol UO!lI.rtu } lsotuF ~u!anpoad

2.5 Alumina
The State’s alumina output increased by around 1.5% toreach 8.3 million tonnes. Average contract pricesreceived byAustralian producers in 1996-97 were up by3% on the previous year. Total value of production wastherefore higher by 2% to reachA$2 billion (Figure 2.14).Again, this value could have been greater had it notbeen for the offsetting effect of an appreciatedAustralian currency in 1996-97.
WesternAustralia produced 63% of Australia’s aluminain 1996/97 (Figure 2.15).
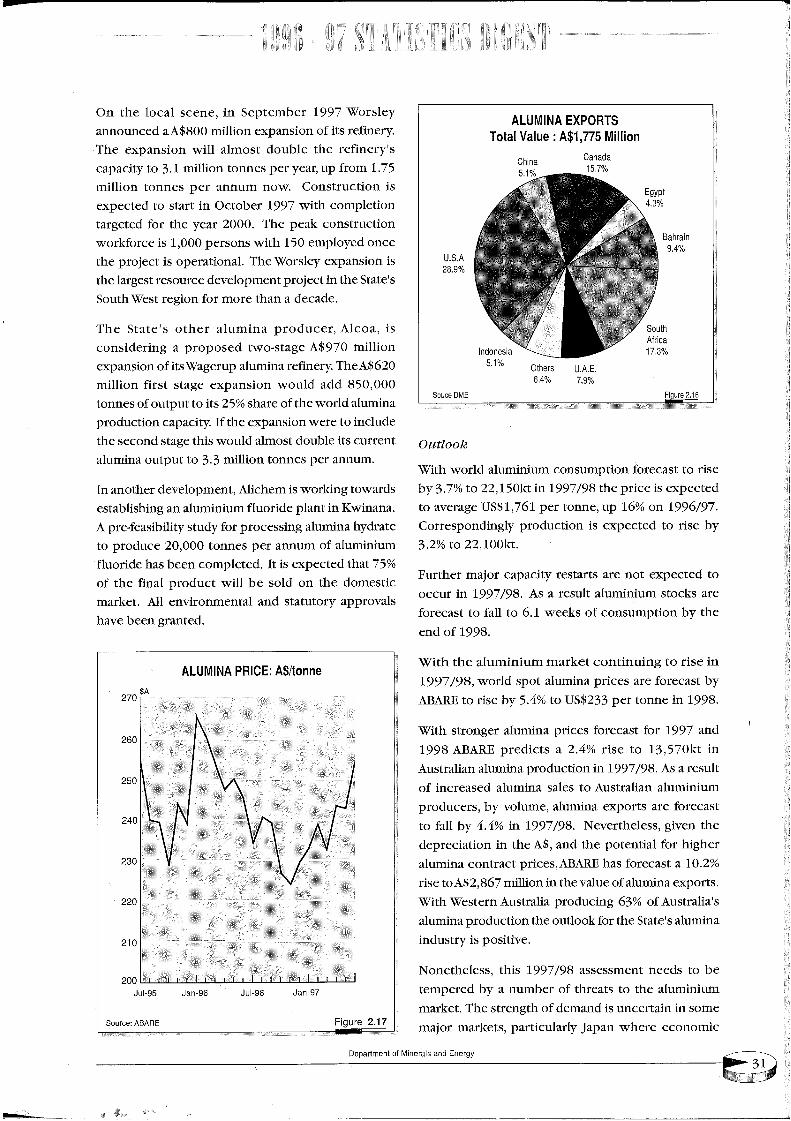
Around 90% of the State’s production was exportedoverseas. The USA (29%), SouthAfrica (17%), Canada(16%) and Bahrain (9%) were the State’s predominantalumina export markets (Figure 2.16).
1996/9 7 Alumina Industry Highlights
In 1996/97 world alurnininm markets were buoyant.
Production and consumption increased by 3.0% and
4.3% respectively but more importantly aluminiumstocks have been falling. Stocks are expected to fall
to around 6.5 weeks of consumption by the end of
1997, down from 7.9 weeks in 1996. Nonetheless,there is still some speculation in the market that not
all aluminium stocks are accounted for.
With a number of capacity expansions the aluminiumprice fell by 9% to average US$1,513 per tonne in
ALUMINAProduction and Value by Quarter
Mt SA Million600
2.0
1.5
1,0
0.5
5O0
400
300
2O0
100
Source: DME Figure 2.14
1996/97. However the underlying demand strengthin the aluminium market, largely driven by OECD andUSA consumption growth, has resulted in substantialprice increases in the September 1997 quarter, withthe aluminium price closing above US$1,600 pertonne.
ALUMINA PRODUCTION
Mt
12
1960 1965 1970 1975 1980 1985 1990 1995
Source: DME, BMR & ABARE Figure 2,15
In the first half of 1996/97, the alumina market wasalso highlighted by downward pressure on the worldspot price which emanated from increased capacityas producers began to restart projects which weremothballed by the memorandum of understandingreached between aluminium world producers overtwo and a half years ago. With rising demand andcapacity constraints emerging in the second half of1996/97, world alumina spot prices began to risemarkedly (Figure 2.17). Over 1997ABARE has forecastalumina prices to rise by 27% to US$221 per tonne in1997.
In a nutshell, the consensus of forecasters is that in1997/98 both LME and producer aluminiuminventories should decline further as world economicgrowth translates into increased orders for aluminiumproducts by manufacturers.
Manufacturers are also expected to rebuild stocks toensure they can meet rising demand. This translatesinto a positive 1997/98 market outlook for alumina.
Department of Minerals and Energy
~6Jeu9 pue SleJeu!~ jo lueLupedeG
lL’g eJnl~!-I3NVSV :aoJno£
Z6-uep96-1np96-uep£6-1np00~
’I~I00I’EE oaAq asta o1 paaaadxa st uotlanpoad AI~u!puodsaaaoD’/_6/966I uo %9I dn ’auuo! aad I9/-’I $SFI a~gaaag olpmaadxa s! aa!ad aql 86/L66I m. l~t0gI’~ ol %k’{ Aqas!a o1 lsgaaaoj uotldmnsuoa mntu!tunlg plaom
alooBno
3~1~ oono£%6"L%#’9
e!seuopul
qlno£
%6
UO!ll!~ £LL’LSV : onleA lelOiS/HOdXa VNIOnlV
¯ ranting aad sauuo! UOfllttU {’{ ol lndlnoluaJana slt alqnop lsOtUlg plnoax S!ql a~ms puoaasapnput o1 aaam uotsugdxa aql JI ’Altagdga uotlanpoadgt .munlg pFoax aqljo a.tgqs %g~ s!! ol red,no jo sauuol000’0g~ PPg PIhoax uo!sugdxa aBg!s lsa!j uo!II!m0g9$Vaq£ ’Aaau!jaa gutumlg dnaa~e~sl! jo uo!sugdxauOtllttU Ok6$V a~glg-O~al pasodoad g ~u!aap!suoas! ’goaIV ’aaanpoad gu!mnlg aaqlo s,alglg
apgaap g ugql aaom aoj uo!~aa lsaAxqlnoss,almS aq! m. aaa[oad luamdolaaap aaanosaa lsa~agI aqls! uo!sugdxa AalgaOAX aq~L "Fuo!leaadoaauo pa*oldma Og I qlDa suosaad 000’I s! aaaoJ~taoa~uo!aana!suoa ~Igad aq~L "O00E agaX aql aoj paaa~amuo!laldmoa qlpa L66I aaqolao ut lag!s ol palaadxast uotlanalsuoD ’axou mnuug aad gauuoa uotlI!mgk’I tuoaj dn ’agaA aad sauuo! uo! .llfms,Xaau!jaa aql alqnop lSOmlg |IDA uo!sugdxa¯ XaautJaa g!! jo uo!sugdxa uo!iltm OOR$Ve paaunouugAalgaoAx L66I aaqmaadag ut ’auaas igaoi aql uO
growth forecasts have been wound down. Thesituation surrounding Russia is also unclear,specifically, no one is sure of the country’s indigenousdemand situation and hence, Russian metal availablefor export. Foremost is the question regarding howquickly the amount of idle capacity will be returnedto production. Currently around 800,000 tonnes ofworldwide smelter capacity remains idle. The highcost nature of some of this may prevent it from beingrestarted, but considerable potential still exists foradditional production to come on stream relativelyquickly.
The longer term outlook is that high prices willcertainly encourage at least some new production andrising stocks, especially after 1999. This will putrenewed downward pressure on prices depending onthe extent to which current smelter expansions goahead.
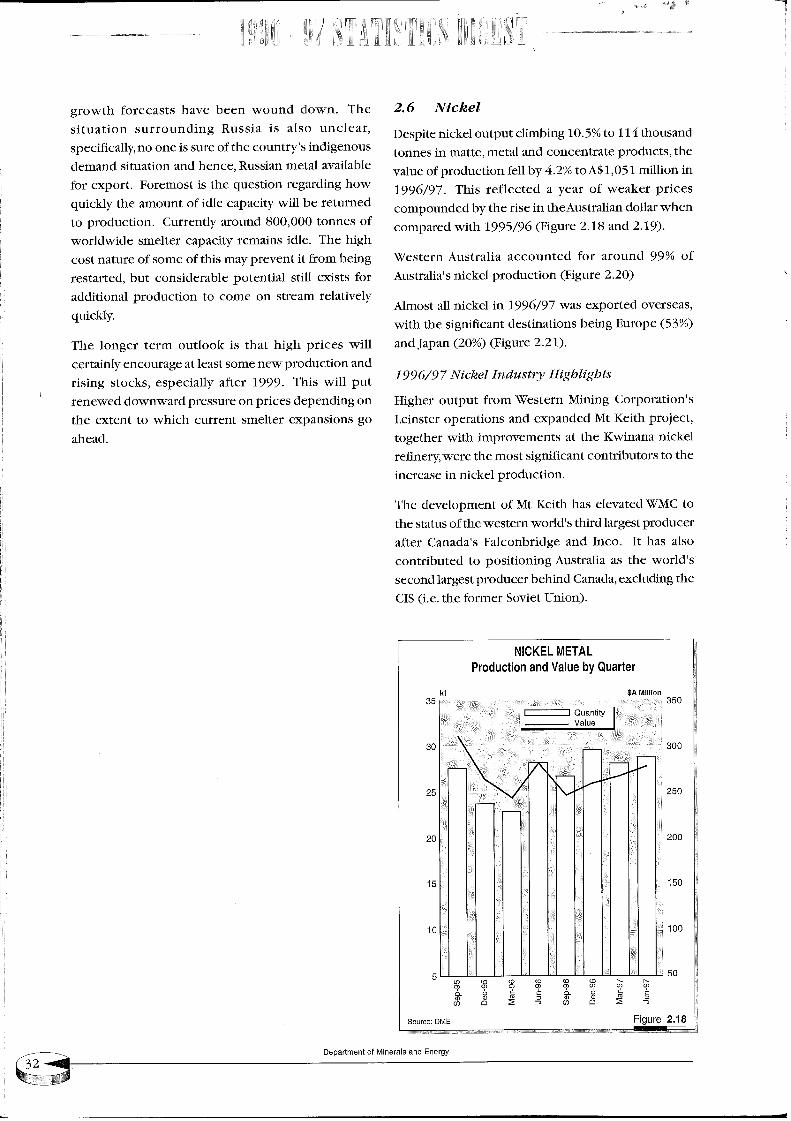
2. 6 Nickel
Despite nickel output climbing 10.5% to 114 thousandtonnes in matte, metal and concentrate products, thevalue of production fell by 4.2% toA$1,051 million in1996/97. This reflected a year of weaker pricescompounded by the rise in theAustralian dollar whencompared with 1995/96 (Figure 2.18 and 2.19).
Western Australia accounted for around 99% ofAustralia’s nickel productiorf (Figure 2.20)
Almost all nickel in 1996/97 was exported overseas,with the significant destinations being Europe (53%)and Japan (20%) (Figure 2.21).
1996/97 Nickel Industry Highlights
Higher output from Western Mining Corporation’sLeinster operations and expanded Mt Keith project,together with improvements at the Kwinana nickelrefinery, were the most significant contributors to theincrease in nickel production.
The development of Mt Keith has elevated WMC tothe status of the western world’s third largest producerafter Canada’s Falconbridge and Inco. It has alsocontributed to positioning Australia as the world’ssecond largest producer behind Canada, excluding theCIS (i.e. the former Soviet Union).
35
NICKEL METALProduction and Value by Quarter
$A Million350
Quantity
25 250
20 200
10 : : : 100
Source: DME Figure 2.
Department of Minerals and Energy
0~’~ ran!!4
0
O~
09
08
NOllOnOOEld 7~DIOIN
a!8(l eono£
JeLI~O
%67£edmn9
NOI’I’IIIR 9W~$V : ~tn’IVA "IV±01Sl~lOdX~ 7=I)IOlN
"uo!I .lgtU 0g{$vpunoat lgoa lI!~’ql!~ papaaaoad uaq~put j.~’o~j~ agtqd "(oH astqd) It!am Ia}Ia!u jo mnuutaad sauuol 000’gg ol paputdxa aq plnoa !aa!oadaqJ~ "866I AtI~ u! palaadxa ~u!uo!s~!mmoa q!!~/-66I lJ.advu! paauammoa auo agtqd jo uo!!ana!suoD¯ !it4oa jo mnuut aad gauuoa 00/- put ltlamia~ia!u jo tuntmt aad gatmo1000’6 aanpoad put uo..qlFtU00gSV !soa o! palaadxa g.~ laa!oad aql jo auo agttId¯ lFodap !ltqoa/la~Ia!U ~uoln{t aq! jo luamdoIaaapo! jlagl! pall.nJJmOa prl amloga~I 9661 aaqmaldag uI
pal!!mmoa Xtluaaana aat glaa!oad Ia}p!u jo aaqmnu V
’/-66t jo pua aq! spat~o! dn aptm aq o! palaadxa ssoIuo!!anpoad art1 tll!~’qluotu t lnoqt aoj u~op lnqg gl~aa!iams aqj~ ’tuaoj allttu u! Ia~ta!u jo sauuo! 000’8put 000’/- uaa~laq jo gso[ tIo!lanpoad t paltttq.lga g~ttDI~Ak ’/-66I l!advu! aalIares aRaoo~FN ~!! It pa~dtlIOa
la~ st~/-6/966I u! uo!Dnpoad ~,DI~AkXlaltunl.~oJUCl
6 V~ eJn6[z]a6ma^v ~lqlUOlA] ’qseo 91A17 :eoJno8
Z6-uep96-1rip96-uep96-1np
8
ouuo1/$V ::~OIl:ld "I=I)IOlN
0~

The A$220 million Cawse nickel/cobalt project isexpected to be commissioned in August 1998. The
project will produce 8,700 tonnes per annum of
nickel and 2,000 tonnes per annum of cobalt (as
sulphide).
Significantly, Bulong, Murrin Murrin and Cawse, arebased on laterite ores. These have been previouslyshunned by Australian producers in favour of moreeasily treated sulphide deposits. The processingmethod proposed for these new laterite nickelprojects inWesternAustralia has the potential to altersignificantly the State’s nickel supply picture.
Some market analysts suggest that because of theimproved processing method, the unit costs of theselaterite deposits will be around US$1/lb less than thoseof Western Mining’s Kambalda operations,which havebeen estimated at US$2.18/lb in 1997/98.
Long term price uncertainty threatens the worldnickel market because a number of projects arecoming on stream, the most important of which isCanada’s Voisey Bay project (discussed below).
The low unit cost of the Bulong, Muffin Murrin andCawse projects will shelter them from a substantialfall in the world nickel price which in June 1997 wasaround US$ 3.25/lb.
It should be noted that unit costs atWestern Mining’soperations have been falling. In the September 1997quarter the Company indicated that overall unit costsfor all its nickel operations were around A$2.00/lb.
Mining Project Investor’s (MPI) newA$46 Silver Swanmine development came on stream in late 1996/97.First deliveries to Outokumpu’s smelter commencedin May 1997. Nickel output of around 10,000 tonnesper annum is expected from this project.
Other State nickel projects currently underconsideration include:
¯ Carr Boyd (Defiance Mining);
¯ HoneymoonWell (CRA-Outokumpu);
¯ Lake Johnston/Maggie Hayes (Forrestania Gold-
Gencor Ltd); and
¯ Yakabindie (Dominion Mining-North Ltd).
Outlook
In 1997/98 world supplies of stainless steel scrap are
expected to tighten. In addition world economic
conditions are expected to improve resulting inincreased stainless steel production and associatednickel demand.
Over 1997/98, nickel stocks, currently estimated ataround 8.6 weeks of WesternWorld consumption,willbe slowly drawn down. By the end of 1998 worldnickel stocks are expected to be around eight weeksof Western World consumption.
World 1997/98 US$ nickel prices are, therefore,forecast byABARE to rise by 2.4% to US$7,395 pertonne. The depreciation in the AS over 1997/98should also help nickel producers to recover someof the US$ price losses derived in 1996/97 from lowerworld nickel prices and a higher AS.
The outlook for the State’s nickel industry isfavourable. With Murrin Murrin, Cawse and Bulongexpected to come on stream in 1998 the resultingincreased State nickel output should maintain theindustry’s current position as the State’s fifth largestminerals and energy sector.
In the longer term the consensus is that prices willdecline to some lower base level. Western worldproduction is already at a record and a number of newprojects, not including those inWesternAustralia, areexpected to come on stream before the year 2002. In1998 production is expected to commence atFalconbridge’s 20,000 tonne a year Raglan concentrateoperation in Canada and Mineracao Corumbaense’s10,000 tonne a year Fortalesza de Minas refinery inBrazil.
In analysing the effects of increased production onprices, it needs at least to be balanced by the buoyantoutlook for demand for nickel in stainless steelproduction. ABARE data suggests world nickelproduction has increased by around 4.7% per annumsince 1992/93 which means demand is increasing byabout 40,000 tonnes per annum on average.
The most significant of new projects is Inco’s giantVoisey Bay deposit in eastern Canada. Initialproduction from this project alone is estimated at60,000 tonnes per annum, to rise eventually to122,500 tonnes. This suggests Voisey Bay could beproducing around 10% of the world’s nickel by theyear 2000. Not only its size, but also its proximity to
Department of Minerals and Energy
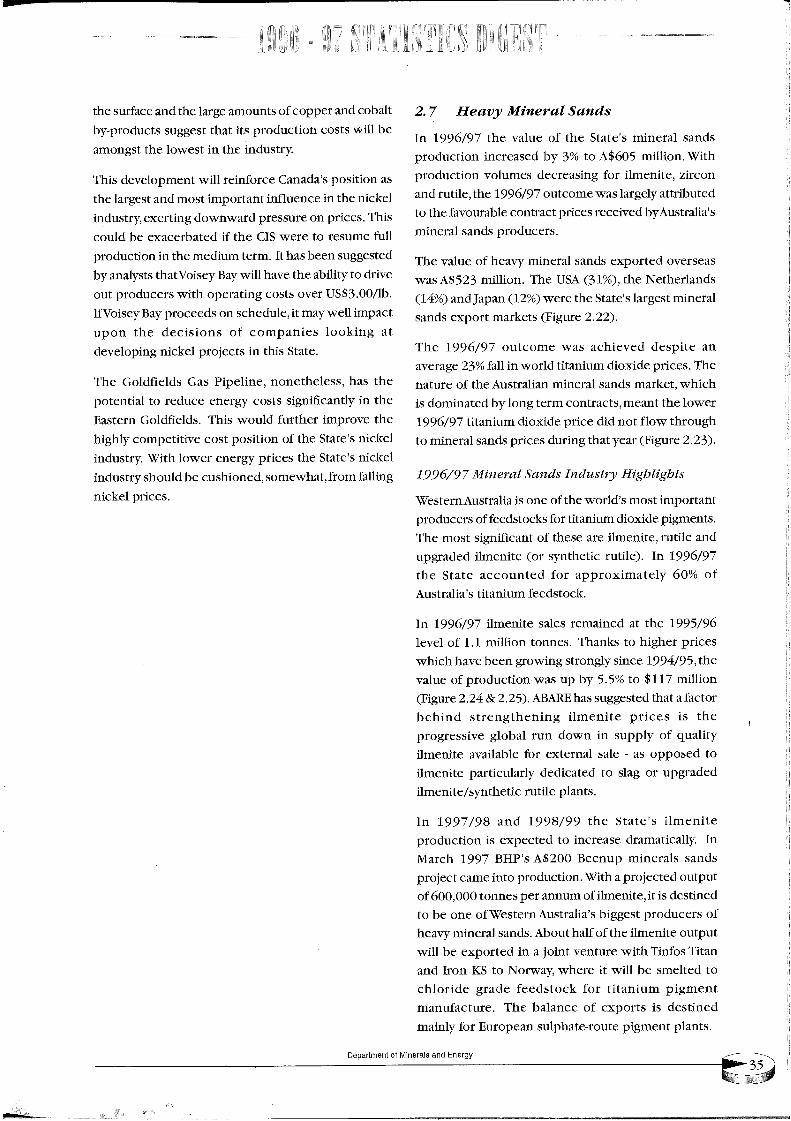
~IaolspaaJ mn!lll~l!l s,l~!II~.tlsnVjo %09 AIa!~m!x°add~
L6/966I uI "(aI!ma a!laqluAg ao) al!uaml!, pap~a~dnpu~ aI!ma ’al!uaml!.¯ gltlaKi~!d ap!xo!p mn.mm!l aoj s>laolgpaaj~o saaanpoadlu~laodm!, lsollI g,pi.!o~ aqljo auo s! e!iea!gnvu.talga~
sgq*gHq~tH £&*snpuI spurs lWaU.~W Z6/9661
¯ ({g’g aan~!,4) a~aX aeql ~u!anp saa!ad spu~s Faau.m~ o!q~noaql aXOlJ lot~ P!P aa!ad ap!xo!p mn!u~!!! L6/966Iaa~aoI aq! lt~am’gla~aluoa maal ~t~oIqa!q~ ’la~Ia~m spu~s Faam.m u~!Falgn¥ aq130 aam~uaq~ ’gaa!ad ap!xo!p mn!um!l plao~awe aa!dsap paaa!qae sea amoalno L6/966I
"(EZ’Z aan~!D sla~Iaem a.todxaFaau!m lga~aeI s,aamS aqa aaaa~ (%ZI) u~def pu, (%~1)gpuelaaqaaNI aqa ’(%I{)VSFI aq~L ’uo! .ll!m {ggSVs~asaaao palaodxa gptn~g Faau!m L~eaq jo anF,
saaanpoad spusg iI~aau.mls j~.tlgalgnyXq paa!aaaa saa!ad lagaltlOa alqsanoaet aql olpaanq!all~ XIa~aeI s~ amoaano L6/966I aqa’aI!mauoaa!z ’aa!uami! aoj ~u!geaaaap samnloa uo!aanpoad
ql!A~ ’uo!lI.w-I g095¥ o1%{ Aq pag~aaam, uo!aanpoadgpttl~g Faau!m g,alglg aql jo anIea aq! L6/966I u1
gaa!ad ia~Ia!U~tqlFj moaj’leqaxamog ’pauo!qsna aq plnoqs Aaasnpu!Ia~ta!u s,alglg aq! gaa!ad A~aaua aa~oI ql!?A ’Aalgnpu!Ia~Ia!U s,alglg aql ~o tto!l!sod lSOa aa!l!ladmoa Alq~!qaql aaoadm! aaqaat~I plno~ s!q.l~ ’gpla!jploD uaaase~aql u! XIIU~a!j!.u~!g glSOa A~aatla aanpaa ol Ig!attalodaqa g~q ’ggaIaqlauou ’au!Iad!a g~9 gpla!Jplo9 aq~L
Xalsnpu! aq! tt! lgaa~oI aq! ls~ttom~
aq li!~ slgoa uo!lanpoad sl! lgq! lsa~ns slanpoad-Xq
1Fqoa pu~ aaddoa jo gmnom, a&*~I aq! pu~ aa~jang
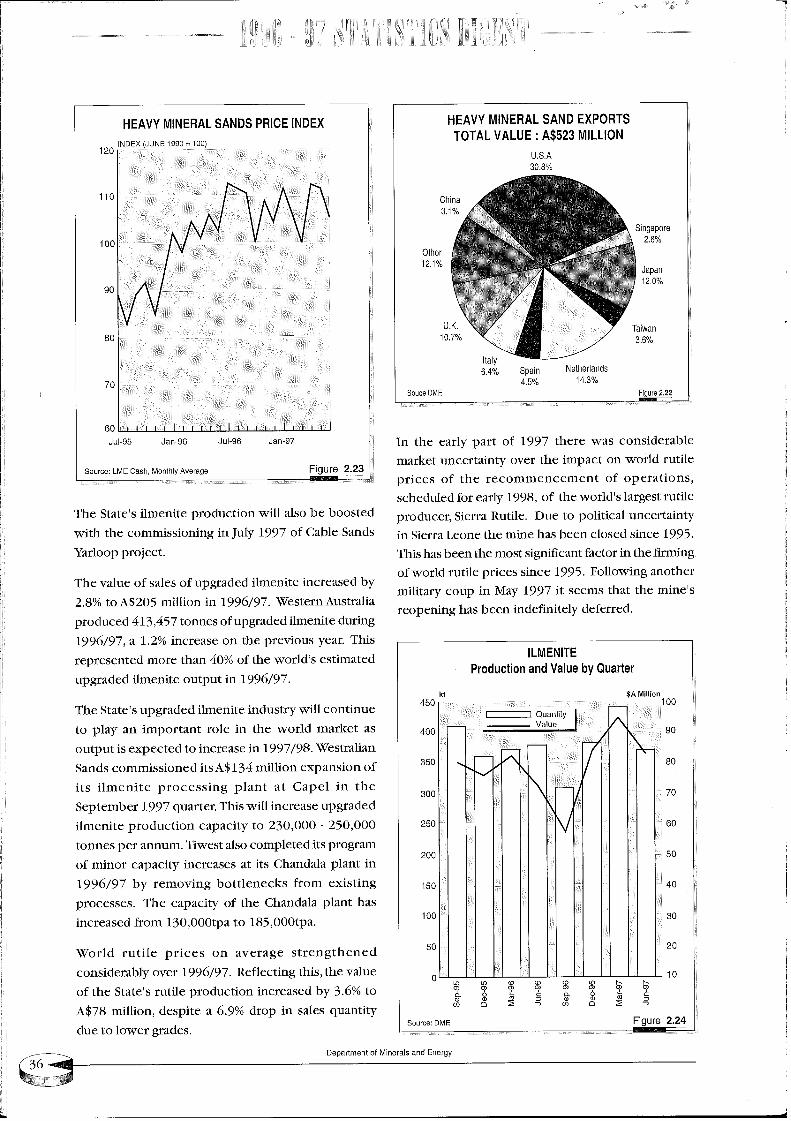
120
11o
lOO
9O
8O
HEAVY MINERAL SANDS PRICE INDEXINDEX (JUNE 1990 = 100)
7O
6OJul-95 Jan-96 Jul-96 Jan-97
Source: LME Cash, Monthly Average Figure 2.23
The State’s ilmenite production will also be boostedwith the commissioning in July 1997 of Cable SandsYarloop project.
The value of sales of upgraded ilmenite increased by2.8% to A$205 million in 1996/97. Western Australiaproduced 413,457 tonnes of upgraded ilmenite during1996/97, a 1.2% increase on the previous year. Thisrepresented more than 40% of the world’s estimatedupgraded ilmenite output in 1996/97.
The State’s upgraded ilmenite industry will continueto play an important role in the world market asoutput is expected to increase in 1997/98. WestralianSands commissioned its A$134 million expansion ofits ilmenite processing plant at Capel in theSeptember 1997 quarter. This will increase upgradedilmenite production capacity to 230,000 - 250,000tonnes per annum. Tiwest also completed its programof minor capacity increases at its Chandala plant in1996/97 by removing bottlenecks from existingprocesses. The capacity of the Chandala plant hasincreased from 130,O00tpa to 185,000tpa.
World rutile prices on average strengthenedconsiderably over 1996/97. Reflecting this, the valueof the State’s futile production increased by 3.6% toA$78 million, despite a 6.9% drop in sales quantitydue to lower grades.
HEAVY MINERAL SAND EXPORTSTOTAL VALUE : A$523 MILLION
U.S.A30.8%
China3.1%
Other12.1%
Singapore2.6%
Japan12,0%
U.K. Taiwan10.7% 3.6%
Italy6.4% Spain Netherlands
4,5% 14.3%Souce DME Figure 2.22
In the early part of 1997 there was considerablemarket uncertainty over the impact on world futileprices of the recommencement of operations,scheduled for early 1998, of the world’s largest futileproducer, Sierra Rutile. Due to political uncertaintyin Sierra Leone the mine has been closed since 1995.This has been the most significant factor in the firmingof world rutile prices since 1995. Following anothermilitary coup in May 1997 it seems that the mine’sreopening has been indefinitely deferred.
ILMENITEProduction and Value by Quarter
Source: DME Figure 2.24
Department of Minerals and Energy

NOllOn(]Ol~d :111N3~’II
’86//_661 u! saseaaau!aa!ad aaqlanj laoddns plnoa 1! pue/661 Aaenuef aau!sapem sm.e~ aa!ad aql alep!Iosuoa ol UO!l!god e it! aq
plnoa 1! aapeaI aa!ad s,ta~Iaem mn!uel!l aql ~m.moaaqluodn(I q!!A~ ’%0} ol %gE punoae moaj X!!agdeaplaoax jo aagqs el! pageaaau! ggq slasse uo!lanpoadmatu~!d uga!aamv uou s,IDI jo uo!l!s!nbae s,ltlodn(I
Faoadde papuammoaaapue Fsodoad aql passagsg seq A!!aoqlnV uo!aaaloadIeluamuoa!au~ aq~ "salea!!u qlaea aaga p!iog jomnwae aad satKio1000’~ [ pile al!zeuom Jo t~Itltltte aadsaUUOl 000’EI o! dn ssaaoad I~ax laa!oad aq~L ’666Iaoj patmeld ~u!uo!ss!mmoa q!!ax 8661 m. aauammoaol palaadxa g! eaae!u!d aeau lueld qlaga aaea pasodoadg,e!Iealgnv a!m!qD auaInod auotpa jo UO!lanalguoD
"uo!lI!m 008V$ ol uo.qI!m 00LSvpunoae s! o1pall!mmoa ao uo!leaap!guoa aapun AllUaaana gaaa[oadspueg Igaau!m alelg jo anFa aq£ ’aa!l!sod s.t Aalsnpu!spues Faam.m s,almg aql aoj ~Ioollno 86//-66I aq.L
al!uamI! papga~dn pugal.mamI! aoj Allg!aadga ’asia o1 palaadxa Ogle aag gaa!ad~polgpaaj palg!aosge ’majj gaa!ad luam~!d sv ’paaealaaae s~Iao!g ggaaxa se puetuap luam~!d u! Xaaaoaaa e olalnq!amoa plnoqs sla~I.Iem aamnguoa ao[em lsotttsuo!a!pLtoa a!mouoaa alqganoaU :leql lSa~ng slsXIetIV
alOOL*no
tuntKle Jod uoaa!z josauuo1000’0~ aanpoad ol palaadxa s! qaFqax aaa!oadspues Faau.rm dnuaa{t axau g,dH~ Aq palgooq aq I~axlndlno uoaa!Z ’1!earlap qlaONI eqqeana s,DD~I moajsapea~ u! au!pap e seax Al!luenb soles u! uoIlanpaaaq! jo asnea Aaolnq!aluoa ao[em V ’/-6/966I u!uo.~. 8klSgo! %8"I Aq IIaJ uo!lanpoad uoaa!z s,almg
aql jo anFa aq! ga!l!luenb soles it! doap %I~ e uaa!B
’ssalaqlauoN ’1095V ol %1 ~ Xq paseaaam, gaaanpoaduoaa!z ~iinq s,e!iealsn¥ Aq pau!elqo aa!ad laodxa
SV a~gaaae aql ’/-6/966I u1 "g6/}66I mo-u ~m.axgdn~uoals a!aql ~u!nu!luoa saa!ad uoaa!z axes /-6/966I
’uo!aanpoadu! aggaaau! %I~ e o! palnq!alle AIa~aeI sgax anleatq aseaaau! aqz ’uo!ii!m g’g [ $V o! %~ Aq paggaaau!uo!lanpoad auaxoanaI s,almg aqa jo anleA aq! la~Iagtug~Iaolspaaj gnoaajgtm!a aIqganoaej e jo ~taeq aq! uO
2. 8 Diamonds
At 53 million carats, the volume of diamonds soldfromWesternAustralian was up a significant 57% in1996/97. But because of lower prices, the value ofsales was down 25% to $396 million. All productionemanated solely from theArgyle operation.
The increase in sales volume was due to the purchaseof Argyle’s deferred stocks by the Central SellingOrganisation (CSO), in addition to Argyle DiamondMines’ aggressive marketing strategy in its first yearof selling diamonds directly to the market. The markethas continued to support the Argyle product andArgyle hopes that sales will further expand.
Overall CSO purchases of Argyles diamonds totalled28 million carats,valued atA$253 million, in 1996/97.
1996/9 7 Diamond Industry Highlights
Production from theArgyle mine reached 37.1 millioncarats in 1996/97. While this was down 5 million caratson the 1995/96 figures the 1996/97 productionoutcome was on budget.
According to Argyle the fall in production was theresult of a decision by the mine owners to producelarger stones, leaving a large volume of the smallerlow grade stones, primarily industrial stones, in thewaste stream. While Argyle is the world’s biggestdiamond producer by volume, only about 5% to 10%of its diamonds are gem quality.
In addition to a change in the production focus ofArgyle to larger stones, production was also affectedby heavy rain and some mining problems in the secondhalf of 1996/97.
Argyle’s open pit operation is due to finish around2002. Argyle has indicated that it would prefer todeepen its existing pit before committing itself to amove to underground mining. The Company isundertaking a drilling program as part of a pitexpansion feasibility study.
A study into the underground mining of AK-1 ore wascompleted in early 1997. It is estimated that anunderground development would extend mine life byat least 5 to 7 years.
The move to direct marketing by the Argyle jointventure, from 1 July 1997, has tested the cohesivenessof one of the oldest cartels in existence. It has beensuggested that the world diamond marketing cartel
controlled by De Beers was on the brink of dissolving
until Russia signed a memorandum of understanding
(MOU) with the CSO in February 1996.
The MOU was to be replaced with a comprehensiveCSO/Russian agreement. The three-year agreementthat will give Russia over one-quarter of global salesthrough the CSO is still clouded with uncertainty.While it was scheduled to be signed in December 1996it now seems the Agreement will not be signed untillate 1997. The major question still is whether Russiacould control diamond sales outside the CSO. Notably,Russia contributed about 26% to CSO sales valuecompared withArgyle’s 6% during its membership.
The CSO must also contend with the potential floodof additional gems from SouthAfrica and Canada.
InAugust 1997, BHP indicated that it was likely to sella proportion of its gem quality diamonds from itsA$750 million Lac de Dras diamond project, locatedin Canada, outside the CSO. BHP indicated that if itwas to sell all its diamonds through the CSO, USAregulators would object because of concerns that theCSO was a cartel. The project, scheduled to commenceproduction in 1998, has an initial 17 year mine life.
A further long term threat to CSO market control isdevelopment of CRA - RTZ’s Diavik diamond projectin Canada. Interestingly CRA-RTZ also have a 60% stakeinArgyle.
If both BHP and CRA - RTZ opt out of the CSO, tip to20% of the world’s gem diamond sales could be tradedoutside the CSO.
State diamond exploration activity has been relativelystrong over the last few years. Some prospectivedeposits have had encouraging results. In particular,Striker Resources announced in September 1997 thatit had discovered a 2.45 carat diamond at its Beta Creekproject in the Northern Kimberley. Striker alsoindicated that results from its other drill cores aroundthe area were positive and as a result it would initiatea program of comprehensive bulk sampling todetermine diamond grades and the quality of thesedeposits. If the results are encouraging a pre-feasibilitystudy would be undertaken.
Outlook
The outlook for the State’s diamond industry remainsuncertain. Argyle diamond sales over the second halfof 1996/97 have been sluggish. This has mainly
Department of Minerals and Energy
’uo! .ll!m 095 ol %{’8 Aq iiaJt~o!lanpoad aaddoa jo anlga aql’$Vati! m. uo!le!aaadde
~u!s!a uo!lanpoad aaddoa s,almg aq! a!!dsa(I ’atmolaad g9E’Eg~l$ oa %5I Aq iiaJ gaa!ad aaddoa k6/966I uI
"Xlaa!laadsaa 866I pug 566I u! %g pue %g{punoae Xq as!.t ol !geaaaoj a.,e saa!ad au!z ’866I pug
566I qloq u! uo!lanpoad au!m paaaxa o! palaadxauo!ldmnsuoa ql!~ pug llg~ o! atm!lt, oa islam at~!z jo~Iaoas plaOA~ "aa!!!sod s! at~z aoj ~IOOllno 86//-66[
UO!lI!m 085VO! %9 Aquo!lanpoad au!z s,almg aq! jo anlga aq! uo.~lanpoad u!IIgJ %8 e al!dsa(I ’aalamlb 5661 aunf aql u! atmol aad00{’I S SFI a~eaaag ol ’%gg punoae Xq ~u!g!a ’56/9661jo jleq puoaas aq! m. papunoqaa XI~uoals saa!ad au!Z
’~o..rIl]m 9}I $VO! 46/966[ u! %g Xq llaJ t,o!lanpoad am.zpug peaI ’aaddoa g,ale!g aql jo anlea pau!qmoa aq~
’86/566I aaao aaeaapom o1 aseaaaoj aaojaaaq!’~uoaas Alaa!lglaa uaaq p~q sa~aA aaaqa ~ulpaaaad
aaao qa~m’saIeS puomelp ulqs~nls aq o1 soles puome!p laadxa
la~iaem puome!p ’qamoa~ asau~def paaaadxa
Am~maaaun a!mouoaa qa!~ "966Ipunoa~ jo saI~S ma~ paoaaa,saaa~ aG a!~dsaG "OgD aqa aplslno saaanpoad
Ig~gapq!l~ aq! ~u~OlIOJ xnI~ul~maa gla~a~m puomglp
¯ apem ~u!aq XaaAoas.~p
~u!moaaq g! Xl!a!tag uo!lgaoldxa puome!p alglg
’L66I jo aapu!emaa aql aoj ls!saad II!.m suo!!!puoaasaq! !eq! pa!ea!pu! seq alA~aV ’uo.~aa ttg!sVaql ~o slaed aaq!o pue ~uo~I ~UOH u! pnemap aa~oI

value fell by 53% toA$5.9 million in 1996/97. With anumber of lead mines coming on stream in 1997/98,such as Cannington in Queensland, it is expected thatworld lead production will outstrip consumption. Asa resultABARE has forecast a 10% fall in the average1997/98 lead price.
Coal
Coal outpm eased by 6% in 1996/97 to result in a 5%drop in the value of production toA$257 million. InNovember 1996,production commenced from GriffinCoal Mining’s A$60 million Ewington II open cutproject. This will assist in providing feedstock for thenew 300 megawatt coal-fired power station beingconstructed at Collie and expected to be operationalin 1999. Development of the Western CollieriesPremier open cut mine for dedicated supply to thenew power station also commenced with the PremierPit 1 now producing coal.
Ma riga n ese
The value of the State’s manganese production fell by14% to A$35 million in 1996/97. This was primarilythe result of a 12% fall in production to 304,000tonnes.
The first shipment from Gwalia Consolidated’sKemerton Silica Sand Mine was made in July1997. The mine is on target for annual outputof 400,0OO tonnes next year. Capacity is forecastto rise to 1 million tonnes per annum.
Uranium
Western Australia does not produce any uranium butthis situation may change.
In 1996 the new Commonwealth Governmentabandoned the previous government’s ’three minespolicy’, therefore enabling uranium projects to beconsidered for development. In addition and duringMay 1997, the Senate Select Committee on UraniumMining and Milling supported the principal findingsof the 1977 Fox Inquiry that there should be nounreasonable impediment to developing Australia’suranium mining industry.
Consistent with this was the Commonwealth’sapproval for mining at Jabiluka (Northern Territory),held by Energy Resources of Australia Ltd. The mine,expected to commence production in 1999, will bethe first established since the abolition of the formergovernment’s three mines policy.
Salt
Salt production increased by 1.3% to 7.5 milliontonnes in 1996/97, but lower prices and the ASappreciation saw the value of output dropping 0.4%.The State’s biggest salt producer, Dampier Salt Ltd, isto diversify into gypsum production at its LakeMacLeod operation. Initial contracts have been signedfor commitment to developing a gypsum outputcapacity of up to 2 million tonnes per annum.
In addition, Onslow Salt is expected to develop a newsalt field at Onslow with capacity of up to 2.5 milliontonnes per annum. The project cost is A$80 million.
Other
Tantalite production fell 15% to 379 tonnes worthA$31 million. This product is chiefly produced byGwalia from its Greenbushes operation, as isspodumene. Despite a 6% fall in spodumeneproduction its value increased by 20% toA$16 million.More than 50% of the world’s spodumene is mined atGreenbushes and changes in production levels closelyreflect world demand.
Although 1996/97 world demand for uranium farexceeded production, spot prices for uraniumdeclined sharply from about US$15.50 per pound in1996 to a forecast ofUS$11.50 per pound in 1997. Asa result, there are few signs at present of renewedexploration for uranium in West Australia, andexploration expenditure for uranium remains athistorically low levels of $2-3 million per year.
Of the likely State mine developments, the largeKintyre deposit, in the Rudall River area, is the mostadvanced. However, although exploration continues,a decision by Rio Tinto on whether to develop hasbeen put on hold until the uranium market improves.A go-ahead by WMC for the deposit at Yeelirrie, 110lma northwest of Leinster, is unlikely followingWMC’scommitment to the expansion of Olympic Dam inSouthAustralia.
Department of Minerals and Energy
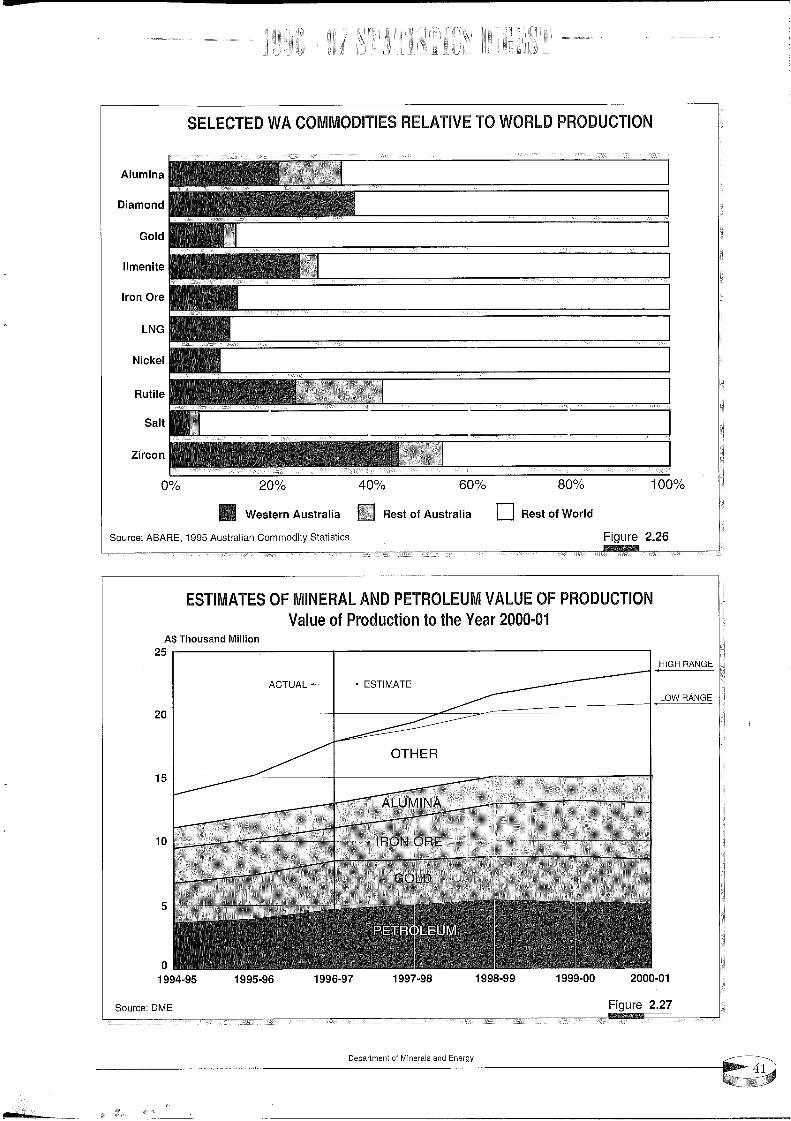
/_~’~ eJn6!_-I3~(3 :eo~nos
LO-O00~00-666L66-866L86"Z66LZ6"966L96-£66L£6-#66L0
9vn±ov
0L
0~
UO!ll!l~l puesnoq± SV
I.O-O00g ~ ~q| ol uo!|onpo~d ~o ~nl~^NOIlOrl(]OEId 40 an7vA lan:a101:ll~d ClNV 7VEI=~NI~ 40 S=IlV~IIS~I
9~’~ eJn6!4so!;s!;e;s ~;!poLUUJOO Ue!le~;snv g66L ’qEIVSV :eo~nos
PlaOM ~O |SeEl D e!le~|snv ,to ~,seEI ~ e!le~isnv u~e|seM ~
%00 ~%08%09%0#%0E;%0
I
uooa!z
lies
elP, n~
le}lO!N
e~O UOal
e~!ueLUll
PlO9
puoua~!G
~u!~unlv
NOllOnOOl:Id 078ON~ O1 ~AIIV7:J~i S~lllaO~O0 VN~ O~]lO~lT~]S

o EXPLORATIOS, CAPITAL EXPENDITURE AND EMPLOYMEST
Mineral Exploration
Mineral exploration in Western Australia expandedsignificantly despffe uncertainties caused by the nativetitle debate. In 1996/97, mineral explorationexpenditure reachedA$690 million, 33% higher thanthe previous year, indicating a substantial increase inactivity.
WesternAustralia attracted 59.6% of the totalAustralianmineral exploration budget, the highest level reachedsince 1986/87. This compared with 54.1% in 1995/96.
In 1996/97 State gold exploration activity increasedby 44% toA$531 million. The State now accounts for73% of Australia’s gold exploration expenditures, upabout 6 percentage points on 1995/96. Goldaccounted for 77% of the State’s exploration effort,also tip 6 percentage points on 1995/96.
This occurred despite a significant fall in the gold pricein the June 1997 quarter, in part, triggered by theReserve Bank of Australia’s disclosure that it had sold167 tonnes of its gold stocks. This action apparentlyhad no impact on State gold exploration activity inthe June 1997 quarter. Continued uncertainty oninternational gold markets, through the potential ofadditional gold sales by, in particular, European CentralBanks, will most likely impact, if at all, on State goldexploration activity during 1997/98.
In 1996, gold discoveries and resource categoryupgrades contributed, in net terms, more than 300tonnes of contained in-ground gold resources to themeasured and indicated inventory. This translates toa discovery cost of around A$26/oz, providing verygood value for exploration investment. A largeproportion of the resource increase is in’brownfield’areas around existing mines. True greenfielddiscoveries most likely cost 2 to 3 times the above-mentioned figure.
Numerous gold discoveries were made during 1996-97and from diverse geological settings, including thePilbara, the Ashburton Basin and along the NorthernTerritory border (southeast of Halls Creek).
TheYilgarn Craton continues to be a major focus ofactivity. However, more explorers are focusing on theless traditional areas along its south-eastern and easternmargins.
Aggressive exploration in the Yandal area has beensuccessful in upgrading measured and indicatedresources. Exploration has concentrated around theJundee, Nimary, Bronzewing, Mt McClure and Darlotgold mines.
Many of the long-established open pit operations ofthe Goldfields region have been delineating longerterm resources below existing pit limits. This is beingcarried out to allow production to move progressivelyunderground.
Base metals (including nickel) exploration fell byaround 1% to A$88.1 million. With gold explorationsurging this has meant that its share of Stateexploration fell by four percentage points to 13%. Thisshare is around the 1994/95 outcome. As severalnickel - cobalt projects are apparently advancingwell, this decline may indicate greater weakness inthe exploration for zinc, copper and lead. Internationalcopper and lead markets were relatively weak in 1996/97 with their prices falling.
Base-metal activity was concentrated in the Pilbara andKimberley regions.
Regular announcements of good drill intersectionshave come from project areas that have been exploredover the past few years, including Panorama in thePilbara, Koongie Park in the East Kimberley, and PillaraRange in the West Kimberley.
Nickel exploration has continued to surge even witha decreasing nickel price. The focus is on upgradingknown deposits for ’fast-tracldng’ development priorto 1999 whenVoisey Bay in Canada is expected to becommissioned.The most notable impact of the nickelsearch and evaluation in W.A. is the emergence oflaterite nickel deposits as the front runners for thenext phase of development (i.e.Bulong, Murrin Murrinand Cawse). This owes a lot to the application andadaptation of high-pressure acid-leach processtechnology (in conjunction with Solvent ExtractionElectrowinners) and cheaper power from theGoldfields Gas Transmission Line. Laterite nickelprojects are potentially very cost competitive withsulphide operations.
In addition to the major laterite nickel deposits, asignificant amount of regional exploration is beingconducted throughout the known nickel provinces
Department of Minerals and Energy

L6/966I uI "sDaoI p.to3~a !~ o3Nd ~u!:’I~l s.t ’op.tax~!FJ!snv ’tlo.lll~aoIdxa a.toqgjjo ll~ql saxoqs l~!l~p g{fV
’% [ I s~x sas~aI uoBanpoad uo aan!!puadxa uo!!~aoidxa96/g661 uI ’gas~aI uo.tlanpoad uo aanl!puadxaUO!l~aoldxa gpa~axol ~u.taxg ~ luasaadaa saan~.tj agaq!’96/g661 ol paa~dmoD "s~aa~ l!tuaad uo.*!~aoldxa uo’saaqlo !s~uottl~ ’luadg s~ %~78 ~ .mm.~tuaa aql aI!q~s~aa~ ag~aI uo!!anpoad no luads s~ax %9I lnoq~g.lq! JO ’uo*.II.t~ k’ 1L85¥ o! %0g ~q pas~aaam. L6/9661u! aan!!puadxa uo!l~aoldxa tunaloalad tt~algnV
s~ ~!a!la~ uo!a~aoldxa ~naIoalad’L6/9661 tn.
’k619661% t g ol 96/g661 u! %~ tuoaj aJn!!puadxa uoBgaoldxatunaloalad g,~.q~alsnV jo aa~qs s,al~lg aql pag!~apu~’Sla~aI s066 [ aS~aaa~ aaoq~ a.m!.tpuadxa uo!!~aoldxatunaloalad s,al~lg aql slJ!I atuoalno L6/966I
"uo.qI!tu ###$V o! %6{ Xq pas~aaau! laoJja uo!!~aoldxatunaloalad s,all~lg aql k6/9661 uT. !~q! slga~ng m~p
uoB~aoldxR mnaloa!ad
jo 1sore aaaq~ ~aa~ aql ’saaanosaa m.s~fl Aalsaam~Hg,alglg aql u! pal~aluaauoa ggq laojja uoB~aoldx.q
’tta~Flaapunaq pinoa~ Xpnls X!!I!q!s~aj-aad ~ ffu!~anoauasllngaa aq! JI "g!!sodap agaq! jo ~l.q~nb aql pu~ sap~a~puom~!p au!tuJalap o! ~U.tldtu~s ~nq aa!suaqaadmoajo tu~a~oad ~ al~!l.tU.t plno~x 1! llngaa ~ g~ pu~aaB!sod aaa~ ~a.x~ aql punoa~ saaoa IIPP aaqlo s!.t tuo.gs!Insaa 1~ttl paisa!puT, osF aa)W!g ’Xalaaqtu.DI uJaqlaoNaql u! !3a!oad ~IaaaD ~la{f g!! !~ puotu~!p l~a~a ~’g ~paaaaoas!p p~q 1! 11~ql k661 aaqtualdag u! paaunouu~saaanosa~[ aa)i!alg ’a~ina!la~d uI ’sllnsaJ ~u!~anoauap~q aa~q saaaoldxa puo~t~!p aa.tlaadsoad atuog
s~aa~ ~a~qI!d pu~ auXoas~9 ’IFma~u~fl’uJe~gxaql ~ ua~tmaapun ~u!aq :,Iao~ aau~ss.t~uuoaaaFuo.t~aa aap~oJq q!.tax’g~aa~ la~Jel paugap jo aaqtm~tt ~1~ Xl.ta!la~ jo snaoj uT.~tu aq! aq o! ganu!luoa ’aaOtlSjjopu~ aaoqguo qloq ’Sgalaqlauou’uo!~aa Xalaaqm.oI aq3~
aau!Aoad al.qaaqmpI axau Xlie!lua!od ~g~ uo!~aa sa!zuaIN-~aouoa~l aqljo aaua~aatua aq! pu~’lI~tUs pu~ a~a~I q!oq’sa!u~dmoa snoaatunu Xquaa~t q!!ax ’uol~aD u.t~I!X aql jo i~.tlt~a!od puom~!paql jo uo.tl~!aaadd~ aal~aa~ ~ sluasaadaa A[lSOttl
as~a.~au.t aq.l. ’uo!II.mt 9’~{$V m %{I ~q pas~aaau!aanl!puadxa uo.tl~aoldxa puom~!p ’k6/9661 u1
’adaoqlsuaae~Ipu~ a~Ug~l pla~ ’(aIaq auolsuaaa~ u.taanNu.~aJnN) aFpuolaaI~ pu~ aan~)I al!~?A’(llaq auo!suaaa~laa~a~I~) su~ao([ uolaaag~i ’(llaq auolsuaaa~eu!pn[pR) ~apu.ttu~ptmx pu~ snld~Fana ’Oa!aas!pa!qq~inI~) Sala~tm!d ’(llaq auo!suaaa~ ~ptt~{I ~aO)~!aaq!s ~tt!pnlatU. ’saauaaanaao u~omt aaqlo !~ pu~
offshore exploration worthA$617.1 million accountedfor 71% of all petroleum exploration and was up by12% on 1995/96. Onshore petroleum exploration inAustralia increased by 46% in 1996/97 to A$254.5million.
In December 1996 a significant oil discovery was madein the Cornea field,located in the Browse Basin 400kmnorth of Derby. Oil estimates for the field range from500 Mmbbl to 2,665 Mmbbl. Results of futureproduction tests are awaited with much anticipation.
Mining Investment
The ABS mining capital investment statistics arepublished for each financial year and show that in1996/97 the State’s investment fell by 4% to A$4,115million. The main reason for the fall was the timing ofmining investment. Strong growth in imports ofinvestment goods in the June quarter 1997 areconsistent with a pickup in mining investmentspending in the first half of 1997/98. The 1996/97outcome follows strong mining investment growth inthe early 1990s and is more than double the level in1991/92. With Australian mining investment activityrising by 16% to A$8,716 million Western Australia’sshare of the national total fell 10 percentage points to47% in 1996/97. As a result of the forecast pick up inthe State’s mining investment activity in 1997/98 it isexpected that the State’s share of Australian mininginvestment will rise in 1997/98.
ABS mining investment figures need to be treatedcautiously as they do not capture all mininginvestments. Investment in downstream processingis regarded by the ABS as manufacturing investment.A breakdown of the manufacturing figures intoresource processing and other categories is notavailable.
The Delta Electricity and Access EconomicsInvestment Monitor indicates that there is currentlyover A$30,000 million worth of mining projects inWestern Australia either under construction,committed or under consideration. \Vestern Australiaaccounts for more than half of Anstralia’s investmentin proposed mining and downstream processingprojects.
expenditure that will generate a growing mineralproduction profile leading into the next century. Theseeds of this expansion were set in the late 1980s andearly 1990s when large discoveries were made. Newtechnology, improved infrastructure andmicroeconomic reforms have all contributed toencouraging companies to develop these large finds.In terms of the latter a recent Industry CommissionReport (September 1997) has indicated thatAustralian1990s productivity growth is 50% higher than theOECD average and is comparable to the high growthrates of the 1960s and early 1970s. Over the period1970 to 1989 Australia’s productivity growth hadsignificantly lagged behind the OECD average.
These anticipated resource developments do not onlyprovide a foundation for the long term viability of theState’s resource sector but also through its associatedmultiplier effects provides a significant impetus to Stateeconomic and employment growth. These benefits areenhanced when projects have a significant degree oflocal content. Excellent levels of local content havebeen obtained in several of the State’s big recentmining developments. For example local content was94% in the A$200 million Beenup mineral sandsproject; 75% in the A$200 million East Spar petroleumproject; and 65% in the A$450 million Goldfields GasPipeline project. In addition it has been estimated thatAustralian content in the A$11,200 million spent tofinancial year 1995/96 on the North West Shelf GasProject was 74%.
Mining Employment
The Department of Minerals and Energy’s officialemployment statistics are compiled from industryreturns and include contracted mining labour workingon the mine sites.
Due to production problems these figures were notavailable when this publication went to print.
The Australia wide trend in mining investment is notbased on a speculative rush of exploration expenditureor high commodity prices, but on solid capital
Department of Minerals and Energy
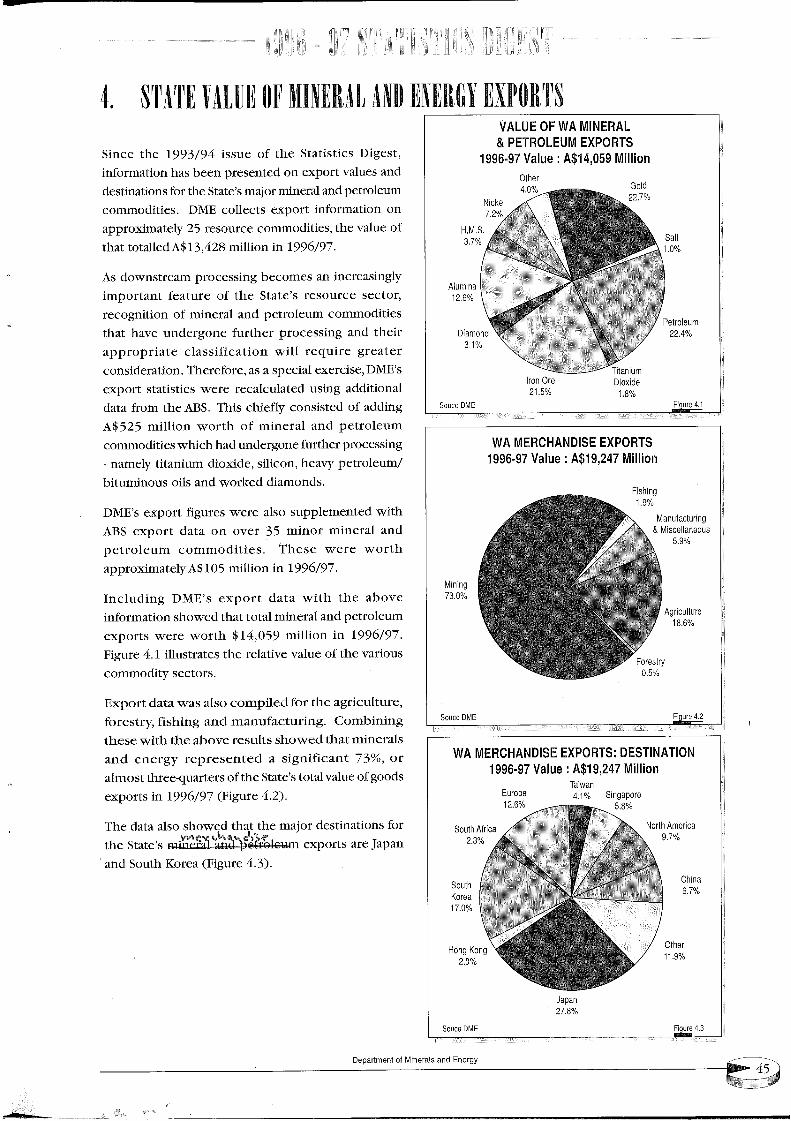
%9’L~uedep
%0’L ~ee~o~ %Z’9 qlnos
eu!qo
%8’9%97 !.emde6u!£ %LPedo,~n3
UO!ll!lN LI~’6ISv : anleA L6-9661.NOIlVNIIS~](] :SIBOdX~ BSIONVHOt:I~R
%9’0
%0’8L
6u!qs!4
UO!ll!lN Lt~’61.$V : enleA L6-9661.SIEIOdX~] =ISIONVHOEI~]IN V~
%97.ep!xo!(3e,~O uo.qLun!uel!/
pUOLUe!d
%9 7 l-eU!Lunlv
%L’~
%0’#JeqlO
UO!ll!~ 6£O’t~$V : anleA L6-966LSll:lOdX=l ~n370I:113d ~"IVB3NIIN VAA :I0 3n’IVA
saolaas X!!pommoasno!agA aql jo anlga aA!!glaa aq! sa!ga!snlI.~ I ’~ aan~!~I
"L6/9661 u! uo!lI!m 6g0’~15 qlaoax aaaax slaodxamnaloalad pu~ Faau!m lglo111~q1 paaxoqs uo!lemaoju!aaoqe aql ql.tax elgp laodxa s,5tl~(I ~u!pnlauI
’k6/9661 u! uo!I .I!m g0[ SV~Ia!~m!xoadd~qlaoax aaaax asaqj~ ’sa!!!pommoa mnaloaladpu~ Faau!m aougu g{ aaao uo glgp laodxa gIiVq!!ax pamamalddns osI~ aaaax saanS!j laodxa g,aI~(I
’16/966I u! uo!II!m 8EF{ISVPalImOl l~q!jo anlga aq! ’sa!!!pommoa aaanosaa gE Xlal~m!xoadd~
uo uo!!~maoju! laodxa slaalIOa ~I~(I "sa.~!!pommoamnaloalad pue Faam.m ao!~m g,alglg aql aoj guo!lgu!.lsappu~ sanFa laodxa uo paluasaad uaaq s~tt’lsa~!(I ga.tls.tlglg aq! jo anss! ~6/~66I aql aau~.S

TABI,E 1
1995-96 1996-97COMMODITY\Mineral UNIT QUANTITY VALUE (AS) QUANTITY VALUE (AS)
BAUXITE-ALUMINAAlumina
Gallium
TOTAL BAUXITE - ALUMINA
CLAYS
Attapulgite
Clay Shaie
Fire Clay
Kaolin
White Clay
TOTAL CLAYS
COAL
CONSTRUCTION MATERIALS
Aggregate
Gravel
Rock
Sand
t 8,232,135 1,918,337,128 (r) 8,347,933 1,955,770,170
5,388 (r) 2,118,702 (r) 25,221 9,570,910
1,920,455,830 (r) 1,965,341,080
t 19,753 4,096,240 20.473 4,073,620
t 21.175 259,212 16,689 212,081
t 127,813 258,976 54.861 65,833
t 3,363 173,565 3,307 211,973
t 10,885 108,850 13,003 130.030
4,896,843 4,693,537
t 5,897,443 270,359,539 5,556,644 257,303,044
t 556,743 3,487,810 405.993 2,635,481
t 177,597 1,019,434 234,063 1.326,354
t 261,652 1,711,061 404.438 2,525,448
t 1,353,346 5,968.708 1,621,532
TOTAL CONSTRUCTION MATERIALS 12,187,013
DIAMOND
DIMENSION STONEBlack Granite
Granite
Jasper
TOTAL DIMENSION STONE
GEM & SEMI-PRECIOUS STONEAgate kg
Chalcedony kg
Chrysoprase kg
Jasper kg
Variscite kg
TOTAL GEM & SEMI-PRECIOUS STONE
ct 33,522,991 (r) 525,213.116 (r) 52,521,276395,793,8o6
t 0 0 946 283,695
t 40 12,000 220 11.000
t 25 9,016 0 0
21,016 294.695
0 0 5 3,o89
2,053 20,020 41 20,680
39,220 47,136 20 4,000
0 0 1,193 23,798
25,700 33,314 29 17,238
100,470 68,805
GYPSUM 252,910 2,451,768 251,909 2,642,427
Department of Minerals and Energy

uo!l!pa sno!Aa:~d moaj pas!aa~I 60alttu.t!sR (a)
ai!ln.~ a!laqluXs st ua~om[ OSlV
¯ slav auatuaaa~V alms lU~AaIaa put E861 aaV (spu~’I paSaatuqng) tunaloalad aql ’/-961 laV l-Unalo.tladaid ’8161 laV Su!tqIA~ aql Aq paaaaoa UmalOalad put si~.taU!l< o1Xlddt AlUO alqt! s!ql u! pasn sa!l!lu~n~) :a!oN
( ) ~6 I9~ 9~ fit];1Tv’A TV~O~
9~0’9~9’~f~~6E’9~f’L0~6 LIE ~[ ( ) 669 [f~’!.
000~E’~9[000"9~ap~xo pa~SL~ROld
0o8~L’o~L~~
8g~ 98L fI(a)~SL’889’89I’l~I~’gSg’Igg~60~’f66’1L8~
&68 III If0 I 06~ 9LL () ~6~’I0~’L60’I616’I9La
ILL’~fS’0g8L8806’889’99Ok8a
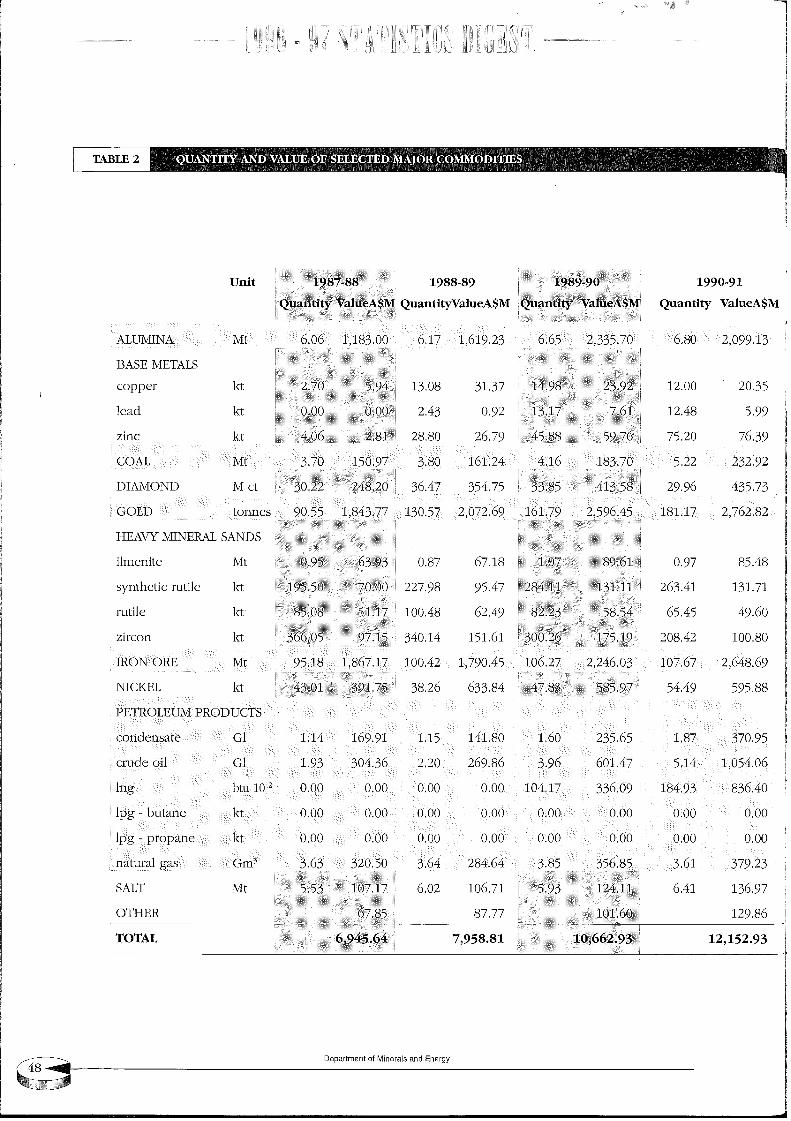
TABLE 2
ValueA~ QuantityValueA$M ~ ~nti~ ~eA~ Quantity ValueA$M
29.96 435.73
GOLD i~nn~s 90 55 ~1843 ~30!57 2;072169 ~61 79 21~96 ~5 181117 2,762182
HEAVY MINERAL SANDS
ilmenite Mt 0.87 67.18 0.97 85.48
synthetic futile kt 227.98 95.47 263.41 131.71
futile M 100.48 62.49 65.45 49.60
zircon M 340.14 151.61 208.42 100.80
IRON ORE Mt 95.18 1.867.17 100.42 1.790.45 106.27 2.246.03 107.67 2.648.69
NICKEL kt 43.01 391.75 38.26 633.84 47.83 585.97 54.49 595.88
PETROLEUM PRODUCTS
condensate G1
crude oil G1
btu 10~
lpg- butane kt
1.14 169.91 1.15 141.80 1.60 235.65 1.87 370.95
1.93 304.36 2.20 269.86 3.96 601.47 5,14 1,054.06
0.00 0.00 0.00 0.00 104.17 336.09 184.93 836.40
0.00 0.00 0.00 0.00 0.00 0.00 0.00 0.00
tpg - propane kt
natural gas
SALT
OTHER
TOTAL
GITI3
Mt
0.00 0.00 0.00
3.63 320.50 3.64
5.53 107.17 6.02
0.00 0.00 0.00 0.00 0.00
284.64 3.85 356.85 3.61 379.23
106.71 5.93 124.11 6.41 136.97
87.77 10L60 129.86
7,958.81 12,152.93
Department of Minerals and Energy
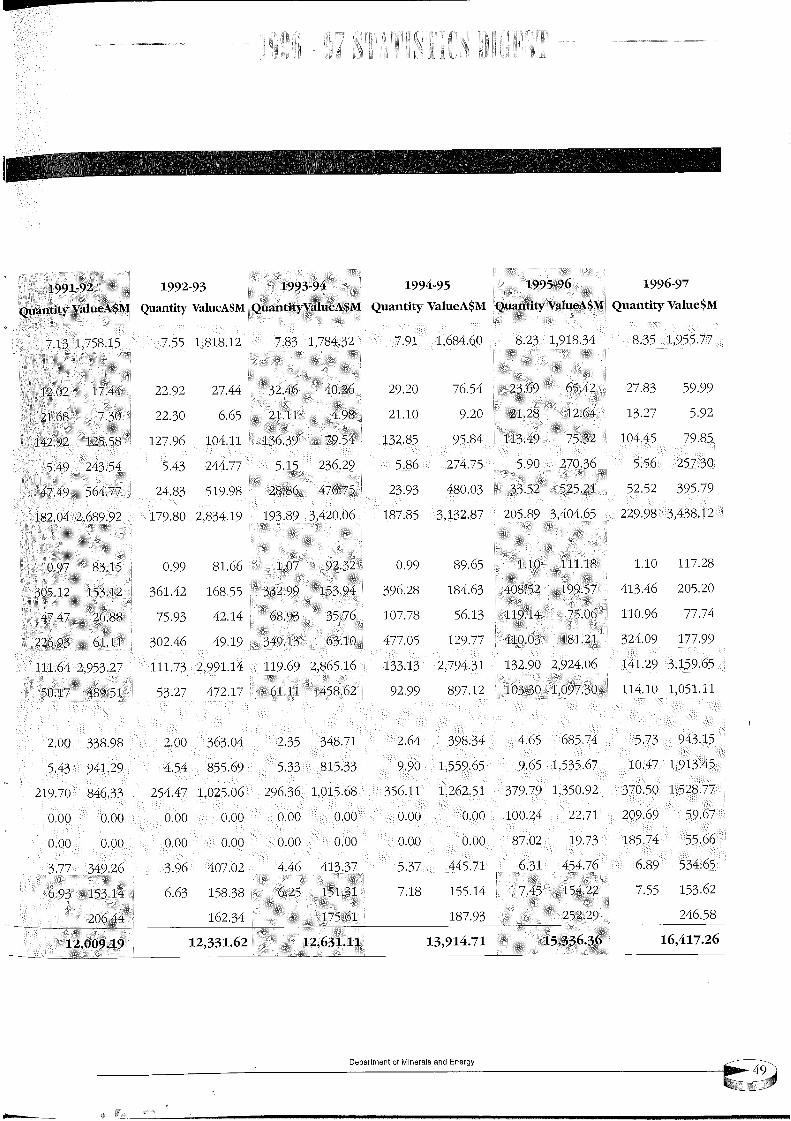
9~’6~
99"�~;#L’�81.{k’6[~:O’k800"000’000’000"000’000"000°000"0
k9"6g69’60~:l~k’?:g>g’OOT00"000’000"000"000’000’000’000’0
LL’8g~’[Og’OL~~;6"0~’[6L’6L{[g’~;9~;’[H:’9~89’�[0’1~9{;’96~;90’�Z0’[L~7’~,�~:{{;’9~78OL’61Z
[[’l;gO’I 011"~7[~0{’L60’1~ O{;’~Ol~?:11’L6866Z6g9"Sg~[[’[9k[’gkI7L~’~g[g’68~7kli’Og
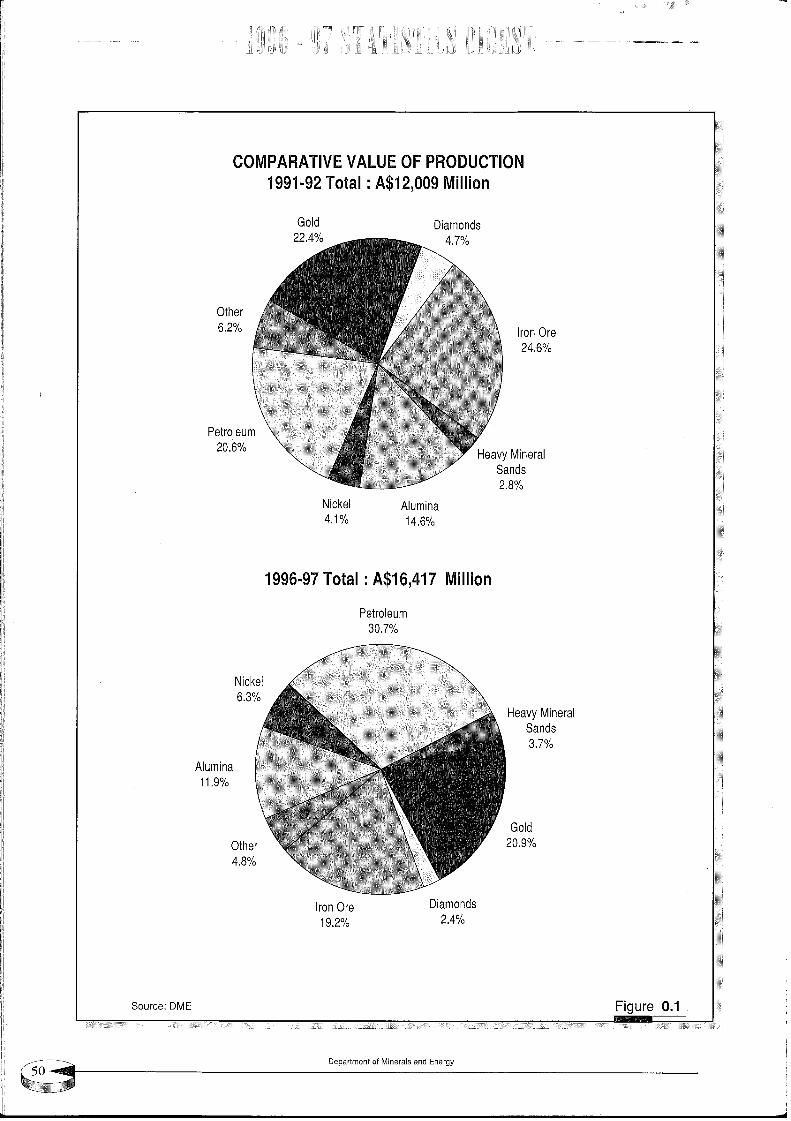
COMPARATIVE VALUE OF PRODUCTION1991-92 Total ¯ A$12,009 Million
Gold Diamonds22.4% 4.7%
Other6.2% Iron Ore
24.6%
Petroleum20.6%
Nickel Alumina4.1% 14.6%
Heavy MineralSands2.8%
1996-97 Total ’ A$16,417 Million
Petroleum30.7%
Nickel6.3%
Alumina11.9%
Heavy MineralSands3.7%
Other4.8%
Gold20.9%
Iron Ore Diamonds19.2% 2.4%
Source: DME Figure 0.1
Department of Minerals and Energy
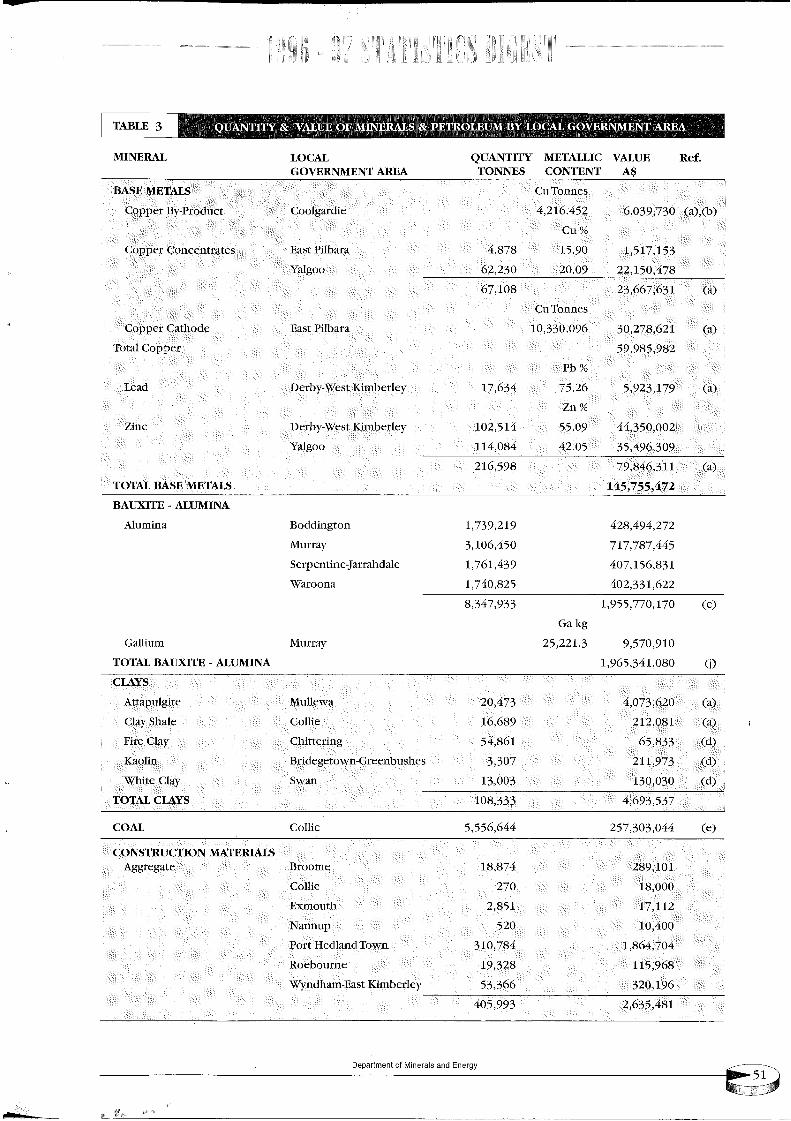
~6Jeu3 pue SleJau![h] jo ]ueuqJ~oda(3
(})I[E9RLEO~960 0~{ 01[
V~hn¢ LN~IAIklRRAO9TVDO’I

TABLE (cont.)3
MINERAI~ LOCALGOVERNMENT AREA
CONSTRUCTION MATERIALS Cont ....
Gravel
QUANTITY METALLIC VALUE Ref.TONNES CONTENT AS
Broome
Coolgardie
Kalamunda
Port Hedland Town
Shark Bay
23,808 115,066
47,078 280.691
135-257 811,542
22,000 110,000
50 250
Wyndham-East Kimberley 5,870 8.805
234,063 1.326,354
Rock Broome 2,792 81.275
Derby-West Kimberley 177 1,058
East Pilbara 24,990 174,930
Kalgoorlie-Boulder 94,807 568.842
Port Hedland Town 281.672 1.699,343
404,438 2,525,448
Sand Ashburton
Broome
Carnarvon
Cockburn
Collie
2,102 44,984
24.809 146,541
8 280
14,659 58,276
32,338 194,023
Coolgardie 189,755 1,124,843
Coorow 2,586 12,931
Dandaragan 4.147 24,882
Derby-West Khi~berley 1,442 10.099
Gingm 3,937 23,624
Kalgoorlie-Boulder 8,399 50,393
Leonora
Meekatharra 34,450
Menzies 697
Northam 4"78
Port Hedland Town 139,297
Roebourne
Shark Bay
Wanneroo
Wyndham-East Kimberley
Yilgarn
TOTAL CONSTRUCTION MATERIALS
Carats
DIAMOND Wyndham-East Kimberley 52,521,276
DIMENSION STONE
Black Granite Dundas 946
5,492 27.460
206,700
3,485
1,434
734,182
74,298 583.242
300 1,500
1,074,915 4,299,660
4,000 20,000
3,423 17,112
1,621,532 7,585,651
14,072,934 (d)
395,793,806
283,695
Granite Roebourne 220 11.000
TOTAL DIMENSION STONE 294,695 (d)
Deoartmem of Minerals and Energy

~6.~eu:q pue Sle.~eul~ ,to !uemlJede(3
009 6:096
~86’t~t’8~V’�8{9’{oo’6{~
606’~6’L0~9~’{Lg’9969L’90>’g9
~Ig’k99’09g690’1{{’>{g
096’gg}’gkI
I~k’06k’9k90’968’9gL
g9g’g60’081 00}’g86’II
L6I’0gS’0ZI
g6I’>E9’I6>
@6I’gLL’{I
N~nv
uar, NBXoo~IgX
gunI.t~
auolgpu~g
latI~l~,I~ 1~
ga~zua~
~aa~q~aa~
eaouoa~UO1JOAg~
Nu~uuglg~
86L’{~
000’~
089’0~
680’{
~71"I-VA DITIV.12[R
aaplno~- a!iaooNig)I
~IaaaD SlI~H
s~pun(I
anda!pa~IOOD
t~ol~u!ppo~
(rio9 T~J~OJ~
(rIOD
RNIO.I.S SFIOIDRlltI-IIAIRS ~ I~D
ptmlPaH 1.~od
uolanqq,~¥sads~f
(’~uo~) ~ ~I~
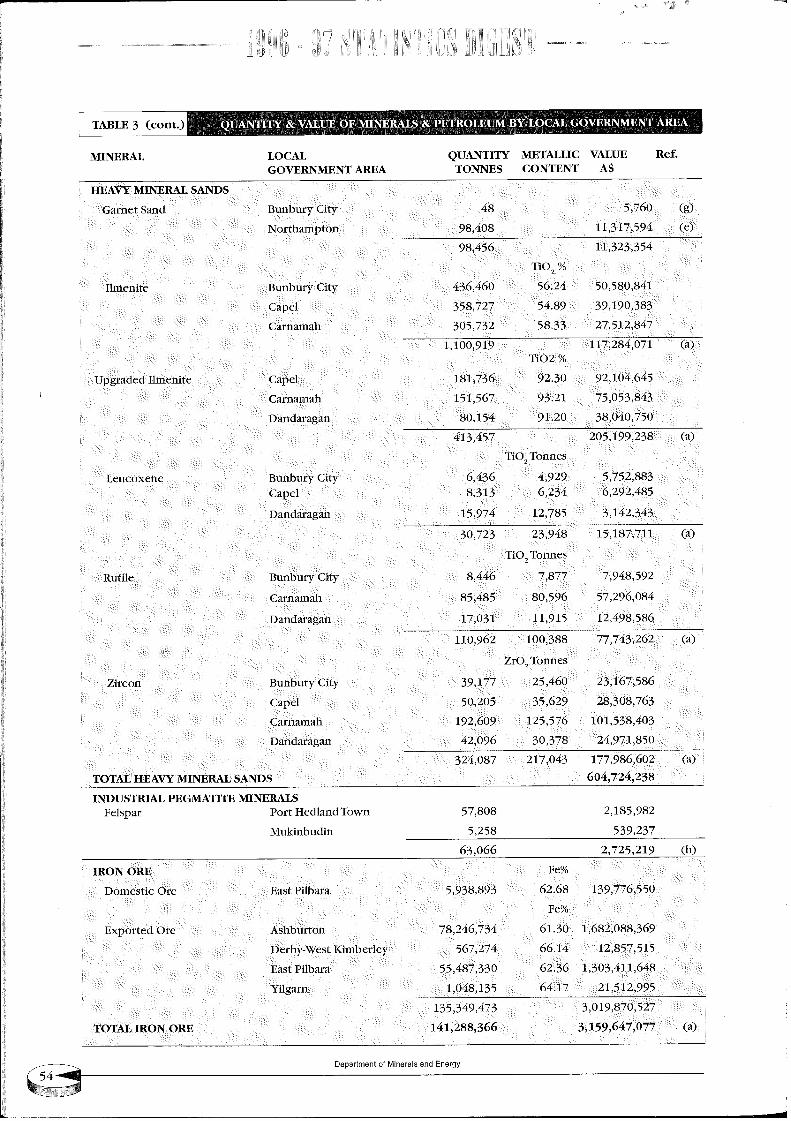
TABLE 3 (cont.)
MINERAL LOCALGOVERNMENT AREA
HEAVY MINERAL SANDS
Garnet Sand
QUANTITY METALLIC VALUE Ref.TONNES CONTENT A$
Bunbury City 48 5,760 (g)
Northampton 98,408 11,317,594 (e)
98,456 11,323,354
TiO2 %
Ilmenite Bunbury Cit3, 436,460 56.24 50.580,841
Capel 358.727 54.89 39,190,383
Carnamah 305,732 58.33 27.512,847
1,100,919 11-.284,071 (a)TiO2 %
Capel 181,736 92.30 92.104,645
Carnamah 151,567 93.21 75,053,843
Dandaragan 80.154 91.20 38,040,750
413,457 205,199,238 (a)
TiO2 Tonnes
Upgraded Ilmenite
Rutile
Leucoxene Bunbury City 6,436 4,929 5,752,883Capel 8.313 6,234 6,292,485
Dandaragan 15,974 12,785 3,142,343
30,723 23,948 15,187.711 (a)
TiO 2 Tomxes
Bunbury City- 8,446 -7,877 7,948.592
Carnamah 85,485 80,596 57,296,084
Dandaragan 17,031 11,915 12,498.586
110,962 100,388 77,743,262 (a)
ZrO2 Yonnes
Zircon Bunbury City 39,177 25,460 23,167,586
Capel 50,205 35,629 28,308,763
Carnamah 192,609 125,576 101,538,403
Dandaragan 42,096 30,378 24,971,850
TOTAL HEAVY MINERAL SANDS
INDUSTRIAL PEGMATITE MINERALSFelspar Port Hedland Town
Mukinbudin
324,087 217,043 177,986,602 (a)
604,724,238
57,808 2,185,982
5,258 539,237
63,066 2,725,219 (h)
Department of Minerals and Energy
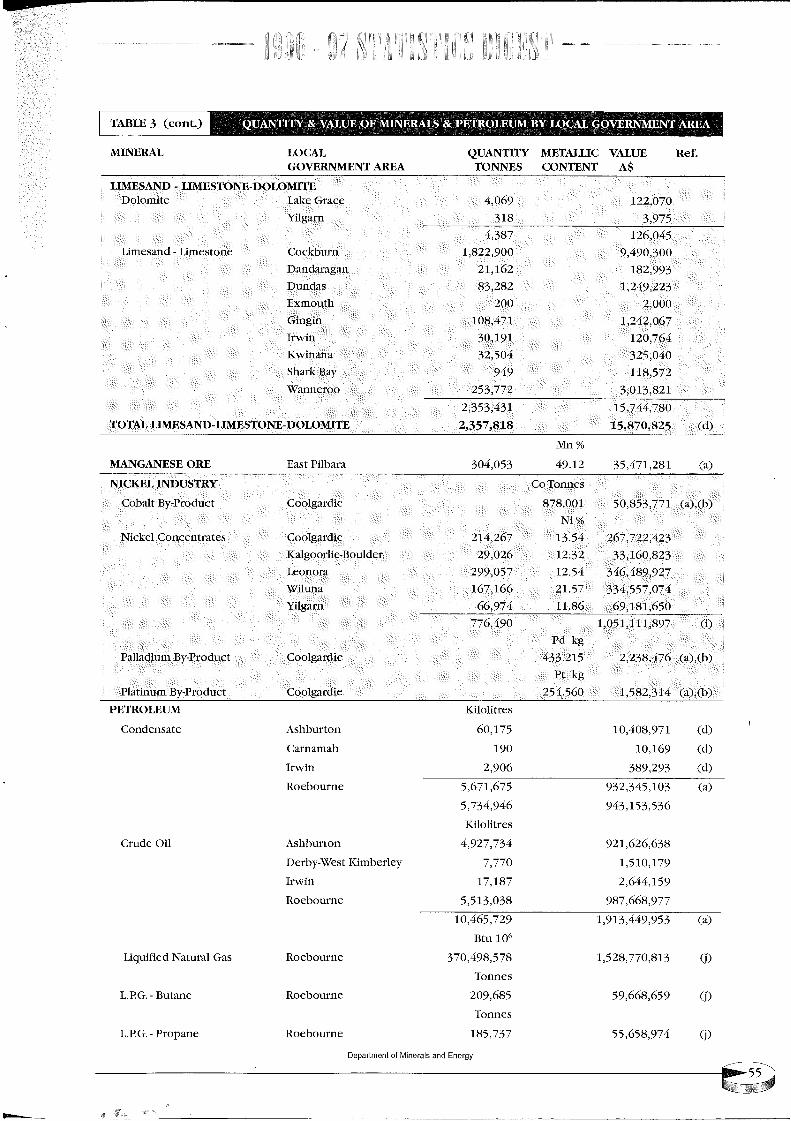
I!O apnaD
~I&II~O’IO (I-R ~IO&S~INI’I-(I~SRRI’I ’IV&Ol
ooaauuuA~
(’luoa) { R~IItV& ]
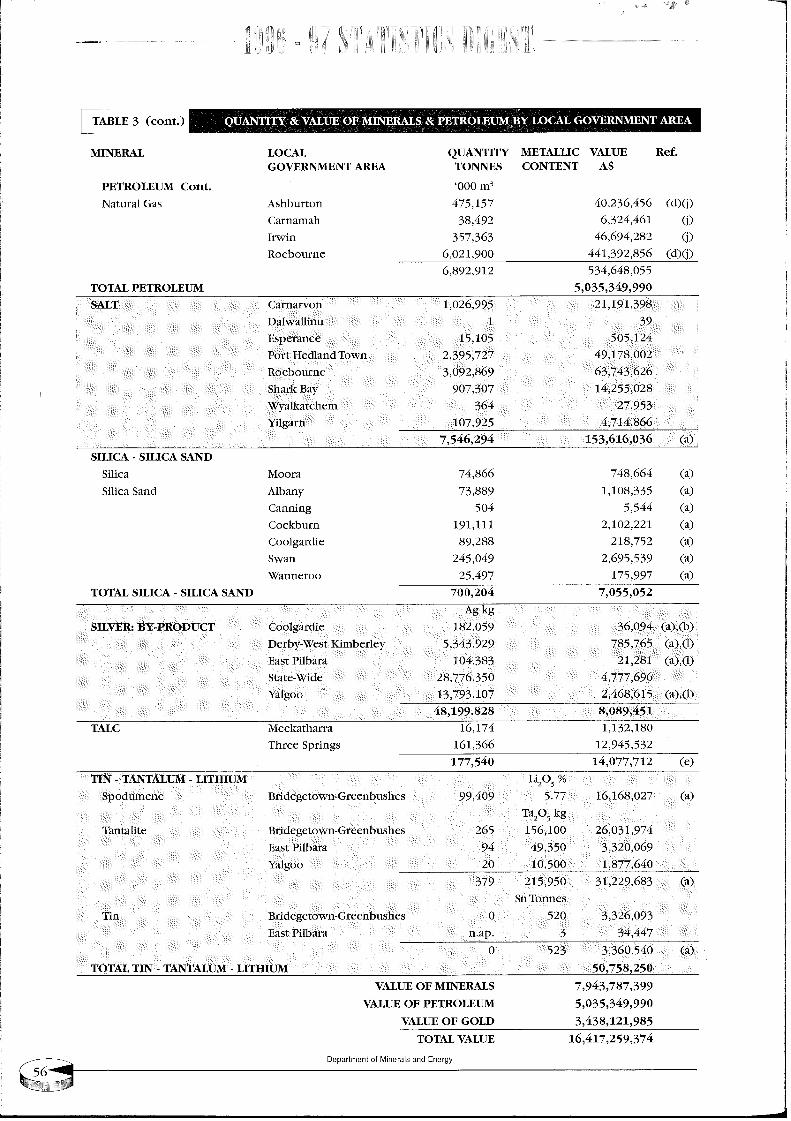
TABLE 3 (cont.)
MINERAL
PETROLEUM Cont.
Natural Gas
TOTAL PETROLEUM
LOCALGOVERNMENT AREA
Ashburton
Carnamah
IrwinRoebourne
QUANTITY METALLIC VALUE Ref.TONNES CONTENT A$
’000 m~
475,157 40,236,456(d)(j)
38,492 6,324,461 (j)357,363 46,694,282 (j)
6,021,900 441,392,856(d)(j)6,892,912 534,648,055
5,035,349,990
SILICA - SILICA SAND
Silica
Silica Sand
MooraAlbanyCanningCockburnCoolgardieSwanWanneroo
74,866 748,664 (a)
73,889 1,108,335 (~504 5,544 (a)
191,111 2,102,221 (~
89,288 218,752 (a)
245,049 2,695,539 (a)
25.497 175,997 (a)
TOTAL SILICA - SILICA SAND 700,204 7,055,052
Ag kg
SILVER: BY-PRODUCT Coolgardie 182.059 36,094 (a),(b)
Derby-West Kimberley 5.343.929 785,765 (a),(l)East Pilbara 104.383 21,281 (a),(1)
State-Wide 28.776.350 4,777,696~algoo 13,793.107
48,199.828TALC Meekatharra 16.174
Three Springs 161,366
177,540
TIN- TANTALUM - LITH1UMSpodumene Bridegetown-Greenbushes 99,409
Tantalite
Tin
2,468,615 (~,(1)
8,089,451
1,132,180
12,945,53214,077,712 (e)
Li20s %5.77 16.168,027 (a)
Ta20~kg
Bridegetown-Greenbushes 265 156,100 26,031,974East Pilbara 94 49,350 3,320,069Yalgoo 20 10,500 1,877,640
379 215,950 31,229,683 (a)SnTonnes
Bridegetown-Greenbushes 0 520 3,326,093East Pilbara n.ap. 3 34,447
0 523 3,360,540 (a)17OTAL TIN - TANTALUM - LITHIUM
VALUE OF MINERALS
VALUE OF PETROLEUM
VALUE OF GOLD
TOTAL VALUE
Department of Minerals and Energy
50,758,250
7,943,787,399
5,035,349,990
3,438,121,985
16,417,259,374

~’0 ~::llAla :eoJnos
%6’;~#wneloJiecl
%9’#le>lo!N%9’9
spuowe!c]
%0’~’spues
leJeU!lAI ,~AeeH
NOI’I"II~ 6’£8£$V" "IVJ.OJ. L6"966L
le~to!N
LuneloJ;ed
%0’8spues
leJeU!lAI/~AeOH
eJo UO~l%0’6spUOLUe!(3
NOI’I"II~ 6’t,#£$V ’ "]ViOl ~6-1.661.S.l.dl=lO=lEI AJ.’IVAOI::I =IAI.LVI::lVd~OO
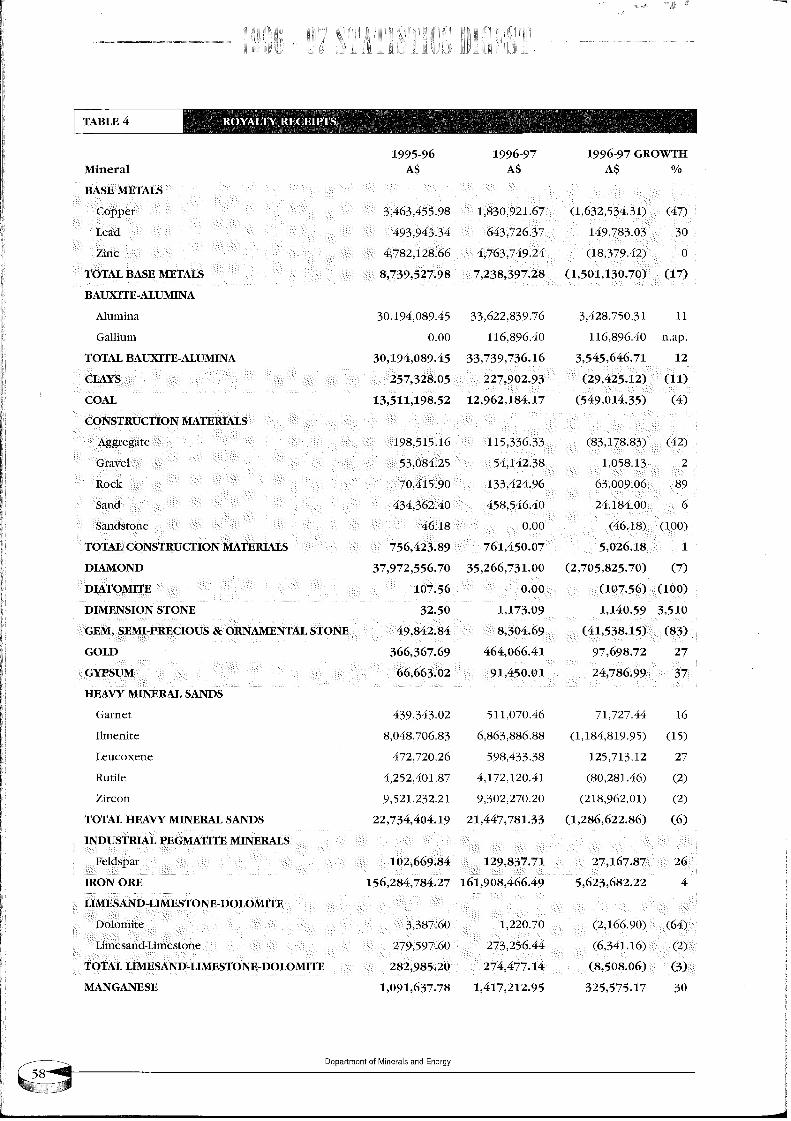
TABLE 4
Mineral
BASEMETALS
BAUXITE-ALUMINA
Alumina
Gallium
TOTAL BAUXITE-ALUMINA
1995-96 1996-97 1996-97 GROWTHA$ A$ A$ %
(1,501,130.70) (17)
30,194,089.45 33,622,839.76 3,428,750.31 11
0.00 116,896.40 116,896.40 n.ap.
30,194,089.45 33,739,736.16 3,545,646.71 12
COAL 13,511,198.52 12,962,184.17 (549,014.35) (4)
.... 70,415.90 133,424.96 63,009.0~ 89
434,362.40 4581546.4024,184.00~618 0.0ff (46.18) (100)
DIAMOND 37,972,556.70 35,266,731.00 (2,705,825.70) (7)
DIMENSION STONE 32.50 1,173.09 1,140.59 3,510
GOLD 366,36%69 464,066.41 97,698.72 27
HEAVY MINERAL SANDS
Garnet 439,343.02 511,070.46 71,727.44 16
Ilmenite 8,048,706.83 6,863,886.88 (1,184,819.95) (15)
Leucoxene 472,720.26 598,433.38 125,713.12 27
Rutile 4,252,401.87 4,172,120.41 (80,281.46) (2)
Zircon 9,521,232.21 9,302,270.20 (218,962.0D (2)
TOTAL HEAVY MINERAL SANDS 22,734,404.19 21,447,781.33 (1,286,622.86) (6)
IRON ORE 156,284,784.27 161,908,466.49 5,623,682.22 4
Limesand-Limestone ~79,597.60 ; ~73,256.4~ (6,34!i16) (2)
TOTAL ~ESAND-LIMESTONE-DOLOMITE 282,985.20_ 274,477.14 (8,508.06)(3)
MANGANESE 1,091,637.78 1,417,212.95 325,575.17 30
Department of Minerals and Energy
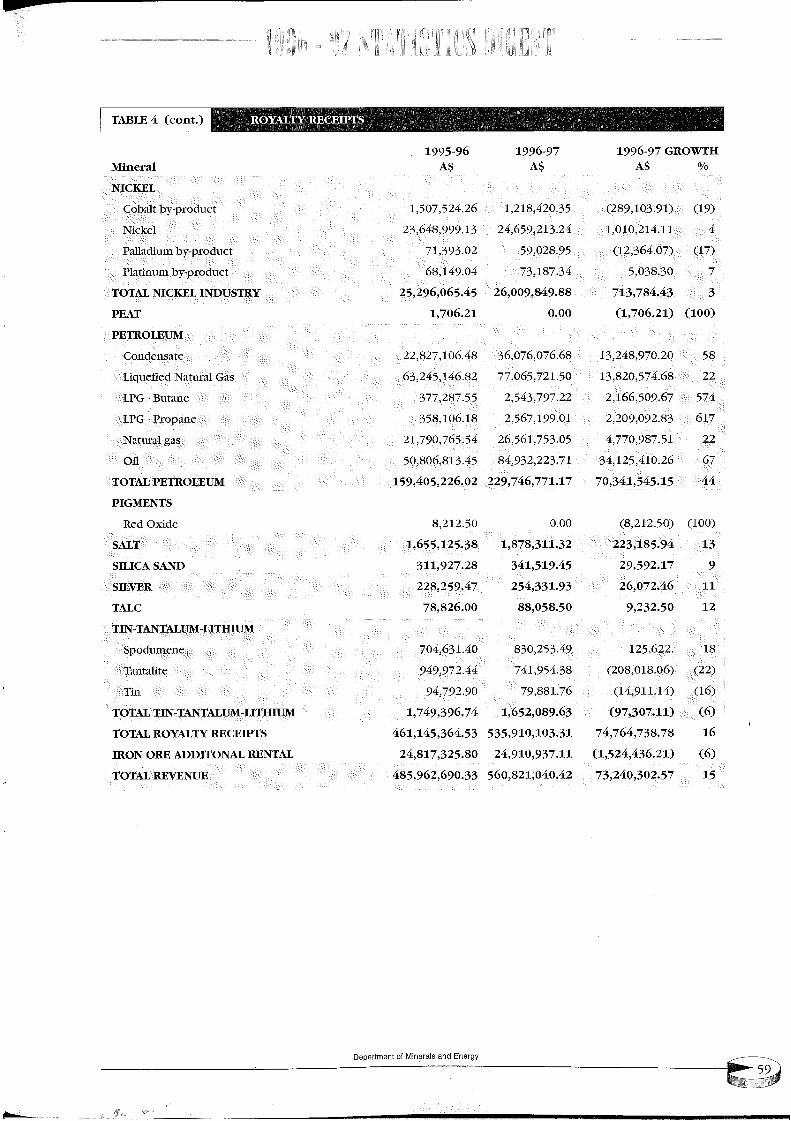
(9)(~Z’9~’~Z~’~) ~’L~6’0~6’~Z 08"~Z~’Z.~g’~Z"IV, LM~I "IVMO£KI(IV ~IO MOlII
S~IIT~DTt~I X.L’IVXOII "IVZOZ
8~’LZ6’II~(IkWS v3rIIS
(000(0g’ZlZ’8)00"0
%SvSvH;L?AO~I9 ~6-966[L6-9661
F0"6~I’89lanpoad-Aq tunu!leId
EO’{6~’IL
~V666’8~9’~
]anposd-Aq mn!pglFd
Ia~ta!N
lanposd-AqaFqoD
IR3IDII~I
(’:moa) ,:r7
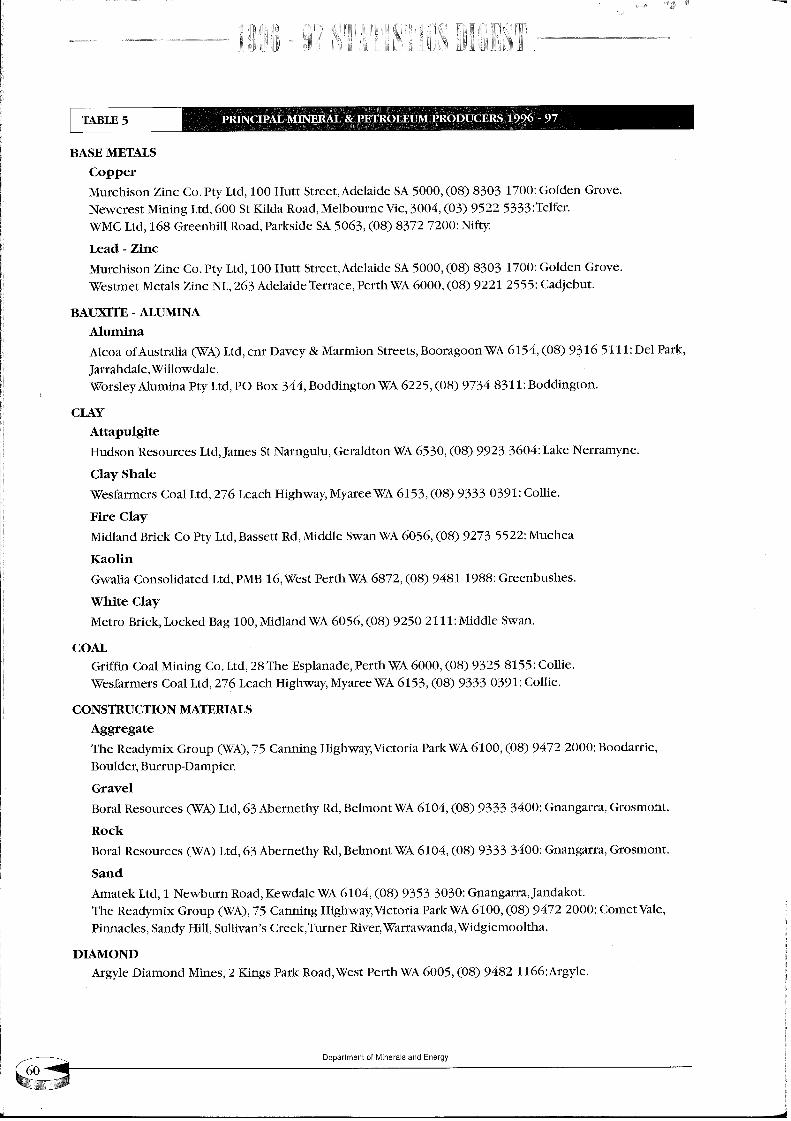
TABLE 5
BASE METALS
CopperMurchison Zinc Co. Pty Ltd, 100 Hutt Street,Adelaide SA 5000, (08) 8303 1700: Golden Grove.Newcrest Mining Ltd, 600 St Kilda Road, Melbourne Vic, 3004, (03) 9522 5333:Telfer.WMC Ltd, 168 Greenhill Road, Parkside SA 5063, (08) 8372 7200: Nifty.
Lead - ZincMurchison Zinc Co. Pty Ltd, 100 Hutt Street,Adelaide SA 5000, (08) 8303 1700: Golden Grove.Westmet Metals Zinc NL, 263 Adelaide Terrace, Perth WA 6000, (08) 9221 2555: Cadjebut.
BAUXITE - ALUMINAAluminaAlcoa ofAustralia (WA) Ltd, cnr Davey & Marmion Streets, Booragoon WA 6154, (08) 9316 5111 Del Park,Jarrahdale,Willowdale.WorsleyAlumina Pty Ltd, PO Box 344, Boddington WA 6225, (08) 9734 8311: Boddington.
CLAYAttapulgiteHudson Resources Ltd,James St Narngulu, GeraldtonWA 6530, (08) 9923 3604: Lake Nerramyne.
Clay ShaleWesfarmers Coal Ltd, 276 Leach Highway, Myaree WA 6153, (08) 9333 0391: Collie.
Fire Clay
Midland Brick Co Pty Ltd, Bassett Rd, Middle SwanWA 6056, (08) 9273 5522: Muchea
KaoHn
Gwalia Consolidated Ltd, PMB 16,West PerthWA 6872, (08) 9481 1988: Greenbushes.
White ClayMetro Brick, Locked Bag 100, MidlandWA 6056, (08) 9250 2111: Middle Swan.
COAL
Griffin Coal Mining Co. Ltd, 28 The Esplanade, Perth WA 6000, (08) 9325 8155: Collie.Wesfarmers Coal Ltd, 276 Leach Highway, Myaree WA 6153, (08) 9333 0391: Collie.
CONSTRUCTION MATERIALS
Aggregate
The Readymix Group (WA), 75 Canning Highway, Victoria ParkWA 6100, (08) 9472 2000: Boodarrie,Boulder, Burrnp-Dampier.
Gravel
Boral Resources (WA) Ltd, 63 Abernethy Rd, Belmont WA 6104, (08) 9333 3400: Gnangarra, Grosmont.
Rock
Boral Resources (WA) Ltd, 63 Abernethy Rd, Belmont WA 6104, (08) 9333 3400: Gnangarra, Grosmont.
Sand
Amatek Ltd, 1 Newburn Road, Kewdale WA 6104, (08) 9353 3030: Gnangarra, Jandakot.The Readymix Group (WA), 75 Canning Highway, Victoria ParkWA 6100, (08) 9472 2000: Comet Vale,Pinnacles, Sandy Hill, Sullivan’s Creek,Turner River, Warrawanda,Widgiemooltha.
DIAMOND
Argyle Diamond Mines, 2 Kings Park Road,West PerthWA 6005, (08) 9482 1166:Argyle.
Department of Minerals and Energy
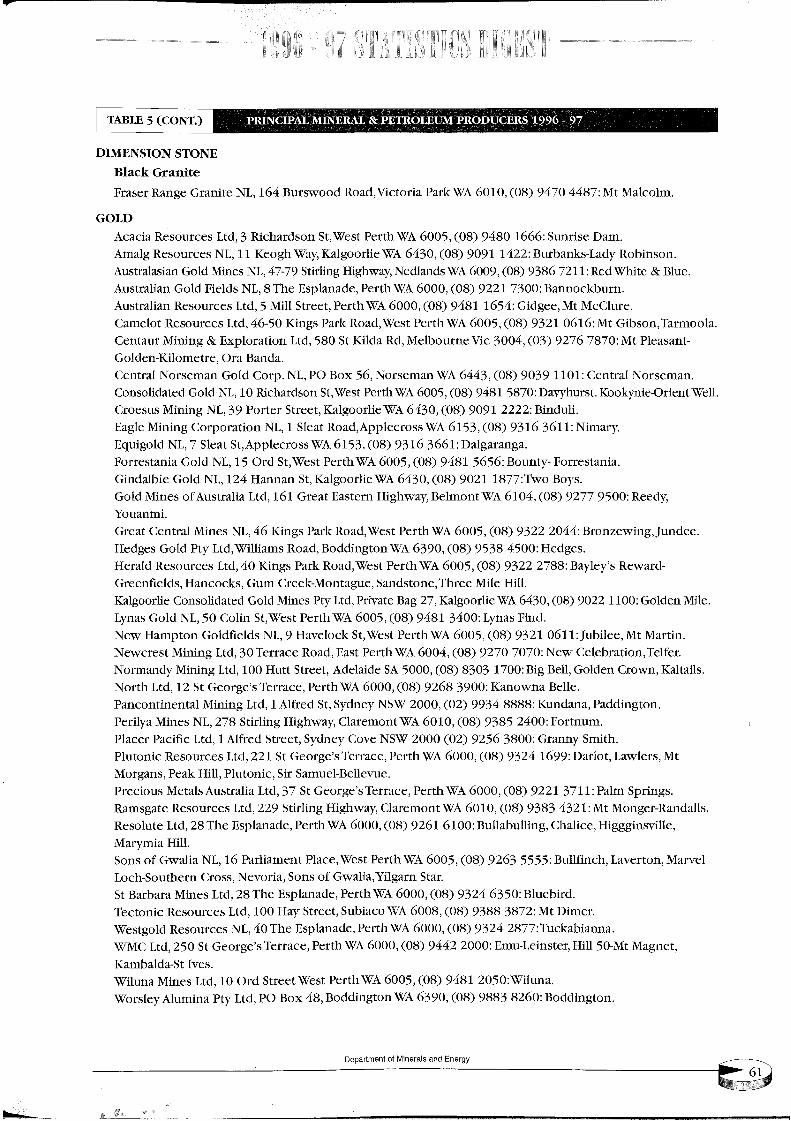
’um~u!ppo~t :09Eg ~gg6 (g0) ’06~9 VAkUOl~u!ppo~t ’g9 xofl Od ’prI ~d’~ung~:0g0g 18~6 (~0) ’¢009 v~qlJ~d lsg~lg~J1S pao 0I ’p!2 sgu~N ~unI~
’!ou~gN ~N-0~ II~H ’Jmsu~-nm~ :000g g~6 (~0) ’0009 V~ qlJ~d ’o3gJa~& s,~oo9 ~S 0~g ’P~’guug~qmlan~:LLgE >g{6 (g0)’0009 v~qlaad ’apgugldsR aqz 0~ ’3N saaanosa8 ploglsa~
aau~ 1~ :gkg{ 88{6 (g0) ’g009 V~ oag~qns ’!oaalg XgH 00 [ ’p!~ saaanosa~’Pa~qanI~ :0g{9 ~g{6 (~0)’0009 V~ qlaad ’ap~u~IdsR aq~ ~g ’p12 sau~N ~a~qa~R
’a~lg ua~gK’e~I~O jo gnog ’~aoaaN ’ggoaD uaaRlnog-qao2Iaaa~N ’uolaaa~ ’qa~n~ :��¢g {996 (R0)’g009 V~ Rlaad lga~’aa~Id luam~Ia~d 9I ’~N ~I~ ~o
’9~stg~H ’9~g~qD ’~t~nq~gng :0019 19E6 @0)’0009 V~ q~Jgd ’~p~uNds~ 9q& 8E ’P12
’s~ads mlgd :I I k{ I E E6 (g0) ’0009 V~ q!aad ’aagaaa& s,a~aoaD lg £{ ’p!~ g~Igalsnv glglaN snopaad’a~alIaR-Ian~gg a~g ’a~uolnld ’II~H Bgad
1N ’saaI~gR ’loIag~ :669I ~E{6 (80) ’0009 v~qlaad ’aagaaaZ g,a~aoaD lg [gg ’pa~ gaaanogaN a~uolnld’q!~s X~gaD :008{ 9gg6 (g0) 000E ~gN aaoD XaupXg haaalS pa.1JW I ’p12 ag~agd
’mnmao~ :00}E gg{6 (80) ’0109 V~lUO~aaglD ’Xg~q~H ~uga~lg 8kg ’~N satgN gXWad’uol~ppgd ’gugpunN :8888 ~{66 (g0) ’000g ~gN XaupXg ’lg paa~ I ’pl~ ~u~N IglUaNluoaugd
¯ alIa~ gu~ougN :006{ 89E6 (80) ’0009 V~ qlaad ’aagaaaZ s,a~aoaD !g E I ’pl~ qlaoNSWIlgN ’u~oaD uaploD ’IDa ~ :00£I {0~8 (80) ’000g Vg aP~glaPV ’laaalg lmH 00I ’p!2 ~u~u~N
’aaJIaZ’uo~lgaqalaD ~aN :0k0k 0kg6 (g0) ’}009 V~ qlaad lSgR ’pgoR aagaaa& 0{ ’pl~ gNtgNu~lagN 1N ’aaI~qnf: I 190 I g {6 (80) ’g009 V~ qlaad !sa~’18 ~aolaagH 6 ’2N gPlagploD uoldmgH
pu~d sguX2:00>{ 1~>6 (80)’g009 v~qlaad lsa~’lg u~IoD 0g ’~N plod’aI~N uaploD :00I I gg06 (80)’0{}9 V~ a~Iaoo~IgR ’ZE ~g~ al~a, ad ’pl~ ~d sa~N plod palgp~IosuoD a~goo~Ig
’~H aI~N aaaq&’auolspugs ’angmuoN-NaaaD rand ’s~aoaugH ’spla~aaa~-pag~a8 s,XalXg~ :gRZE gg{6 (80) ’g009 V~qlaad lsa~’pgoN Bagd s~u~ 0> ’p!~ saaanosa8 plgaaH
"sa~paH :00g} 8{g6 (80) ’06{9 V~ uo!~u~ppoR ’pgoN smg~II~’p!2 ~d plod sa~paH¯ aapunf’~u~azuoa~ :}>0g gg{6 (80) ’g009 V~ Rlaad lsa~’pgoR Nagd s~u~ 9} ’~N saNN IgaluaD
’~u*ugnox’XpaaN :0096 kkg6 (80)’~019 V~ luo~a~ ~R~H uaa!sgR lgaaD I9I ’pl~ g~lgalgnvjo gau~N plod
¯ sXoa o~&:Zkg I I E06 (80)’0~9 V~ a~goo~IgN ’18 ug~gH }E [ ’~N plod a~qlgP~D"g~umsaaaod -~uno~ :9g9g 18>6 (80)’g009 V~qlaad lsa~’!g paD gI ’~N plod
¯ g~ugag~Ig~ :199{ 91 {6 (80) ’{g[9 V~ ssoaaalddv’!g lgaN k ’~N Plo~nba¯ XagugN : I 19{ 91 {6 (80)’ { g 19 V~ ggOaaalddV’pgOR ~galg I ’~N uo~lgao&oD ~u~NN
"gnptga :EEEE 1606 (80) ’0{>9 V~ agaoo~IgN ’laaalg aaaaod 6{ ’RN ~u~u~N snsaoaD¯ ga~lua~aO-ag*~ooN ’lsanq~gG :0k8� 18}6 (80)’g009 V~qlaad !sa~’lg uospagqaN 0I ’~N PloD PaagP~IOSUOD
¯ ugu~asaoN IgaluaD : I 011 6{06 (80) ’{}}9 V~ ugmasaoN ’9g xo~ Od ’~N ’&oD plod ugu~asaoN IgaluaD’gpug~ gaD ’aalamOI~-uapIoD
-lugggald 1N :0£8k 9kE6 ({0) ’}00{ a~A auanoqlaN ’pN gp~ lg 08g ’p!~ uoBgaoldx~ ~ ~u~u~N anmuaD’gloomag&’uosq~D 1N :9190 Ig{6 (80) ’�009 V~qlaad lsa~’pgoN ~agd s~t~ 0g-9> ’p!2 saaanosa8 !olamgD
’aanlDaN 1N ’aa~p~D :>g9I Ig>6 (80)’0009 V~qlaad ’laaalg II~N g ’p!~ saaanosaR ug~Igalsnv’uanq~aouuga :00{k I gg6 (80)’0009 V~qaaad ’apgugIdsR aRZ 8 ’~N sPla~ PlOD
"anI~ ~ aaN~ paR:I I EZ 98{6 (80)’6009 V~ sPuglpaN ’Ag~R~H g~g~lg 6£-k} ’2N gau,N plod ug~sglga!snV¯ uogu~qoN XpgTg~ugqan~ :gg>I I606 (g0)’0{>9 V~ a~Iaoo~IgN ’Xg~ q~oaN I I ’2N saaanosaN
mg~ as~aung :9991 08}6 (80)’g009 V~ qlaad lsa~’!g uospagqa~ { ’pl~ saaanosaN gDgaV
’uqoaIeIaI aN :kg>> 0L>6 (g0)’0109 VAX~Iagd ~!aola!A’peolt poo~sang ~91 ’~IN alg~a9 ague~I aasea8
RNOJ~S NOISN~tI~II(I
(’it~OD) g ~t~lltVit ]

TABLE 5 (CONT.)
GYPSUMH.B. Brady & Co. Pty Ltd, PO Box 42, Bayswater WA 6053, (08) 9279 4422: Lake Brown.Quantum Holdings Pty Ltd, 17 Hawkstone St, Cottlesloe WA 6011, (08) 9481 4101:Jurien Bay.Swan Portland Cement Ltd, Burswood Road, Rivervale WA 6103, (08) 9361 8822: Lake Hillman.Westdeen Holdings Pty Ltd, 7 Armstrong Road,Applecross WA 6153, (08) 9364 4951: Lake Cowcowing.
HEAVY MINERAL SANDSGarnet Sand
GMA Garnet Pty Ltd, PO Box 188, GeraldtonWA 6530, (08) 9923 3644: Port Gregory.
Ilmenite, Lencoxene, Rutile & Zircon
BHP Titanium Minerals Pty Ltd, PO Box 22, Karridale WA 6288, (08) 97582500: Beenup.
Cable Sands (WA) Pty Ltd, PO Box 133, BunburyWA 6230, (08) 9721 4111: Busselton,Jangardup,Waroona.RGC Mineral Sands, PO Box 62, Geraldton WA 6530, (08) 99568 822: Capel, Eneabba North, Eneabba West,Narngulu.TiWest Pty Ltd, 1 Brodie Hall Drive, BentleyWA 6102, (08) 9365 1390: Cooljarloo, Chandala.Westralian Sands Ltd, PO Box 96, Capel WA 6271, (08) 9727 2002:Yoganup,Yoganup Extended.
INDUSTRIAL PEGMATITE MINERALS
Feldspar
Commercial Minerals Ltd, 26-28 Tomlinson Road,Welshpool WA 6106, (08) 9362 1411: Mukinbudin,Pippingarra.
1RON OREBHP Iron Ore (Goldsworthy) Ltd, 200 St George’s Terrace, Perth WA 6000, (08) 9320 4444: Nimingarra,Yarrie.BHP Iron Ore (Jimblebar) Ltd, 200 St George’s Terrace, PerthWA 6000, (08) 9320 4444:Jimblebar.BHP Iron Ore Ltd, 200 St George’s Terrace, PerthWA 6000, (08) 9320 4444: Newman,Yandicoogina.Channar Mining Pty Ltd, 152 George’s Terrace, Perth WA 6000, (08) 9327 2327: Channar.Hamersley Iron Pty Ltd, 152 George’s Terrace, PerthWA 6000, (08) 9327 2327: Brockman, Marandoo,TomPrice, Paraburdoo.Koolyanobbing Iron Pty Ltd, 1 William St, PerthWA 6000, (08) 426 3388: Cockatoo Island, Koolyanobbing.Robe River IronAssociates, 12 St George’sTerrace, PerthWA 6000, (08) 9421 4747: Pannawonica.
LIMESAND - LIMESTONECockburn Cement Ltd, Russell Road, East Munster WA 6166, (08) 9411 1000: Cockburn Sound, Coogee.Swan Portland Cement Ltd, Burswood Road, Rivervale WA 6103, (08) 9361 8822:Wanneroo.
MANGANESEValiant Consolidated Ltd, 250 St George’s Terrace, Perth WA 6000, (08) 9321 3797: Mt Sydney, Pearana.
NICKELMining Project Investors Pty Ltd, 600 Bourke Street, Melbourne Vic 3000, (03) 9672 3222: Black SwanOutokumpu Australia Pty Ltd, 141 Burswood Road., Burswood WA 6100, (08) 9472 3144: ForrestaniaWMC Ltd, 250 St George’s Terrace, Perth WA 6000, (08) 9442 2000: Blair, Carnilya Hill, Kambalda, Leinster,Mt Keith.
PETROLEUMApache Energy Ltd, 256 St George’s Terrace, PerthWA 6000, (08) 9422 7222:Campbell, Harriet, Rosette,Sinbad,Tanami.BHP Petroleum Pty Ltd, 152-158 St George’s Terrace, PerthWA 6000, (08) 9278 4800: GriffinBoral Energy Resources Ltd, 60 Hindmarsh Square,Adelaide SA 5000, (08) 8235 3737: Beharra Springs,Tubridgi.CMS Transmission of Australia Pty Ltd, 8 Marchesi St, Kewdale WA 6105, (08) 9353 7555: Dongara,Mondara.
Department of Minerals and Energy
¯ ggtn.adg aaatlZ:L#Og #g66 (gO)’61g9 V?A ggu!adg aaaq~’9I [ xoi{ Od ’P!~I DI~?A"~tooaq~ag 1IN :gg6I I g#6 (gO) ’gkg9
(INIVS VDYIIS - VDYIIS
¯ a)Wl )ILq.d ’lsg~qgaoqa(I a~tg~l :g6#g 0~#6 (gO) ’~919 V?A I[!H uo! .[p~UgH ’pgo~I uanq)DoD ’pl~l Ald ~tq.qqougAIoosI !Igg VZA
¯ doo~l gsalaSCl :IIg# ZE~6 (gO) ’0009 V?Aqlaad ’laaalg lunoIN EE ’aanlt*aAlu!of llgg ~{g£ )[agqg’poalaglN a)Wl
’aa!dm~([ :66EE kE£6 (gO)’0009 vzAqlaad ’aagaaaZ s,a~aoao lg ggI-gg I ’P!~I Ald (guo!l~aado) !lgg aa!dm~(I’puglPaH laod :ggEI 0~16 (gO)’IEZ9 V?A Pu~IPaH laod ’Og# xo{[ OcI ’Pl~I g.q~-tlsnv II!~agD
’uPlu~H ttlaoN ’u~poo9’~a~u~?A/)I~SgoD : I I I# #SS6 (gO)’0009 ¥?A tllaad ’aa~aaa~L aP!~IaPV I ’Pl~I Ald ’lad aaoqgJJO apFpoo?A
¯ ~aaap~mm~X’tq.p~Fg ’almtg-aallOH ’!saaD ’al~oD ’pu~ISI ~oaa~{{:0009 {9~6 (g0) ’0009 V?Atllaad ’aa~aaa~L g,agaoaO !g Og~ ’IA~) ’CL~ldVAk) pl~I Ald mnaloalad ’lsn¥1gaA&
’aa~aaa~Llga!A’u~opung ’p~oFl ’ga~puno£ ’~u!R[ :~91/- #~g (gO)’IOOg Vg aP!~laP¥’laaa!g lIaJUaa9 6{ ’p1~I golu~g
¯ aaUaOH 1IN :001~ 0g#6 (gO) ’gO09 ’V?Aqlaad lgaA~’anua~¥ aomuaA I{ ’Pl~I Ald ~!Falsn¥I!O aa!tuaad’~p~poo?A:O0gS 1996 (gO) ’0009 V?A qlaad ’ap~u~Id£H atI~ gg ’pl~l Zld ~aauH ~uaoqd
"pu~IgI a!|a.W’-~addad qlnog ’pFaaHqlaoN ’V.aaaqD :00kk 9g~6 (gO)’g009 VZ~ qlaad !sa?A’p~o~I )lard s~ .ug~ 9L ’Pl~I Ald ~!t~a!snv!sa?A snAoN
oopu~?A:00g{ 6~6 (g0) ’0009 V?A qlaad ’aa~aaaj~ s,agaoao aS 0gg ’Pl~I AlcI ~!Falsnv 8u!anpoad :~ uo!l~aoldx~[ ~qoIN
"luoD I~ILI~IOIIZRd
(’,l&IO:)) ~ R~IltV, I.

ABBREVIATIONS, REFERENCES, UNITS AND CONVERSION FACTORSAs the document makes use of abbreviations and references, an explanation of each has been included below.A conversion
table, relating the units by which various commodities are measured, has also been provided.
ABBREVIATIONScons concentrates n.ap. not applicable
f.o.t, free on truck f.o.b, free on boardf.o.r, free on rail ¥ JapaneseYenA$ Australian Dollar US$ United States DollarABS Australian Bureau of Statistics GDP Gross Domestic ProductAFR Australian Financial Reviezv BMR Bureau of Mineral ResourcesCSO Central Selling Organisation HBI Hot Briquetted IronDRI Direct Reduced Iron IMF International MonetalT FundRBA Reserve Bank of Anstralia
ABARE Australian Bureau of Agricultural and Resource Economics
REFERENCES(a) Estimated f.o.b, value.
(b) Metallic by-product of nickel mining.
(c) Value based on the average Australian Value of Alumina as published by theABS.(d) Value at works.
(e) Estimated ex-mine value.(f) Value based on monthly production and average gold price of that month as supplied by GoldCorp.(g) Estimated f.o.t, value.
(h) Estimated f.o.r, value.(i) Estimated f.o.b, value based on the current price of nickel containing products.(j) Delivered value.
(k) Metallic by-product of copper mining.
(r) Revised from previous edition.
UNITS AND CONVERSION FACTORS
Mass
Metric Unit Symbol
1 gram (g)1 kilogram (kg)
1 tonne (t)
1 tonne (t)
Imperial Unit
= 0.032151 troy (fine) ounce (oz)= 2.204624 pounds 0bs)
=1.10231 United States short ton [1 US short ton =2,000 lbs]-- 0.98421 United Kingdom long ton [1 UK long ton = 2,240 lbs]
Volume 1 kilolitre (kl) = 6.28981 barrels (bbls)1 cubic metre (m3) = 35.3147 cubic feet (ft3) [1 kilolitre (kl) = 1 cubic metre (m3)]
Energy 1 kilojoule (kj) = 0.94781 British Thermal Units (Btn)
Energy Content Pref’tx
Coal 19.7 GJ/t kilo (k) 103Condensate 32.0 MJ/L mega (M) 10~
Crude oil 37.0 MJ/L giga (G) 109
LNG 25.0 MJ/L tera (W) 1012
Natural gas 38.2 MJ/m3 peta (P) 1015
Department of Minerals and Energy

![Petroleum Exploration Production Act regulations 1984 · · 2016-06-16LAWS OF MALAWI Petroleum (Exploration and Production) Cap. 61 Petroleum (Applications) Regulations 41 [Subsidiary]](https://img.pdfslide.us/doc/110x75/5ac9a3347f8b9a5d718da164/petroleum-exploration-production-act-regulations-1984-of-malawi-petroleum-exploration.jpg)