Embed Size (px)
Citation preview
Structural and Functional Studies of
Sensor Kinase RetS from Pseudomonas aeruginosa
and
Peptidoglycan Hydrolase SleB from Bacillus anthracis Xing Jing
Dissertation submitted to the faculty of the Virginia Polytechnic Institute and State University in partial fulfillment of the requirements for the degree of
Doctor of Philosophy
In Biological Sciences
Florian D. Schubot, Committee Chair David R. Bevan
Daniel G. Capelluto Zhaomin Yang
April 30, 2013
Blacksburg, Virginia
Keywords (PartI): Pseudomonas aeruginosa, biofilm formation, EPS, two-component systems, RetS, periplasmic sensory domain, GacS, dimer, phosphatase Keywords (PartII): SleB, CwlJ, Bacillus anthracis, spore, germination, lytic transglycosylase, muramic-δ-lactam, peptidoglycan, cortex peptidoglycan
Copyright 2013, Xing Jing
Structural and Functional Studies of
Sensor Kinase RetS from Pseudomonas aeruginosa
and
Peptidoglycan Hydrolase SleB from Bacillus anthracis
Xing Jing
Abstract
Part I: The opportunistic human pathogen Pseudomonas aeruginosa causes both
acute and chronic infections in predisposed individuals. Acute infections require a
functional Type Three Secretion System (TTSS), which mediates the translocation of
select cytotoxins into host cells. Chronic infections, the leading cause of death among
cystic fibrosis patients, are characterized by drug-resistant biofilms formation. To
regulate gene expression, Pseudomonas aeruginosa utilizes two-component
regulatory systems (TCS). Specifically, we focus on the TCS signaling kinase RetS,
which is a critical repressor of biofilm formation. The signaling mechanism of RetS is
unusual. According to recent findings and one hypothesis, RetS employs a novel
signaling mechanism involving direct binding to the signaling kinase GacS, thereby
repressing the GacS-induced biofilm formation. RetS is believed to be regulated by
the interaction of its periplasmic sensory domain (RetSperi) with an unknown ligand.
As such, RetSperi is a potential drug target. We hypothesized that ligand-binding shifts
the equilibrium between the formation of a RetS homo-dimer and the RetS-GacS
complex by tuning the homo-dimerization of the RetSperi. While the molecular signal
that regulates RetS is unknown, our structural studies of the sensory domain suggest
that this ligand is a carbohydrate-based moiety. Unchanged biofilm-EPS production
phenotype of RetSperi ligand binding site mutants indicates that the natural ligand is
not from Pseudomonas aeruginosa.
Additional experiments unambiguously determined that the sensory domain
forms a stable homodimer. Adding to the complexity of the system, we have identified
two possible dimer interfaces in our in vitro assays. However, inconsistent with the
current model, elimination of RetSperi results in a slightly increased biofilm EPS
production phenotype. Therefore, with the previous demonstration that RetS is able to
dephosphorylate GacS, we propose an alternative hypothesis: the RetS kinase domain
serves as a phosphatase for phosphorylated GacS; this phosphatase activity is tuned
by signaling sensing on RetSperi. Finally, to provide an important piece of information
for understanding the molecular basis of RetS-GacS signaling, we have developed a
crystallization-based structure determination strategy in order to reveal the precise
RetS-GacS interaction pattern.
Part II: Bacillus anthracis produces metabolically inactive spores. Germination of
these spores requires germination-specific lytic enzymes (GSLEs) that degrade the
unique cortex peptidoglycan to permit resumption of metabolic activity and outgrowth.
We report the first crystal structure of the catalytic domain of a GSLE, SleB. The
structure revealed a transglycosylase fold with unique active site topology and
permitted identification of the catalytic glutamate residue. Moreover, the structure
provided insights into the molecular basis for the specificity of the enzyme for
muramic-δ-lactam-containing cortex peptidoglycan. The protein also contains a
metal-binding site that is positioned directly at the entrance of the substrate-binding
cleft.
iii
Acknowledgements Foremost I want to thank my advisor Dr. Florian Schubot. You brought me into
your lab and the protein-structure biology field with all exciting projects. You put a lot of energy and time in me which made me able to go further in research in the future. You have taught me not only about science but also about being ambitious and being precise. I benefited a lot from the communication skills and logical thinking that you passed on to me. Due to your mentoring during these five years, I have improved myself in many aspects.
I would also like to thank the other three members in my committee: Dr. David R. Bevan, Dr. Daniel G. Capelluto and Dr. Zhaomin Yang. Your suggestions have been invaluable to my research.
I really enjoyed Dr. David R. Bevan’s class for protein structure-function study. Thank you for your recommendation letters for my application of 2010 National Summer School.
I thank Dr. Daniel G. Capelluto for your advice when I was applying to Virginia Tech.
I am grateful for Dr. Zhaomin Yang who let me join his pioneering research project. Your deep and precise understanding of signal transduction has been inspiring to me.
I also want to thank Dr. David Popham who provided me the opportunity to join the SleB project.
I also like to express appreciation for Dr. Birgit Scharf’s kindness to me. Since you came to our program, I have obtained a lot of advice from you. You invited me to your thanksgiving party every year. You are a very kind person and friend.
To the Schubot lab, I thank all my labmates who I have worked with. I thank Robert Cory Bernhards, Yi Xiao, Jordan Mancl, Manisha Shrestha and all undergraduate students. I appreciate Jordan Mancl’s editorial support to this dissertation.
I also want to thank my lovely girlfriend Dr. Ye Liu. You have brought a lot of happiness into my life.
To people in Microbiology program at Life Science I building, thank you all for constructing the friendly environment. Thank everybody who allowed me to borrow your reagents or to use your instruments.
iv
Table of content
Abstract
ii
Acknowledgements
iv
List of Figures
ix
List of Tables
xi
Part I Signaling Role of the Sensor Kinase RetS in Biofilm formation Regulation of Pseudomonas aeruginosa
Chapter One: Introduction and Review of the Literature 11
Pseudomonas aeruginosa virulence mechanisms 2Two-Component Systems 4Biofilm-a highly drug- resistant matrix 7The exopolysaccharide synthesis locus (psl) and pellicle locus (pel) 8Virulence mechanisms associated with chronic and acute P. aeruginosa infections are reciprocally regulated 9The role of TCS in gene regulation in P. aeruginosa 10RsmZ/RsmA regulatory system 10GacS/GacA two-component system 12The signaling kinase LadS enhances biofilm formation 14The non-canonical sensor kinase RetS inhibits GacS/GacA signaling 15RetS-GacS Signaling mechanism 19Hypothesis and Objectives of the study 20References
22
Chapter Two: Crystal structure and oligomeric state of the RetS signaling kinase sensory domain 33Abstract 34Introduction 35Materials and Methods 38 Cloning, expression, and purification of the RetS sensory domain 38 Preparation of selenomethionine- labeled RetSperi 40 Limited proteolysis of the RetS sensory domain 40
Crystallization of RetSperi and SeMet-RetSperi 41 Data collection, structure solution, and refinement 41 Protein–protein crosslinking 42 Quantitative oligomerization assay 42
v
Results 44 The RetS sensory domain assumes a beta-sandwich fold
reminiscent of carbohydrate binding proteins 44 Qualitative and quantitative evidence for RetSperi dimerization 45Discussion 49 The putative ligand binding site of RetSperi 49
Implications of RetSperi dimerization for the RetS-GacS signaling mechanism 51
Conclusions 52Acknowledgements 52References
53
Chapter Three: Characterization of the Ligand Binding and Dimerization of RetS Periplasmic Sensory Domain In vitro and In vivo 62
Abstract 63Introduction 64Materials and Methods 66
PSL overexpression and isolation from Pseudomonas aeruginosa 66 Differential Scanning Fluorimetry (DSF) assay for RetSperi ligand
binding study 67Circular Dichroism 67Construction of expression plasmids for retS and retS mutant genes 67
RetSperi cysteine variant preparation for in vitro crosslinking experiments 68
Bacterial strains and growth 69Reverse transcription-PCR and quantitative real-time PCR (qRT-PCR)
69
Congo red biofilm assay to detect biofilm exopolysaccharides (EPS) production 70
Results and Discussion 71Ligand titration into RetSperi causes a decreased melting temperature (Tm) and only PSL-A (not B or C) could shift the Tm of RetSperi 71PSL-A has no signaling role in RetS-involved biofilm formation regulation 71Previously identified synthetic biofilm inhibitors do not affect RetS signaling 72Deletion of RetSperi causes moderately increased biofilm EPS production 72
vi
Both putative dimer interfaces assist in vitro cysteine-cysteine crosslinking 73Introduction of single cysteine mutations to RetSperi do not affect in vivo biofilm EPS production phenotype 74Single mutations on either putative ligand binding site do not affect biofilm EPS production 75Conclusion and Discussion 75
Acknowledgements 76 References
77
Chapter Four: Study the Functional Role of Cytoplasmic domains of RetS in Biofilm Formation Regulation 93
Abstract 94Introduction 95Materials and Methods 97
Construction of plasmids containing either retS or retS mutant genes, transformation to Pseudomonas aeruginosa and congo red biofilm assay 97Cloning, expression and purification of the RetS kinase domain and the GacS kinase domain 97Circular dichroism experiments to test ATP* (noncleavable ATP analog) binding 99Crystallization of GacSkin and RetSkin 99
Results and Discussion 100The conserved aspartate residues of the RetS response regulator domains are not required for regulating EPS production in PAO1 100Is the phosphatase motif of the RetS kinase domain involved in the regulation of EPS production? 100Both purified RetSkin and GacSkin can bind ATP* 101Crystallization of RetSkin with and without ATP* 102Conclusion and discussion 102
Acknowledgements 103References
104
Chapter Five: Final Discussion 113References
117
Part II The catalytic domain of the germination-specific lytic
transglycosylase SleB from Bacillus anthracis displays a 118
vii
unique active site topology Abstract 119Introduction 120Materials and Methods 122
Expression and purification of SleB and SleBCAT 122Cloning, expression, and purification of selenomethionine-substituted SleBCATT and SleB CATT
L143M 122Crystallization of native SleBCATT and SleBcat L143M 123Data collection, structure solution, and refinement 123Construction of active site mutant and assay of SleB function 124
Results 125Structure solution and overall fold of SleBCAT 125Identification of the catalytic glutamate residue of SleB and CwlJ 125Conserved and unique features of the PG-binding cleft of SleBCAT
127
The entrance of the SleBCATT substrate binding cleft is shaped by a metal-binding site 129
Discussion 130Acknowledgements 130References 131
viii
List of Figures Part I Chapter One Figure 1.1: Schematic diagrams of two-component systems (TCSs) 30Figure 1.2: Schematic diagrams of domain organizations of GacS, LadS
and RetS based on sequence analysis 31Figure 1.3: Schematic representation summarizing the currently signal
transduction pathway for the reciprocal regulation of genes associated with chronic and acute infections, respectively
32
Chapter Two Figure 2.1: The final equations to fit the FRET data 58Figure 2.2: Structural determination and analysis of RetSperi 59Figure 2.3: Demonstration and quantification of RetS dimerizatioinperi 60Figure 2.4: Structural analysis for RetSperi ligand binding site prediction
61
Chapter Three Figure 3.1: Examination of biofilm EPS production and gene expression
of target PAO1 strains 84Figure 3.2: Results of the Differential Scanning Fluorimetry (DSF) assay 85Figure 3.3: Examination of protein-ligand binding for PSL and RetSperi 86Figure 3.4: Signaling role of PSL overexpression 87Figure 3.5: Ligand screening aimed at identifying signaling-effective
RetSperi ligands using commercial biofilm inhibitors 88Figure 3.6: In vitro cysteine-crosslinking results to probe the RetSperi
dimerization interface 89Figure 3.7: Effect of single cysteine introduction into RetSperi on EPS
production 90Figure 3.8: Examination of EPS production in single cysteine mutants
with cysteine-crosslinker BMOE 91Figure 3.9: In vivo mutational analysis targeting the putative RetSperi
ligand binding site
92
Chapter Four Figure 4.1: Homology models for RetSkin and GacSkin 109Figure 4.2: The signaling role of phosphorelay residues of RetS in
biofilm EPS producton regulation 110Figure 4.3: Examination of ATP-binding for RetSkin and GacSkin 111
ix
Figure 4.4: Crystallization of RetSkin with and without ATP* 112
Part II Figure 6.1: Crystal structure of SleBCAT 135Figure 6.2: Mapping of conserved and unique features of the SleBCAT-active site 136
x
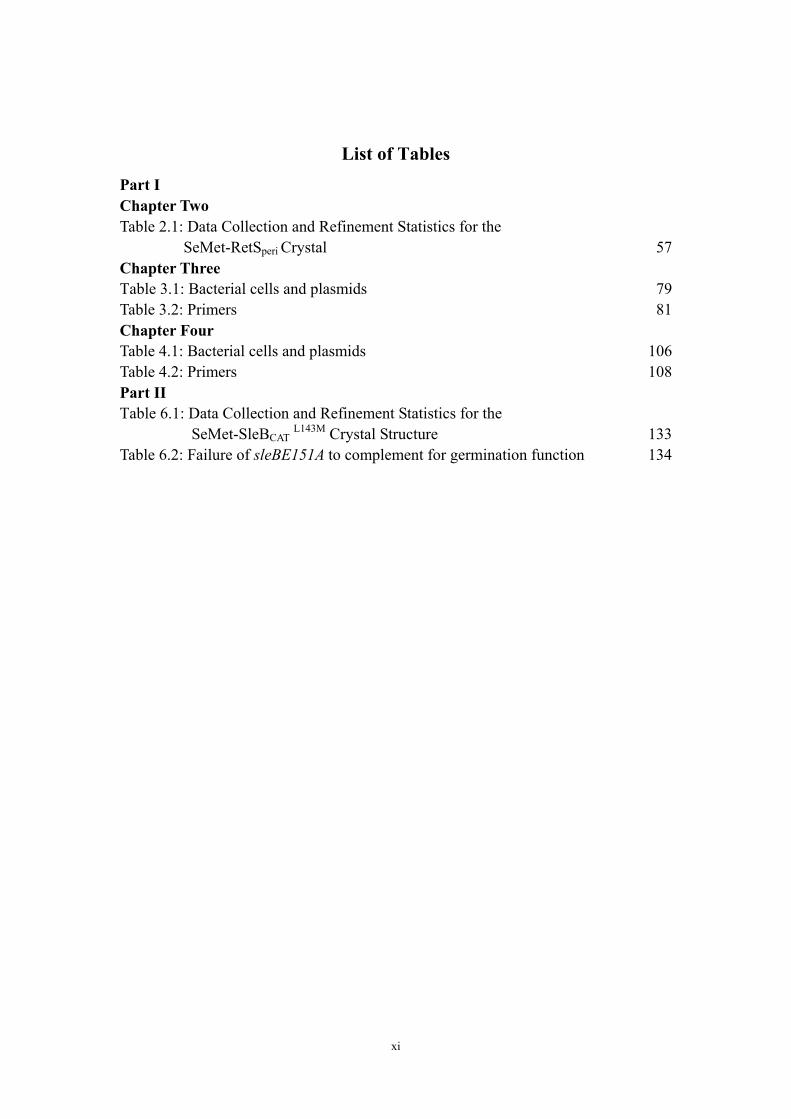
List of Tables Part I Chapter Two Table 2.1: Data Collection and Refinement Statistics for the
SeMet-RetSperi Crystal 57Chapter Three Table 3.1: Bacterial cells and plasmids 79Table 3.2: Primers 81Chapter FourTable 4.1: Bacterial cells and plasmids 106Table 4.2: Primers 108Part II TTable 6.1: Data Collection and Refinement Statistics for the
SeMet-SleB CATT
L143M Crystal Structure 133Table 6.2: Failure of sleBE151A to complement for germination function 134
xi
Part I
Signaling Role of the Sensor Kinase RetS in Biofilm formation
Regulation of Pseudomonas aeruginosa
Chapter One
Introduction and Literature Review
1

Pseudomonas aeruginosa virulence mechanisms
Pseudomonas aeruginosa, the type species of the genus Pseudomonas (4), is an
aerobic Gram-negative bacterium (87). Ubiquitous in nature, P. aeruginosa can be
found in various environments such as soil, water, skin-flora and most man-made
environments throughout the world, largely due to the fact that it is able to utilize a
wide range of organic materials for nutrition (4). Because it grows on the surfaces of
most materials, this human pathogen is found in many medical institutions (8, 56).
In plants, animals and humans, P. aeruginosa causes a broad range of
opportunistic infections (44, 82, 89, 106). In humans, P. aeruginosa may cause
chronic as well as acute infections in burn victims, and other immunocompromised
patients (64). It has been estimated that the lungs of more than 80% of Cystic Fibrosis
(CF) patients are infected by Pseudomonas aeruginosa (108). Therefore there is a
strong interest in looking for effective therapies for this pathogen. The major
challenge Pseudomonas aeruginosa brings to the medical community is its high
antibiotic-resistance (64). Recent studies have shown that the environmental
adaptability of Pseudomonas aeruginosa may be attributed to the complex regulation
of gene expression, which controls the switch of specific virulence effector expression
between chronic and acute infections (23, 39).
Pseudomonas aeruginosa has a relatively large genome (6-7Mb) encoding
around 6000 (predicted) genes, among which, 5021 are conserved across at least five
of the to date analyzed genomes with a minimum sequence identity of 70% (67). The
pathogenesis of acute infections requires the expression of genes encoding the type III
secretion system (TTSS), along with other effector proteins (115). The TTSS, a
special toxin-translocating machinery found in a number of Gram-negative bacteria, is
composed of a needle-like protein complex, which forms a channel to transport
effector proteins into host cells. Four effectors have been identified for Pseudomonas
aeruginosa: ExoS, ExoT, ExoU and ExoY (18, 113, 115). Responsible for virulence,
2
these toxins perform a wide range of functions, including inhibiting host cell
phagocytosis, tuning of host inflammatory responses, and host cell killing (113). A
three-protein set is required for translocation: hydrophobic proteins PopB and PopD
act as translocators, inserting into host cells; while the hydrophilic protein PcrV, forms
a complex at the end of the needle, which acts as a platform for the two translocators
(16, 71). The whole set of machinery is constructed and activated by interaction with
host eukaryotic cells and can also be induced in vitro under low-calcium conditions
(24, 40).
Biofilm formation by P. aeruginosa is a serious problem for medical care in
industrialized societies. The increased antimicrobial resistance of P. aeruginosa
biofilms underlies the difficulties in treating of many chronic infections (81). P.
aeruginosa biofilms may form on abiotic surfaces, such as catheters but are also the
underlying cause of the chronic infections in Cystic Fibrosis patients’ lungs (17). It
has been shown that long term infections consist of a mixture of biofilm and
planktonic Pseudomonas aeruginosa cells coexisting together (29). Biofilm
communities are held together by a protective extracellular polymeric matrix. It has
been demonstrated that biofilm formation involves the coordination of several
sequential processes: beginning with surface attachment by planktonic bacteria
followed by the formation of microcolonies and subsequent development of
differentiated structures in which individual bacteria as well as the entire community
are surrounded by exopolysaccharides (22, 33, 74, 76). Biofilms enable bacteria to be
much more resistant to antibiotics compared to their planktonic counterparts. Many
substances exist in the biofilm matrix, such as DNA, polysaccharides, cell debris such
as flagella and pili, proteins, membrane vesicles (MV) and phage, which serves as a
protective ‘coating’ for biofilm bacteria (43, 66). Current studies have shown that
MVs are likely important in disease pathogenesis, possibly responsible for the
antibiotic resistance of a biofilm. Different proteins are packaged into MVs to make it
3
like a ‘decoy’ or ‘sponge’ that would decrease the levels of harmful agents such as
antibiotics and immune factors that penetrate the biofilm (90).
The sputum of CF patients, especially those with chronic infections, is rich in
biofilm and planktonic Pseudomonas aeruginosa cells (34, 111). However, it is not a
good source of this pathogen for pathobiology studies due to patients’ drug use and
patient-to-patient variability (58, 93, 95). A variety of man-made media have been
developed to simulate the CF lung environment. Most recently, an artificial CF
sputum medium has been developed by using mucin, albumin and DNA, instead of
CF sputum, to study the global transcription profile of Pseudomonas aeruginosa.
Their results show that by using this special medium, 23 TTSS genes and a few
anaerobic respiration genes were up-regulated in early exponential growth phase
suggesting augmented virulence factor expression and priming biofilm formation.
Under stationary growth phase, however, TTSS genes are down-regulated in this
medium (27).
Two-Component Systems
There are many ways for bacteria to regulate virulence factor expression. The
most commonly used signal transduction pathways are two-component
sensor–regulator systems (TCSs) (20, 68). TCSs allow bacteria to modulate gene
expression in response to environmental stimuli (38, 97). Most bacterial species
contain dozens of TCSs, which regulate wide range of life activities such as
fundamental metabolism and motility (28). TCSs are the most common multistep
signaling pathways found in nature. Absent in mammalian cells, these systems are
appealing targets for the development of antimicrobial agents against pathogens (28).
The conserved core structure of TCSs is composed of a membrane-associated
sensor histidine kinase (HK) protein domain (the “sensor”) as well as a cognate
receiver domain (the “response regulator”-RR) whose function is regulated by a
phosphotransfer reaction from its cognate histidine kinase. The HK is responsible for
4
receiving the input environmental signal to regulate the signaling pathway followed
by auto-phosphorylation at a conserved histidine residue. The RR then receives the
phosphoryl group at a conserved Aspartate residue and subsequently induces a
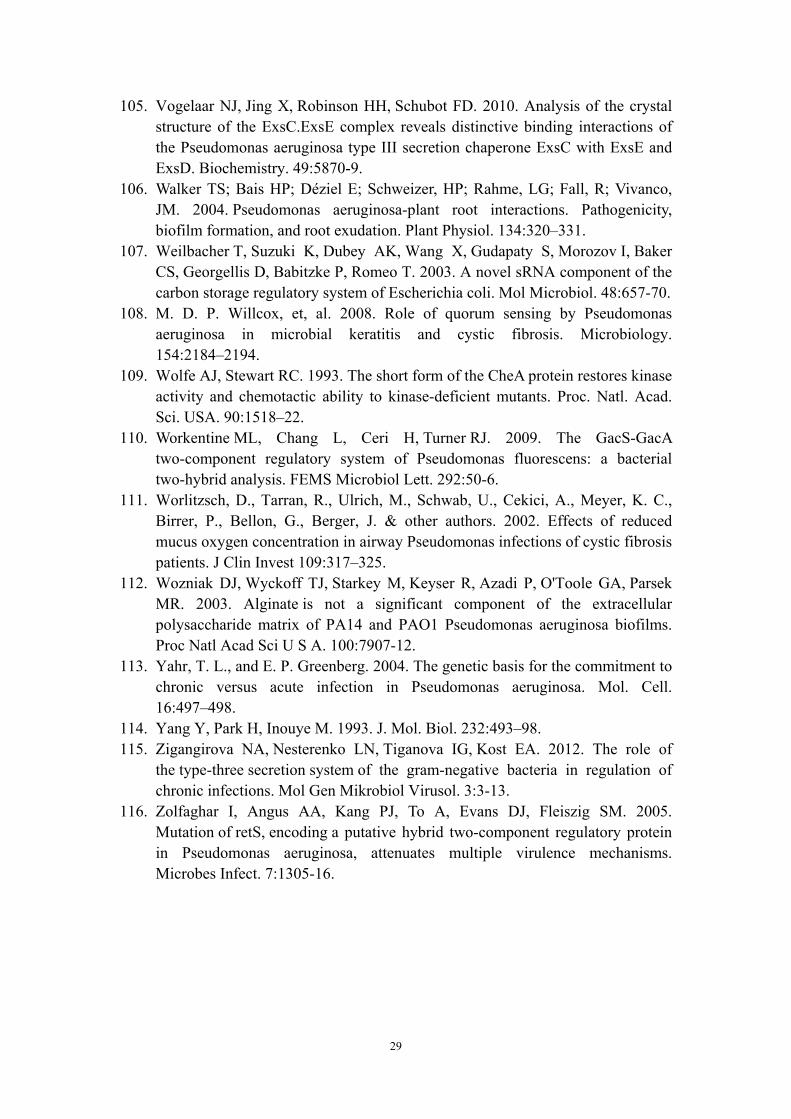
conformational change, which results in effective cellular responses (figure 1.1a) (79,
96).
The distinct trait of HKs phosphorylation is the formation of phosphoramidates
rather than the phosphoesters formed in conventional Ser/Thr/Tyr kinases. The N-P
bond in phosphor-Histidine between the phosphoryl group and the imidazole ring in
Histidine is relatively unstable, and is thus more suitable as a phosphotransfer
intermediate (28, 98). Like other signaling proteins, a HK has an input domain linked
to a conserved catalytic kinase core in the cytoplasm composed of two domains: a
dimeric Histidine phosphotransfer domain, which receives the phosphoryl group from
ATP once it is hydrolyzed by a C-terminal ATPase domain (21). There are several
conserved contiguous sequence motifs in the kinase cores of HKs. Based on their
specific characteristic sequences they are named H, N, G1, F and G2 boxes (1, 79, 96).
Most HKs also have phosphatase activity, which is often overlooked in
phosphorylation assays. For regulatory purposes, the phosphorylation level of the RR
is adjusted by tuning the balance between kinase and phosphatase activities via
cellular signal sensing. This signal input often requires a distinct sensory domain that
is linked to the N-terminus of the HK domain (2, 28). By virtue of having great
sequence variability within the sensory domain, HKs are able to sense a wide range of
environmental stimuli. The auto-phosphorylation of a HK domain occurs in “trans”
mode, which requires homo-dimerization, however, this dimerization does not affect
signal sensing induced HK signaling function (75, 78, 99, 100, 109, 114).
The RR is named based on its prototypical domain architecture: a phosphoryl
receiver domain linked to a variable effecter (response) domain (28, 97). RR
phosphorylation by HK at the Asp residue of the receiver generates a high-energy
5
acyl phosphate group, which causes a conformational change in the receiver domain
(5, 48, 101). This change in turn shifts the equilibrium between activity on and off
modes in the effecter domain. However, the lifetime of the phosphorylation state of
Asp could vary from seconds to hours. The intrinsic phosphatase activity of many
RRs shortens the lifetime of the aspartate site phosphorylation. But there are also a
few cases that RRs stabilize the phospho-Asp (28, 47). The functions of activated RRs
are usually associated with modulations of either DNA binding affinities of the RR
(63% of the time) or enzymatic activities (59, 91, 92, 102). The presence of multiple
homologous HK/RR pairs raises the possibility of cross-talk between structurally
similar HK and receiver domains. Although the unwanted cross phosphorylation has
been observed, the specific cognate HK/RR interactions are still strongly preferred
kinetically (61, 94).
Besides the typical two-component organization, some multistep phosphor-relay
systems possess and require individual histidine containing phosphotransfer proteins
that are responsible for receiving phosphoryl group from first-step RRs and
phosphorylating target aspartate residues in downstream RRs to achieve a three-step
His-Asp-His-Asp phosphor-relay mechanism (figure 1.1b) (28, 97). This modular
organization has been extensively investigated (54). Multistep phosphotransfer
reactions can also take place within a single HK. These kinases contain additional
phosphotransfer modules referred to as the R1 receiver and the HPt (histidine
phosphotransfer) phosphotransfer domains that are attached to the C-terminal side of
the kinase domain. These HKs are called hybrid kinases, representing about 25% of
HKs (31).
In summary, 1) TCS signaling follows a highly conserved mechanism. 2) HK and
RR interactions are highly conserved they are also highly specific, therefore unwanted
cross-talk is rarely observed. 3) Irrespective of whether a TCS or phospho-relay
system is employed, the input signal is transmitted via phosphate-transfer reactions
6
which ulitmately modulate gene expression by regulating the DNA binding affinity of
a protein or altering its enzymatic activity.
Biofilm-a highly drug- resistant matrix
CF patients are frequently colonized by bacterial biofilms within a few years of
their birth and the colonies can stay and survive throughout patients’ lifetimes. The
ability of P. aeruginosa to sustain decades-long chronic infections is thought to
depend upon the regulated developmental process of biofilm formation (81). The
interaction of P. aeruginosa with host cells can be described as a two-stage process:
initially, colonizing bacteria regulate expression to cause an acute infection, while the
subsequent persistent stage relies on the expression of adaptive factors that promote
biofilm formation (31). In acute infection stage, P. aeruginosa is vulnerable to
antibiotics. However, after successful colonization, this pathogen protects itself from
the environment attack by biofilm formation. This highly drug- resistant matrix makes
the clinical treatment for P. aeruginosa a challenge (19). The extracellular
polysaccharides are the key attributes to the biofilm matrix and crucial for the
architecture and antibiotic resistance of bacteria in biofilms (65). Different types of
polysaccharides are synthesized to form biofilms depending on the environment.
Nonmucoid P. aeruginosa strains initially colonize CF lungs, but over time, mucoid
variants emerge and become predominant (33). Mucoid strains produce a capsular
polysaccharide virulence factor called alginate, which is an acetylated polymer
composed of nonrepetitive monomers of β-1,4 linked L-guluronic and D-mannuronic
acid (33, 65). During the past decade, however, most P. aeruginosa strains being
studied, such as PAO1 and PA14, are nonmucoid (88). These strains do not produce
significant amount of alginate. Moreover, disruption of the alginate genes does not
affect biofilm formation in PAO1 and PA14. However, the biofilms produced by these
nonnucoid strains are still suggested to contain polysaccharide-material (112).
7

The exopolysaccharide synthesis locus (psl) and pellicle locus (pel)
Targeting nonmucoid P. aeruginosa strains, several groups initiated studies of
non-alginate polysaccharide expression and identified two gene loci, psl and pel (112).
The pel (pellicle) locus is a seven-gene locus, found to be responsible for pellicle
formation in PA14 by screening a PA14 transposon library for pellicle-deficient
mutants. Mutations in the pel locus do not affect PA14 biofilm initiation, however,
the colony morphology is affected. Moreover, unlike wild type cells, pel mutants are
not able to bind Congo red, which detects neutral polysaccharides (25). So far, the
structure of pel-synthesized exopolysaccharide (called PEL) has not been chemically
characterized (26). It has been demonstrated that PEL is a crucial component to
maintaining cell-cell interactions in a PA14 biofilm, serving as a primary structural
scaffold for the community. However, this function is strain specific because PEL is
not required for biofilm cell attachment and development in a PAO1 strain (103).
Instead, the psl-synthesized exopolysaccharide (PSL) has been proven to be the
primary structural polysaccharide for biofilm maturity. 15 enzymes (PslA to PslO),
encoded by the psl operon, are responsible for PSL biosynthesis. Mutational analysis
in biofilm attachment assays indicated that PslH and PslI are two key enzymes
(galactosyltransferase and mannosyltransferase respectively) for PSL biosynthesis.
Deletion of either pslH or pslI also causes reduced biofilm formation (26, 46, 65). The
Wozniak group has shown in their initial study that the exopolysaccharide PSL is
mainly composed of galactose and mannose, as well as glucose and traces of
rhamnose, xylose and GlcNAc (65). Later on, a more detailed biochemical analysis by
the same group has demonstrated that PSL released from the cell is a polysaccharide
with a pentasaccharide as the repeating unit, which contains D-mannose, D-glucose
and L-rhamnose. Size-exclusion gel filtration of the isolated sample identified three
fractions with different molecular weight, representing different degrees of
polymerization (14). More studies are ongoing to uncover the detailed structures and
8

functional roles of biofilm matrix exopolysaccharides.
Virulence mechanisms associated with chronic and acute P. aeruginosa infections
are reciprocally regulated
In early colonized CF lungs, P. aeruginosa is fully motile and features
predominant expression of the TTSS for toxin injection into human cells and
repression of the innate immune response. The gene expression of TTSS thusly plays
a crucial role in early colonization, however as the bacterium transitions to a
biofilm-assisted chronic infection, the TTSS is shut down, while exopolysaccharide
production is greatly up-regulated (104). Initially the inactivity of the TTSS in P.
aeruginosa biofilms was thought to be the result of mutations in key genes TTSS
genes. However, recent studies have uncovered regulatory mechanisms that actively
facilitate the transitions between planktonic and biofilm lifestyles.
Before translocating the four effector toxins from P. aeruginosa into host cells,
the TTSS apparatus has to be structured and maintained for functional purpose.
However, since assembling and maintenance of this needle-like machinery is very
energy consuming, the bacteria tightly regulate the biosynthesis of the TTSS (105). In
P. aeruginosa, the expression of all TTSS genes is perhaps most prominently
regulated by ExsA, an AraC/XylS-type transcriptional activator. ExsA controls 10
promoters responsible for expression of toxin effectors and chaperones, secretion and
translocation apparatus and TTSS gene expression regulators, including itself.
Deletion of the exsA gene causes the loss of TTSS function and inability to cause
acute infection. Three additional proteins ExsD, ExsC and ExsE form a signaling
cascade that ties up-regulation of TTSS gene expression to host cell contact (55).
However, whether or not the ExsACDE cascade also plays a role in the transition
between acute and chronic infection modes is not clear.
Of the many other mechanisms that either directly or indirectly affect TTSS the
signaling kinase RetS appears to play a key role in facilitating this transition.
9
The role of TCS in gene regulation in P. aeruginosa
In P. aeruginosa, at least 64 TCSs, representing 8% of transcriptional regulators,
are utilized for the gene expression regulation in order to meet the needs of adaptation
to the environment. This is the largest TCS population that has ever been found in a
sequenced microbe (30, 85). One of the most studied TCSs in P. aeruginosa, for
example, is the PilS/PilR system. This system is responsible for controlling the
production of Type IV pili and biofilm formation (49, 77). In contrast, GacS/GacA
TCS negatively regulates ptrA gene that positively regulates biofilm formation. These
two systems represent good examples for regulatory networks that simultaneously
control target gene expression for biofilm formation versus TTSS, in an antagonistic
manner. This important concept has inspired more and more studies on the gene
expression switch between TTSS-assisted acute infection and exopolysaccharide
related biofilm formation to assist chronic infection. In this review I will emphasize
the RetS/LadS/GacS(A)/RsmZ/RsmA system, which is the best characterized signal
transduction pathway that reciprocally regulates TTSS and biofilm formation in P.
aeruginosa.
RsmZ/RsmA regulatory system
The GacA/RsmZ/RsmA pathway is a conserved signal transduction system
controlling a variety of functions in P. aeruginosa (51). RsmA (repressor of
secondary metabolites), the homologue of which is called CsrA in E. coli, is a
posttranscriptional regulatory protein, which belongs to CsrA/RsmA protein family
found in many bacterial organisms (6, 86). This small protein (7kD) regulates gene
expression by binding target mRNA to modulate mRNA stability. It recognizes an
exposed stem-loop structure which contains a conserved GGA tri-nucleotide motif in
the 5’ side of target mRNA leader sequences. This protein-RNA interaction prevents
ribosome binding and gene translation and promotes mRNA degradation, because the
GGA motif always overlaps the ribosome binding site (11). But it has to be mentioned
10
that positive posttranscriptional regulation by CsrA has also been found in E. coli
(86).
In 2006, Mulcahy and O’Gara demonstrated that RsmA plays a crucial role in the
interaction between P. aeruginosa and human airway epithelial cells by positively
regulating the TTSS. Loss of rsmA causes a severe defect in production of proteins
required for TTSS machinery assembly and key toxin effectors to be injected into host
cells and reduces the expression of positive regulators of TTSS genes (72). Through
microarray analysis, Burrows and O’Gara were able to identify additional target genes
that are controlled by RsmA in P. aeruginosa. Of 5570 screened genes, the expression
of 9% was altered by the rsmA mutation in a PAO1 strain. This result indicates RsmA
is a global regulatory protein, at least in P. aeruginosa (13). In 2008, a further detailed
study by the same group demonstrated that mutation of rsmA in P. aeruginosa causes
a significant defect in initial colonization of a mouse model of acute pneumonia and
reduces the mortality in mice with chronic infection with P. aeruginosa. On the other
hand, the PAO1 rsmA mutant displays increased adhesion to plastics and glass and
increased air-liquid interface biofilm formation in vitro (72). Furthermore, higher
persistence of rsmA mutants compared to the wild type PAO1 strain in lungs of
chronically infected mice indicated that loss of RsmA promotes the development of
chronic infection (73). In 2010, the Parsek group took a further step toward
understanding the role of RsmA in biofilm-related gene expression regulation in P.
aeruginosa. Using psl mRNA, they identified a large untranslated sequence which
binds to RsmA. They also demonstrated that RsmA is a translational repressor of psl
because psl translation, but not transcription, is increased in an rsmA deletion mutant
of P. aeruginosa (45).
The activity of CsrA/RsmA proteins is regulated by noncoding small regulatory
RNAs, which represent the other component of the Rsm/Csr system. In bacteria, these
noncoding regulatory RNA molecules, also known as small RNAs (sRNAs), are a key
11
component in regulatory networks for gene expression regulation (6, 86). Even
though most sRNAs in microorganisms function by base-pairing with mRNAs of
target genes, several studies have been targeting their function of antagonizing
CsrA/RsmA proteins (13, 63, 72). This important participation of sRNAs in the
regulatory network was initially discovered from RNA-CsrA complexes that were
isolated during CsrA protein purification (63). All known cognate sRNAs contain
multiple repeated CsrA/RsmA binding sites and are capable of sequestering
CsrA/RsmA proteins (11). Thus, the RsmA and the small RNA RsmZ which binds to
RsmA, in most cases, have opposite effects on the expression of RsmA target genes.
GacS/GacA two-component system
Another common feature of sRNAs is that their transcription is activated by a
TCS signal transduction system upon sensing of an environmental signal. In P.
aeruginosa, the transcription of two small noncoding RNAs, RsmY and RsmZ, which
are antagonists of the RsmA protein, is regulated by the well-defined GacS/GacA
system (12).
The sensor kinase GacS was first characterized in Pseudomonas syringae strain
B728A and initially called LemA, an essential factor for lesion manifestation (41, 57).
The response regulator GacA was first defined as a global activator of antibiotic and
cyanide production in Pseudomonas fluorescens strain CHAO (62). They were
proposed as a putative pair of cognate sensor kinase and response regulator based on
the first genetic study in Pseudomonas syringae and supported by later studies for
many other organisms (36. 84). The interaction between GacS and GacA was
eventually confirmed by experimentally demonstrating the phosphotransfer between
GacS homologue BarA and GacA homologue UvrY in E. coli strain K-12 (80). The
domain architecture of the GacS is highly conserved in many microorganisms. Its
N-terminus has two transmembrance segments that are separated by a variable
periplasmic loop region. The poor sequence conservation of this loop might explain
12
why the identification of the GacS signal has been unsuccessful (36). Following the
N-terminus, the cytoplasmic part of GacS possesses a HAMP (present in histidine
kinases, adenylate cyclases, methyl accepting proteins and phosphatases) domain,
which serves as an amphipathic linker for signal transmission. The HAMP domain is
followed by histidine kinase core containing a HisKA domain and an ATPase domain.
The homodimerization of this kinase domain is a common and required feature for
environmental signal triggered autophosphorylation in most histidine kinases (28).
The phosphorylated HisKA domain is responsible for transferring the phosphoryl
group to the following response regulator (receiver) domain and subsequently to a
conserved aspartate residue in C-terminal Hpt domain (figure 1.2a) (28, 36, 97). The
response regulator GacA is the last phosphoryl receiver at the end point of this
phosphorelay. With a typical helix-turn-helix motif in the effecter domain,
phosphorylated GacA binds to DNA and in turn controls target gene transcription (32,
36, 110).
Since its identification, the GacS/GacA family has been one of the best studied
regulatory systems in many organisms, such as VarS/VarA in Vibro cholerae,
BarA/UvrY in E. coli and LetS/LetA in Legionella. These global regulatory systems
regulate the expression of a broad range of genes including those for various
metabolic functions, secreted toxins, motility and quorum sensing (12). Moreover,
GacS and GacA were also shown to be involved in the activation of multiple
virulence genes including those related to biofilm formation (30). Consistent with this
finding, GacA was shown to contribute to chronic P. aeruginosa infection in a murine
CF model (30). A GacS mutant of P. aeruginosa also has a defect in swarming
motility (30).
In many organisms the loss of the GacS/GacA system produces very similar
phenotypes as sRNAs mutants. The reported cases include: gacA and rsmY/rsmZ
mutants in P. aeruginosa, uvrY and csrB/C in E. coli, gacA and rsmX/rsmY/rsmZ in
13
Pseudomonas fluorescens (52, 53, 107). These cases provided an indication that
GacS/GacA and RsmZ (or homologues) are concordant partners in signal transduction
pathways. Even though it is possible that the GacS/GacA system directly controls
other types of genes, there is enough evidence to suggest that GacS/GacA mainly
regulates target gene expression through the regulation of Rsm systems. This
hypothesis is also supported by Brencic’s mutational analysis in P. aeruginosa, where
a gacA mutant and an rsmYZ double mutant have almost indistinguishable gene
expression patterns and reduced biofilm phenotypes. Furthermore, only two DNA
fragments, which are located in the rsmY and rsmZ loci, were able to bind GacA
protein in their genome-wide ChIP-on-chip analysis (12). In addition, at the upstream
region of rsmY and rsmZ promoters there is a conserved sequence, which is highly
conserved in many microorganisms. Deleting this sequence decreased transcription of
both rsmZ and rsmY, similar to that of a gacA mutant in P. aeruginosa (12, 36, 53).
Overall, these results demonstrate that this conserved DNA sequence upstream of
rsmY/rsmZ is recognized by phosphorylated GacA and required for GacS-GacA
dependent RsmY/RsmZ expression. In summary, all the previous analyses confirmed
that the GacS/GacA TCS controls gene expression in P. aeruginosa primarily through
modulating the expression levels of these two small RNAs, which in turn favor the
Rsm-dependent gene expression for biofilm formation and control the TTSS in the
opposite direction by sequestering RsmA (12).
The signaling kinase LadS enhances biofilm formation
Through microarray analysis of a transposon insertion library of the P.
aeruginosa strain PAK, Ventre and Filloux identified another TCS gene that is
associated with biofilm formation. Three transposon insertions that caused failure of
biofilm formation were in the same gene, ORF PA3974 in the P. aeruginosa PAO1
genome. Amino acid sequence analysis suggested that this ORF codes for a putative
two-component sensor kinase, which was designated as “ladS” (lost adhesion sensor)
14
because its deletion resulted in a defect of biofilm formation and expression of LadS
in a PAK ladS mutant restored the wild-type biofilm phenotype (104). The predicted
LadS domain architecture shows that it contains a putative periplasmic N-terminal
7TMR-DISMED2 (7-transmembrane-receptor with diverse intracellular signaling
modules extracellular domain 2) followed by a 7TMR-DISM_7TM domain (7
transmembrane segments found adjacent to 7TMR-DISM domains). In the
cytoplasmic portion, the 7TMR-DISM_7TM domain is followed by a histidine kinase
domain and a response regulator domain, which makes LadS a hybrid sensor kinase
(figure 1.2b) (3, 37, 104).
The identification of LadS was later applied to explain the deficiency of biofilm
formation and enhanced cytotoxicity of the PA14 strain, which contains an
out-of-frame mutation in the ladS gene (37). These phenotypes in PA14 are consistent
with Ventre and Filloux’s transcriptome analysis wherein a PAK ladS mutant
displayed repression of the biofilm associated pel (pellicle locus) genes but activation
of TTSS genes. Ventre and Filloux further found that overexpression of LadS could
not restore the pellicle formation of a pelF deletion mutant of PAK, indicating that
LadS activates pellicle formation in a pel-dependent manner, and in turn induces
biofilm formation (104). On the other hand, deletion of the ladS gene dramatically
increased the ExoS expression and secretion, which are strong indicators of TTSS
activation in P. aeruginosa. LadS has also been connected to the Gac/Rsm system.
The effects of the ladS gene on pel expression and TTSS activation are likely the
result of the negative impact this protein has on in a RsmZ expression (35, 104). But
exactly how LadS interacts with this system remains unknown.
The non-canonical sensor kinase RetS inhibits GacS/GacA signaling
Another essential TCS protein that critically controls virulence factor expression
in P. aeruginosa and attracts intense interest among the medical community is RetS.
RetS was initially named RtsM by Laskowski in 2004 because it was found to be a
15

crucial Regulator of Type three secretion System (59). Using a PA103 transposon
insertion library for mutational analysis Laskowski found that deletion of this gene,
located at locus PA4856 in the PAO1 genome, resulted in remarkably reduced P.
aeruginosa cytotoxicity. They further demonstrated that this altered phenotype is due
to the loss of TTSS activity. First of all, RetS is required for the production and
secretion of toxin effectors that are translocated into host cells by a functional TTSS;
secondly, RetS is required for transcription of the TTSS machinery (31, 105); finally,
RetS controls the transcription of exsA and exsD, which encode the transcriptional
activator and anti-activator of TTSS respectively (55). In addition, the restoration of
TTSS effector production and secretion in the rtsM mutant by overexpression of ExsA
also suggests that RtsM controls TTSS in an ExsA-dependent manner (9, 55). Shortly
after its identification, this putative TCS sensor was shown to be a global
pathogenesis regulator. From a 39-mutant library in the strain PAK, Andrew
Goodman found that single mutation in rtsM (PA4856) could dramatically raise
biofilm formation and activate a number of biofilm related genes including the psl and
pel operons which encode biofilm matrix-required exopolysaccharides (112). He also
found that, consistent with Laskowski’s results, deletion of PA4856 causes the loss of
cytotoxicity due to the defect of the TTSS gene expression, which in turn abates the
virulence of P. aeruginosa in a murine acute pneumonia model. Goodman, therefore
designated RtsM (PA4856) as RetS (Regulator of Exopolysaccharide and Type III
secretion), which became the commonly used name from then on (31, 59).
Sequence analysis shows that RetS is a putative hybrid TCS kinase (31, 59, 116).
Resembling LadS, RetS also contains a 7-segment transmembrane domain that
belongs to the 7TM-DISM family (3). The integration of these 7 helices into the inner
membrane is presumbly assisted by the Sec translocation system because a
Sec-dependent leader sequence is located at the amino-terminal end of RetS (amino
acids 1-27), which will be removed during or after protein translocation (15). In the
16
periplasm between the leader sequence and the transmembrane segments, there is a
putative signal sensing domain which makes RetS a “sensor” kinase and sequence
conservation places it in the 7TMR-DISMED2 family (3). Interestingly, the sensory
domains of RetS and LadS share a 35% sequence identity, suggesting they receive
similar but nonidentical environmental signals (31, 37, 59, 104). We were the first
group that solved the crystal structure of the sensory domain of RetS (RetSperi), which
is the first determined structure in 7TMR-DISMED2 family. Consistent with the
prediction for this family, we have demonstrated that it is indeed a carbohydrate
binding domain (50). In the cytoplasm, following the transmembrane segments, RetS
possesses a conventional histidine kinase domain and two response regulator domains
in tandem. This is an unusual feature compared to other identified hybrid sensor
kinases which only have one response regulator domain, suggesting a complex
cellular communication network or multiple functional roles for RetS. The importance
of RetS was demonstrated by a transcriptome analysis, which showed that RetS
controls at least 400 genes in P. aeruginosa (28, 31, 97). Deletion of the retS gene
causes downregulation of several essential genes for a functional type II secretion
system (31). A retS mutant also exhibits the repressed expression of type IV pili
which are required for acute infection with P. aeruginosa in several animal models
(116). RetS is also connected to signaling of c-di-GMP which is utilized as a
secondary messenger for the transition between the planktonic and sessile lifestyles of
P. aeruginosa (70). In addition, the RetS orthologue in Pseudomonas syringae has
been shown to regulate genes for EPS production and represses type VI secretion
system and controls several virulence-associated activities (83).
The most notable functional role of RetS is its participation in the Gac/Rsm
regulatory pathway, which was proposed based on the repressed TTSS and
hyperbiofilm phenotypes of a retS mutant of P. aeruginosa (31, 59). After identifying
and changing the nomenclature of RetS, Goodman applied a transposon insertion
17
derived mutagenesis experiment to identify additional genes that are connected to
RetS signaling transduction. Targeting the transposon insertion mutants that failed to
show a hyperbiofilm phenotype and repressed TTSS activity, they identified genes in
the Gac/Rsm pathway such as gacS, gacA and rsmZ (31). This discovery implied that
RetS controls the GacS/GacA/RsmZ regulatory system. In addition, deletion of ladS,
which is the gene favoring biofilm formation, also exhibits high rsmZ expression level
in the retS mutant background (104). This finding indicates that RetS and LadS
signaling are antagonistic and RetS is downstream of LadS, even though the signaling
mechanism between these two sensor kinases is still unknown. As a result, a model
for reciprocal regulation of genes required for chronic and acute infections by RetS
and LadS sensors converging on sRNA regulation has been proposed: LadS and
GacS/GacA favor biofilm gene expression and repress the TTSS through activation of
the rsmZ gene; on the other hand, RetS stimulates the TTSS and suppresses biofilm
formation by blocking the Gac/Rsm system. Due to its central role in regulating
virulence gene expression in P. aeruginosa this signal transduction pathway has been
the focus of subsequent studies aimed at revealing the molecular basis for the choice
between TTSS expression and biofilm formation (7, 31, 104).
Even though it possesses conserved histidine and aspartate residues in the kinase
and response regulator domains respectively, RetS does not have detectable kinase
activity (32, 42). This unexpected characteristic of RetS aroused the interest in its
exact signaling task in signal transduction pathways. Laskowski and Kazmierczak
took the first step toward uncovering the functional role of each putative signaling
domain in RetS. They found that deletion of the putative periplasmic sensory domain
did not cause a defect in TTSS activity and acute infection in the mouse model,
indicating the sensory domain is not required for TTSS-inducing function of RetS in
PA103 strain, which is a biofilm-deficient strain. By mutational analysis targeting the
conserved phosphorylation residues in kinase domain (HK) and two response
18
regulator domains (RR1 and RR2), they further showed that single mutations in the
HK and RR2 domains, but not the RR1 domain, cause a significant decrease in TTSS
activity. The slightly greater TTSS activity of the HK/RR1 double mutant compared
to that of the HK single mutant also suggests that RR1 might inhibit RetS function.
Interestingly, only the RR2 domain is required for RetS activity in vivo (60).
Although the strain (PA103) used in that study is naturally deficient in biofilm
formation, the presence of a conserved RetS/Gac/Rsm pathway suggests that the
mutations described above should have the opposite effect on biofilm genes (60, 104).
Surprisingly, this expected gene expression pattern was not observed by Goodman
who showed that mutations on neither HK domain nor RR1/RR2 domains impacted
RsmZ expression level in PAK strain (32). Therefore, whether RetS functions as a
typical bacterial sensor kinase is still controversial.
Lacking a Hpt domain, RetS requires an Hpt protein to execute its cellular
phosphorelay activity (28, 97). There are three Hpt proteins identified in P.
aeruginosa by Hsu and colleagues in 2008, annotated as HptA, HptB and HptC. They
demonstrated that only HptB can interact with RetS by both in vitro phosphorelay
assay and in vivo bacterial two-hybrid assay (42). Bordi, Filloux and colleagues have
subsequently shown that an hptB mutant has a pel-dependent hyperbiofilm phenotype,
similar to that of a retS mutant. Furthermore, similar to RetS, HptB favors TTSS
expression and represses biofilm formation through GacS/GacA/RsmZ regulatory
system. However, although the HptB regulon is entirely included in the RetS regulon,
RetS regulates many other genes that are not controlled by HptB (10). Finally, the
reversible phosphorylation between RetS and HptB suggests these two TCS proteins
could participate in other unknown signaling pathways (10, 42).
RetS-GacS Signaling mechanism
The demonstration that a retS and gacS/gacA double mutant has the same
biofilm-deficient phenotype as that of a gacS or gacA single mutant implies that RetS
19
represses biofilm formation by inhibiting the GacS/GacA system (10, 12). This
inhibition mechanism remained a mystery until a novel model was proposed by
Goodman and Lory (32). After excluding the possibility that RetS controls the
transcription or translation of GacS or GacA, they demonstrated that RetS and GacS
are able to interact physically. This interaction can be observed in vitro or in vivo by
co-purification from P. aeruginosa and by a two-hybrid experiment. They also found
that the kinase domains of RetS and GacS are sufficient for this interaction.
Furthermore, they have shown that RetS, despite lacking detectable kinase activity,
can inhibit GacS phosphorylation with its kinase domain. This discovery, along with
the fact that most histidine kinases require homo-dimerization for
autophosphorylation, allowed Goodman and Lory to hypothesize a model for
RetS-GacS signaling wherein the competitive binding of RetS with GacS disrupts the
GacS homo-dimer thus blocking the GacS trans-autophosphorylation needed to
induce the GacS/GacA system (28, 32, 97).
Hypothesis and objectives of the study
Possessing a periplasmic sensory domain (RetSperi), RetS is believed to represent
one of the sensors responsible for sensing an extracellular signal that allows P.
aeruginosa to adapt to environmental change (28, 31, 97). Uncovering the specific
functional role of RetSperi can provide invaluable information to gain a full
understanding of the RetS signaling mechanism for biofilm formation regulation.
Considering the absence of TCS in mammalian cells and crucial participation of RetS
in pathogenesis regulation, RetSperi is an appealing drug target to assist clinical
therapy for patients infected by P. aeruginosa (28).
The objective of this study is to uncover the specific functional role of RetSperi in
biofilm formation. Based on the current published RetS-GacS signaling model and the
role of RetS in repressing biofilm formation, we proposed an alternative hypothesis
which is described in chapter two: signal sensing by RetSperi disrupts dimerization in
20
the periplasmic domain and in turn causes disruption of a RetS homo-dimer to permit
binding of GacS and blocking of GacS trans-autophosphorylation. Another aim of this
chapter is to provide initial characterization of RetSperi ligand binding and
homo-dimerization activities. The analyses and discoveries were used for subsequent
studies with the aim to reveal the exact functional roles of ligand binding and
dimerization of RetSperi, which are described in chapter three. To test the current
RetS-GacS model and our hypothesis and uncover the molecular basis of the
RetS-GacS interaction and signaling mechanism, chapter four describes a mutational
analysis targeting conserved cytoplasmic phosphorylation residues on RetS. Overall,
this chapter aims to resolve the ambiguity in the current literature regarding the
question whether RetS phosphorylation activity is required for RetS-GacS signaling
and biofilm regulation. Moreover, the interaction pattern and the signaling
mechanism for RetS-GacS complex are discussed.
Part II of this dissertation focuses on the structural studies aimed at
understanding substrate recognition and ligand binding in another carbohydrate
binding protein, the germination specific lytic peptidoglycan hydrolysis enzyme
called SleB from Bacillus anthracis.
21
Reference 1. Alex LA, Simon MI. Protein histidine kinases and signal transduction in
prokaryotes and eukaryotes. 1994. Trends Genet.10:133–38. 2. Alves R, Savageau MA. 2003. Comparative analysis of prototype
two-component systems with either bifunctional or monofunctional sensors: differences in molecular structure and physiological function. Mol. Microbiol. 48:25–51.
3. Anantharaman V, Aravind L. 2003. Application of comparative genomics in the identification and analysis of novel families of membrane-associated receptors in bacteria. BMC Genomics. 4: 34.
4. Anzai; Kim, H; Park, JY; Wakabayashi, H; Oyaizu, H. 2000. Phylogenetic affiliation of the pseudomonads based on 16S rRNA sequence. Int J Syst Evol Microbiol. 50: 1563–89.
5. Aravind L, Galperin MY, Koonin EV. 1998. The catalytic domain of the P-type ATPase has the haloacid dehalogenase fold. Trends Biochem Sci. 23:127–29.
6. Paul Babitzke, Tony Romeo. 2007. CsrB sRNA family: sequestration of RNA-binding regulatory proteins. Current Opinion in Microbiology. 10: 156-163
7. Balasubramanian D, Schneper L, Kumari H, Mathee K. 2013. A dynamic and intricate regulatory network determines Pseudomonas aeruginosa virulence. Nucleic Acids Res. 41:1-20.
8. Bayram Y, Parlak M, Aypak C, Bayram I. 2012. Three-year review of bacteriological profile and antibiogram of burn wound isolates in Van, Turkey. Int J Med Sci. 10:19-23.
9. Bernhards RC, Jing X, Vogelaar NJ, Robinson H, Schubot FD. 2009. Structural evidence suggests that antiactivator ExsD from Pseudomonas aeruginosa is a DNA binding protein. Protein Sci. 18:503-13.
10. Bordi C, Lamy MC, Ventre I, Termine E, Hachani A, Fillet S, Roche B, Bleves S, Méjean V, Lazdunski A, Filloux A. 2010. Regulatory RNAs and the HptB/RetS signalling pathways fine-tune Pseudomonas aeruginosa pathogenesis. Mol Microbiol. 76:1427-43.
11. Brencic A, Lory S. 2009. Determination of the regulon and identification of novel mRNA targets of Pseudomonas aeruginosa RsmA. Molecular Microbiol. 72:612-32.
12. Brencic A, McFarland KA, McManus HR, Castang S, Mogno I, Dove SL, Lory S. 2009. The GacS/GacA signal transduction system of Pseudomonas aeruginosa acts exclusively through its control over the transcription of the RsmY and RsmZ regulatory small RNAs. Mol Microbiol. 73:434-45.
13. Burrowes E, Baysse C, Adams C, O'Gara F. 2006. Influence of the regulatory protein RsmA on cellular functions in Pseudomonas aeruginosa PAO1, as revealed by transcriptome analysis. Microbiology. 152:405-18.
14. Byrd MS, Sadovskaya I, Vinogradov E, Lu H, Sprinkle AB, Richardson SH, Ma L, Ralston B, Parsek MR, Anderson EM, Lam JS, Wozniak DJ. 2009. Genetic
22
and biochemical analyses of the Pseudomonas aeruginosa Psl exopolysaccharide reveal overlapping roles for polysaccharide synthesis enzymes in Psl and LPS production. Mol Microbiol. 73:622-38.
15. Chatzi KE, Sardis MF, Karamanou S, Economou A. 2013. Breaking on through to the other side: protein export through the bacterial Sec system. Biochem J. 449:25-37.
16. Cornelis, G., and Van Gijsegem, F. 2000. Assembly and function of type III secretory systems. Annu Rev Microbiol. 54:735–774.
17. Cornelis P (editor). 2008. Pseudomonas: Genomics and Molecular Biology (1st edition). Caister Academic Press.
18. Dean P. 2011. Functional domains and motifs of bacterial type III effector proteins and their roles in infection. FEMS Microbiol Rev. 3:1100-25.
19. Drenkard E. 2003. Antimicrobial resistance of Pseudomonas aeruginosa biofilms. Microbes Infect. 5:1213-9.
20. M. Dziejman, J.J. Mekalanos. 1995. Two-component signal transduction and its role in the expression of bacterial virulence factors, in: J.A. Hoch, T.J. Sihavy (Eds.), Two-Component Signal Transduction, Vol. ASM Press, Washington, DC.
21. Finn RD, Tate J, Mistry J, Coggill PC, Sammut SJ, et al. 2008. The Pfam protein families database. Nucleic Acids Res. 36:281–88
22. Fletcher, E. L., Weissman, B. A., Efron, N., Fleiszig, S. M., Curcio, A. J. & Brennan, N. A. 1993. The role of pili in the attachment of Pseudomonas aeruginosa to unworn hydrogel contact lenses. Curr. Eye Res. 12:1067–1071.
23. Folkesson A, Jelsbak L, Yang L, Johansen HK, Ciofu O, Hoiby N, Molin S. 2012. Adaptation of Pseudomonas aeruginosa to the cystic fibrosis airway: an evolutionary perspective. Nat Rev Microbiol. 10:841-51.
24. Frank, D.W. 1997. The exoenzyme S regulon of Pseudomonas aeruginosa. Mol Microbiol. 4:621–629.
25. Friedman L, Kolter R. 2004. Genes involved in matrix formation in Pseudomonas aeruginosa PA14 biofilms. Mol Microbiol. 51:675–690.
26. Friedman L, Kolter R. 2004. Two genetic loci produce distinct carbohydrate-rich structural components of the Pseudomonas aerguinosa biofilm matrix. J Bacteriol. 186:4457–4465.
27. Fung C, Naughton S, Turnbull L, Tingpej P, Rose B, Arthur J, Hu H, Harmer C, Harbour C, Hassett DJ, Whitchurch CB, Manos J. 2010. Gene expression of Pseudomonas aeruginosa in a mucin-containing synthetic growth medium mimicking cystic fibrosis lung sputum. J Med Microbiol. 59: 1089-100.
28. Gao R, Stock AM. 2009. Biological insights from structures of two-component proteins. Annu Rev Microbiol. 63:133-54.
29. Garcia-Medina, R., Dunne, W. M., Singh, P. K. & Brody, S. L. 2005. Pseudomonas aeruginosa acquires biofilm-like properties within airway epithelial cells. Infect Immun. 73:8298–8305.
30. Gooderham WJ, Hancock RE. 2009. Regulation of virulence and antibiotic resistance by two-component regulatory systems in Pseudomonas aeruginosa.
23
FEMS Microbiol Rev. 33:279-94. 31. Andrew L. Goodman, Bridget Kulasekara, Arne Rietsch, Dana Boyd, Roger S.
Smith, and Stephen Lory. 2004. A Signaling Network Reciprocally Regulates Genes Associated with Acute Infection and Chronic Persistence in Pseudomonas aeruginosa. Developmental Cell. 7:745–754.
32. Goodman AL, Merighi M, Hyodo M, Ventre I, Filloux A, Lory S. 2009. Direct interaction between sensor kinase proteins mediates acute and chronic disease phenotypes in a bacterial pathogen. Genes Dev. 23:249-59.
33. Govan, J. R. & Deretic, V. 1996. Microbial pathogenesis in cystic fibrosis: mucoid Pseudomonas aeruginosa and Burkholderia cepacia. Microbiol. Rev. 60:539–574.
34. Hassett, D. J., Cuppoletti, J., Trapnell, B., Lymar, S. V., Rowe, J. J., Yoon, S. S., Hilliard, G. M., Parvatiyar, K., Kamani, M. C. & other authors. 2002. Anaerobic metabolism and quorum sensing by Pseudomonas aeruginosa biofilms in chronically infected cystic fibrosis airways: rethinking antibiotic treatment strategies and drug targets. Adv Drug Deliv Rev. 54:1425–1443
35. Heeb S, Blumer C, Haas D. 2002. Regulatory RNA as mediator in GacA/RsmA-dependent global control of exoproduct formation in Pseudomonas fluorescens CHA0. J Bacteriol. 184:1046-56
36. Heeb S, Haas D. 2001. Regulatory Roles of the GacS/GacA Two-Component System in Plant-Associated and Other Gram-Negative Bacteria. Mol Plant Microbe Interact. 14:1351-63.
37. Helga Mikkelsen, Rachel McMullan, Alain Filloux. 2011. The Pseudomonas aeruginosa Reference Strain PA14 Displays Increased Virulence Due to a Mutation in lads. PLoS One. 6:29113.
38. Hoch JA, Silhavy TJ. 1995. Two-Component Signal Transduction.Washington, DC: Am. Soc. Microbiol. Press. 488 pp. eds.
39. Hogardt M, Heesemann J. 2010. Adaptation of Pseudomonas aeruginosa during persistence in the cystic fibrosis lung. Int J Med Microbiol. 300:557-62.
40. Hornef, M.W., Roggenkamp, A., Geiger, A.M., Hogardt, M., Jacobi, C.A., and Heesemann, J. 2000. Triggering the ExoS regulon of Pseudomonas aeruginosa: a GFPreporter analysis of exoenzyme (Exo) S, ExoT and ExoU synthesis. Microb Pathog. 29:329–343.
41. Hrabak, E. M., and Willis, D. K. 1992. The lemA gene required for pathogenicity of Pseudomonas syringae pv. syringae on bean is a member of a family of two-component regulators. J. Bacteriol. 174:3011-3020.
42. Hsu JL, Chen HC, Peng HL, Chang HY. 2008. Characterization of the histidine-containing phosphotransfer protein B-mediated multistep phosphorelay system in Pseudomonas aeruginosa PAO1. J Biol Chem. 283:9933-44.
43. Hunter RC, Beveridge TJ. 2005. High-resolution visualization of Pseudomonas aeruginosa PAO1 biofilms by freeze-substitution transmission electron microscopy. Journal of Bacteriology. 187:7619–7630
44. Iglewski BH. 1996. Pseudomonas. In: Baron's Medical Microbiology (Baron S et al., eds.) (4th ed.). Univ of Texas Medical Branch.
24
45. Irie Y, Starkey M, Edwards AN, Wozniak DJ, Romeo T, Parsek MR. 2010. Pseudomonas aeruginosa biofilm matrix polysaccharide Psl is regulated transcriptionally by RpoS and post-transcriptionally by RsmA. Mol Microbiol. 78:158-72.
46. Jackson KD, Starkey M, Kremer S, Parsek MR, Wozniak DJ. 2004. Identification of psl, a locus encoding a potential exopolysaccharide that is essential for Pseudomonas aeruginosa PAO1 biofilm formation. J Bacteriol. 186:4466–4475.
47. Janiak-Spens F, Sparling JM, Gurfinkel M, West AH. 1999. Differential stabilities of phosphorylated response regulator domains reflect functional roles of the yeast osmoregulatory SLN1 and SSK1 proteins. J. Bacteriol. 181:411–17
48. Jencks WP. 1980. The utilization of binding energy in coupled vectorial processes. Adv. Enzymol. 51: 75–106
49. Jin S, Ishimoto KS, Lory S. 1994. PilR, a transcriptional regulator of piliation in Pseudomonas aeruginosa, binds to a cis-acting sequence upstream of the pilin gene promoter. Mol Microbiol. 14:1049-57.
50. Jing X, Jaw J, Robinson HH, Schubot FD. 2010. Crystal structure and oligomeric state of the RetS signaling kinase sensory domain. Proteins. 78:1631-40.
51. Karin Heurlier, Faye Williams, Stephan Heeb, Corinne Dormond, Gabriella Pessi, Dustin Singer, Miguel Cámara, Paul Williams, Dieter Haas. 2004. Positive control of swarming, rhamnolipid synthesis, and lipase production by the posttranscriptional RsmA/RsmZ system in Pseudomonas aeruginosa PAO1. J Bacteriol. 186:2936–2945.
52. Kay E, Dubuis C, Haas D. 2005. Three small RNAs jointly ensure secondary metabolism and biocontrol in Pseudomonas fluorescens CHA0. Proc Natl Acad Sci U S A. 102:17136-41.
53. Kay E, Humair B, Dénervaud V, Riedel K, Spahr S, Eberl L, Valverde C, Haas D. 2006. Two GacA-dependent small RNAs modulate the quorum-sensing response in Pseudomonas aeruginosa. J Bacteriol. 188:6026-33.
54. Dong-jin Kim and Steven Forst. 2001. Genomic analysis of the histidine kinase family in bacteria and archaea Microbiology. 147:1197–1212
55. King JM, Brutinel ED, Marsden AE, Schubot FD, Yahr TL. 2012. Orientation of Pseudomonas aeruginosa ExsA monomers bound to promoter DNA and base-specific contacts with the P(exoT) promoter. J Bacteriol. 194:2573-85.
56. King EO, Ward MK, Raney DE. 1954. Two simple media for the demonstration of pyocyanin and fluorescein. J Lab Clin Med. 44:301–7
57. Kitten, T., Kinscherf, T. G., McEvoy, J. L., and Willis, D. K. 1998. A newly identified regulator is required for virulence and toxin production in Pseudomonas syringae. Mol. Microbiol. 28:917-929.
58. Klausen, M., Heydorn, A., Ragas, P., Lambertsen, L., Aaes-Jorgensen, A., Molin, S. & Tolker-Nielsen, T. 2003. Biofilm formation by Pseudomonas aeruginosa wild type, flagella and type IV pili mutants. Mol Microbiol. 48:1511–1524.
25
59. Michelle A. Laskowski, Ellice Osborn and Barbara I. Kazmierczak. 2004. A novel sensor kinase–response regulator hybrid regulates type III secretion and is required for virulence in Pseudomonas aeruginosa. Molecular Microbiology. 54:1090–1103.
60. Michelle A. Laskowski and Barbara I. Kazmierczak. 2006. Mutational Analysis of RetS, an Unusual Sensor Kinase-Response Regulator Hybrid Required for Pseudomonas aeruginosa Virulence. Infection and Immunity. 74:4462–4473.
61. Laub MT, Goulian M. 2007. Specificity in two-component signal transduction pathways. Annu. Rev. Genet. 41:121–45
62. Laville, J., Voisard, C., Keel, C., Maurhofer, M., Défago, G., and Haas, D. 1992. Global control in Pseudomonas fluorescens mediating antibiotic synthesis and suppression of black root rot of tobacco. Proc. Natl. Acad. Sci. U.S.A. 89:1562-1566.
63. Liu MY, Gui G, Wei B, Preston JF 3rd, Oakford L, Yüksel U, Giedroc DP, Romeo T. 1997. The RNA molecule CsrB binds to the global regulatory protein CsrA and antagonizes its activity in Escherichia coli. J Biol Chem. 272:17502-10.
64. Lyczak, J. B., C. L. Cannon, and G. B. Pier. 2000. Establishment of Pseudomonas aeruginosa infection: lessons from a versatile opportunist. Microbes Infect. 2:1051–1060.
65. Ma L-Y, Jackson K, Landry RM, Parsek MR, Wozniak DJ. 2006. Analysis of Pseudomonas aeruginosa conditional Psl variants reveals roles for the Psl polysaccharide in adhesion and maintaining biofilm structure postattachment. J Bacteriol. 188:8213–8221.
66. L. Mashburn-Warren, R. J. C. Mclean and M. Whiteley. 2008. Gram-negative outer membrane vesicles: beyond the cell surface. Geobiology. 6:214–219
67. Mathee, K., Narasimhan, G.; Valdes, C., Qiu, X., Matewish, J. M., Koehrsen, M., Rokas, A., Yandava, C. N. et al. 2008. Dynamics of Pseudomonas aeruginosa genome evolution. Proceedings of the National Academy of Sciences. 105: 3100–3105
68. J.J. Mekalanos. 1992. Environmental signals controlling expression of virulence determinants in bacteria. J. Bacteriol. 174:1–7.
69. Mizuno T. 1997. Compilation of all genes encoding two-component phosphotransfer signal transducers in the genome of Escherichia coli. DNA Res. 4:161–68.
70. Moscoso JA, Mikkelsen H, Heeb S, Williams P, Filloux A. 2011. The Pseudomonas aeruginosa sensor RetS switches type III and type VI secretion via c-di-GMP signalling. Environ Microbiol. 13:3128-38.
71. C. A. Mueller, P. Broz and G. R. Cornelis. 2008. The type III secretion system tip complex and ranslocon. Molecular Microbiology. 68:1085–1095
72. Mulcahy H, O'Callaghan J, O'Grady EP, Adams C, O'Gara F. 2006. The posttranscriptional regulator RsmA plays a role in the interaction between Pseudomonas aeruginosa and human airway epithelial cells by positively regulating the type III secretion system. Infect Immun. 74:3012-5.
26
73. Mulcahy H, O'Callaghan J, O'Grady EP, Maciá MD, Borrell N, Gómez C, Casey PG, Hill C, Adams C, Gahan CG, Oliver A, O'Gara F. 2008. Pseudomonas aeruginosa RsmA plays an important role during murine infection by influencing colonization, virulence, persistence, and pulmonary inflammation. Infect Immun. 76:632-8.
74. Nickel, J. C., Downey, J. A. & Costerton, J. W. 1989. Ultrastructural study of microbiologic colonization of urinary catheters. Urology. 34:284–291.
75. Ninfa EG, Atkinson MR, Kamberov ES, Ninfa AJ. 1993. Mechanism of autophosphorylation of Escherichia coli nitrogen regulator II (NRII or NtrB): trans-phosphorylation between subunits. J. Bacteriol. 175:7024–32.
76. O’Toole, G., Kaplan, H. B.and Kolter, R. 2000. Biofilm formation as microbial development. Annu. Rev. Microbiol. 54:49–79.
77. O'Toole GA, Kolter R. 1998. Flagellar and twitching motility are necessary for Pseudomonas aeruginosa biofilm development. Mol Microbiol. 30:295-304.
78. Pan SQ, Charles T, Jin S, Wu Z-L, Nester EW. 1993. Preformed dimeric state of the sensor protein VirA is involved in plant--Agrobacterium signal transduction. Proc. Natl. Acad. Sci. USA. 90:9939–43.
79. Parkinson JS, Kofoid EC. 1992. Communication Modules in Bacterial Signaling Proteins. Annu. Rev. Genet. 26:71–112.
80. Pernestig, A. K., Melefors, O., and Georgellis, D. 2001. Identification of UvrY as the cognate response regulator for the BarA sensor kinase in Escherichia coli. J. Biol. Chem. 276:225-231.
81. Poole, K. 2004. Efflux-mediated multiresistance in Gram-negative bacteria. Clinical Microbiology and Infection. 10:12–26.
82. Rahme LG, Stevens EJ, Wolfort SF, Shao J, Tompkins RG, Ausubel FM. 1995. Common virulence factors for bacterial pathogenicity in plants and animals. Science. 268:1899–1902.
83. Records AR, Gross DC. 2010. Sensor kinases RetS and LadS regulate Pseudomonas syringae type VI secretion and virulence factors. J Bacteriol. 192:3584-96.
84. Rich, J. J., Kinscherf, T. G., Kitten, T., and Willis, D. K. 1994. Genetic evidence that the gacA gene encodes the cognate response regulator for the lemA sensor in Pseudomonas syringae. J. Bacteriol. 176:7468-7475.
85. Rodrigue, A., Quentin, Y., Lazdunski, A., Mejean, V., and Foglino, M. 2000. Two-component systems in Pseudomonas aeruginosa: why so many? Trends Microbiol. 8:498–504.
86. Romeo T. 1998. Global regulation by the small RNA-binding protein CsrA and the non-coding RNA molecule CsrB. Mol Microbiol. 29:1321-30.
87. Ryan KJ, Ray CG (editors). 2004. Sherris Medical Microbiology (4th ed.). McGraw Hill.
88. Ryder C, Byrd M, Wozniak DJ. 2007. Role of polysaccharides in Pseudomonas aeruginosa biofilm development. Curr Opin Microbiol. 10:644-8.
27
89. Sadikot RT, Blackwell TS, Christman JW, Prince AS. 2005. Pathogen-host interactions in Pseudomonas aeruginosa pneumonia. Am J Respir Crit Care Med. 171:1209–1223.
90. Schooling SR, Beveridge TJ. 2006. Membrane vesicles: an overlooked component of the matrices of biofilms. Journal of Bacteriology. 188:5945–5957.
91. Shaulsky G, Escalante R, Loomis WF. 1996. Developmental signal transduction pathways uncovered by genetic suppressors. Proc. Natl. Acad. Sci. USA 93: 15260–65.
92. Shaulsky G, Fuller D, Loomis WF. 1998. A cAMP-phosphodiesterase controls PKA-dependent differentiation. Development. 125:691–99.
93. Shrout, J. D., Chopp, D. L., Just, C. L., Hentzer, M., Givskov, M. & Parsek, M. R. 2006. The impact of quorum sensing and swarming motility on Pseudomonas aeruginosa biofilm formation is nutritionally conditional. Mol Microbiol. 62: 1264–1277.
94. Skerker JM, Prasol MS, Perchuk BS, Biondi EG, Laub MT. 2005. Two-component signal transduction pathways regulating growth and cell cycle progression in a bacterium: a system-level analysis. PLoS Biol. 3:1770–88.
95. Sriramulu, D. D., Lunsdorf, H., Lam, J. S. & Romling, U. 2005. Microcolony formation: a novel biofilm model of Pseudomonas aeruginosa for the cystic fibrosis lung. J Med Microbiol 54:667–676.
96. J B Stock, A J Ninfa and A M Stock. 1989. Protein phosphorylation and regulation of adaptive responses in bacteria. Microbiol Rev. 53:450–490.
97. Stock AM, Robinson VL, Goudreau PN. 2000. Two-component signal transduction. Annu. Rev. Biochem. 69:183–215.
98. Stock JB, Stock AM, Mottonen JM. 1990. Signal transduction in bacteria. Nature. 344:395–400.
99. Surette MG, Levit M, Liu Y, Lukat G, Ninfa EG, et al. 1996. Dimerization is required for the activity of the protein histidine kinase CheA that mediates signal transduction in bacterial chemotaxis. J. Biol. Chem. 271: 939–45.
100. Swanson RV, Bourret RB, Simon MI. 1993. Intermolecular complementation of the kinase activity of CheA. Mol. Microbiol. 8:435–41.
101. Tanford C. 1984. Twenty questions concerning the reaction cycle of the sarcoplasmic reticulum calcium pump. CRC Crit. Rev. Biochem. 17:123–51.
102. Thomason PA, Traynor D, Cavet G, ChangW-T, Harwood AJ, Kay RR. 1998. An intersection of the cAMP/PKA and two-component signal transduction systems in Dictyostelium. EMBO J. 17:2838–45.
103. Vasseur P, Vallet-Gely I, Soscia C, Genin S, Filloux A. 2005. The pel genes of the Pseudomonas aeruginosa PAK strain are involved at early and late stages of biofilm formation. Microbiology. 151:985–997.
104. Ventre I, Goodman AL, Vallet-Gely I, Vasseur P, Soscia C, Molin S, Bleves S, Lazdunski A, Lory S, Filloux A. 2006. Multiple sensors control reciprocal expression of Pseudomonas aeruginosa regulatory RNA and virulence genes. Proc Natl Acad Sci U S A. 103:171-6.
28
105. Vogelaar NJ, Jing X, Robinson HH, Schubot FD. 2010. Analysis of the crystal structure of the ExsC.ExsE complex reveals distinctive binding interactions of the Pseudomonas aeruginosa type III secretion chaperone ExsC with ExsE and ExsD. Biochemistry. 49:5870-9.
106. Walker TS; Bais HP; Déziel E; Schweizer, HP; Rahme, LG; Fall, R; Vivanco, JM. 2004. Pseudomonas aeruginosa-plant root interactions. Pathogenicity, biofilm formation, and root exudation. Plant Physiol. 134:320–331.
107. Weilbacher T, Suzuki K, Dubey AK, Wang X, Gudapaty S, Morozov I, Baker CS, Georgellis D, Babitzke P, Romeo T. 2003. A novel sRNA component of the carbon storage regulatory system of Escherichia coli. Mol Microbiol. 48:657-70.
108. M. D. P. Willcox, et, al. 2008. Role of quorum sensing by Pseudomonas aeruginosa in microbial keratitis and cystic fibrosis. Microbiology. 154:2184–2194.
109. Wolfe AJ, Stewart RC. 1993. The short form of the CheA protein restores kinase activity and chemotactic ability to kinase-deficient mutants. Proc. Natl. Acad. Sci. USA. 90:1518–22.
110. Workentine ML, Chang L, Ceri H, Turner RJ. 2009. The GacS-GacA two-component regulatory system of Pseudomonas fluorescens: a bacterial two-hybrid analysis. FEMS Microbiol Lett. 292:50-6.
111. Worlitzsch, D., Tarran, R., Ulrich, M., Schwab, U., Cekici, A., Meyer, K. C., Birrer, P., Bellon, G., Berger, J. & other authors. 2002. Effects of reduced mucus oxygen concentration in airway Pseudomonas infections of cystic fibrosis patients. J Clin Invest 109:317–325.
112. Wozniak DJ, Wyckoff TJ, Starkey M, Keyser R, Azadi P, O'Toole GA, Parsek MR. 2003. Alginate is not a significant component of the extracellular polysaccharide matrix of PA14 and PAO1 Pseudomonas aeruginosa biofilms. Proc Natl Acad Sci U S A. 100:7907-12.
113. Yahr, T. L., and E. P. Greenberg. 2004. The genetic basis for the commitment to chronic versus acute infection in Pseudomonas aeruginosa. Mol. Cell. 16:497–498.
114. Yang Y, Park H, Inouye M. 1993. J. Mol. Biol. 232:493–98. 115. Zigangirova NA, Nesterenko LN, Tiganova IG, Kost EA. 2012. The role of
the type-three secretion system of the gram-negative bacteria in regulation of chronic infections. Mol Gen Mikrobiol Virusol. 3:3-13.
116. Zolfaghar I, Angus AA, Kang PJ, To A, Evans DJ, Fleiszig SM. 2005. Mutation of retS, encoding a putative hybrid two-component regulatory protein in Pseudomonas aeruginosa, attenuates multiple virulence mechanisms.
Microbes Infect. 7:1305-16.
29
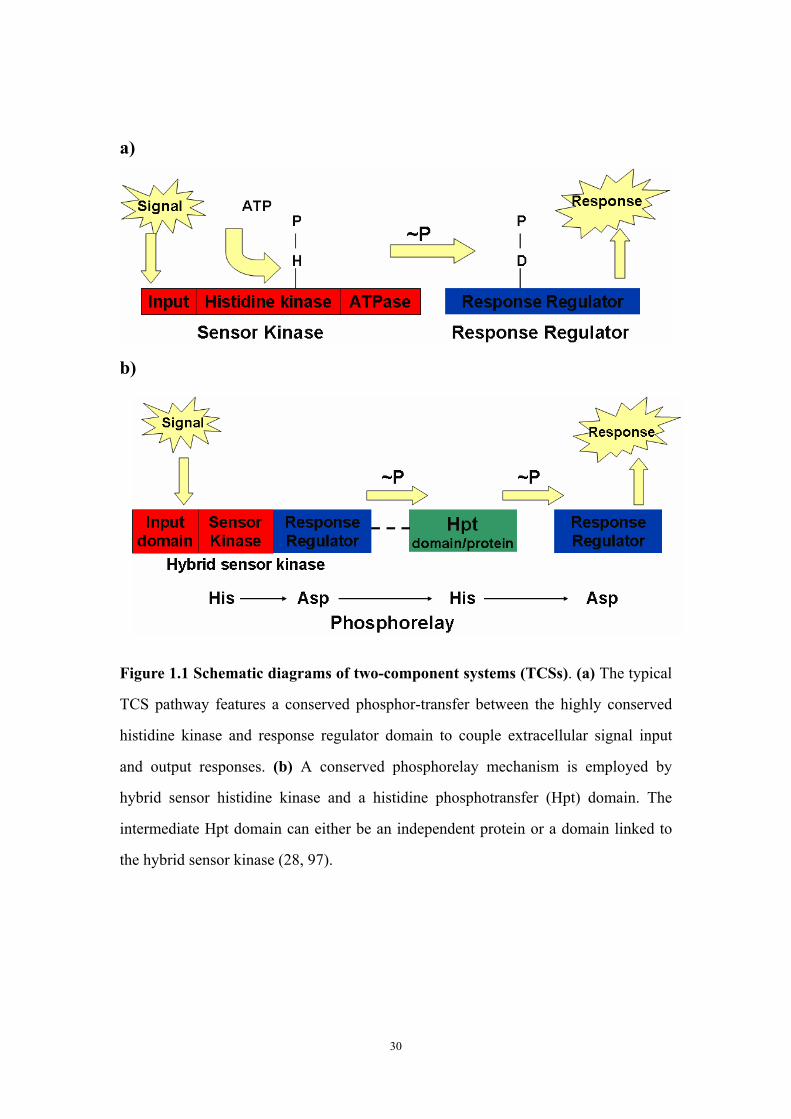
a)
b)
Figure 1.1 Schematic diagrams of two-component systems (TCSs). (a) The typical
TCS pathway features a conserved phosphor-transfer between the highly conserved
histidine kinase and response regulator domain to couple extracellular signal input
and output responses. (b) A conserved phosphorelay mechanism is employed by
hybrid sensor histidine kinase and a histidine phosphotransfer (Hpt) domain. The
intermediate Hpt domain can either be an independent protein or a domain linked to
the hybrid sensor kinase (28, 97).
30
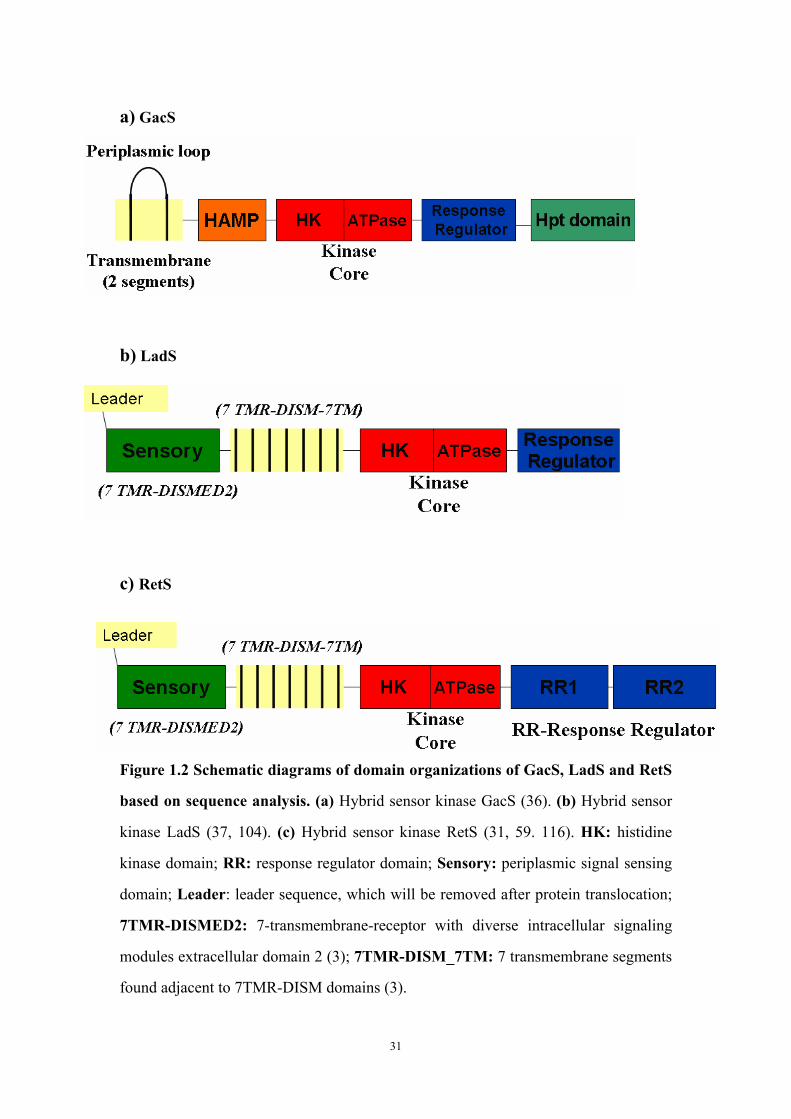
a) GacS
b) LadS
c) RetS
Figure 1.2 Schematic diagrams of domain organizations of GacS, LadS and RetS
based on sequence analysis. (a) Hybrid sensor kinase GacS (36). (b) Hybrid sensor
kinase LadS (37, 104). (c) Hybrid sensor kinase RetS (31, 59. 116). HK: histidine
kinase domain; RR: response regulator domain; Sensory: periplasmic signal sensing
domain; Leader: leader sequence, which will be removed after protein translocation;
7TMR-DISMED2: 7-transmembrane-receptor with diverse intracellular signaling
modules extracellular domain 2 (3); 7TMR-DISM_7TM: 7 transmembrane segments
found adjacent to 7TMR-DISM domains (3).
31
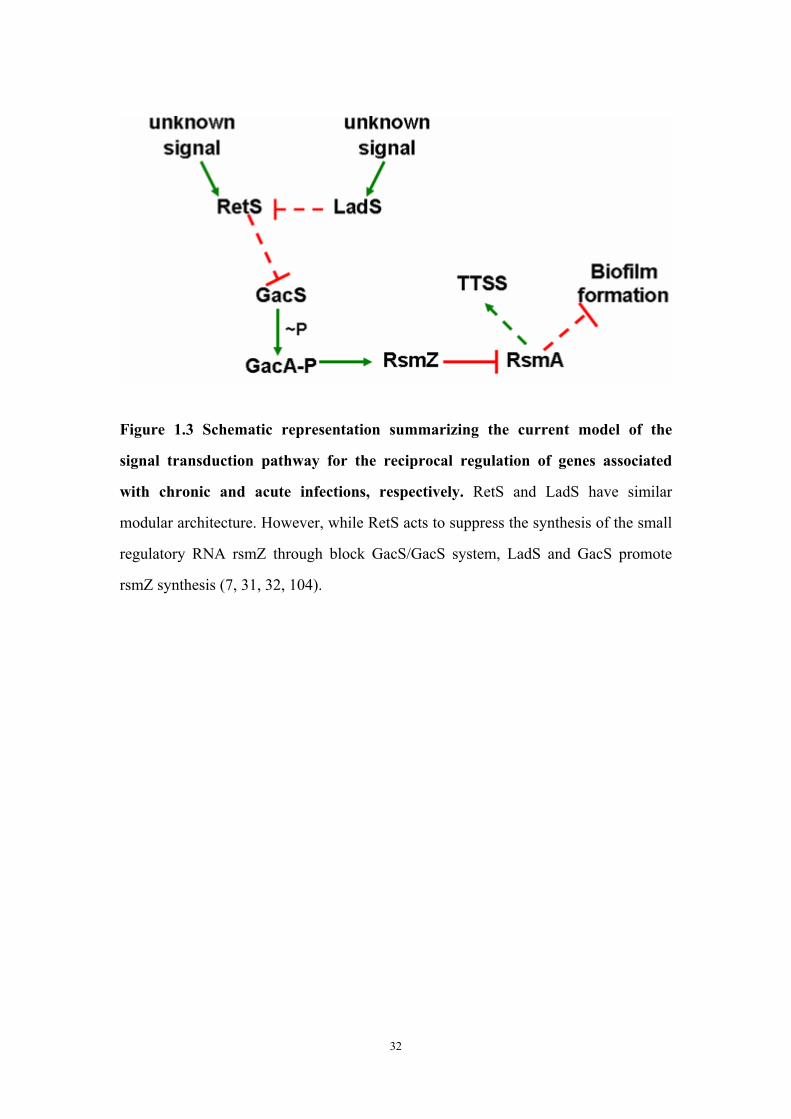
Figure 1.3 Schematic representation summarizing the current model of the
signal transduction pathway for the reciprocal regulation of genes associated
with chronic and acute infections, respectively. RetS and LadS have similar
modular architecture. However, while RetS acts to suppress the synthesis of the small
regulatory RNA rsmZ through block GacS/GacS system, LadS and GacS promote
rsmZ synthesis (7, 31, 32, 104).
32
Chapter Two
Crystal structure and oligomeric state of the
RetS signaling kinase sensory domain
Xing Jing1, Jessica Jaw1, Howard H. Robinson2 and Florian David Schubot1. 2010.
Proteins Journal. (15)78:1631-40 1 Department of Biological Sciences, Life Science I, Virginia Polytechnic Institute and State University, Blacksburg, Virginia 24060 2 Biology Department, Brookhaven National Laboratory, Upton, New York 11973-5000 Keywords: RetS; type III secretion; biofilm formation; sensor kinase; sensory domain; carbohydrate binding; signal transduction; two-component system; periplasmic domain.
33
Abstract
The opportunistic pathogen Pseudomonas aeruginosa may cause both acute and
chronic-persistent infections in predisposed individuals. Acute infections require the
presence of a functional type III secretion system (T3SS), whereas chronic P.
aeruginosa infections are characterized by the formation of drug-resistant biofilms.
The T3SS and biofilm formation are reciprocally regulated by the signaling kinases
LadS, RetS, and GacS. RetS downregulates biofilm formation and upregulates
expression of the T3SS through a unique mechanism. RetS forms a heterodimeric
complex with GacS and thus prevents GacS autophosphorylation and downstream
signaling. The signals that regulate RetS are not known but RetS possesses a
distinctive periplasmic sensor domain that is believed to serve as receptor for the
regulatory ligand. We have determined the crystal structure of the RetS sensory
domain at 2.0 Å resolution. The structure closely resembles those of carbohydrate
binding modules of other proteins, suggesting that the elusive ligands are likely
carbohydrate moieties. In addition to the conserved beta-sandwich structure, the
sensory domain features two alpha helices which create a unique surface topology.
Protein–protein crosslinking and fluorescence energy transfer experiments also
revealed that the sensory domain dimerizes with a dissociation constant of Kd = 580 ±
50 nM, a result with interesting implications for our understanding of the underlying
signaling mechanism.
34
Introduction
The Gram-negative bacterium Pseudomonas aeruginosa poses a major challenge
to the medical community. Antibiotic-resistant strains of this pathogen may cause
chronic-persistent as well as acute infections in transplant patients and other
immunocompromised individuals (6, 12, 7, 22, 31). Most prominently, chronic P.
aeruginosa-associated lung infections are the leading cause of mortality among people
with cystic fibrosis (27).
Beyond its ability to colonize human tissues P. aeruginosa can persist in a
variety of other milieus including plants and soil. This remarkable versatility may be
attributed to a diverse array of virulence mechanisms, which enable the bacterium to
adapt to vastly different environmental challenges. Expression and activation of these
virulence mechanisms are carefully controlled by complex regulatory networks to
ensure an optimal adaptive response. The type III secretion system (T3SS), for
instance, is a hallmark of acute infections but is not active in chronic infections (11,
33), which are instead characterized by the formation of antibiotic-resistant biofilms
(35).
The two-component signaling system (TCS) is the primary means of bacteria to
translate complex environmental cues into adaptive gene expression patterns. A
canonical TCS is composed of a histidine kinase (HK) and a cognate receiver
response regulator (RR). Signaling in response to a stimulus involves HK
autophosphorylation and subsequent transfer of the phosphate group to a cognate RR.
Frequently the receiver proteins are transcription factors where the RR domains are
coupled with DNA binding domains. Phosphorylation and dephosphorylation control
gene expression by modulating the affinity of these transcription factors for their
DNA binding sites.
P. aeruginosa harbors a particularly broad array of over 60 TCSs to modulate its gene
expression (15), including the expression of genes related to the T3SS and biofilm
35
formation. Remarkably, T3SS and biofilm formation are regulated in a coordinated
but reciprocal fashion by the signaling kinases RetS, LadS, and GacS (18, 23, 39).
RetS and LadS are hybrid sensor kinases, combining both HK and RR domains in a
single polypepetide, whereas GacS is a canonical signaling kinase requiring the RR
GacA for downstream signaling. RetS is pivotal for the transcription of genes
associated with cytotoxicity and acute infections, including the T3SS. On the other
hand, a retS mutant displayed a hyperadhesive phenotype and showed elevated levels
of transcription for the psl and pel operons, which are associated with the synthesis of
biofilm oligosaccharides, suggesting that RetS downregulates biofilm formation in the
wild-type strain (15, 39). RetS accomplishes its task by blocking the synthesis of
RsmZ, a small regulatory RNA. RsmZ had previously been shown to bind to and
sequester the translational repressor RsmA. Free RsmA blocks biofilm formation and
favors the expression of the T3SS (3, 25). The kinases LadS and GacS, on the other
hand, directly counteract RetS, as they stimulate the expression of
the psl and pel operons by upregulating the expression of the RsmA-antagonist RsmZ
(21, 39). Underlying this reciprocal regulation of the T3SS and biofilm formation is
an entirely novel regulatory mechanism that was uncovered in a recent study by
Goodman et al. and involves direct contacts between RetS and GacS (16). Signaling
kinases are usually homodimeric and autophosphorylation occurs almost always in
trans. According to the proposed model, an unknown environmental signal causes the
RetS homodimer to dissociate to form a heterodimeric RetS-GacS complex. The
asymmetric geometry of the heterodimer is thought to block RsmZ biosynthesis by
preventing GacS trans-autophosphorylation. Remarkably, neither the kinase activity
nor the RR domains of RetS are required for its unusual interactions with GacS (16).
Although the signal that causes RetS-GacS heterodimer formation is unknown,
the periplasmic RetS sensory domain is believed to serve as the receptor for the
elusive ligand. The sensory domain encompasses about 160 amino acids and belongs
36
to the large but poorly characterized 7TM-DISM2 domain family, which has been
hypothesized to constitute a new class of carbohydrate binding proteins (2). However,
experimental support for this model is lacking. The crystal structure of the RetS
sensory domain reported here not only offers insights into the nature of the molecular
signal but also represents the first reported structure for any member of this domain
family. Dimerization of the sensory domain and the stability of the dimer were also
examined because the currently held model assumes a mechanism where ligand
binding shifts the equilibrium from RetS and GacS homodimers to a RetS-GacS
complex.
37
Materials and Methods
Cloning, expression, and purification of the RetS sensory domain
The boundaries of the RetS sensory domain, containing amino acids 27–185, are
defined by two transmembrane helices. The gene fragment coding for the entire
periplasmic domain (RetS27–185) was PCR-amplified from P. aeruginosa genomic
DNA (ATCC 17933D). During PCR, a tobacco etch virus (TEV) protease recognition
site and the appropriate recombination sites (attB1 and attB2) were added to
RetS27–185. Subsequently, the amplicon was recombined into pDONR201
(Invitrogen) to produce the plasmid pDONR201-RetS27–185. After verifying the
nucleotide sequence via DNA sequencing, RetS27–185 was recombined into the
destination vector pDEST-HisMBP (28) to create the expression vector
pDEST-HMBP-RetS27–185. This vector is designed to produce RetS27–185 fused to
the carboxy-terminal end of amino-terminally hexahistidine-tagged E. coli maltose
binding protein (MBP).
Vector pDONR201-RetS41–185, containing a shortened segment of the sensory
domain, was generated via PCR with the appropriate primer and using
pDONR201-RetS27–185 as a template. Following sequence verification, RetS41–185
was recombined into pDEST-HisMBP to create the expression vector
pDEST-HMBP-RetS41–185. The RetS41–185–S45C variant used for the
dimerization studies was generated via site-directed mutagenesis with
pDONR201-RetS41–185 serving as template. Subsequent recombination yielded the
pDESTHMBP-RetS41–185–S45C vector.
The protein expression and purification protocols for RetS27–185, RetS41–185
(RetSperi), and RetS41–185–S45C (RetSperi-S45C) were identical. Single colonies of E.
coli BL21(DE3) CodonPlus RIL cells (Stratagene, La Jolla, CA) containing the
expression plasmid were used to inoculate 100 mL of Luria broth supplemented with
glucose at 2 g/L, 100 μg/mL ampicillin, and 30 μg/mL chloramphenicol. The cell
38
culture was grown with shaking (225g) to saturation overnight at 37°C and then
diluted 66-fold into 6 L of fresh medium. When the cell density reached midlog phase
(OD600 = 0.5), the temperature was reduced to 30°C and
isopropyl-β-D-thiogalacto-pyranoside (IPTG) was added to a final concentration of 1
mM. After 4 h, cells were harvested by centrifugation at 5000g for 15 min.
All of the following steps were carried out at 4°C. Cells were resuspended using a
buffer containing 50 mM Tris-HCl, 150 mM NaCl, and 25 mM imidazole, pH 7.4
(buffer A) and 5 μL EDTA-free protease inhibitor cocktail (Sigma P8849) per
milliliter of buffer (10 mL of buffer per gram of cell mass). Cells were lyzed through
sonication and insoluble debris removed by centrifuging the cell extract at 40,000g for
30 min. The supernatant was filtered through a 0.45 μm polyethersulfone membrane
and loaded onto to a 30 mL Ni-NTA chromatography column (Qiagen, Valencia, CA)
pre-equilibrated in buffer A. The column was washed to baseline with buffer A and
eluted with a linear imidazole gradient to 250 mM over 10 column volumes. Peak
elution fractions were combined and His-TEV (S219V)-Arg (1 mg/100 mg of total
protein) was added to effect the cleavage of His-MBP. The TEV protease-digest
reaction mixture was dialyzed overnight against buffer A. After dialysis, the protein
solution was filtered and applied to a 40-mL Ni-NTA Superflow column (Qiagen)
pre-equilibrated with buffer A. Flow-through fractions containing the sensory domain
were pooled and dialyzed overnight into buffer of 50 mM MES, 50 mM NaCl, pH 6.0
(buffer B). The sample was then applied to a 5 mL Heparin column (GE Healthcare,)
pre-equilibrated with buffer B and was eluted with a linear salt gradient to 1M NaCl.
Peak fractions were concentrated and loaded onto a HiPrep 26/60 Sephacryl S-200
HR column (GE Healthcare), pre-equilibrated in a buffer of 25 mM Tris-HCl, 150
mM NaCl, pH 7.4 (buffer C). The protein was judged to be >95% pure by sodium
dodecyl sulfate-polyacrylamide gel electrophoresis (SDS-PAGE).
39
Preparation of selenomethionine- labeled RetSperi
Selenomethionine-substituted RetSperi (SeMet-RetSperi) was produced in the same
nonauxotrophic strain of E. coli as used for routine protein production. The
incorporation of externally added selenomethionine into the recombinant protein was
accomplished by suppressing methionine biosynthesis (9). Initially, a 1 L overnight
culture of the expression strain was grown in LB medium also containing 100 μg/mL
ampicillin and 30 μg/mL chloramphenicol. The cells were washed twice in 100 mL of
M9 selenomethionine growth media (Medicilon, Chicago, IL). The cells were
resuspended in 100 mL of M9 selenomethionine growth media and used to inoculate
four 1 L cultures containing M9 selenomethionine growth media and antibiotics.
These cultures were grown with agitation at 37°C until the OD600nm reading reached
0.2. At this point IPTG was added to a final concentration of 1 mM and the
temperature lowered to 30°C. Cells were harvested the following morning. The
purification of selenomethione-containing protein followed the same protocols as that
for the native protein with the exception that 2 mM DTT was added to all but final
buffer, which contained 1 mM tris (2-carboxyethyl) phosphine (TCEP) instead.
Limited proteolysis of the RetS sensory domain
A 1 mg/mL stock solution of thermolysin (Roche Molecular Biochemicals) in
thermolysin buffer (10 mM Tris-HCl, 0.2M NaCl, and 2 mMCaCl2, pH 8.0) was used
for the limited proteolysis experiments. The RetS27–185 stock solution consisted of
the protein at 1 mg/mL in buffer C. The five individual reactions were composed of
25 μL of RetS27–185 stock solution, 25 μL of 2X thermolysin buffer, and 0.5 μL of
serial 1:4 dilutions of the thermolysin stock solution. The reactions were allowed to
proceed for 1 h at 37°C before the protease was inactivated by the addition of 0.5 μL
of 0.5M EDTA. Reaction products were initially visualized by SDS-PAGE. The
precise molecular weights of select fragments were determined using LC-electrospray
40
ionization mass spectrometry. The peptide fragments that corresponded to the
observed molecular masses were determined using the FindPep program (13).
Crystallization of RetSperi and SeMet-RetSperi
High-throughput crystallization screening was conducted in the sitting-drop
format by combining a solution of 17 mg/mL RetSperi in buffer C with commercially
available crystallization matrices at volume ratios of 3:1, 1:1, and 1:3, where the
protein solution was maintained at a constant volume of 0.3 μL throughout.
Preliminary crystals were obtained from condition D4 of the IndexHT screen
(Hampton Research). Hit optimization was carried out using the hanging drop vapor
diffusion method at 18°C. In the optimized conditions crystals for both the native
protein and SeMet-RetSperi were obtained from drops containing a 1:1 mixture of 17
mg/mL proteins in their respective storage buffers and a crystallization solution
composed of 0.1M citric acid, 22.5% w/v polyethylene glycol 3350 and 10% v/v
glycerol.
Data collection, structure solution, and refinement
Crystals of RetSperi were loop-mounted and flash-frozen in liquid nitrogen. Data
sets were collected at beamline X-29A of the National Synchrotron Light Source
using an ADSC Q315 CCD detector. Data were processed at the beamline using the
HKL2000 program suite (29). Details of data collection and processing are provided
in Table 2.1. The SeMet-RetSperi structure was determined using the
single-wavelength anomalous dispersion (SAD) method. The location of heavy atoms,
initial phase calculations, phase improvement through density modification, initial
maps, and automated model building steps were all completed in the PHENIX
program suite (41). PHENIX built nearly complete models for both molecules in the
asymmetric unit. Iterative cycles of manual model adjustment using COOT2
(10) followed by refinement in PHENIX rapidly converged to produce the final
structures. Model quality was assessed with PROCHECK2 (24) and the atomic
41
coordinates and structure factors have been deposited in the protein data bank (PDB)
(37) with accession code 3JYB.
Protein–protein crosslinking
RetSperi was dialyzed into a buffer of 20 mM NaH2PO4 and 30 mM NaCl, pH 7.4.
A 2 mM stock solution of bis (sulfosuccinimidyl) suberate (BS3) was prepared in
water. The 50 μL reaction mixtures contained 10 μM RetSperi and 500 μM BS3.
Crosslinking reactions were quenched by adding 20 μL of each reaction to 10 μL 150
mM Tris-HCl, pH 7.4. Crosslinking reactions containing MBP instead of RetSperiwere
used as negative controls. Crosslinked samples were analyzed via SDS-PAGE.
Quantitative oligomerization assay
The RetSperi-S45C variant was fluorescently labeled with Alexa Fluor 488 and
Alexa Fluor 555 (Invitrogen) according to the manufacturer's instructions. Following
overnight labeling, the modified proteins were separated from the unincorporated dye
molecules through buffer exchange into a buffer of 20 mM Tris-HCl and 150
mM NaCl, pH 7.4. The degree of labeling of both the AlexaFluor 555-labeled form of
the RetSperi variant (RetSperi-555) and the Alexa Fluor 488-labeled form of the
RetSperi variant (RetSperi-488) were near 100% as assessed by UV-spectroscopy in
conjunction with the estimated molar extinction coefficients of RetSperi and the
respective fluorophores.
The fluorescence resonance energy transfer (FRET) measurements involved
titrating a solution of 3 nM RetSperi-488 with RetSperi-555. Triplicate setups of 80 μL
reactions containing 3 nM RetSperi-488 and 0–100 μM RetSperi-555 were transferred to a
96-well half area black polystyrene assay plate (Corning). Background fluorescence
produced by RetSperi-555 was accounted for by measuring and subtracting the signal of
solutions that did not contain RetSperi-488 but identical concentrations of RetSperi-555.
A TECAN infinite M200 fluorescence intensity scanner (Tecan) was used for the
experiment. The excitation wavelength was set to 430 nm, whereas the emission
42
spectrum was recorded in between in the wavelength range between 510 and 646 nm
using a 4 nm step-size. The integration time was set to 20 μs and all scans were
carried out at a room temperature of 24°C. Dimer formation was monitored by
recording the decrease in the peak fluorescence of RetSperi-488 at λ = 522 nm. Data
were fit to Equation I (figure 2.1a) using Matlab (The MathWorks).
R5T and R4T are the total concentrations of RetSperi-555 and
RetSperi-488, respectively, F is the fluorescence measured at λ = 522 nm,Fmax is the
fluorescence measured at λ = 522 nm in absence of RetSperi-555, Fmin the residual
fluorescence of RetSperi-488 due to incomplete quenching even when all RetSperi-488 is
bound to RetSperi-555, and Kd is the dissociation constant of the RetSperi dimer.
43
Results
The RetS sensory domain assumes a beta-sandwich fold reminiscent of
carbohydrate binding proteins
To ensure that the complete sensory domain was contained in the cloned
construct, the entire periplasmic region of RetS encompassing residues 27–185 was
initially cloned and overexpressed. Subsequently, the domain boundaries were more
precisely mapped through limited proteolysis of RetS27–185 to facilitate
crystallization. Mass spectrometric analysis of the obtained fragments identified a
relatively stable fragment comprising RetS residues 41–185 (RetSperi). RetSperi,
overexpressed from a newly engineered plasmid, readily crystallized.
SeMet-RetSperi crystals, while very small (∼0.05 × 0.02 × 0.01 mm3), produced X-ray
diffraction to a resolution of 2.0 Å.
Forming an asymmetric dimer, there are two independent RetSperi molecules in
asymmetric unit of the crystal. The structural differences between the backbone atoms
of the two molecules are small as reflected in a root-mean-square-deviation (RMSD)
of 0.4 Å. The electron density throughout the structure was excellent. However, the
amino-terminal regions ranging from Ala-41 to Asn-47 are disordered and produced
no discernable electron density in either molecule. All nonglycine residues of the final
model reside either in the most favorable or in the allowed regions of the
Ramachandran plot; and the overall geometry was comparable to other structures
solved at the same resolution.
A cartoon drawing of the final RetSperi structure model is depicted in figure 2.2a,
while the correlation between protein sequence and tertiary structure is visualized in
figure 2.2b. The sensory domain of RetS adopts β-sandwich or jelly-roll fold formed
by two opposing antiparallel β-sheets. The two sheets have a β1-β3-β8-β5-β6 and a
β2-β9-β4-β7 topology, respectively. The β-sandwich structure is augmented by two
alpha-helices, α-1 follows strand β-1 and the short α-2 helix is formed by the
44
carboxy-terminal residues of RetSperi. The observed fold is characteristic of
carbohydrate binding modules (CBMs). Consistent with this notion, a DALI-guided3
(20) search of the PDB identified CBMs and enzymes involved in carbohydrate
degradation as the closest structural homologs of RetSperi. While the structural
conservation extends to both beta sheets, helix α-1 appears to be unique to RetSperi.
The position of this helix directly above the β1-β3-β8-β5-β6 sheet is interesting
because in most of the related CBMs the equivalent β-sheets form the carbohydrate
binding sites. We examined the temperature factors as well as intermolecular and
intramolecular contacts of helix α-1 to evaluate whether or not this helix might be
conformationally flexible and its conspicuous position perhaps the result of packing
contacts. However, we found no intermolecular contacts involving α-1 within a 5 Å
radius. On the other hand, α-1 forms a total of 18 intramolecular contacts with
neighboring residues if a 4 Å distance cutoff is applied, burying a surface area of 525
Å2. Furthermore, the positions of the two α-1 helices are identical for both molecules
in the asymmetric unit and the average temperature factor of ∼20 Å2 for the main
chain atoms also suggest a stable conformation. Therefore, the unique topology of this
region suggests that the 7TM-DISM2 domains constitute a novel class of
carbohydrate binding proteins.
Qualitative and quantitative evidence for RetSperi dimerization
The reversible oligomerization of RetS is believed to play a pivotal role in the
regulation of RetS function. Consequently, we sought to establish whether or not
RetSperi dimerization contributes to the stability of the RetS homodimer. Intuitively,
we would have expected to observe a symmetric dimer in the crystal, but the two
molecules that form the asymmetric unit display no twofold symmetry. While unusual
this asymmetric dimer could nevertheless represent a biologically relevant dimer.
However, when we compared the intermolecular contacts within the asymmetric unit
to packing contacts between symmetry-related asymmetric units in the crystal, we
45
found them to be very similar. These packing arrangements are visualized in
figure 2.2c, where molecules A and B represent the original asymmetric unit and B′ a
molecule from a symmetry-related asymmetric unit. The buried surface area of the
A·B and A·B′ interfaces are very similar at 610 and 629 Å2, respectively. There are 21
interacting residue pairs at A·B interface and 23 such pairs at the A·B′ interface when
a 4 Å distance cutoff is applied (this cutoff was chosen because it represents the
default value in programs such as Ligplot3 (40) that are designed to analyze
intermolecular contacts). Twenty of these interactions are found at both interfaces.
Distances for the four contacts that did not match ranged between 3.7 and 4 Å,
suggesting that they make only small contributions to the stability of the respective
intermolecular interactions. These similarities suggest that the dimer observed in the
asymmetric unit arose due to crystal packing contacts and does not represent the
biological unit of the protein. Otherwise, if the interactions in the asymmetric unit
were indeed representative of the solution state then RetSperi should be forming higher
order oligomers or even polymerize in solution. This was not observed in the
crosslinking experiments described later.
Since the nonphysiological pH of 3.0 of the crystallization conditions could have
caused a biological RetSperi oligomer to dissociate, protein–protein crosslinking using
chemical BS3 was employed to probe for dimer formation at neutral pH.
Monomeric E. coli MBP served as negative control. After crosslinking MBP still
migrated as a monomer on an SDS-polyacrylamide gel, while a substantial portion of
RetSperi had shifted to a higher band corresponding to the molecular weight of a
RetSperi dimer (figure 2.3a). Higher order oligomers were not observed.
Although the crosslinking result demonstrates RetSperi dimerization, a substantial
fraction of RetSperi failed to crosslink even when large excess of crosslinking agent
and extended reaction times were used. This finding is consistent with the presence of
monomer-dimer equilibrium rather than a purely dimeric state. A FRET-based assay
46
was developed to validate this hypothesis and quantify the strength of the
RetSperi-RetSperi interactions. A low concentration of Alexa-Fluor-488-labeled
RetSperi-S45C (RetSperi-488) was titrated with an Alexa-Fluor-555-labeled form of the
same RetSperi variant (RetSperi-555). Dimerization was monitored by observing the
quenching of the Alexa Fluor 488 fluorescence at λ = 522 nm. The concentration of
the RetSperi-488 was maintained more than a 100-fold below the dissociation constant
(Kd) for RetSperi dimer formation because here virtually all of the protein should be
monomeric. This optimal concentration of RetSperi-488 was determined in an iterative
process where titration experiments were carried out at concentrations of 50, 10, and
finally 3 nM of RetSperi-488 and fit to Equation I (figure 2.1a). The two higher
concentrations of the protein resulted in a poor fit and a Kd value that suggested that a
substantial proportion of RetSperi-488 was dimeric at the outset of the experiment. A
second important consideration relates to the fact that, as the concentration of
RetSperi-555 is increased during the titration experiment, a large fraction of this protein
is already dimeric and therefore not available for binding to RetSperi-488. To properly
model RetSperi dimerization, it was therefore necessary to express the concentration of
the RetSperi-555 monomer as a function of the total concentration of RetSperi-555 and
the Kd. Usually, equations for binding isotherms are arranged to express the amount of
complex formed in terms of the variable concentration of one of the binding partners.
However, when this was done for the modified isotherm the resulting cubic equation
was solvable but the obtained solution was awkwardly long (figure 2.1b). Therefore,
the data were fit to the rearranged and thus simpler Equation I (figure 2.1a). This
equation is valid under the assumption that the fluorescent labels do not influence the
monomer-dimer equilibrium, which is based on the observation that the S45C
mutation used to mediate thiol-based labeling is located in a structurally disordered
region that does not appear to constitute a pivotal part of the sensory domain.
Background-corrected example graphs are presented in figure 2.3b. The resulting
47
FRET data are plotted in figure 2.3c; and fitting Equation I to these data yielded a
dissociation constant of Kd = 580 ± 50 nM for RetSperi dimerization. If
RetSperi-555 dimerization is not taken into consideration and the data are simply fit to a
conventional isotherm, the fit is poor and the obtained Kd incorrect (dashed line in
figure 2.3c).
48
Discussion
The putative ligand binding site of RetSperi
The crystal structure suggests that RetS is regulated by a carbohydrate-based
moiety. However, since the natural ligand of RetS is currently not known, the
common strategy for mapping the ligand binding site involving a mutational analysis
coupled with in vitro binding studies could not be employed. Nevertheless, insights
could be obtained by comparing RetSperi to the altogether eight structurally
homologous proteins, where the positions of the ligand binding sites are known.
Protein–carbohydrate complexes have been reported for the related family 4 CBM of
Lam16A from Thermotoga maritima (TmCBM4-2, PDB code 1gui) (4), the family 6
CBM SdAga16B-CBM6-2 of the β-agarase Aga16B from Saccharophagus
degradans (PDB code: 2CDO) (5), and the family 15 CBM of the Cellvibrio
japonicasXylanase 10C, (CjXyn10C-m, PDB code: 1US2) (30). In addition, the
binding sites of the following proteins have also been mapped and were therefore
included in the analysis: the carbohydrate-recognition domain of the human
glycoprotein sorting receptor p58/ERGIC-53 (PDB code: 1R1Z) (38) the
carbohydrate recognition domain of the cargo receptor Emp46p from Saccharomyces
cerevisiae (PDB code: 2A6W) (32), the carbohydrate binding module of xylanase
10A from the thermophilic bacterium Rhodothermus marinus (RmXyn10A-CBM4-2,
PDB code: 1K42) (34), the catalytic domain of the endoglucanase CelB
from Streptomyces lividans, (SlCelB-2, PDB code: 1NLR) (36), and family 32
carbohydrate-binding protein YeCBM32 from Yersinia enterolitica (PDB code: 2JDA)
(1). Although all eight proteins share the same fold, their ligand binding sites cluster
to not one but two regions when superimposed. In YeCBM32
and SdAga16B-CBM6-2, the ligand binding sites are located between the two beta
sheets, involving residues equivalent to the carboxy-terminal end of β-2, the
amino-terminal end of β-9, and residues from the two connected loop regions in
49
RetSperi. This pocket is not present in RetSperi suggesting that its binding cleft is
located elsewhere.
In the other six homologous structures, the critical residues map to structurally
conserved section of the proteins that corresponds to the β1-β3-β8-β5-β6 sheet in
RetSperi. In the TmCBM4-2 and CjXyn10C-m complexes, the entire beta-sheet forms
an extended cleft, where their respective oligosaccharide ligands are bound, while the
ligand binding site in the other four proteins are smaller, covering only part of the
beta-sheet. In RetSperi helix α-1 alters the topology of this the corresponding surface
area. In fact, α-1 effectively occupies the same space as the bound ligands
in TmCBM4-2 and CjXyn10C-m (figure 2.4a). However, together with residues from
the beta sheet and several surrounding loops α-1 does create three large grooves that
appear well-suited for ligand binding. The pocket that most closely coincides with the
prevalent binding pockets observed in the related proteins is formed by the loop
connecting β-1 and α-1, the amino terminal regions of strands β3 and β5, the
carboxy-terminal ends of strands β1, β8, and β6 and the loop regions between β-2 and
β-3 as well as those between β-8 and β-9 (figure 2.4b,c).
The hypothesis that this site indeed constitutes the ligand binding pocket may be
evaluated from two additional angles. The solvent-accessible surface area of
RetSperi was color-coded according to the degree of sequence conservation using the
ConSurf (14). Those regions with the three highest conservation scores were colored
brightly, while the remainder of the surface was kept white (figure 2.4b,c).
Remarkably, 7 of the 10 amino acids that received the highest conservation scores
map to the β1-β3-β8-β5-β6 beta sheet. Four of these seven residues, Trp-90, Tyr-117,
Arg-162, and Ser-164 are part of the pocket that was identified from the structural
comparison with other binding sites. Trp-90 is one of only two amino acids that are
strictly conserved in all 32 of the homologous protein sequences that were used for
this analysis.
50
Finally, the predicted binding site may also be assessed by analyzing the types of
amino acids that form this pocket. Tryptophan, arginine, asparagine, glutamic acid,
tyrosine, and histidine display the highest propensities for participating in
carbohydrate binding (26). The highly conserved Trp-90, Tyr-117, and Arg-162 fall
into this category. Other residues in the binding pocket also feature prominently in
carbohydrate binding sites: Gln-59, Arg-61, Gln-112, Arg-134, and Asn-166, and the
aromatic residues Tyr-113 and His-129. Pro-86 and Thr-164 constitute the only
unusual residues among the amino acids that are form the putative ligand binding site
(Figure 2.4b,c). In summary, three independent indicators—structural conservation,
sequence conservation, and composition of the putative binding pocket—all point
toward the same location of the ligand binding site and suggest that the elusive ligand
is a carbohydrate moiety. Ultimate confirmation of these findings, however, will
require the identification of the natural ligand of RetS.
Implications of RetSperi dimerization for the RetS-GacS signaling mechanism
RetS is an unusual sensor kinase because at least one of its signaling modes does
not require its kinase activity but relies on direct interactions with GacS kinase to
prevent phosphate transfer in the GacS/GacA TCS (16). The kinase domains of both
enzymes appear to be sufficient for this interaction. The model assumes ligand
binding to the periplasmic sensory domain disrupts the RetS dimer, but how is this
signal communicated across the inner cell membrane? The hypothesis that the RetS
sensory domain mediates the upregulation of T3SS-related gene expression also
appears to be at odds with a previous study, where deletion of the sensory domain did
not cause a decrease but a slight increase in virulence associated with the T3SS
(23). Our finding that RetSperi alone is capable of dimer formation offers a possible
explanation for this apparent contradiction as it suggests that the sensory domain is
required for repression as well as activation of the T3SS. Ligand-free RetSperi likely
dimerizes and prevents RetS-GacS interactions by stabilizing the RetS homodimer.
51
The unknown ligand could act by disrupting the interface between the two sensory
domains, and thus favor RetS-GacS heterodimer formation. Consistent with the
previously published results this model would explain why a deletion of the sensory
domain did not result in a repression of the T3SS, since such a deletion, just as ligand
binding, would favor a RetS-GacS complex.
Conclusions
The crystal structure of the RetS sensory domain, the first representative
structure for the 7TM-DISM2 domain family, revealed a fold closely related to
carbohydrate binding modules, suggesting that RetS function is regulated by a
carbohydrate-based ligand. While the crystal structure does not unambiguously reveal
the ligand binding site, structural homology, sequence conservation, and amino acid
composition suggest that the ligand likely binds to a pocket formed by one of the two
beta sheets and helix α-1. RetSperi dimerizes with a submicromolar dissociation
constant, suggesting that dimerization of the RetS sensory domain plays a role in both
stabilizing the RetS homodimer and, on ligand binding, in shifting the equilibrium
toward RetS-GacS heterodimer formation.
Acknowledgements
The authors thank Dr. Keith Ray for his assistance with the mass spectrometry
work.
52
References 1. Abbott DW, Hrynuik S, Boraston AB. 2007. Identification and characterization
of a novel periplasmic polygalacturonic acid binding protein from Yersinia enterolitica. J Mol Biol. 367:1023–1033.
2. Anantharaman V, Aravind L. 2003. Application of comparative genomics in the identification and analysis of novel families of membrane-associated receptors in bacteria. BMC Genomics. 4:34.
3. Ang S, Horng YT, Shu JC, Soo PC, Liu JH, Yi WC, Lai HC, Luh KT, Ho SW, Swift S. 2001. The role of RsmA in the regulation of swarming motility in Serratia marcescens. J Biomed Sci. 8:160–169.
4. Boraston AB, Nurizzo D, Notenboom V, Ducros V, Rose DR, Kilburn DG, Davies GJ. 2002. Differential oligosaccharide recognition by evolutionarily-related beta-1,4 and beta-1,3 glucan-binding modules. J Mol Biol. 319:1143–1156.
5. Brunger AT. 1992. Free R value: a novel statistical quantity for assessing the accuracy of crystal structures. Nature. 355:472–475.
6. Cheng KH, Leung SL, Hoekman HW, Beekhuis WH, Mulder PG, Geerards AJ, Kijlstra A. 1999. Incidence of contact-lens-associated microbial keratitis and its related morbidity. Lancet. 354:181–185.
7. Crouch Brewer S, Wunderink RG, Jones CB, Leeper KV, Jr. 1996. Ventilator-associated pneumonia due to Pseudomonas aeruginosa. Chest. 109:1019–1029.
8. DeLano WL. 2001. The PyMOL molecular graphics system. San Carlos, CA: DeLano Scientific LLC.
9. Doublie S. 2007. Production of selenomethionyl proteins in prokaryotic and eukaryotic expression systems. Methods Mol Biol. 363:91–108.
10. Emsley P, Cowtan K. 2004. Coot: model-building tools for molecular graphics. Acta Crystallogr D Biol Crystallogr. 60: 2126–2132.
11. Feltman H, Schulert G, Khan S, Jain M, Peterson L, Hauser AR. 2001. Prevalence of type III secretion genes in clinical and environmental isolates of Pseudomonas aeruginosa. Microbiology (Reading England). 147: 2659–2669.
12. Garau J, Gomez L. 2003. Pseudomonas aeruginosa pneumonia. Curr Opin Infect Dis. 16:135–143.
13. Gattiker A, Bienvenut WV, Bairoch A, Gasteiger E. FindPept, a tool to identify unmatched masses in peptide mass finger printing protein identification. Proteomics 2002; 2: 1435–1444.
14. Goldenberg O, Erez E, Nimrod G, Ben-Tal N. 2009. The ConSurf-DB: pre-calculated evolutionary conservation profiles of protein structures. Nucleic Acids Res. 37:323– D327.
53
15. Goodman AL, Kulasekara B, Rietsch A, Boyd D, Smith RS, Lory S. 2004. A signaling network reciprocally regulates genes associated with acute infection and chronic persistence in Pseudomonas aeruginosa. Dev Cell. 7:745–754.
16. Goodman AL, Merighi M, Hyodo M, Ventre I, Filloux A, Lory S. 2009. Direct interaction between sensor kinase proteins mediates acute and chronic disease phenotypes in a bacterial pathogen. Genes Dev. 23:249–259.
17. Gouet P, Robert X, Courcelle E. 2003. ESPript/ENDscript: extracting and rendering sequence and 3D information from atomic structures of proteins. Nucleic Acids Res. 31:3320–3323.
18. Heeb S, Blumer C, Haas D. 2002. Regulatory RNA as mediator in GacA/RsmA-dependent global control of exoproduct formation inPseudomonas fluorescens CHA0. J Bacteriol. 184:1046–1056.
19. Henshaw J, Horne-Bitschy A, van Bueren AL, Money VA, Bolam DN, Czjzek M, Ekborg NA, Weiner RM, Hutcheson SW, Davies GJ,Boraston AB, Gilbert HJ. 2006. Family 6 carbohydrate binding modules in beta-agarases display exquisite selectivity for the non-reducing termini of agarose chains. J Biol Chem. 281:17099–17107.
20. Holm L, Kaariainen S, Wilton C, Plewczynski D. 2006. Using Dali for structural comparison of proteins. Curr Protoc Bioinformatics. Chapter 5:Unit 5.5.
21. Kay E, Humair B, Denervaud V, Riedel K,Spahr S, Eberl L, Valverde C, Haas D. 2006. Two GacA-dependent small RNAs modulate the quorum-sensing response in Pseudomonas aeruginosa. J Bacteriol. 188:6026–6033.
22. Labrec EH, Schneider H, Magnani TJ, Formal SB. 1964. Epithelial cell penetration as an essential step in the pathogenesis of bacillary dysentery. J Bacteriol. 88:1503–1518.
23. Laskowski MA, Kazmierczak BI. 2006. Mutational analysis of RetS, an unusual sensor kinase-response regulator hybrid required forPseudomonas aeruginosa virulence. Infect Immun. 74:4462–4473.
24. Laskowski RA, MacArthur MW, Moss DS, Thornton JM. 1993. PROCHECK: a program to check the steriochemical quality of protein structures. J Appl Cryst. 26:282–291.
25. Liaw SJ, Lai HC, Ho SW, Luh KT, Wang WB. 2003. Role of RsmA in the regulation of swarming motility and virulence factor expression inProteus mirabilis. J Med Microbiol. 52:19–28.
26. Malik A, Ahmad S. 2007. Sequence and structural features of carbohydrate binding in proteins and assessment of predictability using a neural network. BMC Struct Biol. 7:1
27. Mulcahy H, O'Callaghan J, O'Grady EP, Macia MD, Borrell N, Gomez C, Casey PG, Hill C, Adams C, Gahan CG, Oliver A, O'Gara F. 2008. Pseudomonas aeruginosa RsmA plays an important role during murine infection by
54
influencing colonization, virulence, persistence, and pulmonary inflammation. Infect Immun. 76:632–638.
28. Nallamsetty S, Austin BP, Penrose KJ, Waugh DS. 2005. Gateway vectors for the production of combinatorially-tagged His6-MBP fusion proteins in the cytoplasm and periplasm of Escherichia coli. Protein Sci. 14:2964–2971.
29. Otwinowski ZM, W. 1997. HKL2000. Methods Enzymol. 276:307–326. 30. Pell G, Szabo L, Charnock SJ, Xie H, Gloster TM, Davies GJ, Gilbert HJ. 2004.
Structural and biochemical analysis of Cellvibrio japonicusxylanase 10C: how variation in substrate-binding cleft influences the catalytic profile of family GH-10 xylanases. J Biol Chem. 279:11777–11788.
31. Richards MJ, Edwards JR, Culver DH, Gaynes RP. 1999. Nosocomial infections in medical intensive care units in the United States. National Nosocomial Infections Surveillance System. Crit Care Med. 27:887–892.
32. Satoh T, Sato K, Kanoh A, Yamashita K, Yamada Y, Igarashi N, Kato R, Nakano A, Wakatsuki S. 2006. Structures of the carbohydrate recognition domain of Ca2+-independent cargo receptors Emp46p and Emp47p. J Biol Chem. 281:10410–10419.
33. Shaver CM, Hauser AR. 2004. Relative contributions of Pseudomonas aeruginosa ExoU, Exo S, and Exo T to virulence in the lung Infect Immun. 72:6969–6977.
34. Simpson PJ, Jamieson SJ, Abou-Hachem M, Karlsson EN, Gilbert HJ, Holst O, Williamson MP. 2002. The solution structure of the CBM4–2 carbohydrate binding module from a thermostable Rhodothermus marinus xylanase. Biochemistry. 41:5712–5719.
35. Singh PK, Schaefer AL, Parsek MR, Moninger TO, Welsh MJ, Greenberg EP. 2000. Quorum-sensing signals indicate that cystic fibrosis lungs are infected with bacterial biofilms. Nature. 407:762–764.
36. Sulzenbacher G, Shareck F, Morosoli R, Dupont C, Davies GJ. 1997. The Streptomyces lividans family 12 endoglucanase: construction of the catalytic cre, expression, and X-ray structure at 1.75 Å resolution. Biochemistry. 36:16032–16039.
37. Sussman JL, Lin D, Jiang J, Manning NO, Prilusky J, Ritter O, Abola EE. 1998. Protein data bank (PDB): database of three-dimensional structural information of biological macromolecules. Acta Crystallogr D Biol Crystallogr. 54:1078–1084.
38. Velloso LM, Svensson K, Pettersson RF, Lindqvist Y. 2003. The crystal structure of the carbohydrate-recognition domain of the glycoprotein sorting receptor p58/ERGIC-53 reveals an unpredicted metal-binding site and conformational changes associated with calcium ion binding. J Mol Biol. 334:845–851.
55
39. Ventre I, Goodman AL, Vallet-Gely I, Vasseur P, Soscia C, Molin S, Bleves S, Lazdunski A, Lory S, Filloux A. 2006. Multiple sensors control reciprocal expression of Pseudomonas aeruginosa regulatory RNA and virulence genes. Proc Natl Acad Sci USA. 103:171–176.
40. Wallace AC, Laskowski RA, Thornton JM. 1995. LIGPLOT: a program to generate schematic diagrams of protein-ligand interactions.Protein Eng. 8:127–134.
41. Zwart PH, Afonine PV, Grosse-Kunstleve RW, Hung LW, Ioerger TR, McCoy AJ,McKee E, Moriarty NW, Read RJ,Sacchettini JC, Sauter NK, Storoni LC, Terwilliger TC, Adams PD. 2008. Automated structure solution with the PHENIX suite. Methods Mol Biol. 426:419–435.
56
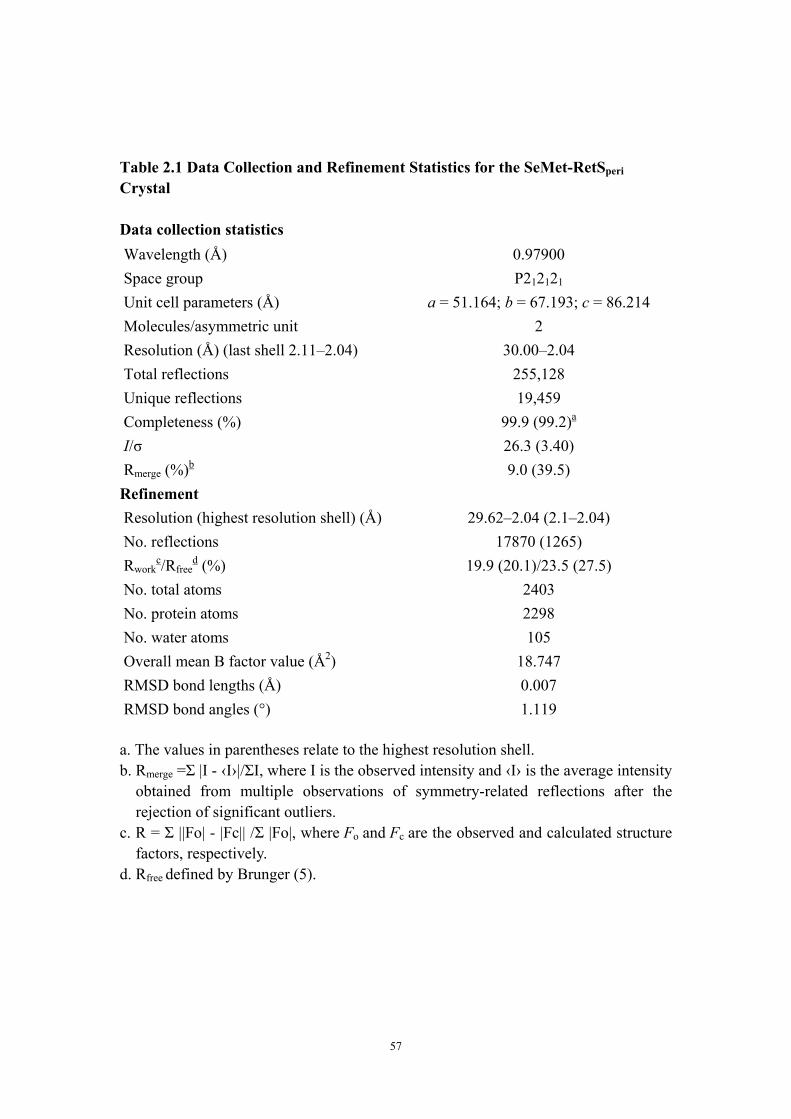
Table 2.1 Data Collection and Refinement Statistics for the SeMet-RetSperi
Crystal Data collection statistics Wavelength (Å) 0.97900 Space group P212121
Unit cell parameters (Å) a = 51.164; b = 67.193; c = 86.214 Molecules/asymmetric unit 2 Resolution (Å) (last shell 2.11–2.04) 30.00–2.04 Total reflections 255,128 Unique reflections 19,459 Completeness (%) 99.9 (99.2)a
I/σ 26.3 (3.40) Rmerge (%)b 9.0 (39.5) Refinement Resolution (highest resolution shell) (Å) 29.62–2.04 (2.1–2.04) No. reflections 17870 (1265) Rwork
c/Rfreed (%) 19.9 (20.1)/23.5 (27.5)
No. total atoms 2403 No. protein atoms 2298 No. water atoms 105 Overall mean B factor value (Å2) 18.747 RMSD bond lengths (Å) 0.007 RMSD bond angles (°) 1.119 a. The values in parentheses relate to the highest resolution shell. b. Rmerge =Σ |I - ‹I›|/ΣI, where I is the observed intensity and ‹I› is the average intensity
obtained from multiple observations of symmetry-related reflections after the rejection of significant outliers.
c. R = Σ ||Fo| - |Fc|| /Σ |Fo|, where Fo and Fc are the observed and calculated structure factors, respectively.
d. Rfree defined by Brunger (5).
57
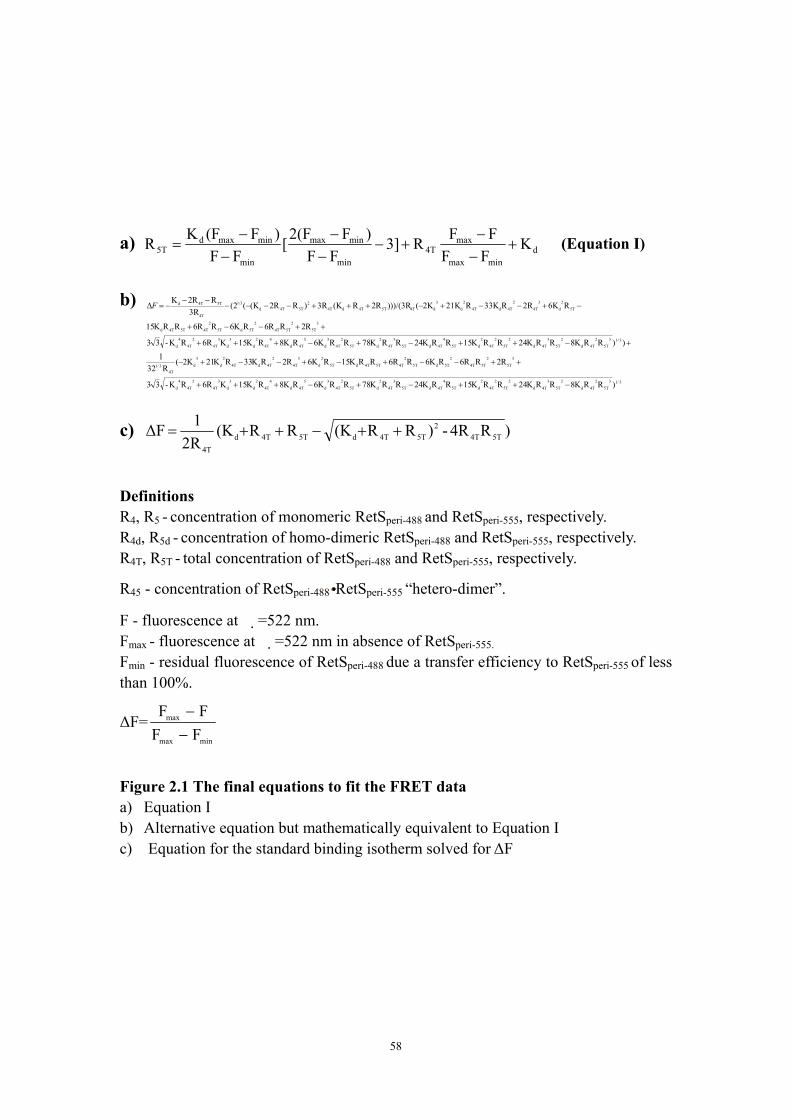
a) dminmax
max4T
min
minmax
min
minmaxd5T K
FFFFR3]
FF)F2(F[
FF)F(FKR +
−−
+−−−
−−
= (Equation I)
b)
3/135T
24Td
25T
34Td
25T
24T
2d5T
44Td5T
34T
2d5T
24T
3d
54Td
44T
2d
3d
34T
24T
4d )RRK8RRK24RRK15RRK24RRK78RRK6RK8RK15KR6RK-33 −++−+−+++
35T
25T4T
25Td5T
24T5T4Td5T
2d
34T
24Td4T
2d
3d
4T3/1
3/135T
24Td
25T
34Td
25T
24T
2d5T
44Td5T
34T
2d5T
24T
3d
54Td
44T
2d
3d
34T
24T
4d
35T
25T4T
25Td5T
24T5T4Td
5T2
d3
4T2
4Td4T2
d3
d4T5T4Td4T2
5T4Td1/3
4T
5T4Td
R2RR6RK6RR6RRK15RK6R2RK33RK21K2(R32
1))RRK8RRK24RRK15RRK24RRK78RRK6RK8RK15KR6RK-33
R2RR6RK6RR6RRK15
R6K2RR33KR21K2K()))/(3RR2R(K3R)RR2(K((23R
RR2KΔ
++−−+−+−−+−
+−++−+−+++
++−−+
−+−−+−+++−−−−−−
−=F
c) )R4R-)RR(KRR(K2R
1ΔF 5T4T2
5T4Td5T4Td4T
++−++=
Definitions R4, R5 - concentration of monomeric RetSperi-488 and RetSperi-555, respectively. R4d, R5d - concentration of homo-dimeric RetSperi-488 and RetSperi-555, respectively. R4T, R5T - total concentration of RetSperi-488 and RetSperi-555, respectively.
R45 - concentration of RetSperi-488 RetSperi-555 “hetero-dimer”.
F - fluorescence at =522 nm. Fmax - fluorescence at =522 nm in absence of RetS peri-555.
Fmin - residual fluorescence of RetSperi-488 due a transfer efficiency to RetSperi-555 of less than 100%.
ΔF=minmax
max
FFFF
−−
Figure 2.1 The final equations to fit the FRET data a) Equation I b) Alternative equation but mathematically equivalent to Equation I c) Equation for the standard binding isotherm solved for ΔF
58
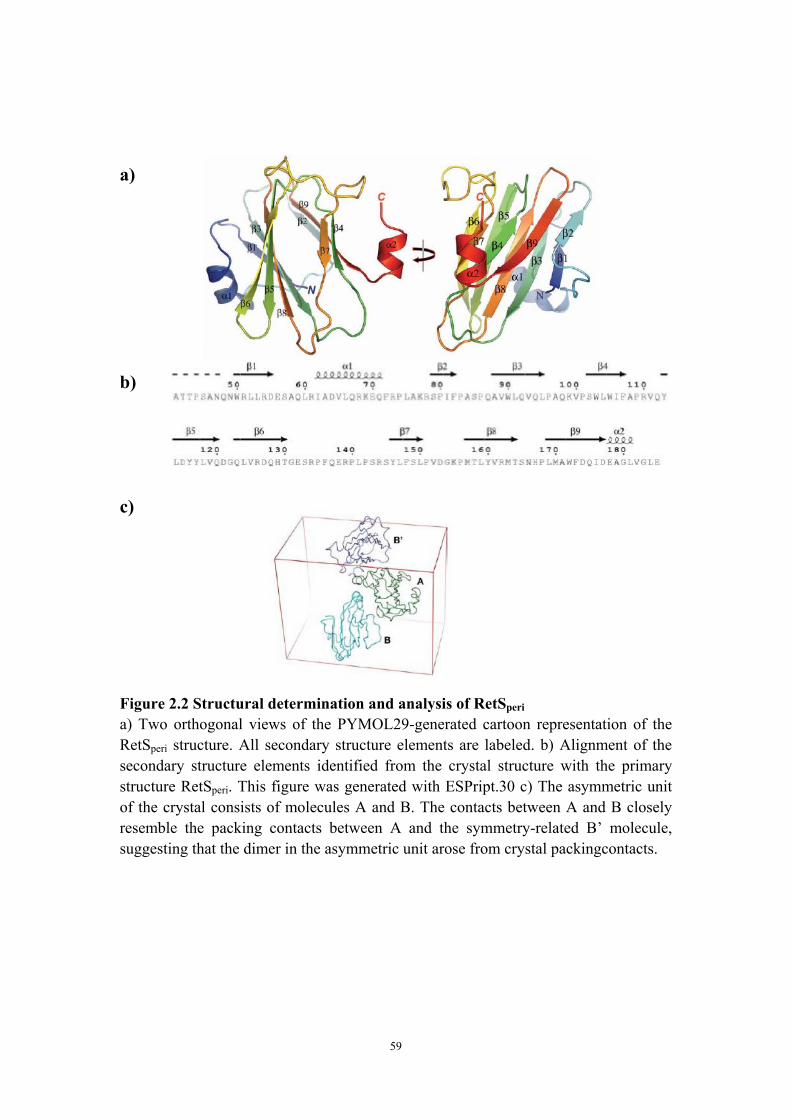
a)
b)
c)
Figure 2.2 Structural determination and analysis of RetSperi
a) Two orthogonal views of the PYMOL29-generated cartoon representation of the RetSperi structure. All secondary structure elements are labeled. b) Alignment of the secondary structure elements identified from the crystal structure with the primary structure RetSperi. This figure was generated with ESPript.30 c) The asymmetric unit of the crystal consists of molecules A and B. The contacts between A and B closely resemble the packing contacts between A and the symmetry-related B’ molecule, suggesting that the dimer in the asymmetric unit arose from crystal packingcontacts.
59
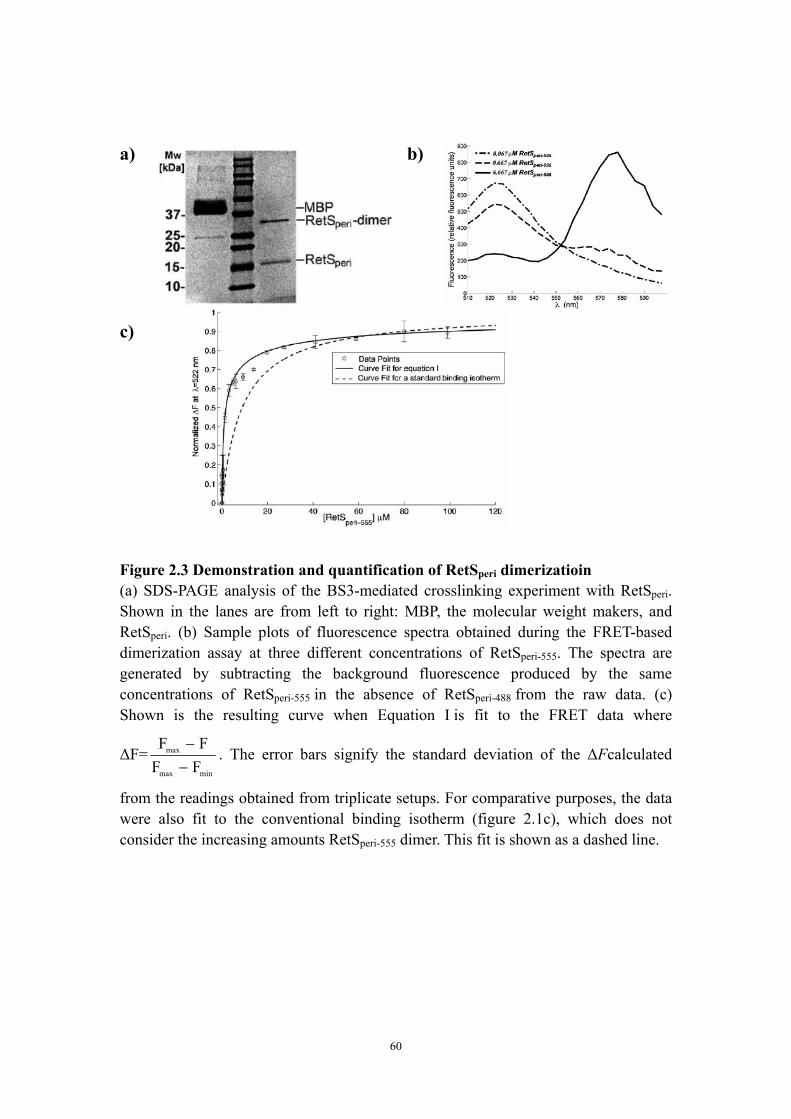
a) b)
c)
Figure 2.3 Demonstration and quantification of RetS dimerizatioin peri
(a) SDS-PAGE analysis of the BS3-mediated crosslinking experiment with RetSperi. Shown in the lanes are from left to right: MBP, the molecular weight makers, and RetSperi. (b) Sample plots of fluorescence spectra obtained during the FRET-based dimerization assay at three different concentrations of RetSperi-555. The spectra are generated by subtracting the background fluorescence produced by the same concentrations of RetSperi-555 in the absence of RetSperi-488 from the raw data. (c) Shown is the resulting curve when Equation I is fit to the FRET data where
ΔF=minmax
max
FFFF
−−
. The error bars signify the standard deviation of the ΔFcalculated
from the readings obtained from triplicate setups. For comparative purposes, the data were also fit to the conventional binding isotherm (figure 2.1c), which does not consider the increasing amounts RetSperi-555 dimer. This fit is shown as a dashed line.
60
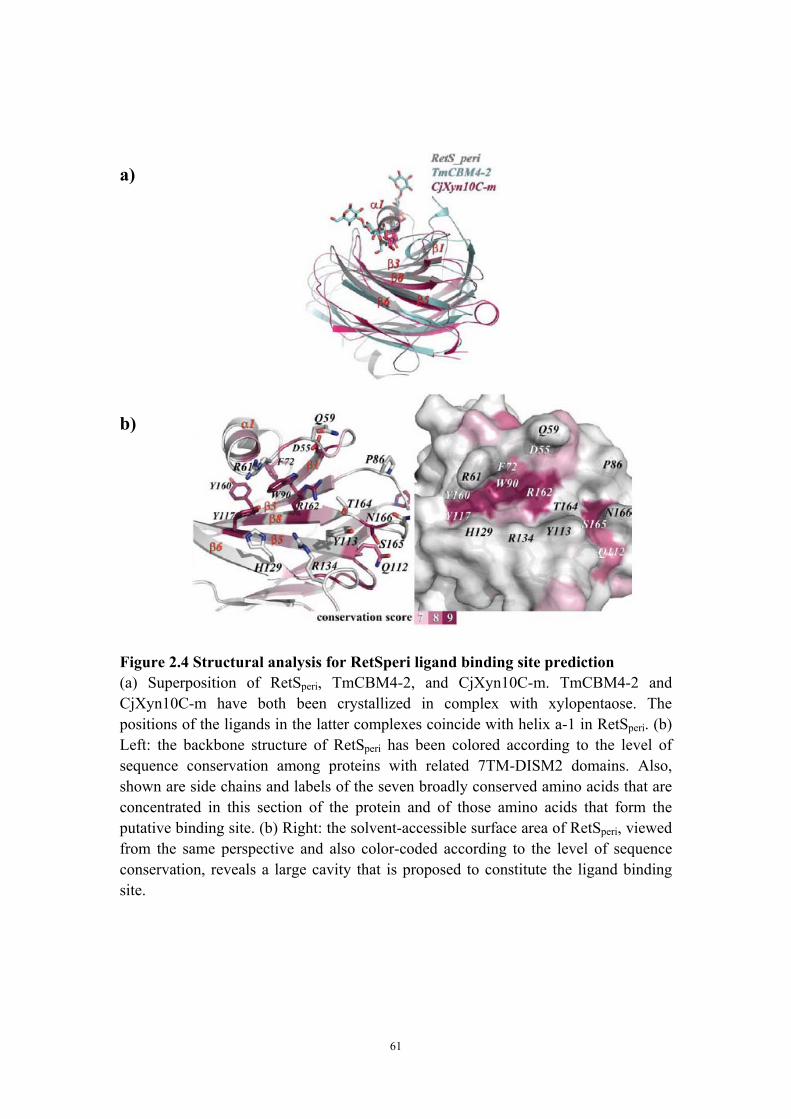
a)
b) Figure 2.4 Structural analysis for RetSperi ligand binding site prediction (a) Superposition of RetSperi, TmCBM4-2, and CjXyn10C-m. TmCBM4-2 and CjXyn10C-m have both been crystallized in complex with xylopentaose. The positions of the ligands in the latter complexes coincide with helix a-1 in RetSperi. (b) Left: the backbone structure of RetSperi has been colored according to the level of sequence conservation among proteins with related 7TM-DISM2 domains. Also, shown are side chains and labels of the seven broadly conserved amino acids that are concentrated in this section of the protein and of those amino acids that form the putative binding site. (b) Right: the solvent-accessible surface area of RetSperi, viewed from the same perspective and also color-coded according to the level of sequence conservation, reveals a large cavity that is proposed to constitute the ligand binding site.
61

Chapter Three
Characterization of the Ligand Binding and Dimerization
of RetS Periplasmic Sensory Domain In vitro and In vivo
62
ABSTRACT
To regulate gene expression for TTSS and biofilm formation in P. aeruginosa,
the two-component system sensor kinase RetS participates in Gac/Rsm signaling
pathway. The complexity in the domain architecture of RetS implies that this hybrid
sensor kinase might be involved in additional signaling pathways and intermolecular
cross-talk with other upstream or downstream TCS proteins. However, all to date
attempts to detect RetS intrinsic kinase activity have failed. The mechanism whereby
RetS executes its cellular signal transduction task remains unclear. To bring to light to
the signaling mechanism of RetS, we focus on the periplasmic sensory domain
(RetSperi) which is a presumed starting point of RetS signaling. Being a potential drug
target, RetSperi is putatively a trigger that turns on RetS cellular signaling activity. The
only reported functional study targeting this domain suggests it might inhibit
RetS-induced TTSS expression. However, the specific functional role of RetSperi in
biofilm formation regulation has not yet been examined. Except for testing the current
GacS-RetS signaling model and our hypothesis, the objective of this chapter is to
resolve the precise mechanism where the ligand binding and dimerization activities of
RetSperi regulate RetS-controlled biofilm formation. Another aim of this work is to
identify the natural ligand of RetSperi or a synthetic compound that could affect
biofilm formation through RetSperi mediated signaling.
63
Introduction
One remarkable trait of P. aeruginosa is its high drug-resistance assisted by the
biofilm formation on abiotic and biotic surfaces, especially in CF patient’s lungs (4).
Like many other bacterial pathogens, P. aeruginosa utilizes two-component systems
(TCSs) for gene expression regulation (7, 20). TCSs act by sensing extracellular
signals and subsequently transducing these signals to mediate target gene expression.
RetS is one of the crucial TCS proteins that regulate TTSS and biofilm assisted
pathogenesis (8, 17), Influencing the expression of more than 400 genes, RetS has
been demonstrated to be a critical negative regulator of biofilm formation (8).
Different from typical sensor kinases, RetS does not have detectable kinase activity (9,
10). In addition, unlike other TCS hybrid sensors, RetS possesses two distinct
response regulator domains implying that RetS might be part of a complex regulatory
network involving communication with other TCSs (8). However, whether the
conserved phosphorylation residues (histidine and aspartate) are required for RetS
signaling function is under debate (8, 16). Our study focused on the RetSperi domain,
which is a putative starting point for RetS signaling (6). Solving the mystery of the
role of this signal sensing domain will provide invaluable information to build up our
understanding of the RetS signal transduction mechanism.
Based on the RetS-GacS signaling model, we have proposed that the functional
role of signal sensing by RetSperi is to disrupt the homo-dimerization of RetS and in
turn to promote RetS-GacS hetero-dimerization in the cytoplasm (8, 12). In this study
our objectives are to test the current hypothesis as well as mapping of the ligand
binding site and dimer interface of RetSperi. Firstly, we demonstrate that both
predicted dimerization sites exist in vitro. Furthermore, we developed different
experimental strategies to either eliminate or enhance RetSperi dimerization and
examine the resulting changes in biofilm-related gene expression and phenotype.
Secondly, targeting the two putative ligand binding pockets (12, 23), we carried out
64
mutational analyses combined with an in vivo functional assay with the goal of
uncovering the signaling role of signal sensing capability of RetSperi.
Finally, RetSperi is a potential target for the development of antimicrobial agents
against biofilm gene expression in P. aeruginosa. Therefore, we aim to identify the
natural or synthetic ligands that are able to affect biofilm formation specifically
through interaction with RetSperi in P. aeruginosa. The crystal structure of RetSperi,
which we determined and characterized, suggests that the mystery ligand is a
carbohydrate moiety. This notion is very appealing because RetS regulates the
production of biofilm-related exopolysaccharides. But whether the source of the
ligand is the host or P. aeruginosa itself is still unknown. High throughput ligand
screening of human made carbohydrate compounds did not reveal any potential leads
for the RetS ligand. So we sought to identify a possible carbohydrate-like ligand from
the biofilm matrix which is rich in exopolysaccharides (EPS) (24). RetS regulates the
expression of the psl and pel operons which are responsible for the biosynthesis of
PSL and PEL, which are major exopolysaccharide components of the biofilm matrix
of nonmucoid Pseudomonas strains such as PAO1 (15, 24). Our preliminary tests
suggest that PSL, but not PEL, binds to RetSperi. Thus, we purified the previously
characterized PSL polysaccharides to conduct further tests (2). In addition, we tested
if any of the compounds identified from a whole cell screen for inhibition of biofilm
formation in P. aeruginosa are acting through RetS (13).
65
Materials and Methods
PSL overexpression and isolation from Pseudomonas aeruginosa
To over-express PSL, the Wozniak group has generated a psl-inducible P.
aeruginosa PAO1 strain (Δpsl/pBAD-psl) WFPA801 by replacing the psl promoter
region with araC-pBAD which can be controlled by arabinose. We have obtained this
strain kindly provided by the Wozniak group. For PSL over-production and isolation,
we strictly followed the protocol which Wozniak group has developed (2). Briefly, 5
ml stationary phase overnight LB culture of WFPA801 was inoculated into 0.5L of
M63 minimal medium (3L per batch) for 48 hours with slow agitation (250 rpm) at
37°C. To overexpress PSL, the cultures were supplemented with 0.4% (w/v) arabinose
(15). Cells and cell-associated matrix material were separated from the viscous
growth media by centrifugation (5000g, 4°C, 30 min). The pellets were resuspended
in saline (0.9% NaCl, 50ml/L cell culture) and the cell surface-associated polymers
were detached by mild sonication (4 × 20 s, 50% cycle, intensity 0.5). The pellet was
then removed by centrifugation (same parameters) and resuspended with fresh saline.
This procedure was repeated twice in order to extract as much biofilm matrix extract
as possible. After that, this extract and the 3L growth medium were treated the same
way. To precipitate DNA and proteins, TCA was added to a final concentration of 5%
(w/v). The precipitation and any insoluble components were removed by
centrifugation (10,000g, 10 minutes). The collected supernatant was then dialyzed in
pure water and lyophilized. The obtained residue was resuspended in pure water and
was centrifuged (10000g, 10 minutes) to remove insoluble materials. The supernatant
was further deproteinated by extracting with equivalent volume of phenol twice and
finally with phenol-chloroform (1:1 volume ratio). This crude polysaccharide sample
was then fractionated by gel filtraction in pure water using a Sephadex G-50
size-exclusion column (16mm x 60cm).
A colorimetric assay was performed to quantify the sample in each fraction (19).
66
Briefly, each 50 μl polysaccharide or mono-mannose sample was mixed with 10μl
20% phenol and 250 μl sulphuric acid. The absorbance at 485nm was measured for all
mixtures using a 96-well transparent plate. The final concentration of PSL was
determined by comparing to a standard curve for a mono-mannose sample.
Differential Scanning Fluorimetry (DSF) assay for RetSperi ligand binding study
5μM RetSperi in either Tris buffer or sodium phosphate buffer (pH7.4) containing
50mM NaCl was incubated with or without 100μM ligand. 5X SYPRO Orange
(5000X commercial stock) was also included in all 30μl samples. Protein melting
(unfolding) was assessed by continuous thermal monitoring using the RT-PCR
thermocycler instrument to detect increases in the fluorescence of the fluorophor.
Samples were heated from 11 °C to 70 °C, with fluorescence acquisition in 0.5 °C
increments. Fluorescence intensities were plotted versus temperature. The stability of
RetSperi with or without ligands was indicated by the melting temperatures which are
represented by the inflecion points of the sigmoidally-shaped melt curves (18).
Circular Dichroism
Far-UV CD spectra were generated using RetSperi protein (10μM) with or
without purified PSL samples on a Jasco J-815 spectropolarimeter equipped with a
Jasco PFD-425 S temperature-control unit. Spectra were collected in a 1-mm
path-length quartz cell at 4°C. Spectra were obtained from three accumulated scans
from 240 to 190 nm using a bandwidth of 1 nm and a response time of 1 s at a scan
speed of 100 nm/min. Buffer (described in chapter two) backgrounds with or without
PSL-A were used to subtract from the protein spectra with or without PSL-A (14).
Construction of expression plasmids for retS and retS mutant genes
The retS gene including its native promoter sequence (258bp) was amplified by
FailSave PCR (Epicentre Biotechnologies) using PAO1 genomic DNA as the template
with the primers containing restriction enzyme sites (SacI/EcoRI) (table 3.2) (16). The
PCR product was then cloned into the pBluescript II SK (pSK) plasmid, which was
67
used for expression of RetS or RetS variant proteins (table 3.1). To transform all the
plasmids carrying either retS or retS mutant gene into the PAO1 retS transposon
insertion mutant strain (PAO1ΔretS) (22), the competent cell preparation and
transformation steps followed a well developed protocol (3). Briefly, PAO1ΔretS cells
were harvested from an overnight LB culture (supplemented with 15μg/ml
tetracycline) by centrifugation (16000g) and washed with fresh 0.3M sucrose twice at
room temperature. Cell pellets were resuspended into 50μl aliquots. Plasmids were
individually transformed to the competent cells by electroporation. All the mutant retS
genes were generated by PCR assisted site-directed mutagenesis (5) using pSK
containing wild type retS gene as the PCR template.
RetSperi cysteine variant preparation for in vitro crosslinking experiments
The RetSperi cysteine mutation variants were generated by site-directed
mutagenesis using an entry clone followed by Gateway cloning (Invitrogen) into an
expression plasmid. Protein expression and purification followed the same procedures
for wild type RetSperi with only the exception that DTT was included in all protein
buffers during purification (12). All of mutation primers are listed in Table 3.2.
Before crosslinking experiments, every protein sample was buffer exchanged to
0.1M Na2HPO4 (pH 7.2), 50mM NaCl and 5mM EDTA using a HiPrepTM 26/10
desalting column (GE Healthcare). To assist crosslinking, two commercial
crosslinkers were individually used: bis(maleimido)ethane (BMOE) (8Å spacer) and
1,11-bismaleimidotriethyleneglycol (BM[PEG]3) (17.8Å spacer) (ThermoScientific)
which were dissolved in 50% DMSO at 1.4mM stock. Each reaction mixture
containing 5μM crosslinker and 2μM RetSperi variant was incubated in 4°C for 2 hours.
Each 75μl crosslinking reaction was quenched by adding 5μl 1M DTT. The reaction
set-up with wild type RetSperi was used as a negative control. Crosslinked samples
were analyzed via SDS-PAGE.
68
Bacterial strains and growth
PAO1 and PAO1 mutants used for all the in vivo experiments are listed in table 3.1
(22). Except during cloning, all strains were grown in chemically defined Jensen’s
minimal medium which was prepared according to a published protocol (11). For the
overnight cultures: PAO1 was grown in the presence of 5μg/ml triclosan; PAO1ΔretS
was grown in the presence of 15μg/ml tetracycline; all the strains containg a pSK
plasmid were grown in the presence of 300μg/ml carbenicillin. For the congo red
experiments, all the cultures were set up without antibiotics. For the growth of psl
overexpression strain WFPA801, the growth cultures were also supplemented with or
without (for control) arabinose.
Reverse transcription-PCR and quantitative real-time PCR (qRT-PCR)
To isolate RNA, all used strains were grown at 37°C in Jensen’s minimal
medium with appropriate antibiotics. Each overnight culture was then subcultured
1:25 into fresh medium and grown at 37°C to mid-logarithmic phase (optical density
at 600 nm (O.D.600) of 0.6). Bacteria were then pelleted by centrifugation and used for
RNA isolation using Trizole as instructed by the manufacturer (5 PRIME). The RNA
samples were treated with DNase to remove bacterial chromosomal DNA. The
concentrations of all finally obtained RNA samples were determined by UV-260nm
absorbance measurements. 1μg of each RNA sample was used for cDNA synthesis
with the reverse transcription kit (Invitrogen).
For quantitative real-time PCR, 1 μl of cDNA synthesized from RNA isolated
from each strain was added to the iQ SYBR Green Supermix (Bio-Rad). The primer
concentration was 50nM. The constitutively expressed rpoD gene was used as an
endogenous control to normalize quantification of the mRNA target. Real-time PCR
data were analyzed, validated, and calculated according to the instructions of the
manufacturer.
69
Congo red biofilm assay to detect biofilm exopolysaccharides (EPS) production
All target strains were grown at 37°C in Jensen’s minimal medium with
appropiate antibiotics. The cell densities of overnight cultures were then measured at
600nm and then subcultured in fresh medium starting with O.D.600 reading of 0.05.
After all strains arrived in stationary phase, the cultures were normalized again to
O.D.600 reading of 0.03 in 3ml fresh medium supplemented with 10μl of filtered
50mg/ml Congo red dye. All the final cultures with Congo red (CR) were grown in
glass tubes at 37°C with 150rpm shaking for different time periods. To achieve in vivo
crosslinking, the crosslinker BMOE was also added to the two cysteine mutant stains
at time zero.
The following day, a 200μl culture was removed in order to determine the
O.D.600 before the bacterial cells were pelleted by centrifugation at 14,000g. For
quantification of CR binding, the A490 of the supernatant of each sample was
determined. Each strain was assayed in duplicate to generate a mean and standard
error. All the samples to be measured were loaded onto a 96-well plate and the
measurements were done by a TECAN infinite M200 fluorescence intensity scanner
(Tecan).
70
Results and Discussion
Ligand titration into RetSperi causes a decreased melting temperature (Tm) and
only PSL-A (not B or C) could shift the Tm of RetSperi
The crystal structure of RetSperi and structural alignment with other CBMs
unquestionably indicate that it binds to carbohydrate molecules (1, 12). To
preliminarily test this hypothesis, we carried out DSF assay for a small-scale ligand
screening using carbohydrate-like compounds. We found that the polymerized
galacturonic acid, but not mono-galacturonic acid, causes a decreased melting
temperature of RetSperi (figure 3.2). Considering the protein stabilization by ligands, a
decreased melting temperature implies suggests an oligmerization disruption of
RetSperi by ligand binding. This indication is consistent with our hypothesis that
RetSperi signal sensing favors RetS-GacS hetero-dimer formation (9, 12).
More interestingly, the ligand that caused the most significant Tm shift is a crude
biofilm matrix material. This is a very alluring result because RetS regulates
biofilm-polysaccharide expression. Using the same assay to test the effect of biofilm
PEL polysaccharides on RetSperi stability, we couldn’t detect a change of Tm. So we
ask the question that if biofilm-PSL could be a ligand of RetSperi (15). The previous
study has shown that PSL is a mixture of polysaccharides with the same repeating unit
but different degrees of polymerization and can be separated in three fractionations:
PSLA, B and C (2). Following the published protocol, we isolated PSL-A, B and C
(figure 3.3a). Each fraction was tested for RetSperi binding by DSF experiments. As
shown by figure 3.3b, only PSL-A, which is the high molecular weight fraction, could
cause a Tm shift of RetSperi. However, when applying circular dichoism experiment to
confirm the DSF result, we could not detect a change of far-UV spectrum of RetSperi
by titrating either PSL-A or PSL-C into the protein sample (figure 3.4a).
PSL-A has no signaling role in RetS-involved biofilm formation regulation
Since the in vitro DSF and CD experiments could not lead a conclusion that
71
whether PSL-A binds to RetSperi or not, we wondered if this putative interaction takes
place in vivo and in turn affects biofilm formation through RetS signaling. To test this
hypothesis, we employed a real-time PCR based examination targeting the expression
of the rsmZ gene, which is part of the RetS signal transduction pathway to regulate
biofilm formation. The expression of PSL was controlled by adjusting the
concentration of arabinose in the growing cultures. As shown in figure 3.4b, we could
not detect an effect of PSL overexpression on RsmZ expression.
Previously identified synthetic biofilm inhibitors do not affect RetS signaling
Junker and Clardy have identified 30 compounds that inhibited biofilm formation
in P. aeruginosa PAO1 strain using a high throughput screening of over 60,000
compounds. To examine if any of these compounds regulates biofilm formation by
signaling through RetSperi, we tested 21 of the 30 compounds in an in vitro DSF-based
protein ligand binding assay as well as our in vivo congo red biofilm assay. One of
these compounds (compound ID: 34600076) caused a shift of RetSperi melting
temperature in the DSF assay (figure 3.5a). This compound also caused a slightly
decreased of biofilm exopolysaccharide production in the PAO1 wild type strain.
However, as shown by figure 3.5b, this compound also had the same effect in the
retSperi deletion mutant. This result indicates that this compound does not act through
binding to RetSperi.
Deletion of RetSperi causes moderately increased biofilm EPS production
Previous studies have shown that RetSperi is not required for RetS activity to
induce the expression of TTSS and might mediate RetS autoinhibition in vivo (16).
However, the role of RetSperi in the regulation of biofilm formation was not examined.
To fill this gap, we transformed a PAO1ΔretS mutant strain with the high copy
number plasmid pSK containing either the wild-type retS gene or a retS gene lacking
the sensory domain (retS41-185). In both cases, the expression of the proteins is
controlled by native retS promoter (16). For in vivo functional studies, the congo red
72
biofilm assay was carried out (15). As shown by figure 3.1, the PAO1 ΔretS shows a
hyperbiofilm-EPS production and hyperbiofilm-attachment phenotypes as expected
(8). Expression of full length RetS protein restored wild type PAO1 with respect to
biofilm EPS production. The slightly lower EPS production by the complemented
strain compared to wild type PAO1 is probably due to a higher expression level of
RetS using the high copy number plasmid pSK (16). On the other hand, the mutant
complementation strain expressing truncated RetS (Δ41-185) shows a moderately
increased biofilm EPS production phenotype compared to the complemented and the
wild type strains. It has been demonstrated that this truncation does not impact the
expression or steady-state stability of RetS (16). To confirm that these phenotypes are
controlled by RetS involved signaling through Gac/Rsm regulatory system, the
transcription levels of the sRNA rsmZ in the mutants were examined by real-time
PCR. Consistent with the result of congo red biofilm assay, the RsmZ expression level
of the strain complmented with retS (Δ41-185) is between those of the retS mutant
and the complementation strain. These results indicate that RetSperi does appear to
inhibit, but not sufficiently repress, RetS-controlled biofilm formation (figure 3.1).
However, in the context of the current hypothesis that RetSperi favors
homo-dimerization of RetS and GacS and in turn biofilm formation, this result is
unexpected as we would have predicted a decrease in biofilm formation as the result
of retSperi deletion (9, 12).
Both putative dimer interfaces assist in vitro cysteine-cysteine crosslinking
Our hypothesis postulates that ligand binding disrupts RetSperi dimerization.
Accordingly, we predicted that the RetSperi dimer interface would be close to the
alpha-helix 1 and the predicted ligand binding site (figure 3.6a) (12). After our
prediction, another dimer interface and ligand binding site were hypothesized, which
located the pocket close to alpha-helix 2 (figure 3.6a) (23). We have demonstrated
RetSperi dimerization via an in vitro lysine-lysine (amine) crosslinking assay (12).
73
However, the involvement of the N-terminus of the protein in amine crosslinking
made it difficult to locate the dimer interface with this strategy. Therefore, targeting
these two putative dimer interfaces, we applied a cysteine-cysteine based crosslinking
strategy. To this end, two single cysteine mutations were introduced in each of the two
putative dimer interfaces. Each RetSperi cysteine variant was successfully purified and
applied to the crosslinking experiment. Crosslinking for the wild type RetSperi, which
was used for a negative control, yielded no dimers. Interestingly, all four cysteine
variants could be crosslinked by either of the two crosslinkers (BMOE and BM[PEG]3)
as shown by figure 3.6b. This result is not too surprising because it has been shown by
small angle scattering data that there are 7% tetramers of RetSperi in solution (23).
Introduction of single cysteine mutations to RetSperi do not affect in vivo biofilm
EPS production phenotype
It has been proposed that there is a functional role of RetSperi dimerization in
biofilm formation regulation. Disruption of RetSperi dimerization is hypothesized to
promote RetS-GacS interaction and in turn biofilm repression (9, 12). Here we are
also interested in the effect of an enhanced RetSperi dimerization on RetS signaling.
Since we have shown that both putative dimer interfaces could assist in vitro
dimerization in our cysteine-based crosslinking assay, we accordingly introduced
single cysteine mutations to periplasmic domain of RetS, which is expressed in the
PAO1ΔretS mutant in order to achieve irreversible dimerization of RetS. One cysteine
residue was introduced to each dimer interface by site-directed mutagenesis method
(glutamin67 and isolusine176). Congo red biofilm in vivo assay was applied to check
the complementation phenotypes of the single cysteine mutants. As shown by figure
3.7a, each cysteine mutant shows the same biofilm phenotype as that of the full
complementation strain.
One explanation for this result is that irreversible dimerization of RetSperi in vivo
requires the presence of a crosslinker despite that the periplasm is an oxidizing
74
environment (21). Thus, the membrane-permeable cysteine crosslinker BMOE (8Å
arm space) was introduced into the congo red biofilm experiments. Unfortunately,
there is no phenotype difference between the cysteine mutants and the
complementation strain in terms of biofilm formation (figure 3.8).
Single Mutations on either putative ligand binding site do not affect biofilm EPS
production
The proposed functional role of RetSperi ligand binding in RetS signaling is to
disrupt RetSperi dimerization, thus promoting RetS-GacS interaction, which in turn
inactivates biofilm gene expression. Hence, increased biofilm formation is expected if
th RetSperi ligand binding site is disrupted. Based on our crystal structure, we have
predicted the first putative RetSperi ligand binding site, which is close to the
alpha-helix1. This site meets all the requirements for the common features of ligand
binding sites in CBM and is structurally conserved in closest structural homologues of
RetSperi (12). However, we could not exclude another putative binding pocket located
close to alpha-helix2 (23). Targeting the critical residues in these two sites, we
employed a mutational analysis combined with in vivo congo red biofilm assay. To
this end, single mutations on two putative RetSperi ligand binding sites were
introduced by site-directed mutagenesis. Corresponding RetS variants were expressed
in PAO1ΔretS mutant strain. Surprisingly, as shown by figure 3.9, none of these single
mutations was able to affect biofilm EPS production.
Conclusion and Discussion
The DSF and CD data indicate that PSL-A might bind RetSperi in vitro. Having
the same sugar composition and repeating unit as those of PSL-A, PSL-B and PSL-C
could not show binding to RetSperi. One explanation for this finding is that except for
the difference in the degrees of polymerization, PSL-A is not identical to PSL-B and
PSL-C (2). Another possibility is that the observations in in vitro DSF and CD
experiments are not due to RetSperi-PSL-A binding. This explanation is more likely
75
true because the qPCR experiment shows that PSL overexpression was not able to
affect RsmZ expression. Additionally, the two identified synthetic biofilm inhibitors,
which could shift the melting temperature of RetSperi, did not impact RetS signaling to
regulate biofilm formation. In summary, our attempt to identify a RetSperi ligand that
could affect biofilm formation through RetS signaling has been unsuccessful.
The current hypothesis states that ligand binding of RetSperi tunes the
homo-dimerization of RetS and RetS-GacS hetero-dimerization (9, 12). Thus, the
deficiency of RetSperi ligand binding is expected to cause an increased biofilm
formation. However, all the single mutations targeting putative RetSperi ligand binding
sites was unable to affect biofilm phenotype. One explanation for this particular result
is that the RetSperi ligand in the congo red assay might be absent. On the other hand, a
down-regulated biofilm phenotype by deletion of RetSperi, which is proposed to
promote RetS-GacS heterodimer formation, was expected (12). However, we
observed the opposite phenomenon. In addition, introduction of single cysteine
residues, which could assist irreversible RetSperi dimerization in vitro, did not impact
biofilm phenotype related exopolysaccharide production through RetS signaling.
Therefore, targeting RetSperi-controlled RetS signaling mechanism as well as the
specific functional role(s) of RetS-GacS interaction, alternative explanations have to
be examined.
Acknowledgements
I thank the first year graduate student Jordan Mancl who has been assisting in the
congo red biofilm assay. I thank Dr. Webster Santos for kindly allowing us to use the
circular dichroism instrument in his lab. This work is funded by the Jeffress Memorial
Trust, the American Heart Association, and the DOE/DER, NIH/NCRR.
76
References 1. Boraston AB, Bolam DN, Gilbert HJ, Davies GJ. 2004. Carbohydrate-binding
modules: fine-tuning polysaccharide recognition. Biochem J. 38:769-81. 2. Byrd MS, Sadovskaya I, Vinogradov E, Lu H, Sprinkle AB, Richardson SH, Ma
L, Ralston B, Parsek MR, Anderson EM, Lam JS, Wozniak DJ. 2009. Genetic and biochemical analyses of the Pseudomonas aeruginosa Psl exopolysaccharide reveal overlapping roles for polysaccharide synthesis enzymes in Psl and LPS production. Mol Microbiol. 73:622-38.
3. Choi KH, Kumar A, Schweizer HP. 2006. A 10-min method for preparation of highly electrocompetent Pseudomonas aeruginosa cells: Application for DNA fragment transfer between chromosomes and plasmid transformationJ Microbiol Methods. 64:391-7.
4. Cornelis P (editor). 2008. Pseudomonas: Genomics and Molecular Biology (1st edition.). Caister Academic Press.
5. Costa GL, Bauer JC, McGowan B, Angert M, Weiner MP. 1996. Site-Directed Mutagenesis Using a Rapid PCR-Based Method. Methods Mol Biol. 57:239-48.
6. Gao R, Stock AM. 2009. Biological insights from structures of two-component proteins. Annu Rev Microbiol. 63:133-54.
7. Gooderham WJ, Hancock RE. 2009. Regulation of virulence and antibiotic resistance by two-component regulatory systems in Pseudomonas aeruginosa. FEMS Microbiol Rev. 33:279-94.
8. Andrew L. Goodman, Bridget Kulasekara, Arne Rietsch, Dana Boyd, Roger S. Smith, and Stephen Lory. 2004. A Signaling Network Reciprocally Regulates Genes Associated with Acute Infection and Chronic Persistence in Pseudomonas aeruginosa, Developmental Cell. 7:745–754.
9. Goodman AL, Merighi M, Hyodo M, Ventre I, Filloux A, Lory S. 2009. Direct interaction between sensor kinase proteins mediates acute and chronic disease phenotypes in a bacterial pathogen. Genes Dev. 23:249-59.
10. Hsu JL, Chen HC, Peng HL, Chang HY. 2008. Characterization of the histidine-containing phosphotransfer protein B-mediated multistep phosphorelay system in Pseudomonas aeruginosa PAO1. J Biol Chem. 283:9933-44.
11. Jensen, S. E., I. T. Facycz, and J. N. Campbell. 1980. Nutritional factors controlling exocellular protease production by Pseudomonas aeruginosa. J. Bacteriol. 144:844-847.
12. Jing X, Jaw J, Robinson HH, Schubot FD. 2010. Crystal structure and oligomeric state of the RetS signaling kinase sensory domain. Proteins. 78:1631-40.
13. Junker LM, Clardy J. 2007. High-Throughput Screens for Small-Molecule Inhibitors of Pseudomonas aeruginosa Biofilm Development. Antimicrob Agents Chemother. 51:3582-90.
14. Kelly SM, Jess TJ, Price NC. 2005. How to study proteins by circular dichroism.
77
Biochim Biophys Acta. 1751:119-39. 15. Ma L-Y, Jackson K, Landry RM, Parsek MR, Wozniak DJ. 2006. Analysis
of Pseudomonas aeruginosa conditional Psl variants reveals roles for the Psl polysaccharide in adhesion and maintaining biofilm structure postattachment. J Bacteriol. 188:8213–8221.
16. Michelle A. Laskowski, and Barbara I. Kazmierczak. 2006. Mutational Analysis of RetS, an Unusual Sensor Kinase-Response Regulator Hybrid Required for Pseudomonas aeruginosa Virulence. Infection and Immunity. 74:4462–4473.
17. Michelle A. Laskowski, Ellice Osborn and Barbara I. Kazmierczak. 2004. A novel sensor kinase–response regulator hybrid regulates type III secretion and is required for virulence in Pseudomonas aeruginosa. Molecular Microbiology. 54:1090–1103.
18. Niesen FH, Berglund H, Vedadi M. 2007. The use of differential scanning fluorimetry to detect ligand interactions that promote protein stability. Nat Protoc. 2:2212-21.
19. Petrakova E, Glaudemans CP. 1995. Synthesis of the methyl cu-glycosides of some isomalto-oligosaccharides specifically deoxygenated at position C-4 Carbohydr Res. 279:133-50.
20. Rodrigue, A., Quentin, Y., Lazdunski, A., Mejean, V., and Foglino, M. 2000. Two-component systems in Pseudomonas aeruginosa: why so many? Trends Microbiol. 8:498–504.
21. Schlapschy M, Skerra A. 2011. Periplasmic Chaperones Used to Enhance Functional Secretion of Proteins in E. coli. Methods Mol Biol. 705:211-24.
22. Shawn Lewenza, et. al. 2005. Construction of a mini-Tn5-luxCDABE mutant library in Pseudomonas aeruginosa PAO1: A toll for identifying differentially regulated genes. Genome Research. 15:583-589.
23. Vincent F, Round A, Reynaud A, Bordi C, Filloux A, Bourne Y. 2010. Distinct oligomeric forms of the Pseudomonas aeruginosa RetS sensor domain modulate accessibility to the ligand binding site. Environ Microbiol. 12:1775-86.
24. Wozniak DJ, Wyckoff TJ, Starkey M, Keyser R, Azadi P, O'Toole GA, Parsek MR. 2003. Alginate is not a significant component of the extracellular polysaccharide matrix of PA14 and PAO1 Pseudomonas aeruginosa biofilms. Proc Natl Acad Sci U S A. 100:7907-12.
78

Table 3.1 Bacterial cells and plasmids
Stain or plasmid Relevant information Source/ Reference
E. coli strains:
BL21 DE3 CodonPlus RIL cells Stratagene
DH5α Only for cloning procedures This study
P. aeruginosa cells:
PAO1 Wild type strain 22
PAO1Δ retS PAO1 retS transposon insertion mutant 22
WFPA801 PAO1 PSL-overexpression mutant 15 PAO1Δ retS+
retS_pSK PAO1 retS complementation strain This study
PAO1ΔretS+ retSQ67C_pSK
PAO1 retS complementation strain with
cysteine mutation on Gln67 This study
PAO1Δ retS+ retSI176C_pSK
PAO1 retS complementation strain with
cysteine mutation on Ile176 This study
PAO1Δ retS +retSY117A_pSK This study
PAO1Δ retS +retSR162A_pSK This study
PAO1Δ retS +retSD115A_pSK This study
PAO1Δ retS +retSF107A_pSK This study
PAO1Δ retS +retSW103A_pSK
For RetS ligand binding site mutation
This study
PAO1Δ retS +retSW105A_pSK For RetS ligand binding site mutation This study
PAO1Δ retS +retSΔperi_pSK RetSperi deletion mutant This study
PAO1+ pSK PAO1 with empty pSK vector This study
PAO1Δ retS +pSK retS mutant with empty pSK vector This study
79
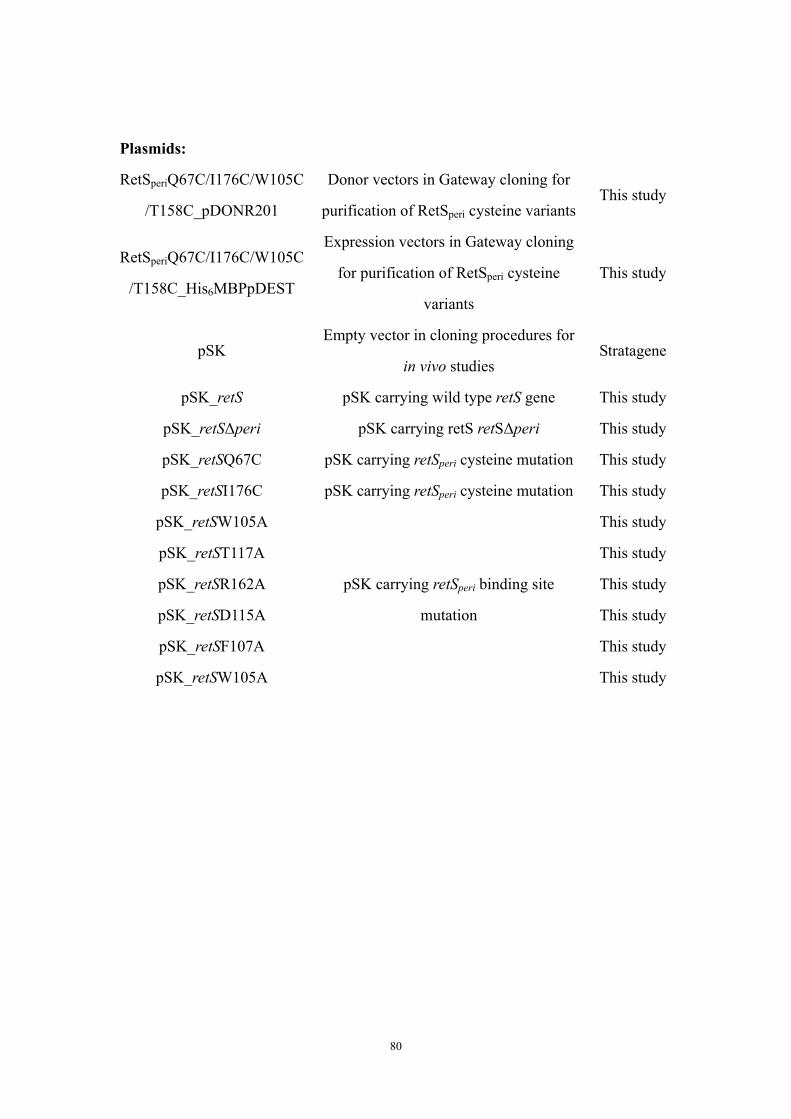
Plasmids:
RetSperiQ67C/I176C/W105C
/T158C_pDONR201
Donor vectors in Gateway cloning for
purification of RetSperi cysteine variants This study
RetSperiQ67C/I176C/W105C
/T158C_His6MBPpDEST
Expression vectors in Gateway cloning
for purification of RetSperi cysteine
variants
This study
pSK Empty vector in cloning procedures for
in vivo studies Stratagene
pSK_retS pSK carrying wild type retS gene This study
pSK_retSΔperi pSK carrying retS retSΔperi This study
pSK_retSQ67C pSK carrying retSperi cysteine mutation This study
pSK_retSI176C pSK carrying retSperi cysteine mutation This study
pSK_retSW105A This study
pSK_retST117A This study
pSK_retSR162A This study
pSK_retSD115A This study
pSK_retSF107A This study
pSK_retSW105A
pSK carrying retSperi binding site
mutation
This study
80
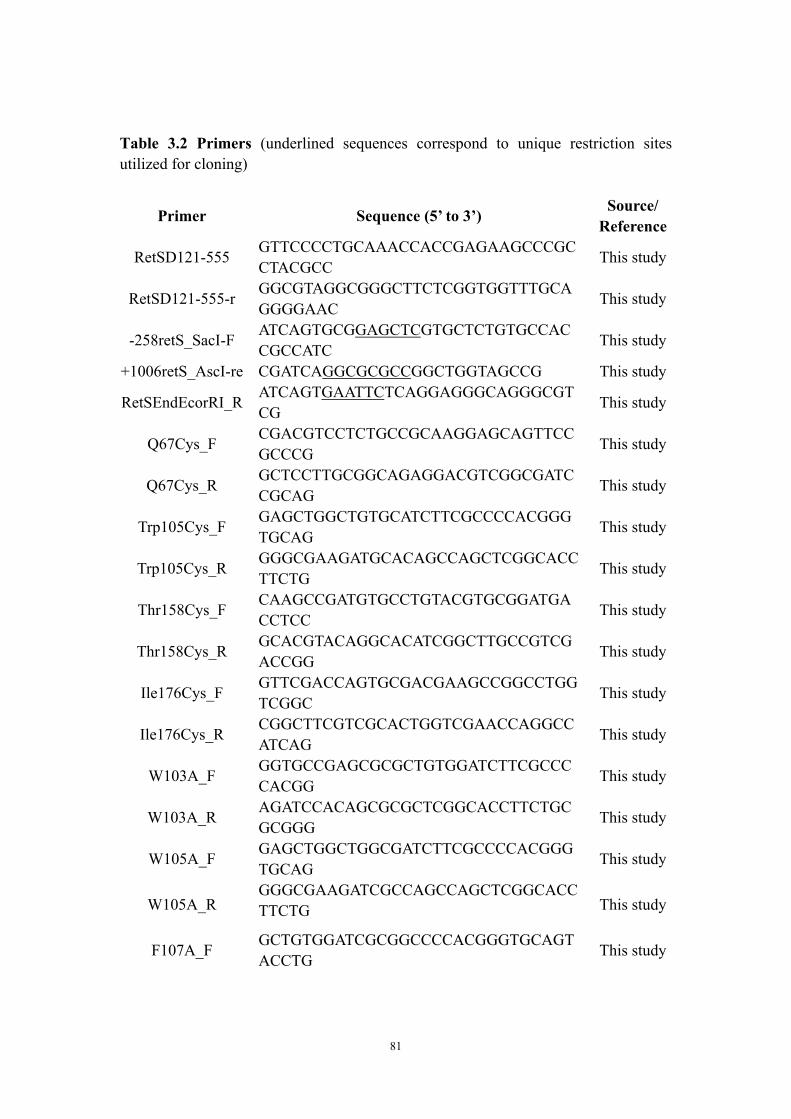
Table 3.2 Primers (underlined sequences correspond to unique restriction sites utilized for cloning)
Primer Sequence (5’ to 3’) Source/ Reference
RetSD121-555 GTTCCCCTGCAAACCACCGAGAAGCCCGCCTACGCC This study
RetSD121-555-r GGCGTAGGCGGGCTTCTCGGTGGTTTGCAGGGGAAC This study
-258retS_SacI-F ATCAGTGCGGAGCTCGTGCTCTGTGCCACCGCCATC This study
+1006retS_AscI-re CGATCAGGCGCGCCGGCTGGTAGCCG This study
RetSEndEcorRI_R ATCAGTGAATTCTCAGGAGGGCAGGGCGTCG This study
Q67Cys_F CGACGTCCTCTGCCGCAAGGAGCAGTTCCGCCCG This study
Q67Cys_R GCTCCTTGCGGCAGAGGACGTCGGCGATCCGCAG This study
Trp105Cys_F GAGCTGGCTGTGCATCTTCGCCCCACGGGTGCAG This study
Trp105Cys_R GGGCGAAGATGCACAGCCAGCTCGGCACCTTCTG This study
Thr158Cys_F CAAGCCGATGTGCCTGTACGTGCGGATGACCTCC This study
Thr158Cys_R GCACGTACAGGCACATCGGCTTGCCGTCGACCGG This study
Ile176Cys_F GTTCGACCAGTGCGACGAAGCCGGCCTGGTCGGC This study
Ile176Cys_R CGGCTTCGTCGCACTGGTCGAACCAGGCCATCAG This study
W103A_F GGTGCCGAGCGCGCTGTGGATCTTCGCCCCACGG This study
W103A_R AGATCCACAGCGCGCTCGGCACCTTCTGCGCGGG This study
W105A_F GAGCTGGCTGGCGATCTTCGCCCCACGGGTGCAG This study
W105A_R GGGCGAAGATCGCCAGCCAGCTCGGCACCTTCTG This study
F107A_F GCTGTGGATCGCGGCCCCACGGGTGCAGTACCTG This study
81
F107A_R CCCGTGGGGCCGCGATCCACAGCCAGCTCGGCAC This study
RetSD115_F GCAGTACCTGGCCTACTACCTGGTGCAGGACGGC This study
RetSD115_R CCAGGTAGTAGGCCAGGTACTGCACCCGTGGGGC This study
RetS-Y91A-F CCTGGACTACGCCCTGGTGCAGGACGGCCAACTG This study
RetS-Y91A-R CCTGCACCAGGGCGTAGTCCAGGTACTGCACCCG This study
RetS-R136A-F CCTGTACGTGGCGATGACCTCCAACCATCCGCTG This study
RetS-R136A-R TGGAGGTCATCGCCACGTACAGGGTCATCGGCTTGCC This study
rsmZ-qPCR_F CGTACAGGGAACACGCAACCCCGA
This study
rsmZ-qPCR_R AAAAAGGGGCGGGGTATTACCCCG
This study
rpoD-realtimeF GGGCGAAGAAGAAATGGTC This study rpoD-realtimeR CAGGTGGCGTAGGTGGAGAA This study
82
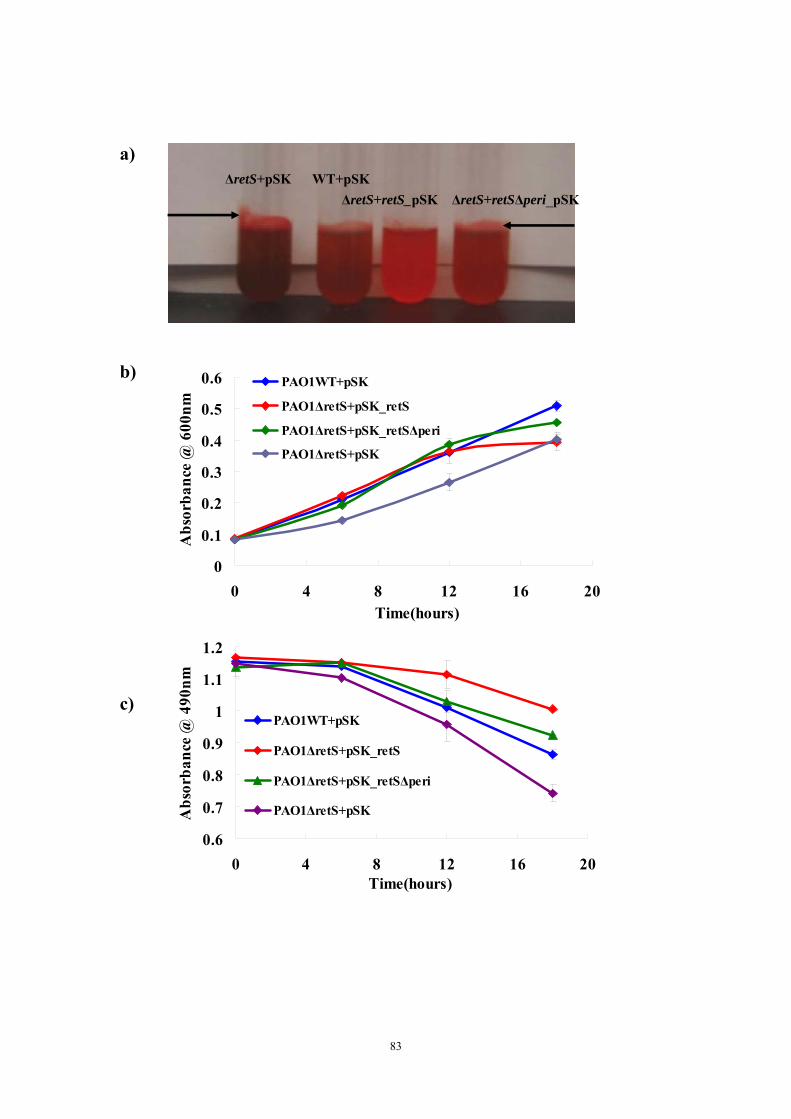
a) ΔretS+pSK WT+pSK
ΔretS+retS_pSK ΔretS+retSΔperi_pSK
b)
0
0.1
0.2
0.3
0.4
0.5
0.6
0 4 8 12 16 20Time(hours)
Abs
orba
nce
@ 6
00nm
PAO1WT+pSK
PAO1ΔretS+pSK_retS
PAO1ΔretS+pSK_retSΔperi
PAO1ΔretS+pSK
c)
0.6
0.7
0.8
0.9
1
1.1
1.2
0 4 8 12 16 20Time(hours)
Abs
orba
nce
@nm
490
PAO1WT+pSK
PAO1ΔretS+pSK_retS
PAO1ΔretS+pSK_retSΔperi
PAO1ΔretS+pSK
83
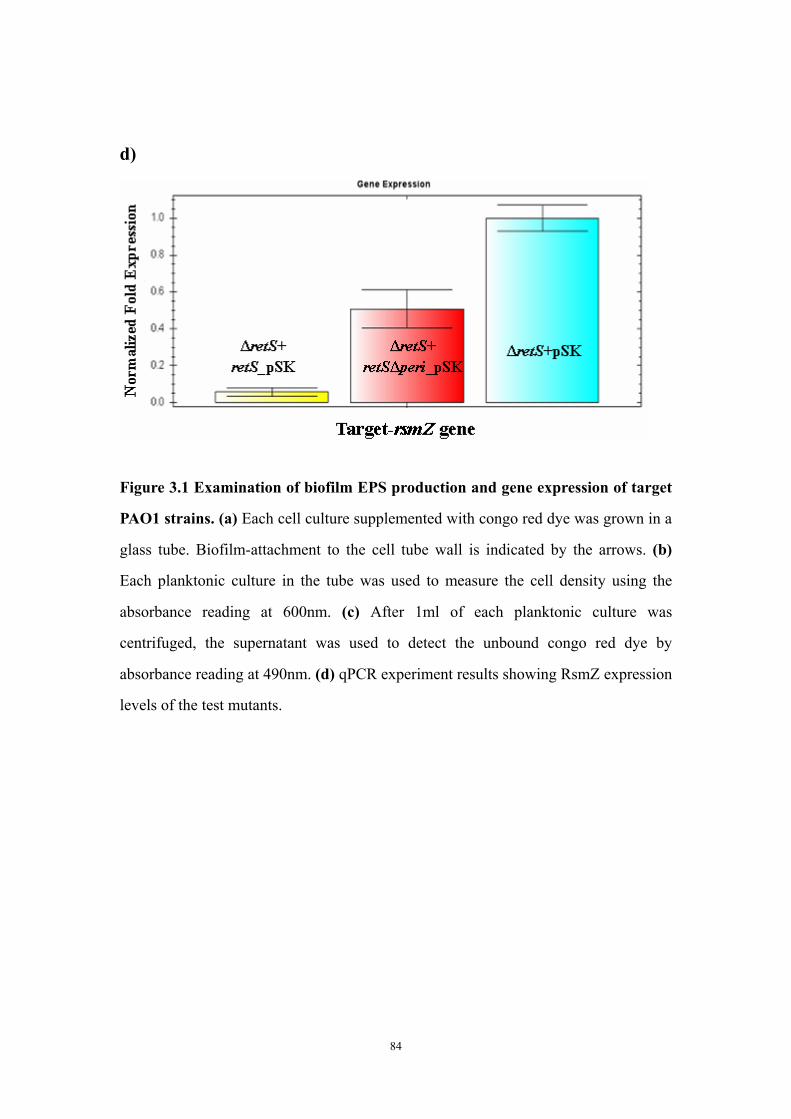
d)
Figure 3.1 Examination of biofilm EPS production and gene expression of target
PAO1 strains. (a) Each cell culture supplemented with congo red dye was grown in a
glass tube. Biofilm-attachment to the cell tube wall is indicated by the arrows. (b)
Each planktonic culture in the tube was used to measure the cell density using the
absorbance reading at 600nm. (c) After 1ml of each planktonic culture was
centrifuged, the supernatant was used to detect the unbound congo red dye by
absorbance reading at 490nm. (d) qPCR experiment results showing RsmZ expression
levels of the test mutants.
84
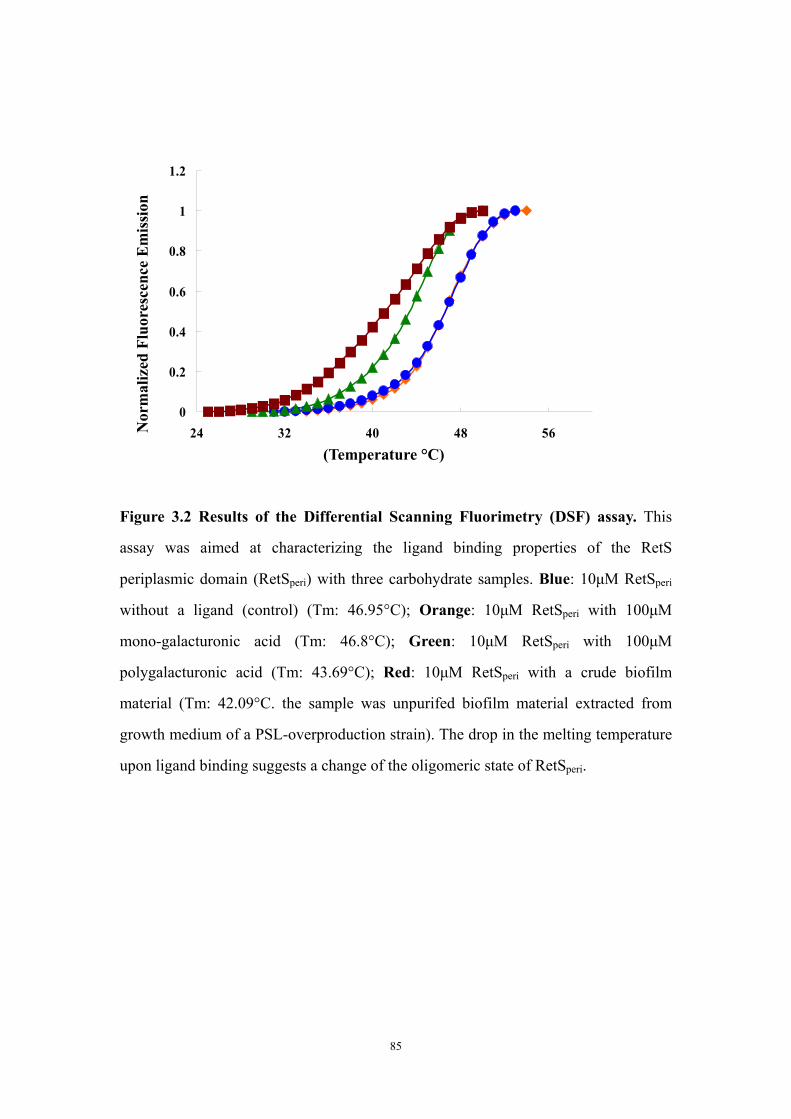
0
0.2
0.4
0.6
0.8
1
1.2
24 32 40 48 56(Temperature °C)
Nor
mal
ized
Flu
ores
cenc
e E
mis
sion
Figure 3.2 Results of the Differential Scanning Fluorimetry (DSF) assay. This
assay was aimed at characterizing the ligand binding properties of the RetS
periplasmic domain (RetSperi) with three carbohydrate samples. Blue: 10μM RetSperi
without a ligand (control) (Tm: 46.95°C); Orange: 10μM RetSperi with 100μM
mono-galacturonic acid (Tm: 46.8°C); Green: 10μM RetSperi with 100μM
polygalacturonic acid (Tm: 43.69°C); Red: 10μM RetSperi with a crude biofilm
material (Tm: 42.09°C. the sample was unpurifed biofilm material extracted from
growth medium of a PSL-overproduction strain). The drop in the melting temperature
upon ligand binding suggests a change of the oligomeric state of RetSperi.
85
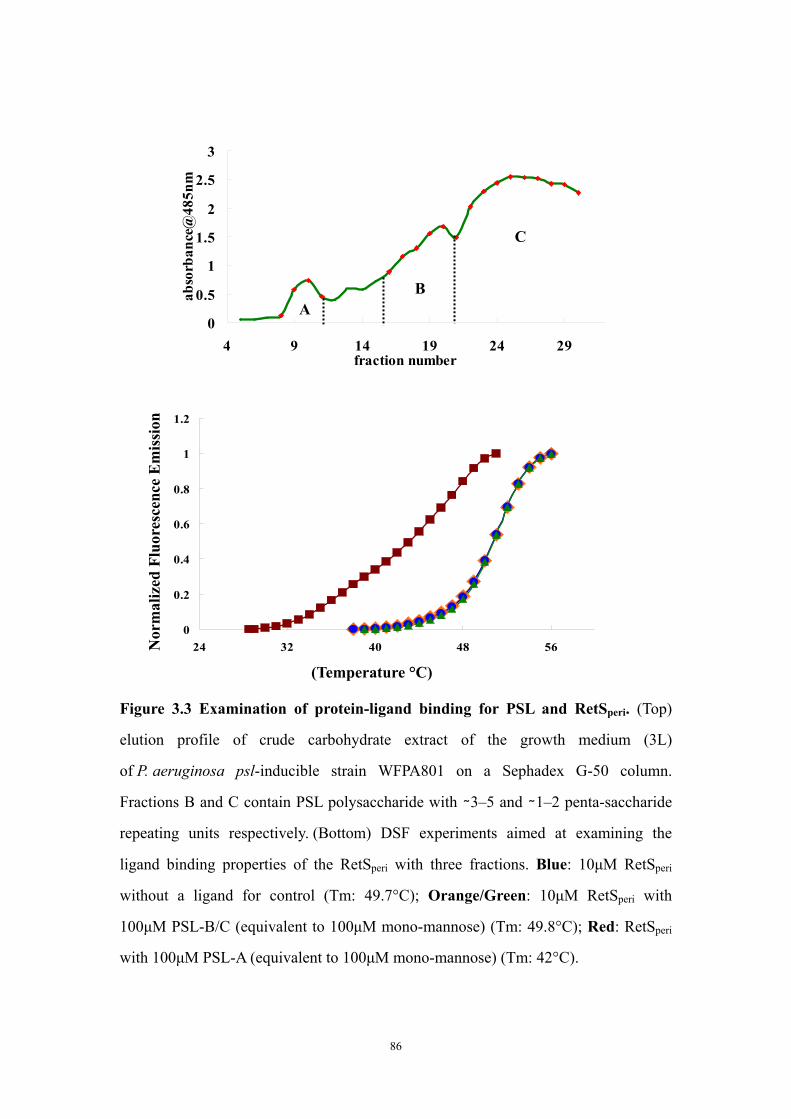
0
0.5
1
1.5
2
2.5
3
4 9 14 19 24 29fraction number
abso
rban
ce@
485n
m
C
BA
0
0.2
0.4
0.6
0.8
1
1.2
24 32 40 48 56
(Temperature °C)
Nor
mal
ized
Flu
ores
cenc
e E
mis
sion
Figure 3.3 Examination of protein-ligand binding for PSL and RetSperi. (Top)
elution profile of crude carbohydrate extract of the growth medium (3L)
of P. aeruginosa psl-inducible strain WFPA801 on a Sephadex G-50 column.
Fractions B and C contain PSL polysaccharide with ∼3–5 and ∼1–2 penta-saccharide
repeating units respectively. (Bottom) DSF experiments aimed at examining the
ligand binding properties of the RetSperi with three fractions. Blue: 10μM RetSperi
without a ligand for control (Tm: 49.7°C); Orange/Green: 10μM RetSperi with
100μM PSL-B/C (equivalent to 100μM mono-mannose) (Tm: 49.8°C); Red: RetSperi
with 100μM PSL-A (equivalent to 100μM mono-mannose) (Tm: 42°C).
86
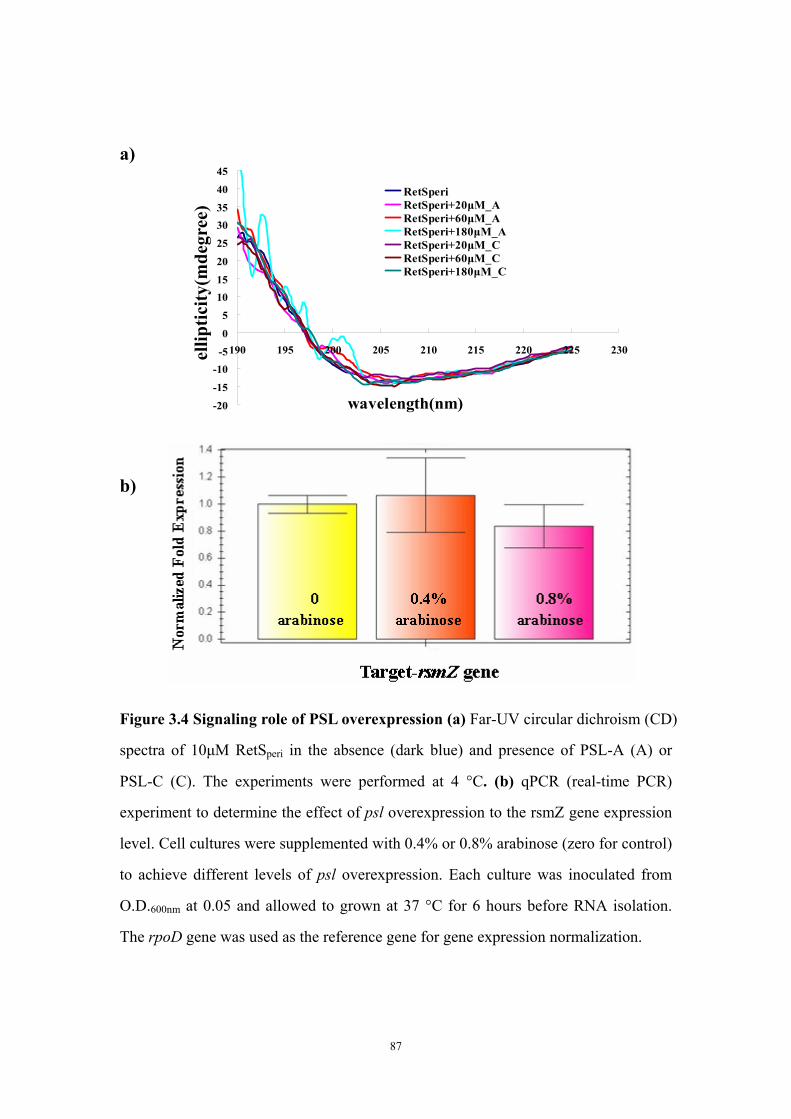
a)
-20
-15
-10-5
0
5
1015
20
25
3035
40
45
190 195 200 205 210 215 220 225 230
wavelength(nm)
mde
gree
RetSperiRetSperi+20μM_ARetSperi+60μM_ARetSperi+180μM_ARetSperi+20μM_CRetSperi+60μM_CRetSperi+180μM_C
ellip
ticity
(mde
gree
)
b)
Figure 3.4 Signaling role of PSL overexpression (a) Far-UV circular dichroism (CD)
spectra of 10μM RetSperi in the absence (dark blue) and presence of PSL-A (A) or
PSL-C (C). The experiments were performed at 4 °C. (b) qPCR (real-time PCR)
experiment to determine the effect of psl overexpression to the rsmZ gene expression
level. Cell cultures were supplemented with 0.4% or 0.8% arabinose (zero for control)
to achieve different levels of psl overexpression. Each culture was inoculated from
O.D.600nm at 0.05 and allowed to grown at 37 °C for 6 hours before RNA isolation.
The rpoD gene was used as the reference gene for gene expression normalization.
87
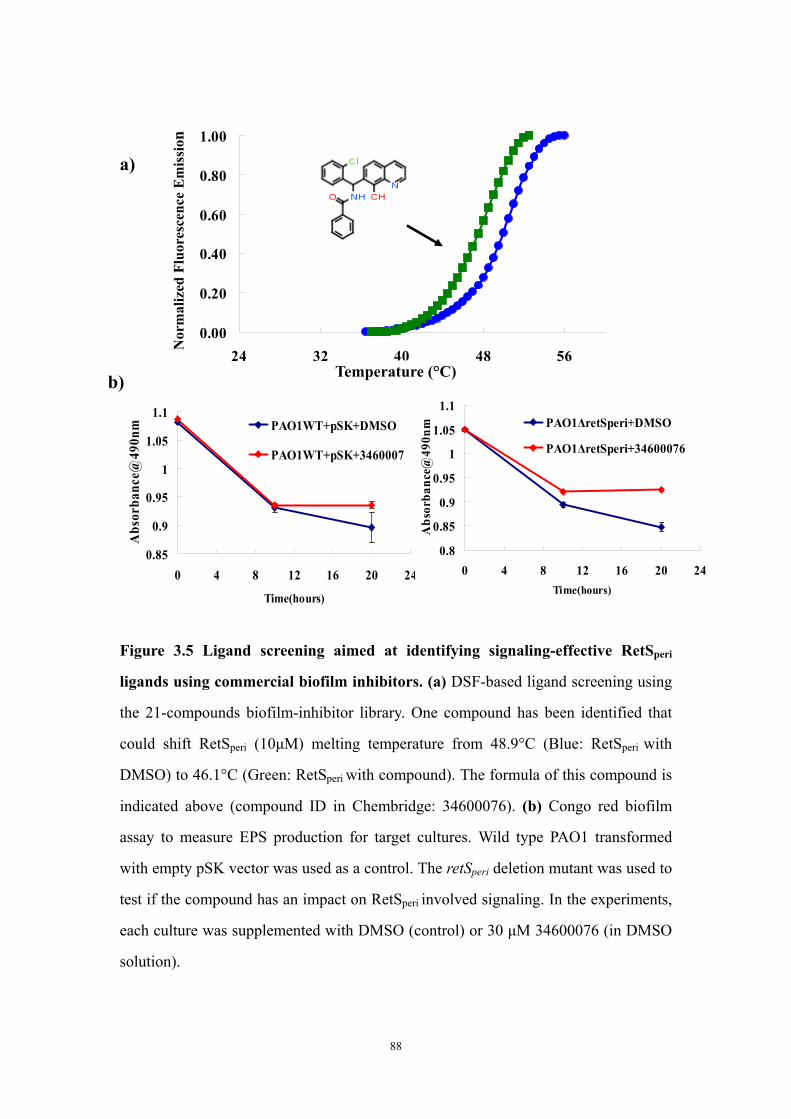
0.00
0.20
0.40
0.60
0.80
1.00
24 32 40 48 56
N
orm
aliz
ed F
luor
esce
nce
Em
issi
on
a)
Temperature (°C) b)
Figure 3.5 Ligand screening aimed at identifying signaling-effective RetSperi
ligands using commercial biofilm inhibitors. (a) DSF-based ligand screening using
the 21-compounds biofilm-inhibitor library. One compound has been identified that
could shift RetSperi (10μM) melting temperature from 48.9°C (Blue: RetSperi with
DMSO) to 46.1°C (Green: RetSperi with compound). The formula of this compound is
indicated above (compound ID in Chembridge: 34600076). (b) Congo red biofilm
assay to measure EPS production for target cultures. Wild type PAO1 transformed
with empty pSK vector was used as a control. The retSperi deletion mutant was used to
test if the compound has an impact on RetSperi involved signaling. In the experiments,
each culture was supplemented with DMSO (control) or 30 μM 34600076 (in DMSO
solution).
0.85
0.9
0.95
1
1.05
1.1
0 4 8 12 16 20
Time(hours)
Abs
orba
nce@
490n
24
0.8
0.85
0.9
0.95
1
1.05
1.1
0 4 8 12 16 20 24Time(hours)
Abs
orba
nce@
490n
m PAO1ΔretSperi+DMSO
PAO1ΔretSperi+34600076
PAO1WT+pSK+DMSOm
PAO1WT+pSK+3460007
88
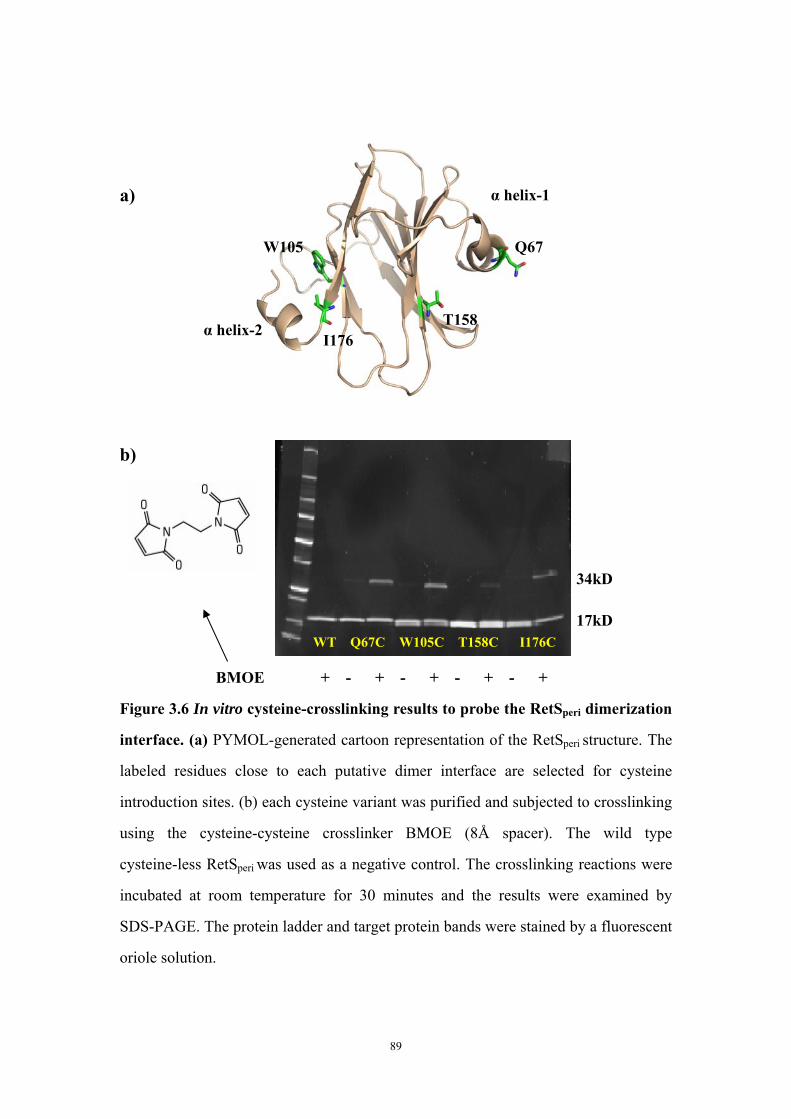
α helix-2
α helix-1
I176
W105
T158
Q67
a)
b)
17kD WT Q67C W105C T158C I176C
34kD
BMOE + - + - + - + - +
Figure 3.6 In vitro cysteine-crosslinking results to probe the RetSperi dimerization
interface. (a) PYMOL-generated cartoon representation of the RetSperi structure. The
labeled residues close to each putative dimer interface are selected for cysteine
introduction sites. (b) each cysteine variant was purified and subjected to crosslinking
using the cysteine-cysteine crosslinker BMOE (8Å spacer). The wild type
cysteine-less RetSperi was used as a negative control. The crosslinking reactions were
incubated at room temperature for 30 minutes and the results were examined by
SDS-PAGE. The protein ladder and target protein bands were stained by a fluorescent
oriole solution.
89
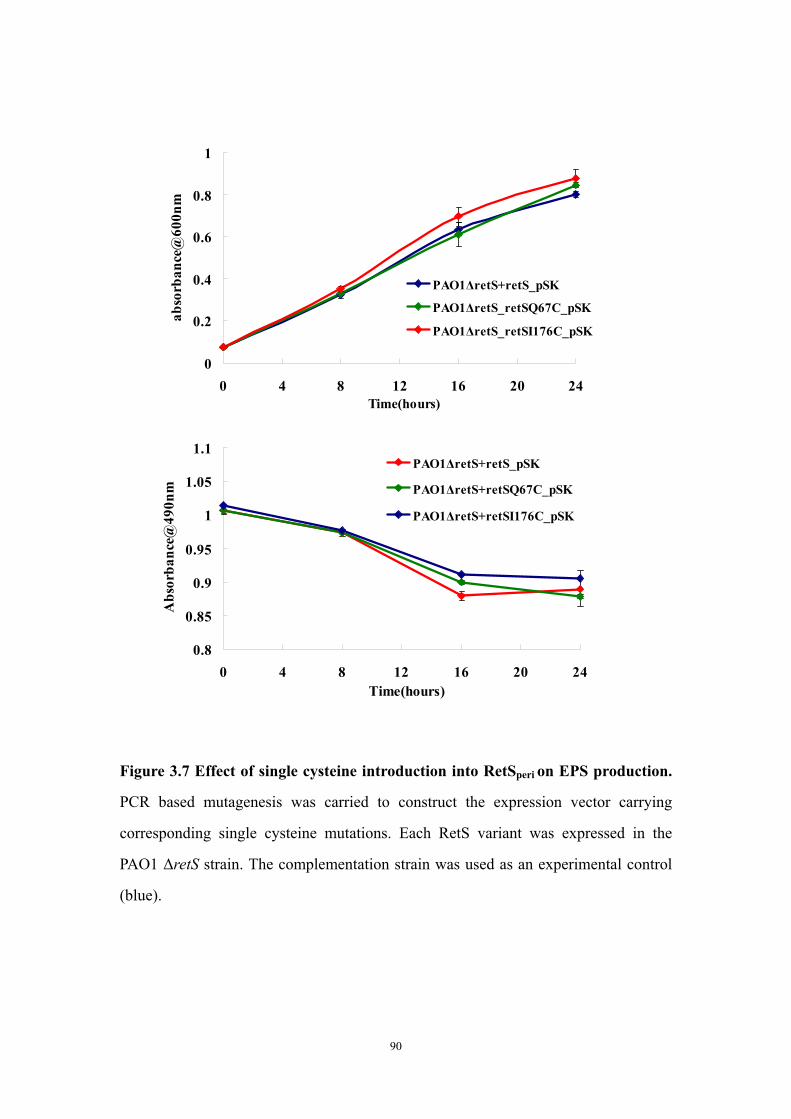
0
0.2
0.4
0.6
0.8
1
0 4 8 12 16 20 24Time(hours)
abso
rban
ce@
600n
m
PAO1ΔretS+retS_pSK
PAO1ΔretS_retSQ67C_pSK
PAO1ΔretS_retSI176C_pSK
0.8
0.85
0.9
0.95
1
1.05
1.1
0 4 8 12 16 20 2Time(hours)
Abs
orba
nce@
490n
m
4
PAO1ΔretS+retS_pSK
PAO1ΔretS+retSQ67C_pSK
PAO1ΔretS+retSI176C_pSK
Figure 3.7 Effect of single cysteine introduction into RetSperi on EPS production.
PCR based mutagenesis was carried to construct the expression vector carrying
corresponding single cysteine mutations. Each RetS variant was expressed in the
PAO1 ΔretS strain. The complementation strain was used as an experimental control
(blue).
90
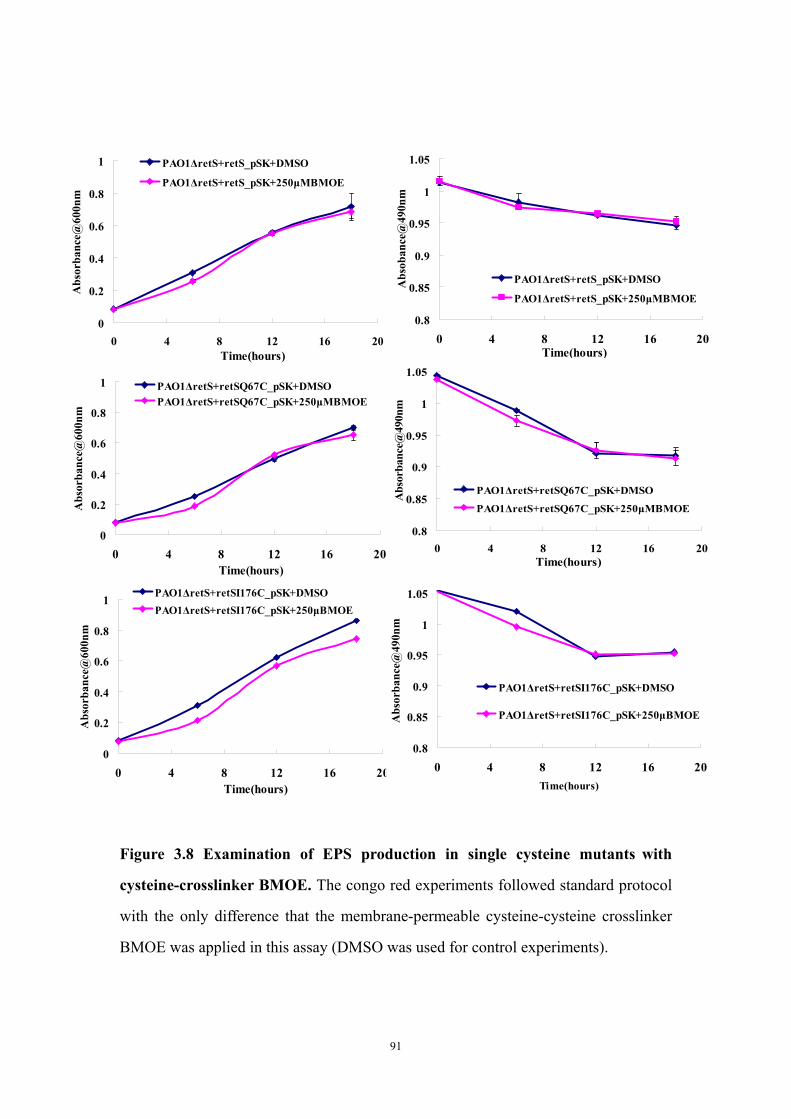
0
0.2
0.4
0.6
0.8
1
0 4 8 12 16 20Time(hours)
Abs
orba
nce@
600n
m
PAO1ΔretS+retS_pSK+DMSO
PAO1ΔretS+retS_pSK+250μMBMOE
0
0.2
0.4
0.6
0.8
1
0 4 8 12 16 2
91
Figure 3.8 Examination of EPS production in single cysteine mutants with
cysteine-crosslinker BMOE. The congo red experiments followed standard protocol
with the only difference that the membrane-permeable cysteine-cysteine crosslinker
BMOE was applied in this assay (DMSO was used for control experiments).
0
0.8
0.85
0.9
0.95
1
1.05
0 4 8 12 16 20Time(hours)
Abs
oban
ce@
490n
m
PAO1ΔretS+retS_pSK+DMSO
PAO1ΔretS+retS_pSK+250μMBMOE
1.05
Time(hours)
Abs
orba
nce@
600n
m
PAO1ΔretS+retSQ67C_pSK+DMSOPAO1ΔretS+retSQ67C_pSK+250μMBMOE
0.8
0.85
0.9
0.95
1
0 4 8 12 16 20Time(hours)
Abs
orba
nce@
490n
m
PAO1ΔretS+retSQ67C_pSK+DMSO
PAO1ΔretS+retSQ67C_pSK+250μMBMOE
0
0.2
0.4
0.6
0.8
1
0 4 8 12 16 20Time(hours)
Abs
orba
nce@
600n
m
PAO1ΔretS+retSI176C_pSK+DMSOPAO1ΔretS+retSI176C_pSK+250μBMOE
0.8
0.85
0.9
0.95
1
1.05
0 4 8 12 16 20Time(hours)
Abs
orba
nce@
490n
m
PAO1ΔretS+retSI176C_pSK+DMSO
PAO1ΔretS+retSI176C_pSK+250μBMOE
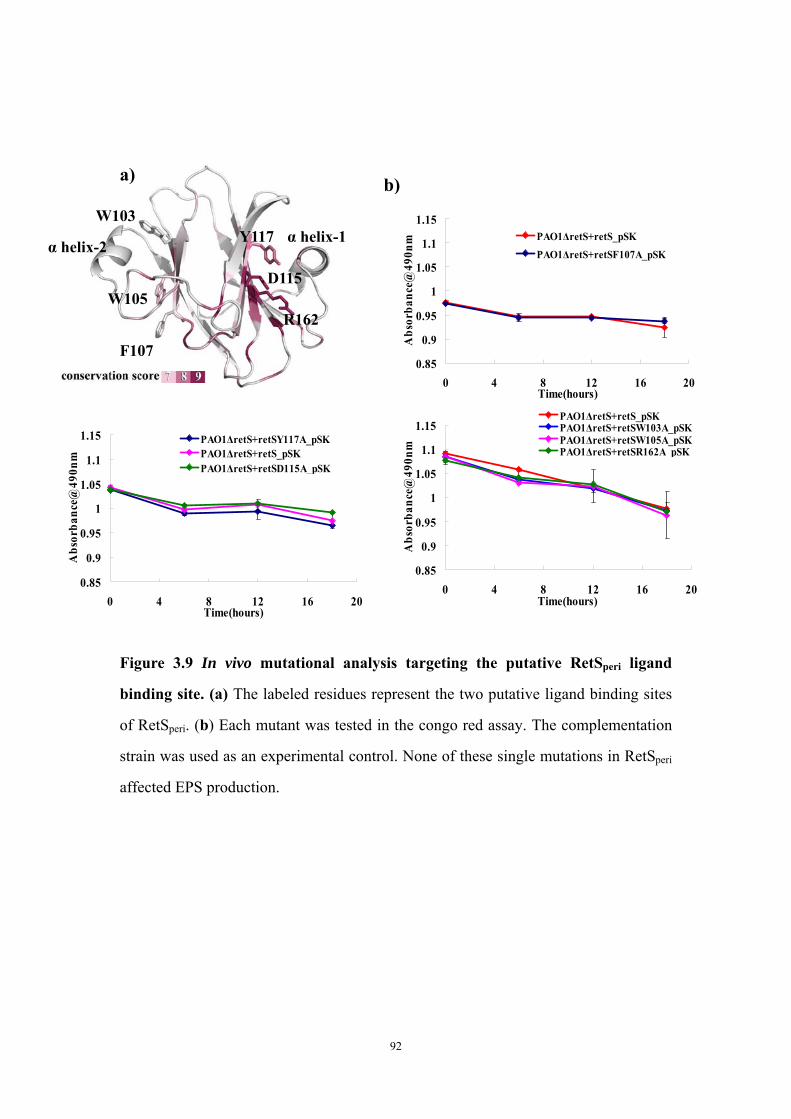
Figure 3.9 In vivo mutational analysis targeting the putative RetSperi ligand
binding site. (a) The labeled residues represent the two putative ligand binding sites
of RetSperi. (b) Each mutant was tested in the congo red assay. The complementation
strain was used as an experimental control. None of these single mutations in RetSperi
affected EPS production.
Y117
α helix-1
W105
F107
W103
a) b)
D115 R162
α helix-2
0.85
0.9
0.95
1
1.05
1.1
1.15
0 4 8 12 16 20Time(hours)
Abs
orba
nce@
490n
m PAO1ΔretS+retS_pSK
PAO1ΔretS+retSF107A_pSK
0.85
0.9
0.95
1
1.05
1.1
1.15
0 4 8 12 16Time(hours)
Abs
orba
nce@
490n
m
20
PAO1ΔretS+retSY117A_pSKPAO1ΔretS+retS_pSKPAO1ΔretS+retSD115A_pSK
0.85
0.9
0.95
1
1.05
1.1
1.15
0 4 8 12 16 20Time(hours)
Abs
orba
nce@
490n
mPAO1ΔretS+retS_pSKPAO1ΔretS+retSW103A_pSKPAO1ΔretS+retSW105A_pSKPAO1ΔretS+retSR162A_pSK
92

Chapter Four
Study the Functional Role of Cytoplasmic Domains
of RetS in Biofilm Formation
93
ABSTRACT
The current model for RetS-GacS signaling in P. aeruginosa posits that RetS
does not utilize the conserved two component system (TCS) signaling mechanism to
inhibit GacS induced biofilm formation. Instead, RetS is though to form a 1:1 protein
complex with GacS, thereby blocking autophosphorylation of the latter protein.
Expanding this model, we proposed that ligand binding disrupts the
homo-dimerization of RetSperi to assist RetS-GacS hetero-dimerization. However, this
RetS-GacS signaling mechanism has never been identified or described in any other
two component systems. Moreover, our previous study targeting RetSperi does not
support the current hypothesis. Therefore, to uncover the cellular signaling
mechanism for RetS, we exmained the cytoplasmic domains of RetS in this chapter to
reveal the specific functional role of RetS-GacS complex formation in biofilm
formation. Specifically, we sought to determine if the histidine and aspartate residues
of RetS that would normally be associated with autophosphorylation and phosphate
transfer in signaling kinases are required for EPS production regulation. Moreover, we
will attempt to characterize the interaction between RetS and GacS kinase domains in
vitro with the aim to uncover the structural basis for RetS-GacS signaling.
94
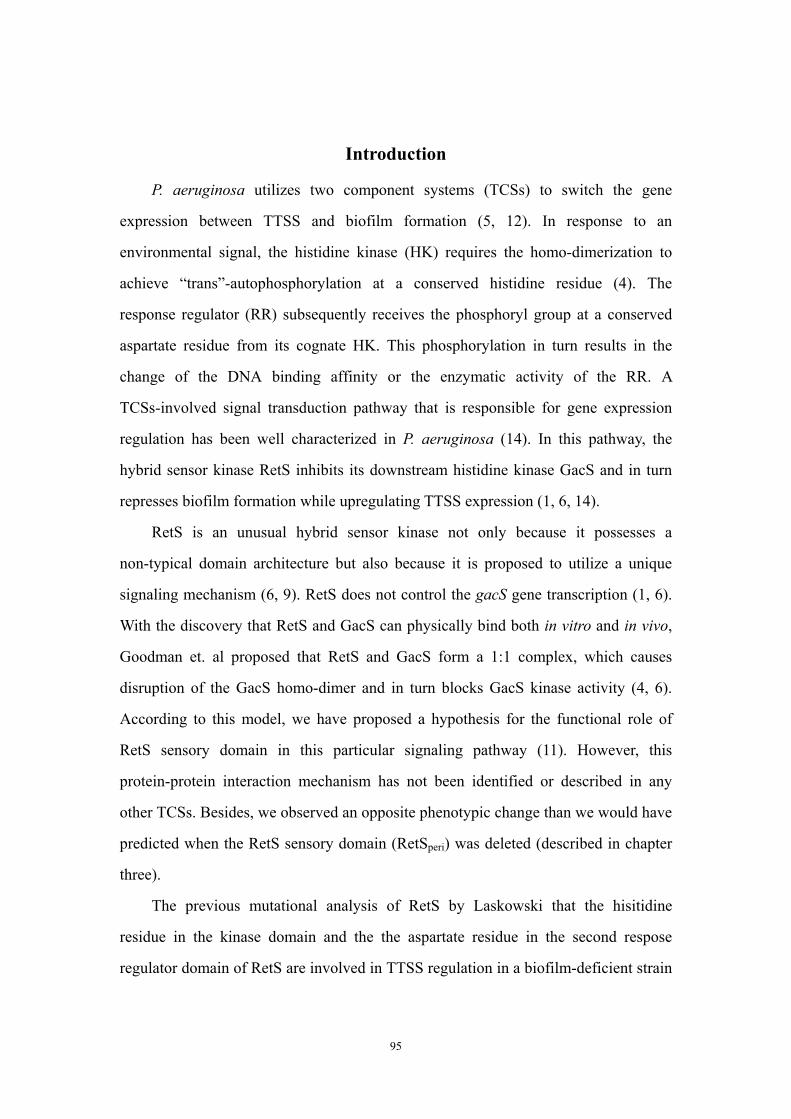
Introduction
P. aeruginosa utilizes two component systems (TCSs) to switch the gene
expression between TTSS and biofilm formation (5, 12). In response to an
environmental signal, the histidine kinase (HK) requires the homo-dimerization to
achieve “trans”-autophosphorylation at a conserved histidine residue (4). The
response regulator (RR) subsequently receives the phosphoryl group at a conserved
aspartate residue from its cognate HK. This phosphorylation in turn results in the
change of the DNA binding affinity or the enzymatic activity of the RR. A
TCSs-involved signal transduction pathway that is responsible for gene expression
regulation has been well characterized in P. aeruginosa (14). In this pathway, the
hybrid sensor kinase RetS inhibits its downstream histidine kinase GacS and in turn
represses biofilm formation while upregulating TTSS expression (1, 6, 14).
RetS is an unusual hybrid sensor kinase not only because it possesses a
non-typical domain architecture but also because it is proposed to utilize a unique
signaling mechanism (6, 9). RetS does not control the gacS gene transcription (1, 6).
With the discovery that RetS and GacS can physically bind both in vitro and in vivo,
Goodman et. al proposed that RetS and GacS form a 1:1 complex, which causes
disruption of the GacS homo-dimer and in turn blocks GacS kinase activity (4, 6).
According to this model, we have proposed a hypothesis for the functional role of
RetS sensory domain in this particular signaling pathway (11). However, this
protein-protein interaction mechanism has not been identified or described in any
other TCSs. Besides, we observed an opposite phenotypic change than we would have
predicted when the RetS sensory domain (RetSperi) was deleted (described in chapter
three).
The previous mutational analysis of RetS by Laskowski that the hisitidine
residue in the kinase domain and the the aspartate residue in the second respose
regulator domain of RetS are involved in TTSS regulation in a biofilm-deficient strain
95

PA103 (10). On the other hand, Goodman has shown that the conserved phosphorelay
residues in RetS do not affect the expression of the small regulatory RNA RsmZ,
which is part of RetS/GacS signaling pathway and favors biofilm gene expression (6).
To further probe the signaling mechanism, we assessed the functional role of the RetS
intrinsic phosphorelay activity in the regulation of the biofilm phenotype, such as
exopolysaccharide production (9, 15). To this end, we applied mutational analysis
targeting the conserved histidine residue and aspartate residues in the HK and RR
domains respectively combined with a biofilm functional assay in this study.
Interestingly, only the single mutation on the conserved histidine residue in the RetS
HK domain causes a moderate increase of biofilm EPS production. With the fact that
RetS is able to inhibit GacS phosphorylation and dephosphorylate phosphorylated
GacS (GacS-P) (6), we propose an alternative hypothesis for RetS-GacS signaling:
RetS kinase domain acts as a phosphatase to dephosphorylate GacS-P and thus blocks
GacS kinase activity. To test this hypothesis, targeting the putative phosphatase
activity of RetS kinase domain, a mutational analysis has been carried out in this
study (4).
Finally, the stoichiometry of the RetS-GacS complex is an important piece of
information for understanding RetS-GacS signaling. It has been demonstrated that
RetS HK domain is sufficient for RetS-GacS interaction and inhibition of GacS
phosphorylation. Therefore, we seek to determine the complex structure of RetS and
GacS kinase domains with the aim to uncover the molecular basis for signaling
mechanism between RetS and GacS.
96
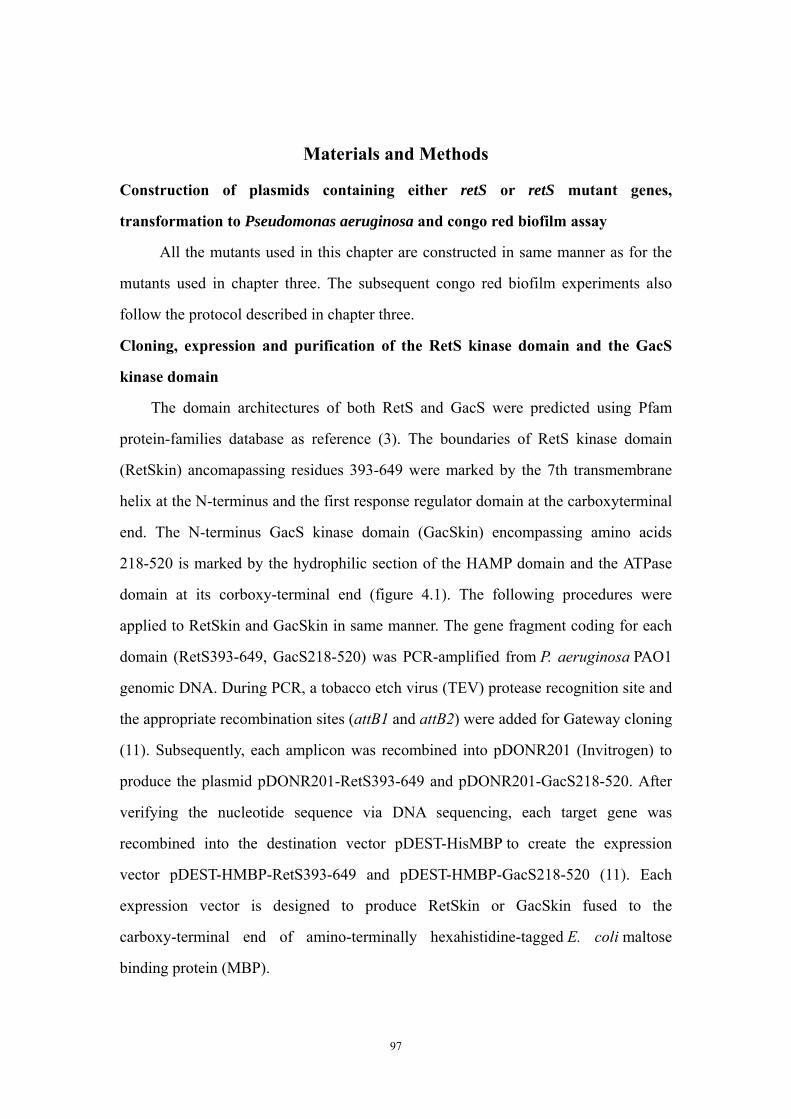
Materials and Methods
Construction of plasmids containing either retS or retS mutant genes,
transformation to Pseudomonas aeruginosa and congo red biofilm assay
All the mutants used in this chapter are constructed in same manner as for the
mutants used in chapter three. The subsequent congo red biofilm experiments also
follow the protocol described in chapter three.
Cloning, expression and purification of the RetS kinase domain and the GacS
kinase domain
The domain architectures of both RetS and GacS were predicted using Pfam
protein-families database as reference (3). The boundaries of RetS kinase domain
(RetSkin) ancomapassing residues 393-649 were marked by the 7th transmembrane
helix at the N-terminus and the first response regulator domain at the carboxyterminal
end. The N-terminus GacS kinase domain (GacSkin) encompassing amino acids
218-520 is marked by the hydrophilic section of the HAMP domain and the ATPase
domain at its corboxy-terminal end (figure 4.1). The following procedures were
applied to RetSkin and GacSkin in same manner. The gene fragment coding for each
domain (RetS393-649, GacS218-520) was PCR-amplified from P. aeruginosa PAO1
genomic DNA. During PCR, a tobacco etch virus (TEV) protease recognition site and
the appropriate recombination sites (attB1 and attB2) were added for Gateway cloning
(11). Subsequently, each amplicon was recombined into pDONR201 (Invitrogen) to
produce the plasmid pDONR201-RetS393-649 and pDONR201-GacS218-520. After
verifying the nucleotide sequence via DNA sequencing, each target gene was
recombined into the destination vector pDEST-HisMBP to create the expression
vector pDEST-HMBP-RetS393-649 and pDEST-HMBP-GacS218-520 (11). Each
expression vector is designed to produce RetSkin or GacSkin fused to the
carboxy-terminal end of amino-terminally hexahistidine-tagged E. coli maltose
binding protein (MBP).
97
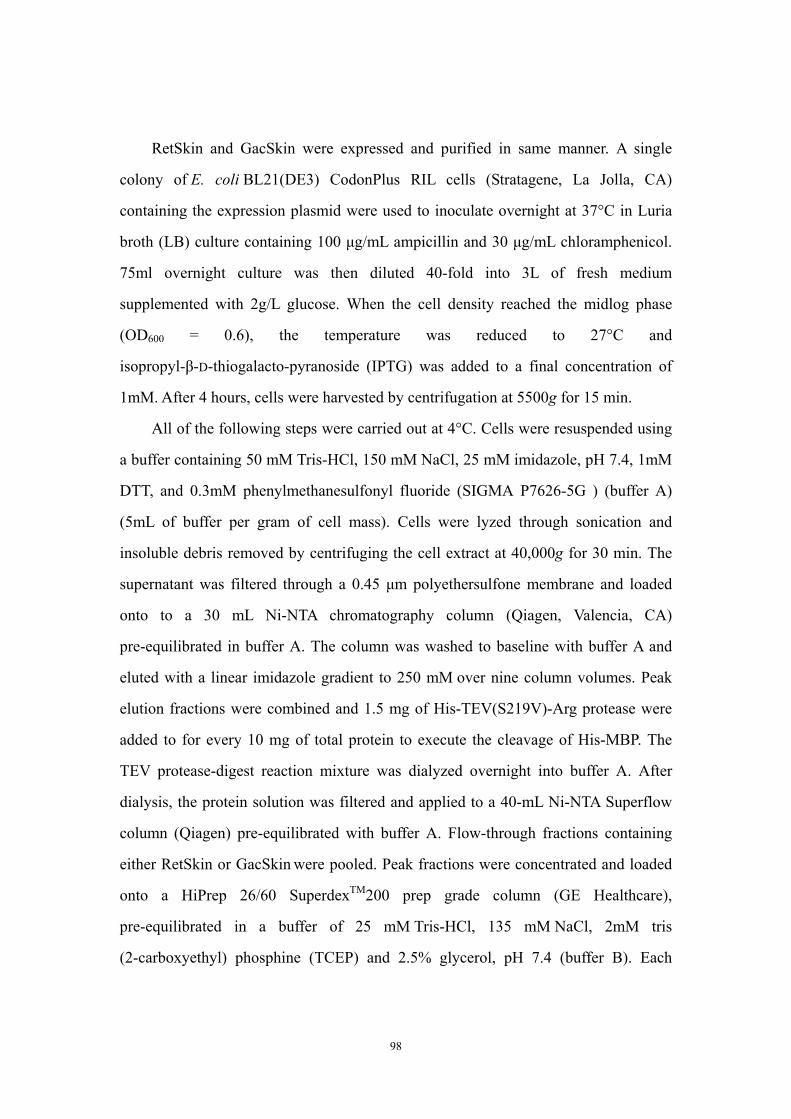
RetSkin and GacSkin were expressed and purified in same manner. A single
colony of E. coli BL21(DE3) CodonPlus RIL cells (Stratagene, La Jolla, CA)
containing the expression plasmid were used to inoculate overnight at 37°C in Luria
broth (LB) culture containing 100 μg/mL ampicillin and 30 μg/mL chloramphenicol.
75ml overnight culture was then diluted 40-fold into 3L of fresh medium
supplemented with 2g/L glucose. When the cell density reached the midlog phase
(OD600 = 0.6), the temperature was reduced to 27°C and
isopropyl-β-D-thiogalacto-pyranoside (IPTG) was added to a final concentration of
1mM. After 4 hours, cells were harvested by centrifugation at 5500g for 15 min.
All of the following steps were carried out at 4°C. Cells were resuspended using
a buffer containing 50 mM Tris-HCl, 150 mM NaCl, 25 mM imidazole, pH 7.4, 1mM
DTT, and 0.3mM phenylmethanesulfonyl fluoride (SIGMA P7626-5G ) (buffer A)
(5mL of buffer per gram of cell mass). Cells were lyzed through sonication and
insoluble debris removed by centrifuging the cell extract at 40,000g for 30 min. The
supernatant was filtered through a 0.45 μm polyethersulfone membrane and loaded
onto to a 30 mL Ni-NTA chromatography column (Qiagen, Valencia, CA)
pre-equilibrated in buffer A. The column was washed to baseline with buffer A and
eluted with a linear imidazole gradient to 250 mM over nine column volumes. Peak
elution fractions were combined and 1.5 mg of His-TEV(S219V)-Arg protease were
added to for every 10 mg of total protein to execute the cleavage of His-MBP. The
TEV protease-digest reaction mixture was dialyzed overnight into buffer A. After
dialysis, the protein solution was filtered and applied to a 40-mL Ni-NTA Superflow
column (Qiagen) pre-equilibrated with buffer A. Flow-through fractions containing
either RetSkin or GacSkin were pooled. Peak fractions were concentrated and loaded
onto a HiPrep 26/60 SuperdexTM200 prep grade column (GE Healthcare),
pre-equilibrated in a buffer of 25 mM Tris-HCl, 135 mM NaCl, 2mM tris
(2-carboxyethyl) phosphine (TCEP) and 2.5% glycerol, pH 7.4 (buffer B). Each
98
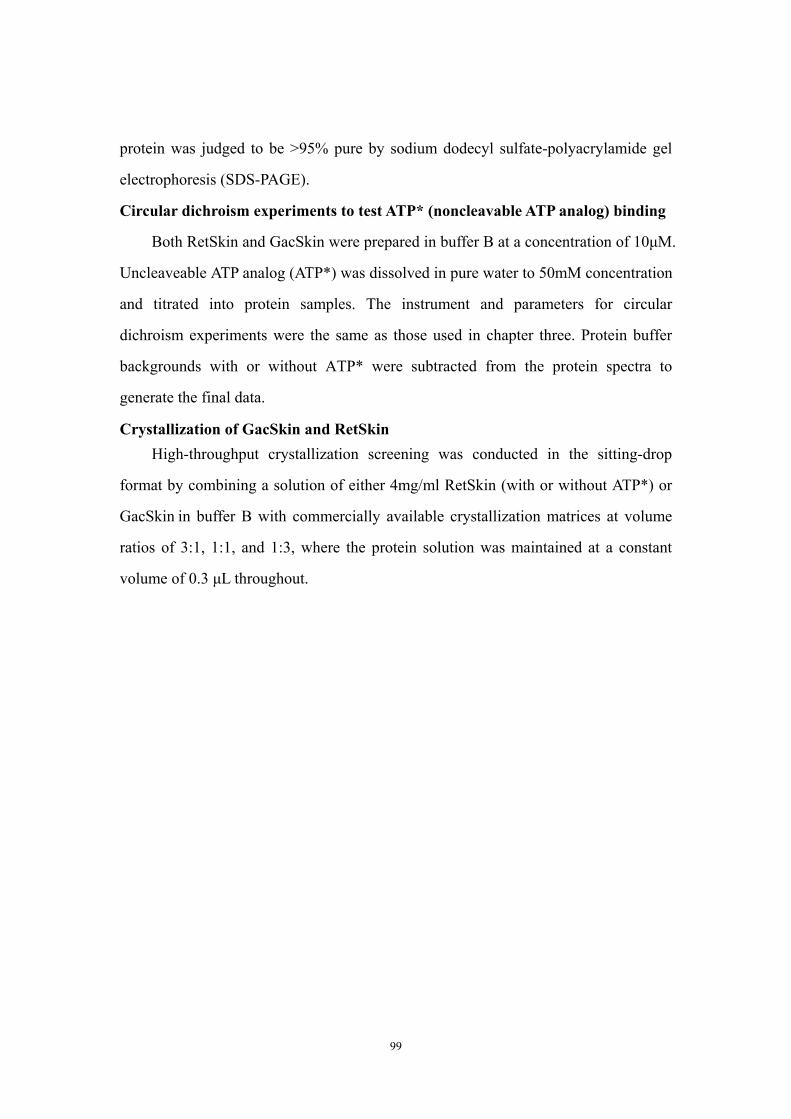
protein was judged to be >95% pure by sodium dodecyl sulfate-polyacrylamide gel
electrophoresis (SDS-PAGE).
Circular dichroism experiments to test ATP* (noncleavable ATP analog) binding
Both RetSkin and GacSkin were prepared in buffer B at a concentration of 10μM.
Uncleaveable ATP analog (ATP*) was dissolved in pure water to 50mM concentration
and titrated into protein samples. The instrument and parameters for circular
dichroism experiments were the same as those used in chapter three. Protein buffer
backgrounds with or without ATP* were subtracted from the protein spectra to
generate the final data.
Crystallization of GacSkin and RetSkin High-throughput crystallization screening was conducted in the sitting-drop
format by combining a solution of either 4mg/ml RetSkin (with or without ATP*) or
GacSkin in buffer B with commercially available crystallization matrices at volume
ratios of 3:1, 1:1, and 1:3, where the protein solution was maintained at a constant
volume of 0.3 μL throughout.
99

Results and Discussion
The conserved aspartate residues of the RetS response regulator domains are not
required for regulating EPS production in PAO1
Mutational analysis in conjunction with the biofilm congo red assay was utilized
to assess the functional role of the conserved phosphorelay residues of RetS in biofilm
formation regulation. Targeting the conserved histidine residue (His424) in the HK
domain and aspartate residues (Asp713, Asp715, Asp858) in two RR domains, single
alanine mutations were introduced into the retS gene (6). Corresponding RetS variants
were expressed in PAO1∆retS in same way as as described in chapter three for wild
type RetS. In the subsequently performed congo red biofilm assays was none of the
aspartate mutants showed a difference in EPS production compared to the mutant
strain complemented with wild-type retS (figure 4.2). This result is consistent with the
previous study by Goodman showing that mutations on these aspartates did not affect
RsmZ expression level in the PAK strain (6). The H424A mutation in the HK domain,
on the other hand, caused a slight higher rate of EPS production compared to that of
the complementation strain (figure 4.2). This phenotype change is unlikely due to the
change of RetS intrinsic phosphorelay activity because the mutations on RR domains
do not impact biofilm EPS production. Therefore, this increased EPS production
phenotype might be caused by the intrinsic phophatase activity of the HK domain in
RetS (4).
Is the phosphatase motif of the RetS kinase domain involved in the regulation of
EPS production?
Previous studies have indicated that RetS may not only prevent GacS
autophosphorylation but also actively dephosphorylate already phosphorylated GacS
(6). Therefore, one potential explanation for the phenotype of the H424A mutant is
that this mutation affects the intrinsic phosphatase activity of the HK in RetS (4).
Sequence analysis indicates that the RetS kinase domain is a member of the HisKA
100
subfamily, which is one of the five HK families of sensor kinases, and this HiskA
subfamily is characterized by a conserved HE/DXXT/N motif (7). The threonine
residue (Thr) has been demonstrated to play an essential role in the phosphatase
activity of EnvZ, a histidine kinase in E. coli (2). Therefore, to test our hypothesis we
mutated corresponding Thr (T428) in RetS and examined effect of this mutation on
biofilm formation regulation. To this end the RetS-T428A was expressed in
PAO1ΔretS mutant followed by congo red biofilm assay. As shown by figure 4.2c,
similar to the H424A mutant, the T428A mutant also exhibits a higher rate of EPS
production phenotype compared to that of the complementation strain.
This result implies that RetS kinase domain possesses phosphatase activity which
has a functional role in EPS production regulation. This result suggests an alternative
possibility for the functional role of RetS-GacS binding that it does not block GacS
auto-transphosphorylation, but dephosphorylates GacS. This hypothesis is supported
by Goodman’s data showing that RetS can reduce the phosphorylation level of
phosphorylated GacS (GacS-P) (6).We seek to characterize the RetS-GacS interaction
with the aim to uncover the molecular basis for RetS-GacS signaling mechanism. It
has been demonstrated that the kinase domain of RetS (RetSkin) is sufficient to bind
GacSkin and dephosphorylate GacS-P (6). So for subsequent studies, we target to
RetSkin and GacSkin, instead of all cytoplasmic domains of these two proteins.
Both purified RetSkin and GacSkin can bind ATP*
Both RetSkin and GacSkin proteins have been successfully purified. As shown
by figure 4.1, each construct contains intact ATPase domain and coil-coil region (4, 6).
GacSkin also contains part of the HAMP domain. In order to determine if the
purification products are properly folded and functional, we examined the ATP
binding capability of purified RetSkin and GacSkin. To this end, circular dichroism
experiments were applied for protein-ligand binding study. As indicated by figure 4.3,
both RetSkin and GacSkin could bind noncleabable ATP (ATP)*. This result also
101
implies that the absence of a detectable kinase activity of RetS might be due to the
deficiency of the ATP hydrolysis but not the ATP binding capability.
Crystallization of RetSkin with and without ATP*
To directly decipher the molecular basis for RetS-GacS signaling, we seek to
determine the RetSkin-GacSkin complex structure, which will provide exact
information for RetS-GacS interaction pattern. To use end, crystallization and
crystallography strategy was applied. Preliminary crystals for both RetSkin with and
without ATP* were obtained from condition F7 of the IndexHT screen (Hampton
Research). Hit optimization was carried out using the hanging drop vapor diffusion
method at room temperature (23°C) (figure 4.4). In the optimized conditions crystals
for RetSkin was obtained from drops containing a 3:1 mixture (protein: precipitant) of
10.5 mg/mL protein in buffer B and a crystallization solution composed of
0.2M ammonium sulfate, 0.1M Bis-Tris (pH 6.54) and 25% w/v polyethylene glycol
3350 (figure 4.4).
Conclusion and discussion
The single mutation on the HE/DXXT/N motif causes decreased biofilm EPS
production. This result indicates that the potential phosphatase activity of RetS kinase
domain might be involved in biofilm formation regulation in P. aeruginosa. Most
histidine kinases possess both kinase and phosphatase activities. Lacking a detectable
kinase activity, RetS kinase domain might exclusively acts as a phosphatase. We have
shown in chapter three that deletion of the homo-dimerization domain RetSperi, which
potentially weakens the RetS homo-dimerization, resulted in increased biofilm EPS
production. Hence, it does not support the previous hypothesis that RetSperi regulates
hetero-dimerization between RetS and GacS. Instead, an alternative possibility is that
RetSperi controls the potential phosphatase activity of RetSkin via sensing
environmental signals. We offer an alternative hypothesis for molecular basis of
RetS-GacS signaling: RetS-GacS is a hetero-tetramer, which causes
102
desphophorylation of phosphorylated GacS via a novel mechanism.
Finally, the structure determination for individual RetSkin and GacSkin as well
as the RetSkin-GacSkin complex will help us to uncover the mechanism, whereby
RetS inhibits the activity of GacS and downstream GacS/GacA signaling.
Acknowledgements
I like to thank the graduate student Jordan Mancl who has been assisting in the
RetSkin crystallization optimization. I also want to thank Dr. Webster Santos for
kindly allowing us to use the circular dichroism instrument in his lab.
103
References 1. Andrew L. Goodman, Bridget Kulasekara, Arne Rietsch, Dana Boyd, Roger S.
Smith, and Stephen Lory. 2004. A Signaling Network Reciprocally Regulates Genes Associated with Acute Infection and Chronic Persistence in Pseudomonas aeruginosa. Developmental Cell. 7:745–754.
2. Dutta R, Yoshida T, Inouye M. 2000. The Critical Role of the Conserved Thr247 Residue in the Functioning of the Osmosensor EnvZ, a Histidine Kinase/Phosphatase, in Escherichia coli J Biol Chem. 275:38645-53.
3. Finn RD, Mistry J, Tate J, Coggill P, Heger A, Pollington JE, Gavin OL, Gunasekaran P, Ceric G, Forslund K, Holm L, Sonnhammer EL, Eddy SR, Bateman A. 2010. The Pfam protein families database. Nucleic Acids Res. 8:211-22.
4. Gao R, Stock AM 2009. Biological insights from structures of two-component proteins. Annu Rev Microbiol. 63:133-54.
5. Gooderham WJ, Hancock RE. 2009. Regulation of virulence and antibiotic resistance by two-component regulatory systems in Pseudomonas aeruginosa. FEMS Microbiol Rev. 33:279-94.
6. Goodman AL, Merighi M, Hyodo M, Ventre I, Filloux A, Lory S. 2009. Direct interaction between sensor kinase proteins mediates acute and chronic disease phenotypes in a bacterial pathogen. Genes Dev. 23:249-59.
7. Huynh TN, Noriega CE, Stewart V. 2010. Conserved mechanism for sensor phosphatase control of two-component signaling revealed in the nitrate sensor NarX. Proc Natl Acad Sci U S A. 107:21140-5.
8. Jing X, Jaw J, Robinson HH, Schubot FD. 2010. Crystal structure and oligomeric state of the RetS signaling kinase sensory domain. Proteins. 78:1631-40.
9. Ma L-Y, Jackson K, Landry RM, Parsek MR, Wozniak DJ. 2006. Analysis of Pseudomonas aeruginosa conditional Psl variants reveals roles for the Psl polysaccharide in adhesion and maintaining biofilm structure postattachment. J Bacteriol. 188:8213–8221.
10. Michelle A. Laskowski, and Barbara I. Kazmierczak. 2006. Mutational Analysis of RetS, an Unusual Sensor Kinase-Response Regulator Hybrid Required for Pseudomonas aeruginosa Virulence. INFECTION AND IMMUNITY. 74:4462–4473
11. Nallamsetty S, Austin BP, Penrose KJ, Waugh DS. 2005. Gateway vectors for the production of combinatorially-tagged His6-MBP fusion proteins in the cytoplasm and periplasm of Escherichia coli. Protein Sci. 14:2964–2971.
12. Rodrigue, A., Quentin, Y., Lazdunski, A., Mejean, V., and Foglino, M. 2000. Two-component systems in Pseudomonas aeruginosa: why so many? Trends Microbiol. 8:498–504.
104
13. Shawn Lewenza, et. al. 2005. Construction of a mini-Tn5-luxCDABE mutant library in Pseudomonas aeruginosa PAO1: A toll for identifying differentially regulated genes. Genome Research. 15:583-589.
14. Ventre I, Goodman AL, Vallet-Gely I, Vasseur P, Soscia C, Molin S, Bleves S, Lazdunski A, Lory S, Filloux A. 2006. Multiple sensors control reciprocal expression of Pseudomonas aeruginosa regulatory RNA and virulence genes. Proc Natl Acad Sci U S A. 103:171-6.
15. Wozniak DJ, Wyckoff TJ, Starkey M, Keyser R, Azadi P, O'Toole GA, Parsek MR. 2003. Alginate is not a significant component of the extracellular polysaccharide matrix of PA14 and PAO1 Pseudomonas aeruginosa biofilms. Proc Natl Acad Sci U S A. 100:7907-12.
105
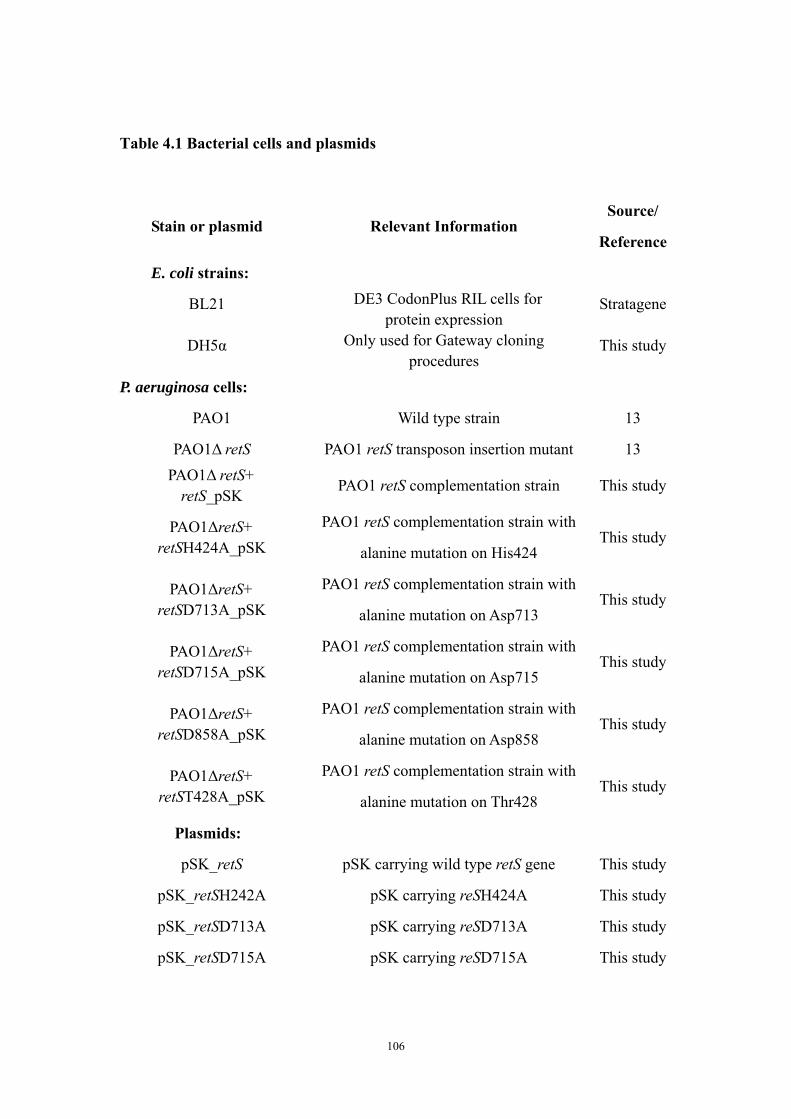
Table 4.1 Bacterial cells and plasmids
Stain or plasmid Relevant Information Source/
Reference
E. coli strains:
BL21 DE3 CodonPlus RIL cells for protein expression
Stratagene
DH5α Only used for Gateway cloning procedures
This study
P. aeruginosa cells:
PAO1 Wild type strain 13
PAO1Δ retS PAO1 retS transposon insertion mutant 13 PAO1Δ retS+
retS_pSK PAO1 retS complementation strain This study
PAO1ΔretS+ retSH424A_pSK
PAO1 retS complementation strain with
alanine mutation on His424 This study
PAO1ΔretS+ retSD713A_pSK
PAO1 retS complementation strain with
alanine mutation on Asp713 This study
PAO1ΔretS+ retSD715A_pSK
PAO1 retS complementation strain with
alanine mutation on Asp715 This study
PAO1ΔretS+ retSD858A_pSK
PAO1 retS complementation strain with
alanine mutation on Asp858 This study
PAO1ΔretS+ retST428A_pSK
PAO1 retS complementation strain with
alanine mutation on Thr428 This study
Plasmids:
pSK_retS pSK carrying wild type retS gene This study
pSK_retSH242A pSK carrying reSH424A This study
pSK_retSD713A pSK carrying reSD713A This study
pSK_retSD715A pSK carrying reSD715A This study
106
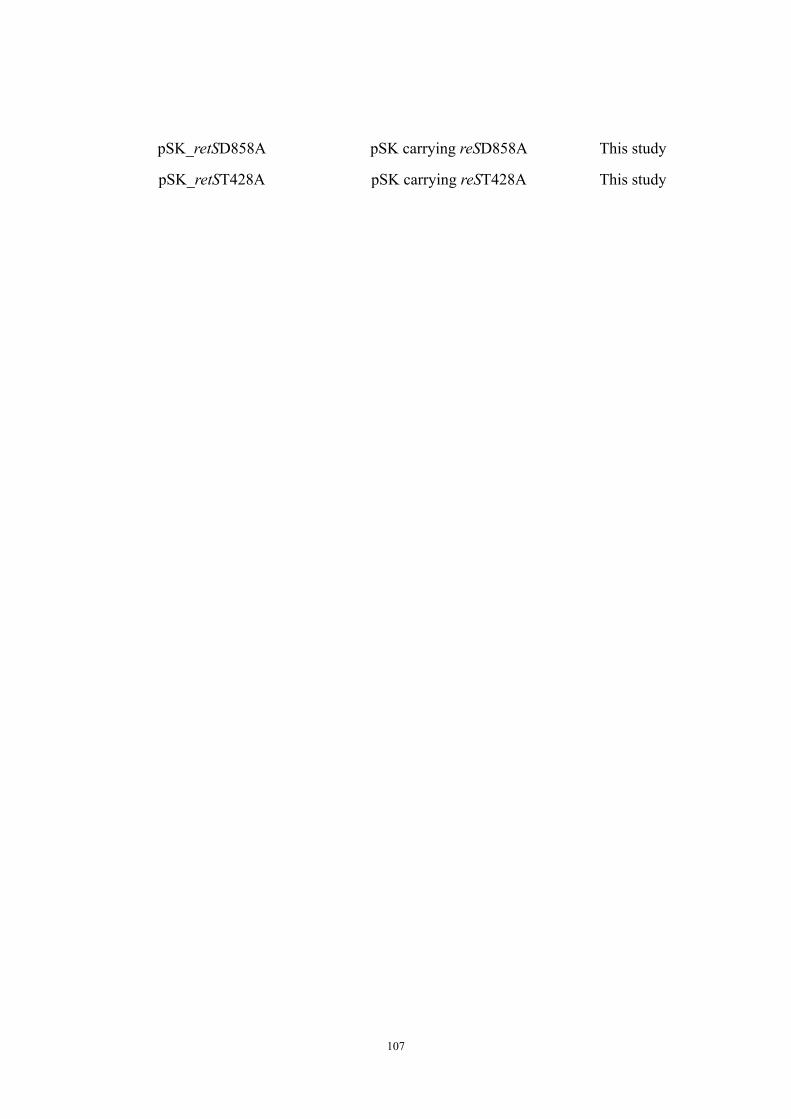
pSK_retSD858A pSK carrying reSD858A This study
pSK_retST428A pSK carrying reST428A This study
107
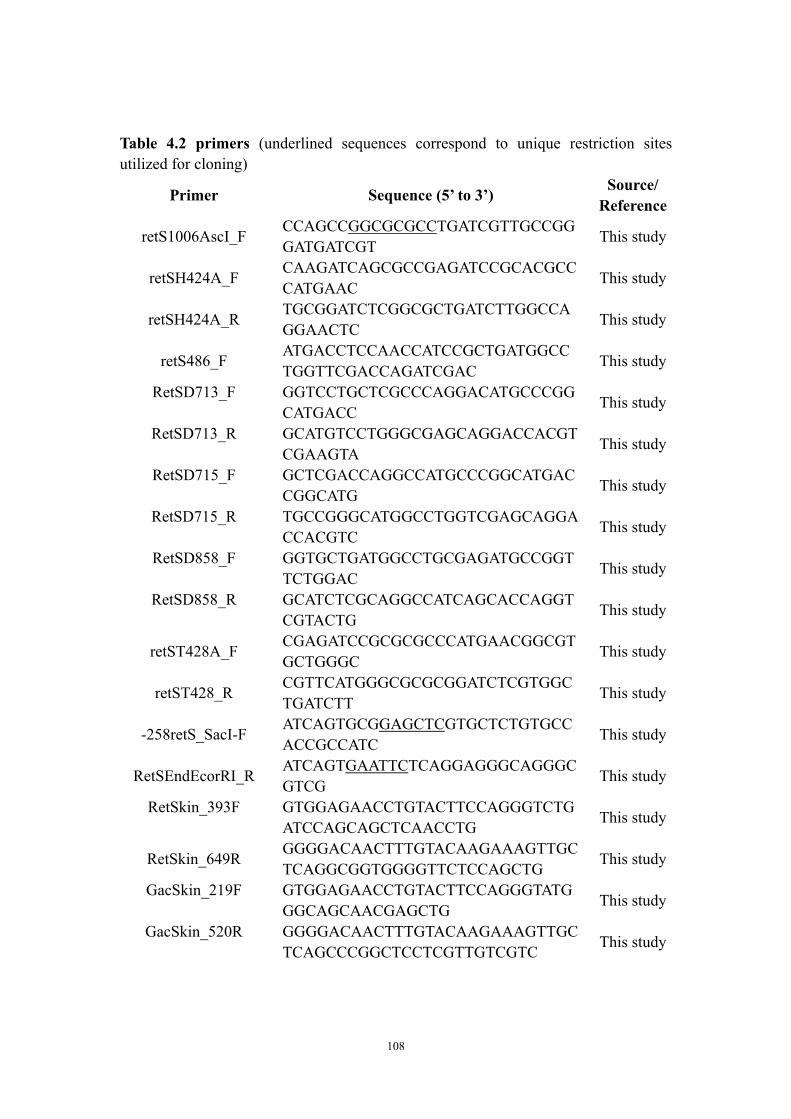
Table 4.2 primers (underlined sequences correspond to unique restriction sites utilized for cloning)
Primer Sequence (5’ to 3’) Source/ Reference
retS1006AscI_F CCAGCCGGCGCGCCTGATCGTTGCCGGGATGATCGT This study
retSH424A_F CAAGATCAGCGCCGAGATCCGCACGCCCATGAAC This study
retSH424A_R TGCGGATCTCGGCGCTGATCTTGGCCAGGAACTC This study
retS486_F ATGACCTCCAACCATCCGCTGATGGCCTGGTTCGACCAGATCGAC This study
RetSD713_F
GGTCCTGCTCGCCCAGGACATGCCCGGCATGACC This study
RetSD713_R
GCATGTCCTGGGCGAGCAGGACCACGTCGAAGTA This study
RetSD715_F
GCTCGACCAGGCCATGCCCGGCATGACCGGCATG This study
RetSD715_R
TGCCGGGCATGGCCTGGTCGAGCAGGACCACGTC This study
RetSD858_F
GGTGCTGATGGCCTGCGAGATGCCGGTTCTGGAC This study
RetSD858_R
GCATCTCGCAGGCCATCAGCACCAGGTCGTACTG This study
retST428A_F CGAGATCCGCGCGCCCATGAACGGCGTGCTGGGC This study
retST428_R CGTTCATGGGCGCGCGGATCTCGTGGCTGATCTT This study
-258retS_SacI-F ATCAGTGCGGAGCTCGTGCTCTGTGCCACCGCCATC This study
RetSEndEcorRI_R ATCAGTGAATTCTCAGGAGGGCAGGGCGTCG This study
RetSkin_393F
GTGGAGAACCTGTACTTCCAGGGTCTGATCCAGCAGCTCAACCTG This study
RetSkin_649R GGGGACAACTTTGTACAAGAAAGTTGCTCAGGCGGTGGGGTTCTCCAGCTG This study
GacSkin_219F
GTGGAGAACCTGTACTTCCAGGGTATGGGCAGCAACGAGCTG This study
GacSkin_520R
GGGGACAACTTTGTACAAGAAAGTTGCTCAGCCCGGCTCCTCGTTGTCGTC This study
108
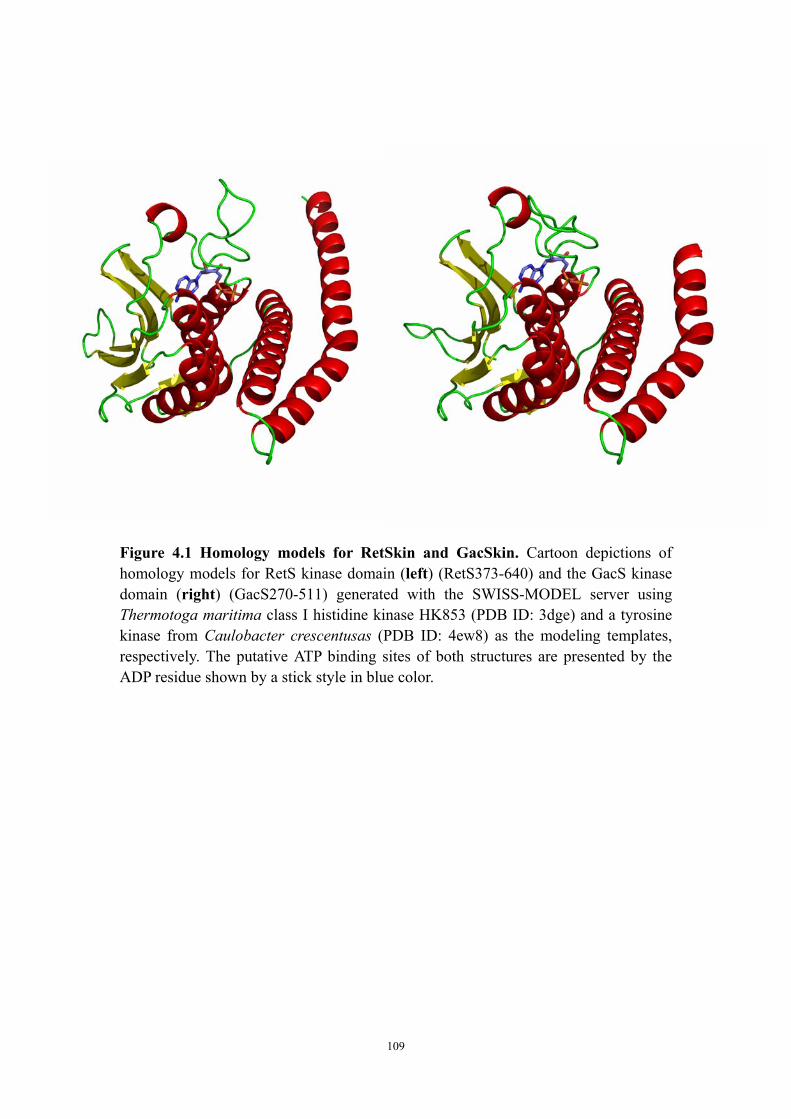
Figure 4.1 Homology models for RetSkin and GacSkin. Cartoon depictions of homology models for RetS kinase domain (left) (RetS373-640) and the GacS kinase domain (right) (GacS270-511) generated with the SWISS-MODEL server using Thermotoga maritima class I histidine kinase HK853 (PDB ID: 3dge) and a tyrosine kinase from Caulobacter crescentusas (PDB ID: 4ew8) as the modeling templates, respectively. The putative ATP binding sites of both structures are presented by the ADP residue shown by a stick style in blue color.
109
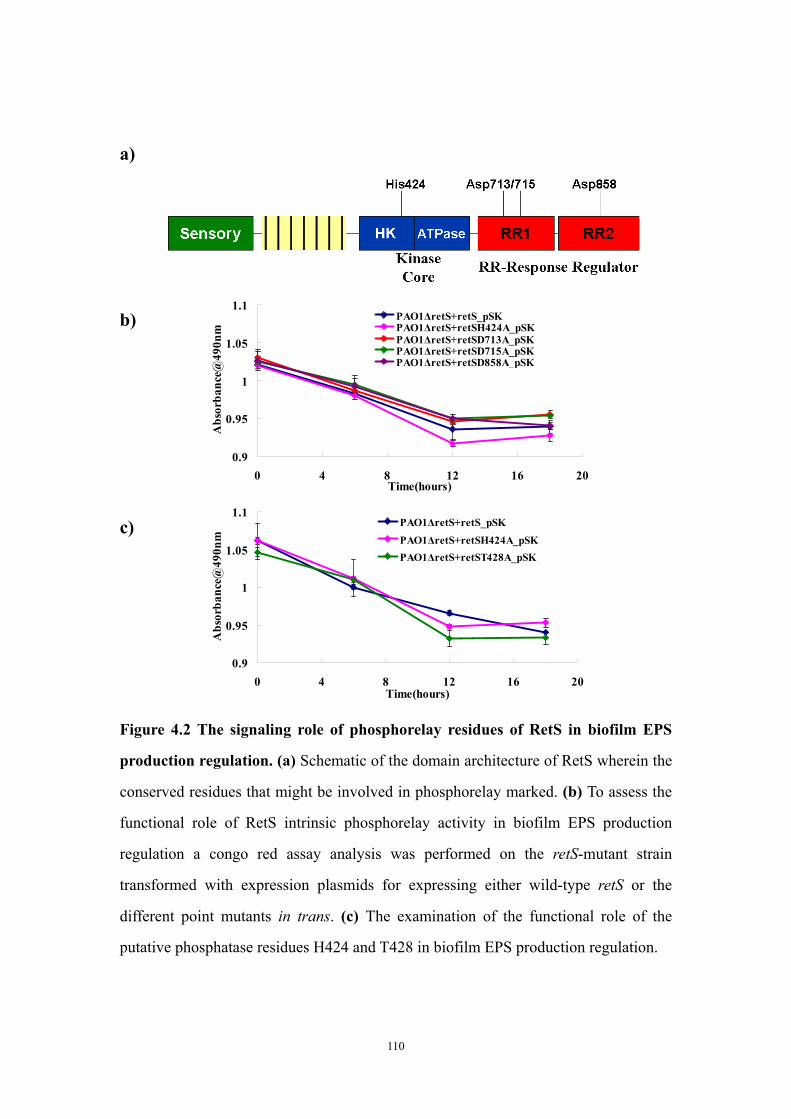
a)
0.9
0.95
1
1.05
1.1
0 4 8 12 16 20Time(hours)
Abs
orba
nce@
490n
m
PAO1ΔretS+retS_pSKPAO1ΔretS+retSH424A_pSKPAO1ΔretS+retSD713A_pSKPAO1ΔretS+retSD715A_pSKPAO1ΔretS+retSD858A_pSK
b)
0.9
0.95
1
1.05
1.1
0 4 8 12 16 20Time(hours)
Abs
orba
nce@
490n
m
PAO1ΔretS+retS_pSK
PAO1ΔretS+retSH424A_pSKPAO1ΔretS+retST428A_pSK
c) Figure 4.2 The signaling role of phosphorelay residues of RetS in biofilm EPS
production regulation. (a) Schematic of the domain architecture of RetS wherein the
conserved residues that might be involved in phosphorelay marked. (b) To assess the
functional role of RetS intrinsic phosphorelay activity in biofilm EPS production
regulation a congo red assay analysis was performed on the retS-mutant strain
transformed with expression plasmids for expressing either wild-type retS or the
different point mutants in trans. (c) The examination of the functional role of the
putative phosphatase residues H424 and T428 in biofilm EPS production regulation.
110
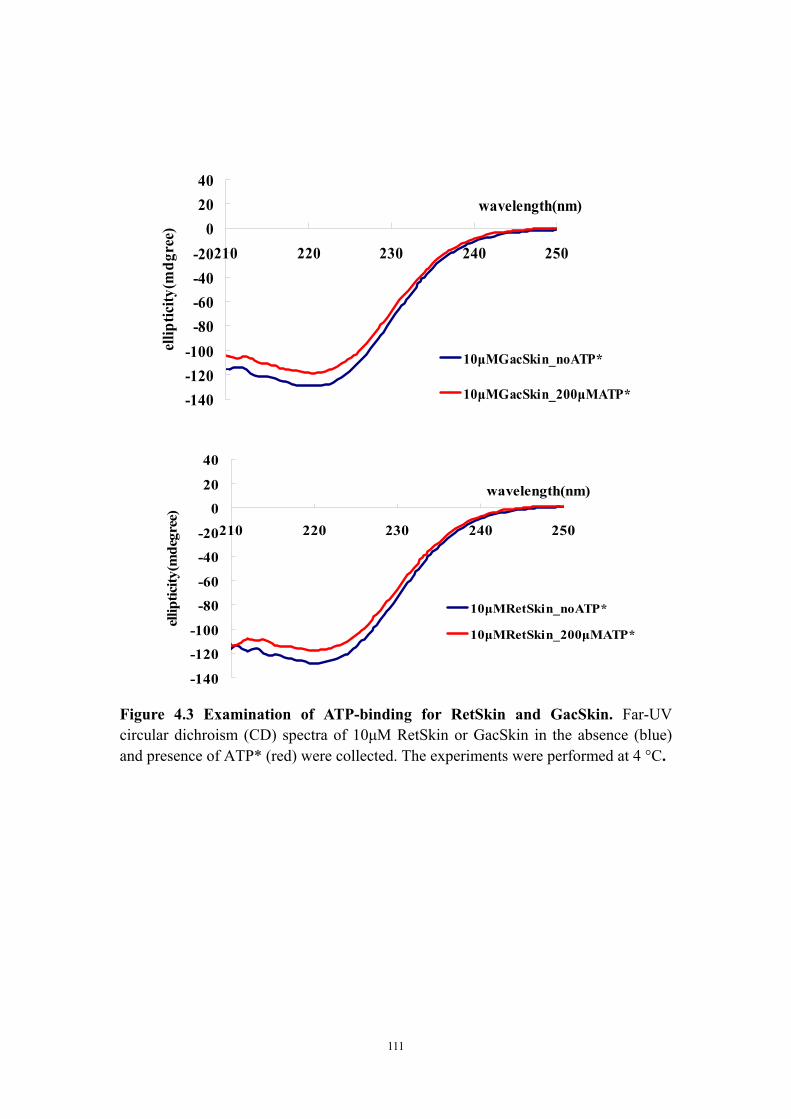
-140-120-100
-80-60-40-20
02040
210 220 230 240 250
wavelength(nm)
ellip
ticity
(mdg
ree)
10μMGacSkin_noATP*
10μMGacSkin_200μMATP*
-140
-120
-100
-80
-60
-40
-20
0
20
40
210 220 230 240 250
wavelength(nm)
ellip
ticity
(mde
gree
)
10μMRetSkin_noATP*
10μMRetSkin_200μMATP*
Figure 4.3 Examination of ATP-binding for RetSkin and GacSkin. Far-UV circular dichroism (CD) spectra of 10μM RetSkin or GacSkin in the absence (blue) and presence of ATP* (red) were collected. The experiments were performed at 4 °C.
111
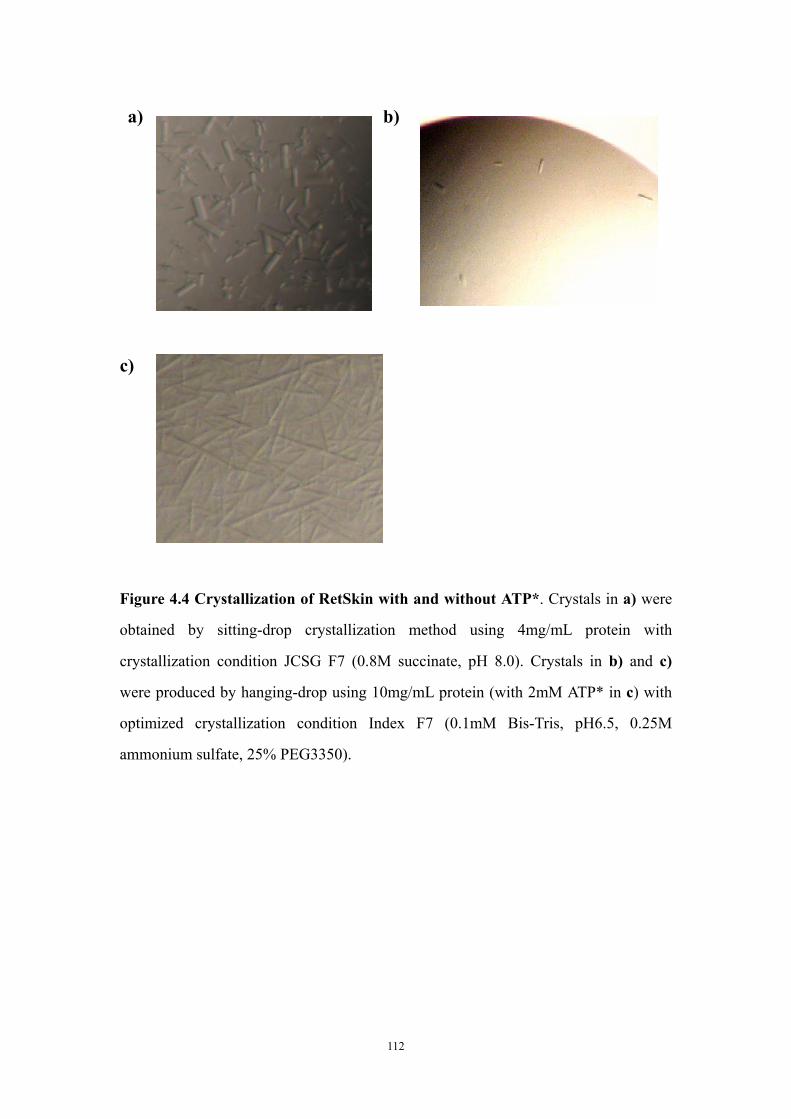
a) b)
c)
Figure 4.4 Crystallization of RetSkin with and without ATP*. Crystals in a) were
obtained by sitting-drop crystallization method using 4mg/mL protein with
crystallization condition JCSG F7 (0.8M succinate, pH 8.0). Crystals in b) and c)
were produced by hanging-drop using 10mg/mL protein (with 2mM ATP* in c) with
optimized crystallization condition Index F7 (0.1mM Bis-Tris, pH6.5, 0.25M
ammonium sulfate, 25% PEG3350).
112

Chapter Five
Final Discussion
113
The chronic infections by Pseudomonas aeruginosa are the major cause of high
mortality and morbidity among more than 80% cystic fibrosis patients (6). There is a
strong interest in looking for effective therapies. The chronic infections by P.
aeruginosa are strongly associated with biofilm formation, which consists of bacterial
cells protected by an exopolysaccharide-rich matrix thus leading to higher levels of
resistance to anti-microbial agents compared to the planktonic form of the bactium(9).
The ultimate goal of our work is to develop a strategy aimed at repressing biofilm
formation-associated gene expression in Pseudomonas aeruginosa.
In P. aeruginosa, the two-component system (TCS) hybrid sensor kinase RetS
significantly represses biofilm formation by interacting with the downstream TCS
histidine kinase GacS, which promotes biofilm gene expression (4, 3). Although RetS
possesses a conserved TCS domain architecture and conserved phoshorelay residues
(3), the signaling mechanism for this protein has been suggested to be unusual (4). We
have shown that the mutations in the phosphorelay residues in RetS response
regulator (RR) domains do not result in any change to either the biofilm EPS
production (chapter four) or biofilm-associated RsmZ expression (4). While data from
the Kazmierczak group revealed that the second RR domain of RetS is required for
virulence in a mouse model of acute pneumonia, the exact signaling role of RetS RR
domains remains unknown.
RetS is an appealing kinase to medical community because it contains a potential
drug-target domain (RetSperi), which is putatively essential for RetS signaling (2, 8).
Unfortunately, all of our attempts to identify signaling-effective ligands for RetSperi
have been unsuccessful. Moreover, our experimental results show that single
mutations on the putative ligand binding sites of RetSperi had no impact on biofilm
EPS production. One explanation for this result is that the natural ligand of RetSperi
does not exist in our congo red biofilm assay, implying that either the ligand comes
from host human cells infected by P. aeruginosa or the availability of the signal for
RetS requires the bacterial-host contact. This might explain why overexpression of
PSL exopolysaccharide, which is one key component of biofilm matrix in unmucoid P.
aeruginosa strain (1, 7), did not affect the expression level of the small regulatory
114
RNA RsmZ (chapter three).
It has been shown that RetS is not capable of autophophorylation. However, this
is unlikely caused by the ATP-binding deficiency of RetS kinase domain as shown by
chapter four. Whether the unsuccessful detection of RetS kinase activity is due to
ATP-hydrolysis deficiency or the absence of RetS sensory domain in the reported
phosphorylation experiments is unclear (2, 4). Based on the novel RetS-GacS
signaling model, two different groups including ours proposed the same hypothesis
for the signaling role of RetSperi. Subsequently, we have developed experimental
strategies to test these hypotheses. However, as described in chapter three, the impact
of deleting of RetSperi on biofilm EPS production was opposite to what we had
expected (4). Introducing single cysteine residues that were able to enhance in vitro
RetSperi homo-dimerization did also not produce changes in the EPS production
phenotype. Therefore, we question the veracity of the current model for the
RetS-GacS signaling mechanism. In addition, along with the data showing that RetS
(or RetS kinase domain-RetSkin) block GacS (or GacS kinase domain-GacSkin)
autophosphorylation, Goodman with colleagues have also shown that RetS or RetSkin
was able to dephosphorylate the phosphorylation-state GacS or GacSkin (4). Hence,
considering the RetSkin has an intrinsic phosphatase activity (2, 5), we hypothesize in
chapter four that RetSkin serves as a phosphatase for GacSkin when the RetS-GacS
complex forms. It has been described that the equilibrium between the kinase activity
and the phosphatase activity is tuned by signal sensing on sensor kinases (2). This
notion might explain the slightly faster biofilm EPS production in the putatively
phosphatase-deficient mutants considering a RetSperi ligand is probably absent in our
congo red assay. This possibility leads to an alternative hypothesis for RetSperi
signaling role that is proposed in chapter four. This hypothesis can be used to explain
why deletion of RetSperi resulted in an increased biofilm-EPS production phenotype
(chapter three).
Finally, according to this alternative hypothesis, dephosphorylation of GacS by
RetS does not require the disruption of GacS homo-dimerization. Future experiments
will examine the oligmeric state of RetS-GacS complex to test this model. This work
115

will be enhanced by ongoing structure-determination studies aimed at understanding
the molecular basis for the RetS-GacS interactions and revealing the unique structural
features of the RetS kinase domain.
116
References 1. Byrd MS, Sadovskaya I, Vinogradov E, Lu H, Sprinkle AB, Richardson SH, Ma
L, Ralston B, Parsek MR, Anderson EM, Lam JS, Wozniak DJ. 2009. Genetic and biochemical analyses of the Pseudomonas aeruginosa Psl exopolysaccharide reveal overlapping roles for polysaccharide synthesis enzymes in Psl and LPS production. Mol Microbiol. 73:622-38.
2. Gao R, Stock AM. 2009. Biological insights from structures of two-component proteins. Annu Rev Microbiol. 63:133-54.
3. Goodman AL, Kulasekara B, Rietsch A, Boyd D, Smith RS, Lory S. 2004. A signaling network reciprocally regulates genes associated with acute infection and chronic persistence in Pseudomonas aeruginosa. Dev Cell. 7:745–754.
4. Goodman AL, Merighi M, Hyodo M, Ventre I, Filloux A, Lory S. 2009. Direct interaction between sensor kinase proteins mediates acute and chronic disease phenotypes in a bacterial pathogen. Genes Dev. 23:249-59.
5. Huynh TN, Noriega CE, Stewart V. 2010. Conserved mechanism for sensor phosphatase control of two-component signaling revealed in the nitrate sensor NarX. Proc Natl Acad Sci U S A. 107:21140-5.
6. Lyczak, J. B., C. L. Cannon, and G. B. Pier. 2000. Establishment of Pseudomonas aeruginosa infection: lessons from a versatile opportunist. Microbes Infect. 2:1051–1060.
7. Ma L-Y, Jackson K, Landry RM, Parsek MR, Wozniak DJ. 2006. Analysis of Pseudomonas aeruginosa conditional Psl variants reveals roles for the Psl polysaccharide in adhesion and maintaining biofilm structure postattachment. J Bacteriol. 188:8213–8221.
8. Michelle A. Laskowski, and Barbara I. Kazmierczak. 2006. Mutational Analysis of RetS, an Unusual Sensor Kinase-Response Regulator Hybrid Required for Pseudomonas aeruginosa Virulence. INFECTION AND IMMUNITY. 74:4462–4473.
9. Schooling SR, Beveridge TJ. 2006. Membrane vesicles: an overlooked component of the matrices of biofilms. Journal of Bacteriology. 188:5945–5957.
117
Part II
The catalytic domain of the germination-specific lytic
transglycosylase SleB from Bacillus anthracis displays a unique active
site topology
Xing Jing1, Howard R. Robinson2, Jared D. Heffron3, David L. Popham1,
and Florian D. Schubot1. 2012. Proteins Journal. 80(10):2469-75 1 Virginia Tech, Department of Biological Sciences, Life Sciences, Blacksburg, Virginia 24061 2 Biology Department, Brookhaven National Laboratory, Upton, New York 11973-5000 3 USAMRIID, Bacteriology Division, Frederick, Maryland 21702-5011
Keywords: SleB; CwlJ; Bacillus anthracis; spore;germination; lytic transglycosylase;
muramic-δ-lactam; peptidoglycan; cortex peptidoglycan
118
Abstract
Bacillus anthracis produces metabolically inactive spores. Germination of these
spores requires germination-specific lytic enzymes (GSLEs) that degrade the unique
cortex peptidoglycan to permit resumption of metabolic activity and outgrowth. We
report the first crystal structure of the catalytic domain of a GSLE, SleB. The structure
revealed a transglycosylase fold with unique active site topology and permitted
identification of the catalytic glutamate residue. Moreover, the structure provided
insights into the molecular basis for the specificity of the enzyme for
muramic-δ-lactam-containing cortex peptidoglycan. The protein also contains a
metal-binding site that is positioned directly at the entrance of the substrate-binding
cleft.
Abbreviations:
Cwlj, cell wall hydrolase j; DTT, dithiothreitol; EGTA, ethylene glycol tetraacetic
acid; GSLEs, germination-specific lytic enzymes; MAD, multiple wavelength
anomalous dispersion; MBP, maltose-binding protein; NAG, N-acetylglucosamine;
NAM, N-acetylmuramic acid; Ni-NTA, nickel–nitrilotriacetic acid; PG, peptidoglycan;
SleB, spore cortex lytic enzyme B; SleBCAT, catalytic domain of SleB.
119
Introduction
Bacterial endospores can survive in a metabolically dormant state for many years
and exhibit extreme resistance to a wide range of killing agents (24). Dormancy and
most resistance properties are dependent on the relative dehydration of the spore core
(cytoplasm), and this dehydration is dependent on the presence of the spore cortex
peptidoglycan (PG) wall surrounding the core (24). When spores sense a favorable
growth environment and initiate germination, they must degrade the cortex PG as an
essential step to allow full core rehydration and a resumption of metabolism (21,
23). The germination-specific lytic enzymes (GSLEs) responsible for cortex
degradation are produced during spore formation and are held in a highly stable yet
inactive state during spore dormancy. The mechanism by which GSLEs are held
inactive, their mechanism of activation, and the molecular basis for their specificity
for the cortex PG are of basic as well as applied interest. Treatments that activate
GSLEs result in a loss of spore resistance properties (14). A method of triggering
highly efficient and synchronous activation of GSLEs would therefore greatly
simplify spore decontamination measures, which is relevant for clinical spaces, food
preparation facilities, and anti-bioweapon development.
The GSLE SleB has been shown to play a key role in the germination of spores
of several Bacillus species (2, 10, 18), and sleB genes are highly conserved across
the Bacillus genus as well as in some Clostridium species (20). SleB is produced
within the developing spore with a signal peptide that is cleaved following SleB
translocation across the spore membrane (17, 18, 19). SleB then remains inactive
within the same spore compartment as the cortex PG and is activated during
germination. Active SleB functions as a lytic transglycosylase to depolymerize the
cortex PG (2, 10). SleB and other GSLEs exhibit specificity for PG containing the
modified sugar muramic-δ-lactam (4, 5, 21), which is found only within spore cortex
PG (26).
In addition to its catalytic domain (pfam07486) (13), SleB possesses an
N-terminal PG-binding domain (pfam01471) (11, 18, 19), which increases its affinity
120
for PG and its rate of PG cleavage although it is not required for either role
(11). Interestingly, a second GSLE, CwlJ, possesses significant sequence similarity
with the catalytic domain of SleB but lacks the PG-binding domain (13).
To begin characterization of SleB substrate recognition and cleavage factors, we
have determined the crystal structure of the catalytic domain of Bacillus
anthracis SleB (SleBBCAT) to a resolution of 1.9 Å. Although it shares some features
with other transglycosylases, SleBCATB displays a unique binding cleft topology
reflective of its unusual specificity for muramic-δ-lactam-containing PG. The
structure also revealed the catalytic glutamate residue and led to the unexpected
discovery of a metal binding site, which is conspicuously positioned at the entrance of
the substrate-binding pocket.
121
Materials and Methods
Expression and purification of SleB and SleBCAT
The expression vectors and protocols used for full-length SleB and SleBCAT were
identical to those used in a previous study (11) with minor modifications. Protein
expression was induced at 20°C rather than 10°C. Cells were resuspended in 5 mL
buffer A (50 mM Tris-HCl, 150 mM NaCl, 25 mM imidazole, pH 7.4), 1
mM dithiothreitol (DTT), and 0.3 mM phenylmethanesulfonyl fluoride (Sigma) per
gram cells. Cell lysis via sonication was followed by centrifugation at 40,000g for 30
min. The supernatant was filtered through a 0.45-μm polyethersulfone membrane and
loaded onto to a 30-mL nickel–nitrilotriacetic acid (Ni-NTA) Superflow column
(Qiagen) pre-equilibrated in buffer A. The column was washed with buffer A and
eluted with a linear imidazole gradient to 250 mM. Cleavage of the HisMBP fusion
proteins was achieved by adding a variant of Tobacco Etch Virus protease,
His-TEV(S219V)-Arg (1.5 mg TEV/10 mg of total protein) to the pooled peak
fractions. The reaction mixture was dialyzed overnight into buffer A. Subsequently,
the protein solution was filtered and applied to a 40-mL Ni-NTA Superflow column
(Qiagen) pre-equilibrated with buffer A. Flow-through fractions containing the SleB
or SleBCAT were dialyzed overnight into 50 mM Tris, 50 mM NaCl, pH 7.5, and 2
mM DTT with 2.5% glycerol (buffer B). The sample was then applied to a 10-mL
Heparin column (GE Healthcare) pre-equilibrated with buffer B and was eluted with a
linear gradient to 0.5M NaCl. Peak fractions were concentrated and loaded onto a
HiPrep 26/60 Superdex™200 prep grade column (GE Healthcare) pre-equilibrated in
a buffer of 25 mMTris-HCl, 150 mM NaCl, 2 mM tris(2-carboxyethyl)phosphine, and
2.5% glycerol, pH 7.4 (buffer C). The protein was judged to be >95% pure by sodium
dodecyl sulfate-polyacrylamide gel electrophoresis.
Cloning, expression, and purification of selenomethionine-substituted
SleBCAT and SleBCAT L143M
As the single methionine in the native sequence of SleBCAT proved insufficient
for structure solution, a second methionine was introduced in position 143 via
122
site-directed mutagenesis using the following primers: 5′-TGATATTCAGAT
GATGGCAAACGCAGTATATGGA-3′ and 5′-CGTTTGCCA
TCATCTGAATATCATTTTGAGAATA-3′. After sequencing, the modified plasmid
was transformed into Escherichia coli BL21 (DE3) CodonPlus RIL cells (Stratagene,
La Jolla, CA) for protein expression.
To prepare selenomethionine-substituted SleBBCAT or SleBCAT L143M, cells
obtained from a 1 L of mid-log phase culture (prepared as described above) were
washed twice in 100 mL of M9 selenomethionine growth media (Medicilon). The
cells were resuspended in 100 mL of M9 selenomethionine growth media and used to
inoculate four 1-L cultures containing M9 selenomethionine growth media and
antibiotics. These cultures were grown with agitation at 37°C until the
OD600nm reading reached 0.5. Protein expression and purification followed the same
procedures as described above.
Crystallization of native SleBCAT and SleBcat L143M
Crystallization screening in the sitting-drop format produced an initial hit from
condition F7 of the IndexHT screen (Hampton Research). Hit optimization was
carried out using the hanging drop vapor diffusion method at room temperature
(23°C). Diffraction quality crystals for both native SleBCAT and
SeMet-SleBCAT L143M were obtained from droplets containing a 1:1 mixture of 2.5
mg/mL protein and a crystallization solution composed of 0.2M ammonium sulfate,
0.1M Bis-Tris (pH 5.8) and 15% w/v polyethylene glycol 3350.
Data collection, structure solution, and refinement
Crystals were loop-mounted after they had been soaked in a cryosolution
consisting of crystallization stock solution supplemented with either 10 or 12.5%
glycerol, and subsequently flash-frozen in liquid nitrogen. All data sets were collected
at beamline X-29A of Brookhaven National Laboratory using an ADSC Q315 CCD
detector. The CCP4 program suite (15) was used for data processing.
Multiple wavelength anomalous dispersion (MAD) data collection (12) of the
SleBCAT L143M variant crystal yielded excellent electron density maps used for model
123
building. Selenium atom search, initial phase calculation, density modification, and
automated model building were all completed in the PHENIX program suite
(1). Iterative cycles of manual model adjustment using COOT followed by refinement
in PHENIX converged to produce the final structures. Detailed statistics for data
collection, experimental phasing, and model refinement are summarized in table 6.1.
The model quality was validated using Procheck (16). The coordinates for the two
molecules in the asymmetric unit have been deposited with the Protein Data Bank
(pdb code 4FET).
Construction of active site mutant and assay of SleB function
To create the sleB E151A allele in which the catalytic glutamate is changed to an
alanine, PCR-based site-directed mutagenesis was carried out using the following
primers: 5′CTCATG GCAAACGCAGTATACGGAGCGTCTCGTGG TG3′ and
5′CACCACGAGACGCTCCGTATACTGCGTTT GCCATGAG3′. The alteration
was made to the sleB gene in plasmid pDPV346 (10). The resulting plasmid
pDPV430 was introduced into strain DPBa74 (9) to test if the altered protein allows
completion of spore germination. Spores were plated in the presence and absence of
lysozyme as described previously (9).
124
Results
Structure solution and overall fold of SleBCAT
Following an unsuccessful attempt to crystallize the full-length SleB, we focused
on the structure of the catalytic domain encompassing residues 125–253 of the
enzyme. We were unable to solve the structure by molecular replacement and
therefore a MAD phasing strategy was employed. Ultimately, data collected from
crystals of the selenomethionine-substituted SleBBCAT L143M variant permitted modeling
of the two virtually identical molecules in the asymmetric unit. Cartoon and solvent
accessible surface representations of one molecule are shown in figure 6.1. The
completed models made it immediately obvious why molecular replacement had not
been successful: While there is a good structural correspondence between the
SleB
CAT and the structures of other transglycosylases for a core region encompassing
helices H1, H2, and H5, the overall structure of SleBCAT is distinct, particularly with
respect to the topology of the active site. H1 contains the conserved catalytic residue,
which is positioned at one end of the active site cleft by the other two core helices. In
addition, the large H2 helix also forms the floor of this cleft. Beyond this minimal
structural conservation, a search of the protein data bank for related structures
produced only a single protein with more extensive structural homology to
SleBCAT belonging to the lytic PG transglycosylase YceG (pdb code 2R1F).
The root-mean-square-deviation for the backbones of the 47 overlapping amino acids
was 2.5 Å (figure 6.2). SleB
E. coli
CAT has an approximately globular shape, measuring ∼46,
36, and 30 Å along its three longest perpendicular axes. Although primarily an
α-helical protein, a large portion of the active site is formed by a three-stranded
antiparallel β-sheet, also preserved in YceG. The 15 Å-deep active site cleft measures
about 27 Å end-to-end; its width varying between 10 and 13Å over the length of the
cleft.
Identification of the catalytic glutamate residue of SleB and CwlJ
The active site clefts of PG transglycosylases contain five or more subsites for
binding ring-shaped carbohydrate moieties. For instance, the bacteriophage φKZ
125
enzyme gp144 contains five subsites −4 to +1 and cleavage occurs between
the N-acetylmuramic acid (NAM) and the NAG moieties bound in sites −1 and +1
(7). The mechanism whereby lytic transglycosylases catalyze the generation of the
characteristic 1,6-anhydromuramic acid product is not fully understood. According to
the currently held model, the cleavage reaction requires a single glutamate and
the N-acetyl group of the NAM moiety bound to the −1 subsite (7, 22). Cleavage is
initiated by the N-acetyl oxygen, which carries out a nucleophilic attack on the
C1-atom of the NAM group. The glutamate is believed to stabilize the first transition
state of the reaction by donating a proton to the forming hydroxyl group of the
departing NAG moiety. The glutamate is also thought to stabilize the second
transition state when the C6-hydroxyl of the terminal NAM moiety displaces
the N-acetyl oxygen at the C1 position to give the final product (figure 6.2).
The low degree of sequence similarity between SleB and other lytic
transglycosylases where the catalytic glutamate had already been identified prevented
the determination of the catalytic residue of SleB until now. However, the
functionally similar enzymes display a higher degree of conservation at the tertiary
structure level. Therefore, a least-square superposition of the SleBCAT structure with
Slt-70 (25), bacteriophage φKZ lytic transglycosylase gp144 (7) and the to-date
unpublished but pdb-deposited structure of a lytic transglycosylase YceG
from E.coli precisely overlaid residue E151 of SleB with glutamates in the other
enzymes. In all cases, this residue is strictly conserved and positioned near one end of
the large substrate-binding cleft at the very end of a large helix. The essential role of
this positionally conserved glutamate in catalysis has been confirmed for both gp144
and Slt-70 (7, 25). A second glutamate, E-155 in SleBCAT, is also conserved among
SleB-type enzymes and is positioned in a loop region that marks the edge of the
binding cleft, suggesting that this residue might form part of the +1 site required for
NAG binding.
We created a version of sleB in which the catalytic E-151 was changed to an
alanine and tested for SleB function in allowing completion of germination. Spores
lacking cwlJ1 and sleB are unable to complete germination and form colonies
126
(10) (table 6.2). Complementation with a plasmid bearing sleB restores function, but
the same plasmid bearing sleB E151A did not. The ability of a limited application of
external lysozyme to rescue these spores' colony-forming ability indicates that their
germination defect is in cortex degradation.
In addition to SleB, B. anthracis produces a second GSLE specific for the
cleavage of cortex PG, CwlJ1 (10). Functionally redundant with SleB, this enzyme
possesses no PG-binding domain but its catalytic domain displays 40% sequence
identity with SleB. CwlJ1 features a close succession of three glutamate residues in
the region that likely contains the catalytic amino acid, making its identification
complicated. However, the close similarity of CwlJ1 and SleB sequences allowed the
construction of a homology model of CwlJ1, which in turn enabled us to predict that
E21 mediates catalysis in this enzyme, whereas E23 and E25 are likely involved in
NAG binding in the +1 site.
Conserved and unique features of the PG-binding cleft of SleBCAT
SleBCAT displays a number of unique structural features beyond the conserved
positions of a core of three helices. The structure most similar to SleBCAT is that of the
YceG enzyme from E. coli. Therefore, we focused our analysis of the
carbohydrate-binding cleft on a comparison of these two proteins. As E. coli does not
produce muramic-δ-lactam-containing PG, this comparison was particularly helpful
with discerning between universally conserved features of the SleBCAT active site and
features that are potentially reflective of the unique substrate specificity of SleB.
Characteristic of carbohydrate-binding sites, the binding clefts of both enzymes are
lined with a number of aromatic amino acids. figure 6.3a shows the superposition of
SleBCAT and E. coli YceG. figure 6.3c shows the side chains of residues that are
structurally conserved. SleBCAT residues F190 and F232 of the E. coli enzyme are also
included because their side chains occupy a very similar space in the pocket although
they are not related at the primary structure level. Similarities in the folds of the two
proteins and in the topologies of the binding clefts are particularly pronounced near
the catalytic residues. This is consistent with the fact that the substrates of the two
enzymes do not differ in the regions that bind to subsites −2, −1, and +1. A
127
fascinating aspect about GSLEs is the question of how these enzymes achieve
specificity for the muramic-δ-lactam moiety that binds in the −3 site. Figure 6.3d is an
extension of figure 6.3c to now include the side chains of residues that are present in
SleBCAT but not in the E. coli enzyme. Intriguingly, these residues are clustered
around a relatively small part of the binding pocket. To determine if this region of
SleB is responsible for muramic-δ-lactam recognition, we attempted to cocrystallize
SleBCAT with a tetrasaccharide muropeptide containing muramic-δ-lactam
(Muropeptide Q, Tetrasaccharide-Ala in Ref (10)), which was similar to a SleB
product. As this was unsuccessful, we examined the ligand-binding modes in the
complexes of the related bacteriophage gp144 enzyme with chitotetraose and of E.
coli transglycosylase SLT70 in complex with the inhibitor Bulgecin A. In both cases,
the ligands are bound in an extended orientation (figure 6.3b). Especially, the relative
positions of the two rings bound to the −2 and −1 sites are very similar. In this
extended conformation, the ring of the chitotetraose that is bound to the −3 site of
gp144 is positioned about 11 Å away from the carboxylate group of the catalytic
glutamate. If we assume that SleB binds substrate to subsites −2 and −1 as observed
in the other two enzymes, then the approximate position of the unique −3 site can be
inferred. This approach suggests that SleB residues F176, P187, R188, W236, and
perhaps even S234 form the −3 subsite that is all residues located in structurally
unique regions of SleB. Consistent with the hypothesis that F176, P187, and W236
play a role in the binding of muramic-δ-lactam, the three residues are not only
conserved among SleB homologues but also in CwlJ where F48, P62, and W114
occupy the corresponding positions in the sequence (Supporting Information File S3).
It should be noted that there is a group of closely related SleB-type proteins, typified
by B. subtilis YkvT, which should not specifically function in the degradation of
cortex PG (5), but the above-listed residues are conserved here as well. Therefore, it is
possible that these residues are necessary but not sufficient for the exclusive
specificity of SleB for muramic-δ-lactam. In addition, the specificity might be
fine-tuned by the next tier of amino acids that acts as scaffolding for the active site
and ensures proper positioning of backbone and side chain atoms.
128
The entrance of the SleBCAT substrate binding cleft is shaped by a metal-binding
site
A surprising feature of the SleB CAT structure was the discovery of a bound
metal ion near the putative −4 subsite of the binding cleft. The metal ion is
octahedrally coordinated by five backbone carbonyl groups of residues from a loop
region that bridges helices H2 and H3 and the side-chain oxygen of asparagine N178.
The six ligand atoms are all positioned about 2.4 Å away from the ion. This distance
is characteristic for complexes of either Ca2+ or Na1+ ion, whereas Mg2+ was
dismissed based on the observation that it forms shorter bonds of around 2.1 Å
(8). The addition of the calcium-chelating agent EGTA to a previously described in
vitro assay (11) had no significant impact on SleB activity. Moreover, modeling a
calcium ion into the SleBCAT structure produced negative density in the Fo–Fc map,
which indicates that either the site is only partially occupied or that the actual ion has
fewer electrons. Finally, when EGTA was included during crystallization, this had no
impact on the height of the electron density peak, leading us to conclude that calcium
was not bound to this site. Therefore, although a metal analysis showed slightly
elevated calcium levels in the protein sample compared to the reference buffer, we
concluded that the observed ion is most likely a Na+1. The conspicuous position of the
metal binding site at the entrance of the substrate binding pocket is intriguing;
however, the biological role of the metal ion remains to be explored.
129
Discussion
The presented crystal structure of the SleB catalytic domain places this enzyme
within the Slt family of (PF01464) lytic transglycosylases. Although other lytic
enzymes have been shown to be promiscuous, cleaving both cortex and conventional
PG, SleB requires the presence of the muramic-δ-lactam structure for its activity and
does not act on regular PG. Therefore, testing our predictions concerning the
muramic-δ-lactam-binding pocket may not be easy because mutations in this region
could not only cause a loss of specificity for muramic-δ-lactam but also produce an
enzyme that is inactive on all substrates. Additional structural studies of
SleB–substrate complexes might be able to clarify this unique substrate specificity.
Acknowledgements
Funding for data collected at beamline 29 NSLS is provided by DOE/DER and NIH/NCRR.
130
References 1. Adams PD, Afonine PV, Bunkoczi G, Chen VB, Davis IW, Echols N, Headd
JJ, Hung LW, Kapral GJ, Grosse-Kunstleve RW, McCoy AJ, Moriarty NW, Oeffner R, Read RJ, Richardson DC, Richardson JS, Terwilliger TC, Zwart PH. 2010. PHENIX: a comprehensive Python-based system for macromolecular structure solution. Acta Crystallogr D Biol Crystallogr. 66:213–221.
2. Boland FM, Atrih A, Chirakkal H, Foster SJ, Moir A. 2000. Complete spore-cortex hydrolysis during germination of Bacillus subtilis 168 requires SleB and YpeB. Microbiology. 146:57–64.
3. Brunger AT. 1992. Free R value: a novel statistical quantity for assessing the accuracy of crystal structures. Nature. 355:472–475.
4. Chen Y, Fukuoka S, Makino S. 2000. A novel spore peptidoglycan hydrolase of Bacillus cereus: biochemical characterization and nucleotide sequence of the corresponding gene, sleL. J Bacteriol. 182:1499–1506.
5. Chirakkal H, O'Rourke M, Atrih A, Foster SJ, Moir A. 2002. Analysis of spore cortex lytic enzymes and related proteins in Bacillus subtilisendospore germination. Microbiology. 148:2383–2392.
6. Emsley P, Lohkamp B, Scott WG, Cowtan K. 2010. Features and development of Coot. Acta Crystallogr D Biol Crystallogr. 66:486–501.
7. Fokine A, Miroshnikov KA, Shneider MM, Mesyanzhinov VV, Rossmann MG. 2008. Structure of the bacteriophage phi KZ lytic transglycosylase gp144. J Biol Chem. 283:7242–7250.
8. Harding MM. Small revisions to predicted distances around metal sites in proteins. 2006. Acta Crystallogr D Biol Crystallogr. 62:678–682.
9. Heffron JD, Lambert EA, Sherry N, Popham DL. 2010. Contributions of four cortex lytic enzymes to germination of Bacillus anthracisspores. J Bacteriol. 192:763–770.
10. Heffron JD, Orsburn B, Popham DL. 2009. Roles of germination-specific lytic enzymes CwlJ and SleB in Bacillus anthracis. J Bacteriol. 191:2237–2247.
11. Heffron JD, Sherry N, Popham DL. 2011. In vitro studies of peptidoglycan binding and hydrolysis by the Bacillus anthracis germination-specific lytic enzyme SleB. J Bacteriol. 193:125–131.
12. Hendrickson WA, Horton JR, LeMaster DM. 1990. Selenomethionyl proteins produced for analysis by multiwavelength anomalous diffraction (MAD): a vehicle for direct determination of three-dimensional structure. EMBO J. 9:1665–1672.
13. Ishikawa S, Yamane K, Sekiguchi J. 1998. Regulation and characterization of a newly deduced cell wall hydrolase gene (cwlJ) which affects germination of Bacillus subtilis spores. J Bacteriol. 180:1375–1380.
14. Koshikawa T, Beaman TC, Pankratz HS, Nakashio S, Corner TR, Gerhardt P. 1984. Resistance, germination, and permeability correlates of Bacillus
131
megaterium spores successively divested of integument layers. J Bacteriol. 159:624–632.
15. Laboratory SD. COLLABORATIVE COMPUTATIONAL PROJECT, NUMBER 4. 1994. The CCP4 Suite: Programs for Protein Crystallography. Acta Cryst D. 50:760–763.
16. Laskowski RA, Macarthur MW, Moss DS, Thornton JM. 1993. Procheck-a program to check the stereochemical quality of protein structures. J Appl Crystallogr. 26:283–291.
17. Moriyama R, Fukuoka H, Miyata S, Kudoh S, Hattori A, Kozuka S, Yasuda Y, Tochikubo K, Makino S. 1999. Expression of a germination-specific amidase, SleB, of Bacilli in the forespore compartment of sporulating cells and its localization on the exterior side of the cortex in dormant spores. J Bacteriol. 181:2373–2378.
18. Moriyama R, Hattori A, Miyata S, Kudoh S, Makino S. 1996. A gene (sleB) encoding a spore cortex-lytic enzyme from Bacillus subtilis and response of the enzyme to L-alanine-mediated germination. J Bacteriol. 178:6059–6063.
19. Moriyama R, Kudoh S, Miyata S, Nonobe S, Hattori A, Makino S. 1996. A germination-specific spore cortex-lytic enzyme from Bacillus cereus spores: cloning and sequencing of the gene and molecular characterization of the enzyme. J Bacteriol. 178:5330–5332.
20. Popham DL, Heffron JD, Lambert EA. 2012. Degradation of spore peptidoglycan during germination. In: Abel-Santos E, editor. Bacterial spores: current research and applications. Norwich, UK: Caister Academic Press.
21. Popham DL, Helin J, Costello CE, Setlow P. 1996. Muramic lactam in peptidoglycan of Bacillus subtilis spores is required for spore outgrowth but not for spore dehydration or heat resistance. Proc Natl Acad Sci USA. 93:15405–15410.
22. Scheurwater E, Reid CW, Clarke AJ. 2008. Lytic transglycosylases: bacterial space-making autolysins. Int J Biochem Cell Biol. 40:586–591.
23. Setlow B, Melly E, Setlow P. 2001. Properties of spores of Bacillus subtilis blocked at an intermediate stage in spore germination. J Bacteriol. 183:4894–4899.
24. Setlow P. 2006. Spores of Bacillus subtilis: their resistance to and killing by radiation, heat and chemicals. J Appl Microbiol. 101:514–525.
25. Thunnissen AM, Rozeboom HJ, Kalk KH, Dijkstra BW. 1995. Structure of the 70-kDa soluble lytic transglycosylase complexed with bulgecin A. Implications for the enzymatic mechanism. Biochemistry. 34:12729–12737.
26. Warth AD, Strominger JL. 1969. Structure of the peptidoglycan of bacterial spores: occurrence of the lactam of muramic acid. Proc Natl Acad Sci USA. 64:528–535.
132

Table 6.1 Data Collection and Refinement Statistics for the
SeMet-SleBCAT L143M Crystal Structure (A) Data collection statistics Space group P22121
molecules/asymmetric unit 2 Cell parameters (Å) a = 53.9, b = 64.5, c = 84.0 Wavelength (Å) 0.9792 0.9611 0.9794 Resolution (Å) 30.34–1.9 (1.9–2.0) 30–1.9 (1.9–2.0) 30–2.0 (2.0–2.11) Completeness (%) (last shell)a 99.3 (100) 99.2 (98.3) 99.1 (98.6)
Redundancy 12.8 (13.9) 12.5 (12.1) 11.9 (11.5) I/σ 19.4 (5.0) 23.3 (4.6) 22.5 (4.6) Rmerge (%)b 9.1 (51.5) 6.8 (55.3) 7.2 (54.1) No. of unique reflections
23,743 23,899 23,892
No. of measured reflections
849,540 1,025,839 1,079,414
(B) Refinement statistics Resolution range (Å) 33.22–1.91 R (%)c/ Rfree (%)d 20.51/24.87 rms bonds (Å)/ rms angles (°) 0.02/2 Number of protein atoms 1896 Number of water atoms 319 Overall mean B-factor value (Å2) 13.95 Wilson plot B-value 13.45 Ramachandran analysis (%)
Most favored 95 Allowed 5 Disallowed 0 a. The values in parentheses relate to the highest resolution shell. b. Rmerge =Σ |I - ‹I›|/ΣI, where I is the observed intensity and ‹I› is the average intensity
obtained from multiple observations of symmetry-related reflections after the rejection of significant outliers.
c. R = Σ ||Fo| - |Fc|| /Σ |Fo|, where Fo and Fc are the observed and calculated structure factors, respectively.
d. Rfree defined by Brunger (3).
133
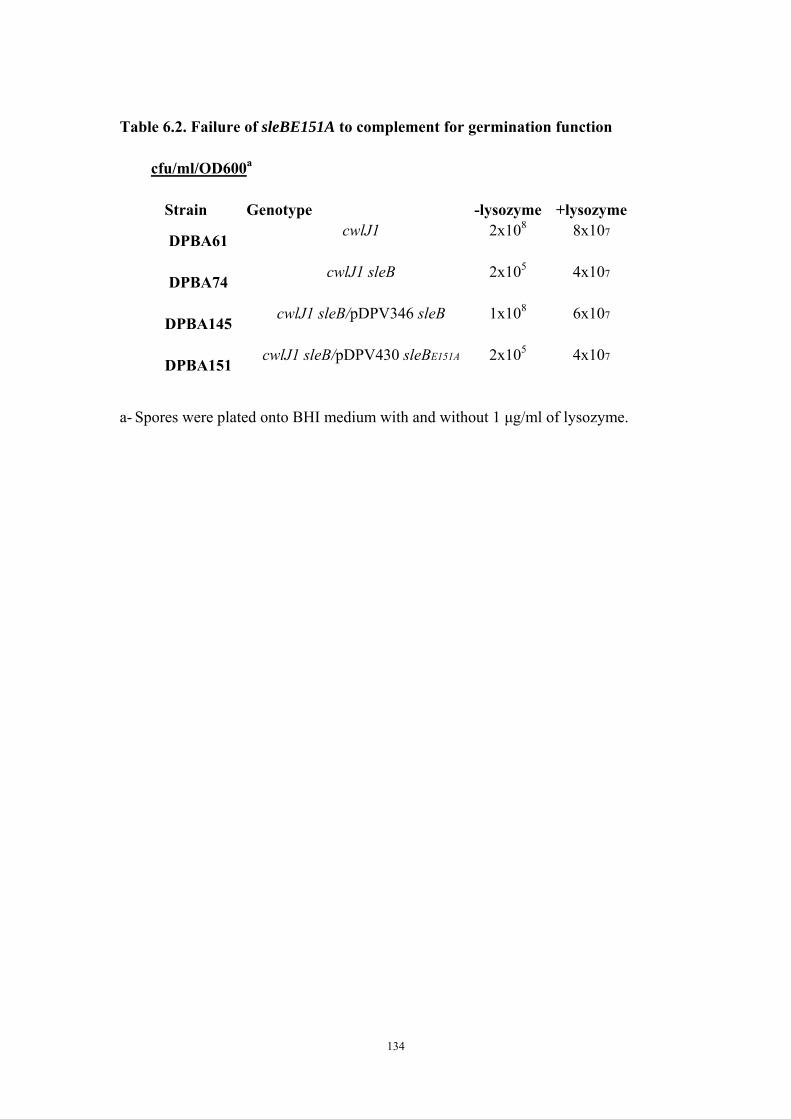
Table 6.2. Failure of sleBE151A to complement for germination function
cfu/ml/OD600a
Strain Genotype -lysozyme +lysozyme
DPBA61 cwlJ1
2x10⁸
8x10⁷
DPBA74 cwlJ1 sleB
2x10⁵
4x10⁷
DPBA145 cwlJ1 sleB/pDPV346 sleB
1x10⁸
6x10⁷
DPBA151 cwlJ1 sleB/pDPV430 sleBE151A
2x10⁵
4x10⁷
a- Spores were plated onto BHI medium with and without 1 μg/ml of lysozyme.
134
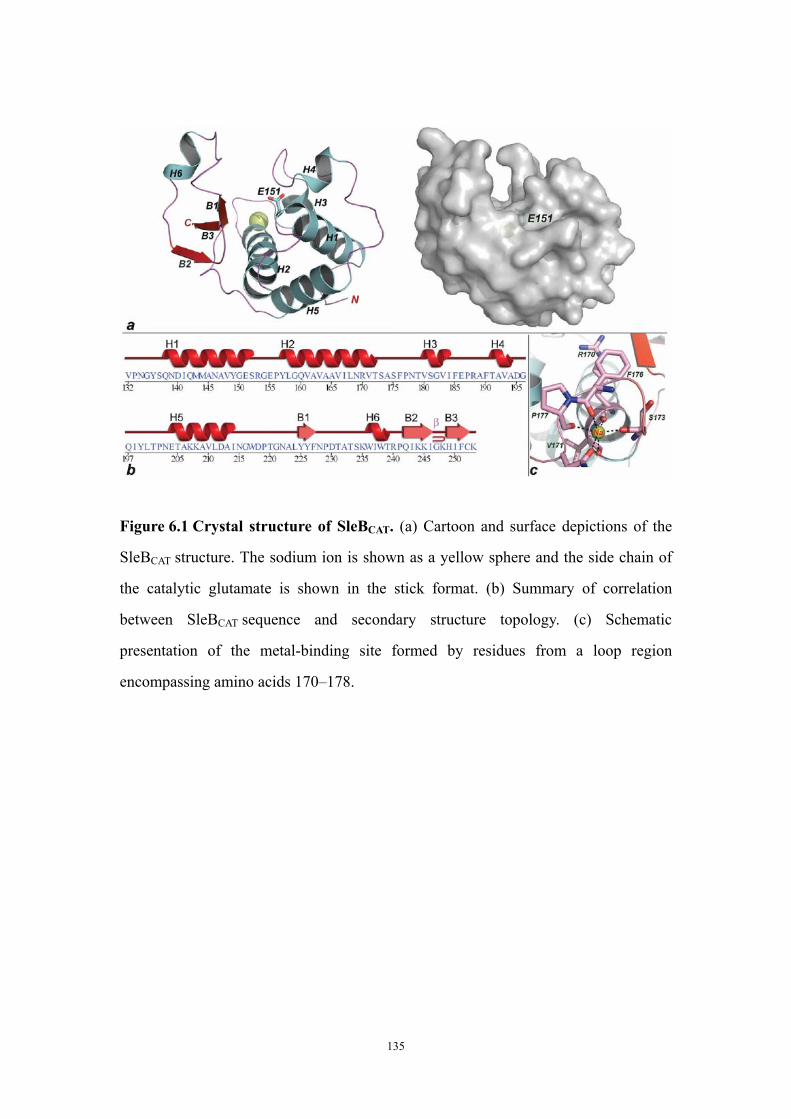
Figure 6.1 Crystal structure of SleBCAT. (a) Cartoon and surface depictions of the
SleBCATT structure. The sodium ion is shown as a yellow sphere and the side chain of
the catalytic glutamate is shown in the stick format. (b) Summary of correlation
between SleB CATT sequence and secondary structure topology. (c) Schematic
presentation of the metal-binding site formed by residues from a loop region
encompassing amino acids 170–178.
135
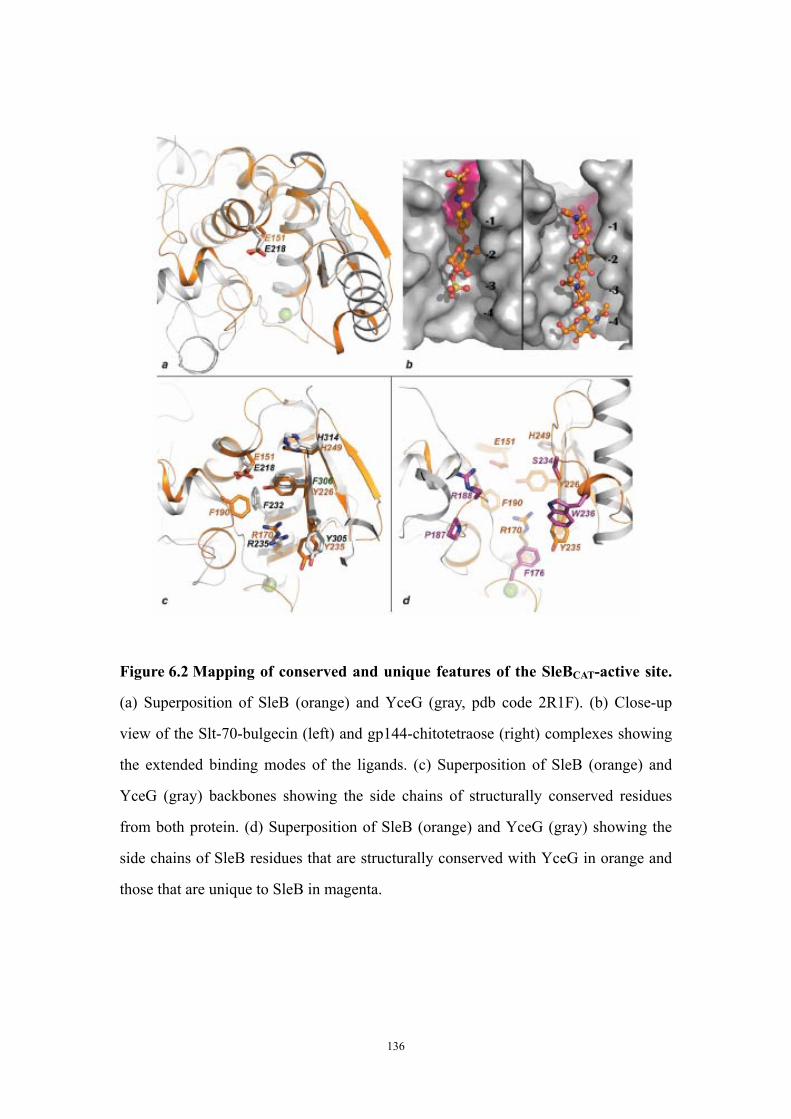
Figure 6.2 Mapping of conserved and unique features of the SleBCAT-active site.
(a) Superposition of SleB (orange) and YceG (gray, pdb code 2R1F). (b) Close-up
view of the Slt-70-bulgecin (left) and gp144-chitotetraose (right) complexes showing
the extended binding modes of the ligands. (c) Superposition of SleB (orange) and
YceG (gray) backbones showing the side chains of structurally conserved residues
from both protein. (d) Superposition of SleB (orange) and YceG (gray) showing the
side chains of SleB residues that are structurally conserved with YceG in orange and
those that are unique to SleB in magenta.
136