Embed Size (px)
Citation preview
Minnesota Comprehensive Statewide Freight
and Passenger Rail Plan
2-1
2 Existing Rail System
2.1 Railroad Industry Organization and
Investment Strategies
The institutional structure of the rail industry in North America is quite different from the other
transportation modes (highways, air, water, etc.) that have typically been the subject of public
planning studies and policy development efforts. In contrast to highway, air, and water facili -
ties, which are generally owned and maintained at public expense and accessible to any licensed
operator, rail carriers provide not only the service but also maintain and control the tracks and
other facilities that are required to provide service. Thus, physical conditions, service, and
institutional structure are closely linked.
Understanding how the rail industry is structured, and the varying scale, ownership and
operating arrangements that are present in Minnesota is critical to developing responsive
strategies that will meet the goals set forth in a vision for rail. While the North American rail
system is an integrated network, the individual carriers, which range from very small railroads
that operate in only a county or two to the largest carriers that service much of the nation, have
significantly varying perspectives and needs.
This chapter provides an overview of Minnesota’s railroads, their economic structure, and a
delineation of the major differences among them. It concludes with an estimation of the value
of the railroad industry to the Minnesota economy using selected metrics.
2.2 Composition of Minnesota’s Freight Railroad
Industry
Railroads are typically categorized by measures of size and geographic reach. This classification
is important in that carrier size is a critical determinant of the rail services that are available in
a region, competitive posture, market access, physical condition, and financial strength.
In the United States, railroads are classified by size following a scheme developed by the
Association of American Railroads (AAR).7 This scheme is based on a combination of revenues
and carrier characteristics.
7 The Surface Transportation Board uses a similar but not identical classification scheme that is purely
revenue based.
Minnesota Comprehensive Statewide Freight
and Passenger Rail Plan
2-2
Class I – The largest railroads with revenues exceeding $319.3 million are designated Class
I carriers. Since 2000, there have been seven such carriers operating in the United States, of
which four – Burlington Northern Santa Fe (BNSF), Union Pacific (UP), Canadian National
(CN), and Canadian Pacific (CP) have operations in Minnesota. Smaller regional and short
line railroads fall into the following three categories (based on 2004 dollar values).
Class II – A non-Class I line-haul railroad operating 350 miles or more with operating
revenues of at least $40 million but less than $319.3 million. Class II railroads are called
regional railroads, though they are often classified with and referred to as short lines.
Minnesota currently has no independent Class II railroads.
Class III – The remaining railroads that have revenues of less than $40 million and are
engaged in line-haul movement. Class III railroads are commonly referred to as short line
railroads.
Switching or Terminal – A railroad engaged primarily in switching and/or terminal
services for other railroads (i.e., they are not typically involved in line-haul moves between
two geographical locations). Switching and terminal railroads are often categorized with
short line railroads due to their operational and revenue characteristics, except in cases
where they are owned by one or more Class I carriers.
Small railroad ownership takes on many different forms, of which many are represented by one
or more Minnesota railroads:
Class I Parent(s) – Typically a jointly owned switching or terminal railroad, such as the
Terminal Railroad Association (TRRA) of St. Louis and the Belt Railway Company (BRC)
in Chicago. Minnesota does not host any such railroads at this time.
Industry – Usually operated for one industry, but can provide service to other unrelated
firms. The most common owners are steel and forest products companies. Over the years,
Minnesota has had several significant industry-owned railroads, most notably the Duluth
Minnesota and Iron Range (DMIR), which was acquired by the CN in 2004 from an
affiliate of U.S. Steel. A current example is the Cloquet Terminal Railroad Company, a
three-mile switching railroad located in the City of Cloquet that is owned by SAPPI Paper.
Holding Company – A railroad that is owned by a corporation holding several short
lines. The two largest are RailAmerica, currently with 47 short line properties, and the
Genesee & Wyoming, with 43 properties. RailAmerica owns one property in Minnesota,
the Otter Tail Valley Railroad; Anacostia and Pacific, another major short line holding
company, operates the Northern Lines Railway.
Public – This includes state and county/city/municipality owned, as well as Federally
owned (typically for military purposes). At present, there are no publicly operated
railroads in Minnesota; however, several Minnesota short lines operate under a lease
agreement over trackage that is owned by regional railroad authorities. Most notably,
these include the Minnesota Prairie Line, the North Shore Scenic, and the Minnesota
Southern Railway.
Independent – Railroads that are independently owned and operated (e.g., Progressive
Rail, Inc., Minnesota Commercial Railway, etc.), with the underlying infrastructure either
Minnesota Comprehensive Statewide Freight
and Passenger Rail Plan
2-3
directly owned by the operator or by a third party, such as a Class I railroad or public
agency. Most of the short lines in Minnesota are independently owned.
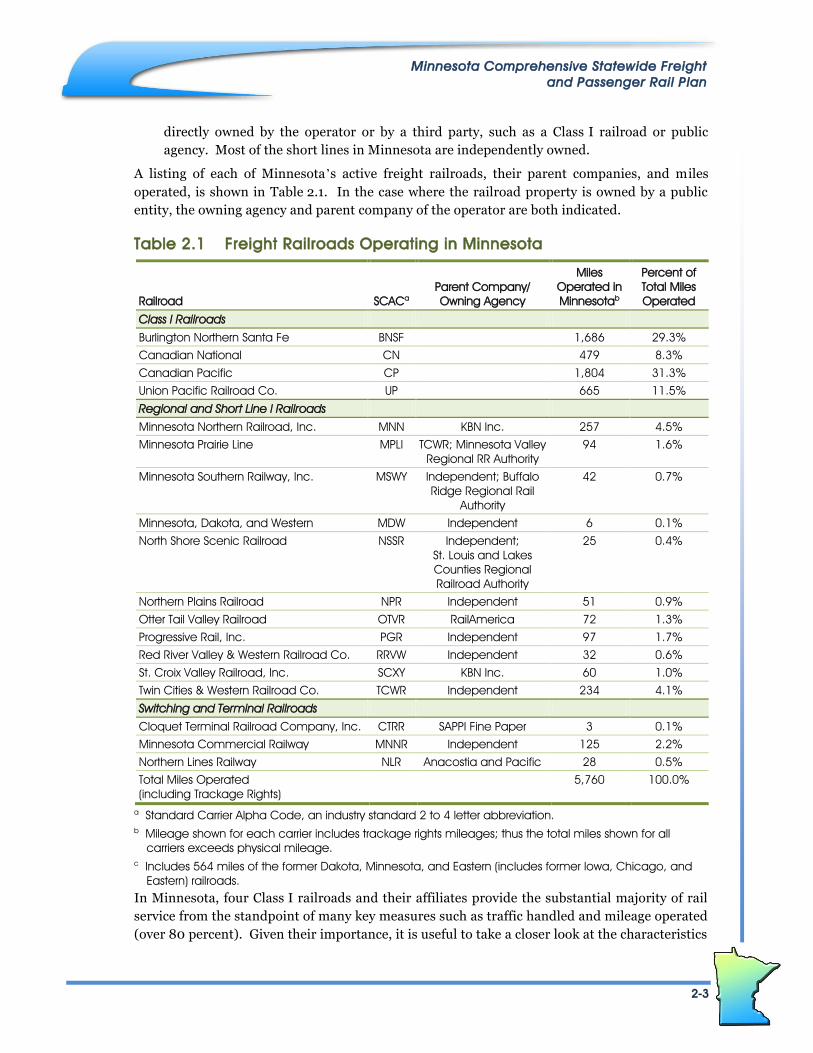
A listing of each of Minnesota’s active freight railroads, their parent companies, and miles
operated, is shown in Table 2.1. In the case where the railroad property is owned by a public
entity, the owning agency and parent company of the operator are both indicated.
Table 2.1 Freight Railroads Operating in Minnesota
Railroad SCACa
Parent Company/
Owning Agency
Miles
Operated in
Minnesotab
Percent of
Total Miles
Operated
Class I Railroads
Burlington Northern Santa Fe BNSF 1,686 29.3%
Canadian National CN 479 8.3%
Canadian Pacific CP 1,804 31.3%
Union Pacific Railroad Co. UP 665 11.5%
Regional and Short Line l Railroads
Minnesota Northern Railroad, Inc. MNN KBN Inc. 257 4.5%
Minnesota Prairie Line MPLI TCWR; Minnesota Valley
Regional RR Authority
94 1.6%
Minnesota Southern Railway, Inc. MSWY Independent; Buffalo
Ridge Regional Rail
Authority
42 0.7%
Minnesota, Dakota, and Western MDW Independent 6 0.1%
North Shore Scenic Railroad NSSR Independent;
St. Louis and Lakes
Counties Regional
Railroad Authority
25 0.4%
Northern Plains Railroad NPR Independent 51 0.9%
Otter Tail Valley Railroad OTVR RailAmerica 72 1.3%
Progressive Rail, Inc. PGR Independent 97 1.7%
Red River Valley & Western Railroad Co. RRVW Independent 32 0.6%
St. Croix Valley Railroad, Inc. SCXY KBN Inc. 60 1.0%
Twin Cities & Western Railroad Co. TCWR Independent 234 4.1%
Switching and Terminal Railroads
Cloquet Terminal Railroad Company, Inc. CTRR SAPPI Fine Paper 3 0.1%
Minnesota Commercial Railway MNNR Independent 125 2.2%
Northern Lines Railway NLR Anacostia and Pacific 28 0.5%
Total Miles Operated
(including Trackage Rights)
5,760 100.0%
a Standard Carrier Alpha Code, an industry standard 2 to 4 letter abbreviation.
b Mileage shown for each carrier includes trackage rights mileages; thus the total miles shown for all
carriers exceeds physical mileage.
c Includes 564 miles of the former Dakota, Minnesota, and Eastern (includes former Iowa, Chicago, and
Eastern) railroads.
In Minnesota, four Class I railroads and their affiliates provide the substantial majority of rail
service from the standpoint of many key measures such as traffic handled and mileage operated
(over 80 percent). Given their importance, it is useful to take a closer look at the characteristics
Minnesota Comprehensive Statewide Freight
and Passenger Rail Plan
2-4
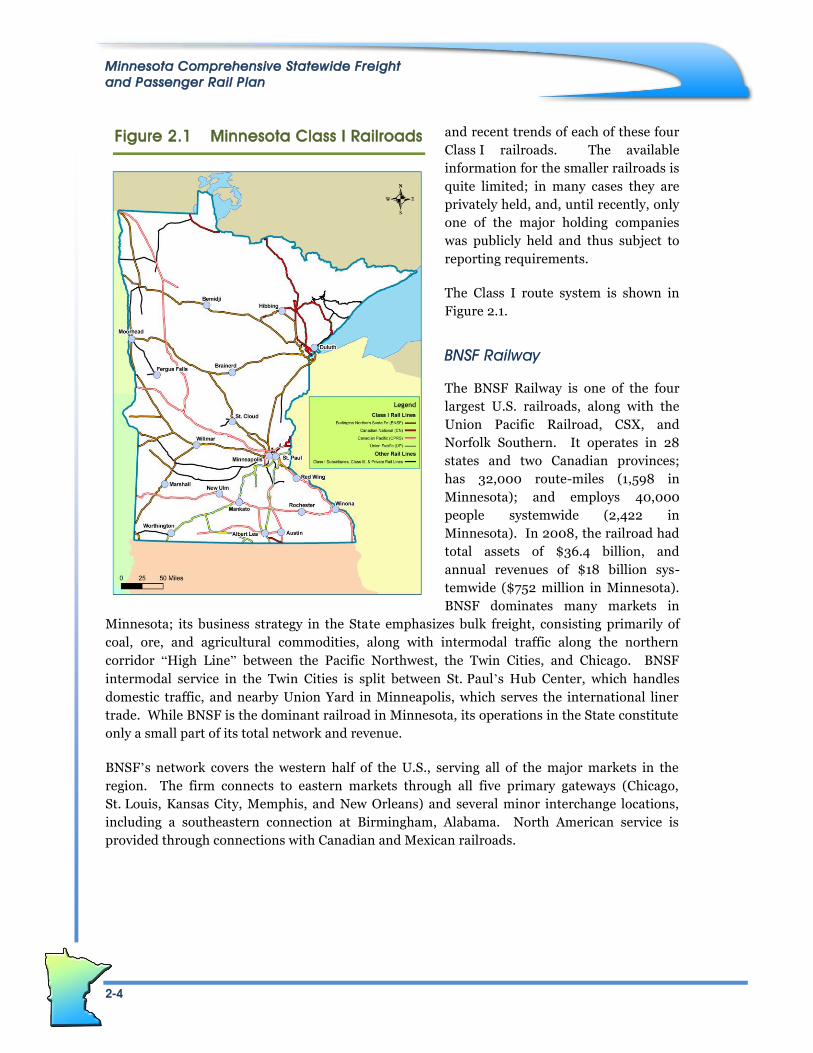
and recent trends of each of these four
Class I railroads. The available
information for the smaller railroads is
quite limited; in many cases they are
privately held, and, until recently, only
one of the major holding companies
was publicly held and thus subject to
reporting requirements.
The Class I route system is shown in
Figure 2.1.
BNSF Railway
The BNSF Railway is one of the four
largest U.S. railroads, along with the
Union Pacific Railroad, CSX, and
Norfolk Southern. It operates in 28
states and two Canadian provinces;
has 32,000 route-miles (1,598 in
Minnesota); and employs 40,000
people systemwide (2,422 in
Minnesota). In 2008, the railroad had
total assets of $36.4 billion, and
annual revenues of $18 billion sys-
temwide ($752 million in Minnesota).
BNSF dominates many markets in
Minnesota; its business strategy in the State emphasizes bulk freight, consisting primarily of
coal, ore, and agricultural commodities, along with intermodal traffic along the northern
corridor “High Line” between the Pacific Northwest, the Twin Cities, and Chicago. BNSF
intermodal service in the Twin Cities is split between St. Paul’s Hub Center, which handles
domestic traffic, and nearby Union Yard in Minneapolis, which serves the international liner
trade. While BNSF is the dominant railroad in Minnesota, its operations in the State constitute
only a small part of its total network and revenue.
BNSF’s network covers the western half of the U.S., serving all of the major markets in the
region. The firm connects to eastern markets through all five primary gateways (Chicago,
St. Louis, Kansas City, Memphis, and New Orleans) and several minor interchange locations,
including a southeastern connection at Birmingham, Alabama. North American service is
provided through connections with Canadian and Mexican railroads.
Figure 2.1 Minnesota Class I Railroads
Minnesota Comprehensive Statewide Freight
and Passenger Rail Plan
2-5
BNSF moves more intermodal traffic than any
other rail system in the world.
UP is the nation’s largest hauler of chemicals, much
of which originates along the Gulf Coast near Houston,
Texas.
BNSF moves more intermodal traffic than any other rail system in
the world. In 2008, more than 4.6 million intermodal shipments
(truck trailers or containers) were transported on BNSF’s rail lines.
According to the BNSF, the railroad is one of the largest grain-
hauling railroads in the United States, transporting more than 1
million carloads of agricultural commodities in 2008, nearly one-
half of which were corn and wheat movements. Among the indus-
trial products carried by BNSF’s carload services are lumber,
newsprint, printing paper, paperboard, propane, lube oil, motor oil,
asphalt, canned beverages, coiled sheet steel, recycled iron and
steel, cement, asphalt, gypsum, crushed stone, limestone, iron ore,
soda ash for glass, and kaolin clay for paper.
Union Pacific Railroad
The Union Pacific Railroad (UP) is the largest railroad in North America, operating 32,400 route
miles in the western United States, and employing over 50,000 people, of which 456 work in
Minnesota. 2008 gross revenues virtually matched BNSF’s revenues of $18 billion, and carloads
totaled 9.26 million. The railroad serves 23 states, every major West Coast and Gulf Coast port,
and the five largest gateways between the East and West at Chicago, St. Louis, Memphis, Kansas
City, and New Orleans. The railroad has one of the most diversified commodity mixes in the
industry, including chemicals, coal, food and food products, forest products, grain and grain
products, metals and minerals, automobiles and parts, and of course intermodal. UP is the
nation’s largest hauler of chemicals, much of which originates along the Gulf Coast near Houston,
Texas. With access to the coal-rich Powder River Basin in Wyoming and coalfields in Illinois,
Colorado, and Utah, the railroad moves more than 250 million tons of coal annually. UP’s
intermodal services, which largely parallel BNSF’s network linking the large West Coast ports
with major markets in the interior, handled 3.16 million units in 2008, 31 percent less than BNSF.
BNSF’s longstanding dominance of the Nation’s largest intermodal lane between Los Angeles and
Chicago provided a substantial boost over UP; differences in intermodal market strategy account
for the rest.
UP gained entry to Minnesota through its 1995 acquisition of the
Chicago and North Western. At present the firm owns approx-
imately 462 miles of track in the State, and operates over an
additional 203 miles through trackage rights. Volume in 2008
amounted to 19.1 million tons of freight originated and/or
terminated in Minnesota. UP’s business strategy in the region has
focused on developing unit train and carload markets, which are
heavily oriented toward agricultural crops, ethanol, and coal.
Intermodal is not much in the picture at present, with the excep-
tion being a twice-weekly Road Railer service between Chicago
and Minneapolis that is operated under contract with the Norfolk
Southern’s Triple Crown subsidiary. There has been some interest
in starting service to the south and southwestern U.S.
Minnesota Comprehensive Statewide Freight
and Passenger Rail Plan
2-6
Canadian National Railway Company
(CN), headquartered in Montréal, Canada, operates the largest
rail network in Canada and the only
transcontinental network in North
America.
Canadian National
Canadian National Railway Company (CN), headquartered in
Montréal, Canada, operates the largest rail network in Canada
and the only transcontinental railroad in North America. The
CN operates approximately 20,264 track miles in eight
Canadian provinces and 16 U.S. states. CN’s Canadian opera-
tions span across Canada from Nova Scotia to British Columbia.
Through a series of acquisitions that began in 1999 with the
purchase of the Illinois Central, CN gained control of an exten-
sive network in the central United States along the Mississippi
River valley from the Great Lakes to the Gulf of Mexico.
In Minnesota, CN has had a long-standing presence with its
Duluth Winnipeg and Pacific (DW&P) subsidiary. However, much
of CN’s current 436 miles of track came through its recent acqui-
sitions of the Wisconsin Central (2001) and the Duluth, Minnesota
and Iron Range (DMIR) (2004). The latter had the well-known
operation between the Iron Range and the ports of Twin Harbors
and Duluth/Superior, and has made the CN the largest carrier of iron ores in North America. The
Wisconsin Central acquisition allowed the CN to create a through route to Chicago, thereby forming
a transcontinental link from western Canada through the United States; secondarily, it also gave the
road access to St. Paul from the east. However, volumes on that route are modest, as CN lacks a
yard in the Twin Cities, and enters the region over trackage owned by the CP. CN does not offer
intermodal service in Minnesota, even though several intermodal trains linking Chicago and
western Canada ply its northern Minnesota main line daily.
Company-wide, the firm employed an average of 22,000 people in Canada and the United
States in 2008, with 440 located in Minnesota. In the same year, gross revenues amounted to
$8.4 billion Canadian and carloads totaled 4.61 million, placing CN in fifth place among the
seven Class I railroads. Traffic mix is quite evenly balanced among carload, unit train, and
intermodal, and between the United States and Canada. Thus, 54 percent of traffic is U.S.
domestic and cross-border, 23 percent is international, and 23 percent is Canadian domestic.
Canadian Pacific Railroad
Based in Calgary, Alberta, the Canadian Pacific Railway (CP) provides freight transportation
services with 15,700 employees over a 14,000-mile network in Canada and the United States,
of which 1,240 miles and 1,050 employees (does not include DME/ICE) are located in
Minnesota. CP’s rail network stretches from Vancouver to Montréal, and also serves major
cities in the United States such as Minneapolis, Chicago, and New York City. In 2008, 2.64
million carloads generated revenues of $4.9 billion Canadian, placing the firm in sixth place
among the Class I railroads, behind CN and ahead of Kansas City Southern (KCS). Over one-
half of the CP’s freight traffic is in coal, grain, and intermodal freight. It also ships
automotive parts and automobiles, sulfur, fertilizers, other chemicals, forest products, and
Minnesota Comprehensive Statewide Freight
and Passenger Rail Plan
2-7
Combined, the DME and ICE properties
added 472 miles of track (564 total, including trackage rights) in
Minnesota, and 2,500 route miles throughout the Upper Midwest to
the CP’s portfolio.
other types of commodities. The busiest part of its railway network is along its main line
between Calgary and Vancouver.
CP has had a lengthy presence in the State through its controlling ownership of the Soo Line
Railroad, which served the upper Midwest. In 1985, CP purchased the remaining assets of the
Milwaukee Road, giving it a more direct through route between Chicago and the Twin Cities.
Combined with CP’s existing lines west of the Twin Cities, a stronger link between Chicago, the
upper Midwest and western Canada could thus be established through gateways at Portal, North
Dakota and Noyes, Minnesota. Subsequent to the Milwaukee acquisition, the CP’s Midwestern
network shrank considerably through a series of line spin-offs. This trend was reversed in
September 2007 when CP initiated acquisition of the Dakota Minnesota and Eastern (DME) and
its affiliate the Iowa, Chicago, and Eastern (ICE); ironically, the latter had been spun off by the CP
in 1997, and had passed through several owners prior to its reacquisition. Combined, the DME
and ICE properties added 472 miles of track (564 total, including trackage rights) in Minnesota,
and 2,500 route miles throughout the Upper Midwest to the CP’s portfolio. Many elements of
DME’s operations are slowly being absorbed into the CP, but the firm is expected to remain as an
identifiable subsidiary entity under the CP umbrella.
The DME acquisition brought with it rights to build an
extension west into Wyoming’s Powder River Basin (PRB).
Planning for this controversial and costly ($6 billion in
20068) extension began in 1997, with the DME receiving
final Surface Transportation Board approval to construct
the line nine years later in February, 2006. By the time
this approval was secured however, the future of this
project had started to dim. The likelihood of its
construction was further diminished subsequent to the CP
transaction, with the recession, turmoil in the financial
markets, flattening electricity demand, and possible
imposition of new regulations on carbon-based fuels from
pending climate change legislation all contributing factors.
Although CP remains publicly committed to its construc-
tion and is preserving its option to build into the PRB,
recent actions indicate that the project is not presently a
high priority.
Prior to the DME acquisition, Minnesota had become more of a through state for the CP, and traffic
volumes thus depend heavily on general economic trends in North America, and not so much on
local conditions. However, with the DME acquisition this trend has been reversed to some degree.
The commodity mix remains largely the same, consisting largely of agricultural products, ethanol,
fertilizers, and coal, most of which moves in high volume unit train service. Intermodal service is
available at Shoreham Yard in the Twin Cities, with access to all major markets on the CP, including
8 http://www.dmerail.com/Media/News%20Releases/060815%20STB%20WDR%20Ruling.pdf.
Minnesota Comprehensive Statewide Freight
and Passenger Rail Plan
2-8
Chicago, Calgary, Winnipeg, Vancouver, and points east. Service to Kansas City and Mexico is likely
to be implemented in the near future. In 2009, CP projects to handle approximately 83,000 lifts at
Shoreham, a decline of more than 20 percent from previous years.
2.3 Freight Rail Industry Environment
2.3.1 Economics of Class I Railroads
The present rail industry is a reflection on its history as one of America’s oldest large-scale
geographically dispersed commercial enterprises. From its beginnings in the 1830s to World
War I, the railroad industry had established itself as the dominant form of land transportation
through its ability to move large volumes of passengers and freight much more rapidly and
efficiently than any other mode. However, by the 1920s, when the rail network had reached its
largest size of more than 250,000 miles, it was generally recognized that too many lines had
been constructed, that competition among railroads had weakened the financial outlook for the
once all-powerful industry, and that trucks were evolving to the point where they could compete
for freight. It was also apparent that automobiles, buses, and – somewhat later – airplanes
would take most of the passenger traffic away. The faster and more flexible highway mode had
begun to make inroads into the railroads’ traffic during the 1920s, a trend that then continued
largely unbroken – with the exception of World War II – for almost 70 years.
By the 1990s, the size of the rail network had declined by almost one-half, and the rail indus-
try’s shares of traffic and especially transportation revenue had dropped dramatically.
Mergers, which had begun almost as soon as railroads were first constructed, have continued
until only a handful of major carriers remain.
In Minnesota, mileage declined from a peak of over 9,100 miles in 1920 to 4,545 in 2007, with most of
the reduction occurring between 1970 and 1990, and the number of Class I carriers dropped from 10
to four over a space of just 14 years between 1970 and 1985.
At the same time as the primary railroad network was being consolidated, many lower density
lines were spun off as small railroads. By 2007, these railroads operated one-third – 45,800
miles – of the 140,100-mile U.S. network, and, for commodities other than coal and intermodal,
they handled 41.5 percent of all rail shipments in North America.9 Short lines have come to
perform a critical transportation function for smaller agricultural and industrial product
shippers, connecting them to the Class I railroad mainline services, for whom they generate a
significant volume of revenue (20 percent for BNSF, for example).
9 Martland, Carl D., and Steve Alpert Research Priorities for Regional and Short Line Railroads, Research
Report prepared for the American Short Line and Regional Railroad Association, Department of Civil and
Environmental Engineering, Massachusetts Institute of Technology, December 2006.
Minnesota Comprehensive Statewide Freight
and Passenger Rail Plan
2-9
In addition to rationalizing the network, the industry greatly improved operating efficiency
through the use of better technologies for track, equipment, and communications and opera-
tions control. New technologies allowed the operation of longer trains with heavier cars and
smaller crews, and the costs of shipping by rail continued to decline. New vehicle designs
allowed railroads to compete effectively with both barge and truck competition. Larger cars,
dedicated unit trains, and better track structure enabled much cheaper transport of coal, grain
and other bulk materials. Multilevel automobile carriers allowed railroads to compete effec-
tively with trucks for serving automobile assembly plants. Intermodal innovations, especially
the introduction of double-stack container trains, allowed railroads to remain competitive for
long-haul shipments of general merchandise.
The net effect of these improvements, combined with long-term economic growth, has resulted
in a situation where rail traffic has grown in terms of ton-miles and tonnage, but not in terms of
revenue and commodity value transported. Whereas railroads produced 28 percent of intercity
freight ton-miles in 2005, they carried only five percent of the value of commodities trans-
ported by all modes in the U.S.10 The railroads’ modest share of overall freight value and
revenues produced is caused by several factors, of which the nature of the commodities handled
by the railroads, service quality (trip times, reliability) vis-à-vis motor freight, and the markets
served by the railroads have had the most influence. Railroads attain their greatest efficiency
and competitive advantage over other modes when handling large volumes over longer dis-
tances in point to point service. Thus, coal has been the single largest commodity hauled for
many years, accounting for around 40 percent of originated tons, followed by chemicals, farm
products, and nonmetallic minerals, each with between seven percent and nine percent of total
tons. Intermodal is in fifth place with over six percent of originated tons. The actual share is
somewhat higher, as figures for the commodity-specific categories include some traffic that
moves intermodally in addition to carload and unit train service.
Competitive pricing has been a critical factor in the railroads’ ability to stabilize and at least
maintain its market share. Rail rates to shippers dropped following economic deregulation in
1980, allowing the railroads to hold market share, but at the cost of revenue and profitability.
Between 1980 and 2002, railroad freight revenues remained essentially flat in current dollars,
and were only partially offset by increases in productivity, asset sales, and other business
strategies. The result was a relatively low rate of return on investment for the railroads. In the
1980s, calculations by the Interstate Commerce Commission (predecessor to the Surface
Transportation Board) indicated that the railroads’ return on net investment (ROI) fluctuated
between two and six percent, compared to a cost of capital that ranged between 12 and
18 percent. Since then, the industry’s rate of ROI has improved, albeit slowly.
10 From forthcoming AASHTO Freight Bottom Line Update, based on IHS-Global Insight TRANSEARCH
Insight data.
Minnesota Comprehensive Statewide Freight
and Passenger Rail Plan
2-10
While these rates of return may seem robust
for transportation carriers, railroads must carry the full burden of
building and maintaining their own
infrastructure. They are among the most capital
intensive of all industries and thus require far
greater access to capital.
Following the recession of 2001 to 2002, the railroads’
ROI began to surpass historic trends, reaching a high
of 10.17 percent in 2007 for the Class I railroads as a
whole. However, this still placed the industry below
the Surface Transportation Board’s calculated cost of
capital of 11.33 percent, and the industry as a whole
continues to generate less revenue than is desirable
from the standpoint of it needs. While these rates of
return may seem robust for transportation carriers,
railroads must carry the full burden of building and
maintaining their own infrastructure. They are among
the most capital intensive of all industries and thus
require far greater access to capital. Between 1995
and 2004, the rail industry invested 17.8 percent of its
revenues in capital (16.7 percent between 1998 and
2007). By contrast, U.S. manufacturing industries
spent an average of 3.5 percent, with the electric utility
industry topping the group at 11.6 percent. And with
few exceptions, the rail industry must continue to
make capital investments and maintain track, bridges,
and locomotives across its network regardless of the
business cycle. It cannot disinvest itself of mainline track or discontinue maintenance during
recessions without ceasing revenue-generating service. This situation encourages railroads to
be highly risk-averse.
The relatively low rates of return, high capital needs, and lack of liquidity (i.e., the inability to
quickly and easily sell track and right-of-way), has traditionally made railroad stock less attrac-
tive to Wall Street and investors looking to invest in high growth and profit industries. This has
resulted in a persistent shortfall or gap between what the railroads “should” be investing out of
their revenues to maintain the rail network, expand it, and grow market share and what they
can afford to invest. Through the 1990s, this shortfall was about $2 billion annually for the
Class I railroads. The gap closed during the 2002 to 2007 traffic boom, but was still estimated
at about $1 billion per year despite record revenues and investment by the railroads in those
years.
It should be noted that the largest share of capital investment goes to maintaining existing infrastructure
in a state of good repair, and purchasing new rolling stock. Relatively little is left over for infrastructure
expansion and this investment is focused on high growth, high density, and most profitable lanes.
The rise in returns from 2003 onward has in part occurred due to a rapid rise in traffic volumes
without associated increases in capacity among both the railroads and their highway
competition. This allowed railroads to raise rates and generate greater profits, thereby boosting
stock prices and generating greater attention on Wall Street. To deal with this new business
Minnesota Comprehensive Statewide Freight
and Passenger Rail Plan
2-11
environment, the railroads adopted a number of strategies. A primary strategy has been to
focus on their “hook and haul” business – the high-density, long-haul freight movements where
large volumes enable economies of scale in operation and revenue generation. This meant
giving priority to intermodal container movements from West Coast ports, unit coal trains from
the Powder River Basin to Midwest, Southeast, and East Coast utilities, and unit grain trains to
Pacific Northwest and Gulf ports. Railroads also faced strong political pressure to maintain
capacity, service, and price in the energy and intermodal markets, so infrastructure expansion
has been focused on the coal lines out of the Powder River Basin and the intermodal lines out of
Ports of Los Angeles and Long Beach.
A second strategy has been to increase prices and reduce service to divest of lower-profit traffic.
This happened across many rail markets, where growing bulk and intermodal traffic was
squeezing out carload traffic. The use of such strategies to allocate rail service makes business
sense from the railroads’ perspective, but for individual shippers and some short lines that are
“captive” to a single railroad, higher rail rates and inferior service mean lower profits, smaller
market share, and in some cases the risk of business failure.
Because the carload business still accounts for a large and profitable element of the railroads’
business, the railroads are pushing a third strategy, which is to encourage consolidation of car-
load traffic at centers on their main lines. Logistics parks, transload centers, and grain
consolidation facilities enable the railroads to continue to provide carload service, but do it as a
more operationally simple “hook and haul” operation. To provide collection and distribution
services to these centers, the Class I railroads continue to transfer low-density branch lines to
short line railroads, who can operate at lower cost than the Class I railroads, and encourage
shippers to truck shipments to the centers. This has been an effective strategy in maintaining
rail services in some markets, but at the cost of transferring risk to the short line operators and,
where trucks are substituted for rail, increased pavement and bridge maintenance costs to the
public sector.
2.3.2 Short Lines
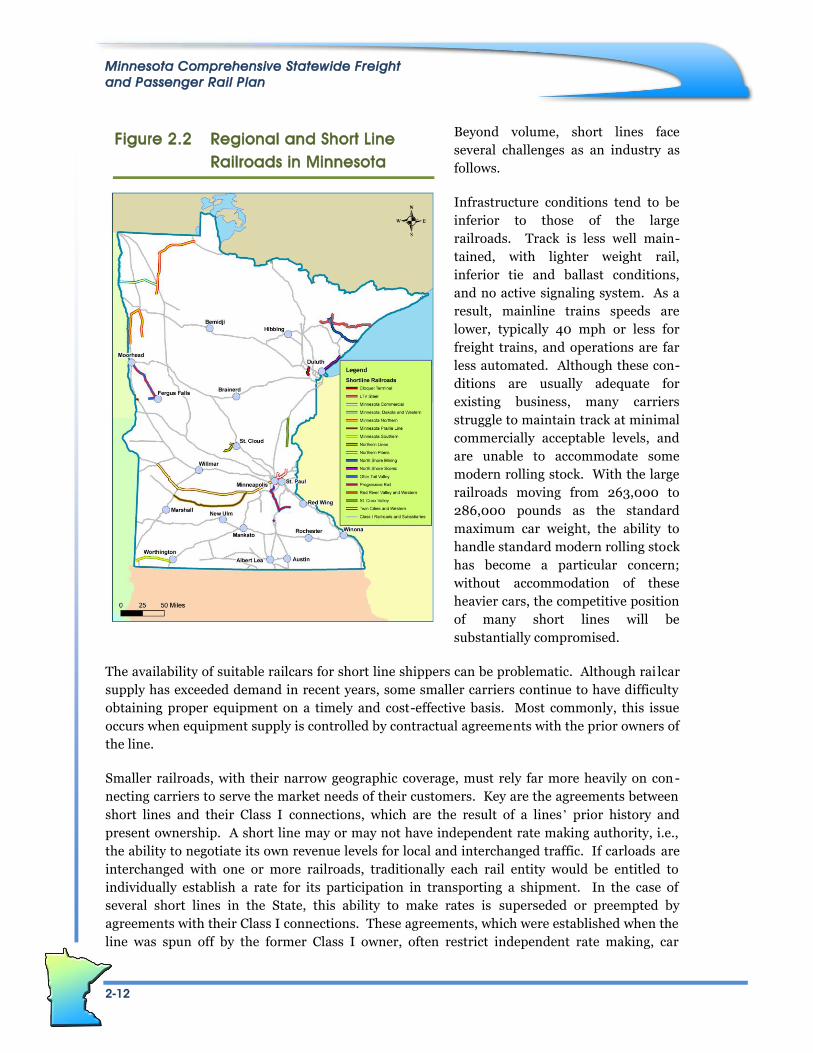
In recent years, the short line industry has consisted of a mix of profitable and marginal
performers. The short line route network in Minnesota is shown in Figure 2.2.
The volume of traffic handled by a short line has a direct impact on track maintenance levels,
speeds, service reliability, and ultimately the financial viability of the short line service.
High-volume markets and lines have done relatively well; low-volume markets and lines
struggle. The national trend toward consolidation of short line ownership and some consoli-
dation of low-density lines and collector/distributor functions has improved the business
outlook for short lines in some areas. This trend has not emerged in Minnesota, which can be
attributed to the minimal presence of short line holding company ownership in the State. It
is apparent that some Minnesota short lines operating in Minnesota and elsewhere are not
meeting critical volume thresholds, and services and investment in track and equipment is
declining.
Minnesota Comprehensive Statewide Freight
and Passenger Rail Plan
2-12
Beyond volume, short lines face
several challenges as an industry as
follows.
Infrastructure conditions tend to be
inferior to those of the large
railroads. Track is less well main-
tained, with lighter weight rail,
inferior tie and ballast conditions,
and no active signaling system. As a
result, mainline trains speeds are
lower, typically 40 mph or less for
freight trains, and operations are far
less automated. Although these con-
ditions are usually adequate for
existing business, many carriers
struggle to maintain track at minimal
commercially acceptable levels, and
are unable to accommodate some
modern rolling stock. With the large
railroads moving from 263,000 to
286,000 pounds as the standard
maximum car weight, the ability to
handle standard modern rolling stock
has become a particular concern;
without accommodation of these
heavier cars, the competitive position
of many short lines will be
substantially compromised.
The availability of suitable railcars for short line shippers can be problematic. Although rai lcar
supply has exceeded demand in recent years, some smaller carriers continue to have difficulty
obtaining proper equipment on a timely and cost-effective basis. Most commonly, this issue
occurs when equipment supply is controlled by contractual agreements with the prior owners of
the line.
Smaller railroads, with their narrow geographic coverage, must rely far more heavily on con -
necting carriers to serve the market needs of their customers. Key are the agreements between
short lines and their Class I connections, which are the result of a lines’ prior history and
present ownership. A short line may or may not have independent rate making authority, i.e.,
the ability to negotiate its own revenue levels for local and interchanged traffic. If carloads are
interchanged with one or more railroads, traditionally each rail entity would be entitled to
individually establish a rate for its participation in transporting a shipment. In the case of
several short lines in the State, this ability to make rates is superseded or preempted by
agreements with their Class I connections. These agreements, which were established when the
line was spun off by the former Class I owner, often restrict independent rate making, car
Figure 2.2 Regional and Short Line
Railroads in Minnesota
Minnesota Comprehensive Statewide Freight
and Passenger Rail Plan
2-13
supply, and the interchange of cars to the line’s original owner, even if connections to other
Class I carriers are available. This process was designed to allow the seller to retain some of the
benefits of unique access to businesses on the branch, often in return for favorable purchase
terms. These rate and operating restrictions, or the ability of the short line to only interchange
with one railroad due lack of other connections, creates what is known as a “captive” short line.
Although most of these restrictive terms are contractually agreed relationships, with advantages
or compensation accruing to both parties to the agreement, in a few cases the restrictions have
led to ongoing inefficiencies, such as unintended increases in short-haul switching moves at or
near the interchange point, and insufficient revenue yields with detrimental effects on the
carriers’ ongoing viability. In some cases, short lines have had to forego new business that
would have been logically routed onto another connecting Class 1, or divert natural rail traffic
onto trucks to reach final destinations that are otherwise rail accessible.
While the terms creating these “captive” conditions are a matter of private contract and have
been deemed acceptable under Federal law concerning interstate commerce, it is notable that i f
and when the State of Minnesota were to purchase track that is being abandoned, and maintain
it in revenue service for local economic benefit (similar to state-owned rail properties in
Wisconsin, Michigan, Georgia, and Vermont), these restrictions should not be acceptable to the
State. Any operating entity on this track would be expected to have unrestricted access to all
connections and freedom to negotiate compensation with shippers, within the strictures of both
interchange agreements, STB case law, and state oversight.
2.4 What’s Next for the Freight Rail Industry?
Overall, the rail industry today has become stable, productive, and competitive, with enough
business and profit to operate, but not to replenish its infrastructure quickly or grow rapidly.
The railroads’ return on investment has been increasing; a major achievement of an industry
that just a few decades ago was struggling financially. However, as economic growth picks up,
it is risky to assume that rail traffic (or freight in general) will simply resume its former growth
patterns, and with it, that the private railroad industry will be able to maintain, let alone
increase investment to expand capacity and improve service. More likely, the railroads stand at
the threshold of major changes that may be as extensive as those that occurred following
deregulation in 1980. Three factors are particularly concerning:
A rapidly changing customer base;
Ongoing initiatives to modify economic regulation; and
Shifting modal economics.
Although any or all of these potential changes may impart some beneficial effects on railroad
industry, they also have the potential to be negative, or at the very least engender substantial
uncertainty that will affect their willingness to invest. Each of these elements is elaborated on
below.
Minnesota Comprehensive Statewide Freight
and Passenger Rail Plan
2-14
2.4.1 Customer Base
Although a railroad’s traffic base constantly evolves to some degree, three of its most important
sectors are expected to undergo major transformations: automobiles, international trade, and
coal. With the bankruptcy of General Motors, the United States’ largest domestic automaker,
and the substantial distress by most others, longstanding patterns of auto manufacturing and
distribution are being upended. Annual sales volumes, which regularly exceeded 17 million
units only a few years ago, are now running at less than 10 million, and few analysts expect
them to exceed 14 to 15 million any time in the next decade. Not only is the automobile
industry a significant railroad customer, ranking sixth in 2007 revenues by commodity, many
other important rail-oriented industries, such as chemicals and steel, also are substantial
suppliers to the auto industry.
International trade, the primary driver behind the boom in intermodal traffic from the mid-
1980s until 2006, has ceased being an engine of growth for the railroads. Although volumes are
expected to increase as the economic recovery gets underway, it is unlikely to reach the levels of
growth that were achieved in recent years.
Coal, which has represented roughly one-quarter of the railroad’s revenues and upward of
40 percent of its ton-miles, faces considerable uncertainty as a fuel. Major recent discoveries of
natural gas in the United States as well as rising concerns about greenhouse gas emissions are
likely to result in either stable or lower demand for coal in future years. Compounding these
effects are pending regulations that mandate cleaner emissions. These will require all coal -
burning plants to implement scrubbing, which will affect the heavy dependence on low sulfur
Powder River Basin (PRB) coal. Once PRB coal requires scrubbing, coalmines that are located
closer to the Midwestern electric utility plants will become more attractive, since the cost of
transportation far exceeds that of the coal itself. Midwestern coal fields will benefit, as will the
barge industry operating on the Mississippi River System, which has served some of these
markets in the past.
2.4.2 Economic Regulation
The Staggers Rail Act of 1980 substantively deregulated the rail industry. The railroads have
successfully fended off a series of legislative attempts at changing the fundamental conditions
of the Staggers Act. However, since 2006 the Surface Transportation Board has made signifi -
cant changes to their procedures to make them more attuned toward shippers. This more
“shipper-friendly” attitude also was evident recently when the STB issued several rate case
decisions in favor of shippers that only a short time ago would likely have favored the railroads.
Furthermore, the current Congress is developing legislation that may further tilt the regulatory
balance against the railroads by modifying longstanding provisions that the industry has
enjoyed. How these changes may impact the financial performance of the industry is not
known, but they are very unlikely to improve them.
Minnesota Comprehensive Statewide Freight
and Passenger Rail Plan
2-15
2.4.3 Shifting Modal Economics
Significant challenges faced by motor freight, the railroad’s primary competitor and sometime
collaborator, stand to influence future rail traffic in a direction that could either benefit or
disadvantage them. The rail industry’s improving financial performance that began in the early
1990s is in part attributable to disproportionate increases in costs faced by motor carriers ver-
sus railroads. Rising diesel prices, growing highway congestion, reduced driver utilization
resulting from new hours of service regulations, and a continuous shortage of long-haul truck
drivers at prevailing wages, not only raised costs but also narrowed the service gap. One
outcome was the development of new intermodal business with long-haul trucking firms which
could use the railroads to carry their shipments in some major lanes as a transparent substitute
for over-the-road line-haul operation. Two of the largest truckload firms, J.B. Hunt and
Schneider National, have subsequently become among the railroad’s largest customers.
The impacts of evolving Federal transportation policy add to the uncertainty. The Highway
Transportation Trust Fund, which for decades has funded most capital investment in highways
through user fees, is insolvent. Starting in FY 2009, the Federal Government has used general
funds to bridge shortfalls, but longer-term solutions are very much still in flux. However, some
form of increased user fees seem inevitable, irrespective of how highway investments will be
funded. While there is some agreement in the trucking industry about the need to increase
these fees, many in the industry are demanding a productivity boost in return through changes
in Federal truck size and weight regulations. Maximum weight has been set to 80,000 pounds
since 1983, and long combination vehicles were limited to certain highways located primarily in
the West since 1991.
The economic impact of a nationwide increase in truck size and weight on the rail industry has
been a matter of contentious discussion for many years. However, any significant changes in
truck size and weight beyond current limits that are broadly applicable will provide productivity
gains to trucking firms that will tilt modal economics toward highway transport. Short lines are
likely to bear the brunt of these impacts disproportionately, given their heavy orientation
toward small volume carload traffic hauling commodities that are most readily divertible to
truck. Perhaps the impact on Minnesota’s short lines may be less severe, given a traffic mix
that is more oriented toward low-value bulk commodities.11
11 Mn/DOT examined changes in truck size and weight standards within the state in a 2006 study. However,
the study did not quantify the impact on railroads; in large part because most of the scenarios affected
short-haul truck trips that were not attractive to railroads, even to short lines. One recent study found
that an increase in truck weight from 80,000 to 97,000 pounds could reduce merchandise traffic volumes
by 44 percent and overall traffic by 17 percent. Carl Martland, Estimating the Competitive Effects of
Larger Trucks on Rail Freight Traffic, September 2007.
Minnesota Comprehensive Statewide Freight
and Passenger Rail Plan
2-16
2.5 Freight Rail Investment and Financing
Practices
Being privately owned, it is obvious that the sources of funds to operate, maintain, and improve
a freight railroad are drawn from private capital. However, while this is largely true, there are
exceptions, some recent, and others longstanding. This is particularly the case with short lines,
where some degree of public funding has been rather common. Table 2.2 lists the typical
sources of funding for operations and maintenance, and the primary categories of capital
investment by carrier type. Entries marked with a green background indicate funding from
public sources, which could be through direct (grants, loans, etc.) or indirect (tax credits,
abatements, etc.) means.
Table 2.2 Typical Sources of Funding of Rail Operations and
Infrastructure
Typical Sources of Funding
Cost Category Class I Carriers Class II and III Carriers
Operations and
Maintenance
Private capital – Cash flow Private capital – Cash flow, loans,
etc.
Capital Maintenance and
Expansion
Private capital – Cash flow, loans,
stock, etc.
Private capital – Cash flow, loans,
stock, etc.
Tax credits, public loans and grants
Cars and Locomotives Private capital – Direct ownership,
third-party lease
Private capital – Direct ownership,
third-party lease
Grade Crossings Private capital – Cash flow Private capital – Cash flow
Federal Section 130 and state/local match
Customer Facilities Private capital – Customer cash flow,
loans, etc.
Private capital – Customer cash flow,
loans, etc.
Freight rail and economic development assistance programs
2.6 Value of Rail Industry to Minnesota
Economic development of Minnesota was heavily shaped by the railroads, which opened up
access to its fertile lands and connected the region together through an integrated network.
They continue to provide considerable value to the State, through their services to shippers,
employment of its residents, and support of its institutions through various taxes.
Direct measures of value include carrier revenues associated with traffic handled in Minnesota,
payroll size, services purchased, taxes paid, capital invested, and valuation of plant and prop-
erty. More indirect measures include the value of goods transported, indirect employment, and
the contribution to state GDP of industries served. In this section three direct measures are
examined:
Minnesota Comprehensive Statewide Freight
and Passenger Rail Plan
2-17
Employment;
Plant and property; and
Corporate tax contributions to the State.
The following sections detail and provide estimates for each of these measures. Data for much
of the material that follows was obtained through e-mail correspondence with the Minnesota
Department of Revenue (MNDOR).
2.6.1 Employment, Wages, and Payroll Taxes
Employment is an indication of the importance of the railroad industry to the State’s workforce,
directly as a career choice, and indirectly as a market to which goods and services can be sold, in
effect the multiplier effect from employment driven economic activity. Given the massive con-
traction in rail employment over the past 50 years, it is useful to note not only current
employment, but also the number of retirees and beneficiaries that are drawing railroad pensions.
Data on industry employment and wages are readily available from several sources. The
Railroad Retirement Board (RRB), a Federal agency that administers the railroad retirement
system (which is separate from Social Security), maintains statistics on active and retired
employees. Information on aggregate wages paid by the State was drawn from the AAR’s state
fact sheets, for which 2007 is the most current year.12
In 2008, Minnesota RRB records indicated employment of 4,500 individuals. With typical
average wages of $71,400 (plus $28,400 in fringe benefits), the total freight-related payroll of
Minnesota’s railroad employees was $321.3 million. These figures include Amtrak employees
domiciled in Minnesota, which totaled 43 individuals in 2008.13 The net revenue to the State
from payroll taxes of active railroad employees amounts to 4.66 percent of $321.3 million, or
$15.0 million.
In addition to the 4,500 active employees, 7,600 retired employees live in Minnesota, and a
further 7,986 are beneficiaries of railroad retirement. This latter group is made up of spouses
and survivors of deceased railroad employees. For all retired railroad employees, the industry -
wide average annual remittance was $23,760, $8,800 for spouses, and $14,580 for survivors.
In Minnesota, the net payout to these beneficiaries amounted to approximately $277 million in
2008, not much less than the active payroll.
12 http://www.aar.org/~/media/AAR/InCongress_RailroadsStates/Minnesota2.ashx.
13 http://www.amtrak.com/pdf/factsheets/MINNESOTA08.pdf.
Minnesota Comprehensive Statewide Freight
and Passenger Rail Plan
2-18
2.6.2 Plant, Property, and Corporate
In Minnesota, railroads pay an annual assessment on the property that they use for conducting
their business. The Commissioner of Revenue, using data supplied by the railroads, estimates the
value of property that is used for operating purposes annually. The estimate is not based on
direct evaluation of each individual property, but rather carrier financial data. For publicly held
carriers, property values are calculated on the basis of cost, income, stock price, and debt levels;
for privately held firms, original cost and income are used. In Minnesota, these property tax rates
are uniform, and the treatment for rail yards and main lines is identical. Property that is not used
for operating purposes is assessed and taxed by the local jurisdiction in which it is located.
For taxes payable in 2008, MNDOR estimated a market value of rail property at $676,443,314,
resulting in a net tax of $20,657,836.
Since the market value of rail property is estimated from an allocation of current revenues
attributed to activity in Minnesota, the current average capital spending to revenue ratio for the
industry as a whole, 14.7 percent between 1998 and 2007, can be applied to estimate annual
expenditures for capitalized maintenance and infrastructure improvements. This permits an
indication of the industry’s ability and willingness to maintain its plant and property, and offers
a comparison with estimates for capital needs. Using the above figures, 2008 capital
investment in Minnesota would have been roughly $100 million. This amount appears to
represent a minimum, and reflects continued disinvestment from non core routes, particularly
among the smaller railroads. This amount is used in Chapter 7 to estimate the ability of the
railroads to contribute to the proposed capital program.
In addition to property and payroll taxes, railroads also pay income and corporate franchise
taxes to the State. According to the Minnesota Department of Revenue (MDOR), the liability
for these taxes was $12.8 million in 2007.
2.7 Passenger Rail
Minnesota has two active passenger rail services – Amtrak’s Empire Builder and the Northstar
commuter rail service. The Empire Builder operates one train per day between Chicago and
Seattle/Portland, with stops in Minnesota in Winona, Red Wing, St. Paul, St. Cloud, Staples,
Detroit Lakes, and Fargo. The Northstar commuter rail service began operations between Big
Lake and Minneapolis as this Plan was being completed.
Although Amtrak’s presence in Minnesota is limited to the one daily train each way, both the
Empire Builder and its patronage by Minnesota riders are standouts in Amtrak performance.
The Twin Cities boasts the highest boardings and alightings of any station in the U.S. served by
a single frequency. Local stops in Red Wing, St. Cloud, Staples, and Fargo/Moorhead show
above-normal ridership generation. The Empire Builder’s cost recovery performance is near
the top among national system trains, second only to the Auto Train between the east central
states and Florida. During the run-up in gasoline prices in 2008, every Minnesota station
showed ridership increases of up to 15 percent despite a perpetually sold-out condition on this
service, limiting any larger potential for growth.
Minnesota Comprehensive Statewide Freight
and Passenger Rail Plan
2-19
Over the years, a number of studies have examined proposed new intercity passenger services
in Minnesota. The Intermodal Surface Transportation Efficiency Act (ISTEA) of 1991 identified
HSR corridors throughout the nation. At around the same time, the state departments of
transportation from Minnesota, Wisconsin, and Illinois were completing the Tri-State Rail
Study, outlining route and service alternatives between Chicago, Milwaukee, and the Twin
Cities. That study looked at two broad corridors – a northern and a southern option. The
Southern Corridor studied three alternative routings within the corridor – along the existing
Amtrak route, a corridor through La Crosse and Rochester, and a corridor that included both
Madison and Rochester. The Northern Corridor included four alternative routings in northern
Wisconsin.
By 1996, Minnesota was part of the Midwest Regional Rail Initiative (MWRRI), which
envisioned a HSR network serving the Midwestern states centered around a Chicago hub. In
2000, Minnesota and Wisconsin commissioned the Tri-State Study II. This study showed that
a Milwaukee to Twin Cities connection through Rochester, including a route that involved new
alignments between Rochester and the Twin Cities and Winona, had the best benefit/cost ratio
of the alternatives studied and should be implemented following the incremental upgrading of
the existing Amtrak route. By 2004, the MWRRI routes showed Milwaukee to Twin Cities
through Madison but not Rochester. Development of the Madison-Twin Cities route continued
through 2008 with the preparation of environmental documentation.
As these studies were underway, two other intrastate intercity HSR corridors were being
examined. The Minneapolis-Duluth/Superior corridor, now known as the Northern Lights
Express, was studied to restore and improve upon passenger rail service that was suspended in
1985. In 2000, an initial concept study for intercity passenger rail service was produced. In
2007, a more comprehensive business plan for 110 mph rail service was prepared for a consor-
tium of counties and regional rail authorities, which led to the creation of the Minneapolis-
Duluth/Superior Passenger Rail Alliance (the “Alliance,” a consortium of county regional rail
authorities). Mn/DOT has received FRA funding for the preparation of a Preliminary
Environmental Impact Statement, including associated engineering reviews, for the proposed
route along the BNSF rail lines. SRF Consulting Group is leading a consultant team performing
this work with the Alliance in cooperation with the Minnesota and Wisconsin DOTs and the
FRA.
HSR via Rochester has been discussed in Midwest HSR studies going back to the 1991 Tri-State
Study and in early MWRRI reports. In 2003, Mn/DOT, with the cooperation of the City of
Rochester, produced a study on the feasibility of a new route for HSR between the
Minneapolis/St. Paul International Airport and the Rochester International Airport. The City
of Rochester, Olmsted County, Mayo Clinic, and Rochester Area Chamber of Commerce formed
the Southeast Minnesota Rail Alliance, which advocates for passenger rail service through
Rochester and a new freight rail bypass around Rochester called the Southern Rail Corridor
alignment. In September 2009, the Southeast Minnesota Rail Alliance produced a new study
on the Rochester route, the “Tri-State III High-Speed Rail Study: Minnesota Segment
Assessment.” This study supports an alignment of Twin Cities to Chicago service through
Rochester on a new alignment, and questions extensive investment in the River Route.
Minnesota Comprehensive Statewide Freight
and Passenger Rail Plan
2-20
The Minnesota High-Speed Rail Commission is a joint powers board which also plays a role in
advancing HSR projects. The group, focused on the River Route for HSR between the Twin
Cities and Chicago, involves Regional Rail Authorities from Ramsey, Washington, Dakota,
Goodhue, Wabasha, and Winona counties. Just as the St. Louis and Lakes County Regional
Railroad Authority acts as the financial agent and lead Authority for the NLX Alliance, so the
Ramsey County Regional Railroad Authority serves as the financial agent and lead Authority for
the Commission. The Commission will comment on corridor plans, advocate with the
Legislature for HSR funding and corridor alignments, and coordinate public outreach and
education efforts on behalf of passenger rail in the corridor.
As this Plan was just getting underway, in
February 2009, the United States Congress
enacted the American Recovery and
Reinvestment Act of 2009, appropriating $8
billion for HSR and intercity passenger rail
services. This appropriation followed the enact-
ment of the Passenger Rail Investment and
Improvement Act of 2008 in October 2008,
authorizing new programs for high-speed and
intercity passenger rail. More information about
these programs is found in Chapter 7 of this
report. In order to develop consensus
recommendations on how to respond to grant
application cycles before the completion of the
State Rail Plan (and identification of HSR corri-
dors therein), Mn/DOT created the Intercity
Passenger Rail Forum.16 The Forum advised
Mn/DOT on which projects to seek funding
through the 2009 FRA grant application cycle.
The Forum is likely to participate in further pub-
lic discussion of the State Rail Plan itself, and may
have an ongoing role in advising Mn/DOT and the
Legislature as passenger rail investment decisions
are made in the future (more discussion of post-
Rail Plan implementation also is in Chapter 7 of
this report).
14 This application for construction and final design was submitted as a Track 1 funding grant, referring to
FRA’s Strategic Plan and Grant Application guidance documents issued in 2009.
15 This application for planning funds was submitted as a Track 3 funding grant, which required a 50%/50%
federal/state funds match.
16 More information about the Passenger Rail Forum, including membership and meetings, can be found at
http://www.dot.state.mn.us/planning/passengerrailforum/index.html.
Mn/DOT submitted two grant applications in August 2009:
St. Paul Urban Depot construction – Mn/DOT, in
cooperation with the Ramsey County Regional
Railroad Authority, prepared an application for final
design and construction of the St. Paul depot
renovation project, to serve as a multimodal hub for
light rail, commuter rail and intercity rail services.14
The
application sought $135,800,000 in Federal funding,
to match $101,700,000 in other Federal and local
funds applied to the project.
Minnesota-Wisconsin Service NEPA – Mn/DOT, on behalf
of the Wisconsin Department of Transportation, sought
$600,000 in Federal funding,15
to be matched by
$600,000 from both state DOTs, to support the
completion of a high-level environmental review of
corridors between Milwaukee and the Twin Cities. This
would result in a Service Level NEPA document, which
combined with other materials of the MWRRI, would
comprise a Service Development Plan, and permit
both states to seek further development funds for the
entire corridor from the FRA.