Embed Size (px)
Citation preview


and hosted by the UN FAO NRCE
Workshop funded and organized by University of Maryland, NASA, USDA/FAS, UN FAO, and the GEO Secretariat
ftp://ftp.iluci.org/GEO_Ag
It is planned for this report to be available through the GEO Secretariat and IGOL websites. In the meantime it can be downloaded from:
2

3
Report from the Workshop on Developing a Strategy for Global Agricultural Monitoring in the framework of Group on Earth Observations (GEO), 16-18 July 2007, FAO, Rome
Table of Contents
Executive Summary
1. The IGOL and the GEOSS Agriculture Societal Benefit Area 2. The Increasing Importance of Global Agriculture Monitoring 3. The Scope of Agricultural Monitoring
3.1 Earth Observation for Monitoring Crop Production 3.2 Earth Observations for Food Security 3.3. Earth Observation for Sustainable Agriculture 3.4 Types of Information Users and their Needs
4. Existing Agricultural Monitoring Systems
4.1 Global to Regional Agricultural Monitoring Systems 4.2 National Agricultural Monitoring Systems
5. The Components of Global Agricultural Monitoring System
5.1 Satellite Observation 5.2 In – Situ observations 5.3 Ground Survey 5.4 Data Provision and Availability
6. Why a GEOSS is needed for Agricultural Monitoring
6.1 The Need for Continuity of the Satellite Data Record 6.2 The Need for Better Coordination of Data 6.3 The Need for a Coordinated Agricultural Monitoring Community 6.4 The Need for Improved Observations 7. Developing an Agricultural Monitoring System of Systems
7.1 The Agricultural Monitoring Community of Practice 7.2 Designing the Monitoring System
8. Necessary Strategic Enhancements to the Current Agricultural Monitoring Systems
8.1 Strategic enhancements to the Satellite Observations 8.2 Strategic enhancements in the Availability of Meteorological Data 8.3 Strategic enhancements to National Agricultural Monitoring Systems 8.4 Strategic enhancements in Capacity Building 8.5 Strategic enhancements in Global Cropland Mapping
9. Relationship to other GEO Tasks 10. Workshop Recommendation Appendix A Examples of Global to Regional Agricultural Monitoring systems Appendix B Examples of National Agricultural Monitoring Systems Appendix C List of Contributors to Document Appendix D Workshop Agenda Appendix E List of Workshop Attendees Appendix F List of Acronyms

4
Report from the Workshop on Developing a Strategy for Global Agricultural Monitoring in the framework of Group on Earth
Observations (GEO)1 16-18 July 2007, FAO, Rome
Edited by Chris Justice and Inbal Becker-Reshef2 (Geography Department, University of Maryland)
Executive Summary The risk of food supply disruptions will continue to grow as our agricultural systems and the land that sustains us continue to respond to the pressures of climate change, energy needs and population increases. Understanding and monitoring global agriculture production is essential to combat both short-term and long-term threats to stable and reliable access to food for all. Strategic investments over the next 10 years in earth observations, involving satellite observations, in-situ (ground-based) measurements and survey could revolutionize global agricultural production monitoring, leading to improved management of our agricultural resources, helping to reduce malnutrition and contribute towards the achievement of the Millennium Development Goals. On July 16-18, 2007 the second IGOL/GEO workshop convened at the headquarters of the UN Food and Agriculture Organization (FAO) in Rome to develop a strategy for global agricultural monitoring in the framework of GEO. Forty-seven participants representing twenty-five national and international organizations attended and established the ‘GEOSS/IGOL Agricultural Monitoring Community of Practice’. The workshop reviewed the current state of agricultural monitoring, and following presentations, discussions and breakout sessions, revised the GEO Agricultural Monitoring Task (AG-07-03) and developed a set of priorities and recommendations calling for:
- The GEOSS/IGOL Agricultural Monitoring Community of Practice to undertake six near-term AG-07-03 subtasks:
1. Hold a workshop in early 2008 to establish best practices and future needs for national acreage forecasting.
2. Coordinate and run a set of regional experiments to determine the earth observation requirements for delivery of accurate crop area estimates early in the growing season.
1 Citation for this document. Justice C.O. and Becker-Reshef I.(Eds.) (2007) Report from the Workshop on Developing a Strategy for Global Agricultural Monitoring in the framework of Group on Earth Observations (GEO), UN FAO, July 2007, Geography Dept., University of Maryland, 66, pp 2 The list of contributing authors is given on page 60

5
3. Organize a series of regional workshops on how to integrate earth observations into national statistical reporting to achieve greater efficiency and accuracy in production and yield estimates.
4. Organize a review of satellite and in-situ data policies and convene a workshop on Agricultural Data Coordination
5. Produce and openly distribute a global croplands map at 250m maximum ground resolution to be updated annually.
6. Establish a community of practice website opening lines of communication for the community. As part of this subtask, work with the GEO Secretariat in Geneva to support a GEO Agriculture Coordinator.
- The GEO Secretariat and the GEO Architecture and Data Committee (ADC) to develop an international agreement on and implementation of a data policy that includes free and open access to data and products contributed by GEO members to support global agricultural monitoring.
- The Committee on Earth Observation Satellites (CEOS) and its member space agencies to focus on securing the space-borne assets needed for agricultural monitoring, emphasizing data continuity, reliability and timeliness of data delivery. Over the next ten years this will include the development of an international, integrated system providing global 10m resolution coverage every 5 -10 days.
- The CEOS Working Group on Information Systems and Services (WGISS) to coordinate the development of an international moderate (30m) resolution data acquisition and provision initiative, providing a global data set for the 2009-2011 period, from the available international space-borne assets.
- The UN FAO and the national agricultural agencies of its member nations and the GEO Capacity Building Working Group, to facilitate the integration of satellite data with traditional agricultural monitoring methods to achieve timely accurate and verifiable reporting of national agriculture statistics.
- The World Meteorological Organization (WMO) and its member agencies to improve the density, distribution and availability of meteorological station data and resultant products for data sparse regions to enable improved monitoring and prediction of crop conditions and production shortfalls.
1. IGOL and the GEOSS Agriculture Societal Benefit Area
Agriculture is an essential component of societal well-being. Agricultural production influences, and is influenced by, health, water quality and quantity, ecosystems, biodiversity, the economy, and energy use and supply. The seasonality and ubiquity of agriculture make agricultural practices and production amenable to efficient synoptic monitoring.
Assessing the need for enhanced agricultural observations (satellite and in-situ) is a responsibility of the Integrated Global Observations of Land (IGOL) program3. IGOL advises the Group on Earth Observations (GEO) on the requirements for improved
3 www.fao.org/gtos/igol/
6
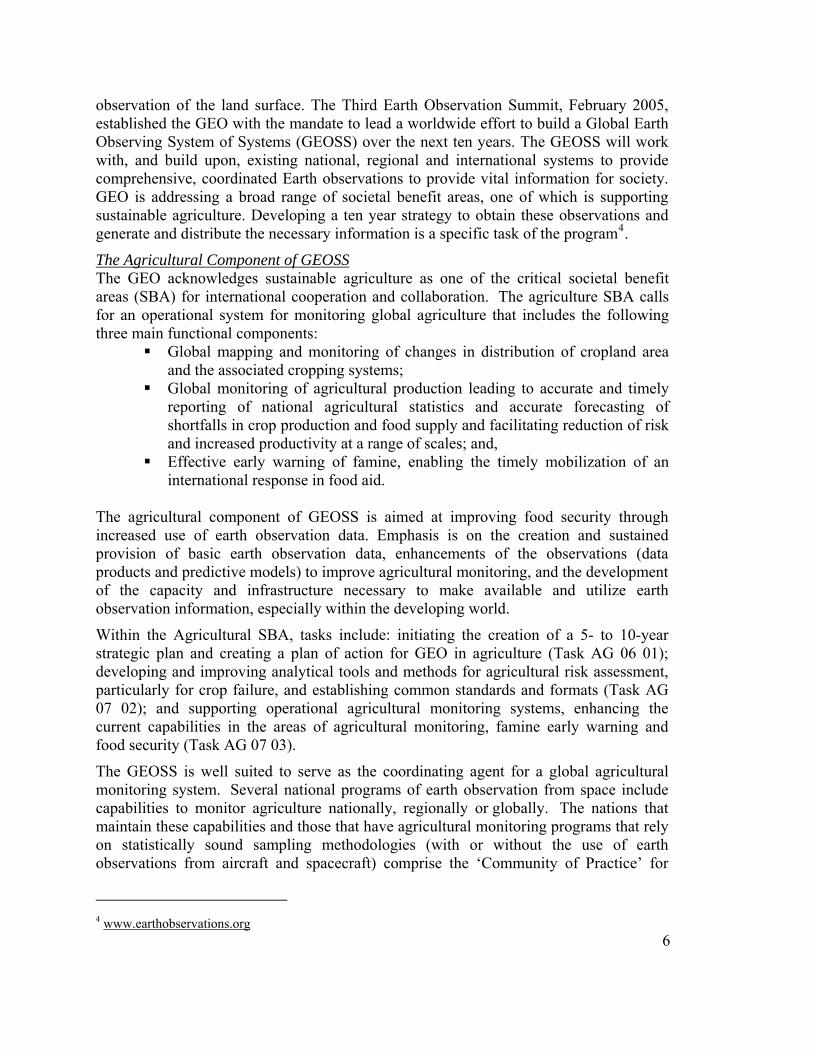
observation of the land surface. The Third Earth Observation Summit, February 2005, established the GEO with the mandate to lead a worldwide effort to build a Global Earth Observing System of Systems (GEOSS) over the next ten years. The GEOSS will work with, and build upon, existing national, regional and international systems to provide comprehensive, coordinated Earth observations to provide vital information for society. GEO is addressing a broad range of societal benefit areas, one of which is supporting sustainable agriculture. Developing a ten year strategy to obtain these observations and generate and distribute the necessary information is a specific task of the program4.
The Agricultural Component of GEOSS The GEO acknowledges sustainable agriculture as one of the critical societal benefit areas (SBA) for international cooperation and collaboration. The agriculture SBA calls for an operational system for monitoring global agriculture that includes the following three main functional components:
Global mapping and monitoring of changes in distribution of cropland area and the associated cropping systems;
Global monitoring of agricultural production leading to accurate and timely reporting of national agricultural statistics and accurate forecasting of shortfalls in crop production and food supply and facilitating reduction of risk and increased productivity at a range of scales; and,
Effective early warning of famine, enabling the timely mobilization of an international response in food aid.
The agricultural component of GEOSS is aimed at improving food security through increased use of earth observation data. Emphasis is on the creation and sustained provision of basic earth observation data, enhancements of the observations (data products and predictive models) to improve agricultural monitoring, and the development of the capacity and infrastructure necessary to make available and utilize earth observation information, especially within the developing world.
Within the Agricultural SBA, tasks include: initiating the creation of a 5- to 10-year strategic plan and creating a plan of action for GEO in agriculture (Task AG 06 01); developing and improving analytical tools and methods for agricultural risk assessment, particularly for crop failure, and establishing common standards and formats (Task AG 07 02); and supporting operational agricultural monitoring systems, enhancing the current capabilities in the areas of agricultural monitoring, famine early warning and food security (Task AG 07 03).
The GEOSS is well suited to serve as the coordinating agent for a global agricultural monitoring system. Several national programs of earth observation from space include capabilities to monitor agriculture nationally, regionally or globally. The nations that maintain these capabilities and those that have agricultural monitoring programs that rely on statistically sound sampling methodologies (with or without the use of earth observations from aircraft and spacecraft) comprise the ‘Community of Practice’ for
4 www.earthobservations.org

7
agricultural monitoring. No single national program can provide data to address all questions pertaining to agricultural monitoring at all scales. An operational program to do so requires collaboration among the existing programs, and GEOSS, by charter, is suited to coordinate such collaboration.
2. The Increasing Importance of Global Agriculture Monitoring
A number of global trends suggest an urgent need for a comprehensive, systematic and accurate global agricultural monitoring system5. More frequent extreme climate events such as floods, drought and frosts are adversely affecting agricultural production worldwide. Changes in precipitation amounts, seasonality, intensity and distribution, are impacting rain fed agriculture. Warming temperatures are changing growing seasons and melting mountain glaciers which supply water for irrigation. Further adaptation of agricultural systems to a changing climate can be expected6. Changing world demographics, economies and diets are altering the global demand for food. Global population, currently at 6.5 billion, will likely reach 9 billion by 2050. The demand for biofuels is changing crop production (for example corn for ethanol is replacing wheat and soybeans in the US Midwest), changing the area under agricultural production, altering market prices and food supply. Land use change is altering the extent of agricultural land. Extensive new areas are being opened up for agricultural production (for example for soybean production in South America), while in other regions agricultural land is being abandoned and replaced by urban or suburban development. Aquifers are being drawn down at rates beyond replacement and increasing competition for water is placing pressure on irrigation systems. Trans-national river systems used for irrigation are potential sources of conflict particularly in semi-arid environments. Poverty and conflict continue to undermine food security in Africa.
In addition, monitoring land use plays an important role in formulating climate policies and international agreements (e.g. Post-Kyoto protocols). Compliance with international agreements can be guaranteed only once agricultural extent and agricultural practices are monitored in a systematic and objective way. Observing systems of land-use and agriculture in particular can therefore help to effectively implement international agreements.
Dependable information on agricultural production and production estimates are essential for agricultural markets and the formulation of effective national and international agricultural policies. More importantly, improving such information would benefit particularly agencies working towards increasing food security in the developing world. Better information could also benefit those most susceptible to food insecurity, for example by fostering the development of insurance and microfinance systems for subsistence agricultural producers. The focus of this report is on monitoring agricultural production for early warning of harvest shortfalls, crop production and agricultural
5 L. Brown 2005. Outgrowing the Earth. Earth Policy Inst., Washington D.C. 6 FAO 2007. Adaptation to climate change in agriculture, forestry and fisheries: perspective, framework and priorities. UN FAO, Interdepartmental Working Group on Climate Change, Rome, Italy. 24pp.

sustainability. Other issues related to food security, such as genetic modification and toxicology, are not addressed.
More accurate and timely information on agricultural production is needed for three related domains: early warning of harvest shortfalls, crop production and agricultural sustainability.
Box 1. Example of rapid agricultural change in Turkey
Example of Land Use Change in Irrigated Cotton Area in the Harran Plain, Located Downstream from the Ataturk Dam in South --
August 23, 1993 -Pre Ataturk Dam & Sanliurfa
August 24, 2002 Post Ataturk Dam & Sanliurfa
Harran (Red indicates irrigated
fields.Harran
(Irrigated fields shown
in red)
Location of Ataturk Dam and Harran Plain The above images were collected from the Landsat-5 satellite during August 23, 1993 and Landsat-7 during August 24, 2002. The false color composites were processed by loading Landsat bands 4, 5, and 3 into the red, green, and blue channels, respectively.
eastern Turkey
Harvest Shortfalls - Early Warning
Under-nourishment and food insecurity are persistent problems that inhibit economic development and hamper efforts to reduce poverty. More than 850 million people are currently undernourished, particularly in Asia (India, Bangladesh, and Nepal) and sub-Saharan Africa, where about one-third of the population is undernourished. Under-nourishment perpetuates poverty by reducing maternal health and gender equity, increasing child mortality and susceptibility to disease, and impairing learning capacity.
8
9
Food security is at the core of international efforts to eradicate poverty and improve human health.
The relationship between people and food is complex but in many developing countries agricultural production and the ability to access food decline in tandem. Thus better information about changes in production can indicate areas where food policies need to be altered, or where food aid may be necessary. Development assistance does not always target the neediest countries, in part because of inaccurate or untimely information and donor policies. More timely information about harvest shortfalls can hasten early identification of potential problem areas and with the necessary international political will, enable earlier and more widespread support for food programs in affected areas. Persistent shortfalls can help prioritize efforts to develop more sustainable agricultural systems.
Crop Production
Large scale changes are taking place in the distribution of agricultural lands and crop production. International trade, national agricultural policies, commodity prices, and producer decisions are all shaped by information about crop production and demand. Improved crop production monitoring will enable more accurate forecasting of commodity prices, reducing risk and increasing market efficiency. Understanding prices and risks is a key component of effectively addressing food supply problems, and plays a key role in reducing food insecurity. Improved monitoring can help reduce risk and contribute to increasing productivity and efficiency at a range of scales from the farm unit level to the globe. The monitoring of the production of permanent tree crops such as vineyards, tea and coffee is not addressed in this report.
Agricultural Sustainability
Crop cultivation is an intensive land use that utilizes soil resources. Unless those resources are managed and replaced, arable land may degrade and become unfit for continued agricultural production. The impacts of the abuse of arable land can be regionally manifested through reduced agricultural production, reduced air and water quality, ecosystem exploitation and degradation, and declines in species diversity. Over the long term, changes in production can also serve as regional indicators of ecosystem health. In semi-arid systems, agricultural irrigation places heavy demands on water resources and requires careful management. Climate variability, extreme weather events and increased and competing demands on the water supply in the short term can affect productivity and in the longer term, the sustainability of agricultural production. In this context, the Nairobi Work Program developed by the Subsidiary Body for Scientific and Technological Advice (SBSTA) of the United Nations Framework Convention on Climate Change (UNFCCC) calls for the development and dissemination of tools and observations that enable assessment of vulnerability to climate variability and change7.
7 http://unfccc.int/adaptation/sbsta_agenda_item_adaptation/items/3633.php

10
3. The Scope of Agricultural Monitoring 3.1 Earth Observation for Monitoring Crop Production Earth observations that provide direct information on, or indicators of, production (area), such as soil moisture, soil type, crop stage, crop vigor, crop type, and other agricultural parameters are vital for effective global agricultural monitoring. Ultimately if food supply is the overall concern, crop production information that is timely, accurate, reliable, transparent and accessible must be a top priority.
Food supply is seen today more than ever as a global market issue; the factors influencing food availability and prices are linked to a number of elements with a strong global dimension. The increase in food demand is linked to population growth and dietary changes in fast-income-growing countries, for instance associated with the increase in the middle-class population of China. Food supply is also influenced by other economic sectors, such as competition from the increased demand for crop-based biofuel. In the last half of the 20th century technological improvements and adaptations in agriculture managed to keep pace with food demand. But conditions in this century are currently unable to adequately answer to the increasing food demand for several reasons: for example, the increase in climate-driven impacts on production systems increasing the yearly variability in world food production and resistance to the use of genetically altered crops, may limit or reduce global agricultural production. Climate variability observed over the last decade and the trends predicted for the future show potentially significant impacts on cropping systems differing by latitude. The Intergovernmental Panel on Climate Change (IPCC) predicts moderate increases in crop production in temperate areas counterbalanced by a decrease in tropical regions8. These factors will contribute to continuing uncertainty in food supply both geographically and temporally, with the associated tensions reflected in market prices. In this context a global system to monitor and assess production is seen as an important decision making tool.
A global agricultural monitoring system should be able to provide timely information on crop production and yield in a standardized and regular fashion at the regional to global level. The ultimate objective is to provide estimates as early as possible during the growing season(s) and update the estimates periodically through the season until harvest. Market decision makers should be able to take early decisions and identify geographically the areas of large variation in production. A global agricultural monitoring system should be based on homogeneous and interchangeable data sets with statistically valid precision and accuracy. Examples of current global crop estimation systems include those of the FAS-USDA and EC-MARS (see Appendix A and Appendix B), which combine weather data, in-situ information and satellite data in a convergence of evidence approach to estimate production and yield. Food supply assessments made throughout the growing season serve several areas of decision making, including risk and damage assessments as well as farming practice monitoring, drought and other extreme climate events analysis, including distribution and frequency.
8 IPCC 2007, 4th Assessment, Working Group II Report, Chapter 5 Food, Fibre and Forest Products, p. 275

11
3.2 Earth Observations for Food Security
“Food Security” is the condition in which a population has physical, social, and economic access to sufficient safe and nutritious food over a given period, to meet dietary needs and preferences for an active life. “Food Insecurity” is the inverse of food security: the condition in which a population does not have access to sufficient safe and nutritious food over a given period to meet dietary needs and preferences for an active life. “Food Access” is a measure of the population’s ability to acquire available food for the given consumption period through a combination of its own production and stocks, market transactions, or transfers. “Food Supply” or “Availability” is a measure of the amount of food that is, and will be, physically available in the relevant vicinity of a population during the given period through a combination of domestic production, stocks, or net imports (imports minus exports). “Food Stability” is a measure of whether a population, household or individual has access to adequate food at all times, without loosing access to food as a consequence of sudden shocks (e.g. an economic or climatic crisis) or cyclical events (e.g. seasonal food insecurity). “Food Utilization” or “Consumption” is a measure of whether a population will be able to derive sufficient nutrition from available and accessible food to meet its dietary needs.
Transitory food insecurity is due to temporary conditions, such as adverse climatic events; if things return to normal, people are expected to become food secure again within a reasonably short period of time. Chronic food insecurity, on the other hand, stems from a long-term or structural inability to have access to sufficient food. Extreme poverty is the main cause of chronic food insecurity. There are chronically food insecure people in virtually every country, regardless of food availability. This is a basic developmental and social problem obviously not amenable to earth observation related approaches. “Vulnerability” is the susceptibility to, or likelihood of, becoming food insecure. It usually stems from a combination of low income, dependence on a degraded resource base for a narrow set of low-productivity activities, and exposure to unpredictable shocks (natural disasters, major price shocks or political/social strife).
The potential contributions of earth observation to food security are numerous. In addition to direct and timely monitoring of agricultural production, earth observations are vital for global or regional climate modelling and prediction, or environmental prediction and monitoring, the associated tracking of ocean currents and sea surface temperatures, forest fires and dust storms, etc. The following describes the process of early warning of food insecurity by the Global Information and Early Warning Service (GIEWS) at the Markets and Trade Division, UN FAO, as an illustration:
Regarding earth observation methods and techniques, the first approach to food security monitoring, especially in sub-Saharan Africa, is to get a very general (large-scale, or low resolution) view of major climatic and agricultural events through rainfall estimates, ground-observed agro-meteorological data and satellite-derived normalized difference vegetation index data. This very general overview of growing conditions is refined with such tools as start-and-duration of growing season models, water satisfaction index models for various crops, and techniques assessing the general productivity of rangelands. Earth observation
12
tools and techniques can help by doing a better job of monitoring short-term food security by increasing the spatial coverage, uniformity, frequency and reliability of all agro-meteorological data, and by providing improvements on the techniques used to extrapolate conclusions drawn from the combination of satellite-based and ground based data sources. This typically involves a combination of low-resolution satellite data, ground based agro-meteorological information, and ancillary data such as crop use intensity, or more precise land cover or cropland maps.
Current crop estimates are first based on assumptions regarding area cultivated, which often does not change drastically from year to year. The second set of assumptions concerns yields. Because of the nature of most traditional farming systems, yields vary widely from one field to another, or even within the same field. However, it is possible to obtain estimates of average yields from sample ground surveys; at the pixel-level, the yield estimate for a traditional farming system simply has a larger standard deviation than in a mono-cropped, industrial farming system. Earth observation tools and techniques can help crop production assessment by helping calibrate estimates based on a combination of large-scale data and ground observations.
3.3. Earth Observation for Sustainable Agriculture
Earth observation tools and techniques provide a clearer understanding of the longer-term trends in the status of the environment as the resource base for agriculture, and a tool for natural resource management at the local territory or ‘terroir’ level. For example, combining satellite observations with systematic in-situ observations on soil quality (e.g. soil carbon and salinity) can provide important information on the state of the soil and its level of degradation. Earth observation has made a unique and critical contribution to our awareness of environmental trends, especially when time-series have been presented as irrefutable evidence of environmental degradation. Such information is essential to those who are trying to model the consequences of these trends for policy analysis and advocacy. At the same time, environmental action requires supportive policies and a legal base for those who collectively make a difference at the local level. Earth observation tools and techniques have been used in a number of cases to help convince local authorities that ‘something needs to be done’ and to provide already mobilized rural communities with the high resolution data to undertake land use planning and community based resource management.
By itself, the fact that rural communities are given the means to apply their knowledge, skills and energy to the local management of a set of related resources (land, forest, range and water) does not change the environmental landscape. However, once one reaches a critical mass of such instances and they are publicized, the case for greater decentralization to local communities of the management of natural resources becomes much stronger. The alternative is to hope for and wait for large scale public investments in environment protection and management.

13
For the longer-term, the combination of low and high resolution earth observation tools and methods should focus on the environment; sharpening our understanding of the evolution of complex systems over time (watershed scale) and providing high resolution information, to rural communities already organized to undertake community based natural resource management. The precise tools and techniques to be used depend on most likely areas of methodological advances, a manageable set of priority needs, and an in-depth review of existing systems being used at international, regional and national levels.
3.4 Types of Information Users and their Needs
There are various classes of users of information from agricultural monitoring systems. International and national organizations and development agencies concerned with global food security need timely information on predicted harvest shortfalls and evolving food shortages. From the food security monitoring point of view it is recognized that there are clients, users and beneficiaries. The clients are the member states (representing their people) on whose behalf the mandate of providing global public goods contributing to more efficient agriculture and to lowering food insecurity, hunger and poverty in the world is implemented. The users of earth observation data and information on food security include international agencies such as the UN FAO, and all its partners in national institutions, donor agencies, development agencies or NGOs who have the same general mandate and concern. These agencies and organizations try to process, analyze and provide earth observation-based information for decision making supporting food security. Finally, the beneficiaries are the producers and consumers of basic foods who work for a better life, those who are food insecure and need assistance, and those who are desperately poor and chronically hungry.
Agricultural ministries and international organizations concerned with markets need timely information on food supply and demand. The crop insurance sector needs information on predicted and actual harvest shortfalls and recent trends. International organizations, national agencies and land managers concerned with environmental monitoring and land degradation need information on trends in productivity, decreases in production potential, salinization, acidification, fertilizer application and water quality. National government agricultural ministries and agricultural statistical agencies need information on crop specific planted area, sowing date, crop condition, harvested area, yield forecast and at-harvest yield estimates, damage assessments due to flood, pests, frosts or droughts.
The global change research community also requires information on agricultural systems, including spatially explicit data sets on crop calendars, fertilizer and pesticide application, irrigation depth and a number of other important management parameters. Such information is used as an input to global and regional scale integrated assessment models, exploring future scenarios and policy options associated with projected climate and socio-economic changes.
Three types of enhanced agricultural information needs, as a function of development status, are summarized in Table 1.

14
Table 1. Typology illustrating how nations can benefit from enhanced observations of agricultural production (Source IGOL 2006).
Type 1 Type 2 Type 3
Reasons for enhanced observations
Agricultural commodity supply/demand assessments; practice verification; damage assessment; precision farming
Regional food security assessments; insurance/microfinance programs; irrigation monitoring
Food insecurity assessment; famine early warning
Development context Developed countries & high income developing countries
Middle income developing countries
Least developed countries
Geographic region North America, Europe, Australia, ‘Northern’ Asia, Near East
South America, East Asia, North Africa, Pacific, Central Asia
Sub-Saharan Africa, South Asia, Central America
Dominant climate type
Temperate, continental, Mediterranean, arid
Tropical, sub-tropical; arid, semiarid
Tropical, sub-tropical; arid, semiarid
Farming systems Highly specialized, mechanized (incl. irrigation), high input & productivity, few holdings
Mixed technology, large acreage under irrigation
Low technology, rain-fed, largely subsistence, low productivity, many farm holdings
Institutional capacity
High capacity, high technology, large data sets (depth & breadth), reliability
Mixed capacity, large potential, rapid growth in data reliability & quantity
Very low capacity, low technology, low levels of reliability
4. Existing Agricultural Monitoring Systems 4.1 Global to Regional Agricultural Monitoring Systems Preliminary research and development on satellite monitoring of agricutkture started with the ERTS (Landsat system) in the early 1970’s. Operational monitoring of major world food crop production using satellite observations started with the AVHRR system in the mid-1980’s with two primary missions – food security in developing countries, and forecasting yield for global market of agricultural crops. A number of global crop programs such as the USDA Foreign Agricultural Service (FAS) Global Agriculture Monitoring program (GLAM), the UNFAO Food Security Global Information and Early Warning System (GIEWS), the USAID Famine Early Warning System (FEWS), the EU DG-JRC Monitoring Agriculture with Remote Sensing (MARS) and the EU Global Monitoring of Food Security (GMFS), utilize satellite observations in their procedures for regional to global scale agricultural monitoring. Several major crop exporting countries have established systems for monitoring national and foreign crop production, and a number of private enterprises employ crop forecasting services. Examples of the major regional to global agricultural monitoring systems are presented in IGOL (2006)9 and are summarized in Appendix A.
9 http://www.fao.org/gtos/igol/docs/meeting-reports/ag-IGOL-meeting-report_v10.pdf

15
4.2 National Agricultural Monitoring Systems National agricultural monitoring is important for all countries involved in crop production, especially those experiencing rapid changes in the extent of agricultural lands, e.g. Brazil and China. In Russia and the former Soviet Union the agricultural sector is undergoing rapid transformation with associated changes in agricultural land ownership and practices. In the USA and Europe rapid changes in crops planted and crop extent are taking place due to increasing demand for biofuels. National agricultural monitoring is particularly important for planning, where there is increasing competition for water and land resources. The examples of national monitoring systems presented in Appendix B. provide an update to the summary of national systems provided in IGOL 20064.
5. Inputs to a Global Agricultural Monitoring System The basic inputs to a global agricultural monitoring system include satellite observations, in-situ observations, ground surveys and model outputs. The availability of these data in a timely fashion is critical for effective monitoring and the generation of agricultural production estimates. In addition to the inputs, the monitoring systems include data processing, synthesis and analysis and information reporting and dissemination components.
The methods used by the agriculture monitoring community to generate agricultural production and yield forecasts and estimates rely upon a variety of data sources. The location and extent of agricultural land is baseline information necessary for regional, national or international assessments. This baseline information needs periodic updating to account for changes in agricultural land use. Crop forecasts are generated for agricultural lands based upon a combination of model-based forecasts, assessments of vegetation condition and field based reports. Whereas most crop production models rely on climatological data, there is a move towards integrating near real-time rainfall data and satellite observations of vegetation condition. Current spatial observations of vegetation condition are obtained by comparison with time-series data from previous growing seasons or crop model output. Anomalies developed by comparative analysis between observations and expectations serve as indicators of increased yield or reduced production due to drought, floods, insect infestation, or other factors. Monitoring of crop condition and phenology is undertaken using various vegetation indices, formed from coarse and moderate resolution time-series data from multiple channels, requiring good pixel geolocation, atmospheric correction, and band to band registration. This approach necessitates a consistent and well-calibrated data record. Targeted imaging of recent local crop condition can be undertaken using very fine spatial resolution data.
Crop production forecasts require in situ and survey data on crop types and cultivars, local crop calendars, germination rates, harvest indices, crop residue, fertilizer application, irrigation, and disturbances like plant pests and diseases. Research is currently underway by different groups to apply data assimilation approaches to crop modeling. Ancillary data on snow distribution and reservoir height provide information
16
pertinent to irrigated lands, helping to identify areas prone to decreased agricultural productivity.
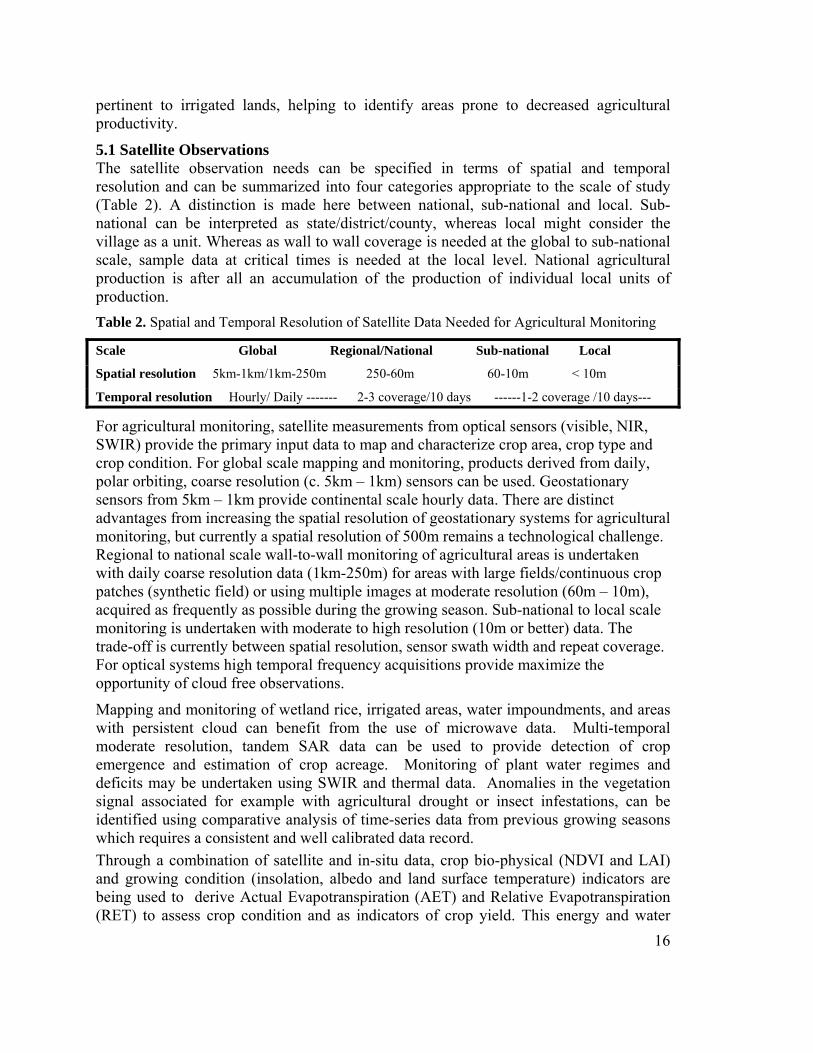
5.1 Satellite Observations The satellite observation needs can be specified in terms of spatial and temporal resolution and can be summarized into four categories appropriate to the scale of study (Table 2). A distinction is made here between national, sub-national and local. Sub- national can be interpreted as state/district/county, whereas local might consider the village as a unit. Whereas as wall to wall coverage is needed at the global to sub-national scale, sample data at critical times is needed at the local level. National agricultural production is after all an accumulation of the production of individual local units of production. Table 2. Spatial and Temporal Resolution of Satellite Data Needed for Agricultural Monitoring
Scale Global Regional/National Sub-national Local
Spatial resolution 5km-1km/1km-250m 250-60m 60-10m < 10m
Temporal resolution Hourly/ Daily ------- 2-3 coverage/10 days ------1-2 coverage /10 days---
For agricultural monitoring, satellite measurements from optical sensors (visible, NIR, SWIR) provide the primary input data to map and characterize crop area, crop type and crop condition. For global scale mapping and monitoring, products derived from daily, polar orbiting, coarse resolution (c. 5km – 1km) sensors can be used. Geostationary sensors from 5km – 1km provide continental scale hourly data. There are distinct advantages from increasing the spatial resolution of geostationary systems for agricultural monitoring, but currently a spatial resolution of 500m remains a technological challenge. Regional to national scale wall-to-wall monitoring of agricultural areas is undertaken with daily coarse resolution data (1km-250m) for areas with large fields/continuous crop patches (synthetic field) or using multiple images at moderate resolution (60m – 10m), acquired as frequently as possible during the growing season. Sub-national to local scale monitoring is undertaken with moderate to high resolution (10m or better) data. The trade-off is currently between spatial resolution, sensor swath width and repeat coverage. For optical systems high temporal frequency acquisitions provide maximize the opportunity of cloud free observations.
Mapping and monitoring of wetland rice, irrigated areas, water impoundments, and areas with persistent cloud can benefit from the use of microwave data. Multi-temporal moderate resolution, tandem SAR data can be used to provide detection of crop emergence and estimation of crop acreage. Monitoring of plant water regimes and deficits may be undertaken using SWIR and thermal data. Anomalies in the vegetation signal associated for example with agricultural drought or insect infestations, can be identified using comparative analysis of time-series data from previous growing seasons which requires a consistent and well calibrated data record. Through a combination of satellite and in-situ data, crop bio-physical (NDVI and LAI) and growing condition (insolation, albedo and land surface temperature) indicators are being used to derive Actual Evapotranspiration (AET) and Relative Evapotranspiration (RET) to assess crop condition and as indicators of crop yield. This energy and water
balance approach is emerging as an effective method using the data in Visible, NIR and Thermal IR region ranging in spatial resolution range of 10m-1km.
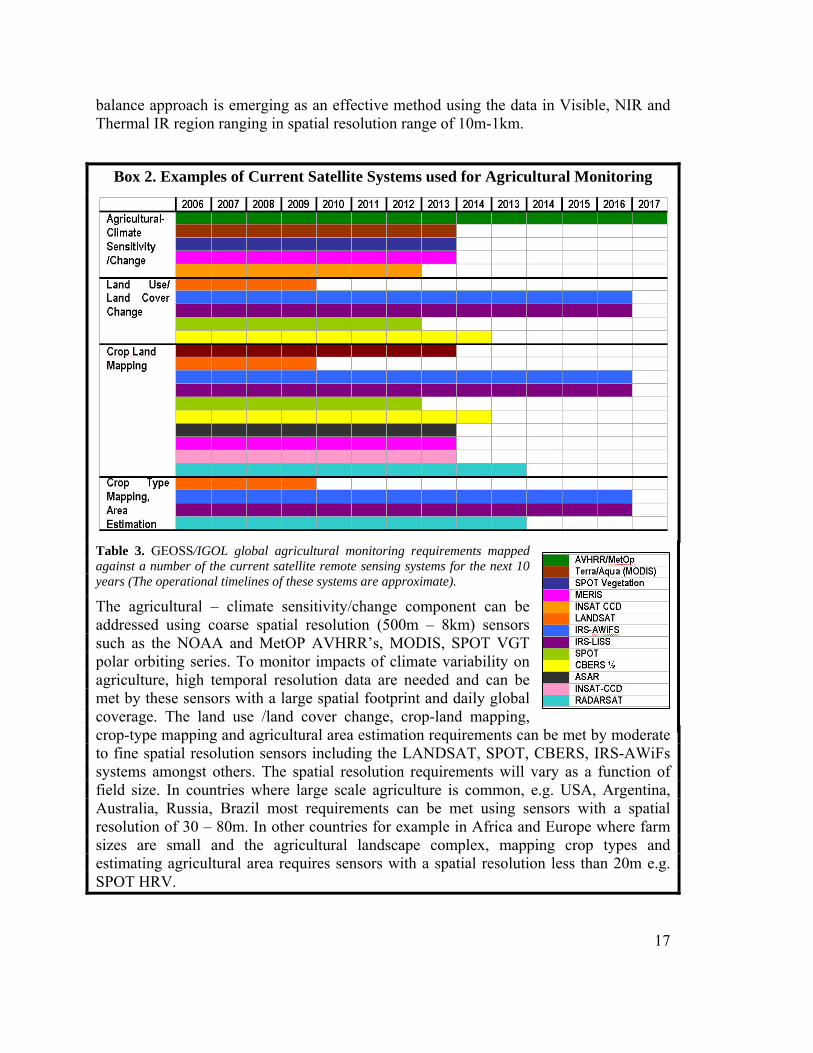
Box 2. Examples of Current Satellite Systems used for Agricultural Monitoring
Table 3. GEOSS/IGOL global agricultural monitoring requirements mapped against a number of the current satellite remote sensing systems for the next 10 years (The operational timelines of these systems are approximate).
17
The agricultural – climate sensitivity/change component can be addressed using coarse spatial resolution (500m – 8km) sensors such as the NOAA and MetOP AVHRR’s, MODIS, SPOT VGT polar orbiting series. To monitor impacts of climate variability on agriculture, high temporal resolution data are needed and can be met by these sensors with a large spatial footprint and daily global coverage. The land use /land cover change, crop-land mapping, crop-type mapping and agricultural area estimation requirements can be met by moderate to fine spatial resolution sensors including the LANDSAT, SPOT, CBERS, IRS-AWiFs systems amongst others. The spatial resolution requirements will vary as a function of field size. In countries where large scale agriculture is common, e.g. USA, Argentina, Australia, Russia, Brazil most requirements can be met using sensors with a spatial resolution of 30 – 80m. In other countries for example in Africa and Europe where farm sizes are small and the agricultural landscape complex, mapping crop types and estimating agricultural area requires sensors with a spatial resolution less than 20m e.g. SPOT HRV.

18
5.2 In – Situ observations The meteorological community has shown the way for international data sharing, through the example of the Global Telecommunications System (GTS) of the World Meteorological Organization (WMO). Over 10,000 automated stations report observations of a suite of variables several times a day, and the data are available to the national meteorological and hydrological services (NMHSs) of all member countries. Nevertheless, there remain significant shortcomings and obstacles to the use of these data for global agricultural monitoring. There are many stations that collect data that do not report, and many missing reports from those that do. Only a relatively small subset of the potential population of stations and observational reports actually are received via the GTS. Many stations are in disrepair, and many of the NMHS face challenges of data transmission and data management. In some countries the network of stations is extremely sparse. In general, the density of rain gauges in developing countries is relatively low and has been decreasing over time. Ironically, the lowest station density often occurs in those countries with the greatest need for observations (Figure 1). In some countries, the data are not recorded on digital media and are therefore not easily distributed. Also access to those data that are on hand is limited to member NMHS, excluding many organizations and individuals with agricultural monitoring responsibilities. Precipitation and temperature are the two variables of highest priority for agricultural monitoring, but solar radiation, relative humidity, wind, and atmospheric pressure are also needed for calculation of crop water requirements. A ten year strategy to enhance the availability of meteorological data should entail:
• Strengthening and expansion of station networks and communications systems • Increased use of satellite data as a complement to station observations • Greatly facilitated internet access to station and gridded meteorological data by
the agricultural monitoring community Increasing the number of near real time reports from the global meteorological station network can be achieved by improving the status of existing stations as well as the establishment of new ones. A full range of technological solutions should be employed, in terms of complexity and expense. Repair of fully automated stations capable of reporting a complete suite of variables, as well as establishment of new stations of this type, should be a priority. Equally important should be the implementation of new reporting mechanisms for simpler stations. Readings obtained manually can now realistically be collected through the use of inexpensive data loggers and personal data assistants (PDA), and reported in near real time using cell phone technology. The establishment of new rainfall data collection posts should be a priority in areas that are characteristically food insecure and underserved by existing station networks. There are, for example, plastic rain gauges on the market for $20 that meet WMO specifications and have a useful life of two to three years. Institutional measures must also be pursued to increase the population of stations reporting in a regular and timely manner. For example, many agricultural research centers maintain fully automated meteorological stations, but the data do not reach the larger community. Agreements need to be negotiated between these research institutes and the NMHSs to bring these additional data online to support agricultural monitoring.

19
Recent positive developments for enhanced surface networks include the Climate for Development in Africa (ClimDev Africa)10 initiative and the announcements of India and China to each increase their national networks by over 1,000 stations. Alternative approaches to improving the observation networks are also being considered for example, in India at the local level, low-cost rain gauges have been provided to agricultural producers, enabling them to benefit from micro-insurance and increase the station density.
Integrating in-situ and satellite rainfall observations
Even with greatly increased funding, surface rainfall station networks will not provide coverage everywhere it is needed. There is an important role to be played by satellite systems to fill in the inevitable observation gaps for crop growing regions, especially those facing chronic food insecurity. The Global Precipitation Mission (GPM)11 is an international initiative that deserves endorsement and support in view of the significant contribution it will make to global agricultural monitoring. There are already good examples of the use of satellite rainfall estimates for monitoring growing conditions and crop water balance modelling. Building on the legacy of the Tropical Rainfall Measuring Mission (TRMM)12, the GPM will consist of a constellation of satellites carrying passive microwave instruments designed expressly for precipitation monitoring, anchored by a space-borne weather radar. By increasing the rate of microwave imaging of rainfall-producing cloud systems, the GPM promises an improved observational framework for the application of algorithms that have a better physical basis and greater accuracy than present operational methods that depend heavily on thermal infrared imagery from geostationary weather satellites.
With the increasing use of geographic information systems (GIS) and spatially distributed modelling of agrometeorological processes, gridded representations of meteorological variables are growing in popularity. Climatological gridded precipitation fields are especially useful for removal of bias from satellite rainfall estimates. Also important are geostatistical post-processing methods for blending locally available station data with satellite rainfall products. Raising awareness of the availability and utility of satellite rainfall estimates, and capacity building in their production and use, should include these important supporting geostatistical technologies.
Gridded fields of surface temperature, solar radiation, relative humidity, etc, are produced by a number of operational atmospheric models (e.g., NOAA’s Global Data Assimilation System (GDAS)). Presently, the utility of these fields is not fully appreciated, even by the NMHS that produce them and the fields are not systematically archived at full resolution. Yet they can supplement station data collections in a number of valuable ways. They provide variable estimates for gaps in the station network, and are well suited to modelling important processes such as potential evapotranspiration. The NMHSs should be encouraged to begin capturing these surface variable fields, and to
10 http://www.wmo.ch/pages/publications/meteoworld/_archive/en/june2007/climdev_africa.html11 http://gpm.gsfc.nasa.gov/index.html 12 http://trmm.gsfc.nasa.gov/

manage the resulting collections in an explicit and systematic fashion, to facilitate their application for agricultural monitoring.
Realization of the benefits to agricultural monitoring from expanded station networks, improved satellite rainfall estimates, and gridded fields of atmospheric variables will not occur without a concurrent initiative to expand access to the these data via the internet. Policy changes and investment in information technology are needed to lift restrictions on the free flow of these data. New web resources must be developed to provide ready access to historical and near real-time station data, satellite rainfall estimates, and gridded atmospheric surface variables. The research, applications development and operational communities focused on agricultural monitoring require unimpeded access to these data to fulfil their respective missions on behalf of the global public. Figure 1. WMO/GTS Raingauge Coverage vs. Food Insecurity
20
Food Security Status: February, 2007
Sudan
Tanzania
Kenya
Ethiopia
Uganda Somalia
WMO/GTS Raingauge network • Most food insecure populations occur in marginal agricultural & pastoral regions
• Areas that have no/sparse “in-situ” data.
5.3 Ground Surveys National agricultural statistics are generated by most countries but their accuracy, timeliness, consistency over time and accessibility vary greatly. In some countries survey data are collected during the growing season from producers, to generate yield surveys indicating crop production but in other countries estimates are generated using subjective assessments based on extremely limited data. Some countries collect administrative data

21
based either upon census, surveys or national sampling frames and some countries have no formal data collection. In general, the data accuracy increases with sampling density. There are no globally recognized standards for in-situ or survey data collection, although GPS systems are used increasingly for precise location of in situ data.
Ground survey data are necessary for agricultural monitoring for at least four key reasons:
a) Area frame sampling
b) Training data, in particular, but not only, for image classification.
c) Accuracy assessment and validation,
d) Combining ground data with EO products, including fine spatial resolution multi-spectral data, to produce statistically valid estimates, in particular area estimates through regression or calibration estimators.
e) Contributing to and updating a global database of cropping systems and crop calendars
Area frame sampling is a well-established statistical method for collecting agricultural data that cannot be obtained directly by satellite, such as crop yield. Training data for image classification must represent as much of the significant variability that is found in the area of interest; this can be achieved through different types of statistical sampling, or through subjective, purposive data collection. For accuracy assessment and for area estimation the statistical properties of the sampling method are crucial. The same sample of ground data can be used for validation and for area estimation, though training data should not be used for validation or area estimation.
The sampling units for ground data collection can be “segments” (pieces of land with physical boundaries or regular geometric shapes), transects of a certain length, or points. Sampling plans can be random or systematic, and usually stratified. Clustering sampling units can be cost-efficient in some cases. Examples of sources of geo-referenced survey data include: national area-frame surveys for agricultural, forest or environmental purpose; data collected for specific research or pilot projects; multi-national surveys (e.g. the EU LUCAS); and existing administrative GIS layers, agricultural registries, cadastres etc. Access to such data is often limited for regulatory reasons or confidentiality rules, and more often because the data and metadata are not properly stored. An initiative towards a “land cover metadata inventory” would be very useful for global agricultural land studies.
Ground surveys are necessary for a rigorous satellite data product validation, but the cost of obtaining statistically robust ground data for large regions can be prohibitive. A possible substitute may be a sample of sites photo-interpreted with very high resolution images, complemented with a set of ground data as close as possible to a statistical sample to have an approximate validation of the photo-interpretation. Statistical data for administrative regions can also be of use for additional checking or orientation for photo-interpreters, but are not enough for a thorough validation.
Ground surveys should also provide regular updates of the information describing cropping systems, i.e. broad information about crop types, varieties, fertilizers use, pest
22
management and crop calendars. Such information is currently available at local and national levels but global crop growth monitoring clearly requires the development of a global database on crop calendars and associated agricultural practices.
5.4 Satellite data provision and availability The agricultural monitoring community needs data which can be acquired in a timely fashion and delivered, ideally, at a marginal access cost. Currently, such requirements are met with a plethora of data access and data use policies with complex terms of applicability related to the type of data, user, and geographic location. In addition, commercial agreements on data redistribution may impose further limitations to the use, and can result in different pricing schemes for the same dataset. Conditions of access/delivery of the data may also influence data prices, as they may require an increased use of the satellite resources for acquiring and transmitting specific data. Dissemination means vary from distribution on media, direct access via Web or FTP or direct downlink via telecom systems at the user’s premises.
Access to Coarse Resolution Data (4km – 250m)
As a consequence of an effort made by several space agencies, effectiveness of existing systems has improved and large volumes of data can now be made available a few hours after acquisition. This results in data generally easily accessible, often with reduced lag-times (near real-time access can be provided in many cases) and at limited or no-cost13. No-cost data are more likely to be associated with on-line dissemination as order and data handling costs are eliminated. In the case of value-added products (e.g. data processed to extract specific geophysical parameters), examples of free and unlimited access also exist14.
Access to Moderate Resolution Data (60m- 10m)
A few examples of data distributed at no15 or marginal cost16 exist: it is hoped that this will generate some momentum and stimulate space agencies to facilitate access to further assets17, allowing for free and open sharing of data. The situation is different when considering data managed and distributed by private entities with commercial goals.
13 For instance this applies to all MODIS and MERIS RR data, worldwide, and to all MERIS full resolution data acquired in European coverage (which are made available in NRT on the Web at no cost) 14 E.g.: archived standard 10-days Vegetation synthesis products from VITO (http://free.vgt.vito.be/), ESA global products from Globcover (http://www.esa.int/due/ionia/globcover) or Globcarbon (http://dup.esrin.esa.int/ionia/globcarbon/products.asp), MGVI from ESA G-POD (http://envisat.esa.int/level3/meris/), monthly global fires from A(A)TSR (http://dup.esrin.esa.int/ionia/wfa/index.asp) or river and lakes heights based on NASA (http://www.pecad.fas.usda.gov/cropexplorer/global_reservoir/) or ESA (http://earth.esa.int/riverandlake/samples/samples_NRT.htm) data 15 For instance the Landsat Geocover or the SPOT1-4 Level1A data acquired over Europe and Africa (the latter distributed by ESA with specific geographic limitations) 16 For instance ASTER data 17 E.g. in the framework of GEOSS discussions are ongoing to facilitate the access to C-BERS data

23
Fine Resolution Data (< 10m)
Data costs respond to market logic and may vary considerably as a function of processing (and quality) level, with an international inequity in pricing and distribution policies. A reduction in price of these data, especially for targeting agricultural lands in regions where food security is a priority issue would be important.
Restrictions on availability and access to the data limit their utility and may hinder possible improvement of agricultural practices. The cost of data presents a serious obstacle for many users of satellite data, particularly in developing countries or developed countries, when large volumes of data are needed, and in addition it discourages research activities on interoperability of data from various platforms. Data policy and pricing inequities present a major obstacle to developing integrated observing systems.
6. Why a GEOSS is needed for Agricultural Monitoring A Global Earth Observing System of Systems is needed for Agricultural Monitoring to focus the space agencies on providing the required observations and to ensure long-term data continuity, to resolve inconsistencies in national data policies and access, to develop standards and systems for data and information exchange, and to build capacity for nations to effectively monitor global agricultural production and to increase global food security. The space agencies should consider the general key-requirements associated with products needed for agricultural monitoring namely, comparability (geometric, including the provision of orthorectified products), consistency (radiometric, including intercalibrated data), validation (accuracy assessment of products including the use of independent data sources), timeliness (including near real-time data delivery systems) and continuity (planned and immediate satellite replacement).
6.1. The Need for a Continuous Satellite Data Record Agricultural monitoring is currently not a priority or focus for the operational satellite agencies, and as a result there are no operational products specifically designed to meet agricultural needs. In addition, observation systems have been designed without consideration of data continuity from one generation of platforms to the next, and consequently there are challenges linking measurements across different sensing platforms. There is a pressing need for the requirements of agricultural monitoring to be factored into the design and implementation of future operational satellites.
Coarse Resolution (4km-250m) Data Continuity The NOAA AVHRR is currently the only operational sensor used for land monitoring and will be replaced on the US operational polar orbiters at the end of the decade by the VIIRS instrument on the NPOESS Preparatory Project (NPP). The NPP VIIRS will extend the NASA MODIS data record and will be continued by the operational NPOESS. EUMETSAT will continue to operate an AVHRR on METOP, their morning platform. In addition, new coarse resolution systems also planned include CBERS 3 (China/Brazil), SGLI (Japan) and Sentinel-3 (ESA). The community welcomes some redundancy of observations as a way to compensate for sensor degradation or system failures. Attention

24
needs to be given to ensuring data product continuity and quality assurance, requiring instrument calibration and inter-calibration, product intercomparison and validation. Data continuity between instruments can be facilitated by a consistent central wavelength and bandwidth for the core visible to shortwave vegetation monitoring bands. Routine quality assessment and product validation is mandatory for products aimed at meeting operational user needs. With the planned missions for the NPP and NPOESS VIIRS, with spatial resolutions at 375 and 750m, the prospect for the long term provision of operational coarse resolution data over the next decade is ensured.
Moderate Resolution (60-10m) Data Continuity For agricultural purposes, systematic acquisition and near real-time delivery of high resolution data are needed for critical periods during the growing season. A continuous moderate resolution (60m-10m) data record is needed, providing multiple cloud-free observations each year, within a few days of critical stages in the growing season. Traditionally Landsat data have been used for this purpose, largely due to the global acquisition strategy and the Landsat data policy. However, in some areas the 16 day overpass combined with cloud cover hindered timely observations. Serious problems with the Landsat 7 instrument (failure of the scan-line corrector) in 2003 created a critical gap in global observations for the agricultural monitoring community and a replacement and preferably an improvement of the functionality of Landsat 7 is urgently needed. With one sensor planned for a Landsat Data Continuity Mission (LDCM) to be launched in 2012 there is already an immediate and extended data gap. Post LDCM the future of US moderate resolution observations is unclear. In the short-term a coordinated global acquisition strategy using other on-orbit moderate resolution assets, such as the aging Landsat 5 (operations are currently suspended), IRS, CBERS, SPOT, ASTER, DMC, FORMOSAT, ALOS-AVNIR and EO1 could fill this data gap, but international will and a high priority for coordination are needed.
In addition, new moderate resolution sensors are being planned for CBERS 3, LDCM, Resourcesat 2, Venμs (see Box 3), Sentinel-2, and FORMOSAT 2. International coordination and planning of repeat global high resolution acquisition in the framework of these missions is needed early in their design phase. In particular, immediate steps should be taken to explore how the high resolution missions planned by ISRO, ESA, NASA, JAXA and China/Brazil could be coordinated to put in place this component of the system of systems that is needed. Operational status is urgently needed for moderate resolution systems with planned instrument replacement, to avoid future gaps in coverage.
There should also be equitable and consistent data and pricing policies enabling the broadest possible use for agricultural monitoring, particularly in developing countries. Data should also be provided in standardized formats, facilitating inter-use. Routine provision of standardized orthorectified products would greatly facilitate interchangeable use of moderate resolution data from different systems.
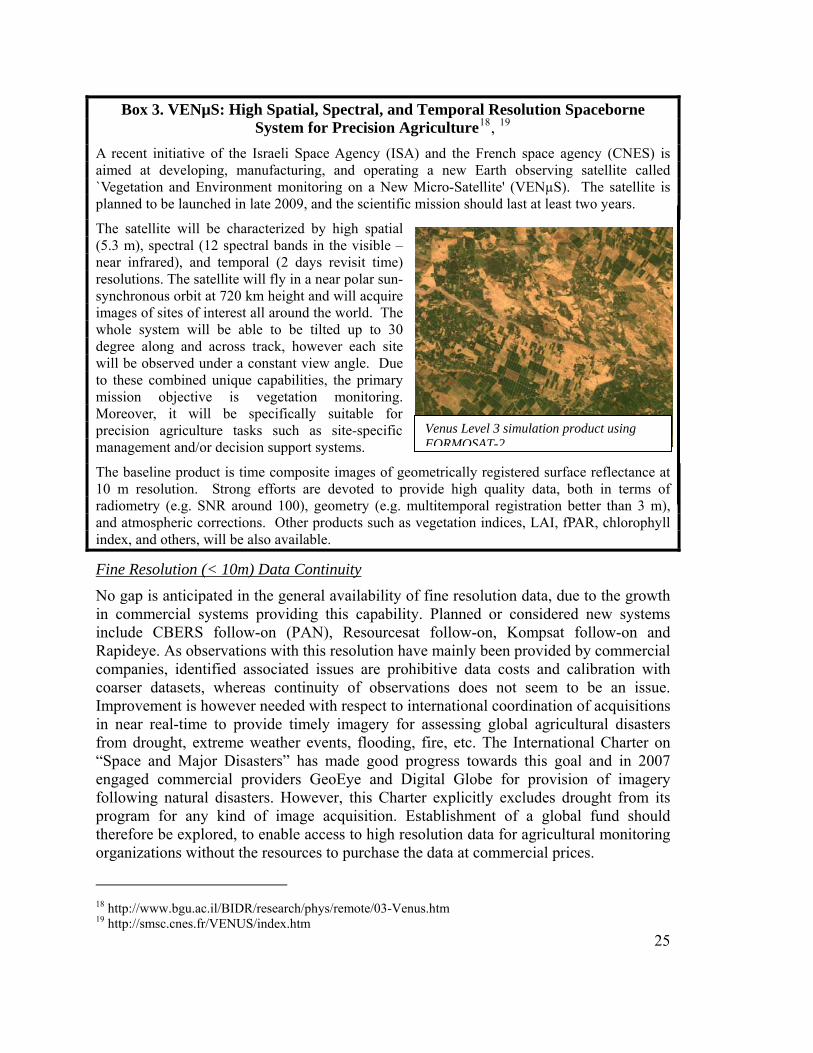
Box 3. VENµS: High Spatial, Spectral, and Temporal Resolution Spaceborne System for Precision Agriculture18, 19
A recent initiative of the Israeli Space Agency (ISA) and the French space agency (CNES) is aimed at developing, manufacturing, and operating a new Earth observing satellite called `Vegetation and Environment monitoring on a New Micro-Satellite' (VENµS). The satellite is planned to be launched in late 2009, and the scientific mission should last at least two years.
The satellite will be characterized by high spatial (5.3 m), spectral (12 spectral bands in the visible – near infrared), and temporal (2 days revisit time) resolutions. The satellite will fly in a near polar sun-synchronous orbit at 720 km height and will acquire images of sites of interest all around the world. The whole system will be able to be tilted up to 30 degree along and across track, however each site will be observed under a constant view angle. Due to these combined unique capabilities, the primary mission objective is vegetation monitoring. Moreover, it will be specifically suitable for precision agriculture tasks such as site-specific management and/or decision support systems.
25
The baseline product is time composite images of geometrically registered surface reflectance at 10 m resolution. Strong efforts are devoted to provide high quality data, both in terms of radiometry (e.g. SNR around 100), geometry (e.g. multitemporal registration better than 3 m), and atmospheric corrections. Other products such as vegetation indices, LAI, fPAR, chlorophyll index, and others, will be also available.
Venus Level 3 simulation product using FORMOSAT-2
Fine Resolution (< 10m) Data Continuity
No gap is anticipated in the general availability of fine resolution data, due to the growth in commercial systems providing this capability. Planned or considered new systems include CBERS follow-on (PAN), Resourcesat follow-on, Kompsat follow-on and Rapideye. As observations with this resolution have mainly been provided by commercial companies, identified associated issues are prohibitive data costs and calibration with coarser datasets, whereas continuity of observations does not seem to be an issue. Improvement is however needed with respect to international coordination of acquisitions in near real-time to provide timely imagery for assessing global agricultural disasters from drought, extreme weather events, flooding, fire, etc. The International Charter on “Space and Major Disasters” has made good progress towards this goal and in 2007 engaged commercial providers GeoEye and Digital Globe for provision of imagery following natural disasters. However, this Charter explicitly excludes drought from its program for any kind of image acquisition. Establishment of a global fund should therefore be explored, to enable access to high resolution data for agricultural monitoring organizations without the resources to purchase the data at commercial prices.
18 http://www.bgu.ac.il/BIDR/research/phys/remote/03-Venus.htm 19 http://smsc.cnes.fr/VENUS/index.htm

26
Availability and Enhancement of Other Sensor Data Observations in C or X band are currently provided by ERS2, ENVISAT, RADARSAT-1, TERRASAR-X and Cosmo-Skymed. Additional observations in L-band are provided by ALOS and planned systems include TERRASAR-L or SMOS (specifically targeted at soil moisture retrieval) and RISAT (C band multiple polarisation). Additional planned microwave systems include Sentinel-1, RISAT, and Radarsat-2.
6.2 The Need for Better Coordination of Data Developing efficient and effective ground segments remains one of the biggest challenges to the space agencies. In particular, the massive increase in data volumes, the need for validated data products, the demand for real-time data, easy access to data products and archives, and the need for periodic reprocessing of products, all present significant technical and logistical challenges. Currently, there are significant differences in data policy among nations which will need to be resolved before a workable system of systems can be developed. Similarly there are significant differences in the level of data quality assurance (QA) and data formats. Interoperability is essential in a system of systems and workable standards will need to be developed and adopted. As an international coordination body GEOSS can help establish a consensus data policy to enable the free and open sharing of data amongst the agricultural community of practice and a minimum set of standards needed for data quality and validation.
6.3 The Need for a Coordinated Agricultural Monitoring Community The task of agricultural monitoring is often distributed amongst a number of organizations at the national level (See Appendix B). Similarly at the international level a number of agencies are involved addressing different elements of agricultural monitoring (See Appendix A). Prior to the recent initiatives of IGOL and GOFC-GOLD there had been little focus on coordination of land observations activities (Townshend et al. 200420, IGOL 200721). As a result, the agricultural monitoring community is somewhat fragmented and disconnected. GEOSS provides an opportunity for an agricultural monitoring community of practice to be established in order to: i) articulate the common observation needs of the agricultural monitoring community, ii) enable transfer of methodologies, technologies and experience for utilizing the observations, and, iii) aid GEOSS in designing and building the necessary agricultural monitoring system of systems. This community should build on existing network structures. For example, over recent years the major Food Security and Famine Early Warning programs have met periodically to assess emerging famines and share data and information. This group already has a community perspective on improved observation needs and effective approaches for capacity building between nations and has participated actively in the GEOSS agricultural monitoring meetings.
20 Townshend J.R.G., Justice C.O., Skole D.L., Belward A., Janetos A., Gunawan I., Goldammer J. and Lee B., 2004. Meeting the goals of GOFC: an evaluation of progress and steps for the future. In Gutman, G.; Janetos, A.C.; Justice, C.O.; et al., Eds., Land Change Science: Observing, Monitoring and Understanding Trajectories of Change on the Earth's Surface, Kluwer Press. 21 http://www.fao.org/gtos/igol/documents_en.asp

27
6.4 The Need for Improved Observations With the high level of international attention to global observations and societal benefits that GEOSS provides, there is an opportunity to advocate for the development of new and enhanced observations needed for improved agricultural monitoring. This can include the addition of in-situ observations in data sparse regions, the development and testing of new space-borne technologies to obtain essential observations which are currently unavailable, improving existing data systems to provide timely access to the necessary products.
The recent performance of the IRS AWiFS has improved upon the frequency of Landsat acquisitions, albeit at the expense of decreased spatial resolution (56m) and has demonstrated the utility of multiple acquisitions each month for the same location, at moderate resolution for agricultural monitoring. In the mid-term (3-5 years) a moderate resolution system of systems is needed that will provide such 5-10 day cloud free coverage globally for all agricultural regions of the World. A system of systems that would increase current acquisitions is currently technically feasible and could be achieved through international cooperation enabled by GEOSS, working with the Committee on Earth Observation Satellites (CEOS).
The need for observations on crop available water is high and remote observations of soil moisture at a resolution and with an accuracy appropriate for operational agricultural monitoring is an area for continued research and development. With respect to the desired improvements from microwave satellite systems, the tandem-like operation of two satellites with C and L band, HH+HV polarization, a 300 km swath and 10-20m resolution with a temporal resolution of 10-15 days would be well suited for crop monitoring. Such a capability would allow use of both intensity and coherence measurements enabling monitoring of cropping activities. Further research efforts are needed to exploit data-synergies between optical and microwave data, as promising results are currently available. An example of new product development is shown in Box 4.
Although altimeter observations are currently available from JASON-1, ERS2 and ENVISAT and are planned for inclusion on NPOESS and Sentinel 3, there are several limitations to the current provision of altimetric reservoir height information. The radar altimeters flown to date have not had inland water applications as their main science objective. Spatial and temporal resolutions are mainly determined by the ocean and ice communities and can vary between missions. In addition, their monitoring capability has not been global with each mission only having the ability to observe a set number of targets. The NASA/CNES Jason-1 mission for example had the potential to observe ~350 lakes at 10-day intervals, while the ESA ENVISAT mission, makes observations every 35 days but potentially over ~1000 lakes. The ability to acquire a clear radar signal over a reservoir or lake, and interpret its height to a sufficient degree of accuracy is also mission dependent. A NASA-funded working group has recognized the need for a dedicated surface water (rivers, lakes, wetlands) mission. Such a mission would serve a number of applications objectives including water resources and agriculture. Exploration of future remote sensing techniques such as Doppler lidar and Doppler radar may greatly improve reservoir accuracy, and spatial and temporal resolution.

Box 4. Experimental Mapping of Rice with ALOS PALSAR data
28
Synthetic Aperture Radar (SAR) is an ideal technology for mapping rice paddy extent and biophysical characteristics (LAI, biomass), but regional applications have been hampered by the lack of routine, extensive and well-timed acquisitions. With the launch of JAXA’s ALOS platform with the Phased Array type L-band SAR (PALSAR), regional acquisitions are part of the mission plan. As part of JAXA’s Kyoto and Carbon Initiative (K&CI), an acquisition strategy for Asia specifically for routine mapping and monitoring of rice has been developed. This strategy includes PALSAR ScanSAR data acquisitions every 46-days for regional mapping and characterization of wetlands, including rice cultivation. With adjacent acquisition overlap of 50%, there will be 2 acquisitions every 46 days. The K & CI wetlands science team has developed provisional algorithms for rice and wetland mapping and maps of rice paddy extent for Southern China and Southeast Asia region will be generated consisting of the extent of rice cropping. PALSAR temporal backscatter signal will be used to translate the approximate rice development stage by incidence angle and polarization following the method developed by Inoue et al (2002)22 (figure a). Multi-temporal
Figure b. Rice agriculture dynamics in Java from multiple PALSAR images collected on 6 Dec 2006 and 21 Jan 2007. Green indicates fields planted, and purple indicates fields harvested during the interval between acquisitions. The image is ~5 km across.
PALSAR ScanSAR data will be used to map rice extent and cropping system and planting and harvest dates (figure b)
Maps of hydro-period for rice paddy and natural wetland systems will include dates of surface flooding. These products will be validated with field measurements for rice and wetlands. Maps of rice biophysical characteristics will include maps of rice development (biomass and age). Field data are currently being collected for 14 rice fields in two regions of China. Field data will include plant height, biomass, LAI and water depth.. Biomass inversion algorithms will be empirically based on field observations and tested against the Inoue et al. (2002) field scatterometer data across a range of incidence angles across PALSAR ScanSAR images.
22 Y. Inouye et al. 2002 Season-long daily measurements of multi-frequency and full polarization backscatter signatures over paddy rice field and their relationship with biological variables. Remote Sensing of Environment 81, 194-204.

29
Fire is commonly used for preparation of agricultural land and removal of crop debris, often impacting air quality in surrounding areas. Agricultural fire monitoring requires high saturation bands (c. 600K) at 3.9 microns at 1km or finer, from polar and geostationary systems and such capabilities are recommended for future missions e.g. SGLI and NPOESS. Plans are currently in development by DLR to launch a constellation of small satellites specifically designed for fire monitoring.
High-temporal resolution data (e.g. 15-30 minute repeat) are currently provided by geostationary systems e.g. GOES and METEOSAT Second Generation (MSG) increasing the opportunity of cloud free observation. Improving the spatial resolution of geostationary systems to greater than 1km will increase their utility for agricultural monitoring A coordinated global geostationary network, currently being promoted by the international GOFC/GOLD program and GEOSS, would improve the availability of near real time data for fire detection and rainfall estimation for use in data assimilation.
7. Developing an Agricultural Monitoring System of Systems The approach adopted at this workshop, through plenary presentations, discussion and focused breakout groups was to, i) establish an initial GEO Community of Practice for Agricultural Monitoring, ii) identify priority long term goals, iii) identify the components of the global agricultural monitoring system in need of improvement, iv) identify a small number of short-term tasks which would lead to improvements, and, vi) formulate recommendations to the GEO its members and partner organizations to support concrete steps in the implementation of the required Agricultural Monitoring System of Systems
The primary goal of a global agricultural monitoring system of systems is to provide information, at global to national scales on agricultural production and yield. This information will enable a wide range of decision makers to act on predictions of deficiencies and respond to events that effect agriculture during a season and in the longer term. In-situ observations of weather and crop condition, earth observations from space and airborne platforms, and statistical analyses are all required to meet this goal. In addition, methodologies for data collection, statistical analyses and processing of remotely sensed data must be made available as common resources for developed and developing nations, and the capacity to use these resources must be transferred to those nations so desiring.
A system of systems for global agricultural monitoring must include the elements and capabilities listed below. Implementation of each element will require substantial discussion and agreement among the community of practice on national contributions and acceptance of standards and protocols.
• Access to earth observations – coordination among existing archives and data systems to identify the data sets for national to global monitoring and establishment and maintenance of processes and procedures for easy and rapid access. Data polices for distribution of critical data sets from the contributing agencies must conform and facilitate access to observations and data products.

30
• Common procedures for product generation and analysis – identification and/or generation of algorithms to generate higher level products from earth observations and related data sets and to use those products to complement statistically sound methodologies for agricultural estimates and monitoring. Interoperability of observations from different sources is essential.
• Verification and validation of national systems and regional/global estimates, predictions, etc. – establishment and maintenance of systems to ensure that data products and agricultural estimates meet specifications and address user needs.
• Continuity of purpose to allow expansion of existing capabilities – assure that the global agricultural monitoring system is sufficiently flexible and adaptable to evolve over time and incorporate new data sets and new capabilities.
The GEO can take responsibility for this coordination and can draw upon the assets of the member organizations to meet the common needs of national and international efforts. The GEO can also coordinate a program to assure that interested states have the training and capacity to apply common methodologies and generate accurate and universally acceptable results. A comprehensive global agricultural observing system would enable the following results:
• Mapping and monitoring of changes in agricultural type and distribution; • Global monitoring of agricultural production, facilitating reduction of risk and
increased productivity at a range of scales; • Monitoring of changes in irrigated areas; • Accurate and timely national agricultural statistical reporting; • Accurate forecasting of shortfalls in crop production and food supply; • Effective early warning of famine, enabling a timely mobilization of an
international response in food aid; and • Reliable and broadly accepted 5, 10 and 20 year projections of food demand and
supply as a function of changing demographics, markets, agricultural practices and climate
7.1 The Agricultural Monitoring Community of Practice To build an effective Global Earth Observation System of Systems (GEOSS) for Agriculture, GEO will need to engage those currently involved in agricultural monitoring to help design and implement the system that is needed, building on what is currently in place. This Community of Practice is comprised of the stakeholders interested in a GEOSS Agriculture Monitoring System and includes producers and/or users of raw or thematic spatial information linked to crop location, crop areas or crop growth conditions. Their common interest resides in the timely and sustained availability, of low-cost / free access, data and products which adhere to predefined standard and validation procedures.
In addition to the space agencies (e.g. NASA, ESA, ISRO, JXTA, CRESDA, CNES), international organisations (e.g. UN FAO, WFP, USAID, EU, CGIAR, World Bank) and the national / regional administrations concerned with agricultural monitoring, the community of practice will need to include representatives of different information user groups, linked to different economic sectors and acting at different levels of society (e.g. NGO's, farmer’s organizations and cooperatives, agro-industries and service providers).

The main economic sectors relate to trade and market analysis, crop insurance and evaluation, development aid, policy making, rural development but also agricultural production and management at field/ local level.
The primary task for the community of practice is to identify priorities for improving global agricultural monitoring and work with GEO and the member organizations to effect those improvements. The Community of Practice will need to meet periodically to assess priorities and to help the GEO develop strategies and approaches for realizing the system of systems. A number of short term tasks will need to be identified and undertaken in concert with the GEO Working Groups.
Attendees of the July 2007 GEO/IGOL Agriculture Monitoring Workshop
7.2 Designing the Monitoring System Figure 2 is the established GEOSS framework that defines the components of a generic, operational earth observation system to support societal benefits. Figure 3 provides an example of how Global Agriculture Monitoring fits within the GEOSS framework.
31Figure 2. GEOSS in relation to end-to-end user provisions
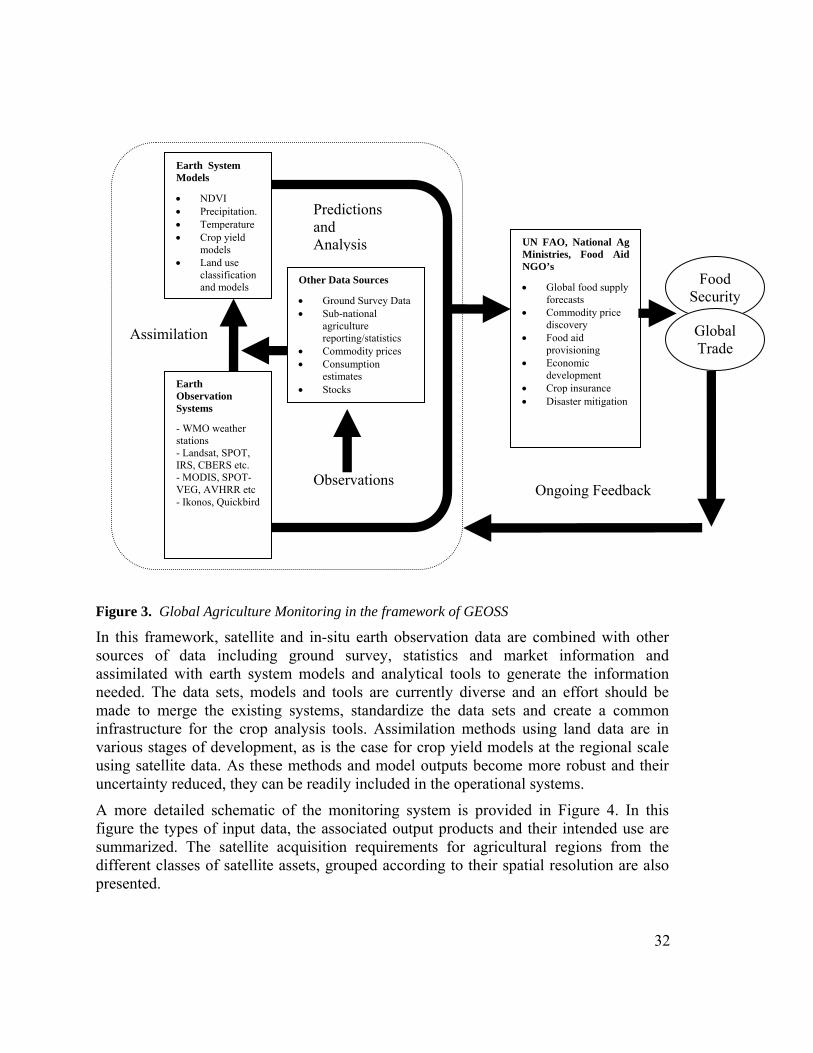
32
Figure 3. Global Agriculture Monitoring in the framework of GEOSS
In this framework, satellite and in-situ earth observation data are combined with other sources of data including ground survey, statistics and market information and assimilated with earth system models and analytical tools to generate the information needed. The data sets, models and tools are currently diverse and an effort should be made to merge the existing systems, standardize the data sets and create a common infrastructure for the crop analysis tools. Assimilation methods using land data are in various stages of development, as is the case for crop yield models at the regional scale using satellite data. As these methods and model outputs become more robust and their uncertainty reduced, they can be readily included in the operational systems.
A more detailed schematic of the monitoring system is provided in Figure 4. In this figure the types of input data, the associated output products and their intended use are summarized. The satellite acquisition requirements for agricultural regions from the different classes of satellite assets, grouped according to their spatial resolution are also presented.
Earth System Models
• NDVI • Precipitation. • Temperature • Crop yield
models • Land use
classificationand models
Earth Observation Systems
- WMO weather stations - Landsat, SPOT, IRS, CBERS etc. - MODIS, SPOT-VEG, AVHRR etc - Ikonos, Quickbird
Other Data Sources
• Ground Survey Data • Sub-national
agriculture reporting/statistics
• Commodity prices • Consumption
estimates • Stocks
UN FAO, National Ag Ministries, Food Aid NGO’s
• Global food supply forecasts
• Commodity price discovery
• Food aid provisioning
• Economic development
• Crop insurance • Disaster mitigation
Food Security
Global Trade
Assimilation
Predictions and Analysis
Observations Ongoing Feedback

Figure 4. A schematic of the inputs and outputs for the Global Agricultural Monitoring System of Systems. 8. Necessary Strategic Enhancements to the Current Agricultural Monitoring Systems The workshop conducted a series of breakout group discussions to develop the long-term agenda and near-term tasks to enhance the current monitoring systems. The following sections summarize the findings.
8.1 Strategic enhancements in the Satellite Observations Figure 4 shows the different satellite observations needed as part of a GEOSS for monitoring agriculture. At the current time and for the foreseeable future, only the regional scale observations (1km-250m) are sufficient to meet the needs of the community, assuming that, at a minimum, the VIIRS instrument on NPP is successfully launched and provides continuity with the MODIS instrument. Additional coarse resolution systems will provide additional capabilities and some desired duplication.
Although sensing systems are available to meet some of the national and sub-national needs, it is at this scale that most of the enhancements are needed. Although daily MODIS 250m data can be used to monitor areas with very large field sizes, finer resolution data are needed two or three times every 10 days to provide the necessary
33

34
cloud free coverage for monitoring most agricultural areas. IRS AWiFS is currently providing 5 to 6 images per month, but global coverage has yet to be fully developed, and there are currently constraints to broad use in terms of the cost of data. There is the need for the space agencies to develop a global acquisition strategy for high resolution data using the currently available assets (e.g. AWiFS, CBERS, ASTER, SPOT, Landsat 7) to provide 2-3 scenes every 10 days at resolutions between 60m and 20m. This strategy should then be extended into the future and applied to the constellation of next generation sensors at this resolution, as they come online e.g. CBERS 3, Resourcesat 2, LDCM, Sentinel 2, Venus and, ultimately, to global acquisitions at 10m. Similarly a strategy is needed to acquire one or two images a month at 5m-1m sampling critical agricultural areas. In addition to the acquisition strategy, protocols need to be developed for data access and exchange and standards will need to be developed for the derived products including format and quality. Development of this task will take cooperation between GEO, the Agricultural Monitoring Community of Practice and CEOS.
8.2 Strategic enhancements in the Availability of Meteorological Data Climate change, variability and extreme events continue to pose a critical global challenge to agricultural production. Montoring is impacted by sparse in-situ agro-meteorological observations in developing countries. A near-term remedy is to build capacity to integrate available station data with near real-time satellite estimates to support comprehensive and continuous monitoring of climate-sensitive crop and livestock conditions for early warning in the world’s most food insecure regions.
The workshop recognized that, presently, there is an increasing effort by the National Meteorological and Hydrological Services (NMHSs), through their Governments’ support, to improve their agro-meteorological field observational network, for the following reasons:
• Increasing vulnerability to recurrent extreme weather conditions (droughts, floods, diseases, etc) which are adversely affecting their socio-economic development,
• Improving and increasingly inexpensive nation-wide telecommunication systems (i.e. cell-phone technology) which allow for timely and cost-effective information sharing, and,
• Reduced cost in basic field observational systems for both manned and automated observational equipment.
In light of these developments, the following short-term recommendations (2007-2010) are proposed. These recommendations support improved agricultural monitoring in all countries, with special focus on developing countries:
• Identify gaps in in-situ agro-meteorological observational network and advocate a significant increase in field observations (in-situ), especially in climate vulnerable regions,
• Lobby for free exchange of field and satellite agro-meteorological data/products through the World Meteorological Organization (WMO) and satellite operators/agencies,

35
• Undertake capacity building activities in the integration of field and satellite observation, in support of localized agro-meteorological product generation and application.
• Leverage improving national and global telecommunication to more widely and freely disseminate data and products to end-users.
These recommendations are in-line with activities of NMHSs under the auspices of WMO and other specialized United Nations agencies such as WMO, FAO, WFP, and donor agencies that are active in agricultural monitoring activities. They are consistent with and reinforce existing international efforts like the Climate for Development (ClimDev) initiative of the Global Climate Observing System (GCOS) and the UN Economic Commission for Africa, which has set forth a framework for action. GEO can help ensure implementation by actively promoting a concerted multi-agency collaboration.
8.3 Strategic enhancements in National Agricultural Survey / Monitoring Systems.
The long term goal is the enhancement of agricultural survey / monitoring capabilities through the realization of satellite observations as an integral part of the overall agriculture survey and monitoring for all countries. This enhancement will consist of a combination of field survey and remote sensing observations, statistically designed to provide an optimal and problem-oriented solution including data collection, analysis and reporting. Two approaches are suggested depending on the status of current national survey / monitoring. Where there are existing systems, the goal is to support countries to undertake their on-going agricultural surveys / monitoring in a more efficient manner, through the use of earth observations. Several possibilities are open for use of remote sensing in agricultural surveys: stratification, model-based estimation or point sampling combined with satellite observations. The challenge is to identify field and satellite parameters in an optimal and practical combination. Where there is no effective agricultural survey system in place, the goal is to develop efficient national agricultural survey systems based on maximal use of satellite observations. Satellite observations provide adequate, timely and cost-effective mechanism for undertaking continuing agricultural crop monitoring (in near real-time) for national / international action to solve urgent social, ecological and humanitarian problems (hardships) arising from short-term (unexpected) fluctuations in agricultural production.
For routine agricultural monitoring, satellite data must be integrated with field data in statistically sound (properly designed) manner, making use of biometric (probabilistic) models, crop forecasting and early warning techniques, etc. While developing and improving the design of agricultural surveys and monitoring systems, there is an ongoing need to bridge the communication gap between remote sensing and agriculture survey specialists. To address these issues, the following short term initiatives were identified:
Immediate measures for bridging the communication gap between remote sensing and agriculture survey specialists.
The breakout group noted with concern that satellite observations have so far found very limited application in survey and monitoring of agricultural crops in most countries. A
36
series of regional workshops combining satellite remote sensing and field techniques in agricultural survey and monitoring practices, would help accelerate the process and help to bridge the communication gap between remote sensing and agriculture survey specialists, fostering lateral transfer of technologies.
Reporting of successful integration of satellite observations and field techniques in National Operational Agriculture Survey and Monitoring
The objective is to develop and document 2-3 existing country studies on the successful use of remote sensing and statistical methods in order to provide timely and cost-effective data to forewarn and tackle urgent social, ecological and humanitarian problems (hardships) for policy making. The FASAL Project in India was suggested as one of the case studies (see Appendix B). The FAO Agricultural Statistical Service Division (ESS) should provide the lead in realizing this objective in partnership with GEO and the Community of Practice.
Technical support for Remote Sensing Applications in Agricultural Survey / Monitoring in countries with weak capacity
This initiative would provide technical support in the application of statistical procedures including remote sensing and field sample surveys in countries with less developed agricultural statistics and country capacity. Concrete technical assistance to member countries could be provided by FAO to develop and disseminate use of integrated system in Agricultural Surveys and Monitoring. FAO is currently providing technical assistance to Ethiopia and Haiti and in the near term, remote sensing could be introduced in these countries to form the foundation of their emerging national agricultural survey. Tailor-made training courses for country experts would be the most beneficial. The system once developed could be multiplied elsewhere. The UN FAO with its focus on national capacity building for agricultural monitoring could play a lead role in this activity. To reach these goals GEO and the Working Group on Capacity Building, should work with the Community of Practice to develop a program of training in the use of satellite data for agricultural survey and monitoring.
8.4 Strategic enhancements in Capacity Building The workshop considered and recognized the need to develop long- and short-term capacity building strategies in developing countries which would enhance agricultural surveys and monitoring through the use of both terrestrial and space observational systems in the next 10-years. In terms of a short-term capacity building strategy (2008-2010), it was considered cost-effective to take into account existing infrastructure and training programs that are in-line with the GEOSS Agriculture Monitoring objectives. In this regard, the following awareness and training programs were identified as both highly desirable and feasible:
• Creating awareness of GEOSS space-programs and opportunities in support of Agriculture Monitoring (2007-2010),
• Enhancement of satellite derived rainfall estimates (RFE) by national meteorological services, and,
• Development of national and regional Food Security Outlook (FSO) scenario’s as part of climate-risk management.

37
The latter is expected to leverage on existing Climate Outlook Forum (COF) initiatives, conducted seasonally in developing countries by Climate Prediction and Applications Centers and whose overall mandate and activities are considered to be in-line with GOESS Agricultural Monitoring tasks. In addition it was suggested that a ‘best practices’ document be developed on the use of geospatial data for agricultural monitoring.
A long-term strategy (2010-2015) was outlined which requires a systematic capacity building program, taking into consideration prioritized agricultural surveys and monitoring needs, current and foreseen challenges, with a special emphasis on developing countries. In this strategy, the following activities were envisioned:
• Developing an inventory of existing and planned “in-situ” agriculture monitoring observational networks,
• Ensuring access to satellite data and products, • Identification of training opportunities and gaps within current and planned
training programs • Collaboratively implementing training programs with other agencies and/or
institutions with similar objectives. For this effort, WMO/Regional Meteorological Training Centers (RMTC), USGS/FEWS NET, EUMETSAT, FAO and Climate Prediction and Application Centers were identified as potential agencies and institutions which could support the capacity building activity in Africa. The UN-Centre for Space Science Technology Education for Asia and the Pacific (CSSTEAP) based in India, could also help develop such activities for Asia and the Pacific region. For other continents, there is a need to identify existing institutions and activities, which GEOSS Agricultural Monitoring could leverage to help achieve its overall objectives.
8.5 Strategic enhancements in Global Cropland Mapping Considerable experience exists in the use of remotely sensed data sets in the estimation of cropped area and crop type distribution. The methods currently reside primarily in the research domain and have been developed and applied regionally. Creating a global synthesis is challenging and requires using approaches that account for varying spatial and temporal scales, as well as levels of intensification of various global cropping systems. It would also require coordinated use of available data sets, tools and capacity found within the global community of agricultural remote sensing researchers. In order to pursue the goal of systematic global cropland characterization, a network of such researchers will need to be established within the GEOSS Community of Practice.
Preliminary tasks for such a group would include the development of databases allowing for the testing of algorithms in characterizing global croplands. Such data would include information along a range of spatial scales, from in situ measurements to multi-resolution satellite-based observations. By assembling examples of parcel level crop information for key commodity crops, such as soybeans, corn, rice, wheat, and others, a database for testing global-scale methodologies would be created. Such data would not be spatially exhaustive, but would emphasize the creation of internally consistent reference data sets usable for study within a global monitoring framework. For example, soybean

38
cultivation data at the parcel level could be assembled for test areas within Argentina, Brazil, China, India, and the United States. This initial dataset would be standardized and used as a prototype for global scale soybean monitoring.
Different strategies may be required to characterize croplands according to their regional contexts. Crop type can be identified over large scale production areas with a good accuracy, while mapping cultivated croplands remains a challenge in fragmented and mixed agricultural landscapes. The diversity of situations encountered at the global scale should be documented along with the accuracy and the timeliness of the croplands information delivery. Mapping the geometric and temporal resolution requirements to produce in a timely manner, accurate crop type or croplands maps at global scale will allow fine tuning the satellite observation acquisition strategies.
It is important to note that the objective is not to compete with existing national agencies in deriving crop inventory information but to improve methods for synthesizing information in order to quantify trends in global agricultural production. To date, the primary use of remote sensing-derived crop characterizations has been as a crop indicator, not as a direct area estimator. As explained above, most agencies responsible for national-scale agricultural statistics do not rely principally on remote sensing and more communication is required. Three main reasons exist for pursuing remote sensing-based croplands monitoring capabilities at the global scale. Firstly, new earth observation data and algorithms offer the possibility of improved monitoring of croplands. Such advances should take place in a coordinated way at the global scale. Second, synthesizing existing cropland information to generate global-scale information would be time-consuming, and remote sensing data offer a way for deriving global-scale cropland characterizations in a more efficient and timely manner. Third, remote sensing is the only way to deliver the wall-to-wall croplands map needed to monitor crop growth throughout the growing season.
A short-term output should be a global croplands map at 250m resolution made freely available. In parallel, regional experiments jointly carried out would allow to set the accuracy and timeliness standards for early crop area estimates. Preliminary activities for a GEOSS global cropland area and type characterization program include the development of a network of sites for the calibration and validation of crop area and type mapping. To do this, the following action items must be pursued:
• Form a steering committee from the Community of Practice. • Develop a user requirements document. • Compile an inventory of existing in situ crop information at a parcel level and
existing crop type and croplands maps. • Convene a technical meeting to design of a globally distributed experiment on
crop and croplands mapping (early 2008) focussing on: – In situ observation: crop type, crop phenology – Definition of requirement for each calibration/validation site – Methods inter-comparison based on standardized accuracy assessment

39
9. The Relationship to other GEOSS Agricultural Tasks The Agricultural Monitoring Task (Ag 07 03) complements the Agricultural Risk Task (Ag 07 02) focused on climate prediction in support of agriculture. With the increasing predictive capability of global climate models there is an interest in applying these tools to agricultural forecasting at the regional level. Coupled ocean and atmospheric models are addressing connections between sea surface temperatures and regional rainfall forecasting, for example, El Niño Southern Oscillation (ENSO) events. Reducing uncertainty in these forecasts is a high priority for the climate research community. Downscaling global models to the regional scale is leading to meso-scale models with improved spatial resolution and relevance for agricultural regions. At the regional scale, better surface parameterizations are leading to improvements in model performance. Long term predictions of rainfall over the next 10 – 50 years in the context of climate change are providing useful inputs to assessments of future global agriculture. A close working relationship needs to be maintained between the various GEOSS Agricultural Tasks.
10. Workshop Recommendations The workshop concluded that a Global Agricultural Monitoring System of Systems is both technically feasible and institutionally desirable. It can be constructed by building on the existing international and national agricultural monitoring systems, providing new and improved observations and monitoring capabilities. This agricultural GEOSS will need to serve the needs of both global and national level monitoring. The latter will be a prerequisite for national agencies to participate and support this development.
Recognizing the large changes currently taking place in the distribution of agricultural land and associated farming practices due to changing socio-economic forces and climatic variability and change, and the increasing importance of effective monitoring of global agriculture and food security, the workshop attendees make the following recommendations to GEO and its members:
Recommendation 1. GEO and the Committee on Earth Observation Satellites (CEOS) and the associated working groups should give increasing attention to securing the following spaceborne assets and infrastructure needed for agricultural monitoring with an emphasis on data continuity and reliability and timeliness of data delivery: a. Coarse Resolution Sensors (4km – 250m) Space agencies should continue and expand the operational space programs to ensure the continuity of morning and afternoon polar orbiters and the associated validated data products used for agricultural monitoring (e.g. surface reflectance, vegetation indices, crop type). Overlap between consecutive missions is required to ensure data continuity and enable cross-calibration. Some planned redundancy between missions is also highly desirable to ensure data continuity.
i) Space agencies should adopt equitable pricing policies for all coarse resolution data resulting in free and open data access and data sharing.

40
ii) Systems need to be put in place to provide moderate resolution data delivery in near real-time, or at a minimum within 24 hours of acquisition.
iii) Space agencies should give increased attention to demonstrating and exploiting the capability of a global geostationary network of sensors for agricultural monitoring. An increase in spatial resolution of these systems to 500m would greatly increase their utility for agriculture.
b. Moderate Resolution Sensors (60m-10m) i) Because of the key role of moderate resolution data in agricultural monitoring, space agencies should move to secure full operational status for moderate resolution (10m-60m) sensing systems, extending the 35 years of dynamic data continuity from Landsat and SPOT. Improvement in temporal resolution of such data is an essential requirement to capture the dynamics of crop growth. ii) An international moderate resolution data initiative should be developed, providing a global fine resolution data set for the 2009-2011 period, from the available international assets. This data set to be derived from multiple international data sources would follow on from the GEOCOVER and Global Land Survey project (to be completed by USGS / NASA in 2008) and be used as a basis for developing a database on global agricultural distribution, crop type and rotation and farming systems. The data set should be made available free of charge. It is recommended that CEOS WGISS provide guidance on the necessary acquisition strategy, metadata standards and product interoperability and availability. iii) Within the next 3 years, the space agencies should collaborate to establish non-prohibitive data pricing policies, allowing for free and open sharing of moderate resolution data in support of global agricultural and food security monitoring. iv) Within the next 5 to 10 years, the space agencies should develop and implement the next generation of operational moderate resolution sensing systems, working in concert to provide a truly integrated system, acquiring and providing global coverage of 60-10m cloud free imagery every 5-10 days v) The international space agencies should give increased attention to demonstrating and exploiting the capability of fine resolution data from microwave, thermal, and microwave sensors for agricultural monitoring and their combination with data from optical sensors.
c. Fine Resolution Data (< 10m). Recognizing that, currently, these systems are primarily operated by the private sector, the community of practice would encourage targeted acquisition of agricultural lands during the growing season in regions where food security is a priority issue. A reduction in price to enable developing countries to readily utilize these data is also needed.
d. Radar Altimetry. These data are currently used for determination of lake and reservoir water levels providing important insight in to water availability for irrigation. Operational status is needed for these satellite systems, along with improved spatial resolution, targeting, swath acquisition capability, and height accuracy.
e. Synthetic Aperture Radar data. Currently SAR data are being mostly acquired based on user request. Considering the demonstrated use of such data for monitoring wetlands

41
agriculture, particularly in the cloud prone regions of Asia, space agencies are requested to regularly acquire, archive and provide such data at reasonable cost for agricultural monitoring.
Recommendation 2. GEO and the UN FAO and its member national agricultural agencies should give increased attention to the use of satellite data to improve the efficiency of traditional methods for national agricultural survey and monitoring leading to timely, accurate, and verifiable reporting of national agricultural statistics. In this context: a. A series of regional workshops should be held, providing demonstrations of the utility of and methods for integration of satellite and in-situ data to improve crop yield forecasting. These workshops should where possible include a lateral (south-south) transfer of technology.
b. The UN FAO ESS and GEO should provide technical support for the technology transfer and assist in the integration of the satellite data in operational agriculture survey and monitoring systems in developing countries. To this end, it is recommended that 2-3 demonstration case studies be developed for different regions of the world, twinning lead agricultural statistical survey and earth observation institutions in the countries chosen.
Recommendation 3. GEO and the WMO and its Members (NMHSs) should recognize the critical need for improving the availability of meteorological station data and resultant products to enable improved prediction and monitoring of crop condition, shortfalls in agricultural production and associated famine early warning. The following specific actions are recommended:
a. Increased coverage of meteorological stations is needed for the WMO database for Africa, reducing the obstacles to timely access to these decadal (10 day) data.
b. Improvements are needed in the accuracy of seasonal weather forecasting, providing reliable input for integration in food production forecasting and famine early warning.
c. Enhancement of satellite derived rainfall estimates (RFE) through a combination of satellite and met-station rainfall products is needed.
Recommendation 4. The GEO Secretariat should assist the Agricultural Monitoring Community of Practice initiated by this workshop to implement the sub-tasks outlined in this report (see Recommendation 5). Specifically, the GEO Secretariat should:
a. Establish a full-time staff person working closely with the GEO Secretariat in Geneva to provide a secretariat function for GEOSS Agriculture, to help coordinate and implement the agricultural monitoring sub-tasks and provide liaison to the GEOSS Working Groups.
b. Coordinate across the different elements of its program and work with its partner organizations to identify resources to support capacity building for developing countries to utilize spaceborne assets for agricultural monitoring, strengthening the capability of regional centers in this regard and supporting developing country scientists and practitioners to attend future meetings of this Community of Practice.

c. Develop an international agreement on, and implementation of, a data policy that includes free and open access to data sets and products contributed by the space agency members of GEO, to meet the objectives of the GEO Agricultural Monitoring System of Systems.
Recommendation 5. The GEOSS/IGOL Agricultural Monitoring Community of Practice as initiated at this workshop should proceed to implement the sub tasks of GEOSS AG 07 – 03 identified at this workshop as follows:
a. A workshop should be held in early 2008 to establish best practices and future needs for national crop acreage forecasting.
b. A set of regional experiments should be coordinated to determine the EO requirements for delivery of accurate crop area estimates early in the growing season.
c. A series of regional workshops should be organized with the UN FAO ESS on integrating earth observation into national statistical reporting.
d. A community of practice web site should be established and used to communicate between participants and to expand community awareness of and participation in the implementation of the sub tasks.
e. A review of current mission plans and data policies should be undertaken and a Global Agricultural Data Coordination Workshop should be held (within 18 months) to address availability, timeliness, quality and exchange of satellite and in situ data for agricultural monitoring.
f. A global croplands map at 250m resolution should be produced annually and made freely available. In regions of small subsistence fields croplands should be mapped at 20-60m resolution using the global fine resolution data set developed under Recommendation 1.b.ii
42
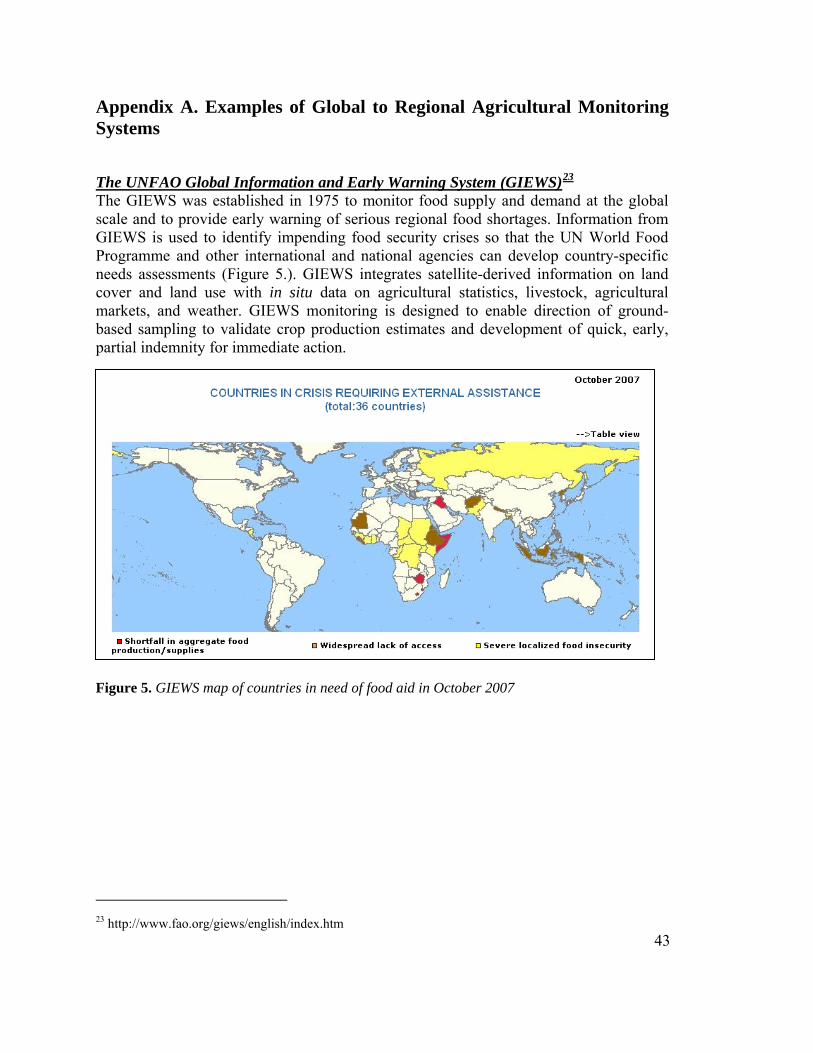
Appendix A. Examples of Global to Regional Agricultural Monitoring Systems
The UNFAO Global Information and Early Warning System (GIEWS)23
The GIEWS was established in 1975 to monitor food supply and demand at the global scale and to provide early warning of serious regional food shortages. Information from GIEWS is used to identify impending food security crises so that the UN World Food Programme and other international and national agencies can develop country-specific needs assessments (Figure 5.). GIEWS integrates satellite-derived information on land cover and land use with in situ data on agricultural statistics, livestock, agricultural markets, and weather. GIEWS monitoring is designed to enable direction of ground-based sampling to validate crop production estimates and development of quick, early, partial indemnity for immediate action.
Figure 5. GIEWS map of countries in need of food aid in October 2007
4323 http://www.fao.org/giews/english/index.htm

The USDA Foreign Agricultural Service (FAS)24
The goal of the Office of Global Analysis (OGA) of FAS, specifically within the International Productions Assessment Branch, is to produce reliable, objective, timely, transparent, accurate data on global agricultural production. FAS monitors world agricultural production and world supply and demand for agricultural products to provide baseline market information and information for US domestic early warning. FAS analyses rely upon a combination of meteorological data, field reports and satellite observations at moderate and high spatial resolutions to aid in crop and growth stage identification and yield analysis. These data are used to confirm or deny unsubstantiated information about forecast crop yields and to identify unreported events likely to impact crop yields. To bring these disparate sources of data together, FAS has developed the Crop Explorer, a GIS-based decision support system. The Global Agricultural Monitoring (GLAM) Project25 jointly funded by USDA and the NASA Applied Sciences Program, is updating the FAS decision support system with the new generation of NASA satellite observations.
Figure 6. FAS decision support system images showing vegetation stress predominantly in croplands, during the 2006 drought, in southeastern Australia. The anomaly image compares NDVI values for the September 14 to September 29, 2006 timestep, to average NDVI measured during the same 16-day period from 2000-2005. The NDVI time series graph shows the reduced NDVI relative to the mean and to a productive year (2003) during the 2006 drought.
MODIS NDVI Time Series Graph for Crop Areas Eastern Australia NDVI Anomaly Image Sept 14-Sept 29, 2006
2003 mean
2006
24 http://www.pecad.fas.usda.gov/index.cfm
4425 http://www.pecad.fas.usda.gov/glam.cfm

Monitoring of Agriculture with Remote Sensing –Food (MARS Food)26
The mission of MARS-Food, a program within the European Commission’s Joint Research Centre, is to monitor food security for at-risk regions world-wide. This information contributes to EU external aid and development policies, in particular food aid and food security policy. The desired outcome is to avoid food shortages and market disruptions and to better calibrate and direct European food aid. Satellite observations and meteorological data are integrated with baseline data on regional agronomic practices into crop growth models to develop MARS-Food ten-daily and monthly bulletins with yield forecasts by crop. Trends, similarity analysis, regression, and expert assessments are used to produce monthly reports that are intended to be directly used by food security administrators. In addition to quantitative and qualitative crop yield assessments, several indicators, like rainfall, radiation and temperature, and water satisfaction indices are published with comparisons to long-term historical average and last year indicators so that food security administrators can have a complete picture of the conditions in food-insecure areas. MARS Stat27 (see Appendix B) is a partner program focused on developing early, independent, and objective statistical estimates about the production of the main crops in Europe.
DDaattaa ccoolllleeccttiioonn && rreettrriieevvaall
Earth Observation
Meteorological
Agronomy
WEB Information
PPrroocceessssiinngg &&AAnnaallyyssiiss
RReeppoorrttiinngg DDiisssseemmiinnaattiioonn
- EU Delegations
- National EW Agencies
45
Figure 7. Diagram of the MARS-Food Crop Assessment Process
26 http://agrifish.jrc.it/marsfood/Default.htm 27 http://agrifish.jrc.it/marsstat/default.htm
#Y
Bay
Mud
Gedo
Hiran
Lower Juba
Galgadud
Bakool
LowerShabelle
MiddleJuba
MiddleShabelle
Ethiopia
Somalia
Mogadishu
#Y
Tog-
Djibouti
AwdalGalbeed
Bakool class "isolated fields/ rainfed"Agro-pastoral sorghum
0.0
1
0.2
0.3
0.4
0.5
0.6
M A M J J A S O N D J F
Time
0.
0
1020
30
40
50
60
70
80
mm
rain 2003-04Average 98-022002-032003-04
Cumulated PrecipitationIran (south)
0
100
200
300
400
500
600
Sep1 Oct1 Nov1 Dec1 Jan1 Feb1 Mar1 Apr1 May1 Jun1 Jul1 Aug1
dekads
mm
2003/2004 2002/2003
KenyaPercentage of maize area in each
class
0%
20%
40%
60%
80%
100%
2001 2002
C-NDVI
Crop GMS
Water SatisfactionIndex
Data Dissemination
Bulletin Dissemination
CCrroopp AAsssseessssmmeenntt PPrroocceessss

USAID Famine Early Warning Systems Network (FEWS NET)28
The U.S. Agency for International Development (USAID) Famine Early Warning Systems Network (FEWS NET) is an information system designed to identify problems in the food supply system that potentially lead to famine or other food-insecure conditions in sub-Saharan Africa, Afghanistan, Central America, and Haiti. FEWS NET is a multi-disciplinary project that collects, analyzes, and distributes regional, national, and sub-national information to decision makers about potential or current famine or other climate hazard-, or socio-economic-related situations, allowing them to authorize timely measures to prevent food-insecure conditions in these nations. Regions and countries with FEWS NET representatives include sub-Saharan Africa (Angola, Burkina Faso, Chad, Djibouti, Ethiopia, Kenya, Malawi, Mali, Mauritania, Mozambique, Niger, Nigeria, Rwanda, Somalia, (southern) Sudan, Tanzania, Uganda, Zambia, and Zimbabwe), Central America (Guatemala, Honduras, and Nicaragua), Afghanistan, and Haiti.
Figure 8. Example of FEWS NET Food Security Bulletins
28 http://www.fews.net/ and http://earlywarning.usgs.gov/adds/overview.php
46

ESA Global Monitoring for Food Security (GMFS) Programme The objective of the GMFS project developed by the European Space Agency (ESA) is to improve the provision of operational and sustainable information services, derived at least partly from earth observation data, to assist food aid and food security decision-makers from local to global level. GMFS aims to consolidate, support and complement existing regional information and early warning systems on food and agriculture. Together with other key players in the sector, GMFS is establishing a European Service for Food Security to guarantee state-of-the-art operational monitoring and forecasting for agricultural production and food security issues in direct support to European food security policy objectives. The longer-term goal of GMFS is to develop a network of geographically distributed service providers capable of contributing to and benefiting from satellite observations related to agricultural production monitoring. One activity that is being leveraged to advance the GMFS project is the broadcast of VEGETATION data to Africa through EUMETCast, aimed at promoting data utilization and develop capacities of regional participants.
Crop growth stage 2005 (Central Ethiopia) Relative Millet Yield Forecast
Senegal
Figure 9. Example GMFS crop monitoring products for Ethiopia and Senegal
SADC Regional Remote Sensing Unit Drought Monitoring Center 29
The Regional Remote Sensing Unit (RRSU) is a program coordinated by the Southern African Development Community (SADC) designed to support early warning for food security of its fourteen member nations. The goal of the program is to promote sustainable natural resource use and to enhance information for disaster risk management.
47
Figure 10. Percent of Average Rainfall in SADC region between January and April 2007 highlighting regions with drought conditions
29 http://www.dmc.co.zw
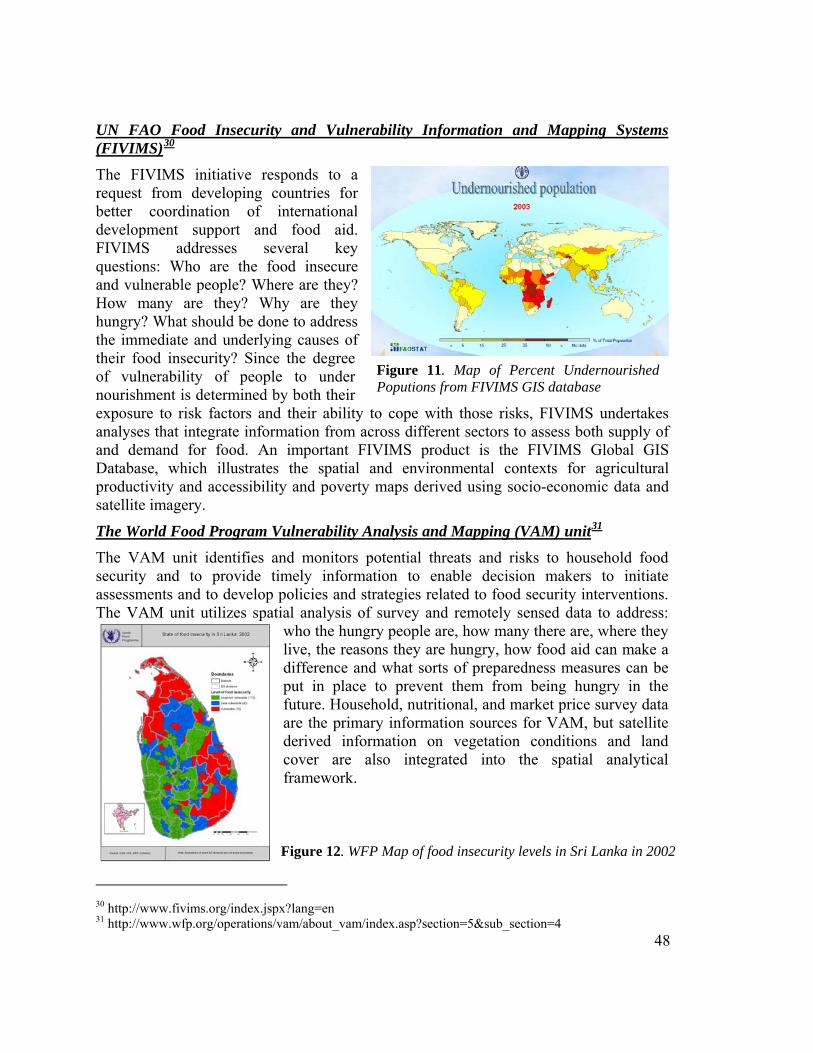
UN FAO Food Insecurity and Vulnerability Information and Mapping Systems (FIVIMS)30
The FIVIMS initiative responds to a request from developing countries for better coordination of international development support and food aid. FIVIMS addresses several key questions: Who are the food insecure and vulnerable people? Where are they? How many are they? Why are they hungry? What should be done to address the immediate and underlying causes of their food insecurity? Since the degree of vulnerability of people to under nourishment is determined by both their exposure to risk factors and their ability to cope with those risks, FIVIMS undertakes analyses that integrate information from across different sectors to assess both supply of and demand for food. An important FIVIMS product is the FIVIMS Global GIS Database, which illustrates the spatial and environmental contexts for agricultural productivity and accessibility and poverty maps derived using socio-economic data and satellite imagery.
Figure 11. Map of Percent Undernourished Poputions from FIVIMS GIS database
The World Food Program Vulnerability Analysis and Mapping (VAM) unit31 The VAM unit identifies and monitors potential threats and risks to household food security and to provide timely information to enable decision makers to initiate assessments and to develop policies and strategies related to food security interventions. The VAM unit utilizes spatial analysis of survey and remotely sensed data to address:
who the hungry people are, how many there are, where they live, the reasons they are hungry, how food aid can make a difference and what sorts of preparedness measures can be put in place to prevent them from being hungry in the future. Household, nutritional, and market price survey data are the primary information sources for VAM, but satellite derived information on vegetation conditions and land cover are also integrated into the spatial analytical framework.
Figure 12. WFP Map of food insecurity levels in Sri Lanka in 2002
30 http://www.fivims.org/index.jspx?lang=en
4831 http://www.wfp.org/operations/vam/about_vam/index.asp?section=5&sub_section=4

The Consortium for Spatial Information (CSI) of the Consultative Group on International Agricultural Research (CGIAR)32
The CSI-CGIAR applies geospatial science to sustainable agricultural development, natural resource management, biodiversity conservation, and poverty alleviation in developing countries. The CGIAR system of research centers has been monitoring global agriculture since the early 1970’s. The CSI is comprised of 15 CGIAR centers plus the International Centre for Integrated Mountain Development (ICIMOD). CSI-CGIAR activities include analyses of agricultural biodiversity and genetic resources, food security and food policy, water and soil resource conservation and agricultural and natural resources management. The centers are modelling the spatial dimensions of crop growth, irrigation, pests and pathogens and forests and fisheries. The consortium coordinates the many efforts of the individual research centers, developing mechanisms to share and disseminate spatial data and GIS and remote sensing software and tools. The CSI has a strong presence in developing countries, with “on-the-ground” research projects with national agricultural research systems and farmers themselves. Scientists directly involved in the CSI work with more than 8,000 other CGIAR scientists and staff to monitor and evaluate agricultural conditions and to conduct research and development for improving developing-country agriculture.
Figure 13. The 16 CSI-CGIAR centers: Bioversity International, International Center for Tropical Agriculture (CIAT), Center for International Forestry Research (CIFOR), International Maize and Wheat Improvement Center (CIMMYT), International Potato Center (CIP), International Center for Agricultural Research in Dry Areas (ICARDA), The International Centre for Integrated Mountain Development (ICIMOD), International Crops Research Institute for the Semi-Arid Tropics (ICRISAT), International Food Policy Research Institute (IFPRI), International Institute for Tropical Agriculture (IITA), International Livestock Research Institute (ILRI), International Rice Research Institute (IRRI), International Water Management Institute (IWMI), African Rice Center (WARDA), World Agroforestry Center, World Fish Center.
4932 http:// www.csi-cgiar.org

Appendix B. Examples of National Agricultural Monitoring Systems
Agricultural Monitoring in Brazil Brazilian agriculture is extensive, with some 54 million hectares of agricultural land and 131 million tons of grain production in 2007. Due to regional differences in soils, relief, climate, management practices, diseases, calendar, rotation and area expansion, crop monitoring and forecasting is a great challenge for the government. The need for more precise, less subjective and timely information led the Ministry of Agriculture, through its National Supply Agency (CONAB – Companhia Nacional de Abastecimento), which is responsible for the official crop production figures, to create a national agricultural monitoring and forecasting project in 2003, called “Geosafras”. The objectives of the “Geosafras Project” are:
• to improve the crop monitoring/forecasting methods • to diminish subjectivity in area and yield estimates • to develop specialists in crop monitoring/forecasting • to operationalize new crop monitoring/forecasting methodologies
The two main components of the project are area estimates, using statistics and remote sensing, and yield estimates, using agrometerorological, spectral and mixed models. The strategy to put together such a project, and gather results in a relatively short period of time, was to create a network of c. 18 partner institutions (universities, research institutes, local and federal government agencies) to develop methodologies for area estimates and yield forecast, based mainly on geospatial technologies. Initially, the area estimates were developed by selecting agricultural municipalities stratified based on their production, and random sampling points for field observation within the municipalities, followed by expansion estimates. This methodology worked well for state level estimates in the southern states, but is still being evaluated for central and northern states which have bigger agricultural fields. For perennial (e.g. coffee) and semi-perennial (e.g. sugar cane) crops, moderate resolution imagery (e.g. Landsat and CBERS-2) are being used for field mapping and area estimates. Coarse spatial resolution
sensors, such as MODIS and NOAA/AVHRR are being used to generate cropland masks. Yield estimates are mainly based on agrometeorologial models (Figure 14), spectral models and mixed (agromet + spectral) models.
The project is in its 4th year, funded by CONAB with fund management by UNDP (United Nations Development Programme), and now, becoming operational at the agency level, within the official calendar of the Crop Evaluation System (SAS) (Figure 15), which releases crop forecasts monthly.
Figure 14. Results of an agrometeorological model for yield/production estimates
50
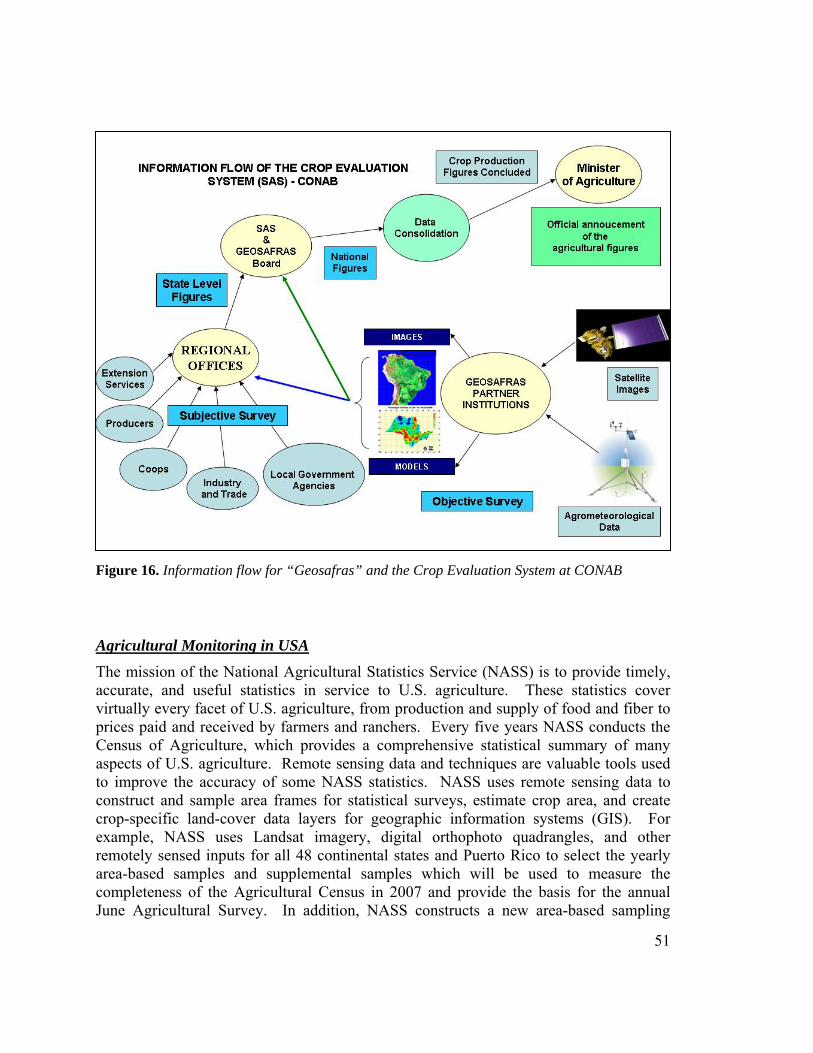
Figure 16. Information flow for “Geosafras” and the Crop Evaluation System at CONAB
Agricultural Monitoring in USA The mission of the National Agricultural Statistics Service (NASS) is to provide timely, accurate, and useful statistics in service to U.S. agriculture. These statistics cover virtually every facet of U.S. agriculture, from production and supply of food and fiber to prices paid and received by farmers and ranchers. Every five years NASS conducts the Census of Agriculture, which provides a comprehensive statistical summary of many aspects of U.S. agriculture. Remote sensing data and techniques are valuable tools used to improve the accuracy of some NASS statistics. NASS uses remote sensing data to construct and sample area frames for statistical surveys, estimate crop area, and create crop-specific land-cover data layers for geographic information systems (GIS). For example, NASS uses Landsat imagery, digital orthophoto quadrangles, and other remotely sensed inputs for all 48 continental states and Puerto Rico to select the yearly area-based samples and supplemental samples which will be used to measure the completeness of the Agricultural Census in 2007 and provide the basis for the annual June Agricultural Survey. In addition, NASS constructs a new area-based sampling
51

frame for approximately two states each year. The remote-sensing acreage estimation project analyzes Resourcesat-1 AWiFS data over the major corn and soybean producing states to produce independent crop acreage estimates at the state and county levels and a crop-specific categorization called the Cropland Data Layer. The Cropland Data Layer program produced crop specific land cover products in over 29 states to date, with annual repeat coverage of 13 agriculturally intensive states (Figure 17). NASS is also in a continuing partnership with the USDA/Agricultural Research Service using NASA MODIS sensor data as an input for setting early season small-area yield estimates in several mid-western states. NASS also produces vegetation condition products based on the normalized difference vegetation index during the growing season from the NOAA-AVHRR sensor, providing policymakers in the Department of Agriculture with an independent look at growing conditions across the nation.
Figure 17. NASS Cropland Data Layers (CDLs)
52

Agriculturalal Monitoring in Europe
The mission of the crop production forecasts activities of the European Commission at the Joint Research Centre (MARS-Stat33) is to provide accurate, independent and timely crop yield forecasts and crop production biomass (including bio fuel crops) for the union territory and other strategic areas of the world. MARS-Stat has been developing and operationally running a Crop Forecasting System since 1992 in order to provide timely crop production forecasts at European level. This system is able to monitor crop vegetation growth (cereal, oil seed crops, protein crops, sugar beet, potatoes, pastures, rice) and include the short-term effects of meteorological events on crop productions and to provide yearly forecasts on European crop predictions. The MARS-Stat system is made by remote sensing (NOAA-AVHR, SPOT-VGT, MODIS, MSG) and meteorological observations (observed station data and ECMWF data), agro-meteorological modeling (Crop Growth Monitoring System, CGMS) and statistical analysis tools. Results are regularly published in the form of bulletins and via the MARSOP website including maps of weather indicators based on observations and numerical weather models, maps and time profiles of crop indicators based on agro-meteorological models and maps of vegetation indices and cumulated dry matter based on remote sensing images (http://www.marsop.info). In addition, MARS-Stat is the depositary of techniques developed using remote sensing and area frame sampling at the European level to estimate crop areas. MARS-Stat will continue the development of new improvements (spatially and methodological) for the Crop Yield Forecasting and Area Estimate System. A new world-wide crop production estimation activity has started with the Black Sea area and will extend to Russia and China with a focus on wheat production.
Figure 18. The MARS Crop Monitoring in Europe - examples of the published bulletins
5333 http://agrifish.jrc.it/marsstat/default.htm

Agricultural Monitoring in Australia
Earth Observation for agricultural monitoring in Australia ranges from broad-scale monitoring of vegetation for greenhouse gas accounting through to sub-paddock precision agriculture applications across numerous industries such as cropping, livestock grazing, viticulture, rice and sugar industries. In addition to earth observation there are a number of static national data sets (e.g. land tenure, remnant vegetation, land use, soils) as well as historical and near real-time climate information and census statistical data that can be integrated with earth observations for interrogation and modelling purposes.
Earth observation applications at the regional and local scale are numerous. They are often developed for particular agro-climatic zones and tailored for specific market segments. Products are both qualitative indices (e.g. NDVI) through to quantitative remote sensing (e.g. pasture biomass and growth rate), and in many instances are integrated with models. Near real-time applications are of increased interest such as fire monitoring, biosecurity surveillance, extreme events, and precision agriculture.
Temporal resolution also remains varied – cropping applications for the within-paddock strategic application of fertilizers utilizes a few key images per year, whereas livestock grazing applications for stock movement decisions utilizes weekly imagery. There are often trade-offs with spatial resolution, with frequent observations using predominantly MODIS imagery; less frequent and within-paddock observations tend to use moderate resolution imagery such as Landsat, Spot, Ikonos, Quickbird and airborne platforms.
© CSIRO
® Pastures from Space
The business model for the provision of remote-sensed products is not well established in Australia. The diversity of the market necessitates tailoring of (i) the products, (ii) the way they are delivered to the market and (iii) packaging with other information streams and decision support software. Advances in sensor networks and information communication technologies are increasing the capacity to deliver. In the face of the global pressures of climate change, extreme events, food security, biosecurity and environmental stewardship, earth observation remains critical for monitoring, understanding and managing Australia’s agricultural and natural ecosystems.
Figure 19. Example image of Australian pasture growth rates (kg/ha/day) delivered weekly at the paddock level
54

Agricultural Monitoring in Argentina
The Dirección de Coordinación de Delegaciones (DCD) is the national Argentine government agency responsible for agricultural estimates within the Secretary of Agriculture, Livestock, Fisheries and Food (SAGPyA). This mission is accomplished by a network of 34 offices throughout the main agricultural areas of the country, gathering information about different statistics concerning agriculture including: area, yield, seeding and harvesting progress, crop condition, etc. Each of these offices reports periodically to the DCD in Buenos Aires, where the information is checked, summarized and released to the user community.
Traditionally, subjective estimates were used. However, since 1981 remote sensing has been applied to improve the estimates through four approaches:
1. Land use/land cover stratification as a basis of area sampling frames.
2. Digital analysis of satellite imagery (Landsat) to estimate area planted of extensive crops (i.e. wheat, corn, soybean) using classification techniques (Figure 20)
. Figure 20. Area planted estimates from Landsat
3. Support of qualitative estimates of land-use through coarse resolution (SAC-C, 175 m pixel size) imagery and e-mailing results in .xls format to local offices.
4. Area assessment of non- extensive crop (i.e. potatoes in SE province of Buenos Aires.).
All the satellite imagery used in this work, were supplied freely by the National Commission of Spatial Activities (CONAE).
55

56
Agricultural Monitoring in Russia Agricultural production is monitored in Russia to foster sustainable agricultural development, for environmental assessment and protection, and to monitor compliance with international environmental and trade conventions. The national agricultural monitoring system, established within the Ministry of Agriculture in 2003, relies on combined use of information from regional agricultural committees, satellite remote sensing data and ground agro-meteorological observations. The remote sensing component of the agricultural monitoring system is developed by Russian Academy of Sciences Space Research Institutes and involves daily MODIS observations as primary source of the satellite data. The primary user of the information is the Federal Ministry of Agriculture, while the Ministry of Natural Resources, the Federal Statistical Agency and Hydro-Meteorological Service, regional agricultural committees and administrators, and local agricultural producers and enterprises are considered as potential users in near future. The main foci of the agricultural monitoring system are arable land area, crop land use mapping, crop rotation and seasonal crop development. In future, the system is likely to contribute to crop production forecasts, greenhouse gas flux monitoring, and soil erosion risk assessment. The current research areas in support of this agricultural monitoring system include: expanding the monitoring system over the entire northern Eurasia region, better attribution of crop rotation characteristics, operationalizing land use change monitoring, combining moderate and high resolution data to improve monitoring accuracy, and developing links to national reporting under international environmental conventions.
Agricultural Monitoring in China In China, the research and application of remote sensing technology to agricultural monitoring began in late 1970s. In 1990, an operational crop remote sensing monitoring system was set up and put into operation based on the achievements of several previous research projects dating from 1984. Since the late 1990s with the rapid development of earth observing instruments and technology, increasing attention has been given in China to agriculture monitoring with remote sensing. Several departments and research agencies have focused their research on this topic and a number of these set up their own remote-sensing-based crop or agriculture monitoring systems. Current operational systems include: the Ministry of Agriculture (MOA) China Agriculture Remote Sensing Monitoring System (CHARMS), the Chinese Academy of Sciences (CAS) China CropWatch System, and the China Meteorological Administration (CMA) crop growth monitoring and yield prediction system. CHARMS developed by the Remote Sensing Application Centre of MOA has been operational since 1999. It monitors crop acreage change, yield, production, crop growth, drought and other agriculture-related information for 5 main crops in China. It provides this information to the MOA and related agriculture management sectors in the form of ad hoc reports according to MOA Agriculture Information Dissemination Calendar more than 5 times per month during the growing season. It provides critical information to inform decision making in MOA. The CAS China Crop Watch System (CCWS) was developed by the Institute of Remote Sensing Applications, CAS in 1998. The CCWS covers China as well as 46 main grain

growing countries around the world. The CCWS monitors crop growing conditions, production, drought, crop plantation structure and cropping index. The CCWS publishes 7 monthly bulletins and 20 newsletters every year, which have become an important information source for various government bodies. In 2004, the National Statistics Bureau began to use remote sensing technology to improve agriculture statistics.
2003,RGB:432 2004,RGB:432
Central Shandong
Wheat Built-up
Figure 21. An example of rapid agricultural land-use change in China, from wheat fields to urban.
Agricultural Monitoring in India The National Crop Forecasting Centre (NCFC) of the Department of Agriculture & Cooperation (DAC), of the Government of India was established in 1998, with a mandate to develop a framework for providing crop production forecasts at district, state and national levels. In addition, to support the high-level decision making and planning it is responsible for providing information on crop sowing progress, crop condition throughout the growing period, and on the effect of episodic events such as floods, drought, hail storms, pests, disease etc. on crop production. Use of remote sensing has been an important consideration by the DAC which sponsored the Crop Acreage and Production Estimation (CAPE) project. The Space Applications Centre (SAC) of the Indian Space Research Organization (ISRO) has led the project in developing: i) a remote sensing based procedure for crop acreage estimation at district level, ii) spectral and weather models for yield forecasting, iii) semi-automatic s/w package CAPEMAN (later renamed CAPEWORKS) for analysis of RS data, iv) technology transfer to teams across the country that use these procedures and make in-season crop production forecasts. LISS-III data from the Indian Remote Sensing satellites (IRS) are being regularly used to make crop production forecasts.
57
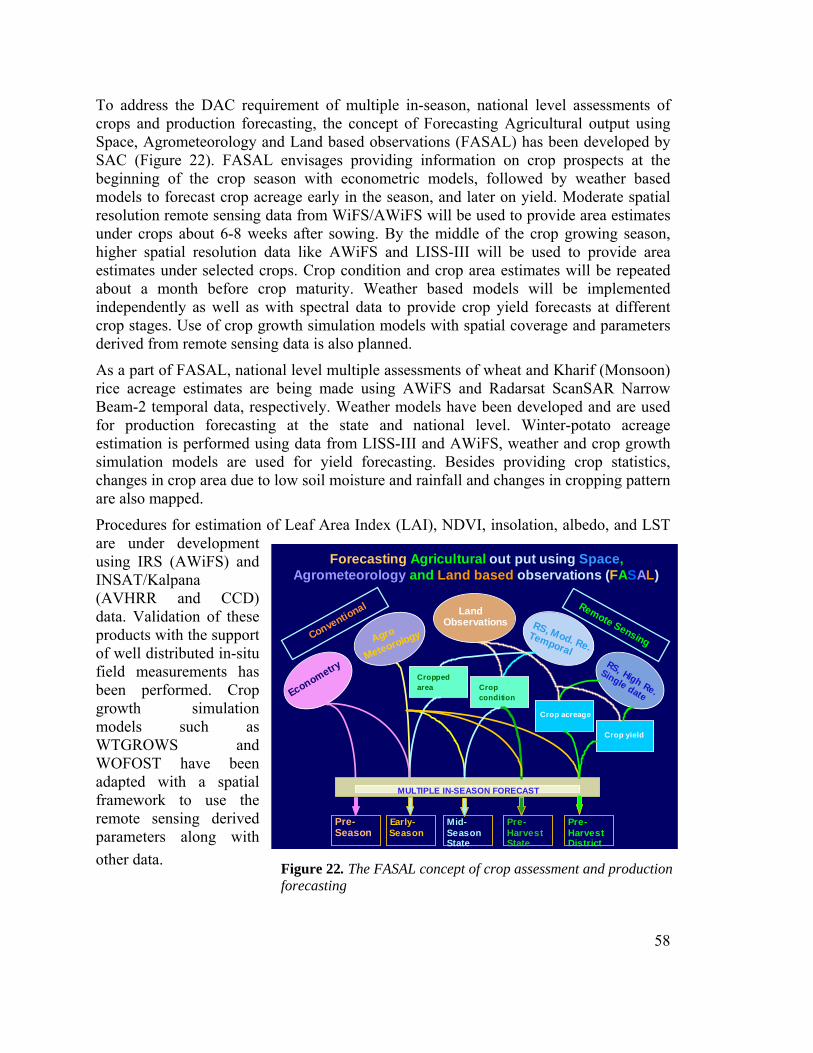
To address the DAC requirement of multiple in-season, national level assessments of crops and production forecasting, the concept of Forecasting Agricultural output using Space, Agrometeorology and Land based observations (FASAL) has been developed by SAC (Figure 22). FASAL envisages providing information on crop prospects at the beginning of the crop season with econometric models, followed by weather based models to forecast crop acreage early in the season, and later on yield. Moderate spatial resolution remote sensing data from WiFS/AWiFS will be used to provide area estimates under crops about 6-8 weeks after sowing. By the middle of the crop growing season, higher spatial resolution data like AWiFS and LISS-III will be used to provide area estimates under selected crops. Crop condition and crop area estimates will be repeated about a month before crop maturity. Weather based models will be implemented independently as well as with spectral data to provide crop yield forecasts at different crop stages. Use of crop growth simulation models with spatial coverage and parameters derived from remote sensing data is also planned.
As a part of FASAL, national level multiple assessments of wheat and Kharif (Monsoon) rice acreage estimates are being made using AWiFS and Radarsat ScanSAR Narrow Beam-2 temporal data, respectively. Weather models have been developed and are used for production forecasting at the state and national level. Winter-potato acreage estimation is performed using data from LISS-III and AWiFS, weather and crop growth simulation models are used for yield forecasting. Besides providing crop statistics, changes in crop area due to low soil moisture and rainfall and changes in cropping pattern are also mapped.
58
Figure 22. The FASAL concept of crop assessment and production forecasting
Procedures for estimation of Leaf Area Index (LAI), NDVI, insolation, albedo, and LST are under development using IRS (AWiFS) and INSAT/Kalpana (AVHRR and CCD) data. Validation of these products with the support of well distributed in-situ field measurements has been performed. Crop growth simulation models such as WTGROWS and WOFOST have been adapted with a spatial framework to use the remote sensing derived parameters along with other data.
Forecasting Agricultural out put using Space, Agrometeorology and Land based observations (FASAL)
Econometry
Agro
Meteorology
LandObservations RS, Mod. Re.
TemporalRS, High Re.
Single date
Conventional Remote Sensing
MULTIPLE IN-SEASON FORECAST
Pre-Season
Early-Season
Mid-SeasonState
Pre-HarvestState
Pre-HarvestDistrict
Cropped area Crop
condition
Crop acreage
Crop yield

Cropping system analysis of the Indo-gangetic Plains region of India has been done. First a gross crop rotation mapping was done using SPOT-VGT data. Subsequently seasonal cropping patterns for Kharif, winter and summer seasons have been mapped using AWiFS and Radarsat ScanSAR Narrow Beam-2 data at larger scale. Crop rotation maps have been generated using the cropping pattern data. Field survey has been carried out to identify and characterise the cropping systems of the region. The example of multi-scale and region coverage with data of different spatial resolutions is shown in Figure 23. A comprehensive data base of cropping systems and associated parameters has been created at a 50m pixel size. A cropping system simulation model (Cropsyst) has been validated with the field and remote sensing data. Cropping system performance indicators such as the Area Diversity Index (ADI), Cultivated Land Utilisation Index (CLUI) and Multiple Cropping Index (MCI) have been developed.
Rice-WheatSugarcane BasedCotton-WheatRice-PotatoMaize-WheatPearlmillet-WheatRice-Fallow-RiceRice-Fallow-FallowRice-Fallow-JuteRice-Wheat-OtherFallow-PulseFallow-WheatMinor Crop Rotat ionsFallowNon-Arable
Rice-WheatSugarcaneFallow-Other cr opSugarcane-WheatOther crop-Other cropRice-FallowOther crop-Fa llowFallow
Rice-WheatCotton-WheatMaize BasedVegetable BasedOthersNon-Agricu ltureRoad NetworkDistrict Bou ndary
SPOT VGT: Regional level
AWiFS: State Level
LISS III: District level
Village level LISS IV
Figure 23. Use of Multi-spatial resolution data for crop rotation mapping at varying scales and coverage in Indo-Gangetic Plains Region of India.
59

60
Appendix C. List of Contributors to the Document (Alphabetical) Assaf Anyamba, Olivier Arino, Bettina Baruth, Inbal Becker-Reshef, Mario Camarero, Elisabetta Carfagna, Cecilia Castelli, Zhongxin Chen, Richard Conant, Pierre Defourny, Jacques Delincé, Paola DeSalvo, Bradley Doorn, Hugh Eva, Claudio Fonda, Steffen Fritz, Gideon Galu, Giampiero Genovese, Fabio Grita, Matthew Hansen, David Henry, Francesco Holecz, Henri Josserand, Chris Justice, Arnon Karnieli, Qiangzi Li, Kennedy Masamvu, Michel Massart, Rick Muller , Francesco Palazzo, Jai Singh Parihar, José Paruelo, Monica Petri, Simon Pinnock, Enrica Maria Porcari, Mike Rast, Jansle Rocha, William Salas,Reuben Sessa, Ed Sheffner, Karan Deo Singh, Mannava Sivakumar, Mark Smulders, Mukesh Kumar Srivastava, James Verdin, Bingfang Wu Appendix D. Workshop Agenda
GEOSS Operational Agricultural Monitoring System
July 16 – 18th 2007, FAO HQ Rome
Day 1. July 16th 9-5
Session 1. Introductory Session Welcome to FAO – Jeff Tschirley (FAO)
Meeting Logistics – Reuben Sessa (FAO)
Summary of 2006 Meeting Recommendations and Goals for this meeting – Chris Justice (UMD)
Background: the GEOSS Ag Tasks and Schedule – Michael Rast (GEOSS)
GEOS Agricultural Risk Management AG 07-02 Task – Mannava. Sivakumar (WMO)
Refining the GEOSS Ag Monitoring Task AG07-03: Discussion - Chris Justice (UMD)
2. Building on Existing Activities Ongoing Plans for Coordinating Food Security Monitoring – Henri Josserand (FAO)
Ongoing Plans for Agricultural Statistical Coordination – Mukesh Srivastava (FAO)
Current Status and Future plans for Global Soils Mapping – Monica Petri (FAO)
3. Tour de Table – Update on Developments in Regional to Global Agricultural Monitoring Programs since the last meeting (5-10 minute updates)
FEWS – Jim Verdin (USGS)
GMFS – Simon Pinnock (ESA)

61
FIVIMS – Fabio Grita (FAO)
GIEWS – Henri Josserand (FAO)
CGIAR- Enrica Porcari
FAS – Brad Doorn (USDA)
MARS STAT/MARS FOOD - Jacques Delince (EU JRC)
GLOBAM Experiment – Pierre Defourny (UCL)
4. Tour de Table - Update on example National Agricultural Monitoring Activities since the last meeting (5 minute updates) China – Qiangzi Li (Chinese Academy of Sciences)
India - Jai Singh Parihar (ISRO)
Argentina - Jose Paruelo (IFEVA)/ Cecilia Castelli (SAGPyA)
Brazil - Jansle Rocha (U. Compinas /CONAB).
Australia – Dave Henry (CSIRO)
USA – Brad Doorn (FAS)
Russia – Theirry Negre (JRC)
5. Tour de Table - Updates on International and National Satellite Systems and Initiatives (10 minute summaries) ESA - Olivier Arino
ISRO - Jai Singh Parihar
China - Zhongxin Chen (CAAS)
NASA – Ed Sheffner
CEOS LSI Constellation – Michael Rast
6. Breakout Groups - Defining the Components of the GEOSS Ag Strategy (Part 1)
What components are currently working well, how sustainable are they and what critical components are missing, what can be done in the framework of GEOSS?
Group 1. Focus on Food Security and Early Warning (Co-Chairs:Jim Verdin/Gideon Galu )
Group 2. Focus on Agricultural Monitoring (Co-Chairs: Jacques Delince/Brad Doorn)
--------------------------------------------------------------------------------------------
Day 2 July 17th 9-5
7. Breakout Groups (Part 2) - Defining the Components of the GEOSS Ag Strategy
Group 1. Focus on Food Security and Early Warning

62
(Co-Chairs:Jim Verdin/Gideon Galu )
Group 2. Focus on Agricultural Monitoring (Co-Chairs: Jacques Delince/Brad Doorn)
8. Report Back from the Breakouts
9. Data Issues GEOSS Data Policy Update– Michael Rast
Current Status of Data Sharing, Access and Lag Times – Francesco Palazzo
Open Discussion on Data Issues – Ed Sheffner
10. Breakout Groups
Charge to the breakout groups – Chris Justice
Group 1. Agricultural Area Estimation (Co Chairs: Pierre Defourny/Jansle Rocha)
Group 2. Cropping Systems Database for Agricultural Monitoring (Co-Chairs Matthew Hansen/Dave Henry)
Group 3. In-Situ Vegetation Measurements and integration with EO
(Co-Chairs Karan Deo Singh/Elizabetta Carfagna)
Group 4. Rainfall/Meteo Data Enhancement
(Co-Chairs Mannava Sivakumar/ Jim Verdin)
----------------------------------------------------------------------------------------------------------- Day 3 July 18th 9- 15:00
Session 10. Report Back Sessions from Groups 1-4 Discussion
11. Round Table Topics Linking to GEO Opportunities for Capacity Building – Michael Rast
Developing Country Priorities for Agricultural Monitoring – Gideon Galu
Establishing a GEOSS Agricultural Monitoring Community of Practice – Jacques Delince
12. Defining what GEOSS can do for Agricultural Monitoring? Chaired Discussion Chris Justice
13. Developing the Meeting Report and Formulating the Recommendations Structuring the Workshop Report
Developing the Recommendations for the GOESS Plenary in November
63
Appendix E. List of Workshop Attendees Chair: Chris Justice, University of Maryland, GEO Task AG 07-03 POC Name Organization Cristina Amaral FAO Assaf Anyamba NASA/Goddard Space Flight Center Olivier Arino European Space Agency Inbal Becker-Reshef University of Maryland Michele Bernardi FAO – NRCB Elisabetta Carfagna University of Bologna Cecilia Castelli Secretaría de Agricultura, Ganadería, Pesca y Alimentos (SAGPyA) Zhongxin Chen Institute of Agri Resources & Regional Planning, CAAS Renato Cumani FAO Pierre Defourny UCL-Geomatics Jacques Delincé EC Joint Research Centre Antonio Di Gregorio FAO Bradley Doorn U.S. Department of Agriculture Hugh Eva EC Joint Research Centre Steffen Fritz IIASA Gideon Galu FEWS René Gommes FAO – NRCB Kailash Govil FAO Fabio Grita FAO/GIEWS Matthew Hansen South Dakota State University David Henry CSIRO Henri Josserand FAO/GIEWS Chris Justice University of Maryland John Latham FAO Qiangzi Li Institute of Remote Sensing Applications, chinese Academy of Sciences Kennedy Masamvu SADC Secretariat Michele Massart EC Joint Research Centre Thierry Nègre EC Joint Research Centre Francesco Palazzo SERCO for ESA Jai Singh Parihar Space Applications Centre, Indian Space Research Organization (ISRO) José Paruelo Facultad de Agronomía - Universidad de Buenos Aires Monica Petri FAO Simon Pinnock European Space Agency Enrica Maria Porcari CGIAR Mike Rast GEO Secretariat Jansle Rocha Universidade Estadual de Campinas (UNICAMP) Reuben Sessa FAO Ed Sheffner NASA Karan Deo Singh GLCN INDIA Mannava Sivakumar World Meteorological Organization Mukesh Kumar Srivastava Country Statistics Service, Statistics Division, FAO Jeff Tschirley FAO James Verdin U.S. Geological Survey/FEWS

64
Appendix F. List of Acronyms ADC Architecture and Data Committee
ADI Area Diversity Index
ALOS Advanced Land Observing Satellite
ASAR Advanced Synthetic Aperture Radar
AVHRR Advanced Very High Resolution Radiometer
AWiFS Advanced Wide Field Sensor
CAPE Crop Acreage and Production Estimation
CAS Chinese Academy of Sciences
CBERS China-Brazilian Earth Resource Satellite
CSSTEAP UN-Centre for Space Science Technology Education for Asia and the Pacific
CCWS China Crop Watch System
CEOS Committee on Earth Observation Satellites
CHARMS China Agriculture Remote Sensing Monitoring System
CLUI Cultivated Land Utilisation Index
CMA China Meteorological Administration
COF Climate Outlook Forum
CONAB Companhia Nacional de Abastecimento
CONAE Commission of Spatial Activities
DCD Dirección de Coordinación de Delegaciones
FAS Foreign Agricultural Service
FASAL Forecasting Agricultural output using Space, Agrometeorology and Land based observations
FCCC Framework Convention on Climate Change
FEWS NET Famine Early Warning Systems Network
FEWS Famine Early Warning System
FIVIMS Food Insecurity and Vulnerability Information and Mapping Systems
FSO Food Security Outlook
FY Fengyun Chinese Meteorological Satellite Series
GDAS Global Data Assimilation System

65
GEOSS Global Earth Observing System of Systems
GIEWS Global Information and Early Warning System
GLAM Global Agricultural Monitoring
GMFS Global Monitoring of Food Security
GPM Global Precipitation Mission
GTS Global Telecommunications System
IGOL Integrated Global Observing Strategy
INSAT CCD Indian Satellite with Charge Coupled Device (CCD) camera
IPCC Intergovernmental Panel on Climate Change
IRS Indian Remote sensing Satellite
ISRO Indian Space Research Organization
K&CI Kyoto and Carbon Initiative
LAI Leaf Area Index
LANDSAT Land Satellite
LISS III W Linear Imaging & Self Scanning Sensor - Wide Swath
LISS Linear Imaging & Self Scanning Sensor
LST Land Surface Temperature
LUCAS Land Use/Cover Area frame statistical Survey
MARS Monitoring of Agriculture with Remote Sensing
MCI Multiple Cropping Index
MERIS Medium Resolution Imaging Spectrometer Instrument
MetOP Meteorological Operational satellite programme
MOA Ministry of Agriculture
MODIS Moderate Resolution Imaging Spectroradiometer
MSG METEOSAT Second Generation
NASS National Agricultural Statistics Service
NCFC National Crop Forecasting Centre
NDVI Normalized Difference Vegetation Index
NMHS National Meteorological and Hydrological Services
NMS National Meteorological Services
NOAA National Oceanic and Atmospheric Administration
NPOESS National Polar-orbiting Operational Environmental Satellite

66
system
NPP NPOESS Preparatory Project Suite
OGA Office of Global Analysis
PALSAR Phased Array type L-band Synthetic Aperture Radar
RFE rainfall estimates
RISAT Radar Imaging Satellite
RMTC Regional Meteorological Training Centers
RRSU Regional Remote Sensing Unit
SAC Space Applications Centre
SADC Southern African Development Community
SAGPyA Secretary of Agriculture, Livestock, Fisheries and Food
SAR Synthetic Aperture Radar
SBA societal benefit areas
SBSTA Subsidiary Body for Scientific and Technological Advice
Sentinel-1/2/3 Family of European Community’s Global Monitoring for Environment and Security (GMES) space missions or “Sentinels”
SPOT Végétation Satellite Pour l'Observation de la Terre (Vegetation Instrument)
SPOT Satellite Pour l'Observation de la Terre with HRV (High Resolution Visible) and HRVIR (High Resolution Visible IR) sensors
SWIR Short Wave InfraRed
TRMM Tropical Rainfall Measuring Mission
VAM Vulnerability Analysis and Mapping
VENUS Vegetation and Environment monitoring on a New Micro-Satellite
VIIRS Visible Infrared Imager Radiometer
WGISS Working Group on Information Systems and Services
WMO World Meteorological Organization